Attached files
| file | filename |
|---|---|
| EX-23.1 - EX-23.1 - CMTSU Liquidation, Inc. | a09-35835_1ex23d1.htm |
| EX-21.1 - EX-21.1 - CMTSU Liquidation, Inc. | a09-35835_1ex21d1.htm |
| EX-32.1 - EX-32.1 - CMTSU Liquidation, Inc. | a09-35835_1ex32d1.htm |
| EX-32.2 - EX-32.2 - CMTSU Liquidation, Inc. | a09-35835_1ex32d2.htm |
| EX-31.2 - EX-31.2 - CMTSU Liquidation, Inc. | a09-35835_1ex31d2.htm |
| EX-31.1 - EX-31.1 - CMTSU Liquidation, Inc. | a09-35835_1ex31d1.htm |
UNITED STATES
SECURITIES AND EXCHANGE COMMISSION
Washington, D.C. 20549
FORM 10-K
ANNUAL REPORT PURSUANT TO SECTION 13 OR 15(d) OF THE SECURITIES EXCHANGE ACT OF 1934
For the fiscal year ended December 31, 2009
Commission File Number: 001-13103
CIBER, INC.
(Exact name of registrant as specified in its charter)
|
Delaware |
|
38-2046833 |
|
(State or other jurisdiction of incorporation or organization) |
|
(I.R.S. Employer Identification No.) |
|
|
|
|
|
6363 South Fiddler’s Green Circle,
Suite 1400, |
|
80111 |
|
(Address of Principal Executive Offices) |
|
(Zip Code) |
Registrant’s telephone number, including area code: (303) 220-0100
Securities registered pursuant to Section 12(b) of the Act:
|
Title of class |
|
Name of exchange on which registered |
|
Common Stock, $0.01 par value |
|
New York Stock Exchange |
Securities registered pursuant to Section 12(g) of the Act: None
Indicate by check mark if the registrant is a well-known seasoned issuer, as defined in Rule 405 of the Securities Act. o Yes x No
Indicate by check mark if the registrant is not required to file reports pursuant to Section 13 or Section 15(d) of the Act. o Yes x No
Indicate by check mark whether the registrant (1) has filed all reports required to be filed by Section 13 or 15(d) of the Securities Exchange Act of 1934 during the preceding 12 months (or for such shorter period that the registrant was required to file such reports), and (2) has been subject to such filing requirements for the past 90 days. x Yes o No
Indicate by check mark whether the registrant has submitted electronically and posted on its corporate Web site, if any, every Interactive Data File required to be submitted and posted pursuant to Rule 405 of Regulation S-T (§ 232.405 of this chapter) during the preceding 12 months (or for such shorter period that the registrant was required to submit and post such files). o Yes o No
Indicate by check mark if disclosure of delinquent filers pursuant to Item 405 of Regulation S-K (§ 229.405 of this chapter) is not contained herein, and will not be contained, to the best of registrant’s knowledge, in definitive proxy or information statements incorporated by reference in Part III of this Form 10-K or any amendment to this Form 10-K. o
Indicate by check mark whether the registrant is a large accelerated filer, an accelerated filer, a non-accelerated filer, or a smaller reporting company. See the definitions of “large accelerated filer,” “accelerated filer” and “smaller reporting company” in Rule 12b-2 of the Exchange Act.
|
Large accelerated filer o |
|
Accelerated filer x |
|
|
|
|
|
Non-accelerated filer o (Do not check if a smaller reporting company) |
|
Smaller reporting company o |
Indicate by check mark whether the registrant is a shell company (as defined in Rule 12b-2 of the Exchange Act). o Yes x No
The aggregate market value of the outstanding voting stock held by non-affiliates of the registrant as of June 30, 2009, was $196,374,361, based on the closing price of the registrant’s Common Stock of $3.10 per share reported on the New York Stock Exchange on such date.
As of February 26, 2010, there were 69,282,212 shares of the registrant’s Common Stock outstanding.
DOCUMENTS INCORPORATED BY REFERENCE
Portions of the Proxy Statement for the Registrant’s 2010 Annual Meeting of Shareholders to be held on May 11, 2010, are incorporated by reference into Part III of this Report.
CIBER, Inc.
Form 10-K
Disclosure Regarding Forward-Looking Statements
This Annual Report on Form 10-K contains forward-looking statements within the meaning of the Private Securities Litigation Reform Act of 1995 relating to our operations, results of operations and other matters that are based on our current expectations, estimates, forecasts and projections. Words, such as “anticipate,” “believe,” “could,” “expect,” “estimate,” “intend,” “may,” “opportunity,” “plan,” “potential,” “project,” “should,” and “will” and similar expressions, are intended to identify forward-looking statements. For example, we make certain forward-looking statements regarding our current estimates for revenue and profitability for certain of our business units for 2010. These statements are not guarantees and involve risks, uncertainties and assumptions that are difficult to predict. Actual outcomes and results may differ materially from such forward-looking statements due to a number of factors, including without limitation, the factors set forth in this Annual Report on Form 10-K under the caption “Item 1A. Risk Factors.” Forward-looking statements are not guarantees of performance and speak only as of the date they are made, and we undertake no obligation to publicly update any forward-looking statements in light of new information or future events. Undue reliance should not be placed on such forward-looking statements.
In this Annual Report on Form 10-K, we use the terms “CIBER,” “we,” “the Company,” “our” and “us” to refer to CIBER, Inc. and its subsidiaries. All references to years, unless otherwise noted, refer to our fiscal year, which ends on December 31.
Overview
CIBER is a diversified, system integration and information technology (“IT”) services consulting firm, with approximately 8,000 employees and consultants and total revenue of approximately $1.0 billion in 2009. We operate our business model from over 70 offices in 18 countries. CIBER helps clients achieve their business goals by building, integrating and supporting mission-critical applications and systems for optimized quality, increased business value, faster time-to-market and reduced total cost of operations. Our clients consist primarily of governmental agencies and Fortune 1000 and middle market companies across most major industries.
Services and Operations
We organize our operations by the nature of their services, client base and geography. We have five reportable segments, which are our primary operating divisions, and for the year ended December 31, 2009, our percentage of total revenue by division was as follows:
|
|
|
2009 |
|
|
|
|
Revenue % |
|
|
Custom Solutions |
|
36 |
% |
|
International |
|
34 |
% |
|
IT Outsourcing |
|
7 |
% |
|
Federal |
|
11 |
% |
|
U.S. ERP |
|
12 |
% |
Custom Solutions
CIBER’s Custom Solutions division focuses on providing custom development, integration and support to U.S.-based commercial, state and local government clients. We provide the full range of application portfolio management support, including analysis, design, development, testing, implementation and maintenance of business applications. Our delivery capabilities span service-oriented architectures, including J2EE and .NET, as well as traditional client/server and mainframe development. We also offer portal development, wireless and mobility applications and content delivery.
The Custom Solutions division has developed expertise in a variety of commercial verticals, including the automotive, manufacturing, services, retail, financial and telecommunications industries, as well as its expanded strategic consulting practices, which include IT Strategy, Architecture, Business Intelligence/Data Warehousing (“BI/DW”), Collaborative Solutions and Supply Chain. The Custom Solutions division also has expertise in the following government verticals: Health and Human Services and Public Health, Transportation, Administration and Law and Justice.
Our delivery model employs the use of local branch offices, which allow us to provide local, on-site services to both commercial and state and local government clients, as well as Global Solution Centers, which are our domestic and offshore solution centers. Our Global Solution Centers are strategically located in both the U.S. and India, and they are focused on providing application development and management and IT operations support on either an individual or comprehensive integrated basis. Our Global Solution Centers are designed to provide a high value, lower-cost alternative for our clients. Our five domestic delivery centers are located in Tampa and Orlando, Florida, Pittsburgh and Harrisburg, Pennsylvania, and Detroit, Michigan. We were able to significantly grow our Global Solutions Center in Bangalore, India through our January 2009 acquisition of Iteamic Pvt. Ltd. Our Indian operations have led the way in integrating global delivery into every part of CIBER’s business.
International
Our CIBER International division (formerly CIBER Europe), headquartered in the Netherlands, delivers a mix of enterprise and custom solutions. CIBER International is a full-line service provider, able to offer a range of services covering the full IT solution lifecycle to clients in both commercial enterprises and public sector organizations. Key geographies for our International division include the Netherlands, the United Kingdom, Germany and the Scandinavian region consisting of Norway, Sweden, Denmark and Finland.
Our enterprise solutions focus primarily on providing services related to Enterprise Resource Planning (“ERP”) and Customer Relationship Management (“CRM”) software products. Our partner relationships in Europe and Asia/Pacific include SAP and Microsoft, with SAP-related solutions and services accounting for approximately 60% to 65% of the International division’s total revenue in 2009. We have Special Expertise status in SAP Industry Solutions such as Retail, Automotive and Chemicals, and we are a value-added reseller of SAP software in some geographies. We also work closely with Microsoft to deliver ERP and CRM solutions in selected geographies.
We build custom solutions based on leading technologies such as Microsoft and Oracle to develop web services applications, implement workflow solutions, integrate legacy systems as part of an extended enterprise and build sophisticated information infrastructures through the use of BI/DW technologies.
IT Outsourcing
Our IT Outsourcing division is a global and expanding business with domestic headquarters in Edison, New Jersey and international presence throughout Europe, offering a robust set of solutions that span the entire spectrum of IT infrastructure and IT operations services. Our solutions range from help desks and hosting, to software rollouts and security monitoring, to server virtualization and more, in data centers in the U.S., the United Kingdom, the Netherlands and Spain, and global support centers in the U.S., the United Kingdom and India. In 2009, we aggressively expanded both our direct-selling model and our offshore delivery footprint. We were able to significantly grow our service desk/help desk business, leverage our data center footprint, expand our India-based delivery operations, enhance our global managed services platforms and increase our international business in Europe. Additionally, we are certified by SAP as both Global Hosting and Global Application Management Partners.
Federal
Our Federal division provides a range of custom IT services and support for U.S. federal government projects, including specialized strategic staffing, security assessments, legacy modernization services, data warehousing solutions and help desk support. We provide these services to defense and civilian agencies, both domestic and abroad, including all branches of the U.S. military. In the aggregate, the various agencies of the U.S. federal government represent our largest client and accounted for approximately 11% of our total revenue in 2009.
Our processes, infrastructure and tools meet stringent contracting requirements essential to success in the federal government prime contract market. Our Federal division has continued to build and enhance our capabilities to meet these federal requirements. In 2009, our Federal Government Property Management Plan was approved and our government-compliant Procurement and Earned Value Management Systems were implemented.
The Federal division is aligned along a customer focus to allow each practice to provide a full set of capabilities to customers with common missions, goals and requirements, and to create synergies within the groups. The alignment also allows us to establish strong client relationships and fit within each client’s culture. These customer-focused practices consist of Defense Technology Systems, Defense and Intelligence and Civilian Technology Solutions. The Defense Technology Systems Practice focuses on the U.S. Army and Navy and provides specialized expertise in telephony, network operations and call
center support across the federal business base. The Defense and Intelligence Practice focuses on supporting the Joint Military Commands, the intelligence community and the Air Force, where we occupy a special niche by providing mission operations support and highly-skilled staff to meet specialized requirements in ensuring our Nation’s security. The Civilian Technology Solutions Practice provides an array of services ranging from enterprise architecture development to financial management for its clients, which include the following agencies: Homeland Security, U.S. Courts, Education, Transportation, Commerce, Agriculture, Energy, Interior, the Center for Medicare and Medicaid Services, and the Centers for Disease Control. Within the Civilian Technology Solutions Practice is our Enterprise Security Solutions group, which provides engineering and system integration solutions for federally-funded, enterprise level security and risk management programs protecting ports, the shipping industry and other critical infrastructure environments.
U.S. ERP
Our U.S. ERP division (formerly known as our Enterprise Solutions division) provides consulting services to support multi-package ERP solutions for customers in the U.S. from vendors including SAP, Oracle (including E-Business Suite, PeopleSoft and JD Edwards) and Lawson, as well as several education management products. We are highly focused on industry solutions for vertical markets such as the public sector, higher education, K-12, healthcare, retail, grower management, food and beverage and manufacturing. Our U.S. ERP division frequently works with our Custom Solutions division, leveraging the local relationships of that division to cross-sell opportunities in ERP solutions along with Custom Solutions division services. Our ability to offer cost-effective solutions from leading software vendors to the public sector, in partnership with our other divisions, positions CIBER as a valued partner to our clients.
In addition to being an SAP gold channel partner, we are also an SAP-certified global provider of application management services. Our comprehensive SAP solutions support our customers throughout the life cycle and include implementations and upgrades, extensions, integrations and customizations. We have organized our SAP Practice to serve multiple vertical markets. In our SAP Commercial Practice we focus on customers in retail, apparel and footwear, mining, metals, manufacturing, financial services and aerospace and defense industries. The SAP Public Sector Practice focuses on delivering solutions to state and local governments.
We are an Oracle Platinum Partner, which is the highest level of partnership in the Oracle Partner Network Specialized Program and a strategic partner to Oracle in several key industries such as the public sector, higher education and food and beverage. Our Oracle, PeopleSoft and JD Edwards solutions involve building, integrating and supporting mission critical systems for real-time enterprises.
We are a Certified Lawson Consulting Partner, providing full scale business transformation projects in Lawson’s target vertical markets through business process, change management and functional and technical services around Lawson technology. These target markets are healthcare, public sector, food and beverage and general manufacturing, for which we offer budgeting, financial processing and analysis, human capital management, sales order processing and manufacturing systems solutions.
Our Technology Solutions Group Practice focuses on providing customers with the best infrastructure products and architecture. Offerings include enterprise servers, storage, middleware, integration services, assessments and related products required to support critical business applications. Strategic relationships with IBM, NetApp, Dell, HP and other leading manufacturers allow us to architect and deploy the right solutions for our customers’ environments.
Financial Information about Segments and Geographic Areas
The information required by these items is incorporated herein by reference to “Management’s Discussion and Analysis of Financial Condition and Results of Operations” and Note 13 of the Notes to our Consolidated Financial Statements included under “Financial Statements and Supplementary Data” of this Annual Report.
Clients
Our clients consist primarily of Fortune 1000 and middle market companies across most major industries, as well as governmental agencies in the U.S. and abroad. These organizations typically have significant IT budgets and frequently depend on outside consultants to help achieve their business and IT objectives. In 2009, we estimate our approximate percentage of total revenue by client industry was:
|
Government |
|
29 |
% |
|
Manufacturing/high tech |
|
17 |
% |
|
Financial |
|
13 |
% |
|
Healthcare/pharmaceutical |
|
8 |
% |
|
Retail |
|
7 |
% |
|
Automotive |
|
6 |
% |
|
Telecommunications |
|
4 |
% |
|
Services and other |
|
16 |
% |
Certain clients account for a significant portion of our revenue. Our largest client, the various agencies of the U.S. federal government, collectively accounted for approximately 12%, 11% and 11% of total revenue in 2007, 2008 and 2009, respectively. No other client accounted for more than 5% of our total revenue in 2009. Most of our divisions had revenue from a single client that equaled or exceeded 10% of their division’s total revenue. These clients accounted for the following percentages of each division’s 2009 total revenues: Custom Solutions - 12%; IT Outsourcing - 20%; Federal - 100%; and U.S. ERP - 10%.
Client retention and turnover is highly dependent upon the type of solution we are providing. Many of our client relationships in which we are providing a custom solution have continued for many years. Each year, most of the services revenue in our Custom Solutions, IT Outsourcing and Federal divisions comes from clients for whom we have previously provided services. Both our IT Outsourcing and Federal divisions typically contract with their clients for periods ranging from three to five years. With services related to package software solutions, which includes our U.S. ERP division, as well as a large part of our International division, client engagements most typically involve a large enterprise software implementation over a period of six to eighteen months. Typically, once package software implementations are completed, future consulting services revenues from that client are minimal and, as a result, client turnover is high.
Typically, both our commercial and government clients may cancel their contracts or reduce their use of our services on short notice. If any significant client terminates its relationship with us or substantially decreases its use of our services, it could have a material adverse affect on our financial condition and results of operations.
Acquisitions/Business Combinations
Since the late-1980s, CIBER has executed a strategy of growth and diversification that included expanding our range of IT-related services, developing a professional sales force and selectively acquiring established complementary companies. Since our initial public offering in March of 1994, we have completed over 60 business combinations. In the past several years, our acquisition strategy has centered upon our need to further augment business segments with additional vertical areas of expertise, consultants or geographic reach. Our acquisition strategy has been central to our ability to expand our business model in the following areas:
· Increased project-based capabilities - We have expanded our project-based delivery capabilities by adding expertise around SAP, Oracle (which now includes PeopleSoft and JD Edwards) and other ERP packages. In addition to acquiring project-based ERP capabilities, we have developed internal project level expertise in delivery of custom software applications, application maintenance and technology outsourcing services. This combination of acquired and organically-developed project delivery capabilities has resulted in a shift in our mix of business to project-based work from staff supplementation services.
· Established significant public sector presence - Our acquisitions have enabled us to become an established firm in the public sector, providing services to most of the 50 states, as well as hundreds of city, county, school, transit and public utility organizations in 2009. Our public sector clients, including those in Europe, accounted for approximately 29% of our total revenue in 2009.
· Expanded geographic presence - Acquisitions have also allowed us to expand our geographic footprint to include a significant European presence. Beginning with our first foreign acquisition in the Netherlands in 1999, and most
recently our 2009 acquisition of an Indian company specializing in application development for offshore projects, we have expanded our foreign operations to include offices located throughout Europe and Asia/Pacific.
Competition
The IT services industry is extremely competitive and characterized by continuous changes in customer requirements and improvements in technologies. Our competition varies significantly from city to city, as well as by the type of service provided. Our principal competitors include Accenture plc, Atos Origin SA, BearingPoint, Inc, CACI International Inc, Cap Gemini SA, CGI Group Inc., Cognizant Technology Solutions, Logica PLC, Maximus, Inc. and Tieto Corporation. We also compete with privately-held local and regional IT consulting firms, as well as the service divisions of various software developers. In addition, we must frequently compete with a client’s own internal IT staff.
Our industry is being impacted by the growing use of lower-cost offshore delivery capabilities. There can be no assurance that we will be able to continue to compete successfully with existing or future competitors, or that competition will not have a material adverse effect on our results of operations and financial condition.
Our Competitive Strengths
We believe that our corporate strengths, identified below, position us to respond to the long-term trends, changing demands and competition within our principal markets.
· Long-term Client Relationships - We have been in business since 1974 and a prominent first-year client, Ford Motor Company, remains one of our top five clients today in terms of annual revenue. This relationship exemplifies the kind of long-term commitment that we have toward our clients and speaks to the quality and breadth of the services that we provide.
· Competitive Pricing Model - Our pricing structure is very competitive relative to the level of our service offerings. Because of the efficient overhead structure of our branch office operations and the high utilization of our billable consulting staff, we are able to offer our clients a pricing model that is very competitive. We believe that, on average, our hourly billing rates are significantly lower than the rates of our national competitors for similar services.
· Scale of Operations - The competitive landscape for the delivery of IT services is highly fragmented. In almost every major market we compete with larger national and international publicly-held firms, as well as a host of smaller regional and local privately-held firms. For the past several years, large clients have attempted to consolidate the purchasing of IT services and work with fewer firms. Because of the relatively large scale of our operations, we have been able to compete effectively to remain a vendor to these large clients. Our success has come at the expense of local and regional competitors that currently lack the scale to compete successfully for this work.
· Balanced Business Model - We have developed a business model that allows us to provide superior, leading-edge services that are routinely updated to meet the current needs of our clients. We have developed a reputation for thought leadership in industry verticals within each of our divisions.
· Breadth of Service Offering - We offer a broad range of services to our clients in both the private and public sectors, including staff supplementation services, custom application development services, implementation of ERP packages, application maintenance outsourcing services, resale of certain hardware and software products, managed hosting and call center support. We believe that having this broad delivery capacity is often a competitive advantage, particularly when competing against smaller local and regional firms.
· Optimized Delivery Methodology - Our proprietary Optimized Delivery Model® (“ODM”) is designed to determine the right mix of client and CIBER resources and the appropriate work site for an engagement, as well as balance the cost of the resources and the complexity of managing a diverse and distributed team. Our approach minimizes resource costs and maximizes delivery effectiveness for the benefit of the client. The approach consists of a series of steps to profile the customer’s business drivers and capabilities, create alternative resource scenarios and formalize governance around delivering the work. The output of these efforts is a recommended delivery model that is optimized to balance the client’s resource costs with the risks and constraints of distributed delivery teams. The overall ODM process has been effective in our pursuit of project engagements and use of the methodology has become a distinct competitive advantage.
Employees
As of December 31, 2009, we had approximately 8,000 employees and contractor consultants. We routinely supplement our employee consulting staff with the use of contractors. At December 31, 2009, we had approximately 7,100 billable consultants, including approximately 900 contractors of which most are from other services firms. None of our employees are subject to a collective bargaining arrangement. We have employment agreements with our executive officers and certain other employees. We believe our relations with our employees are good.
Seasonality
We experience a moderate amount of seasonality. Typically, our billable hours, which directly affect our revenue and profitability, decrease in the second half of the year, especially during the fourth quarter, due to the large number of holidays and vacation time taken by our billable consultants. As a result, our operating income as a percentage of total revenue is generally the lowest in the fourth quarter of each calendar year.
Available Information
The Internet address of our website is http://www.ciber.com. On the Investor Relations section of our website, we make available free of charge our Annual Reports on Form 10-K, Quarterly Reports on Form 10-Q, Current Reports on Form 8-K, and any amendments to those reports, as soon as reasonably practical after the reports are electronically filed with or furnished to the Securities and Exchange Commission (the “SEC”) pursuant to Section 13(a) or 15(d) of the Exchange Act.
We operate in a dynamic and rapidly changing economic and technological environment that involves numerous risks and uncertainties, many of which are driven by factors that we cannot control or predict. The following section describes some, but not all, of the factors that could have a material adverse affect on our business, financial condition, results of operations and the market price of our common stock.
Our results of operations can be adversely affected by economic conditions and the impacts of these conditions on our clients’ operations and technology spending.
Our results of operations are affected by the level of business activity of our clients, which in turn is affected by the regional and global economic conditions in which they operate. The global economic recession has reduced, and may continue to reduce, demand for our services. These circumstances have caused some of our clients to delay, cancel or scale back their IT projects or IT spending, to seek lower pricing or extended payment terms, to delay payments due to us and, as occurred with several clients, to enter into bankruptcy or liquidation. Reduced demand for IT services has also resulted in reductions in the growth of new business, led to increased price competition for our services and increased the possibility that we will enter into contracts that produce lower profit margins. In the event our clients continue to be negatively affected by these economic events, our revenues, results of operations and financial condition may be materially adversely affected.
The IT services industry is highly competitive, and we may not be able to compete effectively.
We operate in a highly competitive industry that includes a large number of participants. We currently compete principally with other IT professional services firms and technology vendors, including a variety of large multinational providers and large off-shore service providers that offer some or all of the services that we offer, as well as many niche solution or service providers that compete with us in a specific geographic market, industry segment or service area. In addition, a client may choose to use its own resources rather than to engage an outside firm for the type of services that we provide. Many of the companies that provide services in our industry have significantly greater financial, technical and marketing resources than we do. Additionally, some of our competitors, particularly those located in regions with lower costs of doing business, may be able to provide services and solutions to clients at lower costs or on more attractive terms. Increased competition has, and may continue to, put downward pressure on the prices we can charge for our services.
Our marketplace is experiencing rapid changes in its competitive landscape. Some of our competitors have sought access to public and private capital and others have merged or consolidated. A possible consequence of the consolidation activity among hardware manufacturers, software developers and vendors and IT service providers may be greater convergence of products and services that were once offered separately by independent vendors. This possible integration of products and services could adversely affect our competitive position.
We may be unable to compete successfully with current or future competitors, and our revenue and profitability may be adversely affected.
If we are not able to anticipate and keep pace with rapid changes in technology, our business will be negatively affected.
Our success depends on our ability to develop and implement technology services and solutions that anticipate and keep pace with rapid and continuing changes in technology, industry standards and client preferences. We may not be successful in anticipating or responding to these developments on a timely basis, and our offerings may not be successful in the marketplace. In addition, services, solutions and technologies developed by current or future competitors may make our service or solution offerings uncompetitive or obsolete. Any one of these circumstances could have a material adverse effect on our ability to obtain and successfully complete client engagements.
Termination of a contract by a significant client and/or cancellation with short notice could adversely affect our results of operations.
Our five largest clients accounted for approximately 23% of our total revenue in 2009. The various agencies of the U.S. federal government represent our largest client, accounting for approximately 11% of our total revenue in 2009, while no other client accounted for more than 5% of our total revenue in 2009. Our clients typically retain us on a non-exclusive, engagement-by-engagement basis. Most individual client assignments are from three to twelve months; however, many of our client relationships have continued for many years. Although they may be subject to penalty provisions, clients may generally cancel a contract at any time with short notice. Under many contracts, clients may reduce or delay their use of our services without penalty. These terminations, reductions or delays could result from factors unrelated to our work product or the progress of the project, but could be related to business or financial conditions of the client, changes in client strategies or the economy generally. When contracts are terminated, for whatever reason, we lose the associated revenues, and we may not be able to eliminate associated costs in a timely manner. There is a risk, especially given the global economic recession, that we could experience a significant number of contract terminations. Consequently, our revenue and profit margins may be adversely affected.
Our current level of indebtedness places restrictions upon our business, and we face the risk of breaching the financial covenants in our Senior Credit Facility.
We have a senior credit agreement with several financial institutions as lenders and Bank of America, N.A. as administrative agent (the “Senior Credit Facility”) that matures on August 20, 2012. We had borrowed a total of $97.5 million under the Senior Credit Facility at December 31, 2009. As amended on February 18, 2010, the Senior Credit Facility provides for: 1) an $85 million revolving line of credit and 2) a term loan with a balance of $47.5 million. The term loan portion of the Senior Credit Facility requires quarterly principal reductions of $2.5 million.
CIBER’s obligations under the Senior Credit Facility are secured by all of our present and future domestic tangible and intangible assets, as well as a pledge of 66% of the capital stock of our direct foreign subsidiaries. The terms of the Senior Credit Facility, as amended, include among other provisions, specific limitations on the incurrence of additional indebtedness and liens, stock repurchases, investments, guarantees, mergers, dispositions and acquisitions, and a prohibition on the payment of any dividends. Additionally, the Senior Credit Facility also requires us to maintain certain financial covenants, including a maximum consolidated total leverage ratio, a minimum consolidated fixed charge coverage ratio, a minimum EBITDA and an asset coverage test. On occasion, we have experienced instances of covenant non-compliance under previous bank borrowings that were waived by our lenders. The failure to comply with any of these debt covenants in the future would cause a default under the Senior Credit Facility. A default, if not waived, could cause our debt to become immediately due and payable. In such a situation, we may not be able to repay our debt or borrow sufficient funds to refinance it, and even if new financing is available, it may not contain terms acceptable to us. Additionally, if we needed to obtain a waiver under, or an amendment to, the Senior Credit Facility in the future, or if we seek other financing, if available, our cost of borrowing could significantly increase and we could face more restrictive covenants. This could materially adversely affect our results of operations and financial condition. Given the current global economic recession, there is an increased risk regarding our ability to maintain compliance with these debt covenants.
In the past, we have been successful in generating sufficient cash flow from operations to reduce our indebtedness; however, that does not mean that we will be successful in doing so in the future. If we are unable to repay outstanding balances that exceed our maximum credit available as the aggregate commitments under the Senior Credit Facility are reduced, we will be in default unless we can obtain a waiver or amendment.
We could incur losses due to impairment in the carrying value of our goodwill.
We have recorded a significant amount of goodwill on our consolidated balance sheet as a result of numerous acquisitions. At December 31, 2009, the carrying value of our goodwill was $450.7 million. The carrying value of goodwill represents the fair value of an acquired business in excess of identifiable assets and liabilities as of the acquisition date. We are required to test goodwill for impairment annually and do so during the second quarter of each year, as well as on an interim basis to the extent that factors or indicators become apparent that could reduce the fair value of any of our business units below its book value. These determinations are based in part on several factors, including our judgments regarding the cash flow potential of each of our business units and involve projections that are inherently subject to change based on future events. A significant downward revision in the fair value of one or more of our business units that causes the carrying value to exceed the fair value, as determined based on discounted future cash flows of the related business, will cause goodwill to be considered impaired, and would result in a non-cash impairment charge in our consolidated statement of operations.
In June 2009, we performed our annual test for goodwill impairment. This goodwill impairment analysis did not result in an impairment charge for any of our business units. The forecasts utilized in the discounted cash flow analysis as part of our impairment test assume future growth in each of our reporting units during the next five years and beyond. Our Federal and U.S. ERP business units had decreases in their operating income or losses during 2008. If our business units can’t obtain, or we determine at a later date that we no longer expect them to obtain the projected levels of profitability, future impairment tests may result in an impairment charge. There can be no assurances that these business units will be able to achieve our estimated levels of profitability. We currently have goodwill of $74.3 million and $54.3 million recorded for our Federal and U.S. ERP business units, respectively, and there was not significant excess fair value during the June 2009 annual impairment test. The downturn in our financial results in the second half of 2009, particularly in our Custom Solutions and Federal business units, increases our risk of a future goodwill impairment charge if we cannot start to grow revenue and profits in these business units in 2010.
Given the deteriorated global economic conditions affecting our industry and impacting our customers and their use of our services, we cannot be certain that goodwill impairment will not be required during future periods. Additionally, if a goodwill impairment charge related to any one of our business units were required, it would likely trigger a violation of the financial covenants under our Senior Credit Facility.
Financial and operational risks of our international operations could result in a decline in revenue and profitability.
We have continued to expand our international operations and estimate that our foreign offices currently represent approximately 35% of our total revenue. We operate in 17 foreign countries. Due to our international operations, we are subject to a number of financial and operational risks that may adversely affect our revenue and profitability, including:
· the costs and difficulties relating to managing geographically diverse operations;
· foreign currency exchange rate fluctuations (discussed in more detail below);
· differences in, and uncertainties arising from, changes in foreign business culture and practices;
· restrictions on the movement of cash and the repatriation of earnings;
· multiple and possibly overlapping or conflicting tax laws;
· the costs of complying with a wide variety of national and local laws;
· operating losses incurred in certain countries and the non-deductibility of those losses for tax purposes; and
· differences in, and uncertainties arising from, changes in legal, labor, political and economic conditions, as well as international trade regulations and restrictions, and tariffs.
The revenues and expenses of our international operations generally are denominated in local currencies. Accordingly, we are subject to exchange rate fluctuations between such local currencies and the U.S. dollar. These exchange rate fluctuations subject us to currency translation risk with respect to the reported results of our international operations and the cost of potential acquisitions. There can be no assurance that we will not experience fluctuations in financial results from our operations outside of the U.S., and there can be no assurance that we will be able, contractually or otherwise, to reduce the currency risks associated with our international operations. We manage our exposure to changes in foreign currency exchange rates through our normal operating and financing activities and, when deemed appropriate, with derivative financial instruments. There is no assurance that we will continue to use such financial instruments in the future or that any such use will be successful in managing or controlling foreign currency risks.
Foreign exchange rate fluctuations negatively impacted our 2009 results of operations and such adverse effects may continue. Over one-third of our 2009 consolidated revenue was generated in foreign currencies. Significant strengthening of the U.S. dollar against currencies like the Great Britain Pound and the Euro negatively impacted revenue and profits in the last quarter of 2008 and throughout much of 2009. Overall, revenue for fiscal 2009 decreased by approximately 4% as compared to the same period of 2008 due to foreign exchange rates. In addition, we have transactions with clients, as well as inter-company transactions between our subsidiaries, that cross currencies and expose us to foreign currency gains and losses. These types of events are difficult to predict and may be expected to recur. Accordingly, we could experience material losses in revenues and earnings due to fluctuations in foreign currency rates, and in addition these may cause material fluctuations in our revenues and earnings from period to period.
We depend on contracts with various federal, state and local government agencies for a significant portion of our revenue and, if the spending policies or budget priorities of these agencies change, we could lose revenue.
In 2009, approximately 29% of our total revenue was from public sector clients, including federal, state, local and foreign governments and agencies. The market for our services depends largely on federal and state legislative programs and the budgetary capability to support programs, including the continuance of existing programs. These programs can be modified or amended at any time by acts of such governments. The various agencies of the U.S. federal government collectively represent our largest customer accounting for 11% of our total revenue in 2009. In addition, changes in federal initiatives or in the level of federal spending due to budgetary or deficit considerations may have a significant impact on our future financial performance, as may curtailment of the federal government’s use of consulting and technology services firms, the adoption of new laws or regulations that affect companies providing services to the federal government and potential delays in the government appropriation process.
Additionally, government contracts contain provisions and are subject to laws and regulations that provide government clients with rights and remedies not typically found in commercial contracts. Among other things, governments may terminate contracts with short notice for convenience, as well as for default, and may cancel multi-year contracts if funds become unavailable.
Our revenues, operating results and profitability will vary from quarter to quarter, which may result in increased volatility in the price of our securities.
Our quarterly revenues, operating results and profitability have varied in the past and, in the future are likely to vary significantly from quarter to quarter, making them difficult to predict. This may lead to volatility in the price of our securities. Some of the factors that are likely to cause these variations are:
· the business decisions of our clients regarding the use of our services;
· the stage of completion of existing projects and/or their termination;
· client satisfaction with our services;
· our clients’ financial ability to pay for our services;
· our ability to properly manage and execute client projects, especially those under fixed-price arrangements;
· our ability to properly price fixed-price contracts to provide for adequate profits;
· our ability to maintain our profit margins and manage costs, including those for personnel and support services;
· acquisition and integration costs related to possible acquisitions of other businesses;
· changes in, or the application of changes in, accounting principles or pronouncements under U.S. generally accepted accounting principles;
· changes in significant accounting estimates;
· changes in interest rates on our debts;
· currency exchange rate fluctuations;
· changes in estimates, accruals or payments of variable compensation to our employees; and
· global, regional and local economic and political conditions and related risks.
Our profit margin, and therefore our profitability, is largely a function of the rates we charge for our services and the utilization rate, or chargeability, of our consultants. Accordingly, if we are not able to maintain the rates we charge for our services or an appropriate utilization rate for our consultants, we will not be able to sustain our profit margin and our profitability will suffer. A number of factors affect the rates we charge for our services, including:
· our clients’ perception of our ability to add value through our services;
· changes in our pricing policies or those of our competitors;
· the introduction of new products or services by us or our competitors;
· the use of globally-sourced, lower-cost service delivery capabilities by our competitors and our clients; and
· economic conditions in the U.S. and abroad.
Additionally, a number of factors affect our utilization rates, such as:
· seasonality, including number of workdays and holiday and summer vacations;
· our ability to transition consultants quickly from completed projects to new engagements;
· our ability to forecast demand for our services and thereby maintain an appropriately balanced and sized workforce; and
· our ability to manage employee turnover.
As a services business, our largest expense is salaries and payroll-related expenses. However, it is our skilled employees that generate our revenues. Balancing our workforce levels against the demands for our services is extremely difficult in troubled economic times. Delays or cutbacks in projects or delays in finding new projects increase the non-productive time of our consultants which decrease our utilization levels and our margins. We generally cannot reduce our labor costs as quickly as negative changes in revenue can occur. In addition, in a number of the foreign countries in which we operate, the local labor regulations make it very expensive to involuntarily terminate employees. As a result, our foreign operations will often retain underutilized employees for longer periods than our domestic operations.
Our business could be adversely affected if our clients are not satisfied with our services, and we could face damage to our professional reputation and/or legal liability.
As a professional services firm, we depend largely on our relationships with our clients and our reputation for high-quality professional services and integrity to attract and retain clients. Additionally, many of our engagements involve projects that are critical to the operations of our clients’ businesses. If a client is not satisfied with the quality of work performed by us or a subcontractor, or with the type of services or solutions delivered, we could incur additional costs to address the situation, the profitability of that work might be impaired, and the client’s dissatisfaction with our services could damage our ability to obtain additional work from that client. Clients that are not satisfied may also seek to terminate our contracts. In addition, negative publicity related to our client relationships, regardless of its accuracy, may further damage our business by affecting our ability to compete for new contracts with current and prospective clients.
If we do not meet our contractual obligations to a client, it could subject us to legal liability. Our contracts typically include provisions to limit our exposure to legal claims relating to our services and the applications we develop; however, these provisions may not protect us, or may not be enforceable under some circumstances or under the laws of some jurisdictions. We may enter into non-standard agreements because we perceive an important economic opportunity or because our personnel did not adequately adhere to our guidelines. We may find ourselves committed to providing services that we are unable to deliver or whose delivery will cause us financial loss. If we cannot or do not fulfill our obligations, we could face legal liability. Although we maintain professional liability insurance, the policy limits may not be adequate to provide protection against all potential liabilities. In addition, if we were to fail to properly deliver on a project, we may not be able to collect any related accounts receivable or could even be required to refund amounts paid by the client.
We may experience declines in revenue and profitability if we do not accurately estimate the cost of a large engagement conducted on a fixed-price basis.
Although the percentage may vary from year to year, we estimate that approximately 20-25% of our total services revenue in 2009 was from engagements performed in accordance with fixed-price contracts. When making a proposal or managing a fixed-price engagement, we rely on our estimates of costs and timing for delivering our services, which might be based on limited data and could turn out to be inaccurate. These estimates reflect our best judgment regarding the efficiencies of our methodologies and consultants as we plan to apply them to the engagement. If we do not accurately estimate our costs and timing for completion of projects, our contract could prove unprofitable or yield a profit margin that is lower than expected.
Some fixed-price engagements are long-term contracts of three to five years and estimating future year costs on such engagements is extremely difficult and subject to additional risks. Often our cost estimates and pricing from outsourcing projects anticipates long-term cost savings from transformational and other initiatives that we expect to benefit from over the term of the outsourcing contract. There is a risk that we will fail to accurately estimate the costs of performing our services, and that we will under price our contracts having an adverse effect on our profits.
Losses, if any, on fixed-price contracts are recognized when the loss is determined. Any increased or unexpected costs or unanticipated delays in connection with the performance of fixed-price contracts, including delays caused by factors outside of our control, could make these contracts less profitable or unprofitable and may affect the amount of revenue reported in any period. In addition, these risks may be heightened by the current difficult economic conditions.
A privacy breach could adversely affect our business.
The protection of client, employee and company data is critical to the Company. The regulatory environment surrounding information security and privacy is increasingly demanding, with the frequent imposition of new and constantly changing requirements. In addition, our clients have a high expectation that we will adequately protect their confidential information. We are required at times to manage, utilize and store sensitive or confidential client or employee data. As a result, we are subject to numerous U.S. and foreign jurisdiction laws and regulations designed to protect this information, such as the European Union Directive on Data Protection and various U.S. federal and state laws governing the protection of health or other individually identifiable information. If any person, including any of our employees, negligently disregards or intentionally breaches our established controls with respect to such data or otherwise mismanages or misappropriates that data, we could be subject to monetary damages, fines and/or criminal prosecution. Unauthorized disclosure of sensitive or confidential client or employee data, whether through systems failure, employee negligence, fraud or misappropriation, could damage our reputation and cause us to lose clients. Similarly, unauthorized access to or through our information systems or those we develop for our clients, whether by our employees or third parties, could result in negative publicity, legal liability and damage to our reputation.
If we are unable to collect our receivables, our results of operations and cash flows could be adversely affected.
Our business depends on our ability to successfully obtain payment from our clients for the amounts they owe us for work performed. We evaluate the financial condition of our clients and usually bill and collect on relatively short cycles. We maintain allowances against receivables, but actual losses on client balances could differ from those that we currently anticipate and as a result, we might need to adjust our allowances. There is no guarantee that we will accurately assess the creditworthiness of our clients. In addition, timely collection of client balances depends on our ability to complete our contractual commitments and bill and collect our contracted revenues. Deteriorating global economic conditions in 2008 and 2009 resulted in financial difficulties for a number of our clients and, consequentially, we experienced a greater amount of bad debt expense from clients filing for bankruptcy.
If we are unable to meet our contractual requirements, we might experience delays in the collection of, and/or be unable to collect, our client balance and, if this occurs, our results of operations and cash flows could be adversely affected.
Unfavorable government audits could require us to adjust previously reported operating results, to forego anticipated revenue and subject us to penalties and sanctions.
The government agencies we contract with generally have the authority to audit and review our contracts with them. As part of that process, the government agency reviews our performance on the contract, our pricing practices, our cost structure and our compliance with applicable laws, regulations and standards. An audit of our work, including an audit of work performed by companies we have acquired or may acquire, could result in a substantial adjustment to our previously reported operating
results. For example, any costs that were originally reimbursed could be subsequently disallowed. In this case, cash we have already collected may have to be refunded and operating margins may be reduced.
If a government audit uncovers improper or illegal activities by us, or we otherwise determine that these activities have occurred, we may be subject to civil and criminal penalties and administrative sanctions, including termination of contracts, forfeiture of profits, suspension of payments, fines and suspension or disqualification from doing business with the government. Any unfavorable determination could adversely affect our ability to bid for new work with one or more jurisdictions.
Our future success depends on our ability to continue to retain and attract qualified employees.
Our business involves the delivery of professional services and is highly labor intensive. Our future success depends upon our ability to continue to attract, train, effectively motivate and retain highly-skilled technical, managerial, sales and marketing personnel. Although we invest significant resources in recruiting and retaining employees, there is often considerable competition for certain personnel in the IT services industry and as a result, employee turnover is generally high. From time to time, we have trouble locating enough highly-qualified candidates that are in our desired geographic locations, with the required specific expertise or at the desired compensation levels. The inability to attract and retain qualified employees in sufficient numbers could have a serious negative effect on us, including our ability to obtain and successfully complete important client engagements and thus, maintain or increase our revenues. Such conditions could also force us to resort to the use of higher-priced subcontractors, which would adversely affect the profitability of the related engagement.
In addition, we believe that there are certain key employees within the organization, primarily in the senior management team, who are important for us to meet our objectives. Due to the competitive employment nature of our industry, there is a risk that we will not be able to retain these key employees. The loss of one or more key employees could adversely affect our continued growth. In addition, uncertainty created by turnover of key employees could result in reduced confidence in our financial performance, which could cause fluctuations in the price of our securities and result in further turnover of our employees.
Our services or solutions could infringe upon the intellectual property rights of others, or we might lose our ability to utilize the intellectual property of others.
We cannot be sure that our services and solutions, or the solutions of others that we offer to our clients, do not infringe on the intellectual property rights of third parties, and we could have infringement claims asserted against us or against our clients. These claims could harm our reputation, cost us money and prevent us from offering some services or solutions. In a number of our contracts, we agree to indemnify our clients for expenses or liabilities resulting from claimed infringements of the intellectual property rights of third parties. In some instances, the amount of these indemnities could be greater than the revenues we receive from the client. Any claims or litigation in this area, whether we ultimately win or lose, could be time-consuming and costly, injure our reputation or require us to enter into royalty or licensing arrangements. We might not be able to enter into these royalty or licensing arrangements on acceptable terms. If a claim of infringement were successful against us or our clients, an injunction might be ordered against our clients or our own services or operations, causing further damages. We could lose our ability to utilize the intellectual property of others. Third-party suppliers of software, hardware or other intellectual assets could be acquired or sued, and this could disrupt use of their products or services by us and our clients. If our ability to provide services and solutions to our clients is impaired, our operating results could be adversely affected.
We have adopted anti-takeover defenses that could make it difficult for another company to acquire control of CIBER or limit the price investors might be willing to pay for our stock, thus affecting the market price of our securities.
We have adopted a Rights Agreement, commonly known as a “poison pill,” under which each stockholder of the Company holds one share purchase right, which we refer to as a Right, for each share of Company common stock held. The Rights become exercisable upon the occurrence of certain events and may make the acquisition of our Company more difficult and expensive. In addition, our certificate of incorporation and bylaws each contain provisions that may make the acquisition of our Company more difficult without the approval of our board of directors, including a provision that gives our board of directors the ability to issue preferred stock and determine the rights and designations of the preferred stock at any time without stockholder approval. The rights of the holders of our common stock will be subject to, and may be adversely affected by, the rights of the holders of any preferred stock that may be issued in the future. The issuance of preferred stock by our board of directors pursuant to our certificate of incorporation could have the effect of making it more difficult for a third party to acquire, or of discouraging a third party from acquiring, a majority of the outstanding voting stock of CIBER.
In addition, the staggered terms of our board of directors could have the effect of delaying or deferring a change in control. These provisions could limit the price that investors might be willing to pay in the future for our securities and as a result, the price of our securities could decline.
The above factors and certain provisions of the Delaware General Corporation Law may have the effect of deterring hostile takeovers or otherwise delaying or preventing changes in the control or management of CIBER; this could adversely affect transactions in which our stockholders might otherwise receive a premium over the then-current market price for their CIBER securities.
Item 1B. Unresolved Staff Comments
None.
Item 2. Properties
Our corporate office is located at 6363 South Fiddler’s Green Circle, Suite 1400, Greenwood Village, Colorado 80111, where we, along with our Denver area operations, occupy approximately 77,000 square feet under a lease that expires in December 2018. Generally, we provide our services at client locations and therefore, our office locations are primarily used for sales and other administrative functions. At December 31, 2009, we had lease obligations for approximately 700,000 square feet of office space in approximately 100 locations.
We believe our facilities are adequate for our current level of operations.
The Company is involved in legal proceedings, audits, claims and litigation arising in the ordinary course of business. Although the outcome of such matters is not predictable with assurance, we do not expect that the ultimate outcome of any of these matters, individually or in the aggregate, will have a material adverse effect on our financial condition, results of operations or cash flows.
Item 5. Market for Registrant’s Common Equity, Related Shareholder Matters and Issuer Purchases of Equity Securities
Market Information, Holders and Dividends
Our common stock is listed on the New York Stock Exchange under the symbol “CBR.” The table below sets forth, for the periods indicated, the low and high sales price per share of our common stock.
|
|
|
Year Ended |
|
Year Ended |
|
||||||||
|
|
|
December 31, 2008 |
|
December 31, 2009 |
|
||||||||
|
|
|
Low |
|
High |
|
Low |
|
High |
|
||||
|
First Quarter |
|
$ |
4.20 |
|
$ |
6.20 |
|
$ |
2.03 |
|
$ |
5.66 |
|
|
Second Quarter |
|
4.60 |
|
7.50 |
|
2.64 |
|
3.69 |
|
||||
|
Third Quarter |
|
5.57 |
|
8.97 |
|
2.99 |
|
4.50 |
|
||||
|
Fourth Quarter |
|
2.95 |
|
7.10 |
|
2.88 |
|
4.08 |
|
||||
The closing price of our common stock on February 19, 2010, was $3.82. As of February 19, 2010, there were 2,753 registered holders of record of our common stock. We estimate there are approximately 11,200 beneficial owners of our common stock.
Our policy is to retain our earnings to support the growth of our business. Accordingly, we have never paid cash dividends on our common stock and have no present plans to do so. In addition, pursuant to the terms of our Senior Credit Facility, we are prohibited from paying dividends on our stock.
Securities Authorized for Issuance under Equity Compensation Plans
Information regarding securities authorized for issuance under our equity compensation plans can be found under “Security Ownership of Certain Beneficial Owners and Management and Related Stockholder Matters.”
Recent Sales of Unregistered Securities and Use of Proceeds from Registered Securities
None.
Purchases of Equity Securities by the Issuer
The following table sets forth the information required regarding repurchases of our equity securities made during the three months ended December 31, 2009.
|
Period (1) |
|
Total
Number of |
|
Average
Price Paid |
|
Total
Number of |
|
Maximum
Number |
|
||
|
|
|
|
|
|
|
|
|
|
|
||
|
October 2009 |
|
210,392 |
|
$ |
3.70 |
|
210,392 |
|
$ |
5,867,252 |
|
|
November 2009 |
|
85,000 |
|
$ |
3.27 |
|
85,000 |
|
$ |
5,589,393 |
|
|
December 2009 |
|
20,000 |
|
$ |
3.21 |
|
20,000 |
|
$ |
5,525,230 |
|
|
Total |
|
315,392 |
|
$ |
3.55 |
|
315,392 |
|
|
|
|
(1) Calendar month
(2) As of end of month indicated
(3) CIBER has had a common stock share repurchase program since 1999, under which we have repurchased approximately 23.8 million shares for a total cost of $196.2 million, and that has been amended from time to time by our Board of Directors. Following the most recent authorization in October 2009, approximately $5.5 million remained available at December 31, 2009 (see above table).
Performance Graph
The following graph compares the cumulative 5 year total return provided to shareholders on CIBER, Inc.’s common stock relative to the cumulative total returns of the S&P 500 index, the RDG MicroCap Technology index, and two customized peer groups of companies that includes an old peer group of five companies, which are: Accenture plc, BearingPoint, Inc, CACI International Inc, CGI Group Inc. and Maximus, Inc.; and another new peer group of ten companies which are: Accenture plc, Atos Origin SA, BearingPoint, Inc, CACI International Inc, Cap Gemini SA, CGI Group Inc., Cognizant Technology Solutions, Logica PLC, Maximus, Inc. and Tieto Corporation. The Company utilizes self-constructed peer groups to better align itself with industry competition. An investment of $100 (with reinvestment of all dividends) is assumed to have been made in our common stock, in each of the peer groups, and in the indices on December 31, 2004, and its relative performance is tracked through December 31, 2009.
COMPARISON OF 5 YEAR CUMULATIVE TOTAL RETURN*
Among CIBER, Inc., The S&P 500 Index, The RDG MicroCap Technology Index
An Old Peer Group And A New Peer Group
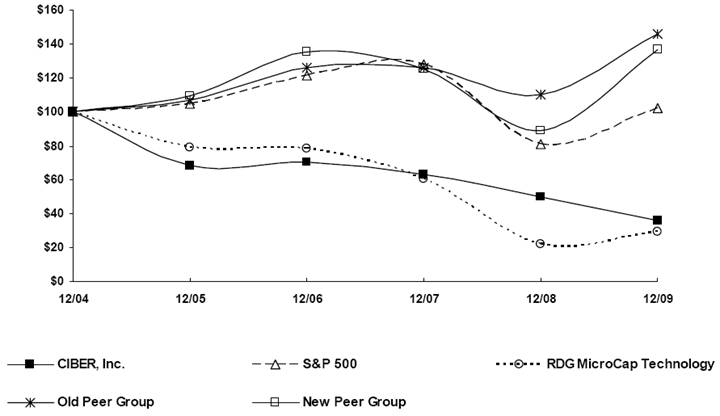
*$100 invested on 12/31/04 in stock or index, including reinvestment of dividends. Fiscal year ending December 31.
Copyright© 2010 S&P, a division of The McGraw-Hill Companies Inc. All rights reserved.
Corresponding index value and common stock price values are given below:
|
|
|
Cumulative Total Return |
|
||||||||||||||||
|
|
|
12/04 |
|
12/05 |
|
12/06 |
|
12/07 |
|
12/08 |
|
12/09 |
|
||||||
|
|
|
|
|
|
|
|
|
|
|
|
|
|
|
||||||
|
CIBER, Inc. |
|
100.00 |
|
68.46 |
|
70.33 |
|
63.38 |
|
49.90 |
|
35.79 |
|
||||||
|
S & P 500 |
|
100.00 |
|
104.91 |
|
121.48 |
|
128.16 |
|
80.74 |
|
102.11 |
|
||||||
|
RDG MicroCap Technology |
|
100.00 |
|
78.95 |
|
78.44 |
|
60.68 |
|
21.93 |
|
28.99 |
|
||||||
|
Old Peer Group |
|
100.00 |
|
107.19 |
|
126.42 |
|
125.84 |
|
110.44 |
|
145.99 |
|
||||||
|
New Peer Group |
|
100.00 |
|
109.31 |
|
135.59 |
|
125.76 |
|
89.25 |
|
136.82 |
|
||||||
|
CIBER, Inc. Closing Stock Price |
|
$ |
9.64 |
|
$ |
6.60 |
|
$ |
6.78 |
|
$ |
6.11 |
|
$ |
4.81 |
|
$ |
3.45 |
|
Item 6. Selected Financial Data
We have derived the selected consolidated financial data presented below from our Consolidated Financial Statements and the related Notes. This information should be read in conjunction with “Management’s Discussion and Analysis of Financial Condition and Results of Operations” and our Consolidated Financial Statements and related Notes, included under “Financial Statements and Supplementary Data” of this Annual Report.
|
|
|
As of and for the Year Ended December 31, |
|
|||||||||||||
|
|
|
2005 |
|
2006 |
|
2007 |
|
2008 |
|
2009 |
|
|||||
|
|
|
(In thousands, except per share data) |
|
|||||||||||||
|
Statement of Operations Data: |
|
|
|
|
|
|
|
|
|
|
|
|||||
|
Revenue |
|
$ |
956,009 |
|
$ |
995,837 |
|
$ |
1,081,975 |
|
$ |
1,191,567 |
|
$ |
1,037,700 |
|
|
Gross profit |
|
257,177 |
|
266,079 |
|
292,459 |
|
324,480 |
|
259,293 |
|
|||||
|
Selling, general and administrative expenses |
|
204,563 |
|
215,109 |
|
232,119 |
|
264,268 |
|
225,643 |
|
|||||
|
Operating income |
|
46,656 |
|
45,040 |
|
54,520 |
|
53,938 |
|
27,759 |
|
|||||
|
Net income — CIBER, Inc. |
|
24,707 |
|
24,735 |
|
23,951 |
|
26,884 |
|
14,958 |
|
|||||
|
Net Income Per Share — CIBER, Inc.: |
|
|
|
|
|
|
|
|
|
|
|
|||||
|
Basic |
|
$ |
0.40 |
|
$ |
0.40 |
|
$ |
0.39 |
|
$ |
0.45 |
|
$ |
0.22 |
|
|
Diluted |
|
0.38 |
|
0.40 |
|
0.39 |
|
0.45 |
|
0.22 |
|
|||||
|
Weighted Average Shares Outstanding: |
|
|
|
|
|
|
|
|
|
|
|
|||||
|
Basic |
|
62,536 |
|
61,925 |
|
61,207 |
|
60,092 |
|
67,996 |
|
|||||
|
Diluted |
|
68,296 |
|
62,357 |
|
61,924 |
|
60,389 |
|
68,107 |
|
|||||
|
|
|
|
|
|
|
|
|
|
|
|
|
|||||
|
Balance Sheet Data: |
|
|
|
|
|
|
|
|
|
|
|
|||||
|
Working capital |
|
$ |
147,382 |
|
$ |
140,757 |
|
$ |
173,924 |
|
$ |
165,233 |
|
$ |
136,854 |
|
|
Total assets |
|
744,567 |
|
779,679 |
|
848,931 |
|
797,520 |
|
803,256 |
|
|||||
|
Long-term debt, current portion |
|
2,000 |
|
3,602 |
|
9,108 |
|
2,002 |
|
10,697 |
|
|||||
|
Long-term debt, non-current portion |
|
217,638 |
|
192,092 |
|
193,978 |
|
165,710 |
|
87,500 |
|
|||||
|
Total shareholders’ equity |
|
376,607 |
|
416,122 |
|
459,939 |
|
453,324 |
|
506,246 |
|
|||||
|
|
|
|
|
|
|
|
|
|
|
|
|
|||||
|
Shares outstanding, net of treasury |
|
62,047 |
|
61,753 |
|
60,747 |
|
60,085 |
|
69,482 |
|
|||||
Note: On January 1, 2009, we were required to retrospectively apply new accounting guidance related to convertible debt and noncontrolling interests to our previously reported results for 2007 and 2008. As a result, the amounts shown in the table above for 2007 and 2008 are the adjusted amounts following these retrospective accounting adjustments. Our results for 2005 and 2006 have not been adjusted for this retrospective application. Please see Note 1 to the Consolidated Financial Statements included herein for additional discussion.
Additionally, please refer to Note 12 to the Consolidated Financial Statements included herein for a discussion of our February 2009 offering of common shares and the use of the net proceeds from that offering to pay down a portion of our long-term debt.
Item 7. Management’s Discussion and Analysis of Financial Condition and Results of Operations
The following discussion and analysis should be read in conjunction with our Consolidated Financial Statements and related Notes included elsewhere in this Annual Report on Form 10-K. This section also contains forward-looking statements and should be read in conjunction with the section of this report titled “Disclosure Regarding Forward-Looking Statements.”
Business and Industry Overview
CIBER provides IT system integration consulting and other IT services primarily to governmental agencies and Fortune 1000 and middle market companies across most major industries. From offices located throughout the United States and Europe, as well as Eastern Asia, Australia and New Zealand, we provide our clients with a broad range of IT services, including custom and package software development, maintenance, implementation and integration. To a lesser extent, we also resell certain IT hardware and software products.
Our reportable segments are our operating divisions, which are organized internally primarily by the nature of their services, client base and geography. In 2009, we made several changes to our divisions in order to better align our operations, reduce overhead costs and to separate our growing IT Outsourcing practice into its own division. All prior year segment data has been adjusted to conform to the 2009 presentation. Our divisions now consist of our International division (formerly Europe), which includes Europe, Eastern Asia, Australia and New Zealand, and our Custom Solutions, IT Outsourcing, Federal and U.S. ERP (formerly Enterprise Solutions) divisions. Our International division provides a broad range of IT consulting services, including package software implementation, application development, systems integration and support services, with SAP-related solutions and services accounting for 60% to 65% of its total revenue in 2009. Our Custom Solutions and Federal divisions provide IT services and products in custom-developed software environments. Our India-based operations are considered part of our Custom Solutions division. Our IT Outsourcing division offers a set of solutions that span the entire spectrum of IT infrastructure and IT operations services. Our U.S. ERP division primarily provides enterprise software implementation services, including ERP software from software vendors such as Oracle, SAP and Lawson for U.S. customers.
We recognize the majority of our services revenue under time-and-material contracts as hours and costs are incurred. Under fixed-price contracts, which currently make up approximately 20-25% of our services revenue, our revenue is fixed under the contract, while our costs to complete our obligations under the contract are variable. As a result, our profitability on fixed-price contracts can vary significantly and occasionally can even be a loss. Changes in our services revenue are primarily a function of hours worked on revenue-generating activities and, to a lesser extent, changes in our average rate per hour and changes in contract mix. Hours worked on revenue-producing activities vary with the number of consultants employed and their utilization level. Utilization represents the percentage of time worked on revenue-producing engagements divided by the standard hours available (i.e., 40 hours per week). Our average utilization rates are higher in our Custom Solutions and Federal divisions (typically around 85% to 90%) as compared to our International and U.S. ERP divisions (typically around 75% to 80%). With time-and-materials contracts, higher consultant utilization results in increased revenue; however, with fixed-price contracts, it may result in higher costs and lower gross profit margins because our revenue is fixed. We actively manage both our number of consultants and our overall utilization levels. If we determine we have excess available resources that we cannot place on billable assignments in the near future, we consider reducing those resources. As a result, during the last three years, most of our consultant turnover has been from involuntary termination of employment.
The hourly rate we charge for our services varies based on the level of the consultant involved, the particular expertise of the consultant and the geographic area. Our typical time-and-materials hourly rates range from $50 to $200 per hour and, on average, are generally highest in our U.S. ERP division and lowest in our Federal division. We also have fixed-price projects, as well as engagements whose pricing is based on cost-plus or level-of-effort. For such projects, where our revenue is not directly based on hours incurred, our realized rate per hour will vary significantly depending on success or overages on such projects.
Selling, general and administrative (“SG&A”) costs as a percentage of revenue vary by business segment. Close to 60% of our overall SG&A expenses are typically for personnel costs for our branch office personnel, which includes our branch management, consulting staff management, sales and recruiting personnel and administrative staff, as well as our corporate office support staff and management personnel. Although these costs are not immediately affected by changes in revenue, there is often a relatively short-term correlation between these SG&A salary expenses and revenue. Additionally, as we bid on larger and longer projects, the sales cycle and related sales costs have been increasing. As a result of the above, we analyze changes in our SG&A expenses in terms of the relationship between these costs and revenue (expressed as a percentage of revenue) rather than total dollars or percentage change in the total dollars.
Other revenue includes resale of third-party IT hardware and software products, sales of proprietary software and commissions on sales of IT products. Our sales of IT hardware and software generally involve IT network infrastructure. The gross profit margin on consolidated other revenues is typically in the range of 30% to 50%. This is a blend of low-margin hardware sales (typically a 5% to 10% gross margin), mid-margin software sales (typically a 20% to 40% gross margin) and higher-margin product commissions and proprietary software sales. Depending on the mix of these business activities, gross profit margin on other revenue will fluctuate.
The market demand for CIBER’s services is heavily dependent on IT spending by major corporations, organizations and government entities in the markets and regions that we serve. The pace of technological advancement and changes in business requirements and practices of our clients all have a significant impact on the demand for the services that we provide.
Our International division comprised over one-third of our total revenues in both 2008 and 2009, up from 29% of consolidated revenues in 2007. Our International division operates primarily in Western Europe, but also has offices in China, Russia, Australia and New Zealand. As such, these operations transact business in local currencies of the countries in which they operate. Generally in recent years, approximately 50% to 55% of our International division’s revenue has been denominated in Euro’s, approximately 15% to 20% has been denominated in Great Britain Pounds (“GBP”) and the balance has come from a number of other currencies. Changes in the exchange rates between these foreign currencies and the U.S. dollar affect the reported amounts of our assets, liabilities, revenues and expenses. For financial reporting purposes, the assets and liabilities of our foreign operations are translated into U.S. dollars at current exchange rates at period end and revenues and expenses are translated at average exchange rates for the period.
Retroactive Accounting Pronouncement Adjustments
In May 2008, the Financial Accounting Standards Board (“FASB”) issued new accounting guidance on convertible debt instruments that may be settled in cash upon conversion. This guidance requires that the proceeds from the issuance of certain convertible debt instruments be allocated between a liability component (issued at a discount) and the embedded conversion option (i.e., the equity component) in a manner that reflects the entity’s nonconvertible debt borrowing rate. The difference between the principal amount of the debt and the amount of the proceeds allocated to the liability component must be reported as a debt discount and subsequently amortized to earnings as additional non-cash interest expense over the convertible debt’s expected life using the effective interest method. We adopted this guidance, which requires retrospective application for all periods presented, on January 1, 2009. The adoption changed the historical accounting treatment for our Convertible Senior Subordinated Debentures (“Debentures”) even though all of our Debentures were repurchased and retired prior to December 31, 2008.
In December 2007, the FASB issued accounting guidance contained within ASC 810, “Consolidation,” regarding noncontrolling interests. This guidance requires that the noncontrolling interests in the equity of a subsidiary be accounted for and reported as equity, provides revised guidance on the treatment of net income and losses attributable to the noncontrolling interests and changes in ownership interests in a subsidiary and requires additional disclosures that identify and distinguish between the interest of the controlling and noncontrolling owners. We prospectively adopted these requirements on January 1, 2009, except for the presentation and disclosure requirements, which have been applied retrospectively to all periods presented.
The required retrospective applications of the above guidance had the following impact on our net income, diluted earnings per share and presentation of the consolidated statement of operations for the 2007 and 2008 annual periods:
|
|
|
2007 |
|
2008 |
|
||
|
|
|
|
|
|
|
||
|
Net income — CIBER, Inc., as previously reported |
|
$ |
29,026 |
|
$ |
29,956 |
|
|
Impact of convertible debenture adjustment |
|
(5,075 |
) |
(3,072 |
) |
||
|
Net income — CIBER, Inc., as adjusted |
|
23,951 |
|
26,884 |
|
||
|
Net income — noncontrolling interests |
|
1,566 |
|
929 |
|
||
|
Consolidated net income |
|
$ |
25,517 |
|
$ |
27,813 |
|
|
|
|
|
|
|
|
||
|
Earnings per share — basic and diluted: |
|
|
|
|
|
||
|
Net income — CIBER, Inc., as previously reported |
|
$ |
0.47 |
|
$ |
0.50 |
|
|
Impact of convertible debenture adjustment |
|
(0.08 |
) |
(0.05 |
) |
||
|
Net income — CIBER, Inc., as adjusted |
|
$ |
0.39 |
|
$ |
0.45 |
|
Comparison of the Years Ended December 31, 2009 and 2008 - Consolidated
We translate the results of our foreign operations into U.S. dollars from the relevant local currencies. In periods when the U.S. dollar is weaker, this results in a proportionately larger number of U.S. dollars, and thus helps our results. In U.S. dollar terms, currency rates were favorable for CIBER during the first 3 quarters of 2008. During the fourth quarter of 2008, we saw significant declines in foreign exchange rates as compared to the U.S. dollar. The strength of the U.S. dollar remained fairly consistent throughout the first half of 2009, only to weaken against foreign currencies during the second half of the year, making for a more favorable currency environment for CIBER once again by the end of 2009 as compared to the end of 2008. The foreign exchange rates used for translating the balance sheet of our foreign operations at December 31, 2009, increased by 4% for the Euro and 11% for the GBP as compared to December 31, 2008. The negative impact on our financial results related to the strength of the U.S. dollar during the first half of 2009 was partially offset by a weaker U.S. dollar in the second half of the year, resulting in an overall decrease in revenue of approximately $41 million in 2009.
The following table sets forth certain Consolidated Statement of Operations data in dollars and expressed as a percentage of revenue:
|
|
|
Year Ended December 31, |
|
||||||||
|
|
|
2008 |
|
2009 |
|
||||||
|
|
|
(Dollars in thousands, except billing rate) |
|
||||||||
|
Consulting services |
|
$ |
1,133,233 |
|
95.1 |
% |
$ |
992,779 |
|
95.7 |
% |
|
Other revenue |
|
58,334 |
|
4.9 |
|
44,921 |
|
4.3 |
|
||
|
Total revenue |
|
1,191,567 |
|
100.0 |
|
1,037,700 |
|
100.0 |
|
||
|
|
|
|
|
|
|
|
|
|
|
||
|
Gross profit — consulting services |
|
303,427 |
|
26.8 |
|
242,615 |
|
24.4 |
|
||
|
Gross profit — other revenue |
|
21,053 |
|
36.1 |
|
16,678 |
|
37.1 |
|
||
|
Gross profit — total |
|
324,480 |
|
27.2 |
|
259,293 |
|
25.0 |
|
||
|
|
|
|
|
|
|
|
|
|
|
||
|
SG&A expenses |
|
264,268 |
|
22.2 |
|
225,643 |
|
21.7 |
|
||
|
|
|
|
|
|
|
|
|
|
|
||
|
Operating income |
|
53,938 |
|
4.5 |
|
27,759 |
|
2.7 |
|
||
|
|
|
|
|
|
|
|
|
|
|
||
|
Net income — CIBER, Inc. |
|
26,884 |
|
2.3 |
|
14,958 |
|
1.4 |
|
||
|
|
|
|
|
|
|
|
|
|
|
||
|
Consultant utilization |
|
87 |
% |
|
|
86 |
% |
|
|
||
|
Average billable headcount |
|
7,395 |
|
|
|
7,130 |
|
|
|
||
Revenue. Total revenue decreased $153.9 million, or 13%, for 2009 compared to 2008. Poor economic conditions and the strength of the U.S. dollar against many currencies between the comparable periods are primarily responsible for the decline. Foreign currency rate changes resulted in a reduction in 2009 reported revenue of approximately $41 million, or 4%, compared with 2008. Excluding the unfavorable currency translation effects, our total revenue decreased 9% for 2009 compared to 2008. The global economic downturn, which began late in 2008, has led to lower overall demand for IT services and products. Over much of the period from late 2008 and throughout most of 2009, many of our clients and prospects have been focused on initiatives to deliver near- and medium-term cost savings, and while they continue to exercise caution in launching new IT projects, especially larger ones, we are engaging in more conversations with our clients and prospects about possible projects relating to their future growth. Many clients and prospects have reduced, delayed or cancelled IT spending over this same time period. We have also experienced pricing pressures from existing clients and prospects that have been working hard to manage their costs, but we have recently seen a slowing in the frequency of pricing pressure from existing customers. The pricing environment for new work, however, continues to be very competitive.
Revenue by segment/division was as follows:
|
|
|
Year Ended December 31, |
|
|
|
||||
|
|
|
2008 |
|
2009 |
|
% change |
|
||
|
|
|
(In thousands) |
|
|
|
||||
|
Custom Solutions |
|
$ |
466,208 |
|
$ |
372,168 |
|
(20.2 |
)% |
|
International |
|
406,071 |
|
349,834 |
|
(13.9 |
) |
||
|
IT Outsourcing |
|
72,453 |
|
76,341 |
|
5.4 |
|
||
|
Federal |
|
127,391 |
|
117,613 |
|
(7.7 |
) |
||
|
U.S. ERP |
|
122,163 |
|
126,443 |
|
3.5 |
|
||
|
Corporate/Inter-segment |
|
(2,719 |
) |
(4,699 |
) |
n/m |
|
||
|
Total revenue |
|
$ |
1,191,567 |
|
$ |
1,037,700 |
|
(12.9 |
)% |
n/m = not meaningful
· Custom Solutions’ revenue decreased primarily due to the successful completion of the very large Pennsylvania Turnpike Commission (“PTC”) project in mid-2008, plus the normal completion of other projects, as well as a number of cancelled or delayed projects and staffing reductions on other projects resulting from current economic conditions. Most significantly, some large clients cut back on the use of our services in 2009 due to strategy decisions. We have been unable to close sufficient new contracts, especially larger ones, to offset these reductions.
· Unfavorable foreign currency fluctuations accounted for a 10% decline in our International division’s current year results. Excluding the impact of unfavorable foreign currency translation, our International division revenue decreased by approximately 4%. Completed projects and delays in customer decisions on new projects slowed revenue contributions in 2009. Client bankruptcy and financial constraints also caused cancellation of, or reductions in some client contracts which negatively impacted this division’s 2009 results.
· IT Outsourcing revenue increased in 2009 due to account growth at existing customers, plus the addition of several new clients in late 2008 and in 2009, all of which combined more than offset a client bankruptcy, cancelled project and reduced scope and spending at several other clients.
· Federal division revenue was down in 2009 as compared to 2008 related to expired contracts that have yet to be replaced. Federal had a large contract that expired at the end of 2008 and was then awarded to a qualified small business. The Federal division was successful in 2009 at winning a number of its expiring contracts where we were eligible to recompete, but delays in new contract awards have continued to push out improvements in our Federal division’s revenue. Recently, the Federal division obtained a number of Multiple Award Contract vehicles that allow us to compete for new business. The Federal division is working on winning task order awards under these indefinite delivery/indefinite quantity contracts that we expect will lead to additional revenue in future periods.
· U.S. ERP division revenues improved over 3% in 2009 compared with 2008. Several large contract wins in late 2008 and early 2009 in our Oracle and SAP practices were primarily responsible for the increase. Partially offsetting these contributions was the successful completion of the implementation phase of the very large PTC project (mentioned above) in mid-2008. We continue to provide support services to the PTC, but at considerably less revenue than during the implementation phase. Additionally, our Technology Solutions group incurred a $1.7 million reduction in current year revenue due to slower hardware sales related to the weak economy.
Gross Profit. In total, our gross profit margin decreased 220 basis points to 25.0% for 2009, compared with 27.2% for 2008. Gross profit margin on consulting services revenue accounted for all of the decrease, with sizable consulting services margin decreases in all but our U.S. ERP division, which had a significant improvement over 2008 due to the turnaround in our SAP practice from its poor performance in 2008. The significant declines in consulting services gross margins were primarily due to pricing pressures, which has reduced pricing on our existing work, as well as lowered pricing for new competitive awards. As customers have reduced, delayed or cancelled projects, it has been difficult to maintain our normal levels of consultant utilization, which has also contributed to the reduction in our gross margin. Our International division also incurred an approximate 2.5% employee wage increase at the beginning of 2009 that we were not able to recover through increased billing rates due to the pricing pressures mentioned above.
Selling, general and administrative. We began a number of cost reduction initiatives in the fall of 2008 in response to the deteriorating economic conditions. As a result, our SG&A costs for 2009 declined by $38.6 million, or 15%, compared with 2008. As a percentage of revenue, SG&A expenses were down 50 basis points between the comparable annual periods. Significant cost reductions resulted from the combination of our former Commercial and State & Local Government divisions in 2009; however, reductions were made in all divisions other than IT Outsourcing, which experienced increases in SG&A costs primarily related to additional infrastructure to support revenue growth within that division. Overall, salary reductions represented approximately half of the annual SG&A costs savings, and the remainder was achieved primarily through reductions in a number of other categories such as recruiting, training and meeting expenses and travel costs, in addition to a $4.7 million decrease in bad debt expense, primarily from fewer client bankruptcies in 2009 compared to the prior year.
Operating income. The 220 basis point reduction in our gross profit margin, partially offset by a 50 basis point savings in our SG&A costs, resulted in a decrease in our operating income margin to 2.7% for 2009, compared to 4.5% for 2008.
Operating income by segment/division was as follows:
|
|
|
Year
Ended |
|
% |
|
2008 |
|
2009 |
|
||||
|
|
|
2008 |
|
2009 |
|
change |
|
revenue* |
|
revenue* |
|
||
|
|
|
(In thousands) |
|
|
|
|
|
|
|
||||
|
Custom Solutions |
|
$ |
45,170 |
|
$ |
24,125 |
|
(46.6 |
)% |
9.7 |
% |
6.5 |
% |
|
International |
|
30,795 |
|
20,107 |
|
(34.7 |
) |
7.6 |
|
5.8 |
|
||
|
IT Outsourcing |
|
(244 |
) |
(1,823 |
) |
(647.1 |
) |
(0.3 |
) |
(2.4 |
) |
||
|
Federal |
|
8,682 |
|
5,994 |
|
(31.0 |
) |
6.8 |
|
5.1 |
|
||
|
U.S. ERP |
|
1,196 |
|
9,764 |
|
716.4 |
|
1.0 |
|
7.7 |
|
||
|
Corporate expenses |
|
(25,387 |
) |
(24,517 |
) |
3.4 |
|
(2.1 |
) |
(2.4 |
) |
||
|
Total |
|
60,212 |
|
33,650 |
|
(44.1 |
)% |
5.0 |
|
3.2 |
|
||
|
Amortization of intangibles |
|
(6,274 |
) |
(5,891 |
) |
|
|
(0.5 |
) |
(0.5 |
) |
||
|
Operating income |
|
$ |
53,938 |
|
$ |
27,759 |
|
|
|
4.5 |
% |
2.7 |
% |
*Divisions calculated as a % of division revenue, all other calculated as a % of total revenue
· Custom Solutions’ operating income decreased due to a substantial reduction in consulting services gross margin resulting primarily from higher-margin projects that ended or were cancelled and downward pricing pressure from both existing customers and new clients. In addition, some lower-margin, fixed-price projects also contributed to the margin decrease. Additionally, although SG&A expenses decreased $14.0 million in this division between the comparable years as we successfully reduced direct and overhead labor costs, we could not adjust these costs as quickly as our revenue was adjusting downward. Therefore, SG&A expenses as a percentage of revenue increased between the comparable periods, in part due to labor costs not reducing quickly enough, as well as increased costs for bad debt expense and higher rent expense in India.
· Operating income for our International division declined due to the significant reduction in services gross profit margins stemming from lower consultant utilization and increased consultant wages, as well as some customer-induced pricing pressures. A considerable reduction in SG&A expenses due to lower overhead personnel cost, plus lower recruiting and travel expenses, as well as reduced bad debt expense helped to partially offset the gross margin decline.
· IT Outsourcing operating loss increased due to both a reduction in consulting services gross profit margin, as well as an increase in SG&A expenses as a percentage of revenue. This division had some fixed-cost utilization issues following a late 2008, large customer bankruptcy that prevented it from reducing its costs when the related revenue was lost. Additional infrastructure costs to accommodate future revenue growth caused most of the increase in SG&A costs.
· Federal’s operating income was down due to the erosion of gross profit margin as revenues and consultant utilization have decreased and new and re-compete projects are priced at lower margins than the projects they are replacing due to competitive market conditions. Additionally, the division has not been able to fully offset its decreased revenue with reductions in costs as it continues to build the infrastructure required to compete for major prime contracts.
· The U.S. ERP division had significantly improved operating income in 2009 over 2008 related to improvements in both consulting services gross profit margin and reduced SG&A expenses in total dollars and as a percentage of revenue. The gross profit margin increase was led by a significant turnaround in our SAP practice related to improved consultant utilization, cost reductions and completion of a large, low-margin fixed-price contract.
· Corporate expenses decreased 3% as primarily salary-related cost-cutting measures were partially offset by significantly increased expenses related to the $2.2 million paid in the third quarter to settle a lawsuit, including attorney fees, as well as increased share-based compensation expenses and increased costs related to our new corporate headquarters.
Interest expense. Interest expense decreased $7.7 million during 2009, compared to 2008; $4.3 million of which related to the 2008 restatement of interest expense due to our January 1, 2009 adoption of FASB’s new accounting guidance for our convertible debt, which was retired by December 31, 2008. The remaining decrease was primarily due to lower average borrowings during 2009 and, to a lesser extent, due to lower average interest rates.
Other income (expense), net. Other income, net was $0.3 million in 2009, compared to other expense, net of $1.4 million in 2008. Our foreign exchange transaction gains/losses accounted for a $2.8 million improvement between the comparable periods. Offsetting the improvement from foreign exchange results was a $1.3 million gain on the retirement of our Debentures during 2008 with no similar gain in 2009.
Income taxes. Our effective tax rate increased to 34.0% for 2009, compared to 30.3% for 2008, primarily due to additional U.S. taxes of approximately $1 million on a one-time repatriation of cash to the U.S. The U.S. Federal Research and Experimentation tax credit expired on December 31, 2009, and unless it is extended, it will negatively impact our tax rate in future years.
Comparison of the Years Ended December 31, 2008 and 2007 — Consolidated
In U.S. dollar terms, currency rates were favorable for CIBER during the first 3 quarters of 2008. During the fourth quarter of 2008, we saw significant declines in foreign exchange rates as compared to the U.S. dollar. The balance sheet rates at December 31, 2008, declined by 5% for the Euro and 27% for the GBP as compared to 2007. This had a significant impact on our reported balance sheet year over year. Despite the significant decline in exchange rates vs. the U.S. dollar in the fourth quarter, our weighted average exchange rates for the 2008 year increased by approximately 6% over 2007, resulting in approximately $19 million of additional revenue in 2008.
The following table sets forth certain Consolidated Statement of Operations data in dollars and expressed as a percentage of revenue:
|
|
|
Year Ended December 31, |
|
||||||||
|
|
|
2007 |
|
2008 |
|
||||||
|
|
|
(Dollars in thousands, except billing rate) |
|
||||||||
|
Consulting services |
|
$ |
1,024,172 |
|
94.7 |
% |
$ |
1,133,233 |
|
95.1 |
% |
|
Other revenue |
|
57,803 |
|
5.3 |
|
58,334 |
|
4.9 |
|
||
|
Total revenue |
|
1,081,975 |
|
100.0 |
|
1,191,567 |
|
100.0 |
|
||
|
|
|
|
|
|
|
|
|
|
|
||
|
Gross profit — consulting services |
|
269,057 |
|
26.3 |
|
303,427 |
|
26.8 |
|
||
|
Gross profit — other revenue |
|
23,402 |
|
40.5 |
|
21,053 |
|
36.1 |
|
||
|
Gross profit — total |
|
292,459 |
|
27.0 |
|
324,480 |
|
27.2 |
|
||
|
|
|
|
|
|
|
|
|
|
|
||
|
SG&A expenses |
|
232,119 |
|
21.5 |
|
264,268 |
|
22.2 |
|
||
|
|
|
|
|
|
|
|
|
|
|
||
|
Operating income |
|
54,520 |
|
5.0 |
|
53,938 |
|
4.5 |
|
||
|
|
|
|
|
|
|
|
|
|
|
||
|
Net income — CIBER, Inc. |
|
23,951 |
|
2.2 |
|
26,884 |
|
2.3 |
|
||
|
|
|
|
|
|
|
|
|
|
|
||
|
Consultant utilization |
|
84 |
% |
|
|
87 |
% |
|
|
||
|
Average billable headcount |
|
7,220 |
|
|
|
7,395 |
|
|
|
||
Revenue. Total revenue for 2008 increased 10% compared to total revenue for 2007. We are a global company; therefore, our revenue is denominated in multiple currencies and may be significantly affected by currency exchange-rate fluctuations. The U.S. dollar weakened in the first half of 2008 and strengthened during the last half of 2008 against many currencies; however, overall the U.S. dollar was weaker against many currencies during 2008 as compared to 2007, resulting in favorable currency translation and greater reported U.S. dollar revenues in the current year. Foreign currency rate changes resulted in approximately $19 million, or almost 2%, of additional reported revenue in 2008 over 2007. Additionally, small acquisitions completed in both our U.S. ERP and International divisions contributed incremental revenue of approximately $18 million to 2008 results. Excluding the favorable currency translation effects and the incremental revenue from acquisitions, our total revenue for 2008 increased 7% from total revenue reported for 2007, primarily due to increased SAP software-related services in our International division, as well as increased consulting services revenue in our Custom Solutions and IT Outsourcing divisions. Our 2008 results, most notably in the fourth quarter, were adversely affected by the worsening global economic conditions. During the fourth quarter of 2008, we began to experience client reductions in the use of our services, as well as clients delaying starts on new projects and seeking price reductions. Additionally, billable headcount was down to approximately 7,250 at December 31, 2008, as compared to our average billable headcount of 7,395 for the 2008 fiscal year and compared to 7,325 as of December 31, 2007.
Revenue by segment/division was as follows:
|
|
|
Year Ended December 31, |
|
|
|
||||
|
|
|
2007 |
|
2008 |
|
% change |
|
||
|
|
|
(In thousands) |
|
|
|
||||
|
Custom Solutions |
|
$ |
450,679 |
|
$ |
466,208 |
|
3.5 |
% |
|
International |
|
315,202 |
|
406,071 |
|
28.8 |
|
||
|
IT Outsourcing |
|
61,521 |
|
72,453 |
|
17.8 |
|
||
|
Federal |
|
137,268 |
|
127,391 |
|
(7.2 |
) |
||
|
U.S. ERP |
|
119,670 |
|
122,163 |
|
2.1 |
|
||
|
Corporate/Inter-segment |
|
(2,365 |
) |
(2,719 |
) |
n/m |
|
||
|
Total revenue |
|
$ |
1,081,975 |
|
$ |
1,191,567 |
|
10.1 |
% |
n/m = not meaningful
· Custom Solutions revenue increased in 2008 mainly due to several sizable contract wins, additional work on other existing contracts and improved productivity.
· The performance of our International division during 2008 represented its best revenue results to date. In 2008, our International division represented approximately 34% of our consolidated revenue, up from 29% of consolidated revenue in 2007. These results were in part due to approximately $19 million related to favorable foreign currency fluctuations, as well as approximately $8 million of incremental revenue from several small acquisitions in late 2007 and the first half of 2008. Excluding these items, our International division grew approximately 20% resulting from continued strong sales of SAP implementation services in almost all of our major operating territories, as well as many of our smaller territories. Despite the strong revenue growth of 2008, the International division slowed in the fourth quarter of 2008 due to the deteriorating economic environment, including two client bankruptcies in 2008 and strength in the U.S. dollar against a number of currencies.
· IT Outsourcing division revenue increased primarily due to new contracts, although account growth at existing clients also contributed.
· Federal revenue declined mainly due to the expiration of one of our larger, long-term contracts that was subsequently awarded to a qualified small business. CIBER has similarly lost several contracts in recent years because we do not qualify as a small business; therefore, we have been precluded from bidding on the renewal business. We initially obtained these contracts through acquisitions of qualified small businesses that were originally awarded these contracts. We submitted proposals on a number of projects in 2008 where we would serve as either the prime contractor or a subcontractor, but the deteriorating economic environment delayed decisions to award and start projects funded by the federal government; thus, we were unsuccessful in replacing our expired contracts. The Federal division did have a high number of contract renewals during 2008, of which a sizable majority was won.
· Included in the U.S. ERP division revenue for 2008 is approximately $10 million of incremental revenue associated with an acquisition completed in September 2007. Excluding that acquisition, our U.S. ERP division revenue shrunk over 6% in 2008, compared to 2007. Our U.S. SAP practice had a particularly challenging year as its revenue decreased by $8.3 million, or 20%, compared to 2007. This decrease was partially offset by revenue growth in our Oracle Higher Education and Lawson practices.
Gross Profit. In total, our gross profit margin improved 20 basis points to 27.2% for 2008 compared to 27.0% for 2007. Gross profit margin on consulting services revenue, which grew by 50 basis points, accounted for the increase. Strong consulting services margin improvements in our Custom Solutions and Federal divisions were responsible. An increased focus on the pursuit of higher-margin business, project pricing and delivery improvement has helped to achieve these results. Our International division experienced a decrease in its services gross profit margin in 2008 due to a shift in the mix of its service offerings toward longer, fixed-term contracts that are more secure yet earn lower gross margins. The U.S. ERP division had a substantial decrease in its services gross margin for 2008, related to several large completed projects that have not yet been successfully replaced, resulting in poor consultant utilization during the year. In addition, the margins in the U.S. ERP division were hurt by several lower-margin fixed-price projects. In 2008, margins on other revenue have declined to 36.1% from 40.5% for 2007 related to profit margins being squeezed by hardware and software manufacturers. Our Custom Solutions and International divisions are our largest segments; therefore, changes in their margins tend to greatly
dictate our consolidated results. For 2008, margin gains in our Custom Solutions division were mostly offset by International’s gross margin decreases, resulting in a slight improvement in gross margin over the prior year.
Selling, general and administrative. As a percentage of revenue, SG&A expenses increased to 22.2% for 2008 compared to 21.5% for 2007. Over 50 basis points of the increase can be attributed to a $6.1 million increase in our provision for doubtful receivables between 2007 and 2008. The remaining 20 basis points related primarily to increased costs in the U.S. ERP and Federal divisions. The U.S. ERP division’s SG&A costs increased due to infrastructure and sales-related costs from a mid-2007 acquisition. Federal’s SG&A costs increased due to costs incurred to further our ability to bid on large projects as a prime contractor. All of the above were partially offset by International’s continuing efforts to drive down its relative SG&A spending, despite increased bad debt costs during 2008.
Operating income. As a result of the increased SG&A expenses as a percentage of revenue, our operating income decreased 50 basis points to 4.5% for 2008 compared to 5.0% for 2007.
Operating income by segment/division was as follows:
|
|
|
Year Ended |
|
% |
|
2007 |
|
2008 |
|
||||
|
|
|
2007 |
|
2008 |
|
change |
|
revenue* |
|
revenue* |
|
||
|
|
|
(In thousands) |
|
|
|
|
|
|
|
||||
|
Custom Solutions |
|
$ |
39,072 |
|
$ |
45,170 |
|
15.6 |
% |
8.7 |
% |
9.7 |
% |
|
International |
|
19,140 |
|
30,795 |
|
60.9 |
|
6.1 |
|
7.6 |
|
||
|
IT Outsourcing |
|
2,610 |
|
(244 |
) |
(109.4 |
) |
4.2 |
|
(0.3 |
) |
||
|
Federal |
|
11,031 |
|
8,682 |
|
(21.3 |
) |
8.0 |
|
6.8 |
|
||
|
U.S. ERP |
|
11,370 |
|
1,196 |
|
(89.5 |
) |
9.5 |
|
1.0 |
|
||
|
Corporate expenses |
|
(22,883 |
) |
(25,387 |
) |
(10.9 |
) |
(2.1 |
) |
(2.1 |
) |
||
|
Total |
|
60,340 |
|
60,212 |
|
(0.2 |
)% |
5.6 |
|
5.0 |
|
||
|
Amortization of intangibles |
|
(5,820 |
) |
(6,274 |
) |
|
|
(0.6 |
) |
(0.5 |
) |
||
|
Operating income |
|
$ |
54,520 |
|
$ |
53,938 |
|
|
|
5.0 |
% |
4.5 |
% |
*Divisions calculated as a % of division revenue, all other calculated as a % of total revenue
· Custom Solutions’ operating income percentage increased due to the division making a strong improvement in gross profit margin on services revenue, which was due to better pricing on newer engagements, as well as efficient staff utilization. The gross profit margin improvement was partially offset by increased SG&A costs as a percentage of revenue related to salaries for delivery infrastructure enhancements and increased recruiting costs.
· International’s operating income improved primarily due to a reduction in SG&A expenses as a percentage of revenue that was attained from operating leverage achieved on higher revenue volumes and reduced overhead personnel costs as a percentage of sales, which were partially offset by higher bad debt expenses. The improvement in SG&A as a percentage of revenue was partially offset by decreased gross profit margins due to a shift in product mix. Our International division had fewer high-margin software sales in 2008, as well as increased revenues from lower-margin, long-term outsourcing contracts and increased costs to build additional outsourcing infrastructure.
· IT Outsourcing division operating income significantly decreased related to a decrease in the gross profit margin on consulting services, as well as increased SG&A costs as a percentage of revenue. Some of the impact was due to adding to the data center facilities and infrastructure costs to position the division for future growth, as well as increased travel costs associated with the division’s new global delivery model and bad debt expense related a client bankruptcy during 2008.
· The Federal division’s operating income was down because increased SG&A expenses for operations infrastructure enhancements related to obtaining certifications for prime contractor bidding status more than offset the improvement in this division’s consulting services margin.
· The U.S. ERP division had 1.0% operating income percentage in the current year compared to 9.5% in 2007, primarily due to several large SAP projects coming to completion that had not been replaced, resulting in lower revenue and lower consultant utilization, as well as lower or negative margins on a couple of fixed-price SAP projects. Additionally, the division incurred increased SG&A costs, some of which were due to increased infrastructure costs from a 2007 acquisition, increased SAP sales costs on reduced levels of revenue and a bad debt expense resulting from client bankruptcy. As indicated above, our U.S. ERP division was negatively impacted by
losses in our domestic SAP practice in 2008. As a result, during the second half of 2008, we made a number of significant changes to our domestic SAP practice including restructured leadership, refocused marketing and delivery efforts, as well as implementation of a number of cost-reduction measures.
· Corporate expenses increased by $2.5 million, primarily as a result of increased share-based compensation costs, lower 401(k) forfeitures and increased operational support costs.
Interest expense. Interest expense decreased $2.6 million during 2008 compared to the prior year, primarily due to lower average interest rates on our borrowings. In late 2007, we began to repurchase and retire our fixed-rate Debentures, which were completely retired by December 31, 2008. We used borrowings under our revolving credit facility to fund repurchases of our fixed-rate Debentures. During 2008, our revolving credit facility interest rates, which were tied to market rates for Prime and LIBOR, also decreased.
Other expense, net. Other expense, net was $1.4 million in 2008, compared to $0.2 million in 2007. Our foreign exchange transaction gains/losses accounted for a $1.4 million decrease between the comparable periods. Offsetting the decrease from foreign exchange results was a $0.4 million increase in the gain on the retirement of our Debentures between the comparable periods.
Income taxes. Our effective tax rates decreased to 30.3% for 2008 compared to 34.0% for 2007, primarily due to a higher proportion of income being generated in lower tax jurisdictions. Our International division tends to have a lower effective tax rate than our domestic operations. In addition, during 2008 our International division benefitted from lower statutory rates in several countries, as well as having profitable operations in all territories. Our foreign operations contributed 67% of our total income before taxes for 2008 as compared to 40% during 2007.
Liquidity and Capital Resources
At December 31, 2009, we had $136.9 million of working capital and a current ratio of 1.8:1, compared to working capital of $165.2 million and a current ratio of 2.1:1 at December 31, 2008. This reduction in working capital is due to accounts receivable collections, increased income tax liabilities and debt repayments. We have used cash flows from the collection of domestic accounts receivable to reduce our long-term bank debt. Beginning on December 31, 2009, the term loan portion of our August 2009 Senior Credit Facility requires quarterly repayments of $2.5 million; thus, $10.0 million of the new Senior Credit Facility is classified as a current liability. Historically, we have used our operating cash flow and borrowings, as well as periodic sales of our common stock to finance ongoing operations and business combinations. We believe that our cash and cash equivalents, our operating cash flow and our available Senior Credit Facility will be sufficient to finance our working capital needs through the next year.
|
|
|
Year Ended December 31, |
|
|||||||
|
|
|
2007 |
|
2008 |
|
2009 |
|
|||
|
|
|
(In thousands) |
|
|||||||
|
Net cash provided by (used in): |
|
|
|
|
|
|
|
|||
|
Operating activities |
|
$ |
22,676 |
|
$ |
92,171 |
|
$ |
81,547 |
|
|
Investing activities |
|
(33,650 |
) |
(22,237 |
) |
(13,389 |
) |
|||
|
Financing activities |
|
6,097 |
|
(49,932 |
) |
(52,583 |
) |
|||
|
Effect of foreign exchange rates on cash |
|
3,275 |
|
(2,870 |
) |
3,000 |
|
|||
|
Net increase (decrease) in cash and cash equivalents |
|
$ |
(1,602 |
) |
$ |
17,132 |
|
$ |
18,575 |
|
Our balance of cash and cash equivalents was $67.4 million at December 31, 2009, compared to a balance of $48.8 million at December 31, 2008. Typically, most of our cash balance is maintained by our foreign subsidiaries and our domestic cash balances are used daily to reduce our outstanding balance on our Senior Credit Facility.
Operating activities. Cash provided by operating activities in 2009 was down approximately $10.6 million compared with 2008, mainly due to decreased net income, net of decreases in our bad debt provision and non-cash interest on our Debentures, related to our restatements of 2007 and 2008 for new accounting treatment for convertible debt. Changes in normal short-term working capital items like accounts receivable, especially domestic accounts receivable, accrued and other liabilities and income taxes, offset our reduced net income. Our working capital fluctuates based on seasonal factors, as well as the timing of our domestic payroll and accounts payable processing cycles in regard to month-end dates. The primary reason for significantly reduced cash flows from operating activities in 2007 was related to reduced accounts receivable collections in Europe at the end of the year with a number of expected client payments slipping into early 2008.
Total accounts receivable decreased to $213.1 million at December 31, 2009, from $235.1 million at December 31, 2008, primarily due to decreased revenues. Our total accounts receivable day’s sales outstanding (“DSO”) was 68 days at December 31, 2009, compared to 72 days at December 31, 2008. The overall reduction was achieved as a result of 3-4 day reductions in both our domestic and International division DSO. Our International division typically experiences their lowest DSO levels in December. Changes in accounts receivable have a significant impact on our cash flow. Items that can affect our accounts receivable DSO include: contractual payment terms, client payment patterns (including approval or processing delays and cash management), client mix (public vs. private), fluctuations in the level of IT product sales and the effectiveness of our collection efforts. Many of the individual reasons are outside of our control and, as a result, it is normal for our DSO to fluctuate from period to period, affecting our liquidity. Our outstanding accounts receivable balance from the City of New Orleans (the “City”) was approximately $3.9 million at December 31, 2009, down from $9.2 million at December 31, 2008. Of our outstanding receivable balance from the City at December 31, 2009, a significant portion still relates to work performed following the 2005 hurricane disaster. The City continues to experience administrative complications and FEMA reimbursement delays, which have delayed payment for our services. We continue to work with the City and FEMA on the remaining balance and based on our communications with them, we believe we will be able to collect the balance in full.
Accrued compensation and related liabilities increased to $65.7 million at December 31, 2009, from $62.4 million at December 31, 2008. These balances are subject to the effects from the timing of our normal bi-weekly U.S. payroll cycle; however, at December 31, 2009, there were 9 days of unpaid wages, compared to 8 days of unpaid wages at December 31, 2008. In addition, annual bonuses are typically accrued throughout the year and paid in the first quarter of the following year, causing some fluctuation from quarter to quarter.
Accounts payable and other accrued liabilities typically fluctuate based on when we receive actual vendor invoices and when they are paid. The largest of such items typically relates to vendor payments for IT hardware and software products that we resell and payments to services-related contractors. Other accrued expenses and liabilities increased to $34.6 million at December 31, 2009, from $28.9 million at December 31, 2008, primarily due to an increase in our liability for value added taxes (“VAT”) in Europe, a good portion of which has been deferred related to a payment deferral plan.
Investing activities. Investing activities are primarily comprised of cash paid for acquisitions and purchases of property and equipment. We used $4.3 million (net of $0.4 million of cash acquired) to acquire Iteamic Pvt. Ltd., a Bangalore, India-based IT services company during 2009, compared with $7.8 million primarily for the acquisition of a Norwegian SAP consultancy and a noncontrolling interest in one of our European subsidiaries during 2008, and $22.3 million used for acquisitions during 2007. Spending on property and equipment decreased to $9.1 million in 2009, compared to $14.7 million and $13.2 million in 2008 and 2007, respectively. Capital spending was unusually high in 2008, as we built the infrastructure to support our IT Outsourcing division. During 2007, we sold an aircraft acquired in the Novasoft AG acquisition in 2004 for $1.9 million.
Financing activities. Typically, our most significant financing activities consist of the borrowings and repayments on our long-term bank debt. During the year ended December 31, 2009, we had net payments of $69.5 million, compared to net borrowings of $109.0 million and $38.3 million for the years ended December 31, 2008 and 2007, respectively. The net payments in 2009 resulted primarily from $23.2 million of cash received following the sale of our common stock, as well as the positive cash flow generated by our operating activities and the use of existing cash balances. The net borrowings in 2008 were primarily used to retire our Debentures. During the year ended December 31, 2008, we used $149.5 million of cash for this purpose, compared to $22.1 million for the year ended December 31, 2007, resulting in gains on retirement of debt of approximately $2.1 million in 2008 and $0.9 million in 2007. Additional financing activity inflows consist of sales of stock under our employee stock purchase plan and the exercise of employee stock options. The cash provided by sales of stock under our employee stock purchase plan and options exercised was $2.4 million for the year ended December 31, 2009, compared to $4.0 million and $5.6 million for the years ended December 31, 2008 and 2007, respectively. In addition to payments on our long-term bank debt, our other primary financing activity outflow typically includes the purchase of treasury stock. We repurchased $5.0 million of common stock into treasury during the year ended December 31, 2009, compared to $8.1 million and $15.3 million for the years ended December 31, 2008 and 2007, respectively. In 2008, we also had an outflow of $4.3 million related to the settlement of cross-currency interest rate swaps, compared to a similar settlement outflow of $0.3 million in 2007. At December 31, 2009, we had authorization for the repurchase of an additional $5.5 million of our common stock under our current repurchase plan. We may continue to use cash to repurchase our common stock (subject to limitations under our Senior Credit Facility discussed below).
Senior Credit Facility. On August 20, 2009, CIBER entered into a three-year senior credit agreement with several financial institutions as lenders and Bank of America, N.A. as administrative agent (the “Senior Credit Facility”). The Senior Credit Facility replaced our previous senior secured reducing revolving credit facility and refinanced all amounts outstanding thereunder. The credit available under the Senior Credit Facility may be used for the working capital needs and general
corporate purposes of the Company. The Senior Credit Facility was subsequently amended on February 18, 2010, and matures on August 20, 2012.
The Senior Credit Facility, as amended, provides for: 1) an $85 million revolving line of credit (“Revolver”), which may be used for revolving loans and to request the issuance of letters of credit on CIBER’s behalf, and 2) a $50 million term loan (“Term Loan”). The Term Loan requires quarterly principal reductions of $2.5 million, beginning on December 31, 2009. The Term Loan balance at December 31, 2009, following the first required quarterly principal reduction, is $47.5 million, of which $10.0 million is classified as a current liability.
Additionally, the Senior Credit Facility is subject to mandatory prepayments (and commitment reductions) in amounts equal to the net cash proceeds of any asset disposition, event of loss, extraordinary receipts, issuance or incurrence of indebtedness and issuance of equity, subject in each case as appropriate to thresholds and other exceptions and definitions as specified in the credit agreement. CIBER’s obligations under the Senior Credit Facility are secured by all of CIBER’s present and future domestic tangible and intangible assets, as well as a pledge of 66% of the capital stock of CIBER’s direct foreign subsidiaries.
Subject to applicable conditions, we may elect interest rates on our Senior Credit Facility borrowings calculated by reference to either the Bank of America prime lending rate (“Prime”) plus a margin that ranges from 1.75% to 2.50%, or a London Interbank Offered Rate (“LIBOR”) for one, three or six month maturities, plus a margin that ranges from 2.75% to 3.50%. The applicable margins on our Prime loans and LIBOR loans are determined by reference to our current consolidated total leverage ratio. We are also required to pay a commitment fee of 0.50% per annum on the unused portion of the Senior Credit Facility. The Senior Credit Facility and the related loan documents provide for the payment of other specified recurring fees and expenses, including administrative agent fees, letter of credit and other fees. We currently have two interest rate swaps. The first interest rate swap matures on March 12, 2010, and effectively converts $50.0 million of our borrowings under our Senior Credit Facility from a variable-rate instrument into a 1.26% fixed-rate instrument, plus the applicable margin. The second interest rate swap matures on March 31, 2012, and effectively converts $25.0 million of our borrowings under our Senior Credit Facility from a variable-rate instrument into a 1.77% fixed-rate instrument, plus the applicable margin. At December 31, 2009, our weighted average interest rate on our outstanding borrowings under the Senior Credit Facility, including the interest swaps, was 4.41%.
The terms of the Senior Credit Facility, as amended, include among other provisions, specific limitations on the incurrence of additional indebtedness and liens, stock repurchases, investments, guarantees, mergers, dispositions and acquisitions, and a prohibition on the payment of any dividends. The Senior Credit Facility also contains certain financial covenants, including: 1) a maximum consolidated total leverage ratio; 2) a minimum consolidated fixed charge coverage ratio; 3) a minimum EBITDA; and 4) an asset coverage test. A summary of these financial covenants is as follows:
· The maximum consolidated total leverage ratio (Funded Debt divided by EBITDA) may not be greater than 2.75 to 1.00 through December 31, 2009. The maximum leverage ratio reduces to 2.50 to 1.00 on March 31, 2010, and further to 2.25 to 1.00 on June 30, 2010, and then to 2.00 to 1.00 on June 30, 2011.
· The minimum consolidated fixed charge coverage ratio (EBITDA minus capital expenditures divided by the sum of tax expense plus interest expense plus scheduled funded debt payments plus any restricted payments) must be not less than 1.25 to 1.00 on December 31, 2009 and March 31, 2010, and not less than 1.20 to 1.00 on June 30, 2010 and September 30, 2010, and returning to not less than 1.25 to 1.00 on December 31, 2010 and thereafter.
· We must maintain twelve-month EBITDA of at least $50 million through December 31, 2009, and $45 million thereafter.
· Under the asset coverage test, the aggregate amount of loans advanced under the Senior Credit Facility shall, at any time, not exceed an amount equal to 80% of all of our net accounts receivable.
Certain elements of these ratios are defined below:
· Funded Debt includes borrowings under our Senior Credit Facility, any other bank debt plus the face amount of any outstanding Letters of Credit.
· EBITDA represents the sum of net income (or net loss), net interest expense, income tax expense, depreciation expense, amortization expense, share-based compensation expense and September 2009 legal settlement costs of $2.2 million, measured over the twelve-month period ending as of the end of each fiscal quarter.
We are required to be in compliance with the financial covenants at the end of each calendar quarter, and we were in compliance with these financial covenants as of December 31, 2009, with the following calculations for our financial covenant ratios:
Consolidated total leverage ratio — 1.90 to 1.00 (maximum permitted — 2.75 to 1.00)
Consolidated fixed charge coverage ratio — 1.47 to 1.00 (minimum permitted — 1.25 to 1.00)
Consolidated EBITDA - $51.7 million (minimum permitted - $50 million)
Asset Coverage Test - $97.5 million (not to exceed $170.5 million)
At December 31, 2009, our closest financial covenant was the minimum EBITDA of $50 million. Based on management’s current estimates, we do not currently believe a covenant violation to be probable of occurring through at least December 31, 2010. However, given the current volatile economic conditions, there can be no assurance that we will continue to be in compliance with these bank covenants.
At December 31, 2009, we had outstanding borrowings of $97.5 million under the Senior Credit Facility.
We cannot be certain that the foregoing factors will not result in any financial covenant violation in the future and given these factors, it is possible that a financial covenant violation may occur in subsequent quarters. If a covenant violation were to occur, we believe that we would be able to obtain a waiver or amendment from our credit group. Any such waiver or amendment would come at additional costs to CIBER and such costs could be material. We believe that other sources of credit or financing would be available to us; however, we cannot predict at this time what types of credit or financing will be available in the future or the costs of such credit or financing.
Off-Balance Sheet Arrangements
We do not have any reportable off-balance sheet arrangements.
Contractual Obligations
The contractual obligations presented in the table below represent our estimates of future payments under fixed contractual obligations and commitments. Changes in our business needs, cancellation provisions, changing interest rates and other factors may result in actual payments differing from these estimates. We cannot provide certainty regarding the timing and amounts of payments. We have presented below a summary of the most significant assumptions used in our information within the context of our consolidated financial position, results of operations and cash flows.
The following table is a summary of our contractual obligations as of December 31, 2009:
|
|
|
Payments due by period |
|
|||||||||||||
|
|
|
Total |
|
2010 |
|
2011-2012 |
|
2013-2014 |
|
Thereafter |
|
|||||
|
|
|
(In thousands) |
|
|||||||||||||
|
Principal payments on long-term debt |
|
$ |
98,197 |
|
$ |
10,697 |
|
$ |
87,500 |
|
$ |
— |
|
$ |
— |
|
|
Interest payments on long-term debt(1) |
|
9,954 |
|
4,134 |
|
5,820 |
|
— |
|
— |
|
|||||
|
Operating leases(2) |
|
77,952 |
|
25,520 |
|
31,703 |
|
11,612 |
|
9,117 |
|
|||||
|
Purchase obligations |
|
861 |
|
581 |
|
247 |
|
33 |
|
— |
|
|||||
|
Total(3) |
|
$ |
186,964 |
|
$ |
40,932 |
|
$ |
125,270 |
|
$ |
11,645 |
|
$ |
9,117 |
|
(1) Interest payments were calculated based on terms of the related agreements and effective interest rates as of December 31, 2009, for our borrowings.
(2) Includes operating leases for all office locations, automobiles and office equipment.
(3) At December 31, 2009, we had gross unrecognized tax benefits of $3.6 million, all of which is expected to be paid after one year. We are unable to make a reasonably reliable estimate as to when a cash settlement with the appropriate taxing authority may occur; as such, our unrecognized tax benefits are not included in the table above.
Critical Accounting Policies and Estimates
The preparation of our consolidated financial statements in accordance with U.S. generally accepted accounting principles requires management to make estimates, judgments and assumptions that affect the reported amounts of assets and liabilities as of the date of the financial statements, as well as the reported amounts of revenue and expenses during the periods presented. We continually evaluate our estimates, judgments and assumptions based on available information and experience. We believe that our estimates, judgments and assumptions are reasonable based on information available to us at the time they are made. To the extent there are differences between our estimates, judgments and assumptions and actual results, our financial statements will be affected. Such differences may be material to our financial statements. The accounting policies that reflect our more significant estimates, judgments and assumptions are described below.
Revenue recognition - CIBER earns revenue primarily from providing IT services to its clients, and to a much lesser extent, from the sale and resale of IT hardware and software products. CIBER’s consulting services revenue comes from three primary sources: (1) technology integration services where we design, build and implement new or enhanced system applications and related processes; (2) general IT consulting services, such as system selection or assessment, feasibility studies, training and staffing; and (3) managed IT services in which we manage, staff, maintain, host or otherwise run solutions and/or systems provided to our customers. Contracts for these services have different terms based on the scope, deliverables and complexity of the engagement, which requires management to make judgments and estimates in recognizing revenue. Fees for these contracts may be in the form of time-and-materials or fixed-price. The majority of our consulting services revenue is recognized under time-and-materials contracts as hours and costs are incurred. Consulting services revenue also includes project-related reimbursable expenses for travel and other out-of-pocket expenses separately billed to clients.
Revenue for technology integration consulting services where we design/redesign, build and implement new or enhanced systems applications and related processes for our clients is generally recognized based on the percentage-of-completion method. Under the percentage-of-completion method, management estimates the percentage of completion based upon the contract costs incurred to date as a percentage of the total estimated contract costs. If the total cost estimate exceeds revenue, we accrue for the estimated loss immediately. The use of the percentage-of-completion method requires significant judgment relative to estimating total contract revenue and costs, including assumptions as to the length of time to complete the project, the nature and complexity of the work to be performed and anticipated changes in estimated costs. Estimates of total contract costs are continuously monitored during the term of the contract and recorded revenues and costs are subject to revision as the contract progresses. Such revisions may result in increases or decreases to revenue and income and are reflected in the Consolidated Financial Statements in the periods in which they are first identified.
Revenue for general IT consulting services is recognized as work is performed and amounts are earned. We consider amounts to be earned once evidence of an arrangement has been obtained, services are delivered, fees are fixed or determinable and collectability is reasonably assured. For contracts with fees based on time-and-materials or cost-plus, we recognize revenue over the period of performance. For fixed-price contracts, depending on the specific contractual provisions and nature of the deliverables, revenue may be recognized on a proportional performance model based on level-of-effort, as milestones are achieved or when final deliverables have been provided.
Managed IT services arrangements typically span several years. Revenue from managed services time-and-materials contracts is recognized as the services are performed. Revenue from unit-priced contracts is recognized as transactions are processed based on objective measures of output. Revenue from fixed-price contracts is recognized on a straight-line basis, unless revenues are earned and obligations are fulfilled in a different pattern. Costs related to delivering managed services are expensed as incurred, with the exception of labor and other direct costs related to the set-up of processes, personnel and systems, which are deferred during the transition period and expensed evenly over the period services are provided. Amounts billable to the client for transition or set-up activities are also deferred and recognized as revenue evenly over the period that the managed services are provided.
Other revenue includes resale of third-party IT hardware and software products, sales of proprietary software and commissions on sales of IT products. Some software license arrangements also include implementation services and/or post-contract customer support. In such multi-element arrangements, if the criteria are met, revenue is recognized based on the vendor specific objective evidence of the fair value of each element. Software support revenue is recognized ratably over the term of the related agreement. Revenue related to the sale of IT products is generally recognized when the products are shipped or if applicable, when delivered and installed in accordance with the terms of the sale. Where we are the re-marketer of certain IT products, commission revenue is recognized when the products are drop-shipped from the vendor to the customer. Our commission revenue represents the sales price to the customer less the cost paid to the vendor.
Unbilled accounts receivable represent amounts recognized as revenue based on services performed in advance of billings in accordance with contract terms. Under our typical time-and-materials billing arrangement, we bill our customers on a regularly scheduled basis, such as biweekly or monthly. At the end of each accounting period, we accrue revenue for services performed since the last billing cycle. These unbilled amounts are generally billed the following month. Unbilled accounts receivable also arise when percentage-of-completion accounting is used and costs plus estimated contract earnings exceed billings. Such amounts are billed at specific milestone dates or at contract completion. Management expects all unbilled accounts receivable to be collected within one year of the balance sheet date. Billings in excess of revenue recognized are recorded as deferred revenue and are primarily comprised of deferred software support revenue.
Goodwill - At December 31, 2009, we had $450.7 million of goodwill resulting from acquisitions. Goodwill is not amortized, but rather is subject to impairment testing. We review goodwill for impairment annually at June 30, and whenever events or changes in circumstances indicate its carrying value may not be recoverable. The result of our June 30, 2009 annual impairment test was that no impairment was indicated. Goodwill impairment testing consists of a two-step process. In the first step, we compare the fair value of each reporting unit to its carrying value. Our reporting units are consistent with the reportable segments identified in Note 13 to our Consolidated Financial Statements. If the fair value of the reporting unit exceeds the carrying value of the net assets assigned to that unit, goodwill is considered not to be impaired and we are not required to perform further testing. If the carrying value of the net assets assigned to the reporting unit exceeds the fair value of the reporting unit, then we must perform the second step of the impairment test in order to determine the implied fair value of the reporting unit’s goodwill. If the carrying value of a reporting unit’s goodwill exceeds its implied fair value, then we would record an impairment loss equal to the difference.
Determining the fair value of a reporting unit is judgmental in nature and involves the use of significant estimates and assumptions. These estimates and assumptions include revenue growth rates and operating margins used to calculate projected future cash flows, risk-adjusted discount rates, future economic and market conditions and determination of appropriate market comparables. We base our fair value estimates on assumptions we believe to be reasonable but that are unpredictable and inherently uncertain. Actual future results may differ from those estimates. In addition, we make certain judgments and assumptions in allocating shared assets and liabilities to determine the carrying values for each of our reporting units. Our most recent annual goodwill impairment analysis, which was performed as of June 30, 2009, did not result in an impairment charge for any of our business units. The forecasts utilized in the discounted cash flow analysis as part of our impairment test assume future growth in each of our reporting units during the next five years and beyond. Our Federal and U.S. ERP business units had decreases in their operating income or losses in 2008. If our business units can’t obtain, or we determine at a later date that we no longer expect them to obtain the projected levels of profitability, future impairment tests may result in an impairment charge. There can be no assurances that these business units will be able to achieve our estimated levels of profitability. We currently have goodwill of $74.3 million and $54.3 million recorded for our Federal and U.S. ERP business units, respectively, and there was not significant excess fair value during the June 2009 annual impairment test. The downturn in our financial results in the second half of 2009, particularly in our Custom Solutions and Federal business units, increases our risk of a future goodwill impairment charge if we cannot start to grow revenue and profits in these business units in 2010.
In accordance with new accounting standards for fair value measurement that became effective in 2009, we have modified our approach to the determination of the weighted average cost of capital (“WACC”) to be used in the discounted cash flow calculations of our goodwill impairment testing. In 2009, our WACC for each business unit ranged from 8.3% to 13.0% and varied primarily based on our analysis of peer group comparable companies’ WACC. In our previous impairment test in December 2008, the business unit WACC was primarily based on CIBER’s WACC and ranged from 10.4% to 11.4%.
In our process of estimating future cash flows for our business units, we have assumed a blended overall 10% increase in revenue in 2010 and then increases ranging from 4% to 6% in future years. We have assumed a perpetual growth rate after 5 years of 4%. In addition, we have assumed improvement in operating income as a percentage of revenue resulting from recent changes we have made to our cost structure, improvements in operating performance and leverage of revenue growth. In our overall evaluation of the business unit fair value determinations from our discounted cash flow analysis, we also consider a sensitivity analysis of various discount rates and growth rate assumptions.
It is not possible at this time to determine if any future impairment charge would result from the foregoing factors but, if an impairment change were to be required for any of our business units, it would likely be material. Given the significant amount of goodwill we have recorded, the deteriorated economic conditions of the industry in which we operate, including the current worldwide economic conditions impacting our customers and their use of our services, and the lack of significant excess fair value during our last impairment test, among other factors, we cannot be certain that a goodwill impairment write-down will not be required during future periods.
Income taxes - Significant judgment is required in determining our worldwide income tax provision. As a global company, we calculate and provide for income taxes in each of the tax jurisdictions in which we operate. This involves estimating current tax exposures in each jurisdiction, as well as making judgments regarding the recoverability of deferred tax assets. We calculate our current and deferred tax provision based on estimates and assumptions that could differ from the actual results reflected in income tax returns filed during the subsequent year. Adjustments based on filed returns are generally recorded in the period when the tax returns are filed. We apply an estimated annual effective tax rate to our quarterly operating results to determine the provision for income tax expense. In the event there is a significant unusual or infrequent item recognized in our quarterly operating results, the tax attributable to that item is recorded in the interim period in which it occurs. Changes in the geographic mix or estimated level of annual income before taxes can affect our overall effective tax rate.
We are regularly audited by various taxing authorities, and sometimes these audits result in proposed assessments where the ultimate resolution may result in us owing additional taxes plus interest and possible penalties. Tax exposures can involve complex issues and may require an extended period to resolve. We establish reserves when, despite our belief that our tax return positions are appropriate and supportable under local tax law, we believe it is more likely than not that all or some portion of a tax benefit will not be realized as the result of an audit. We evaluate these reserves each quarter and adjust the reserves and the related interest in light of changing facts and circumstances regarding the estimates of tax benefits to be realized, such as the progress of a tax audit or the expiration of a statute of limitations. We believe the estimates and assumptions used to support our evaluation of tax benefit realization are reasonable. However, final determinations of prior-year tax liabilities, either by settlement with tax authorities or expiration of statutes of limitations, could be materially different from estimates reflected in assets and liabilities and historical income tax provisions. The outcome of these final determinations could have a material effect on our income tax provision, net income or cash flows in the period in which that determination is made. We believe our tax positions comply with applicable tax law and that we have adequately provided for any known tax contingencies.
No taxes have been provided on undistributed foreign earnings that are planned to be indefinitely reinvested. If future events, including material changes in estimates of cash, working capital and long-term investment requirements, necessitate that these earnings be distributed, an additional provision for withholding taxes may apply, which could materially affect our future effective tax rate.
Allowance for doubtful accounts receivable - We maintain an allowance for doubtful accounts at an amount we estimate to be sufficient to cover the risk of collecting less than full payment on our receivables. At December 31, 2009, we had gross accounts receivable of $216.3 million and our allowance for doubtful accounts was $3.2 million. Our allowance for doubtful accounts is based upon specific identification of probable losses. We review our accounts receivable and reassess our estimates of collectability each month. Historically, our bad debt expense has been a very small percentage of our total revenue, as most of our revenues are from large, credit-worthy Fortune 1000 companies and governments. During 2008, as global economic conditions worsened, we experienced an unusually high number of client bankruptcies and financial difficulties. Our bad debt expense increased to $7.0 million in 2008 as compared to $0.8 million in 2007. If our clients’ financial condition or liquidity were to deteriorate, resulting in an impairment of their ability to make payments, or if customers were to express dissatisfaction with the services we have provided, additional allowances may be required. At December 31, 2009, our outstanding accounts receivable balance from the City of New Orleans (the “City”) was approximately $3.9 million, down from $9.2 million at December 31, 2008. The City continues to experience administrative complications and FEMA reimbursement delays, which have delayed payment for our services. We continue to work with the City and FEMA on the remaining balance and based on our communications with them, we believe we will be able to collect the balance in full. Therefore, we have not provided for any reserves related to this balance at December 31, 2009. We cannot be assured that we will be 100% successful in our collection efforts. Should the City’s financial condition deteriorate or should other information arise in the future to indicate that we may not be paid in full, we would provide for an appropriate reserve at such time.
Accrued compensation and certain other accrued liabilities - Employee compensation costs are our largest expense category. We have several different variable compensation programs, which are highly dependent on estimates and judgments, particularly at interim reporting dates. Some programs are discretionary, while others have quantifiable performance metrics. Certain programs are annual, while others are quarterly or monthly. Often actual compensation amounts cannot be determined until after our results are reported. We believe we make reasonable estimates and judgments using all significant information available. We also estimate the amounts required for incurred but not reported health claims under our self-insured employee benefit programs. Our accrual for health costs is based on historical experience and actual amounts may vary. In the ordinary course of business, we are currently involved in various claims and legal proceedings. We periodically review the status of each significant matter and assess our potential financial exposure. If the potential loss from any claim or legal proceeding is considered probable and the amount can be reasonably estimated, we accrue a liability for the estimated
loss. We use significant judgment in both the determination of probability and the determination as to whether an exposure is reasonably estimable. Because of uncertainties related to these matters, accruals are based only on the best information at that time. As additional information becomes available, we reassess the potential liability related to our pending claims and litigation and may revise our estimates. Such revisions in the estimates of potential liabilities could have a material impact on our financial position and results of operations. We expense legal fees as incurred.
Other intangible assets - In connection with our acquisitions, we are required to recognize other intangible assets separate and apart from goodwill, if such assets arise from contractual or other legal rights or if such assets are separable from the acquired business. Other intangible assets primarily include, among other things, customer-related assets such as order backlog, customer contracts and customer relationships. Determining a fair value for such items requires a high degree of judgment, assumptions and estimates. We often use third parties to assist us with such valuations. In addition, these intangible assets are amortized over our best estimate of their useful life.
Item 7A. Quantitative and Qualitative Disclosures about Market Risk
We are exposed to market risks related to changes in foreign currency exchange rates and interest rates. We believe our exposure to other market risks is immaterial.
During 2009, 35.0%, or $363.2 million of our total revenue was attributable to our foreign operations. Using sensitivity analysis, a hypothetical 10% increase or decrease in the value of the U.S. dollar against all currencies would change total revenue by 3.5%, or $36.0 million. A portion of this fluctuation would be offset by expenses incurred in local currency. Additionally, we have exposure to changes in foreign currency rates related to short-term inter-company transactions with our foreign subsidiaries and from client receivables in different currencies. Foreign sales are mostly made by our foreign subsidiaries in their respective countries and are typically denominated in the local currency of each country. Our foreign subsidiaries incur most of their expenses in their local currency as well, which helps minimize our risk of exchange rate fluctuations.
Our exposure to changes in interest rates arises primarily because our indebtedness under our Senior Credit Facility has a variable interest rate. At December 31, 2009, our outstanding borrowings under our Senior Credit Facility were $97.5 million and our weighted average interest rate was 4.41%. We currently have two interest rate swaps with financial institutions to help us manage our interest rate risk under our Senior Credit Facility by converting a portion of our floating-rate debt to a fixed-rate basis, thus reducing the impact of interest rate changes on future interest expense. The first interest rate swap matures on March 12, 2010, and effectively converts $50.0 million of our floating-rate debt to a fixed-rate basis (1.26%, plus the applicable margin). The second interest rate swap matures on March 31, 2012, and effectively converts $25.0 million of our floating-rate debt to a fixed-rate basis (1.77%, plus the applicable margin). Assuming $97.5 million of outstanding borrowings, of which $75.0 million is fixed-rate due to the interest rate swaps, a 1% increase in interest rates would result in approximately $0.2 million of additional interest expense.
Item 8. Financial Statements and Supplementary Data
The following consolidated financial statements and supplementary data are included as part of this Annual Report on Form 10-K:
Report of Independent Registered Public Accounting Firm
The Board of Directors and Shareholders of CIBER, Inc.
We have audited the accompanying consolidated balance sheets of CIBER, Inc. and subsidiaries (the Company) as of December 31, 2008 and 2009, and the related consolidated statements of operations, shareholders’ equity, and cash flows for each of the three years in the period ended December 31, 2009. These financial statements are the responsibility of the Company’s management. Our responsibility is to express an opinion on these financial statements based on our audits.
We conducted our audits in accordance with the standards of the Public Company Accounting Oversight Board (United States). Those standards require that we plan and perform the audit to obtain reasonable assurance about whether the financial statements are free of material misstatement. An audit includes examining, on a test basis, evidence supporting the amounts and disclosures in the financial statements. An audit also includes assessing the accounting principles used and significant estimates made by management, as well as evaluating the overall financial statement presentation. We believe that our audits provide a reasonable basis for our opinion.
In our opinion, the financial statements referred to above present fairly, in all material respects, the consolidated financial position of the Company at December 31, 2008 and 2009, and the consolidated results of its operations and its cash flows for each of the three years in the period ended December 31, 2009, in conformity with U.S. generally accepted accounting principles.
As discussed in Note 1 to the consolidated financial statements, effective as of January 1, 2009, the Company adopted Financial Accounting Standards Board (FASB) Staff Position No. APB 14-1, “Accounting for Convertible Debt Instruments That May Be Settled in Cash Upon Conversion (Including Partial Cash Settlement)” (codified in FASB ASC Topic 470, “Debt with Conversions and Other Options”) and FASB Statement No. 160 “Non-Controlling Interests in Consolidated Financial Statements” (codified in FASB ASC Topic 810, “Consolidation”) and retrospectively adjusted its accounting for its consolidated financial statements for the years ended December 31, 2008 and 2007 presented herein.
We also have audited, in accordance with the standards of the Public Company Accounting Oversight Board (United States), CIBER, Inc.’s internal control over financial reporting as of December 31, 2009, based on criteria established in Internal Control—Integrated Framework issued by the Committee of Sponsoring Organizations of the Treadway Commission and our report dated March 4, 2010 expressed an unqualified opinion thereon.
|
|
/s/ Ernst & Young LLP |
|
|
|
|
Denver, Colorado |
|
|
March 4, 2010 |
|
CIBER, Inc. and Subsidiaries
Consolidated Statements of Operations
(In thousands, except per share data)
|
|
|
Year Ended December 31, |
|
|||||||
|
|
|
2007 |
|
2008 |
|
2009 |
|
|||
|
Consulting services |
|
$ |
1,024,172 |
|
$ |
1,133,233 |
|
$ |
992,779 |
|
|
Other revenue |
|
57,803 |
|
58,334 |
|
44,921 |
|
|||
|
Total revenue |
|
1,081,975 |
|
1,191,567 |
|
1,037,700 |
|
|||
|
|
|
|
|
|
|
|
|
|||
|
Cost of consulting services |
|
755,115 |
|
829,806 |
|
750,164 |
|
|||
|
Cost of other revenue |
|
34,401 |
|
37,281 |
|
28,243 |
|
|||
|
Selling, general and administrative expenses |
|
232,119 |
|
264,268 |
|
225,643 |
|
|||
|
Amortization of intangible assets |
|
5,820 |
|
6,274 |
|
5,891 |
|
|||
|
Operating income |
|
54,520 |
|
53,938 |
|
27,759 |
|
|||
|
Interest income |
|
854 |
|
1,253 |
|
994 |
|
|||
|
Interest expense |
|
(16,508 |
) |
(13,854 |
) |
(6,180 |
) |
|||
|
Other income (expense), net |
|
(184 |
) |
(1,444 |
) |
338 |
|
|||
|
Income before income taxes |
|
38,682 |
|
39,893 |
|
22,911 |
|
|||
|
Income tax expense |
|
13,165 |
|
12,080 |
|
7,795 |
|
|||
|
Consolidated net income |
|
25,517 |
|
27,813 |
|
15,116 |
|
|||
|
Less: Net income — noncontrolling interests |
|
1,566 |
|
929 |
|
158 |
|
|||
|
Net income — CIBER, Inc. |
|
$ |
23,951 |
|
$ |
26,884 |
|
$ |
14,958 |
|
|
|
|
|
|
|
|
|
|
|||
|
Net income per share — CIBER, Inc.: |
|
|
|
|
|
|
|
|||
|
Basic |
|
$ |
0.39 |
|
$ |
0.45 |
|
$ |
0.22 |
|
|
Diluted |
|
$ |
0.39 |
|
$ |
0.45 |
|
$ |
0.22 |
|
|
|
|
|
|
|
|
|
|
|||
|
Weighted average shares outstanding: |
|
|
|
|
|
|
|
|||
|
Basic |
|
61,207 |
|
60,092 |
|
67,996 |
|
|||
|
Diluted |
|
61,924 |
|
60,389 |
|
68,107 |
|
|||
See accompanying notes to consolidated financial statements.
CIBER, Inc. and Subsidiaries
(In thousands, except per share data)
|
|
|
December 31, |
|
||||
|
|
|
2008 |
|
2009 |
|
||
|
Assets |
|
|
|
|
|
||
|
Current assets: |
|
|
|
|
|
||
|
Cash and cash equivalents |
|
$ |
48,849 |
|
$ |
67,424 |
|
|
Accounts receivable, net of allowances of $4,411 and $3,192 respectively |
|
235,066 |
|
213,100 |
|
||
|
Prepaid expenses and other current assets |
|
20,633 |
|
22,727 |
|
||
|
Deferred income taxes |
|
4,883 |
|
6,627 |
|
||
|
Total current assets |
|
309,431 |
|
309,878 |
|
||
|
|
|
|
|
|
|
||
|
Property and equipment, at cost |
|
80,360 |
|
82,788 |
|
||
|
Less accumulated depreciation |
|
(52,988 |
) |
(57,958 |
) |
||
|
Property and equipment, net |
|
27,372 |
|
24,830 |
|
||
|
|
|
|
|
|
|
||
|
Goodwill |
|
439,147 |
|
450,739 |
|
||
|
Other intangible assets, net |
|
10,666 |
|
5,159 |
|
||
|
Other assets |
|
10,904 |
|
12,650 |
|
||
|
Total assets |
|
$ |
797,520 |
|
$ |
803,256 |
|
|
|
|
|
|
|
|
||
|
Liabilities and Shareholders’ Equity |
|
|
|
|
|
||
|
Current liabilities: |
|
|
|
|
|
||
|
Current portion of long-term bank debt |
|
$ |
2,002 |
|
$ |
10,697 |
|
|
Accounts payable |
|
35,373 |
|
33,981 |
|
||
|
Accrued compensation and related liabilities |
|
62,437 |
|
65,747 |
|
||
|
Deferred revenue |
|
13,591 |
|
17,634 |
|
||
|
Income taxes payable |
|
1,874 |
|
10,402 |
|
||
|
Other accrued expenses and liabilities |
|
28,921 |
|
34,563 |
|
||
|
Total current liabilities |
|
144,198 |
|
173,024 |
|
||
|
|
|
|
|
|
|
||
|
Long-term bank debt |
|
165,710 |
|
87,500 |
|
||
|
Deferred income taxes |
|
34,288 |
|
36,486 |
|
||
|
Total liabilities |
|
344,196 |
|
297,010 |
|
||
|
|
|
|
|
|
|
||
|
Commitments and contingencies |
|
|
|
|
|
||
|
|
|
|
|
|
|
||
|
Shareholders’ equity: |
|
|
|
|
|
||
|
Preferred stock, $0.01 par value, 1,000 shares authorized, no shares issued |
|
— |
|
— |
|
||
|
Common stock, $0.01 par value, 100,000 shares authorized, 64,705 and 74,487 shares issued, respectively |
|
647 |
|
745 |
|
||
|
Additional paid-in capital |
|
296,227 |
|
322,999 |
|
||
|
Retained earnings |
|
188,428 |
|
199,668 |
|
||
|
Accumulated other comprehensive income (loss) |
|
(983 |
) |
12,193 |
|
||
|
Treasury stock, 4,620 and 5,005 shares, at cost |
|
(31,889 |
) |
(30,069 |
) |
||
|
Total CIBER, Inc. shareholders’ equity |
|
452,430 |
|
505,536 |
|
||
|
Noncontrolling interests |
|
894 |
|
710 |
|
||
|
Total shareholders’ equity |
|
453,324 |
|
506,246 |
|
||
|
Total liabilities and shareholders’ equity |
|
$ |
797,520 |
|
$ |
803,256 |
|
See accompanying notes to consolidated financial statements.
CIBER, Inc. and Subsidiaries
Consolidated Statements of Shareholders’ Equity
(In thousands)
|
|
|
|
|
|
|
|
|
|
|
|
|
|
|
Accumulated |
|
|
|
|
|
|||||||
|
|
|
|
|
|
|
|
|
|
|
Additional |
|
|
|
Other |
|
|
|
Total |
|
|||||||
|
|
|
Common Stock |
|
Treasury Stock |
|
Paid-in |
|
Retained |
|
Comprehensive |
|
Noncontrolling |
|
Shareholders’ |
|
|||||||||||
|
|
|
Shares |
|
Amount |
|
Shares |
|
Amount |
|
Capital |
|
Earnings |
|
Income (Loss) |
|
Interests |
|
Equity |
|
|||||||
|
Balances at January 1, 2007, as previously stated |
|
64,705 |
|
$ |
647 |
|
(2,952 |
) |
$ |
(21,865 |
) |
$ |
269,303 |
|
$ |
152,681 |
|
$ |
15,356 |
|
$ |
— |
|
$ |
416,122 |
|
|
Cumulative effect of changes in accounting principles for convertible debentures and noncontrolling interests |
|
— |
|
— |
|
— |
|
— |
|
23,104 |
|
(12,696 |
) |
— |
|
129 |
|
10,537 |
|
|||||||
|
Balances at January 1, 2007, as adjusted |
|
64,705 |
|
647 |
|
(2,952 |
) |
(21,865 |
) |
292,407 |
|
139,985 |
|
15,356 |
|
129 |
|
426,659 |
|
|||||||
|
Consolidated net income |
|
— |
|
— |
|
— |
|
— |
|
— |
|
23,951 |
|
— |
|
1,566 |
|
25,517 |
|
|||||||
|
Loss on hedging activity, net of $1,796 tax |
|
— |
|
— |
|
— |
|
— |
|
— |
|
— |
|
(3,140 |
) |
— |
|
(3,140 |
) |
|||||||
|
Foreign currency translation |
|
— |
|
— |
|
— |
|
— |
|
— |
|
— |
|
18,367 |
|
(143 |
) |
18,224 |
|
|||||||
|
Debenture retirement |
|
— |
|
— |
|
— |
|
— |
|
(743 |
) |
— |
|
— |
|
— |
|
(743 |
) |
|||||||
|
Dividends paid to noncontrolling interests |
|
— |
|
— |
|
— |
|
— |
|
— |
|
— |
|
— |
|
(400 |
) |
(400 |
) |
|||||||
|
Buyout of noncontrolling interests |
|
— |
|
— |
|
— |
|
— |
|
— |
|
— |
|
— |
|
(362 |
) |
(362 |
) |
|||||||
|
Acquisition consideration |
|
— |
|
— |
|
122 |
|
910 |
|
— |
|
57 |
|
— |
|
— |
|
967 |
|
|||||||
|
Treasury shares issued under employee share plans |
|
— |
|
— |
|
917 |
|
6,779 |
|
— |
|
(1,150 |
) |
— |
|
— |
|
5,629 |
|
|||||||
|
Tax benefit from employee share plans |
|
— |
|
— |
|
— |
|
— |
|
313 |
|
— |
|
— |
|
— |
|
313 |
|
|||||||
|
Share-based compensation |
|
— |
|
— |
|
30 |
|
224 |
|
2,384 |
|
(1 |
) |
— |
|
— |
|
2,607 |
|
|||||||
|
Purchases of treasury stock |
|
— |
|
— |
|
(2,075 |
) |
(15,332 |
) |
— |
|
— |
|
— |
|
— |
|
(15,332 |
) |
|||||||
|
Balances at December 31, 2007 |
|
64,705 |
|
647 |
|
(3,958 |
) |
(29,284 |
) |
294,361 |
|
162,842 |
|
30,583 |
|
790 |
|
459,939 |
|
|||||||
|
Consolidated net income |
|
— |
|
— |
|
— |
|
— |
|
— |
|
26,884 |
|
— |
|
929 |
|
27,813 |
|
|||||||
|
Gain on hedging activity, net of $54 tax |
|
— |
|
— |
|
— |
|
— |
|
— |
|
— |
|
89 |
|
— |
|
89 |
|
|||||||
|
Foreign currency translation |
|
— |
|
— |
|
— |
|
— |
|
— |
|
— |
|
(31,655 |
) |
(283 |
) |
(31,938 |
) |
|||||||
|
Debenture retirement |
|
— |
|
— |
|
— |
|
— |
|
(1,518 |
) |
— |
|
— |
|
— |
|
(1,518 |
) |
|||||||
|
Buyout of noncontrolling interests |
|
— |
|
— |
|
— |
|
— |
|
— |
|
— |
|
— |
|
(542 |
) |
(542 |
) |
|||||||
|
Treasury shares issued under employee share plans |
|
— |
|
— |
|
757 |
|
5,289 |
|
(4 |
) |
(1,255 |
) |
— |
|
— |
|
4,030 |
|
|||||||
|
Tax benefit from employee share plans |
|
— |
|
— |
|
— |
|
— |
|
121 |
|
— |
|
— |
|
— |
|
121 |
|
|||||||
|
Share-based compensation |
|
— |
|
— |
|
31 |
|
215 |
|
3,267 |
|
(43 |
) |
— |
|
— |
|
3,439 |
|
|||||||
|
Purchases of treasury stock |
|
— |
|
— |
|
(1,450 |
) |
(8,109 |
) |
— |
|
— |
|
— |
|
— |
|
(8,109 |
) |
|||||||
|
Balances at December 31, 2008 |
|
64,705 |
|
647 |
|
(4,620 |
) |
(31,889 |
) |
296,227 |
|
188,428 |
|
(983 |
) |
894 |
|
453,324 |
|
|||||||
|
Consolidated net income |
|
— |
|
— |
|
— |
|
— |
|
— |
|
14,958 |
|
— |
|
158 |
|
15,116 |
|
|||||||
|
Loss on hedging activity, net of $122 tax |
|
— |
|
— |
|
— |
|
— |
|
— |
|
— |
|
(198 |
) |
— |
|
(198 |
) |
|||||||
|
Foreign currency translation |
|
— |
|
— |
|
— |
|
— |
|
— |
|
— |
|
13,374 |
|
23 |
|
13,397 |
|
|||||||
|
Sale of common stock, net of $194 of issuance costs |
|
9,000 |
|
90 |
|
— |
|
— |
|
23,130 |
|
— |
|
— |
|
— |
|
23,220 |
|
|||||||
|
Acquisition of noncontrolling interests |
|
782 |
|
8 |
|
— |
|
— |
|
628 |
|
— |
|
— |
|
(365 |
) |
271 |
|
|||||||
|
Treasury shares issued under employee share plans |
|
— |
|
— |
|
1,018 |
|
6,545 |
|
(565 |
) |
(3,576 |
) |
— |
|
— |
|
2,404 |
|
|||||||
|
Tax benefit deficiency from employee share plans |
|
— |
|
— |
|
— |
|
— |
|
(53 |
) |
— |
|
— |
|
— |
|
(53 |
) |
|||||||
|
Share-based compensation |
|
— |
|
— |
|
42 |
|
273 |
|
3,632 |
|
(142 |
) |
— |
|
— |
|
3,763 |
|
|||||||
|
Purchases of treasury stock |
|
— |
|
— |
|
(1,445 |
) |
(4,998 |
) |
— |
|
— |
|
— |
|
— |
|
(4,998 |
) |
|||||||
|
Balances at December 31, 2009 |
|
74,487 |
|
$ |
745 |
|
(5,005 |
) |
$ |
(30,069 |
) |
$ |
322,999 |
|
$ |
199,668 |
|
$ |
12,193 |
|
$ |
710 |
|
$ |
506,246 |
|
See accompanying notes to consolidated financial statements.
CIBER, Inc. and Subsidiaries
Consolidated Statements of Cash Flows
(In thousands)
|
|
|
Year Ended December 31, |
|
|||||||
|
|
|
2007 |
|
2008 |
|
2009 |
|
|||
|
Operating activities: |
|
|
|
|
|
|
|
|||
|
Net income |
|
$ |
25,517 |
|
$ |
27,813 |
|
$ |
15,116 |
|
|
Adjustments to reconcile net income to net cash provided by operating activities: |
|
|
|
|
|
|
|
|||
|
Depreciation |
|
11,872 |
|
12,519 |
|
11,719 |
|
|||
|
Amortization of intangible assets |
|
5,820 |
|
6,274 |
|
5,891 |
|
|||
|
Deferred income tax expense |
|
2,122 |
|
3,120 |
|
1,462 |
|
|||
|
Provision for doubtful receivables |
|
831 |
|
6,965 |
|
2,260 |
|
|||
|
Share-based compensation expense |
|
2,607 |
|
3,439 |
|
3,763 |
|
|||
|
Noncash interest from discount on convertible debentures |
|
9,615 |
|
5,303 |
|
— |
|
|||
|
Other, net |
|
(54 |
) |
216 |
|
2,329 |
|
|||
|
Changes in operating assets and liabilities, net of acquisitions: |
|
|
|
|
|
|
|
|||
|
Accounts receivable |
|
(32,318 |
) |
16,527 |
|
24,775 |
|
|||
|
Other current and long-term assets |
|
(2,110 |
) |
(653 |
) |
(520 |
) |
|||
|
Accounts payable |
|
(7,166 |
) |
1,860 |
|
(1,967 |
) |
|||
|
Accrued compensation and related liabilities |
|
8,423 |
|
11,641 |
|
1,035 |
|
|||
|
Other accrued expenses and liabilities |
|
(3,970 |
) |
(3,792 |
) |
8,441 |
|
|||
|
Income taxes payable/refundable |
|
1,487 |
|
939 |
|
7,243 |
|
|||
|
Net cash provided by operating activities |
|
22,676 |
|
92,171 |
|
81,547 |
|
|||
|
|
|
|
|
|
|
|
|
|||
|
Investing activities: |
|
|
|
|
|
|
|
|||
|
Acquisitions, net of cash acquired |
|
(22,342 |
) |
(7,790 |
) |
(4,330 |
) |
|||
|
Purchases of property and equipment, net |
|
(13,172 |
) |
(14,680 |
) |
(9,059 |
) |
|||
|
Proceeds from sale of property and equipment |
|
1,864 |
|
— |
|
— |
|
|||
|
Other, net |
|
— |
|
233 |
|
— |
|
|||
|
Net cash used in investing activities |
|
(33,650 |
) |
(22,237 |
) |
(13,389 |
) |
|||
|
|
|
|
|
|
|
|
|
|||
|
Financing activities: |
|
|
|
|
|
|
|
|||
|
Borrowings on long-term bank debt |
|
378,965 |
|
619,850 |
|
569,619 |
|
|||
|
Payments on long-term bank debt |
|
(340,694 |
) |
(510,829 |
) |
(639,135 |
) |
|||
|
Retirement of debentures |
|
(22,113 |
) |
(149,495 |
) |
— |
|
|||
|
Sale of common stock, net of $194 of issuance costs |
|
— |
|
— |
|
23,220 |
|
|||
|
Employee stock purchases and options exercised |
|
5,629 |
|
4,030 |
|
2,404 |
|
|||
|
Purchases of treasury stock |
|
(15,332 |
) |
(8,109 |
) |
(4,998 |
) |
|||
|
Excess tax benefits from share-based compensation |
|
323 |
|
148 |
|
— |
|
|||
|
Settlement of cross-currency interest rate swaps |
|
(339 |
) |
(4,280 |
) |
— |
|
|||
|
Credit facility origination/amendment fees paid |
|
— |
|
(1,243 |
) |
(3,471 |
) |
|||
|
Other, net |
|
(342 |
) |
(4 |
) |
(222 |
) |
|||
|
Net cash provided by (used in) financing activities |
|
6,097 |
|
(49,932 |
) |
(52,583 |
) |
|||
|
Effect of foreign exchange rate changes on cash and cash equivalents |
|
3,275 |
|
(2,870 |
) |
3,000 |
|
|||
|
Net increase (decrease) in cash and cash equivalents |
|
(1,602 |
) |
17,132 |
|
18,575 |
|
|||
|
Cash and cash equivalents, beginning of year |
|
33,319 |
|
31,717 |
|
48,849 |
|
|||
|
Cash and cash equivalents, end of year |
|
$ |
31,717 |
|
$ |
48,849 |
|
$ |
67,424 |
|
See accompanying notes to consolidated financial statements.
CIBER, Inc. and Subsidiaries
Notes to Consolidated Financial Statements
(1) Summary of Significant Accounting Policies
(a) Description of Business
CIBER, Inc. and its subsidiaries, collectively, are an international, diversified, system integration and information technology (“IT”) services consulting firm. Our services are offered on a project or strategic staffing basis, in both custom and enterprise resource planning (“ERP”) package environments, and across all technology platforms, operating systems and infrastructures. To a lesser extent, we resell certain third-party IT hardware and software products. Our clients consist primarily of governmental agencies and Fortune 1000 and middle market companies across most major industries. Founded in 1974, we operate in a geographically-based business model, with our consultants serving clients from over 70 offices in 18 countries.
(b) Principles of Consolidation
The Consolidated Financial Statements include the accounts of CIBER, Inc. and all of its majority-owned subsidiaries (together “CIBER,” “the Company,” “we,” “our,” or “us”). All material inter-company balances and transactions have been eliminated. Certain amounts reported in 2007 and 2008 have been reclassified to conform to the 2009 presentation. These reclassifications have no effect on our previously reported net income or cash flows.
The shares of our foreign subsidiaries that are owned by persons other than CIBER are referred to as noncontrolling interests in these Consolidated Financial Statements. The noncontrolling shareholders’ proportionate share of the equity of these subsidiaries is reflected as “noncontrolling interests” in the Consolidated Balance Sheet. The noncontrolling shareholders’ proportionate share of the net income or loss of these subsidiaries is reflected as “net income — noncontrolling interests” in the Consolidated Statement of Operations. In accounting for the acquisition of a noncontrolling interest, any consideration in excess of the book value of the noncontrolling interest is recorded as a reduction of CIBER shareholders’ equity. In April 2009, we issued 782,584 shares of our common stock, valued at approximately $2.4 million, in exchange for all of the noncontrolling interests in one of our foreign subsidiaries.
(c) Use of Estimates
The preparation of our Consolidated Financial Statements in conformity with U.S. generally accepted accounting principles (“GAAP”) requires management to make estimates and assumptions that affect amounts reported in the Consolidated Financial Statements and accompanying disclosures. We base our estimates on historical experience and on various other assumptions that we believe are reasonable under the circumstances. Actual results could differ from those estimates.
(d) Retroactive Accounting Pronouncement Adjustments
In May 2008, the FASB issued new accounting guidance on convertible debt instruments that may be settled in cash upon conversion. This guidance requires that the proceeds from the issuance of certain convertible debt instruments be allocated between a liability component (issued at a discount) and the embedded conversion option (i.e., the equity component) in a manner that reflects the entity’s nonconvertible debt borrowing rate. The difference between the principal amount of the debt and the amount of the proceeds allocated to the liability component must be reported as a debt discount and subsequently amortized to earnings as additional non-cash interest expense over the convertible debt’s expected life using the effective interest method. We adopted this guidance, which requires retrospective application for all periods presented, on January 1, 2009. The adoption changed the historical accounting treatment for our Convertible Senior Subordinated Debentures (“Debentures”) even though all of our Debentures were repurchased and retired prior to December 31, 2008.
In December 2007, the FASB issued accounting guidance contained within ASC 810, “Consolidation,” regarding noncontrolling interests. This guidance requires that the noncontrolling interests in the equity of a subsidiary be accounted for and reported as equity, provides revised guidance on the treatment of net income and losses attributable to the noncontrolling interests and changes in ownership interests in a subsidiary, and requires additional disclosures that identify and distinguish between the interest of the controlling and noncontrolling owners. We prospectively adopted these requirements on January 1, 2009, except for the presentation and disclosure requirements, which have been applied retrospectively to all periods presented.
The required retrospective applications of the above guidance had the following impact on our net income, diluted earnings per share and presentation of the consolidated statement of operations for 2007 and 2008:
|
|
|
Year Ended December 31, |
|
||||
|
|
|
2007 |
|
2008 |
|
||
|
|
|
(In thousands) |
|
||||
|
Net income — CIBER, Inc., as previously reported |
|
$ |
29,026 |
|
$ |
29,956 |
|
|
Impact of convertible debenture adjustment |
|
(5,075 |
) |
(3,072 |
) |
||
|
Net income — CIBER, Inc., as adjusted |
|
23,951 |
|
26,884 |
|
||
|
Net income — noncontrolling interests |
|
1,566 |
|
929 |
|
||
|
Consolidated net income |
|
$ |
25,517 |
|
$ |
27,813 |
|
|
|
|
|
|
|
|
||
|
Earnings per share — basic and diluted: |
|
|
|
|
|
||
|
Net income — CIBER, Inc., as previously reported |
|
$ |
0.47 |
|
$ |
0.50 |
|
|
Impact of convertible debenture adjustment |
|
(0.08 |
) |
(0.05 |
) |
||
|
Net income — CIBER, Inc., as adjusted |
|
$ |
0.39 |
|
$ |
0.45 |
|
(e) Revenue Recognition
CIBER earns revenue primarily from providing IT services to its clients, and to a much lesser extent, from the sale and resale of IT hardware and software products. CIBER’s consulting services revenue comes from three primary sources: (1) technology integration services where we design, build and implement new or enhanced system applications and related processes; (2) general IT consulting services, such as system selection or assessment, feasibility studies, training and staffing; and (3) managed IT services in which we manage, staff, maintain, host or otherwise run solutions and/or systems provided to our customers. Contracts for these services have different terms based on the scope, deliverables and complexity of the engagement, which requires management to make judgments and estimates in recognizing revenue. Fees for these contracts may be in the form of time-and-materials or fixed-price. The majority of our consulting services revenue is recognized under time-and-materials contracts as hours and costs are incurred. Consulting services revenue also includes project-related reimbursable expenses for travel and other out-of-pocket expenses separately billed to clients.
Revenue for technology integration consulting services where we design/redesign, build and implement new or enhanced systems applications and related processes for our clients is generally recognized based on the percentage-of-completion method. Under the percentage-of-completion method, management estimates the percentage of completion based upon the contract costs incurred to date as a percentage of the total estimated contract costs. If the total cost estimate exceeds revenue, we accrue for the estimated loss immediately. The use of the percentage-of-completion method requires significant judgment relative to estimating total contract revenue and costs, including assumptions as to the length of time to complete the project, the nature and complexity of the work to be performed and anticipated changes in estimated costs. Estimates of total contract costs are continuously monitored during the term of the contract and recorded revenues and costs are subject to revision as the contract progresses. Such revisions may result in increases or decreases to revenue and income and are reflected in the Consolidated Financial Statements in the periods in which they are first identified.
Revenue for general IT consulting services is recognized as work is performed and amounts are earned. We consider amounts to be earned once evidence of an arrangement has been obtained, services are delivered, fees are fixed or determinable and collectability is reasonably assured. For contracts with fees based on time-and-materials or cost-plus, we recognize revenue over the period of performance. For fixed-price contracts, depending on the specific contractual provisions and nature of the deliverables, revenue may be recognized on a proportional performance model based on level-of-effort, as milestones are achieved or when final deliverables have been provided.
Managed IT services arrangements typically span several years. Revenue from managed services time-and-materials contracts is recognized as the services are performed. Revenue from unit-priced contracts is recognized as transactions are processed based on objective measures of output. Revenue from fixed-price contracts is recognized on a straight-line basis, unless revenues are earned and obligations are fulfilled in a different pattern. Costs related to delivering managed services are expensed as incurred, with the exception of labor and other direct costs related to the set-up of processes, personnel and systems, which are deferred during the transition period and expensed evenly over the period services are provided. Amounts billable to the client for transition or set-up activities are also deferred and recognized as revenue evenly over the period that the managed services are provided.
Other revenue includes resale of third-party IT hardware and software products, sales of proprietary software and commissions on sales of IT products. Some software license arrangements also include implementation services and/or post-contract customer support. In such multi-element arrangements, if the criteria are met, revenue is recognized based on the vendor specific objective evidence of the fair value of each element. Software support revenue is recognized ratably over the term of the related agreement. Revenue related to the sale of IT products is generally recognized when the products are
shipped or if applicable, when delivered and installed in accordance with the terms of the sale. Where we are the re-marketer of certain IT products, commission revenue is recognized when the products are drop-shipped from the vendor to the customer. Our commission revenue represents the sales price to the customer less the cost paid to the vendor.
Unbilled accounts receivable represent amounts recognized as revenue based on services performed in advance of billings in accordance with contract terms. Under our typical time-and-materials billing arrangement, we bill our customers on a regularly scheduled basis, such as biweekly or monthly. At the end of each accounting period, we accrue revenue for services performed since the last billing cycle. These unbilled amounts are generally billed the following month. Unbilled accounts receivable also arise when percentage-of-completion accounting is used and costs plus estimated contract earnings exceed billings. Such amounts are billed at specific milestone dates or at contract completion. Management expects all unbilled accounts receivable to be collected within one year of the balance sheet date. Billings in excess of revenue recognized are recorded as deferred revenue and are primarily comprised of deferred software support revenue.
(f) Cash and Cash Equivalents
Cash and cash equivalents includes bank demand and time deposits, money market funds and all other highly liquid investments with maturities of three months or less when purchased. Substantially all of our cash balance at December 31, 2008 and 2009 was held by our European subsidiaries.
(g) Accounts Receivable and Allowance for Doubtful Accounts
We record accounts receivable at their face amount less an allowance for doubtful accounts. On a regular basis, we evaluate our client receivables, especially receivables that are past due, and we establish an allowance for doubtful accounts based on specific client collection issues.
(h) Property and Equipment
Property and equipment, which consists of computer equipment and software, furniture and leasehold improvements, is stated at cost. Depreciation is computed using straight-line and accelerated methods over the estimated useful lives, ranging primarily from three to seven years, or the related lease term, if shorter. Direct costs of time and materials incurred for the development of software for internal use are capitalized as property and equipment.
(i) Goodwill and Other Intangible Assets
Goodwill represents the cost of acquired businesses in excess of the estimated fair value assigned to the net assets acquired. Goodwill is not amortized, but rather is subject to impairment testing. We review goodwill for impairment annually at June 30, and whenever events or changes in circumstances indicate its carrying value may not be recoverable. The result of our June 30, 2009 annual impairment test was that no impairment was indicated. Goodwill impairment testing consists of a two-step process. In the first step, we compare the fair value of each reporting unit to its carrying value. Our reporting units are consistent with the reportable segments identified in Note 13 to our Consolidated Financial Statements. If the fair value of the reporting unit exceeds the carrying value of the net assets assigned to that unit, goodwill is considered not to be impaired and we are not required to perform further testing. If the carrying value of the net assets assigned to the reporting unit exceeds the fair value of the reporting unit, then we must perform the second step of the impairment test in order to determine the implied fair value of the reporting unit’s goodwill. If the carrying value of the reporting unit’s goodwill exceeds its implied fair value, we would record an impairment loss equal to the difference. Our goodwill impairment tests did not result in any impairment in 2007, 2008 or 2009.
Other intangible assets arise from business combinations and consist primarily of customer relationships that are amortized over periods of up to seven years.
(j) Capitalized Software Development Costs
For software we intend to sell, we capitalize internal software development costs from the time technological feasibility is established. Capitalized software development costs are reported at the lower of unamortized cost or estimated net realizable value. At December 31, 2008 and 2009, unamortized software development costs were $1.6 million and $520,000, respectively, and are included in “other assets” on the Consolidated Balance Sheet. Amortization of the capitalized software costs began in 2007 and will occur over the software’s estimated useful life of 36 months. Amortization of approximately $820,000, $1.0 million and $1.0 million was recorded in 2007, 2008 and 2009, respectively, and was included in cost of product sales in the Consolidated Statement of Operations.
(k) Long-Lived Assets (excluding Goodwill)
Long-lived assets are reviewed for impairment whenever events or circumstances indicate that the carrying amount of an asset may not be fully recoverable. An impairment loss is recognized only if the carrying amount of a long-lived asset is not recoverable from its undiscounted cash flows and is measured as the difference between the carrying amount and fair value of the asset.
(l) Income Taxes
Deferred tax assets and liabilities are recognized for the future tax consequences attributable to differences between the financial statement carrying amounts of existing assets and liabilities and their respective tax bases and for operating loss carryforwards. Deferred tax amounts are based on enacted tax rates expected to be in effect during the year in which the differences reverse. The effect on deferred tax assets and liabilities due to a change in tax rates is recognized in income tax expense in the period that includes the enactment date. Deferred tax assets and liabilities are classified as current and non-current amounts based on the financial statement classification of the related asset and liability. A valuation allowance is provided when it is more likely than not that a deferred tax asset will not be realized. We use a two-step approach to recognizing and measuring uncertain tax positions taken or expected to be taken in an income tax return. We first determine if the weight of available evidence indicates that it is more likely than not that the tax position will be sustained on audit, including resolution of any related appeals or litigation processes. The second step involves measuring the tax benefit as the largest amount that is more than 50% likely to be realized upon ultimate settlement.
The provision for income taxes represents the estimated amounts for federal, state and foreign taxes. The determination of the provision for income tax expense, deferred tax assets and liabilities and related valuation allowance involves judgment. As a global company, we are required to calculate and provide for income taxes in each of the tax jurisdictions where we operate. This involves making judgments regarding the recoverability of deferred tax assets, which can affect the overall effective tax rate. In addition, changes in the geographic mix or estimated level of pre-tax income can affect the overall effective tax rate. Interim-period tax expense is recorded based upon our best estimate of the effective tax rate expected to be applicable for the full fiscal year. Interest expense on tax liabilities is included in interest expense.
(m) Foreign Currency
The assets and liabilities of our foreign operations are translated into U.S. dollars at current exchange rates and revenue and expense are translated at average exchange rates for the period. The resulting translation adjustments are included in “accumulated other comprehensive income (loss)” on the Consolidated Balance Sheet. Gains and losses arising from inter-company international transactions that are of a long-term investment nature are reported in the same manner as translation adjustments.
All foreign currency transaction gains and losses, including foreign currency gains and losses on short-term inter-company loans and advances, are included in “other income (expense), net” in the Consolidated Statement of Operations as incurred.
(n) Share-Based Compensation
We record share-based compensation expense for awards of equity instruments to employees based on the estimated grant-date fair value of these awards. Share-based compensation cost is recognized, as appropriate, in either “cost of consulting services” or in “selling, general and administrative expense” in the Consolidated Statement of Operations.
(o) Other Income (Expense), Net
Other income (expense), net consisted of the following:
|
|
|
Year Ended December 31, |
|
|||||||
|
|
|
2007 |
|
2008 |
|
2009 |
|
|||
|
|
|
(In thousands) |
|
|||||||
|
Foreign exchange gains (losses), net |
|
$ |
(1,021 |
) |
$ |
(2,459 |
) |
$ |
296 |
|
|
Gain on retirement of convertible debentures |
|
887 |
|
1,264 |
|
— |
|
|||
|
Other |
|
(50 |
) |
(249 |
) |
42 |
|
|||
|
Other income (expense), net |
|
$ |
(184 |
) |
$ |
(1,444 |
) |
$ |
338 |
|
(p) Fair Value of Financial Instruments
The carrying values of our cash and cash equivalents, accounts receivable and accounts payable approximate their fair values due to their short-term nature. The fair value of derivative instruments such as interest rate swaps is determined utilizing market based information. The book values of the borrowings under our senior credit facility and our other bank debt approximate their fair values due to either their variable interest rates or their short-term nature.
(q) Business and Credit Concentrations
Financial instruments that are potentially subject to concentrations of credit risk are cash and cash equivalents and accounts receivable. Our cash and cash equivalents are in high-credit quality short-term investments and held by financial institutions. Accounts receivable are reviewed on a periodic basis and an allowance for bad debts is recorded where such amounts are determined to be uncollectible. We do not require collateral from our customers. Our revenue and accounts receivable are principally concentrated with large companies across several industries and governmental entities located throughout the United States and Europe.
(r) Contingencies
We are routinely involved in legal proceedings, audits, claims and litigation arising in the ordinary course of business. Although, the outcome of such matters is not predictable with assurance, we do not expect that the ultimate outcome of any of these matters, individually or in the aggregate, will have a material adverse effect on our financial condition. However, depending on the amount and timing, an unfavorable outcome of any such matters could possibly materially affect our future results of operations or cash flow in any particular period.
(s) Recently Adopted Accounting Pronouncements
In June 2009, the Financial Accounting Standards Board (“FASB”) issued Accounting Standards Codification (“ASC”) 105, “Generally Accepted Accounting Principals.” ASC 105 establishes the FASB ASC as the single source of authoritative nongovernmental U.S. GAAP. The standard is effective for interim and annual periods ending after September 15, 2009. We adopted the provisions of the standard on September 30, 2009. The adoption of the standard has changed how we reference various elements of GAAP when preparing our financial statement disclosures, but did not have an impact on CIBER’s financial position, results of operations or cash flows.
(2) Acquisitions
We have acquired certain businesses, as set forth below, that we have accounted for using the purchase method of accounting for business combinations and, accordingly, the accompanying Consolidated Financial Statements include the results of operations of each acquired business since the date of acquisition.
Acquisitions — 2009
In January 2009, we acquired Iteamic Private Ltd. (“Iteamic”) of Bangalore, India. Iteamic specialized in application development of offshore projects, primarily with companies in North America, and became part of our Custom Solutions division. The acquisition added leadership and delivery skills depth to our India offshore global solution center. The purchase price was approximately $4.7 million, and was allocated as follows: $800,000 to net tangible assets acquired and $3.9 million to goodwill.
Acquisitions — 2008
On April 15, 2008, our International division acquired a Norwegian SAP consultancy for a total purchase price of approximately $6.5 million. The results of the acquired operation have been included in our consolidated financial statements since the date of acquisition. Approximately $4.8 million was paid during 2008 and approximately $1.7 million is expected to be paid in the future. In connection with the acquisition, we recorded goodwill of approximately $5.5 million and acquired other net assets of $1.0 million.
Additionally, in 2008, we purchased a noncontrolling interest in one of our European subsidiaries for a purchase price of approximately $2.8 million.
Acquisitions — 2007
On September 4, 2007, we acquired California-based Metamor Enterprise Solutions LLC (“Metamor”). Metamor, which provided SAP software implementation services and was a reseller of SAP products, became part of our U.S. ERP division. At the time of the acquisition, Metamor had approximately 100 SAP consultants. The acquisition provided scale to our domestic SAP activities, where we previously had difficulty in locating skilled SAP employee resources. The purchase price was approximately $16.4 million, including expenses, and was allocated as follows: $2.1 million to net tangible assets acquired, $1.3 million to other intangibles and $13.0 million to goodwill.
On October 12, 2007, our International division acquired a Swedish SAP consultancy with approximately 30 consultants for a total purchase price of approximately $4.2 million, which included approximately 122,000 shares of CIBER common stock valued at $967,000. We acquired net tangible liabilities of approximately $100,000, other intangible assets of approximately $500,000 and recorded goodwill of approximately $3.8 million.
Additionally in 2007, we purchased a noncontrolling interest in one of our European subsidiaries for a purchase price of approximately $1.4 million.
(3) Net Income per Share
Our computation of net income per share — basic and diluted is as follows:
|
|
|
Year Ended December 31, |
|
|||||||
|
|
|
2007 |
|
2008 |
|
2009 |
|
|||
|
|
|
(In thousands, except per share amounts) |
|
|||||||
|
Numerator: |
|
|
|
|
|
|
|
|||
|
Net income — CIBER, Inc. |
|
$ |
23,951 |
|
$ |
26,884 |
|
$ |
14,958 |
|
|
Denominator: |
|
|
|
|
|
|
|
|||
|
Basic weighted average shares outstanding |
|
61,207 |
|
60,092 |
|
67,996 |
|
|||
|
Dilutive effect of employee share plans |
|
717 |
|
297 |
|
111 |
|
|||
|
Diluted weighted average shares outstanding |
|
61,924 |
|
60,389 |
|
68,107 |
|
|||
|
|
|
|
|
|
|
|
|
|||
|
Net income per share — basic |
|
$ |
0.39 |
|
$ |
0.45 |
|
$ |
0.22 |
|
|
Net income per share — diluted |
|
$ |
0.39 |
|
$ |
0.45 |
|
$ |
0.22 |
|
Dilutive securities are excluded from the diluted weighted average shares outstanding computation in periods in which they have an anti-dilutive effect, such as when stock options have an exercise price that is greater than the average market price of CIBER common stock during the period. The approximate average number of anti-dilutive securities omitted from the computation of diluted weighted average shares outstanding was 4,415,000, 6,256,000 and 9,149,000 for 2007, 2008 and 2009, respectively.
(4) Accounts Receivable
Accounts receivable consists of the following:
|
|
|
December 31, |
|
||||
|
|
|
2008 |
|
2009 |
|
||
|
|
|
(In thousands) |
|
||||
|
Billed accounts receivable |
|
$ |
183,415 |
|
$ |
159,895 |
|
|
Unbilled - scheduled billings |
|
39,394 |
|
40,578 |
|
||
|
Costs and estimated earnings in excess of billings |
|
16,668 |
|
15,819 |
|
||
|
|
|
239,477 |
|
216,292 |
|
||
|
Less allowance for doubtful accounts |
|
(4,411 |
) |
(3,192 |
) |
||
|
|
|
$ |
235,066 |
|
$ |
213,100 |
|
The activity in the allowance for doubtful accounts consists of the following:
|
|
|
|
|
Additions |
|
|
|
Effect of |
|
|
|
||
|
|
|
Balance at |
|
Charge |
|
|
|
foreign |
|
Balance |
|
||
|
|
|
beginning |
|
to cost and |
|
Deductions |
|
exchange |
|
at end |
|
||
|
|
|
of period |
|
expense |
|
Write-offs |
|
rate changes |
|
of period |
|
||
|
|
|
(In thousands) |
|
||||||||||
|
Year ended December 31, 2007 |
|
$ |
2,989 |
|
831 |
|
(1,800 |
) |
38 |
|
$ |
2,058 |
|
|
Year ended December 31, 2008 |
|
$ |
2,058 |
|
6,965 |
|
(4,337 |
) |
(275 |
) |
$ |
4,411 |
|
|
Year ended December 31, 2009 |
|
$ |
4,411 |
|
2,260 |
|
(3,528 |
) |
49 |
|
$ |
3,192 |
|
(5) Property and Equipment
Property and equipment consist of the following:
|
|
|
December 31, |
|
||||
|
|
|
2008 |
|
2009 |
|
||
|
|
|
(In thousands) |
|
||||
|
Computer equipment and software |
|
$ |
60,281 |
|
$ |
63,447 |
|
|
Furniture and fixtures |
|
10,956 |
|
9,922 |
|
||
|
Leasehold improvements, buildings and other |
|
9,123 |
|
9,419 |
|
||
|
|
|
80,360 |
|
82,788 |
|
||
|
Less accumulated depreciation |
|
(52,988 |
) |
(57,958 |
) |
||
|
Property and equipment, net |
|
$ |
27,372 |
|
$ |
24,830 |
|
(6) Goodwill and Other Intangible Assets
The changes in the carrying amount of goodwill are as follows:
|
|
|
Custom |
|
International |
|
IT |
|
Federal |
|
U.S. ERP |
|
Total |
|
||||||
|
|
|
(In thousands) |
|
||||||||||||||||
|
Balance at January 1, 2008 |
|
$ |
144,948 |
|
$ |
152,359 |
|
$ |
31,935 |
|
$ |
74,264 |
|
$ |
54,339 |
|
$ |
457,845 |
|
|
Acquisitions |
|
— |
|
7,744 |
|
— |
|
— |
|
— |
|
7,744 |
|
||||||
|
Adjustments on prior acquisitions: |
|
|
|
|
|
|
|
|
|
|
|
|
|
||||||
|
Acquired tax benefits realized |
|
— |
|
(3,191 |
) |
— |
|
— |
|
— |
|
(3,191 |
) |
||||||
|
Other |
|
748 |
|
— |
|
— |
|
— |
|
— |
|
748 |
|
||||||
|
Effect of foreign exchange rate changes |
|
— |
|
(23,999 |
) |
— |
|
— |
|
— |
|
(23,999 |
) |
||||||
|
Balance at December 31, 2008 |
|
145,696 |
|
132,913 |
|
31,935 |
|
74,264 |
|
54,339 |
|
439,147 |
|
||||||
|
Acquisitions |
|
3,922 |
|
64 |
|
— |
|
— |
|
— |
|
3,986 |
|
||||||
|
Adjustments on prior acquisitions |
|
— |
|
(1,289 |
) |
— |
|
— |
|
— |
|
(1,289 |
) |
||||||
|
Effect of foreign exchange rate changes |
|
— |
|
8,895 |
|
— |
|
— |
|
— |
|
8,895 |
|
||||||
|
Balance at December 31, 2009 |
|
$ |
149,618 |
|
$ |
140,583 |
|
$ |
31,935 |
|
$ |
74,264 |
|
$ |
54,339 |
|
$ |
450,739 |
|
Other intangible assets are comprised of the following:
|
|
|
Cost |
|
Accumulated |
|
Intangible |
|
|||
|
|
|
(In thousands) |
|
|||||||
|
December 31, 2008 |
|
|
|
|
|
|
|
|||
|
Noncompete agreements |
|
$ |
50 |
|
$ |
(50 |
) |
$ |
— |
|
|
Customer relationships |
|
35,791 |
|
(25,125 |
) |
10,666 |
|
|||
|
|
|
$ |
35,841 |
|
$ |
(25,175 |
) |
$ |
10,666 |
|
|
|
|
|
|
|
|
|
|
|||
|
December 31, 2009 |
|
|
|
|
|
|
|
|||
|
Customer relationships |
|
$ |
37,542 |
|
$ |
(32,383 |
) |
$ |
5,159 |
|
At December 31, 2009, our customer relationships have a weighted average remaining life of 1.2 years. Amortization expense for future periods as estimated at December 31, 2009, consists of the following (in thousands):
|
|
|
Estimated Amortization |
|
|
|
Year ended December 31, 2010 |
|
$ |
4,121 |
|
|
Year ended December 31, 2011 |
|
1,038 |
|
|
(7) Operating Leases
We have non-cancelable operating leases primarily for our office space, automobiles and office equipment. Expense for operating leases totaled approximately $23.0 million, $25.4 million and $25.7 million in 2007, 2008 and 2009, respectively.
Future minimum operating lease payments as of December 31, 2009, are (in thousands):
|
|
|
Rental Payments |
|
|
|
2010 |
|
$ |
25,520 |
|
|
2011 |
|
18,590 |
|
|
|
2012 |
|
13,113 |
|
|
|
2013 |
|
7,623 |
|
|
|
2014 |
|
3,989 |
|
|
|
Thereafter |
|
9,117 |
|
|
|
|
|
$ |
77,952 |
|
(8) Borrowings
Senior Credit Facility — On August 20, 2009, CIBER entered into a three-year senior credit agreement with several financial institutions as lenders and Bank of America, N.A. as administrative agent (the “Senior Credit Facility”). The Senior Credit Facility replaced our previous senior secured reducing revolving credit facility and refinanced all amounts outstanding thereunder. The credit available under the Senior Credit Facility may be used for the working capital needs and general corporate purposes of the Company. The Senior Credit Facility was subsequently amended on February 18, 2010, and matures on August 20, 2012.
The Senior Credit Facility, as amended, provides for: 1) an $85 million revolving line of credit (“Revolver”), which may be used for revolving loans and to request the issuance of letters of credit on CIBER’s behalf, and 2) a $50 million term loan (“Term Loan”). The Term Loan requires quarterly principal reductions of $2.5 million, beginning on December 31, 2009. The Term Loan balance at December 31, 2009, is $47.5 million, of which $10.0 million is classified as a current liability.
Additionally, the Senior Credit Facility is subject to mandatory prepayments (and commitment reductions) in amounts equal to the net cash proceeds of any asset disposition, event of loss, extraordinary receipts, issuance or incurrence of indebtedness and issuance of equity, subject in each case as appropriate to thresholds and other exceptions and definitions as specified in the credit agreement. CIBER’s obligations under the Senior Credit Facility are secured by all of CIBER’s present and future domestic tangible and intangible assets, as well as a pledge of 66% of the capital stock of CIBER’s direct foreign subsidiaries.
Subject to applicable conditions, we may elect interest rates on our Senior Credit Facility borrowings calculated by reference to either the Bank of America prime lending rate (“Prime”) plus a margin that ranges from 1.75% to 2.50%, or a London Interbank Offered Rate (“LIBOR”) for one, three or six month maturities, plus a margin that ranges from 2.75% to 3.50%. The applicable margins on our Prime loans and LIBOR loans are determined by reference to our current consolidated total leverage ratio. We are also required to pay a commitment fee of 0.50% per annum on the unused portion of the Senior Credit Facility. The Senior Credit Facility and the related loan documents provide for the payment of other specified recurring fees and expenses, including administrative agent fees, letter of credit and other fees. We currently have two interest rate swaps. The first interest rate swap matures on March 12, 2010, and effectively converts $50.0 million of our borrowings under our Senior Credit Facility from a variable-rate instrument into a 1.26% fixed-rate instrument, plus the applicable margin. The second interest rate swap matures on March 31, 2012, and effectively converts $25.0 million of our borrowings under our Senior Credit Facility from a variable-rate instrument into a 1.77% fixed-rate instrument, plus the applicable margin. At December 31, 2009, our weighted average interest rate on our outstanding borrowings under the Senior Credit Facility, including the interest swaps, was 4.41%.
The terms of the Senior Credit Facility, as amended, include among other provisions, specific limitations on the incurrence of additional indebtedness and liens, stock repurchases, investments, guarantees, mergers, dispositions and acquisitions, and a prohibition on the payment of any dividends. The Senior Credit Facility also contains certain financial covenants, including:
1) a maximum consolidated total leverage ratio; 2) a minimum consolidated fixed charge coverage ratio; 3) a minimum EBITDA; and 4) an asset coverage test.
Total upfront and arrangement fees and related expenses for completing the Senior Credit Facility in 2009 were approximately $3.5 million and are being amortized over three years to interest expense.
At December 31, 2009, we had outstanding borrowings of $97.5 million under the Senior Credit Facility. We are required to be in compliance with the financial covenants at the end of each calendar quarter, and we were in compliance with these financial covenants as of December 31, 2009.
We estimated the fair value of the Senior Credit Facility by discounting expected future cash flows using estimated interest rate spreads currently available for a credit facility with similar terms and maturity to our existing outstanding borrowings. At December 31, 2009, interest rate spreads are the same as when we entered into the Senior Credit Facility, therefore, the estimated fair value of our amounts outstanding under the Senior Credit Facility are the same as the outstanding borrowings recorded in our financial statements at the carrying value of $97.5 million.
Bank Debt — Bank debt consisted of the following (dollars in thousands):
|
|
|
December 31, |
|
||||
|
|
|
2008 |
|
2009 |
|
||
|
Revolving Credit Facility |
|
$ |
165,710 |
|
$ |
— |
|
|
Senior Credit Facility |
|
— |
|
97,500 |
|
||
|
Loan payable in monthly installments of $136 (including principal and interest), at a fixed interest rate of 7.11%, maturing November 2009 |
|
1,442 |
|
— |
|
||
|
Other |
|
560 |
|
697 |
|
||
|
Total bank debt |
|
167,712 |
|
98,197 |
|
||
|
Less current portion |
|
(2,002 |
) |
(10,697 |
) |
||
|
Long-term bank debt |
|
$ |
165,710 |
|
$ |
87,500 |
|
Maturities — Maturities of long-term debt were determined to be as follows (in thousands):
|
|
|
Amount Maturing |
|
|
|
2010 |
|
$ |
10,697 |
|
|
2011 |
|
10,000 |
|
|
|
2012 |
|
77,500 |
|
|
|
|
|
$ |
98,197 |
|
(9) Financial Instruments
We recognize all derivative instruments as either assets or liabilities on our balance sheet at fair value. The accounting for changes in the fair value (i.e., gains or losses) of a derivative instrument depends on whether it has been designated and qualifies as part of a hedging relationship and further, on the type of hedging relationship. All hedging instruments must be designated, based on the exposure being hedged, as a fair value hedge, a cash flow hedge or a hedge of a net investment in a foreign operation.
CIBER is exposed to certain risks related to its ongoing business operations. From time to time, CIBER may choose to use derivative instruments to manage certain risks related to foreign currency exchange rates and interest rates.
For derivative instruments that are designated and qualify as a cash flow hedge, the gain or loss on the effective hedge portion of the derivative instrument is reported as a component of “accumulated other comprehensive income (loss)” on the Consolidated Balance Sheet and is reclassified into earnings in the same period during which the hedged transaction affects earnings. The gain or loss is classified in the same statement of operations line item as the associated item being hedged.
We have entered into several interest rate swaps with financial institutions, for which we have elected hedge accounting and have designated them as cash flow hedges. These interest rate swaps help us manage our interest rate risk under our Senior Credit Facility by converting a portion of our floating-rate debt to a fixed-rate basis, thus reducing the impact of interest rate changes on future interest expense. These agreements involve the receipt of floating-rate amounts in exchange for fixed-rate payments over the life of the agreements without any exchange of underlying principal amounts. Interest is net settled monthly with the financial institution counterparties. The first interest rate swap, which matures on March 12, 2010,
effectively converts $50.0 million of our borrowings under our Senior Credit Facility from a variable-rate instrument into a fixed-rate instrument at 1.26% plus our current credit margin of 3.25% at December 31, 2009, for a total rate of 4.51%. The second interest rate swap, which matures on March 31, 2012, effectively converts $25.0 million of our borrowings under our Senior Credit Facility from a variable-rate instrument into a fixed-rate instrument at 1.77% plus our current credit margin of 3.25% at December 31, 2009, for a total rate of 5.02%. At December 31, 2009, the estimated unrealized loss on our interest rate swaps, net of taxes of $122,000, reflected in “accumulated other comprehensive income” was approximately $198,000. The liability for the unrealized loss on the swaps of $320,000 is presented with “other accrued expenses and liabilities” on the Consolidated Balance Sheet and is expected to be recognized in earnings over the remaining terms of the swaps.
CIBER will also, from time to time, enter into foreign currency forward contracts related to customer agreements or intercompany transactions denominated in a foreign currency or related to certain forecasted foreign operating results. We have not elected hedge accounting for these derivatives. We had several of these instruments outstanding during 2009, with only one instrument remaining at December 31, 2009, none of which were material.
(10) Income Taxes
Income tax expense consists of the following:
|
|
|
Year Ended December 31, |
|
|||||||
|
|
|
2007 |
|
2008 |
|
2009 |
|
|||
|
|
|
(In thousands) |
|
|||||||
|
Current: |
|
|
|
|
|
|
|
|||
|
Federal |
|
$ |
5,282 |
|
$ |
1,520 |
|
$ |
(436 |
) |
|
State and local |
|
1,969 |
|
1,016 |
|
380 |
|
|||
|
Foreign |
|
3,792 |
|
6,424 |
|
6,389 |
|
|||
|
|
|
11,043 |
|
8,960 |
|
6,333 |
|
|||
|
Deferred: |
|
|
|
|
|
|
|
|||
|
Federal |
|
662 |
|
2,055 |
|
2,169 |
|
|||
|
State and local |
|
105 |
|
763 |
|
475 |
|
|||
|
Foreign |
|
1,355 |
|
302 |
|
(1,182 |
) |
|||
|
|
|
2,122 |
|
3,120 |
|
1,462 |
|
|||
|
Income tax expense |
|
$ |
13,165 |
|
$ |
12,080 |
|
$ |
7,795 |
|
U.S. and foreign income before income taxes are as follows:
|
|
|
Year Ended December 31, |
|
|||||||
|
|
|
2007 |
|
2008 |
|
2009 |
|
|||
|
|
|
(In thousands) |
|
|||||||
|
United States |
|
$ |
23,057 |
|
$ |
13,247 |
|
$ |
3,790 |
|
|
Foreign |
|
15,625 |
|
26,646 |
|
19,121 |
|
|||
|
Income before income taxes |
|
$ |
38,682 |
|
$ |
39,893 |
|
$ |
22,911 |
|
Income tax expense differs from the amounts computed by applying the statutory U.S. Federal income tax rate to income before income taxes as a result of the following:
|
|
|
Year Ended December 31, |
|
|||||||
|
|
|
2007 |
|
2008 |
|
2009 |
|
|||
|
|
|
(In thousands) |
|
|||||||
|
Income tax expense at the federal statutory rate of 35% |
|
$ |
13,539 |
|
$ |
13,963 |
|
$ |
8,019 |
|
|
Increase (decrease) resulting from: |
|
|
|
|
|
|
|
|||
|
State income taxes, net of federal income tax benefit |
|
1,310 |
|
1,132 |
|
556 |
|
|||
|
Non-deductible other costs |
|
965 |
|
1,282 |
|
1,232 |
|
|||
|
Federal research credit |
|
(1,684 |
) |
(1,586 |
) |
(1,083 |
) |
|||
|
Impact of foreign taxes |
|
226 |
|
(2,275 |
) |
(1,485 |
) |
|||
|
Other |
|
(1,191 |
) |
(436 |
) |
556 |
|
|||
|
Income tax expense |
|
$ |
13,165 |
|
$ |
12,080 |
|
$ |
7,795 |
|
The components of the net deferred tax asset or liability are as follows:
|
|
|
December 31, |
|
||||
|
|
|
2008 |
|
2009 |
|
||
|
|
|
(In thousands) |
|
||||
|
Deferred tax assets: |
|
|
|
|
|
||
|
Accrued expenses |
|
$ |
5,092 |
|
$ |
6,069 |
|
|
Federal tax credit carryforwards |
|
7,168 |
|
8,597 |
|
||
|
U.S. net operating loss (“NOL”) carryforwards |
|
1,545 |
|
1,346 |
|
||
|
Foreign NOL carryforwards |
|
5,990 |
|
7,753 |
|
||
|
Other |
|
2,330 |
|
2,799 |
|
||
|
Total gross deferred tax assets |
|
22,125 |
|
26,564 |
|
||
|
Less valuation allowance for foreign NOL carryforwards |
|
(5,990 |
) |
(7,753 |
) |
||
|
Deferred tax assets, net |
|
16,135 |
|
18,811 |
|
||
|
Deferred tax liabilities: |
|
|
|
|
|
||
|
Intangible assets |
|
(43,204 |
) |
(47,828 |
) |
||
|
Other |
|
(1,835 |
) |
(1,157 |
) |
||
|
Total gross deferred tax liabilities |
|
(45,039 |
) |
(48,985 |
) |
||
|
Net deferred tax liability |
|
$ |
(28,904 |
) |
$ |
(30,174 |
) |
|
|
|
|
|
|
|
||
|
Balance sheet classification of deferred taxes: |
|
|
|
|
|
||
|
Deferred tax asset — current |
|
$ |
4,883 |
|
$ |
6,627 |
|
|
Deferred tax asset — long-term |
|
705 |
|
— |
|
||
|
Deferred tax liability — current |
|
(204 |
) |
(315 |
) |
||
|
Deferred tax liability — long-term |
|
(34,288 |
) |
(36,486 |
) |
||
|
Net deferred tax liability |
|
$ |
(28,904 |
) |
$ |
(30,174 |
) |
Based on our evaluation of current and anticipated future taxable income, we believe sufficient taxable income will be generated to realize the net deferred tax assets.
At December 31, 2009, we have approximately $4.0 million of NOL carryforwards for U.S. Federal tax purposes resulting from acquisitions. Annual usage of these U.S. NOL carryforwards is limited under U.S. tax rules; however, they do not begin to expire until 2022. There is no valuation allowance for U.S. NOL carryforwards as we expect to fully utilize them. At December 31, 2009, we also have approximately $29.1 million of foreign NOL carryforwards of which approximately $6.7 million were pre-acquisition NOLs. We have recorded a valuation allowance for 100% of the foreign NOL carryforwards, as we do not believe it is more likely than not that we will utilize them. Less than 20% of the foreign NOL carryforwards may expire. In 2008, we reduced goodwill by $3.2 million as a result of the realization of tax benefits from the usage of pre-acquisition foreign NOL carryforwards. Any future year’s realized benefit from our foreign NOL carryforwards will be recorded as a reduction of income tax expense.
We do not provide for U.S. income taxes on the undistributed earnings of our foreign subsidiaries, as we consider these to be permanently reinvested in the operations of such subsidiaries. At December 31, 2009, these undistributed earnings totaled approximately $126.0 million. If some of these earnings were distributed, some countries may impose withholding taxes. In addition, as foreign taxes have previously been paid on these earnings, we would expect to be entitled to a U.S. foreign tax credit that would reduce the U.S. taxes owed on such distribution. As such, it is not practicable to determine the net amount of the related unrecognized U.S. deferred tax liability.
We are routinely subject to examination by various domestic and foreign tax authorities. The outcome of tax audits is always uncertain and could result in cash tax payments that could be material. Tax audits may take long periods of time to ultimately resolve. We do not believe the outcome of any tax audit at December 31, 2009, will have a material adverse effect on our consolidated financial position or results of operations.
The changes in the balance of our unrecognized tax benefits were as follows:
|
|
|
Unrecognized |
|
|
|
|
|
(In thousands) |
|
|
|
Balance at January 1, 2008 |
|
$ |
2,985 |
|
|
Increases related to current year tax positions |
|
680 |
|
|
|
Lapse of statute of limitations |
|
(353 |
) |
|
|
Balance at December 31, 2008 |
|
3,312 |
|
|
|
Increases related to current year tax positions |
|
464 |
|
|
|
Lapse of statute of limitations |
|
(210 |
) |
|
|
Balance at December 31, 2009 |
|
$ |
3,566 |
|
Most of our unrecognized tax benefits would affect our effective tax rate if recognized. Furthermore, we do not reasonably expect the total amounts of unrecognized tax benefits to significantly increase or decrease within the next 12 months. We file a U.S. Federal income tax return and tax returns in nearly all U.S. states, as well as in numerous foreign jurisdictions. We routinely have tax examinations in process. Currently, our U.S. Federal income tax returns dating back to 2006 are open to possible examination. Our most significant foreign operations are in the U.K., the Netherlands, Germany and Norway, where we are no longer subject to tax examination for years prior to 2008, 2004, 2007 and 2000, respectively.
(11) 401(k) Savings Plan
Almost all of our U.S. employees are eligible to participate in our 401(k) savings plan. We match a portion of the employees’ contribution. In 2009, the Company’s match was reduced to a maximum of one and one-half percent of an employee’s compensation, with a limit of $1,500 per calendar year, from a maximum of three percent of an employee’s contribution, with a $3,000 limit per calendar year in 2007 and 2008. Vesting in CIBER’s matching contribution occurs over six years. Forfeitures reduce our matching contributions. We record forfeitures when a participant’s employment ends. We recorded expense of $3.3 million, $4.8 million and $1.4 million in 2007, 2008 and 2009, respectively, related to this plan.
(12) Shareholders’ Equity
Share-Based Compensation — On April 27, 2004, our shareholders approved the adoption of the CIBER, Inc. 2004 Incentive Plan (the “2004 Plan”). To date, 10,000,000 shares of CIBER, Inc. common stock have been authorized for issuance under the 2004 Plan. The plan administrators may grant restricted stock, stock options, performance units or any combination thereof, to officers, employees and consultants. The Compensation Committee of the Board of Directors determines the number, nature and vesting of such awards. As of December 31, 2009, there are approximately 2,902,000 shares available for future grants under the 2004 Plan.
The 2004 Plan also implements a formula stock option plan for non-employee directors. Under the formula plan, each non-employee director will receive a non-statutory option to purchase 20,000 shares of common stock upon election to the Board of Directors and an option to purchase 5,000 shares of common stock on each anniversary of election to the Board of Directors. Effective until October 1, 2009, the 2004 Plan further provided that non-employee directors would receive shares of CIBER common stock as compensation for attending Board, Annual and committee meetings, as well as for serving as committee chairpersons. Subsequent to October 1, 2009, non-employee directors will instead receive cash payments for above-mentioned purposes. Compensation expense for grants of common stock to non-employee directors was $224,000, $153,000 and $131,000 for the years ended December 31, 2007, 2008 and 2009, respectively, and is included in our total recorded share-based compensation costs.
The table below summarizes the amounts recorded in the Consolidated Statement of Operations for share-based compensation:
|
|
|
Year Ended December 31, |
|
|||||||
|
|
|
2007 |
|
2008 |
|
2009 |
|
|||
|
|
|
(In thousands) |
|
|||||||
|
Total share-based compensation costs included in consolidated net income |
|
$ |
2,607 |
|
$ |
3,439 |
|
$ |
3,763 |
|
|
Estimated income tax benefit related to share-based compensation included in consolidated net income |
|
646 |
|
833 |
|
829 |
|
|||
Options granted under the 2004 Plan generally have an exercise price that is at least equal to the market value of our common stock on the date of issuance. Options currently being granted under the 2004 Plan are subject to cliff or graded vesting or performance-based conditions in combination with graded vesting. Graded vesting generally ranges from one to four years,
as determined at the date of grant by the Board of Directors, with the exception of some options granted to employees of our International division, which may be fully vested on the grant date. Additionally, options granted under the 2004 Plan have contractual terms ranging from four to 10 years, but all 2004 Plan options must expire no later than 10 years from the grant date. During 2009, all options granted had contractual terms of five years.
The fair value of each option award is estimated on the date of grant using the Black-Scholes option pricing method. Compensation costs related to options with graded vesting are recognized on a straight-line basis over the vesting period. The expected life for options with a contractual life of 10 years is derived from historical data pertaining to option exercises and employee terminations. The expected life for options with a contractual life of less than 10 years is derived using the SEC’s “simplified method,” as we did not have sufficient historical data pertaining to options with contractual lives of less than 10 years upon which to base an expected term assumption. Expected volatilities are based on historical volatility of our common stock. The risk-free interest rate is derived from the U.S. Treasury yields in effect at the time of grant and the dividend yield is based on historical experience and expected future changes. A summary of the weighted average assumptions used to value options granted and the grant date fair value follows:
|
|
|
Year Ended December 31, |
|
|||||||
|
|
|
2007 |
|
2008 |
|
2009 |
|
|||
|
Expected life (in years) |
|
5.0 |
|
3.4 |
|
3.4 |
|
|||
|
Risk-free interest rate |
|
4.46 |
% |
2.25 |
% |
1.72 |
% |
|||
|
Expected volatility |
|
36 |
% |
41 |
% |
54 |
% |
|||
|
Dividend yield |
|
0 |
% |
0 |
% |
0 |
% |
|||
|
Fair value |
|
$ |
2.79 |
|
$ |
1.81 |
|
$ |
1.37 |
|
A summary of stock option activity for 2009 is presented below:
|
|
|
Number |
|
Weighted |
|
Weighted |
|
Aggregate |
|
||
|
|
|
(Options in thousands) |
|
||||||||
|
Outstanding at January 1, 2009 |
|
8,712 |
|
$ |
6.97 |
|
|
|
|
|
|
|
Granted |
|
1,386 |
|
$ |
3.71 |
|
|
|
|
|
|
|
Exercised |
|
— |
|
$ |
— |
|
|
|
|
|
|
|
Expired or cancelled |
|
(425 |
) |
$ |
10.76 |
|
|
|
|
|
|
|
Forfeited |
|
(133 |
) |
$ |
5.83 |
|
|
|
|
|
|
|
Outstanding at December 31, 2009 |
|
9,540 |
|
$ |
6.35 |
|
3.8 |
|
$ |
868,692 |
|
|
Vested and expected to vest at December 31, 2009 |
|
9,463 |
|
$ |
6.36 |
|
3.8 |
|
$ |
846,777 |
|
|
Exercisable at December 31, 2009 |
|
7,597 |
|
$ |
6.82 |
|
3.7 |
|
$ |
128,794 |
|
The total intrinsic value of options exercised (which is the amount by which the stock price exceeded the exercise price of the options on the date of exercise) during the years ended December 31, 2007, 2008 and 2009, was approximately $963,000, $584,000 and $0, respectively.
Restricted stock units (“RSUs”) currently being granted under the 2004 Plan are subject to three-year graded vesting or performance-based conditions in combination with three-year graded vesting, as determined at the date of grant by the Board of Directors. The fair value of the RSUs, equivalent to the Company’s stock price at the date of grant, is expensed over the vesting term.
A summary of RSU activity for 2009 is presented below:
|
|
|
Number |
|
Weighted |
|
|
|
|
|
(RSUs in thousands) |
|
|||
|
Nonvested shares outstanding at January 1, 2009 |
|
174 |
|
$ |
4.91 |
|
|
Granted |
|
354 |
|
$ |
3.16 |
|
|
Vested |
|
(89 |
) |
$ |
5.29 |
|
|
Forfeited |
|
(3 |
) |
$ |
6.00 |
|
|
Nonvested shares outstanding at December 31, 2009 |
|
436 |
|
$ |
3.40 |
|
The total fair value of RSUs vested during the year ended December 31, 2009, was $307,000.
As of December 31, 2009, there was approximately $2.8 million of total unrecognized compensation cost related to the nonvested stock options and RSUs disclosed in the tables above. That cost is expected to be recognized over a weighted average period of 1.7 years.
At December 31, 2009, there were approximately 12,878,000 shares of CIBER common stock reserved for share-based awards outstanding and available future grants under our share-based plans.
Our Employee Stock Purchase Plan (“ESPP”), which is a non-qualified plan, allows eligible employees to purchase shares of our common stock at a price equal to 85% of the lesser of the fair market value on the first or last day of the applicable offering period, which is equal to three months. Under this plan, substantially all employees may elect to contribute up to $6,000 of their compensation during one calendar year. In 2007, 2008 and 2009, we issued approximately 354,000, 475,000 and 1,030,000 shares, respectively, under our ESPP and the related compensation cost recorded was approximately $531,000 for 2007, $740,000 for 2008 and $900,000 for 2009.
Sale of Common Stock — During the year ended December 31, 2009, we sold nine million shares of our common stock, for proceeds of $23.2 million, net of issuance costs, which were used to repay a portion of the outstanding borrowings under our then-outstanding senior secured reducing revolving credit facility.
Repurchase Program — CIBER has had a common stock share repurchase program since 1999 that has been amended from time to time by our Board of Directors to increase the authorized shares available for repurchase. Under the most recent authorization in October 2009, the Board approved an additional $5 million for future repurchases of our common stock. Under the program in 2009, we repurchased approximately 1,445,000 shares of common stock at a cost of $5.0 million. At December 31, 2009, there was approximately $5.5 million remaining for future repurchases under this program.
Shelf Registration Statements on Form S-4 — At December 31, 2009, we have two effective registration statements on Form S-4, under which together approximately 13,469,000 shares of our common stock remain available. The shares available under either one of these registration statements may be used by CIBER from time to time in connection with future business combinations.
Shelf Registration Statement on Form S-3 — At December 31, 2009, we have an effective registration statement on Form S-3, under which up to $100 million of debt securities, shares of our common stock, shares of our preferred stock and warrants may be sold in the future. This registration statement enables us to raise funds from the offering of such instruments described above from time to time, subject to market conditions and our capital needs.
Stock Purchase Rights — Pursuant to our Rights Agreement, dated August 31, 1998, CIBER, Inc. paid a dividend of one preferred stock purchase right (a “Right”) for each outstanding share of CIBER, Inc. common stock (“Common Stock”) on September 21, 1998. A Right is also attached to all shares of Common Stock issued after the dividend date. On May 2, 2008, we amended and restated our original Rights Agreement. Under the Amended Rights Agreement, each shareholder of the Company holds one Right for each share of Common Stock held. The Rights generally become exercisable only in the event that an acquiring party accumulates 15% or more of our outstanding Common Stock. Each Right entitles the registered holder to purchase one one-thousandth of a share of Series A Junior Participating Preferred Stock of CIBER, Inc., par value $0.01, at a purchase price of thirty-seven dollars, subject to the conditions set forth in the Amended Rights Agreement. If this were to occur, subject to certain exceptions, each Right (except for the Rights held by the acquiring party) would allow its holder to purchase Common Stock with a value equal to twice the exercise price of the Right. In the event that, after an acquiring party has accumulated 15% or more of our outstanding Common Stock, the Company is acquired in a merger or other business combination transaction or 50% or more of its consolidated assets, cash flow or earning power are sold, each unexercised Right (except for the Rights held by the acquiring party) would thereafter allow its holder to purchase stock of the acquiring company (or our Common Stock if it is the surviving company to the transaction) with a value equal to twice the purchase price of the Right. If the Rights were fully exercised, the shares issued would cause substantial dilution to the acquiring party or the shareholders of the acquiring company. The Amended Rights Agreement provides a period of time during which we may redeem the Rights, in whole or in part at a price of $0.001 per Right, such that this period will end on the earlier of (i) the tenth business day following the date a person or group becomes the beneficial owner of 15% or more of the Common Stock or (ii) the final expiration date of the Rights, which is May 2, 2018.
Comprehensive Income (Loss) — Comprehensive income (loss) includes changes in the balances of items that are reported directly as separate components of shareholders’ equity. Comprehensive income (loss) includes net income plus changes in cumulative foreign currency translation adjustment and gains or losses on foreign subsidiary net investment hedges, net of taxes.
The components of comprehensive income (loss) were as follows:
|
|
|
Year Ended December 31, |
|
|||||||
|
|
|
2007 |
|
2008 |
|
2009 |
|
|||
|
|
|
(In thousands) |
|
|||||||
|
Comprehensive income (loss): |
|
|
|
|
|
|
|
|||
|
Consolidated net income |
|
$ |
25,517 |
|
$ |
27,813 |
|
$ |
15,116 |
|
|
Gain (loss) on hedging activity, net of tax |
|
(3,140 |
) |
89 |
|
(198 |
) |
|||
|
Foreign currency translation adjustments |
|
18,224 |
|
(31,938 |
) |
13,397 |
|
|||
|
Comprehensive income (loss) |
|
40,601 |
|
(4,036 |
) |
28,315 |
|
|||
|
Less: Comprehensive income — noncontrolling interests |
|
1,423 |
|
646 |
|
181 |
|
|||
|
Comprehensive income (loss) — CIBER, Inc. |
|
$ |
39,178 |
|
$ |
(4,682 |
) |
$ |
28,134 |
|
The balance of accumulated other comprehensive income (loss) reflected on the Consolidated Balance Sheets was comprised of the following:
|
|
|
Accumulated Other Comprehensive Income (Loss) |
|
|||||||
|
|
|
Foreign |
|
Hedge Gain |
|
Total |
|
|||
|
|
|
(In thousands) |
|
|||||||
|
Balance at January 1, 2008 |
|
$ |
33,325 |
|
$ |
(2,742 |
) |
$ |
30,583 |
|
|
Change in foreign currency translation |
|
(31,655 |
) |
— |
|
(31,655 |
) |
|||
|
Change in fair value of net investment hedges, net of tax |
|
— |
|
89 |
|
89 |
|
|||
|
Settlement of net investment hedges |
|
(2,653 |
) |
2,653 |
|
— |
|
|||
|
Balance at December 31, 2008 |
|
(983 |
) |
— |
|
(983 |
) |
|||
|
Change in foreign currency translation |
|
13,374 |
|
— |
|
13,374 |
|
|||
|
Change in fair value of cash flow hedges, net of tax |
|
— |
|
(198 |
) |
(198 |
) |
|||
|
Balance at December 31, 2009 |
|
$ |
12,391 |
|
$ |
(198 |
) |
$ |
12,193 |
|
In 2009, we had a loss of $479,000 on our interest rate swaps (cash flow hedges) that was reclassified to interest expense.
(13) Segment Information
Our reportable segments are our operating divisions, which are organized internally primarily by the nature of their services, client base and geography. In 2009, we made several changes to our divisions. All prior year segment data has been adjusted to conform to the 2009 presentation. Our divisions now consist of our International division (formerly Europe), which includes Europe, Eastern Asia, Australia and New Zealand, and our Custom Solutions, IT Outsourcing, Federal and U.S. ERP (formerly Enterprise Solutions) divisions. Our International division provides a broad range of IT consulting services, including package software implementation, application development, systems integration and support services. Our Custom Solutions and Federal divisions provide IT services and products in custom-developed software environments. Our India-based operations are considered part of our Custom Solutions division. Our IT Outsourcing division offers a set of solutions that span the entire spectrum of IT infrastructure and IT operations services. Our U.S. ERP division primarily provides enterprise software implementation services, including ERP software from software vendors such as Oracle, SAP and Lawson for U.S. customers.
We evaluate our divisions’ results of operations based on operating income before amortization of intangible assets. The accounting policies of our divisions are the same as those disclosed in the Summary of Significant Accounting Policies in Note 1, except for share-based compensation. Share-based compensation is not charged to operating divisions, but rather is recorded as part of corporate expenses. We do not account for, or report to, our chief executive officer any information on assets or capital expenditures by division as such information is only prepared on a consolidated basis.
Our largest client is the various agencies of the U.S. federal government, which accounted for approximately 12%, 11% and 11% of our total revenue in 2007, 2008 and 2009, respectively. No other client accounted for more than 5% of our total revenue in 2009. Most of our divisions had revenue from a single client that equaled or exceeded 10% of their division’s total revenue. These clients accounted for the following percentages of each division’s 2009 total revenues: Custom Solutions - 12%; IT Outsourcing - 20%; Federal - 100%; and U.S. ERP - 10%.
The following presents financial information about our reporting segments:
|
|
|
Year Ended December 31, |
|
|||||||
|
|
|
2007 |
|
2008 |
|
2009 |
|
|||
|
|
|
(In thousands) |
|
|||||||
|
Total revenue: |
|
|
|
|
|
|
|
|||
|
Custom Solutions |
|
$ |
450,679 |
|
$ |
466,208 |
|
$ |
372,168 |
|
|
International |
|
315,202 |
|
406,071 |
|
349,834 |
|
|||
|
IT Outsourcing |
|
61,521 |
|
72,453 |
|
76,341 |
|
|||
|
Federal |
|
137,268 |
|
127,391 |
|
117,613 |
|
|||
|
U.S. ERP |
|
119,670 |
|
122,163 |
|
126,443 |
|
|||
|
Corporate/Inter-segment |
|
(2,365 |
) |
(2,719 |
) |
(4,699 |
) |
|||
|
Total revenue |
|
$ |
1,081,975 |
|
$ |
1,191,567 |
|
$ |
1,037,700 |
|
|
|
|
|
|
|
|
|
|
|||
|
Income from operations: |
|
|
|
|
|
|
|
|||
|
Custom Solutions |
|
$ |
39,072 |
|
$ |
45,170 |
|
$ |
24,125 |
|
|
International |
|
19,140 |
|
30,795 |
|
20,107 |
|
|||
|
IT Outsourcing |
|
2,610 |
|
(244 |
) |
(1,823 |
) |
|||
|
Federal |
|
11,031 |
|
8,682 |
|
5,994 |
|
|||
|
U.S. ERP |
|
11,370 |
|
1,196 |
|
9,764 |
|
|||
|
Corporate expenses |
|
(22,883 |
) |
(25,387 |
) |
(24,517 |
) |
|||
|
Total |
|
60,340 |
|
60,212 |
|
33,650 |
|
|||
|
Amortization of intangibles |
|
(5,820 |
) |
(6,274 |
) |
(5,891 |
) |
|||
|
Operating income |
|
$ |
54,520 |
|
$ |
53,938 |
|
$ |
27,759 |
|
|
|
|
|
|
|
|
|
|
|||
|
Other information: |
|
|
|
|
|
|
|
|||
|
Total foreign revenue(1) |
|
$ |
331,078 |
|
$ |
429,843 |
|
$ |
363,192 |
|
|
Total foreign long-lived assets(2) |
|
177,284 |
|
151,874 |
|
157,809 |
|
|||
(1) Represents sales to all foreign clients based on client locations.
(2) This balance includes $162.2 million, $138.1 million and $142.8 million of goodwill and other intangible assets as of December 31, 2007, 2008 and 2009, respectively.
(14) Supplemental Statement of Cash Flow Information
Supplemental statement of cash flow information is as follows:
|
|
|
Year Ended December 31, |
|
|||||||
|
|
|
2007 |
|
2008 |
|
2009 |
|
|||
|
|
|
(In thousands) |
|
|||||||
|
Acquisitions: |
|
|
|
|
|
|
|
|||
|
Fair value of assets recorded, excluding cash |
|
$ |
27,482 |
|
$ |
8,315 |
|
$ |
5,279 |
|
|
Liabilities recorded |
|
(4,554 |
) |
(1,385 |
) |
(949 |
) |
|||
|
Noncontrolling interest reduction |
|
381 |
|
860 |
|
— |
|
|||
|
Common stock and options issued |
|
(967 |
) |
— |
|
— |
|
|||
|
Cash paid for acquisitions, net of cash acquired |
|
$ |
22,342 |
|
$ |
7,790 |
|
$ |
4,330 |
|
|
|
|
|
|
|
|
|
|
|||
|
Noncash investing and financing activities: |
|
|
|
|
|
|
|
|||
|
Value of shares and options issued for acquisitions |
|
$ |
967 |
|
$ |
— |
|
$ |
— |
|
|
Cash paid for interest |
|
7,964 |
|
10,241 |
|
5,673 |
|
|||
|
Cash paid for income taxes, net |
|
9,922 |
|
8,966 |
|
1,419 |
|
|||
(15) Selected Quarterly Financial Information (Unaudited)
|
|
|
First |
|
Second |
|
Third |
|
Fourth |
|
Total |
|
|||||
|
|
|
(In thousands, except per share amounts) |
|
|||||||||||||
|
Year ended December 31, 2008 |
|
|
|
|
|
|
|
|
|
|
|
|||||
|
Revenue |
|
$ |
294,464 |
|
$ |
317,579 |
|
$ |
299,966 |
|
$ |
279,558 |
|
$ |
1,191,567 |
|
|
Gross profit |
|
80,965 |
|
87,102 |
|
82,281 |
|
74,132 |
|
324,480 |
|
|||||
|
Operating income |
|
14,903 |
|
17,409 |
|
13,213 |
|
8,413 |
|
53,938 |
|
|||||
|
Consolidated net income |
|
6,283 |
|
8,456 |
|
7,432 |
|
5,642 |
|
27,813 |
|
|||||
|
Net income — CIBER, Inc. |
|
5,927 |
|
8,185 |
|
7,235 |
|
5,537 |
|
26,884 |
|
|||||
|
Net income per share — CIBER, Inc. basic and diluted |
|
0.10 |
|
0.14 |
|
0.12 |
|
0.09 |
|
0.45 |
|
|||||
|
|
|
|
|
|
|
|
|
|
|
|
|
|||||
|
Year ended December 31, 2009 |
|
|
|
|
|
|
|
|
|
|
|
|||||
|
Revenue |
|
$ |
258,475 |
|
$ |
260,604 |
|
$ |
256,367 |
|
$ |
262,254 |
|
$ |
1,037,700 |
|
|
Gross profit |
|
64,882 |
|
65,929 |
|
64,957 |
|
63,525 |
|
259,293 |
|
|||||
|
Operating income |
|
7,016 |
|
7,468 |
|
7,034 |
|
6,241 |
|
27,759 |
|
|||||
|
Consolidated net income |
|
4,297 |
|
4,709 |
|
3,559 |
|
2,551 |
|
15,116 |
|
|||||
|
Net income — CIBER, Inc. |
|
4,265 |
|
4,656 |
|
3,505 |
|
2,532 |
|
14,958 |
|
|||||
|
Net income per share — CIBER, Inc. basic and diluted |
|
0.07 |
|
0.07 |
|
0.05 |
|
0.04 |
|
0.22 |
|
|||||
Item 9. Changes in and Disagreements with Accountants on Accounting and Financial Disclosure
Not applicable.
Item 9A. Controls and Procedures
Evaluation of Disclosure Controls and Procedures - During the fiscal period covered by this report, our management, with the participation of our Chief Executive Officer and Chief Financial Officer, carried out an evaluation of the effectiveness of the design and operation of our disclosure controls and procedures, as defined in Rules 13a-15(e) and 15d-15(e) of the Exchange Act. Based upon this evaluation, our principal executive officer and principal financial officer have concluded that, as of the end of the period covered by this report, our disclosure controls and procedures were effective to ensure that information required to be disclosed by us in reports we file or submit under the Exchange Act is (1) recorded, processed, summarized and reported within the time periods specified in Securities and Exchange Commission rules and forms, and (2) accumulated and communicated to our management, including our Chief Executive Officer and Chief Financial Officer, to allow timely decisions regarding required disclosure.
Management’s Report on Internal Control Over Financial Reporting - Our management is responsible for establishing and maintaining adequate internal control over financial reporting, as such term is defined in Exchange Act Rule 13a-15(f). CIBER’s internal control systems were designed to provide reasonable assurance to the Company’s management and Board of Directors regarding the preparation and fair presentation of published financial statements. All internal control systems, no matter how well designed, have inherent limitations. Because of its inherent limitations, internal control over financial reporting may not prevent or detect misstatements. Therefore, even those systems determined to be effective can provide only reasonable assurance with respect to financial statement preparation and presentation. Also, projections of any evaluation of effectiveness to future periods are subject to the risk that controls may become inadequate because of changes in conditions, or that the degree of compliance with the policies or procedures may deteriorate.
Under the supervision and with the participation of our management, including our principal executive officer and principal financial officer, we conducted an evaluation of the effectiveness of our internal control over financial reporting as of December 31, 2009, based on the framework in Internal Control - Integrated Framework issued by the Committee of Sponsoring Organizations of the Treadway Commission. Based on our evaluation under the framework in Internal Control - Integrated Framework, our management concluded that our internal control over financial reporting was effective as of December 31, 2009.
The attestation report on our internal control over financial reporting as of December 31, 2009, issued by Ernst & Young LLP, the independent registered public accounting firm who also audited our consolidated financial statements, is included following this Item 8A.
Changes in Internal Controls - The Company recently completed the development and installation of major modifications to the SAP Enterprise Resource Planning (“ERP”) system and related changes to internal controls for the International division of the Company. We have updated the Company’s internal controls over financial reporting as necessary to accommodate these modifications to business processes or accounting procedures.
Other than the matters noted above, there were no changes in our internal control over financial reporting that occurred during our most recently completed fiscal quarter that have materially affected, or are reasonably likely to materially affect, our internal control over financial reporting.
We continue to monitor the effectiveness of our internal controls and make necessary modifications to our processes and testing as appropriate on an on-going basis.
Report of Independent Registered Public Accounting Firm
The Board of Directors and Shareholders of CIBER, Inc.
We have audited CIBER, Inc.’s internal control over financial reporting as of December 31, 2009, based on criteria established in Internal Control—Integrated Framework issued by the Committee of Sponsoring Organizations of the Treadway Commission (the COSO criteria). CIBER, Inc.’s management is responsible for maintaining effective internal control over financial reporting, and for its assessment of the effectiveness of internal control over financial reporting included in the accompanying Management’s Report on Internal Control over Financial Reporting. Our responsibility is to express an opinion on the company’s internal control over financial reporting based on our audit.
We conducted our audit in accordance with the standards of the Public Company Accounting Oversight Board (United States). Those standards require that we plan and perform the audit to obtain reasonable assurance about whether effective internal control over financial reporting was maintained in all material respects. Our audit included obtaining an understanding of internal control over financial reporting, assessing the risk that a material weakness exists, testing and evaluating the design and operating effectiveness of internal control based on the assessed risk, and performing such other procedures as we considered necessary in the circumstances. We believe that our audit provides a reasonable basis for our opinion.
A company’s internal control over financial reporting is a process designed to provide reasonable assurance regarding the reliability of financial reporting and the preparation of financial statements for external purposes in accordance with generally accepted accounting principles. A company’s internal control over financial reporting includes those policies and procedures that (1) pertain to the maintenance of records that, in reasonable detail, accurately and fairly reflect the transactions and dispositions of the assets of the company; (2) provide reasonable assurance that transactions are recorded as necessary to permit preparation of financial statements in accordance with generally accepted accounting principles, and that receipts and expenditures of the company are being made only in accordance with authorizations of management and directors of the company; and (3) provide reasonable assurance regarding prevention or timely detection of unauthorized acquisition, use, or disposition of the company’s assets that could have a material effect on the financial statements.
Because of its inherent limitations, internal control over financial reporting may not prevent or detect misstatements. Also, projections of any evaluation of effectiveness to future periods are subject to the risk that controls may become inadequate because of changes in conditions, or that the degree of compliance with the policies or procedures may deteriorate.
In our opinion, CIBER, Inc. maintained, in all material respects, effective internal control over financial reporting as of December 31, 2009, based on the COSO criteria.
We also have audited, in accordance with the standards of the Public Company Accounting Oversight Board (United States), the consolidated balance sheets of CIBER, Inc. as of December 31, 2008 and 2009, and the related consolidated statements of operations, shareholders’ equity, and cash flows for each of the three years in the period ended December 31, 2009 and our report dated March 4, 2010 expressed an unqualified opinion thereon.
|
|
/s/ Ernst & Young LLP |
|
|
|
|
Denver, Colorado |
|
|
March 4, 2010 |
|
None
The information required by Part III is omitted from this Report on Form 10-K because the Registrant will file a definitive proxy statement for its 2010 Annual Meeting of Shareholders scheduled for May 11, 2010 (the “2010 Proxy Statement”), within 120 days after December 31, 2009, and certain information included therein is incorporated herein by reference.
Item 10. Directors, Executive Officers and Corporate Governance
Corporate Governance Matters
We have a Code of Business Conduct and Ethics (the “Code”) that applies to our principal executive officer, principal financial officer, principal accounting officer, or persons performing similar functions. The code can be found on our website at http://www.ciber.com. We also have Corporate Governance Guidelines and charters for the Audit, Compensation and Nominating/Corporate Governance Committees of our Board of Directors. These Guidelines and Charters can also be found on our website. Any amendments or waivers to our Code will be disclosed as necessary on our website. Additionally, copies of our Code and Corporate Governance Guidelines, as well as the Charters for the various Committees of the Board of Directors are available in print, free of charge, to any shareholder that requests them.
As required by Section 303A.12(a) of the Listed Company Manual of the New York Stock Exchange (“NYSE”), the Company has filed with the NYSE the chief executive officer’s annual certification regarding compliance with the NYSE’s corporate governance listing standards. Additionally, the Company’s chief executive officer and chief financial officer certifications required by Section 302 of the Sarbanes-Oxley Act are included as Exhibits 31.1 and 31.2 in this Annual Report on Form 10-K.
The additional information required by this item is incorporated by reference from the sections captioned “Directors and Executive Officers,” “Section 16(a) Beneficial Ownership Reporting Compliance” and “Corporate Governance Practices” in CIBER’s 2010 Proxy Statement.
Item 11. Executive Compensation
The information required by this item is incorporated by reference from the sections captioned “Executive Compensation” and “Corporate Governance Practices” in CIBER’s 2010 Proxy Statement.
Item 12. Security Ownership of Certain Beneficial Owners and Management and Related Stockholder Matters
Securities Authorized for Issuance under Equity Compensation Plans
The following table provides information as of December 31, 2009, regarding compensation plans under which our equity securities are authorized for issuance.
|
|
|
Number of securities to |
|
Weighted-average |
|
Number of securities |
|
|
|
Equity compensation plans/arrangements approved by shareholders |
|
9,889,462 |
(2) |
$ |
6.32 |
|
4,875,990 |
(3) |
|
Equity compensation plans/arrangements not approved by shareholders (4) |
|
86,849 |
|
$ |
9.57 |
|
— |
|
|
Total |
|
9,976,311 |
|
|
|
4,875,990 |
|
|
|
(1) |
|
Excludes securities reflected in 1st column. |
|
(2) |
|
Consists of 9,453,445 stock options with a weighted average exercise price of $6.32 and 436,017 restricted stock units. |
|
(3) |
|
Includes 2,901,953 shares remaining available for future grants at December 31, 2009, under our 2004 Incentive Plan, plus 1,974,037 shares available for future sales to employees under our Employee Stock Purchase Plan. |
|
(4) |
|
Represents shares issued under the SCB Employee Inducement Award Plan. |
The additional information required by this item is incorporated by reference from the section captioned “Security Ownership of Certain Beneficial Owners and Management” in CIBER’s 2010 Proxy Statement.
Item 13. Certain Relationships and Related Transactions, and Director Independence
The information required by this item is incorporated by reference from the section captioned “Certain Relationships and Related Party Transactions” and “Corporate Governance Practices” in CIBER’s 2010 Proxy Statement.
Item 14. Principal Accountant Fees and Services
The information required by this item is incorporated by reference from the section captioned “Independent Registered Public Accounting Firm” in CIBER’s 2010 Proxy Statement.
Part IV
Item 15. Exhibits and Financial Statement Schedules
|
(a) |
(1) |
Financial Statements |
|
|
|
|
|
|
|
The following financial statements are filed as part of this report: |
|
|
|
|
|
|
|
Report of Independent Registered Public Accounting Firm |
|
|
|
Consolidated Statements of Operations — Years Ended December 31, 2007, 2008 and 2009 |
|
|
|
Consolidated Balance Sheets — December 31, 2008 and 2009 |
|
|
|
Consolidated Statements of Shareholders’ Equity — Years Ended December 31, 2007, 2008 and 2009 |
|
|
|
Consolidated Statements of Cash Flows — Years Ended December 31, 2007, 2008 and 2009 |
|
|
|
Notes to Consolidated Financial Statements |
|
|
|
|
|
|
(2) |
Financial Statement Schedules |
|
|
|
|
|
|
|
All schedules are omitted, either because they are not applicable or because the required information is shown in the consolidated financial statements or notes thereto. |
|
|
|
|
|
|
(3) |
Exhibits |
|
|
|
|
|
|
|
The Exhibits filed as part of this Annual Report on Form 10-K are listed on the Exhibit Index immediately preceding such Exhibits, which Exhibit Index is incorporated herein by reference. |
SIGNATURES
Pursuant to the requirements of Section 13 or 15(d) of the Securities Exchange Act of 1934, as amended, the Registrant has duly caused this report to be signed on its behalf by the undersigned, thereunto duly authorized.
|
|
CIBER, Inc. |
|
|
|
|
|
|
Date: March 4, 2010 |
By: |
/s/ Mac J. Slingerlend |
|
|
|
Mac J. Slingerlend |
|
|
|
Chief Executive Officer, President and Secretary |
Pursuant to the requirements of the Securities Exchange Act of 1934, this report has been signed below by the following persons on behalf of the registrant and in the capacities and on the dates indicated.
|
Signature |
|
Title |
|
Date |
|
|
|
|
|
|
|
/s/ BOBBY G. STEVENSON |
|
Chairman of the Board and Founder |
|
March 4, 2010 |
|
Bobby G. Stevenson |
|
|
|
|
|
|
|
|
|
|
|
/s/ MAC J. SLINGERLEND |
|
Chief Executive Officer, President, |
|
March 4, 2010 |
|
Mac J. Slingerlend |
|
Secretary and Director |
|
|
|
|
|
(Principal Executive Officer) |
|
|
|
|
|
|
|
|
|
/s/ PETER H. CHEESBROUGH |
|
Chief Financial Officer, Executive Vice |
|
March 4, 2010 |
|
Peter H. Cheesbrough |
|
President, Treasurer and Director |
|
|
|
|
|
(Principal Financial Officer) |
|
|
|
|
|
|
|
|
|
/s/ CHRISTOPHER L. LOFFREDO |
|
Vice President/Chief Accounting Officer |
|
March 4, 2010 |
|
Christopher L. Loffredo |
|
(Principal Accounting Officer) |
|
|
|
|
|
|
|
|
|
/s/ PAUL A. JACOBS |
|
Director |
|
March 4, 2010 |
|
Paul A. Jacobs |
|
|
|
|
|
|
|
|
|
|
|
/s/ STEPHEN S. KURTZ |
|
Director |
|
March 4, 2010 |
|
Stephen S. Kurtz |
|
|
|
|
|
|
|
|
|
|
|
/s/ ARCHIBALD J. MCGILL |
|
Director |
|
March 4, 2010 |
|
Archibald J. McGill |
|
|
|
|
|
|
|
|
|
|
|
/s/ JAMES C. SPIRA |
|
Director |
|
March 4, 2010 |
|
James C. Spira |
|
|
|
|
|
|
|
|
|
|
|
/s/ JAMES C. WETHERBE |
|
Director |
|
March 4, 2010 |
|
James C. Wetherbe |
|
|
|
|
|
Exhibit |
|
|
|
Incorporated by Reference |
||||
|
Number |
|
Exhibit Description |
|
Form |
|
File No. |
|
Date Filed |
|
3.1 |
|
Restated Certificate of Incorporation of CIBER, Inc. |
|
10-Q |
|
001-13103 |
|
11/7/2005 |
|
3.2 |
|
Amended and Restated Bylaws of CIBER, Inc., as adopted February 15, 2001; Amendment to the Amended and Restated Bylaws of CIBER, Inc., as adopted February 18, 2003; Amendment to the Amended and Restated Bylaws of CIBER, Inc., as adopted May 3, 2005; Amendment to the Amended and Restated Bylaws of CIBER, Inc., as adopted February 25, 2009 |
|
10-K |
|
001-13103 |
|
3/5/2009 |
|
4.1 |
|
Form of Common Stock Certificate |
|
S-1 |
|
33-74774 |
|
2/2/1994 |
|
4.2 |
|
First Amended and Restated Rights Agreement, dated as of May 2, 2008, between CIBER, Inc. and Wells Fargo Bank, National Association. |
|
8-A/A |
|
001-13103 |
|
5/2/2008 |
|
10.1* |
|
1989 CIBER, Inc. Employee Stock Option Plan |
|
S-1 |
|
33-74774 |
|
2/2/1994 |
|
10.2* |
|
Form of CIBER, Inc. Non-Employee Directors’ Stock Option Plan |
|
S-1 |
|
33-74774 |
|
2/2/1994 |
|
10.3* |
|
CIBER, Inc. Equity Incentive Plan, amended and restated as of February 15, 2001 |
|
10-Q |
|
001-13103 |
|
5/7/2001 |
|
10.4* |
|
CIBER, Inc. Non-Employee Directors’ Stock Compensation Plan (as amended July 1, 1997) |
|
10-K |
|
001-13103 |
|
9/24/1998 |
|
10.5* |
|
Employment Agreement with Mac J. Slingerlend dated March 30, 2005 |
|
8-K |
|
001-13103 |
|
4/1/2005 |
|
10.6* |
|
Form of Change of Control Agreement adopted as of February 18, 2003 |
|
10-K |
|
001-13103 |
|
3/27/2003 |
|
10.7* |
|
Form of Indemnification Agreement adopted as of February 18, 2003 |
|
10-K |
|
001-13103 |
|
3/27/2003 |
|
10.8* |
|
CIBER, Inc. SCB Employment Inducement Award Plan, effective March 1, 2004 |
|
S-8 |
|
333-113259 |
|
3/3/2004 |
|
10.9* |
|
CIBER, Inc. 2004 Incentive Plan, as amended April 29, 2008 |
|
8-K |
|
001-13103 |
|
5/5/2008 |
|
10.10* |
|
Fourth revision to the CIBER, Inc. Salary Continuation Retirement Plan for Mac J. Slingerlend dated as of March 30, 2005 |
|
8-K |
|
001-13103 |
|
4/1/2005 |
|
10.11* |
|
Employment agreement with Terje Laugerud dated January 1, 2003 |
|
10-K |
|
001-13103 |
|
3/14/2005 |
|
10.12* |
|
Employment agreement with Marcia M. Kim dated April 23, 2007 |
|
10-Q |
|
001-13103 |
|
5/7/2007 |
|
10.13* |
|
Employment agreement with Peter Cheesbrough dated October 31, 2007 |
|
8-K/A |
|
001-13103 |
|
11/2/2007 |
|
10.14* |
|
CIBER, Inc. Employee Stock Purchase Plan, as amended and restated May 4, 2009 |
|
S-8 |
|
333-159635 |
|
6/1/2009 |
|
10.15 |
|
Amended and Restated Credit Agreement, by and among CIBER, Inc., as borrower, Bank of America, N.A., as administrative agent, swing line lender and L/C issuer, and the other lender parties thereto, dated August 20, 2009 |
|
8-K |
|
001-13103 |
|
8/20/2009 |
|
10.16 |
|
Security and Pledge Agreement, by and among CIBER, Inc. and certain subsidiaries of CIBER, Inc., in favor of Bank of America, N.A., in its capacity as administrative agent, dated August 20, 2009 |
|
8-K |
|
001-13103 |
|
8/20/2009 |
|
10.17 |
|
First Amendment to Amended and Restated Credit Agreement, by and among CIBER, Inc., as borrower, Bank of America, N.A., as administrative agent, swing line lender and L/C issuer, and the other lender parties thereto, dated February 18, 2010 |
|
8-K |
|
001-13103 |
|
2/22/2010 |
|
21.1 |
|
List of Subsidiaries of CIBER, Inc. |
|
|
|
Filed herewith |
|
|
|
23.1 |
|
Consent of Ernst & Young, LLP |
|
|
|
Filed herewith |
|
|
|
31.1 |
|
Certification of Principal Executive Officer Pursuant to Section 302 of the Sarbanes-Oxley Act of 2002 |
|
|
|
Filed herewith |
|
|
|
31.2 |
|
Certification of Principal Financial Officer Pursuant to Section 302 of the Sarbanes-Oxley Act of 2002 |
|
|
|
Filed herewith |
|
|
|
32.1 |
|
Principal Executive Officer Certification Pursuant to Section 906 of |
|
|
|
Furnished |
|
|
|
|
|
the Sarbanes-Oxley Act of 2002 |
|
|
|
|
|
|
|
32.2 |
|
Principal Financial Officer Certification Pursuant to Section 906 of the Sarbanes-Oxley Act of 2002 |
|
|
|
Furnished |
|
|
* Indicates a management contract or compensatory plan or arrangement.