Attached files
| file | filename |
|---|---|
| EX-31.1 - GLOBAL AXCESS CORP | v175968_ex31-1.htm |
| EX-23.1 - GLOBAL AXCESS CORP | v175968_ex23-1.htm |
| EX-31.2 - GLOBAL AXCESS CORP | v175968_ex31-2.htm |
| EX-32.2 - GLOBAL AXCESS CORP | v175968_ex32-2.htm |
| EX-32.1 - GLOBAL AXCESS CORP | v175968_ex32-1.htm |
UNITED
STATES
SECURITIES
AND EXCHANGE COMMISSION
Washington,
D.C. 20549
FORM
10-K
(Mark
One)
x ANNUAL
REPORT PURSUANT TO SECTION 13 OR 15(d) OF THE SECURITIES EXCHANGE ACT OF
1934
For the
fiscal year ended December 31, 2009
OR
o TRANSITION
REPORT PURSUANT TO SECTION 13 OR 15(d) OF THE SECURITIES EXCHANGE ACT OF
1934
For the
transition period from ___________ to ___________
|
|
000-17874
(Commission
file number)
GLOBAL
AXCESS CORP
(Exact
name of registrant as specified in its
charter)
|
|
NEVADA
|
88-0199674
|
|
(State
or other jurisdiction of incorporation or organization)
|
(I.R.S.
Employer Identification No.)
|
|
7800
BELFORT PARKWAY, Suite 165
|
|
|
JACKSONVILLE,
FLORIDA
|
32256
|
|
(Address
of principal executive offices)
|
(Zip
Code)
|
(904)
280-3950
(Registrant's
telephone number, including area code)
Securities
registered pursuant to Section 12(b) of the Act: None
Securities
registered pursuant to Section 12(g) of the Act: Common Stock, $0.001 par
value
Indicate
by check mark if the registrant is a well-known seasoned issuer, as defined in
Rule 405 of the Securities Act. o Yes x No
Indicate
by check mark if the registrant is not required to file reports pursuant to
Section 13 or Section 15(d) of the Act. o Yes x No
Indicate
by check mark whether the registrant (1) has filed all reports required to be
filed by Section 13 or 15(d) of the Securities Exchange Act of 1934 during the
preceding 12 months (or for such shorter period that the registrant was required
to file such reports), and (2) has been subject to such filing requirements for
the past 90 days. xYes o No
Indicate
by checkmark whether the registrant has submitted electronically and posted on
its corporate website, if any, every Interactive Data File required to be
submitted and posted pursuant to Rule 405 of Regulation S-T during the
proceeding 12 months (or for such shorter period that the registrant was
required to submit and post such files). o Yes o No
Indicate
by check mark if disclosure of deliquent filers pursuant to Item 405 of
Regulation S-K is not contained herein, and will not be contained, to the best
of registrant’s knowledge, in definitive proxy or information statements
incorporated by reference in Part III of this Form 10-K or any amendment to this
Form 10-K. o
Indicate
by check mark whether the registrant is a large accelerated filer, an
accelerated filer, a non-accelerated filer or a smaller reporting
company. See definitions of “large accelerated filer,” “accelerated
filer,” and “smaller reporting company” in Rule 12b-2 of the Exchange
Act.
|
Large
accelerated Filer o
|
Accelerated
Filer o
|
|
Non-accelerated
Filer o (Do not
check if smaller reporting company)
|
Smaller
reporting company x
|
Indicate
by check mark whether the registrant is a shell company (as defined in Rule
12b-2 of Exchange Act). o Yes x No
As of
June 30, 2009, the aggregate market value of the registrant’s common stock held
by non-affiliates of the registrant was $9,373,696.
As of
March 01, 2010, the registrant had 21,883,924 shares outstanding of the common
stock ($0.001 par value).
DOCUMENTS INCORPORATED BY
REFERENCE
Portions
of the registrant’s definitive proxy statement to be delivered to shareholders
in connection with the registrant’s 2010 Annual Meeting of Shareholders are
incorporated by reference in response to Part III of this
report.
TABLE
OF CONTENTS
|
Page
No.
|
|||
|
PART
I
|
4
|
||
|
Item
1.
|
Business
|
4
|
|
|
Item
1A.
|
Risk
Factors
|
14
|
|
|
Item
1B.
|
Unresolved
Staff Comments
|
20
|
|
|
Item
2.
|
Properties
|
21
|
|
|
Item
3.
|
Legal
Proceedings
|
22
|
|
|
Item
4.
|
[Removed
and Reserved]
|
22
|
|
|
PART
II
|
22
|
||
|
Item
5.
|
Market
for Registrant’s Common Equity, Related Stockholder Matters and Issuer
Purchases of Equity Securities
|
22
|
|
|
Item
6.
|
Selected
Financial Data
|
25
|
|
|
Item
7.
|
Management's
Discussion and Analysis of Financial Condition and Results of
Operations
|
26
|
|
|
Item
7A.
|
Quantitative
and Qualitative Disclosures about Market Risk
|
36
|
|
|
Item
8.
|
Financial
Statements and Supplementary Data
|
37
|
|
|
Item
9.
|
Changes
in and Disagreements with Accountants on Accounting and Financial
Disclosure
|
37
|
|
|
Item
9A.
|
Controls
and Procedures
|
37
|
|
|
Item 9A(T).
|
Controls
and Procedures
|
37
|
|
|
Item
9B.
|
Other
Information
|
38
|
|
|
PART
III
|
38
|
||
|
Item
10.
|
Directors,
Executive Officers and Corporate Governance
|
38
|
|
|
Item
11.
|
Executive
Compensation
|
38
|
|
|
Item
12.
|
Security
Ownership of Certain Beneficial Owners and Management and Related
Stockholder Matters
|
38
|
|
|
Item
13.
|
Certain
Relationships and Related Transactions, and Director
Independence
|
38
|
|
|
Item
14.
|
Principal
Accounting Fees and Services
|
38
|
|
|
PART
IV
|
39
|
||
|
Item
15.
|
Exhibit,
Financial Statement Schedules
|
39
|
|
|
SIGNATURES
|
42
|
||
Page
2
Forward-Looking
Statements
Unless
the context indicates otherwise, all references in this document to “we,” “us”
and “our” refer to Global Axcess Corp and its subsidiaries.
In
addition to historical information, this Annual Report on Form 10-K contains
forward-looking statements that involve risks and uncertainties that could cause
actual results to differ materially. Factors that might cause or contribute to
such differences include, but are not limited to, those discussed in the
sections entitled "Management's Discussion and Analysis of Financial Condition
and Results of Operations" and “Risk Factors.” You should carefully review the
risks described in other documents we file from time to time with the Securities
and Exchange Commission (the “SEC”), including the Quarterly Reports on Form
10-Q to be filed in 2010. When used in this report, the words "expects,"
"anticipates," "intends," "plans," "believes," "seeks," "targets," "estimates,"
and similar expressions are generally intended to identify forward-looking
statements. You should not place undue reliance on the forward-looking
statements, which speak only as of the date of this Annual Report on Form 10-K.
We undertake no obligation to publicly release any revisions to the
forward-looking statements or reflect events or circumstances after the date of
this document. Estimates of future financial results are
inherently unreliable.
From
time to time, representatives of Global Axcess Corp (the “Company”) may make
public predictions or forecasts regarding the Company's future results,
including estimates regarding future revenues, expense levels, earnings or
earnings from operations. Any forecast regarding the Company's future
performance reflects various assumptions. These assumptions are subject to
significant uncertainties, and, as a matter of course, many of them will prove
to be incorrect. Further, the achievement of any forecast depends on numerous
factors (including those described in this discussion), many of which are beyond
the Company's control. As a result, there can be no assurance that the Company's
performance will be consistent with any of management’s forecasts or that the
variation from such forecasts will not be material and adverse. Investors are
cautioned not to base their entire analysis of the Company's business and
prospects upon isolated predictions, but instead are encouraged to utilize the
entire available mix of historical and forward-looking information made
available by the Company, and other information affecting the Company and its
products, when evaluating the Company's prospective results of
operations.
In
addition, representatives of the Company may occasionally comment publicly on
the perceived reasonableness of published reports by independent analysts
regarding the Company's projected future performance. Such comments should not
be interpreted as an endorsement or adoption of any given estimate or range of
estimates or the assumptions and methodologies upon which such estimates are
based. Undue reliance should not be placed on any comments regarding the
conformity, or lack thereof, of any independent estimates with the Company's own
present expectations regarding its future results of operations. The
methodologies employed by the Company in arriving at its own internal
projections and the approaches taken by independent analysts in making their
estimates are likely different in many significant respects. Although the
Company may presently perceive a given estimate to be reasonable, changes in the
Company's business, market conditions or the general economic climate may have
varying effects on the results obtained through the use of differing analyses
and assumptions. The Company expressly disclaims any continuing responsibility
to advise analysts or the public markets of its view regarding the current
accuracy of the published estimates of outside analysts. Persons relying on such
estimates should pursue their own independent investigation and analysis of
their accuracy and the reasonableness of the assumptions on which they are
based.
Page
3
PART
I
ITEM
1. BUSINESS
History
Headquartered
in Jacksonville, Florida, Global Axcess Corp (referred to herein as the
“Company,” “we,” “our” or “us”) is a Nevada corporation organized in 1984.
Unless the context otherwise requires, all references to the Company include the
Company’s subsidiary corporations.
Global
Axcess Corp was reorganized in 2001 by principals with backgrounds in
network-based electronic commerce and financial transaction processing, with a
mission to emerge as the leading independent provider of self-service kiosk
services in the United States. The Company’s objective is to expand
through internal growth and through the offering of enhanced self-service kiosk
products or services. The Company is evaluating the attractiveness of
possible acquisitions, its current strategy is to grow via acquisitions and
organic growth.
Business
Description
The
Company operates one of the United States’ largest networks of self-service
kiosks. These solutions include ATM and DVD kiosk management and support
services focused on serving the self-service kiosk needs of merchants, grocers,
retailers and financial institutions nationwide. It is a one-stop gateway for
unattended self-service kiosk management services. Our network
currently includes approximately 4,500 ATMs and DVD kiosks, principally in
regional chains and individual merchant locations. Approximately 1,712 of the
ATMs we operate are Company-owned (full placement), 2,644 are merchant-owned and
127 are under a service-only agreement. Our high-traffic retail locations and
national footprint make us an attractive partner for regional and national
financial institutions that are seeking to increase their market penetration. We
provide proprietary ATM branding and processing services for approximately 53
financial institutions that have approximately 512 branded sites under contract
with the Company nationwide. We provide network processing for an
average of approximately 1.4 million ATM financial transactions per
month.
Additional Company
Information
General
information about us can be found at http://www.globalaxcess.biz. We file
annual, quarterly, and other reports as well as other information with the SEC
under the Securities Exchange Act of 1934, as amended (the “Exchange Act”). Our
Annual Reports on Form 10-K, Quarterly Reports on Form 10-Q, Current Reports on
Form 8-K, and amendments to those reports are available free of charge on our
website as soon as reasonably practicable after the reports are filed or
furnished electronically with the SEC. You may also request a copy of these
filings at no cost by writing or telephoning us at the following address: Global
Axcess Corp, Attention: Investor Relations, 7800 Belfort Parkway, Suite 165,
Jacksonville, Florida 32256, (904) 280-3950. Information on our website is not
incorporated into this Annual Report on Form 10-K or our other securities
filings.
Nationwide Money Services,
Inc.
Nationwide
Money Services, Inc., a wholly owned subsidiary of the Company, is engaged in
the business of operating a network of ATMs. The ATMs provide debit and credit
cardholders with access to cash, account information and other services at
locations and times convenient to the cardholder. Debit and credit cards are
principally issued by banks and credit card companies.
To
promote usage of ATMs in our network, we have relationships with national and
regional card organizations (also referred to as networks) which enable the
holder of a card issued by one network to use another network’s ATM to process a
transaction. These relationships are provided through processing
providers: Elan Financial Services (“Elan”), formerly Genpass Technologies, LLC,
First Data Retail ATM Services (“First Data”), and Columbus Data Services
(“Columbus Data”).
ATMs. We deploy and
operate ATMs primarily under the following two programs:
|
|
·
|
Full placement
program. Under a full placement arrangement, the Company owns
or leases the ATM and is responsible for controlling substantially all
aspects of its operation including maintenance, cash management and
loading, supplies, signage and telecommunications services. The Company is
generally responsible for almost all of the expenses related to the
operation of the ATM with the exception of power and, on occasion,
telecommunications. The Company typically uses this program for major
national and regional merchants, as well as, for its Financial Institution
Outsourcing service.
|
Page
4
|
|
·
|
Merchant-owned
program. Under a merchant-owned arrangement, the merchant
(or, for a merchant using lease financing, its lease finance provider)
typically buys the ATM from the Company and the merchant is responsible
for most of the operating expenses such as maintenance, cash management
and loading, supplies and telecommunication services. The Company
typically provides all transaction processing services, and the merchants
use the Company’s maintenance services from time to
time.
|
Most of
our new ATMs feature advanced functionality, diagnostics and ease of use
including color displays, personal computer-based operating systems, thermal
printing, dial-up and remote monitoring capabilities, and upgrade and
capacity-expansion capability. All machines can perform basic cash dispensing
and balance inquiry transactions, transmit on-screen marketing, dispense coupons
and conduct marketing surveys. Most of our equipment is modular in design, which
allows us to be flexible and accommodating to the needs of our clients as
technology advances.
ATM
Relationships. We purchase our
ATMs primarily from Hyosung (America), Inc and Triton Systems. We believe that
the large quantity of ATMs we purchase from these manufacturers enables us to
receive favorable pricing. In addition, we maintain close working relationships
with these manufacturers in the course of our business, allowing us to stay
informed regarding product updates and to minimize technical problems with
purchased equipment.
Merchant
Customers. We have
contracts with national and regional merchants and with numerous independent
store operators. The terms of our merchant contracts vary as a result of
negotiations at the time of execution. In the case of our full placement
programs, the contract terms for contracts currently in place typically
include:
|
|
·
|
an
initial term of at least five to seven
years;
|
|
|
·
|
ATM
exclusivity at locations where we install an ATM and, in many cases, a
right of first refusal for all other
locations;
|
|
|
·
|
a
requirement that the merchant provide a highly visible space for the ATM
and signage;
|
|
|
·
|
protection
for us against underperforming locations by permitting us to increase the
withdrawal fee or remove ATMs; and
|
|
|
·
|
provisions
making the merchant’s fee variable depending on the number of ATM
transactions and milestones.
|
New
contracts under our merchant-owned or rental arrangements typically include
seven year terms with other terms similar to our full placement contracts, as
well as the following additional terms:
|
|
·
|
provisions
imposing an obligation on the merchant to ensure the ATM is operational at
all times its store is open to the public;
and
|
|
|
·
|
provisions
that require a merchant to use its best efforts to have any purchaser of
the merchant’s store assume our
contract.
|
Nationwide Ntertainment
Services, Inc.
Nationwide
Ntertainment Services, Inc., a wholly owned subsidiary of the Company formed
during fiscal 2009, is engaged in the business of operating a network of DVD
rental kiosks. We offer self-service DVD rentals through kiosks where consumers
can rent or purchase movies or games. Our current DVD kiosks are installed
primarily at grocery stores. Our DVD kiosks, through our brand
InstaFlix, serve as a mini video rental store and occupy an area of
less than ten square feet. Consumers use a touch screen to select
their DVD, swipe a valid credit or debit card, and rent movies or games in some
kiosks. The process is designed to be fast, efficient and fully automated with
no upfront or membership fees. Typically, the DVD rental price is a flat fee
plus tax for one night and if the consumer chooses to keep the DVD for
additional nights, they are automatically charged for the additional fee. We
generate revenue primarily through fees charged to rent or purchase a DVD, and
pay our retail partners a percentage of our revenue.
Page
5
Revenues
generated from our DVD rental kiosks were immaterial to our fiscal 2009
results.
Revenue
Sources
Transaction
Fees. Our revenue is recurring in nature and principally
derived from two types of feesthat we charge for processing transactions on our
ATM network. We receive an interchange fee from the issuer of the credit or
debit card for processing a transaction when a cardholder uses an ATM in our
network. In addition, in many cases, we receive a surcharge/convenience fee from
the cardholder when the cardholder makes a cash withdrawal from an ATM in our
network. See the “Overview” section in Item 7 “Management's Discussion and
Analysis of Financial Condition and Results of Operations.”
Surcharge/Convenience
Fees. In April 1996, national debit and credit card
organizations changed the rules applicable to their members, including us, to
permit the imposition of surcharge/convenience fees on cash withdrawals from
ATMs. Our business is substantially dependent upon our ability to impose
surcharge/convenience fees. Any changes in laws or card association rules
materially limiting our ability to impose surcharge/convenience fees would have
a material adverse effect on our financial results. See "Government and Industry
Regulation - Surcharge Regulation." Since April 1996, we have expanded the
number of ATMs in our network and have expanded our practice of imposing
surcharge/convenience fees on cash withdrawals from ATMs.
ATM
Network Management Services. In addition to revenues derived
from interchange and surcharge/convenience fees, we also derive revenues from
providing ATM network management services to banks and other third-party owners
of ATMs included in our ATM network. These services include 24-hour transaction
processing, monitoring and notification of ATM status and cash condition,
notification of ATM service interruptions, in some cases dispatch of field
service personnel for necessary service calls, and cash settlement and reporting
services. Banks may choose whether to limit transactions on their ATMs to cards
issued by the bank or to permit acceptance of all cards accepted on our
network. See the “Overview” section in Item 7 “Management's
Discussion and Analysis of Financial Condition and Results of
Operations.”
Seasonality. We
have traditionally experienced higher transaction volumes per machine in the
second and third quarters than in the first and fourth quarters. The increased
volumes in the summer months coincide with increased vacation travel in the
United States. However, during 2009 lower vacation travel and the
slower economy reduced the positive seasonal impact.
Our
Strategy
Our
strategy is to enhance our position as a leading independent provider of ATM
services in the United States and to position the Company as a preferred service
provider to financial institutions. We are currently a
“return-and-profit” driven company whose current primary focus is on the
achievement of increased profitability and increased positive cash flow. Key
objectives of our strategy include:
Expanding
our existing customer base. We believe our experience combined
with our dedication to enhance our existing customer relationships will enable
us to expand our customer base. We believe in creating loyal
customers by providing a superior experience at a great value. We are committed
to providing “hassle-free” consistent products and services based on
standards-based technology and processes, and outperforming the competition with
value and a superior customer experience, particularly in the financial services
markets.
Expanding
our existing product offerings. We believe we can achieve
distribution leverage by acquiring distribution rights to complimentary products
and services which can be sold to our existing customers.
Attaining
operational excellence. We believe we can attain operational
excellence along with a corresponding market identity by standardizing product
offerings and delivery processes.
Increasing
and expanding our geographic presences. We believe we can
achieve economies of scale by increasing and expanding our geographic market
concentration. By achieving economies of scale, we can reduce our
cost basis on expenses such as maintenance, vault cash, telecommunications,
replenishment, ATMs and ATM supplies.
Our
Strengths
Leading
Market Position. We operate one of the largest networks of
ATMs in the United States. Our network currently includes approximately 4,483
ATMs located throughout the United States. Our size and diversity of products
and services give us significant economies of scale and the ability to provide
attractive and efficient solutions to national, regional and local financial
institutions and retailers.
Page
6
Diverse
Network of Retail Merchants Under Multi-Year Contracts. We
have developed significant relationships with regional and local merchants
within the United States. These merchants typically operate
high-traffic locations, which we have found to result in increased ATM activity
and profitability. Our contracts with our merchant customers are typically
multi-year arrangements with initial terms of five to seven years. These
long-term relationships can provide opportunities to deploy additional ATMs in
new locations.
Recurring
and Stable Revenue and Operating Cash Flow. The long-term
contracts that we enter into with our merchant customers provide us with access
to customer traffic and relatively stable, recurring revenue. Our recurring and
stable revenue base, relatively low and predictable maintenance capital
expenditure requirements, and minimal working capital requirements allow us to
generate relatively predictable and consistent operating cash
flows.
Low-Cost
Provider. We believe the size of our network combined with our
operating infrastructure allows us to be among the low-cost providers in our
industry. We believe our operating costs per ATM are significantly lower than
the operating costs incurred by bank ATM operators. Our scale provides us with a
competitive advantage both in operating our ATM fleet and the potential to offer
cost effective outsourcing services to financial institutions.
Fiscal Year 2009 and Recent
Developments in Our Company
To
improve our revenues and cost structure, during 2009 we:
|
|
·
|
Increased
the surcharge at a number of the Company’s owned
ATMs;
|
|
|
·
|
Closed
a financing agreement with SunTrust Bank, extending a $5 million line of
credit to the Company at a fixed interest rate of 6.99%, thereby
satisfying 9% loans with Wachovia Bank and
CAMOFI;
|
|
|
·
|
Refinanced
$1.2 million in 9% debenture notes due in October 2010, reducing the
Company's working capital requirements for 2010 by extending the maturity
date of the notes by 15 months without any pre-payment penalty. As a
result of the refinancing, Global Axcess expects approximately $40,000 in
2010 interest savings due to the lower interest rate of the
loan. Additionally, there will be the elimination of warrants
for 345,000 shares of the Company's common stock which were issued in
relation to these notes;
|
|
|
·
|
Improved
ATM uptime rates on company-owned machines to an average of over
99.0%;
|
|
|
·
|
Renewed
a major client's placement contract for five
years;
|
|
|
·
|
Renewed
the contract of a major distributor for five
years;
|
|
|
·
|
Closed
a bank branding deal on select ATMs in
Texas;
|
|
|
·
|
Renewed
an existing financial institution outsourcing deal on
ATMs;
|
|
|
·
|
Signed
new, four-year contract valued at almost $100,000 per year, with a
convenience store chain that will cover processing for a total of 50 ATMs
when complete;
|
|
|
·
|
Closed
two new ATM placement deals for a combined 61 new
ATMs;
|
|
|
·
|
Expanded
an existing client relationship by 65 new placement
ATMs;
|
|
|
·
|
Signed
a three-year, $750,000 annual contract, with a national grocery chain that
has 400 locations nationwide. Under this new contract, the Company will
install, maintain and conduct transaction processing for ATMs in 51 of
their retail outlets;
|
|
|
·
|
Signed
a five-year, $550,000 annual contract, with a regional convenience store
chain in the Southeastern United States for ATMs at 52 locations;
and
|
Page
7
|
|
·
|
The
Company announced an expansion of its DVD
initiative.
|
Breach of
Contracts
Although
our merchant-owned ATM customers have multi-year contracts with us for
transaction processing services, due to competition, some of these customers may
leave us for our competitors prior to the expiration of their contracts, or may
not renew their contracts upon their expiration. Additionally, some merchants
may sell or close their stores or are unable to load cash into their ATMs due to
cash flow issues. When these events occur, we pursue these customers
to continue to utilize our processing services or alternatively, in the event
they terminate their relationship with us prior to the expiration of their
contacts, we seek payment of damages under a breach of contract clause in our
contracts. The Company lost 26 ATM locations during 2009 as a result
of breached contracts. The Company recognizes revenue on breached contracts when
cash is received.
Our ATM
Network
General. Our
network ATMs are located primarily in the south and on the east coast, and our
concentration as of December 31, 2009 is in the ten states listed
below:
|
STATE
|
NUMBER OF ATMs
|
|
|
GA
|
845
|
|
|
TX
|
692
|
|
|
NY
|
641
|
|
|
VA
|
580
|
|
|
FL
|
445
|
|
|
NC
|
256
|
|
|
NM
|
233
|
|
|
MD
|
136
|
|
|
SC
|
112
|
|
|
NJ
|
72
|
The
operation of our network involves the performance of many complementary tasks
and services, including principally:
|
|
·
|
acquiring
ATMs to be utilized by us and our
customers;
|
|
|
·
|
selecting
ATM locations and entering into leases for access to those
locations;
|
|
|
·
|
in
the case of third party merchants, establishing relationships with these
merchants for processing transactions on their
ATMs;
|
|
|
·
|
the
sale of our Branded Cash services to local and regional banks or credit
unions;
|
|
|
·
|
establishing
relationships with national and regional card organizations and credit
card issuers to promote usage of our network
ATMs;
|
|
|
·
|
processing
ATM transactions;
|
|
|
·
|
supplying
ATMs with cash and monitoring cash levels for
re-supply;
|
|
|
·
|
monitoring
ATM operations and managing the service needs of ATMs;
and
|
|
|
·
|
managing
the collection of fees generated by our network
operations.
|
ATM
Locations. We believe that the profitable operation of any ATM
is largely dependent upon the ATM’s location. Thus, we devote significant effort
to selecting locations that we believe will generate high cardholder
utilization. Additionally, we believe the availability of attractive sites is a
principal factor affecting our ability to achieve further market penetration. We
attempt to identify locations where pedestrian traffic is high, people need
quick access to cash, and use of the ATM is convenient and secure. In addition,
we believe such locations also provide a convenience to the retailer who may
wish to avoid the financial exposure and added overhead of offering
check-cashing services to their customers. Key target locations for our ATMs
include the following:
Page
8
|
|
·
|
grocery
stores;
|
|
|
·
|
convenience
stores and combination convenience stores and gas
stations;
|
|
|
·
|
major
regional and national retailers:
|
|
|
·
|
hotels;
|
|
|
·
|
shopping
malls;
|
|
|
·
|
airports;
|
|
|
·
|
colleges;
|
|
|
·
|
amusement
parks;
|
|
|
·
|
sports
arenas;
|
|
|
·
|
bars/clubs;
|
|
|
·
|
theaters;
and
|
|
|
·
|
bowling
alleys.
|
Our goal
is to secure key locations in advance of our competitors as we believe
cardholders generally establish a pattern of continued usage of a particular
ATM. Further, we believe such patterned usage will continue unless
there are frequent problems with the location, such as a machine being out of
service.
We enter
into leases for our ATM locations, which generally provide for payment to the
lessor of either a portion of the fees generated by use of the ATM or a fixed
monthly rent. Most of our leases have initial five to seven year terms and
include various renewable time periods (typically the site owner renews under
the lease). We generally have the right to terminate a lease if the ATM does not
meet certain performance standards. The lessor generally has the right to
terminate a lease before the end of the lease term if we breach the lease
agreement or become the debtor in a bankruptcy proceeding.
Typical
ATM Transaction. In a typical ATM transaction in our network,
a debit or credit cardholder inserts a credit or debit card into an ATM to
withdraw funds or obtain a balance inquiry. The transaction is routed from the
ATM to a processing center at Elan, First Data or Columbus Data by dedicated
dial-up communication links. The processing center computers identify the card
issuer by the bank identification number contained within the card's magnetic
strip. The transaction is then switched to the local issuing bank or card
organization (or its designated processor) for authorization. Once the
authorization is received, the authorization message is routed back to the ATM
and the transaction is completed.
Authorization
of ATM transactions. Transactions processed on our network
ATMs are the responsibility of the card issuer. We are not liable in the event
of an error in dispensing cash if we receive a proper authorization message from
a card issuer.
Transaction
Volumes. We monitor the number of transactions that are made by
cardholders on ATMs in our network. The transaction volumes processed on any
given ATM are affected by a number of factors, including location of the ATM,
the amount of time the ATM has been installed at that location, seasonality and
market demographics. Our experience is that transaction volume on a newly
installed ATM is initially very low and increases for a period of three to six
months as consumers become familiar with the machine location. We processed a
total of approximately 17,090,000 transactions in fiscal 2009 and 17,936,000
transactions on our network in fiscal 2008.
Page
9
ATM
transactions. During 2009, compared to 2008, the Company experienced an
approximate 5% decrease in the average number of transactions and withdrawals
per ATM. The decrease in the average number of transactions from 2009
to 2008 is mainly due the loss of high volume ATMs during the year combined with
fallout from current economic environment.
Acquisition
Strategy
The
Company is evaluating the attractiveness of possible acquisitions, its current
strategy is to grow via acquisitions and organic growth.
Business Continuity
Plan
The
Company’s business continuity plan includes the following two main
components:
|
|
·
|
a
plan to ensure the continuous operation of the Company’s core information
technology infrastructure; and
|
|
|
·
|
a
plan to minimize disruption of the remainder of its business
functions.
|
Information Technology
Infrastructure
The
Company hosts its IT infrastructure at Peak 10, the largest independent data
center operator and managed services provider in the United States, to utilize
Peak 10’s managed collocation, communications, and security services out of its
Jacksonville, Florida data center facility. The Company and Peak 10
maintain Universal Power Systems and diesel generators for back-up power in the
event of temporary and extended power outages. In the event of a
longer-term business interruption, our Business Continuity Plan directs the
process by which all core IT infrastructure needs are re-routed to the Company’s
back-up site at SunGard Availability Services (“SunGard”), an international
leader in business continuity services. The Company’s back-up site is
located in Carlstadt, New Jersey.
Intellectual
Property
Our
success depends in part on our proprietary rights and technology. We rely on a
combination of patent, copyright, trademark and trade secret laws, employee and
third-party non-disclosure agreements and other methods to protect our
proprietary rights.
Other Business
Functions
The
Company has a Business Continuity Plan for the remainder of its business
functions consisting of 4 elements: prevention, event management,
event mitigation, and event recovery. The plan addresses events such
as vendor service interruption, natural disasters, and issues with our internal
systems. In the event of a catastrophic event, the Company also
maintains alternate sites for office operations through an arrangement with
SunGard. These alternate sites, which are located in Lake Mary,
Florida and Atlanta, Georgia, provide immediate access to the technical and
office facilities required for failover. We have also converted our desktop
environment to a mobile environment; therefore, when an emergency occurs, users
can take their laptops and reach our network from either the alternate site or a
safe location with power and internet. In addition, we maintain copies of our
software and critical business information off-site.
Competition
Individuals
seeking ATM-related services have a variety of choices at banking locations and
within retail establishments. The convenience cash delivery and balance inquiry
market is, and we expect it to remain, highly competitive due to the fact that
there are few barriers to entry into the business. Our principal competition
arises from other independent sales organizations, or ISOs, similar to the
Company including Access To Money, Payment Alliance International and
Cardtronics, Inc. We also compete with numerous national and regional banks that
operate ATMs at their branches and at other non-branch locations. In addition,
we believe that there will be continued consolidation in the ATM industry in the
United States. Accordingly, new competitors may emerge and quickly acquire
significant market share.
Competitive
factors in our business include network availability and response time, price to
both the card issuer and to our customers, and ATM locations. Our principal
competitors are national ATM companies that have a dominant share of the market.
These companies have greater sales, financial, production, distribution and
marketing resources than ours.
Page
10
We have
identified the following categories of ATM network operators:
|
|
·
|
Financial
Institutions. Banks have been traditional deployers of
ATMs, which have customarily been located at their banking facilities. In
addition, the present trend is for many banks to place ATMs in retail
environments when the bank has an existing relationship with the retailer.
This practice presents both a threat and an opportunity. It is
a threat if the financial institution chooses to manage this program on
its own, whereby it would limit the ATM locations available to the
Company. On the other hand, it may be an opportunity if the
financial institution chooses to outsource the management of this type of
program to companies such as us.
|
|
|
·
|
Credit Card
Processors. Several credit card processors have
diversified their business by taking advantage of existing relationships
with merchants to place ATMs at sites with those
merchants.
|
|
|
·
|
Third Party
Operators. This category includes data processing
companies that have historically provided ATM services to financial
institutions.
|
|
|
·
|
Companies that have
the capability to provide both back-office services and ATM management
services.
|
|
|
·
|
Consolidator
networks. Consolidator networks such as TRM and
Cardtronics, whose United States operations consist of approximately
11,800 ATMs and 28,600 ATMs,
respectively.
|
Management
believes that many of the above providers, with the exception of Cardtronics and
TRM, deploy ATMs to diversify their operations and that the operation of the ATM
network provides a secondary income source to a primary business.
In April
1996, national debit and credit card organizations changed the rules applicable
to their members to permit the imposition of surcharge/convenience
fees. Since that time, we have experienced increased competition,
both from existing ATM network operators and new companies entering the
industry. There can be no assurance that we will compete successfully with
national ATM companies. A continued increase in competition could adversely
affect our margins and may have a material adverse effect on our financial
condition and results of operations.
ATM Network
Technology
Most of
the ATMs in our network are manufactured by Triton and
Tranax/Hyosung. In addition, we own several other ATM brands such as
Wincor, WRG, Greenlink, NCR EasyPoint (formerly Tidel), and others. Due to the
wide range of advanced technology available, we are able to supply our customers
with state-of-the-art ATMs providing electronic features and reliability through
sophisticated diagnostics and self-testing routines. The various machine types
perform functions ranging from the basic routines, which include dispensing
cash, displaying account information, and providing a receipt to the user, to
more sophisticated routines such as dispensing stamps or coupons and providing
advertising revenue through the use of monochrome or color monitor graphics.
Many of our ATMs are modular and upgradeable so we may adapt them to provide
additional services in response to changing technology and consumer demand. Our
field services staff tests each ATM prior to placing it in service.
Vault
Cash
Currently,
we rent cash (“vault cash”) for 1,200 of our ATMs through agreements with
various banks, which are located throughout the United States. The
vault cash is replenished periodically based upon cash
withdrawals. In addition, our branded cash partners provide cash for
512 ATMs covered under our Branded Cash program. For the remaining
2,644 ATMs in our network, such as merchant-owned ATMs, ATMs owned by other
third party owners and ATMs that are only processed under our contract with
Elan, we do not supply the vault cash. See the “Liquidity and Capital Resources”
section of Item 7 “Management's Discussion and Analysis of Financial Condition
and Results of Operations”.
Page
11
Significant
Relationships
We have
agreements with Food Lion and Kash n’ Karry Stores for whom approximately 677
and 104 ATMs, respectively, have been installed at their locations as of
December 31, 2009. Both of these agreements were extended in September 2003 to
run through April 2011 and are set to automatically renew, unless terminated 60
days prior to their termination dates. In addition, the site owner has the right
to terminate the lease before the end of the lease term under certain
circumstances. Currently, there is no such breach or
circumstance. The aggregate revenues from Food Lion and Kash n’ Karry
Stores accounted for approximately 22.8% and 4.0% of our revenues from
continuing operations in fiscal year 2009, respectively.
Government and Industry
Regulation
Our
business is generally not subject to significant government regulation, although
we are subject to certain industry regulations. Our failure to comply with
applicable regulations could result in restrictions on our ability to provide
our services.
Surcharge
Regulation. The imposition of surcharge fees is not currently
subject to federal regulation. However, several states in which we
currently have no operations have banned companies from imposing such fees,
generally as a result of activities of consumer advocacy groups that believe
that transaction fees are unfair to users. There have been, however, various
state and local efforts in the United States to ban or limit transaction fees.
We are not aware of any existing bans or limits on transaction fees applicable
to us in any of the jurisdictions in which we currently do business. However,
some states, particularly Tennessee, Nebraska, Connecticut, Delaware, New
Mexico, West Virginia, Wyoming, and Iowa, require us to obtain a bank sponsor in
order to charge withdrawal fees. As a result, in these states we must make
arrangements with a local bank to act as a sponsor of our ATMs, which typically
involves additional documentation costs and payment of a fee to the bank.
Additionally, states such as Illinois and New Jersey limit or ban withdrawal
fees on electronic benefit card usage, which has had virtually no impact on our
financial statements. Nevertheless, we cannot guarantee that transaction fees
will not be banned or limited in the jurisdictions in the United States in which
we operate. Such a ban or limit could materially limit or reduce our ATM
revenues.
Our ATM
business is subject to government and industry regulations, which we describe
below. This regulatory environment is subject to change and various proposals
have been made which, if finalized, could affect our ATM operations. Our failure
to comply with existing or future laws and regulations pertaining to our ATM
business could result in restrictions on our ability to provide our products and
services, as well as the imposition of civil fines.
Electronic
Funds Transfer Act. The United
States Electronic Funds Transfer Act, commonly known as “Regulation E”, while
directed principally at banks and other financial institutions, also has
provisions that apply to us. In particular, the act requires ATM operators that
impose withdrawal fees to notify a customer of the withdrawal fee before the
customer completes a withdrawal and incurs the fee. Notification must be made
through signs placed at or on the ATM and by notification either on the ATM
screen or through a print-out from the ATM. All of our ATMs provide both types
of notification.
Americans
with Disabilities Act. The Americans
with Disabilities Act (“ADA”) includes provisions regulating the amount of clear
floor space required in front of each ATM, prescribing the maximum height and
reach depth of each ATM and mandating that instructions and all information for
use of the ATM be made accessible to and independently usable by persons with
vision impairments. The United States Department of Justice may adopt new
accessibility guidelines under the ADA that will include provisions addressing
ATMs and how to make them more accessible to the disabled. Under the proposed
guidelines that have been published for comment but not yet adopted, ATM height
and reach requirements would be shortened, keypads would be required to be laid
out in the manner of telephone keypads, and ATMs would be required to possess
speech capabilities, among other modifications. If adopted, these new guidelines
would affect the manufacturing of ATM equipment going forward and could require
us to retrofit ATMs in our network as those ATMs are refurbished or updated for
other purposes. Additionally, proposed Accessibility Guidelines under the ADA
would require voice-enabling technology for newly-installed ATMs and ATMs that
are otherwise retrofitted or substantially modified. We are committed to
ensuring that all of our ATMs comply with all applicable ADA
regulations. Should the guidelines proposed become final, we
anticipate an 18-month phase-in before new equipment in new locations must
comply with new accessibility requirements.
Page
12
Rehabilitation
Act. On
December 1, 2006, a United States District Court judge ruled that the United
States’ currencies violate the Rehabilitation Act, a law that prohibits
discrimination in government programs on the basis of disability, as the paper
currencies issued by the United States are identical in size and color,
regardless of denomination. Under the current ruling, the United States Treasury
Department has been ordered to develop ways in which to differentiate paper
currencies such that an individual who is visually-impaired would be able to
distinguish between the different denominations. In response to the November 26,
2006 ruling, the Department of Justice filed an appeal with the United States
Court of Appeals for the District of Columbia Circuit requesting that the
decision be overturned on the grounds that varying the size of denominations
could cause significant burdens on the vending machine industry and cost the
Bureau of Engraving and Printing an initial investment of $178.0 million and up
to $50.0 million in new printing plates. While it is still uncertain at this
time what the outcome of the appeals process will be, in the event the current
ruling is not overturned, we, along with other participants in the ATM industry,
may be forced to incur significant costs to upgrade current machines’ hardware
and software components.
Anti-fraud
Initiatives. Because of reported
instances of fraudulent use of ATMs, legislation was passed that
requires state or federal licensing and background checks of ATM operators. We
completed the U.S. Patriot Act-mandated merchant underwriting process on all of
our ATMs. Additionally, there are proposals pending in some jurisdictions,
including New York and New Jersey, which would require merchants that are not
financial institutions to be licensed in order to maintain an ATM on their
premises. There are other jurisdictions that currently require such
licensing. New licensing requirements could increase our cost of doing business
in those markets.
Electronic
Financial Transactions Network Regulations. Electronic Financial
Transactions Networks (“EFTN”) has adopted extensive regulations that are
applicable to various aspects of our operations and the operations of other ATM
operators. These regulations include the encryption standards described more
fully below and limitations on the maximum amount of cash that can be withdrawn
from each machine. As described in the “Triple DES” section below, we needed to
convert our ATMs to the new encryption standards by their compliance dates. With
respect to all other EFTN regulations, we believe that we are in compliance with
the regulations that are currently in effect and, if any deficiencies were
discovered, we would be able to correct them before they had a material adverse
impact on our business.
Encrypting
Pin Pad and Triple-Data Encryption Standards. Data encryption
makes ATMs more tamper-resistant. Two of the more recently developed advanced
data encryption methods are commonly referred to as Encrypting Pin Pad (“EPP”)
and the Triple Data Encryption Standard (“Triple-DES”). In 2005, we
adopted a policy that any new ATMs we acquire from a manufacturer must be both
EPP and Triple-DES compliant. As of December 31, 2007, we had substantially
completed our Triple-DES upgrade efforts related to our Company-owned and
merchant-owned machines, and all of our machines were EPP
compliant.
Network
Regulations. National and regional networks are subject to
extensive regulations that are applicable to various aspects of our operations
and the operations of other ATM network operators. We believe that we are in
material compliance with all such regulations.
Employees
At
December 31, 2009, the Company had 48 full-time employees working in the
following entities:
|
Global
Axcess Corp
|
3
|
|
Nationwide
Ntertainment Services, Inc.
|
1
|
|
Nationwide
Money Services, Inc.
|
44
|
|
|
48
|
Our
business is highly automated and we outsource specialized, repetitive functions
such as cash delivery and security. As a result, our labor requirements for the
operation of our network are relatively modest and are centered on monitoring
activities to ensure service quality and cash reconciliation and control. None
of our employees are represented by a labor union or covered by a collective
bargaining agreement. We have not experienced work stoppages and consider our
employee relations to be good.
Page
13
ITEM
1A. RISK
FACTORS
We
operate in a rapidly changing business environment that involves substantial
risk and uncertainty. The following discussion addresses some of the risks and
uncertainties that could cause, or contribute to cause, actual results to differ
materially from expectations. We caution all readers to pay particular attention
to the descriptions of risks and uncertainties described below, in other
sections of this report and in our other filings with the SEC.
If any of
the following risks actually occur, our business, financial condition or results
of operations could be materially and adversely affected. In such case, the
trading price of our common stock could decline and we may be forced to consider
strategic alternatives with regards to current operations.
This
Annual Report on Form 10-K contains forward-looking statements that involve
risks and uncertainties. Our actual results could differ materially from those
anticipated in the forward-looking statements as a result of certain factors,
including the risks described below and elsewhere in this Annual Report on Form
10-K.
Risks Relating to Our
Business and Operations
|
|
·
|
Our sales
depend on transaction fees from our network of ATMs. A decline in
either transaction volume or the level of transaction fees could reduce
our sales and harm our operating results.
|
|
|
·
|
Transaction
fees for our network of ATMs produce substantially all of our
sales. Consequently, our future operating results will depend on
both transaction volume and the amount of the transaction fees we receive.
Our transaction volume and fees will depend principally
upon:
|
|
|
·
|
our
ability to find replacement sites in the event of merchant
turnover;
|
|
|
·
|
competition,
which can result in over-served markets, pressure to reduce existing fee
structures and increase sales discounts to merchants, and reduced
opportunities to secure merchant or other placements of our
machines;
|
|
|
·
|
our
ability to service, maintain and repair ATMs in our network promptly and
efficiently;
|
|
|
·
|
continued
market acceptance of our services;
and
|
|
|
·
|
government
regulation and network adjustment of our
fees.
|
|
|
·
|
Changes in
payment technologies and customer preferences could reduce the use of ATMs
and, as a result, reduce our sales. New technology such
as Radio Frequency Identification (“RFID”) and other contact-less payment
systems that eliminate the need for ATMs may result in the existing
machines in our networks becoming obsolete, requiring us, or the merchants
in our networks who own their machines, to either replace or upgrade our
existing machines. Any replacement or upgrade program to machines that we
own or that we must upgrade or replace under contracts with merchant
owners would involve substantial expense. A failure to either replace or
upgrade obsolete machines could result in customers using other
alternative payment methods, thereby reducing our sales and reducing or
eliminating any future operating
margins.
|
The use
of debit cards by consumers has been growing. Consumers use debit cards to make
purchases from merchants, with the amount of the purchase automatically deducted
from the consumers' checking accounts. An increasing number of merchants are
accepting debit cards as a method of payment and are also permitting consumers
to use the debit cards to obtain cash. The increasing use of debit cards to
obtain cash may reduce the number of cash withdrawals from our ATMs and may
adversely affect our revenues from surcharge/convenience fees. A continued
increase in the use and acceptance of debit cards could have a material adverse
effect on our business, results of operations and financial
condition.
Additionally,
the growth in the use of surcharge-free ATM networks by consumers may reduce the
number of cash withdrawals from our ATMs and may adversely affect our revenues
from surcharge/convenience fees. A continued increase in surcharge-free ATM
networks could have a material adverse effect on our business, results of
operations and financial condition.
Page
14
|
|
·
|
We depend
on Elan and Pendum to provide many services on which we
rely. Our ATM business requires close coordination of
merchant relationships, service company relationships, cash management
activities and telecommunication services. In an effort to reduce costs
and improve our service levels, we entered into agreements with Elan and
Pendum pursuant to which Elan and Pendum will provide many of these
services to us. Elan also provides us with transaction processing
services. As a result, we depend on Elan and Pendum to provide many
services that are necessary to the operations of our ATM business. At some
point, Elan and Pendum may be unable or unwilling to provide all of these
services at a level that we consider necessary. In that event, if we are
unable to terminate our relationship with Elan and Pendum or are unable to
obtain replacement services in a timely manner, our transaction volume
could be reduced and our relationships with our merchants or financial
institutions could deteriorate.
|
|
|
·
|
Changes in
laws or card association rules affecting our ability to impose
surcharge/convenience fees and continued customer willingness to pay
surcharge/convenience fees;
|
|
|
·
|
Our ability
to form new strategic relationships and maintain existing relationships
with issuers of credit cards and national and regional card
organizations;
|
|
|
·
|
Our ability
to expand our ATM based
business;
|
|
|
·
|
The
availability of financing at reasonable rates for vault cash and for other
corporate purposes, including funding our ATM expansion
plans;
|
|
|
·
|
Our ability
to maintain our existing relationships with Food Lion and Kash n’
Karry;
|
|
|
·
|
Our ability
to keep our ATMs at other existing locations and to place additional ATMs
in preferred locations at reasonable rental
rates;
|
|
|
·
|
The extent
and nature of competition from financial institutions, credit card
processors and third party operators, many of whom have substantially
greater resources;
|
|
|
·
|
Our ability
to maintain our ATMs and information systems technology without
significant system failures or
breakdowns;
|
|
|
·
|
Our ability
to develop new products and enhance existing products to be offered
through ATMs, and our ability to successfully market these
products;
|
|
|
·
|
Our
entrance into the DVD kiosk business could be cash
dilutive;
|
|
|
·
|
Our
entrance into the DVD kiosk business could contribute negative
earnings;
|
Our DVD
services business has a very limited operating history and faces many of the
risks inherent to a new business. Redbox, the largest player in the DVD services
business, incurred a net operating loss each year since it began operations in
2002 through 2007. As a result of its limited operating history, it is difficult
to accurately forecast our potential revenue and operating results from our new
DVD kiosk business. If we are unable to attract customers to our DVD rental
kiosks, our operations and financial condition will be adversely affected.
Because of our limited operating history in this business line and because the
DVD rental kiosk market and our business model for DVD services is rapidly
evolving, we have very limited data for predicting kiosk and market performance
in future periods. As a result, we may make errors in predicting and reacting to
relevant business trends which could have a material adverse effect on our
business, financial condition and results of operations.
|
|
·
|
Our ability
to retain senior management and other key
personnel;
|
Page
15
|
|
·
|
The current
global economic downturn could adversely impact our
business;
|
Our sales
are dependent upon the availability and access to cash for ATM
users. The current global economic downturn may have a negative
impact on availability and accessibility to or the affordability of fees imposed
by our ATMs. Accordingly, a pronounced and sustained economic
downturn could have a material, adverse effect on our business, financial
condition and results of operations. Additionally, the current global
economic downturn may have a negative impact on the merchants with which we do
business, thus leading to increased store closures or lack of cash to replenish
their ATMs.
|
|
·
|
Changes in
general economic conditions.
|
The ATM markets
are highly competitive, which could limit our growth or reduce our
sales. While our principal
competition comes from national and regional banks, we are also experiencing
increased competition from independent ATM companies. All of these competitors
offer services similar to or substantially the same as those services offered by
us. We expect that competition will intensify as consolidation within the
financial services industry continues. In addition, the majority of
these competitors are larger, more established and have greater financial,
technical, and marketing resources, greater name recognition, and a larger
installed customer base than the Company. Such competition could prevent us from
obtaining or maintaining desirable locations for our machines or could cause us
to reduce user fees generated by our ATMs, which could cause our profits to
decline.
In
addition to our current competitors, we expect substantial competition from new
companies. We cannot assure that the Company will be able to compete effectively
against current and future competitors. Increased competition could result in
price reductions, reduced gross profits or loss of market share.
Our failure to
achieve and maintain adequate internal controls, in an industry that is
relatively new and complex, could result in a loss of investor confidence
regarding our financial reports and have an adverse effect on our business,
financial condition, results of operations and stock price. Pursuant to
Section 404 of the Sarbanes-Oxley Act of 2002, we are required to furnish a
report of management’s assessment of the design and effectiveness of our
internal control over financial reporting as part of our Annual Report on Form
10-K filed with the SEC. Our independent auditors are not required to attest to,
and report on, management’s assessment and the effectiveness of internal control
over financial reporting until fiscal 2010. Our management is also required to
report on the effectiveness of our disclosure controls and
procedures. Any material weakness and deficiencies in the
effectiveness of internal control over financial reporting could result in
inaccurate financial statements or other disclosures or fail to prevent fraud,
which could have an adverse effect on our business, financial condition or
results of operations. Further, if we do not remediate any material weakness, we
could be subject to sanctions or investigation by regulatory authorities, such
as the SEC, we could fail to timely meet our regulatory reporting obligations,
or investor perceptions could be negatively affected; each of these potential
consequences could have an adverse effect on our business, financial condition
or results of operations.
If merchant-owned
ATM customers terminate their relationships with us prior to the termination of
their contracts or do not renew their contracts upon their expiration, it could
reduce our ATM sales. Although our merchant-owned ATM customers have
multi-year contracts with us for transaction processing services, due to
competition, some of these customers may leave us for our competitors prior to
the expiration of their contracts, or may not renew their contracts upon their
expiration. When these contracts expire, we pursue these customers to remain
processing with us. In the event they terminate their relationship with us prior
to the expiration of their contacts, we seek payment of damages under a breach
of contract clause in our contracts. If a substantial number of merchant-owned
ATM customers end their relationships with us, it could cause a reduction in our
ATM sales.
Increases in
interest rates will increase our expenses. We have credit and
vault cash facilities that carry variable interest rates. Consequently, a rise
in interest rates would increase our operating costs and expenses.
Our ATM business
operates in a changing and unpredictable regulatory environment. ATM
withdrawal transactions involve the electronic transfer of funds through
Electronic Financial Transactions Networks (EFTNs). The United States Electronic
Funds Transfer Act provides the basic framework establishing the rights,
liabilities and responsibilities of participants in EFTNs. In addition, there
have been various state and local efforts to ban, limit or otherwise regulate
ATM transaction fees, which make up a large portion of our sales for our full
placement ATMs and the principal source of ATM revenues for merchants with
merchant-owned ATMs in our network. For example, in Tennessee, Nebraska,
Connecticut, Delaware, New Mexico, West Virginia, Wyoming, and Iowa only
bank-sponsored ATMs can impose withdrawal fees. As a result, in these states we
must make arrangements with a local bank to act as a sponsor of ATMs in our
networks, which typically involves additional documentation costs and payment of
a fee to the bank.
Page
16
Because
of reported instances of fraudulent use of ATMs, legislation is pending that
would require state or federal licensing and background checks of ATM operators.
There are proposals pending in some jurisdictions, including New York and New
Jersey, which would require merchants that are not financial institutions to be
licensed in order to maintain an ATM on their premises; other jurisdictions
currently require such licensing. New licensing requirements could increase our
cost of doing business in those markets.
New government
and industry standards will increase our costs and, if we cannot meet compliance
deadlines, could require us to remove non-compliant machines from service.
The Americans with Disabilities Act (“ADA”) includes provisions
regulating the amount of clear floor space required in front of each ATM,
prescribing the maximum height and reach depth of each ATM and mandating that
instructions and all information for use of the ATM be made accessible to and
independently usable by persons with vision impairments. The United States
Department of Justice may adopt new accessibility guidelines under the ADA that
will include provisions addressing ATMs and how to make them more accessible to
the disabled. Under the proposed guidelines that have been published for comment
but not yet adopted, ATM height and reach requirements would be shortened,
keypads would be required to be laid out in the manner of telephone keypads, and
ATMs would be required to possess speech capabilities, among other
modifications. If adopted, these new guidelines would affect the manufacturing
of ATM equipment going forward and could require us to retrofit ATMs in our
network as those ATMs are refurbished or updated for other purposes.
Additionally, proposed Accessibility Guidelines under the ADA would require
voice-enabling technology for newly-installed ATMs and for ATMs that are
otherwise retrofitted or substantially modified. We are committed to ensuring
that all of our ATMs comply with all applicable ADA regulations. No
guidelines have yet been promulgated. Should the guidelines proposed become
final, we anticipate an 18-month phase-in before new equipment in new locations
must comply with new accessibility requirements.
If ATMs
in our network are not compliant with any applicable ADA guidelines by the
respective deadlines and we cannot obtain compliance waivers, we may have to
remove the non-compliant ATMs from service and, as a result, our ATM revenues
could be materially reduced during the period of time necessary to become
compliant.
If we,
our transaction processors, our EFTNs or our other service providers experience
system failures, the ATM products and services we provide could be delayed or
interrupted, which would harm our business. Our ability to provide reliable
service largely depends on the efficient and uninterrupted operations of our
transaction processors, EFTNs and other service providers. Any significant
interruptions could severely harm our business and reputation and result in a
loss of sales. Additionally, if we cause any such interruption, we could lose
the affected merchants or damage our relationships with them. Our systems and
operations, and those of our transaction processors, EFTNs and other service
providers, could be exposed to damage or interruption from fire, natural
disaster, unlawful acts, terrorist attacks, power loss, telecommunications
failure, unauthorized entry and computer viruses. We cannot be certain that any
measures we and our service providers have taken to prevent system failures will
be successful or that we will not experience service interruptions.
We rely on EFTNs
and transaction processors; if we cannot renew our agreements with them, if they
are unable to perform their services effectively or if they decrease the level
of the transaction fees we receive, it could harm our business. We rely
on several EFTNs and transaction processors to provide card authorization, data
capture and settlement services to us and our merchant customers. Any inability
on our part to renew our agreements with these or similar service providers or
their failure to provide their services efficiently and effectively may damage
our relationships with our merchants and may permit those merchants to terminate
their agreements with us.
Our ATM
revenues depend to a significant extent upon the transaction fees we receive
through EFTNs. If one or more of the EFTNs in which we participate reduces the
transaction fees it pays to us, and we are unable to route transactions to other
EFTNs to replace them, our ATM revenues would be reduced. Our ATMs do not meet
all of the requirements for first tier status. As a means of mitigating the
impact of the lower interchange rates paid by Visa/Plus we have had our
processing agents adjust priority routing tables to, whenever possible, move
transactions through EFTNs whose interchange rates are higher than those paid by
the Visa/Plus EFTN.
Page
17
Risks
Relating to Our Common Stock
The price of our
common stock has been highly volatile due to factors that will continue to
affect the price of our stock. Since January 2001, our common stock has
traded as high as $13.75 and as low as $0.10 per share (after giving effect to
the 1-for-5 reverse stock split of our common stock that occurred on April 28,
2005). Historically, the over-the-counter markets for securities such as our
common stock have experienced extreme price fluctuations. Some of the factors
leading to this volatility include:
|
|
·
|
fluctuations
in our quarterly revenues and operating
results;
|
|
|
·
|
litigation
against the Company;
|
|
|
·
|
announcements
of product releases or new services by us or our
competitors;
|
|
|
·
|
announcements
of acquisitions and/or partnerships by us or our
competitors.
|
There is
no assurance that the price of our common stock will not continue to be volatile
in the future.
A significant
portion of our total outstanding shares of common stock may be sold in the
market in the near future. As of February 15, 2010, approximately 5.6
million or 25.5% of registered securities are beneficially owned by 4 persons or
groups. Sales of substantial amounts of these securities, when sold, could
reduce the market price of our common stock. This could cause the
market price of our common stock to drop significantly, even if our business is
doing well. Sales of a substantial number of shares of our common stock in the
public market could occur at any time. These sales, or the perception in the
market of such sales, may have a material adverse effect on the market price of
our common stock.
We do not plan to
declare dividends on our common stock. We do not plan to
declare dividends on our common stock for the foreseeable future and, in any
event, under the terms of our credit facility with SunTrust Bank, are prohibited
from doing so.
Risk Relating to Our
Operating Results
Our
business is subject to numerous factors affecting our operating results. In
addition to the risk factors discussed above, our operating results may be
affected by:
We have an
operating history which may not be an indicator of our future
results. As a
result of our operating history, our plan for growth, and the increasingly
competitive nature of the markets in which we operate, our historical financial
data may not be a good indicator of our future revenues and operating expenses.
Our planned expense levels will be based in part on expectations concerning
future revenues, which is difficult to forecast accurately based on current
plans of expansion and growth. We may be unable to adjust spending in a timely
manner to compensate for any unexpected shortfall in revenues.
If we incur
operating losses, we may be unable to continue our current
operations. We incurred significant
operating losses during the two fiscal years of 2005 and 2006. Even though we
reported net income during fiscal year 2007 through fiscal 2009, we have
reported an accumulated deficit of $7.6 million as of December 31, 2009. If we
incur operating losses in the future, we may be unable to continue our current
operations. Our future profitability depends on our ability to retain current
customers, obtain new customers, respond to competition, introduce new products
and services, and successfully market and support our products. We cannot assure
that this will be achieved.
If we cannot
raise adequate lease financing in the future, we may be unable to continue to
expand our ATM portfolio. In the future, we will
need to raise lease financing to fund new purchases of ATMs. Funding from lease
financing sources may not be available when needed or on favorable terms. If we
cannot raise adequate lease financing to satisfy our capital requirements, we
may have to limit, delay, scale-back or eliminate future growth.
The termination
of our contract with our major customers could negatively impact our results of
operations and may result in a significant impact to revenues. In November 2001, we
entered into new contracts with Food Lion and its affiliated company, Kash n’
Karry. These contracts replaced a prior agreement with Food Lion that
expired in September 2001. The new contracts were for a five-year term and
included approximately 550 sites then operating, plus an additional 400 sites
that we began servicing in September 2001. During fiscal year 2003, we
renegotiated these contracts to extend the term to April 2011, and as of
December 31, 2009, we have in service approximately 781 ATM sites. The sites
maintained by Food Lion and Kash n’ Karry constitute approximately 17.4% of our
total sites and approximately 26.8% of our total revenues. Historically, these
sites have generated average revenue per site in excess of other sites. The loss
of, or any further reduction in business from, this major customer could have a
material adverse impact on our working capital and future results of
operations.
Page
18
The continued
growth and acceptance of debit cards as a means of payment could negatively
impact our results of operations. The use of debit cards by
consumers has been growing. Consumers use debit cards to make purchases from
merchants, with the amount of the purchase automatically deducted from the
consumers' checking accounts. An increasing number of merchants are accepting
debit cards as a method of payment and are also permitting consumers to use the
debit cards to obtain cash. The increasing use of debit cards to obtain cash may
reduce the number of cash withdrawals from our ATMs and may adversely affect our
revenues from surcharge/convenience fees. A continued increase in the use and
acceptance of debit cards could have a material adverse effect on our business,
results of operations and financial condition.
Any regulation or
elimination of surcharge/convenience or interchange fees could have a material
adverse impact on our results of operations. There have been various
efforts by both consumer groups and various legislators to eliminate
surcharge/convenience fees, which comprised $12.0 million, or 55.7%, of our
revenues from continuing operations in fiscal 2009. In the event that
surcharge/convenience fees are eliminated, the revenues generated from cash
withdrawal transactions would be significantly reduced, which would have a
material adverse impact on our working capital and results of
operations. There have also been efforts by various legislators to
eliminate interchange fees. Although this would have an immediate, negative
impact, we believe that the industry will respond by increasing
surcharge/convenience fees to make up the loss in interchange fees. In the event
that the loss of interchange fees could not be passed through by increasing
surcharge/convenience fees, the elimination of interchange fees would have a
material adverse impact on our working capital and results of
operations.
If banks decrease
the surcharge/convenience fees they charge, we may need to reduce the
surcharge/convenience fees we charge. While we experience
competition from independent ATM companies, our principal competition comes from
national and regional banks. Should these national and regional banks
decrease the surcharge/convenience fees they charge, in order to remain
competitive, we may also need to reduce the surcharge/convenience fees we
charge, which may adversely affect our revenues.
Mergers,
acquisitions and personnel changes at financial institutions, Electronic Funds
Transfer Networks, and Independent Sales Organizations may adversely affect our
business, financial condition and results of operations. Currently, the banking
industry is consolidating, causing the number of financial institutions and ATM
networks to decline. This consolidation could cause us to lose:
|
|
·
|
current
and potential customers;
|
|
|
·
|
market
share if the combined entity determines that it is more efficient to
develop in-house products and services similar to ours or use our
competitors' products and services;
and
|
|
|
·
|
revenues
if the combined institution is able to negotiate a greater volume discount
for, or discontinue the use of, our products and
services.
|
If our computer
network and data centers were to suffer a significant interruption, our business
and customer reputation could be adversely impacted and result in a loss of
customers. Our ability to provide reliable service largely depends on the
efficient and uninterrupted operations of our computer network systems and third
party data centers. Any significant interruptions could severely harm our
business and reputation and result in a loss of customers. Our systems and
operations could be exposed to damage or interruption from fire, natural
disaster, power loss, telecommunications failure, unauthorized entry and
computer viruses. Although we and the third party data centers have taken steps
to prevent a system failure, we cannot be certain that the measures will be
successful and that we will not experience system failures. Further, our
property and business interruption insurance may not be adequate to compensate
us for all losses or failures that may occur.
We may be unable
to protect our intellectual property rights, which could have a negative impact
on our results of operations. Despite our efforts to
protect our intellectual property rights, third parties may infringe or
misappropriate our intellectual property rights, or otherwise independently
develop substantially equivalent products and services. The loss of intellectual
property protection or the inability to secure or enforce intellectual property
protection could harm our business and ability to compete. We rely on a
combination of trademark and copyright laws, trade secret protection, and
confidentiality and license agreements to protect our trademarks, software and
know-how. We may find it necessary to spend significant resources to protect our
trade secrets and monitor and police our intellectual property
rights.
Page
19
Third
parties may assert infringement claims against us in the future. In particular,
there has been a substantial increase in the issuance of patents for
Internet-related business processes, which may have broad implications for all
participants in Internet commerce. Claims for infringement of these patents are
becoming an increasing source of litigation. If we become subject to an
infringement claim, we may be required to modify our products, services and
technologies or obtain a license to permit our continued use of those rights. We
may not be able to do either of these things in a timely manner or upon
reasonable terms and conditions. Failure to do so could seriously harm our
business and operating results. In addition, future litigation relating to
infringement claims could result in substantial costs to us and a diversion of
management resources. Adverse determinations in any litigation or proceeding
could also subject us to significant liabilities and could prevent our use of
certain of our products, services or technologies.
ITEM
1B. UNRESOLVED STAFF
COMMENTS
Not
Applicable.
Page
20
ITEM
2. PROPERTIES
We do not
own any real property. The following table sets forth certain
information about our leased properties as of December 31, 2009.
|
Location
|
Approximate
Square
Footage
|
Use
|
||
|
Jacksonville,
Florida
|
5,841
sq. ft.
|
General
office use; operations, accounting, sales, and related
administration.
|
||
|
West
Columbia, South Carolina
|
3,600
sq. ft.
|
General
warehouse use, equipment storage, and maintenance
operations.
|
||
|
Jacksonville,
Texas
|
5,000
sq. ft.
|
General
office and warehouse use, equipment storage, customer service, and
maintenance operations.
|
||
|
Duluth,
Georgia
|
250
sq. ft.
|
General
office use and
administration.
|
In
general, all facilities are leased under operating leases and are in good
condition.
Page
21
ITEM
3. LEGAL
PROCEEDINGS
Information
regarding legal proceedings is contained in Financial Footnote #14 ”Legal
Proceedings” to the consolidated financial statements contained in this report
and is incorporated herein by reference.
ITEM
4. [REMOVED
AND RESERVED]
PART
II
ITEM
5. MARKET FOR REGISTRANT’S
COMMON EQUITY, RELATED STOCKHOLDER MATTERS AND ISSUER PURCHASES OF EQUITY
SECURITIES
Price
Range
On April
28, 2005, the Company completed a one-for-five reverse split of its common
shares outstanding as of that date at which time our trading symbol changed from
“GLXS” to “GAXC.” Our common stock is currently quoted on the
Over-the-Counter Bulletin Board ("OTCBB") under the symbol "GAXC." As of March
1, 2009, there were 21,931,786 shares of the Company’s common stock ($0.001 par
value) issued and 21,883,924 shares outstanding.
We are
currently authorized to issue a total of 45,000,000 shares of common stock
($0.001 par value) and 5,000,000 shares of preferred stock ($0.001 par value).
The Company does not currently have any shares of its preferred stock
outstanding. The following table sets forth the high and low sales
price per share of our common stock (as adjusted for the one-for-five reverse
split that occurred on April 28, 2005). The quotations reflect
inter-dealer prices, without mark-up, mark-down or commission, and may not
represent actual transactions.
|
Price Range
|
||||||||
|
High
|
Low
|
|||||||
|
Fiscal
2010:
|
||||||||
|
First
Quarter through February 24th
|
$ | 1.06 | 0.85 | |||||
|
Fiscal
2009:
|
||||||||
|
First
Quarter
|
$ | 0.22 | 0.10 | |||||
|
Second
Quarter
|
0.44 | 0.20 | ||||||
|
Third
Quarter
|
0.99 | 0.40 | ||||||
|
Fourth
Quarter
|
0.90 | 0.58 | ||||||
|
Fiscal
Year
|
0.99 | 0.10 | ||||||
|
Fiscal
2008:
|
||||||||
|
First
Quarter
|
$ | 0.31 | 0.20 | |||||
|
Second
Quarter
|
0.30 | 0.23 | ||||||
|
Third
Quarter
|
0.30 | 0.24 | ||||||
| 0.26 | 0.11 | |||||||
|
Fiscal
Year
|
0.31 | 0.11 | ||||||
Dividends
We have
not historically declared or paid any dividends on our common stock and we
currently plan to retain future earnings to fund the development and growth of
our business. The declaration of future dividends, whether in
cash or in-kind, is within the discretion of the Board of Directors and will
depend upon business conditions, our results of operations, our financial
condition, and other factors. In addition, under the terms of our
credit facility we are prohibited from declaring dividends.
Page
22
Shareholders
On March
1, 2010, there were 232 registered holders of record of our common stock.
Because many of such shares are held by brokers and other institutions on behalf
of stockholders, we are unable to estimate the total number of stockholders
represented by these record holders.
Securities authorized for
issuance under equity compensation plans
As of
December 31, 2009, we had the following securities authorized for issuance under
the equity compensation plans (as adjusted for the one-for-five reverse split
that occurred on April 28, 2005):
|
Plan Category
|
Number of
securities to
be issued
upon
exercise of
outstanding
options,
warrants and
rights
|
Weighted-
average
exercise
price of
outstanding
options,
warrants
and rights
|
Number of
securities
remaining
available for
future
issuance
under equity
compensation
plans
(excluding
securities
reflected in
first column)
|
|||||||||
|
Equity
compensation plans approved by security holders
|
||||||||||||
|
Stock
Options
|
2,889,700 | $ | 0.40 | 193,427 | ||||||||
|
Warrants
|
365,000 | $ | 0.59 | — | ||||||||
|
Equity
compensation plans not approved by security holders
|
— | — | — | |||||||||
|
Total
|
3,254,700 | $ | 0.42 | 193.427 | ||||||||
Recent Sales of Unregistered
Securities
None.
Stock Performance
Graph
The
following stock performance graph does not constitute soliciting material, and
should not be deemed filed or incorporated by reference into any other Company
filing under the Securities Act of 1933, as amended, or the Exchange Act, except
to the extent the Company specifically incorporates this stock performance graph
by reference therein.
The
following performance graph compares the cumulative total stockholder return on
our common stock to the cumulative total return on the NASDAQ Composite Index
and the weighted average return of our peer group (described below) for the five
years ended December 31, 2009, assuming an initial investment of $100 and the
reinvestment of all dividends.
Our
current peer group consists of the following: Cardtronics Inc. and Access to
Money.
Page
23
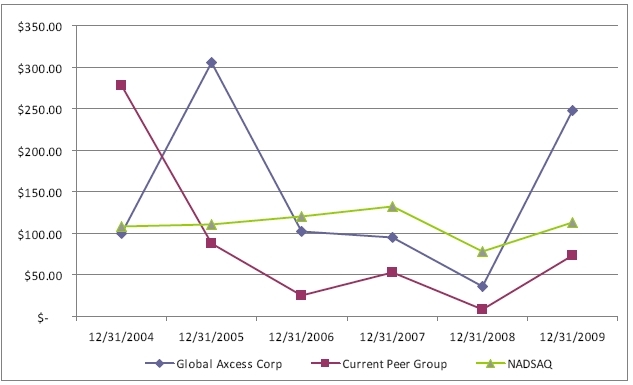
|
12/31/2004
|
12/31/2005
|
12/31/2006
|
12/31/2007
|
12/31/2008
|
12/31/2009
|
|||||||||||||||||||
|
Global
Axcess Corp
|
$ | 100.00 | $ | 305.56 | $ | 102.78 | $ | 94.44 | $ | 36.11 | $ | 247.22 | ||||||||||||
|
Current
Peer Group
|
$ | 278.19 | $ | 87.34 | $ | 25.09 | $ | 52.64 | $ | 8.88 | $ | 73.09 | ||||||||||||
|
NADSAQ
|
$ | 108.59 | $ | 110.08 | $ | 120.56 | $ | 132.39 | $ | 78.72 | $ | 113.27 | ||||||||||||
Page
24
ITEM
6. SELECTED FINANCIAL
DATA
Summary
Statement of Operations Data
|
For
the Year Ended December 31,
|
||||||||||||||||||||
|
2009
|
2008
|
2007
|
2006
|
2005
|
||||||||||||||||
|
(In
thousands except gross profit percentage and per share
data)
|
||||||||||||||||||||
|
Revenues
|
$ | 21,495 | $ | 22,171 | $ | 21,751 | $ | 21,437 | $ | 19,526 | ||||||||||
|
Gross
profit
|
10,178 | 9,823 | 9,045 | 9,032 | 8,004 | |||||||||||||||
|
Gross
profit %
|
47.4 | % | 44.3 | % | 41.6 | % | 42.1 | % | 41.0 | % | ||||||||||
|
Operating
income (loss) from continuing operations
|
2,655 | 2,193 | 1,511 | (3,510 | ) | 1,284 | ||||||||||||||
|
Net
Income (loss) from continuing operations
|
$ | 2,813 | $ | 1,170 | $ | 256 | $ | (4,588 | ) | $ | 550 | |||||||||
|
Income
(loss) from discontinued operations
|
$ | - | $ | - | $ | 175 | $ | (276 | ) | $ | (1,273 | ) | ||||||||
|
Net
Income (loss)
|
$ | 2,813 | $ | 1,170 | $ | 431 | $ | (4,864 | ) | $ | (723 | ) | ||||||||
|
Income
(loss) per common share - basic:
|
||||||||||||||||||||
|
Income
(loss) from continuing operations
|
$ | 0.13 | $ | 0.06 | $ | 0.01 | $ | (0.22 | ) | $ | 0.03 | |||||||||
|
Income
(loss) from discontinued operations
|
$ | - | $ | - | $ | 0.01 | $ | (0.01 | ) | $ | (0.07 | ) | ||||||||
|
Net
Income (loss) per common share
|
$ | 0.13 | $ | 0.06 | $ | 0.02 | $ | (0.23 | ) | $ | (0.04 | ) | ||||||||
|
Income
(loss) per common share - diluted:
|
||||||||||||||||||||
|
Income
(loss) from continuing operations
|
$ | 0.12 | $ | 0.06 | $ | 0.01 | $ | (0.22 | ) | $ | 0.03 | |||||||||
|
Income
(loss) from discontinued operations
|
$ | - | $ | - | $ | 0.01 | $ | (0.01 | ) | $ | (0.07 | ) | ||||||||
|
Net
Income (loss) per common share
|
$ | 0.12 | $ | 0.06 | $ | 0.02 | $ | (0.23 | ) | $ | (0.04 | ) | ||||||||
|
Weighted
average common shares outstanding:
|
(**As
adjusted for the one-for-five reverse split that occurred on April 28,
2005)
|
|||||||||||||||||||
|
Basic
|
21,654,554 | 20,973,924 | 20,988,348 | 20,996,013 | 18,858,947 | ** | ||||||||||||||
|
Diluted
|
22,845,241 | 20,973,924 | 20,988,348 | 20,996,013 | 19,416,107 | ** | ||||||||||||||
|
Summary
Balance Sheet Data
|
||||||||||||||||||||
|
At
December 31,
|
||||||||||||||||||||
|
2009
|
2008
|
2007
|
2006
|
2005
|
||||||||||||||||
|
(In
thousands)
|
||||||||||||||||||||
|
Total
current assets
|
$ | 4,412 | $ | 3,466 | $ | 1,842 | $ | 2,797 | $ | 5,081 | ||||||||||
|
Total
assets
|
26,117 | 23,648 | 24,001 | 26,091 | 31,638 | |||||||||||||||
|
Total
current liabilities
|
5,776 | 3,938 | 4,968 | 6,343 | 6,049 | |||||||||||||||
|
Total
liabilities
|
9,551 | 10,184 | 11,866 | 14,462 | 15,068 | |||||||||||||||
|
Working
Capital
|
(1,364 | ) | (472 | ) | (3,127 | ) | (3,546 | ) | (969 | ) | ||||||||||
|
Total
stockholders' equity
|
16,566 | 13,464 | 12,134 | 11,629 | 16,570 | |||||||||||||||
|
Cash
and cash equivalents
|
$ | 2,008 | $ | 1,561 | $ | 540 | $ | 754 | $ | 2,358 | ||||||||||
|
Resticted
cash
|
800 | - | - | - | - | |||||||||||||||
|
Total
cash, cash equivalents and restricted cash
|
$ | 2,808 | $ | 1,561 | $ | 540 | $ | 754 | $ | 2,358 | ||||||||||
|
Short-term
and long-term debt
|
$ | 6,317 | $ | 7,381 | $ | 8,505 | $ | 10,070 | $ | 10,802 | ||||||||||
|
Warrant
valuation discounts
|
- | 307 | 473 | 639 | 807 | |||||||||||||||
|
Total
debt
|
$ | 6,317 | $ | 7,688 | $ | 8,978 | $ | 10,709 | $ | 11,609 | ||||||||||
Page
25
ITEM
7. MANAGEMENT'S DISCUSSION AND
ANALYSIS OF FINANCIAL CONDITION AND RESULTS OF OPERATIONS
The
following discussion should be read in conjunction with the consolidated
financial statements and notes thereto.
In
addition to historical information, this Annual Report on Form 10-K contains
forward-looking statements that involve risks and uncertainties that could cause
actual results to differ materially. Factors that might cause or contribute to
such differences include, but are not limited to, those discussed below. You
should carefully review the risks described in other documents we file from time
to time with the SEC, including the Quarterly Reports on Form 10-Q to be filed
in 2010. When used in this report, the words "expects," "anticipates,"
"intends," "plans," "believes," "seeks," "targets," "estimates," "looks for,"
"looks to," and similar expressions are generally intended to identify
forward-looking statements. You should not place undue reliance on these
forward-looking statements, which speak only as of the date of this Annual
Report on Form 10-K. We undertake no obligation to publicly release any
revisions to the forward-looking statements or reflect events or circumstances
after the date of this document.
Overview
Global
Axcess Corp, through its wholly owned subsidiaries, owns or leases, operates or
manages Automated Teller Machines ("ATM"s) with locations primarily in the
eastern and southwestern United States of America. Our revenues are principally
derived from two types of fees, which we charge for processing transactions on
our ATM network. We receive an interchange fee from the issuer of the credit or
debit card for processing a transaction when a cardholder uses an ATM in our
network. In addition, in most cases we receive a surcharge/convenience fee from
the cardholder when the cardholder makes a cash withdrawal from an ATM in our
network.
Interchange
fees are processing fees that are paid by the issuer of the credit or debit card
used in a transaction. Interchange fees vary for cash withdrawals, balance
inquiries, account transfers or uncompleted transactions, which are the primary
types of transactions that are currently processed on ATMs in our network. The
maximum amount of the interchange fees is established by the national and
regional card organizations and credit card issuers with whom we have a
relationship. We receive interchange fees for transactions on ATMs that we own,
but sometimes we rebate a portion of the fee to the owner of the ATM location
under the applicable lease for the ATM site. We also receive the interchange fee
for transactions on ATMs owned by third party vendors included within our
network, but we rebate all or a portion of each fee to the third party vendor
based upon negotiations between us. The interchange fees received by us vary
from network to network and, to some extent, from issuer to issuer, but
generally range from $0.15 to $0.55 per cash withdrawal. Interchange fees for
balance inquiries, account transfers and denied transactions are generally
substantially less than fees for cash withdrawals. The interchange fees received
by us from the card issuer are independent of the service fees charged by the
card issuer to the cardholder in connection with ATM transactions. Service fees
charged by card issuers to cardholders in connection with transactions through
our network range from zero to $2.50 per transaction. We do not receive any
portion of these service fees.
In most
markets we impose a surcharge/convenience fee for cash withdrawals.
Surcharge/convenience fees are a substantial additional source of revenue for us
and other ATM network operators. The surcharge/convenience fee for most of the
ATMs in our network ranges between $1.50 and $2.75 per withdrawal. The
surcharge/convenience fee for other ATMs in our network ranges between $0.50 and
$7.50 per withdrawal. We receive the full surcharge/convenience fee for cash
withdrawal transactions on ATMs that we own, but often we rebate a portion of
the fee to the owner of the ATM location under the applicable lease for the ATM
site. We also receive the full surcharge/convenience fee for cash withdrawal
transactions on ATMs owned by third party vendors included within our network,
but we rebate all or a portion of each fee to the third party vendor based upon
a variety of factors, including transaction volume and the party responsible for
supplying vault cash to the ATM and only record earned revenues based upon the
Company’s contracts with the third party vendors.
In
addition to revenues derived from interchange and surcharge/convenience fees, we
also derive revenues from providing network management services to third parties
owning ATMs included in our ATM network. These services include 24 hour
transaction processing, monitoring and notification of ATM status and cash
condition, notification of ATM service interruptions, in some cases dispatch of
field service personnel for necessary service calls and cash settlement and
reporting services. The fees for these services are paid by the owners of the
ATMs.
Interchange
fees are credited to us by networks and credit card issuers on a monthly basis
and are paid to us in the following month between the 5th and 15th business day.
Surcharge/convenience fees are charged to the cardholder and credited to us by
networks and credit card issuers on a daily basis. We rebate the portion of
these fees to ATM owners and owners of ATM locations as commission payments as
per their contractual terms. Fees for network management services are generally
paid to us on a monthly basis.
Page
26
We
compete in a fragmented industry, in which no one firm has a significant market
share and can strongly influence the industry outcome. Our industry
is populated by a large number of financial institutions and Independent Sales
Organizations (“ISOs”) which deploy ATMs. Our industry is also
characterized by essentially undifferentiated services.
There are
underlying economic causes as to why our industry is fragmented. For
example:
|
|
·
|
Low
overall entry barriers;
|
|
|
·
|
Absence
of national economies of scale;
|
|
|
·
|
Seasonal
and geographic volume fluctuations;
|
|
|
·
|
The
need for local presence in some market segments;
and
|
|
|
·
|
The
need for low overhead.
|
Additionally,
our industry is showing increasing signs of being an industry in
decline. Reasons for this market decline include:
|
|
·
|
Emergence of debit cards, “pay pass” machines
and RFID as substitutes for cash in making
purchases;
|
|
|
·
|
Increasing
acceptance of debit cards by younger demographics;
and
|
|
|
·
|
Market
saturation of prime ATM locations in the United
States.
|
The
demand for our ATM services is primarily a function of population growth and new
business creation to serve that population growth. In addition,
opportunities exist:
|
|
·
|
As
our competitors seek to exit the
business;
|
|
|
·
|
As
our competitors encounter financial and regulatory difficulties;
and
|
|
|
·
|
As
financial institutions seek to reduce their costs of managing an ATM channel during a period of
decreasing ATM usage.
|
Opportunities
may also exist to leverage our existing customer base by selling additional
products and services to them.
Page
27
Results of Continuing
Operations
The
following tables set forth certain consolidated statement of continuing
operations data as a percentage of revenues for the periods
indicated. Percentages may not add due to rounding.
|
For the year ended
|
For the year ended
|
For the year ended
|
||||||||||
|
December 31, 2009
|
December 31, 2008
|
December 31, 2007
|
||||||||||
|
Revenues
|
100.0 | % | 100.0 | % | 100.0 | % | ||||||
|
Cost
of revenues
|
52.6 | % | 55.7 | % | 58.4 | % | ||||||
|
Gross
profit
|
47.4 | % | 44.3 | % | 41.6 | % | ||||||
|
Depreciation
expense
|
5.5 | % | 6.4 | % | 7.1 | % | ||||||
|
Amortization
of intangible merchant contracts
|
3.7 | % | 3.5 | % | 3.3 | % | ||||||
|
Selling,
general and administrative
|
25.3 | % | 23.9 | % | 24.3 | % | ||||||
|
Impairment
of notes receivable
|
0.0 | % | 0.0 | % | 0.0 | % | ||||||
|
Recovery
of bad debts
|
0.0 | % | 0.0 | % | (0.5 | )% | ||||||
|
Stock
compensation expense
|
0.6 | % | 0.7 | % | 0.4 | % | ||||||
|
Total
operating expenses
|
35.1 | % | 34.5 | % | 34.6 | % | ||||||
|
Operating
income from continuing operations before items shown below
|
12.3 | % | 9.8 | % | 7.0 | % | ||||||
|
Interest
expense, net
|
(3.0 | )% | (4.7 | )% | (5.7 | )% | ||||||
|
Gain
on disposal of assets
|
0.0 | % | 0.1 | % | (0.1 | )% | ||||||
|
Loss
on early extinguishment of debt
|
(2.2 | )% | 0.0 | % | 0.0 | % | ||||||
|
Income
tax benefit
|
5.9 | % | 0.0 | % | 0.0 | % | ||||||
|
Income
from continuing operations
|
13.1 | % | 5.3 | % | 1.2 | % | ||||||
|
Income
from discontinued operations
|
0.0 | % | 0.0 | % | 0.8 | % | ||||||
|
Net
income
|
13.1 | % | 5.3 | % | 2.0 | % | ||||||
|
EBITDA
(1)
|
19.3 | % | 19.8 | % | 17.2 | % | ||||||
(1) See
“—EBITDA” below.
Comparison of Results of
Operations for the Fiscal Years Ended December 31, 2009 and
2008
Revenues
Our
revenues from continuing operations decreased 3.0% to $21,494,867 for
the fiscal year ended December 31, 2009 ("fiscal 2009") from $22,171,072 for the
fiscal year ended December 31, 2008 ("fiscal 2008"). This decrease
was partly due to lower transaction volumes resulting from a lost distributor’s
client account whose 90 terminals contributed significant transactions and
revenue yet contributed only several thousand dollars a month in gross
profit. Additionally, lower transaction volumes were experienced
during the summer months of 2009. The Company typically sees an
increase in transaction activity during the summer months, but lower vacation
travel and the slower economy reduced the positive seasonal impact.
Cost of
Revenues
Our total
cost of revenues from continuing operations decreased by approximately 8.4% to
$11,316,919 in fiscal 2009 from $12,347,991 in fiscal
2008. Total cost of revenues as a percentage of revenues from
continuing operations was approximately 52.6% in fiscal 2009 and 55.7% in fiscal
2008. The principal components of cost of revenues are merchant and
distributor commissions, cost of cash, cash replenishment, maintenance,
transaction processing charges, telecommunication costs and equipment costs on
related equipment sales. The decrease in cost of revenues period over
period was achieved mainly due to lower fuel charges resulting in lower first
line and second line maintenance costs, and lower interest rates which resulted
in lower cash costs for fiscal 2009.
Page
28
Gross
Profit
Gross
profit from continuing operations as a percentage of revenues was approximately
47.4% in fiscal 2009 and approximately 44.3% in fiscal 2008. The increased gross
profit and gross profit percentage for the fiscal year ended December 31, 2009
versus the same period in 2008 was mainly attributable to the decreased costs
discussed above.
Operating
Expenses
Our total
operating expenses from continuing operations decreased to $7,522,912, or
approximately 35.1% of revenues, in fiscal 2009 from $7,630,429, or
approximately 34.5% of revenues in fiscal 2008. The principal components of
operating expenses are general and administrative expenses such as professional
and legal fees, administrative salaries and benefits, consulting and audit fees,
occupancy costs, sales and marketing expenses and administrative
expenses. Operating expenses also include depreciation, amortization
of intangible merchant contracts, impairment of notes receivable, recovery of
bad debts and stock compensation expenses.
To aid in
the understanding of our discussion and analysis of our operating expenses, the
following table summarizes the amount and percentage change in the amounts from
the previous year for certain operating expense line items:
|
For the year ended
|
For the year ended
|
2008 to 2009
|
2008 to 2009
|
|||||||||||||
|
December 31, 2009
|
December 31, 2008
|
$ Change
|
% Change
|
|||||||||||||
|
Depreciation
expense
|
$ | 1,178,927 | $ | 1,411,360 | $ | (232,433 | ) | (16.5 | )% | |||||||
|
Amortization
of intangible merchant contracts
|
786,173 | 770,270 | 15,903 | 2.1 | % | |||||||||||
|
Selling,
general and administrative
|
5,437,624 | 5,288,959 | 148,665 | 2.8 | % | |||||||||||
|
Stock
compensation expense
|
120,188 | 159,840 | (39,652 | ) | (24.8 | )% | ||||||||||
|
Total
operating expenses
|
$ | 7,522,912 | $ | 7,630,429 | $ | (107,517 | ) | (1.4 | )% | |||||||
See
explanation of operating expenses below:
Depreciation
Expense
Depreciation
expense from continuing operations decreased in fiscal 2009 to $1,178,927 from
$1,411,360 in fiscal 2008. This decrease in depreciation expense was
mainly due to depreciation savings resulting from refinancing several fair
market value capital leases to bargain price capital leases at the end of the
second quarter of fiscal 2008. This refinancing requires the Company
to depreciate the assets covered under the respective leases over a longer
period of time thus reducing depreciation expense during 2009.
Amortization of Intangible
Merchant Contracts
Amortization
of intangible merchant contracts from continuing operations increased in fiscal
2009 to $786,173 from $770,270 in fiscal 2008. The increase in
amortization expense was mainly due to the additional amortization from the
capitalized merchant contracts relating to newly acquired business in fiscal
2009.
The
Company amortized $0 and $103,884 of developed software in fiscal years 2009 and
2008, respectively.
See
Financial Statement Footnotes #2 “Summary of Significant Accounting Policies”
and #7 “Intangible Assets and Merchant Contracts,” regarding the amortization of
intangible merchant contracts.
Selling, General and
Administrative (SG&A) Expenses
Our total
SG&A expenses from continuing operations increased to $5,437,624 in fiscal
2009 from $5,288,959 in fiscal 2008. SG&A expenses represented
25.3% of revenues for the year ended December 31, 2009 compared to 23.9% of
revenues for the year ended December 31, 2008. The increase in
SG&A expenses for fiscal 2009 was mainly due to expenses incurred in
connection with our DVD rental kiosk initiative, the hiring of an investor
relations firm to promote the company’s stock, and the hiring of an investment
banking firm to evaluate possible merger and acquisitions.
Page
29
Stock Compensation
Expense
In fiscal
2009, we recorded stock compensation expenses of $120,188 mainly relating to
executive stock option grants (see Financial Footnotes #1 “Description of
Business and Basis of Presentation,” #2 “Summary of Significant Accounting
Policies” and # 18 “Stock Options and Warrants”) during fiscal years 2007, 2008
and 2009. During the fiscal year ended December 31, 2008 we recorded
stock compensation expenses of $159,840.
Interest
Expense
Interest
expense from continuing operations decreased to $645,758, or 3.0% of revenues,
for the fiscal year ended December 31, 2009 compared to $1,046,287, or 4.7% of
revenues, in fiscal 2008. The decrease was mainly due to the Company refinancing
its senior debt from interest rates of 9.0% to 6.99% combined with decreased
debt balances in fiscal 2009 as compared to the debt balances in fiscal 2008.
During the fiscal period ended December 31, 2009, we recorded interest income of
$7,921 relating to the change in fair value of an interest rate swap agreement
we entered into with our former senior lender. The interest rate swap
had not been designated as a hedging instrument and our policy is to record the
change in fair value as an increase or decrease to interest expense in our
consolidated statements of income. During the fiscal period ended
December 31, 2008 we recorded interest expense of $40,985 relating to the
interest rate swap agreement.
|
For the year ended
|
For the year ended
|
|||||||
|
December 31, 2009
|
December 31, 2008
|
|||||||
|
Interest
expense, net
|
$ | 595,692 | $ | 880,299 | ||||
|
Accretion
of discount on notes payable
|
50,066 | 165,988 | ||||||
|
Total
Interest expense, net
|
$ | 645,758 | $ | 1,046,287 | ||||
Gain on Sale or Disposal of
Assets
In fiscal
2008, we recorded a gain on disposal of certain ATM assets of
$23,872. This gain related to insurance proceeds from a warehouse
flood in Texas during the summer of 2008.
Loss on early extinguishment
of debt
During
the fiscal 2009, we recorded non-cash expenses of $474,960 relating to the
payoff of debt balances with two senior lenders and related parties
notes. See Financial Footnote #21 “Loss on Early Extinguishment of
Debt” for detail of these charges.
Income Tax
Benefit
The
income tax benefit from continuing operations was $1,278,888 for fiscal year
2009 due to the reversal of a portion of the valuation allowance as the Company
expects to utilize the net operating losses against future taxable income, and
$0 for 2008. At December 31, 2009, the Company has a Net Operating
Loss (“NOL”) carryforward of approximately $22.7 million
available. The NOL is due to expire during fiscal years
2010-2028.
As of
December 31, 2009, 2008 and 2007, the Company’s gross deferred tax assets are
reduced by a valuation allowance of $3,856,880, $4,946,030 and $5,413,703,
respectively, due to negative evidence, primarily previous years operating
losses, indicating that a valuation allowance is required under
GAAP. In assessing the realizability of the deferred tax assets,
management considers whether it is more likely than not, that some portion or
all of the deferred tax assets will not be realized. The valuation
allowance at December 31, 2009 is related to deferred tax assets arising from
net operating loss carryforwards. Management believes that based upon
its projection of future taxable income for the foreseeable future, it is more
likely than not that the Company will not be able to realize the full benefit of
the net operating loss carryforwards before they expire due to
the amortization and depreciation losses from the projected
acquisition assets. During 2009, the Company reduced the valuation
allowance related to the remaining deferred tax assets by approximately
$1,100,000. This reduction reflects the Company’s expectation that it
is more than likely than not that it will generate future taxable income to
utilize this amount of net deferred tax assets. While management’s projection of
future taxable income for the foreseeable future does not provide sufficient
positive evidence that the entire balance of valuation allowance should be
eliminated (as previously mentioned), management does believe it is more likely
than not this $1,100,000 reduction in valuation allowance is substantiated by
its projection of future taxable income. The benefit from this reduction was
recorded as income tax benefit in the accompanying statement of
income.
Page
30
Net
Income
We had
net income of $2,813,206 during the fiscal year ended December 31, 2009 compared
to net income of $1,170,237 for the fiscal year ended December 31,
2008.
EBITDA
EBITDA (a
non-GAAP measure) is defined as earnings before net interest, taxes,
depreciation and amortization. EBITDA has some inherent limitations in measuring
operating performance due to the exclusion of certain financial elements such as
depreciation and is not necessarily comparable to other similarly titled
captions of other companies due to potential inconsistencies in the method of
calculation. Furthermore, EBITDA is not intended to be a substitute for cash
flows from operating activities, as a measure of liquidity, or an alternative to
net income in determining our operating performance in accordance with
accounting principles generally accepted in the United States of America. Our
use of EBITDA should be considered within the following context:
|
|
·
|
We
acknowledge that our depreciable assets are necessary to earn revenue
based on our current business.
|
|
|
·
|
Our
use of EBITDA as a measure of operating performance is not based on our
belief about the reasonableness of excluding depreciation when measuring
financial performance.
|
|
|
·
|
Our
use of EBITDA is supported by the importance of EBITDA to the following
key stakeholders:
|
|
|
·
|
Analysts — who
estimate our projected EBITDA and other EBITDA-based metrics in their
independently developed financial models for
investors;
|
|
|
·
|
Creditors — who
evaluate our operating performance based on compliance with certain
EBITDA-based debt covenants;
|
|
|
·
|
Investment
Bankers — who use EBITDA and other EBITDA-based metrics in their
written evaluations and comparisons of companies within our industry;
and
|
|
|
·
|
Board of Directors and
Executive Management — who use EBITDA as an essential metric for
evaluating management performance relative to our operating budget and
bank covenant compliance, as well as our ability to service debt and raise
capital for growth opportunities which are a critical component to our
strategy.
|
The
following table sets forth a reconciliation of net income from continuing
operations to EBITDA for each period included herein:
|
For the Twelve Months Ended
|
||||||||||||
|
December 31, 2009
|
December 31, 2008
|
December 31, 2007
|
||||||||||
|
Net
income from continuing operations
|
$ | 2,813,206 | $ | 1,170,237 | $ | 255,507 | ||||||
|
Income
tax benefit
|
(1,278,888 | ) | - | - | ||||||||
|
Interest
expense, net
|
645,758 | 1,046,287 | 1,232,661 | |||||||||
|
Depreciation
expense
|
1,178,927 | 1,411,360 | 1,536,616 | |||||||||
|
Amortization
of intangible merchant contracts
|
786,173 | 770,270 | 725,935 | |||||||||
|
EBITDA
from continuing operations
|
$ | 4,145,176 | $ | 4,398,154 | $ | 3,750,719 | ||||||
Our
EBITDA from continuing operations decreased to $4,145,176 for fiscal 2009 from
$4,398,154 for fiscal 2008. EBITDA from continuing operations as a percentage of
revenues decreased to 19.3% for fiscal 2009 from 19.8% for fiscal
2008. The decrease in EBITDA from continuing operations was due to
the loss on early extinguishment of debt charges of $474,960 recorded during
fiscal 2009. See Financial Footnote #21 “Loss on Early Extinguishment
of Debt” for details of the amounts charged to loss on early extinguishment of
debt charges incurred during fiscal 2009.
Page
31
The
following table sets forth a reconciliation of net income from continuing
operations to EBITDA from continuing operations before stock compensation
expense and loss on early extinguishment of debt (“Adjusted
EBITDA”) for each period included herein:
|
For the Twelve Months Ended
|
||||||||||||
|
December 31, 2009
|
December 31, 2008
|
December 31, 2007
|
||||||||||
|
Net
income from continuing operations
|
$ | 2,813,206 | $ | 1,170,237 | $ | 255,507 | ||||||
|
Income
tax benefit
|
(1,278,888 | ) | - | - | ||||||||
|
Interest
expense, net
|
645,758 | 1,046,287 | 1,232,661 | |||||||||
|
Depreciation
expense
|
1,178,927 | 1,411,360 | 1,536,616 | |||||||||
|
Amortization
of intangible merchant contracts
|
786,173 | 770,270 | 725,935 | |||||||||
|
Stock
compensation expense
|
120,188 | 159,840 | 87,181 | |||||||||
|
Loss
on early extinguishment of debt
|
474,960 | - | - | |||||||||
|
Adjusted
EBITDA
|
$ | 4,740,324 | $ | 4,557,994 | $ | 3,837,900 | ||||||
Our
Adjusted EBITDA from continuing operations increased to $4,740,324 for fiscal
2009 from $4,557,994 for fiscal 2008. Adjusted EBITDA from continuing operations
as a percentage of revenues increased to 22.1% for fiscal 2009 from 20.6% for
fiscal 2008.
LIQUIDITY
AND CAPITAL RESOURCES
Financial
Condition
|
For the year ended
|
For the year ended
|
2008 to 2009
|
2008 to 2009
|
|||||||||||||
|
December 31, 2009
|
December 31, 2008
|
$ Change
|
% Change
|
|||||||||||||
|
Net
cash provided by operating activities
|
$ | 4,444,097 | $ | 2,979,341 | $ | 1,464,756 | 49.2 | % | ||||||||
|
Net
cash used in investing activities
|
(1,172,154 | ) | (261,381 | ) | (910,773 | ) | 348.4 | % | ||||||||
|
Net
cash used in financing activities
|
(2,824,993 | ) | (1,697,211 | ) | (1,127,782 | ) | 66.4 | % | ||||||||
|
Increase
in cash
|
$ | 446,950 | $ | 1,020,749 | $ | (573,799 | ) | |||||||||
Operating
Activities
During
fiscal 2009, we funded our continuing operations through operating activities.
Net cash provided by continuing operating activities amounted to $4,444,097 as
compared to $2,979,341 during fiscal 2008, an increase of 49.2%.
Investing
Activities
Net cash
used in investing activities from continuing operations for fiscal 2009 was
$1,172,154. The increase from the $261,381 used for fiscal 2008 was
due to the ATM purchases associated with new contracts signed in 2009 and was
also due to DVD rental kiosk purchases associated with Company’s DVD rental
kiosks initiative.
Financing
Activities
Net cash
used in financing activities for continuing operations for fiscal 2009 amounted
to $2,824,993, mainly relating to principal payments on senior lenders’ notes
payable and capital lease obligations and depositing $800,000 into a restricted
cash deposit account with SunTrust Bank per the credit and security agreement
signed on March 27, 2009.
Working
Capital
As of
December 31, 2009, the Company had current assets of $4,411,839 and current
liabilities of $5,775,913, which results in negative working capital of
$1,364,074. This compares to a working capital deficit of $471,787
that existed at December 31, 2008. During fiscal 2009, the Company
refinanced debt through notes with SunTrust Bank (see Financial Footnote # 11
“Senior Lenders’ Notes Payable”.) The refinancing of this debt
eliminated the CAMOFI Master and Wachovia Bank loans and eliminated the balloon
payments for this debt. As a result of the new financing, the amortization of
these loans was not reflected in the balance sheet last year, hence 2009 working
capital shows a greater deficit. Despite the negative working
capital, we believe that if we achieve our 2010 business plan, we will have
sufficient working capital to meet our current obligations during
2010. However, we do anticipate the need to raise capital lease
financing to meet our capital needs of approximately $2,500,000 to expand our
ATM and DVD kiosk portfolio and fund new back office equipment during
2010.
Page
32
Additional Funding
Sources
We are
continuing our efforts to raise additional capital lease
financing. We estimate the Company will require approximately
$2,500,000 of new lease financing to fund new purchases of ATMs, DVD kiosks and
back office equipment. We currently have lease and bank lines
available for these new purchases.
The
Company does not use its own funds for vault cash, but rather relies upon third
party sources. The Company in general rents the vault cash from financial
institutions and pays a negotiated interest rate for the use of the money. The
vault cash is never in the possession of, controlled or directed by the Company,
but rather cycles from the bank to the armored car carrier and to the ATM. Each
day’s withdrawals are settled back to the owner of the vault cash on the next
business day. Both Nationwide and its customers (the merchants) sign a document
stating that the vault cash belongs to the financial institution and that
neither party has any legal rights to the funds. The required vault cash is
obtained under the following arrangements:
|
|
·
|
Wilmington
Savings Fund Society. Beginning in September 2004, the Company has
an arrangement with Wilmington Savings Fund Society allowing us to obtain
up to $20,000,000 in vault cash. The WSFS contract may be
terminated by WSFS at any time upon breach by us and upon the occurrence
of certain other events. Under this arrangement, we are required to pay a
monthly service fee on the outstanding amount equal to the prime rate of
interest, plus a specified percentage, and must pay monthly "bank" and
insurance fees. We are also required to maintain insurance on the vault
cash. The contract currently in place with WSFS expires on October 31,
2010, with a one year automatic renewal period unless one party gives 60
days notice of their intention not to renew. As of December 31,
2009, the Company had 11 ATMs funded by WSFS with a vault cash outstanding
balance of approximately $215,000 in connection with this
arrangement.
|
|
|
·
|
Elan
(formerly GenPass Technologies). On November 24, 2006,
we signed a Cash Provisioning Agreement with Elan allowing us to obtain up
to $30,000,000 in vault cash. The Elan contract may be
terminated by Elan at any time upon breach by us and upon the occurrence
of certain other events. Under this arrangement, we are
required to pay a monthly service fee on the average terminal balance plus
a load factor. In addition, we are required to maintain
insurance on the vault cash. The contract currently in place
with Elan expires on August 11, 2010, with a one year automatic renewal
period unless one party gives 180 days notice of their intention not to
renew. As of December 31, 2009, the Company had 1,316 ATMs
funded by Elan with a vault cash outstanding balance of about
approximately $27,310,130.
|
|
|
·
|
Various
Branded Cash Partners. Nationwide has partnered with
numerous banks and credit unions to market specific Nationwide ATMs to the
cardholders of these institutions. We add signage and marketing
material to the ATM so that the ATM is easily identified as being
associated with the bank or credit union, and the cardholders of these
institutions receive surcharge free transactions at the designated
ATMs. This provides the bank or credit union additional
marketing power and another point of access to funds for their
cardholders. In return for this benefit, the bank or credit
union, provide and manage the vault cash in the specified ATM(s), as well
as provide and pay for cash replenishment and first line
maintenance. The advantage to Nationwide is that this reduces
the costs associated with vault cash, cash replenishment and first line
maintenance by approximately 50%. Another advantage is that
with a branded ATM, transactions volumes traditionally increase more than
at non-branded ATMs. As of December 31, 2009, Nationwide had 53
branded financial partners, which funded 512
ATMs.
|
Contractual
Obligations
Our
ability to fund our capital needs is also impacted by our overall capacity to
acquire favorable financing terms in our acquisition of ATMs. Our contractual
obligations, including commitments for future payments under non-cancelable
lease arrangements and short and long-term debt arrangements, are summarized
below and are fully disclosed in Financial Footnotes #9 “Notes Payable – Related
Parties”, #11 “Senior Lenders’ Notes Payable,” #12 “Capital Lease Obligations”
and #13 “Commitments and Contingencies” to our consolidated financial
statements. We do not participate in, nor secure financings for, any
unconsolidated, limited or special purpose entities.
Page
33
We
anticipate that our capital expenditures for fiscal 2010 will total
approximately $2,500,000, primarily for the acquisition of ATMs and DVD rental
kiosks and related installation costs. We lease our kiosks under capital lease
agreements that expire in 2012 and provide for lease payments at interest rates
averaging approximately 9.8% per annum. In 2009, we acquired approximately
$663,500 of new lease financing for ATMs. Also, we acquired
approximately $69,900 of auto financing for two trucks for our
technicians. See Financial Footnote #12 “Capital Lease Obligations”
to our consolidated financial statements. We have the following payment
obligations under current financing and leasing arrangements:
|
Total
|
Less than 1 year
|
1-2 Years
|
2-9 Years
|
|||||||||||||
|
Notes
payable- related parties (*)
|
$ | 118,005 | $ | 36,000 | $ | 36,000 | $ | 46,005 | ||||||||
|
Notes
payable (*)
|
112,509 | 27,601 | 27,601 | 57,307 | ||||||||||||
|
Senior
lender notes (*)
|
5,600,265 | 2,107,837 | 1,988,140 | 1,504,288 | ||||||||||||
|
Capital
lease obligations (*)
|
1,087,972 | 736,806 | 314,178 | 36,988 | ||||||||||||
|
Operating
leases
|
321,491 | 124,787 | 114,794 | 81,910 | ||||||||||||
|
Total
contractual cash obligations
|
$ | 7,240,242 | $ | 3,033,031 | $ | 2,480,713 | $ | 1,726,498 | ||||||||
(*)
Includes interest in future periods
Critical Accounting
Policies
The
preparation of financial statements and related disclosures in conformity with
accounting principles generally accepted in the United States of America
requires management to make judgments, assumptions and estimates that affect the
amounts reported in our consolidated financial statements and accompanying
notes. We base our estimates and judgments on historical experience and various
other assumptions that we believe are reasonable under the circumstances.
However, future events are subject to change, and the best estimates and
judgments routinely require adjustment. The amounts of assets and liabilities
reported in our consolidated balance sheet, and the amounts of revenues and
expenses reported for each of our fiscal periods, are affected by estimates and
assumptions that are used for, but not limited to, the accounting for allowance
for doubtful accounts, depreciation and amortization, fixed assets, goodwill and
intangible asset impairments, stock-based compensation, restructurings and
income taxes. Actual results could differ from these estimates. The following
critical accounting policies are significantly affected by judgments,
assumptions and estimates used in the preparation of our consolidated financial
statements.
Revenue Recognition
Policies
We
recognize revenues as ATM card holders use ATMs or as services are rendered to
customers. Revenues are adjusted with positive and negative
processing accruals occurring in the operation of the Company's ATM network in
the ordinary course of business. It is our policy to book as revenue all
surcharge and interchange fees we receive and have earned based on contracts,
whether for company-owned ATMs or for those we manage. In the case of managed
ATMs, the Company then books as commission expense all monies paid to the owners
of the ATMs. Surcharge/convenience fees are fees assessed directly to the
consumer utilizing the ATM terminals owned by the Company. The
surcharge/convenience fees assessed mostly range from $1.50 to $2.75 based upon
a cash withdrawal transaction from the ATM terminals.
Interchange
fees are fees assessed directly to the card issuer of the
consumer. The interchange fees are comprised of two fees: (1) an
interchange fee ranging from approximately $0.40 to $0.55 based upon each cash
withdrawal transaction; and (2) an interchange fee ranging from approximately
$0.15 to $0.25 based upon an account inquiry by the consumer.
Management
fees are charged and recognized monthly to various companies or individuals that
use the services of Nationwide to operate their ATMs. These fees are for
services such as cash management, project management and account
management.
The
Company recognizes revenues on breached contracts when cash is
received.
DVD
revenue is recognized during the term of a customer’s rental transaction or
purchase, and is recorded net of applicable sales taxes.
Page
34
Allowance of Uncollectible
Accounts Receivable
Accounts
receivable have been reduced by an allowance for amounts that may become
uncollectible in the future. This estimated allowance is based on historical
experience, credit evaluations, specific customer collection issues and the
length of time a receivable is past due. The Company records an
allowance for doubtful accounts for any billed invoice aged past 60 days. When
the Company deems the receivable to be uncollectible, the Company charges the
receivable against the allowance for doubtful accounts.
Fixed
assets
ATM and
computer equipment comprises a significant portion of our total assets. Changes
in technology or changes in our intended use of these assets may cause the
estimated period of use or the value of these assets to change. We perform
annual internal studies to confirm the appropriateness of estimated economic
useful lives for each category of current equipment. Estimates and assumptions
used in setting depreciable lives require significant judgment.
Stock-based
compensation
Effective
January 1, 2006, the Company adopted the fair value recognition provisions of
GAAP, using the modified-prospective-transition method which required us to
recognize compensation expense on a prospective basis. GAAP requires that all
stock based compensation be recognized as an expense in the financial statements
and that such cost be measured at the fair value of the award. The stock based
compensation expense is included in operating expenses in the consolidated
statements of income.
Impairment of Long-Lived
Assets
The
Company reviews long-lived assets for impairment under
GAAP. Long-lived assets to be held and used are reviewed for
impairment whenever events or changes in circumstances indicate that the
carrying amount of an asset may not be recoverable. The carrying
amount of a long-lived asset is not recoverable if it exceeds the estimated sum
of the undiscounted cash flows expected to result from the use and eventual
disposition of the asset. Long-lived assets to be disposed of are
reported at the lower of carrying amount or fair value less cost to
sell.
Deferred Income Tax
Assets
The
Company had net deferred tax assets of approximately $1,682,466 at December 31,
2009. Deferred tax assets and liabilities are recognized for the future tax
consequences attributable to differences between financial statement carrying
amounts of existing assets and liabilities and their respective tax bases.
Deferred tax assets and liabilities are measured using enacted tax rates
expected to be applied to taxable income in the years in which those temporary
differences are expected to be recovered or settled.
The
ultimate realization of the deferred income tax assets are primarily dependent
on generating sufficient future taxable income or being able to carryback any
taxable losses and claim refunds against previously paid income taxes. The
Company has had taxable income for the last three years and believes a portion
of its net deferred income tax assets at December 31, 2009, are realizable. If
future operating results generate taxable losses, it may be necessary to
increase valuation allowances to reduce the amount of the deferred income tax
assets to realizable value.
Recent Accounting
Pronouncements
See
Financial Footnotes #2 “Summary of Significant Accounting Policies” regarding
the impact of recently issued accounting pronouncements.
Page
35
ITEM
7A. QUANTITATIVE AND QUALITATIVE
DISCLOSURES ABOUT MARKET RISK
Impact
of Inflation and Changing Prices. Our results of operations were impacted
by decreasing interest rates as noted below:
Increases
in interest rates will increase our cost of cash expenses. We have
vault cash agreements with various financial institutions that supply cash to
our ATMs for fees based on variable interest rates. Vault cash obtained under
these programs remains the property of the financial institution and, as such,
is not reflected on our consolidated balance sheet. During 2009, amounts we
accessed each month ranged from $23 million to $28 million and we paid cash
fees for the fiscal year totaling approximately $515 thousand for use of the
cash. During 2008, amounts we accessed each month ranged from $19.0 million to
$23.0 million and we paid cash fees totaling approximately $800 thousand
for use of the cash. Such fees are related to the bank’s interest rates. If such
rates were to increase by 100 basis points, our gross profit would decline by
approximately $200,000 on a pre-tax basis for 2009 and 2008. If
such rates were to decrease by 100 basis points, our gross profit would increase
by approximately $200,000.
Interest
Rate Impact. We paid an average interest rate of approximately 2.04% for
our vault cash fees in fiscal 2009 compared to an average interest rate of 3.94%
in fiscal 2008. Specific to this decrease in interest rates,
our gross profit increased in fiscal 2009 by approximately
$285,000.
Page
36
ITEM
8. FINANCIAL STATEMENTS AND
SUPPLEMENTARY DATA
Our
consolidated financial statements required by this item are incorporated herein
by reference to the consolidated financial statements beginning on Page F-1
immediately following the signature page.
|
|
ITEM
9.
|
CHANGES IN AND
DISAGREEMENTS WITH ACCOUNTANTS ON ACCOUNTING AND FINANCIAL
DISCLOSURE
|
None.
ITEM
9A. CONTROLS AND
PROCEDURES
Not
applicable.
ITEM
9A(T). CONTROLS AND
PROCEDURES
Evaluation of Disclosure
Controls and Procedures and Changes in Internal Control over Financial
Reporting
Our
management, with the participation of our chief executive officer and chief
financial officer, evaluated the effectiveness of our disclosure controls and
procedures (as defined in Rules 13a-15(e) and 15d-15(e) under the Exchange Act)
as of December 31, 2009. In designing and evaluating our disclosure controls and
procedures, management recognized that any controls and procedures, no matter
how well designed and operated, can provide only reasonable assurance of
achieving their objectives and management necessarily applied its judgment in
evaluating the cost-benefit relationship of possible controls and procedures.
Based on this evaluation, our chief executive officer and chief financial
officer concluded that, as of December 31, 2009, our disclosure controls and
procedures were (1) effective in that they were designed to ensure that material
information relating to us is made known to our chief executive officer and
chief financial officer by others within the Company, as appropriate to allow
timely decisions regarding required disclosures, and (2) effective in that they
provide that information required to be disclosed by us in our reports that we
file or submit under the Exchange Act is recorded, processed, summarized and
reported within the time periods specified in the SEC’s rules and
forms.
Management’s Responsibility
for Financial Statements
Our
management is responsible for the integrity and objectivity of all information
presented in this Annual Report on Form 10-K. The consolidated financial
statements were prepared in conformity with accounting principles generally
accepted in the United States of America and include amounts based on
management’s best estimates and judgments. Management believes the consolidated
financial statements fairly reflect the form and substance of transactions and
that the financial statements fairly represent the Company’s financial position
and results of operations.
The Audit
Committee of the Board of Directors, which is composed solely of independent
directors, meets regularly with the Company’s independent registered public
accounting firm and representatives of management to review accounting,
financial reporting, internal control and audit matters, as well as the nature
and extent of the audit effort. The Audit Committee is responsible for the
engagement of the independent registered public accounting firm. The independent
registered public accounting firm has free access to the Audit
Committee.
Management’s Report on
Internal Control Over Financial Reporting
Management
of the Company is responsible for establishing and maintaining adequate internal
control over financial reporting and for the assessment of the effectiveness of
internal controls over financial reporting. The Company's internal control
system over financial reporting is a process designed under the supervision of
the Company's chief executive officer and chief financial officer to provide
reasonable assurance regarding the reliability of financial reporting and the
preparation of the consolidated financial statements in accordance with U.S.
generally accepted accounting principles.
The
Company’s management, including its principal executive officer and principal
financial officer, conducted an evaluation of the effectiveness of its internal
control over financial reporting based on the framework in “Internal
Control-Integrated Framework” issued by the Committee of Sponsoring
Organizations of the Treadway Commission. Based on its evaluation
under the framework in “Internal Control-Integrated Framework,” the Company’s
management concluded that the Company’s internal control over financial
reporting was effective as of December 31, 2009.
Page
37
All
internal control systems, no matter how well designed, have inherent
limitations. Therefore, even those systems determined to be effective can
provide only reasonable assurance with respect to financial statement
preparation and presentation. Also, projections of any evaluation of
effectiveness to future periods are subject to the risk that controls may become
inadequate because of changes in conditions.
This
annual report does not include an attestation report of the Company's registered
public accounting firm regarding internal control over financial
reporting. Management's report was not subject to attestation by the
Company's registered public accounting firm pursuant to temporary rules of the
SEC that permit the company to provide only management's report in this annual
report.
Changes
in Internal Control Over Financial Reporting
There
were no changes during the quarter ended December 31, 2009 in our internal
control over financial reporting or in other factors that materially affected,
or are reasonably likely to materially affect, our internal controls over
financial reporting.
ITEM
9B. OTHER
INFORMATION
None.
PART
III
ITEM
10. DIRECTORS, EXECUTIVE
OFFICERS AND CORPORATE GOVERNANCE
The
information required by this item is incorporated by reference to the definitive
proxy statement to be filed pursuant to Regulation 14A of the Exchange Act for
our 2010 Annual Meeting of Stockholders.
ITEM
11. EXECUTIVE
COMPENSATION
The
information required by this item is incorporated by reference to the definitive
proxy statement to be filed pursuant to Regulation 14A of the Exchange Act for
our 2010 Annual Meeting of Stockholders.
ITEM
12. SECURITY OWNERSHIP OF
CERTAIN BENEFICIAL OWNERS AND MANAGEMENT AND RELATED STOCKHOLDER
MATTERS
The
information required by this item is incorporated by reference to the definitive
proxy statement to be filed pursuant to Regulation 14A of the Exchange Act for
our 2010 Annual Meeting of Stockholders.
ITEM
13. CERTAIN RELATIONSHIPS AND
RELATED TRANSACTIONS, AND DIRECTOR INDEPENDENCE
The
information required by this item is incorporated by reference to the definitive
proxy statement to be filed pursuant to Regulation 14A of the Exchange Act for
our 2010 Annual Meeting of Stockholders.
ITEM
14. PRINCIPAL ACCOUNTING FEES
AND SERVICES
The
information required by this item is incorporated by reference to the definitive
proxy statement to be filed pursuant to Regulation 14A of the Exchange Act for
our 2010 Annual Meeting of Stockholders.
Page
38
PART
IV
ITEM
15. EXHIBIT, FINANCIAL STATEMENT
SCHEDULES
(a) INDEX
TO EXHIBITS
|
Exhibit
Number
|
Exhibit Description
|
|
|
3.1
|
Articles
of Incorporation – Restated and Amended May 30, 2001(incorporated by
reference to form 10-KSB filed with the SEC on March 31,
2003).
|
|
|
3.2
|
ByLaws
of Global Axcess Corp – As Amended (incorporated by reference to Form
10-KSB filed with the SEC on March 31, 2003).
|
|
|
3.3
|
Amendment
to the Articles of Incorporation (incorporated by reference to Form 8-K
filed with the SEC on May 3, 2005).
|
|
|
4.1
|
Securities
Purchase Agreement dated October 27, 2005 entered by and between the
Company and the Investor (incorporated by reference to Form 8-K filed with
the SEC on November 1, 2005).
|
|
|
4.2
|
Common
Stock Purchase Warrant dated October 27, 2005 issued by the Company to the
Investor (incorporated by reference to Form 8-K filed with the SEC on
November 1, 2005).
|
|
|
4.3
|
Registration
Rights Agreement dated October 27, 2005 entered by and between the Company
and the Investor (incorporated by reference to Form 8-K filed with the SEC
on November 1, 2005).
|
|
|
4.4
|
Subsidiary
Guarantee dated October 27, 2005 (incorporated by reference to Form 8-K
filed with the SEC on November 1, 2005).
|
|
|
4.5
|
Security
Agreement dated October 27, 2005 entered by and between the Company and
the Investor (incorporated by reference to Form 8-K filed with the SEC on
November 1, 2005).
|
|
|
10.1
|
Agreement
entered into with Food Lion, LLC and Nationwide Money Services, Inc dated
October 5, 2001 (incorporated by reference to form 10KSB filed with the
SEC on April 16, 2002).
|
|
|
10.2
|
Distributor
ATM Processing Agreement between Nationwide Money Services and Genpass
Technologies LLC dated December 15, 2005 (incorporated by reference to
Form 8-K filed with the SEC on December 20, 2005).
|
|
|
10.3
|
Cash
Provisioning Agreement, dated November 24, 2006, by and between Genpass
Technologies, LLC and Nationwide Money Services, Inc. (incorporated by
reference to Form 8-K filed February 1, 2007).
|
|
|
10.4
|
Office
Lease with Surburban Owner LLC (incorporated by reference to Form 8-K
filed March 27, 2007).
|
|
|
10.5
|
Net
Enterprise Value Special Transaction Plan (incorporated by reference to
Form 8-K filed June 14, 2007) (Management compensation plan or
arrangement).
|
|
|
10.6
|
Shareholder
Agreement with Industrial Electronic Investments Limited for sale of Cash
Axcess Corporations (Proprietary) Limited (incorporated by reference to
Form 8-K filed with the SEC on October 17, 2006).
|
|
|
10.7
|
Separation
Agreement and Release by and between the Company and Michael Dodak
(incorporated by reference to Form 8-K filed October 11,
2006).
|
Page
39
|
Exhibit
Number
|
Exhibit Description
|
|
|
10.8
|
Separation
Agreement and Release by and between the Company and David Fann
(incorporated by reference to Form 8-K filed October 11,
2006).
|
|
|
10.9
|
Employment
Agreement dated July 1, 2008 by and between the Company and George McQuain
(incorporated by reference to Form 8-K filed July 2, 2008) (Management
compensation plan or arrangement).
|
|
|
10.10
|
Director
Compensation Arrangements (incorporated by reference to Form 10-Q filed
August 7, 2008) (Management compensation plan or
arrangement).
|
|
|
10.11
|
Settlement
Agreement, effective as of August 12, 2008, between the Company and CAMOFI
Master LDC (incorporated by reference to Form 8-K filed August 18,
2008).
|
|
|
10.12
|
First
Modification to Settlement Agreement, dated November 6, 2008, between the
Company and CAMOFI Master LDC (incorporated by reference to Form 8-K filed
November 10, 2008).
|
|
|
10.13
|
2002
Stock Incentive Plan (incorporated by reference to Form S-8 filed December
10, 2003).
|
|
|
10.14
|
First
Amendment to 2002 Stock Incentive Plan (incorporated by reference to Form
10-K filed March 3, 2009).
|
|
|
10.15
|
2004
Stock Incentive Plan (incorporated by reference to Form S-8 filed June 25,
2004).
|
|
|
10.16
|
First
Amendment to 2004 Stock Incentive Plan. (incorporated by reference to Form
10-K filed March 3, 2009).
|
|
|
10.17
|
Mediated
Settlement Agreement, dated January 22, 2009, by and between the Company
and Sidney Michael Cole (incorporated by reference to Form 10-K filed
March 3, 2009) (This agreement has been redacted pursuant to a
confidential treatment request filed with the SEC on the date
hereof).
|
|
|
10.18
|
Settlement
Agreement, effective as of March 17, 2009, between Global Axcess Corp and
CAMOFI Master LDC (incorporated by reference to Form 8-K filed March 23,
2009).
|
|
|
10.19
|
Credit
and Security Agreement, dated as of March 27, 2009, by and among Global
Axcess Corp and SunTrust bank (incorporated by reference to Form 8-K file
March 30, 2009).
|
|
|
10.20
|
Promissory
Note, dated March 27, 2009, issued by Global Axcess Corp to SunTrust Bank
(incorporated by reference to Form 8-K filed March 30,
2009).
|
|
|
10.21
|
Credit
and Security Agreement, dated as of December 23, 2009, by and among Global
Axcess Corp and SunTrust Bank (incorporated by reference to Form 8-K filed
December 30, 2009).
|
|
|
10.22
|
Promissory
Note, dated December 23, 2009, issued by Global Axcess Corp to SunTrust
Bank (incorporated by reference to Form 8-K filed December 30,
2009).
|
|
|
10.23
|
Loan
and Security Agreement, dated December 29, 2009, by Global Axcess Corp to
Proficio Bank (incorporated by reference to Form 8-K filed December 30,
2009).
|
|
|
10.24
|
Master
Non-Revolving Line of Credit Note, dated December 29, 2009, issued by
Global Axcess Corp to Proficio Bank (incorporated by reference to Form 8-K
filed December 30,
2009).
|
Page
40
|
Exhibit
Number
|
Exhibit Description
|
|
|
21.1
|
List
of Subsidiaries:
Nationwide
Money Services, Inc., a Nevada corporation
Nationwide
Ntertainment Services, Inc., a Nevada corporation
EFT
Integration, Inc., a Florida corporation
|
|
|
23.1
|
Consent
of Kirkland, Russ, Murphy & Tapp, P.A.
|
|
|
31.1
|
Certification
of the Chief Executive Officer of Global Axcess Corp pursuant to Section
302 of the Sarbanes-Oxley Act of 2002.
|
|
|
31.2
|
Certification
of the Chief Financial Officer of Global Axcess Corp pursuant to Section
302 of the Sarbanes-Oxley Act of
2002.
|
Page
41
SIGNATURES
Pursuant
to the requirements of the Securities Exchange Act of 1934, as of March 2, 2010
the Registrant has duly caused this report to be signed on its behalf by the
undersigned, thereunto duly authorized.
|
GLOBAL
AXCESS CORP
|
||
|
By:
|
/s/
George A. McQuain
|
|
|
George
A. McQuain
|
||
|
President
and Chief Executive Officer
|
Pursuant
to the requirements of the Securities Exchange Act of 1934, this report has been
signed below by the following persons on behalf of the Registrant and in the
capacities indicated on March 2, 2010.
|
Signature
|
Title
|
||
|
/S/
Walter A. Howell
|
|||
|
Walter
A. Howell
|
Director
|
||
|
/S/
Lock Ireland
|
|||
|
Lock
Ireland
|
Vice
Chairman and Director
|
||
|
/S/
Robert Landis
|
|||
|
Robert
Landis
|
Director
|
||
|
/S/
Michael J. Loiacono
|
|||
|
Michael
J. Loiacono
|
Chief
Financial Officer and Chief Accounting Officer
|
||
|
/S/
Joseph Loughry
|
|||
|
Joseph
Loughry
|
Chairman
and Director
|
||
|
/s/George
A. McQuain
|
|||
|
George
A. McQuain
|
President,
CEO and Director
|
||
|
/S/
Alan Rossiter
|
|||
|
Alan
Rossiter
|
Director
|
Page
42
GLOBAL
AXCESS CORP AND SUBSIDIARIES
CONSOLIDATED
FINANCIAL STATEMENTS
TABLE
OF CONTENTS
|
PAGE NO.
|
||
|
Report
of Independent Registered Public Accounting Firm
|
1
|
|
|
Consolidated
financial statements
|
||
|
Consolidated
balance sheets as of December 31, 2009 and 2008
|
2
|
|
|
Consolidated
statements of income for the years ended December 31, 2009, 2008 and
2007
|
3
|
|
|
Consolidated
statements of stockholders’ equity for the years ended December 31, 2009,
2008 and 2007
|
4
|
|
|
Consolidated
statements of cash flows for the years ended December 31, 2009, 2008 and
2007
|
5
|
|
|
Notes
to consolidated financial statements as of December 31,
2009
|
7
|
Page
43
Report Of
Independent Registered Public Accounting Firm
Board of
Directors and Stockholders of
Global
Axcess Corp:
We have
audited the accompanying consolidated balance sheets of Global Axcess Corp and
Subsidiaries as of December 31, 2009 and 2008 and the related consolidated
statements of income, stockholders’ equity and cash flows for the years ended
December 31, 2009, 2008 and 2007. These consolidated financial statements are
the responsibility of the Company’s management. Our responsibility is to express
an opinion on these consolidated financial statements based on our
audits.
We
conducted our audits in accordance with the standards of the Public Company
Accounting Oversight Board (United States). Those standards require that we plan
and perform the audit to obtain reasonable assurance about whether the
consolidated financial statements are free of material misstatement. The Company
is not required to have, nor were we engaged to perform, an audit of its
internal control over financial reporting. Our audit included consideration of
internal control over financial reporting as a basis for designing audit
procedures that are appropriate in the circumstances, but not for the purpose of
expressing an opinion on the effectiveness of the Company’s internal control
over financial reporting. Accordingly, we express no such opinion. An audit
includes examining, on a test basis, evidence supporting the amounts and
disclosures in the consolidated financial statements. An audit also includes
assessing the accounting principles used and significant estimates made by
management, as well as evaluating the overall financial statement presentation.
We believe that our audits provide a reasonable basis for our
opinion.
In our
opinion, the consolidated financial statements referred to above present fairly,
in all material respects, the consolidated financial position of Global Axcess
Corp and Subsidiaries as of December 31, 2009 and 2008 and the results of its
operations and its cash flows for the years ended December 31, 2009, 2008 and
2007 in conformity with accounting principles generally accepted in the United
States of America.
|
/s/
KIRKLAND, RUSS, MURPHY & TAPP, P.A.
|
|
Certified
Public Accountants
|
|
Clearwater,
Florida
|
|
March
2, 2010
|
1
GLOBAL
AXCESS CORP AND SUBSIDIARIES
CONSOLIDATED
BALANCE SHEETS
|
As of December 31,
|
||||||||
|
2009
|
2008
|
|||||||
|
ASSETS
|
||||||||
|
Current
assets
|
||||||||
|
Cash
and cash equivalents
|
$ | 2,007,860 | $ | 1,560,910 | ||||
|
Automated
teller machine vault cash
|
250,000 | - | ||||||
|
Accounts
receivable, net of allowance of $12,616 in 2009 and $9,799 in
2008
|
845,000 | 848,373 | ||||||
|
Inventory,
net of allowance for obsolescence of $94,572 in 2009 and $54,033 in
2008
|
308,031 | 276,731 | ||||||
|
Deferred
tax asset - current
|
868,848 | 615,332 | ||||||
|
Prepaid
expenses and other current assets
|
132,100 | 164,968 | ||||||
|
Total
current assets
|
4,411,839 | 3,466,314 | ||||||
|
Fixed
assets, net
|
5,299,661 | 4,723,138 | ||||||
|
Other
assets
|
||||||||
|
Merchant
contracts, net
|
10,665,613 | 11,331,126 | ||||||
|
Intangible
assets, net
|
4,095,911 | 4,118,426 | ||||||
|
Deferred
tax asset - non-current
|
813,618 | - | ||||||
|
Restricted
cash
|
800,000 | - | ||||||
|
Other
assets
|
30,307 | 9,232 | ||||||
|
Total
assets
|
$ | 26,116,949 | $ | 23,648,236 | ||||
|
LIABILITIES
AND STOCKHOLDERS' EQUITY
|
||||||||
|
Current
liabilities
|
||||||||
|
Accounts
payable and accrued liabilities
|
$ | 2,983,583 | $ | 2,527,396 | ||||
|
Automated
teller machine vault cash payable
|
250,000 | - | ||||||
|
Notes
payable - related parties - current portion,
net
|
26,722 | 24,010 | ||||||
|
Notes
payable - current portion
|
19,803 | - | ||||||
|
Senior
lenders' notes payable - current portion, net
|
1,828,572 | 606,705 | ||||||
|
Capital
lease obligations - current portion
|
667,233 | 779,990 | ||||||
|
Total
current liabilities
|
5,775,913 | 3,938,101 | ||||||
|
Long-term
liabilities
|
||||||||
|
Notes
payable - related parties - long-term portion, net
|
72,690 | 1,304,595 | ||||||
|
Notes
payable - long-term portion
|
73,120 | - | ||||||
|
Senior
lenders' notes payable - long-term portion, net
|
3,300,000 | 4,240,086 | ||||||
|
Capital
lease obligations - long-term portion
|
329,314 | 425,582 | ||||||
|
Deferred
tax liability- long-term portion
|
- | 275,532 | ||||||
|
Total
liabilities
|
9,551,037 | 10,183,896 | ||||||
|
Stockholders'
equity
|
||||||||
|
Preferred
stock; $0.001 par value; 5,000,000 shares authorized, no shares issued and
outstanding
|
- | - | ||||||
|
Common
stock; $0.001 par value; 45,000,000 shares authorized, 21,931,786 and
21,021,786 shares issued and 21,883,924 and 20,973,924 shares outstanding
at 12/31/09 and 12/31/08, respectively
|
21,932 | 21,022 | ||||||
|
Additional
paid-in capital
|
22,900,880 | 22,613,424 | ||||||
|
Accumulated
deficit
|
(6,344,934 | ) | (9,158,140 | ) | ||||
|
Treasury
stock; 47,862 shares of common stock at cost
|
(11,966 | ) | (11,966 | ) | ||||
|
Total
stockholders' equity
|
16,565,912 | 13,464,340 | ||||||
|
Total
liabilities and stockholders' equity
|
$ | 26,116,949 | $ | 23,648,236 | ||||
See
Accompanying Independent Registered Public Accounting Firm’s Report and Notes to
Consolidated Financial Statements
2
GLOBAL
AXCESS CORP AND SUBSIDIARIES
CONSOLIDATED
STATEMENTS OF INCOME
|
For the Fiscal Years Ended December
31,
|
||||||||||||
|
2009
|
2008
|
2007
|
||||||||||
|
Revenues
|
$ | 21,494,867 | $ | 22,171,072 | $ | 21,750,897 | ||||||
|
Cost
of revenues
|
11,316,919 | 12,347,991 | 12,705,636 | |||||||||
|
Gross
profit
|
10,177,948 | 9,823,081 | 9,045,261 | |||||||||
|
Operating
expenses
|
||||||||||||
|
Depreciation
expense
|
1,178,927 | 1,411,360 | 1,536,616 | |||||||||
|
Amortization
of intangible merchant contracts
|
786,173 | 770,270 | 725,935 | |||||||||
|
Selling,
general and administrative
|
5,437,624 | 5,288,959 | 5,279,101 | |||||||||
|
Impairment
of notes receivable
|
- | - | 5,743 | |||||||||
|
Recovery
of bad debts
|
- | - | (100,000 | ) | ||||||||
|
Stock
compensation expense
|
120,188 | 159,840 | 87,181 | |||||||||
|
Total
operating expenses
|
7,522,912 | 7,630,429 | 7,534,576 | |||||||||
|
Operating
income from continuing operations before items shown below
|
2,655,036 | 2,192,652 | 1,510,685 | |||||||||
|
Interest
expense, net
|
(645,758 | ) | (1,046,287 | ) | (1,232,661 | ) | ||||||
|
Gain
(loss) on sale or disposal of assets
|
- | 23,872 | (22,517 | ) | ||||||||
|
Loss
on early extinguishment of debt
|
(474,960 | ) | - | - | ||||||||
|
Income
from continuing operations before income tax benefit
|
1,534,318 | 1,170,237 | 255,507 | |||||||||
|
Income
tax benefit
|
1,278,888 | - | - | |||||||||
|
Income
from continuing operations
|
$ | 2,813,206 | $ | 1,170,237 | $ | 255,507 | ||||||
|
Income
from discontinued operations
|
$ | - | $ | - | $ | 175,000 | ||||||
|
Net
Income
|
$ | 2,813,206 | $ | 1,170,237 | $ | 430,507 | ||||||
|
Income
per common share - basic:
|
||||||||||||
|
Income
from continuing operations
|
$ | 0.13 | $ | 0.06 | $ | 0.01 | ||||||
|
Income
from discontinued operations
|
$ | - | $ | - | $ | 0.01 | ||||||
|
Net
Income per common share
|
$ | 0.13 | $ | 0.06 | $ | 0.02 | ||||||
|
Income
per common share - diluted:
|
||||||||||||
|
Income
from continuing operations
|
$ | 0.12 | $ | 0.06 | $ | 0.01 | ||||||
|
Income
from discontinued operations
|
$ | - | $ | - | $ | 0.01 | ||||||
|
Net
Income per common share
|
$ | 0.12 | $ | 0.06 | $ | 0.02 | ||||||
|
Weighted
average common shares outstanding:
|
||||||||||||
|
Basic
|
21,654,554 | 20,973,924 | 20,988,348 | |||||||||
|
Diluted
|
22,845,241 | 20,973,924 | 20,988,348 | |||||||||
See
Accompanying Independent Registered Public Accounting Firm’s Report and Notes to
Consolidated Financial Statements
3
GLOBAL
AXCESS CORP AND SUBSIDIARIES
CONSOLIDATED
STATEMENTS OF STOCKHOLDERS' EQUITY
FOR THE
YEARS ENDED DECEMBER 31, 2009, 2008 AND 2007
|
Additional
|
Total
|
||||||||||||||||||
|
Common
Stock
|
Paid-in
|
Accumulated
|
Treasury
|
Stockholders'
|
|||||||||||||||
|
Shares
|
Amount
|
Capital
|
Deficit
|
Stock
|
Equity
|
||||||||||||||
|
Balances,
December 31, 2006
|
21,021,786 | $ | 21,022 | $ | 22,366,403 | $ | (10,758,884 | ) | $ | - | $ | 11,628,541 | |||||||
|
Settlement
of note receivable through receipt of treasury stock (47,862
shares)
|
(47,862 | ) | - | - | - | (11,966 | ) | (11,966 | ) | ||||||||||
|
Stock
compensation expense
|
- | - | 87,181 | - | - | 87,181 | |||||||||||||
|
Net
income
|
- | - | - | 430,507 | - | 430,507 | |||||||||||||
|
Balances,
December 31, 2007
|
20,973,924 | $ | 21,022 | $ | 22,453,584 | $ | (10,328,377 | ) | $ | (11,966 | ) | $ | 12,134,263 | ||||||
|
Stock
compensation expense
|
- | - | 159,840 | - | - | 159,840 | |||||||||||||
|
Net
income
|
- | - | - | 1,170,237 | - | 1,170,237 | |||||||||||||
|
Balances,
December 31, 2008
|
20,973,924 | $ | 21,022 | $ | 22,613,424 | $ | (9,158,140 | ) | $ | (11,966 | ) | $ | 13,464,340 | ||||||
|
Stock
compensation expense
|
- | - | 120,188 | - | - | 120,188 | |||||||||||||
|
Stock
options issued to consultants in lieu of cash compensation
|
- | - | 23,999 | - | - | 23,999 | |||||||||||||
|
Stock
expense relating to early extinguishment of debt
|
- | - | 135,079 | - | - | 135,079 | |||||||||||||
|
Stock
warrants excercised
|
910,000 | 910 | 8,190 | - | - | 9,100 | |||||||||||||
|
Net
income
|
- | - | - | 2,813,206 | - | 2,813,206 | |||||||||||||
|
Balances,
December 31, 2009
|
21,883,924 | $ | 21,932 | $ | 22,900,880 | $ | (6,344,934 | ) | $ | (11,966 | ) | $ | 16,565,912 | ||||||
See
Accompanying Independent Registered Public Accounting Firm’s Report and Notes to
Consolidated Financial Statements
4
GLOBAL
AXCESS CORP AND SUBSIDIARIES
CONSOLIDATED
STATEMENTS OF CASH FLOWS
|
For
the Fiscal Years Ended December 31,
|
||||||||||||
|
2009
|
2008
|
2007
|
||||||||||
|
Cash
flows from operating activities:
|
||||||||||||
|
Income
from continuing operations
|
$ | 2,813,206 | $ | 1,170,237 | $ | 255,507 | ||||||
|
Adjustments
to reconcile net income from continuing operations to net cash provided by
continuing operating activities:
|
||||||||||||
|
Stock
based compensation
|
120,188 | 159,840 | 87,181 | |||||||||
|
Stock
options issued to consultants in lieu of cash compensation
|
23,999 | - | - | |||||||||
|
Loss
on early extinguishment of debt
|
474,960 | - | - | |||||||||
|
Depreciation
expense
|
1,178,927 | 1,411,360 | 1,536,616 | |||||||||
|
Amortization
of intangible merchant contracts
|
786,173 | 770,270 | 725,935 | |||||||||
|
Amortization
of capitalized loan fees
|
26,756 | 46,431 | 66,975 | |||||||||
|
Allowance
for doubtful accounts
|
2,883 | (14,201 | ) | (36,240 | ) | |||||||
|
Allowance
for inventory obsolescence
|
40,539 | 54,033 | - | |||||||||
|
Non-cash
interest expense (income) on swap agreement with senior
lender
|
(7,921 | ) | 40,985 | 48,551 | ||||||||
|
Accretion
of discount on notes payable
|
50,066 | 165,988 | 165,987 | |||||||||
|
Impairment
of notes receivable
|
- | - | 5,743 | |||||||||
|
(Gain)
loss on sale or disposal of assets
|
- | (23,872 | ) | 22,517 | ||||||||
|
Changes
in operating assets and liabilities:
|
||||||||||||
|
Change
in automated teller machine vault cash
|
(250,000 | ) | - | 26,220 | ||||||||
|
Change
in accounts receivable
|
490 | 90,457 | 300,491 | |||||||||
|
Change
in other receivable
|
- | - | 15 | |||||||||
|
Change
in inventory
|
(112,270 | ) | 116 | 164,881 | ||||||||
|
Change
in prepaid expenses and other current assets
|
26,468 | (23,620 | ) | 93,969 | ||||||||
|
Change
in other assets
|
(21,075 | ) | 5,907 | (383 | ) | |||||||
|
Change
in intangible assets, net
|
(80,734 | ) | 634 | (10,635 | ) | |||||||
|
Change
in deferred taxes
|
(1,342,666 | ) | - | - | ||||||||
|
Change
in accounts payable and accrued liabilities
|
464,108 | (875,224 | ) | (878,002 | ) | |||||||
|
Change
in automated teller machine vault cash payable
|
250,000 | - | (26,220 | ) | ||||||||
|
Net
cash provided by continuing operating activities
|
4,444,097 | 2,979,341 | 2,549,108 | |||||||||
|
Discontinued
operations
|
||||||||||||
|
Net
income (loss)
|
- | - | 175,000 | |||||||||
|
Adjustments
to reconcile net income (loss) to net cash used in discontinued
operations:
|
||||||||||||
|
Change
in deferred gain on sale of subsidiary
|
- | - | (175,000 | ) | ||||||||
|
Net
cash used in discontinued operating activities
|
- | - | - | |||||||||
|
Net
cash provided by continuing operating activities
|
4,444,097 | 2,979,341 | 2,549,108 | |||||||||
|
Cash
flows from investing activities:
|
||||||||||||
|
Proceeds
from other receivable related to sale of subsidiary
|
- | - | 175,000 | |||||||||
|
Insurance
proceeds on disposal of fixed assets
|
- | 72,681 | 47,180 | |||||||||
|
Costs
of acquiring merchant contracts
|
(120,660 | ) | (43,758 | ) | (273,628 | ) | ||||||
|
Purchase
of property and equipment
|
(1,051,494 | ) | (290,304 | ) | (869,935 | ) | ||||||
|
Net
cash used in investing activities
|
(1,172,154 | ) | (261,381 | ) | (921,383 | ) | ||||||
|
Cash
flows from financing activities:
|
||||||||||||
|
Proceeds
from issuance of common stock
|
9,100 | - | - | |||||||||
|
Proceeds
from senior lenders' notes payable
|
6,200,000 | 39,028 | 100,000 | |||||||||
|
Proceeds
from notes payable
|
69,905 | - | - | |||||||||
|
Change
in restricted cash
|
(800,000 | ) | - | - | ||||||||
|
Principal
payments on senior lenders' notes payable
|
(6,171,429 | ) | (704,177 | ) | (658,333 | ) | ||||||
|
Principal
payments on notes payable
|
(11,833 | ) | (25,000 | ) | (25,000 | ) | ||||||
|
Principal
payments on notes payable - related parties
|
(1,248,186 | ) | (20,695 | ) | (18,472 | ) | ||||||
|
Principal
payments on capital lease obligations
|
(872,550 | ) | (986,367 | ) | (1,239,603 | ) | ||||||
|
Net
cash used in financing activities
|
(2,824,993 | ) | (1,697,211 | ) | (1,841,408 | ) | ||||||
|
Increase
(decrease) in cash
|
446,950 | 1,020,749 | (213,683 | ) | ||||||||
|
Cash,
beginning of period
|
1,560,910 | 540,161 | 753,844 | |||||||||
|
Cash,
end of the period
|
$ | 2,007,860 | $ | 1,560,910 | $ | 540,161 | ||||||
|
Cash
paid for interest
|
$ | 555,969 | $ | 786,697 | $ | 931,357 | ||||||
See
Accompanying Independent Registered Public Accounting Firm’s Report and Notes to
Consolidated Financial Statements
5
GLOBAL
AXCESS CORP AND SUBSIDIARIES
CONSOLIDATED
STATEMENTS OF CASH FLOWS
|
For
the Fiscal Years Ended December 31,
|
||||||||||||
|
SUPPLEMENTAL
CASH FLOW INFORMATION
|
2009
|
2008
|
2007
|
|||||||||
|
The
significant non-cash investing and financing activities of the Company
were as follows:
|
||||||||||||
|
Operating
activities:
|
||||||||||||
|
Net
transfer of de-installed net fixed assets to (from)
inventory
|
$ | (40,431 | ) | $ | 95,283 | $ | - | |||||
|
Total
non-cash operating activities
|
$ | (40,431 | ) | $ | 95,283 | $ | - | |||||
|
Investing
activities:
|
||||||||||||
|
Purchase
of assets under capital lease obligations
|
$ | 663,525 | $ | 407,404 | $ | 110,505 | ||||||
|
Net
transfer of de-installed net fixed assets (to) from
inventory
|
40,431 | (95,283 | ) | - | ||||||||
|
Total
non-cash investing activities
|
$ | 703,956 | $ | 312,121 | $ | 110,505 | ||||||
|
Settlement
of note receivable through issuance of treasury stock:
|
||||||||||||
|
Note
receivable
|
$ | - | $ | - | $ | (17,709 | ) | |||||
|
Impairment
of notes receivable
|
- | - | 5,743 | |||||||||
|
Repurchase
of treasury stock, 47,862 shares of common stock at cost
|
$ | - | $ | - | $ | (11,966 | ) | |||||
See
Accompanying Independent Registered Public Accounting Firm’s Report and Notes to
Consolidated Financial Statements
6
GLOBAL
AXCESS CORP AND SUBSIDIARIES
NOTES TO
CONSOLIDATED FINANCIAL STATEMENTS
AS OF
DECEMBER 31, 2009
|
|
1.
|
DESCRIPTION OF THE
COMPANY’S BUSINESS AND BASIS OF
PRESENTATION
|
Global
Axcess Corp (the “Company”), is a Nevada corporation organized in
1984. The Company, primarily through its wholly owned subsidiaries,
Nationwide Money Services, Inc., Nationwide Ntertainment Services, Inc. and EFT
Integration Inc., is an independent provider of self-service kiosk
services. Nationwide Ntertainment Services, Inc. was formed during
fiscal 2009. These solutions include ATM and DVD kiosk management and
support services focused on serving the self-service kiosk needs of merchants,
grocers, retailers and financial institutions nationwide. It is a one-stop
gateway for unattended self-service kiosk management services. The
Company’s fiscal year ended December 31, 2009.
|
|
2.
|
SUMMARY OF SIGNIFICANT
ACCOUNTING POLICIES
|
Cash
Equivalents
The
Company considers all highly-liquid investments with a maturity of three months
or less when purchased to be cash equivalents.
Concentration of Credit
Risk
Financial
instruments that potentially subject the Company to concentration of credit risk
consist primarily of temporary cash investments. The Company has several bank
accounts maintained with one financial institution and amounts on deposit may,
at times, exceed federally insurable amounts.
Principles of
consolidation
The
consolidated financial statements include the accounts of Global Axcess Corp and
its subsidiaries. The Company has the following
subsidiaries: Nationwide Money Services, Inc., Nationwide
Ntertainment Services, Inc. and EFT Integration, Inc. All significant
inter-company balances and transactions have been eliminated in
consolidation.
Reclassifications
Certain
reclassifications were made to the 2007 consolidated statements of income to
conform to the 2008 and 2009 presentation. These reclassifications
had no impact on net income or stockholders’ equity.
Merchant contract
concentration
The
Company contracts the locations for its ATMs with various merchants. As of
December 31, 2009, the Company has approximately 4,483 active ATMs, of which
approximately 677 machines are contracted through a single merchant. Revenues
from this merchant were approximately 22.8%, 24.1% and 21.4% of total fees from
continuing operations for the fiscal years ended December 31, 2009, 2008 and
2007, respectively.
Use of
estimates
The
preparation of the consolidated financial statements in conformity with
accounting principles generally accepted in the United States of America
requires management to make estimates and assumptions that affect the amounts
reported in the consolidated financial statements and accompanying notes. Actual
results could differ from these estimates.
Revenue
recognition
Transaction
service and processing fees are recognized in the period that the service is
performed. The Company receives two types of
fees: surcharge/convenience fees paid by consumers utilizing certain
ATMs owned or managed by the Company; and interchange fees paid by their
banks. Processing fees are generally charged on a per
transaction basis, depending on the contractual arrangement with the
client. ATM sales revenue is recognized when the ATM is shipped and
installed. Revenue from managing ATMs for others is recognized each
month when the services are performed.
7
Branding
fees are generated by the Company’s bank branding arrangements, under which
financial institutions pay a fixed monthly fee per ATM to the Company to have
their brand name on selected ATMs within the Company’s ATM portfolio. In return
for such fees, the bank’s customers can use those branded ATMs without paying a
surcharge fee. Branding fees are recognized in the period that the
service is performed. None of the branding fees are subject to escalation
clauses. Should the Company include escalation clauses in its future
branding contracts, pursuant to Generally Accepted Accounting Principles
(”GAAP”) guidelines for revenue recognition, the monthly per ATM branding fees,
which would be subject to escalation clauses within the agreements, would be
recognized as revenues on a straight-line basis over the term of the agreement.
In most of its branding agreements, the Company does not receive any one-time
set-up fees in addition to the monthly branding fees. The Company has received
immaterial one-time set-up fees per ATM. This set-up fee is separate from the
recurring, monthly branding fees and is meant to compensate the Company for the
burden incurred related to the initial set-up of a branded ATM versus the
on-going monthly services provided for the actual branding. Since any and all
one-time set up fees have been immaterial to date, the Company has recorded the
fee upon contract signing. Should any future branding agreements
contain material set-up fees, in accordance with GAAP, the Company would defer
these set-up fees (as well as the corresponding costs associated with the
initial set-up) and recognize such amounts as revenue (and expense) over the
terms of the underlying bank branding agreements.
Additionally,
the Company recognizes revenue on breached contracts when cash is
received. During the fiscal year ended December 31, 2009, the Company
did not record any revenue on breached contracts.
In
connection with the Company’s merchant-owned ATM operating/processing
arrangements, the Company typically pays the surcharge fees that it earns to the
merchant as fees for providing, placing, and maintaining the ATM unit. In
accordance with GAAP, the Company has recorded such payments as a direct
reduction of revenue.
The
Company follows GAAP in reporting revenue gross as a principal versus net as an
agent for its merchant contracts. In accordance with GAAP, if the company
performs as an agent or broker without assuming the risks and rewards of
ownership of the goods, sales should be and are reported on a net
basis.
The
Company is not exposed to similar financial obligations and risks on
merchant-owned ATM contracts as it is on its company-owned ATM
contracts. For example, under a merchant-owned arrangement, the
merchant is responsible for most of the operating expenses of the ATM such as
maintenance, cash management and loading, supplies, signage and
telecommunication services. As such, the Company reports the
surcharge/convenience fees relating to merchant-owned ATM arrangements on a net
basis.
Total Revenue and Total Cost
of Revenues Presentation
The
Company presents “Revenues” and “Cost of revenues” as single line items in the
consolidated statements of income. The following tables set forth the
revenue and cost of revenues sources included in the single line items presented
for the fiscal years ended December 31, 2009, 2008 and 2007:
8
Revenues:
|
For
the year ended
|
For
the year ended
|
For
the year ended
|
||||||||||
|
December
31, 2009
|
December
31, 2008
|
December
31, 2007
|
||||||||||
|
Surcharge
/ Convenience Fee revenue
|
$ | 11,975,275 | $ | 11,782,306 | $ | 10,807,322 | ||||||
|
Interchange
revenue
|
7,252,177 | 7,806,372 | 8,177,250 | |||||||||
|
Processing
revenue
|
210,329 | 286,914 | 322,938 | |||||||||
|
ATM
Sales revenue
|
458,759 | 519,861 | 575,804 | |||||||||
|
Other
revenue
|
1,598,327 | 1,775,619 | 1,867,583 | |||||||||
|
Total
revenue
|
$ | 21,494,867 | $ | 22,171,072 | $ | 21,750,897 | ||||||
|
For
the year ended
|
For
the year ended
|
For
the year ended
|
||||||||||
|
December
31, 2009
|
December
31, 2008
|
December
31, 2007
|
||||||||||
|
ATM
Operating revenue
|
$ | 21,036,108 | $ | 21,651,211 | $ | 21,175,093 | ||||||
|
ATM
Sales revenue
|
458,759 | 519,861 | 575,804 | |||||||||
|
Total
revenue
|
$ | 21,494,867 | $ | 22,171,072 | $ | 21,750,897 | ||||||
Cost
of Revenues:
|
For
the year ended
|
For
the year ended
|
For
the year ended
|
||||||||||
|
December
31, 2009
|
December
31, 2008
|
December
31, 2007
|
||||||||||
|
Merchant
residual / commission costs
|
$ | 6,480,422 | $ | 7,051,263 | $ | 6,672,380 | ||||||
|
Cost
of cash
|
1,738,813 | 2,025,680 | 2,616,403 | |||||||||
|
Processing
costs
|
860,910 | 848,428 | 960,544 | |||||||||
|
Communication
costs
|
593,642 | 562,030 | 558,557 | |||||||||
|
ATM
Sales costs
|
434,693 | 486,901 | 472,286 | |||||||||
|
Other
cost of revenues
|
1,208,439 | 1,373,689 | 1,425,466 | |||||||||
|
Total
cost of revenues
|
$ | 11,316,919 | $ | 12,347,991 | $ | 12,705,636 | ||||||
|
For
the year ended
|
For
the year ended
|
For
the year ended
|
||||||||||
|
December
31, 2009
|
December
31, 2008
|
December
31, 2007
|
||||||||||
|
Cost
of ATM operating revenue
|
$ | 10,882,226 | $ | 11,861,090 | $ | 12,233,350 | ||||||
|
ATM
Sales costs
|
434,693 | 486,901 | 472,286 | |||||||||
|
Total
cost of revenues
|
$ | 11,316,919 | $ | 12,347,991 | $ | 12,705,636 | ||||||
Accounts
Receivable
The
Company reviews the accounts receivable on a regular basis to determine the
collectibility of each account. The Company maintains allowances for doubtful
accounts for estimated losses resulting from the failure of its customers to
make required payments. At each reporting period, the Company evaluates the
adequacy of the allowance for doubtful accounts and calculates the appropriate
allowance based on historical experience, credit evaluations, specific customer
collection issues and the length of time a receivable is past due. The Company
records an allowance for doubtful accounts for any billed invoice aged past 60
days. When the Company deems the receivable to be uncollectible, the Company
charges the receivable against the allowance for doubtful
accounts. As of December 31, 2009 and 2008, the Company reserved
$12,616 and $9,799 as an allowance for doubtful accounts against the accounts
receivable of $857,616 and $858,172, respectively.
9
Inventory
Inventory
is stated at the lower of cost (first-in, first-out method) or
market. Inventory consists primarily of ATMs, DVD rental kiosks and
related parts and equipment. Parts relating to upgrading ATMs to
become Triple DES compliant were recorded to fixed assets when the part was
placed into service, if the ATM is company-owned. Parts relating to upgrading
ATMs to become Triple DES compliant were recorded to Merchant Contracts when the
part was placed into service, if the ATM is merchant-owned and the merchant
signed a term extension to an existing contract. The cost of the part
was subsequently amortized over the life of the contract extension. Parts
relating to upgrading ATMs to become Triple DES compliant were expensed when the
part was placed into service, if the Company upgraded the merchant-owned ATMs at
no charge to the merchant with no contract extension. ATMs and parts
available for sale are classified as inventory until such time as the machine or
part is sold or installed and in service. Once the ATM or part is sold, it is
relieved to cost of revenues. The Company reserves for inventory obsolescence
based upon physical inventory count and evaluations of how long items remain in
inventory combined with historical usage of respective items. At
December 31, 2009 and 2008, the Company's inventory, net of an allowance for
obsolescence of $94,572 and $54,033 totaled $308,031 and $276,731,
respectively.
Fixed
assets
Fixed
assets are stated at cost, less accumulated depreciation and amortization.
Leasehold improvements are amortized on a straight-line basis over the shorter
of the lease term or the life of the asset. The cost of repairs and
maintenance is charged to expense as incurred. Expenditures for property
improvements and renewals are capitalized, if they extend the useful life of the
related asset. Upon the sale or other disposition of a depreciable asset, cost
and accumulated depreciation are removed from the accounts and any gain or loss
is reflected in gain (loss) on sale of assets.
The
Company periodically evaluates whether events and circumstances have occurred
that may warrant revision of the estimated useful life of fixed assets or
whether the remaining balance of fixed assets should be evaluated for possible
impairment. The Company uses an estimate of the related undiscounted cash flows
over the remaining life of the fixed assets in measuring their recoverability,
as well as historical age, to estimate useful economic lives and
values.
Depreciation
is recognized using the straight-line method over the following approximate
useful lives.
|
Useful Life
|
||
|
ATMs
|
10
years
|
|
|
DVD
kiosks
|
5
years
|
|
|
Computers
|
5 years
|
|
|
Office
furniture and equipment
|
5
years
|
|
|
Vehicles
|
5
years
|
|
|
Leasehold
improvements
|
shorter
of lease term or useful
life
of improvement
|
Lease
Committments
The
Company is party to various operating leases relating to office facilities and
certain other equipment with various expiration dates. All leasing arrangements
contain normal leasing terms without unusual purchase options or escalation
clauses. Rental expense under operating leases aggregated $206,068, $218,379 and
$237,639 for the years ended December 31, 2009, 2008 and 2007,
respectively. The Company is also party to various capital leases for
ATMs and related components. The assets associated with these capital
leases are recorded as fixed assets and depreciated accordingly. The
capital lease obligation is recorded and amortized over the life the of the
lease.
Merchant Contracts and
Intangible Assets, including Goodwill
In June
2001, the Financial Accounting Stansards Board issued guidance on goodwill and
other intangible assets. The guidance established accounting and
reporting standards for goodwill and intangible assets resulting from business
combinations. The guidance included provisions discontinuing the periodic
amortization of, and requiring the assessment of, the potential impairments of
goodwill (and intangible assets deemed to have indefinite lives). As the
guidance replaced the measurement guidelines for goodwill impairment, goodwill
not considered impaired under previous accounting literature may now be
considered impaired under GAAP. The guidance also required that the
Company complete a two-step goodwill impairment test. The first step compares
the fair value of each reporting unit to its carrying amount, including
goodwill. If the fair value of a reporting unit exceeded its carrying amount,
goodwill is not considered to be impaired and the second step is not required.
The guidance required completion of this first step within the first nine months
of initial adoption and annually thereafter. If the carrying amount of a
reporting unit exceeded its fair value, the second step is performed to measure
the amount of impairment loss. The second step compared the implied fair value
of goodwill to the carrying value of a reporting unit's goodwill. The implied
fair value of goodwill is determined in a manner similar to accounting for a
business combination with the allocation of the assessed fair value determined
in the first step to the assets and liabilities of the reporting unit. The
excess of the fair value of the reporting unit over the amounts assigned to the
assets and liabilities is the implied fair value of goodwill. This allocation
process is only performed for purposes of evaluating goodwill impairment and
does not result in an entry to adjust the value of any assets or liabilities. An
impairment loss is recognized for any excess in the carrying value of goodwill
over the implied fair value of goodwill.
10
In June
2001, the Company acquired 100% of the outstanding capital stock of Nationwide
Money Services, Inc. in consideration of 3,874,000 shares of the Company's
common stock, including 149,000 shares for a finder's fee. This acquisition was
recorded using the purchase method of accounting under GAAP and as such, the
Company accounted for its 100% ownership interest in Nationwide. The results of
operations for the acquired company have been included in the consolidated
financial results of the Company from the date of such transaction
forward.
The
purchase price amount in excess of fair value of net assets was allocated to
merchant account contracts totaling $1,020,000, which is being amortized on a
straight-line basis over the estimated useful lives of 21 years, and goodwill
totaling $1,311,195.
Additionally,
the Company purchased 900 Merchant ATM contracts in February
2004. The purchase price was $3,900,000 and was reflected in Merchant
Contracts. During September 2004, the Company made two additional acquisitions:
one for 111 ATM contracts, and another for 745 ATM contracts. The
prices for those acquisitions were $918,000 and $7,000,000, respectively. In
these two acquisitions, the Company also acquired ATM machines with the fair
value of $166,500 and $1,200,000, respectively.
When the
Company acquires another company’s assets, GAAP requires the Company to estimate
the fair value of the other company's tangible assets and liabilities and
identifiable intangible assets. Any unallocated purchase price has been recorded
as goodwill. The Company applies GAAP to review for impairment to the intangible
goodwill and merchant contracts. As of September 2004, the Company had relied on
the reported values of the assets acquired from the seller to estimate fair
value. In reviewing the seller's balances, current fair values in the market,
discounted cash flow analysis of the merchant contracts; and after considering
the outlay of cash for maintenance and capital costs along with the projected
income from the future income stream from the contracts, the Company allocated
$2,878,450 of the ATM Network's asset purchase to goodwill, as of December 31,
2004, all other acquisitions assets had fair values equal or greater than the
acquisition price. To date, the Company’s testing has indicated that there is no
impairment of its goodwill.
Intangible
assets with finite lives and merchant contracts are stated at cost, net of
accumulated amortization, and are subject to impairment testing under certain
circumstances in accordance with GAAP. These assets are amortized on the
straight-line method over their estimated useful lives or period of expected
benefit. These assets are subject to periodic impairment testing in accordance
with GAAP.
The
Company’s merchant contracts are made up of contracts with automatic renewable
lives. The Company has determined after review of its contracts that
the economic life of the contracts is extended and estimated over 21 years (or
three times renewal) based on historical and expected useful lives of similar
assets. The Company amortizes the merchant contracts over their
estimated useful lives of 21 years. The Company has adopted GAAP to
reflect the fair value of the merchant contracts, and uses a two step valuation
process to determine if there has been any impairment on the value of the
merchant contract assets. Additionally, when the Company gives away
an ATM part to induce a contract extension from the merchant, the Company
records the value of the ATM part to Merchant Contracts and amortizes the value
of the part over the life of the contract extension.
The first
step is to periodically assess the remaining contract lives, including expected
renewals. If the periodic assessment results in a determination that
the economic lives of the merchant contracts are less than 21 years, the Company
adjusts the remaining amortization lives of the merchant
contracts. The Company’s merchant contracts have an average initial
term of approximately seven years. While the Company has historically
experienced a higher turnover rate among its merchant-owned clients than with
its company-owned portfolio, the Company is currently experiencing an average of
2.2 renewals on its current merchant-owned contracts acquired through the end of
fiscal 2005. In accordance with GAAP, an entity shall consider its
own historical experience about renewal or extension used to determine the
useful life of a recognized intangible asset. Until such time when
the Company’s historical experience does not support the useful and economic
life of the merchant contracts, the Company concludes that the current economic
life of 21 years is appropriate.
11
The
second step is to compare the estimated future undiscounted cash flows of each
reporting unit to the carrying amount of the merchant contracts, thus testing
the impairment of the value of the contracts. An impairment loss is
recognized for any excess in the carrying value of merchant contracts over the
assessed fair value of merchant contracts. To date, the Company’s testing has
indicated that there is no impairment of its goodwill and merchant
contracts.
Impairment of Long-Lived
Assets
In
accordance with GAAP, the Company reviews its long-lived assets, including
property and equipment and capitalized software development, for impairment
whenever events or changes in circumstances indicate that the carrying amount of
the assets may not be fully recoverable. To determine recoverability of its
long-lived assets, the Company evaluates the probability that future
undiscounted net cash flows will be less than the carrying amount of the assets.
If future estimated undiscounted cash flows are less than the carrying amount of
long-lived assets, then such assets are written down to their estimated fair
value. During the fiscal years ended December 31, 2009, 2008 and
2007, the Company recorded no impairment charges of long-lived
assets.
Fair value of financial
instruments
The
carrying amounts of the Company’s long-term liabilities approximate the
estimated fair values at December 31, 2009 and 2008, based upon the Company’s
ability to acquire similar debt at similar maturities. The carrying values of
all other financial instruments approximate their fair value, because of the
short-term maturities of these instruments.
Earnings per
share
In
calculating basic income per share, net income is divided by the weighted
average number of common shares outstanding for the period. Diluted income per
share reflects the assumed exercise or conversion of all dilutive securities,
such as options and warrants. No such exercise or conversion is
assumed where the effect is anti-dilutive, such as when there is a net loss from
continuing operations or when the exercise price of the potentially dilutive
securities is less than the market value of the Company’s stock.
Income
taxes
The
Company accounts for its income taxes in accordance with GAAP which requires
recognition of deferred tax assets and liabilities for future tax consequences
attributable to differences between the financial statement carrying amounts of
existing assets and liabilities and their respective tax basis and tax credit
carry-forwards. Deferred tax assets and liabilities are recognized for the
future tax consequences attributable to differences between financial statement
carrying amounts of existing assets and liabilities and their respective tax
bases. Deferred tax assets and liabilities are measured using enacted tax rates
expected to be applied to taxable income in the years in which those temporary
differences are expected to be recovered or settled. A valuation allowance is
recorded to reduce the Company’s deferred tax assets to the amount that is more
likely than not to be realized.
Pursuant
to GAAP, when establishing a valuation allowance, the Company considers future
sources of taxable income such as “future reversals of existing taxable
temporary differences, future taxable income exclusive of reversing temporary
differences and carryforwards” and “tax planning strategies.” GAAP defines a tax
planning strategy as “an action that: is prudent and feasible; an enterprise
ordinarily might not take, but would take to prevent an operating loss or tax
credit carryforward from expiring unused; and would result in realization of
deferred tax assets.” In the event the Company determines that the deferred tax
assets will not be realized in the future, the valuation adjustment to the
deferred tax assets is charged to earnings in the period in which the Company
makes such a determination. If it is later determined that it is more likely
than not that the deferred tax assets will be realized, the Company will release
the valuation allowance to current earnings or adjust the purchase price
allocation, consistent with the manner of origination.
The
amount of income taxes the Company pays is subject to ongoing audits by federal,
state and foreign tax authorities. The Company’s estimate of the potential
outcome of any uncertain tax issue is subject to management’s assessment of
relevant risks, facts, and circumstances existing at that time, pursuant to
GAAP. GAAP requires a more-likely-than-not threshold for financial
statement recognition and measurement of tax positions taken or expected to be
taken in a tax return. The Company records a liability for the difference
between the benefit recognized and measured pursuant to GAAP and tax position
taken or expected to be taken on the tax return. To the extent that the
Company’s assessment of such tax positions changes, the change in estimate is
recorded in the period in which the determination is made.
12
Repairs and maintenance
costs
Repairs
and maintenance costs are expensed as incurred. Repairs and
maintenance pertaining to the Company’s ATMs are recorded in cost of
revenues. The Company records repairs and maintenance costs relating
to general office and backend related equipment to general and administrative
costs.
Performance Based 401k
Contribution Plan
Effective
fiscal 2007, the Company implemented a performance based incentive program
matching 401k contributions. For each quarter the Company achieves
its Net Income budget, the Company matches up to 50% of the first 6% of an
employee’s 401k contributions during that respective quarter. The
Company recorded $21,050, $44,741 and $7,917 of expenses relating to this plan
during the fiscal years ended December 31, 2009, 2008 and 2007,
respectively.
Performance Based Incentive
Bonus Plan
Effective
fiscal 2008, the Company implemented a performance based incentive program for
employees and management of the Company. A quarterly cash bonus pool
is funded by the Company’s achievement of net profits. During the
fiscal years ended December 31, 2009 and 2008, the Company recorded $214,083 and
$178,927, respectively, of expenses relating to this plan. During fiscal 2007, the
Company implemented a performance based incentive program for several employees
and management of the Company. A quarterly cash bonus pool was funded
by the Company’s achievement of operating profits from continuing
operations. During the fiscal period ended December 31, 2007 the
Company recorded $15,793 of expenses relating to this plan.
Stock-based
compensation
Effective
January 1, 2006, the Company adopted the fair value recognition provisions of
GAAP using the modified-prospective-transition method which requires us to
recognize compensation expense on a prospective basis. GAAP requires that all
stock-based compensation be recognized as an expense in the financial statements
and that such cost be measured at the fair value of the award. Under this
method, in addition to reflecting compensation for new share-based awards,
expense is also recognized to reflect the remaining service period of awards
that had been included in pro-forma disclosure in prior periods. The
stock based compensation expense is included in operating expenses in the
consolidated statements of income.
As of
December 31, 2009, total unrecognized compensation cost related to non-vested
stock-based compensation plans was $378 thousand. This unrecognized
compensation is expected to be recognized over a weighted average period of 1.8
years.
Off Balance Sheet
Arrangements
We have
no off balance sheet arrangements, obligations under any guarantee contracts or
contingent obligations.
Recent accounting
pronouncements
In June
2003, the SEC adopted final rules under Section 404 of the Sarbanes-Oxley Act of
2002 (“Section 404”), as amended, by SEC Release No. 33-8760 on December 15,
2006. Commencing with the Company’s annual report for the year ended December
31, 2007, the Company is required to include a report of management on the
Company’s internal control over financial reporting. The internal control report
must include a statement of management’s responsibility for establishing and
maintaining adequate internal control over financial reporting for the Company;
of management’s assessment of the effectiveness of the Company’s internal
control over financial reporting as of year-end; and of the framework used by
management to evaluate the effectiveness of the Company’s internal control over
financial reporting. Furthermore, beginning with the Company’s annual
report for fiscal year 2010, the Company is required to file the auditor’s
attestation report separately on the Company’s internal control over financial
reporting on whether it believes that the Company has maintained, in all
material respects, effective internal control over financial
reporting.
13
On July
1, 2009, the FASB issued the FASB Accounting Standards Codification
(“Codification”). The Codification became the single source of authoritative
nongovernmental U.S. GAAP, superseding existing FASB, American Institute of
Certified Public Accountants (AICPA), Emerging Issues Task Force (EITF) and
related literature. The Codification eliminates the previous US GAAP hierarchy
and establishes one level of authoritative GAAP. All other literature is
considered non-authoritative. The Codification changes the referencing and
organization of accounting guidance and is effective for the Company beginning
the quarter ended September 30, 2009. The Codification does not change GAAP and
only affects how specific references to GAAP literature are disclosed in the
notes to the Company’s consolidated financial statements. The
adoption of this standard did not have a material impact on the Company's
financial statements.
14
|
|
3.
|
QUARTERLY INFORMATION
(IN THOUSANDS EXCEPT PER SHARE
DATA):
|
|
Fiscal 2009
(unaudited)
|
||||||||||||||||
|
First
|
Second
|
Third
|
Fourth
|
|||||||||||||
|
Quarter
|
Quarter
|
Quarter
|
Quarter
|
|||||||||||||
|
Revenues
|
$ | 5,414 | $ | 5,369 | $ | 5,315 | $ | 5,396 | ||||||||
|
Gross
profit
|
2,559 | 2,555 | 2,527 | 2,537 | ||||||||||||
|
Operating
income from continuing operations
|
777 | 707 | 623 | 548 | ||||||||||||
|
Net
Income
|
$ | 97 | $ | 557 | $ | 476 | $ | 1,683 | ||||||||
|
Income
per common share - basic:
|
||||||||||||||||
|
Net
Income per common share
|
$ | 0.01 | $ | 0.03 | $ | 0.02 | $ | 0.08 | ||||||||
|
Income
per common share - diluted:
|
||||||||||||||||
|
Net
Income per common share
|
$ | 0.01 | $ | 0.03 | $ | 0.02 | $ | 0.07 | ||||||||
|
Weighted
average common shares outstanding:
|
||||||||||||||||
|
Basic
|
20,973,924 | 21,873,924 | 21,883,924 | 21,883,924 | ||||||||||||
|
Diluted
|
20,973,924 | 22,321,389 | 23,471,284 | 23,606,552 | ||||||||||||
|
Fiscal 2008 (unaudited)
|
||||||||||||||||
|
First
|
Second
|
Third
|
Fourth
|
|||||||||||||
|
Quarter
|
Quarter
|
Quarter
|
Quarter
|
|||||||||||||
|
Revenues
|
$ | 5,528 | $ | 5,845 | $ | 5,653 | $ | 5,145 | ||||||||
|
Gross
profit
|
2,408 | 2,587 | 2,453 | 2,375 | ||||||||||||
|
Operating
income from continuing operations
|
422 | 667 | 533 | 571 | ||||||||||||
|
Net
Income
|
$ | 112 | $ | 450 | $ | 277 | $ | 331 | ||||||||
|
Income
per common share - basic:
|
||||||||||||||||
|
Net
Income per common share
|
$ | 0.01 | $ | 0.02 | $ | 0.01 | $ | 0.02 | ||||||||
|
Income
per common share - diluted:
|
||||||||||||||||
|
Net
Income per common share
|
$ | 0.01 | $ | 0.02 | $ | 0.01 | $ | 0.02 | ||||||||
|
Weighted
average common shares outstanding:
|
||||||||||||||||
|
Basic
|
20,973,924 | 20,973,924 | 20,973,924 | 20,973,924 | ||||||||||||
|
Diluted
|
20,973,924 | 20,979,768 | 21,043,567 | 20,973,924 | ||||||||||||
15
4. ACCOUNTS
RECEIVABLE
The
components of accounts receivable for the periods presented are as
follows:
|
December
31, 2009
|
December
31, 2008
|
|||||||
|
Trade
accounts receivable, billed
|
$ | 183,052 | $ | 130,478 | ||||
|
Trade
accounts receivable, unbilled
|
674,564 | 727,694 | ||||||
| 857,616 | 858,172 | |||||||
|
Less:
allowance for doubtful accounts
|
12,616 | 9,799 | ||||||
|
Accounts
receivable, net
|
$ | 845,000 | $ | 848,373 | ||||
5. INVENTORY
The
components of inventory for the periods presented are as follows:
|
December
31, 2009
|
December
31, 2008
|
|||||||
|
Parts
and supplies
|
$ | 221,320 | $ | 130,173 | ||||
|
Automated
teller machines
|
120,679 | 200,591 | ||||||
|
DVD
rental kiosks
|
60,604 | - | ||||||
| 402,603 | 330,764 | |||||||
|
Less:
reserve for inventory obsolescence
|
94,572 | 54,033 | ||||||
|
Inventory,
net
|
$ | 308,031 | $ | 276,731 | ||||
|
|
6.
|
FIXED
ASSETS
|
The
components of fixed assets for the periods presented are as
follows:
|
December
31, 2009
|
December
31, 2008
|
|||||||
|
Automated
teller machines (A)
|
$ | 10,094,375 | $ | 9,031,960 | ||||
|
DVD
rental kiosks
|
311,925 | - | ||||||
|
Furniture
and fixtures
|
443,922 | 443,922 | ||||||
|
Computers,
equipment and software (A)
|
2,356,724 | 2,060,954 | ||||||
|
Automobiles
|
412,322 | 342,418 | ||||||
|
Leasehold
equipment
|
72,533 | 72,533 | ||||||
| 13,691,801 | 11,951,787 | |||||||
|
Less:
accumulated depreciation and amortization (B)
|
8,392,140 | 7,228,649 | ||||||
|
Fixed
assets, net
|
$ | 5,299,661 | $ | 4,723,138 | ||||
|
(A)
|
See
Financial Footnote #12 “Capital Lease Obligations” for ATMs and computers
held under capital leases.
|
|
(B)
|
Depreciation
expense from continuing operations for the years ended December 31, 2009,
2008 and 2007 was $1,178,927, $1,411,360 and $1,536,616,
respectively.
|
16
|
|
7.
|
INTANGIBLE ASSETS AND MERCHANT
CONTRACTS
|
The
following table summarizes Intangible assets and merchant contracts at December
31, 2009:
|
Gross Carrying Value
|
Accumulated
Amortization
|
Net
|
||||||||||
|
Goodwill
|
$ | 4,189,645 | $ | 168,286 | $ | 4,021,359 | ||||||
|
Other
Intangible Assets
|
89,701 | 15,149 | 74,552 | |||||||||
|
Merchant
contracts
|
14,818,294 | 4,152,681 | 10,665,613 | |||||||||
|
Total
Intangible assets and merchant contracts
|
$ | 19,097,640 | $ | 4,336,116 | $ | 14,761,524 | ||||||
The
following table summarizes Intangible assets and merchant contracts at December
31, 2008:
|
Gross Carrying Value
|
Accumulated
Amortization
|
Net
|
||||||||||
|
Goodwill
|
$ | 4,189,645 | $ | 168,286 | $ | 4,021,359 | ||||||
|
Other
Intangible Assets
|
338,092 | 241,025 | 97,067 | |||||||||
|
Merchant
contracts
|
14,700,588 | 3,369,462 | 11,331,126 | |||||||||
|
Total
Intangible assets and merchant contracts
|
$ | 19,228,325 | $ | 3,778,773 | $ | 15,449,552 | ||||||
The
Company recorded amortization expense of $786,173, $770,270 and $725,935, for
the years ended December 31, 2009, 2008 and 2007, respectively. The
Company records the amortization of loan costs in interest expense.
Aggregate
amortization over the next five years, assuming a useful life of 21 years for
merchant contracts, is expected to be as follows:
|
2010
|
$ | 787,221 | ||
|
2011
|
$ | 776,967 | ||
|
2012
|
$ | 765,971 | ||
|
2013
|
$ | 689,821 | ||
|
2014
|
$ | 674,661 |
The
Company has no intangible assets, other than goodwill, that are not subject to
amortization.
|
|
8.
|
ACCOUNTS PAYABLE AND
ACCRUED LIABILITIES
|
The
components of accounts payable and accrued liabilities for the periods presented
are as follows:
|
December 31, 2009
|
December 31, 2008
|
|||||||
|
Accounts
payable
|
$ | 624,874 | $ | 417,874 | ||||
|
Accrued
commissions/residual payments
|
1,223,734 | 1,157,410 | ||||||
|
Accrued
cost of cash and cash replenishment expenses
|
440,043 | 326,015 | ||||||
|
Accrued
payroll
|
332,117 | 298,139 | ||||||
|
Accrued
audit fees
|
84,000 | 83,000 | ||||||
|
Accrued
interest
|
- | 97,827 | ||||||
|
Asset
Retirement Obligation
|
63,074 | 60,120 | ||||||
|
Income
tax payable
|
64,500 | - | ||||||
|
Other
|
151,241 | 87,011 | ||||||
|
Accounts
payable and accrued liabilities
|
$ | 2,983,583 | $ | 2,527,396 | ||||
17
|
|
9.
|
NOTES PAYABLE –
RELATED PARTIES
|
The
components of notes payable – related parties for the periods presented are as
follows:
|
December 31, 2009
|
December 31, 2008
|
|||||||
|
Promissory
note in the original amount of $243,981 to a stockholder, unsecured,
payable in monthly principal and interest installments of $3,000, bearing
an annual interest rate of 11%, and due June 2013
|
$ | 99,412 | $ | 122,598 | ||||
|
Subordinated
unsecured debentures of $1,225,000 provided by certain stockholders with
interest only payments made quarterly at a rate of 9%, with balloon
payments due October 28, 2010, net of discounts and fees of $18,993 in
2009 and 2008. Notes were repaid in December
2009.
|
- | 1,206,007 | ||||||
| 99,412 | 1,328,605 | |||||||
|
Less:
current portion
|
26,722 | 24,010 | ||||||
|
Long-term
portion, net of notes payable – related parties
|
$ | 72,690 | $ | 1,304,595 | ||||
As of
December 31, 2009, principal payments due on the notes payable – related parties
are as follows:
|
2010
|
$ | 26,722 | ||
|
2011
|
29,741 | |||
|
2012
|
33,100 | |||
|
2013
|
9,849 | |||
| $ | 99,412 |
|
10.
|
NOTES
PAYABLE
|
The
components of notes payable for the periods presented are as
follows:
|
December 31, 2009
|
December 31, 2008
|
|||||||
|
Various
auto loans
|
$ | 92,923 | $ | - | ||||
| 92,923 | - | |||||||
|
Less:
current portion
|
19,803 | - | ||||||
|
Long-term
portion, net of notes payable
|
$ | 73,120 | $ | - | ||||
On
December 29, 2009, the Company, entered into a Loan and Security Agreement (the
"Loan Agreement"), with Proficio Bank (the "Lender"). The Loan
Agreement provides for a line of credit of up to $1 million. On
December 29, 2009, the Company issued a Master Non-Revolving Line of Credit Note
(the "LOC Note") in the amount of $1 million to the Lender. The
Company will repay any amounts borrowed under the LOC Note over 36 equal and
consecutive monthly installments of principal payments plus accrued
interest. The Lender has no obligation to make advances on the LOC
Note after December 29, 2011. The interest rate applicable to any
principal advances shall be the greater of eight and three-quarters of one
percent (8.75%) per annum, and, at the Company’s election, either (i) a variable
rate of five and one-half of one percent (5.50%) in excess of the interest rate
published by the Wall Street Journal, Jacksonville, Florida, from time to time
as the prime rate of interest (the "Prime Rate"); or (ii) a fixed rate equal to
the Prime Rate in effect on the date that the Company requests an advance from
Lender under the LOC Note (as to such advance), plus five and one-half of one
percent (5.50%). Any proceeds drawn under the line of credit will be
used for the leasing of certain equipment to be used in connection with the
Company’s business. As of December 31, 2009, the Company did not draw
down any amounts against the LOC Note.
18
As of
December 31, 2009, principal payments due on the notes payable are as
follows:
|
2010
|
$ | 19,803 | ||
|
2011
|
21,815 | |||
|
2012
|
23,575 | |||
|
2013
|
27,730 | |||
| $ | 92,923 |
|
|
11.
|
SENIOR LENDERS’ NOTES
PAYABLE
|
The
components of senior lenders’ notes payable for the periods presented are as
follows:
|
December 31, 2009
|
December 31, 2008
|
|||||||
|
SunTrust
Bank
|
$ | 5,128,572 | $ | - | ||||
|
Wachovia
Bank – Fourth Amended and Restated Loan Agreement
|
1,634,851 | |||||||
|
CAMOFI
Master LDC, net of warrant valuation discounts of $288,060 in
2008
|
- | 3,211,940 | ||||||
| 5,128,572 | 4,846,791 | |||||||
|
Less:
current portion
|
1,828,572 | 606,705 | ||||||
|
Long-term
portion, net of senior lenders' notes payable
|
$ | 3,300,000 | $ | 4,240,086 | ||||
On March
27, 2009, the Company entered into a credit and security agreement (the “Credit
Agreement”) with SunTrust Bank (the “Lender”). The Credit Agreement
provides for a maximum term loan of up to $5 million. On March 27,
2009, the Company borrowed $5 million under the Credit Agreement and issued a
promissory note (the “Promissory Note”) in such amount to the
Lender. The Company will repay the amount borrowed over 42 months,
beginning April 30, 2009, with 41 equal monthly principal payments plus accrued
interest, with the final payment to be made on September 30,
2012. The interest rate is fixed at 6.99% per annum. The
proceeds were used to repay CAMOFI Master LDC (“CAMOFI”) in connection with the
settlement agreement, effective as of March 17, 2009, between the Company and
CAMOFI, and to repay the outstanding principal balance under a loan agreement
with Wachovia Bank. Upon entering into the Credit Agreement, the
Company repaid in full all outstanding borrowings under and terminated (1) its
Fourth Amended and Restated Loan Agreement, entered into as of September 28,
2007 (the “Prior Loan Agreement”), by and between the Company and Wachovia Bank,
and (2) its Consolidated Renewal Promissory Note issued on September 28, 2007
(the “Renewal Note”) to Wachovia Bank. See Financial Footnote #21
“Loss on Early Extinguishment of Debt” for detail of the charges relating to the
extinguishment of these debts.
The
Company also paid a termination fee of $85,312 for its interest swap agreement
in connection with the prepayment of the Prior Loan Agreement and Renewal Note,
which amount was previously accounted for as accrued interest.
The
Credit Agreement contains customary representations, warranties and covenants,
including (1) maintenance of a minimum amount of $800,000 of restricted cash in
a deposit account with the Lender, (2) maintenance of tangible net worth value
of at least $9 million, and (3) maintenance of debt service coverage of at least
1.25. As of December 31, 2009, the Company was in compliance with all
applicable covenants and ratios under its credit agreement with SunTrust
Bank.
On
December 23, 2009, the Company entered into a Credit and Security Agreement,
dated as of December 23, 2009 (the "Second Credit Agreement"), with SunTrust
Bank. The Second Credit Agreement provides for a maximum term loan of
up to $1.2 million. On December 23, 2009, the Company borrowed $1.2
million under the Credit Agreement and issued a promissory note (the "Promissory
Note") in such amount to SunTrust. The Company will repay the amount
borrowed over 25 months, beginning January 31, 2010, with 25 equal monthly
principal payments plus accrued interest, with the final payment to be made on
January 31, 2012. The interest rate is fixed at 4.96% per
annum. The proceeds were used to redeem certain subordinated,
unsecured debentures of $1.2 million from certain stockholders. See
Financial Footnote # 9 “Notes Payable – Related Parties” for detail regarding
the subordinated unsecured debentures.
19
The
Second Credit Agreement contains customary representations, warranties and
covenants, including covenants on the following: (1) maintenance of deposit
accounts with SunTrust; (2) sale of assets; (3) merger, consolidation and
dissolution; (4) loans and advances; (5) change in business; (6) other
agreements; (7) discount or sale of receivables; (8) capital expenditures; (9)
limitations on debt; (10) limitations on liens; (11) limitations on changes in
ownership structure; (12) dividends; and (13) repurchases of
shares. The Credit Agreement and Promissory Note also include
customary default provisions, including, without limitation, payment defaults,
cross-defaults to other material indebtedness, bankruptcy and insolvency, and
the deterioration of the Company’s relationship with a specified
customer. In general, upon an event of default, SunTrust may, among
other things, declare the outstanding principal and interest immediately due and
payable.
As of
December 31, 2009, principal payments due on the senior lenders’ notes payable
are as follows:
|
2010
|
$ | 1,828,572 | ||
|
2011
|
1,828,572 | |||
|
2012
|
1,471,428 | |||
| $ | 5,128,572 |
|
12.
|
CAPITAL LEASE
OBLIGATIONS
|
The
Company is obligated under various capital leases for automated teller machines
and computer equipment. For financial reporting purposes, minimum lease payments
relating to this equipment have been capitalized. Capital lease obligations,
excluding interest, totaling $996,547 require minimum monthly lease payments
ranging from approximately $30 to $7,700 with interest rates ranging between
5.99% and 12.11%. The existing capital lease agreements as of December 31, 2009
are at an average interest rate of 9.79%. The future minimum lease payments
required under capital lease obligations as of December 31, 2009 are as
follows:
|
2010
|
$ | 736,806 | ||
|
2011
|
314,178 | |||
|
2012
|
36,988 | |||
| 1,087,972 | ||||
|
Less:
amount representing interest
|
91,425 | |||
|
Present
value of minimum lease payments
|
996,547 | |||
|
Less:
current portion of capital lease obligations
|
667,233 | |||
|
Total
|
$ | 329,314 |
Equipment
leased under capital leases as of December 31, 2009 and 2008, totaled $4,977,987
and $2,224,389, which is net of accumulated depreciation of $2,467,532 and
$1,972,774, respectively.
|
13.
|
COMMITMENTS AND
CONTINGENCIES
|
Leased
facilities
Commencing
May 2007, the Company entered into a lease for their Jacksonville, Florida
office. The term of the lease is for a period of 62 months and the rent expense
on a monthly basis for the first year is $7,545, for the second year is $7,773,
for the third year is $8,007, for the fourth year is $8,246 and for the final
period through the end of the term is $8,494. The Company entered into a new
office lease in Jacksonville, Texas which, effective February 1, 2009, became a
month to month lease. The agreement provides for minimum monthly base rental
payments of approximately $4,406. The Company also leases a warehouse facility
in South Carolina which is a month to month lease and a facility in Georgia is
also on a month to month term. The Company also has various operating
leases for computers and equipment. Rental expense under operating
leases aggregated $206,068, $218,379 and $237,639 for the years ended
December 31, 2009, 2008 and 2007, respectively.
20
The
following is a schedule by years of future minimum rental payments required
under operating leases that have initial or remaining non-cancelable lease terms
in excess of one year as of December 31, 2009:
|
2010
|
$ | 124,787 | ||
|
2011
|
114,794 | |||
|
2012
|
66,585 | |||
|
2013
|
9,193 | |||
|
2014
|
6,132 | |||
|
Total
|
$ | 321,491 |
|
14.
|
LEGAL
PROCEEDINGS
|
From time
to time, the Company and its subsidiaries may be parties to, and their property
is subject to, ordinary, routine litigation incidental to their business. We
know of no material, active or pending legal proceedings against the Company,
nor are we involved as a plaintiff in any material proceeding or pending
litigation. There are no proceedings in which any of our directors, officers or
affiliates, or any registered or beneficial shareholder, is an adverse party or
has a material interest adverse to our interest.
|
15.
|
CONSULTING AND
EMPLOYMENT AGREEMENTS
|
During
the fiscal year ended December 31, 2008, the Company entered into a one-year
employment agreement with Mr. George A. McQuain. The contract was for
one year beginning April 1, 2008. The contract provides for a
one-year employment term, and provides that if the employment agreement is not
otherwise terminated, it will be automatically extended for successive periods
of one year at the end of each calendar year and as such was extended on April
1, 2009.
The
agreement provides that during the term of the contract and for a period of one
year and six months after the termination of the employment agreement for any
reason, Mr. McQuain will not directly or indirectly employ or solicit employees
of the Company, compete with the Company for its customers in any state where
the Company does business, interfere with relationships of the Company, or
provide information about the Company to competitors of the
Company.
The
contract also provides that if Mr. McQuain is terminated by the Company without
cause, and provided he complies with the restrictive covenants of the employment
agreement and signs a release agreement provided by the Company, he will
continue to receive his base salary for the following time period: (1) if the
termination occurs during the initial term, for the remaining portion of such
initial term, or for one year after the date of termination of his employment,
whichever is longer, or (2) if the termination occurs after the initial term,
for one year after the date of termination of his employment. In addition, Mr.
McQuain will continue to receive benefits for the applicable time period, and
the Company will pay him for any bonuses earned by the date of termination. The
employment agreement further provides that if there is a “change in control,”
Mr. McQuain will be entitled to receive the same benefits that he would be
entitled to receive if he were terminated without cause by the
Company.
|
16.
|
INCOME
TAXES
|
Deferred
income taxes arise from the temporary differences in reporting assets and
liabilities for income tax and financial reporting purposes. These
temporary differences primarily resulted from net operating losses and different
amortization and depreciation methods used for financial and tax
purposes.
21
The
components of the provision for income taxes are as follows:
|
2009
|
2008
|
2007
|
||||||||||
|
Current:
|
||||||||||||
|
Federal
|
$ | - | $ | - | $ | - | ||||||
|
State
|
64,500 | - | - | |||||||||
|
Federal
and state deferred tax assets
|
(253,516 | ) | 1,614,873 | 421,230 | ||||||||
|
Change
in valuation allowance
|
(1,089,150 | ) | (1,614,873 | ) | (421,230 | ) | ||||||
|
Provision
for income taxes
|
$ | (1,278,166 | ) | $ | - | $ | - | |||||
The
provision (benefit) for income taxes shown above varies from
statutory
federal income tax rates for those periods as follows:
|
Federal
Income Tax Rate
|
-34.00 | % | -34.00 | % | -34.00 | % | ||||||
|
State
Income Tax Rate, net of federal tax effect
|
3.47 | % | -3.96 | % | -0.78 | % | ||||||
|
Permanent
items
|
0.24 | % | -0.69 | % | -2.35 | % | ||||||
|
Change
in valuation allowance
|
-26.95 | % | ||||||||||
|
Other,
net
|
-25.76 | % | 38.65 | % | 37.13 | % | ||||||
|
Effective
tax rate
|
-83.00 | % | 0.00 | % | 0.00 | % |
The
components of the net deferred tax assets and the deferred tax liabilities are
shown below.
|
2009
|
2008
|
2007
|
||||||||||
|
Deferred
tax assets (liabilities)
|
||||||||||||
|
Current
portion
|
||||||||||||
|
Arising
from operating loss and credit carryforwards
|
$ | 868,848 | $ | 615,332 | ||||||||
|
Total
|
$ | 868,848 | $ | 615,332 | $ | - | ||||||
|
Long
term portion
|
||||||||||||
|
Arising
from operating loss and credit carryforwards
|
6,591,736 | $ | 8,298,145 | $ | 8,719,407 | |||||||
|
Arising
from accumulated depreciation and amortization
|
(3,068,438 | ) | (4,774,847 | ) | (2,965,904 | ) | ||||||
|
Total
|
3,523,298 | 3,523,298 | 5,753,503 | |||||||||
|
Valuation
allowance
|
(2,709,680 | ) | (3,798,830 | ) | (5,413,703 | ) | ||||||
|
Total
|
$ | 813,618 | $ | (275,532 | ) | $ | 339,800 | |||||
As of
December 31, 2009, 2008 and 2007, the Company’s gross deferred tax assets are
reduced by a valuation allowance of $2,709,680, $3,798,830 and $5,413,703,
respectively, due to negative evidence, primarily previous years operating
losses, indicating that a valuation allowance is required under
GAAP. In assessing the realizability of the deferred tax assets,
management considers whether it is more likely than not, that some portion or
all of the deferred tax assets will not be realized. The valuation
allowance at December 31, 2009 is related to deferred tax assets arising from
net operating loss carryforwards. Management believes that based upon
its projection of future taxable income for the foreseeable future, it is more
likely than not that the Company will not be able to realize the full benefit of
the net operating loss carryforwards before they expire due to
the amortization and depreciation losses from the projected
acquisition assets. During 2009, the Company reduced the valuation
allowance related to the remaining deferred tax assets by approximately
$1,100,000. This reduction reflects the Company’s expectation that it
is more than likely than not that it will generate future taxable income to
utilize this amount of net deferred tax assets. While management’s projection of
future taxable income for the foreseeable future does not provide sufficient
positive evidence that the entire balance of valuation allowance should be
eliminated (as previously mentioned), management does believe it is more likely
than not this $1,100,000 reduction in valuation allowance is substantiated by
its projection of future taxable income. The benefit from this reduction was
recorded as income tax benefit in the accompanying statement of
income.
22
In July
2006, the FASB issued guidance which clarifies the accounting for uncertainty in
income taxes recognized in an entity's financial statements in accordance with
GAAP and prescribes a recognition threshold and measurement attributes for
financial statement disclosure of tax positions taken or expected to be taken on
a tax return. Under GAAP, the impact of an uncertain income tax
position on the income tax return must be recognized at the largest amount that
is more-likely-than-not to be sustained upon audit by the relevant taxing
authority. An uncertain income tax position will not be recognized if
it has less than a 50% likelihood of being sustained. Additionally,
GAAP provides guidance on derecognition, classification, interest and penalties,
accounting in interim periods, disclosure and transition.
For the
period ended December 31, 2008, the Company increased its unrecognized tax
benefits for certain positions taken in the amount of $1,147,200 that resulted
in a decrease to the deferred tax asset. The entire amount of this
unrecognized tax benefit, if recognized, would result in a decrease to the
deferred tax asset valuation allowance, and would not have an impact on the
effective tax rate.
A
reconciliation of the beginning and ending amount of unrecognized tax benefits
for fiscal 2008 and 2009 is as follows:
|
Balance
at January 1, 2008
|
$ | - | ||
|
Additions
based on tax positions related to the current year
|
1,147,200 | |||
|
Additions
for tax positions of prior years
|
- | |||
|
Reductions
for tax positions of prior years
|
- | |||
|
Settlements
|
- | |||
|
Total
adjustments at December 31, 2008
|
$ | 1,147,200 | ||
|
Balance
at January 1, 2009
|
$ | 1,147,200 | ||
|
Additions
based on tax positions related to the current year
|
- | |||
|
Additions
for tax positions of prior years
|
- | |||
|
Reductions
for tax positions of prior years
|
- | |||
|
Settlements
|
- | |||
|
Total
adjustments at December 31, 2009
|
$ | 1,147,200 |
At
December 31, 2009, the Company has net operating loss carryforwards remaining of
approximately $22.7 million that may be offset against future taxable income
through 2028. As part of management’s tax strategies they will be
reviewing the use of the net operating loss carryforwards. The Company is
reviewing its tax depreciation methods for future utilization of the
NOL.
The
Company’s income tax returns for all tax years remain open to examination by
federal and state taxing authorities due to the Company’s net operating loss
carryforwards. There were no income tax audits during the year ended December
31, 2009.
|
17.
|
NET INCOME PER COMMON
SHARE
|
Basic net
income per share is computed based on the weighted average number of common
shares outstanding during the period. Diluted net income per common
share is computed based on the weighted average number of common shares
outstanding during the period increased by the effect of dilutive stock options
and stock purchase warrants using the treasury stock method. No such
conversion is assumed where the effect is anti-dilutive, such as when there is a
net loss from continuing operations or when the exercise price of the
potentially dilutive securities is less than the market value of the Company’s
stock. The following table sets forth the computation of basic and
diluted net income per common share:
23
|
Fiscal Year Ended
December 31, 2009
|
Fiscal Year Ended
December 31, 2008
|
Fiscal Year Ended
December 31, 2007
|
||||||||||
|
Numerator
|
||||||||||||
|
Income
from continuing operations
|
$ | 2,813,206 | $ | 1,170,237 | $ | 255,507 | ||||||
|
Income
from discontinued operations
|
- | - | 175,000 | |||||||||
|
Numerator
for diluted income per share available to common
stockholders
|
$ | 2,813,206 | $ | 1,170,237 | $ | 430,507 | ||||||
|
Denominator
|
||||||||||||
|
Weighted
average shares
|
21,654,554 | 20,973,924 | 20,988,348 | |||||||||
|
Effect
of dilutive securities:
|
||||||||||||
|
Treasury
method, effect of employee stock options & warrants
|
1,190,687 | - | - | |||||||||
|
Denominator
for diluted income per share adjusted weighted shares after assumed
exercises
|
22,845,241 | 20,973,924 | 20,988,348 | |||||||||
|
Income
per common share - basic:
|
||||||||||||
|
Income
from continuing operations
|
$ | 0.13 | $ | 0.06 | $ | 0.01 | ||||||
|
Income
from discontinued operations
|
$ | - | $ | - | $ | 0.01 | ||||||
|
Net
Income per common share
|
$ | 0.13 | $ | 0.06 | $ | 0.02 | ||||||
|
Income
per common share - diluted:
|
||||||||||||
|
Income
from continuing operations
|
$ | 0.12 | $ | 0.06 | $ | 0.01 | ||||||
|
Income
from discontinued operations
|
$ | - | $ | - | $ | 0.01 | ||||||
|
Net
Income per common share
|
$ | 0.12 | $ | 0.06 | $ | 0.02 | ||||||
|
18.
|
STOCK OPTIONS AND
WARRANTS
|
Stock
options
The
Company established a 2002 Stock Incentive Plan (the “2002 Plan”) and a 2004
Stock Incentive Plan (the “2004 Plan”), which provide the granting of options to
officers, employees, directors, and consultants of the Company. As of
December 31, 2009, options to purchase 2,000 shares of common stock were
available for future grants under the 2002 Plan and 191,427 shares of common
stock were available for future grants under the 2004 Plan. As of
December 31, 2009, 193,427 shares of common stock were reserved for future stock
option grants and no shares were reserved for warrants to purchase common
stock.
Options
granted under our 2002 Plan and 2004 Plan generally have a three-year vesting
period and expire five years after grant. Most of our stock options vest ratably
during the vesting period, as opposed to awards that vest at the end of the
vesting period. We recognize compensation expense for options using the
straight-line basis, reduced by estimated forfeitures. Upon exercise of stock
options, we issue new shares of our common stock (as opposed to using treasury
shares). All options granted pursuant to the plans shall be
exercisable at a price not less than the fair market value of the common stock
on the date of grant.
The Plans
are administered by the Company's Board of Directors. The Board of
Directors has the authority to select individuals to receive awards, to
determine the time and type of awards, the number of shares covered by the
awards, and the terms and conditions of such awards in accordance with the terms
of the plans. In making such determinations, the Board of Directors
may take into account the recipient's current and potential contributions and
any other factors the Board of Directors considers relevant. The
Board of Directors is authorized to establish rules and regulations and make all
other determinations that may be necessary or advisable for the administration
of the Plan.
24
During
the years ended December 31, 2009 and 2008, the Company granted stock options
totaling 979,000 and 995,500 shares of its common stock, with a weighted average
strike price of $0.39 and $0.24 per share, respectively. Certain stock options
were exercisable upon grant and have a life ranging from four months to five
years. The following table summarizes the Company’s stock options activity under
compensation plans:
|
Number
|
Weighted
|
|||||||
|
Of
|
Average
|
|||||||
|
Options
|
Exercise Price
|
|||||||
|
Balance,
December 31, 2007
|
1,660,900 | $ | 0.75 | |||||
|
Options
granted
|
995,500 | 0.24 | ||||||
|
Options
cancelled
|
(272,000 | ) | 0.28 | |||||
|
Options
expired
|
(186,700 | ) | 1.47 | |||||
|
Options
exercised
|
— | — | ||||||
|
Balance,
December 31, 2008
|
2,197,700 | $ | 0.50 | |||||
|
Options
granted
|
979,000 | 0.39 | ||||||
|
Options
cancelled
|
- | - | ||||||
|
Options
expired
|
(287,000 | ) | 1.18 | |||||
|
Options
exercised
|
— | — | ||||||
|
Balance,
December 31, 2009
|
2,889,700 | $ | 0.40 | |||||
The
following table summarizes information about options outstanding and exercisable
at December 31, 2009:
|
Weighted Average
|
||||||||||||||||||||
|
Shares Underlying
|
Remaining
|
Weighted Average
|
Shares Underlying
|
Weighted Average
|
||||||||||||||||
|
Exercise Price
|
Options Outstanding
|
Contractual Life Years
|
Exercise Price
|
Options Excercisible
|
Exercise Price
|
|||||||||||||||
|
<
$0.89
|
2,697,500 | 3.26 | $ | 0.33 | 868,812 | $ | 0.32 | |||||||||||||
|
$0.89
|
- | - | - | - | - | |||||||||||||||
|
$0.89-$1.55
|
192,200 | 0.41 | $ | 1.36 | 192,200 | $ | 1.36 | |||||||||||||
|
Totals
|
2,889,700 | $ | 0.40 | 1,061,012 | $ | 0.51 | ||||||||||||||
|
Exercise Price Equals,
|
|||||||||||||
|
Number of Remaining
|
Exceeds or is Less than
|
Weighted Average
|
Range of
|
Weighted Average
|
|||||||||
|
Options Granted
|
Market Value as of 12/31/09
|
Exercise Price
|
Exercise Price
|
Fair Value
|
|||||||||
|
2,697,500
|
Less
than
|
$ | 0.33 |
<
$0.89
|
$ | 0.28 | |||||||
|
-
|
Equals
|
$ | - |
$0.89
|
$ | - | |||||||
|
192,200
|
Exceeds
|
$ | 1.36 |
$0.89-$1.55
|
$ | 1.15 | |||||||
|
2,889,700
|
|||||||||||||
A summary
of the status of the Company’s nonvested options as of December 31, 2009 and
changes during the year then ended is presented below:
25
|
Weighted Average
|
||||||||
|
Options
|
Grant-Date
|
|||||||
|
Outstanding
|
Fair Value
|
|||||||
|
Nonvested
options outstanding as of December 31, 2008
|
1,228,500 | $ | 0.23 | |||||
|
Granted
|
979,000 | $ | 0.29 | |||||
|
Vested
|
(378,813 | ) | $ | 0.30 | ||||
|
Forfeited
|
- | $ | - | |||||
|
Nonvested
options outstanding as of December 31, 2009
|
1,828,688 | $ | 0.30 | |||||
Stock
warrants
The
following table summarizes the Company’s stock warrant activity:
|
Number
|
Weighted
|
|||||||
|
Of
|
Average
|
|||||||
|
Warrants
|
Exercise Price
|
|||||||
|
Balance,
December 31, 2007
|
7,532,860 | $ | 2.48 | |||||
|
Warrants
granted
|
— | — | ||||||
|
Warrants
cancelled
|
— | — | ||||||
|
Warrants
expired
|
(887,856 | ) | 1.61 | |||||
|
Warrants
exercised
|
— | — | ||||||
|
Balance,
December 31, 2008
|
6,645,004 | $ | 2.58 | |||||
|
Warrants
granted
|
230,000 | .20 | ||||||
|
Warrants
cancelled
|
— | — | ||||||
|
Warrants
expired
|
(5,600,004 | ) | 2.87 | |||||
|
Warrants
exercised
|
(910,000 | ) | .01 | |||||
|
Balance,
December 31, 2009
|
365,000 | $ | 0.59 | |||||
The
following table summarizes information about warrants outstanding and
exercisable at December 31, 2009:
|
Weighted Average
|
|||||||||||||||||||||
|
Shares Underlying
|
Remaining
|
Weighted Average
|
Shares Underlying
|
Weighted Average
|
|||||||||||||||||
|
Exercise Price
|
Warrants Outstanding
|
Contractual Life Years
|
Exercise Price
|
Warrants Excercisible
|
Exercise Price
|
||||||||||||||||
| $ |
0.20
|
230,000 | 4.3 | $ | 0.20 | 230,000 | $ | 0.20 | |||||||||||||
| $ |
1.25
|
135,000 | 0.8 | $ | 1.25 | 135,000 | $ | 1.25 | |||||||||||||
| 365,000 | $ | 0.59 | 365,000 | $ | 0.59 | ||||||||||||||||
|
|
19.
|
RELATED PARTY
TRANSACTIONS
|
None.
|
20.
|
FAIR VALUE
MEASUREMENT
|
On
January 1, 2008, we adopted FASB guidance regarding fair value measurements
which defines fair value, establishes a framework for using fair value to
measure assets and liabilities, and expands disclosures about fair value
measurements. The statement applies whenever other statements require
or permit assets or liabilities to be measured at fair value. The
guidance is effective for fiscal years beginning after November 15, 2007, except
for nonfinancial assets and liabilities that are recognized or disclosed at fair
value in the financial statements on a nonrecurring basis for which application
has been deferred for one year.
The
guidance established the following fair value hierarchy that prioritizes the
inputs used to measure fair value:
Level 1:
Quoted prices are available in active markets for identical assets or
liabilities as of the reporting date. Active markets are those in
which transactions for the asset or liability occur in sufficient frequency and
volume to provide pricing information on an ongoing basis. Level 1
primarily consists of financial instruments such as exchange-traded derivatives,
listed equities and U.S. government treasury securities.
26
Level 2:
Pricing inputs are other than quoted prices in active markets included in Level
1, which are either directly or indirectly observable as of the reporting
date. Level 2 includes those financial instruments that are valued
using models or other valuation methodologies. These models are
primarily industry-standard models that consider various assumptions, including
quoted forward prices for commodities, time value, volatility factors, and
current market and contractual prices for the underlying instruments, as well as
other relevant economic measures. Substantially all of these
assumptions are observable in the marketplace throughout the full term of the
instrument, can be derived from observable data or are supported by observable
levels at which transactions are executed in the
marketplace. Instruments in this category include non-exchange-traded
derivatives such as over the counter forwards, options and repurchase
agreements.
Level 3:
Pricing inputs include significant inputs that are generally less observable
from objective sources. These inputs may be used with internally
developed methodologies that result in management’s best estimate of fair
value. At each balance sheet date, we perform an analysis of
all instruments subject in accordance with GAAP and include in Level 3 all of
those whose fair value is based on significant unobservable inputs.
The
following table presents our financial assets and liabilities that were
accounted for at fair value on a recurring basis as of December 31, 2009 by
level within the fair value hierarchy:
|
Fair Value Measurements Using
|
||||||||||||||||
|
Total
|
Level 1
|
Level 2
|
Level 3
|
|||||||||||||
|
Assets
|
$ | - | $ | - | $ | - | $ | - | ||||||||
|
Liabilities:
|
||||||||||||||||
|
Derivative
financial instruments
|
$ | - | $ | - | $ | - | $ | - | ||||||||
Our
derivative financial instruments are interest rate swap agreements, which are
observable at commonly quoted intervals for the full term of the derivatives and
therefore considered a level 2 input. During the year ended December
31, 2009, we recorded $7,921 of income relating to the interest rate swap which
is included in the interest expense, net in our consolidated statements of
operations.
In the
accompanying consolidated balance sheets, we have recorded an asset retirement
obligation. As discussed above, the application of the guidance
regarding fair value measurements for these non-recurring items has been
deferred.
|
21.
|
LOSS ON EARLY
EXTINGUISHMENT OF DEBT
|
As
discussed in Note #11 “Senior Lenders’ Notes Payable,” the Company entered into
a credit and security agreement with SunTrust Bank. The proceeds were
used to repay CAMOFI in connection with a settlement agreement, effective as of
March 17, 2009, between the Company and CAMOFI, and to repay the outstanding
principal balance under a loan agreement with Wachovia
Bank. Additionally, the Company entered into a second credit and
security agreement with SunTrust Bank on December 23, 2009. The
proceeds were used to repay certain subordinated, unsecured debentures of $1.2
million from certain stockholders.
In
accordance with GAAP, the net carrying amount of the extinguished debt should be
recognized currently in income of the period of extinguishment as losses or
gains and identified as a separate item.
The
following summarizes the amounts charged to loss on early extinguishment of debt
for the fiscal period ended December 31, 2009:
27
|
Extinguishment
|
||||
|
Item description
|
Charge
|
|||
|
Accelerated
accretion of discount on notes payable
|
$ | 256,988 | ||
|
Accelerated
amortization of capitalized loan fees
|
$ | 76,493 | ||
|
Accelerated
expense of prepaid loan fees
|
$ | 6,400 | ||
|
Stock
expense relating to repriced warrants on debt settlement
|
$ | 107,025 | ||
|
Stock
expense relating to warrants issued to subordinated note
holders
|
$ | 28,054 | ||
|
Total
loss on early extinguishment of debt
|
$ | 474,960 | ||
|
22.
|
DISCONTINUED
OPERATIONS
|
On May 2,
2006, the Company entered into a Shareholder Agreement to sell 50% of Cash
Axcess Corporation (Proprietary) Limited, in a stock arrangement with Industrial
Electronic Investments Limited. Under the requirements of FASB Interpretation
No. 46(R), this transaction constituted a variable interest for the Company,
with the Company being determined as the primary beneficiary. In
exchange for 200 additional shares, or 50% of the outstanding shares of Cash
Axcess Corporation (Proprietary) Limited, the Company received the equivalent of
$745,341 of cash before exchange losses, to be maintained in the accounts of
Cash Axcess and used for their own ongoing operations. This sale resulted in the
Company recording a $555,409 gain deferral on the sale which was subsequently
recorded to the Company’s statement of income upon the sale of the remaining 50%
of Cash Axcess Corporation. During the quarter ended September 30,
2006, the Company approved plans to discontinue its South African operation
which did not fit within management’s strategic plans. On September
30, 2006, the Company finalized the sale of the remaining 50% of Cash Axcess
Corporation (Proprietary) Limited (“CAC”), its Variable Interest Entity for
$700,000. As part of the sale of 50% of CAC on September 30, 2006,
$175,000 of the sale price was held in an escrow account as security to cover
any claims made in connection with a breach of any of the Company's warranties
in the sale agreement. The warranty period ended and the Company
received the full escrowed amount of $175,000 on March 28, 2007. The
Company recognized the $175,000 deferred gain on sale as income from
discontinued operations during the year ended December 31,
2007.
28