Attached files
| file | filename |
|---|---|
| 8-K - FORM 8-K - Clearwater Paper Corp | d8k.htm |
 Clearwater Paper Corporation March 2010 Exhibit 99.1 |
 1 Forward-Looking Statements – Our disclosure and analysis in this presentation contains, in addition to historical
information, certain forward-looking statements within the meaning of the Private Securities Litigation Reform Act of 1995, including statements regarding our
plans to build additional converting and paper making capacity, the financial returns on capital investments, the cost and timing to complete new facilities, future growth opportunities, future revenues, cash flows, capital expenditures, liquidity, cost controls, capital structure, product pricing, sales
volumes, input costs, and our financial condition and results of operations. Words such as “anticipate,” “expect,” “intend,” “plan,” “target,” “project,” “believe,” “schedule,” “estimate,” “may,” and similar expressions are intended to identify such forward-looking statements. These forward looking statements are based
on management’s current expectations, estimates, assumptions and
projections that are subject to change. Our actual results of operations may differ materially from those expressed or implied by the forward-looking statements contained in this report. Important factors that could cause or contribute to
such differences include the risk factors described in Item 1A of Part I of
our Annual Report on Form 10-K for the year ended December 31, 2009, as well as the following: • our ability to implement our growth strategies; • changes in raw material costs and energy availability and costs; • changes in the United States and international economies; • changes in customer product preferences; • cyclical industry conditions; • our qualification to retain alternative fuel mixture tax credits and the tax treatment associated with receipt of such credits; • unanticipated manufacturing disruptions, including equipment malfunction and damage to
our manufacturing facilities caused by fire or weather related
events; • the loss of business from any of our three largest Consumer Products segment customers
or a large Pulp and Paperboard segment customer; • competitive pricing pressures for our products; • changes in the relationship between supply and demand in the forest products industry,
including the amount of available manufacturing capacity and wood fiber
used in manufacturing products; • changes in freight costs and disruptions in transportation services; • unforeseen environmental liabilities or expenditures; • changes in expenses and required contributions associated with our pension plans;
• changes in laws, regulations or industry standards affecting our business; • labor disruptions; • changes in the level of construction activity; and • changes in exchange rates between the U.S. dollar and other currencies. Forward-looking statements contained in this report present management’s views
only as of the date of this presentation. We undertake no obligation to publicly update forward-looking statements, whether as a result of new information,
future events or otherwise. |
 2 Business Overview |
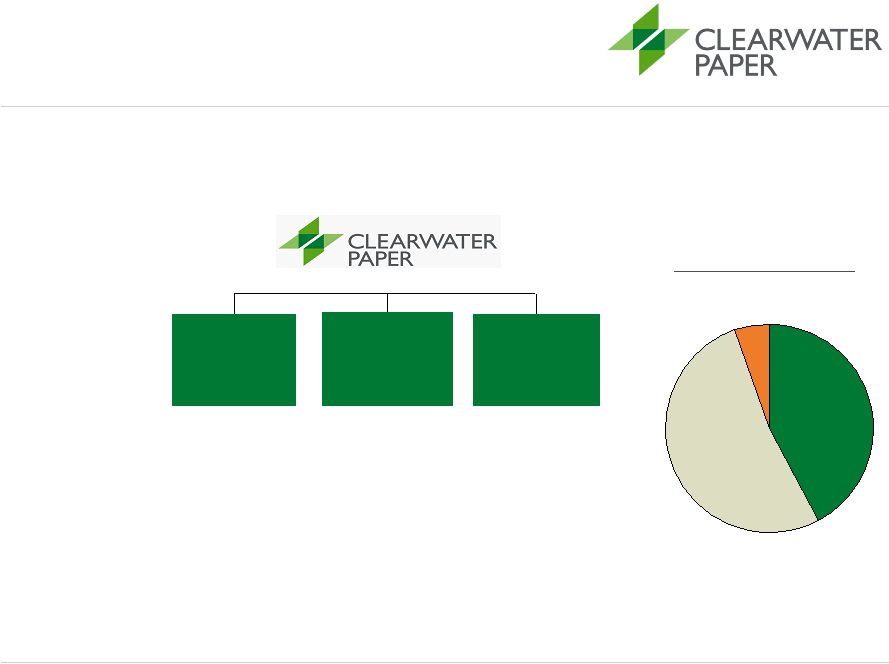 3 Clearwater Paper Overview Pulp & Paperboard (PPD) Net Sales ¹ EBITDA ² EBITDA Margin Capex 4 $686.8 $67.6 ³ 9.8% $ 4.4 $554.0 $138.1 24.9% $ 14.2 $ 70.3 $(16.4) (23.3)% $ - % of Net Sales (2009) ¹ US $ in millions Wood Products (WP) Consumer Products (CPD) WP 5.4% CPD 42.3% PPD 52.4% Note: EBITDA is a non-GAAP measure that management uses to evaluate the cash generating capacity of the
company. The most direct comparable GAAP measure is net earnings. EBITDA, as we
define it, is net earnings adjusted for net interest expense, income taxes, debt retirement costs, depreciation and amortization. Segment EBITDA represents operating income (loss) plus depreciation. See Appendix B for a reconciliation to net earnings or segment
operating income (loss) in accordance with GAAP. 1 Includes intersegment sales. 2 See Appendix B for reconciliation to segment operating income (loss) in accordance with GAAP. 3 Excludes $170.6 million of alternative fuel mixture tax credits. 4 Excludes corporate capital expenditures. Leading manufacturer and seller of private-label consumer tissue and pulp & paperboard,
with $1.25 billion in net sales and $174.2 million of EBITDA for 2009 3 |
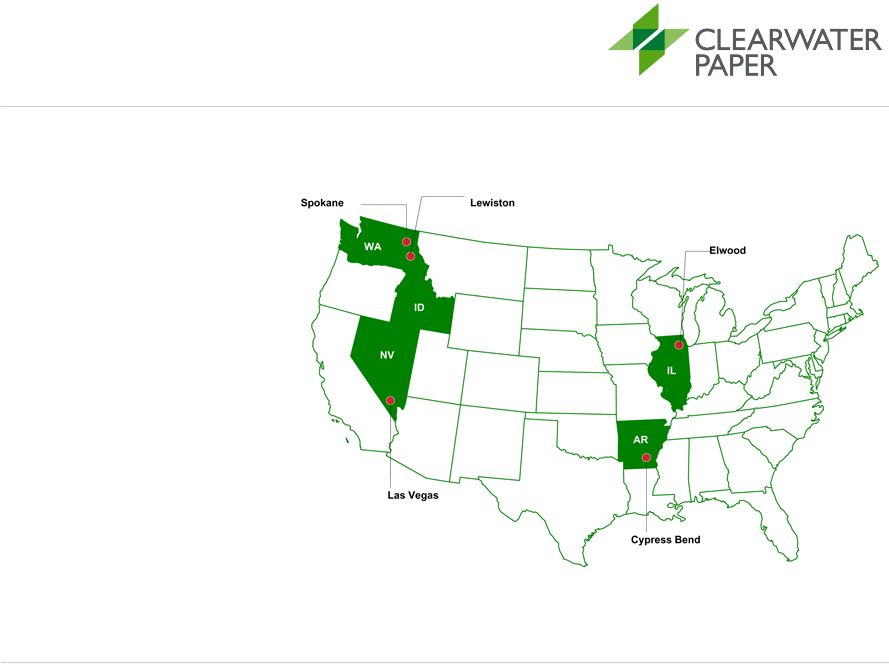 4 Current Clearwater Paper Facilities Overview Spokane, WA Headquarters Office Lewiston, ID Tissue Mill 189,000 (Capacity/Tons) Tissue Converting 102,000 (Capacity/Tons) Bleached Kraft Pulp Mill 540,000 (Capacity/Tons) Bleached Paperboard Mill 435,000 (Capacity/Tons) Sawmill 205,000 (Capacity/MBF) Cypress Bend, AR Bleached Kraft Pulp Mill 305,000 (Capacity/Tons) Bleached Paperboard Mill 330,000 (Capacity/Tons) Las Vegas, NV Tissue Mill 36,000 (Capacity/Tons) Tissue Converting 50,000 (Capacity/Tons) Elwood, IL Tissue Converting 61,000 (Capacity/Tons) |
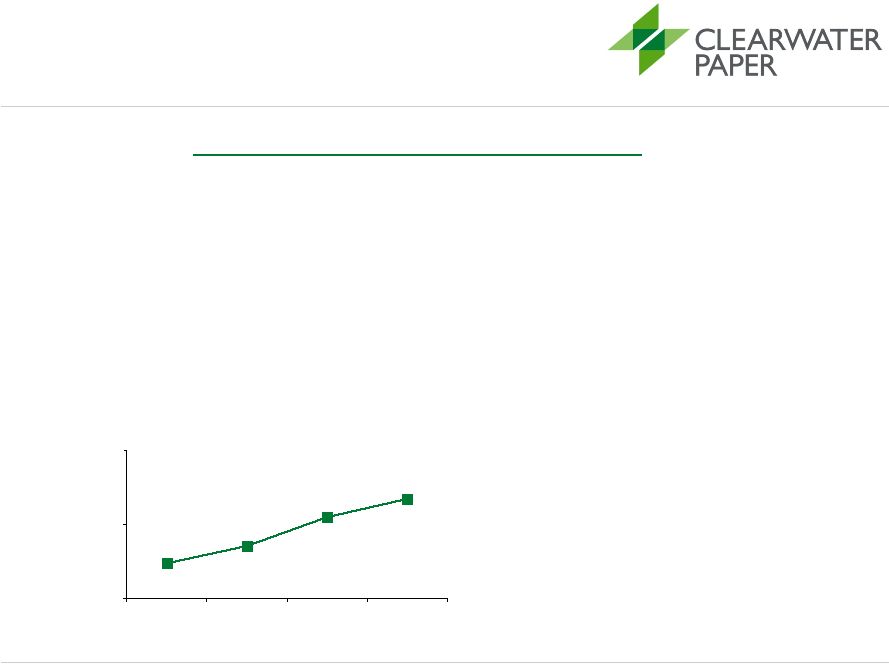 5 High-Quality, Premium Products Consumer Products Segment • Committed to maintaining high-quality products that match the quality of leading national brands • Only U.S. consumer tissue producer that manufactures solely private label tissue $2,357 $2,242 $2,553 $2,673 2,000 2,500 3,000 2006 2007 2008 2009 Price per Ton (Tissue) ¹ 1 Converted short tons. |
 6 Clearwater Paper Business Overview Facilities Key Competitors • ~1,050 Consumer Products Segment Products Capacity (2009) Utilization (2009) Key Customers • Bath Tissue • Household Towels • Napkins • Facial Tissue • 2 Tissue Mills (Idaho & Nevada) • 3 Tissue Converting Facilities (Idaho, Illinois, Nevada) • Tissue Production: 225,000 tons • Tissue Conversion: 213,000 tons • Tissue Mills: 99% • Tissue Converting Facilities: 98% • “Big 3” grocery store chains (~60% of total segment sales in 2009) • Premier regional grocery store chains • Procter & Gamble, Georgia Pacific, Kimberly-Clark Full-Time Employees (2009) |
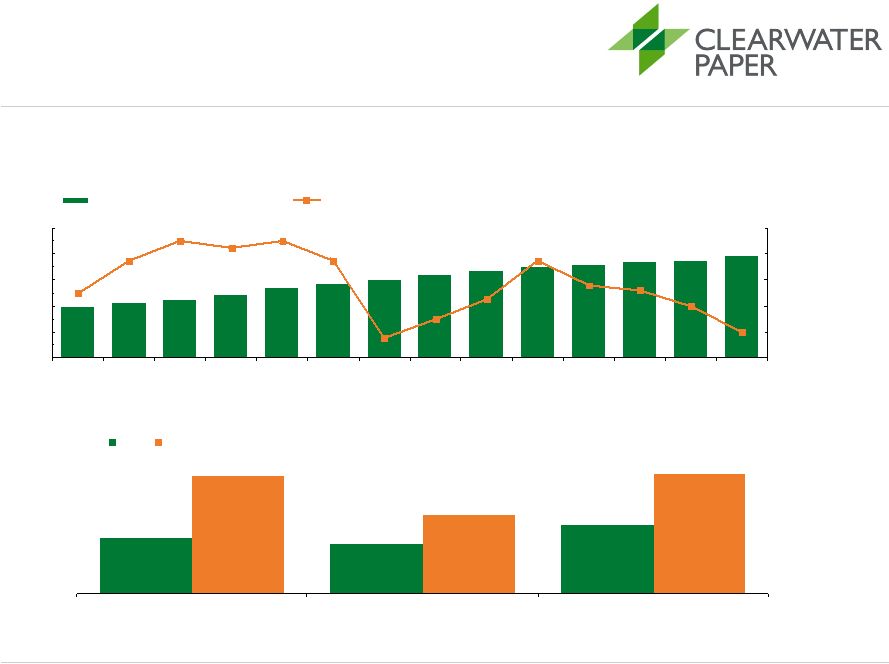 7 Attractive Industry Characteristics -Tissue 30.5% 30.9% 17.8% 13.0% 14.4% 20.2% Facial tissue Bath tissue Paper towels 2002 2009 103 105 109 114 120 124 127 132 134 135 139 130 100 117 1.0% 2.0% 2.6% 2.8% 3.8% 2.3% 1.5% 0.8% 3.8% 4.5% 4.3% 4.5% 3.8% 2.5% 60 80 100 120 140 160 1995 1996 1997 1998 1999 2000 2001 2002 2003 2004 2005 2006 2007 2008 0% 1% 2% 3% 4% 5% U.S. Tissue Demand (Indexed)¹ U.S. GDP % Change Private label tissue market share continues to grow in key products ² Attractive and stable segment of the paper market Source: RISI, IRI 1 Based on converted short tons. 2 Represents market share as a % of sales. |
 8 Premier U.S. Private Label Tissue Producer • Produced approximately 56% of private label tissue products sold in grocery stores in the U.S. in 2009 • Well positioned to benefit from value- oriented customers shifting to private label products • Customers include top three national grocery chains Away- from Home 33% Grocery Stores 45% Non- Grocery 55% Branded 73% Private Label 27% Other 44% Clearwater Paper 56% 2009 U.S. Tissue Market (7.9mm tons) 2009 U.S. At-Home Tissue Market 2009 Grocery Store Product Mix 2009 U.S. Private Label Grocery Tissue Suppliers ¹ Top U.S. Grocery Tissue Suppliers 2009 Market Share Procter and Gamble 26.0% Kimberly-Clark 22.3% Georgia Pacific 20.6% Clearwater Paper 15.2% All Other Private Label 11.8% All Other Brands 4.1% Source: IRI Infoscan, IRI Panel Projections from the Consumer Insights Builder and RISI, Tissue World
Magazine, April/May 2010 1 Total Private Label tissue products sold in grocery stores in the United States in 2009. At-Home 67% |
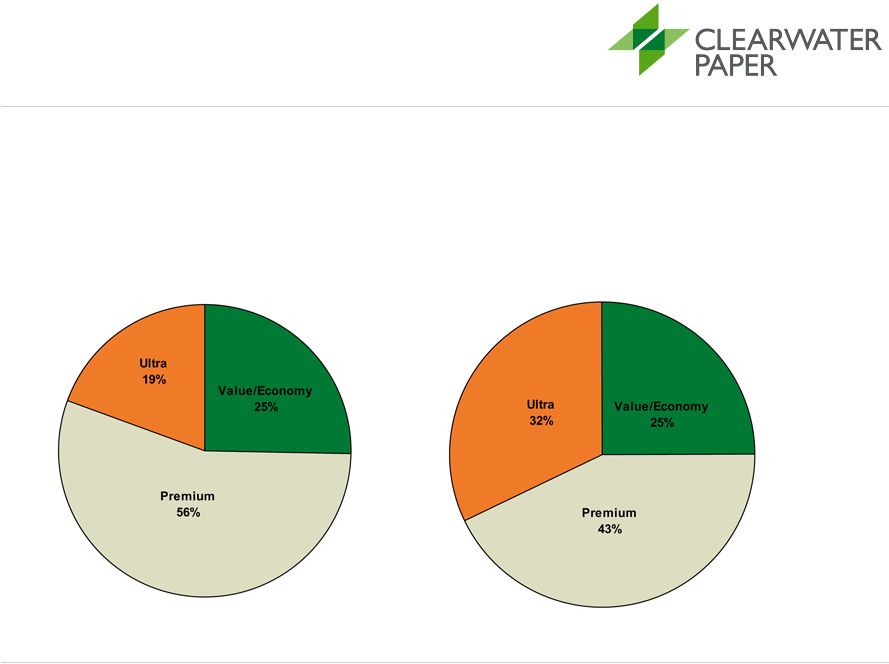 Market Statistics:
- Bathroom tissue & towels represent 86% of 2009 tissue opportunity at grocery - Bathroom tissue alone represents 54% of category 9 US Grocery Bathroom Tissue Market Ultra segment has grown to 32% from 19% in last 3 years Data Source: IRI. Infoscan 52 Weeks Ending 02/10/2010. 2006 Total U.S. Grocery Bathroom Tissue Segment Share 2009 Total U.S. Grocery Bathroom Tissue Segment Share |
 Through-Air-Dried
(TAD) driving ultra segment changes 10 US Grocery Ultra Bathroom Tissue Market 32% Conventional 68% TAD Data Source: IRI. Infoscan 52 Weeks Ending 02/10/2010. 20% Conventional 80% TAD 2006 Total US Grocery Ultra Bathroom Tissue Share 2009 Total US Grocery Ultra Bathroom Tissue Share A/O Corp 1% Clearwater Paper (Conv) 11% Cottonelle (TAD) 17% Quilted Northern (Conv) 20% Charmin Ultra (TAD) 51% Charmin Ultra Strong (TAD) 11% Clearwater Paper (Conv) 7% Cottonelle (TAD) 20% Quilted Northern (Conv) 13% Charmin Ultra Soft (TAD) 49% |
 11 Approximately $149mm of capital expenditures in Consumer Products business between 2000 and 2009 State-of-the-Art Consumer Products Converting Facilities Nevada • TAD machine completed in 2004 • Two new converting lines • Tonnage produced up 39% from 2004 to 2009 Illinois • Began converting operations in 2004 • Added six converting lines since 2004 with facial line scheduled to start in 2010 • Cases produced up 654% since 2004 • Serves as point of access to customers in the Midwestern and Eastern U.S. Idaho • Provides Clearwater with secure pulp supply and significant freight and drying cost savings • Well maintained assets $177 $209 $268 $666 150 200 250 300 350 400 450 500 550 600 650 700 2006 2007 2008 2009 EBITDA per Ton (Tissue) ¹ , ² Note: EBITDA is a non-GAAP measure that management uses to evaluate the cash generating capacity of the
company. The most direct comparable GAAP measure is net earnings. EBITDA, as we
define it, is net earnings adjusted for net interest expense, income taxes, debt retirement costs, depreciation and amortization. Segment EBITDA represents operating income (loss) plus depreciation. See Appendix B for a reconciliation to net earnings or segment
operating income (loss) in accordance with GAAP. 1 Converted short tons. 2 Segment EBITDA divided by total tons shipped. |
 12 High-Quality, Premium Products • Focus on high-end paperboard products, such as pharmaceuticals and cosmetics packaging – Superior print surfaces and cleanliness for discriminating domestic and international markets – Valued industry consulting – Effective logistics to meet just-in-time customer needs Pulp and Paperboard Segment |
 13 Clearwater Paper Business Overview Facilities Key Competitors Pulp and Paperboard Segment Products Capacity (2009) Utilization (2009) Key Customers Full-Time Employees (2009) • Folding Carton and Plate • Liquid Packaging and Cup • Commercial Print • Pulp Sales • 2 Pulp Mills (Arkansas & Idaho) • 2 Bleached Paperboard Mills (Arkansas & Idaho) • Pulp Production: 845,000 tons • Paperboard: 765,000 tons • Pulp Mills: 93% • Bleached Paperboard Mills: 96% • Specialty mid-size paperboard converters • International customers (~17% of total segment sales in 2009) • International Paper, MeadWestvaco, Georgia Pacific, Rock-Tenn • ~1,050 |
 14 Attractive Industry Characteristics – Paperboard 71% 85% 0% 20% 40% 60% 80% 100% 1998 2009 Source: RISI 1 Top 5 manufacturers in 1998 were International Paper, Westvaco, Temple-Inland,
Georgia-Pacific, and Potlatch; Top 5 manufacturers in 2009 were International Paper, MeadWestvaco, Georgia- Pacific, Clearwater Paper, and Evergreen Packaging. 2 Based on tons produced. 3 Average price per short ton of 16 pt SBS folding carton C1S. 2009 North American Bleached Paperboard (SBS) Production Pulp and Paperboard ¹ Capacity Top 5 Manufacturers 109 108 97 102 101 106 108 108 100 100 100 108 103 105 99 $1,031 $880 $760 $810 $740 $713 $773 $728 $700 $727 $713 $772 $718 $861 $961 60 80 100 120 1995 1996 1997 1998 1999 2000 2001 2002 2003 2004 2005 2006 2007 2008 2009 600 800 1,000 1,200 U.S. Bleached Paperboard Demand (Indexed)² U.S. Bleached Paperboard Price ($/short ton)³ 0 Stable demand for U.S. paperboard products Georgia Pacific, 12% Evergreen Packaging, 12% Rock-Tenn, 5% Tembec Paperboard, 3% Weyerhaeuser, 5% MeadWestvaco, 24% International Paper, 25% Smurfit Stone, 2% Clearwater Paper, 12% |
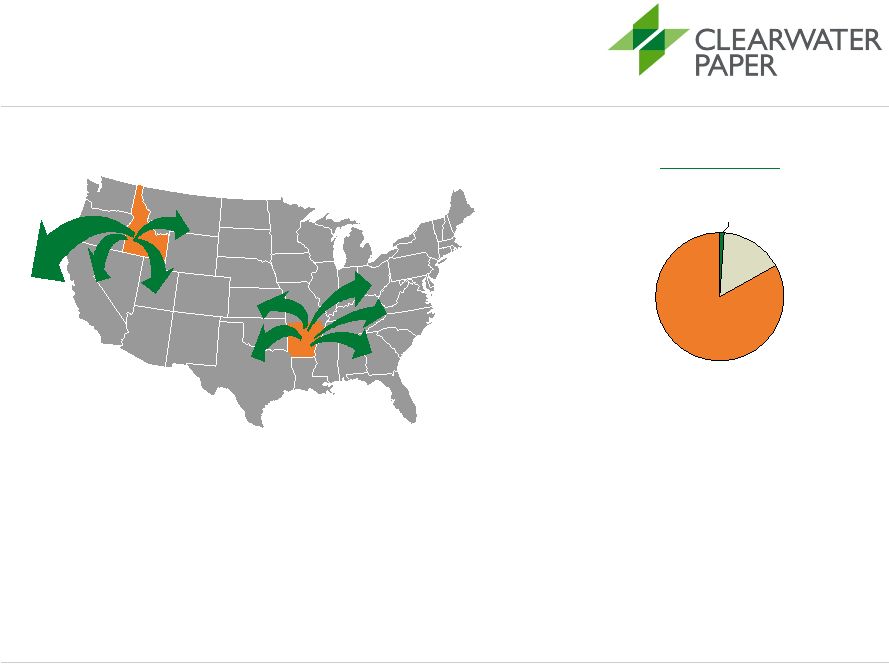 15 Strategically Positioned Pulp & Paperboard Facilities Facilities positioned to provide broad geographic reach and cost-efficient transportation points • Idaho Mill – Reduced transportation costs to Asia versus East Coast competitors – One of two bleached paperboard mills in Western U.S. – 418,000 tons of bleached paperboard produced in 2009 • Arkansas Mill – Central location reduces freight costs to Midwest and East Coast – Most recently built bleached paperboard mill in North America – 317,000 tons of bleached paperboard produced in 2009 2009 PPD Sales • Approximately $138mm of capital expenditures in Pulp & Paperboard business between 2000 and 2009 resulting in increased quality, capacity and efficiency North America, 83% Europe, 1% Asia, 16% |
 16 Clearwater Paper Business Overview Facilities Key Competitors Wood Products Segment Products Capacity (2009) Utilization (2009) Key Customers Full-Time Employees (2009) • Dimensional Framing Lumber • Specialty Appearance Grade Cedar • 1 Sawmill (Idaho) • Sawmill: 205mm board ft • Sawmill: 83% • Builders & lumber brokers • Regional lumber mills • ~300 |
 17 Strategic Growth Initiatives |
 Consumer Products Growth - Current Announced Tissue Converting Expansion • Build two converting lines for approximately $30 million • Expected to generate more than $10 million in EBITDA in first year of operation • Construction expected to be completed in Q2 2011 • Still finalizing site selection, but will be in the Southeast • Expected to serve existing and new customers with both conventional and TAD paper
• Evaluated buy-build-partner-outsource; build expected to have the highest
long-term returns • Would increase company’s capacity and provide significant freight savings for East
Coast customers 18 Consumer Products |
 Consumer Products Growth
- Future 19 Potential Paper Machine • Potential new paper machine would produce TAD paper • TAD ultra tissue products continue to take market share from the conventional ultra, premium and
economy/value segments • Will not be pursued unless expected returns significantly exceed our WACC of 9%-10% • Would take approximately 2 years to complete and would be expected to generate positive EBITDA by the
end of the first year of production • Expected to cost over $120 million (not including land and building costs) • High capacity machine that would produce over 70,000 tons annually • Would also drive need for 5 more converting lines costing roughly $40 million • Not yet approved by the Board of Directors |
 20 Financial Information |
 21 Financial Objectives We intend to actively manage our business through the cycles • Employ effective capital spending for maximum shareholder returns – Closely control capital expenditures and allocate to high ROI projects • Maintain a prudent capital structure – Modest leverage through the cycles • Ensure ample, through-the-cycle liquidity with flexible, low-cost
revolver • Generate cash flows to support growth and provide additional liquidity • Apply stringent cost discipline at corporate and mill level
|
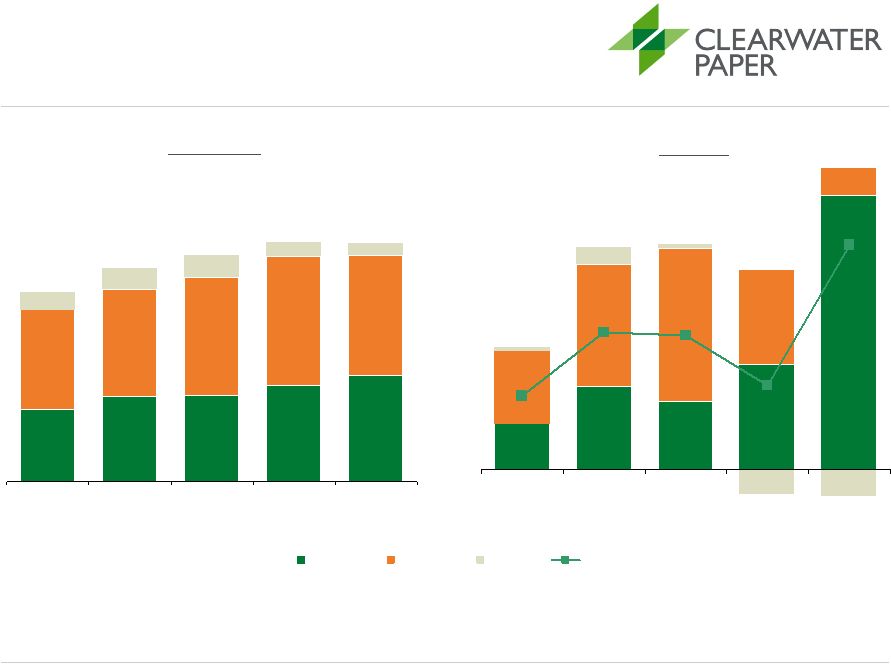 22 Financial Track Record $375 $445 $452 $525 $565 $617 $672 $633 $79 $63 $504 $554 $114 $107 $92 2005 2006 2007 2008 2009 U.S. $ in millions EBITDA Net Sales 1 Note: EBITDA is a non-GAAP measure that management uses to evaluate the cash generating capacity of the
company. The most direct comparable GAAP measure is net earnings. EBITDA, as we define it, is net earnings adjusted for net interest expense, income taxes, debt retirement costs,
depreciation and amortization. Segment EBITDA represents operating income (loss) plus depreciation. See Appendix B for a reconciliation to net earnings or segment operating income (loss) in accordance with
GAAP. 1 Net Sales excludes intersegment net sales and transfers. 2 Excludes $170.6 million of alternative fuel mixture tax credits for the period late January through December 31, 2009. 3 EBITDA margin for total Clearwater Paper business. $993 $1,117 $1,183 $1,255 $1,250 $23 $41 $34 $53 $138 $36 $62 $48 $77 $(12) $(16) $2 $9 13.9% 5.4% 6.0% 8.8% 9.0% 2005 2006 2007 2008 2009 $53 $101 $104 $75 5 Yr Average: $1,160mm $174 2 CPD PPD WP Margin 3 $68² 5 Yr Average: $101mm |
 23 Conservative Capital Structure U.S. $ in millions Note: EBITDA is a non-GAAP measure that management uses to evaluate the cash generating capacity of the
company. The most direct comparable GAAP measure is net earnings. EBITDA, as we define it, is net earnings adjusted for net interest expense, income taxes, debt retirement costs, depreciation and amortization. Segment EBITDA represents operating income (loss) plus depreciation. See Appendix B for a reconciliation to net earnings or segment operating income (loss)
in accordance with GAAP. 1 Excludes accumulated other comprehensive loss 2 As of December 31, 2009, Clearwater Paper is eligible to borrow under the credit facility at LIBOR plus 2.75%. As of December 31, 2009 % of Capitalization x EBITDA for 2009 x EBITDA 5-Yr Average Cash and Short-Term Investments $190.8 New Debt Issuance 148.3 Total Debt $148.3 23.2 % 0.9 x 1.5 x Book Value of Equity 1 $490.7 76.8 % 2.8 x 4.9 x Total Capitalization $639.0 100.0 % 3.7 x 6.3 x Cash and Short-Term Investments $190.8 Available Revolver Amount 2 $106.8 |
 24 Strong Cash Flow Generation U.S. $ in millions 1 2009 amount excludes $170.6 m of alternative fuel mixture tax credits 2 Cash taxes paid amount for 2006 – 2008 represent tax provision amounts as specific amount are not available due to taxes being handled as part of Potlatch’s centralized approach. 3 Cash Net Interest Expense amounts for 2006-2008 represent total net interest expense as specific amounts
are not available due to Potlatch’s centralized approach. 4 See Appendix B for a reconciliation to Cash Flow items in accordance with GAAP. 5 See Appendix B for a reconciliation to Net Cash provided by Operating Activities in accordance with
GAAP. 2006 2007 2008 2009 EBITDA (excluding alternative fuel mixture tax credits) $100.6 $103.7 $75.4 $174.3 Capital Expenditures (27.5) (20.5) (21.3) (19.3) Cash Taxes Paid 2 (12.4) (14.1) (5.6) (41.3) Cash Net Interest Expense 3 (13.0) (13.0) (13.1) (15.1) Working Capital Dec (Inc) 4 13.9 37.6 (21.2) (99.6) Other Cash Flow Items 4 6.9 (5.8) 6.5 88.2 Free Cash Flow 5 $68.5 $87.9 $20.7 $87.2 1 Note: EBITDA is a non-GAAP measure that management uses to evaluate the cash generating capacity of the
company. The most direct comparable GAAP measure is net earnings. EBITDA, as we
define it, is net earnings adjusted for net interest expense, income taxes, debt retirement costs, depreciation and amortization. Segment EBITDA represents operating income (loss) plus depreciation. See Appendix B for a reconciliation to net earnings or segment operating income (loss) in
accordance with GAAP. |
 25 Business Outlook |
 26 Business Outlook • Pricing environment for Consumer Products and Pulp & Paperboard Segments appears stable relative to fourth quarter of 2009 • Consumer Products and Pulp & Paperboard Segment volumes expected to be steady in 2010 • Input costs expected to increase modestly for pulp and energy • Major maintenance expense of $20-25 million planned for 2010, with over 80% of this expense coming in the first quarter • Capital expenditures expected to be $40-45 million in 2010, which includes $12 million from 2
new Southeast converting lines • Tax rate expected to be approximately 35% for 2010 |
 27 Key Investment Highlights • Leading Producer in Attractive Market Segments – #1 producer in at-home private label grocery tissue – High-quality, premium products – Long-standing customer relationships • Attractive Growth Profile – Potentially attractive returns in TAD bath tissue projects – High returns expected from efficiency improvement capital expenditures • Conservative Financial Profile – Strong balance sheet – Substantial free cash flow generation |
 28 Experienced Management Team Gordon Jones, CEO and Director • Over 25 years of experience in the paper industry in both operational and financial roles • Vice President of Potlatch in 2008 • CEO and Director of Blue Ridge Paper Products from 1999-2000 • Served in increasing roles for Smurfit Stone and its predecessor companies from 1983 to 2000, including in various executive officer roles. • Held a series of positions with Procter & Gamble from 1976 to 1983 Linda Massman, CFO • Over 11 years of experience in the consumer products retailing industries • Vice President of Potlatch in 2008 • Group Vice President, Finance and Corporate Planning, for SUPERVALU from
2002-2008 • Strategy consultant with Accenture, Finance and Treasury at Ralphs Grocery Company and
Bank of America Robert DeVleming, Vice President of Consumer Products
• Over 30 years of experience in the paper industry in operations, sales and strategic growth • Vice President of Consumer Products for Potlatch from 2004-2008 • Vice President of Consumer Products Sales for Potlatch from 2003-2004 • Vice President, Tissue Expansion and led the Las Vegas TAD paper machine and converting lines Thomas Colgrove, Vice President of Pulp and Paperboard • Over 25 years of experience in the paper industry in operations • Senior Director – North America Product Supply for Kimberly Clark Corporation • Mill Manager of Kimberly Clark’s largest mill in North America from 2003 to
2006 • Numerous positions throughout Kimberly Clark |
 29 Thank you. |
 30 Appendix A: Financial Detail |
 31 Income Statement U.S. $ in millions 2005 2006 2007 2008 2009 Net Sales $992.7 $1,116.9 $1,183.0 $1,255.3 $1,250.1 Costs & Expenses Materials, Labor, & Other Operating Expenses $950.9 $1,033.6 $1,083.8 $1,179.4 $1,052.2 Selling, General, & Administrative 44.1 45.5 46.8 47.4 71.1 Income from Canadian Lumber Settlement - 8.5 - - - Alternative fuel mixture tax credit - - - - 170.6 Earnings (Loss) Before Interest, Debt Retirement Costs and Income Taxes $(2.2) $46.3 $52.4 $28.5 $297.4 Margin (%) (0.2)% 4.1 % 4.4 % 2.3 % 23.8 % Depreciation and Amortization 54.9 54.3 51.3 47.0 47.4 EBITDA ¹ $52.7 $100.6 $103.7 $75.4 $174.2 Margin (%) 5.3 % 9.0 % 8.8 % 6.0 % 13.9 % Interest Expense 12.6 13.0 13.0 13.1 15.5 Debt Retirement Cost - - - - 6.2 Earnings Before Income Taxes $(14.8) $33.3 $39.4 $15.3 $275.7 Income Tax provision (6.1) 12.4 14.1 5.6 93.2 Net Earnings $(8.7) $20.9 $25.3 $9.7 $182.5 Note: EBITDA is a non-GAAP measure that management uses to evaluate the cash generating capacity of the
company. The most direct comparable GAAP measure is net earnings. EBITDA, as we
define it, is net earnings adjusted for net interest expense, income taxes, debt retirement costs, depreciation and amortization. Segment EBITDA represents operating income (loss) plus depreciation. See Appendix B for a reconciliation to net earnings or segment
operating income (loss) in accordance with GAAP. 1 EBITDA for 2009 excludes $170.6m related to the alternative fuel mixture tax credit.
|
 32 Balance Sheet 1 Includes Land, Pension Assets & Other Long-Term Assets. 2 Includes Non-Current Pension and OPEB and Other Long-Term Liabilities. U.S. $ in millions 2006 2007 2008 2009 Assets Current Assets Cash & Short-term investments $0.2 - $14.0 $190.8 Net Receivables 114.0 95.2 104.0 94.5 Taxes receivable - - - 101.3 Inventories 135.3 142.5 154.4 169.8 Prepaid Expenses 1.8 1.4 2.4 3.0 Deferred Taxes 8.2 8.6 14.8 12.9 $259.4 $247.7 $289.6 $572.3 Long-Term Assets Net Plant & Equipment 437.0 408.3 385.1 359.3 Other 44.6 41.9 8.5 15.9 481.6 450.2 393.7 375.2 Total Assets $741.0 $697.9 $683.3 $947.5 Liabilities Current Liabilities Notes Payable - - $50.0 - Note Payable to Potlatch - - 100.0 - Accounts Payable & Accrued Liabilities 84.2 111.2 116.5 109.8 Other 8.3 8.0 9.1 9.9 Long Term Liabilities Note Payable to Potlatch 100.0 100.0 - - Long Term Debt - - - 148.3 Deferred Taxes 83.3 74.8 1.8 - Other Long Term Obligations 2 136.4 135.9 224.9 242.3 Accrued Taxes - - - 73.5 Total Liabilities $412.2 $429.9 $502.3 $583.8 Total Stockholders' Equity $328.8 $268.0 $181.0 $363.7 Total Stockholders' Equity & Liabilities $741.0 $698.0 $683.3 $947.5 1 |
 33 Cash Flow Statement Note: Other Cash Flow Items represents the sum of adjustments made to the following
accounts in order to reconcile Net Earnings (Loss) to Net Operating Cash Flows: Deferred Taxes, Equity- Based Compensation Expense, Employee Benefit Plans, and (Gain) Loss on Disposal of Plant and Equipment. Other Cash Flow Items is not required by or presented in accordance with generally accepted accounting principles in the United States (GAAP). 1 Includes $170.6 million of alternative fuel mixture tax credits for the period late January through December 31, 2009. U.S. $ in millions 2005 2006 2007 2008 2009 Cash Flow From Operations Net earnings¹ $(8.7) $20.9 $25.3 $9.7 $182.5 Depreciation and Amortization 54.9 54.3 51.3 47.0 47.4 Deferred Taxes (5.6) 8.3 (8.1) 4.9 (4.6) Working Capital Decrease / (Increase) (5.1) 13.9 37.6 (21.2) (99.6) Other Cash Flow Items 2.6 (1.4) 2.3 1.6 99.1 Net Cash Provided by Operations $38.0 $96.0 $108.5 $42.1 $224.8 Cash Flows From Investing Additions to Plant & Equipment $(43.4) $(27.5) $(20.5) $(21.3) $(19.3) Change in Short-Term Investments - - - (10.8) (177.1) Other, Net 0.1 0.1 - 0.6 - Net Cash Used for Investing $(43.4) $(27.4) $(20.5) $(31.5) $(196.4) Cash Flows From Financing Net Payments to Potlatch $4.6 $(68.8) $(88.5) $(79.9) - Change in Book Overdrafts - - - 8.8 - Net Proceeds from long-term debt - - - - $38.9 Increase (decerase) in notes payable - - - 50.0 (50.0) Repayment to Potlatch - - - 16.5 (16.5) Deferred Loan Fees - - - (2.8) (1.2) Other, Net 0.5 0.3 0.3 (0.1) - Net Cash Provided by (Used for) Financing $5.1 $(68.6) $(88.2) $(7.3) $(28.8) Change in Cash $(0.2) $0.0 $(0.2) $3.2 $(0.4) |
 34 Segment Financials – Consumer Products • Net sales increased by $49.4M, or 10% and operating income grew $84.8M, or 227%, from 2008 to 2009, driven by higher net selling prices and increased shipments coupled with lower input costs. - Average net selling prices were 5% higher in 2009 when compared to the average in 2008 - Shipment volumes were also 5% higher compared to the same period in 2008, primarily due to higher production • Operating costs decreased $35.3M compared to 2008 and were primarily attributable to lower costs for pulp, freight and energy Comments U.S. $ in millions 2005 2006 2007 2008 2009 Net Sales Consumer Products $375.3 $445.0 $452.0 $504.6 $554.0 Intersegment Net Sales or Transfer (0.1) (0.1) (0.1) (0.1) (0.1) Total $375.2 $444.9 $451.9 $504.5 $553.9 Operating Income $7.5 $25.7 $17.6 $37.3 $122.1 Depreciation 15.6 15.8 16.3 15.7 16.0 EBITDA $23.0 $41.5 $33.9 $53.0 $138.1 % Margin 6.1 % 9.3 % 7.5 % 10.5 % 24.9 % Assets 285.5 269.2 256.5 252.0 256.9 Note: EBITDA is a non-GAAP measure that management uses to evaluate the cash generating capacity of the
company. The most direct comparable GAAP measure is net earnings. EBITDA, as we
define it, is net earnings adjusted for net interest expense, income taxes, debt retirement costs, depreciation and amortization. Segment EBITDA represents operating income (loss) plus depreciation. See Appendix B for a reconciliation to net earnings or segment
operating income (loss) in accordance with GAAP. |
 35 Segment Financials – Pulp & Paperboard Comments • Net sales decreased by $38.9M, or 6%, but operating income grew $191.3M, for 2009 compared to 2008, driven primarily by $170.6M of pre-tax income related to alternative fuel mixture tax credits. • Paperboard net sales were 5% lower in 2009 compared to 2008. - Paperboard net sales prices were up 3% - Paperboard shipments were down 7% • Pulp net sales were $18.4M lower, or 20%, due almost entirely to lower pricing. • Operating costs decreased $71.4M compared to 2008 and were primarily attributable to lower costs for wood fiber, chemicals and energy U.S. $ in millions 2005 2006 2007 2008 2009 Net Sales Paperboard $503.4 $538.2 $569.4 $644.4 $612.8 Pulp 64.6 77.7 102.6 92.3 73.9 Other 0.9 1.1 1.1 0.8 0.1 Intersegment Net Sales or Transfer (43.7) (52.1) (55.8) (65.3) (53.4) Total $525.2 $565.0 $617.2 $672.3 $633.4 Operating Income (Loss) $(0.3) $26.1 $45.1 $18.9 $210.2 Depreciation 36.4 35.5 32.4 28.9 28.0 EBITDA¹ $36.1 $61.6 $77.5 $47.8 $67.6 % Margin 6.9 % 10.9 % 12.5 % 7.1 % 10.7 % Assets 406.1 383.6 363.6 362.0 335.2 Note: EBITDA is a non-GAAP measure that management uses to evaluate the cash generating capacity of the
company. The most direct comparable GAAP measure is net earnings. EBITDA, as we
define it, is net earnings adjusted for net interest expense, income taxes, debt retirement costs, depreciation and amortization. Segment EBITDA represents operating income (loss) plus depreciation. See Appendix B for a reconciliation to net earnings or segment operating income (loss)
in accordance with GAAP. 1 Excludes $170.6 million of alternative fuel mixture tax credits for the period late January through
December 31, 2009. |
 36 Segment Financials – Wood Products • Net sales decreased $18.7M, or 21%, from 2008 to 2009, due primarily to 23% decrease in net selling prices • Expenses decreased by $14.8M due largely to lower log costs and lower overall costs associated with decreased lumber shipments during 2009 • The operating loss for the segment increased $3.8M during 2009 when compared to 2008 and was due to the prolonged housing market downturn Comments U.S. $ in millions 2005 2006 2007 2008 2009 Net Sales Wood Products $97.6 $113.3 $121.4 $89.0 $70.3 Intersegment Net Sales or Transfer (5.3) (6.3) (7.4) (10.5) (7.6) Total $92.3 $107.1 $113.9 $78.6 $62.7 Operating Income (Loss) $(0.0) $6.1 $(0.1) $(14.5) $(18.3) Depreciation 2.5 2.5 2.2 2.0 1.9 EBITDA $2.5 $8.6 $2.1 $(12.5) $(16.4) % Margin 2.7 % 8.1 % 1.8 % NM NM Assets 34.9 38.7 53.7 63.0 51.6 Note: EBITDA is a non-GAAP measure that management uses to evaluate the cash generating capacity of the
company. The most direct comparable GAAP measure is net earnings. EBITDA, as we
define it, is net earnings adjusted for net interest expense, income taxes, debt retirement costs, depreciation and amortization. Segment EBITDA represents operating income (loss) plus depreciation. See Appendix B for a reconciliation to net earnings or segment
operating income (loss) in accordance with GAAP. |
 37 Total Cost: % of Total Cost of Sales 2008 2009 Key Historical Cost Drivers Key cost drivers are wood fiber, energy, transportation and maintenance Wood Fiber Energy Transportation 2007 Total Cost: % of Total Cost of Sales Total Cost: % of Total Cost of Sales $163 / ton NA $89.8 8% $113.7 9% $96.2 9% $124.7 11% $142.8 12% $116.8 10% NA NA $88.1 7% $96.9 9% $203 / ton 34% $178 / ton 30% Maintenance & Repair Total Cost: % of Total Cost of Sales |
 38 Appendix B: US GAAP Reconciliation |
 39 Reconciliation of Non-GAAP to GAAP: EBITDA U.S. $ in millions Note: EBITDA is a non-GAAP measure that management uses to evaluate the cash generating capacity of the
company. The most direct comparable GAAP measure is net earnings. EBITDA, as we define it, is net earnings adjusted for net interest expense, income taxes, debt retirement costs, depreciation and amortization. Segment EBITDA represents operating income (loss) plus depreciation. 1 Excludes $170.6 million of alternative fuel mixture tax credits for the period late January through December 31, 2009. 2005 2006 2007 2008 2009 Net Earnings (Loss) $(8.7) $20.9 $25.3 $9.7 $182.5 Debt Retirement Costs - - - - $6.3 Income Tax Provision (Benefit) (6.1) 12.4 14.1 5.6 93.2 Interest Expense 12.6 13.0 13.0 13.1 15.5 Earnings (Loss) Before Interest and Income Taxes (2.2) 46.3 52.4 28.5 297.5 Depreciation & Amortization 54.9 54.3 51.3 47.0 47.4 EBITDA (including alternative fuel mixture tax credits) $52.7 $100.6 $103.7 $75.4 $344.9 EBITDA, as Adjusted¹ $52.7 $100.6 $103.7 $75.4 $174.2 |
 40 Reconciliation of Non-GAAP to GAAP: EBITDA by Segment U.S. $ in millions Note: EBITDA is a non-GAAP measure that management uses to evaluate the cash generating capacity of the
company. The most direct comparable GAAP measure is net earnings. EBITDA, as we define it, is net earnings adjusted for net interest expense, income taxes, debt retirement costs, depreciation and amortization. Segment EBITDA represents operating income (loss) plus depreciation. 1 Excludes $170.6 million of alternative fuel mixture tax credits for the period late January through December 31, 2009. Reconciliation - EBITDA by Segment 2005 2006 2007 2008 2009 Consumer Products Operating Income $7.5 $25.7 $17.6 $37.3 $122.1 Depreciation 15.6 15.8 16.3 15.7 16.0 EBITDA $23.0 $41.5 $33.9 $53.0 $138.1 Pulp & Paperboard Operating Income (Loss)¹ $(0.3) $26.1 $45.1 $18.9 $39.6 Depreciation 36.4 35.5 32.4 28.9 28.0 EBITDA¹ $36.1 $61.6 $77.5 $47.8 $67.6 Wood Products Operating Income (Loss) $(0.0) $6.1 $(0.1) $(14.5) $(18.3) Depreciation 2.5 2.5 2.2 2.0 1.9 EBITDA $2.5 $8.6 $2.1 $(12.5) $(16.4) |
 41 Reconciliation of Non-GAAP to GAAP: Free Cash Flow U.S. $ in millions 1 2009 amount excludes $170.6 million of alternative fuel mixture tax credits for the period late January through December 31, 2009. 2006 2007 2008 2009 Net Cash Provided by Operating Activities¹ $96.0 $108.5 $42.1 $54.2 Capital Expenditures (27.5) (20.5) (21.3) (19.3) Non-cash Net Interest Expense 0.4 Non-cash Tax Expense 51.9 Free Cash Flow $68.5 $88.0 $20.8 $87.2 |
 42 Reconciliation of Working Capital Dec (Inc) U.S. $ in millions 2006 2007 2008 2009 Dec (Inc) in Receivables $(21.2) $18.8 $(8.8) $9.5 Inc in Tax Receivables - - - $(101.3) Dec (Inc) in Inventories 32.1 (8.5) (14.0) (16.8) Dec (Inc) in Prepaid Expenses (0.7) 0.4 (0.5) 0.1 Inc (Dec) in Taxes Payable 4.6 18.1 0.8 (0.8) Inc (Dec) in Accounts Payable and Accrued Liabilities (0.8) 8.9 1.3 9.7 Working Capital Dec (Inc) $13.9 $37.6 $(21.2) $(99.6) |
 43 Reconciliation of Other Cash Flow Items U.S. $ in millions 2006 2007 2008 2009 Equity-Based Compensation Expense $1.4 $3.3 $2.3 $3.0 Employee Benefit Plans 3.0 (1.0) 1.1 16.7 (Gain) Loss on Disposal of Plant and Equipment 0.3 0.1 (0.2) 0.2 Increase in Other Assets - - (1.6) (0.5) Funding of Qualified Pension Plans (6.1) - - - Excess Tax Benefit from Share- based Payment Arrangements - - - (0.1) Change in Non-current Accrued Taxes - - - 73.5 Change in Deferred Taxes 8.3 (8.1) 4.9 (4.6) Other Cash Flow Items $6.9 $(5.8) $6.5 $88.2 |
 44 Appendix C: Customer Relationships |
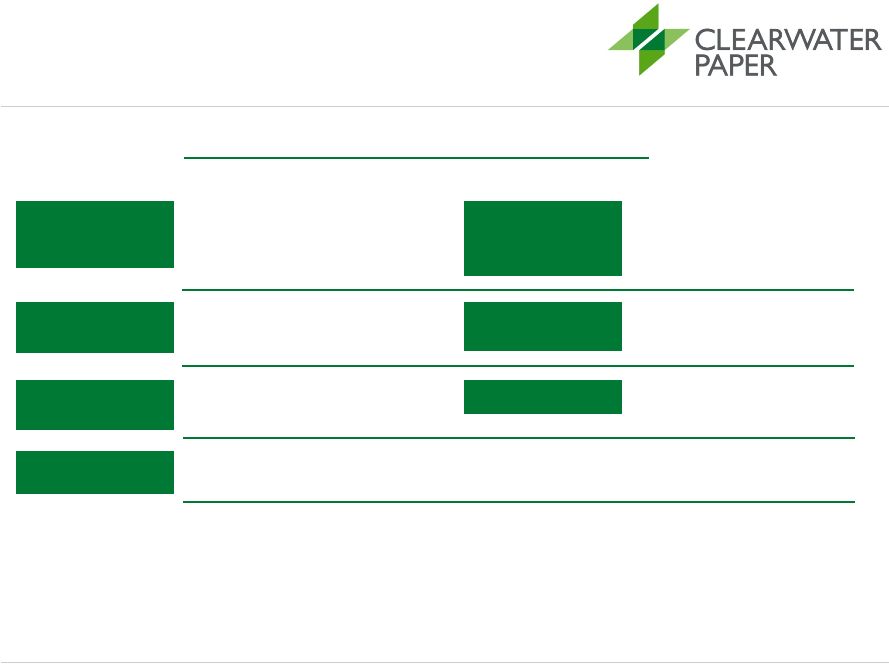
 45 Long-Standing Customer Relationships Consumer Products Segment Top 10 Customers Length of Customer Relationship Customer 1 25+ Customer 2 25+ Customer 3 12 Customer 4 25+ Customer 5 25+ Customer 6 25+ Customer 7 10 Customer 8 10 Customer 9 20 Customer 10 10 Average Length of Customer Relationships 19 Years |
 46 Long-Standing Customer Relationships Pulp and Paperboard Segment Top 10 Customers Length of Customer Relationship Customer 1 10 Customer 2 26 Customer 3 20 Customer 4 37 Customer 5 37 Customer 6 41 Customer 7 21 Customer 8 26 Customer 9 21 Customer 10 11 Average Length of Customer Relationships 25 Years |