Attached files
Table of Contents
UNITED STATES
SECURITIES AND EXCHANGE COMMISSION
Washington, D.C. 20549
FORM 10-K
| x | ANNUAL REPORT PURSUANT TO SECTION 13 or 15(d) OF THE SECURITIES EXCHANGE ACT OF 1934 |
For the fiscal year ended January 2, 2010
OR
| ¨ | TRANSITION REPORT PURSUANT TO SECTION 13 OR 15(d) OF THE SECURITIES EXCHANGE ACT OF 1934 |
For the transition period from to
Commission File Number 01-07284
Baldor Electric Company
Exact name of registrant as specified in its charter
| Missouri | 43-0168840 | |
| State or other jurisdiction of incorporation or organization |
IRS Employer Identification No. | |
| 5711 R. S. Boreham, Jr. St | ||
| Fort Smith, Arkansas | 72901 | |
| Address of principal executive offices | Zip Code | |
479-646-4711
Registrant’s telephone number, including area code
Securities registered pursuant to section 12(b) of the Act:
| Title of each class |
Name of each exchange on which registered | |
| Common Stock, $0.10 Par Value | New York Stock Exchange |
Securities registered pursuant to section 12(g) of the Act: None
Indicate by check mark if the registrant is a well-known seasoned issuer, as defined in Rule 405 of the Securities Act. Yes x No ¨
Indicate by check mark if the registrant is not required to file reports pursuant to Section 13 or Section 15(d) of the Act. Yes ¨ No x
Indicate by check mark whether the registrant (1) has filed all reports required to be filed by Section 13 or 15(d) of the Securities Exchange Act of 1934 during the preceding 12 months and (2) has been subject to such filing requirements for the past 90 days. Yes x No ¨
Indicate by check mark whether the registrant has submitted electronically and posted on its corporate Website, if any, every Interactive Data File required to be submitted and posted pursuant to Rule 405 of Regulation S-T during the preceding 12 months. Yes ¨ No ¨
Indicate by check mark if disclosure of delinquent filers pursuant to Item 405 of Regulation S-K is not contained herein, and will not be contained, to the best of registrant’s knowledge, in definitive proxy or information statements incorporated by reference in Part III of this Form 10-K or any amendment to this Form 10-K. ¨
Indicate by check mark whether the registrant is a large accelerated filer, an accelerated filer, a non-accelerated filer, or a smaller reporting company. See the definitions of “large accelerated filer”, “accelerated filer” and “smaller reporting company” in Rule 12b-2 of the Exchange Act.
| Large accelerated filer | x | Accelerated filer | ¨ | |||
| Non-accelerated filer | ¨ | Smaller reporting company | ¨ | |||
Indicate by check mark whether the registrant is a shell company (as defined in Rule 12b-2 of the Act). Yes ¨ No x
The aggregate market value of voting and non-voting common stock held by non-affiliates of the registrant based on the closing price on July 4, 2009, was $979,673,409.
At January 30, 2010, there were 46,618,873 shares of the registrant’s common stock outstanding.
DOCUMENTS INCORPORATED BY REFERENCE
Portions of the Proxy Statement for the Annual Meeting of Shareholders to be held May 1, 2010 (the “2010 Proxy Statement”), are incorporated by reference into Part III.
Table of Contents
| Page | ||||||
| 2 | ||||||
| Item 1 |
– | 3 | ||||
| Item 1A |
– | 8 | ||||
| Item 1B |
– | 11 | ||||
| Item 2 |
– | 11 | ||||
| Item 3 |
– | 12 | ||||
| Item 4 |
– | 13 | ||||
| PART II | ||||||
| Item 5 |
– | Market for the Registrant’s Common Equity, Related Stockholder Matters and Issuer Purchases of Equity Securities | 14 | |||
| Item 6 |
– | 16 | ||||
| Item 7 |
– | Management’s Discussion and Analysis of Financial Condition and Results of Operations |
16 | |||
| Item 7A |
– | 25 | ||||
| Item 8 |
– | 25 | ||||
| Item 9 |
– | Changes in and Disagreements With Accountants on Accounting and Financial Disclosure |
55 | |||
| Item 9A |
– | 55 | ||||
| Item 9B |
– | 56 | ||||
| PART III | ||||||
| Item 10 |
– | 59 | ||||
| Item 11 |
– | 60 | ||||
| Item 12 |
– | Security Ownership of Certain Beneficial Owners and Management and Related Stockholder Matters |
60 | |||
| Item 13 |
– | Certain Relationships and Related Transactions, and Director Independence |
61 | |||
| Item 14 |
– | 61 | ||||
| PART IV | ||||||
| Item 15 |
– | 62 | ||||
| 63 | ||||||
| 63 | ||||||
| 65 | ||||||
Table of Contents
This annual report, the documents incorporated by reference into this annual report, and other written reports and oral statements made time to time by Baldor and its representatives may contain statements that are forward-looking. The forward-looking statements (generally identified by words or phrases indicating a projection or future expectation such as “assume”, “believe”, “can”, “continue”, “could”, “depend”, “estimate”, “expect”, “forecast”, “future”, “if”, “intend”, “may”, “ongoing”, “pending”, “probable”, “projected”, “should”, “subject to”, “will”, “would”, or any grammatical forms of these words or other similar words) are based on our current expectations and are subject to risks and uncertainties. Accordingly, you are cautioned that any such forward-looking statements are not guarantees of future performance and involve risks and uncertainties, and that actual results may differ materially from those projected in the forward-looking statements as a result of various factors, including those more fully described in “Risk Factors”. Baldor is under no duty or obligation to update any of the forward-looking statements after the date of this annual report.
Table of Contents
| Item 1. | Business |
General
We are a leading marketer, designer, and manufacturer of industrial electric motors, mechanical power transmission products, drives, and generators, currently supplying over 10,000 customers in more than 200 industries. Our products are sold to original equipment manufacturers (“OEM”) and distributors serving markets in the United States and throughout the world. We focus on providing customers with value through a combination of quality products and customer service, short lead times and total cost of ownership, which takes into account initial product cost, product life, maintenance costs and energy consumption. We estimate that the initial purchase price and lifetime maintenance costs of a typical electric motor represents approximately 2% of the total cost of owning the motor, with electricity making up the remaining cost, over its lifetime. Due to high energy prices, our customers increasingly base their purchasing decisions on the energy efficiency of our motors and other products, rather than on the purchase price alone.
On January 31, 2007, we acquired Reliance Electric Company (“Reliance”) and certain affiliates from Rockwell Automation, Inc. (“Rockwell”). Reliance was a leading manufacturer of industrial electric motors and other mechanical power transmission products sold under the Reliance® and Dodge® brand names. The acquisition extended our product offerings, provided a manufacturing base in China for the Asian markets, increased our manufacturing capabilities and flexibility, strengthened our management team, and provided strong opportunities for synergies and cost savings.
On August 29, 2008, we acquired Poulies Maska, Inc. (“Maska”) of Ste-Claire, Quebec, Canada. Maska was a designer, manufacturer and marketer of sheaves, bushings, couplings and related mechanical power transmission components. The acquisition gave us additional manufacturing plants in both Canada and China and expanded our market share of sheaves and bushings in North America.
Our Competitive Strengths
We believe that we are well positioned in the markets in which we compete based on the following competitive strengths.
| • | Excellent reputation and strong brand name preference. |
We have an excellent reputation for producing high-quality innovative products, having exceptional engineering expertise, excellent customer service, and an overall leadership position in the industry. Baldor•Reliance® was the preferred brand in 19 of 21 independent surveys of industrial electric motor users conducted over the past five years. Dodge also holds a top tier brand preference for mechanical power transmission products in the industries to which these products are sold.
| • | Emphasis on providing our customers the highest value. |
We provide value to our customers by offering a broad range of high quality products, short lead times on custom products, quick delivery for stock products and local customer service and support. We also offer the capability to design and manufacture custom products that address the special requirements of many of our customers. We believe we are well positioned relative to many of our competitors who emphasize low price.
- 3 -
Table of Contents
| • | Diversified customer base and end markets. |
Approximately one-half of our sales are to OEMs and one-half are to distributors. We believe that the different purchasing patterns among our customers in the various end markets served reduces the overall sensitivity of demand for our products in a changing economy. Also, we believe our large installed base and specification of our products by leading OEMs on original equipment creates significant replacement demand. On average, our top 20 customers in 2009 have been doing business with us for almost 20 years.
| • | Robust product development. |
Since our inception, we have introduced many innovative products, including our Super-E® branded line of premium energy efficient motors. We estimate that the initial purchase price and lifetime maintenance costs of a typical electric motor represent approximately 2% of the total cost of operation over the lifetime of the motor, with electricity making up the remaining 98% of the cost. In addition, our line of variable speed drives have been designed to be the most reliable, easy to use, and efficient drives available in the market. The Dodge brand mechanical power transmission products are also recognized for innovation. For example, customers are able to configure Dodge bearings with (i) a Grip-Tite® feature that allows it to be easily attached to standard sized shafts, (ii) an EZ-KLEEN® feature that seals the bearing in order to allow a wash-down application, and (iii) an air-handling bearing that provides ultra quiet, high-speed operation. Most recently, Dodge introduced the new MagnaGear® speed reducer that provides higher torque in a smaller package, cooler operating temperatures and greater efficiency than competitive products on the market where large gearing is required.
| • | Committed and motivated workforce. |
Our employees are highly motivated and productive. Our shared values, commitment to education and training, retention practices and the ability to participate in equity ownership through profit sharing, stock options and 401(k) plans help us keep motivated and productive employees. We are committed to an operating environment that is conducive to operational excellence and we invest regularly to make sure our plants are modern, clean and safe for our employees.
| • | Experienced management team. |
Our senior management team has significant experience in industrial manufacturing, marketing and sales under a wide range of economic conditions. The members of our senior management team have been with us on average for over 20 years and are dedicated to the success of our company.
Our Strategy
Our mission is to be the best (as determined by our customers) marketers, designers and manufacturers of industrial electric motors, mechanical power transmission products, drives and generators. Our strategies to achieve our mission include:
| • | Leverage existing customer relationships and realize cross-selling opportunities. |
Our product portfolio encompasses each level of the process that converts electrical energy to mechanical energy. This comprehensive product offering allows us to continuously strengthen our relationships with customers and enhance our ability to obtain additional business.
- 4 -
Table of Contents
| • | Continuous product development. |
We continually evaluate our products to find ways to improve performance and reduce the material content needed to meet our customers’ demands. On average, we release 250 new product lines a year and approximately 25% of our annual sales in each of the past five years were from newly developed products, defined as products developed in the prior five year period.
| • | Pursue growth opportunities. |
We believe the end markets we serve provide attractive growth opportunities. We expect to continually develop new products and enhance existing products to meet customers’ end-use applications. In addition, we intend to expand our global reach by capitalizing on high-growth regions such as China with our broad product offering, local service and support, and local manufacturing capabilities.
| • | Reduce financial leverage. |
We intend to steadily reduce our long-term debt with cash flow generated from operations.
Products
| • | Industrial Electric Motors. Our Baldor•Reliance brand motor products have a reputation of being premium products in the markets we serve. Our industrial motor product line includes both AC and DC electric motors. Our AC motors range in size from subfractional to 15,000 horsepower and our DC motors range from subfractional to 3,000 horsepower. Our motors are used in a wide variety of essential applications, including unit handling (conveyors and other material handling equipment), air handling (fans and blowers), and fluid handling (pumps). Our motors are used in many industries, including agriculture, chemical, food and beverage, machinery manufacturing, petroleum exploration and production, medical equipment, mining, paper and packaging, semiconductor manufacturing, military, and water supply. We also manufacture a full line of integral gear motors. We believe that this diversification across industries allows us to be less dependent on any particular industry or customer segment. |
Our motors are designed as both stock and custom products. Stock motors represented approximately 56% of our domestic motor sales for 2009 and are available for immediate shipment. Custom motors are built to customer specifications and are typically built and shipped within 2-4 weeks of order entry.
| • | Mechanical power transmission products. Baldor•Dodge mechanical power transmission products include mounted bearings, enclosed shaft mount, helical and worm gearing, and other mechanical power transmission components such as bushings, sheaves and conveyor pulleys. Our mechanical power transmission products are used in many applications and industries, including mining, petroleum, aggregate, unit handling, power generation, and package handling. |
| • | Drives. Baldor drives are electronic controls used to adjust the speed and torque of an electric motor to match an end application. Our drives product line ranges from fractional to 1,500 horsepower. We also make a line of drives, such as linear and rotary servo motors and motion control products, which are used to automate manual processes. Generally, our industrial drives and motion control products are used in the same industries and applications as our motors. |
| • | Generators. Our Baldor generator product line ranges from 1.3 kilowatts to 2.2 megawatts, and includes portable generators, industrial towable generators, mobile light |
- 5 -
Table of Contents
| towers, emergency and standby generators, prime power generators and peak-shaving generators. Generators are sold through distributors and, certain OEMs in a variety of industries, including agriculture, construction, equipment rental, military, municipal, and telecom. |
Manufacturing
We manufacture substantially all of the products we sell including many of the components used in our products, such as laminations, stamped steel parts, and aluminum die castings. In addition to manufacturing components, our motor manufacturing operations include machining, welding, winding, assembling, and finishing operations. Manufacturing many of our own components permits us to better manage cost, quality, and availability. Our Lean Flex Flow™ manufacturing process enables us to provide short lead times and continually reduce non value-added inputs.
The raw materials and parts necessary for our manufacturing operations are available from numerous global sources. These materials include steel, copper wire, gray iron castings, aluminum, insulating materials, electronic components, and combustion engines. Many of these materials and parts are purchased from more than one supplier. We believe alternative sources are available for such materials and parts.
Sales and Marketing
Our products are sold throughout the United States and in more than 70 countries. Our field sales organization, comprised of independent manufacturer’s representatives and factory direct sales personnel, covers more than 70 countries, including 40 locations in North America.
Custom and stock products are sold to OEMs for installation in new equipment, while independent distributors typically sell stock products as replacement components in industrial machinery that is being modernized or upgraded for improved performance.
International Sales
Our products are distributed globally, principally in Canada, Mexico, Europe, Australia, the Far East, and Latin America. We have international manufacturing facilities in Canada, England, China, and Mexico. For information concerning our foreign operations, see Note M, Foreign Operations, of the Notes to Consolidated Financial Statements, included in Item 8, Financial Statements and Supplementary Data, of this Annual Report on Form 10-K.
Competition
We face substantial competition in all markets served. Some of our competitors are larger in size or are divisions of large diversified companies having substantially greater financial resources. We focus on providing customers with value through a combination of quality products and customer service, as well as short lead times and attractive cost of ownership, which takes into account initial product cost, product life, maintenance costs and energy consumption. Our value proposition is what differentiates us from other competitors in the marketplace.
Research and Engineering
Our design and development of industrial electric motors, mechanical power transmission products, drives and generators include the development of products, which extend our product lines, the modification of existing products to meet new application requirements, and research in fields of emerging technologies. New products are typically the result of customer driven application requirements, enhancements to current product performance or the development of a complete new product solution. Additional development is performed to improve production
- 6 -
Table of Contents
methods. Costs associated with research, new product development, and product and cost improvements are expensed when incurred and amounted to approximately $31.2 million in 2009, $35.4 million in 2008, and $34.3 million in 2007.
Emerging technology development is conducted in our Advanced Technology Labs located in Cleveland, Ohio.
Intellectual Property
We rely on a combination of patents, trademarks, copyright and trade secret laws in the United States and other jurisdictions, as well as employee and third-party non-disclosure agreements, license arrangements and domain name registrations to protect our intellectual property. We sell our products under a number of registered and unregistered trademarks, which we believe are widely recognized in our industry. With the exception of our brand names, we do not believe any single patent, trademark or trade name is material to our business as a whole. Some of our trademarks include: Baldor, Baldor•Reliance, Reliance Electric, Dodge, Baldor•Dodge, Super-E, H2, Lean Flex Flow, MINT®, CST®, Torque-Arm®, Baldor•Maska® and Maska®.
Environmental Matters
We are subject to a variety of federal, state, local, foreign and provincial environmental laws and regulations including those governing discharge of chemicals into the air or water, management and disposal of hazardous substances and wastes and responsibility to investigate and clean-up contaminated sites that are or were owned, leased, operated or used by us or our predecessors. Many of our operations require environmental permits and controls to prevent and limit water and air emissions. These permits contain terms and conditions that impose limitations on our manufacturing activities, production levels and associated activities and periodically may be subject to modification, renewal and revocation by issuing authorities. Fines and penalties may be imposed for non-compliance with applicable environmental laws and regulations and the failure to have or to comply with the terms and conditions of required permits. We are also subject to the federal Occupational Health and Safety Act and similar state and foreign laws which impose requirements and standards of conduct on our operations for the health and safety of our employees. We periodically review our operations, procedures and policies for compliance with environmental and health and safety requirements. We believe that our operations generally comply with applicable environmental regulatory requirements or that any non-compliance will not result in a material liability or cost to achieve compliance.
Certain environmental laws in the United States, such as the federal Superfund law and similar state laws, impose liability for the entire cost of investigation or remediation of contaminated sites upon the current site owners, the site owners and operators at the time the contamination occurred, and upon parties who generated waste or transported or sent this waste to an off-site facility for treatment or disposal, regardless of whether the owner owned the site at the time of the release of the hazardous substances or the lawfulness of the original waste disposal activity. As a practical matter, however, the costs of investigation and remediation are generally allocated among the viable responsible parties on some form of equitable basis. There is or could be contamination at some of our current or formerly owned or operated facilities, primarily related to historical operations at those sites, for which we could be liable under applicable environmental laws. Thus far, compliance with environmental requirements and resolution of environmental claims has been accomplished without material effect on our liquidity and capital resources, competitive position or financial condition.
The Company is or may be a potentially responsible party at several judicial and administrative proceedings initiated on behalf of various state and federal regulatory agencies, or by private parties, seeking to clean up sites which have been environmentally impacted and to recover costs they have incurred or will incur as to the sites. The Company has established reserves for the sites and/or has sought insurance coverage, as appropriate. The Company believes that any environmental claims for these sites in excess of reserves, insurance proceeds and indemnified amounts will not have a material effect on its financial position or results of operations.
- 7 -
Table of Contents
Reliance is indemnified by Exxon Mobil Corporation (“Exxon”) for substantially all costs associated with environmental matters of Federal Pacific Electric Company, a non-operating subsidiary of Reliance. This indemnity has been transferred to Rockwell, and Rockwell has agreed to indemnify us with respect to costs associated with environmental claims of Federal Pacific Electric Company. The indemnification agreement covers claims for which Reliance gave notice to Exxon before December 29, 2006. We also face certain environmental claims associated with other discontinued and former operations of Reliance, including the ongoing remediation of a former Toledo-Scale manufacturing facility located in Orlando, Florida. Prior to the acquisition, Reliance began implementing a clean-up pursuant to a Consent Order with the Florida Department of Environmental Protection. Rockwell has agreed to indemnify us for these environmental matters related to the Orlando, Florida, facility.
Employees
As of January 30, 2010, we had approximately 7,250 employees, including 69 part-time employees.
Executive Officers of the Registrant
Information regarding executive officers is contained herein under Part III - Item 10.
Access to Filings on Company Website
Our Forms 10-K, 10-Q, 8-K, and amendments thereto are available on our corporate website when filed with or furnished to the SEC. These filings, along with Baldor’s Annual Reports to Shareholders, Proxy Statements, Code of Ethics for Certain Executives, and certain other corporate governance documents may be viewed online free of charge by accessing our website at www.baldor.com and selecting Investor Relations.
| Item 1A. | Risk Factors |
The most significant risk factors related to our business are as follows:
Prolonged economic weakness could adversely affect our business, financial condition and results of operation. Our results of operations are affected by the levels of business activities of our customers, which can be affected by economic conditions. Generally, our financial performance is driven by industrial spending and the strength of the economies in which we sell our products. In 2008 and 2009, general worldwide economic conditions experienced a downturn due to slower economic activity and the credit crisis. These conditions had a negative impact on our business and results of operations in 2009 and, if prolonged, could have a negative impact on our business, financial condition, and results of operations in the future.
Our future results are subject to fluctuations in the price of raw materials. The principal raw materials used to produce our industrial electric motors are steel, copper and aluminum. The prices of those raw materials are susceptible to significant fluctuations due to supply/demand trends, transportation costs, government regulations and tariffs, price controls, economic conditions and other unforeseen circumstances. If we are unable to mitigate raw materials price increases through product design improvements, price increases to our customers, and hedging transactions, our future profitability could be adversely affected.
Our financial results may be affected by competitive conditions. We operate in markets that are highly competitive. Some of our competitors are larger in size or are divisions of large diversified companies and have substantially greater financial resources. Demand for our products may be affected by our ability to respond to downward pricing pressure, to continue to provide shorter lead time and quicker delivery of our products than our competitors, and to
- 8 -
Table of Contents
respond to changes in customer order patterns. Our success depends both on our ability to continue developing new and improved products in line with technological advancements that meet the evolving requirements of our customers, and our ability to bring these products rapidly to market. New products, or refinements and improvements of existing products, may have technical failures, their introduction may be delayed, they may have higher production costs than originally expected or they may not be accepted by our customers. If we are not able to anticipate, identify, develop and market products that respond to changes in customer preferences, demand for our products could decline and our operating results would be adversely affected.
We rely on independent distributors and the loss of these distributors would adversely affect our business. In addition to our direct sales force and manufacturer sales representatives, we depend on the services of independent distributors to sell our products and provide service and aftermarket support to our customers. We are supported by an extensive distribution network with over 10,000 distributor locations worldwide. Rather than serving as passive conduits for delivery of product, our industrial distributors are active participants in the overall competitive dynamics in our industry. Industrial distributors play a significant role in determining which of our products are stocked, and therefore are readily accessible to end-users, and the price at which our products are sold. Approximately one-half of our domestic sales are generated through distributors. Most of the distributors with whom we transact business also offer products and services of our competitors to our customers. In addition, the distribution agreements we have are typically not exclusive and are cancelable by the distributor after a short notice period. Impairment of our relationship with our distributors, loss of a substantial number of these distributors, or an increase in distributors’ sales of our competitors’ products to our customers could materially reduce our sales and profits.
We are subject to the risks of doing business outside of the United States. Future growth rates and success of our business depend in part on continued growth in our non-U.S. operations. We have both sales and manufacturing operations outside the United States. Numerous risks and uncertainties affect our non-U.S. operations. These risks and uncertainties include political and economic instability, changes in local governmental laws, regulations and policies, including those related to tariffs, investments, taxation, exchange controls, employment regulations and repatriation of earnings, and enforcement of contract and intellectual property rights. International transactions may also involve increased financial and legal risks due to differing legal systems and customs, including risks of non-compliance with U.S. and local laws affecting our activities abroad. While these factors and the impact of these factors are difficult to predict, any one or more of them could adversely affect our business, financial condition or operating results. Prior to our acquisition of Reliance, Rockwell disclosed potential violations of the U.S. Foreign Corrupt Practices Act (“FCPA”) in connection with certain of Reliance’s foreign operations. We have been indemnified by Rockwell against government penalties arising from these potential violations, but this indemnification is subject to limitations and there can be no assurance that Rockwell will be able to pay on the indemnity at the time we make a claim against the indemnity. Our foreign operations may be adversely affected by the change in business practices made necessary by the FCPA. See “Item 3 – Legal Proceedings.”
We could face potential product liability claims relating to products we manufacture, which could result in us having to expend significant time and expense to defend these claims and to pay material claims or settlement amounts. We face a risk of exposure to product liability claims in the event that the use of our products is alleged to have resulted in injury or other damage. We currently maintain product liability insurance coverage for claims in excess of certain self insured limits; however, we may not be able to obtain such insurance on acceptable terms in the future, if at all, or obtain insurance that will provide adequate coverage against potential claims. Product liability claims can be expensive to defend and can divert the attention of management and other personnel for long periods of time, regardless of the ultimate outcome. An unsuccessful product liability defense could have a material adverse effect on our business, financial condition, results of operations or our ability to make payments under our debt obligations when due. In addition, we believe our business depends on the strong brand
- 9 -
Table of Contents
reputation we have developed. In the event that our reputation is damaged, we may face difficulty in maintaining our pricing positions with respect to some of our products, which would reduce our sales and profitability.
Our future results may be affected by various legal and regulatory proceedings. From time to time, we are party to legal and regulatory proceedings in the normal course of business. We have been named a defendant in lawsuits alleging personal injury as a result of exposure to asbestos. The outcome of legal proceedings could differ from our expectations since the outcomes of litigation, including regulatory matters, and our ability to collect from our insurers or on indemnities from third parties, are sometimes difficult to predict. As a result, we could be required to change current estimates of liabilities as litigation matters develop. Changes in these estimates or changes in our business as a result of legal and regulatory proceedings could have a materially adverse effect on our results of operations.
Our total assets include goodwill and other indefinite-lived intangibles. If we determine these have become impaired in the future, net income could be materially adversely affected. Goodwill represents the excess of cost over the fair market value of net assets acquired in business combinations. Indefinite-lived intangibles are comprised of trademarks. At January 2, 2010, goodwill and other indefinite-lived intangibles totaled $1.4 billion, most of which arose from our acquisition of Reliance. We review goodwill and other intangibles at least annually for impairment and any excess in carrying value over the estimated fair value is charged to the results of operations. A reduction in net income resulting from the write down or impairment of goodwill or indefinite-lived intangibles could have a material adverse effect on our financial statements.
Our future results may be affected by environmental, health and safety laws, and regulations. We are subject to various laws and regulations relating to the protection of the environment and human health and safety and have incurred and will continue to incur capital and other expenditures to comply with those regulations. Failure to comply with certain regulations could subject us to future liabilities, fines or penalties or the suspension of production. In addition, we incur, in the normal course of business, various remediation expenses related to our manufacturing sites, none of which is expected to be material. If remediation obligations were to increase beyond our expectations or if we incurred fines, penalties, or suspension of production, future results could be adversely affected. Prior to our acquisition of Reliance, Reliance had been named as a potentially responsible party at environmental clean-up sites, and may be so named in the future as well and the costs associated with these current and future sites may be significant. We have been indemnified by Rockwell against environmental liabilities relating to certain properties that had been formerly owned or operated by Reliance but this indemnification is subject to limitations and there can be no assurance that Rockwell will be able to pay on the indemnity at the time we make a claim against the indemnity.
Our operations are highly dependent on information technology infrastructure and failures could significantly affect our business. We depend heavily on our information technology infrastructure in order to achieve our business objectives. If we experience a problem that impairs this infrastructure, such as a computer virus, a problem with the functioning of an important IT application, or an intentional disruption of our IT systems by a third party, the resulting disruptions could impede our ability to record or process orders, manufacture and ship in a timely manner, or otherwise carry on our business in the ordinary course. Any such events could cause us to lose customers or revenue and could require us to incur significant expense to eliminate these problems and address related security concerns.
The inability to secure and maintain rights to intellectual property could harm our business and our customers. We own the rights to many patents, trademarks, brand names and trade names that are important to our business. The loss of patents or licenses used in principal portions of our business may have an adverse effect on our results of operations. Expenses related to enforcing our intellectual property rights could be significant. In addition,
- 10 -
Table of Contents
others may assert intellectual property infringement claims against us or our customers. We sometimes provide a limited intellectual property indemnity in connection with our terms and conditions of sale to our customers and in other types of contracts with third parties. Indemnification payments and legal costs to defend claims could have an adverse effect on our business.
Our balance sheet includes significant long-term debt. If we are unable to service our debt and meet financial covenants, we could be adversely affected. We substantially increased our leverage to finance the acquisition of Reliance. In January 2007, we borrowed $1.55 billion under a senior secured credit facility and a senior unsecured note agreement and at January 2, 2010, the amount outstanding was $1.21 billion. The increased indebtedness may reduce our flexibility to respond to changing business and economic conditions or fund capital expenditures or working capital needs because we will require additional funds to service our indebtedness. In addition, financial and other covenants related to the financing will limit our ability to incur additional indebtedness, make investments, pay dividends and engage in other transactions, and the leverage may cause potential lenders to be less willing to loan funds to us in the future. Our failure to comply with these covenants could result in an event of default that, if not waived or cured, could result in the acceleration of the due date of all our indebtedness.
| Item 1B. | Unresolved Staff Comments |
There are no unresolved written SEC staff comments regarding our periodic or current reports required by the Securities Exchange Act of 1934.
| Item 2. | Properties |
We believe that our facilities, including equipment and machinery, are in good condition, suitable for current operations, adequately maintained and insured, and capable of sufficient additional production levels. The following table contains information with respect to our properties.
| Location |
Primary Use |
Area (Sq. Ft.) |
|||||
| Fort Smith, AR |
AC motor production Distribution and service center Administration and engineering offices Aluminum die casting Drives production center |
384,901 563,789 96,980 79,330 141,726 |
|||||
| St. Louis, MO |
Metal stamping and engineering toolroom | 187,385 | |||||
| Columbus, MS |
AC motor production | 304,000 | (a | ) | |||
| Westville, OK |
AC and DC motor production | 207,250 | |||||
| Fort Mill, SC |
Held for sale | 108,000 | (e | ) | |||
| Clarksville, AR |
Subfractional and small AC and DC motors, gear motors, worm-gear speed reducers, and tachometer production | 165,735 | (a | ) | |||
| Ozark, AR |
AC motor production | 151,783 | |||||
| Athens, GA |
Small and medium AC motor production | 396,000 | (a | ) | |||
- 11 -
Table of Contents
| Gainesville, GA |
Specialty, variable speed motors and small and medium AC and DC motor production for the electrical business | 212,000 | (a | ) | |||
| Kings Mountain, NC |
Large AC, large DC, mining and hermetic motor production | 237,000 | (a | ) | |||
| Asheville, NC |
Couplings, bushings, sheaves, clutch/brake modules, sleevoil hydrodynamic bearings production | 160,000 | (a | ) | |||
| Belton, SC |
Enclosed worm and helical gearing production | 122,000 | |||||
| Clio, SC |
Conveyor pulleys Torque Arm motor mounts and bearing take-up frames production | 165,400 | |||||
| Columbus, IN |
Enclosed helical and custom gearing production | 223,000 | (a | ) | |||
| Greenville, SC |
Shaft mount and concentric gear reducers production | 237,960 | (a | ) | |||
| Marion, NC |
Mounted roller bearings production | 174,000 | |||||
| Rogersville, TN |
Mounted ball bearings and plain bearings production | 221,000 | (a | ) | |||
| Greenville, SC |
Administrative and engineering offices | 134,443 | (b | ) | |||
| Cleveland, OH |
Advanced Technology Research & Development Laboratory | 6,300 | (a | ) | |||
| Eleven other domestic locations |
Metal stamping and motor, drives, and generator production, regional sales offices | 401,424 | (c | ) | |||
| 33 foreign locations |
Sales and distribution centers, motors, electronic controls, and mechanical power transmission production | 754,588 | (d | ) | |||
| 5,835,994 | |||||||
| (a) | This property is leased. |
| (b) | Of this amount, approximately 22,943 sq. ft. is leased. |
| (c) | Of this amount, approximately 2,820 sq. ft. is leased. |
| (d) | Of this amount, approximately 477,686 sq. ft. is leased. |
| (e) | This property is held for sale and included in other current assets on the consolidated balance sheet as of January 2, 2010. |
| Item 3. | Legal Proceedings |
We are or may be a party to various lawsuits, claims and proceedings relating to the conduct of our business, including those pertaining to product liability, workers compensation, intellectual property, employment, and contract matters.
We have been named as a defendant in lawsuits alleging personal injury as a result of exposure to asbestos that was allegedly used in certain components of our products many years ago. Currently, there are hundreds of claimants in lawsuits that name us as a defendant, together with hundreds of other companies. The great bulk of the complaints, however, do not identify
- 12 -
Table of Contents
any of our products or specify which of these claimants, if any, were exposed to asbestos attributable to our products; and past experience has shown that the vast majority of the claimants will never identify any of our products. For those claimants who do show that they worked with our products, we believe we have meritorious defenses, in substantial part due to the lack of asbestos in our products, the integrity of our products, the encapsulated nature of any asbestos-containing components, and the lack of any impairing medical condition on the part of many claimants.
As a result of an internal review, Rockwell determined during the fourth quarter of 2006 that actions by a small number of employees at certain of Reliance’s operations in one jurisdiction may have violated the FCPA or other applicable laws. Reliance did business in this jurisdiction with government owned enterprises or government owned enterprises that are evolving to commercial businesses. These actions involved payments for non-business travel expenses and certain other business arrangements involving potentially improper payment mechanisms for legitimate business expenses. Special outside counsel has been engaged by Rockwell to investigate the actions and report to Rockwell’s Audit Committee. Their review is ongoing.
Rockwell voluntarily disclosed these actions to the U.S. Department of Justice (“DOJ”) and the SEC beginning in September 2006. Rockwell and Reliance implemented thorough remedial measures, and are cooperating on these issues with the DOJ and SEC. Rockwell has agreed to update the DOJ and SEC periodically regarding any further developments as the investigation continues. If violations of the FCPA occurred, Rockwell and Reliance may be subject to consequences that could include fines, penalties, other costs and business-related impacts. Rockwell and Reliance could also face similar consequences from local authorities.
Although the outcome of litigation cannot be predicted with certainty and some lawsuits, claims or proceedings may be disposed of unfavorably, we believe the disposition of matters that are pending or asserted will not have a material adverse effect on our business or financial condition. In addition, Rockwell has agreed to indemnify us for asbestos claims related to products manufactured or sold prior to the acquisition date and for any governmental penalties that may be imposed in relation to the FCPA review.
| Item 4. | Reserved |
Not applicable.
- 13 -
Table of Contents
| Item 5. | Market for Registrant’s Common Equity, Related Stockholder Matters and Issuer Purchases of Equity Securities |
Ticker
Our common stock trades on the New York Stock Exchange (NYSE) with the ticker symbol BEZ.
Common Stock Price Range
As reported by the NYSE, the high and low composite sale prices per share for our common stock for each quarterly period during the past two fiscal years are listed below.
| 2009 | 2008 | |||||||||||
| HIGH | LOW | HIGH | LOW | |||||||||
| 1st quarter |
$ | 20.26 | $ | 10.21 | $ | 34.26 | $ | 24.08 | ||||
| 2nd quarter |
26.24 | 16.41 | 39.89 | 25.51 | ||||||||
| 3rd quarter |
30.58 | 20.66 | 39.90 | 30.45 | ||||||||
| 4th quarter |
30.82 | 24.97 | 30.60 | 10.71 | ||||||||
Performance Graph
Comparison of Five-Year Cumulative Total Return
Among Baldor Electric Company, the S&P 500 Index, and the
Dow Jones US Electrical Components & Equipment Group Index
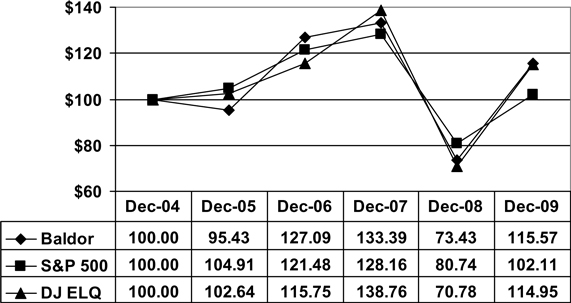
This performance graph assumes $100 invested at year-end 2004 in Baldor Electric Company, the S&P 500 Index, and the Dow Jones U.S. Electrical Components & Equipment Group Index. The compound annual growth rate is 2.9% for Baldor, 0.4% for the S&P 500 Index, and 2.8% for the Dow Jones U.S. Electrical Components & Equipment Group Index.
- 14 -
Table of Contents
Shareholders
At January 30, 2010, there were 2,002 shareholders of record.
Dividends Paid
The terms of our senior secured credit facility and the indenture for the senior unsecured notes limit our ability to increase dividends above a certain amount to the holders of our common stock. Quarterly dividend rates per share paid for fiscal years 2009, 2008, and 2007 are listed in the table below.
| 2009 | 2008 | 2007 | |||||||
| 1st quarter |
$ | 0.17 | $ | 0.17 | $ | 0.17 | |||
| 2nd quarter |
0.17 | 0.17 | 0.17 | ||||||
| 3rd quarter |
0.17 | 0.17 | 0.17 | ||||||
| 4th quarter |
0.17 | 0.17 | 0.17 | ||||||
| Year |
$ | 0.68 | $ | 0.68 | $ | 0.68 | |||
Other Equity-related Items
During the three months ended January 2, 2010, we repurchased shares of our common stock in private transactions as summarized in the table below.
ISSUER PURCHASES OF EQUITY SECURITIES
| Period |
(a) Total Number of Shares (or Units) Purchased (1) |
(b) Average Price Paid per Share (or Unit) |
(c) Total Number of Shares (or Units) Purchased as Part of Publicly Announced Plans or Programs |
(d) Maximum Number (or Approximate Dollar Value) of Shares (or Units) That May Yet Be Purchased Under the Plans or Programs | |||||
| Month #1 |
|||||||||
| Oct 4, 2009 – Oct 31, 2009 |
1,095 | $ | 29.71 | — | — | ||||
| Month #2 |
|||||||||
| Nov 1, 2009 – Nov 28, 2009 |
— | — | — | — | |||||
| Month #3 |
|||||||||
| Nov 29, 2009 – Jan 2, 2010 |
19,394 | $ | 27.65 | — | — | ||||
| Total |
20,489 | $ | 27.76 | — | — | ||||
| (1) | Consists only of shares received from trades for payment of the exercise price or tax liability on stock option exercises. |
During the fourth quarter of 2009, certain District Managers did not exercise non-qualified stock options previously granted to them under the Baldor Electric Company 1990 Stock Option Plan for District Managers (the “DM Plan”). When exercised, the exercise price paid by the District Managers equals the market value of the stock on the date of the grant. When a District Manager exercises an option, we intend to use the proceeds from these option exercises for general corporate purposes. The total amount of shares that have been granted under the DM Plan is 1.0% of the outstanding shares of our common stock. None of the transactions were registered under the Securities Act of 1933, as amended (the “Act”), in reliance upon the exemption from registration afforded by Section 4(2) of the Act. We deem this exemption to be
- 15 -
Table of Contents
appropriate given that there are a limited number of participants in the DM Plan and all parties are knowledgeable about us. In 2006, this DM Plan was effectively cancelled except with respect to then outstanding grants and no further awards have since been or will be granted from this Plan.
| Item 6. | Selected Financial Data |
Information concerning net sales, net income, net earnings per common share, dividends per common share, total assets, and long-term obligations for the years ended 1999 through 2009 is presented in the table below:
Eleven-Year Summary of Financial Data
(In thousands, except per share data)
| Per Common Share Data | |||||||||||||||||||||
| Net Sales | Net Income |
Diluted Net Earnings |
Basic Net Earnings |
Dividends | Total Assets |
Long-term Obligations | |||||||||||||||
| 2009 (c) |
$ | 1,524,072 | $ | 59,796 | $ | 1.28 | $ | 1.29 | $ | 0.68 | $ | 2,651,537 | $ | 1,156,005 | |||||||
| 2008 (b) |
1,954,679 | 99,423 | 2.15 | 2.15 | 0.68 | 2,834,159 | 1,318,578 | ||||||||||||||
| 2007 (a) |
1,824,899 | 94,102 | 2.08 | 2.11 | 0.68 | 2,821,626 | 1,355,905 | ||||||||||||||
| 2006 |
811,280 | 48,118 | 1.46 | 1.48 | 0.67 | 523,982 | 97,025 | ||||||||||||||
| 2005 |
721,569 | 43,021 | 1.28 | 1.30 | 0.62 | 507,205 | 70,025 | ||||||||||||||
| 2004 |
648,195 | 35,052 | 1.05 | 1.06 | 0.57 | 501,560 | 104,025 | ||||||||||||||
| 2003 |
561,391 | 24,779 | 0.74 | 0.75 | 0.53 | 476,955 | 79,465 | ||||||||||||||
| 2002 |
549,507 | 23,895 | 0.69 | 0.70 | 0.52 | 472,761 | 105,285 | ||||||||||||||
| 2001 |
557,459 | 22,385 | 0.65 | 0.66 | 0.52 | 457,527 | 98,673 | ||||||||||||||
| 2000 |
621,242 | 46,263 | 1.34 | 1.36 | 0.50 | 464,978 | 99,832 | ||||||||||||||
| 1999 |
585,551 | 43,723 | 1.19 | 1.21 | 0.45 | 423,941 | 56,305 | ||||||||||||||
| (a) | Includes Reliance assets acquired and liabilities assumed at January 31, 2007, and results of operations beginning February 1, 2007. |
| (b) | Includes Maska assets acquired and liabilities assumed at August 29, 2008, and results of operations beginning August 30, 2008. |
| (c) | Net income and EPS includes $21.6 million gain, after tax, on debt modification and long-term obligations include $42.2 million related to the noncash debt discount. The discount is being amortized over the remaining life of the debt. See Note G, Long-term obligations, of the Notes to the Consolidated Financial Statements. |
| Item 7. | Management’s Discussion and Analysis of Financial Condition and Results of Operations |
Overview
We are a leading marketer, designer, and manufacturer of industrial electric motors, drives, generators, and other mechanical power transmission products, currently supplying over 10,000 customers in more than 200 industries. Our products are sold to a diverse customer base consisting of original equipment manufacturers (“OEM’s”) and distributors, serving markets in the United States and throughout the world. OEM’s primarily use our products in new installations which expands our installed base and leads to future replacement product sales. Overall our domestic sales are generated equally between OEM’s and distributors. Approximately 59% of our industrial motor products and approximately 24% of our mechanical power transmission products are sold directly to OEM’s with the remainder being sold to distributors.
- 16 -
Table of Contents
Generally, our financial performance is driven by industrial spending and the strength of the economies in which we sell our products, and is also influenced by:
| • | Investments in manufacturing capacity, including upgrades, modifications, and expansions of existing manufacturing facilities, and the creation of new manufacturing facilities; |
| • | Capacity utilization; |
| • | Our customers’ needs for greater variety, timely delivery, and higher quality at a competitive cost; and |
| • | Our large installed base, which creates a significant replacement demand. |
Demand for our products is closely tied to growth trends in the economy and levels of industrial activity and capital investment. Specific drivers of demand for our products include process automation, efforts in energy conservation and productivity improvement, regulatory and safety requirements, new technologies and replacement of worn parts. Our products are typically critical parts of customers’ end-applications, and the end user’s cost associated with their failure is high. Consequently, we believe that end users of our products base their purchasing decisions on quality, reliability, efficiency and availability as well as customer service. We believe key success factors in our industry include strong reputation and brand preference, good customer service and technical support, product availability, and a strong distribution network.
Business conditions were challenging in 2009 as a result of the broad-based impact of the global economic recession. For the year ended January 2, 2010, our sales decreased 22.0%, operating profit decreased 27.1%, and diluted EPS decreased 40.5%. Sales to our domestic distributor customers decreased 21.1% as distributors aggressively reduced inventories during 2009. This destocking process substantially ended during the third quarter and incoming order rates from our distributors improved through the fourth quarter. Sales to our domestic OEM customers declined 23.2% as a result of overall declines in capital spending.
During 2009, we implemented a number of sales strategies aimed at enhancing our sales organization and gaining new customers during the economic downturn, including a bounty hunt commission strategy targeted at obtaining specifically identified new customers. Through the bounty hunt initiative, we gained over 400 new customers. As these customers’ businesses recover, we will realize additional benefits of our strategy.
Sales of our Super-E premium-efficient motor products continued to grow during 2009 ahead of the December 2010 effective date of the 2007 Energy Independence and Security Act (“EISA”). While these motors sell at a 20% to 30% price premium over standard-efficiency motors, partly because they cost more to produce, they consume less energy and result in overall decreased total cost of ownership to our customers. Once EISA takes effect in 2011, we expect premium-efficient motors to comprise approximately 50% of our total motor sales.
During the fourth quarter of 2008, we proactively began implementing cost reduction initiatives across the Company, and began accelerating integration projects related to our recent acquisitions. As a result of these initiatives, we achieved more than $92 million of cost reductions for fiscal year 2009. We expect these cost reductions to amount to approximately $115 million on an annual basis beginning in 2010. During 2009, we consolidated two of our manufacturing facilities into other existing facilities in the United States at a one-time cost of $5.0 million. These consolidations will provide annual cost savings of approximately $9.0 million. Our proactive cost reduction actions combined with continued productivity improvements resulted in sequentially improving operating margins each quarter of 2009 when compared to fourth quarter 2008 in spite of declining revenues. In addition, third and fourth quarter 2009 operating margins each improved when compared to the same periods of 2008.
- 17 -
Table of Contents
Results of Operations
2009 compared to 2008
For fiscal year 2009, we reported diluted EPS of $1.28, down 40.5% from $2.15 per diluted share in 2008. Average diluted shares outstanding was 46.8 million for 2009 compared to 46.3 million for 2008. Net income was $59.8 million for fiscal year 2009, down 39.9% from $99.4 million in 2008.
Net sales for the year decreased 22.0% to $1.52 billion compared to $1.95 billion in 2008. Sales of industrial electric motor products decreased 23.5% from 2008 and comprised 64.1% of total sales for the year compared to 65.3% for the same period last year. While overall motor product sales decreased, sales of Super-E premium-efficient motors grew 4.0% for the year and increased to 14.1% of total motor sales in 2009 compared to 10.4% in 2008. Sales of mounted bearings, gearing, and other mechanical power transmission products decreased 20.4% from 2008 and comprised 29.2% of total sales in 2009 compared to 28.6% in 2008. Our mechanical power transmission product sales are heavily weighted toward distributor customers. Consequently, inventory destocking had a significant impact on sales of these products in 2009. Sales of other products decreased 14.3% from 2008 and comprised 6.7% of total sales in 2009 compared to 6.1% in 2008. These products outperformed motors and mechanical power transmission products primarily due to growth in our generator product sales which increased 15.5% for the year. During 2009, we made organizational changes in our generator group and continued to integrate those products into our distribution network. As a result, we continue to gain new customers and expand our presence in the generator marketplace.
Gross margin was 29.0% for the year as compared to 29.6% in 2008. As a result of continued product design improvements, reduction of waste, and price improvement in certain commodities, our materials cost as a percentage of sales improved during 2009 when compared to 2008. Manufacturing costs as a percentage of sales increased in 2009 as a result of decreased sales. Our cost reduction efforts helped to partially offset the margin impact of decreased sales and production levels.
Operating margin decreased to 11.9% for the year from 12.7% in 2008. Selling and administrative expenses decreased by $64.7 million in 2009, but increased 0.5% as a percentage of sales. We realized significant cost reductions during 2009 which substantially offset the margin impact of declining sales.
Interest expense increased $4.6 million from 2008. While we benefitted from reducing our outstanding debt balance, interest rates on our variable rate debt increased as a result of the March 31, 2009 amendment of our senior secured credit facility.
Pre-tax income for 2009 decreased 33.6% from 2008. Pre-tax income for 2009 included a $35.7 million noncash gain and $7.5 million noncash debt discount amortization related to the modification of our senior secured credit facility completed March 31, 2009. The total discount of approximately $49.7 million is being amortized over the remaining term of the credit facility which matures January 31, 2014.
Our effective income tax rate was 40.9% in 2009 compared to 34.7% in 2008. Our 2009 effective income tax rate was primarily impacted by a cash dividend from a foreign subsidiary, which was utilized to repay debt and resulted in a 3.0% increase in the effective income tax rate, and an increase in the valuation allowance for certain net operating loss carryforwards of foreign subsidiaries which resulted in a 1.9% increase in the effective tax rate.
2008 compared to 2007
For fiscal year 2008, we reported diluted EPS of $2.15, up 3.4% from $2.08 per diluted share in 2007. Average diluted shares outstanding was 46.3 million for 2008 compared to 45.2 million for 2007. Net income was $99.4 million for fiscal year 2008, up 5.7% from $94.1 million in 2007.
- 18 -
Table of Contents
Net sales for 2008 increased 7.1% to $1.95 billion compared to $1.82 billion in 2007. Sales of industrial electric motor products increased 9.6% for 2008 as compared to 2007 and comprised 65.3% of total sales for 2008 compared to 64.2% for 2007. Sales of Super-E premium-efficient motors grew by 25.0% in 2008 and comprised 10.4% of total motor product sales. Sales of mounted bearings, gearing, and other mechanical power transmission products grew 11.1% during 2008 as compared to 2007 and comprised 28.6% of total sales compared to 26.5% in 2007. Sales of mechanical power transmission products in 2008 included $11.7 million from our Maska acquisition completed on August 29, 2008. Sales of other products decreased 6.0% during 2008 as compared to 2007 and comprised 6.1% of total sales compared to 9.3% in 2007.
Gross margin decreased slightly to 29.6% in 2008 as compared to 30.1% in 2007. Raw material costs were substantially higher in 2008 than in 2007. While the increased costs were partially offset by product design improvements and price increases implemented during the year, margins were negatively impacted in 2008.
Operating margin decreased to 12.7% in 2008 from 13.8% in 2007. Selling and administrative expenses increased slightly as a percentage of sales in 2008 primarily due to increased commission expense as we integrated the Reliance motor products into our sales network, and the inclusion of Maska expenses beginning August 30, 2008.
Interest expense decreased $5.7 million from 2007 to 2008 even though there was a full year of interest expense in 2008 related to the debt incurred on January 31, 2007 to fund our acquisition of Reliance, compared to eleven months of interest in 2007. Interest rates on our variable rate debt decreased in 2008 and we reduced our outstanding debt balance by a net amount of $49.4 million during the year.
Our effective income tax rate was 34.7% in 2008 compared to 36.1% in 2007. The change was primarily related to increased earnings generated outside the United States and the domestic production activities deduction.
Our Expectations for 2010
While 2009 was a very difficult year, we believe we made many decisions during the year that will benefit us in the long-term. During 2009, we achieved cost reductions that will amount to approximately $115.0 million in 2010, while continuing to invest in new products, new customers, and productivity improvements and retaining our talented and experienced workforce. We expect to maintain these cost reductions as business improves in 2010 and we believe the long-term focus of our decisions during the recession has positioned us to take advantage of opportunities as the economy recovers. Our current outlook is for a slight sales increase along with improved earnings in 2010. See “Forward-looking statements” concerning important factors that could impact actual results.
Environmental Remediation
We believe, based on our internal reviews and other factors, that any future costs relating to environmental remediation and compliance will not have a material effect on our capital expenditures, earnings, cash flows, or competitive position.
Liquidity and Capital Resources
Our primary sources of liquidity are cash flows from operations and funds available under our senior secured revolving credit facility. We expect that short-term and long-term funding requirements will continue to be met by these sources. At January 2, 2010, we had no outstanding borrowings under the revolving credit facility. We have approximately $180.2 million of borrowing capacity under the senior secured revolving credit facility which matures in 2012.
- 19 -
Table of Contents
The recent financial market conditions have not affected our ability to borrow from our revolving credit facility.
Cash flows from operations amounted to $205.7 million in 2009, $99.1 million in 2008, and $163.0 million in 2007. During 2009, our reductions in inventories, in response to declining business levels, contributed approximately $68.4 million to operating cash flows. While we aggressively reduced our inventory levels in 2009, we continue to maintain adequate inventories to serve our existing customers as well as new business. In addition to reduced inventories we had reductions in accounts receivables, and accounts payables and accrued expenses, relative to the decline in sales. These normal fluctuations contributed a net of $19.0 million to operating cash flows in 2009. Finally during 2009, we recovered $19.1 million of margin deposits on our commodity hedges that were funded during the fourth quarter of 2008.
Net cash used in investing activities was $42.3 million in 2009, $59.4 million in 2008, and $1,742.9 million in 2007. Investing activities in 2009 were primarily related to property, plant and equipment additions. Investing activities in 2008 included $23.3 million proceeds from a real estate transaction and $41.3 million (net of cash acquired) used to acquire Maska. Investing activities in 2007 included $1.8 billion (net of cash acquired) used to acquire Reliance. The Reliance acquisition was funded with proceeds from the issuance of Baldor common stock and borrowings under our senior secured credit facility and senior unsecured notes. In addition, 2007 included proceeds of $49.9 million from the divestiture of certain U.S. service centers.
Net cash used in financing activities of $161.3 million in 2009 included dividends paid to shareholders of $31.6 million, amendment fees of $7.3 million related to the March 31, 2009 amendment of our senior secured credit facility, and net debt payments of $121.8 million. Net cash used in financing activities of $64.4 million in 2008 included dividends paid to shareholders of $31.4 million and net debt reductions of $52.0 million. During 2008, we made principal payments of approximately $112.0 million on our term loan and notes payable and we had borrowings on our revolving credit facility of approximately $40.0 million and $19.1 million to fund the acquisition of Maska and margin deposits on our commodity hedges, respectively. Net cash provided by financing activities of $1.6 billion in 2007 included dividends paid to shareholders of $31.2 million, proceeds of $1.6 billion from new debt incurred and equity issued in the acquisitioin of Reliance (net of repayments and issuance costs).
We have a corporate family credit rating of BB- and senior secured debt rating of Ba3 with a stable outlook by Moody’s Investors Services, Inc. (“Moody’s”). We have a long-term issuer credit rating of B1 and senior secured debt rating of BB+ with a stable outlook by Standard & Poor’s Rating Service (“S&P”). We have senior unsecured debt ratings of B3 by Moody’s and B by S&P. Both ratings agencies recently affirmed our ratings, and Moody’s upgraded our liquidity rating from SGL-3 to SGL-2 following the successful amendment of our credit agreement on March 31, 2009. Our senior secured credit facility has a downward rating trigger that increases the margin paid on variable rate borrowings from 3.25% to 3.50% for any period during which our Moody’s corporate family rating is below BB- or our S&P long-term issuer rating is below B1. We have no downward rating triggers that would accelerate the maturity of amounts drawn under our senior secured credit facility. Also, we have no downward rating triggers under our senior unsecured notes.
Our senior secured credit facility and senior unsecured notes contain various customary covenants, which limit, among other things, indebtedness and dispositions of assets, and which require us to maintain compliance with certain quarterly financial ratios. The primary financial ratios in our credit agreement are total leverage (total debt/EBITDA, as defined) and senior secured leverage (senior secured debt/EBITDA, as defined). We have maintained compliance with all covenants and were in compliance at January 2, 2010. Our total leverage ratio and senior secured leverage ratios were 3.93x and 2.14x, respectively, at January 2, 2010. These were within our maximum covenant requirements of 5.25x and 2.75x, respectively. Our maximum covenant requirements step down to 5.00x and 2.50x, respectively at December 31, 2010. We expect to remain in compliance with these covenants in 2010.
- 20 -
Table of Contents
On March 31, 2009, we amended our senior secured credit facility. The amendment relaxed our total leverage and senior secured leverage ratio requirements to help ensure we maintain sufficient headroom under our covenants during the economic recession. In conjunction with the amendment, the margin applied to LIBOR on our variable term loan and revolver borrowings was increased to 3.25%, and a LIBOR floor of 2.00% was implemented.
The amendment of the senior secured term loan was considered a substantial modification of the debt. As a result, the senior secured term loan was recorded at fair value as of the modification date which resulted in a noncash debt discount of $49.7 million being recorded in long-term obligations on the consolidated balance sheet and a $35.7 million gain on debt modification included in income from continuing operations in the consolidated statement of income. Fees paid related to the amendment of $5.7 million along with unamortized fees related to the original agreement of $8.3 million were considered when calculating the gain. The discount is being amortized to other expense over the remaining term of the debt. Amortization amounted to $7.5 million during 2009.
The amendment did not change the borrowing capacity of the revolving credit facility; therefore, fees of $1.6 million related to the amendment were deferred and are being amortized over the remaining term of the facility agreement along with unamortized fees of $1.1 million related to the original agreement.
The table below summarizes our contractual obligations as of January 2, 2010.
| (In thousands) | Payments due by years | ||||||||||||||
| Total | 2010 | 2011-2012 | 2013-2014 | 2015 and Thereafter | |||||||||||
| Contractual Obligations: |
|||||||||||||||
| Long-term debt obligations (a) |
$ | 1,740,602 | $ | 104,754 | $ | 207,854 | $ | 759,295 | $ | 668,699 | |||||
| Operating lease obligations |
71,492 | 14,191 | 22,692 | 12,964 | 21,645 | ||||||||||
| Other Commercial Commitments: |
|||||||||||||||
| Letters of Credit |
19,772 | 19,722 | — | — | — | ||||||||||
| (a) | Includes interest on both fixed and variable rate obligations. Interest associated with variable rate obligations is based upon interest rates in effect at January 2, 2010. The contractual amounts to be paid on variable rate obligations are affected by changes in market interest rates. Future changes in market interest rates could materially affect the contractual amounts to be paid. |
Dividend Policy
Dividends paid to shareholders amounted to $0.68 per common share in 2009, 2008, and 2007. Our objective is for shareholders to receive dividends while also participating in Baldor’s growth. The terms of our credit agreement and indenture limit our ability to increase dividends in the future.
Market Risk
Market risks relating to our operations result primarily from changes in commodity prices, interest rates, concentrations of credit, and foreign exchange rates. To help maintain stable pricing for customers, we enter into various commodity hedging transactions. To manage interest rate risk on variable rate outstanding debt, we enter into various interest rate hedging transactions.
We purchase copper and aluminum, and periodically utilize commodity futures contracts for hedging purposes to reduce the effects of changing prices in these commodities. Generally, contract terms of a hedge instrument closely mirror those of the hedged item providing a high degree of risk reduction and correlation. We had derivative contracts designated as commodity cash flow hedges with a fair value of $17.4 million recorded in other current assets at January 2, 2010. A hypothetical 10% change in the fair value of open positions would not have a material effect on our results of operations.
- 21 -
Table of Contents
Our interest rate risk is primarily related to our senior secured credit facility which bears interest at variable rates. Additionally, our long-term obligations include senior unsecured notes totaling $550.0 million which bear interest at a fixed rate of 8.625%. We utilize various interest rate hedge instruments to manage future exposure to interest rate risk on a portion of the variable rate obligations. Effective March 31, 2009, we amended our senior secured credit agreement. In conjunction with the amendment, a LIBOR floor was added to the variable rate borrowings. As a result, we determined that our existing interest rate instruments were no longer expected to be highly effective and were discontinued as cash flow hedges. Details regarding the instruments as of January 2, 2010, are as follows:
| Instrument |
Notional Amount |
Maturity |
Rate Paid |
Rate Received (1) |
Fair Value (2) | |||||||
| Swap |
$250.0 million | April 30, 2012 | 5.12 | % | LIBOR | $ | (16.6) million | |||||
| Collar |
$100.0 million | April 30, 2012 | LIBOR | LIBOR; Floor 4.29%; Cap 6.50% | $ | (5.4) million | ||||||
| (1) | LIBOR is determined each reset date based on London and New York business days. |
| (2) | Fair value is an estimated amount that the Company would have paid at January 2, 2010, to terminate the agreement. |
Our financial instruments that are exposed to concentrations of credit risk consist primarily of cash equivalents and trade receivables. Cash equivalents are in high quality securities placed with major banks and financial institutions. Concentrations of credit risk with respect to receivables is limited due to our large number of customers and their dispersion across geographic areas and industries. We perform periodic credit evaluations of customers’ financial conditions and generally do not require collateral. No single customer represents more than 10% of net accounts receivable or sales for any period presented in this report. We have not experienced an increase in customer bad debts as a result of market conditions.
Foreign affiliates comprise approximately 12% of our consolidated net sales and generally conduct business in their respective local currencies. As a result, our exposure to foreign currency risk is not significant. We continue to monitor the effects of foreign currency exchange rates and will utilize foreign currency hedges where appropriate.
Critical Accounting Estimates
Our consolidated financial statements are prepared in accordance with accounting principles generally accepted in the United States (“GAAP”), which requires us to make estimates and assumptions that affect the reported amounts of assets, liabilities, revenues, expenses and the related disclosures during the periods reported. We base our assumptions, estimates and judgments on historical experience, current trends and other factors management believes to be relevant at the time our consolidated financial statements are prepared. On a regular basis, we review the accounting policies, assumptions, estimates and judgments to ensure that our financial statements are presented fairly and in accordance with GAAP. However, because future events and their effects cannot be determined with certainty, actual results could differ from our assumptions and estimates, and such differences could be material.
Our significant accounting policies are discussed in Note A, Significant Accounting Policies, of the Notes to Consolidated Financial Statements, included in Item 8, Financial Statements and Supplementary Data, of this Annual Report on Form 10-K. We believe that the following accounting estimates are the most critical to aid in fully understanding and evaluating our reported financial results, and they require our most subjective or complex judgments, resulting from the need to make estimates about the effect of matters that are inherently uncertain.
- 22 -
Table of Contents
Allowance for Doubtful Accounts: We record allowances for doubtful accounts based on customer-specific analysis, current assessments of past due balances and economic conditions, and historical experience. We have not made any material changes in the accounting methodology used to establish our allowance for doubtful accounts and do not believe there is a reasonable likelihood that there will be a material change in the assumptions used to determine the allowance. However, additional allowances for doubtful accounts may be required if there is deterioration in past due balances, if economic conditions are less favorable than anticipated, or for customer-specific circumstances, such as financial difficulty.
Inventories: We value inventories at the lower of cost or market with cost being determined principally by the last-in, first-out (LIFO) method, except for non-U.S. inventories, which are determined by the first-in, first-out (FIFO) method. The valuation of LIFO inventories is made at the end of each year based on inventory levels and costs at that time. The net realizable value of inventory is reviewed on an on-going basis with consideration given to deterioration, obsolescence, and other factors. We have not made any material changes in the accounting methodology used to value our inventories and do not believe there is a reasonable likelihood that there will be a material change in the future estimates or assumptions used to determine inventory values in the future. However, if actual conditions differ from those estimated by management, adjustments to inventory values may be required.
Self-Insurance Liabilities: We are self-insured for certain losses related to health, workers’ compensation and general and product liability claims. However, we obtain third-party insurance coverage to limit our exposure to these claims. When estimating our self-insured liabilities, we consider a number of factors, including historical claims experience, demographic factors, and valuations provided by independent third-party actuaries. Periodically, we review our assumptions and the valuations provided by independent third-party actuaries to determine the adequacy of our self-insured liabilities. Our self-insured liabilities contain uncertainties because management is required to make assumptions and to apply judgment to estimate the ultimate cost to settle reported claims and claims incurred but not reported at each balance sheet date. We have not made any material changes in the accounting methodology used to establish our self-insured liabilities and do not believe there is a reasonable likelihood that there will be a material change in assumptions used to calculate these liabilities. However, if actual results are not consistent with our estimates or assumptions, adjustments to the reserves could be required that could be material.
Acquisitions – Purchase Price Allocation: We account for acquired businesses using the purchase method of accounting, which requires that the assets acquired and liabilities assumed be recorded at the date of acquisition at their respective fair values. Any excess of the purchase price over the estimated fair values of the net assets acquired is recorded as goodwill. The judgments made in determining the estimated fair value assigned to each class of assets acquired and liabilities assumed, as well as asset lives, can materially impact our results of operations. Accordingly, for significant items, we typically obtain assistance from third party valuation specialists. The valuations are based on information available near the acquisition date and are based on expectations and assumptions that have been deemed reasonable by management.
There are multiple methods that can be used to determine the fair value of assets acquired and liabilities assumed. For intangible assets, we typically use relief from royalty, income and market approach methodologies. These methodologies start with a forecast of expected future net cash flow, which are then adjusted to present value by applying an appropriate discount rate that reflects the risk factors associated with the cash flow streams. Some of the more significant estimates and assumptions inherent in the income method or other methods include the amount and timing of projected future cash flows; the discount rate selected to measure the risks inherent in the future cash flows; and the assessment of the asset’s life cycle and the competitive trends impacting the asset including consideration of any technical, legal, regulatory, or economic barriers to entry. Determining the useful life of an intangible asset also requires judgment as different types of intangible assets will have different useful lives and certain assets
- 23 -
Table of Contents
may even be considered to have indefinite useful lives. We do not believe there is a reasonable likelihood that there will be a material change in the future estimates or assumptions used to complete the purchase price allocation and estimate the fair value of acquired assets and liabilities.
Goodwill and Indefinite-Lived Intangibles: At January 2, 2010, goodwill and indefinite-lived intangibles amounted to $1.0 billion and $354.8 million, respectively. We evaluate goodwill and other intangible assets for impairment annually. However, we could be required to evaluate the recoverability of goodwill and other intangible assets prior to the required annual assessment if we experience disruptions to the business, unexpected significant declines in operating results, divestiture of a significant component of the business or a sustained decline in market capitalization. Our impairment evaluation is completed by performing an internal valuation analysis, considering other publicly available market information and utilizing the assistance of an independent valuation firm.
We determine fair value from a highest and best use perspective, using widely accepted valuation techniques including discounted cash flows and market participant analyses. See Note A, Significant Accounting Policies, of the Notes to Consolidated Financial Statements, included in Item 8, Financial Statements and Supplementary Data, of this Annual Report on Form 10-K for a discussion of methodologies applied. These types of analyses contain uncertainties because they require management to make assumptions and to apply judgment to estimate industry economic factors and future revenues and profitability. We conduct impairment testing based on our current business strategy in light of present industry and economic conditions, as well as our future expectations. No material changes have been made in the accounting methodology used to perform impairment testing and we do not believe there is a reasonable likelihood that there will be a material change in the future, of the estimates or assumptions used to test for impairment of goodwill and other intangible assets. However, if actual results are not consistent with our estimates or assumptions, we may incur an impairment charge that could be material.
During the fourth quarter of 2009, we completed our annual impairment testing of goodwill and other indefinite-lived intangible assets using the methodology described above, and determined there was no impairment. We believe it is unlikely that we are at risk of failing step one of the annual goodwill impairment test at the reporting unit level. However, the fair value of one of our indefinite-lived intangibles exceeded the carrying value of $225.9 million by only 3.1%. Should business conditions not improve in the near future, it is reasonably possible that this indefinite-lived intangible could be partially impaired. See Note A, Significant Accounting Policies, of the Notes to Consolidated Financial Statements, included in Item 8, Financial Statements and Supplementary Data, of this Annual Report on Form 10-K for a discussion of impairment testing and sensitivity analyses performed in 2009.
Share-Based Compensation: We have share-based compensation plans which include stock options and non-vested stock units. See Note A, Significant Accounting Policies, and Note K, Stock Plans, of the Notes to Consolidated Financial Statements, included in Item 8, Financial Statements and Supplementary Data, of this Annual Report on Form 10-K for a discussion of our share-based compensation programs.
We determine the fair value of our stock option awards at the date of grant using a Black-Scholes option-pricing model. Option-pricing models require management to make assumptions and to apply judgment to determine the fair value of our awards. These assumptions and judgments include estimating the future volatility of our stock price, expected dividend yield, future employee turnover rates and future employee stock option exercise behaviors. Changes in these assumptions can materially affect the fair value estimate.
We amortize the fair value of restricted stock unit awards, which is based on the closing market price on the date of grant, to compensation expense generally on a straight-line basis over the vesting period, taking into consideration an estimate of shares expected to vest.
- 24 -
Table of Contents
We do not believe there is a reasonable likelihood there will be a material change in the future estimates of assumptions used to determine share-based compensation expense. However, if actual results are not consistent with our estimates or assumptions, we may be exposed to changes in share-based compensation expense that could be material.
Fair Value Measurements: In measuring the fair value of our commodity derivative instruments designated as cash flow hedges, we obtain quoted market prices from a third party broker at each measurement date for a majority of the instruments. These quoted market prices are for identical assets/liabilities traded in an active market. For the remaining portion of the instruments, we obtain valuations from a third party broker that are based on inputs readily observable.
In measuring the fair value of our interest rate derivatives, we obtain valuations from a third party broker at each measurement date. These valuations are derived from inputs readily observable (eg., interest rates, yield curves and volatilities) and can be matched to the terms of our derivatives.
We have not made any material changes in the accounting methodology used to estimate the fair value of our derivative instruments and do not believe there is a reasonable likelihood there will be a material change in future estimates or assumptions. However, the use of different assumptions in deriving these fair values could have a material impact on the estimated fair values recorded in our financial statements.
Recently Issued Accounting Pronouncements
See Note Q, Recently Issued Accounting Pronouncements, of the Notes to Consolidated Financial Statements, included in Item 8, Financial Statements and Supplementary Data, of this Annual Report on Form 10-K for recently issued accounting pronouncements.
| Item 7A. | Quantitative and Qualitative Disclosures about Market Risk |
Information regarding market risk is found under the sub-caption Market Risk contained in Part II - Item 7, Management’s Discussion and Analysis of Financial Condition and Results of Operations, of this Annual Report on Form 10-K, and is incorporated herein by reference.
| Item 8. | Financial Statements and Supplementary Data |
Report of Management on Responsibility for Financial Reporting
Management is responsible for the integrity and objectivity of the financial information contained in this annual report. The accompanying financial statements have been prepared in conformity with accounting standards generally accepted in the United States, applying informed judgments and estimates where appropriate.
The Audit Committee of the Board of Directors is composed solely of independent outside directors and is responsible for recommending to the Board the independent registered public accounting firm to be retained for the coming year. The Audit Committee meets regularly with the independent registered public accounting firm, with Audit Services, as well as with Baldor management, to review accounting, auditing, internal accounting controls, and financial reporting matters. The independent registered public accounting firm, Ernst & Young LLP, and Audit Services have direct access to the Audit Committee without the presence of management to discuss the results of their audits.
| /s/ John A. McFarland |
| JOHN A. MCFARLAND Chairman and Chief Executive Officer |
| /s/ George E. Moschner |
| GEORGE E. MOSCHNER Chief Financial Officer and Secretary |
- 25 -
Table of Contents
REPORT OF INDEPENDENT REGISTERED PUBLIC ACCOUNTING FIRM
The Board of Directors and Shareholders of
Baldor Electric Company
We have audited the accompanying consolidated balance sheets of Baldor Electric Company as of January 2, 2010 and January 3, 2009, and the related consolidated statements of income, shareholders’ equity, and cash flows for each of the three years in the period ended January 2, 2010. These financial statements are the responsibility of the Company’s management. Our responsibility is to express an opinion on these financial statements based on our audits.
We conducted our audits in accordance with the standards of the Public Company Accounting Oversight Board (United States). Those standards require that we plan and perform the audit to obtain reasonable assurance about whether the financial statements are free of material misstatement. An audit includes examining, on a test basis, evidence supporting the amounts and disclosures in the financial statements. An audit also includes assessing the accounting principles used and significant estimates made by management, as well as evaluating the overall financial statement presentation. We believe that our audits provide a reasonable basis for our opinion.
In our opinion, the financial statements referred to above present fairly, in all material respects, the consolidated financial position of Baldor Electric Company at January 2, 2010 and January 3, 2009, and the consolidated results of its operations and its cash flows for each of the three years in the period ended January 2, 2010, in conformity with U.S. generally accepted accounting principles.
As described in Note E to the consolidated financial statements, the Company adopted a new accounting principle related to accounting for uncertain income tax positions in 2007.
We also have audited, in accordance with the standards of the Public Company Accounting Oversight Board (United States), Baldor Electric Company’s internal control over financial reporting as of January 2, 2010, based on criteria established in Internal Control – Integrated Framework issued by the Committee of Sponsoring Organizations of the Treadway Commission and our report dated March 3, 2010, expressed an unqualified opinion thereon.
| /s/ Ernst & Young LLP |
Tulsa, Oklahoma
March 3, 2010
- 26 -
Table of Contents
PART I – FINANCIAL INFORMATION
| Item 1. | Financial Statements |
Baldor Electric Company
Consolidated Balance Sheets
| (In thousands, except share amounts) | January 2, 2010 | January 3, 2009 | ||||||||||||||
| ASSETS |
||||||||||||||||
| Current Assets |
||||||||||||||||
| Cash and cash equivalents |
$ | 15,270 | $ | 13,098 | ||||||||||||
| Accounts receivable, less allowance for doubtful accounts of |
229,174 | 275,789 | ||||||||||||||
| Inventories: |
||||||||||||||||
| Finished products |
163,861 | 190,077 | ||||||||||||||
| Work-in-process |
44,176 | 56,716 | ||||||||||||||
| Raw materials |
126,598 | 164,574 | ||||||||||||||
| 334,635 | 411,367 | |||||||||||||||
| LIFO valuation adjustment |
(58,071 | ) | (66,447 | ) | ||||||||||||
| 276,564 | 344,920 | |||||||||||||||
| Prepaid expenses |
3,150 | 4,619 | ||||||||||||||
| Other current assets |
79,076 | 78,727 | ||||||||||||||
| Total Current Assets |
603,234 | 717,153 | ||||||||||||||
| Property, Plant and Equipment |
||||||||||||||||
| Land and improvements |
16,483 | 17,070 | ||||||||||||||
| Buildings and improvements |
121,643 | 139,277 | ||||||||||||||
| Machinery and equipment |
618,501 | 603,913 | ||||||||||||||
| Allowances for depreciation and amortization |
(393,662 | ) | (359,914 | ) | ||||||||||||
| Net Property, Plant and Equipment |
362,965 | 400,346 | ||||||||||||||
| Other Assets |
||||||||||||||||
| Goodwill |
1,032,733 | 1,033,575 | ||||||||||||||
| Intangible assets, net of amortization |
637,070 | 653,271 | ||||||||||||||
| Other |
15,535 | 29,814 | ||||||||||||||
| Total Assets |
$ | 2,651,537 | $ | 2,834,159 | ||||||||||||
| LIABILITIES AND SHAREHOLDERS’ EQUITY |
||||||||||||||||
| Current Liabilities |
||||||||||||||||
| Accounts payable |
$ | 61,776 | $ | 98,046 | ||||||||||||
| Accrued employee compensation |
7,436 | 11,165 | ||||||||||||||
| Accrued profit sharing |
7,815 | 16,554 | ||||||||||||||
| Accrued warranty costs |
9,330 | 9,477 | ||||||||||||||
| Accrued insurance obligations |
9,635 | 10,667 | ||||||||||||||
| Accrued interest expense |
27,782 | 22,830 | ||||||||||||||
| Other accrued expenses |
55,090 | 110,006 | ||||||||||||||
| Dividends payable |
7,924 | 7,863 | ||||||||||||||
| Note payable |
— | 735 | ||||||||||||||
| Current maturities of long-term obligations |
7,108 | 7,609 | ||||||||||||||
| Total Current Liabilities |
193,896 | 294,952 | ||||||||||||||
| Long-term obligations |
1,156,005 | 1,318,578 | ||||||||||||||
| Other liabilities |
69,581 | 72,731 | ||||||||||||||
| Deferred income taxes |
308,212 | 308,371 | ||||||||||||||
| Commitments and Contingencies |
||||||||||||||||
| January 2, 2010 | January 3, 2009 | |||||||||||||||
| Shareholders’ Equity |
||||||||||||||||
| Preferred stock, $0.10 par value: |
||||||||||||||||
| Authorized shares |
5,000,000 | |||||||||||||||
| Issued and outstanding shares |
None | |||||||||||||||
| Common stock, $0.10 par value: |
||||||||||||||||
| Authorized shares |
150,000,000 | |||||||||||||||
| Issued shares |
55,538,933 | 55,388,068 | 5,554 | 5,538 | ||||||||||||
| Outstanding shares |
46,612,596 | 46,253,575 | ||||||||||||||
| Additional paid-in capital |
551,830 | 546,313 | ||||||||||||||
| Retained earnings |
562,497 | 534,330 | ||||||||||||||
| Accumulated other comprehensive loss |
(7,209 | ) | (53,721 | ) | ||||||||||||
| Treasury stock, at cost |
8,926,337 | 9,134,493 | (188,829 | ) | (192,933 | ) | ||||||||||
| Total Shareholders’ Equity |
923,843 | 839,527 | ||||||||||||||
| Total Liabilities and Shareholders’ Equity |
$ | 2,651,537 | $ | 2,834,159 | ||||||||||||
See notes to consolidated financial statements.
- 27 -
Table of Contents
Baldor Electric Company
Consolidated Statements of Income
| Year Ended | ||||||||||||
| (In thousands, except per share amounts) | January 2, 2010 | January 3, 2009 | December 29, 2007 | |||||||||
| Net sales |
$ | 1,524,072 | $ | 1,954,679 | $ | 1,824,899 | ||||||
| Cost of goods sold |
1,081,418 | 1,376,381 | 1,274,753 | |||||||||
| Gross profit |
442,654 | 578,298 | 550,146 | |||||||||
| Selling and administrative expenses |
265,044 | 329,701 | 297,418 | |||||||||
| Gain on property sale |
3,721 | — | — | |||||||||
| Operating profit |
181,331 | 248,597 | 252,728 | |||||||||
| Other income (loss), net |
(1,421 | ) | 6,113 | 2,611 | ||||||||
| Gain on debt modification |
35,740 | — | — | |||||||||
| Debt discount amortization |
(7,452 | ) | — | — | ||||||||
| Interest expense |
(107,084 | ) | (102,441 | ) | (108,176 | ) | ||||||
| Income before income taxes |
101,114 | 152,269 | 147,163 | |||||||||
| Provision for income taxes |
41,318 | 52,846 | 53,061 | |||||||||
| Net income |
$ | 59,796 | $ | 99,423 | $ | 94,102 | ||||||
| Net earnings per common share – basic |
$ | 1.29 | $ | 2.15 | $ | 2.11 | ||||||
| Net earnings per common share – diluted |
$ | 1.28 | $ | 2.15 | $ | 2.08 | ||||||
| Weighted-average shares outstanding – basic |
46,519 | 46,158 | 44,674 | |||||||||
| Weighted-average shares outstanding – diluted |
46,816 | 46,339 | 45,242 | |||||||||
| Dividends declared per common share |
$ | 0.68 | $ | 0.68 | $ | 0.68 | ||||||
See notes to consolidated financial statements
- 28 -
Table of Contents
Baldor Electric Company
Consolidated Statements of Cash Flows
| Year Ended | ||||||||||||
| (In thousands) | January 2, 2010 | January 3, 2009 | December 29, 2007 | |||||||||
| Operating activities: |
||||||||||||
| Net income |
$ | 59,796 | $ | 99,423 | $ | 94,102 | ||||||
| Adjustments to reconcile net income to net cash provided by operating activities: |
||||||||||||
| Gains on sales of marketable securities |
— | — | (32 | ) | ||||||||
| Losses (gains) on sales of assets |
(2,491 | ) | 2,387 | (470 | ) | |||||||
| Mark to market on derivative instruments |
(6,561 | ) | — | — | ||||||||
| Gain on debt modification |
(35,740 | ) | — | — | ||||||||
| Amortization of debt discount |
7,452 | — | — | |||||||||
| Amortization of discontinued interest rate hedge |
9,009 | — | — | |||||||||
| Depreciation |
50,166 | 58,001 | 52,660 | |||||||||
| Amortization |
22,312 | 23,532 | 19,119 | |||||||||
| Allowance for doubtful accounts receivable |
(224 | ) | 59 | 1,810 | ||||||||
| Deferred income tax |
7,446 | (26,280 | ) | (2,513 | ) | |||||||
| Share-based compensation expense |
5,451 | 7,127 | 5,976 | |||||||||
| Cash provided by (used in) changes in operating assets and liabilities: |
||||||||||||
| Receivables |
46,839 | 11,537 | (31,348 | ) | ||||||||
| Inventories |
68,432 | (18,042 | ) | 5,038 | ||||||||
| Other current assets |
(6,536 | ) | 9,132 | (25,829 | ) | |||||||
| Accounts payable |
(28,770 | ) | 8,317 | (19,491 | ) | |||||||
| Accrued expenses and other liabilities |
992 | (37,271 | ) | 35,316 | ||||||||
| Income taxes (recoverable) payable |
(2,920 | ) | (15,028 | ) | 10,139 | |||||||
| Other assets, net |
11,068 | (23,772 | ) | 18,541 | ||||||||
| Net cash provided by operating activities |
205,721 | 99,122 | 163,018 | |||||||||
| Investing activities: |
||||||||||||
| Purchases of property, plant and equipment |
(44,158 | ) | (42,877 | ) | (39,490 | ) | ||||||
| Proceeds from sale of property, plant and equipment |
177 | 69 | 3,493 | |||||||||
| Proceeds from sale of marketable securities |
— | — | 23,034 | |||||||||
| Acquisitions net of cash acquired |
— | (41,285 | ) | (1,779,837 | ) | |||||||
| Divestitures |
— | — | 49,886 | |||||||||
| Proceeds from sale of equity investment |
1,716 | 1,373 | — | |||||||||
| Net proceeds from sale of property |
— | 23,310 | — | |||||||||
| Net cash used in investing activities |
(42,265 | ) | (59,410 | ) | (1,742,914 | ) | ||||||
| Financing activities: |
||||||||||||
| Proceeds from long-term obligations |
52,059 | 137,535 | 1,550,000 | |||||||||
| Principal payments of long-term obligations |
(173,120 | ) | (177,960 | ) | (283,000 | ) | ||||||
| Proceeds from note payable |
— | — | 12,321 | |||||||||
| Debt issuance/amendment costs |
(7,342 | ) | — | (30,519 | ) | |||||||
| Principal payments on note payable |
(735 | ) | (11,586 | ) | — | |||||||
| Proceeds from common stock issued |
— | — | 379,857 | |||||||||
| Dividends paid |
(31,568 | ) | (31,392 | ) | (31,184 | ) | ||||||
| Stock option exercises |
6,450 | 11,133 | 11,397 | |||||||||
| Excess tax benefits on share-based payments |
472 | 399 | 668 | |||||||||
| Net increase (decrease) in bank overdrafts |
(7,500 | ) | 7,500 | (4,624 | ) | |||||||
| Net cash (used in) provided by financing activities |
(161,284 | ) | (64,371 | ) | 1,604,916 | |||||||
| Net increase (decrease) in cash and cash equivalents |
2,172 | (24,659 | ) | 25,020 | ||||||||
| Beginning cash and cash equivalents |
13,098 | 37,757 | 12,737 | |||||||||
| Ending cash and cash equivalents |
$ | 15,270 | $ | 13,098 | $ | 37,757 | ||||||
Noncash items:
| • | Additional paid-in capital resulting from shares traded for option exercises and taxes amounted to $1,566, $1,411, and $3,040 in 2009, 2008, and 2007, respectively. |
| • | Common stock valued at $50,932 was issued January 31, 2007, in conjunction with the acquisition of Reliance Electric (see NOTE B). |
| • | Treasury shares amounting to $3,487 and $3,284 were issued in March 2009 and 2008 to fund the 2008 and 2007 accrued profit sharing contributions, respectively. |
See notes to consolidated financial statements.
- 29 -
Table of Contents
Baldor Electric Company
Consolidated Statements of Shareholders’ Equity
| Additional | Accumulated Other |
Treasury | Total | ||||||||||||||||||||||
| Common Stock | Paid-in | Retained | Comprehensive | Stock | |||||||||||||||||||||
| (In thousands, except per share amounts) | Shares | Amount | Capital | Earnings | Income (Loss) | (at cost) | |||||||||||||||||||
| BALANCE AT DECEMBER 30, 2006 |
41,475 | $ | 4,147 | $ | 88,067 | $ | 403,381 | $ | (927 | ) | $ | (189,839 | ) | $ | 304,829 | ||||||||||
| Comprehensive income |
|||||||||||||||||||||||||
| Net income |
— | — | — | 94,102 | — | — | 94,102 | ||||||||||||||||||
| Other comprehensive income (loss): |
|||||||||||||||||||||||||
| Postretirement plan actuarial loss, net of tax benefit of $859 |
— | — | — | — | (1,471 | ) | — | (1,471 | ) | ||||||||||||||||
| Translation adjustments |
— | — | — | — | 8,311 | — | 8,311 | ||||||||||||||||||
| Unrealized adjustment on derivatives, net of tax benefits of $3,798 |
— | — | — | — | (5,940 | ) | — | (5,940 | ) | ||||||||||||||||
| Total other comprehensive loss |
900 | ||||||||||||||||||||||||
| Total comprehensive income |
95,002 | ||||||||||||||||||||||||
| Stock option plans (net of 99 shares exchanged and $1,610 tax benefit) |
358 | 36 | 15,077 | — | — | (3,780 | ) | 11,333 | |||||||||||||||||
| Cash dividends at $0.68 per share |
— | — | — | (31,184 | ) | — | — | (31,184 | ) | ||||||||||||||||
| Acquisition |
13,304 | 1,330 | 429,459 | — | — | — | 430,789 | ||||||||||||||||||
| BALANCE AT DECEMBER 29, 2007 |
55,137 | $ | 5,513 | $ | 532,603 | $ | 466,299 | $ | (27 | ) | $ | (193,619 | ) | $ | 810,769 | ||||||||||
| Comprehensive income |
|||||||||||||||||||||||||
| Net income |
— | — | — | 99,423 | — | — | 99,423 | ||||||||||||||||||
| Other comprehensive income (loss): |
|||||||||||||||||||||||||
| Postretirement plan actuarial loss, net of tax benefit of $2,720 |
— | — | — | — | (4,333 | ) | — | (4,333 | ) | ||||||||||||||||
| Translation adjustments |
— | — | — | — | (20,481 | ) | — | (20,481 | ) | ||||||||||||||||
| Unrealized adjustment on derivatives, net of tax benefits of $18,886 |
— | — | — | — | (28,880 | ) | — | (28,880 | ) | ||||||||||||||||
| Total other comprehensive income |
(53,694 | ) | |||||||||||||||||||||||
| Total comprehensive income |
45,729 | ||||||||||||||||||||||||
| Stock option plans (net of 57 shares exchanged and $961 tax benefit) |
251 | 25 | 12,918 | — | — | (1,806 | ) | 11,137 | |||||||||||||||||
| Cash dividends at $0.68 per share |
— | — | — | (31,392 | ) | — | — | (31,392 | ) | ||||||||||||||||
| Treasury stock issued |
— | — | 792 | — | — | 2,492 | 3,284 | ||||||||||||||||||
| BALANCE AT JANUARY 3, 2009 |
55,388 | $ | 5,538 | $ | 546,313 | $ | 534,330 | $ | (53,721 | ) | $ | (192,933 | ) | $ | 839,527 | ||||||||||
| Comprehensive income |
|||||||||||||||||||||||||
| Net income |
— | — | — | 59,796 | — | — | 59,796 | ||||||||||||||||||
| Other comprehensive income (loss): |
|||||||||||||||||||||||||
| Postretirement plan actuarial loss, net of tax benefit of $355 |
— | — | — | — | (850 | ) | — | (850 | ) | ||||||||||||||||
| Translation adjustments |
— | — | — | — | 12,694 | — | 12,694 | ||||||||||||||||||
| Unrealized adjustment on derivatives, net of tax benefits of $22,665 |
— | — | — | — | 34,668 | — | 34,668 | ||||||||||||||||||
| Total other comprehensive income |
46,512 | ||||||||||||||||||||||||
| Total comprehensive income |
106,308 | ||||||||||||||||||||||||
| Stock option plans (net of 67 shares exchanged and $472 tax benefit) |
151 | 16 | 7,840 | — | — | (1,706 | ) | 6,150 | |||||||||||||||||
| Cash dividends at $0.68 per share |
— | — | — | (31,629 | ) | — | — | (31,629 | ) | ||||||||||||||||
| Treasury stock issued |
— | — | (2,323 | ) | — | — | 5,810 | 3,487 | |||||||||||||||||
| BALANCE AT JANUARY 2, 2010 |
55,539 | $ | 5,554 | $ | 551,830 | $ | 562,497 | $ | (7,209 | ) | $ | (188,829 | ) | $ | 923,843 | ||||||||||
See notes to consolidated financial statements.
- 30 -
Table of Contents
Baldor Electric Company
Notes to Consolidated Financial Statements
January 2, 2010
NOTE A – Significant Accounting Policies
Line of Business: The Company operates in one segment that markets, designs and manufactures industrial electric motors, drives, generators, and other mechanical power transmission products, within the power transmission equipment industry. Products are sold throughout the United States and in more than 70 countries.
Use of Estimates: The preparation of financial statements in conformity with accounting principles generally accepted in the United States requires management to make estimates and assumptions that affect the amounts reported in the consolidated financial statements and accompanying notes. Actual results may differ from those estimates.
Consolidation: The consolidated financial statements include the accounts of the Company and its affiliates. Intercompany accounts and transactions have been eliminated in consolidation. The Company does not have any investments in, or contractual arrangements with, any variable interest entities.
Fiscal Year: The Company’s fiscal year ends on the Saturday nearest to December 31, which results in a 52-week or 53-week year. Fiscal year 2009, ending on January 2, 2010, and fiscal year 2007 contained 52 weeks. Fiscal year 2008 contained 53 weeks.
Cash Equivalents: Cash equivalents consist of highly liquid investments having original maturities of three months or less.
Accounts Receivable: Trade receivables are recorded in the balance sheets at the outstanding balance, adjusted for charge-offs and allowance for doubtful accounts. Allowance for doubtful accounts are recorded based on customer-specific analysis, general matters such as current assessments of past due balances and historical experience. Concentrations of credit risk with respect to receivables are limited due to the large number of customers and their dispersion across geographic areas and industries. The Company generally does not require that its customers provide collateral. No single customer represented greater than 10% of net accounts receivable at January 2, 2010, and January 3, 2009. Changes in the allowance for doubtful accounts are as follows:
| (In thousands) | January 2, 2010 |
January 3, 2009 |
December 29, 2007 |
|||||||||
| Balance at beginning of year |
$ | 4,247 | $ | 4,126 | $ | 1,744 | ||||||
| Amounts assumed in acquisition |
— | 62 | 2,715 | |||||||||
| Charges to costs and expenses |
1,545 | 1,264 | 888 | |||||||||
| Deductions |
(1,769 | ) | (1,205 | ) | (1,221 | ) | ||||||
| Balance at end of year |
$ | 4,023 | $ | 4,247 | $ | 4,126 | ||||||
Inventories: The Company uses the last-in, first-out (LIFO) method of valuing inventories held in the United States. The LIFO calculation is made only at year-end based on the inventory levels and costs at that time. Accordingly, interim LIFO adjustments are based on management’s estimates of expected year-end inventory levels and costs which are subject to the final year-end LIFO inventories valuation. Inventories held at foreign locations are valued using the lower of cost measured using the first-in, first-out method (FIFO) or market.
- 31 -
Table of Contents
Property, Plant and Equipment: Property, plant and equipment are stated at cost. Depreciation and amortization are computed principally using the straight-line method over the estimated useful lives of the assets ranging from 10 to 39 years for buildings and improvements and 3 to 15 years for machinery and equipment. Capitalized software costs amounting to $26.4 million and $25.5 million, net of accumulated amortization, at January 2, 2010, and January 3, 2009, respectively, are included in machinery and equipment and are amortized over their estimated useful life of 15 years. Amortization expense was $2.8 million and $2.6 million for 2009 and 2008, respectively. Costs associated with repairs and maintenance are expensed as incurred.
Self-Insurance Liabilities: The Company’s self-insurance programs primarily cover exposure to general and product liability, workers’ compensation and health insurance. The Company self-insures from the first dollar of loss up to specified retention levels. Eligible losses in excess of self-insurance retention levels and up to stated limits of liability are covered by policies purchased from third-party insurers. The aggregate self-insurance liability is estimated using the Company’s claims experience and risk exposure levels. Future adjustments to the self-insured liabilities may be required to reflect emerging claims experience and other factors.
Business Combinations: The Company accounts for acquired businesses using the purchase method of accounting, which requires that the assets acquired and liabilities assumed be recorded at the date of acquisition at their respective fair values. Any excess of the purchase price over the estimated fair values of the net assets acquired is recorded as goodwill. The judgments made in determining the estimated fair value assigned to each class of assets acquired and liabilities assumed, as well as asset lives, can materially impact our results of operations. Accordingly, for significant items, the Company typically obtains assistance from third party valuation specialists. The valuations are based on information available near the acquisition date and are based on expectations and assumptions that have been deemed reasonable by management.
There are multiple methods that can be used to determine the fair value of assets acquired and liabilities assumed. For intangible assets, the Company typically uses relief from royalty, income and market approach methodologies. These methodologies start with a forecast of the expected future net cash flows. These cash flows are then adjusted to present value by applying an appropriate discount rate that reflects the risk factors associated with the cash flow streams. Some of the more significant estimates and assumptions inherent in the income method or other methods include the amount and timing of projected future cash flows; the discount rate selected to measure the risks inherent in the future cash flows; and the assessment of the asset’s life cycle and the competitive trends impacting the asset, including consideration of any technical, legal, regulatory, or economic barriers to entry. Determining the useful life of an intangible asset also requires judgment as different types of intangible assets will have different useful lives and certain assets may even be considered to have indefinite useful lives.
Impairment of Goodwill and Indefinite Lived Intangibles: At January 2, 2010, goodwill and indefinite-lived intangibles amounted to $1.0 billion and $354.8 million, respectively. Goodwill and intangible assets with indefinite useful lives are tested for impairment annually in the fourth quarter. However, the Company could be required to evaluate the recoverability of goodwill and other intangible assets prior to the required annual assessment if the Company experiences disruptions to the business, unexpected significant declines in operating results, divestiture of a significant component of the business or a sustained decline in market capitalization.
- 32 -
Table of Contents
Goodwill impairment is determined using a two-step process. The first step (“Step 1”) is to identify if a potential impairment exists by comparing the fair value of a reporting unit with its carrying amount, including goodwill. If the fair value of a reporting unit exceeds its carrying amount, goodwill of the reporting unit is not considered to have a potential impairment and the second step of the impairment test is not necessary. However, if the carrying amount of a reporting unit exceeds its fair value, the second step is performed to determine if goodwill is impaired and to measure the amount of impairment loss to recognize, if any. The second step compares the implied fair value of goodwill with the carrying amount of goodwill. If the implied fair value of goodwill exceeds the carrying amount, then goodwill is not considered impaired. However, if the carrying amount of goodwill exceeds the implied fair value, an impairment loss is recognized in an amount equal to that excess. The implied fair value of goodwill is determined in the same manner as the amount of goodwill recognized in a business combination (i.e., the fair value of the reporting unit is allocated to all the assets and liabilities, including any unrecognized intangible assets, as if the reporting unit had been acquired in a business combination and the fair value of the reporting unit was the purchase price paid to acquire the reporting unit).
Fair value of a reporting unit is determined using a combination of the Income Approach, which utilizes a discounted cash flow model, and the Market Approach, which utilizes a guideline public company methodology. Judgments and assumptions related to revenue, gross profit, operating expenses, interest, capital expenditures, cash flows, and market conditions are inherent in developing the discounted cash flow model. In applying the guideline public company method, the Company utilized valuation multiples derived from stock prices and enterprise values of publicly traded companies comparable to Baldor.
In 2009 and 2008, Step 1 of the annual impairment tests resulted in no indication of goodwill impairment. In conjunction with the annual goodwill impairment testing, the Company performed a sensitivity analysis, at the reporting unit level, on the discounted cash flows utilized in the analysis. This sensitivity analysis indicated that a higher discount rate or more conservative revenue growth assumptions still resulted in estimated fair value exceeding carrying value. Furthermore, a hypothetical decrease of 10% in the estimated fair value of each of the reporting units would still result in the fair value of each reporting unit exceeding the carrying value. Future changes in judgments and/or assumptions could result in a fair value that differs from these estimates which could ultimately result in the recognition of impairment charges in the financial statements.
Subsequent to the annual testing at October 1, 2008, the Company’s market capitalization decreased significantly as a result of market-driven declines in the stock trading price. While the stock did not trade at a price below book value for a sustained period of time through fiscal year-end 2008, the Company performed an interim test of goodwill at January 3, 2009 due to the decline in market capitalization and overall market conditions. In updating the annual testing analysis from October 1, 2008, the Company reviewed expectations of cash flows and other critical assumptions utilized in the analysis. Based on results of the interim Step 1 test, management concluded that goodwill was not impaired at January 3, 2009.
In conjunction with our annual testing of goodwill, the Company evaluated the reasonableness of the estimated fair value of its reporting units by reconciling to the Company’s market capitalization at each date. This reconciliation allowed the Company to consider market expectations in corroborating the reasonableness of the fair value of its reporting units.
For the other intangible assets, if the carrying value of the intangible asset exceeds its fair value, an impairment loss is recognized by an amount equal to that excess. A relief from royalty methodology is utilized to estimate the fair value of indefinite-lived intangible assets.
- 33 -
Table of Contents
The Company’s fiscal 2009 and 2008 annual impairment analyses of the other intangible assets did not result in an impairment charge. However, based on sensitivity analysis performed in conjunction with the 2009 annual test, a 5% decline in the estimated fair value of one of the Company’s indefinite-lived intangible assets with a carrying value of $225.9 million would have resulted in the estimated fair value falling below the carrying value by approximately $4.7 million. Management will continue to monitor business conditions and projected revenues related to its indefinite-lived intangibles and will perform additional interim testing if deemed necessary.
Long-Lived Assets: The Company periodically evaluates the carrying value of long-lived assets held and used, including intangible assets, when events or circumstances warrant such a review. The Company recognizes impairment losses equal to the excess of the carrying value over the estimated fair value of long-lived assets used in operations when indicators of impairment are present and the undiscounted cash flows expected to be generated by the asset are not sufficient to recover the carrying amount of the asset. Fair value is generally derived using a discounted cash flow model.
Financial Derivatives: The Company uses derivative financial instruments to reduce its exposure to the risk of increasing commodity prices. Contract terms of the hedging instrument closely mirror those of the hedged forecasted transaction providing for the hedge relationship to be highly effective both at inception and continuously throughout the term of the hedging relationship. Additionally, the Company utilizes derivative financial instruments to limit exposure to increasing interest rates on variable rate borrowings. The Company does not engage in speculative transactions, nor does the Company hold or issue financial instruments for trading purposes.
The Company recognizes all derivatives on the balance sheets at fair value. Derivatives that do not meet the criteria for hedge accounting are adjusted to fair value through income. If the derivative is designated as a cash flow hedge, changes in the fair value are recognized in accumulated other comprehensive income (loss) until the hedged transaction is recognized in income. If a hedging instrument is terminated, any unrealized gain (loss) at the date of termination is carried in accumulated other comprehensive income (loss) until the hedged transaction is recognized in income. The ineffective portion of a derivative’s change in fair value is recognized in income in the period of change.
Derivative assets and liabilities executed with the same counterparty under a master netting agreement and collateral accounts (i.e. margin deposits) are netted with the corresponding derivative assets and liabilities in the consolidated balance sheets. The fair value liability as of January 3, 2009, is net of $19.1 million of margin deposits. There were no margin deposits required at January 2, 2010.
Pension and Postretirement Health Plan: The Company uses the fiscal year end as a measurement date for its postretirement health plan.
Income Taxes: Provision for income taxes are provided based on the liability method of accounting. Deferred income taxes are provided for the expected future tax consequences of temporary differences between the basis of assets and liabilities reported for financial and tax purposes.
The Company reviews all of its open tax year income tax filings in order to identify, evaluate, and properly report in its financial statements all material uncertain tax positions taken over the past year. Upon completion of this evaluation and analysis, a determination is made regarding whether the tax positions can be sustained based upon the more-likely-than-not standard, i.e., greater than 50% certainty. Any tax position which is determined not to be sustainable based upon the more-likely-than-not standard is recorded as a liability, with penalties and interest accrued on the uncertain tax positions.
The uncertain tax positions reverse upon either the settlement of an audit, voluntary disclosure and payment, or the expiration of the statute of limitations in the respective taxing jurisdiction.
Research and Engineering: Costs associated with research, new product development, and product and cost improvements are expensed as incurred and amounted to approximately $31.2 million in 2009, $35.4 million in 2008, and $34.3 million in 2007.
- 34 -
Table of Contents
Shipping and Handling Costs: The Company classifies all amounts billed to customers for shipping and handling as revenue and classifies gross shipping and handling costs paid as selling expense. Costs included in selling and administrative expenses related to shipping and handling amounted to approximately $34.5 million in 2009, $56.0 million in 2008, and $48.6 million in 2007.
Revenue Recognition: The Company sells products to its customers FOB shipping point. Title passes to the customer when the product is shipped. Accordingly, revenue is recognized when the product is shipped. Volume discounts and rebates are recorded as a reduction of revenue in conjunction with the sale of the related products. Reserves for sales returns and allowances are recorded as a reduction to revenues, based on historical experience and any specifically known amounts.
Product Warranties: The Company accrues for product warranty claims based on historical experience and the expected costs to provide warranty service. The warranty period generally ranges from one to two years. Changes in the carrying amount of product warranty reserves are as follows:
| (In thousands) | January 2, 2010 |
January 3, 2009 |
||||||
| Balance at beginning of period |
$ | 9,477 | $ | 9,216 | ||||
| Charges to costs and expenses |
11,711 | 12,536 | ||||||
| Payments |
(11,858 | ) | (12,275 | ) | ||||
| Balance at end of period |
$ | 9,330 | $ | 9,477 | ||||
Amounts included in selling and administrative costs related to product warranty expense amounted to $11.7 million in 2009, $12.5 million in 2008, and $11.6 million in 2007.
Foreign Currency Translation: Assets and liabilities of foreign affiliates are translated into U.S. dollars at year-end exchange rates. Income statement items are translated at average exchange rates prevailing during the period. Foreign affiliates generally conduct business in their respective local currencies. Translation adjustments, including those related to intercompany advances that are of a long-term investment nature, are recorded in accumulated other comprehensive income (loss) in shareholders’ equity.
Earnings Per Common Share: Basic earnings per common share is based upon the weighted average number of common shares outstanding. Diluted earnings per common share includes all dilutive common stock equivalents.
Share-Based Compensation: The Company has share-based compensation plans, which are described more fully herein under NOTE K – Stock Plans.
Fair value of the stock options is estimated using a Black-Scholes option pricing formula. The variables used in the option pricing formula for each grant are determined at the time of grant as follows: (1) volatility is based on the daily composite closing price of Baldor’s stock over a look-back period of time that approximates the expected option life; (2) risk-free interest rates are based on the yield of U.S. Treasury Strips as published in the Wall Street Journal or provided by a third-party on the date of the grant for the expected option life; (3) dividend yields are based on Baldor’s dividend yield published in the Wall Street Journal or provided by a third-party on the date of the grant; and (4) expected option life represents the period of time the options are expected to be outstanding. Assumptions used in the fair-value valuation are adjusted to reflect current developments at the date of grant.
- 35 -
Table of Contents
The simplified method for estimating the expected life for employee stock options uses the mid-point between the vesting term and the contractual term of the stock option. The Company used the simplified method through second quarter 2009 and began using historical data for grants issued beginning third quarter 2009. Prior to the third quarter 2009, the Company did not have a method to capture historical exercise data from which to estimate the expected term.
The Company has granted restricted stock units under its share-based compensation plans. The Company amortizes the fair value of restricted stock unit awards, which is based on the closing market price on the date of grant, to compensation expense generally on a straight-line basis over the vesting period, taking into consideration an estimate of shares expected to vest.
NOTE B – Acquisitions
On January 31, 2007, Baldor acquired all of the equity of Reliance Electric from Rockwell and certain of its affiliates. Reliance was a leading manufacturer of industrial electric motors and other mechancial power transmission products. The acquisition extended Baldor’s product offerings, provided a manufacturing base in China for the Asian markets, increased the Company’s manufacturing capabilities and flexibility, strengthened the management team, and provided strong opportunities for synergies and cost savings. The purchase price was $1.83 billion, consisting of $1.78 billion in cash and 1.58 million shares of Baldor common stock valued at $50.93 million, based on the average closing price per share of Baldor’s common stock on the New York Stock Exchange for the three days preceding and the three days subsequent to November 6, 2006, the date of the definitive purchase agreement. The cash portion of the purchase price was funded with proceeds from the issuance of 10,294,118 shares of Baldor common stock at a price of $34.00 per common share, proceeds from the issuance of $550.0 million of 8.625% senior notes due 2017, and borrowings of $1.00 billion under a new $1.20 billion senior secured credit facility. In conjunction with an over-allotment option in the common stock offering, 1,430,882 additional common shares were issued at a price of $34.00 per share. Proceeds from the over-allotment offering of approximately $46.5 million were utilized to reduce borrowings under the senior secured credit facility. Reliance’s results of operations are included in the consolidated financial statements beginning February 1, 2007.
In process research and development amounting to $1.0 million and backlog amounting to $0.7 million were expensed as of the acquisition date and included in cost of goods sold in 2007.
The table below presents summarized unaudited pro forma results of operations as if the acquisition had been effective at the beginning of the fiscal year ended December 29, 2007.
| (In millions, except for per share data) | 2007 | ||
| Net sales |
$ | 1,919.0 | |
| Income before income taxes |
151.3 | ||
| Net income |
96.7 | ||
| Net earnings per common share – diluted |
$ | 2.09 | |
On August 29, 2008, Baldor acquired Poulies Maska, Inc. (“Maska”) of Ste-Claire, Quebec, Canada. The purchase price was $43.2 million which was funded by cash and borrowings under the revolving credit facility. Maska was a designer, manufacturer and marketer of sheaves, bushings, couplings and related mechanical power transmission components. The acquisition gave Baldor additional manufacturing plants in both Canada and China and expanded the Company’s market share of sheaves and bushings in North America. Maska’s results of operations are not material to the Company’s consolidated financial statements and accordingly, pro forma information has not been presented. The Company’s consolidated financial statements include the results of operations of Maska beginning August 30, 2008.
- 36 -
Table of Contents
The excess of the purchase price over the estimated fair values is assigned to goodwill. Adjustments to the estimated fair values may be recorded during the allocation period, not to exceed one year from the date of acquisition.
The following table summarizes the estimated fair values of assets acquired and liabilities assumed at the date of acquisition.
| (In thousands) | |||
| Current assets |
$ | 24,609 | |
| Property, plant and equipment |
18,270 | ||
| Intangible assets subject to amortization – Trade names (useful life of 10 years) |
3,174 | ||
| Goodwill |
5,999 | ||
| Total assets acquired |
52,052 | ||
| Current liabilities |
5,556 | ||
| Long-term obligations |
2,311 | ||
| Deferred income taxes |
1,022 | ||
| Total liabilities assumed |
8,889 | ||
| Net assets acquired |
$ | 43,163 | |
NOTE C – Financial Derivatives
The Company uses derivative financial instruments to reduce its exposure to the risk of increasing commodity prices by maintaining sufficient commodity hedge contracts to ensure the Company pays a certain price or remains within a limited price range even when market prices fluctuate outside that range. Contract terms of the hedging instrument closely mirror those of the hedged forecasted transaction providing for the hedge relationship to be highly effective both at inception and continuously throughout the term of the hedging relationship. Additionally, the Company utilizes derivative financial instruments to limit exposure to increasing interest rates on variable rate borrowings. The Company does not regularly engage in speculative transactions, nor does the Company hold or issue financial instruments for trading purposes.
The Company recognizes all of its derivative instruments as either assets or liabilities in the consolidated balance sheets at fair value. The accounting for changes in the fair value (i.e., gains or losses) of a derivative instrument depends on whether it has been designated and qualifies as part of a hedging relationship and further, on the type of hedging relationship. For those derivative instruments that are designated and qualify as hedging instruments, the Company designates the hedging instrument based upon the exposure being hedged (i.e., fair value hedge, cash flow hedge, or a hedge of a net investment in a foreign operation).
Cash Flow Hedges
The Company has entered into certain commodity forward contracts to manage the price risk associated with forecasted purchases of materials used in the Company’s manufacturing process. The effective portion of the gain or loss on the derivative instruments is reported as a component of other comprehensive income and reclassified into earnings in the same period or periods during which the hedged transaction affects earnings. Gains and losses on the derivative instruments representing either hedge ineffectiveness or hedge components excluded from the assessment of the effectiveness are recognized in earnings in the current period. Ineffective portions of the Company’s commodity cash flow hedges were not material during 2009, 2008, or 2007.
- 37 -
Table of Contents
As of January 2, 2010, the Company had the following outstanding commodity forward contracts:
| Commodity |
Volume in Pounds | |
| Copper |
12,091,500 |
Losses recognized on commodity cash flow hedges increased cost of sales by $18.2 million in 2009 and $718,000 in 2008, and gains recognized reduced cost of sales by $1.3 million in 2007. The Company expects after-tax gains totaling $10.5 million at January 2, 2010, recorded in accumulated other comprehensive income (loss) related to commodity cash flow hedges, will be recognized in cost of sales within the next twelve months.
The Company has entered into interest rate instruments related to variable rate long-term obligations. The notional amount is $350.0 million and the instruments mature on April 30, 2012. Unrealized after-tax losses of $11.8 million are recorded in accumulated other comprehensive income at January 2, 2010. On March 31, 2009, the Company amended its senior secured credit agreement. In conjunction with the amendment, a LIBOR floor was added to the variable rate borrowings. As a result, the Company determined that its existing interest rate hedges were no longer expected to be highly effective. Accordingly, effective March 31, 2009, the interest rate hedge instruments were discontinued as cash flow hedges. Accumulated after-tax losses recorded in accumulated other comprehensive income (loss) prior to the discontinuance remain in accumulated other comprehensive income and are recognized in earnings as the forecasted transactions occur or become probable of not occurring. Amortization related to the discontinuance of the interest rate hedge was $9.0 million during 2009 and is included in interest expense on the consolidated statements of income. The change in fair value of the interest rate hedge instrument was $6.6 during 2009 and is included in interest expense on the consolidated statements of income.
The following table sets forth the pretax impact of cash flow hedge derivative instruments on the consolidated statements of income (in thousands):
| Derivatives designated as hedging instruments – Cash flow hedges |
Gain (Loss) Recognized in OCI on Derivative |
Gain (Loss) Reclassified from Accumulated OCI into Income |
||||||||||||||
| 2009 | 2008 | 2009 | 2008 | |||||||||||||
| Interest rate contracts (1) |
$ | (34 | ) | $ | (17,834 | ) | $ | (9,009 | ) | $ | — | |||||
| Commodity contracts |
30,259 | (30,650 | ) | (18,153 | ) | (718 | ) | |||||||||
| Total |
$ | 30,225 | $ | (48,484 | ) | $ | (27,162 | ) | $ | (718 | ) | |||||
| (1) | Effective March 31, 2009, the interest rate instruments were discontinued as cash flow hedges. The loss reclassified from Accumulated OCI for 2009 represents the amortization related to the discontinuance as cash flow hedge. |
| Derivatives not designated as hedging instruments |
Location of Gain (Loss) Recognized in Income on Derivative |
Amount of Gain (Loss) Recognized in Income on Derivative | ||||||
| 2009 | 2008 | |||||||
| Interest rate contracts (1) |
Interest Expense | $ | 6,561 | $ | — | |||
| Total |
$ | 6,561 | $ | — | ||||
| (1) | Effective March 31, 2009, the interest rate instruments were discontinued as cash flow hedges. |
- 38 -
Table of Contents
The following table sets forth the fair value of all derivative instruments outstanding at January 2, 2010 and January 3, 2009 and the classification in the consolidated balance sheets (in thousands):
| Balance Sheet Classification |
2009 | 2008 | ||||||
| Derivative Assets |
||||||||
| Derivatives designated as hedging instruments |
||||||||
| Commodity contracts |
Other Current Assets |
$ | 17,386 | $ | — | |||
| Total derivative assets—designated |
17,386 | — | ||||||
| Total derivative assets |
$ | 17,386 | $ | — | ||||
| Derivative Liabilities |
||||||||
| Derivatives designated as hedging instruments |
||||||||
| Commodity contracts |
Other Accrued Expenses |
$ | — | $ | 31,026 | |||
| Interest rate contracts (1) |
Other Accrued Expenses |
— | 28,496 | |||||
| Total derivative liabilities—designated |
$ | — | $ | 59,522 | ||||
| Derivatives not designated as hedging instruments |
||||||||
| Interest rate contracts (1) |
Other Accrued Expenses |
$ | 21,969 | $ | — | |||
| Total derivative liabilities – not designated |
21,969 | — | ||||||
| Total derivative liabilities |
$ | 21,969 | $ | 59,522 | ||||
| (1) | Effective March 31, 2009, the interest rate instruments were discontinued as cash flow hedges. |
Unrealized gains or losses related to the Company’s cash flow hedges are recorded in accumulated other comprehensive income (loss) at each measurement date. Unrealized gains or losses related to instruments that are not designated as hedges are recorded through the statement of income at each measurement date.
NOTE D – Goodwill and Other Intangible Assets
The amounts of goodwill at January 2, 2010 and January 3, 2009 are as follows:
| (In thousands) | ||||
| Balance at January 3, 2009 |
$ | 1,033,575 | ||
| Purchase accounting adjustments related to Maska valuation |
3,912 | |||
| Adjustment related to Reliance purchase price allocation |
(5,003 | ) | ||
| Translation adjustment |
249 | |||
| Balance at January 2, 2010 |
$ | 1,032,733 | ||
During the fourth quarter of 2009, the Company determined there was a computational error related to deferred income taxes and income taxes payable balances established in the initial
- 39 -
Table of Contents
Reliance purchase price allocation. The Company evaluated the impact of this error on the initial purchase price allocation and concluded that the error was not of a magnitude to require restatement of the initial purchase price allocation. The computational error had less than 1% impact on goodwill, total assets, net deferred tax liabilities and current liabilities as of December 29, 2007. As a result, the adjustment was reflected in 2009.
The amounts of other intangible assets by type are as follows:
| (In thousands) | January 2, 2010 |
January 3, 2009 |
||||||
| Gross carrying value: |
||||||||
| Tradenames – indefinite lived |
$ | 354,800 | $ | 354,800 | ||||
| Trademarks – definite lived |
3,174 | 2,946 | ||||||
| Customer relationships |
292,000 | 292,000 | ||||||
| Technology |
32,000 | 32,000 | ||||||
| Less accumulated amortization: |
||||||||
| Trademarks |
(423 | ) | — | |||||
| Customer relationships |
(38,054 | ) | (24,337 | ) | ||||
| Technology |
(6,427 | ) | (4,138 | ) | ||||
| Total intangible assets |
$ | 637,070 | $ | 653,271 | ||||
Amortization expense on customer relationships of $13.7 million and $15.4 million was recognized during 2009 and 2008, respectively. Amortization expense on technology of $2.3 million and $1.6 million was recognized during 2009 and 2008, respectively. Amortization expense on definite lived trademarks of $423,000 was recognized during 2009.
| (In millions) | 2010 | 2011 | 2012 | 2013 | 2014 | ||||||||||
| Estimated amortization expense of intangible assets |
$ | 16.5 | $ | 16.8 | $ | 16.2 | $ | 14.5 | $ | 14.0 | |||||
Intangibles are amortized over their estimated period of benefit of five to 30 years (weighted average of 30 years), beginning with the date the benefits from intangible items are realized.
NOTE E – Income Taxes
The Company paid income taxes of $32.6 million, $94.1 million, and $44.6 million during 2009, 2008, and 2007, respectively.
The Company has income taxes recoverable of $7.1 million included in the “Other current assets” on the Consolidated Balance Sheet as of January 2, 2010 and January 3, 2009, respectively.
- 40 -
Table of Contents
The components of the provision for income taxes were:
| (In thousands) | 2009 | 2008 | 2007 | ||||||||||
| Current: |
Federal | $ | 24,708 | $ | 59,047 | $ | 41,918 | ||||||
| State | 5,539 | 12,152 | 8,608 | ||||||||||
| Foreign | 3,625 | 7,927 | 5,048 | ||||||||||
| 33,872 | 79,126 | 55,574 | |||||||||||
| Deferred: |
Federal | 5,390 | (25,793 | ) | (2,316 | ) | |||||||
| State | 910 | (2,106 | ) | (197 | ) | ||||||||
| Foreign | 1,146 | 1,619 | — | ||||||||||
| 7,446 | (26,280 | ) | (2,513 | ) | |||||||||
| $ | 41,318 | $ | 52,846 | $ | 53,061 | ||||||||
The following table reconciles the difference between the Company’s effective income tax rate and the federal statutory rate:
| 2009 | 2008 | 2007 | |||||||
| Statutory federal income tax rate |
35.0 | % | 35.0 | % | 35.0 | % | |||
| State income taxes, net of federal tax benefit |
3.8 | % | 4.5 | % | 3.7 | % | |||
| Domestic production activities deduction |
(0.9 | )% | (2.0 | )% | (1.6 | )% | |||
| Foreign tax rate differential |
(2.3 | )% | (1.8 | )% | (1.9 | )% | |||
| Taxable distribution from foreign subsidiary |
3.0 | % | — | — | |||||
| Other items, net |
0.4 | % | (1.3 | )% | 0.9 | % | |||
| Change in valuation allowance |
1.9 | % | 0.3 | % | 0.0 | % | |||
| Effective income tax rate |
40.9 | % | 34.7 | % | 36.1 | % | |||
The Company has accumulated but undistributed earnings of foreign subsidiaries aggregating approximately $52.5 million at January 2, 2010, that are expected to be indefinitely reinvested in the business. It is not practicable to estimate the tax liability that might be payable on the repatriation of these foreign earnings.
Deferred income taxes reflect the net effects of temporary differences between the carrying amounts of assets and liabilities for financial reporting purposes and the amounts used for income tax purposes.
- 41 -
Table of Contents
The principle components of deferred tax assets (liabilities) are as follows:
| (In thousands) | January 2, 2010 |
January 3, 2009 |
||||||
| Accrued liabilities |
$ | 5,852 | $ | 8,073 | ||||
| Bad debt reserves |
917 | 917 | ||||||
| Derivative instruments, unrealized loss |
846 | 23,511 | ||||||
| Employee compensation and benefits |
614 | 608 | ||||||
| Foreign net operating loss carry forwards |
1,930 | 1,395 | ||||||
| Inventory reserves |
3,706 | 3,533 | ||||||
| Post retirement benefits |
20,810 | 22,147 | ||||||
| Prepaid loan costs |
5,845 | — | ||||||
| Product warranty |
3,576 | 3,781 | ||||||
| Self-insurance reserves |
4,028 | 4,477 | ||||||
| Share-based compensation |
4,766 | 3,842 | ||||||
| State income taxes |
18,007 | 17,840 | ||||||
| Other items |
8,666 | 5,830 | ||||||
| Deferred tax assets |
79,563 | 95,954 | ||||||
| Property, plant, and equipment |
(64,180 | ) | (65,082 | ) | ||||
| Intangible assets |
(281,021 | ) | (286,807 | ) | ||||
| Gain on debt modification |
(17,697 | ) | — | |||||
| Other items |
(11,379 | ) | (15,075 | ) | ||||
| Deferred tax liabilities |
(374,277 | ) | (366,964 | ) | ||||
| Valuation allowance |
(2,533 | ) | (406 | ) | ||||
| Net deferred tax liabilities |
$ | (297,247 | ) | $ | (271,416 | ) | ||
Deferred income taxes are included in the Consolidated Balance Sheets as follows:
| (In thousands) | January 2, 2010 |
January 3, 2009 |
||||||
| Other current assets |
$ | 10,965 | $ | 36,955 | ||||
| Deferred income taxes |
(308,212 | ) | (308,371 | ) | ||||
| Net deferred tax liabilities |
$ | (297,247 | ) | $ | (271,416 | ) | ||
Management reviews the components of deferred tax assets to ascertain that, based upon the information available at the time of the preparation of financial statements, it is more likely-than-not, that the Company expects to utilize these future deductions. In the event that management determines that it is more likely-than-not these future deductions will not be utilized, a valuation allowance is recorded, reducing the deferred tax asset to the amount expected to be realized.
In 2009 and 2008, valuation allowances of $2.5 million and $406,000, respectively, were recorded for certain net operating loss carry-forwards of foreign subsidiaries and state incentive tax credits that do not yet meet the more-likely-than not standard. Of these net operating loss carry-forwards, $1.4 million will expire in various years through 2028. The remaining $5.6 million carry-forwards have no expiration. The state incentive tax credits of $780,000 will expire in various years through 2012.
The Company has $1.1 million and $824,000 in gross unrecognized tax benefits as of January 2, 2010 and January 3, 2009, respectively. The amount of unrecognized tax benefits at January 2,
- 42 -
Table of Contents
2010 and January 3, 2009 that would impact the effective tax rate if these tax benefits were recognized is $862,000 and $536,000, respectively. The Company does not believe the amounts of unrecognized tax benefits will significantly increase or decrease over the next twelve month period.
The Company recognizes interest and penalties related to uncertain tax positions as interest expense and selling and administrative expenses, respectively. During 2009 the total amount of expense for interest and penalties was $213,000. The total amount of accrued interest and penalties for such unrecognized tax benefits is $461,000 at January 2, 2010.
The following table summarizes the activity related to the unrecognized tax benefits:
| (In thousands) | January 2, 2010 |
January 3, 2009 |
December 29, 2007 |
|||||||||
| Unrecognized benefit at beginning of year |
$ | 824 | $ | 824 | $ | 454 | ||||||
| Additions as a result of acquisition |
— | — | 481 | |||||||||
| Additions for tax positions related to prior years |
410 | 32 | 321 | |||||||||
| Reductions for settlements |
(128 | ) | (32 | ) | (432 | ) | ||||||
| Unrecognized benefit at end of year |
$ | 1,106 | $ | 824 | $ | 824 | ||||||
The Company files its income tax returns according to the tax laws of the various jurisdictions in which it operates, which includes the U.S. federal jurisdiction, and various state and foreign jurisdictions. The Company files a consolidated U.S. federal income tax return. Tax years 2004 and forward generally remain subject to examination by federal and state taxing authorities.
NOTE F – Note Payable
The Company’s wholly-owned Chinese subsidiary entered into a short-term note payable during the fourth quarter of 2007. The principal balance was $735,000 at January 3, 2009 and was paid off during the first quarter of 2009.
NOTE G – Long-term Obligations
Long-term obligations are as follows:
| ($ In thousands) | Interest Rate at January 2, 2010 |
January 2, 2010 |
January 3, 2009 | ||||||
| Senior secured term loan, variable interest rate |
5.250 | % | $ | 304,026 | $ | 361,627 | |||
| Senior secured term loan, variable interest rate – hedged |
9.852 | % | 350,000 | 350,000 | |||||
| Revolving credit facility, variable interest rate |
5.250 | % | — | 60,000 | |||||
| Senior unsecured notes, fixed interest rate |
8.625 | % | 550,000 | 550,000 | |||||
| Other |
6.277 | % | 1,324 | 4,560 | |||||
| 1,205,350 | 1,326,187 | ||||||||
| Less current maturities |
7,108 | 7,609 | |||||||
| 1,198,242 | 1,318,578 | ||||||||
| Less discount on senior secured term loan |
42,237 | — | |||||||
| $ | 1,156,005 | $ | 1,318,578 | ||||||
Maturities of long-term obligations are as follows: 2010 - $7.1 million; 2011 - $7.1 million; 2012 - $7.1 million; 2013 - $475.9 million; and thereafter $708.2 million.
- 43 -
Table of Contents
Amendment of Senior Secured Term and Revolving Credit Facility
Effective March 31, 2009, the Company amended its senior secured credit facility. The amendment relaxed certain financial ratio covenants through the remaining term of the agreement. In conjunction with the amendment, pricing on the outstanding term loan borrowings and future revolver borrowings was increased from 1.75% to 3.25% and a LIBOR floor of 2.00% was added to the variable rate borrowings.
The modification of the senior secured term loan was accounted for as an extinguishment of debt. As a result, the senior secured term loan was recorded at fair value as of the modification date which resulted in a noncash debt discount of $49.7 million being recorded in long-term obligations on the consolidated balance sheet and a $35.7 million gain on debt modification in income from continuing operations in the consolidated statement of income. The discount is being amortized to other expense over the remaining term of the debt. Fees paid related to the amendment of $5.7 million along with unamortized fees related to the original agreement of $8.3 million were deducted when calculating the gain. The unamortized balance of the discount is $42.2 at January 2, 2010. Amortization amounted to $7.5 million in 2009.
The amendment did not change the borrowing capacity of the revolving credit facility; therefore, fees of $1.6 million related to the amendment were deferred and are being amortized over the remaining term of the facility agreement and unamortized fees of $1.1 million related to the original agreement continue to be amortized over the remaining term.
Senior Secured Term and Revolving Credit Facility
Interest on the term loan is due periodically and calculated based on 3.25% plus a variable adjusted London Inter-Bank Offered Rate (“LIBOR”) with a minimum LIBOR rate of 2.0%. Quarterly principal payments of $1.7 million are due beginning January 29, 2010, and continue through January 31, 2013, at which date subsequent quarterly principal payments increase to $158.0 million through the loan due date of January 31, 2014.
Additional principal payments may be due based upon a prescribed annual excess cash flow calculation until such time as a prescribed total leverage ratio is achieved. There were no additional payments due based on the Company’s calculations for the fiscal year ended January 2, 2010 and January 3, 2009. Additional principal payments may also be due based upon the net available proceeds from the disposition of assets, a casualty event, an equity issuance or incurrence of additional debt.
This loan agreement limits and restricts certain dividend and capital expenditure payments, establishes maximum total leverage and senior secured leverage ratios, and requires the Company maintain a fixed charge ratio. These restrictions and ratios were all met as of January 2, 2010.
The revolving credit (“RC”) agreement, which matures April 30, 2012, provides for aggregate borrowings of up to $200.0 million, including a swingline loan commitment not to exceed $20.0 million and letter of credit (“LC”) commitment not to exceed $30.0 million, and contains minimum borrowing thresholds for each type of borrowing. As of January 2, 2010, the Company had no outstanding borrowings under the revolver. An RC commitment fee is due quarterly at the annual rate of 0.625% on the unused amount of the RC commitment. At January 2, 2010, $19.8 million of LC’s were issued which reduces the aggregate LC and RC availability. Availability totaled $180.2 million at January 2, 2010. LC participation fees of 3.25% and fronting fees of 0.125% per annum on unissued LC’s are due quarterly based upon the aggregate amount of
- 44 -
Table of Contents
LC’s issued and available for issuance, respectively. Interest on RC borrowings accrues at 3.25% plus LIBOR (0.23% at January 2, 2010) with a minimum rate of 2.0% or 1.25% per annum plus Prime (3.25% at January 2, 2010).
The senior secured credit facility is collateralized by substantially all of the Company’s assets.
Senior Unsecured Notes
The senior unsecured notes are general unsecured obligations of the Company, subordinated to the senior secured credit facility described above, and mature February 15, 2017. Interest is at a fixed rate and is payable semi-annually in arrears on February 15 and August 15 commencing August 15, 2007.
At any time prior to February 15, 2010, the Company may redeem up to 35.0% of the aggregate principal amount of the notes at a redemption price of 108.625% of the principal amount, plus accrued and unpaid interest to the redemption date, with the net cash proceeds of one or more equity offerings with certain restrictions. At any time prior to February 15, 2012, the Company may redeem all or a part of the notes at a redemption price equal to the sum of (i) 100% of the principal amount thereof, plus (ii) the applicable premium as defined in the agreement as of the date of redemption, plus (iii) accrued and unpaid interest to the redemption date. On or after February 15, 2012, the Company may redeem all or a part of the notes at the redemption prices (expressed as percentages of principal amount) set forth below plus accrued and unpaid interest on the notes redeemed to the applicable redemption date.
| Year |
Percentage | ||
| 2012 |
104.313 | % | |
| 2013 |
102.875 | % | |
| 2014 |
101.438 | % | |
| 2015 and thereafter |
100.000 | % |
The indenture agreement contains certain restrictions and requirements including restrictions and requirements regarding mergers, consolidation or sale of assets, certain payments, the incurrence of indebtedness and liens, and issuance of preferred stock, and note holder options if a change of control occurs. These notes are also subject to the term and revolving credit loans maximum total leverage and fixed charges ratios.
Interest paid was $92.5 million in 2009, $99.3 million in 2008, and $76.4 million in 2007.
NOTE H – Commitments and Contingencies
Operating Lease Commitments
The Company leases certain computers, buildings, and other equipment under operating lease agreements. Related rental expense was $14.6 million in 2009, $12.5 million in 2008, and $11.5 million in 2007. Future minimum payments for operating leases having non-cancelable lease terms in excess of one year are: 2010 - $14.2 million; 2011 - $12.6 million; 2012 - $10.1 million; 2013 - $6.8 million, 2014 - $6.2 million; and thereafter - $21.6 million.
On July 21, 2005, the Company entered into a five-year operating lease agreement on a new manufacturing facility in Columbus, Mississippi. At the end of the initial five-year lease term, the Company has the option to extend the lease for up to two successive five-year periods under terms similar to the terms of the original lease or purchase the property at a stated amount that
- 45 -
Table of Contents
approximates the fair value of the property. The Company has annual operating lease commitments of $1.2 million related to the lease. As part of the lease agreement, the Company is subject to an 82% residual value guarantee at the end of the lease term in the event the value of the property has decreased. The maximum potential liability under the residual value guarantee would be $13.6 million should the property become worthless by the end of the lease term. The Company has recorded a liability of $393,000 classified in other liabilities, which represents the fair value of the guarantee, based on a probability-weighted calculation of the expected value of the property at the end of the lease term.
The Company leases certain manufacturing facilities under operating leases entered into by Reliance in a November 2005 sale-leaseback transaction. Reliance retained rights to reacquire land adjacent to three of the properties included in the transaction. As a result, no sale was recorded on these three properties and the assets continue to be carried in Property, Plant and Equipment on the Company’s balance sheet at a net book value of $11.4 million as of January 2, 2010. Proceeds of $18.7 million from the sale-leaseback transaction are recorded as a deferral in Other Liabilities at January 2, 2010 and January 3, 2009. Operating lease payments of $1.4 million per year related to these properties are included in future minimum lease payments.
Legal Proceedings and Contingent Liabilities
The Company is subject to a number of legal actions arising in the ordinary course of business. Management expects the ultimate resolution of these actions will not materially affect the Company’s financial position, results of operations, or cash flows.
Prior to the Company’s acquisition of Reliance Electric, Reliance’s parent company, Rockwell Automation, determined actions by a small number of employees at certain of Reliance’s operations in one jurisdiction may have violated the Foreign Corrupt Practices Act (“FCPA”) or other applicable laws. Reliance did business in this jurisdiction with government owned enterprises or government owned enterprises evolving to commercial businesses. These actions involved payments for non-business travel expenses and certain other business arrangements involving potentially improper payment mechanisms for legitimate business expenses. Rockwell voluntarily disclosed these actions to the U.S. Department of Justice (“DOJ”) and the Securities and Exchange Commission (“SEC”) beginning in September 2006. Rockwell has agreed to update the DOJ and SEC periodically regarding any further developments as the investigation continues. If violations of the FCPA occurred, Rockwell and Reliance may be subject to consequences that could include fines, penalties, other costs and business-related impacts. Rockwell and Reliance could also face similar consequences from local authorities. The Company has been indemnified by Rockwell against government penalties arising from these potential violations. This indemnification covers only penalties and may not cover expenses incurred by the Company for future compliance. The Company conducts compliance training on a regular schedule.
NOTE I – Shareholders’ Equity
Share Repurchases
No shares were repurchased during 2009 or 2008. Future repurchases are limited under terms of the Company’s senior secured credit facility.
- 46 -
Table of Contents
Accumulated Other Comprehensive Income (Loss)
Balances of related after-tax components comprising accumulated other comprehensive income (loss), included in shareholders’ equity are as follows:
| (In thousands) | Unrealized Gains (Losses) on Derivatives |
Post Retirement Plan Adjustment |
Foreign Currency Translation Adjustments |
Total Accumulated Other Comprehensive Income (Loss) |
||||||||||||
| Balance at December 30, 2006 |
$ | (1,293 | ) | $ | — | $ | 366 | $ | (927 | ) | ||||||
| Net change 2007 |
(5,940 | ) | (1,471 | ) | 8,311 | 900 | ||||||||||
| Balance at December 29, 2007 |
(7,233 | ) | (1,471 | ) | 8,677 | (27 | ) | |||||||||
| Net change 2008 |
(28,880 | ) | (4,333 | ) | (20,481 | ) | (53,694 | ) | ||||||||
| Balance at January 3, 2009 |
(36,113 | ) | (5,804 | ) | (11,804 | ) | (53,721 | ) | ||||||||
| Net change 2009 |
34,668 | (850 | ) | 12,694 | 46,512 | |||||||||||
| Balance at January 2, 2010 |
$ | (1,445 | ) | $ | (6,654 | ) | $ | 890 | $ | (7,209 | ) | |||||
NOTE J – Profit –Sharing Plan, Pension Plan and Other Postretirement Benefits
The Company has a profit-sharing plan covering most domestic employees with more than two years of service. The Company’s contribution is derived by a formula that resulted in contributions of approximately 12% of pre-tax earnings of participating companies. Profit sharing expense amounted to approximately $7.9 million in 2009, $16.5 million in 2008, and $17.1 million in 2007.
As a result of the acquisition of Reliance, the Company assumed defined benefit pension and postretirement benefit plans covering certain union employees and retirees. Estimated liabilities amounting to approximately $48.4 million at January 2, 2010 and $51.9 million at January 3, 2009 are included in other liabilities on the consolidated balance sheets.
During 2009, the number of participants in the Company’s defined benefit pension and postretirement benefit plans decreased as a result of plant restructuring. This reduction was accounted for as a curtailment. The curtailment resulted in adjustments of approximately $6.8 million to the estimated pension and postretirement liabilities and accumulated other comprehensive income.
The following table provides a reconciliation of the changes in the plans’ benefit obligations, assets and funded status at January 2, 2010 and January 3, 2009:
| (In thousands) | January 2, 2010 | January 3, 2009 | ||||||
| Pension Benefits |
||||||||
| Change in benefit obligation: |
||||||||
| Benefit obligation at beginning of year |
$ | 3,160 | $ | 3,697 | ||||
| Service cost |
293 | 362 | ||||||
| Interest cost |
254 | 189 | ||||||
| Actuarial (gain) loss |
1,135 | (300 | ) | |||||
| Benefits paid |
(162 | ) | (119 | ) | ||||
| Curtailment |
(167 | ) | — | |||||
| Settlements |
(247 | ) | — | |||||
| Translation |
21 | (669 | ) | |||||
| Benefit obligation at end of year |
4,287 | 3,160 | ||||||
| Change in plan assets: |
||||||||
| Fair value of plan assets at beginning of year |
2,185 | 3,160 | ||||||
| Employer contributions |
1,379 | 333 | ||||||
| Benefits paid |
(162 | ) | (119 | ) | ||||
| Actual return (loss) on assets |
445 | (573 | ) | |||||
| Settlements |
(350 | ) | — | |||||
| Translation |
— | (616 | ) | |||||
| Fair value of assets at end of year |
3,497 | 2,185 | ||||||
| Funded status |
$ | (790 | ) | $ | (975 | ) | ||
| Other Postretirement Benefits |
||||||||
| Change in benefit obligation: |
||||||||
| Benefit obligation at beginning of year |
$ | 50,974 | $ | 49,095 | ||||
| Acquisition |
— | — | ||||||
| Service cost |
87 | 134 | ||||||
| Interest cost |
3,107 | 3,056 | ||||||
| Actuarial (gain) loss |
7,403 | 6,404 | ||||||
| Benefits paid |
(7,311 | ) | (7,715 | ) | ||||
| Divestiture |
— | — | ||||||
| Curtailment |
(6,653 | ) | — | |||||
| Benefit obligation at end of year |
47,607 | 50,974 | ||||||
| Change in plan assets: |
||||||||
| Fair value of plan assets at beginning of year |
— | — | ||||||
| Employer contributions |
7,311 | 7,715 | ||||||
| Benefits paid |
(7,311 | ) | (7,715 | ) | ||||
| Fair value of assets at end of year |
— | — | ||||||
| Funded status |
$ | (47,607 | ) | $ | (50,974 | ) | ||
- 47 -
Table of Contents
Included in accumulated other comprehensive loss are the following pre-tax amounts that have not yet been recognized in net periodic benefit cost:
Pension Benefits
| (In thousands) | January 2, 2010 | January 3, 2009 | ||||
| Unrecognized net actuarial loss |
$ | 352 | $ | 394 | ||
| Prior service cost |
944 | 98 | ||||
| Total |
$ | 1,296 | $ | 492 | ||
Other Postretirement Benefits
| (In thousands) | January 2, 2010 | January 3, 2009 | ||||
| Unrecognized net actuarial loss |
$ | 9,362 | $ | 8,978 | ||
Net Periodic Benefit Cost
Components of net periodic benefit cost for pension and postretirement benefit plans recognized in the Consolidated Statements of Income for the year ended January 2, 2010, January 3, 2009, and December 29, 2007 are as follows:
Pension Benefits
| Year Ended | ||||||||||||
| (In thousands) | January 2, 2010 | January 3, 2009 | December 29, 2007 | |||||||||
| Service cost |
$ | 364 | $ | 424 | $ | 423 | ||||||
| Interest cost |
254 | 188 | 156 | |||||||||
| Expected return on assets |
(181 | ) | (187 | ) | (182 | ) | ||||||
| Amortization of prior service costs |
10 | 9 | — | |||||||||
| Amortization of net loss |
32 | 28 | — | |||||||||
| Settlements |
62 | — | — | |||||||||
| Net periodic benefit cost |
$ | 541 | $ | 462 | $ | 397 | ||||||
- 48 -
Table of Contents
Other Postretirement Benefits
| Year Ended | |||||||||
| (In thousands) | January 2, 2010 | January 3, 2009 | December 29, 2007 | ||||||
| Service cost |
$ | 87 | $ | 134 | $ | 152 | |||
| Interest cost |
3,107 | 3,056 | 2,674 | ||||||
| Expected return on assets |
— | — | — | ||||||
| Amortization of prior service costs |
— | — | — | ||||||
| Amortization of net loss |
367 | — | — | ||||||
| Net periodic benefit cost |
$ | 3,561 | $ | 3,190 | $ | 2,826 | |||
The Company expects approximately $350,000, pre-tax, in accumulated other comprehensive income to be recognized as net periodic benefit cost related to amortization of net loss during 2010.
The Company has established a set of investment objectives related to the assets of the pension plans. The primary strategy is to maximize the long-term return on plan assets at an acceptable level of investment risk. For the international pension plan, the long-term investment target allocations are: 60% for equity securities, 35% for debt securities, and 5% for other including cash and cash equivalents. For the domestic pension plan, the investment allocation is 100% cash and cash equivalents. A majority (in excess of 80%) of the international pension assets are invested in the Montrusco Bolton Balanced Fund as of year-end 2009 and 2008. The weighted average asset allocation for the pension plan, by asset category, is as follows:
| Asset Category | ||||||
| Percentage of Plan Assets at Year-End |
||||||
| 2009 | 2008 | |||||
| Equity securities |
55 | % | 63 | % | ||
| Debt securities |
29 | % | 32 | % | ||
| Cash |
16 | % | 5 | % | ||
| Total |
100 | % | 100 | % | ||
Assumptions
Weighted average assumptions are as follows:
| Year Ended | ||||||
| January 2, 2010 | January 3, 2009 | |||||
| Pension Benefits |
||||||
| Discount rate to determine net periodic benefit cost |
6.25% - 7.50 | % | 5.75% - 6.25 | % | ||
| Discount rate to determine benefit obligations |
5.00% - 6.15 | % | 6.25% - 7.50 | % | ||
| Long-term rate of return on plan assets |
6.75 | % | 7.00 | % | ||
| Other Postretirement Benefits |
||||||
| Discount rate to determine net periodic benefit cost |
6.25 | % | 6.25 | % | ||
| Discount rate to determine benefit obligations |
5.70 | % | 6.25 | % | ||
| Medical trend – current year |
9.00 | % | 9.00 | % | ||
| Medical trend – ultimate year 2028 |
5.00 | % | 5.50 | % | ||
The Company establishes the expected long-term rate of return on plan assets by considering historical rates of return along with anticipated rates of return on the current investment mix.
A one-percentage point change in assumed healthcare cost trend rate would impact the postretirement benefit obligation and total service and interest cost by approximately $300,000 and $4.5 million, respectively.
- 49 -
Table of Contents
The expected medical trend rate for 2010 is 9.00%.
Contributions
The Company’s policy is to fund at least the minimum contribution required to meet applicable employee benefit tax laws. In the Company’s sole discretion, additional amounts may be funded from time to time. The Company currently expects to contribute $550,000 to the defined benefit pension plans in 2010 and expects to make contributions of approximately $4.3 million to the postretirement plan in 2010.
Estimated Future Benefit Payments
The following is a summary of expected future benefit payments:
| (In thousands) | Pension Benefits |
Other Postretirement Benefits | ||||
| 2010 |
$ | 131 | $ | 4,284 | ||
| 2011 |
139 | 4,241 | ||||
| 2012 |
149 | 3,849 | ||||
| 2013 |
162 | 3,736 | ||||
| 2014 |
173 | 4,002 | ||||
| 2015-2019 |
1,053 | 18,789 | ||||
NOTE K – Stock Plans
The purpose of granting stock options and non-vested stock units is to encourage ownership in the Company. This provides an incentive for the participants to contribute to the success of the Company and aligns the interests of the participants with the interests of the shareholders of the Company. Historically, the Company has used newly-issued shares to fulfill stock option exercises. Once options are granted, the Company does not re-price any outstanding options. The 2006 Plan is the only Plan under which awards can be granted. When the 2006 Plan was adopted, the Company’s other stock plans were effectively cancelled except with respect to then outstanding grants and no further awards have since been or will be granted from those plans. In May 2009, shareholders approved an amendment to the 2006 Plan increasing the shares authorized by 1,500,000.
A summary of the Company’s stock plans and summary details about each Plan as of January 2, 2010, follows.
| Plan |
Shares Authorized |
Current Plan Status |
Typical Grant Life | |||
| 1990 | 501,600 | Cancelled in 2006; except for options outstanding | 6 years | |||
| 1994 | 4,000,000 | Cancelled in 2006; except for options outstanding | 10 years | |||
| 1996 | 200,000 | Expired in 2001; except for options outstanding | 10 years | |||
| 2001 | 200,000 | Cancelled in 2006; except for options outstanding | 10 years | |||
| 2006 | 4,500,000 | Active | 10 years |
1990 Plan: Only non-qualified options were granted from this Plan. Options vest and become 50% exercisable at the end of one year and 100% exercisable at the end of two years. All outstanding stock options granted under this Plan are currently exercisable.
- 50 -
Table of Contents
1994 Plans: Incentive stock options vest and become fully exercisable with continued employment of six months for officers and three years for non-officers. Restrictions on non-qualified stock options lapsed after a period of five years or earlier under certain circumstances. All outstanding stock options granted under these plans are currently exercisable.
1996 and 2001 Plans: Each non-employee director was granted an annual grant consisting of non-qualified stock options to purchase: (1) 3,240 shares at a price equal to the market value at date of grant, and (2) 2,160 shares at a price equal to 50% of the market value at date of grant. These options immediately vested and became exercisable on the date of grant.
2006 Plan: Awards granted under the 2006 Plan have included: incentive stock options, non-qualified stock options, and non-vested stock units. Non-vested stock units were awarded with no exercise price. Other awards permitted under this Plan include stock appreciation rights, restricted stock, and performance awards; however, no such awards have been granted. Option re-pricing is not permitted.
A summary of option activity under the Plans during 2009 is presented below:
| Shares | Weighted- Average Exercise Price |
Weighted- Average Remaining Contractual Term |
Aggregate Intrinsic Value | ||||||||
| (In thousands) | |||||||||||
| Outstanding at January 3, 2009 |
2,702,845 | $ | 31.11 | ||||||||
| Granted |
598,958 | 16.65 | |||||||||
| Exercised |
(95,805 | ) | 18.99 | ||||||||
| Expired |
(105,501 | ) | 23.17 | ||||||||
| Forfeited |
(54,060 | ) | 35.98 | ||||||||
| Outstanding at January 2, 2010 |
3,046,437 | 28.80 | 6.6 years | $ | 11,147 | ||||||
| Vested or expected to vest at January 2, 2010 |
2,998,430 | 28.83 | 6.6 years | $ | 10,903 | ||||||
| Exercisable at January 2, 2010 |
1,715,773 | 28.12 | 5.3 years | $ | 4,289 | ||||||
The weighted-average grant-date fair value of options granted was $4.62 in 2009, $6.60 in 2008, and $13.62 in 2007. The total intrinsic value of options exercised was $865,000 in 2009, $2.2 million in 2008, and $4.8 million in 2007.
As of January 2, 2010, there was $4.1 million of total unrecognized compensation cost related to non-vested options granted under the Plans expected to be recognized over a weighted-average period of 1.3 years.
A summary of non-vested stock unit activity under the Plans during 2009 is presented below:
| Non-vested Stock Units |
Shares | Weighted- Average Grant-Date Fair Value Per Unit | ||||
| Non-vested at January 3, 2009 |
141,368 | $ | 31.62 | |||
| Granted |
74,072 | 13.38 | ||||
| Vested |
(57,514 | ) | 36.28 | |||
| Forfeited |
(10,550 | ) | 23.57 | |||
| Non-vested at January 2, 2010 |
147,376 | 19.86 | ||||
The total fair value of stock units vested during the 2009, 2008, and 2007 was $854,000, $1.2 million, and $396,000, respectively.
- 51 -
Table of Contents
As of January 2, 2010, there was $698,000 of total unrecognized compensation cost expected to be recognized over a weighted-average period of 1.0 year related to non-vested stock units granted under the Plans.
The fair value of options is estimated using a Black-Scholes option pricing formula and is amortized to expense over the options’ applicable vesting periods. Listed in the table below are the weighted-average assumptions for those options granted in the period indicated.
| Year Ended | |||||||||
| January 2, 2010 |
January 3, 2009 |
December 29, 2007 |
|||||||
| Volatility |
37.3 | % | 28.1 | % | 25.2 | % | |||
| Risk-free interest rates |
2.4 | % | 3.0 | % | 5.1 | % | |||
| Dividend yields |
4.1 | % | 2.5 | % | 1.5 | % | |||
| Expected option life |
6.3 years | 6.0 years | 6.4 years | ||||||
NOTE L – Earnings Per Share
The table below details earnings per common share for the years indicated:
| (In thousands, except per share data) | 2009 | 2008 | 2007 | ||||||
| Numerator: |
|||||||||
| Net income |
$ | 59,796 | $ | 99,423 | $ | 94,102 | |||
| Denominator Reconciliation: |
|||||||||
| Weighted-average shares – basic |
46,519 | 46,158 | 44,674 | ||||||
| Effect of dilutive securities – Stock options and non-vested stock units |
297 | 181 | 568 | ||||||
| Weighted-average shares – diluted |
46,816 | 46,339 | 45,242 | ||||||
| Earnings per common share – basic |
$ | 1.29 | $ | 2.15 | $ | 2.11 | |||
| Earnings per common share – diluted |
$ | 1.28 | $ | 2.15 | $ | 2.08 | |||
The total number of anti-dilutive securities excluded from the above calculations was 2,083,763 at January 2, 2010, 1,494,369 at January 3, 2009, and 439,816 at December 29, 2007.
NOTE M – Foreign Operations
The Company’s foreign operations include both export sales and the results of its foreign subsidiaries in Canada, Europe, Australia, Far East, Mexico, and China. Consolidated sales, income before income taxes, and identifiable assets consist of the following:
| (In thousands) | 2009 | 2008 | 2007 | ||||||
| Net Sales: |
|||||||||
| United States Companies |
|||||||||
| Domestic customers |
$ | 1,253,342 | $ | 1,584,605 | $ | 1,509,586 | |||
| Export customers |
90,182 | 151,063 | 122,642 | ||||||
| 1,343,524 | 1,735,668 | 1,632,228 | |||||||
| Foreign Affiliates |
180,548 | 219,011 | 192,671 | ||||||
| $ | 1,524,072 | $ | 1,954,679 | $ | 1,824,899 | ||||
| Income Before Income Taxes: |
|||||||||
| United States Companies |
$ | 85,661 | $ | 122,349 | $ | 124,982 | |||
| Foreign Affiliates |
15,453 | 29,920 | 22,181 | ||||||
| $ | 101,114 | $ | 152,269 | $ | 147,163 | ||||
| Long-Lived Assets: |
|||||||||
| United States Companies |
$ | 1,990,807 | $ | 2,052,269 | $ | 2,074,653 | |||
| Foreign Affiliates |
41,961 | 34,923 | 12,937 | ||||||
| $ | 2,032,768 | $ | 2,087,192 | $ | 2,087,590 | ||||
- 52 -
Table of Contents
Foreign currency gains and losses included in other income (loss) on the consolidated statements of income amounted to ($3.8) million in 2009, $3.8 million in 2008, and ($1.1) million in 2007.
NOTE N – Sale of Property
In September 2008, the Company sold real property with a book value of $22.3 million. Proceeds from the sale totaled $30.7 million, of which $6.1 million was invested in the entity which acquired the real property. Due to continuing involvement in the property, no gain was recognized, the value of the real property remained on the consolidated balance sheets at January 3, 2009 and continued to be depreciated, and the proceeds were recorded as a liability in other accrued expenses on the consolidated balance sheets at January 3, 2009. During the third quarter of 2009, the Company sold its equity interest in the acquirer for $1.7 million, eliminating the Company’s continuing involvement in the property. As a result, the property, related liability and equity investment were removed from the balance sheet and a net gain of $3.7 million was recognized in income from continuing operations in 2009.
NOTE O – Fair Value Measurements
Fair value is generally determined based on the exchange price that would be received for an asset or paid to transfer a liability (an exit price) in the principal or most advantageous market for the asset or liability in an orderly transaction between market participants on the measurement date. The fair value hierarchy categorizes the inputs used in valuation techniques into three levels as follows:
Level 1 – Quoted prices in active markets for identical assets or liabilities.
Level 2 – Observable inputs other than Level 1 prices such as quoted prices for similar assets or liabilities; quoted prices in markets that are not active; or other inputs that are observable or can be corroborated by observable market data for substantially the full term of the assets or liabilities.
Level 3 – Unobservable inputs that are supported by little or no market activity, but which are significant to the fair value of the assets or liabilities as determined by market participants.
Assets (liabilities) measured at fair value on a recurring basis are summarized below:
| Fair Value Measurements as of January 2, 2010 |
||||||||||||||
| (In thousands) | Level 1 | Level 2 | Level 3 | Total | ||||||||||
| Interest rate swap |
$ | — | $ | (16,608 | ) | $ | — | $ | (16,608 | ) | ||||
| Interest rate collar |
— | (5,361 | ) | — | (5,361 | ) | ||||||||
| Copper swaps |
17,386 | — | — | 17,386 | ||||||||||
| Total |
$ | 17,386 | $ | (21,969 | ) | $ | — | $ | (4,583 | ) | ||||
- 53 -
Table of Contents
The Company’s methods and assumptions used to estimate the fair value of debt include quoted market prices (level 1) for fixed rate debt and other quoted prices (level 2) for variable rate debt. The carrying amounts and estimated fair values of the Company’s long-term debt at January 2, 2010 are summarized below:
| (In thousands) | Carrying Value | Estimated Fair Value | ||||
| Senior notes |
$ | 550,000 | $ | 567,188 | ||
| Term loan |
$ | 611,789 | $ | 612,168 | ||
The carrying amounts of cash and cash equivalents, receivables, and trade payables at January 2, 2010, approximate their fair value due to the short term maturity of these instruments.
NOTE P – Restructuring Charges
In April 2009, the Company announced a plan to consolidate manufacturing operations of its Ft. Mill, SC and Columbus, IN plants into other existing plants in the United States. Both restructurings are part of manufacturing integration resulting from the Company’s 2007 acquisition of Reliance Electric. The Company incurred one-time restructuring charges of approximately $5.0 million during 2009. These charges are included in cost of goods sold in the consolidated statements of income.
A summary of the restructuring costs is below:
| (In thousands) | Estimated Total Cost |
YTD January 2, 2010 |
Costs Remaining at January 2, 2010 | ||||||
| One-time termination costs |
$ | 2,823 | $ | 2,823 | $ | — | |||
| Employee relocation costs |
104 | 104 | — | ||||||
| Transportation costs |
2,100 | 2,100 | — | ||||||
| Total |
$ | 5,027 | $ | 5,027 | $ | — | |||
Included in other current assets are long-lived assets amounting to $2.0 million that have been classified as held for sale. The assets are recorded at net book value as it is lower than fair value less cost to sale.
NOTE Q – Recently Issued Accounting Pronouncements
In September 2006, the Financial Accounting Standards Board (FASB) issued guidance that establishes a framework for measuring fair value in U.S. generally accepted accounting principles and expands disclosures about fair value measurements. In February 2008, the FASB issued guidance that delayed the effective date for nonfinancial assets and liabilities, except for those recognized or disclosed at fair value on a recurring basis. The Company adopted the guidance at the beginning of 2009 and the adoption did not have a material impact on the consolidated financial statements.
In December 2007, the FASB issued guidance that establishes principles and requirements on how an acquirer recognizes and measures in its financial statements identifiable assets acquired, liabilities assumed, non-controlling interest in the acquiree, goodwill or gain from a bargain purchase and accounting for transaction costs. Additionally, the guidance determines what information must be disclosed to enable users of the financial statements to evaluate the nature and financial effects of the business combination. The Company adopted the guidance at the beginning of 2009.
- 54 -
Table of Contents
In March 2008, the FASB issued guidance that expands disclosure requirements about how derivative and hedging activities affect an entity’s financial position, financial performance, and cash flows. It became effective for fiscal years beginning after November 15, 2008; therefore, the Company adopted the guidance during the first quarter of fiscal 2009. See Note C, Financial Derivatives, of the Notes to Consolidated Financial Statements, included in Item 8, Financial Statements and Supplementary Data, of this Annual Report on Form 10-K for required disclosures.
In May 2009, the FASB issued guidance which establishes general standards of accounting for and disclosure of events that occur after the balance sheet date but before financial statements are issued. It became effective on a prospective basis for interim or annual financial periods ending after June 15, 2009 and the adoption did not have a material impact on the consolidated financial statements and disclosures. See Note A, Subsequent Events, of the Notes to Consolidated Financial Statements, included in Item 8, Financial Statements and Supplementary Data, of this Annual Report on Form 10-K for required disclosures.
NOTE R – Summary of Quarterly Results of Operations (Unaudited)
| Quarter | ||||||||||||||
| (In thousands, except per share data) | First | Second | Third | Fourth | ||||||||||
| 2009: | Net sales | $ | 402,479 | $ | 384,678 | $ | 380,448 | $ | 356,413 | |||||
| Gross profit | 116,426 | 109,222 | 114,969 | 102,359 | ||||||||||
| Net income | 36,418 | 7,795 | 12,592 | 2,988 | ||||||||||
| Net earnings per common share – basic | 0.79 | 0.17 | 0.27 | 0.06 | ||||||||||
| Net earnings per common share – diluted | 0.79 | 0.17 | 0.27 | 0.06 | ||||||||||
| 2008: | Net sales | $ | 470,526 | $ | 503,973 | $ | 506,154 | $ | 474,022 | |||||
| Gross profit | 143,723 | 152,846 | 146,754 | 134,973 | ||||||||||
| Net income | 25,639 | 29,372 | 25,810 | 18,601 | ||||||||||
| Net earnings per common share – basic | 0.56 | 0.64 | 0.56 | 0.40 | ||||||||||
| Net earnings per common share – diluted | 0.56 | 0.63 | 0.55 | 0.40 | ||||||||||
| • | 2008 includes results of operations of Maska beginning August 30, 2008. |
| • | All quarters presented contain 13 weeks with the exception of fourth quarter 2008, which has 14 weeks. |
| • | First quarter 2009 includes $21.6 million, net of tax, related to the gain on debt modification. |
| Item 9. | Changes in and Disagreements With Accountants on Accounting and Financial Disclosure |
Not Applicable.
| Item 9A. | Controls and Procedures |
Disclosure Controls and Procedures
An evaluation was performed by the Company’s management, including the Company’s CEO and CFO, of the effectiveness of the design and operation of the Company’s disclosure controls and procedures (as such term is defined in Rules 13a-15(e) and 15d-15(e) under the Securities Exchange Act of 1934, as amended (the “Exchange Act”)) as of January 2, 2010. Based on such evaluation, the Company’s CEO and CFO have concluded that the Company’s disclosure controls and procedures were effective as of January 2, 2010.
- 55 -
Table of Contents
Internal Control Over Financial Reporting
Management’s assessment, and the attestation report of the Company’s independent registered public accounting firm, of the effectiveness of the Company’s internal control over financial reporting are reported below.
Changes in Internal Control Over Financial Reporting
As a result of the acquisition of Reliance on January 31, 2007 and Maska on August 29, 2008, certain information included in the Company’s consolidated financial statements for the year ended January 2, 2010, was obtained from accounting and information systems utilized by Reliance and Maska that have not yet been integrated in the Company’s systems. The Company is currently in the process of integrating those systems. During the fourth quarter of 2009, some of Reliance’s accounting and financial reporting systems were integrated into the Company’s systems. As a result, certain processes were changed. None of these changes materially affect the Company’s internal controls over financial reporting. There have been no other changes in the Company’s internal controls over financial reporting identified in connection with the evaluation or in other factors that occurred during the fourth quarter of 2009 that has materially affected, or is reasonably likely to materially affect, these controls.
| Item 9B. | Other Information |
On March 2, 2010, the Board of Directors (“Board”) approved the Baldor Electric Company Bonus Plan for Officers and Key Managers (the “Plan”). Eligible Plan participants will be determined annually by the Board. Bonus amounts are earned by the participants based upon achieving target and stretch goals for two independent components – net sales and net earnings. Fifty percent (50%) of the amount earned is based on achieving pre-set net sales goals and fifty percent (50%) of the amount earned is based on achieving pre-set net earnings goals. The specific goals of the Plan will be determined by the Board annually. For net sales or net earnings below the target goal, no bonuses will be awarded. For net sales or net earnings at or above the target, bonuses will be earned pursuant to the respective component on a pro-rata basis, except that the Board has the discretion to cap the bonus amount earned under the net earnings component.
- 56 -
Table of Contents
Report of Management on Internal Control over Financial Reporting
Management is responsible for establishing and maintaining adequate internal control over financial reporting, as such term is defined in Exchange Act Rule 13a-15(f) and 15d-15(f). We maintain a system of internal controls that provide reasonable assurance that transactions are executed in accordance with management’s authorization and recorded properly to permit the preparation of consolidated financial statements in accordance with accounting principles generally accepted in the United States and that assets are safeguarded from unauthorized use or disposition.
We conducted an evaluation of the effectiveness of our internal control over financial reporting based on the framework in Internal Control – Integrated Framework issued by the Committee of Sponsoring Organizations of the Treadway Commission. This assessment included review of the documentation of controls, assessment of the design effectiveness of the controls, testing of the operating effectiveness of controls, and a conclusion on this assessment. Although there are inherent limitations in the effectiveness of any system of internal controls over financial reporting, based on our assessment, we have concluded that our internal control over financial reporting was effective as of January 2, 2010.
The Company’s independent registered public accounting firm, Ernst & Young LLP, has audited the financial statements included in this Form 10-K and has issued an attestation report on the Company’s internal controls over financial reporting.
| /s/ John A. McFarland |
| JOHN A. MCFARLAND |
| Chairman and Chief Executive Officer |
| /s/ George E. Moschner |
| GEORGE E MOSCHNER |
| Chief Financial Officer and Secretary |
- 57 -
Table of Contents
REPORT OF INDEPENDENT REGISTERED PUBLIC ACCOUNTING FIRM
The Board of Directors and Shareholders of Baldor Electric Company
We have audited Baldor Electric Company’s internal control over financial reporting as of January 2, 2010, based on criteria established in Internal Control – Integrated Framework issued by the Committee of Sponsoring Organizations of the Treadway Commission (the COSO criteria). Baldor Electric Company’s management is responsible for maintaining effective internal control over financial reporting, and for its assessment of the effectiveness of internal control over financial reporting included in the accompanying Report of Management on Internal Control Over Financial Reporting. Our responsibility is to express an opinion on the company’s internal control over financial reporting based on our audit.
We conducted our audit in accordance with the standards of the Public Company Accounting Oversight Board (United States). Those standards require that we plan and perform the audit to obtain reasonable assurance about whether effective internal control over financial reporting was maintained in all material respects. Our audit included obtaining an understanding of internal control over financial reporting, assessing the risk that a material weakness exists, testing and evaluating the design and operating effectiveness of internal control based on the assessed risk, and performing such other procedures as we considered necessary in the circumstances. We believe that our audit provides a reasonable basis for our opinion.
A company’s internal control over financial reporting is a process designed to provide reasonable assurance regarding the reliability of financial reporting and the preparation of financial statements for external purposes in accordance with generally accepted accounting principles. A company’s internal control over financial reporting includes those policies and procedures that (1) pertain to the maintenance of records that, in reasonable detail, accurately and fairly reflect the transactions and dispositions of the assets of the company; (2) provide reasonable assurance that transactions are recorded as necessary to permit preparation of financial statements in accordance with generally accepted accounting principles, and that receipts and expenditures of the company are being made only in accordance with authorizations of management and directors of the company; and (3) provide reasonable assurance regarding prevention or timely detection of unauthorized acquisition, use or disposition of the company’s assets that could have a material effect on the financial statements.
Because of its inherent limitations, internal control over financial reporting may not prevent or detect misstatements. Also, projections of any evaluation of effectiveness to future periods are subject to the risk that controls may become inadequate because of changes in conditions, or that the degree of compliance with the policies or procedures may deteriorate.
In our opinion, Baldor Electric Company maintained, in all material respects, effective internal control over financial reporting as of January 2, 2010, based on the COSO criteria.
We also have audited, in accordance with the standards of the Public Company Accounting Oversight Board (United States), the consolidated balance sheets of Baldor Electric Company as of January 2, 2010 and January 3, 2009, and the related consolidated statements of income, shareholders’ equity, and cash flows for each of the three years in the period ended January 2, 2010, and our report dated March 3, 2010 expressed an unqualified opinion thereon.
/s/ Ernst & Young LLP
Tulsa, Oklahoma
March 3, 2010
- 58 -
Table of Contents
| Item 10. | Directors, Executive Officers and Corporate Governance |
Information contained in the 2010 Proxy Statement under the captions “Proposal 1 – Election of Directors”, “Code of Ethics”, “Statement of Director Independence”, “Statement of Audit Committee Member Independence and Financial Expertise”, and “Section 16(a) Beneficial Ownership Reporting Compliance” is incorporated herein by reference. The current executive officers of Baldor, each of whom is elected for a term of one year or until his successor is elected and qualified, are:
| Name |
Age |
Position |
Served as | |||
| John A. McFarland | 58 | Chairman and Chief Executive Officer | 1990 | |||
| Ronald E. Tucker | 52 | President and Chief Operating Officer | 1997 | |||
| George E. Moschner | 51 | Chief Financial Officer and Secretary | 2007 | |||
| Randy L. Colip | 51 | Executive Vice President – Motor Sales | 1997 | |||
| L. Edward Ralston | 40 | Executive Vice President – Business Integration | 2005 | |||
| Gene J. Hagedorn | 63 | Executive Vice President – Materials | 1994 | |||
| Ronald W. Thurman | 55 | Executive Vice President – Engineering | 2005 | |||
| Randal G. Waltman | 60 | Executive Vice President – Operations | 1997 | |||
| Randall P. Breaux | 47 | Vice President – Marketing | 2001 | |||
| Roger V. Bullock | 60 | Vice President – Drives Sales | 2002 | |||
| Bryant G. Dooly, Jr | 48 | Treasurer and Controller | 2008 | |||
| Jason W. Green | 40 | Vice President – Human Resources | 2007 | |||
| Jeffrey R. Hubert | 56 | Vice President – Generators | 2010 | |||
| Larry L. Johnston, Jr. | 45 | Vice President – Audit Services | 2008 | |||
| Tracy L. Long | 44 | Vice President – Investor Relations | 2003 | |||
| Thomas A. Mascari | 58 | Vice President – Drives | 2007 | |||
| Mark L. Shackelford | 50 | Vice President – Information Services | 2007 | |||
There are no direct family relationships among the directors or executive officers; however, Mr. Moschner is an uncle to the wife of Mr. Ralston. Except for the following, each of the executive officers has served as an officer or in a management capacity with Baldor for the last five years.
George E. Moschner joined Baldor as the Company’s Chief Financial Officer at the end of April 2007. Prior to joining Baldor, Mr. Moschner was an accountant with the firm of BKD, LLP for over 25 years, the last 10 years of which he was a partner.
- 59 -
Table of Contents
Jason W. Green joined Baldor in January 2007 as the Company’s Director of Human Resources. Effective February 1, 2007, he became the Company’s Vice President – Human Resources. Prior to joining Baldor, Mr. Green spent several years with Hallmark Cards, Inc. serving in various Human Resources assignments across the company.
Larry L. Johnston, Jr. joined Baldor as an Integration Specialist in mid-May 2007. Prior to joining Baldor, Mr. Johnston was an accountant with the firm of Ernst & Young LLP for seven years, the last five years of which he was a Senior Manager.
Thomas A. Mascari joined Baldor as Vice President – Business Integration effective with Baldor’s acquisition of Reliance on February 1, 2007. Prior to the acquisition, Mr. Mascari served in various executive and managerial positions with Rockwell Automation Power Systems and most recently as Vice President & General Manager of Reliance Electric Company.
Jeffrey R. Hubert joined Baldor in November 2008 as General Manager of Generators. Effective January 1, 2010, he became the Company’s Vice President – Generators. Prior to joining Baldor, Mr. Hubert was Executive Vice President of Sales and Marketing with KMC Stamping, and he has more than 20 years of experience in industrial sales and manufacturing.
| Item 11. | Executive Compensation |
Information contained in the 2010 Proxy Statement under the caption “Compensation Committee Interlocks and Insider Participation” and “Executive Compensation” are incorporated herein by reference. Information contained in the 2010 Proxy Statement under the caption “Compensation Committee Report on Executive Compensation” is furnished and not deemed filed with the SEC. Information contained in the 2010 Proxy Statement under the caption “Proposal 1 – Election of Directors” paragraph headed “Director Compensation” is also incorporated herein by reference.
| Item 12. | Security Ownership of Certain Beneficial Owners and Management and Related Stockholder Matters |
The security ownership by officers, directors, and beneficial owners of more than five percent of Baldor’s Common Stock included under the caption “Security Ownership of Certain Beneficial Owners and Management” of the 2010 Proxy Statement is incorporate herein by reference.
- 60 -
Table of Contents
The following table contains information regarding the number of shares of common stock that may be issued pursuant to our equity compensation plans as of January 2, 2010.
Equity Compensation Plan Information
| Plan Category |
(a) Number of securities to be issued upon exercise of outstanding options, warrants, and rights |
(b) Weighted-average exercise price of outstanding options, warrants, and rights |
(c) Number of securities remaining available for future issuance under equity compensation plans (excluding securities reflected in column (a)) | ||||
| Equity compensation plans approved by security holders |
3,164,863 | $ | 27.47 | 2,194,450 | |||
| Equity compensation plans not approved by security holders |
28,950 | 28.00 | — | ||||
| Total |
3,193,813 | 27.47 | 2,194,450 | ||||
During 1990, Baldor’s Board of Directors approved the establishment of the 1990 Stock Option Plan for District Managers. This is an un-registered plan and was not approved by our shareholders. Only non-qualified options were granted from this Plan. Options vested and became 50% exercisable at the end of one year and 100% exercisable at the end of two years. The exercise price paid by the District Managers equaled the fair market value on the date of the grant. Proceeds from these option exercises are used for general corporate purposes. At year-end 2009, the total amount of shares granted under the DM Plan is 1.0% of the outstanding shares of Baldor common stock. None of the transactions were registered under the Securities Act of 1933, as amended (the “Act”), in reliance upon the exemption from registration afforded by Section 4(2) of the Act. We deem this exemption to be appropriate given that there are a limited number of participants in the DM Plan and all parties are knowledgeable about Baldor. This plan has expired except for approximately 28,950 options outstanding.
| Item 13. | Certain Relationships and Related Transactions, and Director Independence |
Information contained under the caption “Compensation Committee Interlocks and Insider Participation; Related Party Transactions” and “Statement of Director Independence” of the 2010 Proxy Statement is incorporated herein by reference.
| Item 14. | Principal Accountant Fees and Services |
Information contained in the 2010 Proxy Statement under the caption “Independent Registered Public Accounting Firm” is incorporated herein by reference.
- 61 -
Table of Contents
| Item 15. | Exhibits, Financial Statement Schedules |
| (a) | (1) | The following consolidated financial statements of Baldor Electric Company and its Affiliates, are included in Item 8 of this Report: | ||
|
• Consolidated Balance Sheets
• January 2, 2010 and January 3, 2009
• Consolidated Statements of Income
• for each of the three years in the period ended January 2, 2010
• Consolidated Statements of Cash Flows
• for each of the three years in the period ended January 2, 2010
• Consolidated Statements of Shareholders’ Equity
• for each of the three years in the period ended January 2, 2010
• Notes to Consolidated Financial Statements | ||||
| (2) | All financial statement schedules are omitted as inapplicable or because the required information is contained in the financial statements or included in the notes thereto. | |||
| (3) | See Exhibit Index of this Report. | |||
| (b) | Exhibits | |||
| See Exhibit Index of this Report. | ||||
| (c) | Financial Statement Schedules | |||
| All financial statement schedules are omitted as inapplicable or because the required information is contained in the financial statements or included in the notes thereto. | ||||
- 62 -
Table of Contents
Pursuant to the requirements of the Securities Exchange Act of 1934, the registrant has duly caused this report to be signed on its behalf by the undersigned thereunto duly authorized.
| BALDOR ELECTRIC COMPANY | ||
| (Registrant) | ||
| By | /s/ John A. McFarland | |
| John A. McFarland | ||
| Chairman and Chief Executive Officer (Principal Executive Officer) | ||
Date: March 3, 2010
KNOW ALL MEN BY THESE PRESENTS, that each person whose signature appears below constitutes and appoints John A. McFarland and Ronald E. Tucker, and each of them, his true and lawful attorneys-in-fact and agents, with full power of substitution and resubstitution, for him and in his name, place and stead, in any and all capacities, to sign this Report and any and all amendments to this Report, and to file the same, with all exhibits thereto, and other documents in connection therewith, with the Securities and Exchange Commission, granting unto said attorneys-in-fact and agents full power and authority to do and perform each and every act and thing requisite and necessary to be done in and about the premises, as fully to all intents and purposes as they might or could do in person, hereby ratifying and confirming all that said attorneys-in-fact and agents, or any of them, or their substitutes, may lawfully do or cause to be done by virtue hereof.
- 63 -
Table of Contents
Pursuant to the requirements of the Securities Exchange Act of 1934, this report has been signed below by the following persons, on behalf of the registrant, and in the capacities and on the dates indicated.
SIGNATURE PAGE FOR FORM 10-K FOR YEAR ENDED JANUARY 2, 2010.
| Signature |
Title |
Date | ||
| /s/ John A. McFarland |
Chairman, Chief Executive Officer, and Director (Principal Executive Officer) | March 3, 2010 | ||
| John A. McFarland | ||||
| /s/ Ronald E. Tucker |
President and Chief Operating Officer, and Director | March 3, 2010 | ||
| Ronald E. Tucker | ||||
| /s/ George E. Moschner |
Chief Financial Officer and Secretary (Principal Financial Officer) (Principal Accounting Officer) | |||
| George E. Moschner | March 3, 2010 | |||
| /s/ Jefferson W. Asher, Jr. |
Director | March 3, 2010 | ||
| Jefferson W. Asher, Jr. | ||||
| /s/ Merlin J. Augustine, Jr. |
Director | March 3, 2010 | ||
| Merlin J. Augustine, Jr. | ||||
| /s/ Richard E. Jaudes |
Director | March 3, 2010 | ||
| Richard E. Jaudes | ||||
| /s/ Jean A. Mauldin |
Director | March 3, 2010 | ||
| Jean A. Mauldin | ||||
| /s/ Robert J. Messey |
Director | March 3, 2010 | ||
| Robert J. Messey | ||||
| /s/ Robert L. Proost |
Director | March 3, 2010 | ||
| Robert L. Proost | ||||
| /s/ R. L. Qualls |
Director | March 3, 2010 | ||
| R. L. Qualls | ||||
| /s/ Barry K. Rogstad |
Director | March 3, 2010 | ||
| Barry K. Rogstad | ||||
- 64 -
Table of Contents
BALDOR ELECTRIC COMPANY AND AFFILIATES
INDEX OF EXHIBITS
| Exhibit No. |
Description | |||
| 3(i) |
* | Articles of Incorporation (as restated and amended) of Baldor Electric Company, effective May 2, 1998, filed as Exhibit 3(i) to the Registrant’s Quarterly Report on Form 10-Q for the quarter ended July 4, 1998. | ||
| 3(ii) |
* | Bylaws of Baldor Electric Company, as originally adopted on May 2, 1980, and amended effective August 4, 2008, and filed as Exhibit 3(ii) to the Registrant’s Quarterly Report on Form 10-Q for the quarter ended September 27, 2008. | ||
| 4.1 |
* | Specimen of Common Stock representing Common Stock, par value $0.10 per share, filed as Exhibit 4.1 to the Registrant’s Current Report on Form 8-K, filed January 31, 2007. | ||
| 4(ii).1 |
* | Indenture between the Company and Wells Fargo Bank, National Association, dated January 31, 2007, previously filed as Exhibit 4.1 to the Registrant’s Current Report on Form 8-K, filed February 6, 2007. | ||
| 4(ii).2 |
* | First Supplemental Indenture between the Company, Baldor Sub 1, Inc., Baldor Sub 2, Inc., Baldor Sub 3, Inc. and Wells Fargo Bank, National Association, dated January 31, 2007, previously filed as Exhibit 4.2 to the Registrant’s Current Report on Form 8-K, filed February 6, 2007. | ||
| 4(ii).3 |
* | Second Supplemental Indenture between the Company, Reliance Electric Company, REC Holding, Inc., Reliance Electrical Technologies, LLC and Wells Fargo Bank, National Association, dated January 31, 2007, previously filed as Exhibit 4.3 to the Registrant’s Current Report on Form 8-K, filed February 6, 2007. | ||
| 4(ii).4 |
* | Form of 8 5/8% Senior Note due 2017 (incorporated by reference to Exhibit 4(ii).1). | ||
| 10(i).1 |
* | Credit Agreement between the Company and BNP Paribas, as Administrative Agent, dated January 31, 2007, previously filed as Exhibit 10.1 to the Registrant’s Current Report on Form 8-K, filed February 6, 2007. | ||
| 10(i).1.1 |
* | Amendment to Credit Agreement between the Company and BNP Paribas, as Administrative Agent, dated February 14, 2007, filed as Exhibit 10(i).2.1 to the Registrant’s Annual Report on Form 10-K, filed February 28, 2007. | ||
| 10(i).1.2 |
* | Second amendment between the Company and BNP Paribas, as Administrative Agent, dated March 31, 2009, previously filed as Exhibit 10 to the Registrant’s Current Report on Form 8-K, filed April 4, 2009. | ||
| 10(iii).1 |
* † | 1987 Incentive Stock Plan, originally filed as Appendix A to the Registrant’s Proxy Statement dated April 3, 1987, and refiled as Exhibit 10(iii)(A)(3) to the Registrant’ Annual Report on Form 10-K for the year ended December 31, 1994. | ||
- 65 -
Table of Contents
| 10(iii).2 |
* † | 1994 Incentive Stock Option Plan, as restated and amended at the Company’s Annual Meeting on May 2, 1998, filed as Exhibit 10(iii)(A).1 to the Registrant’s Quarterly Report on Form 10-Q for the quarter ended July 4, 1998. | ||
| 10(iii).3 |
* † | 1996 Stock Option Plan for Non-Employee Directors, as restated and amended at the Board of Directors Meeting on August 10, 1998, filed as Exhibit 10(iii)A.3 to the Registrant’s Quarterly Report on Form 10-Q for the quarter ended July 4, 1998. | ||
| 10(iii).4 |
* † | Stock Option Plan for Non-Employee Directors, as approved by the Company’s Board of Directors on February 5, 2001, filed as Exhibit 10 to the Registrant’s Quarterly Report on Form 10-Q for the quarter ended September 29, 2001. | ||
| 10(iii).5 |
† | Bonus Plan for Executive Officers, as approved by the Company’s Compensation Committee of the Board of Directors and the Company’s Board of Directors on March 2, 2010, and filed as Exhibit 10(iii).5 to the Registrant’s Annual Report on Form 10-K for the year ended January 2, 2010. | ||
| 10(iii).6 |
* † | 2006 Equity Incentive Plan, as amended effective May 2, 2009, filed as an appendix to the Registrant’s Proxy Statement dated April 3, 2009. | ||
| 10(iii).7 |
* † | Plan for Tax Deductible Executive Incentive Compensation, filed as Exhibit A to the Registrant’s Proxy Statement dated April 3, 2009. | ||
| 21 |
Subsidiaries of the Registrant. | |||
| 23(i) |
Consent of Independent Registered Public Accounting Firm. | |||
| 24 |
Powers of Attorney (set forth on signature page hereto). | |||
| 31.1 |
Certification by Chief Executive Officer | |||
| Pursuant to Section 302 of the Sarbanes-Oxley Act of 2002. | ||||
| 31.2 |
Certification by Chief Financial Officer | |||
| Pursuant to Section 302 of the Sarbanes-Oxley Act of 2002. | ||||
| 32 |
Certifications | |||
| Pursuant to Section 906 of the Sarbanes-Oxley Act of 2002. | ||||
| 99 |
Not applicable | |||
The Registrant agrees to furnish to the Securities and Exchange Commission, upon request, pursuant to Item 601(b)(4)(iii) of Regulation S-K, copies of instruments defining the rights of the holders of long-term debt of the Registrant and its consolidated affiliates.
| * | Previously filed. |
| † | Management contract or compensatory plan or arrangement. |
- 66 -