Attached files
Exhibit 13
Management’s Discussion and Analysis of Financial Condition and Results of Operations
OVERVIEW
Our business is focused on the development, manufacture and distribution of cardiovascular medical devices for the global cardiac rhythm management, cardiology, cardiac surgery and atrial fibrillation therapy areas and implantable neurostimulation medical devices for the management of chronic pain. We sell our products in more than 100 countries around the world. Our largest geographic markets are the United States, Europe, Japan and Asia Pacific. Our four operating segments are Cardiac Rhythm Management (CRM), Cardiovascular (CV), Atrial Fibrillation (AF), and Neuromodulation (NMD). Our principal products in each operating segment are as follows: CRM – tachycardia implantable cardioverter defibrillator systems (ICDs) and bradycardia pacemaker systems (pacemakers); CV – vascular closure devices, heart valve replacement and repair products and pressure measurement guidewires; AF – electrophysiology introducers and catheters, advanced cardiac mapping, navigation and recording systems and ablation systems; and NMD – neurostimulation devices. References to “St. Jude Medical,” “St. Jude,” “the Company,” “we,” “us” and “our” are to St. Jude Medical, Inc. and its subsidiaries.
Our industry has undergone significant consolidation in the last decade and is highly competitive. Our strategy requires significant investment in research and development in order to introduce new products. We are focused on improving our operating margins through a variety of techniques, including the production of high quality products, the development of leading edge technology, the enhancement of our existing products and continuous improvement of our manufacturing processes. We expect cost containment pressure on healthcare systems as well as competitive pressures in the industry will continue to place downward pressure on prices for our products.
We participate in several different medical device markets, each of which has its own expected growth rate. A significant portion of our net sales relate to CRM devices – ICDs and pacemakers. Management remains focused on increasing our worldwide CRM market share, as we are one of three principal manufacturers and suppliers in the global CRM market. We are also investing in our other three major growth platforms – atrial fibrillation, neuromodulation and cardiovascular – to increase our market share.
We utilize a 52/53-week fiscal year ending on the Saturday nearest December 31st. Fiscal year 2009 and 2007 consisted of 52 weeks and ended on January 2, 2010 and December 29, 2007, respectively. Fiscal year 2008 consisted of 53 weeks and ended on January 3, 2009 with the additional week reflected in our fourth quarter 2008 results.
Net sales in 2009 increased 7% over 2008 net sales, as a result of broad-based volume growth across all operating segments. Unfavorable foreign currency translation comparisons decreased our 2009 net sales by $99.5 million compared to 2008. Our 2009 CRM net sales increased 3% to $2,769.0 million, compared to 2008, driven by ICD volume growth partially offset by unfavorable foreign currency translation of $64.0 million. Our 2009 AF net sales increased 15% to $627.9 million, compared to 2008, due to continued market acceptance of device-based procedures to treat the symptoms of atrial fibrillation. Our 2009 Cardiovascular net sales increased 11%, compared to the prior year, to $953.6 million, driven by incremental sales from our December 2008 Radi Medical Systems AB (Radi Medical Systems) acquisition and continued volume growth from our other cardiovascular products. Additionally, 2009 Neuromodulation net sales grew 30% to $330.8 million, compared to 2008, driven by strong volume growth in the neuromodulation market and continued market acceptance of our products. Refer to the Segment Performance section for a more detailed discussion of our net sales results by operating segment.
Our 2009 net earnings of $777.2 million and diluted net earnings per share of $2.26 increased compared to 2008 net earnings of $353.0 million and diluted net earnings per share of $1.01. Our 2009 net earnings were impacted by after-tax charges of $85.3 million, or $0.25 per diluted share, from special charges, in-process research and development (IPR&D) charges and investment impairment charges, and our fiscal year 2008 net earnings were impacted by after-tax charges of $400.1 million, or $1.15 per diluted share. Compared to 2008, our net earnings and diluted net earnings per share benefited from continued net sales growth in all of our operating segments.
Our 2009 results included $76.4 million of after-tax special charges, or $0.22 per diluted share, which consisted of the following: $51.7 million related to initiatives to enhance the efficiency and effectiveness of the sales, marketing and customer service operations and to streamline our production activities; $11.3 million of inventory obsolescence charges for discontinued products; $8.7 million of accelerated depreciation charges and write-offs for assets that will no longer be utilized; and $4.7 million associated with contract terminations and other unrelated costs. We also recognized an after-tax impairment charge of $5.2 million, or $0.02 per diluted share, related to a cost method investment deemed to be other-than-temporarily impaired and recorded after-tax IPR&D charges of $3.7 million, or $0.01 per diluted share, related to the purchase of certain pre-development technology assets. Refer to the results of operations section for further details of these charges.
1
Our 2008 results included $319.4 million of IPR&D charges, or $0.92 per diluted share, primarily related to our MediGuide, Inc. (MediGuide) acquisition, and $72.7 million, or $0.21 per diluted share of after-tax special charges, which consisted of the following: $59.3 million, or $0.17 per diluted share, primarily associated with the impairment of a technology license agreement and the impairment of purchased technology intangible assets; $8.7 million, or $0.03 per diluted share, of inventory-related charges; and $4.7 million, or $0.01 per diluted share, related to providing our Merlin™@home wireless patient monitoring system to existing St. Jude Medical CRM patients at no charge. Our 2008 results also included $8.0 million, or $0.02 per diluted share, of after-tax investment impairment charges. Refer to the results of operations section for further details of these charges.
We generated $868.9 million of operating cash flows during 2009, compared to $945.6 million of operating cash flows during 2008. We ended the year with $392.9 million of cash and cash equivalents and $1,922.4 million of total debt. During 2009, we issued $1,200.0 million principal amount of debt, consisting of $700.0 million of 3.75% Senior Notes due 2014 (2014 Senior Notes) and $500.0 million of 4.875% Senior Notes due 2019 (2019 Senior Notes), (collectively, Senior Notes). We have strong short-term credit ratings of A1 from Standard & Poor’s, P2 from Moody’s and F1 from Fitch; and long-term credit ratings of A from Standard & Poor’s, Baa1 from Moody’s and A from Fitch. During 2009, we repurchased 27.1 million shares of our common stock for $1.0 billion. Since 2006, we have repurchased over 76 million shares of our common stock, returning $3.0 billion to shareholders.
NEW ACCOUNTING PRONOUNCEMENTS
Certain new accounting standards will become effective for us in fiscal year 2010 and future periods. Information regarding new accounting pronouncements that impacted 2009 or our historical consolidated financial statements and related disclosures is included in Note 1 to the Consolidated Financial Statements.
In October 2009, the Financial Accounting Standards Board (FASB) updated the revenue recognition accounting guidance of FASB Accounting Standards Codification (ASC) Topic 605, Revenue Recognition (ASC Topic 605) relating to the accounting for revenue arrangements that involve more than one deliverable or unit of accounting. The updated guidance allows companies to allocate arrangement consideration in multiple deliverable arrangements in a manner that better reflects the economics of the transaction by revising certain thresholds for separation, and providing criteria for allocation of revenue among deliverables. The FASB also updated the scope of the revenue recognition accounting guidance of FASB ASC Topic 985, Software (ASC Topic 985) removing both non-software components of tangible products and certain software components of tangible products from the scope of existing software revenue guidance, resulting in the recognition of revenue similar to that for other tangible products. The updated ASC Topic 605 and ASC Topic 985 accounting guidance is effective for annual periods beginning after June 15, 2010. Early adoption is permitted and may be prospective or retrospective. We are currently evaluating the impact of adopting this accounting guidance on our consolidated financial statements but do not expect the impact to be material.
In December 2009, the FASB issued Accounting Standards Update (ASU) 2009-17, Consolidations (Topic 810): Improvements to Financial Reporting by Enterprises Involved with Variable Interest Entities. ASU 2009-17 requires a qualitative approach to identifying a controlling financial interest in a variable interest entity (VIE), and requires ongoing assessment of whether an entity is a VIE and whether an interest in a VIE makes the holder the primary beneficiary of the VIE. ASU 2009-17 is effective for annual reporting periods beginning after November 15, 2009. We do not expect the adoption of ASU 2009-17 in the first quarter of 2010 to have a material impact on our consolidated financial statements.
In January 2010, the FASB issued ASU 2010-6, Fair Value Measurements and Disclosures (Topic 820): Improving Disclosures about Fair Value Measurements, which requires reporting entities to make new disclosures about recurring or nonrecurring fair value measurements including significant transfers into and out of Level 1 and Level 2 fair value measurements and information on purchases, sales, issuances, and settlements on a gross basis in the reconciliation of Level 3 fair value measurements. ASU 2010-6 is effective for annual reporting periods beginning after December 15, 2009, except for Level 3 reconciliation disclosures which are effective for annual periods beginning after December 15, 2010. We will adopt the Level 1 and Level 2 disclosures beginning in the first quarter of 2010 and the Level 3 disclosures beginning in the first quarter of 2011.
2
CRITICAL ACCOUNTING POLICIES AND ESTIMATES
Preparation of our consolidated financial statements in accordance with accounting principles generally accepted in the United States requires us to adopt various accounting policies and to make estimates and assumptions that affect the reported amounts in the financial statements and accompanying notes. Our significant accounting policies are disclosed in Note 1 to the Consolidated Financial Statements.
On an ongoing basis, we evaluate our estimates and assumptions, including those related to our accounts receivable allowance for doubtful accounts; inventory reserves; valuation of IPR&D, other intangible assets and goodwill; income taxes; litigation reserves and insurance receivables; and stock-based compensation. We base our estimates on historical experience and various other assumptions that are believed to be reasonable under the circumstances, and the results form the basis for making judgments about the reported values of assets, liabilities, and expenses. Actual results may differ from these estimates. We believe that the following represent our most critical accounting estimates:
Accounts Receivable Allowance for Doubtful Accounts: We grant credit to customers in the normal course of business, and generally do not require collateral or any other security to support our accounts receivable. We maintain an allowance for doubtful accounts for potential credit losses, which primarily consists of reserves for specific customer balances that we believe may not be collectible. We determine the adequacy of this allowance by regularly reviewing the age of accounts receivable, customer financial conditions and credit histories, and current economic conditions. In some developed markets and in many emerging markets, payment of certain accounts receivable balances are made by the individual countries’ healthcare systems for which payment is dependent, to some extent, upon the political and economic environment within those countries. Although we consider our allowance for doubtful accounts to be adequate, if the financial condition of our customers or the individual countries’ healthcare systems were to deteriorate and impair their ability to make payments to us, additional allowances may be required in future periods. The allowance for doubtful accounts was $34.9 million at January 2, 2010 and $29.0 million at January 3, 2009.
Inventory Reserves: We value inventory at the lower of cost or market, with cost determined using the first-in, first-out method. We maintain reserves for excess and obsolete inventory based on forecasted product sales, new product introductions by us or our competitors, product expirations and historical experience. The inventory reserves we recognize are based on our estimates of how these multiple factors are expected to impact the amount and value of inventory we expect to sell. The markets in which we operate are highly competitive and characterized by rapid product development and technological change putting our products at risk of losing market share and/or becoming obsolete. We monitor our inventory reserves on an ongoing basis, and although we consider our inventory reserves to be adequate, we may be required to recognize additional inventory reserves if future demand or market conditions are less favorable than we have estimated.
Valuation of IPR&D, Other Intangible Assets and Goodwill: When we acquire another company, the purchase price is allocated, as applicable, between IPR&D, other identifiable intangible assets, tangible assets and goodwill. Determining the portion of the purchase price allocated to IPR&D and other intangible assets requires us to make significant estimates.
IPR&D is defined as the value assigned to those projects for which the related products have not yet reached technological feasibility and have no future alternative use. The primary basis for determining the technological feasibility of these projects at the time of acquisition is obtaining regulatory approval to market the underlying products in an applicable geographic region. Prior to 2009, we expensed the value attributed to any IPR&D projects acquired in a business acquisition.
Beginning in fiscal year 2009, all IPR&D acquired in a business acquisition is subject to FASB’s ASC Topic 805, Business Combinations, which requires the fair value of IPR&D to be capitalized as an indefinite-lived intangible asset until completion of the IPR&D project or abandonment. Upon completion of the development project (generally when regulatory approval to market the product is obtained), acquired IPR&D assets are amortized over their estimated useful life. If the IPR&D projects are abandoned, the related IPR&D assets would likely be impaired and written down to the remaining fair value, if any. No IPR&D was capitalized during fiscal year 2009.
Our adoption of ASC Topic 805 did not change our accounting policy with respect to asset purchases. In many cases, the purchase of certain intellectual property assets or the rights to such intellectual property is considered a purchase of assets rather than the acquisition of a business. Accordingly, rather than being capitalized, any IPR&D acquired in such asset purchases are expensed.
3
We use the income approach to establish the fair value of IPR&D as of the acquisition date. This approach establishes fair value by estimating the after-tax cash flows attributable to a project over its estimated useful life and then discounting these after-tax cash flows back to a present value. We base our revenue assumptions on estimates of relevant market sizes, expected market growth, and trends in technology as well as anticipated product introductions by competitors. In arriving at the value of the projects, we consider, among other factors, the stage of completion, the complexity of the work completed, the costs incurred, the projected cost of completion, the contribution of core technologies and other acquired assets, the expected introduction date and the estimated useful life of the technology. The discount rate used is determined at the time of acquisition and includes consideration of the assessed risk of the project not being developed to commercial feasibility.
At the time of acquisition, we expect all acquired IPR&D will reach technological feasibility, but there can be no assurance that the commercial viability of these projects will actually be achieved. The nature of the efforts to develop the acquired technologies into commercially viable products consists principally of planning, designing and conducting clinical trials necessary to obtain regulatory approvals. The risks associated with achieving commercialization include, but are not limited to, delay or failure to obtain regulatory approvals to conduct clinical trials, failure of clinical trials, delay or failure to obtain required market clearances, and patent litigation. If commercial viability is not achieved, we would not realize the original estimated financial benefits expected for these projects. We fund all costs to complete IPR&D projects with internally generated cash flows.
The fair value of other identifiable intangible assets is based on detailed valuations using the income approach. Other intangible assets consist of purchased technology and patents, customer lists and relationships, distribution agreements, licenses, trademarks and tradenames, all of which are amortized using the straight-line method over their estimated useful lives, ranging from 3 to 20 years. We review other intangible assets for impairment as changes in circumstance or the occurrence of events suggest the carrying value may not be recoverable. Other intangible assets, net of accumulated amortization, were $456.1 million at January 2, 2010 and $493.5 million at January 3, 2009.
Goodwill represents the excess of the aggregate purchase price over the fair value of net assets, including IPR&D, of the acquired businesses. Goodwill is tested for impairment annually or more frequently if changes in circumstance or the occurrence of events suggest impairment exists. The test for impairment requires us to make several estimates about fair value, most of which are based on projected future cash flows. Our estimates associated with the goodwill impairment tests are considered critical due to the amount of goodwill recorded on our consolidated balance sheets and the judgment required in determining fair value amounts, including projected future cash flows and the use of an appropriate risk-adjusted discount rate. Goodwill was $2,005.9 million at January 2, 2010 and $1,984.6 million at January 3, 2009.
Income Taxes: As part of the process of preparing our consolidated financial statements, we are required to estimate our income taxes in each of the jurisdictions in which we operate. This process involves estimating the actual current tax expense as well as assessing temporary differences in the treatment of items for tax and financial accounting purposes. These timing differences result in deferred tax assets and liabilities, which are included in our consolidated balance sheet. We also assess the likelihood that our deferred tax assets will be recovered from future taxable income, and to the extent that we believe that recovery is not likely, a valuation allowance is established. At January 2, 2010, we had $402.4 million of gross deferred tax assets, including net operating loss and tax credit carryforwards that will expire from 2012 to 2027 if not utilized. We believe that our deferred tax assets, including the net operating loss and tax credit carryforwards, will be fully realized based upon our estimates of future taxable income. As such, we have not recorded any valuation allowance for our deferred tax assets. If our estimates of future taxable income are not met, a valuation allowance for some of these deferred tax assets would be required.
We have not recorded U.S. deferred income taxes on certain of our non-U.S. subsidiaries’ undistributed earnings, as such amounts are intended to be reinvested outside the United States indefinitely. However, should we change our business and tax strategies in the future and decide to repatriate a portion of these earnings to one of our U.S. subsidiaries, including cash maintained by these non-U.S. subsidiaries, additional U.S. tax liabilities would be incurred. It is not practical to estimate the amount of additional U.S. tax liabilities we would incur.
We record our income tax provisions based on our knowledge of all relevant facts and circumstances, including the existing tax laws, our experience with previous settlement agreements, the status of current IRS examinations and our understanding of how the tax authorities view certain relevant industry and commercial matters. Although we have recorded all income tax accruals in accordance with ASC 740, Income Taxes, our accruals represent accounting estimates that are subject to the inherent uncertainties associated with the tax audit process, and therefore include certain contingencies.
4
The finalization of the tax audit process across the various tax authorities, including federal, state and foreign, often takes many years. We have substantially concluded all U.S. federal income tax matters for all tax years through 2001. Additionally, substantially all material foreign, state, and local income tax matters have been concluded for all tax years through 1999. The U.S. Internal Revenue Service (IRS) completed an audit of our 2002-2005 tax returns, and proposed adjustments in its audit report issued in November 2008. We are vigorously defending our positions and initiated defense of these adjustments at the IRS appellate level in January 2009. An unfavorable outcome could have a material negative impact on our effective income tax rate in future periods. At January 2, 2010, our liability for unrecognized tax benefits was $120.5 million, and our accrual for interest and penalties was $28.3 million. We believe that any potential tax assessments from the various tax authorities that are not covered by our income tax accruals will not have a material adverse impact on our consolidated financial position or cash flows; however, they may be material to our consolidated earnings of a future period.
Litigation Reserves and Insurance Receivables: We operate in an industry that is susceptible to significant product liability and intellectual property claims. As a result, we are involved in a number of legal proceedings, the outcomes of which are not in our complete control and may not be known for extended periods of time. In accordance with ASC Topic 450, Contingencies, we record a liability in our consolidated financial statements for costs related to claims, including future legal costs, settlements and judgments where we have assessed that a loss is probable and an amount can be reasonably estimated. Product liability claims may be brought by individuals seeking relief for themselves or, increasingly, by groups seeking to represent a class. In addition, claims may be asserted against us in the future related to events that are not known to us at the present time. Our significant legal proceedings are discussed in detail in Note 5 to the Consolidated Financial Statements. While it is not possible to predict the outcome for most of the legal proceedings discussed in Note 5, the costs associated with such proceedings could have a material adverse effect on our consolidated earnings, financial position or cash flows of a future period.
We record a receivable from our product liability insurance carriers for amounts expected to be recovered. This includes amounts for legal matters where we have incurred defense costs or where we have recorded a liability for probable and estimable future legal costs, settlements or judgments. We record a receivable for the amount of insurance we expect to recover based on our assessment of the specific insurance policies, the nature of the claim, our experience with similar claims and our assessment of collectability based on our insurers’ financial condition. To the extent our insurance carriers ultimately do not reimburse us, either because such costs are deemed to be outside the scope of our product liability insurance policies or because our insurers may not be able to meet their payment obligations to us, the related losses we incur relating to these unreimbursed costs could have a material adverse effect on our consolidated earnings or cash flows. Our receivable from product liability insurance carriers was $42.5 million at January 2, 2010 and $25.6 million at January 3, 2009.
Stock-Based Compensation: Under the fair value recognition provisions of ASC Topic 718, Compensation – Stock Compensation (ASC Topic 718), we measure stock-based compensation cost at the grant date based on the fair value of the award and recognize the compensation expense over the requisite service period, which is the vesting period.
We use the Black-Scholes standard option pricing model (Black-Scholes model) to determine the fair value of stock options and employee stock purchase rights. The determination of the fair value of the awards on the date of grant using the Black-Scholes model is affected by our stock price as well as assumptions of other variables, including projected employee stock option exercise behaviors (expected option life), risk-free interest rate, expected dividend yield and expected volatility of our stock price in future periods.
We analyze historical employee exercise and termination data to estimate the expected life assumption. We believe that historical data currently represents the best estimate of the expected life of a new employee option. We also stratify our employee population based upon distinctive exercise behavior patterns. The risk-free interest rate we use is based on the U.S. Treasury zero-coupon yield curve on the grant date for a maturity similar to the expected life of the options. Because we do not anticipate paying any cash dividends in the foreseeable future, we use an expected dividend yield of zero. Since December 2008, we calculate our expected volatility assumption by equally weighting historical and implied volatility. Previously, we calculated the expected volatility assumption exclusively on the implied volatility of market-traded options. We changed the method of determining expected volatility to take into consideration how future volatility experience over the expected life of the option may differ from short-term volatility experience and thus provide a better estimate of expected volatility over the expected life of employee stock options. The impact of changing the method of determining expected volatility was not material to fiscal year 2008 stock compensation expense. Refer to Note 7 of the Consolidated Financial Statements for further details regarding the change in our expected volatility assumption.
5
The amount of stock-based compensation expense we recognize during a period is based on the portion of the awards that are ultimately expected to vest. We estimate pre-vesting option forfeitures at the time of grant by analyzing historical data and revise those estimates in subsequent periods if actual forfeitures differ from those estimates.
If factors change and we employ different assumptions for estimating stock-based compensation expense in future periods or if we decide to use a different valuation model, the expense in future periods may differ significantly from what we have recorded in the current period and could materially affect our net earnings and net earnings per share of a future period.
ACQUISITIONS
On July 3, 2008, we completed the acquisition of EP MedSystems, Inc. (EP MedSystems) for $95.7 million (consisting of $59.0 million in net cash consideration and direct acquisition costs and 0.9 million shares of St. Jude Medical common stock). EP MedSystems had been publicly traded on the NASDAQ Capital Market under the ticker symbol EPMD. EP MedSystems is based in West Berlin, New Jersey and develops, manufactures and markets medical devices for the electrophysiology market which are used for visualization, diagnosis and treatment of heart rhythm disorders. We acquired EP MedSystems to strengthen our portfolio of products used to treat heart rhythm disorders. EP MedSystems has become part of our Atrial Fibrillation division.
On December 19, 2008, we completed the acquisition of Radi Medical Systems for $248.9 million in net cash consideration, including direct acquisition costs. Radi Medical Systems is based in Uppsala, Sweden and develops, manufactures and markets products that provide precise measurements of intravascular pressure during a cardiovascular procedure and manual compression systems that arrest bleeding of the femoral and radial arteries following an intravascular medical device procedure. We acquired Radi Medical Systems to accelerate our cardiovascular growth platform in these two segments of the cardiovascular medical device market in which we previously had not participated. Radi Medical Systems has become part of our Cardiovascular division.
On December 22, 2008, we completed the acquisition of MediGuide for $285.2 million in net consideration. MediGuide was a development-stage company based in Haifa, Israel and was focused on developing its Medical Positioning System (gMPSTM) technology for localization and tracking capability for interventional medical devices. We plan to expend additional research and development efforts to achieve technological feasibility for this technology. MediGuide has become part of our Atrial Fibrillation division.
SEGMENT PERFORMANCE
Our four operating segments are Cardiac Rhythm Management (CRM), Cardiovascular (CV), Atrial Fibrillation (AF), and Neuromodulation (NMD). The primary products produced by each operating segment are: CRM – ICDs and pacemakers; CV – vascular closure devices, heart valve replacement and repair products and pressure measurement guidewires; AF – electrophysiology introducers and catheters, advanced cardiac mapping, navigation and recording systems and ablation systems; and NMD – neurostimulation devices.
We aggregate our four operating segments into two reportable segments based upon their similar operational and economic characteristics: CRM/NMD and CV/AF. Net sales of our reportable segments include end-customer revenue from the sale of products they each develop and manufacture or distribute. The costs included in each of the reportable segments’ operating results include the direct costs of the products sold to customers and operating expenses managed by each of the reportable segments. Certain operating expenses managed by our selling and corporate functions, including all stock-based compensation expense, impairment charges, IPR&D charges and special charges have not been recorded in the individual reportable segments. As a result, reportable segment operating profit is not representative of the operating profit of the products in these reportable segments.
6
The following table presents net sales and operating profit by reportable segment (in thousands):
|
|
|
|
|
|
|
|
|
|
|
|
|
|
|
|
|
|
CRM/NMD |
|
CV/AF |
|
Other |
|
Total |
|
||||
|
Fiscal Year 2009 |
|
|
|
|
|
|
|
|
|
|
|
|
|
|
Net sales |
|
$ |
3,099,800 |
|
$ |
1,581,473 |
|
$ |
— |
|
$ |
4,681,273 |
|
|
Operating profit |
|
|
1,931,929 |
|
|
829,966 |
|
|
(1,648,849 |
) |
|
1,113,046 |
|
|
Fiscal Year 2008 |
|
|
|
|
|
|
|
|
|
|
|
|
|
|
Net sales |
|
$ |
2,955,603 |
|
$ |
1,407,648 |
|
$ |
— |
|
$ |
4,363,251 |
|
|
Operating profit |
|
|
1,824,023 |
|
|
736,979 |
|
|
(1,905,955 |
) |
|
655,047 |
|
|
Fiscal Year 2007 |
|
|
|
|
|
|
|
|
|
|
|
|
|
|
Net sales |
|
$ |
2,577,975 |
|
$ |
1,201,302 |
|
$ |
— |
|
$ |
3,779,277 |
|
|
Operating profit |
|
|
1,576,439 |
|
|
579,325 |
|
|
(1,362,261 |
) |
|
793,503 |
|
The following discussion of the changes in our net sales is provided by class of similar products within our four operating segments, which is the primary focus of our sales activities.
Cardiac Rhythm Management
|
|
|
|
|
|
|
|
|
|
|
|
|
|
|
|
|
|
|
(in thousands) |
|
2009 |
|
2008 |
|
2007 |
|
2009 vs. 2008 |
|
2008 vs. 2007 |
|
|||||
|
ICD systems |
|
$ |
1,578,471 |
|
$ |
1,534,212 |
|
$ |
1,304,899 |
|
|
2.9 |
% |
|
17.6 |
% |
|
Pacemaker systems |
|
|
1,190,563 |
|
|
1,167,251 |
|
|
1,063,182 |
|
|
2.0 |
% |
|
9.8 |
% |
|
|
|
$ |
2,769,034 |
|
$ |
2,701,463 |
|
$ |
2,368,081 |
|
|
2.5 |
% |
|
14.1 |
% |
Cardiac Rhythm Management 2009 net sales increased 3% to $2,769.0 million compared to 2008. CRM net sales growth was driven by volume growth partially offset by unfavorable foreign currency translation comparisons of $64.0 million and a decline in our U.S. average selling prices. 2009 ICD net sales increased 3%, compared to the prior year, to $1,578.5 million due to volume growth, driven by our international markets. Internationally, 2009 ICD net sales of $580.9 million increased 6% compared to 2008 due to volume growth. Foreign currency translation had a $37.6 million unfavorable impact on international ICD net sales during 2009 compared to the prior year. 2009 U.S. ICD net sales of $997.6 million remained flat over the prior year, as low single-digit volume growth was offset by declines in average selling prices. Pacemaker systems 2009 net sales increased 2%, compared to 2008, to $1,190.6 million, benefiting from increased volume growth driven by our international markets. Internationally, pacemaker systems 2009 net sales increased 4% over 2008 to $671.6 million due to both volume growth and sales mix. Foreign currency translation had a $26.4 million unfavorable impact on international pacemaker net sales in 2009 compared to 2008. In the United States, pacemaker systems 2009 net sales of $518.9 million remained flat as low single-digit volume growth was offset by declines in average selling prices.
Cardiac Rhythm Management 2008 net sales increased 14% to $2,701.5 million compared to 2007 due to strong volume growth. Foreign currency translation had a $69.0 million favorable impact on 2008 net sales compared to 2007. Net sales of ICDs increased approximately 18% to $1,534.2 million driven by strong volume growth in both U.S. and international markets. In the United States, 2008 ICD net sales of $985.4 million increased 11% over last year. Internationally, 2008 ICD net sales of $548.8 million increased nearly 32% compared to 2007. Foreign currency translation had a $28.8 million favorable impact on international ICD net sales compared to 2007. Pacemaker systems 2008 net sales increased nearly 10% to $1,167.3 million driven by strong volume growth, which was also broad-based across both U.S. and international markets. In the United States, 2008 pacemaker net sales of $521.9 million increased 3% compared to 2007. Internationally, 2008 pacemaker net sales of $645.4 million increased 16% over last year. Foreign currency translation had a $40.2 million favorable impact on international pacemaker net sales in 2008 compared to 2007.
Cardiovascular
|
|
|
|
|
|
|
|
|
|
|
|
|
|
|
|
|
|
|
(in thousands) |
|
2009 |
|
2008 |
|
2007 |
|
2009 vs. 2008 |
|
2008 vs. 2007 |
|
|||||
|
Vascular closure devices |
|
$ |
380,965 |
|
$ |
367,893 |
|
$ |
353,987 |
|
|
3.6 |
% |
|
3.9 |
% |
|
Heart valve products |
|
|
323,202 |
|
|
321,534 |
|
|
290,196 |
|
|
0.5 |
% |
|
10.8 |
% |
|
Other cardiovascular products |
|
|
249,453 |
|
|
172,709 |
|
|
146,447 |
|
|
44.4 |
% |
|
17.9 |
% |
|
|
|
$ |
953,620 |
|
$ |
862,136 |
|
$ |
790,630 |
|
|
10.6 |
% |
|
9.0 |
% |
7
Cardiovascular 2009 net sales increased 11% to $953.6 million compared to 2008 driven by volume growth, including incremental sales of products from our Radi Medical Systems acquisition in December 2008. Foreign currency translation had an unfavorable impact on 2009 net sales of $18.6 million compared to 2008. Net sales of vascular closure devices, which include sales of Radi Medical Systems’ compression assist products, increased approximately 4% compared to 2008. Although 2009 heart valve sales volumes increased compared to 2008, unfavorable foreign currency translation and sales mix comparisons largely offset the benefit of increased sales volumes. Net sales of other cardiovascular products increased $76.7 million compared to 2008 due to incremental sales of pressure measurement guidewires, a product line acquired from Radi Medical Systems, and volume growth of other cardiovascular products.
Cardiovascular 2008 net sales increased 9% to $862.1 million compared to 2007 driven by increased sales volumes and favorable foreign currency translation impacts, led by both heart valve products and other cardiovascular products. Foreign currency translation had a $34.0 million favorable impact on CV net sales compared to 2007. Net sales of vascular closure devices increased approximately 4% compared to 2007 due to sales volume growth of Angio-Seal™. Heart valve net sales increased 11% compared to 2007 due to increased sales volumes for both tissue heart valves and mechanical heart valves. Other cardiovascular products net sales increased approximately 18% compared to last year due to increased sales volumes and favorable foreign currency translation.
Atrial Fibrillation
|
|
|
|
|
|
|
|
|
|
|
|
|
|
|
|
|
|
|
(in thousands) |
|
2009 |
|
2008 |
|
2007 |
|
2009 vs. 2008 |
|
2008 vs. 2007 |
|
|||||
|
Atrial fibrillation products |
|
$ |
627,853 |
|
$ |
545,512 |
|
$ |
410,672 |
|
|
15.1 |
% |
|
32.8 |
% |
Atrial Fibrillation 2009 net sales increased 15% to $627.9 million compared to 2008 net sales. The increase in AF net sales was driven by volume growth from continued market acceptance of device-based ablation procedures to treat the symptoms of atrial fibrillation and our expanded product offerings. Our access, diagnosis, visualization and ablation products assist physicians in diagnosing and treating atrial fibrillation and other irregular heart rhythms. Foreign currency translation had an unfavorable impact on AF net sales of $12.8 million compared to 2008.
Atrial Fibrillation 2008 net sales increased approximately 33% to $545.5 million compared to 2007 net sales. The increase in AF net sales was driven by strong volume growth. Foreign currency translation had a favorable impact on AF net sales of $16.0 million compared to 2007.
Neuromodulation
|
|
|
|
|
|
|
|
|
|
|
|
|
|
|
|
|
|
|
(in thousands) |
|
2009 |
|
2008 |
|
2007 |
|
2009 vs. 2008 |
|
2008 vs. 2007 |
|
|||||
|
Neurostimulation devices |
|
$ |
330,766 |
|
$ |
254,140 |
|
$ |
209,894 |
|
|
30.2 |
% |
|
21.1 |
% |
Neuromodulation 2009 net sales increased 30% to $330.8 million compared to 2008 net sales. The increase in NMD net sales was driven by strong volume growth from both continued market acceptance of our products and growth in the neuromodulation market. Foreign currency translation had an unfavorable impact on NMD net sales of $4.1 million compared to 2008.
Neuromodulation 2008 net sales increased 21% to $254.1 million compared to 2007 net sales. The increase in NMD net sales was driven by strong volume growth from both new product introductions and continued growth in the neuromodulation market. Foreign currency translation did not have a significant impact on 2008 net sales.
RESULTS OF OPERATIONS
Net Sales
|
|
|
|
|
|
|
|
|
|
|
|
|
|
|
|
|
|
|
(in thousands) |
|
2009 |
|
2008 |
|
2007 |
|
2009 vs. 2008 |
|
2008 vs. 2007 |
|
|||||
|
Net sales |
|
$ |
4,681,273 |
|
$ |
4,363,251 |
|
$ |
3,779,277 |
|
|
7.3 |
% |
|
15.5 |
% |
Overall, 2009 net sales increased 7% compared to 2008. Net sales growth was favorably impacted by volume growth, which was broad-based across all operating segments. Compared to 2008, foreign currency translation had an unfavorable impact on 2009 net sales of $99.5 million due primarily to the strengthening of the U.S. Dollar against the Euro.
8
Overall, 2008 net sales increased 15% compared to 2007. Net sales growth was favorably impacted by strong volume growth, driven by CRM and AF product sales. Additionally, foreign currency translation had a $120.4 million, or 3%, favorable impact on 2008 net sales compared to 2007, primarily due to the strengthening of both the Euro and Japanese Yen against the U.S. Dollar.
Net sales by geographic location of the customer were as follows (in thousands):
|
|
|
|
|
|
|
|
|
|
|
|
|
Net Sales |
|
2009 |
|
2008 |
|
2007 |
|
|||
|
United States |
|
$ |
2,468,191 |
|
$ |
2,319,645 |
|
$ |
2,107,015 |
|
|
International |
|
|
|
|
|
|
|
|
|
|
|
Europe |
|
|
1,197,912 |
|
|
1,152,601 |
|
|
936,526 |
|
|
Japan |
|
|
480,897 |
|
|
387,648 |
|
|
321,826 |
|
|
Asia Pacific |
|
|
254,429 |
|
|
234,073 |
|
|
192,793 |
|
|
Other (a) |
|
|
279,844 |
|
|
269,284 |
|
|
221,117 |
|
|
|
|
|
2,213,082 |
|
|
2,043,606 |
|
|
1,672,262 |
|
|
|
|
$ |
4,681,273 |
|
$ |
4,363,251 |
|
$ |
3,779,277 |
|
|
|
|
|
|
(a) No one geographic market is greater than 5% of consolidated net sales. |
Foreign currency translation relating to our international operations can have a significant impact on our operating results from year to year. The two main currencies influencing our operating results are the Euro and the Japanese Yen. As discussed above, foreign currency translation had a $99.5 million unfavorable impact on 2009 net sales, while the translation impact in 2008 had a $120.4 million favorable impact on net sales. These impacts to net sales are not indicative of the net earnings impact of foreign currency translation due to partially offsetting foreign currency translation impacts on cost of sales and operating expenses.
Gross Profit
|
|
|
|
|
|
|
|
|
|
|
|
|
(in thousands) |
|
2009 |
|
2008 |
|
2007 |
|
|||
|
Gross profit |
|
$ |
3,427,888 |
|
$ |
3,192,710 |
|
$ |
2,737,683 |
|
|
Percentage of net sales |
|
|
73.2 |
% |
|
73.2 |
% |
|
72.4 |
% |
Gross profit for 2009 totaled $3,427.9 million, or 73.2% of net sales, compared to $3,192.7 million, or 73.2% of net sales in 2008. Special charges in 2009 negatively impacted our gross profit by approximately 0.7 percentage points related to inventory obsolescence charges for discontinued products, accelerated depreciation charges and write-offs for assets that will no longer be utilized and initiatives to streamline our production activities. Special charges in 2008 negatively impacted our gross profit by approximately 1.5 percentage points consisting primarily of charges related to the impairment of a technology license agreement, termination costs related to certain raw material purchase contracts, inventory obsolescence charges associated with a terminated distribution agreement and charges related to providing our new remote patient monitoring system to existing St. Jude Medical CRM patients at no charge. The remaining decrease in our 2009 gross profit percentage as a percent of net sales compared to 2008 was due to unfavorable foreign currency translation impacts, partially offset by productivity improvements.
Gross profit for 2008 totaled $3,192.7 million, or 73.2% of net sales, compared to $2,737.7 million, or 72.4% of net sales in 2007. Special charges in 2008 negatively impacted our gross profit by approximately 1.5 percentage points, as discussed previously. Special charges in 2007 negatively impacted our gross profit margin by approximately 1.0 percentage point and were associated with our 2007 restructuring activities. The improvement in our 2008 gross profit percentage as a percent of net sales compared to 2007 was due to favorable foreign currency translation and favorable product mix from higher margin products. Refer to Note 8 of the Consolidated Financial Statements for further details of the components of the special charges impacting our 2009, 2008 and 2007 gross profit.
9
Selling, General and Administrative (SG&A) Expense
|
|
|
|
|
|
|
|
|
|
|
|
|
(in thousands) |
|
2009 |
|
2008 |
|
2007 |
|
|||
|
Selling, general and administrative expense |
|
$ |
1,675,251 |
|
$ |
1,636,526 |
|
$ |
1,382,466 |
|
|
Percentage of net sales |
|
|
35.8 |
% |
|
37.5 |
% |
|
36.6 |
% |
SG&A expense for 2009 totaled $1,675.3 million, or 35.8% of net sales, compared with $1,636.5 million, or 37.5% of net sales in 2008. SG&A expense for 2009 as a percent of net sales benefited from $26.0 million of lower discretionary company performance-based compensation costs. SG&A expense for 2008 as a percent of net sales was unfavorably impacted by 0.8 percentage points due to our $35.0 million contribution to non-profit organizations, including the St. Jude Medical Foundation.
SG&A expense for 2008 totaled $1,636.5 million, or 37.5% of net sales, compared with $1,382.5 million, or 36.6% of net sales in 2007. The increase in SG&A expense as a percent of net sales over 2007 was primarily due to the $35.0 million of contributions to non-profit organizations discussed previously.
Research and Development (R&D) Expense
|
|
|
|
|
|
|
|
|
|
|
|
|
(in thousands) |
|
2009 |
|
2008 |
|
2007 |
|
|||
|
Research and development expense |
|
$ |
559,766 |
|
$ |
531,799 |
|
$ |
476,332 |
|
|
Percentage of net sales |
|
|
12.0 |
% |
|
12.2 |
% |
|
12.6 |
% |
R&D expense in 2009 totaled $559.8 million, or 12.0% of net sales, compared with $531.8 million, or 12.2% of net sales in 2008. While 2009 R&D expense as a percent of net sales decreased compared to 2008, total R&D expense continues to increase each year, reflecting our continuing commitment to fund future long-term growth opportunities. We will continue to balance delivering short-term results with investments in long-term growth drivers.
R&D expense in 2008 totaled $531.8 million, or 12.2% of net sales, compared with $476.3 million, or 12.6% of net sales in 2007. While 2008 R&D expense as a percent of net sales decreased compared to 2007, total R&D expense increased over 11% compared to 2007, reflecting our continuing commitment to fund future long-term growth opportunities.
Purchased In-Process Research and Development (IPR&D) Charges
|
|
|
|
|
|
|
|
|
|
|
|
|
(in thousands) |
|
2009 |
|
2008 |
|
2007 |
|
|||
|
Purchased in-process research and development charges |
|
$ |
5,842 |
|
$ |
319,354 |
|
$ |
— |
|
Fiscal Year 2009
During 2009, we recorded IPR&D charges of $5.8 million in conjunction with the purchase of intellectual property in our CV and NMD segments since the related technological feasibility had not yet been reached and such technology had no future alternative use.
Fiscal Year 2008
MediGuide, Inc.: In December 2008, we acquired privately-held MediGuide, a development-stage company that has been focused on developing its gMPSTM technology for localization and tracking capability for interventional medical devices. The acquisition provides us with exclusive rights to use and develop MediGuide’s gMPSTM technology. As MediGuide was a development-stage company, the excess of the purchase price over the fair value of the net assets acquired was allocated on a pro-rata basis to the net assets acquired. Accordingly, the excess purchase price was allocated to IPR&D, the principal asset acquired. At the date of acquisition, $306.2 million of the purchase price was expensed as IPR&D since technological feasibility of the underlying projects had not yet been reached and such technology had no future alternative use. Through January 2, 2010, we have incurred costs of approximately $10 million related to these projects. We expect to incur an additional $20 million to bring the technology to commercial viability on a worldwide basis within one to two years.
10
Other: In December 2008, we also made an additional minority investment in a development-stage company and, in accordance with step-acquisition accounting treatment under the equity method of accounting, allocated the excess purchase price over the fair value of the investee’s net assets to IPR&D the principal asset acquired. At the additional investment date, $11.6 million of IPR&D was expensed since technological feasibility of the underlying projects had not yet been reached and such technology had no future alternative use. Additionally, we recognized $1.6 million of IPR&D charges related to the purchase of intellectual property in our CRM and CV segments since the related technological feasibility had not yet been reached and such technology had no future alternative use.
Special Charges
|
|
|
|
|
|
|
|
|
|
|
|
|
(in thousands) |
|
2009 |
|
2008 |
|
2007 |
|
|||
|
Cost of sales special charges |
|
$ |
33,761 |
|
$ |
64,603 |
|
$ |
38,292 |
|
|
Special charges |
|
|
73,983 |
|
|
49,984 |
|
|
85,382 |
|
|
|
|
$ |
107,744 |
|
$ |
114,587 |
|
$ |
123,674 |
|
Fiscal Year 2009
Employee Termination Costs: We incurred charges totaling $107.7 million, of which $71.1 million related to severance and benefit costs for approximately 725 employees. These costs were recognized after management determined that such severance and benefits were probable and estimable, in accordance with ASC Topic 712, Nonretirement Postemployment Benefits. The terminations consisted of approximately 440 employees in our U.S. and International selling divisions in an effort to enhance the efficiency and effectiveness of the sales, marketing and customer service operations in these organizations and approximately 285 employees in our manufacturing divisions related to continuing efforts to streamline our production activities. Of the total $71.1 million charge, $6.6 million was recorded in cost of sales.
Inventory Charges: We recorded $17.7 million of charges in cost of sales relating to inventory that would be scrapped in connection with management’s decision to terminate certain product lines in our CRM and AF divisions that were redundant with other existing products lines.
Fixed Asset Charges: We recorded $5.9 million of charges in cost of sales associated with the accelerated depreciation of phasing out older model diagnostic equipment. We also recognized $6.1 million of asset write-offs related to the carrying value of assets that will no longer be utilized. Of the $6.1 million charge, $3.5 million was recorded in cost of sales.
Other Charges: We recorded charges of $1.8 million associated with contract terminations and $5.1 million of other unrelated costs.
Fiscal Year 2008
Impairment Charges: In 2008, we determined that a large portion of the technology under a license agreement covering certain of our CRM devices was no longer fully utilized in our products and that certain of the patents under the license were no longer valid based upon recent patent law developments. Based upon these developments and changes in circumstances, we recognized an impairment charge of $43.5 million to cost of sales to write our intangible asset for our technology license agreement down to its fair value.
Based upon unfavorable 2008 sales performance as well as negative clinical trial results, we reduced the future revenue and cash flow projections relating to certain product lines acquired from Velocimed LLC (Velocimed) in 2005. Accordingly, we tested the related purchased technology intangible assets for impairment and recognized a $37.0 million impairment charge to write down the related intangible assets to their remaining fair value. We also recognized other impairment charges of $5.8 million in 2008 primarily related to assets in the Cardiovascular division that will no longer be utilized.
In December 2008, we decided to discontinue the use of the Advanced Neuromodulation Systems, Inc. (ANS) tradename. We had acquired ANS in November 2005 and used the related tradename through its discontinuance in December 2008. Accordingly, we wrote off the ANS tradename intangible assets and recognized a $1.7 million impairment charge.
Inventory Charges: In 2008 we entered into purchase contracts in the normal course of business for certain raw material commodities that are used in the manufacture of our products. Favorable decreases in commodity prices resulted in our election to terminate and exit the contracts, paying $10.7 million in termination costs, which was recorded as a special charge in cost of sales.
11
We also recognized inventory obsolescence charges related to inventory not expected to be sold due to the termination of a distribution agreement in Japan. When we elected to terminate the distribution agreement in December 2007, we recorded a $4.0 million special charge in 2007 related to inventory that we estimated would not be sold. We increased this estimate in 2008 and recorded an additional $3.0 million charge in cost of sales.
Other Charges: In 2008, we launched our MerlinTM @home wireless patient monitoring system and committed to provide this system without charge to our existing St. Jude Medical CRM patients. In connection with the completion of this roll-out in the fourth quarter of 2008, we recorded a $7.4 million special charge in cost of sales to accrue for the related costs. We also recognized $5.5 million of other unrelated costs.
Fiscal Year 2007
Patent Litigation: In June 2007, we settled a patent litigation matter with Guidant Corporation (a subsidiary of Boston Scientific Corporation) and Mirowski Family Ventures, L.L.C. and recorded a charge of $35.0 million.
Restructuring Activities: In December 2007, management initiated efforts to streamline operations and implemented restructuring actions primarily focused at our international locations. As a result, we recorded charges totaling $29.1 million in 2007 consisting of employee termination costs ($17.9 million) and other costs ($11.2 million). Of the total $29.1 million charge, $5.9 million was recorded in cost of sales. Employee termination costs related to severance and benefit costs for approximately 200 individuals identified for employment termination. These costs were recognized after management determined that such severance and benefits were probable and estimable, in accordance with ASC Topic 712, Nonretirement Postemployment Benefits. Other costs primarily represented contract termination costs. The actions and related payments for these restructuring activities have been completed.
Impairment Charges: We recognized impairment charges of $23.7 million related to acquired intangible assets associated with a distribution agreement with a supplier of medical products to our Japanese distribution subsidiary. In December 2007, we provided notice to the supplier that we were terminating the distribution agreement. As a result, we recognized an impairment charge to state the related intangible assets at their remaining fair value. We had acquired the intangible assets as part of our acquisition in Japan of Getz Bros. Co., Ltd. in April 2003. The distribution agreement was terminated in June 2008.
Additionally, in connection with completing our United States roll-out of the Merlin™ programmer platform for our ICDs and pacemakers, we recorded an $11.8 million charge in cost of sales to write off the remaining carrying value of older model programmer diagnostic equipment. We also recognized $6.0 million of asset write-offs relating to the carrying value of assets that will no longer be utilized, of which $2.5 million was recorded in cost of sales.
Discontinued Inventory: We recorded a $14.1 million charge in cost of sales relating to inventory that would be scrapped in connection with management’s decision to terminate certain product lines in our CV and AF divisions that were redundant with other existing products lines. By eliminating product lines with redundant characteristics, we do not anticipate any material short-term or long-term impact on future revenue or gross profit percentages.
Additionally, in connection with our decision to terminate the distribution agreement in Japan (see Impairment Charges discussed previously), we recorded a $4.0 million charge in cost of sales to write off the related inventory that will not be sold.
Other Income (Expense)
|
|
|
|
|
|
|
|
|
|
|
|
|
(in thousands) |
|
2009 |
|
2008 |
|
2007 |
|
|||
|
Interest income |
|
$ |
2,057 |
|
$ |
16,315 |
|
$ |
4,374 |
|
|
Interest expense |
|
|
(45,603 |
) |
|
(72,554 |
) |
|
(72,258 |
) |
|
Other |
|
|
(12,107 |
) |
|
(18,040 |
) |
|
(15,343 |
) |
|
Other income (expense), net |
|
$ |
(55,653 |
) |
$ |
(74,279 |
) |
$ |
(83,227 |
) |
The favorable change in other income (expense) during 2009 compared to 2008 was primarily driven by lower average outstanding debt balances in 2009, resulting in less interest expense. Partially offsetting the favorable change in other income (expense) was our recognition of an $8.3 million investment impairment charge to other expense. During 2009, we determined that the fair value of a cost method investment was below its carrying value and that the impairment was other-than-temporary. During 2008, we also recognized $12.9 million of pre-tax impairment charges as other expense related to a decline in the fair values of certain investments that were deemed to be other-than-temporary.
12
The favorable change in other income (expense) during 2008 compared to 2007 was the result of higher interest income driven by higher average invested cash balances compared to 2007. Interest expense for 2008 remained consistent with interest expense for 2007 as our average outstanding debt balance for both years remained consistent. During 2008, we recognized $12.9 million of pre-tax impairment charges discussed above. In 2007, we recognized a $25.1 million pre-tax impairment charge as other expense related to our investment in ProRhythm, Inc. (ProRhythm). This 2007 impairment charge was partially offset by a pre-tax gain of $7.9 million recognized as other income related to the sale of our Conor Medical, Inc. common stock investment.
Income Taxes
|
|
|
|
|
|
|
|
|
|
(as a percent of pre-tax income) |
|
2009 |
|
2008 |
|
2007 |
|
|
Effective tax rate |
|
26.5 |
% |
39.2 |
% |
24.3 |
% |
Our effective tax rate differs from our U.S. federal statutory 35% tax rate because certain operations are subject to tax incentives, state and local taxes and foreign taxes that are different from the U.S. federal statutory rate. Our effective tax rate is also impacted by discrete factors or events such as IPR&D charges, special charges, impairment charges or the resolution of audits by tax authorities.
Our effective tax rate was 26.5% in 2009 compared to 39.2% in 2008 and 24.3% in 2007. Special charges, deductible IPR&D charges and an investment impairment charge favorably impacted the 2009 effective tax rate by 0.4 percentage points. In 2008, non-deductible IPR&D charges, special charges and investment impairment charges unfavorably impacted the 2008 effective tax rate by 12.2 percentage points. In 2007, special charges and investment impairment charges favorably impacted the 2007 effective tax rate by 2.3 percentage points. Refer to Purchased In-Process Research and Development (IPR&D) Charges, Special Charges and Other Income (Expense) sections above for further details regarding these charges.
The Federal Research and Development tax credit (R&D tax credit), which provides a tax benefit on certain incremental R&D expenditures, expired on December 31, 2009. Legislation to retroactively reinstate the R&D tax credit is pending in the U.S. Congress, however, it was not enacted and signed into law as of February 24, 2010. We estimate that our 2010 effective tax rate could be unfavorably impacted by approximately 2 percentage points if the R&D tax credit is not enacted into law for fiscal year 2010.
Net Earnings
|
|
|
|
|
|
|
|
|
|
|
|
|
|
|
|
|
|
|
|
|
|
|
|
|
|
|
2009 vs. 2008 |
|
2008 vs. 2007 |
|
|||||
|
(in thousands, except per share amounts) |
|
2009 |
|
2008 |
|
2007 |
|
% Change |
|
% Change |
|
|||||
|
Net earnings |
|
$ |
777,226 |
|
$ |
353,018 |
|
$ |
537,756 |
|
|
120.2 |
% |
|
-34.4 |
% |
|
Diluted net earnings per share |
|
$ |
2.26 |
|
$ |
1.01 |
|
$ |
1.53 |
|
|
123.8 |
% |
|
-34.0 |
% |
Our 2009 net earnings of $777.2 million and diluted net earnings per share of $2.26 increased compared to 2008 net earnings of $353.0 million and diluted net earnings per share of $1.01. Compared to 2008, our net earnings and diluted net earnings per share benefited from continued net sales growth in all of our operating segments. Net earnings for 2009 included after-tax special charges of $76.4 million, an after-tax investment impairment charge of $5.2 million and after-tax IPR&D charges of $3.7 million for a combined impact of $85.3 million, or $0.25 per diluted share. Net earnings for 2008 included IPR&D charges of $319.4 million, after-tax special charges of $72.7 million and after-tax investment impairment charges of $8.0 million for a combined impact of $400.1 million, or $1.15 per diluted share.
Net earnings were $353.0 million in 2008, a 34.4% decrease over 2007 net earnings of $537.8 million. Diluted net earnings per share were $1.01 in 2008, a 34.0% decrease over 2007 diluted net earnings per share of $1.53. Net earnings for 2008 included IPR&D charges of $319.4 million, after-tax special charges of $72.7 million and after-tax investment impairment charges of $8.0 million for a combined impact of $400.1 million, or $1.15 per diluted share. Net earnings for 2007 included after-tax special charges of $77.2 million and an after-tax investment impairment charge of $15.7 million, for a combined impact of $92.9 million, or $0.26 per diluted share. Compared to 2007, our 2008 net earnings and diluted net earnings per share benefited from increased net sales growth in all of our operating segments with net sales in our CRM and AF operating segments growing 14% and 33%, respectively.
13
LIQUIDITY
We believe that our available borrowing capacity under our $1.0 billion long-term committed credit facility (Credit Facility) and related commercial paper program, existing cash balances and future cash generated from operations will be sufficient to meet our working capital, capital investment and debt service requirements over the next twelve months and in the foreseeable future thereafter. Although we believe that our earnings, cash flows and balance sheet position will permit us to obtain additional debt financing or equity capital should suitable investment opportunities arise, recent disruptions in the global financial markets may adversely impact the availability and cost of capital. As of January 2, 2010, we had $1.0 billion of available borrowing capacity under our Credit Facility and related commercial paper program. Our short-term credit ratings are A1 from Standard & Poor’s, P2 from Moody’s and F1 from Fitch. The ratings are not a recommendation to buy, sell or hold our securities, may be changed, superseded or withdrawn at any time and should be evaluated independently of any other rating.
At January 2, 2010, a portion of our cash and cash equivalents was held by our non-U.S. subsidiaries. These funds are only available for use by our U.S. operations if they are repatriated into the United States. The funds repatriated would be subject to additional U.S. taxes upon repatriation; however, it is not practical to estimate the amount of additional U.S. tax liabilities we would incur. We currently have no plans to repatriate funds held by our non-U.S. subsidiaries.
We use two primary measures that focus on accounts receivable and inventory – days sales outstanding (DSO) and days inventory on hand (DIOH). We use DSO as a measure that places emphasis on how quickly we collect our accounts receivable balances from customers. We use DIOH, which can also be expressed as a measure of the estimated number of days of cost of sales on hand, as a measure that places emphasis on how efficiently we are managing our inventory levels. These measures may not be computed the same as similarly titled measures used by other companies. Our DSO (ending net accounts receivable divided by average daily sales for the quarter) remained consistent year over year, increasing from 88 days at January 3, 2009 to 89 days at January 2, 2010. Our DIOH (ending net inventory divided by average daily cost of sales for the most recent six months) increased from 160 days at January 3, 2009 to 184 days at January 2, 2010. Special charges recognized in cost of sales in the fourth quarter of 2008 reduced our January 3, 2009 DIOH by 19 days. Special charges recognized in cost of sales in the second half of 2009 reduced our January 2, 2010 DIOH by 10 days. The remaining year over year increase in DIOH since January 3, 2009 was the result of higher inventory levels due to new product introductions and lower than expected 2009 net sales in the second half of the year.
A summary of our cash flows from operating, investing and financing activities is provided in the following table (in thousands):
|
|
|
|
|
|
|
|
|
|
|
|
|
|
|
2009 |
|
2008 |
|
2007 |
|
|||
|
Net cash provided by (used in): |
|
|
|
|
|
|
|
|
|
|
|
Operating activities |
|
$ |
868,875 |
|
$ |
945,592 |
|
$ |
865,569 |
|
|
Investing activities |
|
|
(490,585 |
) |
|
(871,073 |
) |
|
(306,315 |
) |
|
Financing activities |
|
|
(130,696 |
) |
|
(322,493 |
) |
|
(259,484 |
) |
|
Effect of currency exchange rate changes on cash and cash equivalents |
|
|
8,890 |
|
|
(4,677 |
) |
|
9,436 |
|
|
Net increase (decrease) in cash and cash equivalents |
|
$ |
256,484 |
|
$ |
(252,651 |
) |
$ |
309,206 |
|
Cash Flows from
Operating Activities
Cash provided by operating activities was $868.9 million for 2009
compared to $945.6 million for 2008 and $865.6 million for 2007. Operating cash
flows can fluctuate significantly from period to period due to payment timing
differences of working capital accounts such as accounts receivable, accounts
payable, accrued liabilities and income taxes payable.
Cash Flows from
Investing Activities
Cash used in investing activities was $490.6 million in 2009 compared to
$871.1 million in 2008 and $306.3 million in 2007. Our purchases of property,
plant and equipment, which totaled $326.4 million, $343.9 million and $287.2
million in 2009, 2008 and 2007, respectively, reflect our continued investment
in our product growth platforms currently in place. During 2009, we made a
second scheduled acquisition payment of $113.8 million for MediGuide. During
2008, we spent $490.0 million of net cash consideration on acquisitions, with
Radi Medical Systems, MediGuide and EP MedSystems being the most significant.
During 2007, we received proceeds of $12.9 million due to liquidating our
minority interest in Conor Medical, Inc., as a result of its acquisition by
Johnson & Johnson.
14
Cash Flows from
Financing Activities
Cash used in financing activities was $130.7 million in 2009 compared to
$322.5 million in 2008 and $259.5 million in 2007. Our financing cash flows can
fluctuate significantly depending upon our liquidity needs and the amount of
stock option exercises and the extent of our common stock repurchases. During
2009, we issued $1.2 billion of Senior Notes, made borrowings of $180.0 million
under a 3-year unsecured term loan and repaid all of our commercial paper
borrowings (net $19.4 million) and outstanding borrowings of $500.0 million
under our $1.0 billion long-term committed Credit Facility. Additionally, we
repurchased $1.0 billion of our common stock, which was financed with both
proceeds from the issuance of our Senior Notes and cash generated from
operations. In December 2009, we voluntarily repaid 1.5 billion Japanese Yen
under a 3-year unsecured term loan totaling 8.0 billion, resulting in an
outstanding balance of 6.5 billion Japanese Yen at January 2, 2010 (the
equivalent of $70.7 million at January 2, 2010).
During 2008, we borrowed $500.0 million from our $1.0 billion long-term committed Credit Facility to fund the repayment of our $1.2 billion 1.22% Convertible Debentures. Additionally, we entered into a 3-year, unsecured term loan totaling $360.0 million and a 3-year, unsecured term loan totaling 8.0 billion Japanese Yen (the equivalent of $88.2 million at January 3, 2009). During 2008, we also used our outstanding cash balances to repurchase $300.0 million of our common stock.
During 2007, we repurchased approximately $1.0 billion of our common stock, which was financed through a combination of a portion of the proceeds from the issuance of $1.2 billion of convertible debentures, proceeds from the issuance of commercial paper and borrowings under an interim liquidity facility. Approximately $700 million of proceeds from the issuance of the convertible debentures were used to repay commercial paper borrowings and borrowings under an interim liquidity facility. Proceeds from stock options exercised and stock issued, inclusive of the related excess tax benefits, provided $152.6 million, $215.0 million and $284.7 million of cash inflows during 2009, 2008 and 2007, respectively. Proceeds from stock options exercised and stock issued can fluctuate significantly based upon, among other things, the amount and exercise price of stock options exercised and the fair market value of our common stock when stock options are exercised.
DEBT AND CREDIT FACILITIES
Total debt increased to $1,922.4 million at January 2, 2010 from $1,201.6 million at January 3, 2009 primarily due to the Company’s issuance of the $1.2 billion Senior Notes.
We have a long-term $1.0 billion committed Credit Facility used to support our commercial paper program and for general corporate purposes. Borrowings under this facility bear interest at the United States Prime Rate (Prime Rate) or the United States Dollar London InterBank Offered Rate (LIBOR) plus 0.235%, at our election. In the event over half of the Credit Facility is drawn upon, an additional five basis points is added to the elected Prime or LIBOR rate. The interest rates are subject to adjustment in the event of a change in our credit ratings. There were no outstanding borrowings under the Credit Facility as of January 2, 2010, as we repaid $500.0 million of borrowings in August 2009 with the net proceeds from the issuance of the Senior Notes.
Our commercial paper program provides for the issuance of short-term, unsecured commercial paper with maturities up to 270 days. During the first quarter of 2009, we repaid a net $19.4 million of our commercial paper borrowings. As of January 2, 2010, we had no outstanding commercial paper borrowings. Any future commercial paper borrowings would bear interest at the applicable then-current market rates. We annually have only issued commercial paper up to the amount of our available borrowings capacity under the Credit Facility, as such commercial paper has lower interest rates.
In July 2009, we issued $700.0 million aggregate principal amount of 5-year, 3.75% Senior Notes and $500.0 million aggregate principal amount of 10-year, 4.875% Senior Notes. In August 2009, we used $500.0 million of the net proceeds from the Senior Notes to repay all amounts outstanding under our Credit Facility. Additionally, we repurchased $1.0 billion of our outstanding common stock under two different authorized share repurchase programs using both net proceeds from the issuance of our Senior Notes and available cash generated from operations. As of January 2, 2010, the outstanding balance of the 2014 Senior Notes was $699.0 million and the outstanding balance of the 2019 Senior Notes was $493.9 million. Interest payments are required on a semi-annual basis. We may redeem the Senior Notes at any time at the applicable redemption price. The Senior Notes are senior unsecured obligations and rank equally with all of our existing and future senior unsecured indebtedness.
In December 2008, we entered into a 3-year, unsecured term loan (2011 Term Loan), which can be used for general corporate purposes or to refinance certain other outstanding borrowings of the Company. The 2011 Term Loan bears interest at LIBOR plus 2.0%, although we may also elect the Prime Rate plus 1.0%, which is subject to adjustment in the event of a change in our credit ratings. We are required to make quarterly principal payments in the amount of 5% ($27.0 million) of the total borrowings. Accordingly, we made $108.0 million of principal payments during 2009. As of January 2, 2010, we had total borrowings of $432.0 million under the 2011 Term Loan.
15
In December 2008, we entered into a 3-year, Yen-denominated unsecured term loan in Japan (Yen Term Loan) totaling 8.0 billion Japanese Yen (the equivalent of $88.2 million at January 3, 2009). In December 2009, we voluntarily repaid 1.5 billion Japanese Yen, resulting in an outstanding balance of 6.5 billion Japanese Yen at January 2, 2010 (the equivalent of $70.7 million at January 2, 2010). We can initiate future borrowings up to the 8.0 billion Japanese Yen term loan amount. The borrowings bear interest at the Yen LIBOR plus 2.0%. Interest payments are required on a semi-annual basis and the entire principal balance is due in December 2011. The principal amount recorded on the balance sheet for the Yen Term Loan fluctuates based on the effects of foreign currency translation.
In May 2003, we issued 7-year, 1.02% Yen-denominated notes in Japan (Yen Notes) totaling 20.9 billion Yen (the equivalent of $226.8 million at January 2, 2010 and $230.1 million at January 3, 2009). Interest payments are required on a semi-annual basis and the entire principal balance is due in May 2010. The principal amount for the Yen Notes recorded on our balance sheet fluctuates based on the effects of foreign currency translation.
Our Credit Facility, 2011 Term Loan and Yen Notes contain certain operating and financial covenants. Specifically, the Credit Facility and 2011 Term Loan require that we have a leverage ratio (defined as the ratio of total debt to EBITDA (net earnings before interest, income taxes, depreciation and amortization)) not exceeding 3.0 to 1.0. The Yen Notes require that we have a ratio of total debt to total capitalization not exceeding 55% and a ratio of consolidated EBIT (net earnings before interest and income taxes) to consolidated interest expense of at least 3.0 to 1.0. Under the Credit Facility, 2011 Term Loan, Senior Notes and Yen Notes we also have certain limitations on how we conduct our business, including limitations on additional liens or indebtedness and limitations on certain acquisitions, mergers, investments and dispositions of assets. We were in compliance with all of our debt covenants as of January 2, 2010.
SHARE REPURCHASES
On October 22, 2009, our Board of Directors authorized a share repurchase program of up to $500.0 million of our outstanding common stock. We completed the repurchases under the program on December 11, 2009. In total, we repurchased 14.1 million shares for $500.0 million at an average repurchase price of $35.44 per share. On July 21, 2009, our Board of Directors authorized a share repurchase program of up to $500.0 million of our outstanding common stock. We completed the repurchases under the program on September 15, 2009. In total, we repurchased 13.0 million shares for $500.0 million at an average repurchase price of $38.32 per share. For fiscal year 2009, we repurchased a total of 27.1 million shares for $1.0 billion at an average repurchase price of $36.83 per share.
On February 22, 2008, our Board of Directors authorized a share repurchase program of up to $250.0 million of our outstanding common stock. On April 8, 2008, our Board of Directors authorized an additional $50.0 million of share repurchases as part of this share repurchase program. We completed the repurchases under the program on May 1, 2008. In total, we repurchased 6.7 million shares for $300.0 million at an average repurchase price of $44.51 per share.
DIVIDENDS
We did not declare or pay any cash dividends during 2009, 2008 or 2007. We currently intend to retain our earnings for use in the operation and expansion of our business and therefore do not anticipate paying any cash dividends in the foreseeable future.
OFF-BALANCE SHEET ARRANGEMENTS AND CONTRACTUAL OBLIGATIONS
We believe that our off-balance sheet arrangements do not have a material current or anticipated future effect on our consolidated earnings, financial position or cash flows. Our off-balance sheet arrangements principally consist of operating leases for various facilities and equipment, purchase commitments and contingent acquisition commitments.
In the normal course of business, we periodically enter into agreements that require us to indemnify customers or suppliers for specific risks, such as claims for injury or property damage arising out of our products or the negligence of our personnel or claims alleging that our products infringe third-party patents or other intellectual property. In addition, under our bylaws and indemnification agreements we have entered into with our executive officers and directors, we may be required to indemnify our executive officers and directors for losses arising from their conduct in an official capacity on behalf of St. Jude Medical. We may also be required to indemnify officers and directors of certain companies that we have acquired for losses arising from their conduct on behalf of their companies prior to the closing of our acquisition. Our maximum exposure under these indemnification obligations cannot be estimated, and we have not accrued any liabilities within our consolidated financial statements or included any indemnification provisions in our commitments table. Historically, we have not experienced significant losses on these types of indemnifications.
16
In addition to the amounts shown in the following table, our noncurrent liability for unrecognized tax benefits was $120.5 million as of January 2, 2010, and we are uncertain as to if or when such amounts may be settled. Related to these unrecognized tax benefits, our liability for potential penalties and interest was $28.3 million as of January 2, 2010.
A summary of contractual obligations and other minimum commercial commitments as of January 2, 2010 is as follows (in thousands):
|
|
|
|
|
|
|
|
|
|
|
|
|
|
|
|
|
|
|
|
|
Payments Due by Period |
|
|||||||||||||
|
|
|
Total |
|
Less than |
|
1-3 |
|
3-5 |
|
More than |
|
|||||
|
Contractual obligations related to off-balance sheet arrangements: |
|
|
|
|
|
|
|
|
|
|
|
|
|
|
|
|
|
Operating leases |
|
$ |
95,178 |
|
$ |
32,067 |
|
$ |
35,142 |
|
$ |
19,260 |
|
$ |
8,709 |
|
|
Purchase commitments (a) |
|
|
355,542 |
|
|
313,909 |
|
|
41,592 |
|
|
41 |
|
|
— |
|
|
Contingent consideration payments (b) |
|
|
142,417 |
|
|
60,689 |
|
|
60,115 |
|
|
921 |
|
|
20,692 |
|
|
Total |
|
$ |
593,137 |
|
$ |
406,665 |
|
$ |
136,849 |
|
$ |
20,222 |
|
$ |
29,401 |
|
|
|
|
|
|
|
|
|
|
|
|
|
|
|
|
|
|
|
|
Contractual obligations reflected in the balance sheet: |
|
|
|
|
|
|
|
|
|
|
|
|
|
|
|
|
|
Debt obligations (c) |
|
|
2,302,076 |
|
|
398,206 |
|
|
506,057 |
|
|
788,125 |
|
|
609,688 |
|
|
Total |
|
$ |
2,895,213 |
|
$ |
804,871 |
|
$ |
642,906 |
|
$ |
808,347 |
|
$ |
639,089 |
|
|
|
|
|
|
|
(a) |
These amounts include commitments for inventory purchases and capital expenditures that do not exceed our projected requirements and are in the normal course of business. The purchase commitment amounts do not represent the entire anticipated purchases and capital expenditures in the future, but only those for which we are contractually obligated. |
|
|
(b) |
These amounts include contingent commitments to acquire various businesses involved in the distribution of our products and other contingent acquisition consideration payments. In connection with certain acquisitions, we may agree to provide additional consideration payments upon the achievement of certain product development milestones, which may include but are not limited to: successful levels of achievement in clinical trials and certain product regulatory approvals. We may also provide for additional consideration payments to be made upon the achievement of certain levels of future product sales. While it is not certain if and/or when these payments will be made, we have included the payments in the table based on our best estimates of the dates when we expect the milestones and/or contingencies will be met. |
|
|
(c) |
Includes current debt obligations, scheduled maturities of long-term debt and scheduled interest payments. See Note 4 to the Consolidated Financial Statements for additional information on our debt obligations. |
MARKET RISK
We are exposed to foreign currency exchange rate fluctuations due to transactions denominated primarily in Euros, Japanese Yen, Canadian Dollars, Australian Dollars, Brazilian Reals, British Pounds, and Swedish Kronor. When the U.S. Dollar weakens against foreign currencies, the dollar value of sales denominated in foreign currencies increases. When the U.S. Dollar strengthens against foreign currencies, the dollar value of sales denominated in foreign currencies decreases. A hypothetical 10% change in the value of the U.S. Dollar in relation to our most significant foreign currency exposures would have had an impact of approximately $209.7 million on our 2009 net sales. This amount is not indicative of the hypothetical net earnings impact due to partially offsetting impacts on the related cost of sales and operating expenses in the applicable foreign currencies.
During 2009, we hedged a portion of our foreign currency exchange rate risk through the use of forward exchange contracts. We use forward exchange contracts to manage foreign currency exposures related to intercompany receivables and payables arising from intercompany purchases of manufactured products. These forward contracts are not designated as qualifying hedging relationships under ASC Topic 815, Derivatives and Hedging (ASC Topic 815). We measure our foreign currency exchange rate contracts at fair value on a recurring basis. The fair value of outstanding contracts was immaterial as of January 2, 2010. During 2009, the Company recorded a $6.7 million net loss to other income (expense) for its forward currency exchange contracts not designated as hedging instruments under ASC Topic 815. The net losses were almost entirely offset by corresponding net gains on the foreign currency exposures being managed. We do not enter into contracts for trading or speculative purposes. Our policy is to enter into hedging contracts with major financial institutions that have at least an “A” (or equivalent) credit rating. Although we are exposed to credit loss in the event of nonperformance by counterparties on our outstanding derivative contracts, we do not anticipate nonperformance by any of the counterparties. We did not enter into any hedging contracts during 2007. We continue to evaluate our foreign currency exchange rate risk and the different mechanisms for use in managing such risk, including using derivative financial instruments and operational hedges, such as international manufacturing operations. Our derivative financial instruments accounting policy is discussed in detail in Note 1 to the Consolidated Financial Statements.
17
Although we have not entered into any derivative hedging contracts to hedge the net asset exposure of our foreign subsidiaries, we have elected to use natural hedging strategies in certain geographies. We have naturally hedged a portion of our Yen-denominated net asset exposure by issuing long-term Yen-denominated debt.
We are also exposed to fair value risk on our Senior Notes and Yen Notes. As of January 2, 2010, the aggregate fair value of our Senior Notes (measured using quoted prices in active markets) was $1,216.8 million compared to the aggregate carrying value of $1,193.0 million. Our 2014 Senior Notes have a fixed interest rate of 3.75% and our 2019 Senior Notes have a fixed rate of interest of 4.875%. A hypothetical one-percentage point change in the interest rates would have an aggregate impact of approximately $65 million on the fair value of our Senior Notes. As of January 2, 2010, the fair value of our Yen Notes, which have a fixed interest rate of 1.02%, approximated their carrying value. A hypothetical one-percentage point change in its interest rate would have an impact of approximately $1 million on the fair value of the Yen Notes.
Our variable-rate debt consists of loans in the United States and Japan. Assuming average outstanding borrowings of $500 million during 2010, a hypothetical one-percentage point change in the interest rates (based upon a weighted average interest rate of 2.3% at January 2, 2010) would have an impact of approximately $5 million on our 2010 interest expense.
We are also exposed to equity market risk on our marketable equity security investments. We hold certain marketable equity securities of publically-traded companies. Our investments in these companies had a fair value of $31.7 million at January 2, 2010, which are subject to the underlying price risk of the public equity markets.
COMPETITION AND OTHER CONSIDERATIONS
We expect that market demand, government regulation and reimbursement policies, and societal pressures will continue to change the worldwide healthcare industry resulting in further business consolidations and alliances. We participate with industry groups to promote the use of advanced medical device technology in a cost-conscious environment.
The global medical technology industry is highly competitive and is characterized by rapid product development and technological change. Our products must continually improve technologically and provide improved clinical outcomes due to the competitive nature of the industry. In addition, competitors have historically employed litigation to gain a competitive advantage.
Competition is anticipated to continue to place pressure on pricing and terms. Also, healthcare reform may result in reduced Medicare provider reimbursement rates, the introduction and/or pilot of various new patient care and payment models, the establishment of reimbursement policies and rates based on clinical outcomes and cost effective treatments, and the institution of an excise tax on all medical devices, requiring the medical device industry to pay an estimated $20 billion in additional taxes over 10 years. Additionally, we believe healthcare reform will result in further hospital consolidations over time with related pressure on pricing and terms from our customers.
The CRM market is highly competitive. Our two principal competitors in these markets are larger than us and have invested substantial amounts in R&D. Rapid technological change in these markets is expected to continue, requiring us to invest heavily in R&D and to effectively market our products.
The cardiovascular market is also highly competitive with numerous competitors. The majority of our sales is generated from our vascular closure devices and heart valve replacement and repair products. We continue to hold the number one market position in the vascular closure device market; however, the market for vascular closure devices is highly competitive and there are several companies in addition to St. Jude Medical that manufacture and market these products worldwide. The cardiovascular market also includes cardiac surgery products such as mechanical heart valves, tissue heart valves and valve repair products, which are also highly competitive. Cardiac surgery therapies continue to shift to tissue valves and repair products from mechanical heart valves.
18
The atrial fibrillation therapy area is broadening to include multiple therapy methods and treatments which include drugs, percutaneous delivery of diagnostic and ablation catheters, external electrical cardioversion and defibrillation, implantable defibrillators and open-heart surgery. As a result, we have numerous competitors in the emerging atrial fibrillation market. Larger competitors have begun to expand their presence in the atrial fibrillation market by leveraging their cardiac rhythm management capabilities and through acquisitions.
The neuromodulation market is one of medical technology’s fastest growing segments. Competitive pressures will increase in the future as our two principal competitors attempt to secure and grow their positions in the neuromodulation market. Other companies are attempting and will attempt in the future to bring new products or therapies into this market. Barriers to entry for new competitors are high, due to a long and expensive product development and regulatory approval process as well as the intellectual property and patent positions existing in the market. However, other larger medical device companies may be able to enter the neuromodulation market by leveraging their existing medical device capabilities, thereby decreasing the time and resources required to enter the market.
We operate in an industry that is susceptible to significant product liability claims. These claims may be brought by individuals seeking relief for themselves or, increasingly, by groups seeking to represent a class. In addition, product liability claims may be asserted against us in the future relative to events that are not known to us at the present time.
For the period from June 15, 2008 through June 15, 2009, we maintained product liability policies which provided $350 million of insurance coverage, with a $50 million per occurrence deductible or a $100 million deductible if the claims were deemed an integrated occurrence under the policies. However, we decided to allow such product liability policies to lapse, and consistent with industry practice, do not currently maintain or intend to maintain any insurance policies with respect to product liability in the future. This decision was made based on current conditions in the insurance marketplace that have led to increasingly higher levels of self-insured retentions, increasing number of coverage limitations and high insurance premium rates. We will continue to monitor the insurance marketplace to evaluate the value to us of obtaining insurance coverage in the future. While based on historical loss trends, we believe that our self-insurance program will be adequate to cover future losses, we can provide no assurances that this will remain true as historical trends may not be indicative of future losses. These losses could have a material adverse impact on our consolidated earnings, financial condition or cash flows.
Group purchasing organizations, independent delivery networks and large single accounts, such as the Veterans Administration in the United States, continue to consolidate purchasing decisions for some of our hospital customers. We have contracts in place with many of these organizations. In some circumstances, our inability to obtain a contract with such an organization could adversely affect our efforts to sell our products to that organization’s hospitals.
CAUTIONARY STATEMENTS
In this discussion and in other written or oral statements made from time to time, we have included and may include statements that constitute “forward-looking statements” with respect to the financial condition, results of operations, plans, objectives, new products, future performance and business of St. Jude Medical, Inc. and its subsidiaries. Statements preceded by, followed by or that include words such as “may,” “will,” “expect,” “anticipate,” “continue,” “estimate,” “forecast”, “project,” “believe” or similar expressions are intended to identify some of the forward-looking statements within the meaning of the Private Securities Litigation Reform Act of 1995 and are included, along with this statement, for purposes of complying with the safe harbor provisions of that Act. These forward-looking statements involve risks and uncertainties. By identifying these statements for you in this manner, we are alerting you to the possibility that actual results may differ, possibly materially, from the results indicated by these forward-looking statements. We undertake no obligation to update any forward-looking statements. Actual results may differ materially from those contemplated by the forward-looking statements due to, among others, the risks and uncertainties discussed in the previous section entitled Off-Balance Sheet Arrangements and Contractual Obligations, Market Risk and Competition and Other Considerations and in Part I, Item 1A, Risk Factors of our Annual Report on Form 10-K as well as the various factors described below. Since it is not possible to foresee all such factors, you should not consider these factors to be a complete list of all risks or uncertainties. We believe the most significant factors that could affect our future operations and results are set forth in the list below.
19
|
|
|
|
|
|
1. |
Any legislative or administrative reform to the U.S. Medicare or Medicaid systems or international reimbursement systems that significantly reduces reimbursement for procedures using our medical devices or denies coverage for such procedures, as well as adverse decisions relating to our products by administrators of such systems on coverage or reimbursement issues. |
|
|
2. |
Assertion, acquisition or grant of key patents by or to others that have the effect of excluding us from market segments or requiring us to pay royalties. |
|
|
3. |
Economic factors, including inflation, contraction in capital markets, changes in interest rates, changes in tax laws and changes in foreign currency exchange rates. |
|
|
4. |
Product introductions by competitors that have advanced technology, better features or lower pricing. |
|
|
5. |
Price increases by suppliers of key components, some of which are sole-sourced. |
|
|
6. |
A reduction in the number of procedures using our devices caused by cost-containment pressures or the development of or preferences for alternative therapies. |
|
|
7. |
Safety, performance or efficacy concerns about our products, many of which are expected to be implanted for many years, leading to recalls and/or advisories with the attendant expenses and declining sales. |
|
|
8. |
Declining industry-wide sales caused by product recalls or advisories by our competitors that result in loss of physician and/or patient confidence in the safety, performance or efficacy of sophisticated medical devices in general and/or the types of medical devices recalled in particular. |
|
|
9. |
Changes in laws, regulations or administrative practices affecting government regulation of our products, such as FDA laws and regulations that increase the time and/or expense of obtaining approval for products or impose additional burdens on the manufacture and sale of medical devices. |
|
|
10. |
Regulatory actions arising from concern over Bovine Spongiform Encephalopathy, sometimes referred to as “mad cow disease,” that have the effect of limiting our ability to market products using bovine collagen, such as Angio-Seal™, or products using bovine pericardial material, such as our Biocor® and Epic™ tissue heart valves, or that impose added costs on the procurement of bovine collagen or bovine pericardial material. |
|
|
11. |
The intent and ability of our product liability insurers to meet their obligations to us, including losses related to our Silzone® litigation, and our ability to fund future product liability losses related to claims made subsequent to becoming self-insured. |
|
|
12. |
Severe weather or other natural disasters that cause damage to the facilities of our critical suppliers or one or more of our facilities, such as an earthquake affecting our facilities in California or a hurricane affecting our facilities in Puerto Rico. |
|
|
13. |
Healthcare industry changes leading to demands for price concessions and/or limitations on, or the elimination of, our ability to sell in significant market segments. |
|
|
14. |
Adverse developments in investigations and governmental proceedings, including the investigation of business practices in the cardiac rhythm management industry by the U.S. Attorney’s Office in Boston. |
|
|
15. |
Adverse developments in litigation, including product liability litigation, patent or other intellectual property litigation or shareholder litigation. |
|
|
16. |
Inability to successfully integrate the businesses that we have acquired in recent years and that we plan to acquire. |
|
|
17. |
Failure to successfully complete clinical trials for new indications for our products and/or failure to successfully develop markets for such new indications. |
|
|
18. |
Changes in accounting rules that adversely affect the characterization of our results of operations, financial position or cash flows. |
|
|
19. |
The disruptions in the financial markets and the economic downturn that adversely impact the availability and cost of credit and customer purchasing and payment patterns. |
|
|
20. |
Conditions imposed in resolving, or any inability to timely resolve, any regulatory issues raised by the FDA, including Form 483 observations or warning letters, as well as risks generally associated with our regulatory compliance and quality systems. |
|
|
21. |
Governmental legislation and/or regulation that significantly impacts the healthcare system in the United States and that results in lower reimbursement for our products, reduces medical procedure volumes or otherwise adversely affects our business and results of operations, including the imposition of an excise tax or other fee on certain medical devices. |
20
Report of Management
Management’s Report on the Financial Statements
We are responsible for the preparation, integrity and objectivity of the accompanying financial statements. The financial statements were prepared in accordance with accounting principles generally accepted in the United States and include amounts which reflect management’s best estimates based on its informed judgment and consideration given to materiality. We are also responsible for the accuracy of the related data in the annual report and its consistency with the financial statements.
Audit Committee Oversight
The adequacy of our internal accounting controls, the accounting principles employed in our financial reporting and the scope of independent and internal audits are reviewed by the Audit Committee of the Board of Directors, consisting solely of independent directors. The independent registered public accounting firm meets with, and has confidential access to, the Audit Committee to discuss the results of its audit work.
Management’s Report on Internal Control Over Financial Reporting
Management is responsible for establishing and maintaining adequate internal control over financial reporting, as such term is defined in Exchange Act Rules 13a-15(f). Under the supervision and with the participation of the Company’s management, including the CEO and the CFO, we conducted an evaluation of the effectiveness of our internal control over financial reporting based on the framework in Internal Control – Integrated Framework issued by the Committee of Sponsoring Organizations of the Treadway Commission. Based on this evaluation, the CEO and CFO concluded that our internal control over financial reporting was effective as of January 2, 2010. Ernst & Young LLP, our independent registered public accounting firm, has also audited the effectiveness of the Company’s internal control over financial reporting as of January 2, 2010 as stated in its report which is included herein.
|
|
|
/s/ Daniel J. Starks |
|
|
|
Daniel J. Starks |
|
Chairman, President and Chief Executive Officer |
|
|
|
/s/ John C. Heinmiller |
|
|
|
John C. Heinmiller |
|
Executive Vice President and Chief Financial Officer |
21
Report of Independent Registered Public Accounting Firm
The Board of
Directors and Shareholders
of St. Jude Medical, Inc.
We have audited St. Jude Medical, Inc.’s internal control over financial reporting as of January 2, 2010, based on criteria established in Internal Control – Integrated Framework issued by the Committee of Sponsoring Organizations of the Treadway Commission (the COSO criteria). St. Jude Medical, Inc.’s management is responsible for maintaining effective internal control over financial reporting, and for its assessment of the effectiveness of internal control over financial reporting included in the accompanying report of management titled Management’s Report on Internal Control Over Financial Reporting. Our responsibility is to express an opinion on St. Jude Medical, Inc.’s internal control over financial reporting based on our audit.
We conducted our audit in accordance with the standards of the Public Company Accounting Oversight Board (United States). Those standards require that we plan and perform the audit to obtain reasonable assurance about whether effective internal control over financial reporting was maintained in all material respects. Our audit included obtaining an understanding of internal control over financial reporting, assessing the risk that a material weakness exists, testing and evaluating the design and operating effectiveness of internal control based on the assessed risk, and performing such other procedures as we considered necessary in the circumstances. We believe that our audit provides a reasonable basis for our opinion.
A company’s internal control over financial reporting is a process designed to provide reasonable assurance regarding the reliability of financial reporting and the preparation of financial statements for external purposes in accordance with generally accepted accounting principles. A company’s internal control over financial reporting includes those policies and procedures that (1) pertain to the maintenance of records that, in reasonable detail, accurately and fairly reflect the transactions and dispositions of the assets of the company; (2) provide reasonable assurance that transactions are recorded as necessary to permit preparation of financial statements in accordance with generally accepted accounting principles, and that receipts and expenditures of the company are being made only in accordance with authorizations of management and directors of the company; and (3) provide reasonable assurance regarding prevention or timely detection of unauthorized acquisition, use, or disposition of the company’s assets that could have a material effect on the financial statements.
Because of its inherent limitations, internal control over financial reporting may not prevent or detect misstatements. Also, projections of any evaluation of effectiveness to future periods are subject to the risk that controls may become inadequate because of changes in conditions, or that the degree of compliance with the policies or procedures may deteriorate.
In our opinion, St. Jude Medical, Inc. maintained, in all material respects, effective internal control over financial reporting as of January 2, 2010, based on the COSO criteria.
We also have audited, in accordance with the standards of the Public Company Accounting Oversight Board (United States), the consolidated balance sheets of St. Jude Medical, Inc. as of January 2, 2010 and January 3, 2009, and the related consolidated statements of earnings, shareholders’ equity, and cash flows for each of the three fiscal years in the period ended January 2, 2010, and our report dated March 2, 2010, expressed an unqualified opinion thereon.
/s/ Ernst & Young LLP
Minneapolis,
Minnesota
March 2, 2010
22
Report of Independent Registered Public Accounting Firm
The Board of
Directors and Shareholders
of St. Jude Medical, Inc.
We have audited the accompanying consolidated balance sheets of St. Jude Medical, Inc. as of January 2, 2010 and January 3, 2009, and the related consolidated statements of earnings, shareholders’ equity, and cash flows for each of the three fiscal years in the period ended January 2, 2010. These financial statements are the responsibility of the Company’s management. Our responsibility is to express an opinion on these financial statements based on our audits.
We conducted our audits in accordance with the standards of the Public Company Accounting Oversight Board (United States). Those standards require that we plan and perform the audit to obtain reasonable assurance about whether the financial statements are free of material misstatement. An audit includes examining, on a test basis, evidence supporting the amounts and disclosures in the financial statements. An audit also includes assessing the accounting principles used and significant estimates made by management, as well as evaluating the overall financial statement presentation. We believe that our audits provide a reasonable basis for our opinion.
In our opinion, the financial statements referred to above present fairly, in all material respects, the consolidated financial position of St. Jude Medical, Inc. at January 2, 2010 and January 3, 2009, and the consolidated results of its operations and its cash flows for each of the three fiscal years in the period ended January 2, 2010, in conformity with U.S. generally accepted accounting principles.
We also have audited, in accordance with the standards of the Public Company Accounting Oversight Board (United States), St. Jude Medical Inc.’s internal control over financial reporting as of January 2, 2010, based on criteria established in Internal Control – Integrated Framework issued by the Committee of Sponsoring Organizations of the Treadway Commission, and our report dated March 2, 2010, expressed an unqualified opinion thereon.
/s/ Ernst & Young LLP
Minneapolis,
Minnesota
March 2, 2010
23
CONSOLIDATED STATEMENTS OF EARNINGS
(in thousands, except per share amounts)
|
|
|
|
|
|
|
|
|
|
|
|
|
Fiscal Year Ended |
|
January 2, 2010 |
|
January 3, 2009 |
|
December 29, 2007 |
|
|||
|
Net sales |
|
$ |
4,681,273 |
|
$ |
4,363,251 |
|
$ |
3,779,277 |
|
|
Cost of sales: |
|
|
|
|
|
|
|
|
|
|
|
Cost of sales before special charges |
|
|
1,219,624 |
|
|
1,105,938 |
|
|
1,003,302 |
|
|
Special charges |
|
|
33,761 |
|
|
64,603 |
|
|
38,292 |
|
|
Total cost of sales |
|
|
1,253,385 |
|
|
1,170,541 |
|
|
1,041,594 |
|
|
Gross profit |
|
|
3,427,888 |
|
|
3,192,710 |
|
|
2,737,683 |
|
|
|
|
|
|
|
|
|
|
|
|
|
|
Selling, general and administrative expense |
|
|
1,675,251 |
|
|
1,636,526 |
|
|
1,382,466 |
|
|
Research and development expense |
|
|
559,766 |
|
|
531,799 |
|
|
476,332 |
|
|
Purchased in-process research and development charges |
|
|
5,842 |
|
|
319,354 |
|
|
— |
|
|
Special charges |
|
|
73,983 |
|
|
49,984 |
|
|
85,382 |
|
|
Operating profit |
|
|
1,113,046 |
|
|
655,047 |
|
|
793,503 |
|
|
|
|
|
|
|
|
|
|
|
|
|
|
Other income (expense), net |
|
|
(55,653 |
) |
|
(74,279 |
) |
|
(83,227 |
) |
|
Earnings before income taxes |
|
|
1,057,393 |
|
|
580,768 |
|
|
710,276 |
|
|
|
|
|
|
|
|
|
|
|
|
|
|
Income tax expense |
|
|
280,167 |
|
|
227,750 |
|
|
172,520 |
|
|
|
|
|
|
|
|
|
|
|
|
|
|
Net earnings |
|
$ |
777,226 |
|
$ |
353,018 |
|
$ |
537,756 |
|
|
|
|
|
|
|
|
|
|
|
|
|
|
Net earnings per share: |
|
|
|
|
|
|
|
|
|
|
|
Basic |
|
$ |
2.28 |
|
$ |
1.03 |
|
$ |
1.57 |
|
|
Diluted |
|
$ |
2.26 |
|
$ |
1.01 |
|
$ |
1.53 |
|
|
|
|
|
|
|
|
|
|
|
|
|
|
Weighted average shares outstanding: |
|
|
|
|
|
|
|
|
|
|
|
Basic |
|
|
340,880 |
|
|
342,888 |
|
|
342,103 |
|
|
Diluted |
|
|
344,359 |
|
|
349,722 |
|
|
352,444 |
|
See notes to the consolidated financial statements.
24
CONSOLIDATED
BALANCE SHEETS
(in thousands, except share amounts)
|
|
|
|
|
|
|
|
|
|
|
|
January 2, 2010 |
|
January 3, 2009 |
|
||
|
ASSETS |
|
|
|
|
|
|
|
|
Current Assets |
|
|
|
|
|
|
|
|
Cash and cash equivalents |
|
$ |
392,927 |
|
$ |
136,443 |
|
|
Accounts receivable, less allowances for doubtful accounts |
|
|
1,170,579 |
|
|
1,101,258 |
|
|
Inventories |
|
|
659,960 |
|
|
546,499 |
|
|
Deferred income taxes, net |
|
|
164,738 |
|
|
137,042 |
|
|
Other current assets |
|
|
172,002 |
|
|
158,821 |
|
|
Total current assets |
|
|
2,560,206 |
|
|
2,080,063 |
|
|
|
|
|
|
|
|
|
|
|
Property, Plant and Equipment |
|
|
|
|
|
|
|
|
Land, buildings and improvements |
|
|
424,310 |
|
|
386,519 |
|
|
Machinery and equipment |
|
|
1,188,614 |
|
|
918,254 |
|
|
Diagnostic equipment |
|
|
336,492 |
|
|
371,206 |
|
|
Property, plant and equipment at cost |
|
|
1,949,416 |
|
|
1,675,979 |
|
|
Less accumulated depreciation |
|
|
(796,330 |
) |
|
(695,803 |
) |
|
Net property, plant and equipment |
|
|
1,153,086 |
|
|
980,176 |
|
|
|
|
|
|
|
|
|
|
|
Goodwill |
|
|
2,005,851 |
|
|
1,984,566 |
|
|
Other intangible assets, net |
|
|
456,142 |
|
|
493,535 |
|
|
Other assets |
|
|
250,526 |
|
|
184,164 |
|
|
TOTAL ASSETS |
|
$ |
6,425,811 |
|
$ |
5,722,504 |
|
|
|
|
|
|
|
|
|
|
|
LIABILITIES AND SHAREHOLDERS’ EQUITY |
|
|
|
|
|
|
|
|
Current Liabilities |
|
|
|
|
|
|
|
|
Current debt obligations |
|
$ |
334,787 |
|
$ |
75,518 |
|
|
Accounts payable |
|
|
132,543 |
|
|
238,310 |
|
|
Income taxes payable |
|
|
13,498 |
|
|
17,608 |
|
|
Accrued expenses |
|
|
|
|
|
|
|
|
Employee compensation and related benefits |
|
|
269,293 |
|
|
297,287 |
|
|
Other |
|
|
317,192 |
|
|
399,801 |
|
|
Total current liabilities |
|
|
1,067,313 |
|
|
1,028,524 |
|
|
|
|
|
|
|
|
|
|
|
Long-term debt |
|
|
1,587,615 |
|
|
1,126,084 |
|
|
Deferred income taxes, net |
|
|
132,392 |
|
|
112,231 |
|
|
Other liabilities |
|
|
314,940 |
|
|
219,759 |
|
|
Total liabilities |
|
|
3,102,260 |
|
|
2,486,598 |
|
|
|
|
|
|
|
|
|
|
|
Commitments and Contingencies (Note 5) |
|
|
— |
|
|
— |
|
|
|
|
|
|
|
|
|
|
|
Shareholders’ Equity |
|
|
|
|
|
|
|
|
Preferred stock |
|
|
— |
|
|
— |
|
|
Common stock (324,537,581 and 345,332,272 shares issued and outstanding at January 2, 2010 and January 3, 2009, respectively) |
|
|
32,454 |
|
|
34,533 |
|
|
Additional paid-in capital |
|
|
5,860 |
|
|
219,041 |
|
|
Retained earnings |
|
|
3,191,203 |
|
|
2,977,630 |
|
|
Accumulated other comprehensive income (loss): |
|
|
|
|
|
|
|
|
Cumulative translation adjustment |
|
|
82,033 |
|
|
(1,023 |
) |
|
Unrealized gain on available-for-sale securities |
|
|
12,001 |
|
|
6,136 |
|
|
Unrealized loss on derivative financial instruments |
|
|
— |
|
|
(411 |
) |
|
Total shareholders’ equity |
|
|
3,323,551 |
|
|
3,235,906 |
|
|
TOTAL LIABILITIES AND SHAREHOLDERS’ EQUITY |
|
$ |
6,425,811 |
|
$ |
5,722,504 |
|
See notes to the consolidated financial statements.
25
CONSOLIDATED STATEMENTS OF SHAREHOLDERS’ EQUITY
(in thousands, except share amounts)
|
|
|
|
|
|
|
|
|
|
|
|
|
|
|
|
|
|
|
|
|
|
|
|
|
|
|
|
|
|
Accumulated |
|
|
|
||||||||
|
|
|
Common Stock |
|
Additional |
|
|
|
|
Total |
|
|||||||||
|
|
|
Number of |
|
Amount |
|
|
Retained |
|
|
|
|||||||||
|
Balance at December 30, 2006 |
|
|
353,932,000 |
|
$ |
35,393 |
|
$ |
100,173 |
|
$ |
2,787,331 |
|
$ |
46,329 |
|
$ |
2,969,226 |
|
|
Comprehensive income: |
|
|
|
|
|
|
|
|
|
|
|
|
|
|
|
|
|
|
|
|
Net earnings |
|
|
|
|
|
|
|
|
|
|
|
537,756 |
|
|
|
|
|
537,756 |
|
|
Other comprehensive income (loss): |
|
|
|
|
|
|
|
|
|
|
|
|
|
|
|
|
|
|
|
|
Unrealized loss on available-for-sale securities, net of taxes of $(3,343) |
|
|
|
|
|
|
|
|
|
|
|
|
|
|
(5,766 |
) |
|
(5,766 |
) |
|
Reclassification of realized gain on available-for-sale securities to net earnings, net of taxes of $3,013 |
|
|
|
|
|
|
|
|
|
|
|
|
|
|
(4,916 |
) |
|
(4,916 |
) |
|
Foreign currency translation adjustment, net of taxes of $(4,227) |
|
|
|
|
|
|
|
|
|
|
|
|
|
|
63,511 |
|
|
63,511 |
|
|
Other comprehensive income |
|
|
|
|
|
|
|
|
|
|
|
|
|
|
|
|
|
52,829 |
|
|
Comprehensive income |
|
|
|
|
|
|
|
|
|
|
|
|
|
|
|
|
|
590,585 |
|
|
Equity conversion option on convertible debentures, net of taxes of $31,411 |
|
|
|
|
|
|
|
|
52,352 |
|
|
|
|
|
|
|
|
52,352 |
|
|
Repurchases of common stock |
|
|
(23,619,400 |
) |
|
(2,361 |
) |
|
(296,091 |
) |
|
(701,415 |
) |
|
|
|
|
(999,867 |
) |
|
Stock-based compensation |
|
|
|
|
|
|
|
|
54,540 |
|
|
|
|
|
|
|
|
54,540 |
|
|
Common stock issued under stock plans and other, net |
|
|
12,534,363 |
|
|
1,253 |
|
|
185,564 |
|
|
|
|
|
|
|
|
186,817 |
|
|
Tax benefit from stock plans |
|
|
|
|
|
|
|
|
125,234 |
|
|
|
|
|
|
|
|
125,234 |
|
|
Cumulative effect adjustment for adoption of FIN 48 |
|
|
|
|
|
|
|
|
|
|
|
8,542 |
|
|
|
|
|
8,542 |
|
|
Purchase of call options, net of taxes of $(37,890) |
|
|
|
|
|
|
|
|
(63,150 |
) |
|
|
|
|
|
|
|
(63,150 |
) |
|
Proceeds from the sale of warrants |
|
|
|
|
|
|
|
|
35,040 |
|
|
|
|
|
|
|
|
35,040 |
|
|
Balance at December 29, 2007 |
|
|
342,846,963 |
|
$ |
34,285 |
|
$ |
193,662 |
|
$ |
2,632,214 |
|
$ |
99,158 |
|
$ |
2,959,319 |
|
|
Comprehensive income: |
|
|
|
|
|
|
|
|
|
|
|
|
|
|
|
|
|
|
|
|
Net earnings |
|
|
|
|
|
|
|
|
|
|
|
353,018 |
|
|
|
|
|
353,018 |
|
|
Other comprehensive loss: |
|
|
|
|
|
|
|
|
|
|
|
|
|
|
|
|
|
|
|
|
Unrealized loss on available-for-sale securities, net of taxes of $(3,675) |
|
|
|
|
|
|
|
|
|
|
|
|
|
|
(6,268 |
) |
|
(6,268 |
) |
|
Unrealized loss on derivative financial instruments, net of taxes of $(247) |
|
|
|
|
|
|
|
|
|
|
|
|
|
|
(411 |
) |
|
(411 |
) |
|
Foreign currency translation adjustment, net of taxes of $(4,281) |
|
|
|
|
|
|
|
|
|
|
|
|
|
|
(87,777 |
) |
|
(87,777 |
) |
|
Other comprehensive loss |
|
|
|
|
|
|
|
|
|
|
|
|
|
|
|
|
|
(94,456 |
) |
|
Comprehensive income |
|
|
|
|
|
|
|
|
|
|
|
|
|
|
|
|
|
258,562 |
|
|
Repurchases of common stock |
|
|
(6,736,888 |
) |
|
(674 |
) |
|
(291,724 |
) |
|
(7,602 |
) |
|
|
|
|
(300,000 |
) |
|
Stock-based compensation |
|
|
|
|
|
|
|
|
52,935 |
|
|
|
|
|
|
|
|
52,935 |
|
|
Common stock issued under stock plans and other, net |
|
|
8,319,532 |
|
|
832 |
|
|
165,182 |
|
|
|
|
|
|
|
|
166,014 |
|
|
Common stock issued in connection with acquisition |
|
|
902,665 |
|
|
90 |
|
|
36,621 |
|
|
|
|
|
|
|
|
36,711 |
|
|
Tax benefit from stock plans |
|
|
|
|
|
|
|
|
62,365 |
|
|
|
|
|
|
|
|
62,365 |
|
|
Balance at January 3, 2009 |
|
|
345,332,272 |
|
$ |
34,533 |
|
$ |
219,041 |
|
$ |
2,977,630 |
|
$ |
4,702 |
|
$ |
3,235,906 |
|
|
Comprehensive income: |
|
|
|
|
|
|
|
|
|
|
|
|
|
|
|
|
|
|
|
|
Net earnings |
|
|
|
|
|
|
|
|
|
|
|
777,226 |
|
|
|
|
|
777,226 |
|
|
Other comprehensive gain: |
|
|
|
|
|
|
|
|
|
|
|
|
|
|
|
|
|
|
|
|
Unrealized gain on available-for-sale securities, net of taxes of $3,369 |
|
|
|
|
|
|
|
|
|
|
|
|
|
|
5,865 |
|
|
5,865 |
|
|
Reclassification of realized loss on derivative financial instruments to net earnings, net of taxes of $247 |
|
|
|
|
|
|
|
|
|
|
|
|
|
|
411 |
|
|
411 |
|
|
Foreign currency translation adjustment, net of taxes of $(173) |
|
|
|
|
|
|
|
|
|
|
|
|
|
|
83,056 |
|
|
83,056 |
|
|
Other comprehensive income |
|
|
|
|
|
|
|
|
|
|
|
|
|
|
|
|
|
89,332 |
|
|
Comprehensive income |
|
|
|
|
|
|
|
|
|
|
|
|
|
|
|
|
|
866,558 |
|
|
Repurchases of common stock |
|
|
(27,154,078 |
) |
|
(2,715 |
) |
|
(433,632 |
) |
|
(563,653 |
) |
|
|
|
|
(1,000,000 |
) |
|
Stock-based compensation |
|
|
|
|
|
|
|
|
59,795 |
|
|
|
|
|
|
|
|
59,795 |
|
|
Common stock issued under stock plans and other, net |
|
|
6,359,387 |
|
|
636 |
|
|
125,620 |
|
|
|
|
|
|
|
|
126,256 |
|
|
Tax benefit from stock plans |
|
|
|
|
|
|
|
|
35,036 |
|
|
|
|
|
|
|
|
35,036 |
|
|
Balance at January 2, 2010 |
|
|
324,537,581 |
|
$ |
32,454 |
|
$ |
5,860 |
|
$ |
3,191,203 |
|
$ |
94,034 |
|
$ |
3,323,551 |
|
See notes to the consolidated financial statements.
26
CONSOLIDATED STATEMENTS OF CASH FLOWS
(in thousands)
|
|
|
|
|
|
|
|
|
|
|
|
|
Fiscal Year Ended |
|
January 2, 2010 |
|
January 3, 2009 |
|
December 29, 2007 |
|
|||
|
OPERATING ACTIVITIES |
|
|
|
|
|
|
|
|
|
|
|
Net earnings |
|
$ |
777,226 |
|
$ |
353,018 |
|
$ |
537,756 |
|
|
Adjustments to reconcile net earnings to net cash from operating activities: |
|
|
|
|
|
|
|
|
|
|
|
Depreciation and amortization |
|
|
213,465 |
|
|
202,428 |
|
|
197,665 |
|
|
Amortization of debt discount |
|
|
370 |
|
|
49,973 |
|
|
34,029 |
|
|
Stock-based compensation |
|
|
59,795 |
|
|
52,935 |
|
|
54,540 |
|
|
Excess tax benefits from stock-based compensation |
|
|
(26,373 |
) |
|
(48,995 |
) |
|
(97,921 |
) |
|
Investment impairment charges |
|
|
8,300 |
|
|
12,902 |
|
|
25,094 |
|
|
Gain on sale of investment |
|
|
— |
|
|
— |
|
|
(7,929 |
) |
|
Purchased in-process research and development charges |
|
|
5,842 |
|
|
319,354 |
|
|
— |
|
|
Deferred income taxes |
|
|
(14,058 |
) |
|
(50,362 |
) |
|
(18,976 |
) |
|
Other, net |
|
|
11,982 |
|
|
87,833 |
|
|
41,500 |
|
|
Changes in operating assets and liabilities, net of business acquisitions: |
|
|
|
|
|
|
|
|
|
|
|
Accounts receivable |
|
|
(39,090 |
) |
|
(92,301 |
) |
|
(91,491 |
) |
|
Inventories |
|
|
(104,463 |
) |
|
(73,763 |
) |
|
4,380 |
|
|
Other current assets |
|
|
10,303 |
|
|
(19,996 |
) |
|
(5,301 |
) |
|
Accounts payable and accrued expenses |
|
|
(65,100 |
) |
|
68,366 |
|
|
49,476 |
|
|
Income taxes payable |
|
|
30,676 |
|
|
84,200 |
|
|
142,747 |
|
|
Net cash provided by operating activities |
|
|
868,875 |
|
|
945,592 |
|
|
865,569 |
|
|
|
|
|
|
|
|
|
|
|
|
|
|
INVESTING ACTIVITIES |
|
|
|
|
|
|
|
|
|
|
|
Purchases of property, plant and equipment |
|
|
(326,408 |
) |
|
(343,912 |
) |
|
(287,157 |
) |
|
Proceeds from the sale of investments |
|
|
— |
|
|
— |
|
|
12,929 |
|
|
Business acquisition payments, net of cash acquired |
|
|
(129,507 |
) |
|
(490,027 |
) |
|
(12,238 |
) |
|
Other investing activities, net |
|
|
(34,670 |
) |
|
(37,134 |
) |
|
(19,849 |
) |
|
Net cash used in investing activities |
|
|
(490,585 |
) |
|
(871,073 |
) |
|
(306,315 |
) |
|
|
|
|
|
|
|
|
|
|
|
|
|
FINANCING ACTIVITIES |
|
|
|
|
|
|
|
|
|
|
|
Proceeds from exercise of stock options and stock issued |
|
|
126,256 |
|
|
166,014 |
|
|
186,817 |
|
|
Excess tax benefits from stock-based compensation |
|
|
26,373 |
|
|
48,995 |
|
|
97,921 |
|
|
Common stock repurchased, including related costs |
|
|
(1,000,000 |
) |
|
(300,000 |
) |
|
(999,867 |
) |
|
Borrowings under debt facilities |
|
|
11,151,754 |
|
|
967,622 |
|
|
8,045,869 |
|
|
Payments under debt facilities |
|
|
(10,435,079 |
) |
|
— |
|
|
(8,724,224 |
) |
|
Issuance (repayment) of convertible debentures |
|
|
— |
|
|
(1,205,124 |
) |
|
1,200,000 |
|
|
Purchase of call options |
|
|
— |
|
|
— |
|
|
(101,040 |
) |
|
Proceeds from the sale of warrants |
|
|
— |
|
|
— |
|
|
35,040 |
|
|
Net cash used in financing activities |
|
|
(130,696 |
) |
|
(322,493 |
) |
|
(259,484 |
) |
|
|
|
|
|
|
|
|
|
|
|
|
|
Effect of currency exchange rate changes on cash and cash equivalents |
|
|
8,890 |
|
|
(4,677 |
) |
|
9,436 |
|
|
Net increase (decrease) in cash and cash equivalents |
|
|
256,484 |
|
|
(252,651 |
) |
|
309,206 |
|
|
Cash and cash equivalents at beginning of year |
|
|
136,443 |
|
|
389,094 |
|
|
79,888 |
|
|
Cash and cash equivalents at end of year |
|
$ |
392,927 |
|
$ |
136,443 |
|
$ |
389,094 |
|
|
|
|
|
|
|
|
|
|
|
|
|
|
Supplemental Cash Flow Information |
|
|
|
|
|
|
|
|
|
|
|
Cash paid during the year for: |
|
|
|
|
|
|
|
|
|
|
|
Income taxes |
|
$ |
225,062 |
|
$ |
211,860 |
|
$ |
100,599 |
|
|
Interest |
|
$ |
24,549 |
|
$ |
21,712 |
|
$ |
32,686 |
|
|
Noncash investing activities: |
|
|
|
|
|
|
|
|
|
|
|
Issuance of stock in connection with EP MedSystms, Inc. acquisition |
|
$ |
— |
|
$ |
36,711 |
|
$ |
— |
|
See notes to the consolidated financial statements.
27
Notes to the Consolidated Financial Statements
NOTE 1 – SUMMARY OF SIGNIFICANT ACCOUNTING POLICIES
Company Overview: St. Jude Medical, Inc., together with its subsidiaries (St. Jude Medical or the Company) develops, manufactures and distributes cardiovascular medical devices for the global cardiac rhythm management, cardiology, cardiac surgery and atrial fibrillation therapy areas and implantable neurostimulation devices for the management of chronic pain. The Company’s four operating segments are Cardiac Rhythm Management (CRM), Cardiovascular (CV), Atrial Fibrillation (AF) and Neuromodulation (NMD). The Company’s principal products in each operating segment are as follows: CRM – tachycardia implantable cardioverter defibrillator systems (ICDs) and bradycardia pacemaker systems (pacemakers); CV – vascular closure devices, heart valve replacement and repair products and pressure measurement guidewires; AF – electrophysiology (EP) introducers and catheters, advanced cardiac mapping, navigation and recording systems and ablation systems; and NMD – neurostimulation devices. The Company markets and sells its products primarily through a direct sales force. The principal geographic markets for the Company’s products are the United States, Europe, Japan and Asia Pacific.
Principles of Consolidation: The consolidated financial statements include the accounts of the Company and its wholly owned subsidiaries. Intercompany transactions and balances have been eliminated in consolidation.
Fiscal Year: The Company utilizes a 52/53-week fiscal year ending on the Saturday nearest December 31st. Fiscal year 2009 and 2007 consisted of 52 weeks and ended on January 2, 2010 and December 29, 2007, respectively. Fiscal year 2008 consisted of 53 weeks and ended on January 3, 2009, with the additional week reflected in the Company’s fourth quarter 2008 results.
Reclassifications: Certain prior period amounts within the Statements of Cash Flows have been reclassified to conform to the current year presentation.
Use of Estimates: Preparation of the Company’s consolidated financial statements in conformity with accounting principles generally accepted in the United States (U.S. GAAP) requires management to make estimates and assumptions that affect the reported amounts in the consolidated financial statements and accompanying notes. Actual results could differ from those estimates.
Cash Equivalents: The Company considers highly liquid investments with an original maturity of three months or less to be cash equivalents. Cash equivalents are stated at cost, which approximates fair value. The Company’s cash equivalents include bank certificates of deposit, money market funds and instruments and commercial paper investments. The Company performs periodic evaluations of the relative credit standing of the financial institutions and issuers of its cash equivalents and limits the amount of credit exposure with any one issuer.
Marketable Securities: Marketable securities consist of publicly-traded equity securities that are classified as available-for-sale securities and investments in mutual funds that are classified as trading securities. On the balance sheet, available-for-sale securities and trading securities are classified as other current assets and other assets, respectively.
Available-for-sale securities are recorded at fair value based upon quoted market prices (see Note 12). Unrealized gains and losses, net of related incomes taxes, are recorded in accumulated other comprehensive income in shareholders’ equity. Realized gains (losses) from the sale of available-for-sale securities are recorded to other income (expense) and are computed using the specific identification method.
The Company’s investments in mutual funds are recorded at fair market value based upon quoted market prices (see Note 12) and are held in a rabbi trust, which is not available for general corporate purposes and is subject to creditor claims in the event of insolvency. These investments are specifically designated as available to the Company solely for the purpose of paying benefits under the Company’s deferred compensation plan (see Note 11).
28
Available-for-sale securities are classified as other current assets. The following table summarizes the components of the balance of the Company’s available-for-sale securities at January 2, 2010 and January 3, 2009 (in thousands):
|
|
|
|
|
|
|
|
|
|
|
|
January 2, 2010 |
|
January 3, 2009 |
|
||
|
Adjusted cost |
|
$ |
12,122 |
|
$ |
12,187 |
|
|
Gross unrealized gains |
|
|
19,797 |
|
|
9,944 |
|
|
Gross unrealized losses |
|
|
(208 |
) |
|
(66 |
) |
|
Fair value |
|
$ |
31,711 |
|
$ |
22,065 |
|
Unrealized gains and losses, net of related income taxes are recorded in accumulated other comprehensive income in shareholders’ equity. Realized gains (losses) from the sale of available-for-sale securities are recorded in other income (expense) and are computed using the specific identification method. Upon the sale of an available-for-sale security, the unrealized gain (loss) is reclassified out of accumulated other comprehensive income and reflected as a realized gain (loss) in net earnings. There were no realized gains (losses) from the sale of available-for-sale securities recorded during fiscal years 2009 or 2008. In 2007, the Company sold an available-for-sale security, recognizing a realized after-tax gain of $4.9 million. The total pre-tax gain of $7.9 million was recognized as other income (see Note 9). Additionally, when the fair value of an available-for-sale security falls below its original cost and the Company determines that the corresponding unrealized loss is other-than-temporary, the Company recognizes an impairment loss to net earnings in the period the determination is made. In 2008, the Company recognized a pre-tax impairment charge of $0.7 million in other expense related to a decline in the fair value of an available-for-sale security that was deemed other-than-temporary. No available-for-sale security impairment losses were recognized during fiscal years 2009 or 2007.
Accounts Receivable: The Company grants credit to customers in the normal course of business, but generally does not require collateral or any other security to support its receivables. The Company maintains an allowance for doubtful accounts for potential credit losses. The allowance for doubtful accounts was $34.9 million and $29.0 million at January 2, 2010 and January 3, 2009, respectively.
Inventories: Inventories are stated at the lower of cost or market with cost determined using the first-in, first-out method. Inventories consisted of the following (in thousands):
|
|
|
|
|
|
|
|
|
|
|
|
January 2, 2010 |
|
January 3, 2009 |
|
||
|
Finished goods |
|
$ |
460,600 |
|
$ |
398,452 |
|
|
Work in process |
|
|
60,702 |
|
|
39,143 |
|
|
Raw materials |
|
|
138,658 |
|
|
108,904 |
|
|
|
|
$ |
659,960 |
|
$ |
546,499 |
|
Property, Plant and Equipment: Property, plant and equipment are recorded at cost and are depreciated using the straight-line method over their estimated useful lives, ranging from 15 to 39 years for buildings and improvements, three to seven years for machinery and equipment and three to five years for diagnostic equipment. Diagnostic equipment primarily consists of programmers that are used by physicians and healthcare professionals to program and analyze data from ICDs and pacemakers. The estimated useful lives of this equipment are based on anticipated usage by physicians and healthcare professionals and the timing and impact of expected new technology platforms and rollouts by the Company. To the extent the Company experiences changes in the usage of this equipment or introductions of new technologies to the market, the estimated useful lives of this equipment may change in a future period. Diagnostic equipment had a net carrying value of $190.9 million and $205.3 million at January 2, 2010 and January 3, 2009, respectively. Property, plant and equipment are depreciated using accelerated methods for income tax purposes.
Goodwill and Other Intangible Assets: Goodwill represents the excess of cost over the fair value of identifiable net assets of businesses acquired. Other intangible assets consist of purchased technology and patents, customer lists and relationships, trademarks and tradenames, licenses and distribution agreements, which are amortized on a straight-line basis over the estimated useful life ranging from 3 to 20 years.
29
The Financial Accounting Standards Board’s (FASB) Accounting Standards Codification (ASC) Topic 350, Intangibles – Goodwill and Other (ASC Topic 350), requires that goodwill for each reporting unit be reviewed for impairment at least annually. The Company has four reporting units as of January 2, 2010, consisting of its four operating segments (see Note 14). The Company tests goodwill for impairment using the two-step process prescribed in ASC Topic 350. In the first step, the Company compares the fair value of each reporting unit, as computed primarily by present value cash flow calculations, to its book carrying value, including goodwill. If the fair value exceeds the carrying value, no further analysis is required and no impairment loss is recognized. If the carrying value exceeds the fair value, the goodwill of the reporting unit is potentially impaired and the Company would complete step 2 in order to measure the potential impairment loss. In step 2, the Company calculates the implied fair value of goodwill by deducting the fair value of all tangible and intangible net assets (including unrecognized intangible assets) of the reporting unit from the fair value of the reporting unit (as determined in step 1). If the implied fair value of goodwill is less than the carrying value of goodwill, the Company would recognize an impairment loss equal to the difference. During the fourth quarters of 2009, 2008 and 2007, the Company completed its annual goodwill impairment test and identified no impairment associated with the carrying values of goodwill.
The Company also reviews other intangible assets for impairment at least annually to determine if any adverse conditions exist that would indicate impairment. If the carrying value of other intangible assets exceeds the related undiscounted future cash flows, the carrying value is written down to fair value in the period identified. In assessing fair value, the Company generally utilizes present value cash flow calculations using an appropriate risk-adjusted discount rate. In 2008, the Company recorded a $37.0 million impairment charge to write down purchased technology intangible assets associated with its 2005 Velocimed LLC (Velocimed) acquisition and a $1.7 million impairment charge to write off Advanced Neuromodulation Systems, Inc. (ANS) tradename intangible assets. In 2007, the Company recorded a $23.7 million impairment charge to write down intangible assets associated with a distribution agreement in Japan. There was no impairment of intangible assets during 2009. Refer to Note 8 for further detail regarding these impairment charges.
Product Warranties: The Company offers a warranty on various products; the most significant of which relate to pacemaker and ICD systems. The Company estimates the costs that may be incurred under its warranties and records a liability in the amount of such costs at the time the product is sold. Factors that affect the Company’s warranty liability include the number of units sold, historical and anticipated rates of warranty claims and cost per claim. The Company periodically assesses the adequacy of its recorded warranty liabilities and adjusts the amounts as necessary.
Changes in the Company’s product warranty liability during fiscal years 2009 and 2008 were as follows (in thousands):
|
|
|
|
|
|
|
|
|
|
|
|
2009 |
|
2008 |
|
||
|
Balance at beginning of year |
|
$ |
15,724 |
|
$ |
16,691 |
|
|
Warranty expense recognized |
|
|
6,627 |
|
|
1,515 |
|
|
Warranty credits issued |
|
|
(2,440 |
) |
|
(2,482 |
) |
|
Balance at end of year |
|
$ |
19,911 |
|
$ |
15,724 |
|
Product Liability: The Company accrues for product liability claims when it is probable that a liability has been incurred and the amount of the liability can be reasonably estimated. As a result of higher costs and increasing coverage limitations, effective June 16, 2009, the Company ceased purchasing product liability insurance. Receivables for insurance recoveries from prior product liability insurance coverage are recorded when it is probable that a recovery will be realized.
Litigation: The Company accrues a liability for costs related to claims, including future legal costs, settlements and judgments where it has assessed that a loss is probable and an amount can be reasonably estimated.
Revenue Recognition: The Company sells its products to hospitals primarily through a direct sales force. In certain international markets, the Company sells its products through independent distributors. The Company recognizes revenue when persuasive evidence of a sales arrangement exists, delivery of goods occurs through the transfer of title and risks and rewards of ownership, the selling price is fixed or determinable and collectability is reasonably assured. A portion of the Company’s inventory is held by field sales representatives or consigned at hospitals. Revenue is recognized at the time the Company is notified that the inventory has been implanted or used by the customer. For products that are not consigned, revenue recognition occurs upon shipment to the hospital or, in the case of distributors, when title transfers under the contract. The Company offers sales rebates and discounts to certain customers. The Company records such rebates and discounts as a reduction of net sales in the same period revenue is recognized. The Company estimates rebates based on sales terms and historical experience.
Research and Development: Research and development costs are expensed as incurred. Research and development costs include product development costs, pre-approval regulatory costs and clinical research expenses.
30
Purchased In-Process Research and Development (IPR&D): The Company’s policy defines IPR&D as the value of technology acquired for which the related products have not yet reached technological feasibility and have no future alternative use. The primary basis for determining the technological feasibility of these projects is obtaining regulatory approval to market the underlying products in an applicable geographic region. Prior to 2009, the Company expensed the value attributed to any IPR&D acquired in a business acquisition.
Beginning in fiscal year 2009, all IPR&D acquired in a business combination is subject to ASC Topic 805, Business Combinations, which requires the fair value of IPR&D to be capitalized as an indefinite-lived intangible asset until completion of the IPR&D project or abandonment. Upon completion of the development project (generally when regulatory approval to market the product is obtained), acquired IPR&D assets are amortized over their estimated useful life. If the IPR&D projects are abandoned, the related IPR&D assets would likely be impaired and written down to the remaining fair value, if any. No IPR&D was capitalized during fiscal year 2009.
The Company’s adoption of ASC Topic 805 did not change the Company’s accounting policy with respect to asset purchases. In many cases, the purchase of certain intellectual property assets or the rights to such intellectual property is considered a purchase of assets rather than the acquisition of a business. Accordingly, rather than being capitalized, any IPR&D acquired in such asset purchases are expensed.
Stock-Based Compensation: The Company accounts for stock-based compensation in accordance with ASC Topic 718, Compensation – Stock Compensation (ASC Topic 718). Under the fair value recognition provisions of ASC Topic 718, the Company measures stock-based compensation cost at the grant date based on the fair value of the award and recognizes the compensation expense over the requisite service period, which is the vesting period, using a straight-line attribution method.
The amount of stock-based compensation expense recognized during a period is based on the portion of the awards that are ultimately expected to vest. The Company estimates pre-vesting option forfeitures at the time of grant by analyzing historical data and revises those estimates in subsequent periods if actual forfeitures differ from those estimates. Ultimately, the total expense recognized over the vesting period will only be for those awards that vest. The Company’s awards are not eligible to vest early in the event of retirement, however, the majority of the Company’s awards vest early in the event of a change in control.
Net Earnings Per Share: Basic net earnings per share is computed by dividing net earnings by the weighted average number of outstanding common shares during the period, exclusive of restricted stock. Diluted net earnings per share is computed by dividing net earnings by the weighted average number of outstanding common shares and dilutive securities.
The following table sets forth the computation of basic and diluted net earnings per share for fiscal years 2009, 2008 and 2007 (in thousands, except per share amounts):
|
|
|
|
|
|
|
|
|
|
|
|
|
|
|
2009 |
|
2008 |
|
2007 |
|
|||
|
Numerator: |
|
|
|
|
|
|
|
|
|
|
|
Net earnings |
|
$ |
777,226 |
|
$ |
353,018 |
|
$ |
537,756 |
|
|
|
||||||||||
|
Denominator: |
|
|
|
|
|
|
|
|
|
|
|
Basic-weighted average shares outstanding |
|
|
340,880 |
|
|
342,888 |
|
|
342,103 |
|
|
Effect of dilutive securities: |
|
|
|
|
|
|
|
|
|
|
|
Employee stock options |
|
|
3,456 |
|
|
6,765 |
|
|
10,249 |
|
|
Restricted stock |
|
|
23 |
|
|
69 |
|
|
92 |
|
|
Diluted-weighted average shares outstanding |
|
|
344,359 |
|
|
349,722 |
|
|
352,444 |
|
|
Basic net earnings per share |
|
$ |
2.28 |
|
$ |
1.03 |
|
$ |
1.57 |
|
|
Diluted net earnings per share |
|
$ |
2.26 |
|
$ |
1.01 |
|
$ |
1.53 |
|
Approximately 22.8 million, 15.0 million, and 12.0 million shares of common stock subject to employee stock options and restricted stock were excluded from the diluted net earnings per share computation because they were not dilutive during fiscal years 2009, 2008 and 2007, respectively.
Foreign Currency Translation: Sales and expenses denominated in foreign currencies are translated at average exchange rates in effect throughout the year. Assets and liabilities of foreign operations are translated at period-end exchange rates. Gains and losses from translation of net assets of foreign operations, net of related income taxes, are recorded in accumulated other comprehensive income (loss). Foreign currency transaction gains and losses are included in other income (expense).
31
Derivative Financial Instruments: The Company follows the provisions of ASC Topic 815, Derivatives and Hedging (ASC Topic 815) to account for its derivative instruments and hedging activities. ASC Topic 815 requires all derivative financial instruments to be recognized on the balance sheet at fair value. Changes in the fair value of derivatives are recognized in net earnings or other comprehensive income depending on whether the derivative is designated as part of a qualifying hedging transaction.
The Company uses forward contracts to manage foreign currency exposures primarily related to intercompany receivables and payables arising from intercompany purchases of manufactured products. These forward contracts are not designated as qualifying hedges and therefore, the changes in the fair values of these derivatives are recognized in net earnings and classified in other income (expense). The gains and losses on these forward contracts largely offset the losses or gains on the foreign currency exposures being managed.
The Company has periodically entered into interest rate swap contracts to hedge the risk to net earnings associated with movements in interest rates by converting variable-rate borrowings into fixed-rate borrowings. As designated cash flow hedges, the fair value of the swap contract is recorded to other current assets or other accrued expenses with the related unrealized gain (loss) recorded to other comprehensive income. Payments made or received under the swap contract are recorded to interest expense.
New Accounting Pronouncements: The Company adopted new accounting standards in fiscal year 2009, the impacts of which have been reflected in the 2009 consolidated financial statements and historical consolidated financial statements, as applicable.
In June 2009, the FASB issued Statement of Financial Accounting Standards (SFAS) No. 168, The FASB Accounting Standards Codification™ and the Hierarchy of Generally Accepted Accounting Principles (SFAS No. 168) which establishes the FASB Accounting Standards Codification (ASC or the Codification) as the source of authoritative accounting principles to be applied by U.S. nongovernmental entities in the preparation of financial statements. The Company adopted SFAS No. 168 in the third quarter of 2009. Accordingly, the Company now references U.S. GAAP by using the numbering system prescribed by the Codification. The Codification did not change existing U.S. GAAP, and the adoption of SFAS No. 168 did not have an impact on the Company’s consolidated financial statements.
In May 2008, the FASB issued Staff Position (FSP) Accounting Principles Board (APB) Opinion No. 14-1, Accounting for Convertible Debt Instruments That May Be Settled in Cash upon Conversion (Including Partial Cash Settlement). This legacy accounting change is now included as part of the authoritative accounting guidance of FASB ASC Topic 470, Debt, (ASC Topic 470) and requires the proceeds from the issuance of certain convertible debt instruments to be allocated between a liability and an equity component in a manner that reflects the entity’s nonconvertible debt borrowing rate when interest expense is recognized in subsequent periods. The resulting debt discount is amortized over the period the convertible debt is expected to be outstanding as additional non-cash interest expense. Retrospective adoption of this accounting guidance was required. The Company adopted this guidance at the beginning of fiscal year 2009 and has retrospectively applied it to all periods presented.
In March 2008, the FASB issued SFAS No. 161, Disclosures about Derivative Instruments and Hedging Activities (SFAS No. 161). This legacy accounting standard is now included as part of the authoritative accounting guidance of FASB ASC Topic 815, Derivatives and Hedging (ASC Topic 815). The updated accounting guidance incorporated into ASC Topic 815 expands disclosures about derivative instruments and hedging activities (see Note 13) to provide a better understanding of a company’s use of derivatives and their effect on the financial statements. The Company’s adoption of this standard at the beginning of fiscal year 2009 did not have a material impact to the Company’s consolidated financial statements (see Note 13).
In April 2009, the FASB issued two related FASB Staff Positions (FSPs): (i) FSP SFAS No. 115-2 and SFAS No. 124-2, Recognition and Presentation of Other-Than-Temporary Impairments and (ii) FSP SFAS No. 107-1 and APB Opinion No. 28-1, Interim Disclosures about Fair Value of Financial Instruments. These legacy FSPs are now included as part of the authoritative accounting guidance of FASB ASC Topic 320, Investments – Debt and Equity Securities (ASC Topic 320) and FASB ASC Topic 820, Fair Value Measurements and Disclosures (ASC Topic 820), respectively. The updated accounting guidance incorporated into ASC Topic 320 modifies the requirement for recognizing other-than-temporary impairments, changes the existing impairment model, and modifies the presentation and frequency of related disclosures. The updated accounting guidance incorporated into ASC Topic 820 requires fair value disclosures at interim reporting periods for financial instruments not reflected in the condensed consolidated balance sheets at fair value, which are similar to the fair value disclosures required in annual financial statements for those same assets and liabilities. The Company’s adoption of this accounting guidance in the second quarter of 2009 did not have a material impact to the Company’s consolidated financial statements (see Note 13).
32
NOTE 2 – ACQUISITIONS
The Company made acquisitions during 2009, 2008 and 2007; the more significant acquisitions are described below. The results of operations of businesses acquired have been included in the Company’s consolidated results of operations since the dates of acquisition. Pro forma results of operations have not been presented for these acquisitions since the effects of these business acquisitions were not material to the Company either individually or in aggregate.
EP MedSystems, Inc.: On July 3, 2008, the Company completed the acquisition of EP MedSystems, Inc. (EP MedSystems) for $95.7 million (consisting of $59.0 million in net cash consideration and direct acquisition costs and 0.9 million shares of St. Jude Medical common stock). EP MedSystems had been publicly traded on the NASDAQ Capital Market under the ticker symbol EPMD. EP MedSystems is based in West Berlin, New Jersey and develops, manufactures and markets medical devices for the electrophysiology market which are used for visualization, diagnosis and treatment of heart rhythm disorders. The Company acquired EP MedSystems to strengthen its portfolio of products used to treat heart rhythm disorders.
The goodwill recorded as a result of the EP MedSystems acquisition is not deductible for income tax purposes and was allocated entirely to the Company’s Atrial Fibrillation operating segment. The goodwill represents the strategic benefits of growing our Atrial Fibrillation product portfolio and the expected revenue growth from increased market penetration from future product and customers. In connection with the acquisition of EP MedSystems, the Company recorded $17.0 million of developed and core technology intangible assets and $3.3 million of customer relationship intangible assets that both have estimated useful lives of 7 to 10 years. The aggregate EP MedSystems purchase price was allocated on a preliminary basis to the assets acquired and liabilities assumed based on their estimated fair values at the date of acquisition. During 2009, the Company finalized the EP MedSystems purchase price allocation and recorded a $3.3 million net decrease to goodwill. The impacts of finalizing the purchase price allocation were not material.
Radi Medical Systems AB: On December 19, 2008, the Company completed the acquisition of Radi Medical Systems AB (Radi Medical Systems) for $248.9 million in net cash consideration, including direct acquisition costs. Radi Medical Systems is based in Uppsala, Sweden and develops, manufactures and markets products that provide precise measurements of intravascular pressure during a cardiovascular procedure and compression systems that arrest bleeding of the femoral and radial arteries following an intravascular medical device procedure. The Company acquired Radi Medical Systems to accelerate its cardiovascular growth platform in these two segments of the cardiovascular medical device market in which the Company previously had not participated.
The goodwill recognized as a result of the Radi Medical Systems acquisition is not deductible for income tax purposes and was allocated entirely to the Company’s Cardiovascular operating segment. The goodwill represents the strategic benefits of growing our Cardiovascular product portfolio and the expected revenue growth from increased market penetration from future products and customers. In connection with the acquisition of Radi Medical Systems, the Company recorded $46.0 million of developed and core technology intangible assets that have estimated useful lives of 8 to 10 years. During 2009, the Company finalized the Radi Medical Systems purchase price allocation and recorded a $3.3 million net decrease to goodwill. The impacts of finalizing the purchase price allocation were not material.
MediGuide, Inc.: On December 22, 2008, the Company completed the acquisition of MediGuide, Inc. (MediGuide), a development stage company, for $285.2 million in net consideration, which included additional cash consideration payments of approximately $145.1 million and direct acquisition costs. The additional cash consideration payments consisted of a $113.8 million payment paid in November 2009 and an estimated $31.3 million payment due in April 2010. The final cash payment has been held as security for potential indemnification obligations of MediGuide. MediGuide was a development-stage company based in Haifa, Israel and has been focused on developing a Medical Positioning System (gMPSTM) technology that provides localization and tracking capability for interventional medical devices. As MediGuide was a development-stage company, the excess of the purchase price over the fair value of the net assets acquired was allocated to IPR&D, the principal asset acquired.
33
The following table summarizes the estimated fair values of the assets acquired and liabilities assumed as a result of the significant business acquisitions (EP MedSystems and Radi Medical Systems) and asset acquisition (MediGuide) made by the Company in fiscal year 2008 (in thousands):
|
|
|
|
|
|
|
|
|
|
|
|
|
|
|
|
|
|
EP MedSystems |
|
Radi |
|
MediGuide |
|
Total |
|
||||
|
Current assets |
|
$ |
8,506 |
|
$ |
21,224 |
|
$ |
132 |
|
$ |
29,862 |
|
|
Goodwill |
|
|
69,719 |
|
|
219,428 |
|
|
— |
|
|
289,147 |
|
|
Other intangible assets |
|
|
20,250 |
|
|
46,000 |
|
|
— |
|
|
66,250 |
|
|
IPR&D |
|
|
— |
|
|
— |
|
|
306,202 |
|
|
306,202 |
|
|
Deferred income taxes, net |
|
|
17,213 |
|
|
— |
|
|
— |
|
|
17,213 |
|
|
Other long-term assets |
|
|
1,101 |
|
|
6,629 |
|
|
408 |
|
|
8,138 |
|
|
Total assets acquired |
|
$ |
116,789 |
|
$ |
293,281 |
|
$ |
306,742 |
|
$ |
716,812 |
|
|
|
|
|
|
|
|
|
|
|
|
|
|
|
|
|
Current liabilities |
|
|
21,084 |
|
$ |
31,405 |
|
|
21,580 |
|
|
74,069 |
|
|
Deferred income taxes, net |
|
|
— |
|
|
12,930 |
|
|
— |
|
|
12,930 |
|
|
Net assets acquired |
|
$ |
95,705 |
|
$ |
248,946 |
|
$ |
285,162 |
|
$ |
629,813 |
|
|
|
|
|
|
|
|
|
|
|
|
|
|
|
|
|
Cash paid, net of cash acquired |
|
$ |
58,994 |
|
$ |
248,946 |
|
$ |
140,104 |
|
|
448,044 |
|
|
Non-cash (SJM shares at fair value) |
|
|
36,711 |
|
|
— |
|
|
— |
|
|
36,711 |
|
|
Future cash consideration |
|
|
— |
|
|
— |
|
|
145,058 |
|
|
145,058 |
|
|
Net assets acquired |
|
$ |
95,705 |
|
$ |
248,946 |
|
$ |
285,162 |
|
$ |
629,813 |
|
NOTE 3 – GOODWILL AND OTHER INTANGIBLE ASSETS
The changes in the carrying amount of goodwill for each of the Company’s reportable segments for the fiscal years ended January 2, 2010 and January 3, 2009 were as follows (in thousands):
|
|
|
|
|
|
|
|
|
|
|
|
|
|
|
CRM/NMD |
|
CV/AF |
|
Total |
|
|||
|
Balance at December 29, 2007 |
|
$ |
1,196,972 |
|
$ |
460,341 |
|
$ |
1,657,313 |
|
|
EP Medsystems |
|
|
— |
|
|
69,719 |
|
|
69,719 |
|
|
Radi Medical Systems |
|
|
— |
|
|
219,428 |
|
|
219,428 |
|
|
Foreign currency translation and other |
|
|
14,566 |
|
|
23,540 |
|
|
38,106 |
|
|
Balance at January 3, 2009 |
|
$ |
1,211,538 |
|
$ |
773,028 |
|
$ |
1,984,566 |
|
|
EP Medsystems |
|
|
— |
|
|
(3,261 |
) |
|
(3,261 |
) |
|
Radi Medical Systems |
|
|
— |
|
|
(3,265 |
) |
|
(3,265 |
) |
|
Foreign currency translation and other |
|
|
27,478 |
|
|
333 |
|
|
27,811 |
|
|
Balance at January 2, 2010 |
|
$ |
1,239,016 |
|
$ |
766,835 |
|
$ |
2,005,851 |
|
The following table provides the gross carrying amount of other intangible assets and related accumulated amortization (in thousands):
|
|
|
|
|
|
|
|
|
|
|
|
|
|
|
|
|
|
January 2, 2010 |
|
January 3, 2009 |
|
||||||||
|
|
|
Gross |
|
Accumulated |
|
Gross |
|
Accumulated |
|
||||
|
|
|
|
|
|
|
|
|
|
|
||||
|
Purchased technology and patents |
|
$ |
506,893 |
|
$ |
171,760 |
|
$ |
494,796 |
|
$ |
124,749 |
|
|
Customer lists and relationships |
|
|
182,368 |
|
|
81,129 |
|
|
166,637 |
|
|
63,385 |
|
|
Trademarks and tradenames |
|
|
24,286 |
|
|
6,336 |
|
|
22,651 |
|
|
4,789 |
|
|
Licenses, distribution agreements and other |
|
|
5,693 |
|
|
3,873 |
|
|
5,529 |
|
|
3,155 |
|
|
|
|
$ |
719,240 |
|
$ |
263,098 |
|
$ |
689,613 |
|
$ |
196,078 |
|
Amortization expense of other intangible assets was $58.5 million, $53.4 million and $53.9 million for fiscal years 2009, 2008 and 2007, respectively. In 2008, the Company recorded a $37.0 million impairment charge to write down purchased technology intangible assets associated with its 2005 Velocimed acquisition and a $1.7 million impairment charge to write off its ANS tradename intangible assets (see Note 8). In 2007, the Company recorded impairment charges of $23.7 million related to acquired intangible assets associated with a terminated distribution agreement (see Note 8). The gross carrying values and related accumulated amortization amounts for these impairment charges were written off in the respective periods.
34
The following table presents expected future amortization expense for amortizable intangible assets. Actual amounts of amortization expense may differ due to additional intangible assets acquired and foreign currency translation impacts (in thousands):
|
|
|
|
|
|
|
|
|
|
|
|
|
|
|
|
|
|
|
|
|
|
|
|
2010 |
|
2011 |
|
2012 |
|
2013 |
|
2014 |
|
After |
|
||||||
|
|
|
|
|
|
|
|
|
|
|
|
|
|
|
|
|
|
|
|
|
|
Amortization expense |
|
$ |
60,245 |
|
$ |
59,576 |
|
$ |
57,178 |
|
$ |
55,366 |
|
$ |
53,048 |
|
$ |
170,729 |
|
NOTE 4 – DEBT
The Company’s debt consisted of the following (in thousands):
|
|
|
|
|
|
|
|
|
|
|
|
January 2, 2010 |
|
January 3, 2009 |
|
||
|
Senior notes due 2014 |
|
$ |
699,036 |
|
$ |
— |
|
|
Senior notes due 2019 |
|
|
493,927 |
|
|
— |
|
|
Term loan due 2011 |
|
|
432,000 |
|
|
360,000 |
|
|
1.02% Yen-denominated notes due 2010 |
|
|
226,787 |
|
|
230,088 |
|
|
Yen-denominated term loan due 2011 |
|
|
70,652 |
|
|
88,222 |
|
|
Credit facility borrowings |
|
|
— |
|
|
500,000 |
|
|
Commercial paper borrowings |
|
|
— |
|
|
19,400 |
|
|
Other |
|
|
— |
|
|
3,892 |
|
|
Total debt |
|
|
1,922,402 |
|
|
1,201,602 |
|
|
Less: current debt obligations |
|
|
334,787 |
|
|
75,518 |
|
|
Long-term debt |
|
$ |
1,587,615 |
|
$ |
1,126,084 |
|
Future minimum principal payments under the Company’s total debt obligations are as follows: $334.8 million in 2010; $394.7 million in 2011; $700.0 million in 2014; and $500.0 million in years thereafter.
Senior notes due 2014: On July 28, 2009, the Company issued $700.0 million principal amount, 5-year, 3.75% unsecured senior notes (2014 Senior Notes) that mature in July 2014. Interest payments are required on a semi-annual basis. The 2014 Senior Notes were issued at a discount, yielding an effective interest rate of 3.784% at issuance. The debt discount is being amortized as interest expense through maturity. The Company may redeem the 2014 Senior Notes at any time at the applicable redemption price.
Senior notes due 2019: On July 28, 2009, the Company issued $500.0 million principal amount, 10-year, 4.875% unsecured senior notes (2019 Senior Notes) that mature in July 2019. Interest payments are required on a semi-annual basis. The 2019 Senior Notes were issued at a discount, yielding an effective interest rate of 5.039% at issuance. The debt discount is being amortized as interest expense through maturity. The Company may redeem the 2019 Senior Notes at any time at the applicable redemption price.
Term loan due 2011: In December 2008, the Company entered into a 3-year, unsecured term loan (2011 Term Loan). The Company initially borrowed $360.0 million in December 2008 and borrowed an additional $180.0 million in January 2009, resulting in total original borrowings of $540.0 million under the 2011 Term Loan. The Company is required to make quarterly principal payments in the amount of 5% ($27.0 million) of the total original borrowings. These borrowings bear interest at United States Dollar London InterBank Offered Rate (LIBOR) plus 2.0%, although the Company may elect the United States Prime Rate (Prime Rate) plus 1.0%. The interest rates are subject to adjustment in the event of a change in the Company’s credit ratings. Borrowings under the 2011 Term Loan incurred interest at a weighted average interest rate of 2.3% during 2009.
1.02% Yen-denominated notes due 2010: In May 2003, the Company issued 7-year, 1.02% unsecured notes in Japan (Yen Notes) totaling 20.9 billion Yen (the equivalent of $226.8 million at January 2, 2010 and $230.1 million at January 3, 2009). The principal amount of the Yen Notes recorded on the balance sheet fluctuates based on the effects of foreign currency translation. Interest payments are required on a semi-annual basis and the entire principal balance is due in May 2010.
Yen-denominated term loan due 2011: In December 2008, the Company entered into a 3-year, Yen-denominated unsecured term loan in Japan (Yen Term Loan) totaling 8.0 billion Japanese Yen (the equivalent of $88.2 million at January 3, 2009). In December 2009, the Company voluntarily repaid 1.5 billion Japanese Yen, resulting in an outstanding balance of 6.5 billion Japanese Yen at January 2, 2010 (the equivalent of $70.7 million at January 2, 2010). The Company can initiate future borrowings up to the 8.0 billion Japanese Yen term loan amount. The principal amount of the Yen Term Loan recorded on the balance sheet fluctuates based on the effects of foreign currency translation. The borrowings bear interest at the Yen LIBOR plus 2.0%. Interest payments are required on a semi-annual basis and the entire principal balance is due in December 2011.
35
Credit facility borrowings: In December 2006, the Company entered into a 5-year, $1.0 billion committed credit facility (Credit Facility) that it may draw on for general corporate purposes and to support its commercial paper program. Borrowings under the Credit Facility bear interest at the Prime Rate or LIBOR plus 0.235%, at the election of the Company. In the event that over half of the Credit Facility is drawn upon, an additional five basis points is added to the elected Prime Rate or LIBOR rate. The interest rates are subject to adjustment in the event of a change in the Company’s credit ratings. In October 2008, the Company borrowed $500.0 million under the Credit Facility to partially fund the retirement of other outstanding borrowings in December 2008. In August 2009, the Company repaid the $500.0 million of Credit Facility borrowings with proceeds from the issuance of the 2014 Senior Notes and 2019 Senior Notes. Accordingly, as of January 2, 2010 the Company has $1.0 billion of available borrowing capacity under the Credit Facility.
In November 2008, the Company entered into an interest rate swap contract to convert $400.0 million of variable-rate borrowings under the Credit Facility into fixed-rate borrowings. The swap contract terminated in February 2009 and payments made or received were recorded to interest expense. Inclusive of the interest rate swap, borrowings under the Credit Facility incurred interest at a weighted average interest rate of 1.0% during 2009.
Commercial paper borrowings: The Company’s commercial paper program provides for the issuance of short-term, unsecured commercial paper with maturities up to 270 days. The Company had no commercial paper borrowings outstanding as of January 2, 2010. Any future commercial paper borrowings would bear interest at the applicable then-current market rates. Interest incurred during 2009 and 2008 was not material. The Company classifies all of its commercial paper borrowings as long-term debt, as the Company has the ability to repay any short-term maturity with available cash from its existing long-term, committed Credit Facility.
NOTE 5 – COMMITMENTS AND CONTINGENCIES
Leases
The Company leases various facilities and equipment under non-cancelable operating lease arrangements. Future minimum lease payments under these leases are as follows: $32.1 million in 2010; $20.3 million in 2011; $14.8 million in 2012; $11.4 million in 2013; $7.9 million in 2014; and $8.7 million in years thereafter. Rent expense under all operating leases was $33.5 million, $28.6 million, and $27.4 million in fiscal years 2009, 2008 and 2007, respectively.
Litigation
Silzone® Litigation and Insurance Receivables: The Company has been sued in various jurisdictions beginning in March 2000 by some patients who received a heart valve product with Silzone® coating, which we stopped selling in January 2000. Some of these claimants allege bodily injuries as a result of an explant or other complications, which they attribute to these products. Others, who have not had their Silzone-coated heart valve explanted, seek compensation for past and future costs of special monitoring they allege they need over and above the medical monitoring all other replacement heart valve patients receive. Some of the lawsuits seeking the cost of monitoring have been initiated by patients who are asymptomatic and who have no apparent clinical injury to date. The Company has vigorously defended against the claims that have been asserted and expects to continue to do so with respect to any remaining claims.
In October 2001, various class-action complaints related to Silzone heart valves were consolidated into one class action case by the U.S. District Court in Minnesota (the District Court). The Company requested the Eighth Circuit Court of Appeals (the Eighth Circuit) to review the District Court’s initial class certification orders and, in October 2005, the Eighth Circuit issued a decision reversing the District Court’s class certification rulings and directed the District Court to undertake further proceedings. In October 2006, the District Court granted plaintiffs’ renewed motion to certify a nationwide consumer protection class under Minnesota’s consumer protection statutes and Private Attorney General Act. The Company again requested the Eighth Circuit to review the District Court’s class certification orders and, in April 2008, the Eighth Circuit again issued a decision reversing the District Court’s October 2006 class certification rulings. The order by the Eighth Circuit returned the case to the District Court for continued proceedings. The plaintiffs requested the District Court to certify a new class, but in June 2009, the District Court issued an order striking any remaining claims seeking class action status. As a result, the former class representative had only an individual claim which has now been resolved.
36
In 2001, the U.S. Judicial Panel on Multi-District Litigation (MDL) ruled that certain lawsuits filed in U.S. federal district court involving products with Silzone coating should be part of MDL proceedings in the District Court. As a result, actions in federal court involving products with Silzone coating have been transferred to the District Court for coordinated or consolidated pretrial proceedings. There are two individual Silzone cases pending in federal court. The plaintiffs in these cases are requesting damages in excess of $75 thousand. The complaint in the case that was most recently transferred to the MDL court was served upon the Company in December 2008.
There are three individual state court suits concerning Silzone-coated products pending, involving three patients. These cases are venued in Minnesota and Texas. The complaints in these state court cases are requesting damages ranging from $10 thousand to $100 thousand and, in some cases, seek an unspecified amount. The most recent individual state court complaint was served upon the Company in February 2008. These state court cases are proceeding in accordance with the orders issued by the judges in those matters.
In Canada, four class-action cases and one individual case were filed against the Company. In one such case in Ontario, the court certified that a class action involving Silzone patients may proceed, and the trial of the initial phase of this matter began in February 2010. A second case seeking class action status in Ontario has been stayed pending resolution of the other Ontario class action. A case filed as a class action in British Columbia has been resolved. The terms of that resolution, including a 2.1 million Canadian Dollars settlement amount (the equivalent of $2.0 million at January 2, 2010), was approved by the court in December 2009 and the deadline for any appeal of that decision has expired. The British Columbia Provincial health insurer has a separate lawsuit seeking to recover the cost of insured services furnished or to be furnished to class members in the British Columbia class actions, and that lawsuit remains pending in the British Columbia court. Although a court in Quebec certified a class action, the parties have reached an agreement to resolve that class action. A hearing for the court to approve the terms of resolution, including a 5.7 million Canadian Dollars settlement amount (the equivalent of $5.5 million at January 2, 2010), is scheduled for April 1, 2010. The resolution agreed to by the parties also resolves the claim raised by the Quebec Provincial health insurer seeking to recover the cost of insured services furnished or to be furnished to class members in the Quebec class action. The complaints in the pending Canadian cases request damages up to 2.0 billion Canadian Dollars (the equivalent of $1.9 billion at January 2, 2010). Based on the Company’s historical experience, the amount ultimately paid, if any, often does not bear any relationship to the amount claimed. The Company is not aware of any unasserted claims related to Silzone-coated products.
The Company has recorded an accrual for probable legal costs, settlements and judgments for Silzone related litigation. For all Silzone legal costs incurred, the Company records insurance receivables for the amounts that it expects to recover. Any costs (the material components of which are settlements, judgments, legal fees and other related defense costs) not covered by the Company’s product liability insurance policies or existing reserves could be material to the Company’s consolidated earnings, financial position and cash flows.
The following table summarizes the Company’s Silzone legal accrual and related insurance receivable at January 2, 2010 and January 3, 2009 (in thousands):
|
|
|
|
|
|
|
|
|
|
|
|
January 2, 2010 |
|
January 3, 2009 |
|
||
|
Silzone legal accrual |
|
$ |
23,326 |
|
$ |
22,308 |
|
|
Silzone insurance receivable |
|
$ |
42,538 |
|
$ |
25,583 |
|
The Company’s remaining product liability insurance for Silzone claims consists of two $50.0 million layers, each of which is covered by one or more insurance companies. The first $50.0 million layer of insurance is covered by American Insurance Company (AIC). In December 2007, AIC initiated a lawsuit in Minnesota Federal District Court seeking a court order declaring that it is not required to provide coverage for a portion of the Silzone litigation defense and indemnity expenses that the Company may incur in the future. The Company believes the claims of AIC are without merit and plans to vigorously defend against the claims AIC has asserted. The insurance broker that assisted the Company in procuring the insurance with AIC has been added as a party to the case.
Part of the Company’s final layer of insurance ($20.0 million of the final $50.0 million layer) is covered by Lumberman’s Mutual Casualty Insurance, a unit of the Kemper Insurance Companies (collectively referred to as Kemper). Prior to being no longer rated by A.M. Best, Kemper’s financial strength rating was downgraded to a “D” (poor). Kemper is currently in “run off,” which means it is no longer issuing new policies, and therefore, is not generating any new revenue that could be used to cover claims made under previously-issued policies. In the event Kemper is unable to pay claims directed to it, the Company believes the other insurance carriers in the final layer of insurance will take the position that the Company will be directly liable for any claims and costs that Kemper is unable to pay. It is possible that Silzone costs and expenses will reach the limit of the final Kemper layer of insurance coverage, and it is possible that Kemper will be unable to meet its full obligations to the Company. Therefore, the Company could incur an expense up to $20.0 million for which it would have otherwise been covered. While potential losses are possible, the Company has not accrued for any such losses as they are not probable or reasonably estimable at this time.
37
Guidant 1996 Patent Litigation: In November 1996, Guidant Corporation (Guidant), which became a subsidiary of Boston Scientific Corporation in 2006, sued the Company in federal district court for the Southern District of Indiana alleging that the Company did not have a license to certain patents controlled by Guidant covering tachycardia implantable cardioverter defibrillator systems (ICDs) and alleging that the Company was infringing those patents.
Guidant’s original suit alleged infringement of four patents by the Company. Guidant later dismissed its claim on the first patent and the district court ruled that the second patent was invalid, and this ruling was later upheld by the Court of Appeals for the Federal Circuit (CAFC). The third patent was found to be invalid by the district court. The fourth patent (the ‘288 patent) was initially found to be invalid by the district court judge, but the CAFC reversed this decision in August 2004. The case was returned to the district court in November 2004. The district court issued rulings on claims construction and a response to motions for summary judgment in March 2006. Guidant’s special request to appeal certain aspects of these rulings was rejected by the CAFC. In March 2007, the district court judge responsible for the case granted summary judgment in favor of the Company, ruling that the only remaining patent claim (the ‘288 patent) asserted against the Company in the case was invalid. In April 2007, Guidant appealed the district court’s March 2007 and March 2006 rulings. In December 2008, the CAFC upheld the March 2006 rulings of the district court but also reversed the district court’s March 2007 ruling that the ‘288 patent was invalid. As such, based on that ruling, although the invalidity of the ‘288 patent was overturned, the damages in the case going forward are limited to those relatively few instances prior to the expiration of the patent in 2003 when the cardioversion therapy method described in the only remaining claim of the ‘288 patent was actually practiced.
The parties filed requests with the CAFC requesting that the entire CAFC re-hear some of the issues addressed in the December 2008 decision, and the CAFC issued a ruling in March 2009 vacating its December 2008 decision, denying Guidant’s request for re-hearing and granting part of the Company’s request for re-hearing. In August 2009, the CAFC issued a ruling further limiting any potential damages in the case and sending the case back to the district court for further proceedings. In September 2009, Guidant filed a motion with the CAFC seeking to halt the return of the case to the district court so that Guidant could first seek to have the U.S. Supreme Court review the issue addressed in the CAFC’s August 2009 ruling. In January 2010, the Supreme Court denied Guidant’s request for Supreme Court review, and the matter will return to the district court for further proceedings. The parties have agreed to conduct a mediation meeting in March 2010.
The ‘288 patent expired in December 2003. Accordingly, the final outcome of the litigation involving the ‘288 patent cannot result in an injunction precluding the Company from selling ICD products in the future. Sales of the Company’s ICD products in which Guidant asserts infringement of the ‘288 patent were approximately 18% and 16% of the Company’s consolidated net sales during fiscal years 2003 and 2002, respectively. Additionally, based on a July 2006 agreement, in exchange for the Company’s agreement not to pursue the recovery of attorneys’ fees or assert certain claims and defenses, Guidant agreed it would not seek recovery of lost profits, prejudgment interest or a royalty rate in excess of 3% of net sales for any patents found to be infringed upon by the Company. This agreement had the effect of limiting the Company’s financial exposure. Based on this and the recent rulings in this case, the Company does not believe that any potential losses arising from any legal settlements or judgments in this case could be material to the Company’s consolidated earnings, financial position and cash flows. The Company has not accrued any amounts for legal settlements or judgments related to the Guidant 1996 patent litigation. Although the Company believes that the assertions and claims in the Guidant 1996 patent litigation are without merit, potential losses arising from any legal settlements or judgments are possible, but not reasonably estimable at this time.
Ohio OIG Investigation: In July 2007, the Company received a civil subpoena from the U.S. Department of Health and Human Services, Office of the Inspector General (OIG), requesting documents regarding the Company’s relationships with ten Ohio hospitals during the period from 2003 through 2006. The Company has received follow-up requests from the U.S. Department of Justice and the U.S. Attorney’s Office in Cleveland regarding this matter. The Company is cooperating with the investigation and is continuing to work with the OIG in responding to the subpoena.
Boston U.S. Attorney Investigation: In October 2005, the U.S. Department of Justice, acting through the U.S. Attorney’s office in Boston, commenced an industry-wide investigation into whether the provision of payments and/or services by makers of ICDs and bradycardia pacemaker systems (pacemakers) to doctors or other persons constitutes improper inducements under the federal health care program anti-kickback law. As part of this investigation, the Company received a civil subpoena from the U.S. Attorney’s office in Boston requesting documents created since January 2000 regarding the Company’s practices related to ICDs, pacemakers, lead systems and related products marketed by the Company’s CRM segment. The Company understands that its principal competitors in the cardiac rhythm management therapy areas received similar civil subpoenas. The Company received an additional subpoena from the U.S. Attorney’s office in Boston in September 2006, requesting documents created since January 2002 related to certain employee expense reports and certain ICD and pacemaker purchasing arrangements. The Company is cooperating with the investigation and has been producing documents and witnesses as requested. In December 2008, the U.S. Attorney’s Office in Boston delivered a third subpoena issued by the OIG requesting the production of documents relating to implantable cardiac rhythm device and pacemaker warranty claims. In August 2009, the U.S. Attorney’s Office in Boston delivered a fourth subpoena issued by the OIG requiring production of documents relating to four CRM post market studies. The Company is cooperating with these investigations. In connection with the first two subpoenas, in January 2010 the U.S. District Court for the District of Massachusetts unsealed a qui tam action (private individual bringing suit on behalf of the U.S. Government) filed by a former employee. The U.S. Department of Justice has decided not to intervene in the suit against the Company at this time, however continues its investigation. The Company intends to file a motion to dismiss the complaint. It is not possible to predict the outcome of this litigation at this time.
38
U.S. Department of Justice Investigation: In October 2008, the Company received a letter from the Civil Division of the U.S. Department of Justice stating that it was investigating the Company for potential False Claims Act and common law violations relating to the sale of the Company’s EpicorTM surgical ablation devices. The Department of Justice is investigating whether companies marketed surgical ablation devices for off-label treatment of atrial fibrillation. Other manufacturers of medical devices used in the treatment of atrial fibrillation have reported receiving similar letters. The letter requests that we provide documents from January 1, 2005 to present relating to U.S. Food and Drug Administration (FDA) approval and marketing of EpicorTM ablation devices. The Company is cooperating with the investigation. In July 2009, the U.S. District Court in Houston, Texas unsealed a qui tam action against the Company. Similar suits were unsealed at the same time against other manufacturers of surgical ablation devices. The Department of Justice has decided not to intervene in the suit against the Company at this time.
Securities Class Action Litigation: In April and May 2006, five shareholders, each purporting to act on behalf of a class of purchasers during the period January 25 through April 4, 2006 (the Class Period), separately sued the Company and certain of its officers in federal district court in Minnesota alleging that the Company made materially false and misleading statements during the Class Period relating to financial performance, projected earnings guidance and projected sales of ICDs. The complaints, all of which sought unspecified damages and other relief, as well as attorneys’ fees, were consolidated. In June 2009, the district court granted summary judgment in favor of the Company on all claims. The plaintiffs agreed not to appeal this matter, paid the Company certain costs and fees and provided a full release of all claims asserted in the action or that could have been asserted against the Company and the individual defendants.
Derivative Action: In February 2007, a derivative action was filed in state court in Minnesota which purported to bring claims belonging to the Company against the Company’s Board of Directors and various officers and former officers for alleged malfeasance in the management of the Company. The claims were based on substantially the same allegations as those underlying the Securities Class Action Litigation matter described above. The plaintiff’s counsel conducted an informal review of evidence from the class action and based on that review, informed the Company that it would enter into a joint stipulation dismissing the action. The Court approved the dismissal in December 2009, and the plaintiff’s complaint has been dismissed.
The Company is also involved in various other product liability lawsuits, claims and proceedings that arise in the ordinary course of business.
Regulatory Matters
The FDA inspected the Company’s manufacturing facility in Minnetonka, Minnesota at various times between December 8 and December 19, 2008. On December 19, 2008, the FDA issued a Form 483 identifying certain observed non-conformity with current Good Manufacturing Practice (cGMP) primarily related to the manufacture and assembly of the SafireTM ablation catheter with a 4 mm or 5 mm non-irrigated tip. Following the receipt of the Form 483, the Company’s Atrial Fibrillation division provided written responses to the FDA detailing proposed corrective actions and immediately initiated efforts to address the FDA’s observations of non-conformity. The Company subsequently received a warning letter dated April 17, 2009 from the FDA relating to these non-conformities with respect to this facility.
The FDA inspected the Company’s Plano, Texas manufacturing facility at various times between March 5 and April 6, 2009. On April 6, 2009, the FDA issued a Form 483 identifying certain observed non-conformities with cGMP. Following the receipt of the Form 483, the Company’s Neuromodulation division provided written responses to the FDA detailing proposed corrective actions and immediately initiated efforts to address FDA’s observations of non-conformity. The Company subsequently received a warning letter dated June 26, 2009 from the FDA relating to these non-conformities with respect to its Neuromodulation division’s Plano, Texas and Hackettstown, New Jersey facilities.
39
With respect to each of these warning letters, the FDA notes that it will not grant requests for exportation certificates to foreign governments or approve pre-market approval applications for Class III devices to which the quality system regulation deviations are reasonably related until the violations have been corrected.
Customer orders are not expected to be impacted while the Company works to resolve the FDA’s concerns. The Company is working diligently to respond timely and fully to the FDA’s requests. While the Company believes the issues raised by the FDA can be resolved without a material impact on the Company’s financial results, the FDA has recently been increasing its scrutiny of the medical device industry and raising the threshold for compliance and the government should be expected to continue to scrutinize the industry closely with inspections, and possibly enforcement actions, by the FDA or other agencies. The Company is regularly monitoring, assessing and improving its internal compliance systems and procedures so that its activities will be consistent with applicable laws, regulations and requirements, including those of the FDA.
NOTE 6 – SHAREHOLDERS’ EQUITY
Capital Stock: The Company’s authorized capital consists of 25 million shares of $1.00 per share par value preferred stock and 500 million shares of $0.10 per share par value common stock. There were no shares of preferred stock issued or outstanding during 2009, 2008 or 2007.
Share Repurchases: On October 22, 2009, the Company’s Board of Directors authorized a share repurchase program of up to $500.0 million of the Company’s outstanding common stock. The Company completed the repurchases under the program on December 11, 2009. In total, the Company repurchased 14.1 million shares for $500.0 million at an average repurchase price of $35.44 per share. On July 21, 2009, the Company’s Board of Directors authorized a share repurchase program of up to $500.0 million of the Company’s outstanding common stock. The Company completed the repurchases under the program on September 15, 2009. In total, the Company repurchased 13.0 million shares for $500.0 million at an average repurchase price of $38.32 per share. For fiscal year 2009, the Company repurchased a total of 27.1 million shares for $1.0 billion at an average repurchase price of $36.83 per share.
In February 2008, the Company’s Board of Directors authorized a share repurchase program of up to $250.0 million of the Company’s outstanding common stock. In April 2008, the Company’s Board of Directors authorized an additional $50.0 million of share repurchases as part of this share repurchase program. The Company completed the repurchases under the program on May 1, 2008. In total, the Company repurchased 6.7 million shares for $300.0 million at an average repurchase price of $44.51 per share.
In January 2007, the Company’s Board of Directors authorized a share repurchase program of up to $1.0 billion of the Company’s outstanding common stock. The Company completed the repurchases under the program on May 8, 2007. In total, the Company repurchased 23.6 million shares for $1.0 billion at an average repurchase price of $42.34 per share.
NOTE 7 – STOCK-BASED COMPENSATION
Stock
Compensation Plans
The Company’s stock compensation plans provide for the issuance of stock-based awards, such as stock options or restricted stock, to directors, officers, employees and consultants. Stock option awards under these plans have an exercise price equal to the fair market value on the date of grant, and generally, an eight-year contractual life and four-year vesting term. Since 2000, all stock option awards have been granted with an eight-year contractual term regardless of the maximum allowable under the plan. Restricted stock awards under these plans generally vest over a four-year period. During the vesting period, ownership of the shares cannot be transferred. Restricted stock is considered issued and outstanding at the grant date and has the same dividend and voting rights as other common stock. Directors can elect to receive half or their entire annual retainer in the form of a restricted stock grant with a six-month vesting term. At January 2, 2010, the Company had 11.8 million shares of common stock available for stock option grants under these plans. The Company has the ability to grant a portion of the remaining shares in the form of restricted stock. Specifically, in lieu of granting up to 10.7 million stock options under these plans, the Company may grant up to 4.8 million restricted stock awards (for certain grants of restricted stock awards, the number of shares available are reduced by 2.25 shares). Additionally, in lieu of granting up to 0.1 million stock options under these plans, the Company may grant up to 0.1 million restricted stock awards (for certain grants of restricted stock awards, the number of shares available are reduced by one share). The remaining 1.0 million shares of common stock are available for stock option grants. At January 2, 2010, there was $143.2 million of total unrecognized stock-based compensation expense, adjusted for estimated forfeitures, which is expected to be recognized over a weighted average period of 3.0 years and will be adjusted for any future changes in estimated forfeitures.
40
The Company also has an Employee Stock Purchase Plan (ESPP) that allows participating employees to purchase newly issued shares of the Company’s common stock at a discount through payroll deductions. The ESPP consists of a 12-month offering period whereby employees can purchase shares at 85% of the market value at either the beginning of the offering period or the end of the offering period, whichever price is lower. Employees purchased 0.8 million, 0.7 million and 0.7 million shares in 2009, 2008 and 2007, respectively. At January 2, 2010, 3.5 million shares of common stock were available for future purchases under the ESPP.
Valuation Assumptions
The Company uses the Black-Scholes standard option pricing model (Black-Scholes model) to determine the fair value of stock options and ESPP purchase rights. The determination of the fair value of the awards on the date of grant using the Black-Scholes model is affected by the Company’s stock price as well as assumptions of other variables, including projected employee stock option exercise behaviors, risk-free interest rate, expected volatility of the Company’s stock price in future periods and expected dividend yield. The fair value of restricted stock is based on the Company’s closing stock price on the date of grant. The weighted average fair values of restricted stock granted during fiscal years 2009, 2008 and 2007 were $39.83, $40.52 and $41.42, respectively. The weighted average fair values of ESPP purchase rights granted to employees during fiscal years 2009, 2008 and 2007were $10.49, $13.12 and $12.07, respectively.
The following table provides the weighted average fair value of stock options granted to employees during fiscal years 2009, 2008 and 2007 and the related weighted average assumptions used in the Black-Scholes model:
|
|
|
|
|
|
|
|
|
|
|
|
|
|
|
2009 |
|
2008 |
|
2007 |
|
|||
|
Fair value of options granted |
|
$ |
12.17 |
|
$ |
9.99 |
|
$ |
13.13 |
|
|
|
||||||||||
|
Assumptions: |
|
|
|
|
|
|
|
|
|
|
|
Expected life (years) |
|
|
4.7 |
|
|
4.2 |
|
|
4.2 |
|
|
Risk-free interest rate |
|
|
2.3 |
% |
|
1.8 |
% |
|
3.6 |
% |
|
Volatility |
|
|
32.8 |
% |
|
37.3 |
% |
|
33.4 |
% |
|
Dividend yield |
|
|
0 |
% |
|
0 |
% |
|
0 |
% |
Expected life: The Company analyzes historical employee exercise and termination data to estimate the expected life assumption. Annually, the Company updates these assumptions unless circumstances would indicate a more frequent update is necessary. The Company uses different expected lives for the general employee population compared to the officer and director population, as the Company’s expected life analysis continues to show that officers and directors hold their stock options for a longer period of time before exercising compared to the rest of the employee population. As a result, the Company continues to use two different populations for estimating its expected life assumptions in determining the fair value of its stock options.
Risk-free interest rate: The rate is based on the U.S. Treasury zero-coupon yield curve on the grant date for a maturity equal to or approximating the expected life of the options.
Volatility: Effective in the fourth quarter of 2008, the Company calculates its expected volatility assumption by blending the historical and implied volatility. The historical volatility is based on the daily closing prices of the Company’s common stock over a period equal to the expected term of the option. Market-based implied volatility is based on utilizing market data of actively traded options on the Company’s stock, from options at- or near-the-money, at a point in time as close to the grant date of the employee options as reasonably practical and with similar terms to the employee share option, or a remaining maturity of at least six months if no similar terms are available. The historical volatility of the Company’s common stock price over the expected term of the option is a strong indicator of the expected future volatility. In addition, implied volatility takes into consideration market expectations of how future volatility will differ from historical volatility. The Company does not believe that one estimate is more reliable than the other, and as a result, the Company uses an equal weighting of historical volatility and market-based implied volatility. Prior to the fourth quarter of 2008, the Company calculated the expected volatility assumption exclusively on market-based implied volatility. The impact of changing the method of determining expected volatility was not material to fiscal year 2008 or fiscal year 2009 stock compensation expense. The Company changed the method of determining expected volatility to take into consideration how future volatility experience over the expected life of the option may differ from short-term volatility experience and thus provide a better estimate of expected volatility over the expected life of employee stock options.
41
Dividend yield: The Company does not anticipate paying any cash dividends in the foreseeable future and therefore a dividend yield of zero is assumed.
Stock Option and Restricted Stock Activity
The following table summarizes stock option activity under all stock compensation plans during the fiscal year ended January 2, 2010:
|
|
|
|
|
|
|
|
|
|
|
|
|
|
|
|
|
|
Options |
|
Weighted |
|
Weighted |
|
Aggregate |
|
||||
|
Outstanding at January 3, 2009 |
|
|
37,321 |
|
$ |
32.76 |
|
|
|
|
|
|
|
|
Granted |
|
|
6,579 |
|
|
38.39 |
|
|
|
|
|
|
|
|
Canceled |
|
|
(1,633 |
) |
|
38.49 |
|
|
|
|
|
|
|
|
Exercised |
|
|
(5,539 |
) |
|
18.12 |
|
|
|
|
|
|
|
|
Outstanding at January 2, 2010 |
|
|
36,728 |
|
$ |
35.73 |
|
|
5.0 |
|
$ |
135,032 |
|
|
Vested and expected to vest |
|
|
34,078 |
|
$ |
35.71 |
|
|
4.8 |
|
$ |
129,042 |
|
|
Exercisable at January 2, 2010 |
|
|
21,443 |
|
$ |
35.60 |
|
|
3.5 |
|
$ |
99,953 |
|
The aggregate intrinsic value of options outstanding and options exercisable is based on the Company’s closing stock price on the last trading day of the fiscal year for in-the-money options. The total intrinsic value of options exercised during fiscal years 2009, 2008 and 2007 was $106.6 million, $182.6 million and $335.5 million, respectively.
The following table summarizes restricted stock activity under all stock compensation plans during the fiscal year ended January 2, 2010:
|
|
|
|
|
|
|
|
|
|
|
|
Restricted Stock |
|
Weighted Average |
|
||
|
Unvested balance at January 3, 2009 |
|
|
67 |
|
$ |
46.61 |
|
|
Granted |
|
|
11 |
|
|
39.83 |
|
|
Vested |
|
|
(70 |
) |
|
46.32 |
|
|
Canceled |
|
|
— |
|
|
— |
|
|
Unvested balance at January 2, 2010 |
|
|
8 |
|
$ |
39.89 |
|
The total fair value of restricted stock vested during fiscal years 2009, 2008 and 2007 was $2.5 million, $3.1 million and $3.3 million, respectively.
NOTE 8 – PURCHASED IN-PROCESS RESEARCH AND DEVELOPMENT (IPR&D) AND SPECIAL CHARGES
IPR&D Charges
Fiscal Year 2009
During 2009, the Company recorded IPR&D charges of $5.8 million in conjunction with the purchase of intellectual property in its CV and NMD segments since the related technological feasibility had not yet been reached and such technology had no future alternative use.
Fiscal Year 2008
MediGuide, Inc.: In December 2008, the Company acquired privately-held MediGuide, a development-stage company that has been focused on developing its gMPSTM technology for localization and tracking capability for interventional medical devices. The acquisition provides the Company with exclusive rights to use and develop the gMPSTM technology. As MediGuide was a development-stage company, the excess of the purchase price over the fair value of the net assets acquired was allocated on a pro-rata basis to the net assets acquired. Accordingly, the excess purchase price was allocated to IPR&D, the principal asset acquired. At the date of acquisition, $306.2 million of the purchase price was expensed as IPR&D since technological feasibility of the underlying projects had not yet been reached and such technology had no future alternative use. Through January 2, 2010, the Company has incurred costs of approximately $10 million related to these projects. The Company expects to incur an additional $20 million to bring the technology to commercial viability on a worldwide basis within one to two years.
42
Other: In December 2008, the Company also made an additional minority investment in a development-stage company and, in accordance with step-acquisition accounting treatment under the equity method of accounting, allocated the excess purchase price over the fair value of the investee’s net assets to IPR&D, the principal asset acquired. At the December 2008 investment date, $11.6 million of IPR&D was expensed since technological feasibility of the underlying projects had not yet been reached and such technology had no future alternative use. The Company also recognized $1.6 million of IPR&D charges in 2008 related to the purchase of intellectual property in its CRM and CV segments since the related technological feasibility had not yet been reached and such technology had no future alternative use.
Savacor, Inc.: In December 2005, the Company acquired privately-held Savacor, Inc. (Savacor) to complement the Company’s development efforts in heart failure diagnostic and therapy guidance products. Through January 2, 2010, the Company has incurred costs of approximately $19 million from the related Savacor IPR&D projects. The Company expects to incur an additional $32 million to bring the device to commercial viability on a worldwide basis within four years.
Special Charges
Fiscal Year 2009
Employee Termination Costs: The Company incurred charges totaling $107.7 million, of which $71.1 million related to severance and benefit costs for approximately 725 employees. These costs were recognized after management determined that such severance and benefits were probable and estimable, in accordance with ASC Topic 712, Nonretirement Postemployment Benefits. The terminations consisted of approximately 440 employees in the Company’s U.S. and International selling divisions in an effort to enhance the efficiency and effectiveness of the sales, marketing and customer service operations in these organizations and approximately 285 employees in the Company’s manufacturing divisions related to continuing efforts to streamline the Company’s production activities. Of the total $71.1 million charge, $6.6 million was recorded in cost of sales.
Inventory Charges: The Company recorded a $17.7 million charge in cost of sales relating to inventory that would be scrapped in connection with the Company’s decision to terminate certain product lines in its CRM and AF divisions that were redundant with other existing products lines.
Fixed Asset Charges: The Company recorded a $5.9 million charge in cost of sales associated with the accelerated depreciation of phasing out older model diagnostic equipment. The Company also recognized $6.1 million of asset write-offs related to the carrying value of assets that will no longer be utilized. Of the $6.1 million charge, $3.5 million was recorded in cost of sales.
Other Charges: The Company recorded charges of $1.8 million associated with contract terminations and $5.1 million of other unrelated costs.
A summary of the activity related to the 2009 special charge accrual is as follows (in thousands):
|
|
|
|
|
|
|
|
|
|
|
|
|
|
|
|
|
|
|
|
|
Employee |
|
Inventory |
|
Fixed asset |
|
Other |
|
Total |
|
|||||
|
Balance at January 3, 2009 |
|
$ |
— |
|
$ |
— |
|
$ |
— |
|
$ |
— |
|
$ |
— |
|
|
Special charges |
|
|
71,158 |
|
|
17,735 |
|
|
11,982 |
|
|
6,869 |
|
|
107,744 |
|
|
Non-cash charges used |
|
|
— |
|
|
(17,735 |
) |
|
(11,982 |
) |
|
— |
|
|
(29,717 |
) |
|
Cash payments |
|
|
(22,560 |
) |
|
— |
|
|
— |
|
|
(349 |
) |
|
(22,909 |
) |
|
Foreign exchange rate impact |
|
|
(758 |
) |
|
— |
|
|
— |
|
|
— |
|
|
(758 |
) |
|
Balance at January 2, 2010 |
|
$ |
47,840 |
|
$ |
— |
|
$ |
— |
|
$ |
6,520 |
|
$ |
54,360 |
|
43
In order to enhance segment comparability and reflect management’s focus on the ongoing operations of the Company, the 2009 special charges have not been recorded in the individual reportable segments.
Fiscal Year 2008
Impairment Charges: In 2008, the Company determined that a large portion of the technology under the license agreement covering certain CRM devices was no longer fully utilized in the Company’s products and that certain of the patents under the license were no longer valid based upon recent patent law developments. Based upon these developments and changes in circumstances, the Company recognized an impairment charge of $43.5 million to cost of sales to write its intangible asset for the technology license agreement down to its fair value.
Based upon unfavorable 2008 sales performance as well as termination of a clinical trial, the Company reduced the future revenue and cash flow projections relating to certain products lines acquired from Velocimed in 2005. Accordingly, the Company tested the related purchased technology intangible assets for impairment and recognized a $37.0 million impairment charge to write down the related intangible assets to their fair value. The Company also recognized other impairment charges of $5.8 million in 2008 primarily related to assets in the Cardiovascular division that will no longer be utilized.
In December 2008, the Company decided to discontinue the use of the ANS tradename. The Company had acquired ANS in November 2005 and used the related tradename through its discontinuance in December 2008. Accordingly, the Company wrote off the ANS tradename intangible assets and recognized a $1.7 million impairment charge.
Inventory Charges: The Company entered into purchase contracts in the normal course of business for certain raw material commodities that are used in the manufacture of its products. Favorable decreases in commodity prices resulted in the Company’s electing to terminate and exit the contracts, paying $10.7 million in termination costs, which was recorded as a special charge in cost of sales.
The Company also recognized inventory obsolescence charges related to inventory not expected to be sold due to the termination of a distribution agreement in Japan. When the Company elected to terminate the distribution agreement in December 2007, the Company recorded a $4.0 million special charge in 2007 related to inventory that it estimated would not be sold. The Company increased this estimate in 2008 and recorded an additional $3.0 million charge in cost of sales.
Other Charges: In 2008, the Company launched its MerlinTM @home wireless patient monitoring system and committed to provide this system without charge to existing St. Jude Medical CRM patients. In connection with the completion of this roll-out in the fourth quarter of 2008, the Company recorded a $7.4 million special charge in cost of sales to accrue for the related costs. The Company also recognized $5.5 million of other unrelated costs.
In order to enhance segment comparability and reflect management’s focus on the ongoing operations of the Company, the 2008 special charges have not been recorded in the individual reportable segments.
Fiscal Year 2007
Patent Litigation: In June 2007, the Company settled a patent litigation matter with Guidant (a subsidiary of Boston Scientific) and Mirowski Family Ventures, L.L.C. and recorded a charge of $35.0 million.
Restructuring Activities: In December 2007, Company management initiated efforts to streamline its operations and implemented restructuring actions primarily focused at international locations. As a result, the Company recorded charges totaling $29.1 million in 2007 consisting of employee termination costs ($17.9 million) and other costs ($11.2 million). Of the total $29.1 million charge, $5.9 million was recorded in cost of sales. Employee termination costs related to severance and benefit costs for approximately 200 individuals identified for employment termination. These costs were recognized after management determined that such severance and benefits were probable and estimable, in accordance with ASC Topic 712, Nonretirement Postemployment Benefits. Other costs primarily represented contract termination costs. These restructuring activities and all related payments have been completed.
Impairment Charges: The Company recognized impairment charges of $23.7 million related to acquired intangible assets associated with a distribution agreement with a supplier of medical products to the Company’s Japanese distribution subsidiary. In December 2007, the Company provided notice to the supplier that it was terminating the distribution agreement, effective in June 2008. As a result, the Company recognized an impairment charge to state the related intangible assets at their remaining fair value. The Company had acquired these intangible assets as part of its acquisition of Getz Bros. Co., Ltd. (Getz Japan) in April 2003. The distribution agreement was terminated in June 2008.
44
Additionally, in connection with the Company completing its United States roll-out of the Merlin™ programmer platform for its ICDs and pacemakers, the Company recorded an $11.8 million charge in cost of sales to write off the remaining carrying value of older model programmer diagnostic equipment. The Company also recognized $6.0 million of asset write-offs relating to the carrying value of assets that will no longer be utilized, of which $2.5 million was recorded in cost of sales.
Discontinued Inventory: The Company recorded a $14.1 million charge in cost of sales relating to inventory that would be scrapped in connection with the Company’s decision to terminate certain product lines in its CV and AF divisions that were redundant with other existing products lines. Additionally, in connection with the Company’s decision to terminate a distribution agreement in Japan (see Impairment Charges discussed previously), the Company recorded a $4.0 million charge in cost of sales to write off the related inventory that will not be sold.
In order to enhance segment comparability and reflect management’s focus on the ongoing operations of the Company, the 2007 special charges have not been recorded in the individual reportable segments.
NOTE 9 – OTHER INCOME (EXPENSE), NET
The Company’s other income (expense) consisted of the following (in thousands):
|
|
|
|
|
|
|
|
|
|
|
|
|
(in thousands) |
|
2009 |
|
2008 |
|
2007 |
|
|||
|
|
||||||||||
|
Interest income |
|
$ |
2,057 |
|
$ |
16,315 |
|
$ |
4,374 |
|
|
Interest expense |
|
|
(45,603 |
) |
|
(72,554 |
) |
|
(72,258 |
) |
|
Other |
|
|
(12,107 |
) |
|
(18,040 |
) |
|
(15,343 |
) |
|
Other income (expense), net |
|
$ |
(55,653 |
) |
$ |
(74,279 |
) |
$ |
(83,227 |
) |
The Company classifies investment impairment charges and realized gains or losses from the sale of investments as other income (expense). The Company recognized impairment charges of $8.3 million, $12.9 million and $25.1 million in 2009, 2008 and 2007, respectively (see Note 12). In 2007, the Company also recognized a realized gain of $7.9 million related to the sale of the Company’s Conor Medical, Inc. common stock investment.
NOTE 10 – INCOME TAXES
The Company’s earnings before income taxes were generated from its U.S. and international operations as follows (in thousands):
|
|
|
|
|
|
|
|
|
|
|
|
|
|
|
2009 |
|
2008 |
|
2007 |
|
|||
|
U.S. |
|
$ |
559,868 |
|
$ |
530,843 |
|
$ |
516,493 |
|
|
International |
|
|
497,525 |
|
|
49,925 |
|
|
193,783 |
|
|
Earnings before income taxes |
|
$ |
1,057,393 |
|
$ |
580,768 |
|
$ |
710,276 |
|
Income tax expense consisted of the following (in thousands):
|
|
|
|
|
|
|
|
|
|
|
|
|
|
|
2009 |
|
2008 |
|
2007 |
|
|||
|
Current: |
|
|
|
|
|
|
|
|
|
|
|
U.S. federal |
|
$ |
212,721 |
|
$ |
198,179 |
|
$ |
141,997 |
|
|
U.S. state and other |
|
|
23,292 |
|
|
26,863 |
|
|
12,421 |
|
|
International |
|
|
58,212 |
|
|
53,070 |
|
|
37,078 |
|
|
Total current |
|
|
294,225 |
|
|
278,112 |
|
|
191,496 |
|
|
|
||||||||||
|
Deferred |
|
|
(14,058 |
) |
|
(50,362 |
) |
|
(18,976 |
) |
|
Income tax expense |
|
$ |
280,167 |
|
$ |
227,750 |
|
$ |
172,520 |
|
45
The tax effects of the cumulative temporary differences between the tax bases of assets and liabilities and their respective carrying amounts for financial statement purposes were as follows (in thousands):
|
|
|
|
|
|
|
|
|
|
|
|
2009 |
|
2008 |
|
||
|
Deferred income tax assets: |
|
|
|
|
|
|
|
|
Net operating loss carryforwards |
|
$ |
22,057 |
|
$ |
26,411 |
|
|
Tax credit carryforwards |
|
|
59,623 |
|
|
53,412 |
|
|
Inventories |
|
|
115,247 |
|
|
106,055 |
|
|
Stock-based compensation |
|
|
56,837 |
|
|
45,556 |
|
|
Accrued liabilities and other |
|
|
148,607 |
|
|
119,052 |
|
|
Deferred income tax assets |
|
|
402,371 |
|
|
350,486 |
|
|
Deferred income tax liabilities: |
|
|
|
|
|
|
|
|
Unrealized gain on available-for-sale securities |
|
|
(7,584 |
) |
|
(2,792 |
) |
|
Property, plant and equipment |
|
|
(168,173 |
) |
|
(132,470 |
) |
|
Intangible assets |
|
|
(194,268 |
) |
|
(190,413 |
) |
|
Deferred income tax liabilities |
|
|
(370,025 |
) |
|
(325,675 |
) |
|
Net deferred income tax assets |
|
$ |
32,346 |
|
$ |
24,811 |
|
The Company has not recorded any valuation allowance for its deferred tax assets as of January 2, 2010 or January 3, 2009 as the Company believes that its deferred tax assets, including the net operating and capital loss carryforwards, will be fully realized based upon its estimates of future taxable income.
A reconciliation of the U.S. federal statutory income tax rate to the Company’s effective income tax rate is as follows:
|
|
|
|
|
|
|
|
|
|
|
|
|
|
|
2009 |
|
2008 |
|
2007 |
|
|||
|
U.S. federal statutory tax rate |
|
|
35.0 |
% |
|
35.0 |
% |
|
35.0 |
% |
|
Increase (decrease) in tax rate resulting from: |
|
|
|
|
|
|
|
|
|
|
|
U.S. state income taxes, net of federal tax benefit |
|
|
1.6 |
|
|
3.3 |
|
|
2.1 |
|
|
International taxes at lower rates |
|
|
(6.4 |
) |
|
(9.9 |
) |
|
(8.3 |
) |
|
Tax benefits from domestic manufacturer’s deduction |
|
|
(0.9 |
) |
|
(1.7 |
) |
|
(0.8 |
) |
|
Research and development credits |
|
|
(2.9 |
) |
|
(6.0 |
) |
|
(3.9 |
) |
|
Non-deductible IPR&D charges |
|
|
— |
|
|
19.2 |
|
|
— |
|
|
Other |
|
|
0.1 |
|
|
(0.7 |
) |
|
0.2 |
|
|
Effective income tax rate |
|
|
26.5 |
% |
|
39.2 |
% |
|
24.3 |
% |
The Company’s 2008 effective tax rate was unfavorably impacted by 19.2 percentage points relating to non-deductible IPR&D charges. The Company’s effective income tax rate is favorably impacted by Puerto Rican tax exemption grants, which result in Puerto Rico earnings being partially tax exempt through the year 2023.
At January 2, 2010, the Company had $55.8 million of U.S. federal net operating and capital loss carryforwards and $0.6 million of U.S. tax credit carryforwards that will expire from 2012 through 2027 if not utilized. The Company also has state net operating loss carryforwards of $22.6 million that will expire from 2012 through 2015 and tax credit carryforwards of $90.9 million that have an unlimited carryforward period. These amounts are subject to annual usage limitations. The Company’s net operating loss carryforwards arose primarily from acquisitions.
The Company has not recorded U.S. deferred income taxes on $1,352.6 million of its non-U.S. subsidiaries’ undistributed earnings because such amounts are intended to be reinvested outside the United States indefinitely.
The Company records all income tax accruals in accordance with ASC Topic 740, Income Taxes. At January 2, 2010, the liability for unrecognized tax benefits was $120.5 million, and the accrual for interest and penalties was $28.3 million. At January 3, 2009, the liability for unrecognized tax benefits was $82.7 million, and the accrual for interest and penalties was $21.7 million. The Company recognizes interest and penalties related to income tax matters in income tax expense. The Company recognized interest and penalties, net of tax benefit, of $4.3 million and $2.8 million, during fiscal years 2009 and 2008, respectively. The Company does not expect its unrecognized tax benefits to change significantly over the next 12 months.
46
The following table summarizes the activity related to the Company’s unrecognized tax benefits (in thousands):
|
|
|
|
|
|
|
|
|
|
|
|
2009 |
|
2008 |
|
||
|
Balance at beginning of year |
|
$ |
82,692 |
|
$ |
95,260 |
|
|
Increases related to current year tax positions |
|
|
36,327 |
|
|
5,136 |
|
|
Increases related to prior year tax positions |
|
|
5,303 |
|
|
5,043 |
|
|
Reductions related to prior year tax positions |
|
|
(586 |
) |
|
(22,667 |
) |
|
Reductions related to settlements / payments |
|
|
(50 |
) |
|
— |
|
|
Expiration of the statute of limitations for the assessment of taxes |
|
|
(3,169 |
) |
|
(80 |
) |
|
Balance at end of year |
|
$ |
120,517 |
|
$ |
82,692 |
|
The Company is subject to U.S. federal income tax as well as income tax of multiple state and foreign jurisdictions. The Company has substantially concluded all U.S. federal income tax matters for all tax years through 2001. Additionally, substantially all material foreign, state, and local income tax matters have been concluded for all tax years through 1999. The U.S. Internal Revenue Service (IRS) completed an audit of the Company’s 2002-2005 tax returns, and proposed adjustments in its audit report issued in November 2008. The Company intends to vigorously defend its positions and initiated defense of these adjustments at the IRS appellate level in January 2009. An unfavorable outcome could have a material negative impact on the Company’s effective income tax rate in future periods.
NOTE 11 – RETIREMENT PLANS
Defined Contribution Plans: The Company has a 401(k) profit sharing plan that provides retirement benefits to substantially all full-time U.S. employees. Eligible employees may contribute a percentage of their annual compensation, subject to IRS limitations, with the Company matching a portion of the employees’ contributions. The Company also may contribute a portion of its earnings to the plan based upon Company performance. The Company’s matching and profit sharing contributions are at the discretion of the Company’s Board of Directors. In addition, the Company has defined contribution programs for employees in certain countries outside the United States. Company contributions under all defined contribution plans totaled $22.2 million, $63.2 million and $54.9 million in 2009, 2008 and 2007, respectively.
The Company also has a non-qualified deferred compensation plan that provides certain officers and employees the ability to defer a portion of their compensation until a later date. The deferred amounts and earnings thereon are payable to participants, or designated beneficiaries, at specified future dates upon retirement, death or termination from the Company. The deferred compensation liability, which is classified as other liabilities, was approximately $160 million and $108 million at January 2, 2010 and January 3, 2009, respectively.
Defined Benefit Plans: The Company has funded and unfunded defined benefit plans for employees in certain countries outside the United States. The Company had an accrued liability totaling $30.2 million and $25.5 million at January 2, 2010 and January 3, 2009, respectively, which approximated the actuarially calculated unfunded liability. The amount of funded plan assets and the amount of pension expense was not material.
NOTE 12 – FAIR VALUE MEASUREMENTS AND FINANCIAL INSTRUMENTS
The fair value measurement accounting standard, codified in ASC Topic 820, provides a framework for measuring fair value and defines fair value as the price that would be received to sell an asset or paid to transfer a liability. Fair value is a market-based measurement that should be determined using assumptions that market participants would use in pricing an asset or liability. The standard establishes a valuation hierarchy for inputs used in measuring fair value that maximizes the use of observable inputs and minimizes the use of unobservable inputs by requiring that the most observable inputs be used when available. Observable inputs are inputs market participants would use in valuing the asset or liability developed based on independent market data sources. Unobservable inputs are inputs that reflect the Company’s assumptions about the factors market participants would use in valuing the asset or liability developed based upon the best information available. The valuation hierarchy is composed of three categories. The categorization within the valuation hierarchy is based on the lowest level of input that is significant to the fair value measurement.
47
The categories within the valuation hierarchy are described as follows:
|
|
|
|
|
|
• |
Level 1 – Inputs to the fair value measurement are quoted prices in active markets for identical assets or liabilities. |
|
|
|
|
|
|
• |
Level 2 – Inputs to the fair value measurement include quoted prices in active markets for similar assets or liabilities, quoted prices for identical or similar assets or liabilities in markets that are not active, and inputs other than quoted prices that are observable for the asset or liability, either directly or indirectly. |
|
|
|
|
|
|
• |
Level 3 – Inputs to the fair value measurement are unobservable inputs or valuation techniques. |
Assets and Liabilities that are Measured at Fair Value on a Recurring Basis
The fair value measurement standard applies to certain financial assets and liabilities that are measured at fair value on a recurring basis (each reporting period). These financial assets and liabilities include money-market securities, trading marketable securities, available-for-sale marketable securities and derivative instruments. The Company had previously and will continue to record these items at fair value on a recurring basis; however, the fair value measurements are now applied using ASC Topic 820. The Company does not have any material nonfinancial assets and liabilities that are measured at fair value on a recurring basis. A summary of the valuation methodologies used for the respective financial assets and liabilities measured at fair value is as follows:
Money-market securities: The Company’s money-market securities include funds that are traded in active markets and are recorded at fair value based upon the quoted market prices. The Company classifies these securities as level 1.
Trading securities: The Company’s trading securities include publically-traded mutual funds that are traded in active markets and are recorded at fair value based upon the net asset values of shares. The Company classifies these securities as level 1.
Available-for-sale securities: The Company’s available-for-sale securities include publically-traded equity securities that are traded in active markets and are recorded at fair value based upon the closing stock prices. The Company classifies these securities as level 1.
Derivative instruments: The Company’s derivative instruments consist of foreign currency exchange contracts and interest rate swap contracts. The Company classifies these instruments as level 2 as inputs other than observable quoted market prices are used to determine fair value. These inputs include spot and forward foreign currency exchange rates and interest rates that the Company obtains from standard market data providers. The fair value of the Company’s foreign currency exchange contracts was not material at January 2, 2010 or January 3, 2009.
A summary of financial assets measured at fair value on a recurring basis at January 2, 2010 and January 3, 2009 is as follows (in thousands):
|
|
|
|
|
|
|
|
|
|
|
|
|
|
|
|
|
|
January 2, 2010 |
|
Quoted Prices |
|
Significant |
|
Significant |
|
||||
|
Assets |
|
|
|
|
|
|
|
|
|
|
|
|
|
|
Money market securities |
|
$ |
258,936 |
|
$ |
258,936 |
|
$ |
— |
|
$ |
— |
|
|
Trading marketable securities |
|
|
160,285 |
|
|
160,285 |
|
|
— |
|
|
— |
|
|
Available-for-sale marketable securities |
|
|
31,711 |
|
|
31,711 |
|
|
— |
|
|
— |
|
|
Total |
|
$ |
450,932 |
|
$ |
450,932 |
|
$ |
— |
|
$ |
— |
|
48
|
|
|
|
|
|
|
|
|
|
|
|
|
|
|
|
|
|
January 3, 2009 |
|
Quoted Prices |
|
Significant |
|
Significant |
|
||||
|
Assets |
|
|
|
|
|
|
|
|
|
|
|
|
|
|
Money market securities |
|
$ |
1,474 |
|
$ |
1,474 |
|
$ |
— |
|
$ |
— |
|
|
Trading marketable securities |
|
|
107,913 |
|
|
107,913 |
|
|
— |
|
|
— |
|
|
Available-for-sale marketable securities |
|
|
22,065 |
|
|
22,065 |
|
|
— |
|
|
— |
|
|
Total |
|
$ |
131,452 |
|
$ |
131,452 |
|
$ |
— |
|
$ |
— |
|
|
|
|
|
|
|
|
|
|
|
|
|
|
|
|
|
Liabilities |
|
|
|
|
|
|
|
|
|
|
|
|
|
|
Interest rate swap contracts |
|
|
658 |
|
|
— |
|
|
658 |
|
|
— |
|
|
Total |
|
$ |
658 |
|
$ |
— |
|
$ |
658 |
|
$ |
— |
|
The Company’s money market securities are also classified as cash equivalents as the funds are highly liquid investments readily convertible to cash. The Company also had $134.0 million and $134.9 million of cash equivalents invested in short-term time deposits and interest and non-interest bearing bank accounts at January 2, 2010 and January 3, 2009, respectively.
Assets and Liabilities that are Measured at Fair Value on a Nonrecurring Basis
At the beginning of fiscal year 2009, the fair value measurement standard also applies to certain nonfinancial assets and liabilities that are measured at fair value on a nonrecurring basis. For example, certain long-lived assets like intangible assets and property, plant and equipment are measured at fair value in connection with business combinations or when an impairment is recognized and the related assets are written down to fair value. The Company recognized $16.0 million of net identifiable tangible and intangible assets and liabilities recognized in connection with business combinations in fiscal year 2009. There was no material impairments of the Company’s long-lived assets recognized in fiscal year 2009.
The Company also holds investments in equity securities that are accounted for as cost method investments, which are classified as other current assets. The carrying value of these investments approximated $57 million at January 2, 2010 and $50 million at January 3, 2009. These cost method investments are measured at fair value on a nonrecurring basis. The fair value of the Company’s cost method investments is not estimated if there are no identified events or changes in circumstance that may have a significant adverse effect on the fair value of these investments. During 2009, the Company determined that the fair value of a cost method investment was below its carrying value and that the carrying value of the investment would not be recoverable within a reasonable period of time. As a result, the Company recognized an $8.3 million impairment charge in other expense (see Note 9), reducing the $13.5 million carrying value of the investment to $5.2 million. The fair value of this investment was measured using market participant valuations from recent and proposed equity offerings for this company (Level 3).
Prior to adopting the fair value measurement accounting guidance of ASC Topic 820, Company recorded other cost method investment impairment charges in 2008 and 2007 of $12.2 million and $25.1 million, respectively. The Company evaluated the fair values of the related investments and determined that the impairments were other-than-temporary based upon the magnitude and length of time that the investments’ fair values had declined.
Fair Value of Other Financial Instruments
The aggregate fair value of the Company’s 2014 Senior Notes and 2019 Senior Notes at January 2, 2010 (measured using quoted prices in active markets) was $1,216.8 million compared to the aggregate carrying value of $1,193.0 million. The fair value of the Company’s other debt obligations approximated their aggregate $729.4 million carrying value due to the variable interest rate and short-term nature of these instruments.
NOTE 13 – DERIVATIVE FINANCIAL INSTRUMENTS
The Company follows the provisions of ASC Topic 815 in accounting for and disclosing derivative instruments and hedging activities. All derivative financial instruments are recognized on the balance sheet at fair value. Changes in the fair value of derivatives are recognized in net earnings or other comprehensive income depending on whether the derivative is designated as part of a qualifying hedging transaction. Derivative assets and derivative liabilities are classified as other current assets and other current liabilities, respectively.
49
The Company hedges a portion of its foreign currency exchange rate risk through the use of forward exchange contracts. The Company uses forward exchange contracts to manage foreign currency exposures related to intercompany receivables and payables arising from intercompany purchases of manufactured products. These forward contracts are not designated as qualifying hedging relationships under ASC Topic 815. The Company measures its foreign currency exchange contracts at fair value on a recurring basis. The fair value of outstanding contracts was immaterial as of January 2, 2010. During fiscal years 2009 and 2008, the net amount of gains (losses) the Company recorded to other income (expense) for its forward currency exchange contracts not designated as hedging instruments under ASC Topic 815 was a net loss of $6.7 million and a net loss of $7.5 million, respectively. These net losses were almost entirely offset by corresponding net gains on the foreign currency exposures being managed. The Company does not enter into contracts for trading or speculative purposes. The Company’s policy is to enter into hedging contracts with major financial institutions that have at least an “A” (or equivalent) credit rating.
In November 2008, the Company entered into an interest rate swap contract to convert $400.0 million of variable-rate borrowings under the Credit Facility into fixed-rate borrowings (see Note 4). The Company designated this interest rate swap as a cash flow hedge under ASC Topic 815. This contract terminated in February 2009. The ineffective portion of the amount of gains (losses) recognized in net earnings was immaterial. The Company recorded the $0.4 million after-tax loss on the settlement of the interest rate swap contract to interest expense.
NOTE 14 – SEGMENT AND GEOGRAPHIC INFORMATION
Segment Information: The Company’s four operating segments are Cardiac Rhythm Management (CRM), Cardiovascular (CV), Atrial Fibrillation (AF), and Neuromodulation (NMD). The primary products produced by each operating segment are: CRM – ICDs and pacemakers; CV – vascular closure devices, heart valve replacement and repair products and pressure measurement guidewires; AF – EP introducers and catheters, advanced cardiac mapping, navigation and recording systems and ablation systems; and NMD – neurostimulation devices.
The Company has aggregated the four operating segments into two reportable segments based upon their similar operational and economic characteristics: CRM/NMD and CV/AF. Net sales of the Company’s reportable segments include end-customer revenues from the sale of products they each develop and manufacture or distribute. The costs included in each of the reportable segments’ operating results include the direct costs of the products sold to customers and operating expenses managed by each of the reportable segments. Certain operating expenses managed by the Company’s selling and corporate functions, including all stock-based compensation expense, impairment charges, IPR&D charges and special charges have not been recorded in the individual reportable segments. As a result, reportable segment operating profit is not representative of the operating profit of the products in these reportable segments. Additionally, certain assets are managed by the Company’s selling and corporate functions, principally including trade receivables, inventory, corporate cash and cash equivalents and deferred income taxes. For management reporting purposes, the Company does not compile capital expenditures by reportable segment; therefore, this information has not been presented as it is impracticable to do so.
50
The following table presents certain financial information by reportable segment (in thousands):
|
|
|
|
|
|
|
|
|
|
|
|
|
|
|
|
|
|
CRM/NMD |
|
CV/AF |
|
Other |
|
Total |
|
||||
|
|
|||||||||||||
|
Fiscal Year 2009 |
|
|
|
|
|
|
|
|
|
|
|
|
|
|
Net sales |
|
$ |
3,099,800 |
|
$ |
1,581,473 |
|
$ |
— |
|
$ |
4,681,273 |
|
|
Operating profit |
|
|
1,931,929 |
|
|
829,966 |
|
|
(1,648,849 |
) |
|
1,113,046 |
|
|
Depreciation and amortization expense |
|
|
83,506 |
|
|
45,765 |
|
|
84,194 |
|
|
213,465 |
|
|
Total assets |
|
|
2,124,534 |
|
|
1,294,009 |
|
|
3,007,268 |
|
|
6,425,811 |
|
|
|
|||||||||||||
|
Fiscal Year 2008 |
|
|
|
|
|
|
|
|
|
|
|
|
|
|
Net sales |
|
$ |
2,955,603 |
|
$ |
1,407,648 |
|
$ |
— |
|
$ |
4,363,251 |
|
|
Operating profit |
|
|
1,824,023 |
|
|
736,979 |
|
|
(1,905,955 |
) |
|
655,047 |
|
|
Depreciation and amortization expense |
|
|
93,397 |
|
|
38,743 |
|
|
70,288 |
|
|
202,428 |
|
|
Total assets |
|
|
2,018,478 |
|
|
1,267,290 |
|
|
2,436,736 |
|
|
5,722,504 |
|
|
|
|||||||||||||
|
Fiscal Year 2007 |
|
|
|
|
|
|
|
|
|
|
|
|
|
|
Net sales |
|
$ |
2,577,975 |
|
$ |
1,201,302 |
|
$ |
— |
|
$ |
3,779,277 |
|
|
Operating profit |
|
|
1,576,439 |
|
|
579,325 |
|
|
(1,362,261 |
) |
|
793,503 |
|
|
Depreciation and amortization expense |
|
|
96,764 |
|
|
35,731 |
|
|
65,170 |
|
|
197,665 |
|
|
Total assets |
|
|
1,977,174 |
|
|
769,194 |
|
|
2,583,036 |
|
|
5,329,404 |
|
Net sales by class of similar products for the respective fiscal years were as follows (in thousands):
|
|
|
|
|
|
|
|
|
|
|
|
|
Net Sales |
|
2009 |
|
2008 |
|
2007 |
|
|||
|
Cardiac rhythm management |
|
$ |
2,769,034 |
|
$ |
2,701,463 |
|
$ |
2,368,081 |
|
|
Cardiovascular |
|
|
953,620 |
|
|
862,136 |
|
|
790,630 |
|
|
Atrial fibrillation |
|
|
627,853 |
|
|
545,512 |
|
|
410,672 |
|
|
Neuromodulation |
|
|
330,766 |
|
|
254,140 |
|
|
209,894 |
|
|
|
|
$ |
4,681,273 |
|
$ |
4,363,251 |
|
$ |
3,779,277 |
|
Geographic Information: The Company markets and sells its products primarily through a direct sales force. The principal geographic markets for the Company’s products are the United States, Europe, Japan and Asia Pacific. The Company attributes net sales to geographic markets based on the location of the customer. Other than the United States, Europe, Japan and Asia Pacific no one geographic market is greater than 5% of consolidated net sales.
Net sales by significant geographic market based on customer location for the respective fiscal years were as follows (in thousands):
|
|
|
|
|
|
|
|
|
|
|
|
|
Net Sales |
|
2009 |
|
2008 |
|
2007 |
|
|||
|
United States |
|
$ |
2,468,191 |
|
$ |
2,319,645 |
|
$ |
2,107,015 |
|
|
International |
|
|
|
|
|
|
|
|
|
|
|
Europe |
|
|
1,197,912 |
|
|
1,152,601 |
|
|
936,526 |
|
|
Japan |
|
|
480,897 |
|
|
387,648 |
|
|
321,826 |
|
|
Asia Pacific |
|
|
254,429 |
|
|
234,073 |
|
|
192,793 |
|
|
Other |
|
|
279,844 |
|
|
269,284 |
|
|
221,117 |
|
|
|
|
|
2,213,082 |
|
|
2,043,606 |
|
|
1,672,262 |
|
|
|
|
$ |
4,681,273 |
|
$ |
4,363,251 |
|
$ |
3,779,277 |
|
51
The amounts for long-lived assets by significant geographic market include net property, plant and equipment by physical location of the asset. Prior periods have been reclassified to conform to the current year presentation. Long-lived assets by significant geographic market were as follows (in thousands):
|
|
|
|
|
|
|
|
|
|
|
|
|
Long-Lived Assets |
|
January 2, 2010 |
|
January 3, 2009 |
|
December 29, 2007 |
|
|||
|
United States |
|
$ |
876,462 |
|
$ |
775,205 |
|
$ |
602,352 |
|
|
International |
|
|
|
|
|
|
|
|
|
|
|
Europe |
|
|
77,790 |
|
|
84,266 |
|
|
84,892 |
|
|
Japan |
|
|
18,756 |
|
|
16,001 |
|
|
1,774 |
|
|
Asia Pacific |
|
|
39,946 |
|
|
17,087 |
|
|
7,183 |
|
|
Other |
|
|
140,132 |
|
|
87,617 |
|
|
80,594 |
|
|
|
|
|
276,624 |
|
|
204,971 |
|
|
174,443 |
|
|
|
|
$ |
1,153,086 |
|
$ |
980,176 |
|
$ |
776,795 |
|
NOTE 15 – QUARTERLY FINANCIAL DATA (UNAUDITED)
|
|
|
|
|
|
|
|
|
|
|
|
|
|
|
|
(in thousands, except per share amounts) |
|
First |
|
Second |
|
Third |
|
Fourth |
|
||||
|
|
|
|
|
|
|
|
|
|
|
|
|
|
|
|
Fiscal Year 2009: |
|
|
|
|
|
|
|
|
|
|
|
|
|
|
Net sales |
|
$ |
1,133,793 |
|
$ |
1,184,412 |
|
$ |
1,159,606 |
|
$ |
1,203,462 |
|
|
Gross profit |
|
|
839,298 |
|
|
878,868 |
|
|
853,875 |
(a) |
|
855,847 |
(c) |
|
Net earnings |
|
|
201,271 |
|
|
219,370 |
|
|
166,935 |
(b) |
|
189,650 |
(d) |
|
Basic net earnings per share |
|
$ |
0.58 |
|
$ |
0.63 |
|
$ |
0.49 |
|
$ |
0.57 |
|
|
Diluted net earnings per share |
|
$ |
0.58 |
|
$ |
0.63 |
|
$ |
0.48 |
|
$ |
0.57 |
|
|
|
|
|
|
|
|
|
|
|
|
|
|
|
|
|
Fiscal Year 2008: |
|
|
|
|
|
|
|
|
|
|
|
|
|
|
Net sales |
|
$ |
1,010,738 |
|
$ |
1,135,760 |
|
$ |
1,084,136 |
|
$ |
1,132,617 |
|
|
Gross profit |
|
|
750,251 |
|
|
848,069 |
|
|
810,210 |
|
|
784,180 |
(e) |
|
Net earnings |
|
|
176,569 |
|
|
192,912 |
|
|
184,696 |
|
|
(201,159 |
) (f) |
|
Basic net earnings per share |
|
$ |
0.51 |
|
$ |
0.57 |
|
$ |
0.54 |
|
$ |
(0.58 |
) |
|
Diluted net earnings per share |
|
$ |
0.50 |
|
$ |
0.55 |
|
$ |
0.53 |
|
$ |
(0.58 |
) |
|
|
|
|
|
|
(a) |
Includes pre-tax special charges of $6.1 million related to initiatives to streamline the Company’s production activities. |
|
|
(b) |
Includes after-tax special charges of $29.4 million related to initiatives to enhance the efficiency and effectiveness of the sales, marketing and customer service operations and to streamline the Company’s production activities; and $2.5 million associated with other unrelated costs. The Company also recorded an after-tax impairment charge of $5.2 million related to a cost method investment deemed to be other-than-temporarily impaired. |
|
|
(c) |
Includes pre-tax special charges of $0.5 million related to initiatives to streamline the Company’s production activities; $17.7 million of inventory obsolescence charges for discontinued products; and $9.4 million of accelerated depreciation charges and write-offs for assets that will no longer be utilized. |
|
|
(d) |
Includes after-tax special charges of $44.5 million, which consist of the following: $22.3 million related to initiatives to enhance the efficiency and effectiveness of the sales, marketing and customer service operations and to streamline the Company’s production activities; $11.3 million of inventory obsolescence charges for discontinued products; $8.7 million of accelerated depreciation charges and write-offs for assets that will no longer be utilized; and $2.2 million associated with contract terminations and other unrelated costs. The Company also recorded after-tax IPR&D charges of $3.7 million related to the Company’s purchase of certain pre-development technology assets. |
|
|
(e) |
Includes pre-tax special charges of $43.5 million associated with the impairment of a license agreement relating to technology no longer fully utilized in the Company’s products; $13.7 million of inventory charges related to the termination of a supply agreement and inventory obsolescence charges associated with a terminated distribution agreement; and $7.4 million related to the Company providing its remote patient monitoring system without charge to existing St. Jude Medical CRM patients. |
52
|
|
|
|
|
|
(f) |
Includes $319.4 million of IPR&D charges primarily associated with the acquisition of MediGuide; after-tax special charges of $72.7 million, which consist of the following: $59.3 million primarily associated with the impairment of a technology license agreement and the impairment of purchased technology intangible assets related to the Company’s 2005 Velocimed acquisition; $8.7 million of inventory-related charges; and $4.7 million related to the Company providing its remote patient monitoring system without charge to existing St. Jude Medical CRM patients. Additionally, the Company recorded $22.2 million of after-tax contribution expenses to non-profit organizations including the St. Jude Medical Foundation, and $8.0 million of after-tax investment impairment charges. Partially offsetting these charges to net earnings, the Company recorded an $18.1 million income tax benefit related to the federal research and development tax credit extended in the fourth quarter of 2008 retroactive to the beginning of the year. |
53
Five-Year Summary Financial Data
(in thousands, except per share amounts)
|
|
|
|
|
|
|
|
|
|
|
|
|
|
|
|
|
|
|
|
|
2009 (a) |
|
2008 (b) |
|
2007 (c) |
|
2006 (d) |
|
2005 (e) |
|
|||||
|
SUMMARY OF OPERATIONS FOR THE FISCAL YEAR: |
|
|||||||||||||||
|
Net sales |
|
$ |
4,681,273 |
|
$ |
4,363,251 |
|
$ |
3,779,277 |
|
$ |
3,302,447 |
|
$ |
2,915,280 |
|
|
Gross profit |
|
$ |
3,427,888 |
|
$ |
3,192,710 |
|
$ |
2,737,683 |
|
$ |
2,388,934 |
|
$ |
2,118,519 |
|
|
Percent of net sales |
|
|
73.2 |
% |
|
73.2 |
% |
|
72.4 |
% |
|
72.3 |
% |
|
72.7 |
% |
|
Operating profit |
|
$ |
1,113,046 |
|
$ |
655,047 |
|
$ |
793,503 |
|
$ |
743,083 |
|
$ |
612,730 |
|
|
Percent of net sales |
|
|
23.8 |
% |
|
15.0 |
% |
|
21.0 |
% |
|
22.5 |
% |
|
21.0 |
% |
|
Net earnings |
|
$ |
777,226 |
|
$ |
353,018 |
|
$ |
537,756 |
|
$ |
539,042 |
|
$ |
393,362 |
|
|
Percent of net sales |
|
|
16.6 |
% |
|
8.1 |
% |
|
14.2 |
% |
|
16.3 |
% |
|
13.5 |
% |
|
Diluted net earnings per share |
|
$ |
2.26 |
|
$ |
1.01 |
|
$ |
1.53 |
|
$ |
1.45 |
|
$ |
1.04 |
|
|
|
|
|
|
|
|
|
|
|
|
|
|
|
|
|
|
|
|
FINANCIAL POSITION AT YEAR END: |
|
|||||||||||||||
|
Cash and cash equivalents |
|
$ |
392,927 |
|
$ |
136,443 |
|
$ |
389,094 |
|
$ |
79,888 |
|
$ |
534,568 |
|
|
Working capital (f) |
|
|
1,492,893 |
|
|
1,051,539 |
|
|
278,954 |
|
|
1,013,958 |
|
|
406,759 |
|
|
Total assets |
|
|
6,425,811 |
|
|
5,722,504 |
|
|
5,329,404 |
|
|
4,789,794 |
|
|
4,844,840 |
|
|
Total debt (g) |
|
|
1,922,402 |
|
|
1,201,602 |
|
|
1,338,018 |
|
|
859,137 |
|
|
1,038,397 |
|
|
Shareholders’ equity |
|
$ |
3,323,551 |
|
$ |
3,235,906 |
|
$ |
2,959,319 |
|
$ |
2,969,226 |
|
$ |
2,892,250 |
|
|
|
|
|
|
|
|
|
|
|
|
|
|
|
|
|
|
|
|
OTHER DATA: |
|
|
|
|
|
|
|
|
|
|
|
|
|
|
|
|
|
Diluted weighted average shares outstanding |
|
|
344,359 |
|
|
349,722 |
|
|
352,444 |
|
|
372,830 |
|
|
379,106 |
|
Fiscal year 2008 consisted of 53 weeks. All other fiscal years noted above consisted of 52 weeks. The Company did not declare or pay any cash dividends during 2005 through 2009.
|
|
|
|
|
|
(a) |
Results for 2009 include after-tax special charges of $76.4 million, an after-tax investment impairment charge of $5.2 million and after-tax IPR&D charges of $3.7 million. The impact of these items on 2009 net earnings was $85.3 million, or $0.25 per diluted share. See Notes to the Consolidated Financial Statements in the Financial Report for further detail. |
|
|
(b) |
Results for 2008 include $319.4 million of IPR&D charges, after-tax special charges of $72.7 million and after-tax investment impairment charges of $8.0 million. The impact of these items on 2008 net earnings was $400.1 million, or $1.15 per diluted share. See Notes to the Consolidated Financial Statements in the Financial Report for further detail. |
|
|
(c) |
Results for 2007 include after-tax special charges of $77.2 million and an after-tax investment impairment charge of $15.7 million. The impact of these items on 2007 net earnings was $92.9 million, or $0.26 per diluted share. See Notes to the Consolidated Financial Statements in the Financial Report for further detail. |
|
|
(d) |
Results for 2006 include after-tax special charges of $22.0 million, or $0.06 per diluted share, related to restructuring activities in the Company’s former Cardiac Surgery and Cardiology divisions and international selling organization. |
|
|
(e) |
Results for 2005 include after-tax IPR&D charges of $179.2 million, or $0.47 per diluted share. |
|
|
(f) |
Total current assets less total current liabilities. Working capital fluctuations can be significant based on the maturity dates of the Company’s debt obligations. |
|
|
(g) |
Total debt consists of current debt obligations and long-term debt. |
54
Cumulative Total Shareholder Returns
(in dollars)
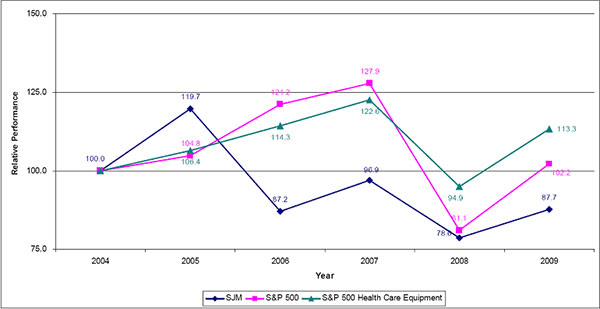
The graph compares the cumulative total shareholder returns for St. Jude Medical common stock for the last five fiscal years with the Standard & Poor’s 500 Health Care Equipment Index and the Standard & Poor’s 500 Index weighted by market value at each measurement point. The comparison assumes that $100 was invested on December 31, 2004, in St. Jude Medical common stock and in each of these Standard & Poor’s indexes and assumes the reinvestment of any dividends.
55
Stock Transfer Agent
Requests concerning the transfer or exchange of
shares, lost stock certificates, duplicate mailings, or change of address
should be directed to the Company’s Transfer Agent at:
Wells Fargo
Shareowner Services
P.O. Box 64874
St. Paul, MN 55164-0874
1.800.468.9716
wellsfargo.com/shareownerservices
Hearing Impaired #TDD: +1 651 450 4144
Annual Meeting of Shareholders
The annual meeting of shareholders will be held at
8:30 a.m. Central time on Friday, May 7, 2010, at the Minnesota History Center,
345 Kellogg Boulevard West, St. Paul, Minnesota, 55102.
Investor Contact
To obtain information about the Company, call +1 800
328 9634, visit St. Jude Medical’s Web site, sjm.com, or write to:
Investor
Relations
St. Jude Medical, Inc.
One St. Jude Medical Drive
St. Paul, Minnesota 55117
The Investor Relations (IR) section on St. Jude Medical’s Web site includes all SEC filings, a list of analysts who cover the Company, webcasts and presentations, financial information and a calendar of upcoming earnings announcements and IR events.
Company Stock Splits
2:1 on 6/15/79, 3/12/80, 9/30/86, 3/15/89, 4/30/90,
6/28/02 and 11/22/04.
3:2 on 11/16/95
Stock Exchange Listings
New York Stock Exchange
Symbol: STJ
The range of high and low prices per share for the Company’s common stock for fiscal years 2009 and 2008 is set forth below. As of February 19, 2010, the Company had 2,363 shareholders of record.
|
|
|
|
|
|
|
|
|
|
|
|
|
|
|
|
|
|
Fiscal Year |
|
||||||||||
|
|
|
2009 |
|
2008 |
|
||||||||
|
Quarter |
|
High |
|
Low |
|
High |
|
Low |
|
||||
|
First |
|
$ |
39.55 |
|
$ |
28.86 |
|
$ |
44.65 |
|
$ |
38.51 |
|
|
Second |
|
$ |
41.96 |
|
$ |
32.57 |
|
$ |
45.77 |
|
$ |
39.58 |
|
|
Third |
|
$ |
40.16 |
|
$ |
35.73 |
|
$ |
48.49 |
|
$ |
40.06 |
|
|
Fourth |
|
$ |
38.82 |
|
$ |
31.66 |
|
$ |
44.04 |
|
$ |
24.98 |
|
Trademarks
All product names appearing in this document are trademarks owned by, or
licensed to, St. Jude Medical Inc.