Attached files
| file | filename |
|---|---|
| 8-K - FORM 8-K - International Coal Group, Inc. | frm8-k.htm |

Simmons
& Company Energy Conference
and
UBS
Energy/Utility Conference
March
2, 2010
Ben
Hatfield
President
& Chief Executive Officer

Forward-Looking
Statements
n Statements in this
presentation that are not historical facts are forward-looking statements within
the “safe harbor” provision of the Private
Securities Litigation Reform Act of 1995 and may involve a number of risks and uncertainties. We have used the words “anticipate,” “believe,”
“could,” “estimate,” “expect,” “intend,” “may,” “plan,” “predict,” “project” and similar terms and phrases, including references to assumptions, to
identify forward-looking statements. These forward-looking statements are made based on expectations and beliefs concerning future events
affecting us and are subject to various risks, uncertainties and factors relating to our operations and business environment, all of which are difficult
to predict and many of which are beyond our control, that could cause our actual results to differ materially from those matters expressed in or
implied by these forward-looking statements. The following factors are among those that may cause actual results to differ materially from our
forward-looking statements: our ability to successfully refinance our outstanding indebtedness and reduce our leverage; market demand for coal,
electricity and steel; availability of qualified workers; future economic or capital market conditions; weather conditions or catastrophic weather-
related damage; our production capabilities; consummation of financing, acquisition or disposition transactions and the effect thereof on our
business; a significant number of conversions of our 9.00% Convertible Senior Notes due 2012 prior to maturity; our plans and objectives for future
operations and expansion or consolidation; our relationships with, and other conditions affecting, our customers; availability and costs of key
supplies or commodities, such as diesel fuel, steel, explosives and tires; availability and costs of capital equipment; prices of fuels which compete
with or impact coal usage, such as oil and natural gas; timing of reductions or increases in customer coal inventories; long-term coal supply
arrangements; reductions and/or deferrals of purchases by major customers; risks in or related to coal mining operations, including risks related to
third-party suppliers and carriers operating at our mines or complexes; unexpected maintenance and equipment failure; environmental, safety and
other laws and regulations, including those directly affecting our coal mining and production, and those affecting our customers’ coal usage; ability
to obtain and maintain all necessary governmental permits and authorizations; competition among coal and other energy producers in the United
States and internationally; railroad, barge, trucking and other transportation availability, performance and costs; employee benefits costs and labor
relations issues; replacement of our reserves; our assumptions concerning economically recoverable coal reserve estimates; availability and costs
of credit, surety bonds and letters of credit; title defects or loss of leasehold interests in our properties which could result in unanticipated costs or
inability to mine these properties; future legislation and changes in regulations or governmental policies or changes in interpretations or
enforcement thereof, including with respect to safety enhancements and environmental initiatives relating to global warming or climate change;
impairment of the value of our long-lived and deferred tax assets; our liquidity, including our ability to adhere to financial covenants related to our
borrowing arrangements; adequacy and sufficiency of our internal controls; and legal and administrative proceedings, settlements, investigations
and claims and the availability of related insurance coverage.
n You should keep in
mind that any forward-looking statement made by us in this presentation or
elsewhere speaks only as of the date on which the
statements
were made. See also the “Risk Factors” in our 2009 Annual Report on Form 10-K
and subsequent filings with the SEC which are
currently available on our website at www.intlcoal.com. New risks and uncertainties arise from time to time, and it is impossible for us to predict
these events or how they may affect us or our anticipated results. In light of these risks and uncertainties, you should keep in mind that any forward
-looking statement made in this presentation might not occur. All data presented herein is as of December 31, 2009 unless otherwise noted.
2

ICG
Highlights
n Strong operating
presence in 3 of 4 largest US coal-producing
regions - Central Appalachia, Northern Appalachia & Illinois Basin
regions - Central Appalachia, Northern Appalachia & Illinois Basin
n Extensive coal
reserve holdings with 66% ownership
n Planned production
growth is primarily from permitted underground
mines with less exposure to environmental issues
mines with less exposure to environmental issues
n Strong sales
position with growing met coal portfolio
n 100% union-free
workforce
n Solid balance sheet
with minimal long-term legacy liabilities
Summary
Statistics
Market
capitalization1:
$780.4 million
Coal
reserves:
1.1
billion tons
Reserve
life:
Approximately
67 yrs
Employees:
2,600
2009 tons sold: 16.8
million
2009 tons
produced: 16.3
million
1Market capitalization
is based on 179.0 million shares outstanding and a stock price of $4.36 as of
February 26, 2010
3
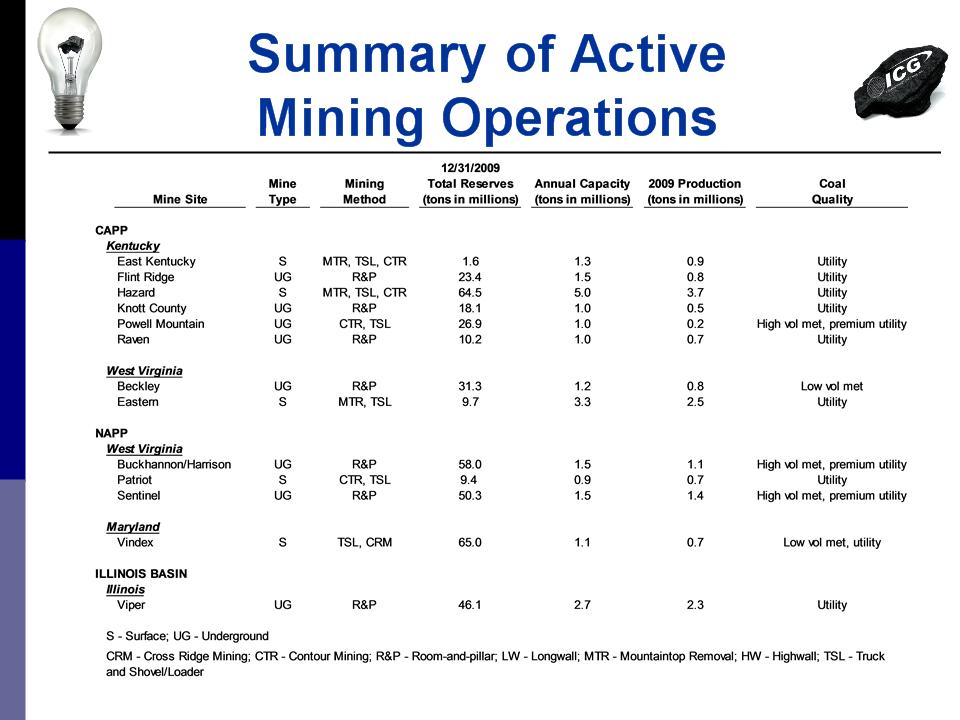
§ 13 active mining
complexes - 8 in Central Appalachia, 4 in Northern Appalachia, and 1 in
Illinois Basin
Illinois Basin
§ Construction of
flagship Tygart project is expected to resume in 2011 with initial
production
in late 2012
in late 2012
Operating
Strength
and Diversity
and Diversity
4

Production
Growth Matched
to
Market Demand
1 Management’s estimate
as of February 26, 2010
1
1
5

Significant
Idle Production
Capacity
Available
§ Additional to
current production and planned developments, nearly 3 million annual tons
of
production capacity can be activated promptly in response to rising market demand
production capacity can be activated promptly in response to rising market demand
– Operations
representing approximately 2.15 million tons/year are held in “hot idle”
status
and require only moderate equipment investment for restart
and require only moderate equipment investment for restart
– Another 0.75 million
tons/year of production capacity are essentially permitted and
available for development within a 6-12 month timeframe
available for development within a 6-12 month timeframe
§ These production
sources are generally higher cost mines that were either idled or
development
-deferred in response to the weaker market of 2009
-deferred in response to the weaker market of 2009
6
Tygart
Represents World Class
Production Opportunity
Production Opportunity
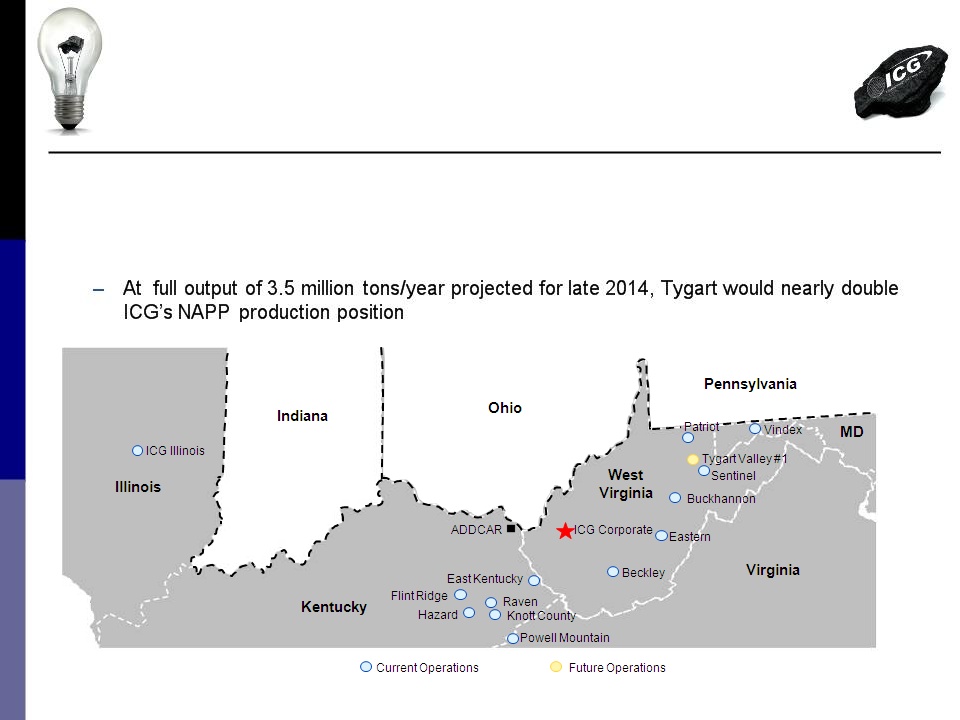
§ Tygart #1 is the
first of 3 or more mining
complexes planned for ICG’s 186 million ton
Hillman property in Northern WV
complexes planned for ICG’s 186 million ton
Hillman property in Northern WV
– High Btu, low- to
medium-sulfur steam and
premium high volatile met quality coal
premium high volatile met quality coal
– Anticipating low
costs due to longwall
mining, owned property, and favorable
geology
mining, owned property, and favorable
geology
§ Projected to produce
up to 3.5 million tons
per year at full output (50% met/50% steam)
per year at full output (50% met/50% steam)
– Startup in late
2012; full output mid-2014
– Targets a 40-50
million ton reserve area
§ Tygart expected to
be one of ICG’s highest
margin operations due to low cost structure
and premium met/thermal marketability
margin operations due to low cost structure
and premium met/thermal marketability
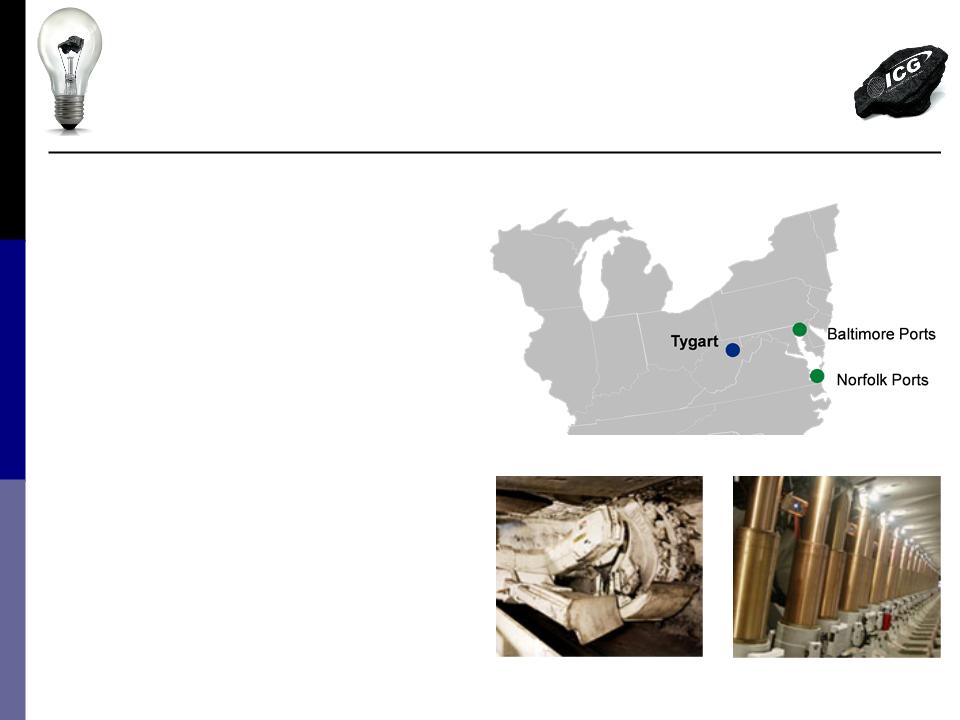
§ Favorable geographic
position relative to
Atlantic terminals and NE customer base
Atlantic terminals and NE customer base
7
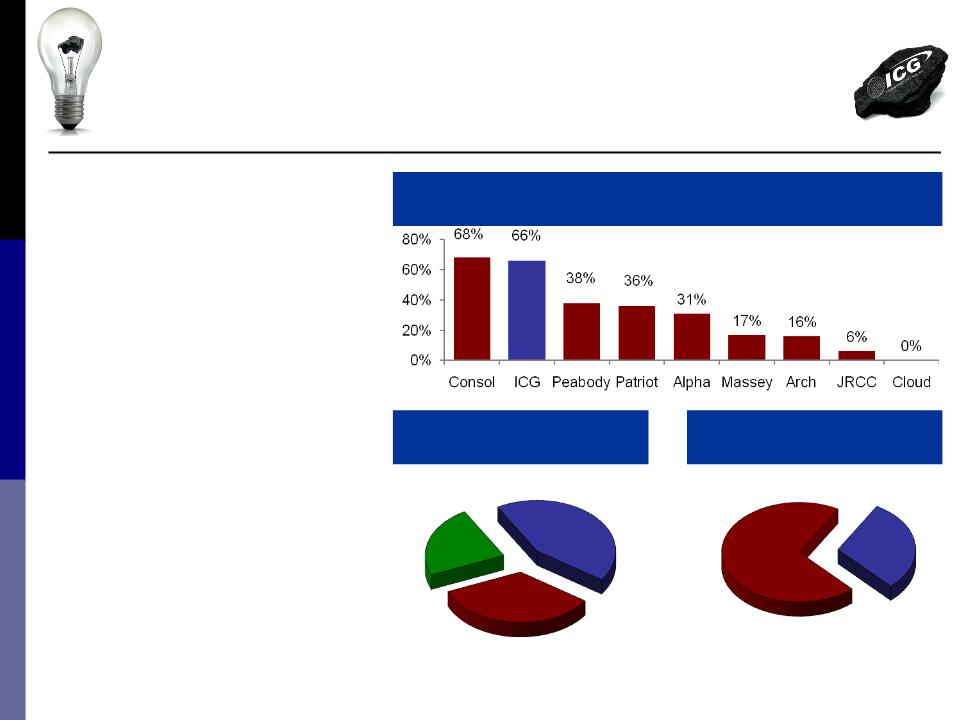
Excellent
Reserve Position
§ ICG owns a larger
portion of its
reserves than nearly all other
public producers
reserves than nearly all other
public producers
– Met reserves 71%
owned
– Thermal reserves 64%
owned
§ ICG controls 1.1
billion tons of
high-quality reserves that are
primarily high-BTU low-sulfur
thermal and premium met coals
high-quality reserves that are
primarily high-BTU low-sulfur
thermal and premium met coals
%
Ownership of Total Reserves
Geographic
Distribution
of
Reserves
30%
Met Quality
325
million tons
70%
Steam Quality
765
million tons
Reserves
by Type
34%
IL Basin
371
million tons
23%
CAPP
256
million tons
43%
NAPP
463
million tons
8

Production
Shift Towards Underground
Mitigates Regulatory Risks
Mitigates Regulatory Risks
n Nearly all ICG
growth is comprised of new or
expanding underground mining operations (rather
than surface mines)
expanding underground mining operations (rather
than surface mines)
– Incremental deep
mine growth totaling 1.7
million TPY by 2011 is planned at Illinois,
Vindex, Beckley, Eastern & KY operations
million TPY by 2011 is planned at Illinois,
Vindex, Beckley, Eastern & KY operations
– The largest
component of anticipated deep
mine growth is the 3.5 million TPY Tygart #1
complex in NAPP
mine growth is the 3.5 million TPY Tygart #1
complex in NAPP
• Production ramp up
is projected for 2012-2014
n Underground mining
operations generally have
fewer regulatory hurdles than surface mines
fewer regulatory hurdles than surface mines
n Reduced risk of
regulatory permitting obstacles
Production
by Mining Method
10%
Surface
104
million tons
90%
Underground
986
million tons
Reserves
by Method
9
Projected
Sales 16.7 -
17.3 16.5 -
18.0
(tons in millions)
(tons in millions)
Total
Price Per Ton $63.00-$64.50 $65.00-$70.00
Metallurgical
Uncommitted 1.0 2.6
(tons in millions)
(tons in millions)
Committed
Tonnage1
1 Management’s
estimate as of February 26, 2010
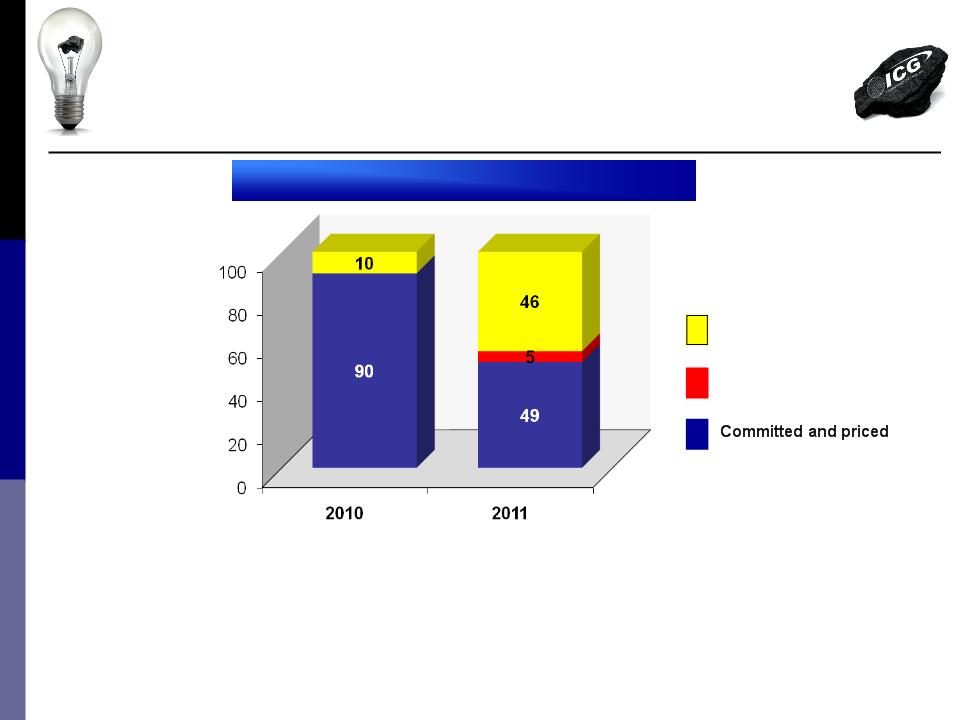
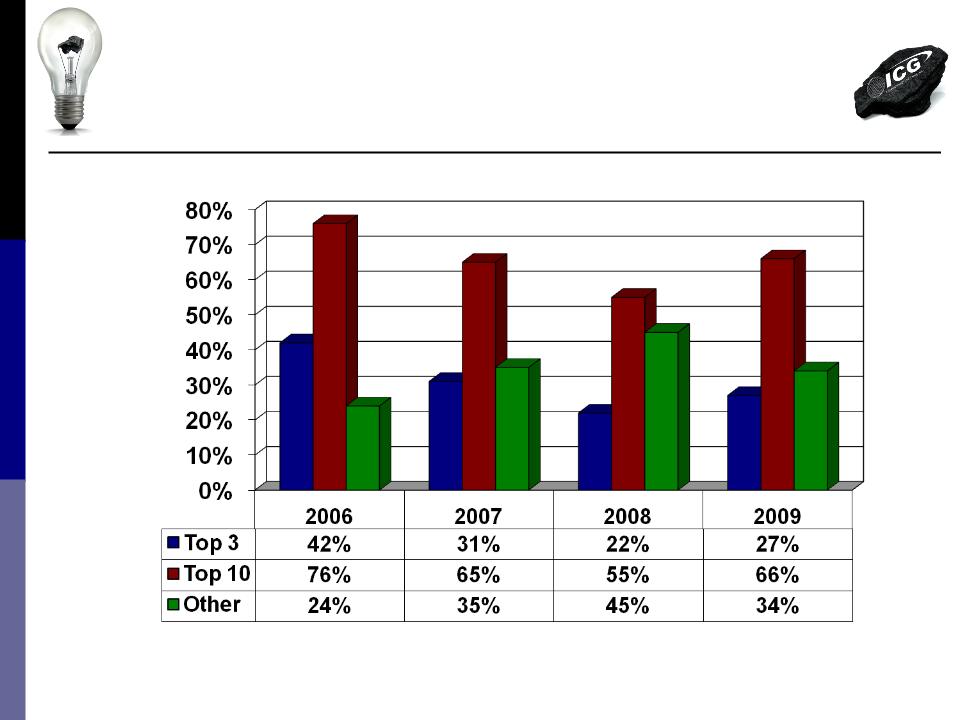
Favorable
Sales Position
%
of
Sales
Sales
Uncommitted
Committed
and not priced
10

Metallurgical
Portfolio
Expanding Rapidly
Expanding Rapidly
Metallurgical
Sales Growth1
Key
drivers of met growth:
n Projected production
increase at met mines
during 2009-2011 of nearly 700,000 tons/year
during 2009-2011 of nearly 700,000 tons/year
– Added 3rd section at Beckley
(LV)
– Higher productivity
at Sentinel (HV)
– New
low volatile met Bismark mine is
being developed at Vindex; startup
projected for Q3 2010
being developed at Vindex; startup
projected for Q3 2010
n Sentinel met sales
projected to increase from
14% in 2009 to 60% in 2010
14% in 2009 to 60% in 2010
– Completion of legacy
utility contracts
– Increased market
demand for Sentinel
quality
quality
n Increase in met
blend sales expected from
Powell Mountain (HV/PCI) and existing Vindex
mines (LV)
Powell Mountain (HV/PCI) and existing Vindex
mines (LV)
11
Increasingly
Diversified
Customer Base
Customer Base
12

ICG
Legacy Liabilities
Total: $144
million
Total
Legacy Liabilities1
1 Source:
Company Annual Reports as of December 31, 2008; legacy liabilities include post
retirement benefits, black lung liabilities, reclamation liabilities,
workers compensation and Coal Act liabilities; Alpha pro forma for Foundation
workers compensation and Coal Act liabilities; Alpha pro forma for Foundation
($ in
millions)
Lowest
Legacy Liabilities
Among
Peer Group
13

New
ABL Credit Facility
n New ABL credit
facility closed on February 22, 2010
n Replaces the $100
million credit facility set to expire in June
of 2011
of 2011
n New facility
provides:
– $125 million in
borrowing capacity, an increase of $25 million
– $125 million in
Letter of Credit capacity, an increase of $45 million
– Eliminates maximum
leverage and minimum interest coverage ratio
requirements
requirements
– Provides for
increased capital spending limits
– Secured by real and
personal property of the Company
– Term runs through
February 2014
14

Coal
Market Outlook
l Current Market
Conditions
l Review of Key
Indicator Trends
l Market
Outlook
15

Current
Market Conditions
n Coal market
sentiment continues to improve
– Natural gas prices
seem to have stabilized in a range of $4.50 to $5.50
n Most key indicators
trending favorably
– Steel capacity
utilization continues on a steady, upward trajectory
– Metallurgical export
demand continues to grow
– Utility inventories
are dropping faster than expected
– Coal output
continues to be restrained
– Over-the-counter
thermal prices continue to improve
n However, areas of
uncertainty temper optimism
– Continued mixed
signals for sustained economic recovery
– Rail service has
been difficult since late January
– Some concern that
Chinese demand is slowing
– Natural gas rig
count seems to be recovering prematurely
n Despite concerns,
overall outlook is much improved
16

Quick
Review of
Key Indicators
Key Indicators
n Prompt-month OTC
coal price trends
n EIA coal production
data
n Natural gas
storage
n Blast furnace
utilization
17
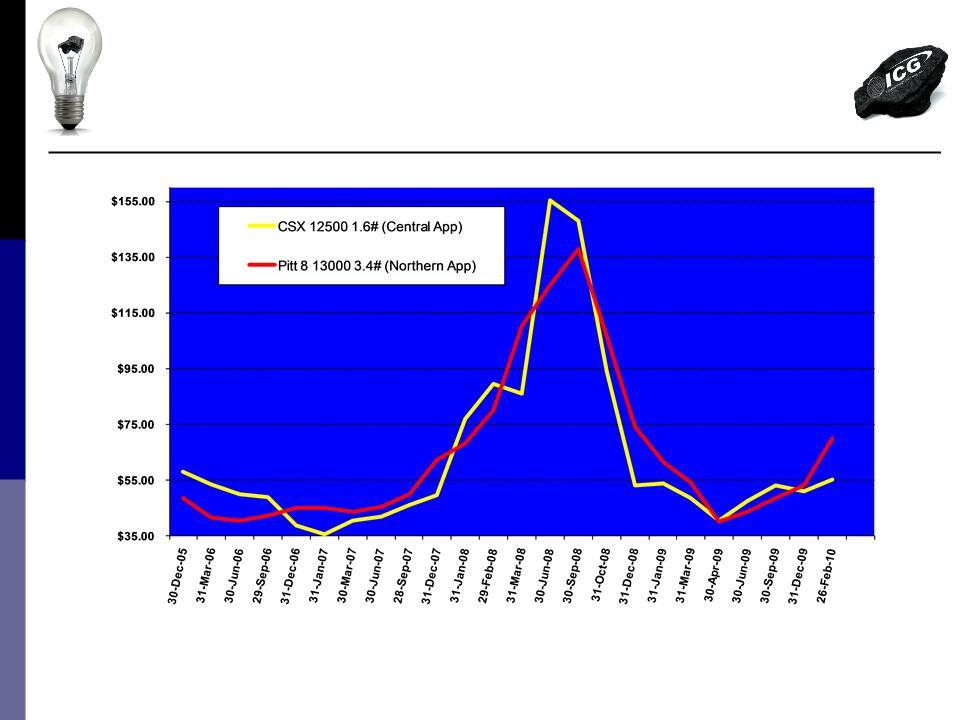
Prompt-Month
OTC
Coal Price Trends
Per ICAP-United, Inc.
Coal Price Trends
Per ICAP-United, Inc.
18
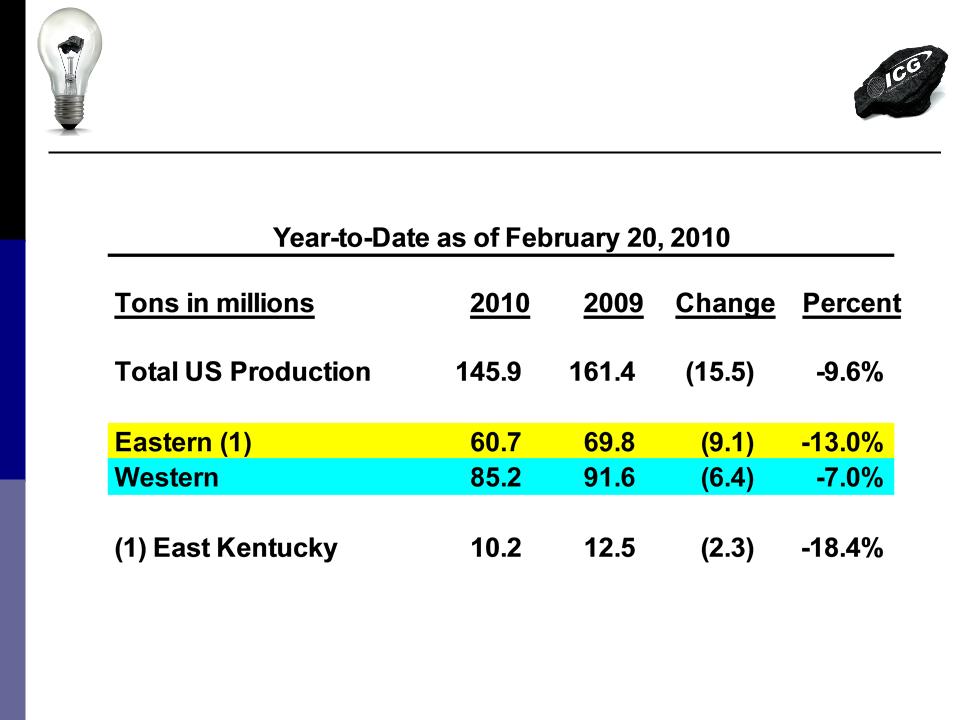
EIA
Coal Production Data
19

Natural
Gas Storage - Now
(Per EIA - week ending 2/05/10)
(Per EIA - week ending 2/05/10)
At
or above 5-Year
Range
Range
Working
Gas in Underground Storage Compared with 5-Year Range
Well
within
5-Year
Range
20

US
Iron And Raw Steel Output
% Capacity Utilization
% Capacity Utilization
Source:
Steelfacts, including AISI and US Dept. of Commerce
21

Short-term Market Outlook
n Thermal coal outlook
improving - early signs of “inventory
stress” are beginning to appear
stress” are beginning to appear
– Utilities that
require high quality coals are feeling the met cross-over impact
– Nationwide utility
inventories have dropped by nearly 40 million tons
– Rail carriers
struggling with weather delays; expect transport issues to
continue into April, which would constrain 1st quarter shipments
continue into April, which would constrain 1st quarter shipments
n Rising metallurgical
demand is expected to continue
attracting higher quality coals from the thermal market
attracting higher quality coals from the thermal market
– Broadly based
speculation is that benchmark hard coking coal settlements
will land in the $200 to $240 range (fob vessel, metric tonne basis)
will land in the $200 to $240 range (fob vessel, metric tonne basis)
– 2009 benchmark was
$129
n US coal production
is expected to decrease through the first
quarter of 2010 and then begin to stabilize
quarter of 2010 and then begin to stabilize
22

Long-term
Market Outlook
n Cold winter weather
is forecast to extend into March
– Natural gas storage
could be near normal by end of withdrawal season
– Coal utilization
should be enhanced and inventory surplus significantly
reduced
reduced
n Strengthening US
economic recovery should boost demand
n Thermal coal
production is expected to remain suppressed
– Producers will be
reluctant to increase production without strong and
sustained price signals
sustained price signals
– Permit and
regulatory issues could begin impacting production in late 2010
– New capital will
generally favor metallurgical projects
n Utilities are
expected to return to the spot market mid-2010
as burns improve
as burns improve
23

Summary
n Well-positioned to
benefit from anticipated market improvement
with strong and diverse operating assets
with strong and diverse operating assets
– Nearly 3 million
tons of idle production capacity available for opportunistic
startup
– Prominent shift from
surface mining to underground production is expected to
mitigate risk of regulatory delays
mitigate risk of regulatory delays
– Flagship Tygart #1
Complex is expected to resume construction in 2011
– Reserves of 1.1
billion tons include 325 million tons of met coal and are 66% owned
n Favorable sales
outlook and growing met coal portfolio
– Having 90% of 2010
sales priced provides near term protection from weak thermal
markets while the 46% open 2011 position allows upside in a rising market
markets while the 46% open 2011 position allows upside in a rising market
– Met sales are
increasing by 250% in 2010 just as prices sharply escalate in response
to strong Asian demand
to strong Asian demand
n As the market
rebalances in 2010 and global stimulus efforts
take hold, increasing demand for low-cost electricity and steel
products should bode well for coal
take hold, increasing demand for low-cost electricity and steel
products should bode well for coal
24

Updated
Guidance Summary
(Management Estimate as of February 26, 2010 )
(Management Estimate as of February 26, 2010 )
|
2010
Guidance
|
|
|
Tons
Sold
|
16.7-17.3
million tons
|
|
Metallurgical
Tons Sold
|
2.4
million tons
|
|
Tons
Produced
|
16.0-16.4
million tons
|
|
Average
Selling Price
|
$63.00-$64.50/ton
|
|
• CAPP
Selling Price
|
$70.50-$72.50/ton
|
|
• NAPP
Selling Price
|
$60.50-$63.50/ton
|
|
• Illinois
Basin Selling Price
|
$36.25-$36.75/ton
|
|
Cash
Costs
|
$49.50-$51.50/ton
|
|
EBITDA
|
$170-$200
million
|
|
CapEx
|
$90-$100
million
|
|
|
|
|
2011
Guidance
|
|
|
Tons
Produced and Sold
|
16.5-18.0
million tons
|
|
Metallurgical
Tons Sold
|
2.7
million tons
|
|
Average
Selling Price
|
$65.00-$70.00/ton
|
25

Appendices
26
27

Peer
Group
Cost
and Margin Comparisons
28

Peer
Group Cost Per Ton
Appalachian Production (2007-2009)
Appalachian Production (2007-2009)
29

Peer
Group Cost Per Ton
Illinois Basin Production (2007-2009)
Illinois Basin Production (2007-2009)
30

Peer
Group Margin Comparison
Margin Per Ton in Dollars (2007-2009)
Margin Per Ton in Dollars (2007-2009)
Note: Margin
comparison reflects Eastern US production only.
31