Attached files
| file | filename |
|---|---|
| EX-21 - EX-21 - Enventis Corp | ex21.htm |
| EX-31.1 - CEO CERTIFICATION SECTION 302 - Enventis Corp | ex31-1.htm |
| EX-31.2 - CFO CERTIFICATION SECTION 302 - Enventis Corp | ex31-2.htm |
| EX-32.1 - CEO CERTIFICATION SECTION 906 - Enventis Corp | ex32-1.htm |
| EX-23.1 - EX23.1 - Enventis Corp | ex23-1.htm |
| EX-32.2 - CFO CERTIFICATION SECTION 906 - Enventis Corp | ex32-2.htm |
UNITED
STATES
SECURITIES
AND EXCHANGE COMMISSION
Washington,
D.C. 20549
FORM
10-K
(Mark
one)
|
x
|
ANNUAL
REPORT PURSUANT TO SECTION 13 OR 15(d) OF THE SECURITIES EXCHANGE ACT OF
1934
|
|
For
the fiscal period ending December 31,
2009
|
|
¨
|
TRANSITION
REPORT PURSUANT TO SECTION 13 OR 15(d) OF THE SECURITIES EXCHANGE ACT OF
1934
|
|
For
the transition period
from to .
|
Commission
File Number 0-13721
HICKORY
TECH CORPORATION
(Exact
name of registrant as specified in its charter)
|
Minnesota
|
41-1524393
|
|
(State
or other jurisdiction of
|
(I.R.S.
Employer
|
|
incorporation
or organization)
|
Identification
No.)
|
221
East Hickory Street
Mankato,
MN 56002-3248
(Address
of principal executive offices)
Registrant’s
telephone number, including area code: (800) 326-5789
Securities
registered pursuant to Section 12(b) of the Act:
|
Title of Class
|
Name of Exchange on Which
Registered
|
|||
|
Common
Stock, no par value
|
NASDAQ
Global Select Market
|
Securities
registered pursuant to Section 12(g) of the Act: None
Indicate
by check mark if the registrant is a well-known seasoned issuer, as defined in
Rule 405 of the Securities Act. Yes ¨ No þ
Indicate
by check mark if the registrant is not required to file reports pursuant to
Section 13 or Section 15(d) of the Act. Yes ¨ No þ
Indicate
by check mark whether the registrant (1) has filed all reports required to be
filed by Section 13 or 15(d) of the Securities Exchange Act of 1934 during the
preceding 12 months (or for such shorter period that the registrant was required
to file such reports), and (2) has been subject to such filing requirements for
the past
90
days. Yes þ No ¨
Indicate
by check mark whether the registrant has submitted electronically and posted on
its corporate Website, if any, every Interactive Data File required to be
submitted and posted pursuant to Rule 405 of Regulation S-T (§232.405 of this
chapter) during the preceding 12 months (or for such shorter period
that the registrant was required to submit and post such files). Yes ¨ No ¨
Indicate
by check mark if disclosure of delinquent filers pursuant to Item 405 of
Regulation S-K is not contained herein, and will not be contained, to the best
of registrant's knowledge, in definitive proxy or information statements
incorporated by reference in Part III of this Form 10-K or any amendment to this
Form 10-K. ¨
Indicate
by check mark whether the registrant is a large accelerated filer, an
accelerated filer, a non-accelerated filer or a smaller reporting company. See
the definition of “large accelerated filer, accelerated filer, a non-accelerated
filer or smaller reporting company” in Rule 12b-2 of the Exchange
Act.
¨ Large accelerated
filer þ Accelerated
filer ¨ Non-accelerated
filer ¨ Smaller
reporting company
Indicate
by check mark whether the registrant is a shell company (as defined in Rule
12b-2 of the Act).
Yes ¨ No þ
The
number of shares of the registrant's common stock, no par value, outstanding as
of February 26, 2010 was 13,120,514. The aggregate market value of the
registrant’s common stock held by non-affiliates as of June 30, 2009 was
$94,526,070 based on the closing sale price of $7.68 per share on The NASDAQ
Global Select Market.
DOCUMENTS
INCORPORATED BY REFERENCE
Certain
portions of the Company’s Proxy Statement for the Annual Meeting of Shareholders
to be held on May 11, 2010 (“Proxy Statement”) are incorporated by reference in
Part III of this Form 10-K.
|
3
|
||
|
13
|
||
|
22
|
||
|
22
|
||
|
22
|
Forward-Looking Statements
The
Private Securities Litigation Reform Act of 1995 contains certain safe harbor
provisions regarding forward-looking statements. This 2009 Annual Report on Form
10-K (“Report”) and other documents filed by HickoryTech Corporation under the
federal securities laws, including Form 10-Q and Form 8-K, and future verbal or
written statements by HickoryTech and its management, may include
forward-looking statements. These statements may include, without limitation,
statements with respect to anticipated future operating and financial
performance, growth opportunities and growth rates, acquisition and divestiture
opportunities, business strategies, business and competitive outlook and other
similar forecasts and statements of expectation. Words such as “expects,”
“anticipates,” “intends,” “plans,” “believes,” “seeks,” “estimates,” “targets,”
“projects,” “will,” “may,” “continues,” and “should,” and variations of these
words and similar expressions, are intended to identify these forward-looking
statements. Such forward-looking statements are subject to risks and
uncertainties that could cause HickoryTech’s actual results to differ materially
from such statements. These risks and uncertainties include those identified
under Part I – Item 1A – “Risk Factors” beginning on page 13.
Because
of these risks, uncertainties and assumptions and the fact that any
forward-looking statements made by HickoryTech and its management are based on
estimates, projections, beliefs and assumptions of management, they are not
guarantees of future performance and you should not place undue reliance on
them. In addition, forward-looking statements speak only as of the date they are
made which is the filing date of this Form 10-K. With the exception of the
requirements set forth in the federal securities laws or the rules and
regulations of the Securities and Exchange Commission, we do not undertake any
obligation to update or review any forward-looking information, whether as a
result of new information, future events or otherwise.
Website
Access to Securities and Exchange Commission Reports
Our
website at www.hickorytech.com
provides information about our products and services, along with general
information about HickoryTech and its management, financial results and press
releases. Copies of our most recent Annual Report on Form 10-K, quarterly
reports on Form 10-Q, current reports on Form 8-K and amendments to those
reports filed pursuant to Section 13 or 15(d) of the Securities Exchange Act of
1934 can be obtained, free of charge, as soon as reasonably practical after such
material is electronically filed, or furnished to the Securities and Exchange
Commission. To obtain this information visit our website noted above and click
on “Investor Relations,” or call (507) 387-3355.
Item 1. Business
“HickoryTech”
or the “Company” refers to Hickory Tech Corporation alone or with its wholly
owned subsidiaries, as the context requires. When this report uses the words
“we,” “our,” or “us,” it refers to the Company and its subsidiaries unless the
context otherwise requires.
Company
Overview and History
HickoryTech
Corporation (dba HickoryTech and Enventis) is a leading integrated
communications provider in the markets we serve. In business for more than 110
years, the corporation is headquartered in Mankato, Minnesota, and has a
regional fiber network with facilities-based operations in Minnesota and Iowa.
We currently operate in two principal business segments: Enventis Sector and
Telecom Sector. The Company trades on the Nasdaq Stock Exchange, symbol:
HTCO.
Our
Enventis Sector began when we purchased Enventis Telecom on December 30,
2005. Today, Enventis serves business customers across a five-state region with
Internet protocol (“IP”) based voice, transport, data and network solutions,
managed services, network integration and support services. Through its regional
fiber network Enventis provides wholesale services to regional and national
service providers, such as interexchange and wireless carriers within the
telecommunications business. Enventis also specializes in providing integrated
unified communication solutions for businesses of all sizes - from enterprise
multi-office organizations to small and medium-sized businesses, primarily in
the upper Midwest. Enventis is focused on providing services specifically to
business customers.
Our
Telecom Sector provides bundled residential and business services, including
high-speed Internet, digital TV and voice services in its legacy telecom
markets. Telecom is comprised of two market segments. The first market includes
the operation of local telephone companies or incumbent local exchange carriers
(“ILEC”). The second Telecom market segment is the operation of a
competitive local exchange carrier (“CLEC”). Our original business consisted of
the operation of a single ILEC and began in 1898. In 1985, we formed HickoryTech
Corporation as a holding company for our current ILECs and to serve as a
platform to expand our business. In 1998, we formed a CLEC, which provides the
competitive services of local service, long distance, high-speed Internet
access, Digital Subscriber Line (“DSL”) and digital TV. All of our Telecom
operations are operated as one integrated unit.
The data
processing services provided by our subsidiary, National Independent
Billing, Inc. (“NIBI”) are also part of our Telecom Sector. The ILECs and
CLEC we operate within the Telecom segment are the primary internal users of
NIBI. NIBI activities are of strategic value to us, primarily because of the
support services it provides to our telecom companies. NIBI also sells its
services externally to other companies in the telecommunications industry. The
goals, objectives and management of the NIBI product line are closely aligned
with, and its operating results included with, those of our Telecom
Sector.
Our
operations are currently conducted through the following eight
subsidiaries:
Enventis
Sector
|
·
|
Enventis
Telecom, Inc. (“Enventis”)
|
|
·
|
CP
Telecom Inc. (“CP Telecom”)
|
Telecom
Sector
|
·
|
Mankato
Citizens Telephone Company (“MCTC”)
|
|
·
|
Mid-Communications,
Inc. (“Mid-Com”)
|
|
·
|
Heartland
Telecommunications Company of Iowa, Inc.
(“Heartland”)
|
|
·
|
Cable
Network, Inc. (“CNI”)
|
|
·
|
Crystal
Communications, Inc. (“Crystal”)
|
|
·
|
National
Independent Billing, Inc. (“NIBI”)
|
Enventis
We
acquired Enventis on December 30, 2005. Through Enventis, we provide
integrated data services and offer fiber optic-based communications including
IP-based voice, data and network solutions to business customers in the Upper
Midwest. Enventis Sector revenue has exceeded 50% of our Company revenue in two
of the last three years and we expect to continue to grow these revenue
streams.
Enventis’ product portfolio
includes:
|
·
|
Fiber
and data networks
|
|
·
|
Voice
and data services
|
|
·
|
Managed
and hosted services
|
|
·
|
Unified
Communications and equipment
|
|
·
|
Data
center services
|
|
·
|
Security
|
|
·
|
Total
care support and monitoring
|
|
·
|
Professional
services
|
Enventis
owns or has long-term leases to approximately 1,500 route miles of fiber optic
cable and has extensive local fiber optic rings that directly connect the
Enventis network with its larger clients (e.g. interexchange carriers, wireless
carriers, retail, health care, government and education customers, etc.). Other
local fiber rings connect the Enventis network to the local telephone central
offices. These connections allow Enventis to utilize telecommunication
providers’ connections, when company owned facilities are not available to
access its smaller clients. Enventis serves customers through interconnections
that are primarily leased from third parties (commonly referred to as “the last
mile”).
Enventis’
product portfolio includes SingleLink® Unified
Communications (“SingleLink”), a hosted or managed IP communications service
that includes local and long distance voice, business IP telephony via a hosted
IP private branch exchange, unified messaging and dedicated Internet access.
This product is focused primarily at small to medium sized business but also has
enterprise customer applications.
Through
its equipment revenue product line, Enventis has business relationships with
Cisco Systems, Inc. and is certified by Cisco as a Gold Partner. The
relationship with Cisco Systems, Inc. is a strategic partnership between
Cisco (as the supplier) and Enventis (as the distributor). Enventis provides
converged IP services that allow all communications (e.g. voice, video and data)
to use the same IP data infrastructure.
In August
2009, we acquired Computer Pro Inc., dba CP Telecom, a privately held
facilities-based telecom provider, serving Minneapolis, St. Paul and northern
Minnesota, for $6.6 million, plus routine working capital adjustments. The
operations of CP Telecom are included in the Enventis Sector. CP Telecom
operations in Minneapolis and Duluth, Minnesota provide voice, data and Internet
services. CP Telecom operates in 23 colocations throughout Minnesota, ten of
which we did not have a presence in prior to the acquisition and five that
brought enhanced functionality to Enventis’ product portfolio. CP Telecom’s
assets include long-term rights to a fiber network encompassing Minneapolis and
St. Paul as well as soft switching technology. The acquisition aligned with our
strategic direction as it enhances our focus on the small and medium sized
business customer, expanded our business product portfolio, and further
developed our agent sales channel program.
Enventis
has authority to operate from the public utility commissions in the majority of
states in the U.S. for interexchange carrier (private line or long distance)
services and, where necessary, has or is seeking authority in states to provide
regulated services to augment our hosted voice over Internet protocol (“VoIP”)
service. Services provided by Enventis compete directly with those from ILECs
and other communications providers in the area in which it operates. Enventis is
not dependent upon any single customer or small group of customers. No single
customer accounts for more than 10% or more of this sector’s
revenue.
Enventis
has Minnesota offices located in Plymouth, Minneapolis, Duluth and Rochester and
operates data centers in Edina, Duluth and Mankato.
Telecom
The
Telecom Sector provides local telephone service, long distance, calling features
and broadband services. As an auxiliary business, the data processing services
of NIBI are also included within the Telecom Sector.
Telecom
includes three ILECs: MCTC, Mid-Com and Heartland. MCTC and Mid-Com provide
telephone service in south central Minnesota, specifically the Mankato,
Minnesota region, and 11 rural communities surrounding Mankato. Heartland, our
third ILEC, provides telephone service for 11 rural communities in northwest
Iowa. In total, there are 23 ILEC exchanges within our Telecom Sector. Telecom
also includes a CLEC, Crystal, which began operations in January 1998 and
provides competitive services in south central Minnesota and near Des Moines,
Iowa. There are eight Minnesota CLEC exchanges and two Iowa CLEC exchanges in
our Telecom Sector.
NIBI, an
auxiliary part of the Telecom Sector, provides data processing and related
services for our affiliated companies, as well as for other ILECs, CLECs,
interexchange network carriers, wireless companies and cable TV providers
throughout the United States and Canada.
Telecom
owns and operates a 900 mile fiber optic network and facilities in Minnesota.
These facilities are used to transport interexchange communications as a service
to telecommunications customers. We operate an unregulated carrier company, CNI,
to administer part of this southern Minnesota fiber network. Our Minnesota ILECs
and CLEC are the primary users of these fiber optic cable facilities in the
Telecom Sector.
Telecom
derives its principal revenue and income from local services charged to
subscribers in its service area, access services charged to interexchange
carriers and the operation of a toll tandem-switching center in Mankato,
Minnesota. The local and interexchange telephone services for our telephone
companies utilize the same facilities and equipment and are managed and
maintained by a common workforce. Interexchange telephone access is provided by
our subsidiaries by connecting the communications networks of interexchange
carriers and wireless carriers with the equipment and facilities of end-users
through its switched networks or private lines.
As local
exchange telephone companies, we provide end office switching and dedicated
circuits to long distance interexchange carriers. These relationships allow our
telephone subscribers to place long distance telephone calls to other networks.
We provide interexchange access to our network for interexchange carriers to
conduct long distance business with individual customers who select a long
distance carrier for termination of calls to all customers. This interexchange
access business is separate and distinct from our own long distance retail
service, which is operated through Crystal.
Our
Telecom subsidiaries are not dependent upon any single customer or small group
of customers. No single customer or long distance interexchange carrier accounts
for 10% or more of our consolidated revenue.
Business
Strategy
Our
vision is to be the leader in connecting business and consumers with advanced,
integrated communications solutions in the regions we serve. In fiscal 2009, we
established a long-term growth strategy for our company. This growth
plan will continue to focus on the growth of broadband services and the
profitability of our Telecom Sector, while making strategic investments to
significantly grow the Enventis business-to-business and wholesale segment.
While we realize there is some risk in this strategy (see “Risks Related to Our
Business”), we believe this plan could generate long-term success for us. This
success depends on the following strategies:
|
·
|
Execute on our local market
strategy. We will continue to leverage the HickoryTech brand and
its strong reputation in our legacy markets and offer a competitive,
multi-service bundle of voice, high-speed Internet and in many markets
digital TV. We will manage the decline in Telecom network access and local
service revenues by offering value-added services such as higher Internet
speeds and localized content along with unparalleled customer service as a
competitive differentiator.
|
|
·
|
Develop and deploy advanced
communications technologies. We have and will continue to upgrade
our networks to take advantage of the fastest growing areas of technology
including advanced high-bandwidth capabilities and services, including
expansion of our network for wholesale and retail customers,
Fiber-to-the-Tower (“FTTT”) services for wireless carriers and last mile
fiber builds to data centers and business customers. We believe our
innovative technical capabilities and the use of VoIP technologies
combined with our Total Care Support offering will allow us to attract and
maintain clients by providing proactive monitoring and deployment of these
services. Our enhanced SingleLink product, which provides customers
with a single, centrally managed and hosted VoIP-based communications
system, allows businesses to leverage the powerful benefits of integrated
IP communications without the time and capital necessary for on-premise
solutions.
|
|
|
|
|
·
|
Grow monthly recurring revenue
services through business-to-business sales. Our focus remains on
supporting business customers ranging in size from small to large
enterprise businesses. We offer integrated communication solutions which
include IP telephony, unified computing, transport and data and network
integration services that combine voice and data into a single platform.
The integration of CP Telecom into our Company has broadened our product
and service offerings for small and medium business customers (“SMB”). We
believe we have created a competitive advantage by utilizing a
consultative sales approach and developing innovative and flexible
solutions for our customers. We will further expand our SMB focus through
the expansion of our local fiber network into cities in which we believe
we can offer competitive services and take market share. We are able to do
this by utilizing our IP expertise, leveraging our extensive fiber network
and offering a full complement of high-quality products and
services.
|
|
·
|
Maintain stable cash flows from
operations and disciplined capital spending. Our current customer
base provides a recurring revenue stream generating stable cash flow. Our
focus remains on growing our services and support product lines that will
over time generate cash flow well in excess of capital expenditure needs.
We have allocated resources to maintain and upgrade our network while
focusing on optimizing returns by completing strategic capital outlays
that will make our network more efficient and cost effective while
bringing a richer product and services portfolio to the markets we
serve.
|
|
·
|
Grow through select strategic
growth initiatives. We intend to continue to pursue a disciplined
process of evaluating select acquisitions of businesses as well as organic
growth opportunities of market expansion and/or products which are
complementary to our business
portfolio.
|
Revenue
Sources
We
currently divide our business into two reportable business segments: Enventis
and Telecom. The following table summarizes our primary sources of revenue
within these two segments for the past three years:
|
For
Year Ended December 31
|
2009
|
2008
|
2007
|
|||||||||||||||||||||
|
Amount
|
Percent
|
Amount
|
Percent
|
Amount
|
Percent
|
|||||||||||||||||||
|
Enventis:
|
||||||||||||||||||||||||
|
Equipment
Sales
|
$ | 27,857 | 20 | % | $ | 43,514 | 28 | % | $ | 51,046 | 33 | % | ||||||||||||
|
Equipment
Services
|
9,579 | 7 | % | 12,387 | 8 | % | 8,292 | 5 | % | |||||||||||||||
|
Fiber
and Data
|
31,247 | 22 | % | 24,075 | 16 | % | 20,464 | 13 | % | |||||||||||||||
|
Telecom:
|
||||||||||||||||||||||||
|
Local
Service
|
15,322 | 11 | % | 16,296 | 11 | % | 17,089 | 11 | % | |||||||||||||||
|
Network
Access
|
24,157 | 17 | % | 25,859 | 17 | % | 30,892 | 20 | % | |||||||||||||||
|
Broadband
|
12,114 | 9 | % | 10,983 | 7 | % | 9,173 | 6 | % | |||||||||||||||
|
Internet
|
4,975 | 4 | % | 4,723 | 3 | % | 4,612 | 3 | % | |||||||||||||||
|
Long
Distance
|
3,791 | 3 | % | 4,563 | 3 | % | 5,068 | 3 | % | |||||||||||||||
|
Other
|
10,060 | 7 | % | 10,775 | 7 | % | 10,013 | 6 | % | |||||||||||||||
|
Total
Revenue
|
$ | 139,102 | 100 | % | $ | 153,175 | 100 | % | $ | 156,649 | 100 | % | ||||||||||||
Enventis Sector
Equipment
Sales — We distribute communications and data processing equipment to
customers to meet their unified communications, computing and data needs. This
revenue is generated primarily through the invoicing of individual shipments of
communication and data products provided by manufacturers. The customers are
generally businesses of medium to enterprise size. Operating results generated
from this line of business can fluctuate widely due to the non-recurring sales
order nature of businesses.
Equipment
Services — This revenue includes services such as network and equipment
monitoring, maintenance and equipment installation and consulting.
Fiber and
Data — We
provide fiber-based transport for businesses, on a retail basis, and regional
and national telecommunications carriers, wireless carriers and other
communications providers on a wholesale basis. We create customer contracts
based on individual customer needs. This revenue is primarily of a monthly
recurring basis and consists of billing for the use of our fiber network and
transport connections. It is primarily under multi-year contracts with either
interexchange carriers or end-user businesses. The fiber and data product line
also includes revenue from our SingleLink Unified Communications services and
data and Internet services sold to small-to-medium size business
customers.
Telecom
Sector
Local
Service — We receive recurring revenue for basic local services which
enable end-user customers to make and receive telephone calls within a defined
local calling area for a flat monthly fee. In addition to subscribing to basic
local telephone services, our customers may choose from numerous custom calling
features. We also receive reciprocal compensation revenue based on
interconnection agreements with wireless carriers using our network to terminate
calls from their wireless subscribers.
Network Access
— We provide access services to other telecommunications carriers to
terminate or originate long distance calls on our network. Additionally, we bill
subscriber line charges to our end-user customers for access to the public
switched network. The monthly subscriber line charges are regulated and approved
by the Federal Communications Commission (“FCC”). In addition, network access
revenue is derived from several federally administered pooling arrangements
designed to provide support and distribute funding to ILECs.
Broadband —
We provide a variety of enhanced data network services on a monthly
recurring basis to our end-user customers. This includes residential and
business DSL access services, digital TV services, which are competitive
services in our markets, and business Ethernet services. Our broadband services
reflect our strategy to offer competitive integrated communication services and
bundles to customers within our Telecom footprint.
Internet — We provide high-speed
Internet services to business and residential customers. We receive revenue in
various usage based and flat rate packages based on the level of service, data
speeds and features. We also provide dial-up, email and web hosting
services.
Long
Distance — Our
end-user customers are billed for toll or long distance service on either a per
call or flat rate basis. This also includes the provision of directory
assistance, operator service and long distance private lines.
Other — We
generate revenue from directory publishing, customer premise equipment sales,
bill processing, and add/move/change services. Our directory publishing revenue
is monthly recurring revenue from end-user subscribers for yellow
page advertising.
Our bill processing revenue is generated from providing data processing as a
service to other telephone service providers. We collect a combination of
monthly recurring revenue, software license fees, and integration services
revenue from companies with which we have established a long-term data
processing relationship.
Competition
We
compete in a rapidly evolving and highly competitive industry, and expect
competition will continue to intensify. Regulatory developments and
technological advances over the past several years have increased opportunities
for alternative communications service providers, which in turn have increased
competitive pressures on our business. These alternate providers often face
fewer regulations and have lower cost structures than we do. In addition, the
telecommunications industry has experienced some consolidation and several of
our competitors have consolidated with other telecommunications providers. The
resulting consolidated companies are generally larger, have more financial and
business resources and have greater geographical reach than we do. Our
competitive advantages include superior services and support, better knowledge
of and connection to the local markets and more flexible communications
solutions than our larger competitors.
Enventis
Enventis
competes with a variety of business-to-business service providers including:
equipment providers, network providers, interexchange carriers, cable companies,
Internet service providers (“ISP”), data hosting service providers, wireless
providers and Value Added Resellers (“VARs”). Aggressive competition
exists in all product areas, and specifically the equipment portion of the
Enventis product portfolio. Enventis is currently a Gold Certified Cisco
Partner and maintains numerous certifications which demonstrate our expertise
and provides us favorable pricing. Competition also comes from an emerging class
of services under the heading of SaaS (“Software as a Service”) that will impact
customer procurement of equipment. Enventis has a centrally managed and
hosted solution, branded SingleLink, to address this trend. Enventis offers
wholesale services including network transport services, Multi-Protocol Label
Switching (“MPLS”), dedicated Internet access and Fiber-to-the-Tower. In our
wholesale segment, we compete with regional and national carriers, cable
companies and wireless service providers.
Telecom
Competition
in our Telecom Sector has intensified within the past several years for end user
services such as voice, broadband and transport services. We currently compete
with cable providers, wireless providers, competitive telephone companies, long
distance carriers, satellite providers, ISPs and VoIP providers. We focus on
providing outstanding local customer support and competitive money saving
bundles, which are customizable and allow customers to select the features,
speeds and channels they desire.
We have
and continue to expect to face increased competition from wireless carriers as
technological developments in wireless features, applications, network capacity
and economies of scale improve, providing our customers with alternatives to the
traditional local telephone and broadband services we provide. Additionally, as
consumers look to reduce expenses, they may be more inclined to discontinue
their land line and maintain their wireless phone.
We also
compete with companies that offer private lines in lieu of our switched voice
services. Additionally, services provided by companies utilizing other Internet,
wireline or wireless technologies permit the bypass of our local exchange
network. These alternatives represent a potential threat to our local service
and network access revenues.
Competition
exists with the interexchange carriers’ services we provide, such as dedicated
private lines, network switching and network routing. Our provision of these
services is primarily month-to-month ordered from a tariff, which is a schedule
of terms, rates and conditions approved by the appropriate state or federal
agency. The interexchange carriers primarily control the procurement of these
services and as they make network rearrangements, our Telecom revenue may be
reduced.
NIBI
competes with approximately 20 other companies in North America that provide
data processing and related services to telecommunications providers.
Competition is based primarily on price, service and support.
Network
Facilities
Our fiber
network is one of the most extensive in Minnesota encompassing more than 2,400
miles of fiber optic cable. Our network has SONET based fiber throughout the
state, metro rings in the major business centers and reaches more than 75% of
Minnesota’s population. We have made significant investments in our network
during the last several years adding technological augmentations such as MPLS
along with an IP-based platform. Complementing our base network with IP-based
services allows us to provide services such as Ethernet, VoIP, MPLS, and
IP-based digital TV services. We continually upgrade bandwidth capacity across
our network through tactics such as migrating our metro locations up to 10.0
gigabits, decentralizing our central office through use of new hubs and using
fiber to the home in targeted new construction areas.
Interconnection
agreements with local, regional, national and global carriers allow us to extend
our network and provide complete solutions for companies nationwide, and broaden
the availability of our hosted communications service, SingleLink. We maintain a
24x7x365 level of support to our network customers through our Network
Operations Center, located in Mankato, Minnesota.
Materials
and Supplies
The materials and supplies that are
necessary for the operation of our businesses are available from a variety of
sources. Our Telecom Sector relies upon one vendor to supply a key piece of
equipment to support our digital TV product in markets that do not utilize our
IPTV platform. We are currently working with other
vendors to potentially supply this equipment. Our central office switches are
supplied by Nortel. A majority of the equipment sold in our Enventis Sector is
supplied by Cisco. Nortel and Cisco are leading suppliers of communications and
data equipment.
Regulation
The
following summary does not describe all present and proposed federal, state and
local legislation and regulations affecting the telecommunications industry.
Some legislation and other regulations are currently the subject of judicial
proceedings, legislative hearings and administrative proposals that could change
the manner in which this industry operates. Neither the outcome of any of these
developments nor their potential impact on us can be predicted at this time.
Regulation can change rapidly in the telecommunications industry and these
changes may have an adverse effect on us in the future. See “Risk Factors —
Risks related to Regulations” on pages 16 to 18 for a further discussion of
the risks associated with regulatory change.
Overview
The
services we offer are subject to varying levels of regulatory oversight. Federal
and state regulatory agencies share responsibility for enforcing statutes and
rules relative to the provision of communications services. Our interstate
or international telecommunications services are subject to regulation by the
FCC. Intrastate services are governed by the relevant state regulatory
commission. The Telecommunications Act of 1996 and the rules enacted under
it also gave oversight of interconnection arrangements and access to network
elements to the state commissions. Our digital TV services are governed by FCC
rules and also by municipal franchise agreements. There are also varying
levels of regulatory oversight depending on the nature of the services offered
or if the services are offered by an incumbent or competitive
carrier.
MCTC,
Mid-Com and Heartland are ILECs. MCTC and MidCom are public utilities operating
pursuant to indeterminate permits issued by the Minnesota Public Utilities
Commission (“MPUC”). Heartland is also a public utility, which operates pursuant
to a certificate of public convenience and necessity issued by the Iowa
Utilities Board (“IUB”). Due to the size of our ILEC companies, neither the MPUC
nor the IUB regulates their rates of return or profits. In Minnesota, regulators
monitor MCTC and Mid-Com price and service levels. In Iowa, Heartland is not
price-regulated. Our companies can change local rates by evaluating various
factors including economic and competitive circumstances.
Crystal,
Enventis and CP Telecom are CLECs. Our CLECs provide services with less
regulatory oversight than our ILEC companies. A company must file for CLEC or
interexchange authority to operate with the appropriate public utility
commission in each state it serves. Our CLECs provide a variety of services to
both residential and business customers in multiple
jurisdictions.
Internet
access (dial-up or high speed) is unregulated at both the state and federal
levels.
Federal
Regulatory Framework
All
carriers must comply with the Federal Communications Act of 1934 as amended,
which requires, among other things, that our interstate services be provided at
just and reasonable rates and on non-discriminatory terms and conditions. The
Federal Communications Act of 1934 also requires FCC approval before we transfer
control of our operating companies, assign, acquire or transfer licenses or
authorizations issued by the FCC, or before we discontinue any interstate
service. The Federal Communications Act of 1934 was amended by the
Telecommunications Act of 1996, which had a dramatic effect on the competitive
environment in the telecommunications industry. In addition to these laws, we
are also subject to rules promulgated by the FCC and could be affected by any
regulatory decisions or orders they issue.
Access
Charges
Access
charges refer to the compensation received by local exchange carriers for the
use of their networks to originate or terminate interexchange or international
calls. We provide two types of access services: special access and switched
access. Special access is provided through dedicated circuits which connect
other carriers to our network. Special access pricing is structured on a flat
monthly fee basis. Switched access rates, which are billed to other carriers,
are based on a per-minute of use fee basis. The FCC regulates the prices that
our ILECs and CLECs including Enventis and CP Telecom charge for interstate
access charges. There has been a trend toward lowering the rates charged to
carriers accessing local networks and the application of a subscriber line
charge as a flat rate on end user bills. The lower per-minute of-use access rate
combined with overall lower minutes of use on our network due to competition has
resulted in a decrease in network access revenue, which may continue. Traffic
sensitive interstate rates were last established in June 2009 for the
period from June 30, 2009 through July 1, 2011.
Each of
our ILECs determine interstate access charges under rate of return regulation,
under which they earn a fixed return over and above operating costs. The
specific process of setting interstate access rates is governed by part 61.39 of
the FCC rules, which applies only to service providers with fewer than 50,000
lines. Two of our ILECs (MCTC and Mid-Com), utilize an average schedule process
and the concept of pooling with other ILECs in the National Exchange Carrier
Association (“NECA”) to arrive at rates and fair compensation. Our third ILEC
(Heartland) arrives at its interstate rates through a study of its own
individual interstate costs. Intrastate access rates are governed by state
utility commissions.
Interstate
access rates for CLECs were established according to an order issued by the FCC
in 2001. Under that order, the switched access rates charged by a competitive
carrier can be no higher than the rates charged by the incumbent carrier with
whom the CLEC competes. Consequently, the rates charged by our facilities-based
CLECs for switched access are significantly lower than the rates charged by our
ILECs.
There
have been ongoing discussions at the FCC regarding changes in intercarrier
compensation. We participate in evaluating and influencing proposed reforms
through our industry associations and affiliations. It is possible that our
ILECs could experience a change in revenue if intercarrier compensation reform
were to be adopted by the FCC. There is no definite timeline for the FCC to act,
so it is not possible for us to predict when any change in revenue will occur or
the extent of the impact.
The MPUC
has considered intrastate access reform and universal service for several years;
however, there has not yet been action taken. In September 2008, the IUB
issued an inquiry docket regarding establishing a state Universal Service Fund
in Iowa. The IUB had previously not exercised oversight in the access rates of
small local exchange carriers, but in January 2009, the IUB ordered rate
reductions in the rates of a tariff filed on behalf of numerous ILECs by a state
trade association. While this ruling may affect many Iowa LECs, it does not
directly impact our Iowa ILEC or CLEC as we did not adopt the association tariff
and further, the intrastate access rates of our companies are in line with the
reduced rates ordered by the IUB. We cannot estimate the impact, if any, of
future potential state access revenue changes or the availability of state
universal service support.
In recent
years, interexchange carriers and others have become more aggressive in
disputing interstate carrier access charges and/or the applicability of access
charges to their traffic. A prime example of this is the claim that companies
who provide VOIP technology services are exempt from having to pay access
charges. In 2005, the FCC ruled that it was impossible to separate VoIP traffic
into interstate and intrastate jurisdictions, and therefore such providers would
be regulated by the FCC and not by state regulatory commissions. In
January 2009, the FCC declined to declare IP traffic as exempt from access
charges. We believe that long distance and other communication providers will
continue to challenge the applicability of access charges either before the FCC
or with their local exchange carriers. To date, no long distance or other
carriers have made a claim to us contesting the applicability of access charges
on VOIP traffic. We cannot predict such future claims and cannot estimate the
impact.
Due to
the combination of rate reforms instituted by the FCC, competitive substitution
by wireless and other carriers and decreased use of the switched network, the
aggregate amount of interstate network access charges paid by long distance
carriers to access providers such as our ILECs and CLECs, has decreased and we
project that this decline will continue. For the year ended December 31,
2009, Telecom carrier access revenue represented approximately 17.4% of our
operating revenue.
Universal
Service
The
Federal Universal Service Fund was established to overcome geographic
differences in costs of providing service and to enable all citizens to
communicate over networks regardless of geographical location and/or personal
income. The FCC established universal service policies at the national level
under terms contained in the Telecommunications Act of 1934. The
Telecommunications Act of 1996 required explicit Federal Universal Service Fund
mechanisms and enlarged the scope of universal service to include four distinct
programs:
|
·
|
High-Cost
program, which subsidizes local carriers operating in high-cost regions of
the country to ensure reasonably based telephone rates. This program has
the most direct impact on our operating
companies,
|
|
·
|
Low-Income
Subscribers program, which includes the Link Up and Lifeline programs that
provide subsidies for service initiation and monthly fees, respectively,
with eligibility based on subscriber
income,
|
|
·
|
Rural
Health Care Providers program, which subsidizes telecommunications
services used by rural health care providers and provides them with toll
free access to an Internet service provider,
and
|
|
·
|
Schools
and Libraries program, also called the E-Rate program, which provides
support funding to schools and libraries for telecommunications services,
Internet access and internal
connections.
|
Federal
Universal Service Fund high cost payments are distributed by NECA and are only
available to carriers that have been designated as Eligible Telecommunications
Carriers by a state commission. Each of our ILECs has been designated as an
Eligible Telecommunications Carrier. All Eligible Telecommunications Carriers
must certify to their appropriate state regulatory commission that the funds
they receive from the Federal Universal Service Fund are being used in the
manner intended. The states must then certify to the FCC which carriers have met
this standard. That certification is due to the FCC in October of each year
in order for carriers to receive funding for the upcoming year. In 2006, both
Minnesota and Iowa adopted more stringent guidelines for this determination as
recommended by the FCC. To some extent, this increased level of scrutiny puts
our receipt of Federal Universal Service Fund payments at risk each
year.
We cannot
predict the outcome of any FCC rulemaking or pending legislation. The outcome of
any of these proceedings or other legislative or regulatory changes could affect
the amount of universal support received by our ILECs. For the year ended
December 31, 2009, Federal Universal Service Fund payments represented 3.5%
of our Telecom revenue and 1.8% of our total revenue.
The
Telecommunications Act of 1996 and Local Competition
The
primary goal of the Telecommunications Act of 1996 and the FCC’s
rules promulgated under it was to open local telecommunications markets to
competition while enhancing universal service. To some extent, Congress
pre-empted the local authority of states to oversee local telecommunications
services.
The
Telecommunications Act of 1996 imposes a number of requirements on all local
telecommunications providers which include:
|
·
|
To
interconnect directly or indirectly with other
carriers,
|
|
·
|
To
allow others to resell their
services,
|
|
·
|
To
provide for number portability, which allows end-users to retain their
telephone number when changing
providers,
|
|
·
|
To
ensure dialing parity,
|
|
·
|
To
ensure that competitor’s customers have nondiscriminatory access to
telephone numbers, operator services, directory assistance and directory
listing services, and
|
|
·
|
To
allow competitors access to telephone poles, ducts, conduits and
rights-of-way, and to establish reciprocal compensation arrangements for
the transport and termination of telecommunications
traffic.
|
There is
another tier of requirements under the Telecommunications Act of 1996 which
apply to incumbent carriers that are not designated as “rural telephone
companies.” Each of our ILECs is a rural telephone carrier and this designation
can only be removed by a petition of a competing carrier to the state regulatory
commission. Because no one has challenged our designation, our ILECs have not
had to meet these requirements. If this designation was removed, our ILECs would
be required to:
|
·
|
Provide
non-discriminatory access to discrete parts of the network, such as local
loops and transport facilities. These are referred to as unbundled network
elements, and
|
|
·
|
Provide
at rates, terms and conditions that are just, reasonable and
non-discriminatory, physical co-location of equipment necessary for
interconnection or access to unbundled network
elements.
|
The
unbundling requirements of the Telecommunications Act of 1996 have been some of
the most controversial provisions of the Act and the rules implementing
them have been revised by the FCC over the years. While our ILECs have not been
required to unbundle their networks, our CLEC operating entities have taken
advantage of the unbundling and colocation requirements and currently purchase
both products in territories served by Qwest Communications.
Environmental
Regulation
We are
subject to federal, state and local laws and regulations governing the use,
storage, disposal of, and exposure to, hazardous materials, the release of
pollutants into the environment and the remediation of contamination. We could
be subject to certain environmental laws that impose liability for the entire
cost of cleanup at a contaminated site, regardless of fault or the lawfulness of
the activity that resulted in contamination. We believe that our
operations are in substantial compliance with applicable environmental laws and
regulations.
Employees
We employ
448 employees, and the majority of these employees are based in Minnesota. A
total of approximately 290 employees are located at our headquarters in Mankato,
Minnesota. We have a collective bargaining agreement with the International
Brotherhood of Electrical Workers Local 949, which involves approximately 93 of
our employees. There have been no work stoppages or strikes by our International
Brotherhood of Electrical Workers Local 949 employees in the past 40 years and
we consider our labor relations to be good.
Intellectual
Property
We have
trademarks, trade names and licenses that we believe are necessary for the
operation of our business as we currently conduct it. The HickoryTech logo,
HickoryTech SuiteSolution, Enventis and Enventis SingleLink are registered
trademarks of the United States. We do not consider our trademarks, trade names
or licenses to be material to the operation of our business.
Item 1A. Risk Factors
Our
businesses face many risks, the most important of which we attempt to describe
in the following section. If any of the events or circumstances described in the
following risks actually occur, our business financial condition or results of
operations may suffer and impact the trading price of our stock.
Risks
Related to Our Business
Unfavorable general economic
conditions in the United States could negatively impact our operating results
and financial condition. Unfavorable general economic conditions,
including the current recession in the United States and the recent financial
crisis affecting the banking system and financial markets, could negatively
affect our business. While it is often difficult for us to predict the impact of
general economic conditions on our business, these conditions could adversely
affect the affordability and demand for some of our products and services and
could cause customers to shift to lower priced products and services or to delay
or forgo purchases of our products and services. In 2009, we experienced a
decline in our Enventis equipment business as customers deferred capital
investment. Also, our customers may not be able to obtain adequate access to
credit, which could affect their ability to make timely payments to us. If that
were to occur, we could be required to increase our allowance for doubtful
accounts, and the number of days outstanding for our accounts receivable could
increase. In addition, as discussed below under the heading “Risks Relating to
our Indebtedness and Capital Structure,” due to turmoil in the credit markets
and the decline in the economy, we may not be able to refinance maturing debt at
terms that are as favorable as those from which we previously benefited, at
terms that are acceptable to us or at all. For these reasons, among others, if
the current economic conditions persist or decline, this could adversely affect
our operating results and financial condition, as well as our ability to service
debt and pay other obligations.
The telecommunications industry is
generally subject to substantial regulatory changes, rapid development and
introduction of new technologies and intense competition that could cause us to
suffer price reductions, reduced operating margins or loss of market
share. The telecommunications industry has been, and we believe will
continue to be, characterized by several trends, including the
following:
|
·
|
Substantial
regulatory change due to the passage and implementation of the
Telecommunications Act of 1996, which included changes designed to
stimulate competition for both local and long distance telecommunications
services,
|
|
·
|
Rapid
development and introduction of new technologies and
services,
|
|
·
|
Increased
competition within established markets from current and new market
entrants that may provide competing or alternative
services,
|
|
·
|
The
blurring of traditional dividing lines between, and the bundling of,
different services, such as local dial tone, long distance, wireless,
cable TV, data and Internet services,
and
|
|
·
|
An
increase in mergers and strategic alliances that allow one
telecommunications provider to offer increased services or access to wider
geographic markets.
|
Some of
these changes have resulted in increased competition, decreased rates and
decreased profitability in our traditional wireline local exchange business. We
cannot assure you that further changes will not adversely affect our
business.
The telecommunications industry is
highly competitive. The Telecommunications Act of 1996 permitted
competition among communication companies for the rights to interconnect with
established networks and to establish new networks in order to offer telephone
service to customers in a franchised area. We serve as an ILEC in a number of
franchised areas, as well as a CLEC in a number of markets. Other
telecommunications carriers have the authority under this legislation to provide
new networking routes, points of interconnection, technology or signaling
protocol, creating competition, which could have a material adverse affect on
our profitability. Many of our voice and data competitors, such as cable TV
providers, Internet access providers, wireless service providers and long
distance carriers, have significantly greater brand name recognition and
financial, personnel, marketing and other resources. In addition, due to
consolidation and strategic alliances within the telecommunications industry, we
cannot predict the number of competitors that will emerge, especially as a
result of existing or new federal and state regulatory or legislative actions.
Such increased competition from existing and new entities could lead to price
reductions and reduced operating margins or loss of market share. Although we
attempt to differentiate our products and service through technology,
reputation, service and price, competition has increased in the markets that we
serve. This competition has impacted our profitability in the past and we cannot
assure you that it will not continue to impact our profitability in the
future.
We may not accurately predict
technological trends or the success of new products in these markets. New
product development often requires long-term forecasting of market trends,
development and implementation of new technologies and processes and substantial
capital investment. If we fail to anticipate or respond in a cost-effective and
timely manner to technological developments, changes in industry standards or
customer requirements, our business, operating results and financial condition
could be materially adversely affected.
We may not be able to successfully
introduce new products and services. Our success depends, in
part, upon our ability to successfully introduce new products and services, our
ability to offer bundled service packages on terms attractive to our customers,
our ability to expand our Internet and digital TV offerings to new markets, our
ability to introduce and distribute the equipment and systems of manufacturers
of switching equipment and the suppliers of communications technology compared
to the competitive alternatives of other suppliers, our ability to provide fiber
and data solutions and competitive IP services, including telecommunications and
network solutions and the ability of our CLEC business to provide competitive
local service in new markets.
Shifts in our product mix may result
in declines in operating profitability. Our traditional ILEC services
carry higher margins than many of our newer services. Changes in product mix may
also cause some of our inventory to become obsolete. We currently manage
potential obsolescence through reserves, but future technology changes may
exceed current reserves.
Consolidation among our customers
could result in our losing customers or experiencing a slowdown as integration
takes place. Consolidation may impact our business as our customers focus
on integrating their operations. We believe that in certain instances, customers
engaged in integrating large-scale solutions may scale back their purchases of
network equipment and services. Further, once consolidation occurs, our
customers may choose to reduce the number of vendors they use to source their
equipment or consolidate their circuits or network routing. After consolidation
occurs, there is no assurance that we will continue to supply equipment or
network services to the surviving communications service provider. The impact of
significant mergers on our business is likely to be unclear until sometime after
such transactions have closed.
We depend on third parties, over
whom we have no control, to deliver our services. Because of the
interconnected nature of the communications industry, we depend heavily on
other telecommunications companies, network providers, and program service
providers some of whom have exclusive rights to content and equipment vendors to
deliver our services. Delays in the shipment of equipment or the loss of
our principal equipment supplier could significantly impact our Enventis
operations. In addition, we are dependent on easements, franchises and licenses
from various private and public entities in order to construct and operate our
networks. The failure to maintain these necessary third party arrangements
on acceptable terms would have an adverse effect on our ability to conduct our
business.
Our possible pursuit of acquisitions
could be expensive, may not be successful and, even if successful may be more
costly than anticipated. Our ability to complete future acquisitions will
depend on our ability to identify suitable acquisition candidates, negotiate
acceptable terms for their acquisition and, if necessary, finance those
acquisitions, in each case, before any attractive candidates are purchased by
other parties, some of whom may have greater financial resources than us.
Whether or not any particular acquisition is closed successfully, these
activities are expensive and require our management to spend considerable time
and effort to accomplish them, which may detract from their ability to run our
current business. We may face unexpected challenges in receiving any required
approvals from the FCC or other applicable state regulatory commissions, which
could result in delay or our not being able to consummate the acquisition.
Although we may spend considerable expense and effort to pursue acquisitions, we
may not be successful in closing them.
If we are
successful in closing acquisitions, we would face several risks associated with
integration. In addition, any due diligence we perform may not prove to have
been accurate. For example, we may face unexpected difficulties in entering
markets in which we have little or no direct experience or in generating
unexpected revenue and cash flow from the acquired companies or
assets.
If we do
pursue an acquisition or a strategic transaction and any of these risks
materialize, they could have a material adverse effect on our business and our
ability to achieve sufficient cash flow, provide adequate working capital,
service and repay our indebtedness and leave sufficient funds to pay
dividends.
Risks
Related to the Management of Our Operations
A failure in our operational systems
or infrastructure could impair our liquidity, disrupt our business, damage our
reputation and cause loss. Shortcomings or failures in our internal
processes, people or systems could impair our liquidity, disrupt our business,
result in liability to customers or regulatory intervention, damage our
reputation or result in financial loss. For example, our telephone operations
require a central switch to complete local and long distance phone calls to
customers. An interruption in the switch operations could lead to interrupted
service for customers. To be successful, we will need to continue providing our
customers with a reliable and secure network. Disruptions or system failures may
cause interruptions in service or reduced capacity for customers. Our inability
to accommodate an increasing volume of transactions could constrain our ability
to increase revenue and expand our businesses. Despite the existence of
contingency plans and facilities, our ability to conduct business may be
adversely impacted by a disruption in the infrastructure that supports our
businesses and the communities in which these businesses are
located.
We operate our network and our
business under contracts and franchises that are subject to non-renewal or
termination. Our network operates pursuant to franchises, permits or
rights from public and private entities, which are terminable if we fail to
comply with material terms of the authority we receive. Many of these permits
and contracts we utilize in our network, have fixed terms and must be renewed
periodically. Our success is dependent on continuing these relationships
without material increase in our expenses or restrictions on our
use.
Our business may be harmed if we are
unable to maintain data security. We are dependent upon automated
information technology processes. Any failure to maintain the security of our
data and our employees’ and customers’ confidential information, including via
the penetration of our network security and the misappropriation of confidential
information, could result in fines, penalties, and private litigation. Any such
failure could adversely impact our business, financial condition and results of
operations.
Our businesses may be adversely
affected if we are unable to hire and retain qualified employees. Our
performance is largely dependent on the talents and efforts of highly skilled
individuals in our telecommunication businesses, including telephone operations,
fiber network sales and administration, billing software development and
communications equipment sales and service. Technological advances require our
employees to continually increase their knowledge base. Our ability to compete
and grow our business effectively depends upon our ability to attract qualified
employees and retain and motivate our existing employees. Our inability to
attract and retain highly qualified technical and senior management in the
future could have a material adverse effect on our business, financial condition
and results of operations. In addition, we may acquire new businesses and our
success will depend, in part, upon our ability to retain or hire and integrate
personnel from acquired businesses, who are critical to the continued success or
the successful integration of these acquired businesses.
The loss of our certification as a
Cisco Gold Partner, or by Cisco losing its position as a leading provider of
technology solutions would adversely impact our Enventis operations. The
majority of our Enventis equipment practice is based on the Cisco product line
by which we provide communications and technological solutions for business
customers. If Cisco equipment and technology fall out of favor in the
marketplace, our success as a distributor may decline or be delayed as we seek
alternative solutions. While Cisco has made no previous indication it would do
so, it could suspend our Gold Partner program and affect our success as a
leading distributor. It is also possible that we may lose the certified
technicians who build the basis for our qualification as a Gold distributor. Our
continued success in providing Cisco communications solutions would be adversely
affected if we were not classified as a top-level distributor with Cisco and may
cause us to change our business plan to be less dependent on equipment-related
solutions.
We may have unanticipated increases
in capital spending, operating or administrative costs, or seek new business
opportunities that require significant up-front investments. We operate in
cash-flow-dependent businesses. Our existing networks require large capitalized
up-front investments for growth and maintenance. Our operating expenses in the
form of payroll for a highly trained workforce and the maintenance cost of
telecommunications networks are large uses of cash. Our debt service obligation
and any dividends to shareholders also require significant cash each year. New
business development may require additional up-front investment in assets and
funding of early stage operating losses. Although we establish financial plans
to attempt to ensure cash is adequate to fund operations, a sudden unanticipated
increase in cash outflow after we have already initiated our business plans
could alter our future plans, which could possibly affect our growth or ability
to maintain our current network infrastructure.
Risks
related to Regulations
The telecommunications industry in
which we operate is subject to extensive federal, state and local regulation
that could change in a manner adverse to us. Our local telephone
businesses in Minnesota and Iowa are subject to extensive regulations that
impact the rates we charge, the areas we service, our contracts with suppliers
and virtually every facet of our business. Laws and regulations may be, and in
some cases have been, challenged in the courts and could be changed by Congress,
state legislatures or regulators at any time. New regulations could be imposed
by federal or state authorities further impacting our operating costs or capital
requirements in a manner that is adverse to us. We cannot predict the impact of
future developments or changes to the regulatory environment or the impact such
developments or changes may have on us. Adverse rulings, legislation or changes
in governmental policy on issues material to us could increase our competition,
cause customer attrition, decrease our revenue, increase our costs and decrease
our profitability.
Legislative or regulatory changes
could reduce the revenue received from network access charges. Access
charges, which are intended to compensate our ILEC and CLEC operations for
originating, terminating or transporting long distance and other carriers’ calls
in our service areas, accounted for approximately 17.4% of our total revenue in
2009. The amount of network access charges we receive is based on interstate
rates set by the FCC and intrastate rates set by the MPUC and the IUB. The large
national carriers who pay these charges have advocated in the past that access
charges should be reduced and some network providers have argued that access
charges do not apply to specific types of traffic. As our business becomes
increasingly competitive, the regulatory disparities regarding network access
revenue, the marketplace forces on its pricing levels and our ability to
enforce the historical rules for collecting this revenue, could have a material
adverse effect on our business. We cannot predict whether or when action may be
taken on any of these issues, or what effect any action may have on revenue and
costs.
We
believe that there has been a general increase in the unauthorized use of
telecommunications providers’ networks without payment of appropriate access
charges, or so-called “phantom traffic,” due in part to advances in technology
that have made it easier to use networks while avoiding payment for the traffic.
As a general matter, we believe this phantom traffic is due to unintended usage
and, in some cases, fraud. While we perform revenue assurance tests regularly,
we are at risk for potential claims made against us contesting the applicability
of network access charges. If there is a successful dispute or avoidance of the
applicability of network access charges, our revenue could decrease causing a
material impact to our operations.
16
Legislative or regulatory changes
could reduce or eliminate the government subsidies we receive. The
federal system of subsidies, from which we derive a portion of our revenue, is
subject to modification. Our ILEC operations received the following federal
subsidy payments.
|
·
|
For
the year ended December 31, 2009, we received an aggregate of $2,479,000
from the Federal Universal Service Fund, which comprised 1.8% of our
revenue for the year.
|
|
·
|
For
the year ended December 31, 2008, we received an aggregate of $2,699,000
from the Federal Universal Service Fund, which comprised 1.8% of our
revenue for the year.
|
|
·
|
For
the year ended December 31, 2007, we received an aggregate of $3,268,000
from the Federal Universal Service Fund, which comprised 2.1% of our
revenue for the year.
|
During
the last two years, the FCC has made modifications to the Federal Universal
Service Fund system that changed the sources of support and the method for
determining the level of support to Federal Universal Service Fund recipients.
It is unclear whether the changes in methodology will continue to accurately
reflect the costs incurred by our ILEC operations and whether we will continue
to receive the same amount of Federal Universal Service Fund support that we
have received in the past. The FCC is also currently considering a number of
issues regarding the source and amount of contributions to, and eligibility for
payment from, the Federal Universal Service Fund, and these issues may also be
the subject of legislative amendments to the Telecommunications Act of
1996.
In
addition, under the Telecommunications Act of 1996, our competitors may obtain
the same level of Federal Universal Service Fund subsidies we do if the MPUC or
IUB, as applicable, determines that granting these subsidies to competitors
would be in the public interest and the competitors offer and advertise certain
telephone services as required by the Telecommunications Act of 1996 and the
FCC. Under current rules, any such payments to our competitors would not affect
the level of subsidies received by our ILEC and CLEC operations, but they would
facilitate competitive entry into our ILEC and CLEC service areas and we may not
be able to compete as effectively or otherwise continue to operate as
profitably. Because of the growing number of competitors receiving Universal
Service Fund subsidies, the FCC is considering universal service reforms to
limit the size of the fund.
Legislative and regulatory changes
in the telecommunications industry could raise our costs by facilitating greater
competition against us and reduce potential revenue. Legislative and
regulatory changes in the telecommunications industry could adversely affect our
business by facilitating greater competition, reducing our revenue or raising
our costs. For example, federal or state legislatures or regulatory commissions
could impose new requirements relating to standards or quality of service,
credit and collection policies, or obligations to provide new or enhanced
services.
Increased regulation of the Internet
could decrease our revenue. Currently, there exists only a small body of
law and regulation applicable to access to, or commerce on, the Internet. As the
significance of the Internet expands, federal, state and local governments may
adopt new rules and regulations or apply existing laws and regulations to the
Internet. The FCC is currently reviewing the appropriate regulatory framework
governing broadband consumer protections for high-speed access to the Internet
through telephone and cable TV providers’ communications networks. The outcome
of these proceedings may affect our regulatory obligations and costs and
competition for our services which could have a material adverse effect on our
revenue.
Our operations are subject to
environmental, health and safety laws and regulation that increase our costs of
operations and could subject us to liability. Our operations and
properties are subject to federal, state and local laws and regulations relating
to the protection of the environment, natural resources and worker health and
safety that could adversely affect our profitability. We operate under a number
of environmental and health and safety laws, including laws and regulations
governing and creating liability to, the management, storage and disposal of
hazardous materials, asbestos, petroleum products and other regulated materials.
We are subject to environmental laws and regulations governing air emissions
from our fleets of vehicles. As a result, we face several risks, including the
following:
|
·
|
Under
certain environmental laws, we could be held liable, jointly and severely
and without regard to fault, for the costs of investigating and the
remediation of any actual or threatened environmental contamination at
currently and formerly owned or operated properties, and those of our
predecessors, and for contamination associated with disposal by us or our
predecessors of hazardous materials at third party disposal
sites,
|
|
·
|
The
presence of contamination can adversely affect the value of our properties
and our ability to sell any such affected property or to use it as
collateral,
|
|
·
|
We
could be held responsible for third party property damage claims, personal
injury claims or natural resource damage claims relating to any such
contamination,
|
|
·
|
The
cost of complying with existing environmental requirements could be
significant,
|
|
·
|
Adoption
of new environmental laws, regulations or changes in existing laws or
regulations or their interpretations could result in significant
compliance costs or as yet identified environmental
liabilities,
|
|
·
|
Future
acquisition of businesses or properties subject to environmental
requirements or affected by environmental contamination could require us
to incur substantial costs relating to such matters,
and
|
|
·
|
In
addition, environmental laws regulating wetland, endangered species and
other land use and natural resource issues may increase costs associated
with future business or expansion opportunities, delay, alter or interfere
with such plans, or otherwise adversely affect such
plans.
|
The high cost of regulatory
compliance could make it more difficult for us to enter new markets, make
acquisitions or change our prices. Regulatory compliance results in
significant costs for us and diverts the time and effort of our management and
officers away from running the business. In addition, because regulations differ
from state to state, we could face significant costs in obtaining information
necessary to compete effectively if we try to provide services, such as long
distance services, in different states. These information barriers could cause
us to incur substantial costs and to encounter significant obstacles and delays
in entering these markets. Compliance costs and information barriers could also
affect our ability to evaluate and compete for new opportunities to acquire
local access lines or businesses as they arise.
Our
intrastate services are also generally subject to certification, tariff filing
and other ongoing state regulatory requirements. Challenges to our tariffs by
regulators or third parties or delays in obtaining certifications and regulatory
approvals could cause us to incur substantial legal and administrative expenses.
If successful, these challenges could adversely affect the rates that we are
able to charge to customers, which would negatively affect our
revenue.
We may incur significant costs from
lawsuits and regulatory inquiries. Any such claims or regulatory
inquiries, whether successful or not, may require us to devote significant
amounts of monetary or human resources to defend ourselves. It could be
necessary to spend significant amounts on our legal defense and senior
management may be required to divert their attention which could detract from
their ability to run our business. If as a result of any proceedings, a judgment
is rendered or a decree is entered against us, it may adversely affect our
business, financial condition and results of operations.
Risks
Related to Our Indebtedness and Our Capital Structure
We have a large balance of senior
bank debt outstanding and may incur additional indebtedness in the future, which
could restrict our ability to pay dividends and fund our operations. We
have senior bank debt outstanding under long-term financing agreements. As of
December 31, 2009, we had $120,491,000 of total long-term debt outstanding,
including current maturities. The degree to which we are leveraged could have
important consequences including:
|
·
|
Requiring
us to dedicate a substantial portion of our cash flow from operations to
make principal and interest payments on our
debt,
|
|
·
|
Limiting
our flexibility in planning for, or reacting to, changes in our business
and the industry in which we
operate,
|
|
·
|
Limiting
our ability to borrow additional funds, or to sell assets to raise funds,
if needed, for working capital, capital expenditures, acquisitions or
other purposes,
|
|
·
|
Increasing
our vulnerability to general adverse economic and industry conditions,
including changes in interest rates,
and
|
|
·
|
Placing
us at a competitive disadvantage compared to our competitors that have
less debt.
|
We cannot
assure you that we will generate sufficient revenue to service and repay our
debt and have sufficient funds left over to achieve or sustain profitability in
our operations, meet our working capital and capital expenditure needs, compete
successfully in our markets or pay dividends to our stockholders.
We may not be able to refinance our
current debt on favorable terms. Most of the indebtedness under our
credit facility matures in 2012 and we would anticipate refinancing in the year
2011. Due to turmoil in the credit markets and the economic conditions impacting
our business, we may not be able to refinance maturing debt on terms that are as
favorable as those we are benefiting from now, on terms that are acceptable to
us or at all.
18
If we seek additional financing, we
may not be able to obtain it on favorable terms, or at all, and our shareholders
may experience dilution of their ownership interest if we seek equity
financing. We currently anticipate that our available cash resources,
which include our ability to generate net cash in-flow from our operations, our
credit facility, existing cash, cash equivalents and available-for-sale
securities, will be sufficient to meet our anticipated needs for working capital
and capital expenditures to execute our near-term business plan, based on
current business operations and economic conditions. If our estimates are
incorrect and we are unable to generate sufficient cash flows from operations
and we expend our credit facility, we may need to raise additional funds. In
addition, if one or more of our strategic growth opportunities exceeds our
existing resources, we may be required to seek additional capital. If we raise
additional funds through the issuance of equity or equity-related securities,
our shareholders may experience dilution of their ownership interests and the
newly issued securities may have rights superior to those of common stock. Our
existing debt covenants require a portion of the proceeds of an equity offering
be applied to the outstanding debt balance. If we raise additional funds by
issuing additional debt, we may be subject to restrictive covenants that could
limit our operating flexibility, and increased interest payments could dilute
earnings per share.
We are subject to risks associated
with changes in interest rates. We face market risks from changes in
interest rates that could adversely affect our results of operations and
financial condition. Although we attempt to reduce this risk through the use of
derivative financial instruments, we do not enter into derivative instruments
for the purpose of speculation. In March 2007, we entered into an interest rate
protection agreement which matures in March 2010 on approximately $60,000,000 of
our variable-interest rate debt in order to manage our exposure to interest rate
movements. In March 2008, we entered into a second interest-rate swap
agreement, effectively locking in the interest rate on an additional
$40,000,000 of variable-interest rate debt through February 2010. In March
2009, we entered into an interest-rate swap agreement, effectively locking in
the interest rate on $80,000,000 of variable-interest rate debt from March 2010
to September 2011. If interest rates fail to rise as anticipated when the
instruments were acquired, we will experience higher-than-market-rate interest
expense and would have paid for protection that wasn’t needed. We also risk
entering a higher interest rate environment when the interest rate protection
agreements expire in 2011. This could affect our future interest expense level.
In addition, we have a fixed interest rate lock on $19,200,000 of our variable
interest rate debt which expires in February 2010. We are subject to the same
positive or negative impacts relative to variable rate alternatives as described
above for our use of derivative instruments.
We are subject to restrictive debt
covenants and other requirements related to our outstanding debt that limit our
business flexibility by imposing operating and financial restrictions on
us. These restrictions limit or restrict, among other things, our ability
and the ability of our subsidiaries that are restricted by these agreements
to:
|
·
|
Incur
additional debt and issue preferred
stock,
|
|
·
|
The
payment of dividends on, and purchase or redemption of, capital
stock,
|
|
·
|
Make
investments in excess of a
threshold,
|
|
·
|
Make
capital expenditures in excess of a
threshold,
|
|
·
|
Create
liens on our assets,
|
|
·
|
Sell
certain assets,
|
|
·
|
Engage
in some transactions with
affiliates,
|
|
·
|
Engage
in business other than telecommunications businesses,
and
|
|
·
|
Make
other restricted payments, including payments in connection with
investments and acquisitions in excess of a
threshold.
|
These
restrictions could limit our ability to obtain future financing, make
acquisitions or fund capital expenditures, withstand downturns in our business
or take advantage of business opportunities. Furthermore, the credit facilities
also require us to maintain specified total leverage and minimum interest
coverage ratios and to satisfy specified financial condition tests, and may
require us to make annual mandatory prepayments with a portion of our available
cash. Our ability to comply with the ratios may be affected by events beyond our
control including prevailing economic, financial and industry
conditions.
A breach
of any of these covenants contained in our credit agreement could result in a
default under our credit facilities. If we were to default, the lenders could
elect to declare all amounts outstanding under the credit facilities to be due
and payable. If the amounts outstanding under our credit facilities were to be
accelerated, we cannot assure you that our assets would be sufficient to repay
the money in full owed to the lenders or to our other debt holders.
Our lenders may not be able to fund
cash draws under our credit facility. We
have binding contracts with six entities upon which we depend for our daily
supply of cash. Five entities are in our senior credit
facility; CoBank ACB, Rural Telephone Finance Cooperative,
Wachovia Bank NA (a Wells Fargo Company), US Bank NA and General Electric
Capital Corporation. These entities operate under a common syndicate agreement
using unified terms and conditions. The sixth entity is General Electric
Commercial Distribution Finance Corporation with whom we operate a wholesale
financing agreement to fund inventory purchased from certain vendors, in an
extended term payable arrangement. It provides 60 days interest free payment
terms for Enventis working capital purposes. In spite of the contractual
obligation of these institutions to perform under the financing agreement, and
in spite of our attempts to remain informed of the capability of these
institutions to perform their functions for us, we may learn that our request
for cash on any given day cannot be fulfilled.
Risks
Related to Financial Aspects of Our Company
Customer payment defaults could have
an adverse effect on our financial condition and results of operations.
As a result of adverse market conditions, some of our customers may experience
serious financial difficulties. Some of the interexchange carriers and long
distance companies that utilize our network are our largest customers when it
comes to recurring revenue. In some cases these difficulties have resulted or
may result in bankruptcy filings or cessation of operations. If customers
experiencing financial problems default on amounts owed to us, we may not be
able to recognize expected revenue. Although we currently manage this exposure
through an allowance for doubtful accounts, an unexpected bankruptcy or default
by a customer may not be fully reserved for in our allowance.
In the future it may become
necessary for us to offer equipment financing to some of our customers to remain
competitive. If we offer such financing, it would be our intent to sell
all or a portion of the financing receivables to third parties. In the past, we
have sold some receivables with recourse and have had to compensate the
purchaser for the related losses.
A failure to maintain effective
internal controls could adversely affect our business. Although we have
completed the documentation and testing of the effectiveness of our internal
control over financial reporting for fiscal 2009, as required by Section 404 of
the Sarbanes-Oxley Act of 2002, we expect we will have to incur continuing
costs, which may include increased accounting fees and increased staffing
levels, in order to maintain compliance with the Sarbanes-Oxley Act. In
addition, our ability to integrate the operations of other companies that we may
acquire in the future could impact our compliance with Section 404. In the
future, if we fail to complete the Sarbanes-Oxley 404 evaluation in a timely
manner, or if our independent registered public accounting firm cannot attest in
a timely manner to the effectiveness of our internal controls, we could be
subject to regulatory scrutiny and a loss of public confidence in our internal
controls. In addition, any failure to implement required new or improved
controls, or difficulties encountered in their implementation, could harm our
operating results or cause us to fail to meet our reporting
obligations.
Risks
Related to Our Common Stock
Our board of directors could, in its
discretion, depart from or change our dividend payment practices at any time.
We are not required to pay dividends and our stockholders are not
guaranteed, and do not have contractual or other rights, to receive dividends.
Our board of directors may decide at any time, at its discretion, to decrease
the amount of dividends, otherwise change or revoke our past dividend payment
practices or discontinue entirely the payment of dividends. In addition, if we
do not pay dividends for whatever reason, your shares of our common stock could
become less liquid and the market price of our common stock could
decline.
Our
ability to pay dividends, and our board of directors’ determination to maintain
our past dividend payment practices, will depend on numerous factors, including
the following:
|
·
|
The
state of our business, the environment in which we operate and the various
risk factors we face, including, but not limited to competition,
technological change, industry change, regulatory and other risks
summarized in this Annual Report on Form
10-K,
|
|
·
|
Our
future results of operations, financial condition, liquidity needs and
capital resources,
|
|
·
|
Our
cash needs, including interest and any future principal payments on our
indebtedness, capital expenditures, taxes, pension and other
post-retirement contributions and certain other costs,
and
|
|
·
|
Potential
sources of liquidity, including borrowing under our revolving credit
facility or possible asset sales.
|
While our
cash flow available to pay dividends for the year ended December 31, 2009 was
sufficient to pay dividends in accordance with our past dividend payment
practices, if our estimated cash flow were to fall below our expectations, our
assumptions as to estimated cash needs are too low or if other applicable
assumptions were to prove incorrect, we may need to:
|
·
|
Either
reduce or eliminate dividends,
|
|
·
|
Fund
dividends by incurring additional debt (to the extent we were permitted to
do so under agreements governing our then existing debt), which would
increase our leverage, debt repayment obligations and interest expense and
decrease our interest coverage, resulting in, among other things, reduced
capacity to incur debt for other purposes, including to fund future
dividend payments,
|
|
·
|
Amend
the terms of our credit agreement, if our lenders agreed, to permit us to
pay dividends or make other payments if we are otherwise not permitted to
do so,
|
|
·
|
Fund
dividends from future issuances of equity securities, which could be
dilutive to our stockholders and negatively affect the price of our common
stock,
|
|
·
|
Fund
dividends from other sources, such as by asset sales or by working
capital, which would leave us with less cash available for other purposes,
and
|
|
·
|
Reduce
other expected uses of cash, such as capital
expenditures.
|
If we continue to pay dividends at
the level currently anticipated under our current dividend payment practices,
our ability to pursue growth opportunities may be limited. We believe
that our current dividend payment practices could limit, but not preclude, our
ability to grow. If we continue paying dividends at the level currently
anticipated under our current dividend payment practices, we may not retain a
sufficient amount of cash and may need to seek financing to fund a material
expansion of our business, including any significant acquisitions or to pursue
growth opportunities requiring capital expenditures significantly beyond our
current expectations.
Anti-takeover provisions in our
charter documents, our shareholder rights plan and Minnesota law could prevent
or delay a change in control of our Company. Provisions of our articles
of incorporation and bylaws, our shareholder rights plan (also known as a
“poison pill”) and Minnesota law may discourage, delay or prevent a merger or
acquisition that a shareholder may consider favorable and may limit the market
price for our common stock. These provisions include the following:
|
·
|
Authorization
for our Board of Directors to issue preferred stock without shareholder
approval,
|
|
·
|
Limitations
on business combinations with interested shareholders,
and
|
|
·
|
Advance
notice requirements for shareholders
proposals.
|
Some of
these provisions may discourage a future acquisition even though our
shareholders would receive an attractive value for their shares or a significant
number of our shareholders believe such a proposed transaction would be in their
best interest.
Our stock price is volatile.
Based on the trading history of our common stock and the nature of the market
for publicly traded securities of companies in our industry, we believe that
some factors have caused and are likely to continue to cause the market price of
our common stock to fluctuate substantially. These fluctuations could occur
day-to-day or over a longer period of time and may be accentuated by the lack of
liquidity in our stock. The factors that may cause such fluctuations include,
without limitation:
|
·
|
Due
to our low liquidity of stock trading volume, any imbalance between period
supply and demand in shares
offered,
|
|
·
|
General
economic conditions in the United States or
internationally,
|
|
·
|
Our
financial health and the financial health of our competitors or our
customers,
|
|
·
|
Developments
in telecommunications regulations,
|
|
·
|
Consolidation
among our competitors or customers,
|
|
·
|
Rumors
or speculation regarding our future business results and
actions,
|
|
·
|
Increased
competition with our competitors or among our
customers,
|
|
·
|
Quarterly
fluctuations in our financial results or the financial results of our
competitors or customers,
|
|
·
|
Announcements
of new products and services by us or our competitors,
and
|
|
·
|
Disputes
concerning intellectual property
rights.
|
In
addition, stocks of companies in our industry in the past have experienced
significant price and volume fluctuations that are often unrelated to the
operating performance of such companies. This market volatility may adversely
affect the market price of our common stock.
Item 1B. Unresolved Staff
Comments
None.
Item 2. Properties
Our
business is primarily focused on the provision of service and our properties are
used for administrative support and to store and safeguard equipment. On
December 31, 2009, our gross property, plant and equipment consisted primarily
of telephone switches, cable, fiber optic networks and network equipment. Our
extensive fiber optic network is primarily owned, but we also have indefeasible
rights to use and long-term leasing commitments to accentuate our owned network.
It is our opinion that our properties are suitable and adequate to provide
modern and effective communications services within our service
areas.
Our
principal property locations are the following:
Enventis
Sector
|
1.
|
Lease
approximately 16,000 square feet of office space in Plymouth, Minnesota
for general offices, technology services and system
support.
|
|
2.
|
Lease
approximately 9,300 square feet in Duluth, Minnesota for general
offices.
|
|
3.
|
Lease
approximately 1,700 square feet in Rochester, Minnesota for general
offices and a network equipment
facility.
|
|
4.
|
Lease
approximately 5,550 square feet in Minneapolis, Minnesota for general
offices.
|
|
5.
|
License
approximately 2,200 square feet in Edina, Minnesota for a data
center.
|
|
6.
|
Utilize
approximately 2,200 square feet secured space within our headquarters
building in Mankato, Minnesota for a data
center.
|
|
7.
|
License
approximately 400 square feet in Duluth, Minnesota for a data
center.
|
Telecom
Sector
|
1.
|
General
offices and our principal central office exchange building are located in
downtown Mankato, Minnesota. This facility, built in 1963, is owned and is
a three-level brick and stone building containing approximately 60,000
square feet of floor space.
|
|
2.
|
Our
main operations center, built in 1996, is owned and located in Mankato,
Minnesota. This operations center is a two-story concrete building
containing approximately 48,000 square feet. The warehouse portion of the
building is used to store vehicles and supplies and is also used as office
space for engineers and
technicians.
|
|
3.
|
Central
office equipment is located in a one-story brick structure in Rock Rapids,
Iowa containing approximately 1,500 square feet of space. We also lease
approximately 2,000 square feet of general office space in Rock Valley,
Iowa.
|
|
4.
|
Lease
office space of approximately 6,000 square feet in Urbandale,
Iowa.
|
|
5.
|
Own
a four-level building in Mankato, Minnesota containing approximately
17,000 square feet used as office space for the data processing services
of our company.
|
Item 3. Legal Proceedings
Other
than routine litigation incidental to our business, there are no pending
material legal proceedings to which we are a party or to which any of our
property is subject.
Item 4. Reserved
|
Item 5. Market for Registrant's Common
Equity, Related Stockholder Matters and Issuer Purchases of Equity
Securities
|
Our
common stock is quoted on the NASDAQ Global Select Market under the symbol
“HTCO.” As of February 8, 2010, there were 1,345 registered shareholders and
1,925 beneficial owners of HickoryTech stock. The following table sets forth the
end-of-day high and low prices for our common stock quoted on the NASDAQ Global
Select Market during 2009 and 2008. The prices below are daily closing prices,
not intraday prices.
|
2009
|
High
|
Low
|
End
of Qtr.
|
|||
|
4th
Quarter
|
$9.29
|
$7.80
|
$8.83
|
|||
|
3rd
Quarter
|
$9.15
|
$7.93
|
$8.55
|
|||
|
2nd
Quarter
|
$8.46
|
$5.28
|
$7.68
|
|||
|
1st
Quarter
|
$6.60
|
$4.91
|
$5.38
|
|||
|
2008
|
High
|
Low
|
End
of Qtr.
|
|||
|
4th
Quarter
|
$6.29
|
$4.92
|
$5.44
|
|||
|
3rd
Quarter
|
$8.25
|
$5.81
|
$5.81
|
|||
|
2nd
Quarter
|
$8.95
|
$7.77
|
$8.27
|
|||
|
1st
Quarter
|
$9.48
|
$7.97
|
$8.27
|
Dividend Tendencies and Restrictions
We
declared quarterly dividends on our common stock of $.13 per share for the year
ended December 31, 2009. We declared quarterly dividends on our common stock of
$0.12 per share for the first three quarters in 2008 and $0.13 per share for the
fourth quarter in 2008. A quarterly cash dividend of $0.13 per share will be
paid on March 5, 2010 to stockholders of record at the close of business on
February 15, 2010.
Our board
of directors has adopted dividend payment practices that reflect its judgment
that our stockholders would be better served if we distributed to them a portion
of the cash generated by our business in excess of our expected cash needs
rather than retaining it or using the cash for other purposes, such as to make
investments in our business or to make acquisitions. We expect to continue to
pay quarterly dividends at an annual rate of $0.52 per share during 2010, but
only if and to the extent declared by our board of directors on a quarterly
basis and subject to various restrictions on our ability to do so (see below).
Dividends on our common stock are not cumulative.
The terms
of our credit facility include certain restrictions regarding the payment of
dividends. The dividend restriction provides that we may not make dividend
distributions or repurchase stock in an aggregate amount in excess of 100% of
the previous year’s net income. In 2007, we were in violation of this dividend
restriction, but a waiver was obtained.
The cash
requirements of our current dividend payment practices are in addition to our
other expected cash needs, both of which we expect to be funded with cash flow
from operations. In addition, we expect we will have sufficient availability
under our revolving credit facility to fund dividend payments in addition to any
expected fluctuations in working capital and other cash needs, although we do
not intend to borrow under this facility to pay dividends.
Issuer
Purchases of Common Stock
During
the quarter ended December 31, 2008, we acquired and retired 393,000 common
shares in block transactions handled through market makers. This was the first
acquisition of our shares since 2003. We do not have a formal share repurchase
plan. Details of the transactions follow:
|
Total
Number of
|
Average
Price Paid
|
Brokerage
|
Total
Transaction
|
|||||||||||||
|
Purchase
Date
|
Shares
Purchased
|
per
Share
|
Commissions
|
Cost
|
||||||||||||
|
October
31, 2008
|
300,000 | $ | 6.10 | $ | 13,500 | $ | 1,843,500 | |||||||||
|
November
20, 2008
|
93,000 | $ | 5.55 | $ | 3,300 | $ | 519,450 | |||||||||
No purchases of common stock were made in 2009.
Equity
Compensation Plan
The
following table provides information on equity compensation plans under which
equity securities of the Company are authorized for issuance, as of December 31,
2009.
|
Plan
Category
|
Number
of securities to be issued upon exercise of outstanding options, warrants
and rights
|
Weighted-average
exercise price of outstanding options, warrants and rights
|
Number
of securities remaining available for future issuance under equity
compensation plans (excluding securities reflected in column
A)
|
|||||||||
| A | B | C | ||||||||||
|
Equity
compensation plans approved by security holders (1):
|
430,950 | $ | 12.87 | 1,774,018 | ||||||||
|
Equity
compensation plans not approved by security holders:
|
-- | -- | -- | |||||||||
|
Total
|
430,950 | $ | 12.87 | 1,774,018 | ||||||||
(1) Includes the Company’s Employee Stock Purchase Plan, Retainer Stock Plans for Directors, Non-Employee Director Stock Option Plan, Non-Employee Directors’ Incentive Plan and Stock Award Plan.
Five
Year Shareholder Return Performance Presentation
The
following table compares the cumulative total shareholder return on the common
stock of HickoryTech for the last five fiscal years with the cumulative total
return on the Russell 2000 Index and the NASDAQ Telecommunications Index. “Total
shareholder return” assumes the investment of $100 in HickoryTech’s common
stock, the Russell 2000 index and the NASDAQ Telecommunication Index on December
31, 2004 and reinvestment of all dividends.
Total
Return to Shareholders (includes reinvestment of dividends)
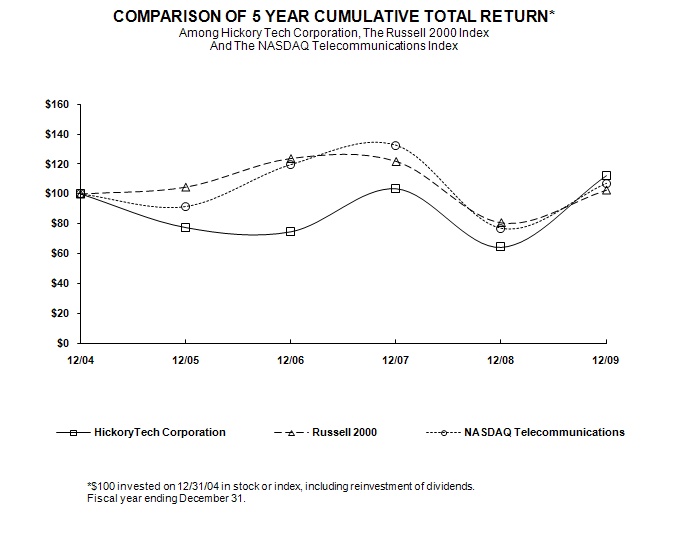
|
ANNUAL
RETURN PERCENTAGE
|
||||||||||||||||||||
|
Years
Ended
|
||||||||||||||||||||
| 12/05 | 12/06 | 12/07 | 12/08 | 12/09 | ||||||||||||||||
|
HickoryTech
Corporation
|
-22.34 | % | -3.59 | % | 38.17 | % | -37.69 | % | 74.09 | % | ||||||||||
|
Russell
2000
|
4.55 | % | 18.37 | % | -1.57 | % | -33.79 | % | 27.17 | % | ||||||||||
|
NASDAQ
Telecommunications
|
-8.34 | % | 30.56 | % | 10.77 | % | -41.84 | % | 39.02 | % | ||||||||||
|
INDEXED
RETURNS
|
||||||||||||||||||||||||
|
Years
Ended
|
||||||||||||||||||||||||
|
Base
|
||||||||||||||||||||||||
|
Period
|
||||||||||||||||||||||||
| 12/04 | 12/05 | 12/06 | 12/07 | 12/08 | 12/09 | |||||||||||||||||||
|
HickoryTech
Corporation
|
100.00 | 77.66 | 74.87 | 103.45 | 64.45 | 112.21 | ||||||||||||||||||
|
Russell
2000
|
100.00 | 104.55 | 123.76 | 121.82 | 80.66 | 102.58 | ||||||||||||||||||
|
NASDAQ
Telecommunications
|
100.00 | 91.66 | 119.67 | 132.55 | 77.09 | 107.17 | ||||||||||||||||||
Item 6. Selected Financial Data
|
(Dollars
in thousands except share and per share amounts)
|
||||||||||||||||||||
|
Statement
of Operations Data:
|
2009
|
2008
|
2007
|
2006
|
2005
|
|||||||||||||||
|
Operating
revenue
|
||||||||||||||||||||
|
Enventis
Sector (A)
|
||||||||||||||||||||
|
Equipment
revenue
|
$ | 27,857 | $ | 43,514 | $ | 51,046 | $ | 36,191 | $ | - | ||||||||||
|
Services
revenue
|
40,826 | 36,462 | 28,756 | 21,814 | - | |||||||||||||||
|
Total
Enventis Sector
|
68,683 | 79,976 | 79,802 | 58,005 | - | |||||||||||||||
|
Telecom
Sector (B)
|
70,419 | 73,199 | 76,847 | 74,896 | 77,922 | |||||||||||||||
|
Total
revenue (I)
|
$ | 139,102 | $ | 153,175 | $ | 156,649 | $ | 132,901 | $ | 77,922 | ||||||||||
|
Income
from continuing operations
|
$ | 11,273 | $ | 8,029 | $ | 8,635 | $ | 5,235 | $ | 8,566 | ||||||||||
|
EBITDA
from continuing operations (C)(I)
|
$ | 39,867 | $ | 40,925 | $ | 42,471 | $ | 34,090 | $ | 34,011 | ||||||||||
|
Per
Share Data:
|
||||||||||||||||||||
|
Basic
EPS - continuing operations
|
$ | 0.86 | $ | 0.61 | $ | 0.65 | $ | 0.40 | $ | 0.65 | ||||||||||
|
Basic
EPS - discontinued operations
|
- | - | - | (0.23 | ) | - | ||||||||||||||
| $ | 0.86 | $ | 0.61 | $ | 0.65 | $ | 0.17 | $ | 0.65 | |||||||||||
|
Diluted
EPS - continuing operations
|
$ | 0.86 | $ | 0.61 | $ | 0.65 | $ | 0.40 | $ | 0.65 | ||||||||||
|
Diluted
EPS - discontinued operations
|
- | - | - | (0.23 | ) | - | ||||||||||||||
| $ | 0.86 | $ | 0.61 | $ | 0.65 | $ | 0.17 | $ | 0.65 | |||||||||||
|
Dividends
per share
|
$ | 0.52 | $ | 0.49 | $ | 0.48 | $ | 0.48 | $ | 0.48 | ||||||||||
|
Balance
Sheet Data:
|
||||||||||||||||||||
|
Total
assets (I)
|
$ | 222,483 | $ | 225,508 | $ | 227,495 | $ | 226,900 | $ | 216,834 | ||||||||||
|
Shareholders’
equity (D)
|
$ | 34,546 | $ | 29,749 | $ | 31,932 | $ | 30,086 | $ | 35,009 | ||||||||||
|
Current
maturites of long-term obligations
|
$ | 620 | $ | 1,621 | $ | 731 | $ | 1,560 | $ | 1,778 | ||||||||||
|
Long-term
debt
|
119,871 | 125,384 | 128,475 | 141,529 | 140,980 | |||||||||||||||
|
Total
debt, long-term and current
|
$ | 120,491 | $ | 127,005 | $ | 129,206 | $ | 143,089 | $ | 142,758 | ||||||||||
|
Debt
ratio (E)
|
77.7 | % | 81.0 | % | 80.2 | % | 82.6 | % | 80.3 | % | ||||||||||
|
Telecom
Sector Customer Data:
|
||||||||||||||||||||
|
Business
access lines
|
25,133 | 25,274 | 27,403 | 27,014 | 27,145 | |||||||||||||||
|
Residential
access lines
|
30,197 | 33,757 | 37,428 | 41,029 | 42,945 | |||||||||||||||
|
Total
access lines
|
55,330 | 59,031 | 64,831 | 68,043 | 70,090 | |||||||||||||||
|
Long
distance subscribers
|
36,107 | 38,458 | 40,956 | 41,196 | 40,321 | |||||||||||||||
|
DSL
customers
|
19,346 | 18,696 | 17,427 | 15,724 | 13,022 | |||||||||||||||
|
Digital
TV customers
|
9,663 | 8,368 | 6,487 | 4,632 | 2,766 | |||||||||||||||
|
Other
Data:
|
||||||||||||||||||||
|
Employees
(year end) (F)
|
448 | 433 | 400 | 399 | 460 | |||||||||||||||
|
Capital
expenditures (I)
|
$ | 17,893 | $ | 17,691 | $ | 17,500 | $ | 21,058 | $ | 19,434 | ||||||||||
|
Shares
outstanding (year end)
|
13,100,568 | 12,992,376 | 13,284,903 | 13,207,970 | 13,124,928 | |||||||||||||||
|
Share
price (G) (year end)
|
$ | 8.83 | $ | 5.44 | $ | 9.32 | $ | 7.15 | $ | 7.89 | ||||||||||
|
Shareholders
|
||||||||||||||||||||
|
Registered
|
1,345 | 1,394 | 1,430 | 1,470 | 1,511 | |||||||||||||||
|
Beneficial
owners (H)
|
1,925 | 1,834 | 1,778 | 1,792 | 1,701 | |||||||||||||||
|
Total
shareholders
|
3,270 | 3,228 | 3,208 | 3,262 | 3,212 | |||||||||||||||
Footnotes for this table are on the following page.
|
(A)
|
HickoryTech
acquired Enventis on December 30,
2005.
|
|
(B)
|
Operating
revenue for NIBI, which prior to 2006 had been reported in the Information
Solutions Sector, has been recast for all years presented to consolidate
our reporting for similar operations for all years presented. Revenue is
now being reported as part of the Telecom
Sector.
|
|
(C)
|
Management
believes that Earnings before Interest, Taxes, Depreciation and
Amortization, as defined in our debt agreement (“EBITDA”), a non-GAAP
financial measure, is an important financial metric as it represents our
ability to generate cash flow and is helpful when evaluating our
performance. A reconciliation of net income to EBITDA from continuing
operations is found in the table
below.
|
|
(D)
|
Shareholders’
Equity at December 31, 2006 includes the impact of following the
guidelines described in ASC Topic 715 – Compensation—Retirement Benefits
which required recognizing the funded status of our post-retirement
benefit plans on the consolidated balance sheet. Please refer to Note 10
to the Notes to the Consolidated Financial Statements for further
information on our post-retirement benefit
plans.
|
|
(E)
|
Debt
Ratio = Total Debt / (Total Debt + Shareholders’ Equity as of December
31).
|
|
(F)
|
All
employee counts reflect actual employee counts at year-end. No numbers
prior to 2006 have been restated for the discontinued Enterprise Solutions
operations. The Enventis acquisition in 2005 added 75 employees. The
Enterprise Solutions sale in 2006 reduced employee counts by 64 employees.
Our CP Telecom acquisition in 2009 added 35
employees.
|
|
(G)
|
Share
price is the last day closing
price.
|
|
(H)
|
The
number of beneficial shareholders is the approximate number of company
registrations in street name
accounts.
|
|
(I)
|
We
sold Collins Communications, Inc. on December 31, 2006. Operating results
which had previously been reported in the Enterprise Solutions Sector and
the effect of the sale transaction are reflected as “discontinued
operations.” Revenue, EBITDA, total assets and capital expenditures do not
include Enterprise Solutions
operations.
|
The
following table sets forth a reconciliation of net income to EBITDA from
continuing operations, as defined in our debt agreement:
|
2009
|
2008
|
2007
|
2006
|
2005
|
||||||||||||||||
|
Net
Income
|
$ | 11,273 | $ | 8,029 | $ | 8,611 | $ | 2,268 | $ | 8,529 | ||||||||||
|
Add:
|
||||||||||||||||||||
|
Income
tax
|
499 | 5,420 | 6,711 | 3,372 | 5,646 | |||||||||||||||
|
Interest
expense
|
6,918 | 6,870 | 8,121 | 7,362 | 4,363 | |||||||||||||||
|
Depreciation
|
20,176 | 19,479 | 17,847 | 16,949 | 14,943 | |||||||||||||||
|
Amortization
|
1,001 | 1,127 | 1,157 | 1,172 | 493 | |||||||||||||||
|
Discontinued
operations (I)
|
- | - | 24 | 2,967 | 37 | |||||||||||||||
|
EBITDA
from continuing operations
|
$ | 39,867 | $ | 40,925 | $ | 42,471 | $ | 34,090 | $ | 34,011 | ||||||||||
Item 7. Management's Discussion and Analysis of
Financial Condition and Results of Operations
The following discussion should be read in conjunction with our historical financial statements and the related notes contained elsewhere in this report.
Overview
HickoryTech
Corporation (dba HickoryTech and Enventis) is a leading integrated
communications provider in the markets it serves. In business for more than 110
years, the corporation is headquartered in Mankato, Minnesota, and has a
regional fiber network with facilities-based operations in Minnesota and Iowa.
We currently operate in two principal business segments: Enventis and
Telecom.
Our
Enventis Sector serves business customers across a five-state region with
IP-based voice, transport, data and network solutions, managed services, network
integration and support services. Through its regional fiber network Enventis
provides wholesale services to regional and national service providers, such as
interexchange and wireless carriers within the telecommunications business.
Enventis also specializes in providing integrated unified communication
solutions for businesses of all sizes - from enterprise multi-office
organizations to small and medium-sized businesses, primarily in the upper
Midwest. Enventis is focused on providing services specifically to business
customers.
Our
Telecom Sector provides bundled residential and business services, including
high-speed Internet, digital TV and voice services in its telecom markets.
Telecom is comprised of two market segments. The first market includes the
operation of ILECs. The second Telecom market is the operation of a
CLEC. Our original business consisted of the operation of a single ILEC and
began in 1898. In 1985, we formed HickoryTech Corporation as a holding company
for our current ILECs and to serve as a platform to expand our business. In
1998, we formed a CLEC, which provides the competitive services of local
service, long distance, high-speed Internet access, DSL and digital TV. Our ILEC
and CLEC operations mentioned above are operated as one integrated unit,
Telecom.
The data
processing services provided by our subsidiary, National Independent
Billing, Inc. (“NIBI”), constitute an auxiliary portion of our Telecom
Sector. The ILECs and CLEC we operate within the Telecom Sector are the primary
internal users of NIBI services. NIBI activities are of strategic value to
HickoryTech, primarily because of the support services provided to our internal
telephone companies. NIBI also sells its services externally to other companies
in the telecommunications industry. The goals, objectives and management of the
NIBI product line are closely aligned with, and its operating results included
with, those of Telecom.
We owned
Collins Communications Systems Company (“Collins”) from 1990 to 2006, and
reported its results of operations in the Enterprise Solutions Sector. We sold
our Collins operations on December 31, 2006. All financial statements and
schedules reflect Collins operations as discontinued operations for all periods
presented.
Highlights
2009
Compared to 2008
|
·
|
Net
income in 2009 increased $3,244,000 or 40.4% compared to 2008. A reduction
of accrued income taxes, which related to the expiration of a statute of
limitations, added $4,454,000 to net income in 2009. Without
the benefit of this income tax reduction, net income would have been
$6,819,000, down $1,210,000 or 15.1% in 2009 compared to
2008.
|
|
·
|
We
realized 29.8% growth in our Enventis fiber and data services revenue in
2009 continuing the double-digit revenue growth that we have experienced
within this product line during the past three years. CP Telecom
operations have been integrated into this product line and caused 15.8% of
the revenue growth. Organic revenue growth for this product
line was 14.0% in 2009 compared to
2008.
|
|
·
|
Operating
results from our Enventis equipment and services product line were
adversely impacted by the nationwide economic conditions in 2009. Revenue
from this product line declined by $18,465,000 or 33.0% in
2009.
|
|
·
|
Telecom
Sector operating income increased by 4.1% in 2009 compared to 2008.
Broadband growth and the positive impact of cost-reduction initiatives
helped offset our continued and expected decline in local service and
access revenues providing stable cash flows for our
company.
|
|
·
|
Our
cash position remained strong. Despite fully funding our CP Telecom
acquisition, reducing our long-term and current portions of our debt
balance by $6,514,000, maintaining capital expenditure levels and
supporting new growth initiatives, our year-end cash balance increased by
$794,000 or 48.8% from 2008 to
2009.
|
2008
Compared to 2007
|
·
|
2008
net income decreased $582,000 or 6.8% compared to 2007. Without the
non-recurring settlement from a switched access dispute with a large
interexchange carrier which increased net income by $1,134,000 in 2007,
net income would have increased $552,000 or 7.4% in 2008 compared to
2007.
|
|
·
|
Our
strategic focus to grow recurring services revenue resulted in a 49.4%
growth in Enventis equipment services revenue and 17.7% growth in Enventis
fiber and data services revenue.
|
|
·
|
Enventis
Sector equipment revenue declined 14.8% in 2008, due primarily to the
widespread economic downturn experienced in the second half of 2008 which
has delayed customer purchases.
|
|
·
|
Telecom
Sector broadband services revenue grew 19.7% in 2008, illustrating the
results of our broadband strategy of providing multiple services over one
high-speed connection to the home.
|
|
·
|
In
2008, Telecom network access revenue continued a downward trend that began
in the third quarter of 2007. Network access revenue declined $5,033,000
or 16.3% in 2008. A switched access dispute with a large interexchange
carrier which resulted in non-recurring revenue of $1,890,000 in 2007
significantly impacts the year-over-year comparability. Without the impact
of the non-recurring access settlement, network access revenue would have
decreased by $3,143,000 or 10.8% in 2008. This decrease in revenue is
primarily due to access line losses combined with the decrease in
interstate access rates which went into effect on July 1,
2007.
|
|
·
|
We
used cash flow from operations to reduce our outstanding long-term debt
balance by $2,201,000 in 2008 and invested $2,363,000 to repurchase and
retire our own capital stock.
|
Trends
Strong
2009 operating results in both our Enventis and Telecom sectors stemming from
our focus on growing our recurring services revenue were somewhat overshadowed
by two factors. First, a reduction of accrued income taxes due to the expiration
of a statute of limitations added $4,454,000 to 2009 net income. Secondly, our
Enventis equipment and services revenue declined by $18,465,000 or 33.0%, with a
corresponding decline in net income of $1,548,000, or 92.7%. This product line
is variable in nature and is the most susceptible to the effects of a recession.
The nationwide economic slowdown in 2009 made our customers hesitant to invest
in capital equipment and significantly impacted our Enventis Sector’s equipment
and service revenue.
Our
Enventis fiber and data services revenue increased by $7,172,000 or 29.8% in
2009. Revenue from our acquisition of CP Telecom contributed 15.8% of the
increase and organic growth accounted for the balance of the growth or 14.0%.
Our organic growth was driven by a strong increase in fiber and data services.
These services include: fiber transport, Ethernet, MPLS, dedicated Internet and
other data services which are sold to retail business and wholesale providers
such as wireless providers, and regional and national service providers. Our
fiber and data services revenue has experienced double-digit growth in monthly
recurring revenue over the past three years and we have focused our 2010
strategic growth initiatives on efforts to continue to grow this business
through network expansion, adding colocations to our network and
Fiber-to-the-Tower.
Telecom
Sector net income was stable at $8,068,000 in 2009 compared to $8,104,000 in
2008 while operating income increased from $13,045,000 in 2008 to $13,587,000 in
2009, an increase of 4.1%. Revenue from our broadband product line increased by
$1,131,000 or 10.30% in 2009 compared to 2008 and helped to offset the decline
in network access and local service revenue of 6.6% and 6.0%, respectively. Our
focus on providing high levels of customer service while controlling costs and
continual process improvement has allowed us to offset the modest decline in
revenue with expense reductions. This focus will continue into 2010 as we are
committed to sustaining our strong cash flow from this sector.
Our
network access revenue will continue to decline consistent with industry wide
trends due to access line loss along with a combination of changing minutes of
use, carriers optimizing their network costs and lower demand for dedicated
lines. Our network access revenue is also significantly impacted by potential
changes in rate regulation at the state and federal levels. We anticipate that
future broadband growth will slow as we reach higher penetrations in many of our
markets.
We are
taking steps by investing in network expansion and opening up additional markets
for our services to re-establish the trend where our advances in profitability
in the Enventis Sector exceed any declines in the profitability of our Telecom
Sector.
Sector
Results of Operations
Enventis
Sector
The
following table provides a breakdown of the Enventis Sector operating
results.
|
ENVENTIS
SECTOR
|
||||||||||||
|
For
Year Ended December 31
|
||||||||||||
|
(Dollars
in thousands)
|
2009
|
2008
|
2007
|
|||||||||
|
Operating
revenue before intersegment eliminations:
|
||||||||||||
|
Operating
revenue
|
||||||||||||
|
Equipment
|
$ | 27,857 | $ | 43,514 | $ | 51,046 | ||||||
|
Services
|
9,579 | 12,387 | 8,292 | |||||||||
|
Equipment
and Services
|
37,436 | 55,901 | 59,338 | |||||||||
|
Fiber
and Data
|
31,247 | 24,075 | 20,464 | |||||||||
|
Intersegment
|
500 | 515 | 440 | |||||||||
|
Total
Enventis operating revenue
|
$ | 69,183 | $ | 80,491 | $ | 80,242 | ||||||
|
Total
Enventis revenue before intersegment eliminations:
|
||||||||||||
|
Unaffiliated
customers
|
$ | 68,683 | $ | 79,976 | $ | 79,802 | ||||||
|
Intersegment
|
500 | 515 | 440 | |||||||||
| 69,183 | 80,491 | 80,242 | ||||||||||
|
Cost
of sales
|
||||||||||||
|
(excluding
depreciation and amortization)
|
24,869 | 37,355 | 45,340 | |||||||||
|
Cost
of services
|
||||||||||||
|
(excluding
depreciation and amortization)
|
23,050 | 21,894 | 14,767 | |||||||||
|
Selling,
general and administrative expenses
|
10,224 | 9,801 | 9,476 | |||||||||
|
Depreciation
and amortization
|
5,413 | 4,417 | 3,755 | |||||||||
|
Operating
income
|
$ | 5,627 | $ | 7,024 | $ | 6,904 | ||||||
|
Net
income
|
$ | 3,362 | $ | 4,369 | $ | 4,074 | ||||||
|
Capital
expenditures
|
$ | 8,738 | $ | 6,408 | $ | 5,928 | ||||||
We manage and evaluate the Enventis operations in their entirety. The following table provides an illustration of the contributions from each of the Enventis primary product lines. Certain allocations have been made, particularly in the area of selling, general and administrative expenses, in order to develop these tables.
|
ENVENTIS
PRODUCT LINE REPORTING
|
||||||||||||||||||||||||
|
For
Year Ended December 31
|
||||||||||||||||||||||||
|
Equipment
and Services
|
Fiber
and Data
|
|||||||||||||||||||||||
|
(Dollars
in thousands)
|
2009
|
2008
|
2007
|
2009
|
2008
|
2007
|
||||||||||||||||||
|
Operating
revenue before intersegment eliminations:
|
||||||||||||||||||||||||
|
Equipment
|
$ | 27,857 | $ | 43,514 | $ | 51,046 | $ | - | $ | - | $ | - | ||||||||||||
|
Services
|
9,579 | 12,387 | 8,292 | 31,247 | 24,075 | 20,464 | ||||||||||||||||||
|
Intersegment
|
- | - | - | 500 | 515 | 440 | ||||||||||||||||||
|
Total
Enventis operating revenue
|
$ | 37,436 | $ | 55,901 | $ | 59,338 | $ | 31,747 | $ | 24,590 | $ | 20,904 | ||||||||||||
|
Cost
of sales
|
||||||||||||||||||||||||
|
(excluding
depreciation and amortization)
|
24,923 | 37,342 | 45,001 | (54 | ) | 13 | 339 | |||||||||||||||||
|
Cost
of services
|
||||||||||||||||||||||||
|
(excluding
depreciation and amortization)
|
7,082 | 10,102 | 4,539 | 15,968 | 11,792 | 10,228 | ||||||||||||||||||
|
Selling,
general and administrative expenses
|
4,848 | 5,264 | 5,115 | 5,376 | 4,537 | 4,361 | ||||||||||||||||||
|
Depreciation
and amortization
|
414 | 515 | 494 | 4,999 | 3,902 | 3,261 | ||||||||||||||||||
|
Operating
income
|
$ | 169 | $ | 2,678 | $ | 4,189 | $ | 5,458 | $ | 4,346 | $ | 2,715 | ||||||||||||
|
Net
income
|
$ | 122 | $ | 1,670 | $ | 2,478 | $ | 3,240 | $ | 2,699 | $ | 1,596 | ||||||||||||
|
Capital
expenditures
|
$ | 528 | $ | 468 | $ | 587 | $ | 8,210 | $ | 5,940 | $ | 5,341 | ||||||||||||
Revenue
Equipment Sales. This revenue is
generated primarily from the sale of communications and data products provided
by third party manufacturers. Due to the “one-time” nature of equipment sales,
equipment revenue is dependent upon the new sales from existing and new
customers.
Equipment
revenue was $27,857,000, down $15,657,000 or 36.0% in 2009 compared to 2008 and
was $43,514,000, down $7,532,000 or 14.8% in 2008 compared to 2007. Sales slowed
significantly in the second half of 2008 and remained sluggish throughout 2009
due to our customers’ hesitancy to invest in capital equipment as a result of
the nationwide economic slowdown.
Equipment Services. This
revenue includes services related to our equipment sales, such as network and
equipment monitoring, maintenance, and equipment consulting and
installation.
Equipment
services revenue was $9,579,000, down $2,808,000 or 22.7% in 2009 compared to
2008. The 2009 revenue decline of $3,146,000 or 29.4% from contract services and
maintenance revenue was highly impacted by the lower equipment sales noted above
as customers did not engage us to complete design, configuration and
installation of equipment or purchase associated equipment maintenance
contracts. During 2008, we experienced a spike in contract services from large
enterprise projects which did not extend into 2009. The decline in services
revenue was partially offset by a 35.9% increase in revenue from customer
support services earned by providing around-the-clock support and monitoring for
products and services by our customer service center that is staffed by
experienced support engineers.
Equipment
services revenue was $12,387,000, which is $4,095,000 or 49.4% higher in 2008
compared to 2007. Primary contributors to this growth were revenue from contract
services, which includes the design, configuration, and installation of voice
and data equipment and support fee revenue. Each of these service lines grew by
more than 50% in 2008 driven by sales to large enterprise
customers.
Fiber and Data. This revenue
is primarily of a monthly recurring basis and consists of billing for the use of
our fiber network and network connections through multi-year contracts with
retail business, regional and national service providers and wireless carriers.
The product line also includes revenue from our hosted VoIP SingleLink Unified
Communications.
Operating
results for CP Telecom, our acquisition which closed on August 1, 2009, have
been integrated into the fiber and data product line. CP Telecom operations
include voice, data and Internet services in the Minneapolis and Duluth,
Minnesota areas. The addition of CP Telecom operations contributed approximately
$3,800,000 in revenue in 2009. Without the increase from CP Telecom, fiber and
data revenue increased $3,372,000 or 14.0% in 2009 compared to
2008.
Fiber and
data revenue was $31,247,000, which increased $7,172,000 or 29.8% in 2009
compared to 2008 and was $24,075,000, which is $3,611,000 or 17.6% higher in
2008 compared to 2007. This revenue growth bridges all customer segments
including wholesale, enterprise and SingleLink.
We
provide communications solutions to three major categories of customers. We
provide wholesale service such as fiber based transport to regional and national
telecommunications carriers, local exchange carriers, Internet Service
Providers, wireless carriers and other service providers. We provide enterprise
service such as transport services by building customized and innovative
communications solutions for business customers and SingleLink Unified
Communications service; a single centrally managed and hosted VoIP
communications solution.
Long
distance revenue associated with our SingleLink product, which had been recorded
in our Telecom Sector prior to 2009, is now recorded in the fiber and data
product line of our Enventis Sector. This realignment increased fiber and data
revenue by $237,000 in 2009.
Cost
of Sales (excluding Depreciation and Amortization)
Enventis
Sector cost of sales (excluding depreciation and amortization) associated with
equipment revenue was $24,869,000, which decreased $12,486,000 or 33.4% in 2009
compared to 2008 and was $37,355,000, which decreased $7,985,000 or 17.6% in
2008 compared to 2007. Cost of sales is primarily related to equipment sales
which decreased 36.0% and 14.8% in 2009 and 2008, respectively. We have
benefited from our focus on selling new VoIP technologies as a higher portion of
our product mix. These sales generate greater rebates from our Cisco Value
Incentive Program. Rebates act as a cost reduction, thereby lowering cost of
sales.
Enventis
Sector cost of sales are primarily equipment material costs. Labor associated
with installation work is not included in this category, but is included in cost
of services (excluding depreciation and amortization) described
below.
Cost
of Services (excluding Depreciation and Amortization)
Enventis
Sector cost of services (excluding depreciation and amortization) was
$23,050,000, which increased $1,156,000 or 5.3% in 2009 compared to 2008
primarily due to cost of services related to our newly-acquired CP Telecom
business. We also experienced a $1,139,000 increase in our circuit costs which
supported the increase in revenue generated from the use of other providers’
networks. Offsetting these increases was lower professional fees paid to
contractors of $2,171,000 in 2009 compared to 2008 driven by the decrease in
customer demand for capital equipment.
Enventis
Sector cost of services (excluding depreciation and amortization) was
$21,894,000, which is $7,127,000 or 48.3% higher in 2008 compared to 2007. The
increase was primarily due to the following items: 1) a $3,090,000 increase in
wages and benefits due to increased staffing levels, 2) a $2,537,000 increase
for professional fees due to external project management consulting and 3) a
$780,000 increase in circuit expenses, which supported the increase in revenue
outside of our own network. In 2008, we increased our staffing due to
significant large enterprise projects combined with our efforts to grow the
services element of the Enventis business.
Selling,
General and Administrative Expenses
Enventis
Sector selling, general and administrative expenses were $10,224,000, which
increased $423,000 or 4.3% in 2009 compared to 2008 primarily due to selling,
general and administrative costs related to our newly-acquired CP Telecom
business. The addition of CP Telecom costs offset decreased costs of $582,000 in
commissions paid to sales representatives due to lower sales activity and an
$187,000 decrease in wages and benefits.
Enventis
Sector selling, general and administrative expenses were $9,801,000, which was
$325,000 or 3.4% higher in 2008 compared to 2007. This increase was primarily
due to a $578,000 increase in corporate expense and a $129,000 increase in
advertising expenses. Offsetting this increase was a $449,000 decrease in wages,
benefits, and commissions, which was the result of the release of temporary
support staff and the realignment of support staff to our corporate
offices.
Depreciation
and Amortization
Enventis
Sector depreciation and amortization was $5,413,000, which increased $996,000 or
22.6% in 2009 compared to 2008 and was $4,417,000, which increased $662,000 or
17.6% in 2008 compared to 2007. Depreciation has increased on a year-over-year
basis since our acquisition of Enventis in December of 2005. We will
continue to experience increases in depreciation for the next few years as we
continue to invest in our fiber network. Our network constitutes the majority of
our asset base and the related assets are depreciated over lives of 16 to 20
years. Also contributing to the increase seen in 2009 is depreciation expense
related to CP Telecom assets.
Enventis
Sector amortization was $998,000, which decreased $52,000 or 4.9% in 2009
compared to 2008. Declines in amortization related to specific
Enventis intangibles, which became fully amortized as of December 31, 2008, were
offset by amortization expense related to acquired CP Telecom assets. Enventis
Sector amortization remained constant in 2008 compared to 2007.
Operating
Income
Enventis
Sector operating income was $5,627,000, which is down $1,397,000 or 19.9% in
2009 compared to 2008. This decrease was primarily due to the $11,308,000
decrease in revenue and the $12,486,000 decrease in cost of sales, offset by the
increases in cost of services (excluding depreciation and amortization),
depreciation and selling, general and administrative expenses of $1,156,000,
$996,000 and $423,000, respectively.
Enventis
Sector operating income was $7,024,000, which increased $120,000 or 1.7% in 2008
compared to 2007. This increase was primarily due to the $7,985,000 decrease in
cost of sales (excluding depreciation and amortization), offset by the
$7,127,000 increase in cost of services (excluding depreciation and
amortization) and the $662,000 increase in depreciation.
Telecom
Sector
The
following table provides a breakdown of the Telecom Sector operating
results.
|
TELECOM SECTOR
|
||||||||||||
|
For
Year Ended December 31
|
||||||||||||
|
(Dollars
in thousands)
|
2009
|
2008
|
2007
|
|||||||||
|
Operating
revenue before intersegment eliminations
|
||||||||||||
|
Operating
Revenue
|
||||||||||||
|
Local
Service
|
$ | 15,322 | $ | 16,296 | $ | 17,089 | ||||||
|
Network
Access
|
24,157 | 25,859 | 30,892 | |||||||||
|
Long
Distance
|
3,791 | 4,563 | 5,068 | |||||||||
|
Broadband
|
12,114 | 10,983 | 9,173 | |||||||||
|
Internet
|
4,975 | 4,723 | 4,612 | |||||||||
|
Directory
|
4,000 | 4,119 | 3,854 | |||||||||
|
Bill
Processing
|
3,351 | 3,325 | 2,474 | |||||||||
|
Intersegment
|
1,217 | 644 | 467 | |||||||||
|
Other
|
2,709 | 3,331 | 3,685 | |||||||||
|
Total
Telecom operating revenue
|
$ | 71,636 | $ | 73,843 | $ | 77,314 | ||||||
|
Total
Telecom revenue before intersegment eliminations
|
||||||||||||
|
Unaffiliated
customers
|
$ | 70,419 | $ | 73,199 | $ | 76,847 | ||||||
|
Intersegment
|
1,217 | 644 | 467 | |||||||||
| 71,636 | 73,843 | 77,314 | ||||||||||
|
Cost
of services (excluding depreciation and amortization)
|
30,730 | 31,141 | 30,893 | |||||||||
|
Selling,
general and administrative expenses
|
11,639 | 13,521 | 13,407 | |||||||||
|
Depreciation
and amortization
|
15,680 | 16,136 | 15,218 | |||||||||
|
Operating
income
|
$ | 13,587 | $ | 13,045 | $ | 17,796 | ||||||
|
Net
income
|
$ | 8,068 | $ | 8,104 | $ | 10,460 | ||||||
|
Capital
expenditures
|
$ | 9,068 | $ | 11,102 | $ | 11,489 | ||||||
|
Key metrics
|
||||||||||||
|
Business
access lines
|
25,133 | 25,274 | 27,403 | |||||||||
|
Residential
access lines
|
30,197 | 33,757 | 37,428 | |||||||||
|
Total
access lines
|
55,330 | 59,031 | 64,831 | |||||||||
|
Long
distance customers
|
36,107 | 38,458 | 40,956 | |||||||||
|
Digital
Subscriber Line customers
|
19,346 | 18,696 | 17,427 | |||||||||
|
Digital
TV customers
|
9,663 | 8,368 | 6,487 | |||||||||
Local Service. We primarily receive monthly recurring revenue for basic voice telephone service, enhanced calling features, miscellaneous local services primarily from end-user customers and reciprocal compensation from wireless carriers. Local service revenue was $15,322,000, which is down $974,000 or 6.0% in 2009 compared to 2008 and was $16,296,000, which is down $793,000 or 4.6% in 2008 compared to 2007. The decrease in both periods is primarily attributable to the loss of access lines. In 2008, a large customer reconfigured their network removing 1,332 lines driving access lines to decrease by 9.0%. Our local access line loss in 2008 would have been 6.9% without the removal of these lines which is still slightly higher than the 6.3% loss experienced in 2009.
Our
business access lines remained stable in 2009 aided by the increase in sales of
ISDN Primary Rate Interface (“PRI”) T-1 services providing voice and data
services, which offset losses in business single and multi-line voice services.
While our residential access lines continue to decline, we remain focused on
selling a competitive bundle of services. Marketing competitive service bundles
to our customers creates a compelling value for them to retain their local voice
line. These bundle packages are customizable and offer competitive
discounts as features and services, such as high-speed DSL and digital TV, are
added to the bundle.
Network Access. We receive a variety of
fees and settlements to compensate us for the origination, transport, and
termination of calls and traffic on our network. These include the fees assessed
to interexchange carriers, subscriber line charges imposed on end-users, and
settlements from nationally administered and jointly funded revenue pools.
Network Access revenue was $24,157,000, down $1,702,000 or 6.6% in 2009 compared
to 2008 and was $25,859,000, down $5,033,000 or 16.3% in 2008 compared to 2007.
Bi-annual interstate rate decreases, which went into effect on July 1st of
2009 and 2007, the decrease in access lines likewise lowering minutes of use and
carriers optimizing their networks lowering the demand for special access
circuits have all significantly played a role in the year–over-year revenue
decline. We expect these factors to continue in 2010 causing network access
revenue to trend lower.
The
settlement of a switched access dispute with a large interexchange carrier
resulted in a non-recurring increase in revenue of $1,890,000 in 2007,
significantly impacting the year-over-year comparability of trends in this
revenue line. Without the impact of the 2007 non-recurring access settlement,
network access revenue would have decreased $3,143,000 or 10.8% in 2008 compared
to 2007.
In
October 2009, we filed a collection action in US District court against an
interexchange carrier. The suit is a result of non-payment of network access
charges. The carrier filed a counter claim against us in November of 2009. This
matter has recently been reassigned to a court in Minnesota. We cannot predict
the outcome of our collection action or the carrier’s counter
claims.
Long Distance. Our end-user customers
are billed for toll or long distance service on either a per-call or flat-rate
basis. This includes the provision of directory assistance, operator service and
long distance private lines. Long distance revenue was $3,791,000, down $772,000
or 16.9% in 2009 compared to 2008 and was $4,563,000, down $505,000 or 10.0% in
2008 compared to 2007. The customer loss rate in our long distance base remained
consistent at 6.1% in 2009 and 2008. Aggressive competition in the markets we
serve and a growing number of residential customers selecting unlimited long
distance calling plans are decreasing the rate per minute charges to our
customers.
Long
distance revenue provided through our SingleLink product is now recorded within
our Enventis Sector to facilitate management of our small to medium business
customer segment. This realignment lowered long distance revenue reported in the
Telecom Sector by $237,000 in 2009.
Broadband. We receive monthly
recurring revenue for a variety of enhanced data network services to our
end-user customers and for the provision of TV programming in competition with
local cable TV, satellite dish TV and on-air TV service providers. This includes
the DSL access portion of Telecom DSL service as well as Ethernet and other data
services. Broadband revenue was $12,114,000, which increased $1,131,000 or 10.3%
in 2009 compared to 2008 and was $10,983,000, which increased $1,810,000 or
19.7% in 2008 compared to 2007.
DSL
customer growth rates have moderated from levels experienced in 2008 and 2007 of
7.3% and 10.8%, respectively as higher penetrations have been achieved in many
of our DSL markets. Digital TV customers have increased 15.5%, 29.0% and 40.0%
in 2009, 2008 and 2007, respectively. Revenue continues to be driven by new
technologies, such as Ethernet and MPLS services, replacing low speed DSL data
circuits such as point-to-point dedicated connectivity for video, voice, and
data applications, and digital TV customer growth combined with an increase in
rates charged to customers of approximately 5.5% during the past three
years.
In late
2007, we more than doubled our digital TV service area launching IPTV services
to several communities including our largest market, Mankato, Minnesota. During
the past two years, we have continued to expand into several communities and
have began offering Digital Video Recorder (DVR) services and interactive media
within our IPTV capable communities.
Internet. We
provide Internet service to our dial-up and DSL subscribers as well as dedicated
Internet services for business customers. Internet revenue was $4,975,000, which
increased $252,000 or 5.3% in 2009 compared to 2008 and was $4,723,000, which
increased $111,000 or 2.4% in 2008 compared to 2007. The increase in both
periods was primarily due to the growth in high speed Internet from DSL along
with increased demand for dedicated Internet access among
businesses.
Directory. We receive monthly
recurring revenue from end-user subscribers for yellow page advertising in our
telephone directories. Directory revenue was $4,000,000, which is down $119,000
or 2.9% in 2009 compared to 2008. Directory revenue was $4,119,000, which
increased $265,000 or 6.9% in 2008 compared to 2007. Following a solid year of
yellow-page advertising sales in 2008, our 2009 selling cycle declined due to
cutbacks in directory advertising by local and national businesses, a direct
effect of the economic conditions.
Bill Processing. We provide data
processing and billing services to other telephone service providers. We collect
a combination of monthly recurring revenue, software license fees and
integration services revenue from companies with whom we have established a
long-term data processing relationship. Bill processing revenue was $3,351,000
in 2009, consistent with revenue of $3,325,000 in 2008, which increased $851,000
or 34.4% in 2008 compared to 2007. The increase in revenue experienced from 2007
to 2008 was driven by project integration services revenue related to the sale
of our billing and management system SuiteSolution® to
several new customers.
Other Revenue. Other revenue
consists primarily of sales of customer premise equipment, circuit private
lines, maintenance, and add, move and change revenue. Other revenue was
$2,709,000, which is down $622,000 or 18.7% in 2009 compared to 2008 and was
$3,331,000, which is down $354,000 or 9.6% in 2008 compared to 2007. The
decrease in both periods was primarily due to a decrease in customer premise
equipment revenue of $469,000 and $338,000 in 2009 and 2008, respectively. This
decline is due to our decision to phase out sales of Nortel customer premise
equipment in favor of the Cisco brand. All Cisco sales results are reported
within the Enventis Sector.
Cost
of Services (excluding Depreciation and Amortization)
Telecom
Sector cost of services (excluding depreciation and amortization) was
$30,730,000, which is down $411,000 or 1.3% in 2009 compared to 2008. The
combination of operational efficiencies allowing us to optimize our network
costs along with management actions to decrease expense throughout the Telecom
Sector enabled us to offset increased programming expense supporting the
increase in digital TV services and higher wage and benefit costs.
Telecom
Sector cost of services (excluding depreciation and amortization) was
$31,141,000, which is $248,000 or 0.8% higher in 2008 compared to 2007. This
increase was primarily due to an increase in programming expense required to
support the increase in digital TV services and an increase in directory
expenses associated with the increase in directory revenue. These increases were
partially offset by the following items: 1) a decrease in co-location primarily
to credits received from a vendor in 2008, 2) a decrease in wages and benefits
primarily due to one-time severance payments made in 2007 and 3) a decrease in
contract labor costs.
Selling, General and Administrative
Expenses
Telecom
Sector selling, general and administrative expenses were $11,639,000, which is
down $1,882,000 or 13.9% in 2009 compared to 2008. The decrease is due to lower
corporate support expense, a decrease in customer premise equipment expense, the
release of a contingent liability reducing market access fees and cost controls
taken by management to limit advertising expense in 2009. Telecom
Sector selling, general and administrative expenses were $13,521,000, which
increased $114,000 or 0.9% in 2008 compared to 2007.
Depreciation
and Amortization
Telecom
Sector depreciation and amortization was $15,680,000, which is down $456,000 or
2.8% in 2009 compared to 2008. Increases in depreciation expense from new
capital expenditures were offset by asset retirements and assets becoming fully
depreciated.
Telecom
Sector depreciation and amortization was $16,136,000, which is up $918,000 or
6.0% in 2008 compared to 2007. The increase was primarily due to capital
expenditures made in 2008, 2007 and 2006 to support our broadband and
infrastructure enhancements.
Operating Income
Telecom
Sector operating income was $13,587,000, which increased $542,000 or 4.1% in
2009 compared to 2008. This increase was primarily due to savings
seen across all expense lines offsetting the decline in revenue.
Telecom
Sector operating income was $13,045,000, which is down $4,751,000 or 26.7% in
2008 compared to 2007. Excluding the non-recurring interexchange carrier
settlement of $1,890,000, our operating income decreased $2,861,000 or 18% in
2008 compared to 2007. This decrease was primarily due to decreases in revenue
along with an increase in depreciation and amortization expenses, all of which
are described above.
Consolidated
Results
Interest
Expense
Interest
expense was $6,918,000, which is up $48,000 in 2009 compared to 2008 primarily
due to the recognition of $664,000 in proceeds from the termination of an
interest-rate swap agreement which lowered interest expense in 2008. Without
this offset, interest expense would have been $7,534,000 in 2008. Interest
expense of $6,870,000, was down $1,251,000 or 15.4% in 2008 compared to 2007.
Interest expense decreased in the past few years due to the pay-down of debt,
lower interest rates, implementation of interest rate protection strategies and
the amortization of gains related to interest-rate swap agreements sold at a
gain in early 2007.
Our
outstanding debt obligation balance (current and long-term) as of the end of the
year totaled $120,491,000 in 2009, down from $127,005,000 in 2008 and
$129,206,000 in 2007. Effective interest rates were 5.47%, 5.22% and 5.94% in
2009, 2008 and 2007, respectively.
Income
Taxes
Income
tax expense was $499,000, which is down $4,921,000 in 2009 compared to
2008. The effective tax rate was 4.2%, 40.3% and 43.7% for 2009, 2008
and 2007, respectively. The effective tax rate in 2009 decreased due to the
release of income tax reserves and associated interest of $4,454,000 during the
third quarter of 2009. The 2009 effective tax rate would have been 42.1% without
the release of the income tax reserves and associated interest in the third
quarter of 2009. The effective tax rate in 2008 was reduced by $400,000 of tax
benefits we recognized in the fourth quarter to adjust our provision
to match tax returns filed for 2007 and amended tax
returns for 2006.
Inflation
It is the
opinion of management that the effects of inflation on operating revenue and
expenses over the past three years have been immaterial. Management anticipates
that this trend will continue in the near future.
Liquidity
and Capital Resources
Capital
Structure
The total
capital structure (long-term and short-term debt obligations plus shareholders’
equity) of HickoryTech was $155,037,000 at December 31, 2009, reflecting 22.3%
equity and 77.7% debt. This compares to a capital structure of $156,754,000 at
December 31, 2008, reflecting 19.0% equity and 81.0% debt. In the
telecommunications industry, debt financing is most often based on operating
cash flows. Specifically, our current use of the senior credit facility is in a
ratio of approximately 2.98 times debt to EBITDA as defined in our credit
agreement; well within acceptable limits for our agreement and our industry.
Management believes adequate operating cash flows and other internal and
external resources are available to finance ongoing operating requirements,
including capital expenditures, business development, debt service, temporary
financing of trade accounts receivable and the payment of dividends, if they
continue to be declared at recent quarterly rates, for the next 12 months. We
employ an extended term payable financing arrangement for the equipment
provisioning portion of the equipment and services product line in the Enventis
Sector and view this arrangement as more of a structured accounts payable that
is paid within 60 days with no separate interest charge. As such, the extended
term payable financing amount of $6,788,000 and $10,474,000 as of December 31,
2009 and 2008, respectively, is not considered to be part of our capital
structure and has been excluded from the above amounts (see Note 8 to the Notes
to the Consolidated Financial Statements).
Cash
Flows
We expect
our liquidity needs to arise from payment of dividends, interest and principal
payments on our indebtedness, income taxes, and capital expenditures. We utilize
our senior revolving credit facility to manage the temporary increases and
decreases in our cash balances.
Unfavorable
general economic conditions, including the economic conditions in the United
States, could negatively affect our business and the related cash flows. While
it is often difficult for us to predict the impact of general economic
conditions on our business, we believe that we will be able to meet our current
and long-term cash commitments through our operating cash flows. We currently
are in full compliance with our debt covenants as of December 31, 2009 and
anticipate that we will be able to meet all requirements in the
future.
While we
periodically seek to add growth initiatives by either expanding our network or
our markets through organic/internal investments or through strategic
acquisitions, we feel we can adjust the timing or the number of our initiatives
according to any limitation which may be imposed by our capital structure or
sources of financing. At this time, we do not anticipate our capital structure
will limit our growth initiatives over the next 12 months.
The
following table summarizes our cash flow:
|
(Dollars
in thousands)
|
For
Year Ended December 31
|
|||||||||||
|
2009
|
2008
|
2007
|
||||||||||
|
Net
cash provided by (used in):
|
||||||||||||
|
Operating
activities
|
$ | 42,254 | $ | 33,770 | $ | 30,731 | ||||||
|
Investing
activities
|
(24,518 | ) | (17,271 | ) | (17,400 | ) | ||||||
|
Financing
activities
|
(16,942 | ) | (15,044 | ) | (13,220 | ) | ||||||
|
Discontinued
operations
|
- | - | (24 | ) | ||||||||
|
Increase
in cash and cash equivalents
|
$ | 794 | $ | 1,455 | $ | 87 | ||||||
Cash generated from operations has sequentially increased during the past years from $30,731,000 in 2007 to $33,770,000 in 2008 and $42,254,000 in 2009. Outstanding accounts receivable balances have declined year-over-year as a result of our internal focus on improving the collection practices within our Enventis Sector, decreasing average day’s sales outstanding during the past few years. Inventory levels are primarily dependent upon the timing of projects in our Enventis equipment and services product line and have also declined in 2009 due to a just-in-time focus by our Telecom operations team.
Cash used
for investing activities has remained relatively stable during the past three
years and is primarily used to support capital spending on revenue generating
products and services, key strategic initiatives and general capacity upgrades
to our network. Capital expenditures were incurred to upgrade broadband
networks, construct additional network facilities and expand fiber optic
facilities. In 2010, we expect the level of capital spending to
increase from levels experienced during the past few years due to our strategic
growth initiatives.
In 2009,
we completed the acquisition of CP Telecom, which added new business products,
network capacity and expanded our sales channel. The CP Telecom
acquisition was funded with cash on hand.
Cash used
for financing activities consists primarily of cash payments reducing our credit
facility and the payment of dividends to our stockholders. The net change in our
extended term payables arrangement is dependent upon the sales of equipment and
showed an increase in 2007 due to strong equipment sales and likewise decreased
as sales began to slow in late 2008 and into 2009. In 2008, we
expended $2,363,000 to purchase and retire 393,000 shares of HickoryTech
stock.
Working
Capital
Working
capital (i.e. current assets minus current liabilities) was $7,690,000 as of
December 31, 2009 compared to working capital of $12,311,000 as of December 31,
2008. The ratio of current assets to current liabilities was 1.3 and 1.4 as of
December 31, 2009 and 2008, respectively.
Extended-Term
Payable
The
Enventis Sector has a $20,000,000 wholesale financing agreement with a financing
company to fund inventory purchased from certain approved vendors. Advances
under the financing arrangement are collateralized by the accounts receivable
and inventory of Enventis and a guaranty of an amount up to $18,000,000 from
HickoryTech. The financing agreement provides 60 day interest free payment terms
for inventory purchases and can be terminated at any time by either party. The
balance outstanding under the financing arrangement was $6,788,000 and
$10,474,000 at December 31, 2009 and 2008, respectively. These balances are
classified as current liabilities in the accompanying balance sheets and are not
considered part of our debt financing.
Long-Term
Debt and Revolving Credit Facilities
Our
long-term obligations as of December 31, 2009 were $119,871,000, excluding
current maturities of $200,000 on debt and $420,000 on current maturities of
capital leases. Long-term obligations as of December 31, 2008, were $125,384,000
excluding current maturities of $1,300,000 on debt and $321,000 of capital
leases. On December 30, 2005, HickoryTech entered into a $160,000,000 credit
agreement with a syndicate of banks (subsequently reduced to a $149,780,000
facility as of December 31, 2009), which amended our previous credit facility.
The credit facility is comprised of a $30,000,000 revolving credit component
that expires on December 30, 2011 and a $130,000,000 term loan component
(subsequently reduced to $29,880,000 and $119,900,000 as of December 31, 2009,
respectively).
The term
loan is comprised of two components, which are defined as term loan B and term
loan C. The outstanding principal balance of term loan B is $100,700,000 as
of December 31, 2009, and is held in varying amounts by three lenders in the
syndicate, US Bank, GE Commercial Distribution Finance Corporate and CoBank.
Under the terms of term loan B, we are required to make quarterly principal
payments of $275,000 from December 31, 2009 through December 31, 2011 with
the remainder of the aggregate principal due in two payments on March 31,
2012 and June 30, 2012. Due to the aggressive pay-down of debt in 2009, we
will not be required to make quarterly principal payments in 2010. The
outstanding principal balance of term loan C is $19,200,000 as of December 31,
2009 and is held entirely by the Rural Telephone Finance Cooperative (“RTFC”).
Under the terms of term loan C, we are required to make quarterly principal
payments of $50,000 on the aggregate principal amount from December 31, 2009
through December 31, 2012 with the remainder of the aggregate principal due
in two payments on March 31, 2013 and June 30, 2013.
Our
credit facility requires us to comply, on a consolidated basis, with specified
financial ratios and tests. These financial ratios and tests include maximum
leverage ratio and maximum capital expenditures. We were in full compliance with
these ratios and tests as of December 31, 2009. Our obligations under the credit
facility are secured by a first-priority lien on all property and assets,
tangible and intangible of HickoryTech and its current subsidiaries, including,
but not limited to accounts receivable, inventory, equipment and intellectual
property, general intangibles, cash and proceeds of the foregoing. We have also
given a first-priority pledge of the capital stock of HickoryTech’s current
subsidiaries to secure the credit facility. Our credit facility permits us to
pay dividends to holders of our common stock, or to make repurchases of our
common stock with restrictions related to net income of the prior year. The
credit facility contains certain restrictions that, among other things, limit or
restrict our ability to create liens or encumbrances, incur additional debt,
issue stock, make asset sales, transfers or dispositions and engage in mergers
and acquisitions over a specified maximum value.
Our
Telecom Sector leases certain computer equipment under capital lease
arrangements. This sector recorded additions to property, plant and equipment of
$417,000, $433,000 and $522,000 in 2009, 2008 and 2007, respectively, related to
these capital lease arrangements.
Obligations
and Commitments
The
following table sets forth our contractual obligations, along with the cash
payments due each period.
|
(Dollars
in thousands)
|
||||||||||||||||||||
|
Contractual
Obligations
|
Total
|
2010
|
2011
to 2012
|
2013
to 2014
|
2015
and after
|
|||||||||||||||
|
Long-term
debt
|
$ | 119,900 | $ | 200 | $ | 101,100 | $ | 18,600 | $ | - | ||||||||||
|
Interest
on long-term debt (A)
|
12,387 | 4,868 | 7,086 | 433 | - | |||||||||||||||
|
Capital
lease obligations
|
591 | 420 | 171 | - | - | |||||||||||||||
|
Interest
on capital leases
|
53 | 44 | 9 | - | - | |||||||||||||||
|
Purchase
obligations (B)
|
1,139 | 1,139 | - | - | - | |||||||||||||||
|
Pension
benefit obligations (C)
|
2,636 | 256 | 534 | 539 | 1,307 | |||||||||||||||
|
Operating
leases
|
4,669 | 1,300 | 1,511 | 1,072 | 786 | |||||||||||||||
|
Total
contractual cash obligations
|
$ | 141,375 | $ | 8,227 | $ | 110,411 | $ | 20,644 | $ | 2,093 | ||||||||||
|
(A)
|
Interest
on long-term debt is estimated using rates in effect as of December 31,
2009. We use interest rate swap agreements to manage our exposure to
interest rate movements on a portion of our variable rate debt obligations
(see Note 12 to the Notes to the Consolidated Financial
Statements).
|
|
(B)
|
Purchase
obligations consist primarily of commitments incurred for construction
projects.
|
|
(C)
|
Pension
benefit obligations consist of the expected net premium payment and life
insurance benefits to be paid relative to our post-retirement benefit
plan.
|
In
addition, we have change of control agreements with key employees. These
potential commitments are not included in the above schedule.
As of
December 31, 2009, we have recognized a liability for uncertain tax positions of
approximately $3,218,000 according to ASC Topic 740 – Income Taxes. The
liability has not been assigned to any particular year in the table above due to
the inherent uncertainty regarding the timing and necessity of future cash
outflows.
Critical
Accounting Policies and Estimates
Management’s
discussion and analysis of financial condition and results of operations stated
in this 2009 Annual Report on Form 10-K are based upon HickoryTech’s
consolidated financial statements, which have been prepared in accordance with
accounting principles generally accepted in the United States and, where
applicable, conform to the accounting principles as prescribed by federal and
state telephone utility regulatory authorities. We presently give accounting
recognition to the actions of regulators where appropriate, as prescribed by ASC
Topic 980 – Regulated Operations. The preparation of these financial statements
requires management to make estimates and judgments that affect the reported
amounts of assets, liabilities, revenue and expenses, and related disclosure of
contingent assets and liabilities. Senior management has discussed the
development and selection of accounting estimates and the related Management
Discussion and Analysis disclosure with the Audit Committee. For a summary of
significant accounting policies, see Note 1 to the Notes to the Consolidated
Financial Statements. There were no significant changes to these accounting
policies during the year ended December 31, 2009.
Revenue
Recognition
We
recognize revenue when (i) persuasive evidence of an arrangement exists, (ii)
delivery of the product has occurred or a service has been provided, (iii) the
price is fixed or determinable and (iv) collectibility is reasonably
assured.
Enventis Sector Revenue Recognition:
Revenue in the Enventis Sector is
generated from the following primary sources: i) the sale of voice and data
communications equipment provided primarily through Cisco, ii) providing design,
configuration and installation services related to voice and data equipment,
iii) the provision of Cisco maintenance support contracts, iv) the sale of
professional support services related to customer voice and data systems, v) the
sale of fiber and data services over the Company-owned and leased fiber optic
network, and vi) the sale of managed voice and data services, including resale
of long distance services. Our revenue recognition policy for each of these
types of products and services is as follows:
|
·
|
In
instances where we sell Cisco voice and data communications equipment with
no installation obligations (equipment only sales), all warranty
obligations reside with Cisco. Therefore, revenue is recognized when the
equipment is delivered to the customer site. In instances where we sell
Cisco voice and data communications equipment with installation
obligations, terms of the agreements typically provide for installation
services without customer-specific acceptance provisions, but sometimes
may provide customer-specific acceptance provisions. For arrangements with
no customer-specific acceptance arrangements, we recognize revenue when
title passes to the customer. For contracts with customer specific
acceptance provisions, we defer revenue recognition until the receipt of
formal customer acceptance, assuming that all other revenue recognition
criteria have been met. When a sale involves multiple elements, revenue is
allocated to each respective element in accordance with ASC Topic 605,
Subtopic 25 – Multiple Element Arrangements, which prescribes accounting
by a vendor for arrangements under which it will perform multiple
revenue-generating activities. ASC 605-25 provides guidance on how an
arrangement involving multiple deliverables should be divided into
separate units of accounting, but does not change otherwise applicable
revenue recognition criteria. In the event that we enter into a multiple
element arrangement and there are undeliverable elements as of the balance
sheet date, we assess whether the elements are separable and have
determinable fair values in assessing the amount of revenue to record.
Allocation of revenue to elements of the arrangement is based on fair
value of the element being sold on a stand-alone
basis.
|
|
·
|
When
we sell equipment to customers, we also typically sell Cisco support
contracts (“SmartNet” contracts). These support contracts state that Cisco
will provide all support services, product warranty and updates directly
to the customer. We have no service obligations under these types of
contracts. The earnings process has culminated for us upon the sale of the
contract and therefore revenue is recognized immediately. Further, we are
serving in an agency relationship to the customer for the sale of the
contract and therefore the revenue is recorded net of the cost that we pay
Cisco for the contract. Support services also include “24x7” support of a
customer’s voice and data systems. Most of these contracts are billed on a
time and materials basis and revenue is recognized either as services are
provided or over the term of the contract. Support services also include
professional support services, which are typically sold on a time and
materials basis, but may be sold as a pre-paid block of time. This revenue
is recognized as the services are provided (deferred and recognized as
utilized if pre-paid). In the event that these services are part of a
multiple element arrangement, the fair value of the services are measured
and deferred in accordance with ASC 605-25 mentioned above. Allocation of
revenue to elements of the arrangement is based on fair value of the
element being sold on a stand-alone
basis.
|
|
·
|
Fiber
and data services are sold through a contractual flat monthly fee. The
revenue generated by these services is typically billed one month in
advance and is deferred until the appropriate month of
recognition.
|
|
·
|
We
also manage customer voice and/or data services. Under these arrangements,
we bill either a flat monthly fee or a fee that is variable based on the
number of “seats” that the customer has. This revenue is recognized on a
monthly basis as the services are
provided.
|
Telecom Sector Revenue
Recognition: Revenue
is earned from monthly billings to customers for telephone services, long
distance, digital TV, DSL, Internet services, hardware and other services.
Revenue is also derived from charges for network access to our local exchange
telephone network from subscriber line charges and from contractual arrangements
for services such as billing and collection and directory advertising. Some
revenue is realized under pooling arrangements with other telephone companies
and is divided among the companies based on respective costs and investments to
provide the services. The companies that take part in pooling arrangements may
adjust their costs and investments for a period of two years, which causes the
dollars distributed by the pool to be adjusted retroactively. We believe that
recorded amounts represent reasonable estimates of the final distribution from
these pools. However, to the extent that the companies participating in these
pools make adjustments, there will be corresponding adjustments to our recorded
revenue in future periods. Revenue is recognized in the period in which service
is provided to the customer. With multiple billing cycles and cut-off dates, we
accrue for revenue earned but not yet billed at the end of a quarter. We also
defer services billed in advance and recognize them as income when
earned.
Shipping
and Handling
Amounts
billed to a customer in a sales transaction related to shipping and handling are
classified as revenue. Shipping and handling costs are included in cost of
services.
Allowance
for Doubtful Accounts
We
maintain allowances for doubtful accounts for estimated losses resulting from
the inability of our customers to make required payments. To estimate the
appropriate allowance for doubtful accounts, we consider specific accounts,
historical write-offs, changes in customer financial condition and credit
worthiness, and concentrations of credit risk. Specific accounts receivable are
written off once we determine that the account is uncollectible. The allowance
for doubtful accounts was $643,000 and $905,000 as of December 31, 2009 and
2008, respectively.
Inventories
Inventory
includes parts, materials and supplies stored in our warehouses to support basic
levels of service and maintenance as well as scheduled capital projects and
equipment awaiting configuration for customers. Inventory also includes parts
and equipment shipped directly from vendors to customer locations while in
transit and parts and equipment returned from customers which is being returned
to vendors for credit, as well as maintenance contracts associated with customer
sales which have not yet transferred to the customer. The inventory value in the
Enventis Sector, comprised of finished goods, as of December 31, 2009 and
December 31, 2008 was $2,770,000 and $5,110,000, respectively. The inventory
value in the Telecom Sector, comprised of materials and customer premise
equipment, as of December 31, 2009 and December 31, 2008 was $2,299,000 and
$3,564,000, respectively.
We value
inventory using the lower of cost (perpetual weighted average-cost or specific
identification) or market method. Similar to our allowance for doubtful
accounts, we make estimates related to the valuation of inventory. We adjust our
inventory carrying value for estimated obsolescence or unmarketable inventory to
the estimated market value based upon assumptions about future demand and market
conditions. As market and other conditions change, we may establish additional
inventory reserves when the facts that give rise to the lower value are
warranted.
Financial
Derivative Instruments
We use
financial derivative instruments to manage our overall exposure to fluctuations
in interest rates. We account for derivative instruments in accordance with ASC
Topic 815 – Derivatives and Hedging which requires derivative instruments to be
recorded on the balance sheet at fair value. Changes in fair value of derivative
instruments must be recognized in earnings unless specific hedge accounting
criteria is met, in which case the gains and losses are included in other
comprehensive income rather than in earnings.
Effective
January 1, 2008, we adopted rules prescribed under ASC Topic 820 – Fair
Value Measurements and Disclosures for our financial assets. Topic 820 defines
fair value, establishes a framework for measuring fair value in accordance with
generally accepted accounting principles and expands disclosures about fair
value measurements. We adopted ASC Topic 820 for nonfinancial assets and
liabilities effective January 1, 2009 and it did not have a material impact on
our financial condition or results of operations.
ASC Topic
820 defines fair value as the price that would be received for an asset or paid
to transfer a liability (an exit price) in the principal or most advantageous
market for the asset or liability in an orderly transaction between market
participants on the measurement date. The fair value of our interest rate swap
agreements were determined based on level 2 inputs using observable inputs other
than quoted prices in active markets for identical assets and liabilities to
determine fair value.
We
utilize interest-rate swap agreements that qualify as cash-flow hedges to manage
our exposure to interest rate fluctuations on a portion of our variable-interest
rate debt. The market value of the cumulative gain or (loss) on financial
derivative instruments is reported as a component of accumulated other
comprehensive income (loss) in shareholders’ equity and is recognized in
earnings over the term of the swap agreement. In March 2007, we terminated two
outstanding interest-rate swap agreements with original maturities of June 2008
in exchange for $1,936,000 in proceeds. Proceeds of $664,000 and $1,272,000 were
recognized as an offset to interest expense during 2008 and 2007,
respectively.
Goodwill
and Intangible Assets
Our
intangible assets include the value of customer relationships, a supplier
relationship and goodwill associated with several strategic acquisitions. We
amortize our definite-lived intangible assets over their estimated useful lives.
Customer lists and other intangibles have remaining lives ranging from one to 15
years. Intangible assets with finite lives are amortized over their estimated
useful lives. We evaluate identifiable intangible assets that are subject to
amortization and test for recoverability whenever events or changes in
circumstances indicate that its carrying amount may not be
recoverable.
Goodwill
assets are not amortized, but are tested for impairment annually. We consider
the impact of general economic conditions and events in our industry and market
area on a more frequent basis. We have goodwill in two of our reporting units.
In our Enventis Sector, we have $4,375,000 of goodwill carrying value as of
December 31, 2009, resulting from our acquisition of Enventis Telecom in 2005
and our acquisition of CP Telecom in 2009. In our Telecom Sector, we have
$23,048,000 of goodwill carrying value as of December 31, 2009, resulting from
our acquisition of Heartland Telecommunications in 1997.
The
goodwill impairment test requires management to determine the fair value of our
reporting units as defined by ASC Topic 350 – Intangibles – Goodwill and Other.
We conduct our annual impairment testing for each reporting unit that has
goodwill and use commonly recognized financial analysis techniques such as
discounted cash flow analysis as well as industry and peer-specific valuation
methods common to our industry. We completed our annual impairment tests for
acquired goodwill as of December 31, 2009 and 2008. This testing resulted in no
impairment charges to goodwill.
Our
estimates of fair value could change based on general market or industry
conditions, or the performance of our specific assets, and could result in a
determination of impairment charges to reduce the carrying value of goodwill in
our reporting units in the future. The fair value of assets including goodwill
which are covered by the impairment tests is in excess of the asset carrying
value for all of our reporting units. We have concluded that no asset impairment
valuation charges are warranted.
Long-Lived
Assets
We review
long-lived assets for impairment if certain events or changes in circumstances
indicate that impairment may be present. Impairment exists if the carrying value
of a long-lived asset exceeds the sum of the undiscounted cash flows expected to
result from the use and eventual disposal of the asset at the date it is
tested.
Income
Taxes
We
account for income taxes in accordance with ASC Topic 740 – Income Taxes. Under
this method, deferred income taxes are based on the estimated future tax effects
of differences between the financial statement and tax basis of assets and
liabilities given the provisions of enacted tax laws. Deferred income tax
provisions and benefits are based on changes to the assets or liabilities from
year to year. In providing for deferred taxes, we consider tax regulations of
the jurisdictions in which we operate, estimates of future taxable income, and
available tax planning strategies. If tax regulations, operating results, or the
ability to implement tax-planning strategies vary from our assumptions, we may
be required to adjust the carrying value of deferred tax assets and liabilities.
Valuation allowances are recorded related to deferred tax assets based on the
“more likely than not” criteria of ASC 740. We recognize interest and penalties
related to income tax matters as income tax expense.
ASC 740
requires us to recognize the financial statement benefit of a tax position only
after determining that the relevant tax authority would more likely than not
sustain the position following an audit. For tax positions meeting the more
likely than not threshold, the amount recognized in the financial statements is
the largest benefit that has a greater than 50% likelihood of being realized
upon ultimate settlement with the relevant tax authority. See additional
disclosures regarding application of ASC 740 in Note 11 to the Notes to the
Consolidated Financial Statements.
As part
of the process of preparing our consolidated financial statements, we are
required to estimate income taxes in each of the jurisdictions in which we
operate. This process involves estimating the current tax exposure together with
assessing temporary differences resulting from the differing treatments of
items, such as deferred revenue for tax and accounting purposes. These
differences result in deferred tax assets and liabilities, which are included
within our consolidated balance sheet. We assess the likelihood that deferred
tax assets will be recovered from future taxable income and to the extent
recovery is not likely, the carrying value of the deferred tax asset is reduced
by a valuation allowance. To the extent that we establish a valuation allowance
or increase an allowance in a period, it must be included as an expense within
the tax provision in the statement of operations. We had valuation allowances of
$1,695,000 and $1,687,000 at December 31, 2009 and 2008, respectively, due to
uncertainty about the realization of certain benefits associated with net
operating losses generated in the states of Iowa and Minnesota. In addition, we
carry reserves for income tax contingencies. These reserves relate to various
tax years subject to audit by tax authorities. We believe our current income tax
reserves are adequate. However, the ultimate outcome may differ from estimates,
and assumptions could impact the provision for income taxes reflected in the
consolidated statements of operations.
Post-Retirement
Benefits
We
provide retirement savings benefits and post-retirement health care and life
insurance benefits for eligible employees. We are not currently funding these
post-retirement benefits, but have accrued these liabilities. The net
post-retirement benefit expense was $995,000, $825,000 and $859,000 in 2009,
2008 and 2007, respectively. Post-retirement benefit expense is recorded in cost
of services and selling, general and administrative expenses. The
post-retirement benefit expense and liability are calculated utilizing various
actuarial assumptions and methodologies. These assumptions include, but are not
limited to, the discount rate and the expected health care cost trend
rate.
Post-retirement
benefits were calculated using the following policies/methods specified in ASC
Topic 715 – Compensation – Retirement Benefits, Subtopic 10 – Overall, Subtopic
20 – Defined Benefit Plans – General and Subtopic 60 – Defined Benefit Plans –
Other Postretirement. Any prior service cost or cumulative net gains and losses
in excess of 10% of Topic 715 corridor are amortized on a straight-line basis
over the average future service lives of the covered group. There are no
substantive commitments for benefits other than as stated in the written plan.
The assumed discount rate represents the discounted value of necessary future
cash flows required to pay the accumulated benefits when due. The rate was
determined based on available market data regarding the spot rate yields in half
year increments on high-quality fixed income securities with the effects of puts
and calls removed that provide cash flows at the same time and in the same
amount as the projected cash flows of the plan.
In
measuring the accumulated post-retirement benefit obligation as of December 31,
2009, we assumed a weighted average discount rate of 5.5%. The reduction in the
discount rate by 25 basis points would increase the accumulated post-retirement
benefit obligation by approximately $570,000 as of December 31, 2009 and would
increase the net periodic cost by approximately $70,000 as of December 31,
2009.
The
health care cost trend rate is based upon an evaluation of the historical trends
and experience, taking into account current and expected market conditions. The
health care cost trend rate represents the expected annual rate of change in the
cost of health care benefits currently provided due to factors other than
changes in the demographics of plan participants. If the assumptions utilized in
determining the post-retirement benefit expense and liability differ from actual
events, the results of operations for future periods could be
impacted.
In
measuring the accumulated post-retirement benefit obligation as of December 31,
2009, the initial health care inflation rate for 2010 was assumed to be 7.9% and
decreases gradually until it reaches 5.6% in 2018 and ultimately 4.0% in 2085.
These assumptions were provided based on a study of the ten-year history of our
self-funded medical benefits plan. This has resulted in HickoryTech consistently
having lower increases in health care costs than the national averages. A
one-percentage point increase in the health care inflation rate for each year
would increase the accumulated post-retirement benefit obligation by $2,350,000.
A one-percentage point decrease in the health care inflation rate for each year
would decrease the accumulated post-retirement benefit obligation by
$1,873,000.
When
actual events differ from the assumptions or when the assumptions used change,
an unrecognized actuarial gain or loss results. As of December 31, 2009, the
unrecognized net actuarial loss was $5,617,000. During each of the last three
years, we adjusted the discount rate assumption due to changes in interest
rates. In recent years, we adjusted the health care cost trend rate assumption
to reflect the current trend of medical costs. The remainder of the net
actuarial loss amount primarily related to differences between the assumed
medical costs and actual experience and changes in the employee population. The
recognized net actuarial loss outside the allowable corridor is expected to be
recognized over the next 11 years. This amount will change in future years as
economic and market conditions generate gains and losses.
Property,
Plant and Equipment
Property,
plant and equipment are recorded at original cost of acquisition or
construction. On December 30, 2005 we acquired Enventis. The Enventis property,
plant and equipment, consisting primarily of a fiber optic communications
network was valued using purchase accounting recording the assets at fair value
at the time of acquisition. Also included are indefeasible right of use of fiber
installed by others accompanied by ownership rights. Both of these categories of
assets have depreciable lives of 16 to 20 years on the assets acquired on
December 30, 2005 and 25 years for new additions.
When
regulated ILEC telephone assets are sold or retired, the assets and related
accumulated depreciation are removed from the accounts and any gains or losses
on disposition are amortized with the remaining net investment in telephone
plant. When other plant and equipment are sold or retired, the cost and related
accumulated depreciation or amortization are removed from the respective
accounts and any resulting gain or loss is included in operating income.
Maintenance and repairs are charged to expense as incurred.
Depreciation for financial statement
purposes is determined using the straight-line method based on the lives of the
various classes of depreciable assets. The composite depreciation rates on the
ILEC telephone plant were 4.5%, 5.0% and 4.8% for 2009, 2008 and 2007,
respectively. All other property, plant and equipment are depreciated over
estimated useful lives of 3 to 20 years.
The
Telecom Sector leases certain computer equipment under capital lease
arrangements. We have recorded the present value or fair value of the future
minimum lease payments as a capitalized asset and related lease obligation.
Assets under these capital leases are included in property, plant and
equipment.
Incentive
Compensation
Our
employee incentive compensation plans provide for distributions based on
achievement of specific organizational operating results or individual employee
objectives. Accrued expenses included amounts accrued for employee incentive
compensation of $1,765,000 and $1,777,000 at December 31, 2009 and December 31,
2008, respectively.
Stock
Compensation
We apply
a fair value based measurement method in accounting for share-based payment
transactions with employees and record compensation cost for all stock awards.
Compensation charges are realized when management concludes it is probable that
the participant will earn the award and recognized during the service period
specified by the stock award plan. See Note 7 to the Notes to the Consolidated
Financial Statements for more information regarding stock-based
compensation.
Stock
based compensation expense recognized was $1,021,000, $415,000 and $688,000 in
2009, 2008 and 2007, respectively. Stock based compensation expense recognized
in 2009 primarily increased due to the increase in our stock price from $5.44 as
of December 31, 2008 to $8.83 as of December 31, 2009. As of December 31, 2009,
all compensation costs related to stock options granted under our stock award
plan have been recognized.
Off-Balance Sheet
Arrangement/Contingent Commitments
We are
not engaged in any transactions, arrangements or other relationships with
unconsolidated entities or other third parties that are reasonably likely to
have a material effect on our liquidity, or on our access to, or requirements
for capital resources. In addition, we have not established any special purpose
entities.
Other
We have
not conducted any public equity offering in our recent history and operate with
original equity capital, retained earnings and financing in the form of bank
term debt with revolving lines of credit. By utilizing cash flow from operations
and current asset balances, we believe that we have adequate resources to meet
the anticipated operating, capital expenditures and debt service requirements of
our current business plan.
Recent
Accounting Developments
See Note
1, “Accounting Policies – Recent Accounting Developments,” in the Notes to the
Consolidated Financial Statements for a discussion of recent accounting
developments.
Item 7A. Quantitative and Qualitative Disclosures about Market
Risk
We do not
have operations subject to risks of foreign currency fluctuations. We do,
however, use derivative financial instruments to manage exposure to interest
rate fluctuations. Our objectives for holding derivatives are to minimize
interest rate risks using the most effective methods to eliminate or reduce the
impact of these exposures. Variable rate debt instruments are subject to
interest rate risk. In March 2007, we terminated two outstanding interest-rate
swap agreements, with original maturities of June 2008, in exchange for
$1,936,000 in proceeds. The proceeds were to be recognized as an offset to
interest expense over the remainder of the original term of the agreement which
ended June 2008. Proceeds of $664,000 and $1,272,000 were recognized as an
offset to interest expense during 2008 and 2007, respectively. Immediately
following the termination of the two agreements discussed above, we executed a
new interest-rate swap agreement, effectively locking in the interest rate on
$60,000,000 of variable-rate debt through March 2010. In March 2008, we entered
into a second interest-rate swap agreement, effectively locking in the interest
rate on an additional $40,000,000 of variable-interest rate debt through
February 2010. In March 2009, we entered into a interest-rate swap agreement,
effectively locking in the interest rate on $80,000,000 of variable-interest
rate debt from March 2010 to September 2011.
The
cumulative gain or loss on current derivative instruments is reported as a
component of accumulated other comprehensive income (loss) in shareholders’
equity and is recognized in earnings when the term of the protection agreement
is concluded. For any portion of our debt not covered with interest rate swap
agreements, our earnings are affected by changes in interest rates as a portion
of its long-term debt has variable interest rates based on LIBOR. If interest
rates for the portion of our long-term debt based on variable rates had averaged
10% more for the year ended December 31, 2009 and December 31, 2008, our
interest expense would have increased $25,000 and $128,000,
respectively.
REPORT
OF INDEPENDENT REGISTERED PUBLIC ACCOUNTING FIRM
Board of
Directors and Shareholders
Hickory
Tech Corporation
We have
audited the accompanying consolidated balance sheets of Hickory Tech Corporation
and subsidiaries (the “Company”) as of December 31, 2009 and 2008, and the
related consolidated statements of operations, shareholders’
equity and comprehensive income, and cash flows for each of the three years in
the period ended December 31, 2009. Our audits of the basic consolidated
financial statements included the financial statement schedule listed in the
index appearing under Item 15(2). These financial statements and financial
statement schedule are the responsibility of the Company’s management. Our
responsibility is to express an opinion on these financial statements and
financial statement schedule based on our audits.
We
conducted our audits in accordance with the standards of the Public Company
Accounting Oversight Board (United States). Those standards require that we plan
and perform the audit to obtain reasonable assurance about whether the financial
statements are free of material misstatement. An audit includes examining,
on a test basis, evidence supporting the amounts and disclosures in the
financial statements. An audit also includes assessing the accounting principles
used and significant estimates made by management, as well as evaluating the
overall financial statement presentation. We believe that our audits provide a
reasonable basis for our opinion.
In our
opinion, the consolidated financial statements referred to above present fairly,
in all material respects, the consolidated financial position of Hickory Tech
Corporation and subsidiaries as of December 31, 2009, and 2008, and
the consolidated results of their operations and their cash flows for each of
the three years in the period ended December 31, 2009 in conformity with
accounting principles generally accepted in the United States of America. Also
in our opinion, the related financial statement schedule, when considered
in relation to the basic consolidated financial statements taken as a whole,
presents fairly, in all material respects, the information set forth
therein.
We also
have audited, in accordance with the standards of the Public Company
Accounting Oversight Board (United States), Hickory Tech Corporation and
subsidiaries’ internal control over financial reporting as of
December 31, 2009, based on criteria established in Internal Control—Integrated
Framework issued by the Committee of Sponsoring Organizations of the
Treadway Commission (COSO), and our report dated March 2, 2010, expressed an
unqualified opinion.
/s/ Grant
Thornton LLP
Minneapolis,
Minnesota
March 2,
2010
REPORT OF INDEPENDENT REGISTERED PUBLIC ACCOUNTING
FIRM
Board of
Directors and Shareholders
Hickory
Tech Corporation
We have
audited Hickory Tech Corporation and subsidiaries’ (the “Company”) internal
control over financial reporting as of December 31, 2009, based on criteria
established in Internal
Control—Integrated Framework issued by the Committee of Sponsoring
Organizations of the Treadway Commission (COSO). The Company’s management is
responsible for maintaining effective internal control over financial
reporting and for its assessment of the effectiveness of internal control
over financial reporting, included in the accompanying Management’s Report on
Internal Control over Financial Reporting. Our responsibility is to express an
opinion on the effectiveness of the Company’s internal control over financial
reporting based on our audit. Our audit of, and opinion on, the Company’s
internal control over financial reporting does not include internal control over
financial reporting of Computer Pro, Inc., dba CP Telecom, a wholly-owned
subsidiary, whose financial statements reflect total assets and revenues
constituting 4 and 3 percent, respectively, of the related consolidated
financial statement amounts as of and for the year ended December 31,
2009. As indicated in Management’s Report, Computer Pro, Inc. dba CP
Telecom, was acquired during 2009 and therefore, management’s assertion on the
effectiveness of the Company’s internal control over financial reporting
excluded internal control over financial reporting of Computer Pro, Inc. dba CP
Telecom.
We
conducted our audit in accordance with the standards of the Public Company
Accounting Oversight Board (United States). Those standards require that we plan
and perform the audit to obtain reasonable assurance about whether effective
internal control over financial reporting was maintained in all material
respects. Our audit included obtaining an understanding of internal control over
financial reporting, assessing the risk that a material weakness exists, testing
and evaluating the design and operating effectiveness of internal control
based on the assessed risk, and performing such other procedures as we
considered necessary in the circumstances. We believe that our audit provides a
reasonable basis for our opinion.
A
company’s internal control over financial reporting is a process designed to
provide reasonable assurance regarding the reliability of financial
reporting and the preparation of financial statements for external purposes in
accordance with generally accepted accounting principles. A company’s
internal control over financial reporting includes those policies and procedures
that (1) pertain to the maintenance of records that, in reasonable detail,
accurately and fairly reflect the transactions and dispositions of the assets of
the company; (2) provide reasonable assurance that transactions are recorded as
necessary to permit preparation of financial statements in accordance with
generally accepted accounting principles, and that receipts and expenditures of
the company are being made only in accordance with authorizations of management
and directors of the company; and (3) provide reasonable assurance regarding
prevention or timely detection of unauthorized acquisition, use, or disposition
of the company’s assets that could have a material effect on the financial
statements.
Because
of its inherent limitations, internal control over financial reporting may not
prevent or detect misstatements. Also, projections of any evaluation
of effectiveness to future periods are subject to the risk that controls may
become inadequate because of changes in conditions, or that the degree of
compliance with the policies or procedures may deteriorate.
In our
opinion, Hickory Tech Corporation and subsidiaries maintained, in all material
respects, effective internal control over financial reporting as of
December 31, 2009, based on criteria established in Internal Control—Integrated
Framework issued by COSO.
We also
have audited, in accordance with the standards of the Public Company
Accounting Oversight Board (United States), the consolidated balance sheets
of Hickory Tech Corporation and subsidiaries as of December 31, 2009 and
2008, and the related consolidated statements of operations, shareholders’
equity and comprehensive income, and cash flows for each of the three years in
the period ended December 31, 2009, and our report dated March 2,
2010, expressed an unqualified opinion on those consolidated financial
statements.
/s/ Grant
Thornton LLP
Minneapolis,
Minnesota
March 2,
2010
Item 8. Financial Statements and Supplementary
Data
|
HICKORY
TECH CORPORATION
|
||||||||||||
|
CONSOLIDATED
STATEMENTS OF OPERATIONS
|
||||||||||||
|
Years
Ended December 31
|
||||||||||||
|
|
||||||||||||
| (Dollars in thousands, except share and per share amounts) |
2009
|
2008
|
2007
|
|||||||||
|
Operating
Revenue:
|
||||||||||||
|
Enventis
Sector
|
||||||||||||
|
Equipment
|
$ | 27,857 | $ | 43,514 | $ | 51,046 | ||||||
|
Services
|
40,826 | 36,462 | 28,756 | |||||||||
|
Total
Enventis Sector
|
68,683 | 79,976 | 79,802 | |||||||||
|
Telecom Sector
|
70,419 | 73,199 | 76,847 | |||||||||
|
Total
operating revenue
|
139,102 | 153,175 | 156,649 | |||||||||
|
Costs
and expenses:
|
||||||||||||
|
Cost of sales, excluding depreciation and amortization
|
24,869 | 37,355 | 45,340 | |||||||||
|
Cost
of services, exluding depreciation and amortization
|
52,211 | 52,004 | 44,881 | |||||||||
|
Selling, general and administrative expenses
|
22,260 | 22,984 | 24,244 | |||||||||
|
Depreciation
|
20,176 | 19,479 | 17,847 | |||||||||
|
Amortization of intangibles
|
1,001 | 1,127 | 1,157 | |||||||||
|
Total
costs and expenses
|
120,517 | 132,949 | 133,469 | |||||||||
|
Operating
income
|
18,585 | 20,226 | 23,180 | |||||||||
|
Other
income and expense:
|
||||||||||||
|
Interest
and other income
|
105 | 93 | 287 | |||||||||
|
Interest
expense
|
(6,918 | ) | (6,870 | ) | (8,121 | ) | ||||||
|
Total
other (expense)
|
(6,813 | ) | (6,777 | ) | (7,834 | ) | ||||||
|
Income
from continuing operations before income taxes
|
11,772 | 13,449 | 15,346 | |||||||||
|
Income
tax provision
|
499 | 5,420 | 6,711 | |||||||||
|
Income
from continuing operations
|
11,273 | 8,029 | 8,635 | |||||||||
|
Discontinued
operations (Note 3)
|
||||||||||||
|
(Loss) from operations of discontinued component
|
- | - | (40 | ) | ||||||||
|
Income
tax benefit
|
- | - | (16 | ) | ||||||||
|
(Loss)
on discontinued operations
|
- | - | (24 | ) | ||||||||
|
Net
income
|
$ | 11,273 | $ | 8,029 | $ | 8,611 | ||||||
|
Basic
earnings per share
|
$ | 0.86 | $ | 0.61 | $ | 0.65 | ||||||
|
Weighted
average common shares outstanding
|
13,061,266 | 13,248,731 | 13,258,369 | |||||||||
|
Diluted
earnings per share
|
$ | 0.86 | $ | 0.61 | $ | 0.65 | ||||||
|
Weighted
average common and equivalent shares outstanding
|
13,061,861 | 13,259,933 | 13,260,087 | |||||||||
|
Dividends
per share
|
$ | 0.52 | $ | 0.49 | $ | 0.48 | ||||||
|
The
accompanying notes are an integral part of the consolidated financial
statements.
|
||||||||||||
|
CONSOLIDATED
BALANCE SHEETS
|
||||||||
|
As
of December 31
|
||||||||
|
(Dollars
in thousands except share and per share amounts)
|
2009
|
2008
|
||||||
|
ASSETS
|
||||||||
|
Current
assets:
|
||||||||
|
Cash and cash equivalents
|
$ | 2,420 | $ | 1,626 | ||||
|
Receivables, net of allowance for doubtful accounts of $643 and
$905
|
19,729 | 26,292 | ||||||
|
Inventories
|
5,069 | 8,674 | ||||||
|
Income taxes receivable
|
- | 566 | ||||||
|
Deferred income taxes, net
|
2,423 | 2,064 | ||||||
|
Prepaid expenses
|
1,751 | 1,409 | ||||||
|
Other
|
1,039 | 1,114 | ||||||
|
Total current assets
|
32,431 | 41,745 | ||||||
|
Investments
|
4,306 | 4,066 | ||||||
|
Property,
plant and equipment
|
357,607 | 338,510 | ||||||
|
Accumulated depreciation
|
(204,129 | ) | (187,157 | ) | ||||
|
Property, plant and equipment, net
|
153,478 | 151,353 | ||||||
|
Other
assets:
|
||||||||
|
Goodwill
|
27,423 | 25,239 | ||||||
|
Intangible assets, net
|
3,025 | 856 | ||||||
|
Deferred costs and other
|
1,820 | 2,249 | ||||||
|
Total other assets
|
32,268 | 28,344 | ||||||
|
Total
assets
|
$ | 222,483 | $ | 225,508 | ||||
|
LIABILITIES
& SHAREHOLDERS' EQUITY
|
||||||||
|
Current
liabilities:
|
||||||||
|
Extended term payable
|
$ | 6,788 | $ | 10,474 | ||||
|
Accounts payable
|
2,883 | 3,133 | ||||||
|
Accrued expenses and other
|
7,792 | 8,001 | ||||||
|
Accrued income taxes
|
642 | - | ||||||
|
Deferred revenue
|
6,016 | 6,205 | ||||||
|
Current maturities of long-term obligations
|
620 | 1,621 | ||||||
|
Total current liabilities
|
24,741 | 29,434 | ||||||
|
Long-term
liabilities:
|
||||||||
|
Debt obligations, net of current maturities
|
119,871 | 125,384 | ||||||
|
Financial derivative instruments
|
1,908 | 3,286 | ||||||
|
Accrued income taxes
|
3,218 | 7,517 | ||||||
|
Deferred income taxes
|
21,895 | 18,282 | ||||||
|
Deferred revenue
|
2,095 | 1,646 | ||||||
|
Accrued employee benefits and deferred compensation
|
14,209 | 10,210 | ||||||
|
Total long-term liabilities
|
163,196 | 166,325 | ||||||
|
Total liabilities
|
187,937 | 195,759 | ||||||
|
Commitments
and contingencies
|
||||||||
|
Shareholders'
equity:
|
||||||||
|
Common stock, no par value, $.10 stated value
|
||||||||
|
Shares authorized: 100,000,000
|
||||||||
|
Shares issued and outstanding: 13,100,568 in 2009 and 12,992,376 in
2008
|
1,310 | 1,299 | ||||||
|
Additional paid-in capital
|
12,975 | 11,504 | ||||||
|
Retained earnings
|
24,687 | 20,199 | ||||||
|
Accumulated other comprehensive (loss)
|
(4,426 | ) | (3,253 | ) | ||||
|
Total shareholders' equity
|
34,546 | 29,749 | ||||||
|
Total
liabilities and shareholders' equity
|
$ | 222,483 | $ | 225,508 | ||||
|
The
accompanying notes are an integral part of the consolidated financial
statements.
|
||||||||
|
HICKORY
TECH CORPORATION
|
||||||||||||
|
CONSOLIDATED
STATEMENTS OF CASH FLOWS
|
||||||||||||
|
Years
Ended December 31
|
||||||||||||
|
|
||||||||||||
| (Dollars in thousands) | ||||||||||||
|
2009
|
2008
|
2007
|
||||||||||
|
OPERATING
ACTIVITIES:
|
||||||||||||
|
Net
income
|
$ | 11,273 | $ | 8,029 | $ | 8,611 | ||||||
|
Adjustments
to reconcile net income to net
|
||||||||||||
|
cash
provided by operating activities:
|
||||||||||||
|
Loss
from discontinued operations
|
- | - | 24 | |||||||||
|
Depreciation
and amortization
|
21,177 | 20,606 | 19,004 | |||||||||
|
Amortization
of gain on sale of financial derivative instrument
|
- | (664 | ) | (1,272 | ) | |||||||
|
Deferred
income tax provision
|
1,968 | 3,660 | 1,523 | |||||||||
|
Stock-based
compensation
|
1,021 | 415 | 688 | |||||||||
|
Accrued
patronage refunds
|
(512 | ) | (563 | ) | (230 | ) | ||||||
|
Other
|
867 | 731 | 889 | |||||||||
|
Changes
in operating assets and liabilities net of effects of
acquisition:
|
||||||||||||
|
Receivables
|
6,779 | 1,780 | (7,814 | ) | ||||||||
|
Prepaids
|
(125 | ) | 304 | 190 | ||||||||
|
Inventories
|
3,605 | (1,620 | ) | 4,239 | ||||||||
|
Accounts
payable and accrued expenses
|
(1,696 | ) | (1,135 | ) | 2,190 | |||||||
|
Deferred
revenue, billings and deposits
|
195 | 1,165 | 601 | |||||||||
|
Income
taxes
|
(3,091 | ) | 218 | 1,237 | ||||||||
|
Other
|
793 | 844 | 851 | |||||||||
|
Net
cash provided by operating activities
|
42,254 | 33,770 | 30,731 | |||||||||
|
INVESTING
ACTIVITIES:
|
||||||||||||
|
Additions
to property, plant and equipment
|
(17,893 | ) | (17,691 | ) | (17,500 | ) | ||||||
|
Acquisitions
|
(6,625 | ) | - | - | ||||||||
|
Other
|
- | 420 | 100 | |||||||||
|
Net
cash (used in) investing activities
|
(24,518 | ) | (17,271 | ) | (17,400 | ) | ||||||
|
FINANCING
ACTIVITIES:
|
||||||||||||
|
Net
change in extended term payables arrangement
|
(3,687 | ) | (3,969 | ) | 6,724 | |||||||
|
Change
in cash overdraft
|
- | - | (1,475 | ) | ||||||||
|
Borrowings
on credit facility
|
- | 34,500 | 15,500 | |||||||||
|
Payments
on credit facility and capital lease obligations
|
(6,930 | ) | (37,132 | ) | (29,906 | ) | ||||||
|
Proceeds
from the sale of financial derivative instrument
|
- | - | 1,936 | |||||||||
|
Proceeds
from issuance of common stock
|
460 | 412 | 358 | |||||||||
|
Dividends
paid
|
(6,785 | ) | (6,492 | ) | (6,357 | ) | ||||||
|
Stock
repurchase
|
- | (2,363 | ) | - | ||||||||
|
Net
cash (used in) financing activities
|
(16,942 | ) | (15,044 | ) | (13,220 | ) | ||||||
|
DISCONTINUED
OPERATIONS:
|
||||||||||||
|
Net
cash (used in) operating activities
|
- | - | (24 | ) | ||||||||
|
Net
cash (used in) discontinued operations
|
- | - | (24 | ) | ||||||||
|
Net
increase in cash and cash equivalents
|
794 | 1,455 | 87 | |||||||||
|
Cash
and cash equivalents at beginning of the year
|
1,626 | 171 | 84 | |||||||||
|
Cash
and cash equivalents at the end of the year
|
$ | 2,420 | $ | 1,626 | $ | 171 | ||||||
|
Supplemental
disclosure of cash flow information:
|
||||||||||||
|
Cash paid for interest
|
$ | 7,094 | $ | 7,962 | $ | 9,319 | ||||||
|
Net cash paid for income taxes
|
$ | 1,622 | $ | 1,542 | $ | 3,935 | ||||||
|
Non-cash
investing activities:
|
||||||||||||
|
Property, plant and equipment acquired with capital leases
|
$ | 417 | $ | 433 | $ | 522 | ||||||
|
Change in other comprehensive income from financial derivatives and
post-retirement benefits
|
$ | 1,173 | $ | 2,186 | $ | 1,517 | ||||||
|
The
accompanying notes are an integral part of the consolidated financial
statements.
|
||||||||||||
|
HICKORY
TECH CORPORATION
|
||||||||||||||||||||||||||||
|
CONSOLIDATED
STATEMENTS OF SHAREHOLDERS' EQUITY AND COMPREHENSIVE
INCOME
|
||||||||||||||||||||||||||||
|
Years
Ended December 31
|
||||||||||||||||||||||||||||
|
(Dollars
in thousands)
|
||||||||||||||||||||||||||||
|
Common
Stock
|
Additional Paid-In
|
Retained
|
Accumulated
Other Comprehensive
|
Total
Shareholders'
|
Total
Comprehensive
|
|||||||||||||||||||||||
|
Shares
|
Amount
|
Capital
|
Earnings
|
Income
(Loss)
|
Equity
|
Income
|
||||||||||||||||||||||
|
Balance,
December 31, 2006
|
13,207,970 | $ | 1,321 | $ | 9,992 | $ | 18,323 | $ | 450 | $ | 30,086 | |||||||||||||||||
|
Stock
Award Plans
|
27,590 | 3 | 196 | 199 | ||||||||||||||||||||||||
|
Employee
Stock Purchase Plan
|
13,792 | 1 | 275 | 276 | ||||||||||||||||||||||||
|
Directors’
Stock Retainer Plan
|
7,586 | 1 | 232 | 233 | ||||||||||||||||||||||||
|
Dividend
Reinvestment Plan
|
27,965 | 3 | 233 | 236 | ||||||||||||||||||||||||
|
Stock
based compensation
|
103 | 103 | ||||||||||||||||||||||||||
|
Net
Income
|
8,611 | 8,611 | $ | 8,611 | ||||||||||||||||||||||||
|
Dividends
Paid
|
(6,357 | ) | (6,357 | ) | ||||||||||||||||||||||||
|
Adoption
of ASC 740
|
62 | 62 | ||||||||||||||||||||||||||
|
Other
Comprehensive Loss,
|
||||||||||||||||||||||||||||
|
Net
of Income Taxes
|
(1,517 | ) | $ | (1,517 | ) | (1,517 | ) | |||||||||||||||||||||
|
Total
Comprehensive Income
|
$ | 7,094 | ||||||||||||||||||||||||||
|
Balance,
December 31, 2007
|
13,284,903 | 1,329 | 11,031 | 20,639 | (1,067 | ) | 31,932 | |||||||||||||||||||||
|
Stock
Award Plans
|
10,493 | 1 | 110 | 111 | ||||||||||||||||||||||||
|
Employee
Stock Purchase Plan
|
23,992 | 2 | 268 | 270 | ||||||||||||||||||||||||
|
Directors’
Stock Retainer Plan
|
13,803 | 1 | 22 | 23 | ||||||||||||||||||||||||
|
Directors'
Incentive Stock Plan
|
18,000 | 2 | 166 | 168 | ||||||||||||||||||||||||
|
Dividend
Reinvestment Plan
|
34,185 | 3 | 241 | 244 | ||||||||||||||||||||||||
|
Stock
Repurchase
|
(393,000 | ) | (39 | ) | (347 | ) | (1,977 | ) | (2,363 | ) | ||||||||||||||||||
|
Stock
based compensation
|
13 | 13 | ||||||||||||||||||||||||||
|
Net
Income
|
8,029 | 8,029 | 8,029 | |||||||||||||||||||||||||
|
Dividends
Paid
|
(6,492 | ) | (6,492 | ) | ||||||||||||||||||||||||
|
Other
Comprehensive Loss,
|
- | |||||||||||||||||||||||||||
|
Net
of Income Taxes
|
(2,186 | ) | (2,186 | ) | (2,186 | ) | ||||||||||||||||||||||
|
Total
Comprehensive Income
|
$ | 5,843 | ||||||||||||||||||||||||||
|
Balance,
December 31, 2008
|
12,992,376 | 1,299 | 11,504 | 20,199 | (3,253 | ) | 29,749 | |||||||||||||||||||||
|
Stock
Award Plans
|
16,303 | 2 | 914 | 916 | ||||||||||||||||||||||||
|
Employee
Stock Purchase Plan
|
20,561 | 2 | 183 | 185 | ||||||||||||||||||||||||
|
Directors’
Stock Retainer Plan
|
13,121 | 1 | - | 1 | ||||||||||||||||||||||||
|
Directors'
Incentive Stock Plan
|
20,000 | 2 | 101 | 103 | ||||||||||||||||||||||||
|
Dividend
Reinvestment Plan
|
38,207 | 4 | 269 | 273 | ||||||||||||||||||||||||
|
Stock
based compensation
|
4 | 4 | ||||||||||||||||||||||||||
|
Net
Income
|
11,273 | 11,273 | $ | 11,273 | ||||||||||||||||||||||||
|
Dividends
Paid
|
(6,785 | ) | (6,785 | ) | ||||||||||||||||||||||||
|
Other
Comprehensive Loss,
|
||||||||||||||||||||||||||||
|
Net
of Income Taxes
|
(1,173 | ) | (1,173 | ) | (1,173 | ) | ||||||||||||||||||||||
|
Total
Comprehensive Income
|
$ | 10,100 | ||||||||||||||||||||||||||
|
Balance,
December 31, 2009
|
13,100,568 | $ | 1,310 | $ | 12,975 | $ | 24,687 | $ | (4,426 | ) | $ | 34,546 | ||||||||||||||||
|
The
accompanying notes are an integral part of the consolidated financial
statements.
|
||||||||||||||||||||||||||||
HICKORYTECH
CORPORATION, INC.
NOTES
TO CONSOLIDATED FINANCIAL STATEMENTS
Fiscal
Years Ended December 31, 2009, 2008 and 2007
Note
1. Summary of Significant Accounting Policies
The
accounting policies of HickoryTech conform with generally accepted accounting
principles and, where applicable, to the accounting principles as prescribed by
federal and state telephone utility regulatory authorities. We presently give
accounting recognition to the actions of regulators where appropriate, as
prescribed by ASC Topic 980 – Regulated Operations. Topic 980 provides guidance
in preparing general purpose financial statements for most public utilities. In
general, the type of regulation covered by this statement permits rates (prices)
for some services to be set at levels intended to recover the estimated costs of
providing regulated services or products, including the cost of capital
(interest costs and a provision for earnings on shareholders’
investments).
Principles
of Consolidation
Our
consolidated financial statements report the financial condition and results of
operations for HickoryTech Corporation and its subsidiaries in two business
segments: Enventis Sector and Telecom Sector. Inter-company transactions have
been eliminated from the consolidated financial statements.
Classification
of Costs and Expenses
Cost of
sales for the Enventis Sector includes the costs associated with the
installation of products for customers. These costs are primarily for equipment
and materials. Labor associated with installation work is not included in this
category, but is included in cost of services (excluding depreciation and
amortization) described below.
Cost of
services includes all costs related to delivery of communication services and
products for all sectors. These operating costs include all costs of performing
services and providing related products including engineering, customer service,
billing and collections, network monitoring and transport costs.
Selling,
general and administrative expenses include direct and indirect selling
expenses, advertising and all other general and administrative costs associated
with the operations of the business.
Use
of Estimates
Preparing
consolidated financial statements in conformity with accounting principles
generally accepted in the United States of America requires management to make
estimates and assumptions that affect the reported amounts of assets,
liabilities, revenue and expenses and disclosure of contingent assets and
liabilities. The estimates and assumptions used in the accompanying consolidated
financial statements are based upon management's evaluation of the relevant
facts and circumstances as of the date of the financial statements. Actual
results may differ from these estimates and assumptions.
Revenue
Recognition
We
recognize revenue when (i) persuasive evidence of an arrangement exists, (ii)
delivery of the product has occurred or service has been provided, (iii) the
price is fixed or determinable and (iv) collectibility is reasonably assured.
Revenue is reported net of all applicable sales tax.
Enventis Sector Revenue Recognition:
Revenue is generated from the following primary sources: i) the sale of
voice and data communications equipment provided primarily through Cisco, ii)
providing design, configuration and installation services related to voice and
data equipment, iii) the provision of Cisco maintenance support contracts, iv)
the sale of professional support services related to customer voice and data
systems, v) the sale of fiber and data services over the Company-owned and
leased fiber optic network, and vi) the sale of managed voice and data services,
including resale of long distance services. Our revenue recognition policy for
each of these types of products and services is as follows:
|
·
|
In
instances where we sell Cisco voice and data communications equipment with
no installation obligations (equipment only sales), all warranty
obligations reside with Cisco. Therefore, revenue is recognized when the
equipment is delivered to the customer site. In instances where we sell
Cisco voice and data communications equipment with installation
obligations, terms of the agreements typically provide for installation
services without customer-specific acceptance provisions, but sometimes
may provide customer-specific acceptance provisions. For arrangements with
no customer-specific acceptance arrangements, we recognize revenue when
title passes to the customer. For contracts with customer specific
acceptance provisions, we defer revenue recognition until the receipt of
formal customer acceptance, assuming that all other revenue recognition
criteria have been met. When a sale involves multiple elements, revenue is
allocated to each respective element in accordance with ASC Topic 605,
Subtopic 25 – Multiple Element Arrangements, which prescribes accounting
by a vendor for arrangements under which it will perform multiple
revenue-generating activities. ASC 605-25 provides guidance on how an
arrangement involving multiple deliverables should be divided into
separate units of accounting, but does not change otherwise applicable
revenue recognition criteria. In the event that we enter into a multiple
element arrangement and there are undeliverable elements as of the balance
sheet date, we assess whether the elements are separable and have
determinable fair values in assessing the amount of revenue to record.
Allocation of revenue to elements of the arrangement is based on fair
value of the element being sold on a stand-alone
basis.
|
|
·
|
When
we sell equipment to customers, we also typically sell Cisco support
contracts (“SmartNet” contracts). These support contracts state that Cisco
will provide all support services, product warranty and updates directly
to the customer. Because we have no service obligations under these types
of contracts, the earnings process has culminated for us upon the sale of
the contract and therefore revenue is recognized immediately. Further, we
are serving in an agency relationship to the customer for the sale of the
contract and therefore the revenue is recorded net of the cost that we pay
Cisco for the contract. Support services also include “24x7” support of a
customer’s voice and data systems. Most of these contracts are billed on a
time and materials basis and revenue is recognized either as services are
provided or over the term of the contract. Support services also include
professional support services, which are typically sold on a time and
materials basis, but may be sold as a pre-paid block of time. This revenue
is recognized as the services are provided (deferred and recognized as
utilized if pre-paid). In the event that these services are part of a
multiple element arrangement, the fair value of the services are measured
and deferred in accordance with ASC 605-25 mentioned above. Allocation of
revenue to elements of the arrangement is based on fair value of the
element being sold on a stand-alone
basis.
|
|
·
|
Fiber
and data services are sold through a contractual flat monthly fee. The
revenue generated by these services is typically billed one month in
advance and is deferred until the appropriate month of
recognition.
|
|
·
|
We
also manage customer voice and/or data services. Under these arrangements,
we bill either a flat monthly fee or a fee that is variable based on the
number of “seats” that the customer has. This revenue is recognized on a
monthly basis as the services are
provided.
|
Telecom Sector Revenue
Recognition: Revenue
is earned from monthly billings to customers for telephone services, long
distance, digital TV, DSL, Internet services, and hardware and other services.
Revenue is also derived from charges for network access to our local exchange
telephone network from subscriber line charges and from contractual arrangements
for services such as billing and collection and directory advertising. Some
revenue is realized under pooling arrangements with other telephone companies
and is divided among the companies based on respective costs and investments to
provide the services. The companies that take part in pooling arrangements may
adjust their costs and investments for a period of two years, which causes the
dollars distributed by the pool to be adjusted retroactively. We believe that
recorded amounts represent reasonable estimates of the final distribution from
these pools. However, to the extent that the companies participating in these
pools make adjustments, there will be corresponding adjustments to our recorded
revenue in future periods. Revenue is recognized in the period in which service
is provided to the customer. With multiple billing cycles and cut-off dates, we
accrue for revenue earned but not yet billed at the end of a quarter. We also
defer services billed in advance and recognize them as income when
earned.
Shipping
and Handling
Amounts
billed to a customer in a sales transaction related to shipping and handling are
classified as revenue. Shipping and handling costs are included in cost of
services.
Advertising
Expense
Advertising
is expensed as incurred. Advertising expense charged to operations was
$1,043,000, $1,415,000 and $1,335,000 in 2009, 2008 and 2007,
respectively.
Cash
and Cash Equivalents
At
December 31, 2009, cash
equivalents totaled $2,420,000 including short-term investments with original
maturities of three months or less. The carrying value of cash and cash
equivalents approximates its fair value due to the short maturity of the
instruments. Our cash deposits may occasionally exceed federally insured limits.
Our commercial paper is valued using level 2 inputs which are observable inputs
other than quoted prices in active markets for identical assets and
liabilities.
Accounts
Receivable
As of
December 31, 2009, consolidated accounts receivable totaled $19,729,000, net of
the allowance for doubtful accounts. As of December 31, 2009, we believe
accounts receivable are recorded at their fair value. As there may be exposure
or risk with accounts receivable, we routinely monitor our accounts receivable
and adjust the allowance for doubtful accounts when certain events occur that
may potentially impact the collection of accounts receivable.
Allowance
for Doubtful Accounts
We
maintain allowances for doubtful accounts for estimated losses resulting from
the inability of our customers to make required payments. To estimate the
appropriate allowance for doubtful accounts, we consider specific accounts,
historical write-offs, changes in customer financial condition and credit
worthiness and concentrations of credit risk. Specific accounts receivable are
written off once we determine that the account is uncollectible. The allowance
for doubtful accounts was $643,000 and $905,000 as of December 31, 2009 and
2008, respectively.
Inventories
Inventory
includes parts, materials and supplies stored in our warehouses to support basic
levels of service and maintenance as well as scheduled capital projects and
equipment awaiting configuration for customers. Inventory also includes parts
and equipment shipped directly from vendors to customer locations while in
transit and parts and equipment returned from customers which is being returned
to vendors for credit, as well as maintenance contracts associated with customer
sales which have not yet transferred to the customer. The inventory value in the
Enventis Sector, comprised of finished goods in transit to customers as of
December 31, 2009 and December 31, 2008 was $2,770,000 and $5,110,000,
respectively. The inventory value in the Telecom Sector, comprised of raw
materials, as of December 31, 2009 and December 31, 2008 was $2,299,000 and
$3,564,000, respectively.
We value
inventory using the lower of cost (perpetual weighted average-cost or specific
identification) or market method. Similar to our allowance for doubtful
accounts, we make estimates related to the valuation of inventory. We adjust our
inventory carrying value for estimated obsolescence or unmarketable inventory to
the estimated market value based upon assumptions about future demand and market
conditions. As market and other conditions change, we may establish additional
inventory reserves.
Investments
Investments
include $2,612,000 of non-interest bearing Subordinated Capital Certificates
from RTFC and $1,694,000 from CoBank which are accounted for under the cost
method of accounting. This method requires us to periodically evaluate whether a
non-temporary decrease in the value of the investment has occurred, and if so,
to write this investment down to its net realizable value.
Property,
Plant and Equipment
Property,
plant and equipment are recorded at original cost of acquisition or
construction. Included in the Enventis property, plant and equipment is fiber
optic cable and indefeasible right of use of fiber installed by others
accompanied by ownership rights. Both of these categories of assets have
depreciable lives of 16 to 20 years. When regulated ILEC telephone assets are
sold or retired, the assets and related accumulated depreciation are removed
from the accounts and any gains or losses on disposition are amortized with the
remaining net investment in telephone plant. When other plant and equipment is
sold or retired, the cost and related accumulated depreciation or amortization
are removed from the respective accounts and any resulting gain or loss is
included in operating income. Maintenance and repairs are charged to expense as
incurred.
The
components of property, plant and equipment as of December 31, 2009 and 2008,
respectively are summarized as follows:
|
(Dollars
in thousands)
|
2009
|
2008
|
||||||
|
Enventis
property and equipment (1)
|
$ | 53,942 | $ | 41,235 | ||||
|
Enventis
indefeasable rights of use
|
5,394 | 5,394 | ||||||
|
Telecom
property and equipment
|
283,770 | 278,138 | ||||||
|
Other
property and equipment
|
14,501 | 13,743 | ||||||
|
Total
|
357,607 | 338,510 | ||||||
|
Accumulated
depreciation
|
(204,129 | ) | (187,157 | ) | ||||
|
Property,
plant, and equipment, net
|
$ | 153,478 | $ | 151,353 | ||||
|
(1)
Enventis property and equipment includes $3,986,000 of assets acquired
with CP Telecom.
|
||||||||
Depreciation for financial statement purposes is determined using the straight-line method based on the lives of the various classes of depreciable assets. The composite depreciation rates on ILEC telephone plant were 4.5%, 5.0% and 4.8% for 2009, 2008 and 2007, respectively. All other property, plant and equipment are depreciated over estimated useful lives of three to 20 years.
The
Telecom Sector leases certain computer equipment under capital lease
arrangements. We have recorded the present value or fair value of the future
minimum lease payments as a capitalized asset and related lease obligation.
Assets under this capital lease are included in property, plant and equipment
and amounted to $547,000 and $561,000 ($1,740,000 and $1,323,000 asset, net of
accumulated depreciation of $1,193,000 and $762,000) as of December 31, 2009 and
2008, respectively.
Capitalized
Software Costs
Software
costs associated with software that is developed or purchased for internal use
only are accounted for in accordance with ASC Topic 350 – Intangible–Goodwill
and Other, Subtopic 40 – Internal-Use Software. We capitalize costs (including
right to use fees) associated with acquired software for internal use. Costs
associated with internally developed software are segregated into three project
stages: preliminary project stage, application development stage and
post-implementation stage. Costs associated with both the preliminary project
stage and post-implementation stage are expensed as incurred. Costs associated
with the application development stage are capitalized. Software maintenance and
training costs are expensed as incurred. Amortization of software costs
commences when the software is ready for its intended use, and is amortized over
a period of three to ten years.
During
2009, 2008 and 2007, we capitalized $449,000, $134,000, and $403,000,
respectively, of costs associated with software purchased or developed for
internal use only. The 2009 costs primarily relate to redevelopment of our
corporate website and software purchased for desktop applications. The 2008
costs primarily relate to software purchased for enterprise software and desktop
applications. The 2007 costs primarily relate to software purchased to support
the Enventis Sector VoIP monitoring and managed services. Total capitalized
software for internal use of $8,686,000, $8,237,000 and $8,103,000 are included
in property, plant and equipment at December 31, 2009, 2008 and 2007,
respectively. Amortization expense relating to these costs amounted to $659,000,
$583,000 and $686,000 in 2009, 2008 and 2007, respectively, resulting in
accumulated amortization of $5,980,000, $5,321,000 and $4,727,000 at December
31, 2009, 2008 and 2007, respectively. Capitalized internal software costs, net
of accumulated amortization of $2,706,000, $2,916,000 and $3,376,000 are
included in property, plant and equipment at December 31, 2009, 2008 and 2007,
respectively.
Goodwill
and Intangible Assets
Goodwill
and intangible assets with indefinite useful lives are not amortized, but tested
for impairment at least annually. See Note 2 to the Notes to the Consolidated
Financial Statements for a more detailed discussion of the intangible assets and
goodwill. The carrying value of our goodwill and intangible assets increased in
2009 due to our acquisition of CP Telecom. Our goodwill balance was $27,423,000
and $25,239,000 as of December 31, 2009 and 2008, respectively. We expect
$25,239,000 of the $27,423,000 goodwill balance to be deductible for tax
purposes. As of December 31, 2009 and 2008, we completed our annual impairment
tests for acquired goodwill. This testing resulted in no impairment charges to
goodwill. Our acquisition price for CP Telecom included intangible assets of
$1,070,000 in customer relationships and contracts and $2,100,000 of other
intangibles including long-term lease rights to a fiber network. The valuations
of intangible assets obtained in our CP Telecom acquisition were evaluated with
the assistance of a study performed by an independent valuation
expert.
Long-Lived
Assets
We review
long-lived assets for impairment if certain events or changes in circumstances
indicate that impairment may be present. Impairment exists if the carrying value
of a long-lived asset exceeds the sum of the undiscounted cash flows expected to
result from the use and eventual disposal of the asset at the date it is
tested.
Accrued
Incentive Compensation
Our
employee incentive compensation plans provide for distributions based on
achievement of specific organizational operating results or individual employee
objectives. Accrued expenses included amounts accrued for employee incentive
compensation of $1,765,000 and $1,777,000 at December 31, 2009 and December 31,
2008, respectively.
Income
Taxes
We
account for income taxes in accordance with ASC Topic 740 – Income Taxes, which
requires an asset and liability approach to financial accounting and reporting
for income taxes. Accordingly, deferred tax assets and liabilities arise from
the difference between the tax basis of an asset or liability and its reported
amount in the financial statements. Deferred tax amounts are determined using
the tax rates expected to be in effect when the taxes will actually be paid or
refunds received, as provided under currently enacted tax law. Valuation
allowances are established when necessary to reduce deferred tax assets to the
amount expected to be realized. Income tax expense or benefit is the tax payable
or refundable, respectively, for the period plus or minus the change in deferred
tax assets and liabilities during the period.
ASC 740
requires us to recognize the financial statement benefit of a tax position only
after determining that the relevant tax authority would more likely than not
sustain the position following an audit. For tax positions meeting the more
likely than not threshold, the amount recognized in the financial statements is
the largest benefit that has a greater than 50% likelihood of being realized
upon ultimate settlement with the relevant tax authority. See Note 11 to the
Notes to the Consolidated Financial Statements for additional information
regarding income taxes.
Post-Retirement
Benefits
We
provide retirement savings benefits and post-retirement health care and life
insurance benefits for eligible employees. We are not currently funding these
post-retirement benefits, but have accrued these liabilities. The
post-retirement benefit expense and liability are calculated utilizing various
actuarial assumptions and methodologies. These assumptions include, but are not
limited to, the discount rate and the expected health care cost trend
rate.
Post-retirement
benefits were calculated using the following methods specified in ASC Topic 715
– Compensation – Retirement Benefits, Subtopic 10 – Overall, Subtopic 20 –
Defined Benefit Plans – General and Subtopic 60 – Defined Benefit Plans – Other
Postretirement. Any prior service cost or cumulative net gains and losses in
excess of 10% of the Topic 715 corridor are amortized on a straight-line basis
over the average future service lives of the covered group. There are no
substantive commitments for benefits other than as stated in the written plan.
The assumed discount rate represents the discounted value of necessary future
cash flows required to pay the accumulated benefits when due. The rate was
determined based on available market data regarding the spot rate yields in half
year increments on high-quality fixed income securities with the effects of puts
and calls removed that provide cash flows at the same time and in the same
amount as the projected cash flows of the plan.
The
health care cost trend rate is based upon an evaluation of the historical trends
and experience, taking into account current and expected market conditions. The
health care cost trend rate represents the expected annual rate of change in the
cost of health care benefits currently provided due to factors other than
changes in the demographics of plan participants. If the assumptions utilized in
determining the post-retirement benefit expense and liability differ from actual
events, the results of operations for future periods could be impacted. When
actual events differ from the assumptions or when the assumptions used change,
an unrecognized actuarial gain or loss results.
Stock
Compensation
We apply
a fair value based measurement method in accounting for share based payment
transactions with employees and record compensation cost for all stock awards
granted. Compensation charges are realized when management concludes
it is probable that the participant will earn the award and recognized during
the service period specified by the stock award plan.
Share-based
compensation expense recognized during a period is based on the value of the
portion of share-based payment awards that are ultimately expected to vest
during the period. Share-based compensation expense recognized in the
Consolidated Statements of Operations includes compensation expense for
share-based payment awards granted prior to, but not yet vested as of December
31, 2005, based on the grant date fair value estimated in accordance with the
fair value provisions of ASC Topic 718. Because share-based compensation expense
recognized in the Consolidated Statements of Operations is based on awards
ultimately expected to vest, it has been reduced for estimated forfeitures. We
use historical data to estimate pre-vesting forfeitures. ASC 718 requires
forfeitures to be estimated at the time of grant and revised, if necessary, in
subsequent periods if actual forfeitures differ from those
estimates.
The fair
value of each option award is estimated on the date of grant using a
Black-Scholes option valuation model. We use a seven-year period to calculate
the historical volatility of its stock price for use in the valuation model. The
dividend yield rate is based on our current dividend payout pattern and current
market price. The risk-free rate for options is based on a U.S. Treasury rate
commensurate with the expected terms. The expected term of options granted is
derived from historical experience and represents the period of time that
options granted are expected to be outstanding. See Note 7 to the Notes to the
Consolidated Financial Statements for more information regarding stock-based
compensation.
Earnings
Per Share
Basic
earnings per share are computed by dividing net income by the weighted average
number of shares of common stock outstanding during the year. Shares used in the
earnings per share assuming dilution calculation are based on the weighted
average number of shares of common stock outstanding during the year increased
by potentially dilutive common shares. Potentially dilutive common shares
include stock options and stock subscribed under the HickoryTech Corporation
Amended and Restated Employee Stock Purchase Plan. Dilution is determined using
the treasury stock method.
|
(Dollars
in thousands, except share and earnings per share amounts)
|
2009
|
2008
|
2007
|
|||||||||
|
Net
Income
|
$ | 11,273 | $ | 8,029 | $ | 8,611 | ||||||
|
Weighted
Average Shares Outstanding
|
13,061,266 | 13,248,731 | 13,258,369 | |||||||||
|
Stock
Options (dilutive only)
|
595 | 958 | 1,718 | |||||||||
|
Stock
Subscribed (ESPP)
|
- | 10,244 | - | |||||||||
|
Total
dilutive shares outstanding
|
13,061,861 | 13,259,933 | 13,260,087 | |||||||||
|
Earnings
per share:
|
||||||||||||
|
Basic
|
$ | 0.86 | $ | 0.61 | $ | 0.65 | ||||||
|
Diluted
|
$ | 0.86 | $ | 0.61 | $ | 0.65 | ||||||
Options to purchase 395,950 shares as of December 31, 2009, 456,200 shares as of December 31, 2008 and 441,000 shares as of December 31, 2007 were not included in the computation of earnings per share assuming dilution because their effect on earnings per share would have been anti-dilutive.
Dividends
per share are based on the quarterly dividend per share as declared by the
HickoryTech Board of Directors.
Recent Accounting
Developments
Issued in
January 2010, ASU Update 2010-06, Fair Value Measures and
Disclosures, provides amendments to Topic 820 that will provide more robust
disclosures about (1) the different classes of assets and liabilities measured
at fair value, (2) the valuation techniques and inputs used, (3) the activity in
level 3 fair value measurements, and (4) the transfers between levels 1, 2, and
3. ASC Update 2010-06 is effective for fiscal years beginning after
December 15, 2010. We do not expect adoption of ASU Update 2010-06 to have
a material effect to our financial statements or our disclosures.
Issued in
October 2009, ASU Update 2009-13, Revenue Recognition Topic 605 -
Multiple-Deliverable Revenue Arrangements provides guidance for separating
consideration in multiple-deliverable arrangements. ASC Number 2009-13 is
effective for fiscal years beginning on or after June 15, 2010. We do not expect
adoption of ASU Update 2009-13 to have a material effect on our financial
statements.
Issued in
December 2008, the FASB issued the disclosure requirements within ASC 715
providing guidance on an employer’s disclosures about plan assets of a defined
benefit pension or post-retirement plan. Disclosure requirements within ASC 715
are effective for fiscal years beginning after December 15, 2009, and will be
adopted by us in the first quarter of 2010. Additional disclosures required
within ASC 715 are not expected to have a material effect on our
disclosures.
Effective
February 2010, we adopted ASU Update 2010-09, Subsequent
Events,which provides amendments to Topic 855 removing the requirement
for SEC filers to disclose the date through which an entity has evaluated
subsequent events. The adoption of ASU Update 2010-09 did not have a significant
impact on our disclosures.
Effective
October 1, 2009, we adopted ASU Update 2009-05, Fair Value Measurement and
Disclosures Topic 820 which provides further guidance on the fair value
measurement of liabilities. The adoption of ASU 2009-05 did not have a material
effect on our consolidated financial statements.
Effective
September 15, 2009, we adopted ASC 105 making the FASB Accounting Standards
Codification, (“Codification”) the single source of authoritative
nongovernmental U.S. generally accepted accounting principles. Rules and
interpretive releases of the SEC under authority of federal securities laws are
also sources of authoritative GAAP for SEC registrants. All other accounting
literature not included in the Codification is non-authoritative.
Effective
June 15, 2009, we adopted disclosure requirements within ASC 825, which require
fair value disclosures in both interim as well as annual financial statements in
order to provide more timely information about the effects of the current market
conditions on financial instruments. Requirements within ASC 825 did not have a
significant impact on our disclosures.
Effective
June 15, 2009, we adopted requirements within ASC 855 which establishes general
standards of accounting for and disclosure of events that occur after the
balance sheet date, but before financial statements are issued or are available
to be issued. ASC 855 sets forth (1) the period after the balance sheet date
during which management of a reporting entity should evaluate events or
transactions that may occur for potential recognition or disclosure in the
financial statements, (2) the circumstances under which an entity should
recognize events or transactions occurring after the balance sheet date in its
financial statements, and (3) the disclosures that an entity should make about
events or transactions that occurred after the balance sheet date. The adoption
of the requirements within ASC 855 did not have a material effect on our
consolidated financial statements. Subsequent events have been evaluated through
the filing date of this Annual Report on Form 10-K.
Effective
January 1, 2009, we adopted requirements within ASC 805 which establish
principles and requirements for how an acquirer recognizes and measures in its
financial statements, the identifiable assets acquired, the liabilities assumed
and any non-controlling interest in the acquired company and the goodwill
acquired. ASC 805 also establishes disclosure requirements to enable the
evaluation of the nature and financial effects of the business combination. The
adoption of the requirements within ASC 805 did not have a material effect on
our consolidated financial statements.
Effective
January 1, 2009, we adopted disclosure requirements within ASC 815 requiring
enhanced disclosures about an entity’s derivative and hedging activities in
order to improve the transparency of financial reporting. The adoption of the
disclosure requirements within ASC 815 did not have a significant impact on our
disclosures.
Effective
January 1, 2009, we adopted the requirements within ASC 820 related to our
non-financial assets and non-financial liabilities. This adoption requires
us to provide additional disclosures related to the valuation of non-financial
assets and liabilities that occur during the year, primarily goodwill
impairment. The adoption of these requirements within ASC 820 did not have a
significant impact on our disclosures.
Note
2. Goodwill and Other Intangible Assets
We have
goodwill in two of our reporting units. In our Enventis Sector, we
have $4,375,000 of goodwill carrying value as of December 31, 2009, resulting
from our acquisition of Enventis Telecom in 2005 and our acquisition of CP
Telecom in 2009. In our Telecom Sector, we have $23,048,000 of goodwill carrying
value as of December 31, 2009, resulting from our acquisition of Heartland
Telecommunications in 1997. The changes to goodwill in 2009 are summarized
below.
|
(Dollars
in thousands)
|
2009
|
|||
|
Goodwill
as of December 31, 2008
|
$ | 25,239 | ||
|
Goodwill
adjustments associated with the purchase of CP Telecom
|
2,184 | |||
|
Goodwill
as of December 31, 2009
|
$ | 27,423 | ||
Goodwill assets are not amortized, but are subject to an impairment test annually, as well as upon certain events that indicate that impairment may be present. We use a fair value approach when reviewing our goodwill for potential impairment testing. Using goodwill impairment tests, as guided by ASC Topic 350 – Intangibles–Goodwill and Other we determined there were no instances where fair value had fallen below the asset carrying value in any of our reporting units during 2009 or 2008. We make estimates of the fair value of the assets in our reporting units based on application of a discounted cash flow analysis, using the best available information at the time estimation of fair value is made. Our estimates of fair value could change based on general market or industry conditions, or the performance of our specific assets, and could result in a determination of impairment charges to reduce the carrying value of goodwill in our reporting units in the future.
The fair
value of assets including goodwill which are covered by the impairment tests is
in excess of the asset carrying value for all of our reporting
units. We have concluded that no asset impairment valuation charges
are warranted.
Our
acquisition price for CP Telecom included intangible assets of $1,070,000 in
customer relationships and contracts and $2,100,000 of other intangibles
including long-term lease rights to a fiber network. The valuations of
intangible assets obtained in our CP Telecom acquisition were evaluated with the
assistance of a study performed by an independent valuation expert.
Intangible
assets with finite lives are amortized over their respective estimated useful
lives to their estimated residual values. Identifiable intangible assets that
are subject to amortization are evaluated for impairment. The components of
intangible assets are as follows:
|
(Dollars
in thousands)
|
As
of December 31, 2009
|
As
of December 31, 2008
|
|||||||||||||||
|
Useful
Lives
|
Gross
Carrying Amount
|
Accumulated
Amortization
|
Gross
Carrying Amount
|
Accumulated
Amortization
|
|||||||||||||
|
Definite-lived
intangible assets
|
|||||||||||||||||
|
Customer
relationships
|
1 -
8 years
|
$ | 5,299 | $ | 4,318 | $ | 4,229 | $ | 3,379 | ||||||||
|
Other
intangibles
|
1 -
5 years
|
2,830 | 786 | 730 | 724 | ||||||||||||
|
Total
|
$ | 8,129 | $ | 5,104 | $ | 4,959 | $ | 4,103 | |||||||||
As outlined by ASC Topic 350 – Intangibles— Goodwill and Other, we periodically reassess the carrying value, useful lives and classifications of identifiable assets. Amortization expense related to the definite-lived intangible assets for 2009, 2008 and 2007 was $1,001,000, $1,127,000, and $1,157,000, respectively. Total estimated amortization expense for the five years subsequent to 2009 is as follows: 2010 - $357,000; 2011 - $354,000; 2012 - $354,000; 2013 – $354,000; 2014 - $265,000.
Note
3. Disposition and Acquisition
Disposition
Effective
December 31, 2006, we sold all of the outstanding capital stock in Collins to
Skyview Capital, LLC. The Collins results of operations were formerly reported
in the Enterprise Solutions Sector. The consolidated statements of operations
for all periods reflect the Collins operations as discontinued
operations.
Acquisition
On August
1, 2009, we purchased all of the capital stock of CP Telecom for an adjusted
purchase price of $6,625,000 to grow our small to medium sized business customer
base. This acquisition was funded with cash on hand. CP Telecom was formerly a
privately held facilities-based telecom provider serving Minneapolis, St. Paul
and northern Minnesota.
The table
below sets forth the final CP Telecom purchase price allocation. The fair value
of the property and equipment were determined based on level 1 inputs. The
valuation of intangible assets was evaluated using level 2 inputs. The valuation
of net working capital and other assets and liabilities were evaluated using
level 3 inputs.
|
(Dollars
in thousands)
|
2009 | ||||
|
Property
and equipment
|
$ | 3,986 | |||
|
Identifiable
intangible assets:
|
|||||
| Customer relationships and contracts |
|
1,070 | |||
| Supplier relationship |
|
2,100 | |||
|
Goodwill
|
2,184 | ||||
|
Other
assets and liabilities
|
(653 | ) | |||
|
Deferred
income tax
|
(2,062 | ) | |||
|
Allocation
of purchase consideration
|
$ | 6,625 | |||
Of the identified intangible assets above, customer relationships and contracts have useful lives of five years and the supplier relationship has a useful life of 15 years. Useful lives for identifiable intangible assets were estimated at the time of the acquisition based on the periods of time from which we expect to derive benefits from the identifiable intangible assets. The identifiable intangible assets are amortized using the straight-line method, which reflects the pattern in which the assets are consumed.
Goodwill
from our CP Telecom acquisition is a result of the value of acquired employees
along with the expected synergies from the combination of CP Telecom and our
operations. Goodwill resulting from the acquisition of CP Telecom is not
deductible for tax purposes.
CP
Telecom operations have been integrated with our Enventis fiber and data product
line. While complete identifiable operational results attributable to the CP
Telecom business are not available, revenue from August 1, 2009 through December
31, 2009 was approximately $3,800,000 and is included in our results of
operations.
Note
4. Fair Value of Financial Instruments
The fair
value of our long-term obligations, after deducting current maturities, is
estimated to be $127,637,000 at December 31, 2009 and $132,157,000 at December
31, 2008, compared to carrying values of $119,871,000 and $125,384,000,
respectively. The fair value estimates are based on the overall weighted average
interest rates and maturity compared to rates and terms currently available in
the long-term financing markets. Our financial instruments also include cash
equivalents, trade accounts receivable, and accounts payable for which current
carrying amounts approximate fair market value.
Note
5. Accumulated Other Comprehensive Income (Loss)
We follow
the provisions of ASC Topic 220 – Comprehensive Income, which established rules
for the reporting of comprehensive income (loss) and its components. In addition
to net income, our comprehensive income includes changes in the market value of
the cumulative unrealized gain or loss, net of tax, on financial derivative
instruments qualifying and designated as cash flow hedges and unrecognized Net
Periodic Benefit Cost related to our Post-Retirement Benefit Plans.
Comprehensive income for the year ended December 31, 2009 and 2008 was
$10,100,000 and $5,843,000, respectively.
In March
2007, we terminated our two outstanding interest-rate swap agreements with
original maturities in June 2008, in exchange for $1,936,000 in proceeds.
Immediately following the termination of these two agreements, we executed a new
interest-rate swap agreement, effectively locking in the interest rate on
$60,000,000 of variable-interest rate debt through March 2010. In March 2008, we
entered into a second interest-rate swap agreement, effectively locking in the
interest rate on an additional $40,000,000 of variable interest rate debt
through February 2010. Due to the February and March 2010 expirations on the
above swaps, we entered into an interest-rate swap agreement in March 2009,
effectively locking in the interest rate on $80,000,000 from March 2010 to
September 2011.The cumulative gain or (loss) on the market value of financial
derivative instruments is reported as a component of accumulated other
comprehensive income (loss) in shareholders’ equity.
The
following summary sets forth the components of accumulated other comprehensive
income (loss), net of tax:
|
Unrecognized
|
Unrecognized
|
Unrecognized
|
Unrealized
|
Accumulated
Other
|
||||||||||||||||
|
Net
Actuarial
|
Prior
Service
|
Transition
|
Gain/(Loss)
|
Comprehensive
|
||||||||||||||||
|
(Dollars
in thousands)
|
Loss
(1)
|
Credit (1)
|
Asset
(1)
|
on
Derivatives
|
Income/(Loss)
|
|||||||||||||||
|
December
31, 2006
|
$ | (867 | ) | $ | 37 | $ | (217 | ) | $ | 1,497 | $ | 450 | ||||||||
|
2007
Activity
|
(87 | ) | 242 | 36 | (1,708 | ) | (1,517 | ) | ||||||||||||
|
December
31, 2007
|
(954 | ) | 279 | (181 | ) | (211 | ) | (1,067 | ) | |||||||||||
|
2008
Activity
|
(421 | ) | (33 | ) | 36 | (1,768 | ) | (2,186 | ) | |||||||||||
|
December
31, 2008
|
(1,375 | ) | 246 | (145 | ) | (1,979 | ) | (3,253 | ) | |||||||||||
|
2009
Activity
|
(2,005 | ) | (33 | ) | 36 | 829 | (1,173 | ) | ||||||||||||
|
December
31, 2009
|
$ | (3,380 | ) | $ | 213 | $ | (109 | ) | $ | (1,150 | ) | $ | (4,426 | ) | ||||||
|
(1) Amounts pertain to
our post-retirement benefit plans.
|
||||||||||||||||||||
The
increase (decrease) in income tax benefits associated with each component of
accumulated other comprehensive income (loss) is as follows:
|
(Dollars
in thousands)
|
2009
|
2008
|
2007
|
|||||||||
|
Income
tax (liability) related to OCI components
|
||||||||||||
| beginning of year | $ | 2,150 | $ | 1,141 | $ | (301 | ) | |||||
|
Income
tax (liability) changes related to:
|
||||||||||||
| Unrecognized net actuarial loss | 1,327 | 281 | 57 | |||||||||
| Unrecognized prior service credit | 21 | 21 | (159 | ) | ||||||||
| Unrecognized transition asset | (24 | ) | (24 | ) | (24 | ) | ||||||
| Unrecognized gain (loss) on derivatives | (548 | ) | 731 | 1,568 | ||||||||
|
Income
tax related to OCI components end of year
|
$ | 2,926 | $ | 2,150 | $ | 1,141 | ||||||
Note 6. Business Segments
Our
operations are conducted in two business segments as: (i) Enventis Sector and
(ii) Telecom Sector.
Enventis
serves business customers across a five-state region with IP-based voice,
transport, data and network solutions, managed services, network integration and
support services. Enventis specializes in providing integrated unified
communication solutions for businesses of all sizes - from enterprise
multi-office organizations to small and medium-sized businesses, primarily in
the upper Midwest. Enventis also provides fiber and data services to wholesale
service providers, such as national and regional carriers and wireless carriers
within the telecommunications business. Enventis is focused on providing
services specifically to business customers.
The
Telecom Sector provides telephone services to Mankato and adjacent areas of
south central Minnesota and to eleven rural communities in northwest Iowa as an
ILEC. The Telecom Sector operates fiber optic cable transport facilities in
Minnesota and Iowa. The Telecom Sector offers an alternative choice for local
telecommunications service, known as CLEC service in the telecommunications
industry, to customers in Minnesota and Iowa not currently in HickoryTech’s ILEC
service area. In addition, the Telecom Sector resells long distance service to
Minnesota and Iowa subscribers in its ILEC and CLEC markets. The Telecom Sector,
through NIBI, also provides data processing and related services to
HickoryTech’s other product lines and to other external telephone companies,
municipalities, utilities and wireless and cable TV providers.
Business
segment information for the years ended December 31, 2009, 2008 and 2007 is as
follows:
|
For
Year Ended December 31
|
||||||||||||||||
|
(Dollars
in thousands)
|
||||||||||||||||
|
|
||||||||||||||||
|
2009
|
Enventis
|
Telecom
|
Corporate
and Eliminations
|
Consolidated
|
||||||||||||
|
Revenue
from unaffiliated customers
|
$ | 68,683 | $ | 70,419 | $ | - | $ | 139,102 | ||||||||
|
Intersegment
revenue
|
500 | 1,217 | (1,717 | ) | - | |||||||||||
|
Total
operating revenue
|
69,183 | 71,636 | (1,717 | ) | 139,102 | |||||||||||
|
Depreciation
and amortization
|
5,413 | 15,680 | 84 | 21,177 | ||||||||||||
|
Operating
income (loss)
|
5,627 | 13,587 | (629 | ) | 18,585 | |||||||||||
|
Interest
expense
|
2 | 95 | 6,821 | 6,918 | ||||||||||||
|
Income
taxes
|
2,299 | 5,451 | (7,251 | ) | 499 | |||||||||||
|
Income
(loss) from continuing operations
|
3,362 | 8,068 | (157 | ) | 11,273 | |||||||||||
|
Identifiable
assets
|
72,856 | 140,494 | 9,133 | 222,483 | ||||||||||||
|
Property,
plant and equipment, net
|
46,867 | 106,328 | 283 | 153,478 | ||||||||||||
|
Capital
expenditures
|
8,738 | 9,068 | 87 | 17,893 | ||||||||||||
|
For
Year Ended December 31
|
||||||||||||||||
|
(Dollars
in thousands)
|
||||||||||||||||
|
|
||||||||||||||||
|
2008
|
Enventis
|
Telecom
|
Corporate
and Eliminations
|
Consolidated
|
||||||||||||
|
Revenue
from unaffiliated customers
|
$ | 79,976 | $ | 73,199 | $ | - | $ | 153,175 | ||||||||
|
Intersegment
revenue
|
515 | 644 | (1,159 | ) | - | |||||||||||
|
Total
operating revenue
|
80,491 | 73,843 | (1,159 | ) | 153,175 | |||||||||||
|
Depreciation
and amortization
|
4,417 | 16,136 | 53 | 20,606 | ||||||||||||
|
Operating
income
|
7,024 | 13,045 | 157 | 20,226 | ||||||||||||
|
Interest
expense
|
- | 85 | 6,785 | 6,870 | ||||||||||||
|
Income
taxes
|
2,660 | 4,879 | (2,119 | ) | 5,420 | |||||||||||
|
Income
(loss) from continuing operations
|
4,369 | 8,104 | (4,444 | ) | 8,029 | |||||||||||
|
Identifiable
assets
|
68,481 | 148,238 | 8,789 | 225,508 | ||||||||||||
|
Property,
plant and equipment, net
|
38,575 | 112,497 | 281 | 151,353 | ||||||||||||
|
Capital
expenditures
|
6,408 | 11,102 | 181 | 17,691 | ||||||||||||
|
|
||||||||||||||||
|
2007
|
Enventis
|
Telecom
|
Corporate
and Eliminations
|
Consolidated
|
||||||||||||
|
Revenue
from unaffiliated customers
|
$ | 79,802 | $ | 76,847 | $ | - | $ | 156,649 | ||||||||
|
Intersegment
revenue
|
440 | 467 | (907 | ) | - | |||||||||||
|
Total
operating revenue
|
80,242 | 77,314 | (907 | ) | 156,649 | |||||||||||
|
Depreciation
and amortization
|
3,755 | 15,218 | 31 | 19,004 | ||||||||||||
|
Operating
income (loss)
|
6,904 | 17,796 | (1,520 | ) | 23,180 | |||||||||||
|
Interest
expense
|
- | 72 | 8,049 | 8,121 | ||||||||||||
|
Income
taxes
|
2,904 | 7,287 | (3,480 | ) | 6,711 | |||||||||||
|
Income
(loss) from continuing operations
|
4,074 | 10,460 | (5,899 | ) | 8,635 | |||||||||||
|
Identifiable
assets
|
66,842 | 152,961 | 7,692 | 227,495 | ||||||||||||
|
Property,
plant and equipment, net
|
35,700 | 117,078 | 153 | 152,931 | ||||||||||||
|
Capital
expenditures
|
5,928 | 11,489 | 83 | 17,500 | ||||||||||||
NOTE 7. STOCK COMPENSATION
Employee
Stock Purchase Plan
Under the
terms of our employee stock purchase plan, participating employees may acquire
shares of common stock through payroll deductions of not more than 10% of their
compensation. The price at which shares can be purchased is 85% of the fair
market value for shares on one specified date, the end of the plan year. As of
December 31, 2009, there were 500,000 common shares reserved for this plan and
441,655 shares still available for issuance. As of December 31, 2009 employees
had subscribed to purchase approximately 21,477 shares for the plan year ended
August 31, 2010. Employees purchased 20,561 shares for the plan year ended
August 31, 2009. We recorded stock compensation expense in the amount of
$27,000, $26,000 and $24,000 during 2009, 2008 and 2007 respectively, related to
this plan.
Retainer
Stock Plans for Directors
Under the
terms of a corporate retainer stock plan for directors, participating directors
may acquire shares of common stock in exchange for their quarterly retainers.
The price at which the shares can be purchased is 100% of the fair market value
for such shares on the date of purchase. In 2009, in addition to any voluntary
acquisitions of shares in exchange for quarterly retainers, directors received
$7,500 of their annual retainer solely in shares of HickoryTech stock from this
plan. As of December 31, 2009, there were 300,000 common shares reserved for
this plan and 203,498 shares still available for future issuance. Beginning in
January 2010, directors will receive $25,000 of their annual retainer solely in
shares of HickoryTech stock.
Non-Employee
Directors’ Incentive Plan
Beginning
in May 2005, we began offering a Directors’ Incentive Plan to attract and retain
outside directors. The plan provides for each director to receive 2,000 shares
of our common stock contingent upon HickoryTech meeting pre-established
objectives. The plan paid out 20,000 shares, 18,000 shares and 0 shares in 2009,
2008, and 2007, respectively. As of December 31, 2009 there were 200,000 common
shares reserved for this plan and 152,000 shares available for future grants.
This plan was discontinued as of January 1, 2010. Undistributed shares reserved
for this plan will no longer be available for use.
Stock
Award Plan
HickoryTech’s
stock award plan provides for the granting of non-qualified stock options, stock
awards and restricted stock awards to employees. The plan provides for stock
awards based on the attainment of certain financial targets and for individual
achievements. Stock options issued under the stock option component of the stock
award plan may be exercised no later than ten years after the date of grant,
with one-third of the options vesting each year. As of December 31, 2009, there
were 1,750,000 common shares reserved for this plan
and 976,865 shares available for future grants.
We
recognize stock compensation charges related to stock award plans when
management concludes it is probable that the participant will earn the award.
Such compensation charges are recorded based upon the fair value of our stock
and is recognized during the service period specified by the stock award plan.
Changes in estimated compensation are recorded in the period in which the change
occurs. Stock based compensation expense recognized was $1,021,000, $415,000 and
$688,000 in 2009, 2008 and 2007, respectively. Stock based compensation expense
recognized in 2009 primarily increased due to the increase in our stock price
from $5.44 as of December 31, 2008 to $8.83 as of December 31,
2009.
As of
December 31, 2009, all compensation costs related to stock options granted under
the Company’s Stock Award Plan have been recognized.
Stock
options, last granted in September 2006, are fully vested as of December 31,
2009. The Stock Award Plan provides for the issuance of stock options, but no
current compensation plans have options as a component.
A summary
of all stock option activity for the three-year period ended December 31, 2009
is as follows:
|
Options
|
Weighted
Average Exercise Price
|
|||||||||||||||||||||||
|
2009
|
2008
|
2007
|
2009
|
2008
|
2007
|
|||||||||||||||||||
|
Outstanding
at Beginning of Year
|
471,200 | 476,000 | 515,884 | $ | 12.79 | $ | 12.79 | $ | 12.75 | |||||||||||||||
|
Granted
|
- | - | - | - | - | - | ||||||||||||||||||
|
Exercised
|
- | - | - | - | - | - | ||||||||||||||||||
|
Forfeited
|
- | - | (499 | ) | - | - | 10.76 | |||||||||||||||||
|
Expired
|
(40,250 | ) | (4,800 | ) | (39,385 | ) | 11.87 | 13.38 | 12.22 | |||||||||||||||
|
Outstanding
at End of Year
|
430,950 | 471,200 | 476,000 | $ | 12.87 | $ | 12.79 | $ | 12.79 | |||||||||||||||
|
Exercisable
at End of Year
|
430,950 | 466,200 | 454,335 | $ | 12.87 | $ | 12.85 | $ | 12.97 | |||||||||||||||
|
Fair
Value of Options Vesting During the Year
|
$ | 7,000 | $ | 41,000 | $ | 156,000 | ||||||||||||||||||
The following table provides certain information with respect to stock options outstanding and exercisable at December 31, 2009:
|
Range
of
|
Stock
Options
|
Stock
Options
|
Weighted
Average
|
Weighted
Average Remaining
|
|||||||||||
|
Exercise
Prices
|
Outstanding
|
Exercisable
|
Exercise
Price
|
Contractual
Life
|
|||||||||||
| $6.00 - $8.00 | 15,000 | 15,000 | $ | 6.95 |
6.7
years
|
||||||||||
| $8.00 - $12.00 | 156,950 | 156,950 | 10.22 |
3.9
years
|
|||||||||||
| $12.00 - $16.00 | 205,250 | 205,250 | 13.95 |
1.3
years
|
|||||||||||
| $16.00 - $21.00 | 53,750 | 53,750 | 18.18 |
1.2
years
|
|||||||||||
| 430,950 | 430,950 | $ | 12.87 |
2.4
years
|
|||||||||||
|
Aggregate
Intrinsic Value
|
$ | 44,000 | |||||||||||||
Note 8. Extended Term Payable
The
Enventis Sector has a $20,000,000 wholesale financing agreement with a financing
company to fund the equipment provisioning portion of the equipment sales
product line from certain approved vendors. Advances under this financing
arrangement are collateralized by the accounts receivable and inventory of
Enventis and a guaranty of an amount up to $18,000,000 by HickoryTech. The
financing agreement provides 60 day interest-free payment terms for working
capital and can be terminated at any time by either party. The balance
outstanding under the financing arrangement was $6,788,000 and $10,474,000 at
December 31, 2009 and 2008, respectively. These balances are classified as
current liabilities in the accompanying Balance Sheets and are not considered
part of our debt financing.
Note
9. Debt and Other Obligations
Our
long-term obligations as of December 31, 2009 were $119,871,000, excluding
current maturities of $200,000 on debt and $420,000 on current maturities of
capital leases. Long-term obligations as of December 31, 2008 were $125,384,000
excluding current maturities of $1,300,000 on debt and $321,000 of capital
leases.
|
As
of December 31
|
||||||||
|
(Dollars
in thousands)
|
2009
|
2008
|
||||||
|
Credit
facility, average interest at 5.5%, maturing in varying amounts
through 2013
|
$ | 119,900 | $ | 126,400 | ||||
|
Capitalized
lease obligations, average interest at 11.4%, maturing March
2011
|
591 | 605 | ||||||
|
Total
|
120,491 | 127,005 | ||||||
|
Less
current maturities
|
620 | 1,621 | ||||||
|
Long-term
obligations
|
$ | 119,871 | $ | 125,384 | ||||
On
December 30, 2005, we entered into a $160,000,000 credit agreement with a
syndicate of banks (subsequently reduced to a $149,780,000 facility as of
December 31, 2009 through normal quarterly amortization), which amended our
previous credit facility. The credit facility is comprised of a $30,000,000
revolving credit component ($29,880,000 available to borrow as of December 31,
2009) that expires on December 31, 2011 and a $130,000,000 term loan component
(subsequently reduced to $119,900,000 as of December 31, 2009 through normal
quarterly amortization).
The term
loan is comprised of two components which are defined as term loan B and term
loan C. The outstanding principal balance of term loan B is $100,700,000 as of
December 31, 2009, and is held in varying amounts by three lenders in the
syndicate, US Bank, GE Commercial Distribution Finance Corporate and CoBank.
Under the terms of term loan B, we are required to make quarterly principal
payments of $275,000 from December 31, 2009 through December 31, 2011 with
the remainder of the aggregate principal due in two payments on March 31,
2012 and June 30, 2012. Due to the pay down of debt in 2009, we will not be
required to make quarterly principal payments in 2010. The outstanding principal
balance of term loan C is $19,200,000 as of December 31, 2009, and is held
entirely by RTFC. Under the terms of term loan C, we are required to make
quarterly principal payments of $50,000 on the aggregate principal amount from
December 31, 2009 through December 31, 2012 with the remainder of the
aggregate principal due in two payments on March 31, 2013 and June 30,
2013.
The term
loan component has a provision whereby we periodically receive patronage capital
refunds. This patronage refund is recorded as an offset to interest expense and
amounted to $512,000 in 2009, $563,000 in 2008 and $230,000 in
2007.
Our
credit facility requires us to comply, on a consolidated basis, with specified
financial ratios and tests. These financial ratios and tests include maximum
leverage ratio and maximum capital expenditures. The terms of our credit
facility include certain restrictions regarding the payment of dividends. The
dividend restriction provides that we will not make dividend distributions or
repurchase stock in an aggregate amount in excess of 100% of the previous year’s
net income. At December 31, 2007, we were in violation of this dividend
restriction, but a waiver was obtained. At December 31, 2009, we were in full
compliance with our debt covenants.
Our
obligations under the credit facility are secured by a first-priority lien on
all property and assets, tangible and intangible of HickoryTech and its current
subsidiaries, including, but not limited to accounts receivable, inventory,
equipment and intellectual property, general intangibles, cash and proceeds of
the foregoing. We have also given a first-priority pledge of the capital stock
of our current subsidiaries to secure the credit facility. The credit facility
contains certain restrictions that, among other things, limit or restrict our
ability to create liens or encumbrances; incur additional debt; issue stock;
make asset sales, transfers, or dispositions; and engage in mergers and
acquisitions over a specified maximum value.
The
credit facility also requires us to maintain interest rate protection agreements
on at least 50% of the term loan components outstanding balance in order to
manage our exposure to interest rate fluctuations. We continually monitor the
interest rates on our bank loans. We currently have fixed interest rates on
$19,200,000 of our debt with these rates expiring in February 2010. Listed below
are our current interest-rate swap agreements which lock in our interest rates
on existing variable-interest rate debt.
|
Interest-Rate
Swap Agreement Effective Dates
|
Coverage
Amount
|
Rate
|
||||||
|
March
2007 - March 2010
|
$ | 60,000,000 | 4.89 | % | ||||
|
March
2008 - February 2010
|
$ | 40,000,000 | 2.54 | % | ||||
|
March
2010 - September 2011
|
$ | 80,000,000 | 2.15 | % | ||||
Our effective interest rate was 5.47%, 5.22% and 5.97% in 2009, 2008 and 2007, respectively. Annual requirements for principal payments for the years subsequent to 2009 are as follows: 2010 - $200,000; 2011 - $1,300,000; 2012 - $99,800,000; and 2013 - $18,600,000.
Note
10. Employee Retirement Benefits
Employees
who meet certain service requirements are covered under a defined contribution
retirement savings plan, which includes IRS Section 401(k) provisions. We
contribute up to 6.0% of the employee’s eligible compensation, based on the
employee's voluntary contribution. Our contributions and costs for the
retirement savings plan were $1,497,000 in 2009, $1,366,000 in 2008 and
$1,432,000 in 2007.
In
addition to providing retirement savings benefits, we provide post-retirement
health care and life insurance benefits for eligible employees. We are not
currently funding these post-retirement benefits, but have accrued these
liabilities. New employees hired on or after January 1, 2007 are not eligible
for post-retirement health care and life insurance benefits. At December 31,
2009, post-retirement benefits expected to be paid for the next five years and
thereafter are as follows: 2010 - $256,000; 2011- $266,000; 2012 -
$268,000; 2013 - $270,000; 2014 – $269,000 and thereafter
– $1,307,000.
ASC Topic
715 requires that we recognize the funded status of our postretirement benefit
plans on the consolidated balance sheet and recognize as a component of
accumulated other comprehensive income, net of tax, the gains or losses and
prior service costs or credits that arise during the period, but are not
recognized as components of net periodic benefit cost.
The
following table summarizes the balance sheet impact, including the benefit
obligations and assets associated with our postretirement benefit plans as of
December 31, 2009 and 2008, respectively.
|
(Dollars
in thousands)
|
2009
|
2008
|
||||||
|
Change
in benefit obligation
|
||||||||
|
Benefit obligation at beginning of year
|
$ | 9,225 | $ | 7,958 | ||||
|
Service cost
|
309 | 254 | ||||||
|
Interest cost
|
547 | 487 | ||||||
|
Actuarial loss
|
3,466 | 781 | ||||||
|
Benefits paid
|
(277 | ) | (255 | ) | ||||
|
Benefit
obligation at end of year
|
$ | 13,270 | $ | 9,225 | ||||
|
As
of December 31
|
||||||||||||
|
(Dollars
in thousands)
|
2009
|
2008
|
2007
|
|||||||||
|
Components
of net periodic benefit cost
|
||||||||||||
|
Service
cost
|
$ | 309 | $ | 254 | $ | 286 | ||||||
|
Interest
cost
|
547 | 487 | 455 | |||||||||
|
Expected
return on plan assets
|
- | - | - | |||||||||
|
Amortization
of transition obligation
|
60 | 60 | 60 | |||||||||
|
Amortization
of prior service cost
|
(55 | ) | (55 | ) | (12 | ) | ||||||
|
Recognized
net actuarial loss
|
134 | 79 | 70 | |||||||||
|
Net
periodic benefit cost
|
$ | 995 | $ | 825 | $ | 859 | ||||||
|
Discount
rate used to determine benefit obligation as of December
31:
|
5.50 | % | 6.00 | % | 6.20 | % | ||||||
In 2010, we expect to recognize approximately $60,000 of the transition obligation, ($55,000) of the prior service credit and $391,000 of the net actuarial loss as a component of total period post-retirement benefit expense.
|
Health
Care Trend Rates for the Year Ending December 31, 2009
|
Year
|
Trend
Rate
|
||
|
2010-2011
|
7.90%
|
|||
|
2011-2012
|
6.60%
|
|||
|
2012-2013
|
5.80%
|
|||
|
2013-2014
|
5.80%
|
|||
|
2014-2015
|
5.70%
|
|||
|
2015-2016
|
5.70%
|
|||
|
2016-2017
|
5.70%
|
|||
|
2017-2018
|
5.70%
|
|||
|
2018-2019
|
5.60%
|
|||
|
2019-2084
|
5.6%-4.00%
|
|||
|
2085
|
4.00%
|
|||
| (Dollars in thousands) | ||||||||
|
Effect
of 1% Increase and 1% Decrease in Trend Rate
|
1%
Increase
|
1%
Decrease
|
||||||
|
Accum.
post-retirement benefit oblig. as of December 31, 2009
|
||||||||
|
Dollar
|
$ | 2,350 | $ | (1,873 | ) | |||
|
Percentage
change in retiree medical
|
18.0 | % | (15.0 | %) | ||||
|
Service
cost and interest cost for fiscal 2009
|
||||||||
|
Dollar
|
$ | 174 | $ | (137 | ) | |||
|
Percentage
change in retiree medical
|
21.0 | % | (17.0 | %) | ||||
As of December 31, 2008, we adopted a new methodology for applying health care trend rates when measuring the accumulated post-retirement benefit obligation. This methodology is based on guidance published by the Society of Actuaries titled “How Health Care Trend Rates are Best Measured” and is the methodology adopted by our third party consultants. Under the new method, health care rates trend downward in the calculations in smaller increments over a longer period of time. The health care cost trend rate used in determining the accumulated post-retirement benefit obligations was 7.9% in 2010 and decreases gradually until it reaches 5.6% in 2018 and ultimately 4.0% in 2085. These initial trend rate assumptions were provided based on a study of the ten-year history of our self-funded medical benefits plan.
In
December 2003, the Medicare Prescription Drug, Improvement and Modernization Act
of 2003 was enacted, which introduced a prescription drug benefit under
Medicare, as well as a federal subsidy to sponsors of retiree health care
benefit plans that provide a benefit that is at least actuarially equivalent to
the Medicare plan. Topic 715 requires current recognition of the federal subsidy
that employers may receive for providing prescription drug coverage to retirees.
Substantial portions of the prescription drug benefits provided under its
post-retirement benefit plan are deemed actuarially equivalent to the benefits
provided under Medicare Part D. Consequently, we re-measured our accumulated
post-retirement benefit obligation as of June 30, 2004 to account for the
federal subsidy. As of December 31, 2009 and 2008, the reduction in the
accumulated post-retirement benefit obligation due to the subsidy was $1,676,000
and $1,134,000, respectively.
Note
11. Income Taxes
The
income tax provision (benefit) for operations for the years ended December 31,
2009, 2008 and 2007 include the following components:
|
(Dollars
in thousands)
|
2009
|
2008
|
2007
|
|||||||||
|
Current
income taxes (benefits):
|
||||||||||||
|
Federal
|
$ | (1,144 | ) | $ | 1,370 | $ | 4,027 | |||||
|
State
|
(325 | ) | 390 | 1,145 | ||||||||
|
Deferred
income taxes (benefits):
|
||||||||||||
|
Federal
|
2,020 | 3,356 | 1,031 | |||||||||
|
State
|
(52 | ) | 304 | 492 | ||||||||
|
Total
income tax provision
|
$ | 499 | $ | 5,420 | $ | 6,695 | ||||||
Income tax expense (benefit) is included in the financial statements as follows:
|
(Dollars
in thousands)
|
2009
|
2008
|
2007
|
|||||||||
|
Continuing
operations
|
$ | 499 | $ | 5,420 | $ | 6,711 | ||||||
|
Discontinued
operations
|
- | - | (16 | ) | ||||||||
|
Total
income tax provision
|
$ | 499 | $ | 5,420 | $ | 6,695 | ||||||
Deferred tax liabilities and assets are comprised of the following at December 31:
|
(Dollars
in thousands)
|
2009
|
2008
|
||||||
|
Tax
liabilities:
|
||||||||
|
Depreciation
and fixed assets
|
$ | 21,445 | $ | 17,924 | ||||
|
Intangible
assets
|
7,475 | 6,075 | ||||||
|
Gross
deferred tax liability
|
$ | 28,920 | $ | 23,999 | ||||
|
Tax
Assets:
|
||||||||
|
Deferred
compensation and post-retirement benefits
|
$ | 6,534 | $ | 4,461 | ||||
|
Receivables
and inventories
|
501 | 460 | ||||||
|
Accrued
liabilities
|
1,112 | 1,167 | ||||||
|
Derivatives
|
760 | 1,309 | ||||||
|
State
net operating loss
|
1,767 | 1,767 | ||||||
|
Other
|
469 | 304 | ||||||
|
Gross
deferred tax asset
|
11,143 | 9,468 | ||||||
|
Valuation
allowance
|
(1,695 | ) | (1,687 | ) | ||||
|
Net
deferred tax liability
|
19,472 | 16,218 | ||||||
|
Current
deferred tax asset
|
2,423 | 2,064 | ||||||
|
Net
non-current deferred tax liability
|
$ | 21,895 | $ | 18,282 | ||||
We have Iowa net operating loss carry-forwards for tax purposes available to offset future income of approximately $26,687,000 at December 31, 2009. The Iowa net operating loss carry-forwards expire in varying amounts between 2018 and 2029. Due to the continued generation of net operating losses by our subsidiaries operating in Iowa, the utilization of these net operating loss carry-forwards is doubtful. A valuation allowance has been established to reduce the carrying value of the benefits associated with the Iowa net operating losses incurred by our subsidiaries in the state of Iowa. We also have a net operating loss carry-forward of approximately $3,700,000 incurred by the parent company in the state of Minnesota. Management believes that it is unlikely that we will realize all of the benefits associated with the Minnesota net operating loss prior to the expiration of the carry forward period. Therefore, a valuation allowance was established to reduce the carrying value of the benefits associated with the net operating losses incurred by the parent company in Minnesota. Future events and changes in circumstances could cause this valuation allowance to change.
The
reconciliation of the U.S. income tax rate to the effective income tax rate for
continuing operations is as follows:
|
For
Year Ended December 31
|
||||||||||||
|
2009
|
2008
|
2007
|
||||||||||
|
Statutory
tax rate
|
35.0 | % | 35.0% | % | 35.0 | % | ||||||
|
Effect
of:
|
||||||||||||
|
State
income taxes net of federal tax benefit
|
6.2 | 6.0 | 6.1 | |||||||||
|
Release
of income tax reserve and prior
|
||||||||||||
|
Year
adjustments
|
(37.5 | ) | (7.8 | ) | 0.6 | |||||||
|
Medicare
part D subsidy
|
(0.6 | ) | (0.4 | ) | (0.3 | ) | ||||||
|
ASC
740
|
1.5 | 3.2 | 2.50 | |||||||||
|
Acquisition
costs
|
0.8 | - | - | |||||||||
|
Expiration
of capital loss
|
- | 5.2 | - | |||||||||
|
Other,
net
|
(1.2 | ) | (0.9 | ) | (0.2 | ) | ||||||
|
Effective
tax rate
|
4.2 | % | 40.3 | % | 43.7 | % | ||||||
We apply the provisions of ASC Topic 740 which provides guidance to address uncertainty in tax positions and clarifies the accounting for income taxes by prescribing a minimum recognition threshold that income tax positions must achieve before being recognized in the financial statements. As of the date of adoption, we had approximately $7,242,000 of unrecognized tax benefits (excluding interest), of which approximately $748,000 relates to a deferred tax asset that is fully reserved for financial reporting purposes.
As of
December 31, 2009, we had unrecognized tax benefits totaling $2,875,000 (net of
tax) excluding interest. The amount of unrecognized tax benefits, if recognized,
that would affect the effective income tax rate in future periods is $2,859,000.
During 2009, we recognized approximately $3,900,000 of previously unrecognized
tax benefits and approximately $601,000 of associated interest as a result of
the expiration of statute of limitations and settlements with taxing
authorities. It is reasonably possible that the total amount of unrecognized tax
benefits may decrease by approximately $2,685,000 during the next 12 months as a
result of expirations of statute of limitations.
We
recognize interest and penalties related to income tax matters as income tax
expense. As of the date of the adoption, we had $172,000 (net of tax)
accrued for interest and nothing accrued for penalties related to tax matters.
As of December 31, 2009 we have accrued $343,000 (net of tax) for interest
related to unrecognized tax benefits of which $175,000 (net of tax) was accrued
in 2009.
The
following roll-forward of unrecognized tax benefits excludes interest accrued on
unrecognized tax benefits and is presented gross of any expected federal tax
benefits related to unrecognized state tax benefits as required by ASC
740.
|
(Dollars
in thousands)
|
2009
|
2008
|
||||||
|
Unrecognized
tax benefits opening balance (excluding interest)
|
$ | 7,239 | $ | 7,591 | ||||
|
Increases:
|
||||||||
|
Tax
positions taken in current period
|
23 | 41 | ||||||
|
Tax
position taken in prior periods
|
3 | 357 | ||||||
|
Decreases:
|
||||||||
|
Tax
positions taken in prior periods
|
- | (750 | ) | |||||
|
Settlements
|
(48 | ) | - | |||||
|
Lapse
of statute limitations
|
(4,002 | ) | - | |||||
|
Unrecognized
tax benefits
|
- | - | ||||||
|
Ending
balance (excluding interest)
|
$ | 3,215 | $ | 7,239 | ||||
We file consolidated income tax returns in the United States federal jurisdiction and combined or separate income tax returns in various state jurisdictions. In general, we are no longer subject to United States federal income tax examinations and examinations by state tax authorities for the years prior to 2006 except to the extent of losses utilized in subsequent years. In June 2009, the Internal Revenue Service completed an examination of our 2006 federal consolidated income tax return. The results of that audit did not have a material effect on the amounts already recorded in the financial statements.
Note
12. Financial Derivative Instruments
We
utilize interest-rate swap agreements that qualify as cash-flow hedges to manage
our exposure to interest rate fluctuations on a portion of our variable-interest
rate debt. Our interest-rate swaps increase or decrease the amount of cash paid
for interest depending on the increase or decrease of interest required on the
variable rate debt. We account for derivative instruments on the balance sheets
at fair value.
Fair
value is the price that would be received for an asset or paid to transfer a
liability (an exit price) in the principal or most advantageous market for the
asset or liability in an orderly transaction between market participants on the
measurement date. Three levels of inputs may be used to measure fair
value:
|
·
|
Level
1 – quoted prices in active markets for identical assets and
liabilities.
|
|
·
|
Level
2 – observable inputs other than quoted prices in active markets for
identical assets and liabilities.
|
|
·
|
Level 3
– unobservable inputs in which there is little or no market data
available, which require the reporting entity to develop its own
assumptions.
|
The fair
value of our interest rate swap agreements were determined based on level 2
inputs. Listed below are our current interest-rate swap agreements which lock in
our interest rates on existing variable-interest rate debt.
|
Interest-Rate
Swap Agreement Effective Dates
|
Coverage
Amount
|
Rate
|
||||||
|
March
2007 - March 2010
|
$ | 60,000,000 | 4.89 | % | ||||
|
March
2008 - February 2010
|
$ | 40,000,000 | 2.54 | % | ||||
|
March
2010 - September 2011
|
$ | 80,000,000 | 2.15 | % | ||||
The fair
value of our derivatives at December 31, 2009 and 2008 are recorded as financial
derivative instruments under the long-term liabilities section of our balance
sheets. The cumulative gain or (loss) on the market value of financial
derivative instruments is reported as a component of accumulated other
comprehensive income (loss) in shareholders’ equity, net of tax. If we were to
terminate our interest rate swap positions, the cumulative change in fair value
at the date of termination would be reclassified from accumulated other
comprehensive income (loss), which is classified in shareholder’s equity, into
earnings in the Consolidated Statements of Operations.
In March
2007, we terminated two outstanding interest-rate swap agreements, with original
maturities of June 2008, in exchange for $1,936,000 in proceeds. Proceeds of
$664,000 and $1,272,000 were recognized as an offset to interest expense in 2008
and 2007, respectively. Immediately following the termination of the two swap
agreements discussed above, we executed a new interest-rate swap agreement,
effectively locking in the interest rate on $60,000,000 of variable-interest
rate debt through March 2010. In March 2008, we entered into a second
interest-rate swap agreement, effectively locking in the interest rate
on an additional $40,000,000 of variable-interest rate debt through February
2010. In March 2009, we entered into a an interest-rate swap agreement,
effectively locking in the interest rate on $80,000,000 of variable-interest
rate debt starting March 2010 through September 2011.
The
cumulative gain or (loss) on the market value of financial derivative
instruments is reported as a component of accumulated other comprehensive income
(loss) in shareholders’ equity. The fair value of our derivatives at December
31, 2009 and 2008 is a net liability of $1,908,000 and $3,286,000, respectively.
The
table below illustrates the effect of derivative instruments on consolidated
operations for the years ended December 31, 2009, 2008 and
2007.
|
(Dollars
in thousands)
|
Gain/(Loss)
Reported
|
Location
of Gain/Proceeds
|
Amount
of Gain/Proceeds
|
|||||||||||
|
in
Accumulated Other
|
Reclassified
from Accumulated
|
Recognized
in
|
||||||||||||
|
Derivatives
in ASC 815
|
Comprehensive
Loss
|
Other
Comprehensive Income
|
Income
on Derivative
|
|||||||||||
|
Cash
Flow Hedging Relationships
|
2009
|
2008
|
2007
|
into
Income
|
2009
|
2008
|
2007
|
|||||||
|
Interest
Rate Contracts
|
$829
|
$(1,768)
|
$(1,708)
|
Interest
Expense
|
$-
|
$664
|
$1,272
|
|||||||
Note
13. Commitments, Contingencies, and Concentrations
We are
involved in certain contractual disputes in the ordinary course of business, but
do not believe the ultimate resolution of any of these existing matters will
have a material adverse effect on our financial position, results of operations
or cash flows.
We have
built our Enventis equipment and services product line practice around the Cisco
brand. We generated sales of approximately $37,000,000, $56,000,000, and
$59,000,000 in the years ended 2009, 2008, and 2007, respectively. Delays in the
shipment of equipment or the loss of Cisco as our principal supplier could
significantly impact this revenue stream. Due to our status as a Cisco Gold
Partner, among their independent distributors, we feel it is likely that the
shipping delays will be no more problematic for us than other distributors in
the Cisco system.
We have a
collective bargaining agreement with the International Brotherhood of Electrical
Workers Local 949, which involves approximately 20.8% of our employees. The
bargaining agreement expires in 2013.
Operating
Lease Commitments
We own
most of our major facilities, but do lease certain office space, land and
equipment under principally non-cancelable operating leases. Rental expense was
$1,683,000 in 2009, $1,439,000 in 2008 and $1,404,000 in 2007. At December 31,
2009, future minimum operating lease rental obligations for the next five years
and thereafter are as follows: 2010 - $1,300,000; 2011- $878,000;
2012 - $633,000; 2013 - $536,000; 2014 – $536,000 and
thereafter – $786,000.
Note
14. Quarterly Financial Information (Unaudited)
|
|
2009
|
|||||||||||||||
| (Dollars in thousands except per share amounts) |
4th
|
3rd
|
2nd
|
1st
|
||||||||||||
|
Operating
revenue
|
$ | 38,330 | $ | 34,908 | $ | 32,403 | $ | 33,461 | ||||||||
|
Operating
income
|
$ | 4,044 | $ | 4,694 | $ | 5,289 | $ | 4,558 | ||||||||
|
Net
income
|
$ | 1,424 | $ | 6,106 | $ | 2,117 | $ | 1,626 | ||||||||
|
Basic
EPS
|
$ | 0.11 | $ | 0.47 | $ | 0.16 | $ | 0.12 | ||||||||
|
Fully
diluted EPS
|
$ | 0.11 | $ | 0.47 | $ | 0.16 | $ | 0.12 | ||||||||
|
Dividends
per share
|
$ | 0.13 | $ | 0.13 | $ | 0.13 | $ | 0.13 | ||||||||
| 2008 | ||||||||||||||||
| (Dollars in thousands except per share amounts) |
4th
|
3rd
|
2nd
|
1st
|
||||||||||||
|
Operating
revenue
|
$ | 37,670 | $ | 39,860 | $ | 39,745 | $ | 35,900 | ||||||||
|
Operating
income
|
$ | 4,106 | $ | 5,360 | $ | 5,891 | $ | 4,869 | ||||||||
|
Net
income
|
$ | 1,679 | $ | 2,072 | $ | 2,497 | $ | 1,781 | ||||||||
|
Basic
EPS
|
$ | 0.13 | $ | 0.16 | $ | 0.19 | $ | 0.13 | ||||||||
|
Fully
diluted EPS
|
$ | 0.13 | $ | 0.16 | $ | 0.19 | $ | 0.13 | ||||||||
|
Dividends
per share
|
$ | 0.13 | $ | 0.12 | $ | 0.12 | $ | 0.12 | ||||||||
The summation of quarterly earnings per share computations may not equate to the year-end computation as the quarterly computations are performed on an individual basis.
Note
15. Subsequent Events
HickoryTech’s
Board of Directors has declared a regular quarterly dividend of 13 cents per
share, payable March 5, 2010 to shareholders of record on February 15,
2010.
We have
evaluated and disclosed subsequent events through the filing date of the Annual
Report on Form 10-K.
Item 9. Changes in and Disagreements with
Accountants on Accounting and Financial Disclosure
None.
Item 9A. Controls and Procedures
EVALUATION
OF DISCLOSURE CONTROLS AND PROCEDURES AND CHANGES IN INTERNAL
CONTROLS
As of the
end of the period covered by this Annual Report on Form 10-K, we carried out an
evaluation under the supervision and with the participation of our Disclosure
Committee and our management, including the Chief Executive Officer and the
Chief Financial Officer, regarding the effectiveness of the design and operation
of our disclosure controls and procedures as defined in Exchange Act Rules
13a-15(e). Disclosure controls and procedures are designed to ensure that
information required to be disclosed in our reports filed under the Securities
Exchange Act of 1934 (the “Exchange Act”) is recorded, processed, summarized and
reported within the time periods specified in the SEC’s rules and forms and that
such information is accumulated and communicated to our management, including
the Chief Executive Officer and Chief Financial Officer, to allow timely
decisions regarding required disclosure. Based on this evaluation, our Chief
Executive Officer and Chief Financial Officer concluded that the design and
operation of our disclosure controls and procedures were effective as of
December 31, 2009 provided that the evaluation did not include an assessment of
the effectiveness of the internal control over financial reporting for our CP
Telecom operations which were acquired on August 1, 2009.
In August
2009, we acquired CP Telecom Inc., which has facilities in Minnesota. Management
has not made an assessment of the business’ internal control over financial
reporting since the date of acquisition. CP Telecom’s assets and liabilities
acquired were $10,035,000 and $3,410,000 respectively and the sales included in
2009 financial statements were approximately $3,800,000. The CP Telecom business
was not included in our evaluation of the effectiveness of disclosure controls
and procedures.
MANAGEMENT’S
REPORT ON INTERNAL CONTROL OVER FINANCIAL REPORTING
Our
management is responsible for establishing and maintaining adequate internal
control over financial reporting, as defined in Exchange Act Rules 13a-15(f) and
15d-15(f). Our internal control over financial reporting is a process designed
to provide reasonable assurance regarding the reliability of financial reporting
and the preparation of financial statements for external purposes in accordance
with generally accepted accounting principles.
Because
of its inherent limitations, internal control over financial reporting may not
prevent or detect misstatements. Also, projections of any evaluation of
effectiveness to future periods are subject to the risk that controls may become
inadequate because of changes in conditions, or that the degree of compliance
with the policies or procedures may deteriorate.
In August 2009, we acquired CP Telecom Inc., which has facilities
in Minnesota. Management has not made an assessment of the business’ internal
control over financial reporting since the date of acquisition. CP Telecom’s
assets and liabilities acquired were $10,035,000 and $3,410,000 respectively and
the sales included in 2009 financial statements were approximately $3,800,000.
The CP Telecom business was not included in our evaluation of the effectiveness
of internal control over financial reporting.
Under the
supervision and with the participation of our management, including our Chief
Executive Officer and Chief Financial Officer, we conducted an evaluation of the
effectiveness of our internal control over financial reporting as of December
31, 2009 based on the criteria established in Internal Control – Integrated
Framework issued by the Committee of Sponsoring Organizations of the
Treadway Commission. Based on the results of this evaluation, we concluded that
our internal control over financial reporting, excluding CP Telecom Inc.
business described above, was effective as of December 31,
2009.
The effectiveness of our internal
control over financial reporting as of December 31, 2009 has been audited by
Grant Thornton LLP, an independent registered public accounting firm, as stated
in their report which is included in Part II of this Annual Report on Form
10-K.
CHANGES
IN INTERNAL CONTROL OVER FINANCIAL REPORTING
There
were no changes in our internal control over financial reporting identified in
connection with the evaluation required by paragraph (d) of Exchange Act Rules
13a-15 or 15d-15 that was conducted during the last fiscal quarter of 2009, that
have materially affected, or are reasonably likely to materially affect, our
internal control over financial reporting. Our existing control environment will
incorporate CP Telecom as we complete the integration of operations processes
and procedures.
Item 9B. Other Information
None.
Item 10. Directors, Executive Officers and Corporate
Governance
Information
as to Directors and Executive Officers of HickoryTech included in the Proxy
Statement under the headings “Proposal 1: Election of Directors,” “Security
Ownership,” “Other Executive Officers,” and “Section 16(a) Beneficial Ownership
Reporting Compliance” is incorporated by reference. Disclosure relating to the
audit committee, including the audit committee financial expert, found under the
heading of “Audit Committee Report” in the Proxy Statement is incorporated by
reference.
We have
adopted a Code of Ethics that applies to our Chief Executive Officer, Chief
Financial Officer, all officers of HickoryTech, Director of Regulatory Affairs,
Director of Public and Investor Relations, Controller, the Board of Directors,
employees involved in financial reporting and to other designated employees. All
employees of the Company have adopted a Code of Conduct and have undergone
training on this code and ethics. Our Board of Directors has also adopted
written charters for its committees that comply with the NASDAQ Global Select
Market.
Item 11. Executive Compensation
Information
as to executive compensation included under the headings of “Compensation
Discussion and Analysis,” “Summary Compensation Table,” “Grants of Plan-Based
Awards in 2009,” “Outstanding Equity Awards at 2009 Fiscal Year-End,” “2009
Option Exercises and Stock Vested,” “Non-Qualified Deferred Compensation for
2009,” “Employment Contracts, Change of Control Agreements, Severance Agreements
and Other Agreements,” “Compensation Committee Report on Executive Compensation”
and “Compensation of Directors” in the Proxy Statement is incorporated by
reference.
Item 12. Security Ownership of Certain
Beneficial Owners and Management and Related Stockholders Matters
No
beneficial owner held more than 5% of HickoryTech’s common stock as of December
31, 2009. The information as to security ownership of management included under
the heading of “Security Ownership” in the Proxy Statement is incorporated by
reference.
Item 13. Certain Relationships and Related
Transactions and Director Independence
We do not
know of any transactions with related persons required to be reported under this
item. The information regarding director independence under the caption
“Corporate Governance Matters – The Board of Directors and Committees,” in the
Proxy Statement is incorporated by reference.
Item 14. Principal Accountant Fees and
Services
The information under the heading
“Independent Auditors and Payment of Fees to Auditors,” in the Proxy Statement
is incorporated herein by reference.
Item 15. Exhibits and Financial Statement
Schedules
The
following documents are filed as part of this Annual Report on Form
10-K:
1. Index of Consolidated Financial
Statements
The
following consolidated financial statements are included at the indicated pages
in this Annual Report on Form 10-K and incorporated in this Item 15(a) by
reference:
|
Page
|
|
|
Reports
of Independent Registered Public Accounting Firm
|
47
|
|
Consolidated
Statements of Operations
|
49
|
|
Consolidated
Balance Sheets
|
50
|
|
Consolidated
Statements of Cash Flows
|
51
|
|
Consolidated
Statements of Shareholder’s Equity and Comprehensive
Income
|
52
|
|
Notes
to Consolidated Financial Statements
|
53
|
2. Financial
Statement Schedule
|
Page
|
|
| Schedule II – Valuation and Qualifying Accounts | 79 |
3. Exhibits
The
following documents are filed as Exhibits to this Form 10-K or incorporate by
reference herein. Any document incorporated by reference is identified by a
parenthetical reference to the SEC filing which included such
document.
|
Exhibit
|
Description
|
|
3(a)
|
Restated
Articles of Incorporation (Incorporated by reference to Exhibit 3 to the
Registrant’s Form 10-Q filed May 7, 1999)
|
|
3(b)
|
Amended
and Restated By-Laws (Incorporated by reference to Exhibit 3.1 to the
Registrant’s Form 10Q filed May 3, 2007)
|
|
3(c)
|
Certificate
of Designations of Series A Junior Participating Preferred Stock of
HickoryTech Corporation (Incorporated by reference to Exhibit 3(c) to the
Registrant’s Form 10-K filed March 29, 2000)
|
|
4(a)
|
Amended
and Restated Shareholder Rights Agreement (Incorporated by reference to
Exhibit 4.1 to the Registrant’s Form 8-A filed March 17,
2009)
|
|
4(b)
|
Third
Amended and Restated Credit Agreement dated as of December 30, 2005, by
and among HickoryTech Corporation, as Borrower, the Lenders referred to
herein and Wachovia (formerly known as First Union National Bank), as
Administrative Agent (Incorporated by reference to Exhibit 4.1 to the
Registrant’s Form 8-K filed January 6, 2006)
|
|
10.1+
|
Supplemental
Retirement Agreement dated January 31, 1984, between registrant’s
subsidiary, Mankato Citizens Telephone company, and David A. Christensen
(Incorporated by reference to Exhibit 10(b) to the Registrant’s Form S-8
filed May 11, 1993)
|
| 10.2+ |
HickoryTech
Corporation Directors' Stock Option Plan Amended and Restated February 5,
2003 (Incorporated by reference to Exhibit 10(g) to the Registrant's Form
10-K filed March 9, 2004)
|
| 10.3+ |
HickoryTech
Corporation Retainer Stock Plan for Directors Restated and Amended
effective September 1, 1996 (Incorporated by reference to Exhibit 10(m) to
the Registrant's Form 10-Q filed August 12, 1996)
|
|
10.4+
|
HickoryTech
Corporation 1993 Stock Award Plan (Amended and Restated effective
September 26, 2001) (Incorporated by reference to Exhibit 10(l) to the
Registrant’s Form 10-K dated March 26, 1997)
|
|
10.5+
|
Summary
of the HickoryTech Corporation Long-Term Executive Incentive Program
(Incorporated by reference to Exhibit 10(q) to the Registrant’s Form 8-K
filed February 22, 2005)
|
|
10.6+
|
Form
of Stock Option Agreement Used in connection with Grants Under the 1993
Stock Award (Incorporated by reference to Exhibit 10(r) to the
Registrant’s Form 10-K filed March 4, 2005)
|
|
10.7+
|
HickoryTech
Corporation Directors’ Incentive Plan (Incorporated by reference to
Exhibit 10(s) to the Registrant’s Form 8-K filed May 9, 2005)
|
|
10.8
|
Stock
Purchase Agreement by and between HickoryTech Corporation and Minnesota
Power Enterprises, Inc. dated November 9, 2005 (Incorporated by reference
from Exhibit 2.1 to the Registrant’s Current Report on Form 8-K filed on
November 10, 2005)
|
|
10.9
|
First
Amendment to the Stock Purchase Agreement by and between HickoryTech
Corporation and Minnesota Power Enterprises, Inc., dated December 30, 2005
(Incorporated by reference to Exhibit 2.1A to the Registrant’s Current
Report on Form 8-K filed on January 05, 2006)
|
|
10.10
|
Agreement
for Wholesale Financing between HickoryTech and GE Commercial Distribution
Finance Corporation dated February 23, 2006, as amended (Incorporated by
reference to the Registrant’s Current Report on Form 8-K filed April 7,
2006)
|
| 10.11+ |
Change
of Control Agreement between HickoryTech Corporation and Walter A.
Prahl (Incorporated by reference to Exhibit 10.1 to the
Registrant's Current Report on Form 8-K filed November 30,
2007)
|
|
Exhibit
|
Description
|
|
10.12+
|
Amended
and Restated HickoryTech Corporation Employee Stock Purchase Plan, dated
August 1, 2006 (Incorporated by reference to Exhibit 10.14 to the
Registrants Form 10-K dated February 29, 2008)
|
|
10.13+
|
Amended
and Restated Change of Control Agreement dated November 29, 2007 between
HickoryTech Corporation and John W. Finke (Incorporated by reference to
Exhibit 10.15 to the Registrants Form 10-K dated February 29,
2008)
|
|
10.14+
|
Change
of Control Agreement between HickoryTech and John P. Morton dated November
29, 2007(Incorporated by reference to Exhibit 10.16 to the Registrants
Form 10-K dated February 29, 2008)
|
|
10.15+
|
Amended
and Restated Change of Control Agreement dated November 29, 2007 between
HickoryTech Corporation and David A. Christensen (Incorporated by
reference to Exhibit 10.17 to the Registrants Form 10-K dated February 29,
2008)
|
|
10.16+
|
Amended
and Restated Change of Control Agreement dated November 29, 2007 between
HickoryTech Corporation and Lane C. Nordquist (Incorporated by reference
to Exhibit 10.18 to the Registrants Form 10-K dated February 29,
2008)
|
|
10.17+
|
Amended
and Restated Change of Control Agreement dated November 29, 2007 between
HickoryTech Corporation and Mary T. Jacobs (Incorporated by reference to
Exhibit 10.19 to the Registrants Form 10-K dated February 29,
2008)
|
|
10.18+
|
Change
of Control Agreement between HickoryTech and Damon D. Dutz dated November
29, 2007 (Incorporated by reference to Exhibit 10.20 to the Registrants
Form 10-K dated February 29, 2008)
|
| 10.19+ |
Employment
Agreement between the HickoryTech and John W. Finke, President and Chief
Executive Officer of the Company, dated August 1, 2006 which includes a
Supplemental Retirement Agreement (Incorporated by reference to the
Registrants Current Report on Form 8-K filed August 16,
2006) Amendment to Employment Agreement dated November 29, 2007
(Incorporated by reference to Exhibit 10.21 to the Registrants Form 10-K
dated February 29, 2008)
|
| 10.20+ |
Employment
Agreement between HickoryTech and John P. Morton dated December 20, 2006
and Amendment to Employment Agreement dated November 29, 2007
(Incorporated by reference to Exhibit 10.22 to the Registrants Form
10-K dated February 29, 2009)
|
|
10.21+
|
HickoryTech
Corporation Executive Incentive Plan Amended and Restated January 1,
2009
|
|
14
|
Code
of Ethics (Incorporated by reference to Exhibit 14 to the registrant’s
Form 10-K filed March 14, 2004)
|
|
21*
|
Subsidiaries
of HickoryTech Corporation
|
|
23.1*
|
Consent
of Independent Registered Public Accounting Firm
|
|
31(a)*
|
Certification
of Chief Executive Officer Under Rule 13a-14(a) Adopted Pursuant to
Section 302 of the Sarbanes-Oxley Act of 2002
|
| Exhibit | Description |
|
31(b)*
|
Certification
of Chief Financial Officer Under Rule 13a-14(a) Adopted Pursuant to
Section 302 of the Sarbanes-Oxley Act of 2002
|
|
32(a)*
|
Certification
of Chief Executive Officer Under 18 U.S.C. Section 1350 Pursuant to
Section 906 of the Sarbanes-Oxley Act of 2002
|
|
32(b)*
|
Certification
of Chief Financial Officer Under 18 U.S.C. Section 1350 Pursuant
to Section 906 of the Sarbanes-Oxley Act of 2002
|
* Filed
herewith.
+ Management compensation
plan or arrangement required to be filed as an
exhibit.
|
SCHEDULE
II - VALUATION AND QUALIFYING ACCOUNTS
|
||||||||||||||||||||
|
HickoryTech
Corporation
|
||||||||||||||||||||
|
(Dollars
in thousands)
|
||||||||||||||||||||
|
Additions
|
||||||||||||||||||||
|
Balance
at
|
Charged
to
|
Charged
to
|
Balance
at
|
|||||||||||||||||
|
Beginning
of
|
Costs
and
|
Other
|
End
of
|
|||||||||||||||||
|
Description
|
Period
|
Expenses
|
Accounts
|
Deductions
|
Period
|
|||||||||||||||
|
Year
ended December 31, 2007
|
||||||||||||||||||||
|
Allowance
for doubtful accounts
|
$ | 851 | $ | 139 | $ | - | $ | 194 | $ | 1,184 | ||||||||||
|
Inventory
valuation reserve
|
462 | 161 | - | (225 | ) | 398 | ||||||||||||||
|
Deferred
tax asset valuation allowance
|
1,616 | - | - | (66 | ) | 1,550 | ||||||||||||||
|
Total
|
$ | 2,929 | $ | 300 | $ | - | $ | (97 | ) | $ | 3,132 | |||||||||
|
Year
ended December 31, 2008
|
||||||||||||||||||||
|
Allowance
for doubtful accounts
|
$ | 1,184 | $ | 286 | $ | - | $ | (565 | ) | $ | 905 | |||||||||
|
Inventory
valuation reserve
|
398 | 184 | - | (333 | ) | 249 | ||||||||||||||
|
Deferred
tax asset valuation allowance
|
1,550 | 137 | - | - | 1,687 | |||||||||||||||
|
Total
|
$ | 3,132 | $ | 607 | $ | - | $ | (898 | ) | $ | 2,841 | |||||||||
|
Year
ended December 31, 2009
|
||||||||||||||||||||
|
Allowance
for doubtful accounts
|
$ | 905 | $ | 128 | $ | - | $ | (390 | ) | $ | 643 | |||||||||
|
Inventory
valuation reserve
|
249 | 110 | - | (104 | ) | 255 | ||||||||||||||
|
Deferred
tax asset valuation allowance
|
1,687 | 8 | - | - | 1,695 | |||||||||||||||
|
Total
|
$ | 2,841 | $ | 246 | $ | - | $ | (494 | ) | $ | 2,593 | |||||||||
Pursuant
to the requirements of Section 13 or 15(d) of the Securities Exchange Act of
1934, the registrant has duly caused this report to be signed on its behalf by
the undersigned, thereunto duly authorized.
|
Dated:
March 2,
2010
|
HICKORYTECH
CORPORATION
|
|
By: /s/ David A.
Christensen
|
|
|
David
A. Christensen, Secretary
|
|
|
Senior
Vice President, Chief Financial
|
|
|
Officer
and Treasurer
|
Pursuant to the requirements of the Securities Exchange Act of 1934, the following persons on behalf of the registrant and in the capacities and on the dates indicated have signed this report.
|
/s/ James W. Bracke
James
W. Bracke, Chair
|
March
2, 2010
|
|
/s/ John W. Finke
John
W. Finke
President,
Chief Executive Officer and Director
(principal
executive officer)
|
March
2, 2010
|
|
/s/ David A. Christensen
David
A. Christensen, Secretary, Senior Vice President, Chief Financial Officer
and Treasurer (principal financial officer and principal accounting
officer)
|
March
2, 2010
|
|
/s/ R. Wynn Kearney, Jr.
R.
Wynn Kearney, Jr., Director
|
March
2, 2010
|
|
/s/ Robert D. Alton
Robert
D. Alton, Director
|
March
2, 2010
|
|
/s/ Lyle T. Bosacker
Lyle
T. Bosacker, Director
|
March
2, 2010
|
|
/s/ Dale E. Parker
Dale
E. Parker, Director
|
March
2, 2010
|
(a
majority of directors)
80