Attached files
UNITED
STATES
SECURITIES
AND EXCHANGE COMMISSION
Washington,
D.C. 20549
FORM
10-K
|
[X]
|
ANNUAL
REPORT PURSUANT TO SECTION 13 OR 15(d) OF THE SECURITIES EXCHANGE ACT OF
1934
|
For the
fiscal year ended December 31, 2009
or
|
[ ]
|
TRANSITION
REPORT PURSUANT TO SECTION 13 OR 15(d) OF THE SECURITIES EXCHANGE ACT OF
1934
|
For the
transition period from _______________ to _______________
Commission
file number: 001-31899
Whiting Petroleum
Corporation
(Exact
name of registrant as specified in its charter)
|
Delaware
(State
or other jurisdiction
of
incorporation or organization)
|
20-0098515
(I.R.S.
Employer
Identification
No.)
|
|
1700
Broadway, Suite 2300
Denver, Colorado
(Address
of principal executive offices)
|
80290-2300
(Zip
code)
|
Registrant’s
telephone number, including area code: (303) 837-1661
Securities
registered pursuant to Section 12(b) of the Act:
|
6.25%
Convertible Perpetual Preferred Stock, $0.001 par value
Common
Stock, $0.001 par value
Preferred
Share Purchase Rights
(Title
of Class)
|
New
York Stock Exchange
New
York Stock Exchange
New
York Stock Exchange
(Name
of each exchange on which
registered)
|
Securities
registered pursuant to Section 12(g) of the Act: None.
Indicate
by check mark if the Registrant is a well-known seasoned issuer, as defined in
Rule 405 of the Securities Act.YesT No £
Indicate
by check mark if the Registrant is not required to file reports pursuant to
Section 13 or 15(d) of the Securities Act.Yes£ No T
Indicate
by check mark whether the registrant (1) has filed all reports required to be
filed by Section 13 or 15(d) of the Securities Exchange Act of 1934 during the
preceding 12 months (or for such shorter period that the registrant was required
to file such reports), and (2) has been subject to such filing requirements for
the past 90 days. YesT No£
Indicate
by check mark whether the registrant has submitted electronically and posted on
its corporate Web site, if any, every Interactive Data File required to be
submitted and posted pursuant to Rule 405 of Regulation S-T (§232.405 of this
chapter) during the preceding 12 months (or for such shorter period that the
registrant was required to submit and post such
files). Yes £
No £
Indicate
by check mark if disclosure of delinquent filers pursuant to Item 405 of
Regulation S-K is not contained herein, and will not be contained, to the best
of registrant’s knowledge, in definitive proxy or information statements
incorporated by reference in Part III of this Form 10-K or any amendment to this
Form 10-K. £
Indicate
by check mark whether the registrant is a large accelerated filer, an
accelerated filer, a non-accelerated filer, or a smaller reporting
company. See the definitions of “large accelerated filer,”
“accelerated filer” and “smaller reporting company” in Rule 12b-2 of the
Exchange Act. (Check one):
|
Large
accelerated filerT
|
Accelerated
filer £
|
Non-accelerated
filer£
|
Smaller
reporting company £
|
Indicate
by check mark whether the Registrant is a shell company (as defined in Rule
12b-2 of the Exchange Act). Yes£ No T
Aggregate
market value of the voting common stock held by non-affiliates of the registrant
at June 30, 2009: $1,794,225,805.
Number of
shares of the registrant’s common stock outstanding at February 15,
2010: 50,843,843 shares.
DOCUMENTS
INCORPORATED BY REFERENCE
Portions
of the Proxy Statement for the 2010 Annual Meeting of Stockholders are
incorporated by reference into Part III.
CERTAIN DEFINITIONS
Unless
the context otherwise requires, the terms “we,” “us,” “our” or “ours” when used
in this Annual Report on Form 10-K refer to Whiting Petroleum Corporation,
together with its consolidated subsidiaries. When the context
requires, we refer to these entities separately.
We have
included below the definitions for certain terms used in this Annual Report on
Form 10-K:
“3-D seismic” Geophysical
data that depict the subsurface strata in three dimensions. 3-D
seismic typically provides a more detailed and accurate interpretation of the
subsurface strata than 2-D, or two-dimensional, seismic.
“Bbl” One stock tank barrel,
or 42 U.S. gallons liquid volume, used in this report in reference to oil and
other liquid hydrocarbons.
“Bcf” One billion cubic feet
of natural gas.
“Bcfe” One billion cubic feet
of natural gas equivalent.
“BOE” One stock tank barrel
equivalent of oil, calculated by converting natural gas volumes to equivalent
oil barrels at a ratio of six Mcf to one Bbl of oil.
“CO2 flood” A tertiary recovery
method in which CO2 is
injected into a reservoir to enhance hydrocarbon recovery.
“completion” The installation
of permanent equipment for the production of crude oil or natural gas, or in the
case of a dry hole, the reporting of abandonment to the appropriate
agency.
“deterministic method” The
method of estimating reserves or resources using a single value for each
parameter (from the geoscience, engineering or economic data) in the reserves
calculation.
“farmout” An assignment of an
interest in a drilling location and related acreage conditioned upon the
drilling of a well on that location.
“FASB” Financial Accounting
Standards Board.
“FASB ASC” The Financial
Accounting Standards Board Accounting Standards Codification.
“flush production” The high
rate of flow from a well during initial production immediately after it is
brought on-line.
“GAAP” Generally accepted
accounting principles in the United States of America.
“MBbl” One thousand barrels
of oil or other liquid hydrocarbons.
“MBOE” One thousand
BOE.
“MBOE/d” One MBOE per
day.
“Mcf” One thousand cubic feet
of natural gas.
“Mcfe” One thousand cubic
feet of natural gas equivalent.
“MMBbl” One million
Bbl.
“MMBOE” One million
BOE.
“MMBtu” One million British
Thermal Units.
“MMcf” One million cubic feet
of natural gas.
“MMcf/d” One MMcf per
day.
“MMcfe” One million cubic
feet of natural gas equivalent.
“MMcfe/d” One MMcfe per
day.
“PDNP” Proved developed
nonproducing reserves.
“PDP” Proved developed
producing reserves.
“plugging and abandonment”
Refers to the sealing off of fluids in the strata penetrated by a well so that
the fluids from one stratum will not escape into another or to the
surface. Regulations of many states require plugging of abandoned
wells.
“possible reserves” Those
reserves that are less certain to be recovered than probable
reserves.
“pre-tax PV10%” The present
value of estimated future revenues to be generated from the production of proved
reserves calculated in accordance with the guidelines of the Securities and
Exchange Commission (“SEC”), net of estimated lease operating expense,
production taxes and future development costs, using price and costs as of the
date of estimation without future escalation, without giving effect to
non-property related expenses such as general and administrative expenses, debt
service and depreciation, depletion and amortization, or Federal income taxes
and discounted using an annual discount rate of 10%. Pre-tax PV10%
may be considered a non-GAAP financial measure as defined by the
SEC. See footnote (1) to the Proved Reserves table in Item 1.
“Business” of this Annual Report on Form 10-K for more information.
“probable reserves” Those
reserves that are less certain to be recovered than proved reserves but which,
together with proved reserves, are as likely as not to be
recovered.
“proved developed reserves”
Proved reserves that can be expected to be recovered through existing wells with
existing equipment and operating methods or in which the cost of the required
equipment is relatively minor compared to the cost of a new well.
“proved reserves” Those
reserves which, by analysis of geoscience and engineering data, can be estimated
with reasonable certainty to be economically producible—from a given date
forward, from known reservoirs and under existing economic conditions, operating
methods and government regulations—prior to the time at which contracts
providing the right to operate expire, unless evidence indicates that renewal is
reasonably certain, regardless of whether deterministic or probabilistic methods
are used for the estimation. The project to extract the hydrocarbons
must have commenced, or the operator must be reasonably certain that it will
commence the project, within a reasonable time.
The area
of the reservoir considered as proved includes all of the
following:
|
a.
|
The
area identified by drilling and limited by fluid contacts, if any,
and
|
|
b.
|
Adjacent
undrilled portions of the reservoir that can, with reasonable certainty,
be judged to be continuous with it and to contain economically producible
oil or gas on the basis of available geoscience and engineering
data.
|
Reserves
that can be produced economically through application of improved recovery
techniques (including, but not limited to, fluid injection) are included in the
proved classification when both of the following occur:
|
a.
|
Successful
testing by a pilot project in an area of the reservoir with properties no
more favorable than in the reservoir as a whole, the operation of an
installed program in the reservoir or an analogous reservoir, or other
evidence using reliable technology establishes the reasonable certainty of
the engineering analysis on which the project or program was based,
and
|
|
b.
|
The
project has been approved for development by all necessary parties and
entities, including governmental
entities.
|
Existing
economic conditions include prices and costs at which economic producibility
from a reservoir is to be determined. The price shall be the average
price during the 12-month period before the ending date of the period covered by
the report, determined as an unweighted arithmetic average of the
first-day-of-the-month price for each month within such period, unless prices
are defined by contractual arrangements, excluding escalations based upon future
conditions.
“proved undeveloped reserves”
Proved reserves that are expected to be recovered from new wells on undrilled
acreage, or from existing wells where a relatively major expenditure is required
for recompletion. Reserves on undrilled acreage shall be limited to
those directly offsetting development spacing areas that are reasonably certain
of production when drilled, unless evidence using reliable technology exists
that establishes reasonable certainty of economic producibility at greater
distances. Undrilled locations can be classified as having
undeveloped reserves only if a development plan has been adopted indicating that
they are schedule to be drilled within five years, unless specific circumstances
justify a longer time. Under no circumstances shall estimates for
proved undeveloped reserves be attributable to any acreage for which an
application of fluid injection or other improved recovery technique is
contemplated, unless such techniques have been proved effective by actual
projects in the same reservoir or an analogous reservoir, or by other evidence
using reliable technology establishing reasonable certainty.
“PUD” Proved undeveloped
reserves.
“reasonable certainty” If
deterministic methods are used, reasonable certainty means a high degree of
confidence that the quantities will be recovered. If probabilistic
methods are used, there should be at least a 90 percent probability that the
quantities actually recovered will equal or exceed the estimate. A
high degree of confidence exists if the quantity is much more likely to be
achieved than not, and, as changes due to increased availability of geoscience
(geological, geophysical and geochemical) engineering, and economic data are
made to estimated ultimate recovery with time, reasonably certain estimated
ultimate recovery is much more likely to increase or remain constant than to
decrease.
“reserves” Estimated
remaining quantities of oil and gas and related substances anticipated to be
economically producible, as of a given date, by application of development
projects to known accumulations. In addition, there must exist, or
there must be a reasonable expectation that there will exist, the legal right to
produce or a revenue interest in the production, installed means of delivering
oil and gas or related substances to market, and all permits and financing
required to implement the project.
“reservoir” A porous and
permeable underground formation containing a natural accumulation of producible
crude oil and/or natural gas that is confined by impermeable rock or water
barriers and is individual and separate from other reservoirs.
“resource
play”
Refers to drilling programs targeted at regionally distributed oil or natural
gas accumulations. Successful exploitation of these reservoirs is
dependent upon new technologies such as horizontal drilling and multi-stage
fracture stimulation to access large rock volumes in order to produce economic
quantities of oil or natural gas.
“working interest” The
interest in a crude oil and natural gas property (normally a leasehold interest)
that gives the owner the right to drill, produce and conduct operations on the
property and a share of production, subject to all royalties, overriding
royalties and other burdens and to all costs of exploration, development and
operations and all risks in connection therewith.
PART
I
|
Item 1.
|
Business
|
Overview
We are an
independent oil and gas company engaged in acquisition, development,
exploitation, production and exploration activities primarily in the Permian
Basin, Rocky Mountains, Mid-Continent, Gulf Coast and Michigan regions of the
United States. We were incorporated in 2003 in connection with our
initial public offering.
Since our
inception in 1980, we have built a strong asset base and achieved steady growth
through property acquisitions, development and exploration
activities. As of December 31, 2009, our estimated proved reserves
totaled 275.0 MMBOE, representing a 15% increase in our proved reserves since
December 31, 2008. Our 2009 average daily production was 55.5
MBOE/d and implies an average reserve life of approximately 13.6
years.
The
following table summarizes our estimated proved reserves by core area, the
corresponding pre-tax PV10% value and our standardized measure of discounted
future net cash flows as of December 31, 2009, and our December 2009 average
daily production:
|
Proved
Reserves(1)
|
||||||||||||||||||||||||
|
Core
Area
|
Oil(2)
(MMBbl)
|
Natural
Gas (Bcf)
|
Total
(MMBOE)
|
%
Oil(2)
|
Pre-Tax
PV10% Value(3)
(In
millions)
|
December
2009 Average Daily Production (MBOE/d)
|
||||||||||||||||||
|
Permian
Basin
|
112.3 | 66.2 | 123.3 | 91 | % | $ | 901.3 | 11.7 | ||||||||||||||||
|
Rocky
Mountains
|
70.2 | 159.4 | 96.8 | 73 | % | 1,266.3 | 30.3 | |||||||||||||||||
|
Mid-Continent
|
36.6 | 15.2 | 39.1 | 94 | % | 581.3 | 9.3 | |||||||||||||||||
|
Gulf
Coast
|
2.3 | 36.6 | 8.4 | 27 | % | 69.6 | 3.0 | |||||||||||||||||
|
Michigan
|
2.4 | 30.0 | 7.4 | 32 | % | 57.2 | 2.3 | |||||||||||||||||
|
Total
|
223.8 | 307.4 | 275.0 | 81 | % | $ | 2,875.7 | 56.6 | ||||||||||||||||
|
Discounted
Future Income Taxes
|
- | - | - | - | (532.2 | ) | - | |||||||||||||||||
|
Standardized
Measure of Discounted Future Net Cash Flows
|
- | - | - | - | $ | 2,343.5 | - | |||||||||||||||||
_____________________
|
(1)
|
Oil
and gas reserve quantities and related discounted future net cash flows
have been derived from oil and gas prices calculated using an average of
the first-day-of-the month price for each month within the most recent 12
months, pursuant to current SEC and FASB
guidelines.
|
|
(2)
|
Oil
includes natural gas liquids.
|
|
(3)
|
Pre-tax
PV10% may be considered a non-GAAP financial measure as defined by the SEC
and is derived from the standardized measure of discounted future net cash
flows, which is the most directly comparable GAAP financial
measure. Pre-tax PV10% is computed on the same basis as the
standardized measure of discounted future net cash flows but without
deducting future income taxes. We believe pre-tax PV10% is a
useful measure for investors for evaluating the relative monetary
significance of our oil and natural gas properties. We further
believe investors may utilize our pre-tax PV10% as a basis for comparison
of the relative size and value of our proved reserves to other companies
because many factors that are unique to each individual company impact the
amount of future income taxes to be paid. Our management uses
this measure when assessing the potential return on investment related to
our oil and gas properties and acquisitions. However, pre-tax
PV10% is not a substitute for the standardized measure of discounted
future net cash flows. Our pre-tax PV10% and the standardized
measure of discounted future net cash flows do not purport to present the
fair value of our proved oil and natural gas
reserves.
|
While
historically we have grown through acquisitions, we are increasingly focused on
a balance between exploration and development programs and continuing to
selectively pursue acquisitions that complement our existing core
properties. We believe that our significant drilling inventory,
combined with our operating experience and cost structure, provides us with
meaningful organic growth opportunities.
Our
growth plan is centered on the following activities:
|
•
|
pursuing
the development of projects that we believe will generate attractive rates
of return;
|
|
|
•
|
maintaining
a balanced portfolio of lower risk, long-lived oil and gas properties that
provide stable cash flows;
|
|
|
•
|
seeking
property acquisitions that complement our core
areas; and
|
|
|
•
|
allocating
a portion of our capital budget to leasing and exploring prospect
areas.
|
During
2009, we incurred $577.9 million in acquisition, development and exploration
activities, including $479.8 million for the drilling of 145 gross (56.2 net)
wells. Of these new wells, 51.1 (net) resulted in productive
completions and 5.1 (net) were unsuccessful, yielding a 91% success
rate. Our current 2010 capital budget for exploration and development
expenditures is $830.0 million, which we expect to fund with net cash provided
by our operating activities. Our 2010 capital budget of $830.0
million represents a substantial increase from the $479.8 million incurred on
exploration and development expenditures during 2009. This increased
capital budget is in response to the higher oil and natural gas prices
experienced during the second half of 2009 and continuing into the first part of
2010.
Acquisitions
and Divestitures
The
following is a summary of our acquisitions and divestitures during the last two
years. See “Management’s Discussion and Analysis of Financial
Condition and Results of Operations” for more information on these acquisitions
and divestitures.
2009 Acquisitions. During
2009, we acquired additional royalty and overriding royalty interests in the
North Ward Estes field and various other fields in the Permian Basin in two
separate transactions with private owners. Also included in these
transactions were contractual rights, including an option to participate for an
aggregate 10% working interest and right to back in after payout for an
additional aggregate 15% working interest in the development of deeper pay zones
on acreage under and adjoining the North Ward Estes field.
We
completed the first additional royalty and overriding interests acquisition in
November 2009, with a purchase price of $38.7 million and an effective date of
October 1, 2009. The average daily net production attributable to
this transaction was approximately 0.3 MBOE/d in September
2009. Estimated proved reserves attributable to the acquired
interests are 2.2 MMBOE, resulting in an acquisition price of $17.59 per
BOE. Reserves attributable to royalty and overriding royalty
interests are not burdened by operating expenses or any additional capital
costs, including CO2 costs,
which are paid by the working interest owners.
We
completed the second additional royalty and overriding interests acquisition in
December 2009, with a purchase price of $27.4 million and an effective date of
November 1, 2009. The average daily net production attributable to
this transaction was approximately 0.2 MBOE/d in September
2009. Estimated proved reserves attributable to the acquired
interests are 1.6 MMBOE, resulting in an acquisition price of $17.13 per
BOE.
In
aggregate, the two acquisitions in the North Ward Estes field represent 3.8
MMBOE of proved reserves at an acquisition price of $66.1 million, or $17.39 per
BOE. We funded these acquisitions primarily with net cash provided by
our operating activities.
2009 Participation
Agreement. In June 2009, we entered into a participation
agreement with a privately held independent oil company covering twenty-five
1,280-acre units and one 640-acre unit located primarily in the western portion
of the Sanish field in Mountrail County, North Dakota. Under the
terms of the agreement, the private company agreed to pay 65% of our net
drilling and well completion costs to receive 50% of our working interest and
net revenue interest in the first and second wells planned for each of the
units. Pursuant to the agreement, we will remain the operator for
each unit.
At the
closing of the agreement, the private company paid us $107.3 million,
representing $6.4 million for acreage costs, $65.8 million for 65% of our cost
in 18 wells drilled or drilling and $35.1 million for a 50% interest in our
Robinson Lake gas plant and oil and gas gathering system. We used
these proceeds to repay a portion of the debt outstanding under our credit
agreement.
2008 Acquisitions. In May 2008, we acquired
interests in 31 producing gas wells, development acreage and gas gathering and
processing facilities on approximately 22,000 gross (11,500 net) acres in the
Flat Rock field in Uintah County, Utah for an aggregate acquisition price of
$365.0 million. After allocating $79.5 million of the purchase price
to unproved properties, the resulting acquisition cost is $2.48 per
Mcfe. Of the estimated 115.2 Bcfe of proved reserves acquired as of
the January 1, 2008 acquisition effective date, 98% are natural gas and 22% are
proved developed producing. The average daily net production from the
properties was 17.8 MMcfe/d as of the acquisition effective date. We
funded the acquisition with borrowings under our credit agreement.
2008
Divestitures. On April 30, 2008, we completed an initial
public offering of units of beneficial interest in Whiting USA Trust I (the
“Trust”), selling 11,677,500 Trust units at $20.00 per Trust unit, providing net
proceeds of $193.8 million after underwriters’ fees, offering expenses and
post-close adjustments. We used the net offering proceeds to repay a
portion of the debt outstanding under our credit agreement. The net
proceeds from the sale of Trust units to the public resulted in a deferred gain
on sale of $100.2 million. Immediately prior to the closing of the
offering, we conveyed a term net profits interest in certain of our oil and gas
properties to the Trust in exchange for 13,863,889 Trust units. We
retained 15.8%, or 2,186,389 Trust units, of the total Trust units issued and
outstanding.
The net
profits interest entitles the Trust to receive 90% of the net proceeds from the
sale of oil and natural gas production from the underlying
properties. The net profits interest will terminate at the time when
9.11 MMBOE have been produced and sold from the underlying
properties. This is the equivalent of 8.2 MMBOE in respect of the
Trust’s right to receive 90% of the net proceeds from such production pursuant
to the net profits interest, and these reserve quantities are projected to be
produced by August 31, 2018, based on the reserve report for the underlying
properties as of December 31, 2009. The conveyance of the net
profits interest to the Trust consisted entirely of proved developed producing
reserves of 8.2 MMBOE, as of the January 1, 2008 effective date,
representing 3.3% of our proved reserves as of December 31, 2007, and
10.0%, or 4.2 MBOE/d, of our March 2008 average daily net
production. After netting our ownership of 2,186,389 Trust units,
third-party public Trust unit holders receive 6.9 MMBOE of proved producing
reserves, or 2.75% of our total year-end 2007 proved reserves, and 7.4%, or 3.1
MBOE/d, of our March 2008 average daily net production.
Business
Strategy
Our goal
is to generate meaningful growth in our net asset value per share for proved
reserves by acquisition, exploitation and exploration of oil and gas projects
with attractive rates of return on capital employed. To date, we have
pursued this goal through both the acquisition of reserves and continued field
development in our core areas. Because of our extensive property
base, we are pursuing several economically attractive oil and gas opportunities
to exploit and develop properties as well as explore our acreage positions for
additional production growth and proved reserves. Specifically, we
have focused, and plan to continue to focus, on the following:
Pursuing High-Return Organic Reserve
Additions. The development of large resource plays such as our
Williston Basin and Piceance Basin projects has become one of our central
objectives. We have assembled approximately 118,000 gross (69,600
net) acres on the eastern side of the Williston Basin in North Dakota in an
active oil development play at our Sanish field area, where the Middle Bakken
reservoir is oil productive. As of February 15, 2010, we have
participated in the drilling of 123 successful wells (88 operated) in our Sanish
field acreage that had a combined net production rate of 12.6 MBOE/d during
December 2009.
As of
December 31, 2009, we have assembled 213,500 gross (127,800 net) acres in the
Lewis & Clark Prospect in Golden Valley and Billings Counties, North
Dakota. Subsequent to year-end we assembled additional acreage, primarily
in Stark County, North Dakota, which brings our total acreage position in the
Lewis & Clark area to 320,000 gross (202,400 net) acres. Through
the end of 2009 we have drilled three horizontal wells into the Three Forks
reservoir at Lewis & Clark and are very encouraged with the results.
We intend to further delineate this area with additional drilling in
2010.
With the
acquisition of Equity Oil Company in 2004, we acquired mineral interests and
federal oil and gas leases in the Piceance Basin of Colorado, where we have
found the Iles and Williams Fork reservoirs (Mesaverde formation) to be gas
productive at our Sulphur Creek field area and the Mesaverde formation to be gas
productive at our Jimmy Gulch prospect area.
In May
2008 we acquired interests in the Flat Rock Gas field in Uintah County,
Utah. The main production in the Flat Rock field is from the Entrada
formation. In our Piceance projects and at the Flat Rock Gas field we
have entered into 5-year fixed-price gas contracts at over $5.00 per Mcf to
enhance the economics of further drilling and development in this area and
thereby maintain the economic viability of this production.
Developing and Exploiting Existing
Properties. Our existing property base and our acquisitions
over the past five years have provided us with numerous low-risk opportunities
for exploitation and development drilling. As of December 31, 2009,
we have identified a drilling inventory of over 1,400 gross wells that we
believe will add substantial production over the next five years. Our
drilling inventory consists of the development of our proved and non-proved
reserves on which we have spent significant time evaluating the costs and
expected results. Additionally, we have several opportunities to
apply and expand enhanced recovery techniques that we expect will increase
proved reserves and extend the productive lives of our mature
fields. In 2005, we acquired two large oil fields, the Postle field,
located in the Oklahoma Panhandle, and the North Ward Estes field, located in
the Permian Basin of West Texas. We have experienced and anticipate
further significant production increases in these fields over the next four to
seven years through the use of secondary and tertiary recovery
techniques. In these fields, we are actively injecting water and
CO2 and executing extensive
re-development, drilling and completion operations, as well as enhanced gas
handling and treating capability.
Growing Through Accretive
Acquisitions. From 2004 to 2009, we completed 15 separate
acquisitions of producing properties for estimated proved reserves of 230.7
MMBOE, as of the effective dates of the acquisitions. Our experienced
team of management, land, engineering and geoscience professionals has developed
and refined an acquisition program designed to increase reserves and complement
our existing properties, including identifying and evaluating acquisition
opportunities, negotiating and closing purchases and managing acquired
properties. We intend to selectively pursue the acquisition of
properties complementary to our core operating areas.
Disciplined Financial
Approach. Our goal is to remain financially strong, yet
flexible, through the prudent management of our balance sheet and active
management of commodity price volatility. We have historically funded
our acquisitions and growth activity through a combination of equity and debt
issuances, bank borrowings and internally generated cash flow, as appropriate,
to maintain our strong financial position. From time to time, we
monetize non-core properties and use the net proceeds from these asset sales to
repay debt under our credit agreement. To support cash flow
generation on our existing properties and help ensure expected cash flows from
acquired properties, we periodically enter into derivative
contracts. Typically, we use costless collars and fixed price gas
contracts to provide an attractive base commodity price
level.
Competitive
Strengths
We
believe that our key competitive strengths lie in our balanced asset portfolio,
our experienced management and technical team and our commitment to effective
application of new technologies.
Balanced, Long-Lived Asset
Base. As of December 31, 2009, we had interests in 9,616 gross
(3,719 net) productive wells across approximately 1,059,500 gross (545,300 net)
developed acres in our five core geographical areas. We believe this
geographic mix of properties and organic drilling opportunities, combined with
our continuing business strategy of acquiring and exploiting properties in these
areas, presents us with multiple opportunities in executing our strategy because
we are not dependent on any particular producing regions or geological
formations. Our proved reserve life is approximately 13.6 years based
on year-end 2009 proved reserves and 2009 production.
Experienced Management
Team. Our management team averages 26 years of experience in
the oil and gas industry. Our personnel have extensive experience in
each of our core geographical areas and in all of our operational
disciplines. In addition, each of our acquisition professionals has
at least 29 years of experience in the evaluation, acquisition and operational
assimilation of oil and gas properties.
Commitment to
Technology. In each of our core operating areas, we have
accumulated detailed geologic and geophysical knowledge and have developed
significant technical and operational expertise. In recent years, we
have developed considerable expertise in conventional and 3-D seismic imaging
and interpretation. Our technical team has access to approximately
6,370 square miles of 3-D seismic data, digital well logs and other subsurface
information. This data is analyzed with advanced geophysical and
geological computer resources dedicated to the accurate and efficient
characterization of the subsurface oil and gas reservoirs that comprise our
asset base. In addition, our information systems enable us to update
our production databases through daily uploads from hand held computers in the
field. With the acquisition of the Postle and North Ward Estes
properties, we have assembled a team of 14 professionals averaging over 21 years
of expertise managing CO2 floods. This
provides us with the ability to pursue other CO2 flood
targets and employ this technology to add reserves to our
portfolio. This commitment to technology has increased the
productivity and efficiency of our field operations and development
activities.
In June
2009, we implemented a “Drill Well on Paper” (“DWOP”) process on our drilling
program in the Sanish field in North Dakota. This process involves
everyone who partakes in the drilling of a well and analyzes what synergies
exist to reduce the cost to drill a well. The first step in the process is
to determine the time required to drill a well assuming everything went right
(drill the well on paper). The next steps are how to apply this to drill
the perfect well in the field. Prior to starting the project the number of
days from well spud to total depth averaged 38 days. As of the end of
February 2010, we have reduced drilling time by 11 days to an average of 27
days, resulting in meaningful cost reductions. We will expand this program
to all of our Sanish field rigs in 2010.
Proved,
Probable and Possible Reserves
Our
estimated proved, probable and possible reserves as of December 31, 2009 are
summarized in the table below. See “Reserves” in Item 2 of this
Annual Report on Form 10-K for information relating to the uncertainties
surrounding these reserve categories.
|
Permian
Basin:
|
Oil
(MMBbl)
|
Natural
Gas
(Bcf)
|
Total
(MMBOE)
|
%
of Total
Proved
|
Future
Capital Expenditures
(In
millions)
|
|||||||||||||||
|
PDP
|
36.3 | 24.8 | 40.4 | 33 | % | |||||||||||||||
|
PDNP
|
25.4 | 11.9 | 27.4 | 22 | % | |||||||||||||||
|
PUD
|
50.6 | 29.5 | 55.5 | 45 | % | |||||||||||||||
|
Total
Proved
|
112.3 | 66.2 | 123.3 | 100 | % | $ | 921.6 | |||||||||||||
|
Total
Probable
|
41.4 | 50.2 | 49.7 | $ | 338.0 | |||||||||||||||
|
Total
Possible
|
89.8 | 13.5 | 92.1 | $ | 433.0 | |||||||||||||||
|
Rocky
Mountains:
|
||||||||||||||||||||
|
PDP
|
48.4 | 74.8 | 60.9 | 63 | % | |||||||||||||||
|
PDNP
|
0.5 | 1.9 | 0.8 | 1 | % | |||||||||||||||
|
PUD
|
21.3 | 82.7 | 35.1 | 36 | % | |||||||||||||||
|
Total
Proved
|
70.2 | 159.4 | 96.8 | 100 | % | $ | 333.1 | |||||||||||||
|
Total
Probable
|
12.0 | 107.1 | 29.9 | $ | 357.5 | |||||||||||||||
|
Total
Possible
|
69.9 | 130.7 | 91.7 | $ | 828.8 | |||||||||||||||
|
Mid-Continent:
|
||||||||||||||||||||
|
PDP
|
28.6 | 13.1 | 30.8 | 79 | % | |||||||||||||||
|
PDNP
|
1.5 | 0.5 | 1.6 | 4 | % | |||||||||||||||
|
PUD
|
6.5 | 1.6 | 6.7 | 17 | % | |||||||||||||||
|
Total
Proved
|
36.6 | 15.2 | 39.1 | 100 | % | $ | 107.7 | |||||||||||||
|
Total
Probable
|
2.3 | 0.0 | 2.3 | $ | 40.3 | |||||||||||||||
|
Total
Possible
|
2.7 | 0.8 | 2.8 | $ | 33.6 | |||||||||||||||
|
Gulf
Coast:
|
||||||||||||||||||||
|
PDP
|
1.7 | 18.7 | 4.8 | 57 | % | |||||||||||||||
|
PDNP
|
0.3 | 3.8 | 0.9 | 11 | % | |||||||||||||||
|
PUD
|
0.3 | 14.1 | 2.7 | 32 | % | |||||||||||||||
|
Total
Proved
|
2.3 | 36.6 | 8.4 | 100 | % | $ | 37.0 | |||||||||||||
|
Total
Probable
|
1.6 | 22.4 | 5.3 | $ | 56.5 | |||||||||||||||
|
Total
Possible
|
3.5 | 30.4 | 8.6 | $ | 116.5 | |||||||||||||||
|
Michigan:
|
||||||||||||||||||||
|
PDP
|
1.1 | 25.5 | 5.4 | 73 | % | |||||||||||||||
|
PDNP
|
1.0 | 3.8 | 1.6 | 22 | % | |||||||||||||||
|
PUD
|
0.3 | 0.7 | 0.4 | 5 | % | |||||||||||||||
|
Total
Proved
|
2.4 | 30.0 | 7.4 | 100 | % | $ | 6.3 | |||||||||||||
|
Total
Probable
|
1.5 | 2.2 | 1.9 | $ | 13.4 | |||||||||||||||
|
Total
Possible
|
0.7 | 9.5 | 2.3 | $ | 27.0 | |||||||||||||||
|
Total
Company:
|
||||||||||||||||||||
|
PDP
|
116.1 | 156.9 | 142.3 | 52 | % | |||||||||||||||
|
PDNP
|
28.7 | 21.9 | 32.3 | 12 | % | |||||||||||||||
|
PUD
|
79.0 | 128.6 | 100.4 | 36 | % | |||||||||||||||
|
Total
Proved
|
223.8 | 307.4 | 275.0 | 100 | % | $ | 1,405.7 | |||||||||||||
|
Total
Probable
|
58.8 | 181.9 | 89.1 | $ | 805.7 | |||||||||||||||
|
Total
Possible
|
166.6 | 184.9 | 197.5 | $ | 1,438.9 | |||||||||||||||
Marketing
and Major Customers
We
principally sell our oil and gas production to end users, marketers and other
purchasers that have access to nearby pipeline facilities. In areas
where there is no practical access to pipelines, oil is trucked to storage
facilities. During 2009, sales to Shell Western E&P, Inc., Plains
Marketing LP and EOG Resources, Inc. accounted for 18%, 15% and 13%,
respectively, of our total oil and natural gas sales. During 2008,
sales to Plains Marketing LP and Valero Energy Corporation accounted for 15% and
14%, respectively, of our total oil and natural gas sales. During
2007, sales to Valero Energy Corporation and Plains Marketing LP accounted for
14% and 13%, respectively, of our total oil and natural gas sales.
Title
to Properties
Our
properties are subject to customary royalty interests, liens under indebtedness,
liens incident to operating agreements, liens for current taxes and other
burdens, including other mineral encumbrances and restrictions. Our
credit agreement is also secured by a first lien on substantially all of our
assets. We do not believe that any of these burdens materially
interfere with the use of our properties in the operation of our
business.
We
believe that we have satisfactory title to or rights in all of our producing
properties. As is customary in the oil and gas industry, minimal
investigation of title is made at the time of acquisition of undeveloped
properties. In most cases, we investigate title and obtain title
opinions from counsel only when we acquire producing properties or before
commencement of drilling operations.
Competition
We
operate in a highly competitive environment for acquiring properties, marketing
oil and natural gas and securing trained personnel. Many of our
competitors possess and employ financial, technical and personnel resources
substantially greater than ours, which can be particularly important in the
areas in which we operate. Those companies may be able to pay more
for productive oil and gas properties and exploratory prospects and to evaluate,
bid for and purchase a greater number of properties and prospects than our
financial or personnel resources permit. Our ability to acquire
additional prospects and to find and develop reserves in the future will depend
on our ability to evaluate and select suitable properties and to consummate
transactions in a highly competitive environment. Also, there is
substantial competition for capital available for investment in the oil and gas
industry.
Regulation
Regulation
of Transportation, Sale and Gathering of Natural Gas
The
Federal Energy Regulatory Commission (“FERC”) regulates the transportation, and
to a lesser extent sale for resale, of natural gas in interstate commerce
pursuant to the Natural Gas Act of 1938 and the Natural Gas Policy Act of 1978
and regulations issued under those Acts. In 1989, however, Congress
enacted the Natural Gas Wellhead Decontrol Act, which removed all remaining
price and nonprice controls affecting wellhead sales of natural gas, effective
January 1, 1993. While sales by producers of natural gas and all
sales of crude oil, condensate and natural gas liquids can currently be made at
uncontrolled market prices, in the future Congress could reenact price controls
or enact other legislation with detrimental impact on many aspects of our
business.
Our
natural gas sales are affected by the availability, terms and cost of
transportation. The price and terms of access to pipeline
transportation and underground storage are subject to extensive federal and
state regulation. From 1985 to the present, several major regulatory
changes have been implemented by Congress and the FERC that affect the economics
of natural gas production, transportation and sales. In addition, the
FERC is continually proposing and implementing new rules and regulations
affecting those segments of the natural gas industry that remain subject to the
FERC's jurisdiction, most notably interstate natural gas transmission companies
and certain underground storage facilities. These initiatives may
also affect the intrastate transportation of natural gas under certain
circumstances. The stated purpose of many of these regulatory changes
is to promote competition among the various sectors of the natural gas industry
by making natural gas transportation more accessible to natural gas buyers and
sellers on an open and non-discriminatory basis.
The FERC
implemented The Outer Continental Shelf Lands Act pertaining to transportation
and pipeline issues, which requires that all pipelines operating on or across
the outer continental shelf provide open access and non-discriminatory
transportation service. One of the FERC’s principal goals in carrying
out this Act’s mandate is to increase transparency in the market to provide
producers and shippers on the outer continental shelf with greater assurance of
open access services on pipelines located on the outer continental shelf and
non-discriminatory rates and conditions of service on such
pipelines.
We cannot
accurately predict whether the FERC’s actions will achieve the goal of
increasing competition in markets in which our natural gas is
sold. In addition, many aspects of these regulatory developments have
not become final, but are still pending judicial and final FERC
decisions. Regulations implemented by the FERC in recent years could
result in an increase in the cost of transportation service on certain petroleum
product pipelines. The natural gas industry historically has been
very heavily regulated. Therefore, we cannot provide any assurance
that the less stringent regulatory approach recently established by the FERC
will continue. However, we do not believe that any action taken will
affect us in a way that materially differs from the way it affects other natural
gas producers.
Intrastate
natural gas transportation is subject to regulation by state regulatory
agencies. The basis for intrastate regulation of natural gas
transportation and the degree of regulatory oversight and scrutiny given to
intrastate natural gas pipeline rates and services varies from state to
state. Insofar as such regulation within a particular state will
generally affect all intrastate natural gas shippers within the state on a
comparable basis, we believe that the regulation of similarly situated
intrastate natural gas transportation in any of the states in which we operate
and ship natural gas on an intrastate basis will not affect our operations in
any way that is of material difference from those of our
competitors.
Pipeline
safety is regulated at both state and federal levels. After a final
rule was implemented by the U.S. Department of Transportation on March 15, 2006
that defines and puts new safety requirements on gas gathering pipelines, we
have screened our gas gathering lines and are implementing programs to comply
with applicable requirements of this section.
Regulation
of Transportation of Oil
Sales of
crude oil, condensate and natural gas liquids are not currently regulated and
are made at negotiated prices. Nevertheless, Congress could reenact
price controls in the future.
Our crude
oil sales are affected by the availability, terms and cost of
transportation. The transportation of oil in common carrier pipelines
is also subject to rate regulation. The FERC regulates interstate oil
pipeline transportation rates under the Interstate Commerce Act. In
general, interstate oil pipeline rates must be cost-based, although settlement
rates agreed to by all shippers are permitted and market-based rates may be
permitted in certain circumstances. Effective January 1, 1995,
the FERC implemented regulations establishing an indexing system (based on
inflation) for crude oil transportation rates that allowed for an increase or
decrease in the cost of transporting oil to the purchaser. FERC’s
regulations include a methodology for oil pipelines to change their rates
through the use of an index system that establishes ceiling levels for such
rates. The mandatory five year review has revised the methodology for
this index to now be based on Producer Price Index for Finished Goods (PPI-FG),
plus a 1.3% adjustment, for the period July 1, 2006 through July
2011. The regulations provide that each year the Commission will
publish the oil pipeline index after the PPI-FG becomes
available. Intrastate oil pipeline transportation rates are subject
to regulation by state regulatory commissions. The basis for
intrastate oil pipeline regulation, and the degree of regulatory oversight and
scrutiny given to intrastate oil pipeline rates, varies from state to
state. Insofar as effective interstate and intrastate rates are
equally applicable to all comparable shippers, we believe that the regulation of
oil transportation rates will not affect our operations in any way that is of
material difference from those of our competitors.
Further,
interstate and intrastate common carrier oil pipelines must provide service on a
non-discriminatory basis. Under this open access standard, common
carriers must offer service to all shippers requesting service on the same terms
and under the same rates. When oil pipelines operate at full
capacity, access is governed by prorationing provisions set forth in the
pipelines’ published tariffs. Accordingly, we believe that access to
oil pipeline transportation services generally will be available to us to the
same extent as to our competitors.
Regulation
of Production
The
production of oil and gas is subject to regulation under a wide range of local,
state and federal statutes, rules, orders and regulations. Federal,
state and local statutes and regulations require permits for drilling
operations, drilling bonds and periodic report submittals during
operations. All of the states in which we own and operate properties
have regulations governing conservation matters, including provisions for the
unitization or pooling of oil and gas properties, the establishment of maximum
allowable rates of production from oil and gas wells, the regulation of well
spacing, and plugging and abandonment of wells. The effect of these
regulations is to limit the amount of oil and gas that we can produce from our
wells and to limit the number of wells or the locations at which we can drill,
although we can apply for exceptions to such regulations or to have reductions
in well spacing. Moreover, each state generally imposes a production
or severance tax with respect to the production or sale of oil, gas and natural
gas liquids within its jurisdiction.
Some of
our offshore operations are conducted on federal leases that are administered by
Minerals Management Service, or MMS, and Whiting is required to comply with the
regulations and orders issued by MMS under the Outer Continental Shelf Lands
Act. Among other things, we are required to obtain prior MMS approval
for any exploration plans we pursue and approval for our lease development and
production plans. MMS regulations also establish construction
requirements for production facilities located on our federal offshore leases
and govern the plugging and abandonment of wells and the removal of production
facilities from these leases. Under limited circumstances, MMS could
require us to suspend or terminate our operations on a federal
lease.
MMS also
establishes the basis for royalty payments due under federal oil and gas leases
through regulations issued under applicable statutory
authority. State regulatory authorities establish similar standards
for royalty payments due under state oil and gas leases. The basis
for royalty payments established by MMS and the state regulatory authorities is
generally applicable to all federal and state oil and gas
lessees. Accordingly, we believe that the impact of royalty
regulation on our operations should generally be the same as the impact on our
competitors.
The
failure to comply with these rules and regulations can result in substantial
penalties. Our competitors in the oil and gas industry are subject to
the same regulatory requirements and restrictions that affect our
operations.
Environmental
Regulations
General. Our oil
and gas exploration, development and production operations are subject to
stringent federal, state and local laws and regulations governing the discharge
or release of materials into the environment or otherwise relating to
environmental protection. Numerous governmental agencies, such as the
U.S. Environmental Protection Agency (the “EPA”) issue regulations to implement
and enforce such laws, which often require difficult and costly compliance
measures that carry substantial administrative, civil and criminal penalties or
that may result in injunctive relief for failure to comply. These
laws and regulations may require the acquisition of a permit before drilling or
facility construction commences, restrict the types, quantities and
concentrations of various materials that can be released into the environment in
connection with drilling and production activities, limit or prohibit project
siting, construction, or drilling activities on certain lands located within
wilderness, wetlands, ecologically sensitive and other protected areas, require
remedial action to prevent pollution from former operations, such as plugging
abandoned wells or closing pits, and impose substantial liabilities for
unauthorized pollution resulting from our operations. The EPA and
analogous state agencies may delay or refuse the issuance of required permits or
otherwise include onerous or limiting permit conditions that may have a
significant adverse impact on our ability to conduct operations. The
regulatory burden on the oil and gas industry increases the cost of doing
business and consequently affects its profitability.
Changes
in environmental laws and regulations occur frequently, and any changes that
result in more stringent and costly material handling, storage, transport,
disposal or cleanup requirements could materially and adversely affect our
operations and financial position, as well as those of the oil and gas industry
in general. While we believe that we are in substantial compliance
with current applicable environmental laws and regulations and have not
experienced any material adverse effect from compliance with these environmental
requirements, there is no assurance that this trend will continue in the
future.
The
environmental laws and regulations which have the most significant impact on the
oil and gas exploration and production industry are as follows:
Superfund. The
Comprehensive Environmental Response, Compensation and Liability Act of 1980,
also known as “CERCLA” or “Superfund,” and comparable state laws impose
liability, without regard to fault or the legality of the original conduct, on
certain classes of persons that contributed to the release of a “hazardous
substance” into the environment. These persons include the “owner” or
“operator” of a disposal site or sites where a release occurred and entities
that disposed or arranged for the disposal of the hazardous substances found at
the site. Under CERCLA, such persons may be subject to strict, joint
and several liability for the costs of cleaning up the hazardous substances that
have been released into the environment, for damages to natural resources and
for the costs of certain health studies, and it is not uncommon for neighboring
landowners and other third parties to file claims for personal injury and
property damage allegedly caused by the hazardous substances released into the
environment. In the course of our ordinary operations, we may
generate material that may fall within CERCLA’s definition of a “hazardous
substance”. Consequently, we may be jointly and severally liable
under CERCLA or comparable state statutes for all or part of the costs required
to clean up sites at which these materials have been disposed or
released.
We
currently own or lease, and in the past have owned or leased, properties that
for many years have been used for the exploration and production of oil and
gas. Although we and our predecessors have used operating and
disposal practices that were standard in the industry at the time, hydrocarbons
or other materials may have been disposed or released on, under, or from the
properties owned or leased by us or on, under, or from other locations where
these hydrocarbons and materials have been taken for disposal. In
addition, many of these owned and leased properties have been operated by third
parties whose management and disposal of hydrocarbons and materials were not
under our control. Similarly, the disposal facilities where discarded
materials are sent are also often operated by third parties whose waste
treatment and disposal practices may not be adequate. While we only
use what we consider to be reputable disposal facilities, we might not know of a
potential problem if the disposal occurred before we acquired the property or
business, and if the problem itself is not discovered until years
later. Our properties, adjacent affected properties, the disposal
sites, and the material itself may be subject to CERCLA and analogous state
laws. Under these laws, we could be required:
|
·
|
to
remove or remediate previously disposed materials, including materials
disposed or released by prior owners or operators or other third
parties;
|
|
·
|
to
clean up contaminated property, including contaminated groundwater;
or
|
|
·
|
to
perform remedial operations to prevent future contamination, including the
plugging and abandonment of wells drilled and left inactive by prior
owners and operators.
|
At this
time, we do not believe that we are a potentially responsible party with respect
to any Superfund site and we have not been notified of any claim, liability or
damages under CERCLA.
Oil Pollution
Act. The Oil Pollution Act of 1990, also known as “OPA,” and
regulations issued under OPA impose strict, joint and several liability on
“responsible parties” for damages resulting from oil spills into or upon
navigable waters, adjoining shorelines or in the exclusive economic zone of the
United States. A “responsible party” includes the owner or operator
of an onshore facility and the lessee or permittee of the area in which an
offshore facility is located. The OPA establishes a liability limit
for onshore facilities of $350.0 million, while the liability limit for offshore
facilities is the payment of all removal costs plus up to $75.0 million in other
damages, but these limits may not apply if a spill is caused by a party’s gross
negligence or willful misconduct; the spill resulted from violation of a federal
safety, construction or operating regulation; or if a party fails to report a
spill or to cooperate fully in a cleanup. The OPA also requires the
lessee or permittee of the offshore area in which a covered offshore facility is
located to establish and maintain evidence of financial responsibility in the
amount of $35.0 million ($10.0 million if the offshore facility is located
landward of the seaward boundary of a state) to cover liabilities related to an
oil spill for which such person is statutorily responsible. The
amount of financial responsibility required under OPA may be increased up to
$150.0 million, depending on the risk represented by the quantity or quality of
oil that is handled by the facility. Any failure to comply with OPA’s
requirements or inadequate cooperation during a spill response action may
subject a responsible party to administrative, civil or criminal enforcement
actions. We believe we are in compliance with all applicable OPA
financial responsibility obligations. Moreover, we are not aware of
any action or event that would subject us to liability under OPA, and we believe
that compliance with OPA’s financial responsibility and other operating
requirements will not have a material adverse effect on us.
Resource Conservation Recovery
Act. The Resource Conservation and Recovery Act, also known as
“RCRA,” is the principal federal statute governing the treatment, storage and
disposal of hazardous wastes. RCRA imposes stringent operating
requirements and liability for failure to meet such requirements on a person who
is either a “generator” or “transporter” of hazardous waste or on an “owner” or
“operator” of a hazardous waste treatment, storage or disposal
facility. RCRA and many state counterparts specifically exclude from
the definition of hazardous waste “drilling fluids, produced waters, and other
wastes associated with the exploration, development, or production of crude oil,
natural gas or geothermal energy”. Therefore, a substantial portion
of RCRA’s requirements do not apply to our operations because we generate
minimal quantities of these hazardous wastes. However, these
exploration and production wastes may be regulated by state agencies as solid
waste. In addition, ordinary industrial wastes, such as paint wastes,
waste solvents, laboratory wastes, and waste compressor oils, may be regulated
as hazardous waste. Although we do not believe the current costs of
managing our materials constituting wastes as they are presently classified to
be significant, any repeal or modification of the oil and gas exploration and
production exemption by administrative, legislative or judicial process, or
modification of similar exemptions in analogous state statutes, would increase
the volume of hazardous waste we are required to manage and dispose of and would
cause us, as well as our competitors, to incur increased operating
expenses.
Clean Water
Act. The Federal Water Pollution Control Act of 1972, or the
Clean Water Act (the “CWA”), imposes restrictions and controls on the discharge
of produced waters and other pollutants into navigable
waters. Permits must be obtained to discharge pollutants into state
and federal waters and to conduct construction activities in waters and
wetlands. The CWA and certain state regulations prohibit the
discharge of produced water, sand, drilling fluids, drill cuttings, sediment and
certain other substances related to the oil and gas industry into certain
coastal and offshore waters without an individual or general National Pollutant
Discharge Elimination System discharge permit.
The EPA
had regulations under the authority of the CWA that required certain oil and gas
exploration and production projects to obtain permits for construction projects
with storm water discharges. However, the Energy Policy Act of 2005
nullified most of the EPA regulations that required storm water permitting of
oil and gas construction projects. There are still some state and
federal rules that regulate the discharge of storm water from some oil and gas
construction projects. Costs may be associated with the treatment of
wastewater and/or developing and implementing storm water pollution prevention
plans. The CWA and comparable state statutes provide for civil,
criminal and administrative penalties for unauthorized discharges of oil and
other pollutants and impose liability on parties responsible for those
discharges, for the costs of cleaning up any environmental damage caused by the
release and for natural resource damages resulting from the
release. In Section 40 CFR 112 of the regulations, the EPA
promulgated the Spill Prevention, Control, and Countermeasure, or SPCC,
regulations, which require certain oil containing facilities to prepare plans
and meet construction and operating standards. The SPCC regulations
were revised in 2002 and required the amendment of SPCC plans and the
modification of spill control devices at many facilities. Since 2002
there have been numerous amendments and extensions for compliance with the 2002
rule and subsequent amendments. On June 19, 2009, the EPA extended
the compliance dates until November 10, 2010 to allow the industry to comply
with the 2002 rule and subsequent amendments and the implementation of SPCC
plans. We believe that our operations comply in all material respects
with the requirements of the CWA and state statutes enacted to control water
pollution and that any amendment and subsequent implementation of our SPCC plans
will be performed in a timely manner and not have a significant impact on our
operations.
Clean Air Act. The
Clean Air Act restricts the emission of air pollutants from many sources,
including oil and gas operations. New facilities may be required to
obtain permits before work can begin, and existing facilities may be required to
obtain additional permits and incur capital costs in order to remain in
compliance. More stringent regulations governing emissions of toxic
air pollutants have been developed by the EPA and may increase the costs of
compliance for some facilities. We believe that we are in substantial
compliance with all applicable air emissions regulations and that we hold or
have applied for all permits necessary to our operations.
Global Warming and Climate
Control. Recent scientific studies have suggested that
emissions of certain gases, commonly referred to as “greenhouse gases”,
including carbon dioxide and methane, may be contributing to warming of the
Earth’s atmosphere. In response to such studies, President Obama has
expressed support for, and it is anticipated that the current session of
Congress will consider legislation to regulate emissions of greenhouse
gases. In addition, more than one-third of the states, either
individually or through multi-state regional initiatives, have already taken
legal measures to reduce emission of these gases, primarily through the planned
development of greenhouse gas emission inventories and/or regional greenhouse
gas cap and trade programs. Also, as a result of the U.S. Supreme
Court’s decision on April 2, 2007 in Massachusetts, et al. v. EPA,
the EPA may be required to regulate greenhouse gas emissions from mobile sources
(e.g., cars and trucks) even if Congress does not adopt new legislation
specifically addressing emissions of greenhouse gases. The Court’s
holding in Massachusetts that greenhouse
gases fall under the federal Clean Air Act’s definition of “air pollutant” may
also result in future regulation of greenhouse gas emissions from stationary
sources under certain Clean Air Act programs. As a result of the
Massachusetts decision,
in April 2009, the EPA published a Proposed Endangerment and Cause or Contribute
Findings for Greenhouse Gases Under the Clean Air Act. New
legislation or regulatory programs that restrict emissions of greenhouse gases
in areas where we operate could adversely affect our operations by increasing
costs. The cost increases would result from the potential new
requirements to install additional emission control equipment and by increasing
our monitoring and record-keeping burden.
Consideration of Environmental
Issues in Connection with Governmental Approvals. Our
operations frequently require licenses, permits and/or other governmental
approvals. Several federal statutes, including the Outer Continental
Shelf Lands Act, the National Environmental Policy Act, and the Coastal Zone
Management Act require federal agencies to evaluate environmental issues in
connection with granting such approvals and/or taking other major agency
actions. The Outer Continental Shelf Lands Act, for instance,
requires the U.S. Department of Interior to evaluate whether certain proposed
activities would cause serious harm or damage to the marine, coastal or human
environment. Similarly, the National Environmental Policy Act
requires the Department of Interior and other federal agencies to evaluate major
agency actions having the potential to significantly impact the
environment. In the course of such evaluations, an agency would have
to prepare an environmental assessment and, potentially, an environmental impact
statement. The Coastal Zone Management Act, on the other hand, aids
states in developing a coastal management program to protect the coastal
environment from growing demands associated with various uses, including
offshore oil and gas development. In obtaining various approvals from
the Department of Interior, we must certify that we will conduct our activities
in a manner consistent with these regulations.
Employees
As of
December 31, 2009, we had 481 full-time employees, including 29 senior level
geoscientists and 45 petroleum engineers. Our employees are not
represented by any labor unions. We consider our relations with our
employees to be satisfactory and have never experienced a work stoppage or
strike.
Available
Information
We
maintain a website at the address www.whiting.com. We
are not including the information contained on our website as part of, or
incorporating it by reference into, this report. We make available
free of charge (other than an investor’s own Internet access charges) through
our website our Annual Report on Form 10-K, quarterly reports on Form 10-Q and
current reports on Form 8-K, and amendments to these reports, as soon as
reasonably practicable after we electronically file such material with, or
furnish such material to, the Securities and Exchange Commission.
|
Item 1A.
|
Risk
Factors
|
Each of
the risks described below should be carefully considered, together with all of
the other information contained in this Annual Report on Form 10-K, before
making an investment decision with respect to our securities. If any
of the following risks develop into actual events, our business, financial
condition or results of operations could be materially and adversely affected,
and you may lose all or part of your investment.
Oil
and natural gas prices are very volatile. An extended period of low
oil and natural gas prices may adversely affect our business, financial
condition, results of operations or cash flows.
The oil
and gas markets are very volatile, and we cannot predict future oil and natural
gas prices. The price we receive for our oil and natural gas
production heavily influences our revenue, profitability, access to capital and
future rate of growth. The prices we receive for our production and
the levels of our production depend on numerous factors beyond our
control. These factors include, but are not limited to, the
following:
|
•
|
changes
in global supply and demand for oil and gas;
|
|
|
•
|
the
actions of the Organization of Petroleum Exporting
Countries;
|
|
|
•
|
the
price and quantity of imports of foreign oil and gas;
|
|
|
•
|
political
and economic conditions, including embargoes, in oil-producing countries
or affecting other oil-producing activity;
|
|
|
•
|
the
level of global oil and gas exploration and production
activity;
|
|
|
•
|
the
level of global oil and gas inventories;
|
|
|
•
|
weather
conditions;
|
|
|
•
|
technological
advances affecting energy consumption;
|
|
|
•
|
domestic
and foreign governmental regulations;
|
|
|
•
|
proximity
and capacity of oil and gas pipelines and other transportation
facilities;
|
|
|
•
|
the
price and availability of competitors’ supplies of oil and gas in captive
market areas; and
|
|
|
•
|
the
price and availability of alternative
fuels.
|
Furthermore,
the continued economic slowdown worldwide has reduced worldwide demand for
energy and resulted in lower oil and natural gas prices. Oil and
natural gas prices have fallen significantly since their third quarter 2008
levels. For example, the daily average NYMEX oil price was $118.13
per Bbl for the third quarter of 2008, $58.75 per Bbl for the fourth quarter of
2008, and $61.93 per Bbl for 2009. Similarly, daily average NYMEX
natural gas prices have declined from $10.27 per Mcf for the third quarter of
2008 to $6.96 per Mcf for the fourth quarter of 2008 and $3.99 per Mcf for
2009.
Lower oil
and natural gas prices may not only decrease our revenues on a per unit basis
but also may reduce the amount of oil and natural gas that we can produce
economically and therefore potentially lower our reserve bookings. A
substantial or extended decline in oil or natural gas prices may result in
impairments of our proved oil and gas properties and may materially and
adversely affect our future business, financial condition, results of
operations, liquidity or ability to finance planned capital
expenditures. To the extent commodity prices received from production
are insufficient to fund planned capital expenditures, we will be required to
reduce spending or borrow any such shortfall. Lower oil and natural
gas prices may also reduce the amount of our borrowing base under our credit
agreement, which is determined at the discretion of the lenders based on the
collateral value of our proved reserves that have been mortgaged to the lenders,
and is subject to regular redeterminations on May 1 and November 1 of each year,
as well as special redeterminations described in the credit
agreement.
The
global recession and tight financial markets may have impacts on our business
and financial condition that we currently cannot predict.
The
current global recession and tight credit financial markets may have an impact
on our business and our financial condition, and we may face challenges if
conditions in the financial markets do not improve. Our ability to
access the capital markets may be restricted at a time when we would like, or
need, to raise financing, which could have an impact on our flexibility to react
to changing economic and business conditions. The economic situation
could have an impact on our lenders or customers, causing them to fail to meet
their obligations to us. Additionally, market conditions could have
an impact on our commodity hedging arrangements if our counterparties are unable
to perform their obligations or seek bankruptcy protection.
Drilling
for and producing oil and natural gas are high risk activities with many
uncertainties that could adversely affect our business, financial condition or
results of operations.
Our
future success will depend on the success of our development, exploitation,
production and exploration activities. Our oil and natural gas
exploration and production activities are subject to numerous risks beyond our
control, including the risk that drilling will not result in commercially viable
oil or natural gas production. Our decisions to purchase, explore,
develop or otherwise exploit prospects or properties will depend in part on the
evaluation of data obtained through geophysical and geological analyses,
production data and engineering studies, the results of which are often
inconclusive or subject to varying interpretations. Please read “—
Reserve estimates depend on many assumptions that may turn out to be inaccurate
. . .” later in these Risk Factors for a discussion of the uncertainty involved
in these processes. Our cost of drilling, completing and operating
wells is often uncertain before drilling commences. Overruns in
budgeted expenditures are common risks that can make a particular project
uneconomical. Further, many factors may curtail, delay or cancel
drilling, including the following:
|
•
|
delays
imposed by or resulting from compliance with regulatory
requirements;
|
|
|
•
|
pressure
or irregularities in geological formations;
|
|
|
•
|
shortages
of or delays in obtaining qualified personnel or equipment, including
drilling rigs and CO2;
|
|
|
•
|
equipment
failures or accidents;
|
|
|
•
|
adverse
weather conditions, such as freezing temperatures, hurricanes and
storms;
|
|
|
•
|
reductions
in oil and natural gas prices; and
|
|
|
•
|
title
problems.
|
The
development of the proved undeveloped reserves in the North Ward Estes and
Postle fields may take longer and may require higher levels of capital
expenditures than we currently anticipate.
As of
December 31, 2009, undeveloped reserves comprised 47% of the North Ward Estes
field’s total estimated proved reserves and 18% of the Postle field’s total
estimated proved reserves. To fully develop these reserves, we expect
to incur future development costs of $573.9 million at the North Ward Estes
field and $44.4 million at the Postle field as of December 31,
2009. Together, these fields encompass 56% of our total estimated
future development costs of $1,103.2 million related to proved undeveloped
reserves. Development of these reserves may take longer and require
higher levels of capital expenditures than we currently
anticipate. In addition, the development of these reserves will
require the use of enhanced recovery techniques, including water flood and
CO2 injection
installations, the success of which is less predictable than traditional
development techniques. Therefore, ultimate recoveries from these
fields may not match current expectations.
Our
use of enhanced recovery methods creates uncertainties that could adversely
affect our results of operations and financial condition.
One of
our business strategies is to commercially develop oil reservoirs using enhanced
recovery technologies. For example, we inject water and CO2 into
formations on some of our properties to increase the production of oil and
natural gas. The additional production and reserves attributable to
the use of these enhanced recovery methods are inherently difficult to
predict. If our enhanced recovery programs do not allow for the
extraction of oil and gas in the manner or to the extent that we anticipate, our
future results of operations and financial condition could be materially
adversely affected. Additionally, our ability to utilize CO2 as an enhanced recovery
technique is subject to our ability to obtain sufficient quantities of CO2. Under our CO2 contracts, if the supplier
suffers an inability to deliver its contractually required quantities of CO2 to us and other parties with
whom it has CO2 contracts,
then the supplier may reduce the amount of CO2 on a pro rata basis it provides
to us and such other parties. If this occurs, we may not have
sufficient CO2 to produce
oil and natural gas in the manner or to the extent that we
anticipate. These contracts are also structured as “take-or-pay”
arrangements, which require us to continue to make payments even if we decide to
terminate or reduce our use of CO2 as part of our enhanced
recovery techniques.
Prospects
that we decide to drill may not yield oil or gas in commercially viable
quantities.
We
describe some of our current prospects and our plans to explore those prospects
in this Annual Report on Form 10-K. A prospect is a property on which
we have identified what our geoscientists believe, based on available seismic
and geological information, to be indications of oil or gas. Our
prospects are in various stages of evaluation, ranging from a prospect which is
ready to drill to a prospect that will require substantial additional seismic
data processing and interpretation. There is no way to predict in
advance of drilling and testing whether any particular prospect will yield oil
or gas in sufficient quantities to recover drilling or completion costs or to be
economically viable. The use of seismic data and other technologies
and the study of producing fields in the same area will not enable us to know
conclusively prior to drilling whether oil or gas will be present or, if
present, whether oil or gas will be present in commercial
quantities. In addition, because of the wide variance that results
from different equipment used to test the wells, initial flowrates may not be
indicative of sufficient oil or gas quantities in a particular
field. The analogies we draw from available data from other wells,
from more fully explored prospects, or from producing fields may not be
applicable to our drilling prospects. We may terminate our drilling
program for a prospect if results do not merit further investment.
If
oil and natural gas prices decrease, we may be required to take write-downs of
the carrying values of our oil and gas properties.
Accounting
rules require that we review periodically the carrying value of our oil and gas
properties for possible impairment. Based on specific market factors
and circumstances at the time of prospective impairment reviews, which may
include depressed oil and natural gas prices, and the continuing evaluation of
development plans, production data, economics and other factors, we may be
required to write down the carrying value of our oil and gas
properties. For example, we recorded a $9.4 million impairment
write-down during 2009 for the partial impairment of producing properties,
primarily natural gas, in the Rocky Mountains region. A write-down
constitutes a non-cash charge to earnings. We may incur additional
impairment charges in the future, which could have a material adverse effect on
our results of operations in the period taken.
Reserve
estimates depend on many assumptions that may turn out to be
inaccurate. Any material inaccuracies in these reserve estimates or
underlying assumptions will materially affect the quantities and present value
of our reserves.
The
process of estimating oil and natural gas reserves is complex. It
requires interpretations of available technical data and many assumptions,
including assumptions relating to economic factors. Any significant
inaccuracies in these interpretations or assumptions could materially affect the
estimated quantities and present value of reserves referred to in this Annual
Report on Form 10-K.
In order
to prepare our estimates, we must project production rates and timing of
development expenditures. We must also analyze available geological,
geophysical, production and engineering data. The extent, quality and
reliability of this data can vary. The process also requires economic
assumptions about matters such as oil and natural gas prices, drilling and
operating expenses, capital expenditures, taxes and availability of
funds. Therefore, estimates of oil and natural gas reserves are
inherently imprecise.
Actual
future production, oil and natural gas prices, revenues, taxes, exploration and
development expenditures, operating expenses and quantities of recoverable oil
and natural gas reserves most likely will vary from our
estimates. Any significant variance could materially affect the
estimated quantities and present value of reserves referred to in this Annual
Report on Form 10-K. In addition, we may adjust estimates of proved
reserves to reflect production history, results of exploration and development,
prevailing oil and natural gas prices and other factors, many of which are
beyond our control.
You
should not assume that the present value of future net revenues from our proved
reserves, as referred to in this report, is the current market value of our
estimated proved oil and natural gas reserves. In accordance with SEC
requirements, we generally base the estimated discounted future net cash flows
from our proved reserves on 12-month average prices and current costs as of the
date of the estimate. Actual future prices and costs may differ
materially from those used in the estimate. If natural gas prices
decline by $0.10 per Mcf, then the standardized measure of discounted future net
cash flows of our estimated proved reserves as of December 31, 2009 would have
decreased from $2,343.5 million to $2,335.5 million. If oil prices
decline by $1.00 per Bbl, then the standardized measure of discounted future net
cash flows of our estimated proved reserves as of December 31, 2009 would have
decreased from $2,343.5 million to $2,286.3 million.
Our
debt level and the covenants in the agreements governing our debt could
negatively impact our financial condition, results of operations, cash flows and
business prospects.
As of
December 31, 2009, we had $160.0 million in borrowings and
$0.3 million in letters of credit outstanding under Whiting Oil and Gas
Corporation’s credit agreement with $939.7 million of available borrowing
capacity, as well as $620.0 million of senior subordinated notes
outstanding. We are permitted to incur additional indebtedness,
provided we meet certain requirements in the indentures governing our senior
subordinated notes and Whiting Oil and Gas Corporation’s credit
agreement.
Our level of indebtedness and the
covenants contained in the agreements governing our debt could have important
consequences for our operations, including:
|
•
|
requiring
us to dedicate a substantial portion of our cash flow from operations to
required payments on debt, thereby reducing the availability of cash flow
for working capital, capital expenditures and other general business
activities;
|
|
|
•
|
potentially
limiting our ability to pay dividends in cash on our convertible perpetual
preferred stock;
|
|
|
•
|
limiting
our ability to obtain additional financing in the future for working
capital, capital expenditures, acquisitions and general corporate and
other activities;
|
|
|
•
|
limiting
our flexibility in planning for, or reacting to, changes in our business
and the industry in which we operate;
|
|
|
•
|
placing
us at a competitive disadvantage relative to other less leveraged
competitors; and
|
|
|
•
|
making
us vulnerable to increases in interest rates, because debt under Whiting
Oil and Gas Corporation’s credit agreement may be at variable
rates.
|
We may be
required to repay all or a portion of our debt on an accelerated basis in
certain circumstances. If we fail to comply with the covenants and
other restrictions in the agreements governing our debt, it could lead to an
event of default and the acceleration of our repayment of outstanding
debt. In addition, if we are in default under the agreements
governing our indebtedness, we will not be able to pay dividends on our capital
stock. Our ability to comply with these covenants and other
restrictions may be affected by events beyond our control, including prevailing
economic and financial conditions. Moreover, the borrowing base
limitation on Whiting Oil and Gas Corporation’s credit agreement is periodically
redetermined based on an evaluation of our reserves. Upon a
redetermination, if borrowings in excess of the revised borrowing capacity were
outstanding, we could be forced to repay a portion of our debt under the credit
agreement.
We may
not have sufficient funds to make such repayments. If we are unable
to repay our debt out of cash on hand, we could attempt to refinance such debt,
sell assets or repay such debt with the proceeds from an equity
offering. We may not be able to generate sufficient cash flow to pay
the interest on our debt or future borrowings, and equity financings or proceeds
from the sale of assets may not be available to pay or refinance such
debt. The terms of our debt, including Whiting Oil and Gas
Corporation’s credit agreement, may also prohibit us from taking such
actions. Factors that will affect our ability to raise cash through
an offering of our capital stock, a refinancing of our debt or a sale of assets
include financial market conditions and our market value and operating
performance at the time of such offering or other financing. We may
not be able to successfully complete any such offering, refinancing or sale of
assets.
The
instruments governing our indebtedness contain various covenants limiting the
discretion of our management in operating our business.
The
indentures governing our senior subordinated notes and Whiting Oil and Gas
Corporation’s credit agreement contain various restrictive covenants that may
limit our management’s discretion in certain respects. In particular,
these agreements will limit our and our subsidiaries’ ability to, among other
things:
|
•
|
pay
dividends on, redeem or repurchase our capital stock or redeem or
repurchase our subordinated debt;
|
|
|
•
|
make
loans to others;
|
|
|
•
|
make
investments;
|
|
|
•
|
incur
additional indebtedness or issue preferred stock;
|
|
|
•
|
create
certain liens;
|
|
|
•
|
sell
assets;
|
|
|
•
|
enter
into agreements that restrict dividends or other payments from our
restricted subsidiaries to us;
|
|
|
•
|
consolidate,
merge or transfer all or substantially all of the assets of us and our
restricted subsidiaries taken as a whole;
|
|
|
•
|
engage
in transactions with affiliates;
|
|
|
•
|
enter
into hedging contracts;
|
|
|
•
|
create
unrestricted subsidiaries; and
|
|
|
•
|
enter
into sale and leaseback
transactions.
|
In
addition, Whiting Oil and Gas Corporation’s credit agreement requires us, as of
the last day of any quarter, (i) to not exceed a total debt to EBITDAX ratio (as
defined in the credit agreement) for the last four quarters of 4.5 to 1.0 for
quarters ending prior to and on September 30, 2010, 4.25 to 1.0 for quarters
ending December 31, 2010 to June 30, 2011 and 4.0 to 1.0 for quarters ending
September 30, 2011 and thereafter, (ii) to have a consolidated current assets to
consolidated current liabilities ratio (as defined in the credit agreement) of
not less than 1.0 to 1.0 and (iii) to not exceed a senior secured debt to
EBITDAX ratio (as defined in the credit agreement) for the last four quarters of
2.75 to 1.0 for quarters ending prior to and on December 31, 2009 and 2.5 to 1.0
for quarters ending March 31, 2010 and thereafter. Also, the indentures under
which we issued our senior subordinated notes restrict us from incurring
additional indebtedness, subject to certain exceptions, unless our fixed charge
coverage ratio (as defined in the indentures) is at least 2.0 to
1. If we were in violation of this covenant, then we may not be able
to incur additional indebtedness, including under Whiting Oil and Gas
Corporation’s credit agreement. A substantial or extended decline in
oil or natural gas prices may adversely affect our ability to comply with these
covenants.
If we
fail to comply with the restrictions in the indentures governing our senior
subordinated notes or Whiting Oil and Gas Corporation’s credit agreement or any
other subsequent financing agreements, a default may allow the creditors, if the
agreements so provide, to accelerate the related indebtedness as well as any
other indebtedness to which a cross-acceleration or cross-default provision
applies. In addition, lenders may be able to terminate any
commitments they had made to make available further
funds. Furthermore, if we are in default under the agreements
governing our indebtedness, we will not be able to pay dividends on our capital
stock.
Our exploration
and development operations require substantial capital, and we may be unable to
obtain needed capital or financing on satisfactory terms, which could lead to a
loss of properties and a decline in our oil and natural gas
reserves.
The oil
and gas industry is capital intensive. We make and expect to continue
to make substantial capital expenditures in our business and operations for the
exploration, development, production and acquisition of oil and natural gas
reserves. To date, we have financed capital expenditures through a
combination of equity and debt issuances, bank borrowings and internally
generated cash flows. We intend to finance future capital
expenditures with cash flow from operations and existing financing
arrangements. Our cash flow from operations and access to capital is
subject to a number of variables, including:
|
•
|
our
proved reserves;
|
|
|
•
|
the
level of oil and natural gas we are able to produce from existing
wells;
|
|
|
•
|
the
prices at which oil and natural gas are sold;
|
|
|
•
|
the
costs of producing oil and natural gas; and
|
|
|
•
|
our
ability to acquire, locate and produce new
reserves.
|
If our
revenues or the borrowing base under our bank credit agreement decreases as a
result of lower oil and natural gas prices, operating difficulties, declines in
reserves or for any other reason, then we may have limited ability to obtain the
capital necessary to sustain our operations at current levels. We
may, from time to time, need to seek additional financing. There can
be no assurance as to the availability or terms of any additional
financing.
If
additional capital is needed, we may not be able to obtain debt or equity
financing on terms favorable to us, or at all. If cash generated by
operations or available under our revolving credit facility is not sufficient to
meet our capital requirements, the failure to obtain additional financing could
result in a curtailment of our operations relating to the exploration and
development of our prospects, which in turn could lead to a possible loss of
properties and a decline in our oil and natural gas reserves.
Our
acquisition activities may not be successful.
As part
of our growth strategy, we have made and may continue to make acquisitions of
businesses and properties. However, suitable acquisition candidates
may not continue to be available on terms and conditions we find acceptable, and
acquisitions pose substantial risks to our business, financial condition and
results of operations. In pursuing acquisitions, we compete with
other companies, many of which have greater financial and other resources to
acquire attractive companies and properties. The following are some
of the risks associated with acquisitions, including any completed or future
acquisitions:
|
•
|
some
of the acquired businesses or properties may not produce revenues,
reserves, earnings or cash flow at anticipated levels;
|
|
|
•
|
we
may assume liabilities that were not disclosed to us or that exceed our
estimates;
|
|
|
•
|
we
may be unable to integrate acquired businesses successfully and realize
anticipated economic, operational and other benefits in a timely manner,
which could result in substantial costs and delays or other operational,
technical or financial problems;
|
|
|
•
|
acquisitions
could disrupt our ongoing business, distract management, divert resources
and make it difficult to maintain our current business standards, controls
and procedures; and
|
|
|
•
|
we
may issue additional equity or debt securities related to future
acquisitions.
|
Substantial
acquisitions or other transactions could require significant external capital
and could change our risk and property profile.
In order
to finance acquisitions of additional producing or undeveloped properties, we
may need to alter or increase our capitalization substantially through the
issuance of debt or equity securities, the sale of production payments or other
means. These changes in capitalization may significantly affect our
risk profile. Additionally, significant acquisitions or other
transactions can change the character of our operations and
business. The character of the new properties may be substantially
different in operating or geological characteristics or geographic location than
our existing properties. Furthermore, we may not be able to obtain
external funding for future acquisitions or other transactions or to obtain
external funding on terms acceptable to us.
Our
identified drilling locations are scheduled out over several years, making them
susceptible to uncertainties that could materially alter the occurrence or
timing of their drilling.
We have
specifically identified and scheduled drilling locations as an estimation of our
future multi-year drilling activities on our existing acreage. As of
December 31, 2009, we had identified a drilling inventory of over 1,400 gross
drilling locations. These scheduled drilling locations represent a
significant part of our growth strategy. Our ability to drill and
develop these locations depends on a number of uncertainties, including oil and
natural gas prices, the availability of capital, costs of oil field goods and
services, drilling results, ability to extend drilling acreage leases beyond
expiration, regulatory approvals and other factors. Because of these
uncertainties, we do not know if the numerous potential drilling locations we
have identified will ever be drilled or if we will be able to produce oil or gas
from these or any other potential drilling locations. As such, our
actual drilling activities may materially differ from those presently
identified, which could adversely affect our business.
We
have been an early entrant into new or emerging plays. As a result,
our drilling results in these areas are uncertain, and the value of our
undeveloped acreage will decline and we may incur impairment charges if drilling
results are unsuccessful.
While our
costs to acquire undeveloped acreage in new or emerging plays have generally
been less than those of later entrants into a developing play, our drilling
results in these areas are more uncertain than drilling results in areas that
are developed and producing. Since new or emerging plays have limited
or no production history, we are unable to use past drilling results in those
areas to help predict our future drilling results. Therefore, our
cost of drilling, completing and operating wells in these areas may be higher
than initially expected, and the value of our undeveloped acreage will decline
if drilling results are unsuccessful. Furthermore, if drilling
results are unsuccessful, we may be required to write down the carrying value of
our undeveloped acreage in new or emerging plays. For example, during
the fourth quarter of 2008, we recorded a $10.9 million non-cash charge for the
partial impairment of unproved properties in the central Utah Hingeline
play. We may also incur such impairment charges in the future, which
could have a material adverse effect on our results of operations in the period
taken. Additionally, our rights to develop a portion of our
undeveloped acreage may expire if not successfully developed or
renewed. See “Acreage” in Item 2 of this Annual Report on Form 10-K
for more information relating to the expiration of our rights to develop
undeveloped acreage.
The
unavailability or high cost of additional drilling rigs, equipment, supplies,
personnel and oil field services could adversely affect our ability to execute
our exploration and development plans on a timely basis or within our
budget.
Shortages
or the high cost of drilling rigs, equipment, supplies or personnel could delay
or adversely affect our exploration and development operations, which could have
a material adverse effect on our business, financial condition, results of
operations or cash flows.
Properties
that we acquire may not produce as projected, and we may be unable to identify
liabilities associated with the properties or obtain protection from sellers
against them.
Our
business strategy includes a continuing acquisition program. From
2004 through 2009, we completed 15 separate acquisitions of producing properties
with a combined purchase price of $1,889.9 million for estimated proved reserves
as of the effective dates of the acquisitions of 230.7 MMBOE. The
successful acquisition of producing properties requires assessments of many
factors, which are inherently inexact and may be inaccurate, including the
following:
|
•
|
the
amount of recoverable reserves;
|
|
|
•
|
future
oil and natural gas prices;
|
|
|
•
|
estimates
of operating costs;
|
|
|
•
|
estimates
of future development costs;
|
|
|
•
|
timing
of future development costs;
|
|
|
•
|
estimates
of the costs and timing of plugging and
abandonment; and
|
|
|
•
|
potential
environmental and other
liabilities.
|
Our
assessment will not reveal all existing or potential problems, nor will it
permit us to become familiar enough with the properties to assess fully their
capabilities and deficiencies. In the course of our due diligence, we
may not inspect every well, platform or pipeline. Inspections may not
reveal structural and environmental problems, such as pipeline corrosion or
groundwater contamination, when they are made. We may not be able to
obtain contractual indemnities from the seller for liabilities that it
created. We may be required to assume the risk of the physical
condition of the properties in addition to the risk that the properties may not
perform in accordance with our expectations.
Our
use of oil and natural gas price hedging contracts involves credit risk and may
limit future revenues from price increases and result in significant
fluctuations in our net income.
We enter
into hedging transactions of our oil and natural gas production to reduce our
exposure to fluctuations in the price of oil and natural gas. Our
hedging transactions to date have consisted of financially settled crude oil and
natural gas forward sales contracts, primarily costless collars, placed with
major financial institutions. As of February 16, 2010, we had
contracts, which include our 24.2% share of the Whiting USA Trust I hedges,
covering the sale for 2010 of between 565,910 and 650,643 barrels of oil per
month and between 39,445 and 43,295 MMBtu of natural gas per
month. All our oil hedges will expire by November 2013, and all our
natural gas hedges will expire by December 2012. See “Quantitative
and Qualitative Disclosure about Market Risk” in Item 7A of this Annual Report
on Form 10-K for pricing and a more detailed discussion of our hedging
transactions.
We may in
the future enter into these and other types of hedging arrangements to reduce
our exposure to fluctuations in the market prices of oil and natural gas, or
alternatively, we may decide to unwind or restructure the hedging arrangements
we previously entered into. Hedging transactions expose us to risk of
financial loss in some circumstances, including if production is less than
expected, the other party to the contract defaults on its obligations or there
is a change in the expected differential between the underlying price in the
hedging agreement and actual prices received. Hedging transactions
may limit the benefit we may otherwise receive from increases in the price for
oil and natural gas. Furthermore, if we do not engage in hedging
transactions or unwind hedging transaction we previously entered into, then we
may be more adversely affected by declines in oil and natural gas prices than
our competitors who engage in hedging transactions. Additionally,
hedging transactions may expose us to cash margin requirements.
Effective
April 1, 2009, we elected to de-designate all of our commodity derivative
contracts that had been previously designated as cash flow hedges as of March
31, 2009 and have elected to discontinue hedge accounting
prospectively. As such, subsequent to March 31, 2009 we recognize all
gains and losses from prospective changes in commodity derivative fair values
immediately in earnings rather than deferring any such amounts in accumulated
other comprehensive income. Subsequently, we may experience
significant net income and operating result losses, on a non-cash basis, due to
changes in the value of our hedges as a result of commodity price
volatility.
Seasonal
weather conditions and lease stipulations adversely affect our ability to
conduct drilling activities in some of the areas where we operate.
Oil and
gas operations in the Rocky Mountains are adversely affected by seasonal weather
conditions and lease stipulations designed to protect various
wildlife. In certain areas, drilling and other oil and gas activities
can only be conducted during the spring and summer months. This
limits our ability to operate in those areas and can intensify competition
during those months for drilling rigs, oil field equipment, services, supplies
and qualified personnel, which may lead to periodic
shortages. Resulting shortages or high costs could delay our
operations and materially increase our operating and capital costs.
The
differential between the NYMEX or other benchmark price of oil and natural gas
and the wellhead price we receive could have a material adverse effect on our
results of operations, financial condition and cash flows.
The
prices that we receive for our oil and natural gas production generally trade at
a discount to the relevant benchmark prices such as NYMEX. The
difference between the benchmark price and the price we receive is called a
differential. We cannot accurately predict oil and natural gas
differentials. Increases in the differential between the benchmark
price for oil and natural gas and the wellhead price we receive could have a
material adverse effect on our results of operations, financial condition and
cash flows.
We
may incur substantial losses and be subject to substantial liability claims as a
result of our oil and gas operations.
We are
not insured against all risks. Losses and liabilities arising from
uninsured and underinsured events could materially and adversely affect our
business, financial condition or results of operations. Our oil and
natural gas exploration and production activities are subject to all of the
operating risks associated with drilling for and producing oil and natural gas,
including the possibility of:
|
•
|
environmental
hazards, such as uncontrollable flows of oil, gas, brine, well fluids,
toxic gas or other pollution into the environment, including groundwater
and shoreline contamination;
|
|
|
•
|
abnormally
pressured formations;
|
|
|
•
|
mechanical
difficulties, such as stuck oil field drilling and service tools and
casing collapse;
|
|
|
•
|
fires
and explosions;
|
|
|
•
|
personal
injuries and death; and
|
|
|
•
|
natural
disasters.
|
Any of
these risks could adversely affect our ability to conduct operations or result
in substantial losses to our company. We may elect not to obtain
insurance if we believe that the cost of available insurance is excessive
relative to the risks presented. In addition, pollution and
environmental risks generally are not fully insurable. If a
significant accident or other event occurs and is not fully covered by
insurance, then it could adversely affect us.
We
have limited control over activities on properties we do not operate, which
could reduce our production and revenues.
If we do
not operate the properties in which we own an interest, we do not have control
over normal operating procedures, expenditures or future development of
underlying properties. The failure of an operator of our wells to
adequately perform operations or an operator’s breach of the applicable
agreements could reduce our production and revenues. The success and
timing of our drilling and development activities on properties operated by
others therefore depends upon a number of factors outside of our control,
including the operator’s timing and amount of capital expenditures, expertise
and financial resources, inclusion of other participants in drilling wells, and
use of technology. Because we do not have a majority interest in most
wells we do not operate, we may not be in a position to remove the operator in
the event of poor performance.
Our
use of 3-D seismic data is subject to interpretation and may not accurately
identify the presence of oil and gas, which could adversely affect the results
of our drilling operations.
Even when
properly used and interpreted, 3-D seismic data and visualization techniques are
only tools used to assist geoscientists in identifying subsurface structures and
hydrocarbon indicators and do not enable the interpreter to know whether
hydrocarbons are, in fact, present in those structures. In addition,
the use of 3-D seismic and other advanced technologies requires greater
predrilling expenditures than traditional drilling strategies, and we could
incur losses as a result of such expenditures. Thus, some of our
drilling activities may not be successful or economical, and our overall
drilling success rate or our drilling success rate for activities in a
particular area could decline. We often gather 3-D seismic data over
large areas. Our interpretation of seismic data delineates for us
those portions of an area that we believe are desirable for
drilling. Therefore, we may choose not to acquire option or lease
rights prior to acquiring seismic data, and in many cases, we may identify
hydrocarbon indicators before seeking option or lease rights in the
location. If we are not able to lease those locations on acceptable
terms, it would result in our having made substantial expenditures to acquire
and analyze 3-D seismic data without having an opportunity to attempt to benefit
from those expenditures.
Market
conditions or operational impediments may hinder our access to oil and gas
markets or delay our production.
In
connection with our continued development of oil and gas properties, we may be
disproportionately exposed to the impact of delays or interruptions of
production from wells in these properties, caused by transportation capacity
constraints, curtailment of production or the interruption of transporting oil
and gas volumes produced. In addition, market conditions or a lack of
satisfactory oil and gas transportation arrangements may hinder our access to
oil and gas markets or delay our production. The availability of a
ready market for our oil and natural gas production depends on a number of
factors, including the demand for and supply of oil and natural gas and the
proximity of reserves to pipelines and terminal facilities. Our
ability to market our production depends substantially on the availability and
capacity of gathering systems, pipelines and processing facilities owned and
operated by third-parties. Additionally, entering into arrangements
for these services exposes us to the risk that third parties will default on
their obligations under such arrangements. Our failure to obtain such
services on acceptable terms or the default by a third party on their obligation
to provide such services could materially harm our business. We may
be required to shut in wells for a lack of a market or because access to gas
pipelines, gathering systems or processing facilities may be limited or
unavailable. If that were to occur, then we would be unable to
realize revenue from those wells until production arrangements were made to
deliver the production to market.
We
are subject to complex laws that can affect the cost, manner or feasibility of
doing business.
Exploration,
development, production and sale of oil and natural gas are subject to extensive
federal, state, local and international regulation. We may be
required to make large expenditures to comply with governmental
regulations. Matters subject to regulation include:
|
•
|
discharge
permits for drilling operations;
|
|
|
•
|
drilling
bonds;
|
|
|
•
|
reports
concerning operations;
|
|
|
•
|
the
spacing of wells;
|
|
|
•
|
unitization
and pooling of properties; and
|
|
|
•
|
taxation.
|
Under
these laws, we could be liable for personal injuries, property damage and other
damages. Failure to comply with these laws also may result in the
suspension or termination of our operations and subject us to administrative,
civil and criminal penalties. Moreover, these laws could change in
ways that could substantially increase our costs. Any such
liabilities, penalties, suspensions, terminations or regulatory changes could
materially adversely affect our financial condition and results of
operations.
Our
operations may incur substantial liabilities to comply with environmental laws
and regulations.
Our oil
and gas operations are subject to stringent federal, state and local laws and
regulations relating to the release or disposal of materials into the
environment or otherwise relating to environmental protection. These
laws and regulations may require the acquisition of a permit before drilling
commences; restrict the types, quantities, and concentration of materials that
can be released into the environment in connection with drilling and production
activities; limit or prohibit drilling activities on certain lands lying within
wilderness, wetlands, and other protected areas; and impose substantial
liabilities for pollution resulting from our operations. Failure to
comply with these laws and regulations may result in the assessment of
administrative, civil, and criminal penalties, incurrence of investigatory or
remedial obligations, or the imposition of injunctive relief. Under
these environmental laws and regulations, we could be held strictly liable for
the removal or remediation of previously released materials or property
contamination regardless of whether we were responsible for the release or if
our operations were standard in the industry at the time they were
performed. Federal law and some state laws also allow the government
to place a lien on real property for costs incurred by the government to address
contamination on the property.
Changes
in environmental laws and regulations occur frequently, and any changes that
result in more stringent or costly material handling, storage, transport,
disposal or cleanup requirements could require us to make significant
expenditures to maintain compliance and may otherwise have a material adverse
effect on our results of operations, competitive position, or financial
condition as well as those of the oil and gas industry in
general. For instance, recent scientific studies have suggested that
emissions of certain gases, commonly referred to as “greenhouse gases”,
including carbon dioxide and methane, may be contributing to warming of the
Earth’s atmosphere. In response to such studies, President Obama has
expressed support for, and it is anticipated that the current session of
Congress will consider legislation to regulate emissions of greenhouse
gases. In addition, more than one-third of the states, either
individually or through multi-state regional initiatives, have already taken
legal measures to reduce emission of these gases, primarily through the planned
development of greenhouse gas emission inventories and/or regional greenhouse
gas cap and trade programs. Also, as a result of the U.S. Supreme
Court’s decision on April 2, 2007 in Massachusetts, et al. v. EPA,
the EPA may be required to regulate greenhouse gas emissions from mobile sources
(e.g., cars and trucks) even if Congress does not adopt new legislation
specifically addressing emissions of greenhouse gases. The Court’s
holding in Massachusetts that greenhouse
gases fall under the federal Clean Air Act’s definition of “air pollutant” may
also result in future regulation of greenhouse gas emissions from stationary
sources under certain Clean Air Act programs. As a result of the
Massachusetts decision,
in April 2009, the EPA published a Proposed Endangerment and Cause or Contribute
Findings for Greenhouse Gases Under the Clean Air Act. New
legislation or regulatory programs that restrict emissions of greenhouse gases
in areas where we operate could adversely affect our operations by increasing
costs. The cost increases would result from the potential new
requirements to install additional emission control equipment and by increasing
our monitoring and record-keeping burden.
Unless
we replace our oil and natural gas reserves, our reserves and production will
decline, which would adversely affect our cash flows and results of
operations.
Unless we
conduct successful development, exploitation and exploration activities or
acquire properties containing proved reserves, our proved reserves will decline
as those reserves are produced. Producing oil and natural gas
reservoirs generally are characterized by declining production rates that vary
depending upon reservoir characteristics and other factors. Our
future oil and natural gas reserves and production, and therefore our cash flow
and income, are highly dependent on our success in efficiently developing and
exploiting our current reserves and economically finding or acquiring additional
recoverable reserves. We may not be able to develop, exploit, find or
acquire additional reserves to replace our current and future
production.
The
loss of senior management or technical personnel could adversely affect
us.
To a
large extent, we depend on the services of our senior management and technical
personnel. The loss of the services of our senior management or
technical personnel, including James J. Volker, our Chairman, President and
Chief Executive Officer; James T. Brown, our Senior Vice President; Rick A.
Ross, our Vice President, Operations; Peter W. Hagist, our Vice President,
Permian Operations; J. Douglas Lang, our Vice President, Reservoir
Engineering/Acquisitions; David M. Seery, our Vice President, Land; Michael J.
Stevens, our Vice President and Chief Financial Officer; or Mark R. Williams,
our Vice President, Exploration and Development, could have a material adverse
effect on our operations. We do not maintain, nor do we plan to obtain, any
insurance against the loss of any of these individuals.
Competition
in the oil and gas industry is intense, which may adversely affect our ability
to compete.
We
operate in a highly competitive environment for acquiring properties, marketing
oil and gas and securing trained personnel. Many of our competitors
possess and employ financial, technical and personnel resources substantially
greater than ours, which can be particularly important in the areas in which we
operate. Those companies may be able to pay more for productive oil
and gas properties and exploratory prospects and to evaluate, bid for and
purchase a greater number of properties and prospects than our financial or
personnel resources permit. Our ability to acquire additional
prospects and to find and develop reserves in the future will depend on our
ability to evaluate and select suitable properties and to consummate
transactions in a highly competitive environment. Also, there is
substantial competition for available capital for investment in the oil and gas
industry. We may not be able to compete successfully in the future in
acquiring prospective reserves, developing reserves, marketing hydrocarbons,
attracting and retaining quality personnel and raising additional
capital.
Certain
federal income tax deductions currently available with respect to oil and gas
exploration and development may be eliminated as a result of future
legislation.
In May
2009, President Obama’s Administration released revenue proposals in “General
Explanations of the Administration’s Fiscal 2010 Revenue Proposals” that would,
if enacted into law, make significant changes to United States tax laws,
including the elimination of certain key U.S. federal income tax preferences
currently available to oil and gas exploration and production
companies. These changes include, but are not limited to (i) the
repeal of the percentage depletion allowance for oil and gas properties, (ii)
the elimination of current deductions for intangible drilling and development
costs, (iii) the elimination of the deduction for certain U.S. production
activities and (iv) an extension of the amortization period for certain
geological and geophysical expenditures. In April 2009, the Oil
Industry Tax Break Repeal Act of 2009, or the Senate Bill, was introduced in the
Senate and includes many of the proposals outlined in the revenue
proposals. It is unclear whether any such changes will actually be
enacted or how soon any such changes could become effective. The
passage of any legislation as a result of the revenue proposals, the Senate Bill
or any other similar change in U.S. federal income tax law could eliminate
certain tax deductions that are currently available with respect to oil and gas
exploration and development, and any such change could negatively impact our
financial condition and results of operations.
|
Item 1B.
|
Unresolved Staff
Comments
|
None.
|
Item 2.
|
Properties
|
Summary
of Oil and Gas Properties and Projects
Permian
Basin Region
Our
Permian Basin operations include assets in Texas and New Mexico. As
of December 31, 2009, the Permian Basin region contributed 123.3 MMBOE (91%
oil) of estimated proved reserves to our portfolio of operations, which
represented 45% of our total estimated proved reserves and contributed 11.7
MBOE/d of average daily production in December 2009.
North Ward Estes
Field. The North Ward Estes field includes six base leases
with 100% working interest in approximately 58,000 gross and net acres in Ward
and Winkler Counties, Texas. The Yates Formation at 2,600 feet is the
primary producing zone with additional production from other zones including the
Queen at 3,000 feet. In the North Ward Estes field, the estimated
proved reserves as of December 31, 2009 were 30% PDP, 23% PDNP and 47%
PUD.
The North
Ward Estes field is responding positively to our water and CO2 floods, which we initiated in
May 2007. As of December 31, 2009, we were injecting 204 MMcf/d of
CO2 in this
field. Production from the field has increased 8% from 6.6 MBOE/d in
December 2008 to 7.1 MBOE/d in December 2009. In this field, we are
developing new and reactivated wells for water and CO2 injection and production
purposes.
Rocky
Mountain Region
Our Rocky
Mountain operations include assets in the states of North Dakota, Montana,
Colorado, Utah, Wyoming and California. As of December 31, 2009,
our estimated proved reserves in the Rocky Mountain region were 96.8 MMBOE (73%
oil), which represented 35% of our total estimated proved reserves and
contributed 30.3 MBOE/d of average daily production in December
2009.
Sanish Field. Our
Sanish area in Mountrail County, North Dakota encompasses approximately 118,000
gross (69,600 net) acres. December 2009 net production in the Sanish
field averaged 12.6 MBOE/d, a 68% increase from 7.5 MBOE/d in December
2008. As of February 15, 2010, we have participated in 123 wells (88
operated) in the Sanish field, of which 103 are producing, ten are in the
process of completion and ten are being drilled. Of these operated
wells, 38 were completed in 2009. In order to process the produced
gas stream from the Sanish wells, we constructed and brought on-line the
Robinson Lake Gas Plant. The first phase of this plant began
processing gas in May 2008, and in December 2008 we completed the construction
of the second phase. We completed the installation of the 17-mile oil
line connecting the Sanish field to the Enbridge pipeline in Stanley, North
Dakota in late December 2009. The pipeline is currently moving
approximately 10,000 Bbls of oil per day. We expect to have all of
our net operated oil production in the pipeline upon completion of Enbridge’s
tank facility at Stanley, which is expected to occur in June 2010.
Parshall
Field. Immediately east of the Sanish field is the Parshall
field, where we own interests in approximately 74,900 gross (18,400 net)
acres. Our net production from the Parshall field averaged 6.4 MBOE/d
in December 2009, a 4% decrease from 6.7 MBOE/d in December 2008. As
of February 15, 2010, we have participated in 114 Bakken wells in the Parshall
field, the majority of which are operated by EOG Resources, Inc., of which 111
are producing and three are in the process of completion. Of these
wells, 28 were completed in 2009.
Lewis & Clark
Prospect. As of December 31, 2009, we have assembled
approximately 213,500 gross (127,800 net) acres in our Lewis & Clark
prospect along the Bakken Shale pinch-out in the southern Williston
Basin. Subsequent to year-end we assembled additional acreage,
primarily in Stark County, North Dakota, which brings our total acreage position
in the Lewis & Clark area to 320,000 gross (202,400 net)
acres. In this area, the Upper Bakken shale is thermally mature,
moderately over-pressured, and we believe that it has charged reservoir zones
within the immediately underlying Three Forks formation.
Flat Rock
Field. We acquired the Flat Rock Field in May 2008 and took
over operations June 1, 2008. In the Flat Rock field area in Uintah
County, Utah, we have an acreage position consisting of approximately 22,000
gross (11,500 net) acres. We currently have one active drilling rig
operating in the field.
Sulphur Creek
Field. In the Sulphur Creek field in Rio Blanco County,
Colorado in the Piceance Basin, we own approximately 10,200 gross (4,500 net)
acres in the Sulphur Creek field area.
Mid-Continent
Region
Our
Mid-Continent operations include assets in Oklahoma, Arkansas and
Kansas. As of December 31, 2009, the Mid-Continent region
contributed 39.1 MMBOE (94% oil) of proved reserves to our portfolio of
operations, which represented 14% of our total estimated proved reserves and
contributed 9.3 MBOE/d of average daily production in December
2009. The majority of the proved value within our Mid-Continent
operations is related to properties in the Postle field.
Postle Field. The
Postle field, located in Texas County, Oklahoma, includes five producing units
and one producing lease covering a total of approximately 25,600 gross (24,200
net) acres. Four of the units are currently active CO2 enhanced recovery
projects. Our expansion of the CO2 flood at the Postle field
continues to generate positive results. As of December 31, 2009,
we were injecting 140 MMcf/d of CO2 in
this field. Production from the field has increased 30% from a net
7.1 MBOE/d in December 2008 to a net 9.2 MBOE/d in December
2009. Operations are underway to expand CO2 injection into the northern
part of the fourth unit, HMU, and to optimize flood patterns in the existing
CO2
floods. These expansion projects include the restoration of shut-in
wells and the drilling of new producing and injection wells. In the
Postle field, the estimated proved reserves as of December 31, 2009 were 78%
PDP, 4% PDNP and 18% PUD.
We are
the sole owner of the Dry Trails Gas Plant located in the Postle
field. This gas processing plant utilizes a membrane technology to
separate CO2 gas from the
produced wellhead mixture of hydrocarbon and CO2 gas so that the CO2 gas can be re-injected into the
producing formation.
In
addition to the producing assets and processing plant, we have a 60% interest in
the 120-mile TransPetco operated CO2 transportation pipeline,
thereby assuring the delivery of CO2 to the Postle field at a fair
tariff. A long-term CO2 purchase agreement was executed
in 2005 to provide the necessary CO2 for the expansion planned in
the field.
Gulf
Coast Region
Our Gulf
Coast operations include assets located in Texas, Louisiana and
Mississippi. As of December 31, 2009, the Gulf Coast region
contributed 8.4 MMBOE (27% oil) of proved reserves to our portfolio of
operations, which represented 3% of our total estimated proved reserves and
contributed 3.0 MBOE/d of average daily production in December
2009.
Edwards Trend. We own
acreage in the Nordheim, Word North, Yoakum, Kawitt, Sweet Home, and Three
Rivers fields along the Edwards Trend in Karnes, Dewitt, Live Oak, and Lavaca
Counties, Texas. In 2007, we farmed out the Kawitt and Nordheim lease
position (12,000 net acres) to another operator who is developing the Edwards
Trend with horizontal wellbores. Under the terms of this agreement,
we were carried on all drilling and completion costs on four Edwards Trend
wells, and Whiting maintained a 16.67% working interest in the completed
wells. Going forward, we had the option to participate upfront for a 25%
working interest in additional Edwards wells to be drilled or elect to take the
25% working interest after payout has occurred. To date, we have
elected to take a 25% after payout working interest in seven wells drilled under
this farmout. We anticipate three more wells to be proposed in 2010
which will fully develop the acreage under the agreement. This agreement
thereby allowed us to maintain a working interest in an expiring acreage
position, which is now held by production, and furthermore our acreage position
in this area has upside potential in the Eagle Ford shale that lies just above
the Edwards Trend.
Michigan
Region
As of
December 31, 2009, our estimated proved reserves in the Michigan region were 7.4
MMBOE (32% oil), and our December 2009 daily production averaged 2.3
MBOE/d. Production in Michigan can be divided into two
groups. The majority of the reserves are in non-operated Antrim Shale
wells located in the northern part of the state. The remainder of the
Michigan reserves are typified by more conventional oil and gas production
located in the central and southern parts of the state. We also
operate the West Branch and Reno gas processing plants. The West
Branch Plant gathers production from the Clayton unit, West Branch field and
other smaller fields.
Marion 3-D
Project. The Marion Prospect, located in Missauke, Clare and
Oceola Counties, Michigan, covers approximately 16,000 gross (14,700 net)
acres. Our analysis of seismic data has identified two drillable
prospects, and we are currently formulating our drilling plans for this
area.
Reserves
As of
December 31, 2009, all of our oil and gas reserves are attributable to
properties within the United States. A summary of our oil and gas
reserves as of December 31, 2009 based on average fiscal-year prices (calculated
as the unweighted arithmetic average of the first-day-of-the-month price for
each month within the 12-month period ended December 31, 2009) is as
follows:
|
Summary
of Oil and Gas Reserves as of Fiscal-Year End Based on Average Fiscal-Year
Prices
|
||||||||||||
|
Oil
(MBbl)
|
Natural
Gas
(MMcf)
|
Total
(MBOE)
|
||||||||||
|
Proved
reserves
|
||||||||||||
|
Developed
|
144,813 | 178,782 | 174,610 | |||||||||
|
Undeveloped
|
78,983 | 128,611 | 100,419 | |||||||||
|
Total
proved—December 31, 2009
|
223,796 | 307,393 | 275,029 | |||||||||
|
Probable
reserves
|
||||||||||||
|
Developed
|
1,360 | 9,844 | 3,000 | |||||||||
|
Undeveloped
|
57,463 | 172,045 | 86,138 | |||||||||
|
Total
probable—December 31, 2009
|
58,823 | 181,889 | 89,138 | |||||||||
|
Possible
reserves
|
||||||||||||
|
Developed
|
22,728 | 9,254 | 24,270 | |||||||||
|
Undeveloped
|
143,912 | 175,656 | 173,188 | |||||||||
|
Total
possible—December 31, 2009
|
166,640 | 184,910 | 197,458 | |||||||||
Proved
reserves. Estimates of proved developed and undeveloped
reserves are inherently imprecise and are continually subject to revision based
on production history, results of additional exploration and development, price
changes and other factors.
In 2009,
total extensions and discoveries of 32.1 MMBOE were primarily attributable to
successful drilling in the Sanish and Parshall fields and related proved
undeveloped well locations added during the year, which in turn extended the
proved acreage in those areas.
In 2009,
revisions to previous estimates increased proved developed and undeveloped
reserves by a net amount of 23.1 MMBOE. Included in these revisions
were (i) 17.3 MMBOE of net upward adjustments caused by higher crude oil prices
incorporated into our reserve estimates at December 31, 2009 as compared to
December 31, 2008 that were partially offset by lower natural gas prices as of
December 31, 2009, and (ii) 5.8 MMBOE of net upward adjustments attributable to
reservoir analysis and well performance. The liquids component of the
5.8 MMBOE revision consisted of a 14.8 MMBOE increase that was primarily related
to North Ward Estes, where additional field areas are now planned for CO2 injection and where the total
amount of CO2 planned for
injection into previously identified flood pattern areas has been
increased. The gas component of the 5.8 MMBOE revision consisted of a
9.0 MMBOE decrease that was primarily related to the Sulphur Creek field, where
reserve assignments for proved developed producing as well as proved undeveloped
well locations were adjusted downward to reflect the current performance of
producing wells.
Proved undeveloped
reserves. From December 31, 2008 to December 31, 2009, our
proved undeveloped reserves (“PUDs”) increased 26% or 20.4
MMBOE. This increase in proved undeveloped reserves was primarily
attributable to additional PUDs estimated at the Sanish and Parshall fields as
well as the North Ward Estes field. The Sanish and Parshall field PUD
extensions resulted from our significant drilling activity in those areas during
2009 and the related proved undeveloped well locations therefore
added. The additional PUDs estimated at North Ward Estes in 2009
related to new field areas now planned for CO2 injection and to previously
identified flood pattern areas where the total CO2 planned for injection has now
been increased. These PUD increases were partially offset by (i) 3.1
MMBOE in PUDs that were removed from the proved undeveloped reserve category
pursuant to the new SEC rules on oil and gas reserve estimation, which in most
cases disallow proved undeveloped reserves to remain in the PUD category for a
period of more than 5 years, and (ii) 5.5 MMBOE of PUDs that were converted into
proved developed reserves due to 39 proved undeveloped well locations that were
drilled and placed on production during 2009. We incurred $69.9
million in capital expenditures, or $12.71 per BOE, to drill and bring on-line
these 39 PUD locations.
The
quantities of PUDs that remain undeveloped after having been disclosed as proved
undeveloped reserves for a period of five years or more are insignificant as of
December 31, 2009. However, we do have material quantities of proved
undeveloped reserves at our North Ward Estes field that will remain in the PUD
category for periods extending beyond five years. Due to the large
areal extent of the field, the CO2 enhanced recovery project will
progress through the field in a sequential manner as earlier injection areas are
completed and new injection areas are initiated. This staged development
is necessary to allow efficient use of purchased and recycled CO2 as well as to enable facilities
to be properly sized for the most economical operation of the
field.
Probable
reserves. Estimates of probable developed and undeveloped
reserves are inherently imprecise. When producing an estimate of the
amount of oil and gas that is recoverable from a particular reservoir, an
estimated quantity of probable reserves is an estimate that is as likely as not
to be achieved. Estimates of probable reserves are also continually
subject to revision based on production history, results of additional
exploration and development, price changes and other factors.
We use
deterministic methods to estimate probable reserve quantities, and when
deterministic methods are used, it is as likely as not that actual remaining
quantities recovered will exceed the sum of estimated proved plus probable
reserves. Probable reserves may be assigned to areas of a reservoir
adjacent to proved reserves where data control or interpretations of available
data are less certain, even if the interpreted reservoir continuity of structure
or productivity does not meet the reasonable certainty
criterion. Probable reserves may be assigned to areas that are
structurally higher than the proved area if these areas are in communication
with the proved reservoir. Probable reserves estimates also include
potential incremental quantities associated with a greater percentage recovery
of the hydrocarbons in place than assumed for proved reserves.
Reductions
in probable reserves during 2009 were primarily attributable to probable
reserves in the Sanish and Parshall fields that were converted into proved
reserves and therefore transferred out of the probable reserve category into
proved. In addition, the participation agreement that we entered into
in 2009 to farmout a portion of our interest in 26 units in the western part of
our Sanish field also decreased our probable reserve quantities during
2009.
Possible
reserves. Estimates of possible developed and undeveloped
reserves are also inherently imprecise. When producing an estimate of
the amount of oil and gas that is recoverable from a particular reservoir, an
estimated quantity of possible reserves is an estimate that might be achieved,
but only under more favorable circumstances than are
likely. Estimates of possible reserves are also continually subject
to revision based on production history, results of additional exploration and
development, price changes and other factors.
We use
deterministic methods to estimate possible reserve quantities, and when
deterministic methods are used to estimate possible reserve quantities, the
total quantities ultimately recovered from a project have a low probability of
exceeding proved plus probable plus possible reserves. Possible
reserves may be assigned to areas of a reservoir adjacent to probable reserves
where data control and interpretations of available data are progressively less
certain. Frequently, this will be in areas where geoscience and
engineering data are unable to define clearly the area and vertical limits of
commercial production from the reservoir by a defined
project. Possible reserves also include incremental quantities
associated with a greater percentage recovery of the hydrocarbons in place than
the recovery quantities assumed for probable reserves.
Possible
reserves may be assigned where geoscience and engineering data identify directly
adjacent portions of a reservoir within the same accumulation that may be
separated from proved areas by faults with displacement less than formation
thickness or other geological discontinuities and that have not been penetrated
by a wellbore, and we believe that such adjacent portions are in communication
with the known (proved) reservoir. Possible reserves may be assigned
to areas that are structurally higher or lower than the proved area if these
areas are in communication with the proved reservoir.
Possible
reserves increased during 2009 primarily due to (i) North Ward Estes where
additional field areas are now planned for CO2 injection and where the total
amount of CO2 planned for
injection into previously identified flood pattern areas has been increased, and
(ii) the Sanish and Parhsall fields where additional possible reserves were
estimated for continued development of the Bakken formation and the anticipated
development of the Three Forks formations.
Preparation
of reserves estimates.
The
Company maintains adequate and effective internal controls over the reserve
estimation process as well as the underlying data upon which reserve estimates
are based. The primary inputs to the reserve estimation process are
comprised of technical information, financial data, ownership interests and
production data. All field and reservoir technical information, which
is updated annually, is assessed for validity when the reservoir engineers hold
technical meetings with geoscientists, operations and land personnel to discuss
field performance and to validate future development plans. Current
revenue and expense information is obtained from the Company’s accounting
records, which are subject to external quarterly reviews, annual audits and
their own set of internal controls over financial reporting. Internal
controls over financial reporting are assessed for effectiveness annually using
the criteria set forth in Internal Control – Integrated Framework issued by the
Committee of Sponsoring Organizations of the Treadway Commission. All
current financial data such as commodity prices, lease operating expenses,
production taxes and field commodity price differentials are updated in the
reserve database and then analyzed to ensure that they have been entered
accurately and that all updates are complete. The Company’s current
ownership in mineral interests and well production data are also subject to the
aforementioned internal controls over financial reporting, and they are
incorporated in the reserve database as well and verified to ensure their
accuracy and completeness. Once the reserve database has been
entirely updated with current information, and all relevant technical support
material has been assembled, Whiting’s independent engineering firm Cawley,
Gillespie & Associates, Inc. (“CG&A”) meets with Whiting’s technical
personnel in the Company’s Denver and Midland offices to review field
performance and future development plans in order to further verify their
validity. Following these reviews the reserve database is furnished
to CG&A so that they can prepare their independent reserve estimates and
final report. Access to the Company’s reserve database is restricted
to specific members of the reservoir engineering department.
CG&A
is a Texas Registered Engineering Firm. Our primary contact at CG&A is
Mr. Robert Ravnaas, Executive Vice President. Mr. Ravnaas is a State of
Texas Licensed Professional Engineer. See Exhibit 99.2 of this Annual
Report on Form 10-K for the Report of Cawley, Gillespie & Associates, Inc.
and further information regarding the professional qualifications of Mr.
Ravnaas.
Our Vice
President of Reservoir Engineering/ Acquisitions is responsible
for overseeing the preparation of the reserves estimates. He has over
36 years of experience, the majority of which has involved reservoir engineering
and reserve estimation, holds a Bachelor’s Degree in Petroleum Engineering from
the University of Wyoming, holds an MBA from the University of Denver and is a
registered Professional Engineer. He has also served on the national
Board of Directors of the Society of Petroleum Evaluation
Engineers.
Acreage
The
following table summarizes gross and net developed and undeveloped acreage by
state at December 31, 2009. Net acreage is our percentage
ownership of gross acreage. Acreage in which our interest is limited
to royalty and overriding royalty interests is excluded.
|
Developed
Acreage
|
Undeveloped
Acreage
|
Total
Acreage
|
||||||||||||||||||||||
|
Gross
|
Net
|
Gross**
|
Net**
|
Gross
|
Net
|
|||||||||||||||||||
|
California
|
32,929 | 8,951 | - | - | 32,929 | 8,951 | ||||||||||||||||||
|
Colorado
|
40,284 | 18,571 | 22,205 | 7,489 | 62,489 | 26,060 | ||||||||||||||||||
|
Louisiana
|
47,457 | 10,718 | 4,304 | 2,294 | 51,761 | 13,012 | ||||||||||||||||||
|
Michigan
|
140,825 | 63,510 | 40,673 | 24,128 | 181,498 | 87,638 | ||||||||||||||||||
|
Montana
|
42,382 | 13,875 | 8,753 | 4,227 | 51,135 | 18,102 | ||||||||||||||||||
|
North
Dakota
|
313,022 | 155,742 | 307,712 | 178,141 | 620,734 | 333,883 | ||||||||||||||||||
|
Oklahoma
|
91,428 | 59,781 | 772 | 471 | 92,200 | 60,252 | ||||||||||||||||||
|
Texas
|
216,109 | 135,818 | 52,189 | 41,751 | 268,298 | 177,569 | ||||||||||||||||||
|
Utah
|
23,090 | 14,162 | 257,566 | 61,650 | 280,656 | 75,812 | ||||||||||||||||||
|
Wyoming
|
96,955 | 55,496 | 75,638 | 50,365 | 172,593 | 105,861 | ||||||||||||||||||
|
Other*
|
15,063 | 8,703 | 3,524 | 1,674 | 18,587 | 10,377 | ||||||||||||||||||
|
Total
|
1,059,544 | 545,327 | 773,336 | 372,190 | 1,832,880 | 917,517 | ||||||||||||||||||
|
*
|
Other
includes Alabama, Arkansas, Kansas, Mississippi and New
Mexico.
|
|
**
|
Out
of a total of approximately 773,300 gross (372,200 net) undeveloped acres
as of December 31, 2009, the portion of our net undeveloped acres that is
subject to expiration over the next three years, if not successfully
developed or renewed, is approximately 14% in 2010, 18% in 2011, and 8% in
2012.
|
Production
History
The
following table presents historical information about our produced oil and gas
volumes:
|
Year
Ended December 31,
|
||||||||||||
|
2009
|
2008
|
2007
|
||||||||||
|
Oil
production (MMBbls)
|
15.4 | 12.4 | 9.6 | |||||||||
|
Natural
gas production (Bcf)
|
29.3 | 30.4 | 30.8 | |||||||||
|
Total
production (MMBOE)
|
20.3 | 17.5 | 14.7 | |||||||||
|
Daily
production (MBOE/d)
|
55.5 | 47.9 | 40.3 | |||||||||
|
North
Ward Estes field production (1)
|
||||||||||||
|
Oil
production (MMBbls)
|
2.2 | 1.9 | 1.6 | |||||||||
|
Natural
gas production (Bcf)
|
0.6 | 1.2 | 1.8 | |||||||||
|
Total
production (MMBOE)
|
2.3 | 2.1 | 2.0 | |||||||||
|
Average
sales prices (including transfers):
|
||||||||||||
|
Oil
(per Bbl)
|
$ | 52.51 | $ | 86.99 | $ | 64.57 | ||||||
|
Natural
gas (per Mcf)
|
$ | 3.75 | $ | 7.68 | $ | 6.19 | ||||||
|
Average
production costs:
|
||||||||||||
|
Production
costs (per BOE) (2)
|
$ | 11.10 | $ | 12.81 | $ | 13.08 | ||||||
|
(1)
|
The
North Ward Estes field was our only field that contained 15% or more of
our total proved reserve volumes as of December 31,
2009.
|
|
(2)
|
Production
costs reported above exclude from lease operating expenses ad valorem
taxes of $12.2 million ($0.61 per BOE), $16.8 million ($0.96 per BOE), and
$16.5 million ($1.12 per BOE) for the years ended December 31, 2009, 2008
and 2007, respectively.
|
Productive
Wells
The
following table summarizes gross and net productive oil and natural gas wells by
region at December 31, 2009. A net well is our percentage
ownership of a gross well. Wells in which our interest is limited to
royalty and overriding royalty interests are excluded.
|
Oil
Wells
|
Natural
Gas Wells
|
Total
Wells(1)
|
||||||||||||||||||||||
|
Gross
|
Net
|
Gross
|
Net
|
Gross
|
Net
|
|||||||||||||||||||
|
Permian
Basin
|
4,030 | 1,772 | 395 | 132 | 4,425 | 1,904 | ||||||||||||||||||
|
Rocky
Mountains
|
2,199 | 481 | 481 | 262 | 2,680 | 743 | ||||||||||||||||||
|
Mid-Continent
|
568 | 358 | 201 | 83 | 769 | 441 | ||||||||||||||||||
|
Gulf
Coast
|
95 | 51 | 470 | 122 | 565 | 173 | ||||||||||||||||||
|
Michigan
|
78 | 41 | 1,099 | 417 | 1,177 | 458 | ||||||||||||||||||
|
Total
|
6,970 | 2,703 | 2,646 | 1,016 | 9,616 | 3,719 | ||||||||||||||||||
|
(1)
|
133
wells are multiple completions. These 133 wells contain a total
of 326 completions. One or more completions in the same bore
hole are counted as one well.
|
We have an interest in or operate 16
enhanced oil recovery projects, which include both secondary (waterflood) and
tertiary (CO2 injection)
recovery efforts, and aggregate production from such enhanced oil recovery
fields averaged 17.3 MBOE/d during 2009 or 31.2% of our 2009 daily
production. For these areas, we need to use enhanced recovery
techniques in order to maintain oil and gas production from these
fields.
Drilling
Activity
We are
engaged in numerous drilling activities on properties presently owned and intend
to drill or develop other properties acquired in the future. As of
December 31, 2009, we were drilling five gross (2.7 net) wells in the Sanish
field and one gross and net well in the Flat Rock field. All of these
wells were intended to be productive wells rather than service
wells.
The
following table sets forth our drilling activity for the last three
years. A dry well is an exploratory, development or extension well
that proves to be incapable of producing either oil or gas in sufficient
quantities to justify completion as an oil or gas well. A productive
well is an exploratory, development or extension well that is not a dry
well. The information should not be considered indicative of future
performance, nor should it be assumed that there is necessarily any correlation
between the number of productive wells drilled and quantities of reserves
found.
|
Gross
Wells
|
Net
Wells
|
|||||||||||||||||||||||
|
Productive
|
Dry
|
Total
|
Productive
|
Dry
|
Total
|
|||||||||||||||||||
|
2009:
|
||||||||||||||||||||||||
|
Development
|
137 | 4 | 141 | 50.2 | 2.6 | 52.8 | ||||||||||||||||||
|
Exploratory
|
1 | 3 | 4 | 0.9 | 2.5 | 3.4 | ||||||||||||||||||
|
Total
|
138 | 7 | 145 | 51.1 | 5.1 | 56.2 | ||||||||||||||||||
|
2008:
|
||||||||||||||||||||||||
|
Development
|
283 | 20 | 303 | 113.3 | 9.2 | 122.5 | ||||||||||||||||||
|
Exploratory
|
2 | 3 | 5 | 1.9 | 1.3 | 3.2 | ||||||||||||||||||
|
Total
|
285 | 23 | 308 | 115.2 | 10.5 | 125.7 | ||||||||||||||||||
|
2007:
|
||||||||||||||||||||||||
|
Development
|
262 | 5 | 267 | 128.6 | 3.8 | 132.4 | ||||||||||||||||||
|
Exploratory
|
9 | 1 | 10 | 6.1 | 0.1 | 6.2 | ||||||||||||||||||
|
Total
|
271 | 6 | 277 | 134.7 | 3.9 | 138.6 | ||||||||||||||||||
As of
December 31, 2009, six operated drilling rigs and 32 operated workover rigs were
active on our properties. We were also participating in the drilling
of three non-operated wells, two of which are located in the Parshall field and
one in the Gulf Coast area. The breakdown of our operated rigs is as
follows:
|
Region
|
Drilling
|
Workover
|
||||||
|
Rocky
Mountain
|
6 | 7 | ||||||
|
Permian
|
- | 4 | ||||||
|
Mid-Continent/Michigan
|
- | 1 | ||||||
|
North
Ward Estes
|
- | 19 | ||||||
|
Postle
|
- | 1 | ||||||
|
Gulf
Coast
|
- | - | ||||||
|
Total
|
6 | 32 | ||||||
Delivery
Commitments
Our
production sales agreements contain customary terms and conditions for the oil
and natural gas industry, generally provide for sales based on prevailing market
prices in the area, and generally have terms of one year or less. We have
also entered into physical delivery contracts which require us to deliver fixed
volumes of natural gas. As of December 31, 2009, we had delivery
commitments of 9.8 Bcf (or 34% of total 2009 natural gas production), 9.1 Bcf
(31%) and 5.3 Bcf (18%) for the years ended December 31, 2010, 2011 and 2012,
respectively. These contracts were related to production at our Boies
Ranch prospect in Rio Blanco County, Colorado, at our Antrim Shale wells in
Michigan and at our Flat Rock field in Uintah County, Utah. We believe our
production and reserves are adequate to meet these delivery
commitments. See “Quantitative and Qualitative Disclosure about
Market Risk” in Item 7A of this Annual Report on Form 10-K for more information
about these contracts.
|
Item 3.
|
Legal
Proceedings
|
Whiting
is subject to litigation claims and governmental and regulatory proceedings
arising in the ordinary course of business. It is management’s
opinion that all claims and litigation we are involved in are not likely to have
a material adverse effect on our consolidated financial position, cash flows or
results of operations.
|
Item 4.
|
Reserved
|
EXECUTIVE OFFICERS OF THE
REGISTRANT
The
following table sets forth certain information, as of February 15, 2010,
regarding the executive officers of Whiting Petroleum Corporation:
|
Name
|
Age
|
Position
|
|
James
J. Volker
|
63
|
Chairman,
President and Chief Executive Officer
|
|
James
T. Brown
|
57
|
Senior
Vice President
|
|
Bruce
R. DeBoer
|
57
|
Vice
President, General Counsel and Corporate Secretary
|
|
Heather
M. Duncan
|
39
|
Vice
President, Human Resources
|
|
Jack
R. Ekstrom
|
63
|
Vice
President, Corporate and Government Relations
|
|
J.
Douglas Lang
|
60
|
Vice
President, Reservoir Engineering/Acquisitions
|
|
Rick
A. Ross
|
51
|
Vice
President, Operations
|
|
David
M. Seery
|
55
|
Vice
President, Land
|
|
Michael
J. Stevens
|
44
|
Vice
President and Chief Financial Officer
|
|
Mark
R. Williams
|
53
|
Vice
President, Exploration and Development
|
|
Brent
P. Jensen
|
40
|
Controller
and Treasurer
|
The
following biographies describe the business experience of our executive
officers:
James J. Volker joined us in
August 1983 as Vice President of Corporate Development and served in that
position through April 1993. In March 1993, he became a contract
consultant to us and served in that capacity until August 2000, at which time he
became Executive Vice President and Chief Operating Officer. Mr.
Volker was appointed President and Chief Executive Officer and a director in
January 2002 and Chairman of the Board in January 2004. Mr. Volker
was co-founder, Vice President and later President of Energy Management
Corporation from 1971 through 1982. He has over 30 years of
experience in the oil and gas industry. Mr. Volker has a degree in
finance from the University of Denver, an MBA from the University of Colorado
and has completed H. K. VanPoolen and Associates’ course of study in reservoir
engineering.
James T. Brown joined us in
May 1993 as a consulting engineer. In March 1999, he became
Operations Manager, in January 2000, he became Vice President of Operations, and
in May 2007, he became Senior Vice President. Mr. Brown has over 30
years of oil and gas experience in the Rocky Mountains, Gulf Coast, California
and Alaska. Mr. Brown is a graduate of the University of Wyoming,
with a Bachelor’s Degree in civil engineering, and the University of Denver,
with an MBA.
Bruce R. DeBoer joined us as our Vice
President, General Counsel and Corporate Secretary in January
2005. From January 1997 to May 2004, Mr. DeBoer served as Vice
President, General Counsel and Corporate Secretary of Tom Brown, Inc., an
independent oil and gas exploration and production company. Mr.
DeBoer has over 25 years of experience in managing the legal departments of
several independent oil and gas companies. He holds a Bachelor of
Science Degree in Political Science from South Dakota State University and
received his J.D. and MBA degrees from the University of South
Dakota.
Heather M. Duncan joined us
in February 2002 as Assistant Director of Human Resources and in January 2003
became Director of Human Resources. In January 2008, she was
appointed Vice President of Human Resources. Ms. Duncan has 13 years
of human resources experience in the oil and gas industry. She holds
a Bachelor of Arts Degree in Anthropology and an MBA from the University of
Colorado. She is a certified Senior Professional in Human
Resources.
Jack R. Ekstrom joined us in
October 2008 as Executive Director, Corporate Communications and Investor
Relations, and became Vice President, Corporate and Government Relations in
January 2010. From 2004 to 2008, Mr. Ekstrom served as the Director of
Government Affairs for Pioneer Natural Resources, an independent oil and gas
exploration and production company. Prior to this he served as the
Director of Government Affairs for Evergreen Resources and Forest Oil. He
has 35 years of experience in the oil and gas industry. Mr. Ekstrom is a
Director of the Colorado Oil & Gas Association and the Independent Petroleum
Association of Mountain States, and is a past chairman of the Western Business
Roundtable and past president of the Denver Petroleum Club. He holds
a Bachelor of Arts Degree in Communications from Augustana College in Rock
Island, Illinois.
J. Douglas Lang joined us in
December 1999 as Senior Acquisition Engineer and became Manager of Acquisitions
and Reservoir Engineering in January 2004 and Vice President—Reservoir
Engineering/ Acquisitions in October
2004. His over 36 years of acquisition and reservoir engineering
experience has included staff and managerial positions with Amoco, Petro-Lewis,
General Atlantic Resources, UMC Petroleum and Ocean Energy. Mr. Lang
holds a Bachelor’s Degree in Petroleum Engineering from the University of
Wyoming and an MBA from the University of Denver. He is a registered
Professional Engineer and has served on the national Board of Directors of the
Society of Petroleum Evaluation Engineers.
Rick A. Ross joined us in
March 1999 as an Operations Manager. In May 2007, he became Vice
President of Operations. Mr. Ross has 27 years of oil and gas
experience, including 17 years with Amoco Production Company where he served in
various technical and managerial positions. Mr. Ross holds a Bachelor
of Science Degree in Mechanical Engineering from the South Dakota School of
Mines and Technology. He is a registered Professional Engineer and is
currently Chairman of the North Dakota Petroleum Council.
David M. Seery joined us as
our Manager of Land in July 2004 as a result of our acquisition of Equity Oil
Company, where he was Manager of Land and Manager of Equity’s Exploration
Department, positions he had held for more than five years. He became
our Vice President of Land in January 2005. Mr. Seery has 29 years of
land experience including staff and managerial positions with Marathon Oil
Company. Mr. Seery holds a Bachelor of Science Degree in Business
Administration from the University of Montana.
Michael J. Stevens joined us
in May 2001 as Controller, and became Treasurer in January 2002 and became Vice
President and Chief Financial Officer in March 2005. From 1993 until
May 2001, he served in various positions including Chief Financial Officer,
Controller, Secretary and Treasurer at Inland Resources Inc., a company engaged
in oil and gas exploration and development. He spent seven years in
public accounting with Coopers & Lybrand in Minneapolis,
Minnesota. He is a graduate of Mankato State University of Minnesota
and is a Certified Public Accountant.
Mark R. Williams joined us in
December 1983 as Exploration Geologist and has been Vice President of
Exploration and Development since December 1999. He has 27 years of
domestic and international experience in the oil and gas
industry. Mr. Williams holds a Master’s Degree in geology from the
Colorado School of Mines and a Bachelor’s Degree in geology from the University
of Utah.
Brent P. Jensen joined us in
August 2005 as Controller, and he became Controller and Treasurer in January
2006. He was previously with PricewaterhouseCoopers L.L.P. in
Houston, Texas, where he held various positions in their oil and gas audit
practice since 1994, which included assignments of four years in Moscow, Russia
and three years in Milan, Italy. He has 16 years of oil and gas
accounting experience and is a Certified Public Accountant. Mr.
Jensen holds a Bachelor of Arts degree from the University of California, Los
Angeles.
Executive
officers are elected by, and serve at the discretion of, the Board of
Directors. There are no family relationships between any of our
directors or executive officers.
PART
II
|
Item 5.
|
Market for the Registrant’s Common Equity, Related
Stockholder Matters and Issuer Purchases of Equity
Securities
|
Whiting
Petroleum Corporation’s common stock is traded on the New York Stock Exchange
under the symbol “WLL”. The following table shows the high and low
sale prices for our common stock for the periods presented.
|
High
|
Low
|
|||||||
|
Fiscal
Year Ended December 31, 2009
|
||||||||
|
Fourth
Quarter (Ended December 31, 2009)
|
$ | 75.65 | $ | 52.67 | ||||
|
Third
Quarter (Ended September 30, 2009)
|
$ | 59.41 | $ | 29.77 | ||||
|
Second
Quarter (Ended June 30, 2009)
|
$ | 49.94 | $ | 24.54 | ||||
|
First
Quarter (Ended March 31, 2009)
|
$ | 44.99 | $ | 19.26 | ||||
|
Fiscal
Year Ended December 31, 2008
|
||||||||
|
Fourth
Quarter (Ended December 31, 2008)
|
$ | 69.58 | $ | 24.36 | ||||
|
Third
Quarter (Ended September 30, 2008)
|
$ | 112.42 | $ | 62.09 | ||||
|
Second
Quarter (Ended June 30, 2008)
|
$ | 108.53 | $ | 63.07 | ||||
|
First
Quarter (Ended March 31, 2008)
|
$ | 66.19 | $ | 44.60 | ||||
On
February 15, 2010, there were 691 holders of record of our common
stock.
We have
not paid any dividends on our common stock since we were incorporated in July
2003, and we do not anticipate paying any such dividends on our common stock in
the foreseeable future. We currently intend to retain future
earnings, if any, to finance the expansion of our business. Our
future dividend policy is within the discretion of our board of directors and
will depend upon various factors, including our financial position, cash flows,
results of operations, capital requirements and investment
opportunities. Except for limited exceptions, which include the
payment of dividends on our 6.25% convertible perpetual preferred stock, our
credit agreement restricts our ability to make any dividends or distributions on
our common stock. Additionally, the indentures governing our senior
subordinated notes contain restrictive covenants that may limit our ability to
pay cash dividends on our common stock and our 6.25% convertible perpetual
preferred stock.
Information
relating to compensation plans under which our equity securities are authorized
for issuance is set forth in Part III, Item 12 of this Annual Report
on Form 10-K.
The
following information in this Item 5 of this Annual Report on Form 10-K is
not deemed to be “soliciting material” or to be “filed” with the SEC or subject
to Regulation 14A or 14C under the Securities Exchange Act of 1934 or to
the liabilities of Section 18 of the Securities Exchange Act of 1934, and
will not be deemed to be incorporated by reference into any filing under the
Securities Act of 1933 or the Securities Exchange Act of 1934, except to the
extent we specifically incorporate it by reference into such a
filing.
The
following graph compares on a cumulative basis changes since December 31, 2004
in (a) the total stockholder return on our common stock with (b) the
total return on the Standard & Poor’s Composite 500 Index and
(c) the total return on the Dow Jones US Oil Companies, Secondary
Index. Such changes have been measured by dividing (a) the sum
of (i) the amount of dividends for the measurement period, assuming
dividend reinvestment, and (ii) the difference between the price per share
at the end of and the beginning of the measurement period, by (b) the price
per share at the beginning of the measurement period. The graph
assumes $100 was invested on December 31, 2004 in our common stock, the
Standard & Poor’s Composite 500 Index and the Dow Jones US Oil
Companies, Secondary Index.
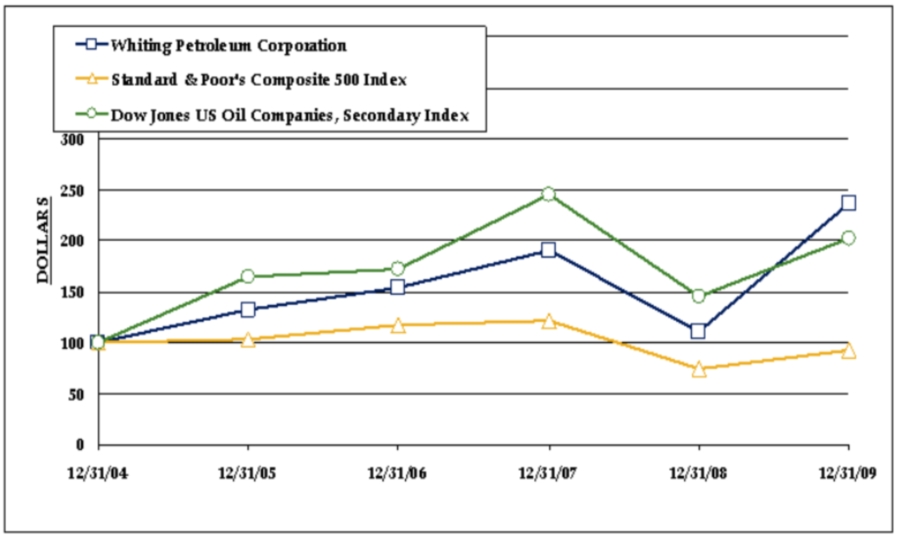
|
12/31/04
|
12/31/05
|
12/31/06
|
12/31/07
|
12/31/08
|
12/31/09
|
|||||||||||||||||||
|
Whiting
Petroleum Corporation
|
$ | 100 | $ | 132 | $ | 154 | $ | 191 | $ | 111 | $ | 236 | ||||||||||||
|
Standard &
Poor’s Composite 500 Index
|
100 | 103 | 117 | 121 | 75 | 92 | ||||||||||||||||||
|
Dow
Jones US Oil Companies, Secondary Index
|
100 | 164 | 172 | 245 | 145 | 202 | ||||||||||||||||||
|
Item 6.
|
Selected Financial
Data
|
The
consolidated statements of income and statements of cash flows information for
the years ended December 31, 2009, 2008 and 2007 and the consolidated
balance sheet information at December 31, 2009 and 2008 are derived from our
audited financial statements included elsewhere in this report. The
consolidated statements of income and statements of cash flows information for
the years ended December 31, 2006 and 2005 and the consolidated balance sheet
information at December 31, 2007, 2006 and 2005 are derived from audited
financial statements that are not included in this report. Our
historical results include the results from our recent acquisitions beginning on
the following dates: Additional interests in North Ward Estes, November 1, 2009
and October 1, 2009; Flat Rock Natural Gas Field, May 30, 2008; Utah
Hingeline, August 29, 2006; Michigan Properties, August 15, 2006;
North Ward Estes and Ancillary Properties, October 4, 2005; Postle
Properties, August 4, 2005; Limited Partnership Interests, June 23,
2005; and Green River Basin, March 31, 2005.
|
Year
Ended December 31,
|
||||||||||||||||||||
|
2009
|
2008
|
2007
|
2006
|
2005
|
||||||||||||||||
|
(dollars
in millions, except per share data)
|
||||||||||||||||||||
|
Consolidated
Statements of Income Information:
|
||||||||||||||||||||
|
Revenues
and other income:
|
||||||||||||||||||||
|
Oil
and natural gas sales
|
$ | 917.6 | $ | 1,316.5 | $ | 809.0 | $ | 773.1 | $ | 573.2 | ||||||||||
|
Gain
(loss) on hedging activities
|
38.8 | (107.6 | ) | (21.2 | ) | (7.5 | ) | (33.4 | ) | |||||||||||
|
Amortization
of deferred gain on sale
|
16.6 | 12.1 | — | — | — | |||||||||||||||
|
Gain
on sale of properties
|
5.9 | — | 29.7 | 12.1 | — | |||||||||||||||
|
Interest
income and other
|
0.5 | 1.1 | 1.2 | 1.1 | 0.6 | |||||||||||||||
|
Total
revenues and other income
|
979.4 | 1,222.1 | 818.7 | 778.8 | 540.4 | |||||||||||||||
|
Costs
and expenses:
|
||||||||||||||||||||
|
Lease
operating
|
237.3 | 241.2 | 208.9 | 183.6 | 111.6 | |||||||||||||||
|
Production
taxes
|
64.7 | 87.5 | 52.4 | 47.1 | 36.1 | |||||||||||||||
|
Depreciation,
depletion and amortization
|
394.8 | 277.5 | 192.8 | 162.8 | 97.6 | |||||||||||||||
|
Exploration
and impairment
|
73.0 | 55.3 | 37.3 | 34.5 | 16.7 | |||||||||||||||
|
General
and administrative
|
42.3 | 61.7 | 39.0 | 37.8 | 30.6 | |||||||||||||||
|
Interest
expense
|
64.6 | 65.1 | 72.5 | 73.5 | 42.0 | |||||||||||||||
|
Change
in Production Participation Plan liability
|
3.3 | 32.1 | 8.6 | 6.2 | 9.7 | |||||||||||||||
|
Commodity
derivative (gain) loss, net
|
262.2 | (7.1 | ) | — | — | — | ||||||||||||||
|
Total
costs and expenses
|
1,142.2 | 813.3 | 611.5 | 545.5 | 344.3 | |||||||||||||||
|
Income
(loss) before income taxes
|
(162.8 | ) | 408.8 | 207.2 | 233.3 | 196.1 | ||||||||||||||
|
Income
tax expense (benefit)
|
(55.9 | ) | 156.7 | 76.6 | 76.9 | 74.2 | ||||||||||||||
|
Net
income (loss)
|
(106.9 | ) | 252.1 | 130.6 | 156.4 | 121.9 | ||||||||||||||
|
Preferred
stock dividends
|
(10.3 | ) | — | — | — | — | ||||||||||||||
|
Net
income (loss) available to common shareholders
|
$ | (117.2 | ) | $ | 252.1 | $ | 130.6 | $ | 156.4 | $ | 121.9 | |||||||||
|
Earnings
(loss) per common share, basic
|
$ | (2.36 | ) | $ | 5.96 | $ | 3.31 | $ | 4.26 | $ | 3.89 | |||||||||
|
Earnings
(loss) per common share, diluted
|
$ | (2.36 | ) | $ | 5.94 | $ | 3.29 | $ | 4.25 | $ | 3.88 | |||||||||
|
Other
Financial Information:
|
||||||||||||||||||||
|
Net
cash provided by operating activities
|
$ | 435.6 | $ | 763.0 | $ | 394.0 | $ | 411.2 | $ | 330.2 | ||||||||||
|
Net
cash used in investing activities
|
$ | (505.3 | ) | $ | (1,134.9 | ) | $ | (467.0 | ) | $ | (527.6 | ) | $ | (1,126.9 | ) | |||||
|
Net
cash provided by financing activities
|
$ | 72.1 | $ | 366.8 | $ | 77.3 | $ | 116.4 | $ | 805.5 | ||||||||||
|
Ratio
of earnings to fixed charges and preferred stock dividends
(1)(2)
|
— | 6.92 | x | 3.65 | x | 4.14 | x | 5.64 | x | |||||||||||
|
Capital
expenditures
|
$ | 585.8 | $ | 1,330.9 | $ | 519.6 | $ | 552.0 | $ | 1,126.9 | ||||||||||
|
Consolidated
Balance Sheet Information:
|
||||||||||||||||||||
|
Total
assets
|
$ | 4,029.5 | $ | 4,029.1 | $ | 2,952.0 | $ | 2,585.4 | $ | 2,235.2 | ||||||||||
|
Long-term
debt
|
$ | 779.6 | $ | 1,239.8 | $ | 868.2 | $ | 995.4 | $ | 875.1 | ||||||||||
|
Total
stockholders’ equity
|
$ | 2,270.1 | $ | 1,808.8 | $ | 1,490.8 | $ | 1,186.7 | $ | 997.9 | ||||||||||
|
(1)
|
For
the purpose of calculating the ratio of earnings to fixed charges and
preferred stock dividends, earnings consist of income before income taxes
and income from equity investees, plus fixed charges, distributed income
from equity investees and amortization of capitalized interest, less
capitalized interest and preferred stock dividends. Fixed
charges consist of interest expensed, interest capitalized, amortized
premiums, discounts and capitalized expenses related to indebtedness, and
an estimate of interest within rental expense. Preferred stock
dividends represent pre-tax earnings required to cover any preferred stock
dividend requirements using our effective tax rate for the relevant
period.
|
|
(2)
|
For
the year ended December 31, 2009, earnings were inadequate to cover fixed
charges and preferred stock dividends, and the ratio of earnings to fixed
charges and preferred stock dividends therefore has not been presented for
that period. The coverage deficiency necessary for the ratio of
earnings to fixed charges and preferred stock dividends to equal 1.00x
(one-to-one coverage) was $181.0 million for the year ended December 31,
2009.
|
|
Item 7.
|
Management’s Discussion and Analysis of Financial
Condition and Results of
Operations
|
Unless
the context otherwise requires, the terms “Whiting,” “we,” “us,” “our” or “ours”
when used in this Item refer to Whiting Petroleum Corporation, together with its
consolidated subsidiaries, Whiting Oil and Gas Corporation and Whiting Programs,
Inc. When the context requires, we refer to these entities
separately. This document contains forward-looking statements, which
give our current expectations or forecasts of future events. Please
refer to “Forward-Looking Statements” at the end of this Item for an explanation
of these types of statements.
Overview
We are an
independent oil and gas company engaged in oil and gas acquisition, development,
exploitation, production and exploration activities primarily in the Permian
Basin, Rocky Mountains, Mid-Continent, Gulf Coast and Michigan regions of the
United States. Prior to 2006, we generally emphasized the acquisition
of properties that increased our production levels and provided upside potential
through further development. Since 2006, we have focused primarily on
organic drilling activity and on the development of previously acquired
properties, specifically on projects that we believe provide the opportunity for
repeatable successes and production growth. We believe the
combination of acquisitions, subsequent development and organic drilling
provides us a broad set of growth alternatives and allows us to direct our
capital resources to what we believe to be the most advantageous
investments.
As
demonstrated by our recent capital expenditure programs, we are increasingly
focused on a balanced exploration and development program while continuing to
selectively pursue acquisitions that complement our existing core
properties. We believe that our significant drilling inventory,
combined with our operating experience and cost structure, provides us with
meaningful organic growth opportunities. Our growth plan is centered
on the following activities:
|
•
|
pursuing
the development of projects that we believe will generate attractive rates
of return;
|
|
|
•
|
maintaining
a balanced portfolio of lower risk, long-lived oil and gas properties that
provide stable cash flows;
|
|
|
•
|
seeking
property acquisitions that complement our core
areas; and
|
|
|
•
|
allocating
a portion of our capital budget to leasing and exploring prospect
areas.
|
We have
historically acquired operated and non-operated properties that exceed our rate
of return criteria. For acquisitions of properties with additional
development, exploitation and exploration potential, our focus has been on
acquiring operated properties so that we can better control the timing and
implementation of capital spending. In some instances, we have been
able to acquire non-operated property interests at attractive rates of return
that established a presence in a new area of interest or that have complemented
our existing operations. We intend to continue to acquire both
operated and non-operated interests to the extent we believe they meet our
return criteria. In addition, our willingness to acquire non-operated
properties in new geographic regions provides us with geophysical and geologic
data in some cases that leads to further acquisitions in the same region,
whether on an operated or non-operated basis. We sell properties when
we believe that the sales price realized will provide an above average rate of
return for the property or when the property no longer matches the profile of
properties we desire to own.
Although
oil prices fell significantly after reaching highs in the third quarter 2008,
they have experienced a rebound in the second half of 2009. For example,
the daily average NYMEX oil price was $118.13 and $58.75 per Bbl for the third
and fourth quarters of 2008, respectively, and $43.21, $59.62, $68.29 and
$76.17, for the first, second, third and fourth quarters of 2009,
respectively. Additionally, natural gas prices have fallen
significantly since their third quarter 2008 levels and remained low throughout
2009. For example, daily average NYMEX natural gas prices have
declined from $10.27 per Mcf for the third quarter of 2008 to $6.96 per Mcf for
the fourth quarter of 2008 and $3.99 per Mcf for 2009. Lower oil and
natural gas prices may not only decrease our revenues, but may also reduce the
amount of oil and natural gas that we can produce economically and therefore
potentially lower our reserve bookings. A substantial or extended decline
in oil or natural gas prices may result in impairments of our proved oil and gas
properties and may materially and adversely affect our future business,
financial condition, cash flows, results of operations, liquidity or ability to
finance planned capital expenditures. Lower oil and gas prices may
also reduce the amount of our borrowing base under our credit agreement, which
is determined at the discretion of the lenders based on the collateral value of
our proved reserves that have been mortgaged to the
lenders. Alternatively, higher oil and natural gas prices may result
in significant non-cash mark-to-market losses being recognized on our commodity
derivatives, which may in turn cause us to experience net losses.
For a
discussion of material changes to our proved, probable and possible reserves
from December 31, 2008 to December 31, 2009 and our ability to convert PUDs to
proved developed reserves, probable reserves to proved reserves and possible
reserves to probable or proved reserves, see “ Reserves” in Item 2 of this
Annual Report on Form 10-K. Additionally, for a discussion relating
to the minimum remaining terms of our leases, see “Acreage” in Item 2 of this
Annual Report on Form 10-K and for a discussion on our need to use enhanced
recovery techniques, see “Productive Wells” in Item 2 of this Annual Report on
Form 10-K.
2009
Highlights and Future Considerations
6.25% Convertible Perpetual
Preferred Stock Offering. In June 2009, we completed a public
offering of 6.25% convertible perpetual preferred stock, selling 3,450,000
shares at a price of $100.00 per share and providing net proceeds of $334.1
million after underwriters’ fees and offering expenses. We used the
net proceeds to repay a portion of the debt outstanding under our credit
agreement.
Each
holder of the convertible perpetual preferred stock is entitled to an annual
dividend of $6.25 per share to be paid quarterly in cash, common stock or a
combination thereof on March 15, June 15, September 15 and December 15, when and
if such dividends are declared by our board of directors. During
2009, we paid dividends of $4.9 million and $5.4 million on September 15, 2009
and December 15, 2009, respectively. Each share of convertible
perpetual preferred stock has a liquidation preference of $100.00 per share plus
accumulated and unpaid dividends and is convertible, at a holder’s option, into
shares of our common stock based on an initial conversion price of $43.4163,
subject to adjustment upon the occurrence of certain events. The
convertible perpetual preferred stock is not redeemable by us. At any
time on or after June 15, 2013, we may cause all outstanding shares of
convertible preferred stock to be automatically converted into shares of common
stock if the closing price of our common stock equals or exceeds 120% of the
then-prevailing conversion price for at least 20 trading days in a period of 30
consecutive trading days. The holders of convertible preferred stock
have no voting rights unless dividends payable on the convertible preferred
stock are in arrears for six or more quarterly periods.
Common Stock
Offering. In February 2009, we completed a public offering of
our common stock, selling 8,450,000 shares of common stock at a price of $29.00
per share and providing net proceeds of $234.8 million after underwriters’ fees
and offering expenses. We used the net proceeds to repay a portion of
the debt outstanding under our credit agreement.
Operational
Highlights. Our Sanish and Parshall fields in Mountrail
County, North Dakota target the Bakken formation. Net production in
the Sanish field increased 68% from a net 7.5 MBOE/d in December 2008 to a net
12.6 MBOE/d in December 2009. Net production in the Parshall field
decreased 4% from a net 6.7 MBOE/d in December 2008 to a net 6.4 MBOE/d in
December 2009.
We
continue to have significant development and related infrastructure activity in
the Postle and North Ward Estes fields acquired in 2005, which have resulted in
reserve and production increases. Our expansion of the CO2 flood at both fields continues
to generate positive results. During 2009, we incurred $150.0 million
of development expenditures on these two projects.
The
Postle field is located in Texas County, Oklahoma. Four of our five
producing units are currently under active CO2 enhanced recovery
projects. As of December 31, 2009, we were injecting 140 MMcf/d of
CO2 in this
field. Production from the field has increased 30% from a net 7.1
MBOE/d in December 2008 to a net 9.2 MBOE/d in December 2009.
The North
Ward Estes field is located in Ward and Winkler Counties, Texas and is
responding positively to our water and CO2 floods, which we initiated in
May 2007. In early March 2009, we expanded the area of our CO2 injection
project. As of December 31, 2009, we were injecting 204 MMcf/d of
CO2 in this
field. Production from the field has increased 8% from a net 6.6
MBOE/d in December 2008 to a net 7.1 MBOE/d in December 2009. In this
field, we are developing new and reactivated wells for water and CO2 injection
and production purposes. Additionally, we plan to install oil, gas
and water processing facilities in eight phases. The first two phases
were substantially complete by December 2009.
2010 Capital Budget and Major
Development Areas. Our current 2010 capital budget for
exploration and development expenditures is $830.0 million, which we expect to
fund with net cash provided by our operating activities. To the
extent net cash provided by operating activities is higher or lower than
currently anticipated, we would adjust our capital budget accordingly or adjust
borrowings outstanding under our credit facility as needed. Our 2010
capital budget currently is allocated among our major development areas as
indicated in the chart below. Of our existing potential projects, we
believe these present the opportunity for the highest return and most efficient
use of our capital expenditures.
|
Development Area
|
2010
Planned Capital Expenditures (In millions)
|
|||
|
Northern
Rockies
|
$ | 377.0 | ||
|
CO2 projects
(1)
|
257.0 | |||
|
Permian
|
51.0 | |||
|
Central
Rockies
|
49.0 | |||
|
Gulf
Coast
|
30.0 | |||
|
Michigan
|
16.0 | |||
|
Other
non-operated
|
20.0 | |||
|
Exploration
(2)
|
30.0 | |||
|
Total
|
$ | 830.0 | ||
_________
|
(1)
|
2010
planned capital expenditures at our CO2 projects include $51.6
million for purchased CO2 at
North Ward Estes and $12.1 million for Postle CO2 purchases.
|
|
(2)
|
Comprised
primarily of exploration salaries, lease delay rentals and seismic and
other development.
|
Acquisitions
Additional Interests in North Ward
Estes Field. During 2009, we acquired additional royalty and
overriding royalty interests in the North Ward Estes field and various other
fields in the Permian Basin in two separate transactions with private
owners. Also included in these transactions were contractual rights,
including an option to participate for an aggregate 10% working interest and
right to back in after payout for an additional aggregate 15% working interest
in the development of deeper pay zones on acreage under and adjoining the North
Ward Estes field.
We
completed the first additional royalty and overriding interests acquisition in
November 2009, with a purchase price of $38.7 million and an effective date of
October 1, 2009. The average daily net production attributable to
this transaction was approximately 0.3 MBOE/d in September
2009. Estimated proved reserves attributable to the acquired
interests are 2.2 MMBOE, resulting in an acquisition price of $17.59 per
BOE. Reserves attributable to royalty and overriding royalty
interests are not burdened by operating expenses or any additional capital
costs, including CO2
costs, which are paid by the working interest owners.
We
completed the second additional royalty and overriding interests acquisition in
December 2009, with a purchase price of $27.4 million and an effective date of
November 1, 2009. The average daily net production attributable to
this transaction was approximately 0.2 MBOE/d in September
2009. Estimated proved reserves attributable to the acquired
interests are 1.6 MMBOE, resulting in an acquisition price of $17.13 per
BOE.
In
aggregate, the two acquisitions in the North Ward Estes field represent 3.8
MMBOE of proved reserves at an acquisition price of $66.1 million, or $17.39 per
BOE. We funded these acquisitions primarily with net cash provided by
our operating activities.
Flat Rock Natural Gas
Field. In May 2008, we acquired interests in 31 producing gas
wells, development acreage and gas gathering and processing facilities on
approximately 22,000 gross (11,500 net) acres in the Flat Rock field in Uintah
County, Utah for an aggregate acquisition price of $365.0
million. After allocating $79.5 million of the purchase price to
unproved properties, the resulting acquisition cost is $2.48 per Mcfe. Of the estimated 115.2
Bcfe of proved reserves acquired as of the January 1, 2008 acquisition
effective date, 98% are natural gas, and 22% are proved developed
producing. The average daily net production from the properties was
17.8 MMcfe/d as of the acquisition effective date. We funded the
acquisition with borrowings under our credit agreement.
Divestitures
Participation
Agreement. In June 2009, we entered into a participation
agreement with a privately held independent oil company covering twenty-five
1,280-acre units and one 640-acre unit located primarily in the western portion
of the Sanish field in Mountrail County, North Dakota. Under the
terms of the agreement, the private company agreed to pay 65% of our net
drilling and well completion costs to receive 50% of our working interest and
net revenue interest in the first and second wells planned for each of the
units. Pursuant to the agreement, we will remain the operator for
each unit.
At the
closing of the agreement, the private company paid $107.3 million, representing
$6.4 million for acreage costs, $65.8 million for 65% of our cost in 18 wells
drilled or drilling and $35.1 million for a 50% interest in our Robinson Lake
gas plant and oil and gas gathering system. We used these proceeds to
repay a portion of the debt outstanding under our credit agreement.
Whiting USA Trust
I. On April 30, 2008, we completed an initial public offering
of units of beneficial interest in Whiting USA Trust I (the “Trust”),
selling 11,677,500 Trust units at $20.00 per Trust unit, and providing net
proceeds of $193.8 million after underwriters’ fees, offering expenses and
post-close adjustments. We used the offering net proceeds to repay a
portion of the debt outstanding under our credit agreement. The net
proceeds from the sale of Trust units to the public resulted in a deferred gain
on sale of $100.2 million. Immediately prior to the closing of the
offering, we conveyed a term net profits interest in certain of our oil and gas
properties to the Trust in exchange for 13,863,889 Trust units. We
have retained 15.8%, or 2,186,389 Trust units, of the total Trust units issued
and outstanding.
The net
profits interest entitles the Trust to receive 90% of the net proceeds from the
sale of oil and natural gas production from the underlying
properties. The net profits interest will terminate at the time when
9.11 MMBOE have been produced and sold from the underlying
properties. This is the equivalent of 8.2 MMBOE in respect of the
Trust’s right to receive 90% of the net proceeds from such production pursuant
to the net profits interest, and these reserve quantities are projected to be
produced by August 31, 2018, based on the reserve report for the underlying
properties as of December 31, 2009. The conveyance of the net profits
interest to the Trust consisted entirely of proved developed producing reserves
of 8.2 MMBOE, as of the January 1, 2008 effective date, representing
3.3% of our proved reserves as of December 31, 2007, and 10.0% (4.2 MBOE/d)
of our March 2008 average daily net production. After netting our
ownership of 2,186,389 Trust units, third-party public Trust unit holders
receive 6.9 MMBOE of proved producing reserves, or 2.75% of our total year-end
2007 proved reserves, and 7.4% (3.1 MBOE/d) of our March 2008 average daily net
production.
On
July 17, 2007, we sold our approximate 50% non-operated working interest in
several gas fields located in the LaSalle and Webb Counties of Texas for total
cash proceeds of $40.1 million, resulting in a pre-tax gain on sale of $29.7
million. The divested properties had estimated proved reserves of 2.3
MMBOE as of December 31, 2006, and when adjusted to the July 1, 2007
divestiture effective date, the divested property reserves yielded a sale price
of $17.77 per BOE. The June 2007 average daily net production from
these fields was 0.8 MBOE/d.
During
2007, we sold our interests in several additional non-core oil and gas producing
properties for an aggregate amount of $12.5 million in cash for total
estimated proved reserves of 0.6 MMBOE as of the divestitures’ effective
dates. No gain or loss was recognized on the sales. The
divested properties were located in Colorado, Louisiana, Michigan, Montana, New
Mexico, North Dakota, Oklahoma, Texas and Wyoming. The average daily
net production from the divested property interests was 0.3 MBOE/d as of the
dates of disposition.
Results
of Operations
The
following table sets forth selected operating data for the periods
indicated:
|
Year
Ended December 31,
|
||||||||||||
|
2009
|
2008
|
2007
|
||||||||||
|
Net
production:
|
||||||||||||
|
Oil
(MMBbls)
|
15.4 | 12.4 | 9.6 | |||||||||
|
Natural
gas (Bcf)
|
29.3 | 30.4 | 30.8 | |||||||||
|
Total
production (MMBOE)
|
20.3 | 17.5 | 14.7 | |||||||||
|
Net
sales (in millions):
|
||||||||||||
|
Oil
(1)
|
$ | 807.6 | $ | 1,082.8 | $ | 618.5 | ||||||
|
Natural
gas (1)
|
109.9 | 233.7 | 190.5 | |||||||||
|
Total
oil and natural gas sales
|
$ | 917.5 | $ | 1,316.5 | $ | 809.0 | ||||||
|
Average
sales prices:
|
||||||||||||
|
Oil
(per Bbl)
|
$ | 52.51 | $ | 86.99 | $ | 64.57 | ||||||
|
Effect
of oil hedges on average price (per Bbl)
|
(0.43 | ) | (8.58 | ) | (2.21 | ) | ||||||
|
Oil
net of hedging (per Bbl)
|
$ | 52.08 | $ | 78.41 | $ | 62.36 | ||||||
|
Average
NYMEX price (per Bbl)
|
$ | 61.93 | $ | 97.24 | $ | 72.30 | ||||||
|
Natural
gas (per Mcf)
|
$ | 3.75 | $ | 7.68 | $ | 6.19 | ||||||
|
Effect
of natural gas hedges on average price (per Mcf)
|
0.05 | - | - | |||||||||
|
Natural
gas net of hedging (per Mcf)
|
$ | 3.80 | $ | 7.68 | $ | 6.19 | ||||||
|
Average
NYMEX price (per Mcf)
|
$ | 3.99 | $ | 9.06 | $ | 6.86 | ||||||
|
Cost
and expense (per BOE):
|
||||||||||||
|
Lease
operating expenses
|
$ | 11.71 | $ | 13.77 | $ | 14.20 | ||||||
|
Production
taxes
|
$ | 3.19 | $ | 5.00 | $ | 3.56 | ||||||
|
Depreciation,
depletion and amortization expense
|
$ | 19.48 | $ | 15.84 | $ | 13.11 | ||||||
|
General
and administrative expenses
|
$ | 2.09 | $ | 3.52 | $ | 2.66 | ||||||
________________
|
(1)
|
Before
consideration of hedging
transactions.
|
Year
Ended December 31, 2009 Compared to Year Ended December 31, 2008
Oil and Natural Gas
Sales. Our oil and natural gas sales revenue decreased $398.9
million to $917.5 million in 2009 compared to 2008. Sales are a
function of volumes sold and average sales prices. Our oil sales
volumes increased 24% between periods, while our natural gas sales volumes
decreased 4%. The oil volume increase resulted primarily from
drilling success in the North Dakota Bakken area, in addition to increased
production at our two large CO2 projects, Postle and North Ward
Estes. Oil production from the Bakken increased 2,505 MBbl compared
to 2008, while Postle oil production increased 695 MBbl and North Ward Estes oil
production increased 365 MBbl over the same period in 2008. These
production increases were partially offset by the Whiting USA Trust I (the
“Trust”) divestiture, which decreased oil production by 435 MBbl. The
gas volume decline between periods was primarily the result of the Trust
divestiture, which decreased gas production in 2009 by 2,220 MMcf, as well as
normal field decline. These decreases were partially offset by
incremental gas production in 2009 of 1,370 MMcf from the Flat Rock acquisition
and higher gas production in 2009 as compared to 2008 in the Bakken and Boies
Ranch areas of 1,652 MMcf and 1,165 MMcf, respectively. Our average
price for oil before the effects of hedging decreased 40% between periods, and
our average price for natural gas before effects of hedging decreased
51%.
Gain (Loss) on Hedging
Activities. Realized cash settlements on commodity derivatives that
we have designated as cash flow hedges are recognized as gain (loss) on hedging
activities. During 2009, we incurred cash settlement gains of $13.5
million on such crude oil hedges. During 2008, we incurred realized
cash settlement losses of $107.6 million on crude oil derivatives designated as
cash flow hedges. None of our natural gas derivatives were designated as
cash flow hedges during 2009 or 2008. Effective April 1, 2009, we elected
to de-designate all of our commodity derivative contracts that had been
previously designated as cash flow hedges as of March 31, 2009 and have elected
to discontinue hedge accounting prospectively. As a result, we
reclassified from accumulated other comprehensive income into earnings $25.3
million in unrealized gains upon the expiration of these de-designated crude oil
hedges from April 1 to December 31, 2009. See Item 7A, “Qualitative
and Quantitative Disclosures About Market Risk” of this Annual Report on Form
10-K for a list of our outstanding oil hedges as of February 16,
2010.
Amortization of Deferred Gain on
Sale. In connection with the sale of 11,677,500 Trust units to the
public and related oil and gas property conveyance on April 30, 2008, we
recognized a deferred gain on sale of $100.2 million. This deferred gain
is amortized to income over the life of the Trust on a units-of-production
basis. During 2009 and 2008, we recognized $16.6 million and $12.1
million, respectively, in income as amortization of deferred gain on
sale.
Gain on Sale of
Properties.
During 2009, we entered into a participation agreement with a privately
held independent oil company covering acreage located primarily in the western
portion of the Sanish field in Mountrail County, North Dakota. At the
closing of the agreement, the private company paid us $107.3 million, resulting
in a pre-tax gain on sale of $4.6 million. In addition, we sold our
interest in several non-core properties for an aggregate amount of $1.3 million
in cash and recognized a pre-tax gain on sale of $1.3 million. There
was no gain or loss on the sale of properties during 2008.
Lease Operating
Expenses. Our lease operating expenses during 2009 were $237.3
million, a $4.0 million or 2% decrease over the same period in
2008. Our lease operating expenses per BOE decreased from $13.77
during 2008 to $11.71 during 2009. The decrease of 15% on a BOE basis
was primarily caused by increased production and a decrease of $14.6 million in
electric power and fuel costs during 2009 as compared to 2008, partially offset
by a high level of workover activity. Workovers amounted to $49.8
million in 2009, as compared to $27.3 million of workover activity during
2008. The increase in workover activity is a result of a higher
number of service wells and producing wells in our CO2 projects.
Production
Taxes. The production taxes we pay are generally calculated as
a percentage of oil and natural gas sales before the effects of
hedging. We take full advantage of all credits and exemptions allowed
in our various taxing jurisdictions. Our production taxes during 2009
were $64.7 million, a $22.9 million decrease over the same period in 2008,
primarily due to lower oil and natural gas sales. Our production
taxes for 2009 and 2008 were 7.0% and 6.7%, respectively, of oil and natural gas
sales. Our production tax rate for 2009 was greater than in 2008
mainly due to successful wells that were completed in the North Dakota Bakken
area during the latter half of 2008 and 2009 and that carry an 11.5% production
tax rate.
Depreciation, Depletion and
Amortization. Our depreciation, depletion and amortization
(“DD&A”) expense increased $117.3 million as compared to
2008. The components of DD&A expense were as follows (in
thousands):
|
Year
Ended December 31,
|
||||||||
|
2009
|
2008
|
|||||||
|
Depletion
|
$ | 384,519 | $ | 270,770 | ||||
|
Depreciation
|
3,147 | 3,439 | ||||||
|
Accretion
of asset retirement obligations
|
7,126 | 3,239 | ||||||
|
Total
|
$ | 394,792 | $ | 277,448 | ||||
DD&A
increased $117.3 million primarily due to $113.7 million in higher depletion
expense between periods. Of this $113.7 million increase in
depletion, $42.5 million related to higher oil and gas volumes produced during
2009, while $71.2 million related to our higher depletion rate in
2009. On a BOE basis, our DD&A rate increased by 23% from $15.84
for 2008 to $19.48 for 2009. The primary factor causing this rate
increase between periods was a net reduction in our proved reserves of 11.6
MMBOE in the fourth quarter of 2008, which was primarily attributable to a 39.0
MMBOE downward revision in reserves for lower oil and natural gas prices as of
December 31, 2008. This significant downward adjustment to reserves
drove our DD&A rate substantially higher during the fourth quarter of 2008
and for the first three quarters of 2009, as compared to our DD&A rate
during the first three quarters of 2008. Our DD&A rate for the
first nine months of 2008 was lower because it was computed based on proved oil
and gas reserves as of December 31, 2007 that incorporated much higher oil and
natural gas pricing. In addition to this primary factor affecting our
DD&A rate between periods, our DD&A rate remained consistently higher in
all of 2009 due to (i) $432.9 million in drilling expenditures incurred during
the past twelve months, (ii) $77.4 million of cash acquisition capital
expenditures that were incurred during 2009 and transferred to the proved
property amortization base, and (iii) the significant expenditures necessary to
develop proved undeveloped reserves, particularly related to the enhanced oil
recovery projects in the Postle and North Ward Estes fields, whereby the
development of proved undeveloped reserves does not increase existing quantities
of proved reserves. Under the successful efforts method of
accounting, costs to develop proved undeveloped reserves are added into the
DD&A rate when incurred.
Exploration and Impairment
Costs. Our exploration and impairment costs increased $17.8
million, as compared to 2008. The components of exploration and
impairment costs were as follows (in thousands):
|
Year
Ended December 31,
|
||||||||
|
2009
|
2008
|
|||||||
|
Exploration
|
$ | 46,875 | $ | 29,302 | ||||
|
Impairment
|
26,139 | 25,955 | ||||||
|
Total
|
$ | 73,014 | $ | 55,257 | ||||
Exploration
costs increased $17.6 million during 2009 as compared to 2008 primarily due to
higher exploratory dry hole expense and rig termination fees recognized during
2009. During 2009, we drilled three exploratory dry holes in the
Rocky Mountains region totaling $18.2 million, while during the same period in
2008 we drilled one exploratory dry hole in the Permian region and participated
in two non-operated exploratory dry holes in the Rocky Mountains region totaling
$3.6 million. Rig termination fees totaled $6.5 million during 2009,
as compared to $0.8 million during 2008. Impairment expense in 2009
includes $9.4 million in non-cash impairment charges for the partial write-down
of mainly natural gas properties whose net book values exceeded their
undiscounted future cash flows, as compared to $10.9 million in non-cash
impairment expense in 2008 for the partial write-down of unproved properties in
the central Utah Hingeline play.
General and Administrative
Expenses. We report general and administrative expenses net of
third party reimbursements and internal allocations. The components
of our general and administrative expenses were as follows (in
thousands):
|
Year
Ended December 31,
|
||||||||
|
2009
|
2008
|
|||||||
|
General
and administrative expenses
|
$ | 92,837 | $ | 103,231 | ||||
|
Reimbursements
and allocations
|
(50,480 | ) | (41,547 | ) | ||||
|
General
and administrative expense, net
|
$ | 42,357 | $ | 61,684 | ||||
General
and administrative expense before reimbursements and allocations decreased $10.4
million to $92.8 million during 2009. The largest components of the
decrease related to $20.5 million in lower accrued distributions under our
Production Participation Plan (“Plan”) between periods due to (i) a lower level
of Plan net revenues (which have been reduced by lease operating expenses and
production taxes pursuant to the Plan formula) resulting from lower oil and
natural gas prices during 2009 as compared to 2008, and (ii) the Trust
divestiture completed in April 2008 which increased 2008 accrued distributions
under the Plan. These lower accrued Plan distributions were partially
offset by $8.9 million in additional employee compensation in 2009 for personnel
hired during the past twelve months as well as for general pay
increases. The increase in reimbursements and allocations in 2009 was
primarily caused by higher salary costs and a greater number of field workers on
operated properties. Our general and administrative expenses, net as
a percentage of oil and natural gas sales remained consistent at 5% for 2008 and
2009.
Interest
Expense. The components of interest expense were as follows
(in thousands):
|
Year
Ended December 31,
|
||||||||
|
2009
|
2008
|
|||||||
|
Senior
Subordinated Notes
|
$ | 43,907 | $ | 43,461 | ||||
|
Credit
Agreement
|
12,891 | 18,377 | ||||||
|
Amortization
of debt issue costs and debt discount
|
9,411 | 4,801 | ||||||
|
Other
|
1,805 | 1,568 | ||||||
|
Capitalized
interest
|
(3,406 | ) | (3,129 | ) | ||||
|
Total
|
$ | 64,608 | $ | 65,078 | ||||
The
decrease in interest expense of $0.5 million between periods was mainly due to a
lower effective cash interest rate and lower borrowings outstanding under our
credit agreement. This decrease was partially offset by higher debt
issue cost amortization associated with additional issuance costs incurred in
April 2009 when renewing our credit agreement. Our weighted average
effective cash interest rate was 5.7% during 2009 compared to 5.9% during
2008. Our weighted average debt outstanding during 2009 was $1,008.5
million versus $1,049.4 million for 2008. After inclusion of non-cash
interest costs for the amortization of debt issue costs, debt discounts and the
accretion of the tax sharing liability, our weighted average effective all-in
interest rate was 6.6% during 2009 compared to 6.3% during 2008.
Change in Production Participation
Plan Liability. For the year ended December 31, 2009, this
non-cash expense was $3.3 million, a decrease of $28.9 million as compared to
2008. This expense in 2009 represents the change in the vested
present value of estimated future payments to be made after 2010 to participants
under our Plan. Although payments take place over the life of the
Plan’s oil and gas properties, which for some properties is over 20 years, we
expense the present value of estimated future payments over the Plan’s five-year
vesting period. This expense in 2009 and 2008 primarily reflected
(i) changes to future cash flow estimates stemming from the volatile
commodity price environment during each respective year, (ii) recent drilling
activity and property acquisitions, and (iii) employees’ continued vesting
in the Plan. The average NYMEX prices used to estimate this liability
decreased by $1.47 for crude oil and $1.04 for natural gas for the year ended
December 31, 2009, as compared to increases of $24.63 for crude oil and $0.86
for natural gas over the same period in 2008. Assumptions that are
used to calculate this liability are subject to estimation and will vary from
year to year based on the current market for oil and gas, discount rates and
overall market conditions.
Commodity Derivative (Gain) Loss,
Net. During 2008, we entered into certain commodity derivative
contracts that we did not designate as cash flow hedges. In addition,
effective April 1, 2009, we elected to de-designate all of our commodity
derivative contracts that had been previously designated as cash flow hedges as
of March 31, 2009 and have elected to discontinue hedge accounting
prospectively. Accordingly, beginning April 1, 2009 all of our
derivative contracts are marked-to-market each quarter with fair value gains and
losses recognized immediately in earnings. Cash flow is only impacted
to the extent that actual cash settlements under these contracts result in
making or receiving a payment from the counterparty, and such cash settlement
gains and losses are also recorded immediately to earnings as commodity
derivative (gain) loss, net. The components of our commodity
derivative (gain) loss, net were as follows (in thousands):
|
Year
Ended December 31,
|
||||||||
|
2009
|
2008
|
|||||||
|
Change
in unrealized (gains) losses on derivative contracts
|
$ | 220,926 | $ | (4,292 | ) | |||
|
Realized
cash settlement (gains) losses
|
18,634 | (900 | ) | |||||
|
(Gain)
loss on hedging ineffectiveness
|
22,655 | (1,896 | ) | |||||
|
Total
|
$ | 262,215 | $ | (7,088 | ) | |||
The
increase of $225.2 million in unrealized losses on derivative contracts during
2009 as compared to the prior year was due to the fact that (i) we averaged 20.0
MMBbls of crude oil hedged during the year ended December 31, 2009, while we
only averaged 6.8 MMBbls of crude oil hedged during the year ended
December 31, 2008, and (ii) there was a significant upward shift in the
forward price curve for NYMEX crude oil during the year ended December 31, 2009
as compared to the downward shift in the same forward price curve during the
year ended December 31, 2008.
Income Tax Expense
(Benefit). Income tax benefit totaled $56.0 million during
2009, versus $156.7 million of income tax expense in 2008. Our
effective income tax rate decreased from 38.3% for 2008 to 34.4% for
2009. Our pre-tax book loss when taken together with our permanent
items resulted in a decrease in our overall effective tax rate. This
decrease, however, was partially offset by an increase in our effective tax rate
caused by a change in our drilling activity in various states.
Net Income (Loss) Available to
Common Shareholders. Net income (loss) available to common
shareholders decreased from $252.1 million in income during 2008 to a $117.2
million loss for 2009. The primary reasons for this decrease include
a 34% decrease in oil prices (net of hedging); a 51% decrease in natural gas
prices (net of hedging); higher unrealized commodity derivative losses,
DD&A, exploration and impairment and dividends paid on preferred
stock. These negative factors were partially offset by a 16% increase
in equivalent volumes sold; lower lease operating expenses, production taxes,
general and administrative expenses, Production Participation Plan expense,
interest expense and income taxes; and higher amortization of deferred gain on
sale, as well as the gain on sale of properties during 2009.
Year
Ended December 31, 2008 Compared to Year Ended December 31, 2007
Oil and Natural Gas
Sales. Our oil and natural gas sales revenue increased $507.5
million to $1,316.5 million in 2008 compared to 2007. Sales are a
function of volumes sold and average sales prices. Our oil sales
volumes increased 30% between periods, while our natural gas sales volumes
decreased 1%. The oil volume increase resulted primarily from
drilling success in the North Dakota Bakken area, in addition to increased
production at our two large CO2 projects, Postle and North Ward
Estes. Oil production from the Bakken increased 2,960 MBbl compared
to 2007, while Postle oil production increased in 2008 by 380 MBbl and North
Ward Estes oil production increased 265 MBbl over the same period in
2007. These production increases were partially offset by the Whiting
USA Trust I (the “Trust”) divestiture, which decreased oil production in 2008 by
630 MBbl. The gas volume decline between periods was primarily the
result of the Trust divestiture, which decreased gas production in 2008 by 2,920
MMcf, and property dispositions in the second half of 2007, which decreased gas
production in 2008 by an additional 780 MMcf. These decreases were
partially offset by incremental gas production of 2,885 MMcf from the Flat Rock
acquisition and higher production during 2008 in the Boies Ranch area of 1,505
MMcf. Our average price for oil before effects of hedging increased
35% between periods, and our average price for natural gas before effects of
hedging increased 24%.
Gain (Loss) on Hedging
Activities. Realized cash settlements on commodity derivatives that
we have designated as cash flow hedges are recognized as gain (loss) on hedging
activities. During 2008, we incurred cash settlement losses of $107.6
million on such crude oil hedges. During 2007, we incurred realized
cash settlement losses of $21.2 million on crude oil derivatives designated as
cash flow hedges. None of our natural gas derivatives were designated as
cash flow hedges during 2008 or 2007.
Amortization of Deferred Gain on
Sale. In connection with the sale of 11,677,500 Trust units to the
public and related oil and gas property conveyance on April 30, 2008, we
recognized a deferred gain on sale of $100.1 million. This deferred gain
is amortized to income over the life of the Trust on a units-of-production
basis. During 2008, we recognized $12.1 million in income as
amortization of deferred gain on sale.
Gain on Sale of
Properties. There was no gain or loss on the sale of
properties during 2008. During 2007, however, we sold certain
non-core properties for aggregate sales proceeds of $52.6 million, resulting in
a pre-tax gain on sale of $29.7 million.
Lease Operating
Expenses. Our lease operating expenses during 2008 were $241.2
million, a $32.4 million or 16% increase over the same period in
2007. Our lease operating expenses per BOE decreased from $14.20
during 2007 to $13.77 during 2008. The decrease of 3% on a BOE basis
was primarily caused by flush production from Bakken drilling, which was
partially offset by inflation in the cost of oil field goods and services and a
higher level of workover activity. Workovers amounted to $27.3
million in 2008, as compared to $17.4 million of workover activity during
2007.
Production
Taxes. The production taxes we pay are generally calculated as
a percentage of oil and natural gas sales before the effects of
hedging. We take full advantage of all credits and exemptions allowed
in our various taxing jurisdictions. Our production taxes during 2008
were $87.5 million, a $35.1 million increase over 2007, primarily due to higher
oil and natural gas sales. Our production taxes for 2008 and 2007
were 6.7% and 6.5%, respectively, of oil and natural gas sales. Our
production tax rate for 2008 was greater than the rate for 2007 mainly due to
successful wells completed in the North Dakota Bakken area during 2008, which
carry an 11.5% production tax rate.
Depreciation, Depletion and
Amortization. Our depreciation, depletion and amortization
(“DD&A”) expense increased $84.6 million in 2008 as compared to
2007. The components of our DD&A expense were as follows (in
thousands):
|
Year
Ended December 31,
|
||||||||
|
2008
|
2007
|
|||||||
|
Depletion
|
$ | 270,770 | $ | 186,838 | ||||
|
Depreciation
|
3,439 | 3,123 | ||||||
|
Accretion
of asset retirement obligations
|
3,239 | 2,850 | ||||||
|
Total
|
$ | 277,448 | $ | 192,811 | ||||
DD&A
increased $84.6 million primarily due to $83.9 million in higher depletion
expense between periods. Of this $83.9 million increase in depletion,
$35.7 million relates to higher oil and gas volumes produced during 2008, while
$48.2 million relates to our higher depletion rate in 2008. On a BOE
basis, our DD&A rate increased by 21% from $13.11 for 2007 to $15.84 for
2008. The primary factors causing this rate increase were (i) $918.1
million in drilling expenditures incurred during the past twelve months, (ii)
net oil and natural gas reserve reductions of 11.6 MMBOE during 2008, which were
primarily attributable to a 39.0 MMBOE downward revision for lower oil and
natural gas prices at December 31, 2008, and (iii) the significant expenditures
necessary to develop proved undeveloped reserves, particularly related to the
enhanced oil recovery projects in the Postle and North Ward Estes fields,
whereby the development of proved undeveloped reserves does not increase
existing quantities of proved reserves. Under the successful efforts
method of accounting, costs to develop proved undeveloped reserves are added
into the DD&A rate when incurred.
Exploration and Impairment
Costs. Our exploration and impairment costs increased $17.9
million, as compared to 2007. The components of exploration and
impairment costs were as follows (in thousands):
|
Year
Ended December 31,
|
||||||||
|
2008
|
2007
|
|||||||
|
Exploration
|
$ | 29,302 | $ | 27,344 | ||||
|
Impairment
|
25,955 | 9,979 | ||||||
|
Total
|
$ | 55,257 | $ | 37,323 | ||||
Exploration
costs increased $2.0 million during 2008 as compared to 2007 primarily due to
higher exploratory dry hole expense. During 2008, we drilled one
exploratory dry hole in the Permian region and participated in two non-operated
exploratory dry holes in the Rocky Mountains region totaling $3.6 million, while
during 2007 we participated in a non-operated exploratory well in the Gulf Coast
region that resulted in an insignificant amount of dry hole
expense. The impairment charges in 2008 and 2007 were primarily
related to the amortization of leasehold costs associated with individually
insignificant unproved properties. As of December 31, 2008, the
amount of unproved properties being amortized totaled $72.3 million, as compared
to $51.5 million as of December 31, 2007. Also lending to the
increase in impairment during 2008 was a $10.9 million non-cash charge to
impairment expense for the partial write-down of unproved properties in the
central Utah Hingeline play. In the fourth quarter of 2008 based on
poor drilling results, we determined that 1,873 net acres within our central
Utah Hingeline position would no longer be evaluated, drilled or otherwise
developed and should be written down accordingly.
General and Administrative
Expenses. We report general and administrative expenses net of
third party reimbursements and internal allocations. The components
of general and administrative expenses were as follows (in
thousands):
|
Year
Ended December 31,
|
||||||||
|
2008
|
2007
|
|||||||
|
General
and administrative expenses
|
$ | 103,231 | $ | 72,008 | ||||
|
Reimbursements
and allocations
|
(41,547 | ) | (32,962 | ) | ||||
|
General
and administrative expense, net
|
$ | 61,684 | $ | 39,046 | ||||
General
and administrative expense before reimbursements and allocations increased $31.2
million to $103.2 million during 2008. The largest components of the
increase related to (i) $20.1 million in higher accrued distributions under our
Production Participation Plan (“Plan”) between periods due to the net profits
interest divestiture associated with the sale of 11,677,500 Trust units, and a
higher level of Plan net revenues (which have been reduced by lease operating
expenses and production taxes pursuant to the Plan formula) in 2008, and (ii)
$9.1 million of additional employee compensation for personnel hired during the
past twelve months along with general pay increases. The increase in
reimbursements and allocations in 2008 was primarily caused by higher salary
costs and a greater number of field workers on operated
properties. Our general and administrative expenses, net as a
percentage of oil and natural gas sales remained constant at 5% for both 2008
and 2007.
Interest
Expense. The components of interest expense were as follows
(in thousands):
|
Year
Ended December 31,
|
||||||||
|
2008
|
2007
|
|||||||
|
Senior
Subordinated Notes
|
$ | 43,461 | $ | 44,691 | ||||
|
Credit
Agreement
|
18,377 | 24,428 | ||||||
|
Amortization
of debt issue costs and debt discount
|
4,801 | 5,022 | ||||||
|
Other
|
1,568 | 2,027 | ||||||
|
Capitalized
interest
|
(3,129 | ) | (3,664 | ) | ||||
|
Total
|
$ | 65,078 | $ | 72,504 | ||||
The
decrease in interest expense of $7.4 million between years was mainly due to
lower interest rates during 2008 on borrowings under our credit
agreement. Our weighted average effective cash interest rate was 5.9%
during 2008 compared to 7.2% during 2007. Our weighted average debt
outstanding during 2008 was $1,049.4 million versus $964.4 million for
2007. After inclusion of non-cash interest costs for the amortization
of debt issue costs, debt discounts and the accretion of the tax sharing
liability, our weighted average effective all-in interest rate was 6.3% during
2008 compared to 7.7% during 2007.
Change in Production Participation
Plan Liability. For the year ended December 31, 2008, this
non-cash expense was $32.1 million, an increase of $23.5 million as compared to
2007. This expense in 2008 represents the change in the vested
present value of estimated future payments to be made to participants after 2009
under our Plan. Although payments take place over the life of the
Plan’s oil and gas properties, which for some properties is over 20 years, we
expense the present value of estimated future payments over the Plan’s five-year
vesting period. This expense in 2008 and 2007 primarily reflects (i)
changes to future cash flow estimates stemming from the volatile commodity price
environment during the past three years, (ii) 2008 drilling activity and
property acquisitions, and (iii) employees’ continued vesting in the
Plan. Due to the higher commodity price environment during 2008, we
moved from using a five-year average of historical NYMEX prices to a three-year
average when estimating the future payments to be made under this
Plan. The average NYMEX prices used to estimate this liability
increased by $24.63 for crude oil and $0.86 for natural gas for the year ended
December 31, 2008, as compared to increases of $8.58 for crude oil and
$0.67 for natural gas over the same period in 2007. Assumptions that
are used to calculate this liability are subject to estimation and will vary
from year to year based on the current market for oil and gas, discount rates
and overall market conditions.
Commodity Derivative (Gain) Loss,
Net. During 2008, we entered into certain commodity derivative
contracts that we did not designate as cash flow hedges. These
derivative contracts are marked-to-market each quarter with fair value gains and
losses recognized immediately in earnings. Cash flow is only impacted
to the extent that actual cash settlements under these contracts result in
making or receiving a payment from the counterparty, and such cash settlement
gains and losses are also recorded immediately to earnings as commodity
derivative (gain) loss, net. The components of our commodity
derivative (gain) loss, net were as follows (in thousands):
|
Year
Ended December 31,
|
||||||||
|
2008
|
2007
|
|||||||
|
Change
in unrealized gains on derivative contracts
|
$ | (4,292 | ) | $ | - | |||
|
Realized
cash settlement gains
|
(900 | ) | - | |||||
|
Gain
on hedging ineffectiveness
|
(1,896 | ) | - | |||||
|
Total
|
$ | (7,088 | ) | $ | - | |||
Income Tax Expense
(Benefit). Income tax expense totaled $156.7 million in 2008
and $76.6 million for 2007. Our effective income tax rate increased
from 37.0% for 2007 to 38.3% for 2008. Our effective income tax rate
was higher in 2008 due to our drilling success in state jurisdictions having
higher income tax rates and an increase in the amount of current income taxes
paid in certain states.
The
current portion of income tax expense was $2.4 million for 2008 compared to $0.6
million in 2007. We reported a net operating loss in our 2007 income
tax return, and we anticipated reporting a net operating loss in our 2008 income
tax return, mainly due to intangible drilling deductions allowed.
Net Income (Loss) Available to
Common Shareholders. Net income (loss) available to common
shareholders increased from $130.6 million for 2007 to $252.1 million for
2008. The primary reasons for this increase include a 19% increase in
equivalent volumes sold, a 26% increase in oil prices (net of hedging) and a 24%
increase in natural gas prices (net of hedging) between periods, amortization of
deferred gain on sale, lower interest expense and commodity derivative
gains. These positive factors were partially offset by higher lease
operating expenses, production taxes, DD&A, exploration and impairment,
general and administrative expenses, Production Participation Plan expense and
income taxes, as well as no gain on sale of properties during 2008.
Liquidity
and Capital Resources
Overview. At
December 31, 2009, our debt to total capitalization ratio was 25.6%, we had
$12.0 million of cash on hand and $2,270.1 million of stockholders’
equity. At December 31, 2008, our debt to total capitalization
ratio was 40.7%, we had $9.6 million of cash on hand and $1,808.8 million of
stockholders’ equity. In 2009, we generated $435.6 million of cash
provided by operating activities, a decrease of $327.4 million from
2008. Cash provided by operating activities decreased primarily due
to lower average sales prices for both crude oil and natural gas, partially
offset by higher oil production volumes in 2009 as well as decreased cash
settlement losses on hedging activities during 2009 as compared to
2008. We also generated $72.1 million from financing activities
primarily consisting of $334.1 million in net proceeds received from the
issuance of our preferred stock and $234.8 million in net proceeds received from
the issuance of our common stock, partially offset by net repayments under our
credit agreement totaling $460.0 million, $23.1 million in debt issuance costs
related to our new credit agreement and payment of preferred stock dividends
totaling $10.3 million. Cash flows from operating and financing
activities, as well as $80.5 million in net proceeds from the sale of interests
in certain properties primarily in the Sanish field, were used to finance $487.9
million of drilling and development expenditures paid in 2009 and $97.9 million
of cash acquisition capital expenditures. The following chart details
our exploration and development expenditures incurred by region during 2009 (in
thousands):
|
Drilling
and Development Expenditures
|
Exploration
Expenditures
|
Total
Expenditures
|
%
of Total
|
|||||||||||||
|
Rocky
Mountains
|
$ | 255,861 | $ | 37,864 | $ | 293,725 | 61 | % | ||||||||
|
Permian
Basin
|
139,534 | 5,958 | 145,492 | 30 | % | |||||||||||
|
Mid-Continent
|
34,088 | 1,273 | 35,361 | 7 | % | |||||||||||
|
Gulf
Coast
|
1,420 | 1,621 | 3,041 | 1 | % | |||||||||||
|
Michigan
|
2,012 | 159 | 2,171 | 1 | % | |||||||||||
|
Total incurred
|
432,915 | 46,875 | 479,790 | 100 | % | |||||||||||
|
Decrease
in accrued capital expenditures
|
54,962 | - | 54,962 | |||||||||||||
|
Total paid
|
$ | 487,877 | $ | 46,875 | $ | 534,752 | ||||||||||
We
continually evaluate our capital needs and compare them to our capital
resources. Our current 2010 capital budget for exploration and
development expenditures is $830.0 million, which we expect to fund with net
cash provided by our operating activities. Our 2010 capital budget of
$830.0 million represents a significant increase from the $479.8 million
incurred on exploration and development expenditures during
2009. This increased capital budget is the result of higher oil and
natural gas prices experienced during the second half of 2009 and continuing
into the first part of 2010. Although we have no specific budget for
property acquisitions in 2010, we will continue to selectively pursue property
acquisitions that complement our existing core property base. We
believe that should attractive acquisition opportunities arise or exploration
and development expenditures exceed $830.0 million, we will be able to finance
additional capital expenditures with cash on hand, cash flows from operating
activities, borrowings under our credit agreement, issuances of additional debt
or equity securities, or agreements with industry partners. Our level
of exploration and development expenditures is largely discretionary, and the
amount of funds devoted to any particular activity may increase or decrease
significantly depending on available opportunities, commodity prices, cash flows
and development results, among other factors. We believe that we have
sufficient liquidity and capital resources to execute our business plans over
the next 12 months and for the foreseeable future. In addition, with
our expected cash flow streams, commodity price hedging strategies, current
liquidity levels, access to debt and equity markets and flexibility to modify
future capital expenditure programs, we expect to be able to fund all planned
capital programs, dividend distributions and debt repayments; comply with our
debt covenants; and meet other obligations that may arise from our oil and gas
operations.
Credit
Agreement. As of December 31, 2009, Whiting Oil and Gas
Corporation, (“Whiting Oil and Gas”), our wholly-owned subsidiary, had a credit
agreement with a syndicate of banks, and this credit facility has a borrowing
base of $1.1 billion with $939.7 million of available borrowing capacity, which
is net of $160.0 million in borrowings and $0.3 million in letters of credit
outstanding. The credit agreement provides for interest only payments
until April 2012, when the agreement expires and all outstanding borrowings are
due.
The
borrowing base under the renewed credit agreement is determined at the
discretion of the lenders, based on the collateral value of the proved reserves
that have been mortgaged to the lenders, and is subject to regular
redeterminations on May 1 and November 1 of each year, as well as special
redeterminations described in the credit agreement, in each case which may
reduce the amount of the borrowing base. Whiting Oil and Gas may,
throughout the term of the credit agreement, borrow, repay and reborrow up to
the borrowing base in effect at any given time. A portion of the
revolving credit agreement in an aggregate amount not to exceed $50.0 million
may be used to issue letters of credit for the account of Whiting Oil and Gas or
other designated subsidiaries of ours. As of December 31, 2009, $49.7
million was available for additional letters of credit under the
agreement.
The
credit agreement contains restrictive covenants that may limit our ability to,
among other things, incur additional indebtedness, sell assets, make loans to
others, make investments, enter into mergers, enter into hedging contracts,
incur liens and engage in certain other transactions without the prior consent
of our lenders. The credit agreement requires us, as of the last day
of any quarter, (i) to not exceed a total debt to EBITDAX ratio (as defined in
the credit agreement) of 4.5 to 1.0 for the last four quarters ending prior to
and on September 30, 2010, 4.25 to 1.0 for quarters ending December 31, 2010 to
June 30, 2011 and 4.0 to 1.0 for quarters ending September 30, 2011 and
thereafter, (ii) to have a consolidated current assets to consolidated current
liabilities ratio (as defined in the credit agreement and which includes an add
back of the available borrowing capacity under the credit agreement) of not less
than 1.0 to 1.0 and (iii) to not exceed a senior secured debt to EBITDAX ratio
(as defined in the credit agreement) of 2.75 to 1.0 for the last four quarters
ending prior to and on December 31, 2009 and 2.5 to 1.0 for quarters ending
March 31, 2010 and thereafter. Except for limited exceptions, which
include the payment of dividends on our 6.25% convertible perpetual preferred
stock, the credit agreement restricts our ability to make any dividends or
distributions on our common stock or principal payments on our senior
notes. We were in compliance with our covenants under the credit
agreement as of December 31, 2009.
For
further information on the interest rates and loan security related to our
credit agreement, refer to the Long-Term Debt footnote in the Notes to
Consolidated Financial Statements.
Senior Subordinated
Notes. In October 2005, we issued at par
$250.0 million of 7% Senior Subordinated Notes due 2014. In
April 2005, we issued $220.0 million of 7.25% Senior Subordinated Notes due
2013. These notes were issued at 98.507% of par, and the associated
discount is being amortized to interest expense over the term of these
notes. In May 2004, we issued $150.0 million of 7.25%
Senior Subordinated Notes due 2012. These notes were issued at 99.26%
of par, and the associated discount is being amortized to interest expense over
the term of these notes.
The
indentures governing the notes restrict us from incurring additional
indebtedness, subject to certain exceptions, unless our fixed charge coverage
ratio (as defined in the indentures) is at least 2.0 to 1. If we were
in violation of this covenant, then we may not be able to incur additional
indebtedness, including under Whiting Oil and Gas Corporation’s credit
agreement. Additionally, the indentures governing the notes contain
restrictive covenants that may limit our ability to, among other things, pay
cash dividends, redeem or repurchase our capital stock or our subordinated debt,
make investments or issue preferred stock, sell assets, consolidate, merge or
transfer all or substantially all of the assets of ours and our restricted
subsidiaries taken as a whole and enter into hedging contracts. These
covenants may potentially limit the discretion of our management in certain
respects. We were in compliance with these covenants as of December
31, 2009. However, a substantial or extended decline in oil or
natural gas prices may adversely affect our ability to comply with these
covenants in the future.
Shelf Registration
Statement. We have on file with the SEC a universal shelf
registration statement to allow us to offer an indeterminate amount of
securities in the future. Under the registration statement, we may
periodically offer from time to time debt securities, common stock, preferred
stock, warrants and other securities or any combination of such securities in
amounts, prices and on terms announced when and if the securities are
offered. The specifics of any future offerings, along with the use of
proceeds of any securities offered, will be described in detail in a prospectus
supplement at the time of any such offering.
Contractual
Obligations and Commitments
Schedule of Contractual
Obligations. The table below does not include our Production
Participation Plan liabilities since we cannot determine with accuracy the
timing or amounts of future payments. The following table summarizes
our obligations and commitments as of December 31, 2009 to make future payments
under certain contracts, aggregated by category of contractual obligation, for
specified time periods (in thousands):
|
Payments
due by period
|
||||||||||||||||||||
|
Contractual
Obligations
|
Total
|
Less
than 1 year
|
1-3
years
|
3-5
years
|
More
than 5 years
|
|||||||||||||||
|
Long-term
debt (a)
|
$ | 780,000 | $ | - | $ | 310,000 | $ | 470,000 | $ | - | ||||||||||
|
Cash
interest expense on debt (b)
|
158,821 | 48,121 | 86,425 | 24,275 | - | |||||||||||||||
|
Asset
retirement obligations (c)
|
77,186 | 10,340 | 926 | 4,820 | 61,100 | |||||||||||||||
|
Tax
sharing liability (d)
|
22,601 | 1,857 | 3,320 | 17,424 | - | |||||||||||||||
|
Derivative
contract liability fair value (e)
|
187,172 | 49,551 | 99,550 | 38,071 | - | |||||||||||||||
|
Purchase
obligations (f)
|
156,796 | 40,235 | 79,251 | 37,310 | - | |||||||||||||||
|
Drilling
rig contracts (g)
|
76,728 | 40,826 | 35,531 | 371 | - | |||||||||||||||
|
Operating
leases (h)
|
11,373 | 2,677 | 6,314 | 2,382 | - | |||||||||||||||
|
Total
|
$ | 1,470,677 | $ | 193,607 | $ | 621,317 | $ | 594,653 | $ | 61,100 | ||||||||||
________________
|
(a)
|
Long-term
debt consists of the 7.25% Senior Subordinated Notes due 2012 and 2013,
the 7% Senior Subordinated Notes due 2014 and the outstanding debt under
our credit agreement, and assumes no principal repayment until the due
date of the instruments.
|
|
(b)
|
Cash
interest expense on the 7.25% Senior Subordinated Notes due 2012 and 2013
and the 7% Senior Subordinated Notes due 2014 is estimated assuming no
principal repayment until the due date of the instruments. Cash
interest expense on the credit agreement is estimated assuming no
principal repayment until the instrument due date and is estimated at a
fixed interest rate of 2.4%.
|
|
(c)
|
Asset
retirement obligations represent the present value of estimated amounts
expected to be incurred in the future to plug and abandon oil and gas
wells, remediate oil and gas properties and dismantle their related
facilities.
|
|
(d)
|
Amounts
shown represent the present value of estimated payments due to Alliant
Energy based on projected future income tax benefits attributable to an
increase in our tax bases. As a result of the Tax Separation
and Indemnification Agreement signed with Alliant Energy, the increased
tax bases are expected to result in increased future income tax deductions
and, accordingly, may reduce income taxes otherwise payable by
us. Under this agreement, we have agreed to pay Alliant Energy
90% of the future tax benefits we realize annually as a result of this
step up in tax basis for the years ending on or prior to December 31,
2013. In 2014, we will be obligated to pay Alliant Energy the
present value of the remaining tax benefits assuming all such tax benefits
will be realized in future years.
|
|
(e)
|
The
above derivative obligation at December 31, 2009 consists of a $177.2
million fair value liability for derivative contracts we have entered into
on our own behalf, primarily in the form of costless collars, to hedge our
exposure to crude oil price fluctuations. With respect to our
open derivative contracts at December 31, 2009 with certain
counterparties, the forward price curve for crude oil generally exceeded
the price curve that was in effect when these contracts were entered into,
resulting in a derivative fair value liability. If current
market prices are higher than a collar’s price ceiling when the cash
settlement amount is calculated, we are required to pay the contract
counterparties. The ultimate settlement amounts under our
derivative contracts are unknown, however, as they are subject to
continuing market and commodity price risk. The above
derivative obligation at December 31, 2009 also consists of a $10.0
million payable to Whiting USA Trust I (“Trust”) for derivative contracts
that we have entered into but have in turn conveyed to the
Trust. Although these derivatives are in a fair value asset
position at year end, 75.8% of such derivative assets are due to the Trust
under the terms of the conveyance.
|
|
(f)
|
We
have two take-or-pay purchase agreements, one agreement expiring in March
2014 and one agreement expiring in December 2014, whereby we have
committed to buy certain volumes of CO2 for use in enhanced
recovery projects in our Postle field in Oklahoma and our North Ward Estes
field in Texas. The purchase agreements are with different
suppliers. Under the terms of the agreements, we are obligated
to purchase a minimum daily volume of CO2 (as calculated on an
annual basis) or else pay for any deficiencies at the price in effect when
the minimum delivery was to have occurred. The CO2 volumes planned for use
in the enhanced recovery projects in the Postle and North Ward Estes
fields currently exceed the minimum daily volumes provided in these
take-or-pay purchase agreements. Therefore, we expect to avoid
any payments for deficiencies.
|
|
(g)
|
We
currently have six drilling rigs under long-term contract, of which three
drilling rigs expire in 2010, one in 2011, one in 2012 and one in
2013. All of these rigs are operating in the Rocky Mountains
region. As of December 31, 2009, early termination of the
remaining contracts would require termination penalties of $49.1 million,
which would be in lieu of paying the remaining drilling commitments of
$76.7 million. No other drilling rigs working for us are
currently under long-term contracts or contracts that cannot be terminated
at the end of the well that is currently being drilled. Due to
the short-term and indeterminate nature of the drilling time remaining on
rigs drilling on a well-by-well basis, such obligations have not been
included in this table.
|
|
(h)
|
We
lease 107,400 square feet of administrative office space in Denver,
Colorado under an operating lease arrangement expiring in 2013, and an
additional 46,700 square feet of office space in Midland, Texas expiring
in 2012.
|
Based on
current oil and natural gas prices and anticipated levels of production, we
believe that the estimated net cash generated from operations, together with
cash on hand and amounts available under our credit agreement, will be adequate
to meet future liquidity needs, including satisfying our financial obligations
and funding our operations and exploration and development
activities.
New
Accounting Pronouncements
For
further information on the effects of recently adopted accounting pronouncements
and the potential effects of new accounting pronouncements, refer to the Adopted
and Recently Issued Accounting Pronouncements footnote in the Notes to
Consolidated Financial Statements.
Critical
Accounting Policies and Estimates
Our
discussion of financial condition and results of operations is based upon the
information reported in our consolidated financial statements. The
preparation of these statements requires us to make certain assumptions and
estimates that affect the reported amounts of assets, liabilities, revenues and
expenses as well as the disclosure of contingent assets and liabilities at the
date of our financial statements. We base our assumptions and
estimates on historical experience and other sources that we believe to be
reasonable at the time. Actual results may vary from our estimates
due to changes in circumstances, weather, politics, global economics, mechanical
problems, general business conditions and other factors. A summary of
our significant accounting policies is detailed in Note 1 to our Consolidated
Financial Statements. We have outlined below certain of these
policies as being of particular importance to the portrayal of our financial
position and results of operations and which require the application of
significant judgment by our management.
Successful Efforts
Accounting. We account for our oil and gas operations using
the successful efforts method of accounting. Under this method, the
fair value of property acquired and all costs associated with successful
exploratory wells and all development wells are capitalized. Items
charged to expense generally include geological and geophysical costs, costs of
unsuccessful exploratory wells and oil and gas production costs. All
of our properties are located within the continental United States and the Gulf
of Mexico.
Oil and Natural Gas Reserve
Quantities. Reserve quantities and the related estimates of
future net cash flows affect our periodic calculations of depletion, impairment
of our oil and natural gas properties, asset retirement obligations, and our
long-term Production Participation Plan liability. Proved oil and gas
reserves are those quantities of oil and gas, which, by analysis of geoscience
and engineering data, can be estimated with reasonable certainty to be
economically producible—from a given date forward, from known reservoirs, and
under existing economic conditions, operating methods, and government
regulations—prior to the time at which contracts providing the right to operate
expire, unless evidence indicates that renewal is reasonably certain, regardless
of whether deterministic or probabilistic methods are used for the
estimation. Reserve quantities and future cash flows included in this
report are prepared in accordance with guidelines established by the SEC and
FASB. The accuracy of our reserve estimates is a function
of:
|
•
|
the
quality and quantity of available data;
|
|
|
•
|
the
interpretation of that data;
|
|
|
•
|
the
accuracy of various mandated economic assumptions; and
|
|
|
•
|
the
judgments of the persons preparing the
estimates.
|
Our
estimates of proved, probable and possible reserve quantities are based 100% on
reports prepared by our independent petroleum engineers. The
independent petroleum engineers, Cawley, Gillespie & Associates, Inc.,
evaluated 100% of our estimated proved reserve quantities and their related
pre-tax future net cash flows as of December 31, 2009. Estimates
prepared by others may be higher or lower than our estimates. Because
these estimates depend on many assumptions, all of which may differ
substantially from actual results, reserve estimates may be different from the
quantities of oil and gas that are ultimately recovered. We
continually make revisions to reserve estimates throughout the year as
additional information becomes available. We make changes to
depletion rates, impairment calculations, asset retirement obligations and our
Production Participation Plan liability in the same period that changes to
reserve estimates are made.
Depreciation, Depletion and
Amortization. Our rate of recording DD&A is dependent upon
our estimates of total proved and proved developed reserves, which estimates
incorporate various assumptions and future projections. If the
estimates of total proved or proved developed reserves decline, the rate at
which we record DD&A expense increases, reducing our net
income. Such a decline in reserves may result from lower commodity
prices, which may make it uneconomic to drill for and produce higher cost
fields. We are unable to predict changes in reserve quantity
estimates as such quantities are dependent on the success of our exploitation
and development program, as well as future economic conditions.
Impairment of Oil and Gas
Properties. We review the value of our oil and gas properties
whenever management judges that events and circumstances indicate that the
recorded carrying value of properties may not be
recoverable. Impairments of producing properties are determined by
comparing future net undiscounted cash flows to the net book value at the end of
each period. If the net capitalized cost exceeds undiscounted future
cash flows, the cost of the property is written down to “fair value,” which is
determined using net discounted future cash flows from the producing
property. Different pricing assumptions or discount rates could
result in a different calculated impairment. We provide for
impairments on significant undeveloped properties when we determine that the
property will not be developed or a permanent impairment in value has
occurred. Individually insignificant unproved properties are
amortized on a composite basis, based on past success, experience and average
lease-term lives.
Asset Retirement Obligation.
Our asset retirement obligations (“AROs”) consist primarily of estimated
future costs associated with the plugging and abandonment of oil and gas wells,
removal of equipment and facilities from leased acreage, and land restoration in
accordance with applicable local, state and federal laws. The
discounted fair value of an ARO liability is required to be recognized in the
period in which it is incurred, with the associated asset retirement cost
capitalized as part of the carrying cost of the oil and gas
asset. The recognition of an ARO requires that management make
numerous assumptions regarding such factors as the estimated probabilities,
amounts and timing of settlements; the credit-adjusted risk-free rate to be
used; inflation rates; and future advances in technology. In periods
subsequent to the initial measurement of the ARO, we must recognize
period-to-period changes in the liability resulting from the passage of time and
revisions to either the timing or the amount of the original estimate of
undiscounted cash flows. Increases in the ARO liability due to
passage of time impact net income as accretion expense. The related
capitalized cost, including revisions thereto, is charged to expense through
DD&A over the life of the oil and gas field.
Production Participation
Plan. We have a Production Participation Plan (“Plan”) in
which all employees participate. Each year, a deemed economic
interest in all oil and gas properties acquired or developed during the year is
contributed to the Plan. The Compensation Committee of the Board of
Directors, in its discretion for each Plan year, allocates a percentage of
future net income (defined as gross revenues less production taxes, royalties
and direct lease operating expenses) attributable to such properties to Plan
participants. Once contributed and allocated, the interests (not
legally conveyed) are fixed for each Plan year. The short-term
obligation related to the Production Participation Plan is included in the
“Accrued Employee Compensation and Benefits” line item in our consolidated
balance sheets. This obligation is based on cash flows during the
year and is paid annually in cash after year end. The calculation of
this liability depends in part on our estimates of accrued revenues and costs as
of the end of each reporting period as discussed below under “Revenue
Recognition”. The vested long-term obligation related to the
Production Participation Plan is the “Production Participation Plan liability”
line item in the consolidated balance sheets. This liability is
derived primarily from reserve report estimates discounted at 12%, which as
discussed above, are subject to revision as more information becomes
available. Our price assumptions are currently determined using
average prices for the preceding three years. Variances between
estimates used to calculate liabilities related to the Production Participation
Plan and actual sales, costs and reserve data are integrated into the liability
calculations in the period identified. A 10% increase to the pricing
assumptions used in the measurement of this liability at December 31, 2009
would have decreased net income before taxes by $10.7 million in
2009.
Derivative Instruments and Hedging
Activity. We periodically enter into commodity derivative
contracts to manage our exposure to oil and natural gas price
volatility. We use hedging to help ensure that we have adequate cash
flow to fund our capital programs and manage price risks and returns on some of
our acquisitions and drilling programs. Our decision on the quantity
and price at which we choose to hedge our production is based in part on our
view of current and future market conditions. While the use of these
hedging arrangements limits the downside risk of adverse price movements, they
may also limit future revenues from favorable price movements. We
primarily utilize costless collars, which are generally placed with major
financial institutions. The oil and natural gas reference prices of
these commodity derivative contracts are based upon crude oil and natural gas
futures, which have a high degree of historical correlation with actual prices
we receive.
All
derivative instruments are recorded on the consolidated balance sheet at fair
value, other than the derivative instruments that meet the normal purchase
normal sales exclusion. Changes in the derivatives’ fair value are
recognized currently in earnings unless specific hedge accounting criteria are
met. For qualifying cash flow hedges, the fair value gain or loss on
the derivative is deferred in accumulated other comprehensive income (loss) to
the extent the hedge is effective and is reclassified to gain (loss) on hedging
activities line item in our consolidated statements of income in the period that
the hedged production is delivered.
We value
our costless collars using industry-standard models that consider various
assumptions, including quoted forward prices for commodities, time value,
volatility factors and contractual prices for the underlying instruments, as
well as other relevant economic measures. The discount rate used in
the fair values of these instruments includes a measure of nonperformance risk
by the counterparty or us, as appropriate. We utilize the counterparties’
valuations to assess the reasonableness of our valuations. The values we report
in our financial statements change as these estimates are revised to reflect
actual results, changes in market conditions or other factors, many of which are
beyond our control.
The use
of hedging transactions also involves the risk that the counterparties will be
unable to meet the financial terms of such transactions. We evaluate
the ability of our counterparties to perform at the inception of a hedging
relationship and on a periodic basis as appropriate.
Income Taxes and Uncertain Tax
Positions. We provide for income taxes in accordance with
Statement of Financial Accounting Standards No. 109, Accounting for Income Taxes,
as codified in FASB ASC topic Income Taxes. We
record deferred tax assets and liabilities to account for the expected future
tax consequences of events that have been recognized in our financial statements
and our tax returns. We routinely assess the realizability of our
deferred tax assets. If we conclude that it is more likely than not
that some portion or all of the deferred tax assets will not be realized, the
tax asset would be reduced by a valuation allowance. We consider
future taxable income in making such assessments. Numerous judgments
and assumptions are inherent in the determination of future taxable income,
including factors such as future operating conditions (particularly as related
to prevailing oil and natural gas prices).
In July
2006, the FASB issued Interpretation No. 48, Accounting for Uncertainty in Income
Taxes — An Interpretation of FASB Statement No. 109, as
codified in FASB ASC topic Income Taxes, which requires
income tax positions to meet a more-likely-than-not recognition threshold to be
recognized in the financial statements. Under FASB ASC topic Income Taxes, tax positions
that previously failed to meet the more-likely-than-not threshold should be
recognized in the first subsequent financial reporting period in which that
threshold is met. Previously recognized tax positions that no longer
meet the more-likely-than-not threshold should be derecognized in the first
subsequent financial reporting period in which that threshold is no longer
met. Prior to 2007 we recorded contingent income tax liabilities to
the extent they were probable and could be reasonably estimated.
We are
subject to taxation in many jurisdictions, and the calculation of our tax
liabilities involves dealing with uncertainties in the application of complex
tax laws and regulations in various taxing jurisdictions. If we
ultimately determine that the payment of these liabilities will be unnecessary,
we reverse the liability and recognize a tax benefit during the period in which
we determine the liability no longer applies. Conversely, we record
additional tax charges in a period in which we determine that a recorded tax
liability is less than we expect the ultimate assessment to be.
Revenue
Recognition. We predominantly derive our revenue from the sale
of produced oil and gas. Revenue is recorded in the month the product
is delivered to the purchaser. We receive payment from one to three
months after delivery. At the end of each month, we estimate the
amount of production delivered to purchasers and the price we will
receive. Variances between our estimated revenue and actual payment
are recorded in the month the payment is received. However,
differences have been insignificant.
Accounting for Business
Combinations. Our business has grown substantially through
acquisitions, and our business strategy is to continue to pursue acquisitions as
opportunities arise. We have accounted for all of our business
combinations to date using the purchase method, which is the only method
permitted under SFAS No. 141(R), Business Combinations, as
codified in FASB ASC topic Business Combinations, and involves the use of
significant judgment.
Under the
purchase method of accounting, a business combination is accounted for at a
purchase price based upon the fair value of the consideration
given. The assets and liabilities acquired are measured at their fair
values, and the purchase price is allocated to the assets and liabilities based
upon these fair values. The excess of the cost of an acquired entity,
if any, over the net amounts assigned to assets acquired and liabilities assumed
is recognized as goodwill. The excess of the fair value of assets
acquired and liabilities assumed over the cost of an acquired entity, if any, is
recognized immediately to earnings as a gain from bargain purchase.
Determining
the fair values of the assets and liabilities acquired involves the use of
judgment, since some of the assets and liabilities acquired do not have fair
values that are readily determinable. Different techniques may be
used to determine fair values, including market prices (where available),
appraisals, comparisons to transactions for similar assets and liabilities, and
present value of estimated future cash flows, among others. Since
these estimates involve the use of significant judgment, they can change as new
information becomes available.
Each of
the business combinations completed during the prior three years consisted of
oil and gas properties. The consideration we have paid to acquire
these properties or companies was entirely allocated to the fair value of the
assets acquired and liabilities assumed at the time of
acquisition. Consequently, there were no goodwill nor any bargain
purchase gains recognized on any of our business combinations.
Effects
of Inflation and Pricing
We
experienced increased costs during 2008 and 2007 due to increased demand for oil
field products and services, while costs in 2009 remained consistent with
2008. The oil and gas industry is very cyclical and the demand for
goods and services of oil field companies, suppliers and others associated with
the industry put extreme pressure on the economic stability and pricing
structure within the industry. Typically, as prices for oil and
natural gas increase, so do all associated costs. Conversely, in a
period of declining prices, associated cost declines are likely to lag and not
adjust downward in proportion to prices. Material changes in prices
also impact the current revenue stream, estimates of future reserves, borrowing
base calculations of bank loans, depletion expense, impairment assessments of
oil and gas properties, and values of properties in purchase and sale
transactions. Material changes in prices can impact the value of oil
and gas companies and their ability to raise capital, borrow money and retain
personnel. While we do not currently expect business costs to
materially increase, higher prices for oil and natural gas could result in
increases in the costs of materials, services and personnel.
Forward-Looking
Statements
This
report contains statements that we believe to be “forward-looking statements”
within the meaning of the Private Securities Litigation Reform Act of
1995. All statements other than historical facts, including, without
limitation, statements regarding our future financial position, business
strategy, projected revenues, earnings, costs, capital expenditures and debt
levels, and plans and objectives of management for future operations, are
forward-looking statements. When used in this report, words such as
we “expect,” “intend,” “plan,” “estimate,” “anticipate,” “believe” or “should”
or the negative thereof or variations thereon or similar terminology are
generally intended to identify forward-looking statements. Such
forward-looking statements are subject to risks and uncertainties that could
cause actual results to differ materially from those expressed in, or implied
by, such statements.
These
risks and uncertainties include, but are not limited to: declines in
oil or natural gas prices; impacts of the global recession and tight credit
markets; our level of success in exploitation, exploration, development and
production activities; adverse weather conditions that may negatively impact
development or production activities; the timing of our exploration and
development expenditures, including our ability to obtain CO2; inaccuracies of our reserve
estimates or our assumptions underlying them; revisions to reserve estimates as
a result of changes in commodity prices; risks related to our level of
indebtedness and periodic redeterminations of the borrowing base under our
credit agreement; our ability to generate sufficient cash flows from operations
to meet the internally funded portion of our capital expenditures budget; our
ability to obtain external capital to finance exploration and development
operations and acquisitions; our ability to identify and complete acquisitions
and to successfully integrate acquired businesses; unforeseen underperformance
of or liabilities associated with acquired properties; our ability to
successfully complete potential asset dispositions; the impacts of hedging on
our results of operations; failure of our properties to yield oil or gas in
commercially viable quantities; uninsured or underinsured losses resulting from
our oil and gas operations; our inability to access oil and gas markets due to
market conditions or operational impediments; the impact and costs of compliance
with laws and regulations governing our oil and gas operations; our ability to
replace our oil and natural gas reserves; any loss of our senior management or
technical personnel; competition in the oil and gas industry in the regions in
which we operate; risks arising out of our hedging transactions; and other risks
described under the caption “Risk Factors” in this Annual Report on Form
10-K. We assume no obligation, and disclaim any duty, to update the
forward-looking statements in this Annual Report on Form 10-K.
|
Item 7A.
|
Quantitative and Qualitative Disclosure About
Market Risk
|
Commodity
Price Risk
The price
we receive for our oil and gas production heavily influences our revenue,
profitability, access to capital and future rate of growth. Crude oil
and natural gas are commodities and, therefore, their prices are subject to wide
fluctuations in response to relatively minor changes in supply and
demand. Historically, the markets for oil and gas have been volatile,
and these markets will likely continue to be volatile in the
future. The prices we receive for our production depend on numerous
factors beyond our control. Based on 2009 production, our income
before income taxes for 2009 would have moved up or down $15.4 million for each
$1.00 per Bbl change in oil prices and $2.9 million for every $0.10 per Mcf
change in natural gas prices.
We
periodically enter into derivative contracts to achieve a more predictable cash
flow by reducing our exposure to oil and natural gas price
volatility. Our derivative contracts have traditionally been costless
collars, although we evaluate other forms of derivative instruments as
well. Starting April 1, 2009, we have not applied hedge accounting,
and therefore all changes in commodity derivative fair values since that date
have been recorded immediately to earnings. Recognition of derivative
settlement gains and losses in the consolidated statements of income occurs in
the period that hedged production volumes are sold.
Our
outstanding hedges as of February 16, 2010 are summarized below:
Whiting
Petroleum Corporation
|
Commodity
|
Period
|
Monthly
Volume
(Bbl)
|
Weighted
Average
NYMEX
Floor/Ceiling
|
|||
|
Crude
Oil
|
01/2010
to 03/2010
|
555,000
|
$61.78/$79.38
|
|||
|
Crude
Oil
|
04/2010
to 06/2010
|
640,000
|
$64.36/$84.48
|
|||
|
Crude
Oil
|
07/2010
to 09/2010
|
630,000
|
$62.37/$84.10
|
|||
|
Crude
Oil
|
10/2010
to 12/2010
|
615,000
|
$62.42/$86.19
|
|||
|
Crude
Oil
|
01/2011
to 03/2011
|
360,000
|
$56.25/$83.78
|
|||
|
Crude
Oil
|
04/2011
to 06/2011
|
360,000
|
$56.25/$83.78
|
|||
|
Crude
Oil
|
07/2011
to 09/2011
|
360,000
|
$56.25/$83.78
|
|||
|
Crude
Oil
|
10/2011
to 12/2011
|
360,000
|
$56.25/$83.78
|
|||
|
Crude
Oil
|
01/2012
to 03/2012
|
330,000
|
$55.91/$85.46
|
|||
|
Crude
Oil
|
04/2012
to 06/2012
|
330,000
|
$55.91/$85.46
|
|||
|
Crude
Oil
|
07/2012
to 09/2012
|
330,000
|
$55.91/$85.46
|
|||
|
Crude
Oil
|
10/2012
to 12/2012
|
330,000
|
$55.91/$85.46
|
|||
|
Crude
Oil
|
01/2013
to 03/2013
|
290,000
|
$55.34/$85.94
|
|||
|
Crude
Oil
|
04/2013
to 06/2013
|
290,000
|
$55.34/$85.94
|
|||
|
Crude
Oil
|
07/2013
to 09/2013
|
290,000
|
$55.34/$85.94
|
|||
|
Crude
Oil
|
10/2013
|
290,000
|
$55.34/$85.94
|
|||
|
Crude
Oil
|
11/2013
|
190,000
|
$54.59/$81.75
|
In
connection with our conveyance on April 30, 2008 of a term net profits interest
to Whiting USA Trust I (as further explained in the note on Acquisitions and
Divestitures), the rights to any future hedge payments we make or receive on
certain of our derivative contracts, representing 1,431 MBbls of crude oil and
5,438 MMcf of natural gas from 2010 through 2012, have been conveyed to the
Trust, and therefore such payments will be included in the Trust’s calculation
of net proceeds. Under the terms of the aforementioned conveyance, we
retain 10% of the net proceeds from the underlying properties. Our
retention of 10% of these net proceeds combined with our ownership of 2,186,389
Trust units, results in third-party public holders of Trust units receiving
75.8%, while we retain 24.2%, of future economic results of such
hedges. No additional hedges are allowed to be placed on Trust
assets.
The table
below summarizes all of the costless collars that we entered into and then in
turn conveyed, as described in the preceding paragraph, to Whiting USA Trust I
(of which we retain 24.2% of the future economic results and third-party public
holders of Trust units receive 75.8% of the future economic
results):
Conveyed
to Whiting USA Trust I
|
Commodity
|
Period
|
Monthly
Volume
(Bbl)/(MMBtu)
|
Weighted
Average
NYMEX
Floor/Ceiling
|
|||
|
Crude
Oil
|
01/2010
to 03/2010
|
45,084
|
$76.00/$135.09
|
|||
|
Crude
Oil
|
04/2010
to 06/2010
|
43,978
|
$76.00/$134.85
|
|||
|
Crude
Oil
|
07/2010
to 09/2010
|
42,966
|
$76.00/$134.89
|
|||
|
Crude
Oil
|
10/2010
to 12/2010
|
41,924
|
$76.00/$135.11
|
|||
|
Crude
Oil
|
01/2011
to 03/2011
|
40,978
|
$74.00/$139.68
|
|||
|
Crude
Oil
|
04/2011
to 06/2011
|
40,066
|
$74.00/$140.08
|
|||
|
Crude
Oil
|
07/2011
to 09/2011
|
39,170
|
$74.00/$140.15
|
|||
|
Crude
Oil
|
10/2011
to 12/2011
|
38,242
|
$74.00/$140.75
|
|||
|
Crude
Oil
|
01/2012
to 03/2012
|
37,412
|
$74.00/$141.27
|
|||
|
Crude
Oil
|
04/2012
to 06/2012
|
36,572
|
$74.00/$141.73
|
|||
|
Crude
Oil
|
07/2012
to 09/2012
|
35,742
|
$74.00/$141.70
|
|||
|
Crude
Oil
|
10/2012
to 12/2012
|
35,028
|
$74.00/$142.21
|
|||
|
Natural
Gas
|
01/2010
to 03/2010
|
178,903
|
$7.00/$18.65
|
|||
|
Natural
Gas
|
04/2010
to 06/2010
|
172,873
|
$6.00/$13.20
|
|||
|
Natural
Gas
|
07/2010
to 09/2010
|
167,583
|
$6.00/$14.00
|
|||
|
Natural
Gas
|
10/2010
to 12/2010
|
162,997
|
$7.00/$14.20
|
|||
|
Natural
Gas
|
01/2011
to 03/2011
|
157,600
|
$7.00/$17.40
|
|||
|
Natural
Gas
|
04/2011
to 06/2011
|
152,703
|
$6.00/$13.05
|
|||
|
Natural
Gas
|
07/2011
to 09/2011
|
148,163
|
$6.00/$13.65
|
|||
|
Natural
Gas
|
10/2011
to 12/2011
|
142,787
|
$7.00/$14.25
|
|||
|
Natural
Gas
|
01/2012
to 03/2012
|
137,940
|
$7.00/$15.55
|
|||
|
Natural
Gas
|
04/2012
to 06/2012
|
134,203
|
$6.00/$13.60
|
|||
|
Natural
Gas
|
07/2012
to 09/2012
|
130,173
|
$6.00/$14.45
|
|||
|
Natural
Gas
|
10/2012
to 12/2012
|
126,613
|
$7.00/$13.40
|
The
collared hedges shown above have the effect of providing a protective floor
while allowing us to share in upward pricing movements. Consequently,
while these hedges are designed to decrease our exposure to price decreases,
they also have the effect of limiting the benefit of price increases above the
ceiling. For the crude oil contracts listed in both tables above, a
hypothetical $5.00 per Bbl change in the NYMEX forward curve as of
December 31, 2009 applied to the notional amounts would cause a change in
our commodity derivative (gain) loss of $67.9 million. For the
natural gas contracts listed above, a hypothetical $0.50 per Mcf change in the
NYMEX forward curve as of December 31, 2009 applied to the notional amounts
would cause a change in our commodity derivative (gain) loss of $0.3
million.
We have
various fixed price gas sales contracts with end users for a portion of the
natural gas we produce in Colorado, Michigan and Utah. Our estimated
future production volumes to be sold under these fixed price contracts as of
February 16, 2010 are summarized below:
|
Commodity
|
Period
|
Monthly
Volume
(MMBtu)
|
|
Weighted
Average
Price
Per MMBtu
|
||
|
Natural
Gas
|
01/2010
to 03/2010
|
689,000
|
$5.36
|
|||
|
Natural
Gas
|
04/2010
to 06/2010
|
695,667
|
$5.36
|
|||
|
Natural
Gas
|
07/2010
to 09/2010
|
702,333
|
$5.36
|
|||
|
Natural
Gas
|
10/2010
to 12/2010
|
702,333
|
$5.36
|
|||
|
Natural
Gas
|
01/2011
to 03/2011
|
659,000
|
$5.39
|
|||
|
Natural
Gas
|
04/2011
to 06/2011
|
665,333
|
$5.38
|
|||
|
Natural
Gas
|
07/2011
to 09/2011
|
649,667
|
$5.38
|
|||
|
Natural
Gas
|
10/2011
to 12/2011
|
649,667
|
$5.38
|
|||
|
Natural
Gas
|
01/2012
to 03/2012
|
457,000
|
$5.41
|
|||
|
Natural
Gas
|
04/2012
to 06/2012
|
461,333
|
$5.41
|
|||
|
Natural
Gas
|
07/2012
to 09/2012
|
465,667
|
$5.41
|
|||
|
Natural
Gas
|
10/2012
to 12/2012
|
398,667
|
$5.46
|
|||
|
Natural
Gas
|
01/2013
to 03/2013
|
360,000
|
$5.47
|
|||
|
Natural
Gas
|
04/2013
to 06/2013
|
364,000
|
$5.47
|
|||
|
Natural
Gas
|
07/2013
to 09/2013
|
368,000
|
$5.47
|
|||
|
Natural
Gas
|
10/2013
to 12/2013
|
368,000
|
$5.47
|
|||
|
Natural
Gas
|
01/2014
to 03/2014
|
330,000
|
$5.49
|
|||
|
Natural
Gas
|
04/2014
to 06/2014
|
333,667
|
$5.49
|
|||
|
Natural
Gas
|
07/2014
to 09/2014
|
337,333
|
$5.49
|
|||
|
Natural
Gas
|
10/2014
to 12/2014
|
337,333
|
$5.49
|
Interest
Rate Risk
Market
risk is estimated as the change in fair value resulting from a hypothetical 100
basis point change in the interest rate on the outstanding balance under our
credit agreement. Our credit agreement allows us to fix the interest
rate for all or a portion of the principal balance for a period up to six
months. To the extent the interest rate is fixed, interest rate
changes affect the instrument’s fair market value but do not impact results of
operations or cash flows. Conversely, for the portion of the credit
agreement that has a floating interest rate, interest rate changes will not
affect the fair market value but will impact future results of operations and
cash flows. Changes in interest rates do not affect the amount of
interest we pay on our fixed-rate Senior Subordinated Notes. At
December 31, 2009, our outstanding principal balance under our credit
agreement was $160.0 million and the weighted average interest rate on the
outstanding principal balance was 2.4%. At December 31, 2009,
the carrying amount approximated fair market value. Assuming a
constant debt level of $160.0 million, the cash flow impact resulting from a 100
basis point change in interest rates during periods when the interest rate is
not fixed would be $1.5 million over a 12-month time period.
|
Item 8.
|
Financial Statements and Supplementary
Data
|
MANAGEMENT’S
ANNUAL REPORT ON INTERNAL CONTROL OVER FINANCIAL REPORTING
The
management of Whiting Petroleum Corporation and subsidiaries is responsible for
establishing and maintaining adequate internal control over financial reporting,
as such term is defined in Rules 13a-15(f) and 15d-15(f) under the Securities
Exchange Act of 1934. Our internal control over financial reporting
is designed to provide reasonable assurance regarding the reliability of
financial reporting and the preparation of financial statements for external
purposes in accordance with generally accepted accounting
principles.
Because
of the inherent limitations of internal control over financial reporting,
misstatements may not be prevented or detected on a timely
basis. Also, projections of any evaluation of the effectiveness of
the internal control over financial reporting to future periods are subject to
the risk that the controls may become inadequate because of changes in
conditions, or that the degree of compliance with the policies or procedures may
deteriorate.
Our
management assessed the effectiveness of our internal control over financial
reporting as of December 31, 2009 using the criteria set forth in Internal
Control - Integrated Framework issued by the Committee of Sponsoring
Organizations of the Treadway Commission. Based on this assessment,
our management believes that, as of December 31, 2009, our internal control
over financial reporting was effective based on those criteria.
The
effectiveness of our internal control over financial reporting as of
December 31, 2009 has been audited by Deloitte & Touche LLP, an
independent registered public accounting firm, as stated in their report which
is included herein on the following page.
REPORT
OF INDEPENDENT REGISTERED PUBLIC ACCOUNTING FIRM
To the
Board of Directors and Stockholders of
Whiting
Petroleum Corporation
Denver,
Colorado
We have
audited the internal control over financial reporting of Whiting Petroleum
Corporation and subsidiaries (the "Company") as of December 31, 2009, based on
criteria established in Internal Control—Integrated Framework issued by the
Committee of Sponsoring Organizations of the Treadway Commission. The
Company's management is responsible for maintaining effective internal control
over financial reporting and for its assessment of the effectiveness of internal
control over financial reporting, included in the accompanying Management’s
Annual Report on Internal Control Over Financial Reporting. Our
responsibility is to express an opinion on the Company's internal control over
financial reporting based on our audit.
We
conducted our audit in accordance with the standards of the Public Company
Accounting Oversight Board (United States). Those standards require
that we plan and perform the audit to obtain reasonable assurance about whether
effective internal control over financial reporting was maintained in all
material respects. Our audit included obtaining an understanding of
internal control over financial reporting, assessing the risk that a material
weakness exists, testing and evaluating the design and operating effectiveness
of internal control based on the assessed risk, and performing such other
procedures as we considered necessary in the circumstances. We
believe that our audit provides a reasonable basis for our opinion.
A
company's internal control over financial reporting is a process designed by, or
under the supervision of, the company's principal executive and principal
financial officers, or persons performing similar functions, and effected by the
company's board of directors, management, and other personnel to provide
reasonable assurance regarding the reliability of financial reporting and the
preparation of financial statements for external purposes in accordance with
generally accepted accounting principles. A company's internal control over
financial reporting includes those policies and procedures that (1) pertain to
the maintenance of records that, in reasonable detail, accurately and fairly
reflect the transactions and dispositions of the assets of the company; (2)
provide reasonable assurance that transactions are recorded as necessary to
permit preparation of financial statements in accordance with generally accepted
accounting principles, and that receipts and expenditures of the company are
being made only in accordance with authorizations of management and directors of
the company; and (3) provide reasonable assurance regarding prevention or timely
detection of unauthorized acquisition, use, or disposition of the company's
assets that could have a material effect on the financial
statements.
Because
of the inherent limitations of internal control over financial reporting,
including the possibility of collusion or improper management override of
controls, material misstatements due to error or fraud may not be prevented or
detected on a timely basis. Also, projections of any evaluation of
the effectiveness of the internal control over financial reporting to future
periods are subject to the risk that the controls may become inadequate because
of changes in conditions, or that the degree of compliance with the policies or
procedures may deteriorate.
In our
opinion, the Company maintained, in all material respects, effective internal
control over financial reporting as of December 31, 2009, based on the criteria
established in Internal Control—Integrated Framework issued by the Committee of
Sponsoring Organizations of the Treadway Commission.
We have also audited, in accordance
with the standards of the Public Company Accounting Oversight Board (United
States), the consolidated financial statements and financial statement schedule
as of and for the year ended December 31, 2009 of the Company and our report
dated March 1, 2010 expressed an unqualified opinion on those financial
statements and financial statement schedule and included an explanatory
paragraph regarding the Company’s adoption of new accounting
guidance.
/s/
DELOITTE & TOUCHE LLP
Denver,
Colorado
March 1,
2010
REPORT
OF INDEPENDENT REGISTERED PUBLIC ACCOUNTING FIRM
To the
Board of Directors and Stockholders of
Whiting
Petroleum Corporation
Denver,
Colorado
We have
audited the accompanying consolidated balance sheets of Whiting Petroleum
Corporation and subsidiaries (the "Company") as of December 31, 2009 and 2008,
and the related consolidated statements of income, stockholders' equity and
comprehensive income, and cash flows for each of the three years in the period
ended December 31, 2009. Our audits also included the financial
statement schedule listed in the Index at Item 15. These financial
statements and financial statement schedule are the responsibility of the
Company's management. Our responsibility is to express an opinion on
the financial statements and financial statement schedule based on our
audits.
We
conducted our audits in accordance with the standards of the Public Company
Accounting Oversight Board (United States). Those standards require
that we plan and perform the audit to obtain reasonable assurance about whether
the financial statements are free of material misstatement. An audit
includes examining, on a test basis, evidence supporting the amounts and
disclosures in the financial statements. An audit also includes
assessing the accounting principles used and significant estimates made by
management, as well as evaluating the overall financial statement presentation.
We believe that our audits provide a reasonable basis for our
opinion.
In our
opinion, such consolidated financial statements present fairly, in all material
respects, the financial position of Whiting Petroleum Corporation and
subsidiaries as of December 31, 2009 and 2008, and the results of their
operations and their cash flows for each of the three years in the period ended
December 31, 2009, in conformity with accounting principles generally accepted
in the United States of America. Also, in our opinion, such financial
statement schedule, when considered in relation to the basic consolidated
financial statements taken as a whole, present fairly, in all material respects,
the information set forth therein.
As
discussed in Note 1 to the consolidated financial statements, the Company
changed its method of oil and gas reserve estimation and related required
disclosures in 2009 with the implementation of new accounting
guidance.
We have
also audited, in accordance with the standards of the Public Company Accounting
Oversight Board (United States), the Company's internal control over financial
reporting as of December 31, 2009, based on the criteria established in Internal
Control—Integrated Framework issued by the Committee of Sponsoring Organizations
of the Treadway Commission and our report dated March 1, 2010 expressed an
unqualified opinion on the Company's internal control over financial
reporting.
/s/
DELOITTE & TOUCHE LLP
Denver,
Colorado
March 1,
2010
WHITING PETROLEUM CORPORATION AND SUBSIDIARIES
CONSOLIDATED
BALANCE SHEETS
(In
thousands)
|
December
31,
|
||||||||
|
2009
|
2008
|
|||||||
|
ASSETS
|
||||||||
|
CURRENT
ASSETS:
|
||||||||
|
Cash
and cash equivalents
|
$ | 11,960 | $ | 9,624 | ||||
|
Accounts
receivable trade, net
|
152,082 | 122,833 | ||||||
|
Derivative
assets
|
4,723 | 46,780 | ||||||
|
Deposits
on oil field equipment
|
- | 17,170 | ||||||
|
Prepaid
expenses and other
|
7,260 | 20,667 | ||||||
|
Total
current assets
|
176,025 | 217,074 | ||||||
|
PROPERTY
AND EQUIPMENT:
|
||||||||
|
Oil
and gas properties, successful efforts method:
|
||||||||
|
Proved
properties
|
4,870,688 | 4,423,197 | ||||||
|
Unproved
properties
|
100,706 | 106,436 | ||||||
|
Other
property and equipment
|
100,833 | 91,099 | ||||||
|
Total
property and equipment
|
5,072,227 | 4,620,732 | ||||||
|
Less
accumulated depreciation, depletion and amortization
|
(1,274,121 | ) | (886,065 | ) | ||||
|
Total
property and equipment, net
|
3,798,106 | 3,734,667 | ||||||
|
DEBT
ISSUANCE COSTS
|
24,672 | 10,779 | ||||||
|
DERIVATIVE
ASSETS
|
8,473 | 38,104 | ||||||
|
OTHER
LONG-TERM ASSETS
|
22,266 | 28,457 | ||||||
|
TOTAL
|
$ | 4,029,542 | $ | 4,029,081 | ||||
|
|
||||||||
|
See
notes to consolidated financial statements.
|
(Continued)
|
|||||||
WHITING
PETROLEUM CORPORATION AND SUBSIDIARIES
CONSOLIDATED
BALANCE SHEETS
(In
thousands, except share and per share data)
|
December
31,
|
||||||||
|
LIABILITIES
AND STOCKHOLDERS’ EQUITY
|
2009
|
2008
|
||||||
|
CURRENT
LIABILITIES:
|
||||||||
|
Accounts
payable
|
$ | 14,023 | $ | 64,610 | ||||
|
Accrued
capital expenditures
|
29,998 | 84,960 | ||||||
|
Accrued
liabilities
|
62,891 | 45,359 | ||||||
|
Accrued
interest
|
10,501 | 9,673 | ||||||
|
Oil
and gas sales payable
|
46,327 | 35,106 | ||||||
|
Accrued
employee compensation and benefits
|
22,105 | 41,911 | ||||||
|
Production
taxes payable
|
21,188 | 20,038 | ||||||
|
Deferred
gain on sale
|
12,966 | 14,650 | ||||||
|
Derivative
liabilities
|
49,551 | 17,354 | ||||||
|
Deferred
income taxes
|
11,325 | 15,395 | ||||||
|
Tax
sharing liability
|
1,857 | 2,112 | ||||||
|
Total
current liabilities
|
282,732 | 351,168 | ||||||
|
NON-CURRENT
LIABILITIES:
|
||||||||
|
Long-term
debt
|
779,585 | 1,239,751 | ||||||
|
Deferred
income taxes
|
341,037 | 390,902 | ||||||
|
Derivative
liabilities
|
137,621 | 28,131 | ||||||
|
Production
Participation Plan liability
|
69,433 | 66,166 | ||||||
|
Asset
retirement obligations
|
66,846 | 47,892 | ||||||
|
Deferred
gain on sale
|
58,462 | 73,216 | ||||||
|
Tax
sharing liability
|
20,744 | 21,575 | ||||||
|
Other
long-term liabilities
|
2,997 | 1,489 | ||||||
|
Total
non-current liabilities
|
1,476,725 | 1,869,122 | ||||||
|
COMMITMENTS
AND CONTINGENCIES
|
||||||||
|
STOCKHOLDERS’
EQUITY:
|
||||||||
|
Preferred
stock, $0.001 par value, 5,000,000 shares authorized;
6.25%
convertible perpetual preferred stock, 3,450,000 and 0 shares issued and
outstanding as of December 31, 2009 and December 31, 2008, respectively,
aggregate liquidation preference of $345,000,000
|
3 | - | ||||||
|
Common
stock, $0.001 par value, 75,000,000 shares authorized;
51,363,638
issued and 50,845,374 outstanding as of December 31, 2009, 42,582,100
issued and 42,323,336 outstanding as of December 31,
2008
|
51 | 43 | ||||||
|
Additional
paid-in capital
|
1,546,635 | 971,310 | ||||||
|
Accumulated
other comprehensive income
|
20,413 | 17,271 | ||||||
|
Retained
earnings
|
702,983 | 820,167 | ||||||
|
Total
stockholders’ equity
|
2,270,085 | 1,808,791 | ||||||
|
TOTAL
|
$ | 4,029,542 | $ | 4,029,081 | ||||
|
See
notes to consolidated financial statements.
|
(Concluded)
|
|||||||
WHITING PETROLEUM CORPORATION AND
SUBSIDIARIES
CONSOLIDATED
STATEMENTS OF INCOME
(In
thousands, except per share data)
|
Year
Ended December 31,
|
||||||||||||
|
2009
|
2008
|
2007
|
||||||||||
|
REVENUES
AND OTHER INCOME:
|
||||||||||||
|
Oil
and natural gas sales
|
$ | 917,541 | $ | 1,316,480 | $ | 809,017 | ||||||
|
Gain
(loss) on hedging activities
|
38,776 | (107,555 | ) | (21,189 | ) | |||||||
|
Amortization
of deferred gain on sale
|
16,596 | 12,143 | - | |||||||||
|
Gain
on sale of properties
|
5,947 | - | 29,682 | |||||||||
|
Interest
income and other
|
500 | 1,051 | 1,208 | |||||||||
|
Total
revenues and other income
|
979,360 | 1,222,119 | 818,718 | |||||||||
|
COSTS
AND EXPENSES:
|
||||||||||||
|
Lease
operating
|
237,270 | 241,248 | 208,866 | |||||||||
|
Production
taxes
|
64,672 | 87,548 | 52,407 | |||||||||
|
Depreciation,
depletion and amortization
|
394,792 | 277,448 | 192,811 | |||||||||
|
Exploration
and impairment
|
73,014 | 55,257 | 37,323 | |||||||||
|
General
and administrative
|
42,357 | 61,684 | 39,046 | |||||||||
|
Interest
expense
|
64,608 | 65,078 | 72,504 | |||||||||
|
Change
in Production Participation Plan liability
|
3,267 | 32,124 | 8,599 | |||||||||
|
Commodity
derivative (gain) loss, net
|
262,215 | (7,088 | ) | - | ||||||||
|
Total
costs and expenses
|
1,142,195 | 813,299 | 611,556 | |||||||||
|
INCOME
(LOSS) BEFORE INCOME TAXES
|
(162,835 | ) | 408,820 | 207,162 | ||||||||
|
INCOME
TAX EXPENSE (BENEFIT):
|
||||||||||||
|
Current
|
236 | 2,361 | 550 | |||||||||
|
Deferred
|
(56,189 | ) | 154,316 | 76,012 | ||||||||
|
Total
income tax expense (benefit)
|
(55,953 | ) | 156,677 | 76,562 | ||||||||
|
NET
INCOME (LOSS)
|
(106,882 | ) | 252,143 | 130,600 | ||||||||
|
Preferred
stock dividends
|
(10,302 | ) | - | - | ||||||||
|
NET
INCOME (LOSS) AVAILABLE TO COMMON SHAREHOLDERS
|
$ | (117,184 | ) | $ | 252,143 | $ | 130,600 | |||||
|
EARNINGS
(LOSS) PER COMMON SHARE, BASIC
|
$ | (2.36 | ) | $ | 5.96 | $ | 3.31 | |||||
|
EARNINGS
(LOSS) PER COMMON SHARE, DILUTED
|
$ | (2.36 | ) | $ | 5.94 | $ | 3.29 | |||||
|
WEIGHTED
AVERAGE SHARES OUTSTANDING, BASIC
|
50,044 | 42,310 | 39,483 | |||||||||
|
WEIGHTED
AVERAGE SHARES OUTSTANDING, DILUTED
|
50,044 | 42,447 | 39,645 | |||||||||
|
See
notes to consolidated financial statements.
|
||||||||||||
WHITING PETROLEUM CORPORATION AND SUBSIDIARIES
CONSOLIDATED
STATEMENTS OF CASH FLOWS
(In
thousands)
|
Year
Ended December 31,
|
||||||||||||
|
2009
|
2008
|
2007
|
||||||||||
|
CASH
FLOWS FROM OPERATING ACTIVITIES:
|
||||||||||||
|
Net
income (loss)
|
$ | (106,882 | ) | $ | 252,143 | $ | 130,600 | |||||
|
Adjustments
to reconcile net income (loss) to net cash provided by operating
activities:
|
||||||||||||
|
Depreciation,
depletion and amortization
|
394,792 | 277,448 | 192,811 | |||||||||
|
Deferred
income taxes
|
(56,189 | ) | 154,316 | 76,012 | ||||||||
|
Amortization
of debt issuance costs and debt discount
|
9,411 | 4,801 | 5,022 | |||||||||
|
Accretion
of tax sharing liability
|
1,615 | 1,267 | 1,505 | |||||||||
|
Stock-based
compensation
|
7,650 | 4,177 | 5,057 | |||||||||
|
Amortization
of deferred gain on sale
|
(16,596 | ) | (12,143 | ) | - | |||||||
|
Gain
on sale of properties
|
(5,947 | ) | - | (29,682 | ) | |||||||
|
Undeveloped
leasehold and oil and gas property impairments
|
26,139 | 25,955 | 9,979 | |||||||||
|
Change
in Production Participation Plan liability
|
3,267 | 32,124 | 8,599 | |||||||||
|
Unrealized
(gain) loss on derivative contracts
|
218,255 | (6,189 | ) | - | ||||||||
|
Other
non-current
|
955 | (18,825 | ) | (5,086 | ) | |||||||
|
Changes
in current assets and liabilities:
|
||||||||||||
|
Accounts
receivable trade
|
(27,336 | ) | (12,396 | ) | (12,606 | ) | ||||||
|
Prepaid
expenses, deposits and other
|
30,024 | (29,136 | ) | 1,404 | ||||||||
|
Accounts
payable and accrued liabilities
|
(36,939 | ) | 55,964 | (3,833 | ) | |||||||
|
Accrued
interest
|
828 | (1,567 | ) | 2,116 | ||||||||
|
Other
current liabilities
|
(7,435 | ) | 35,090 | 12,134 | ||||||||
|
Net
cash provided by operating activities
|
435,612 | 763,029 | 394,032 | |||||||||
|
CASH
FLOWS FROM INVESTING ACTIVITIES:
|
||||||||||||
|
Cash
acquisition capital expenditures
|
(97,920 | ) | (438,759 | ) | (21,568 | ) | ||||||
|
Drilling
and development capital expenditures
|
(487,877 | ) | (892,094 | ) | (497,988 | ) | ||||||
|
Proceeds
from sale of oil and gas properties
|
80,462 | 1,450 | 52,585 | |||||||||
|
Proceeds
from sale of marketable securities
|
- | 764 | - | |||||||||
|
Net
proceeds from sale of 11,677,500 units in Whiting USA Trust
I
|
- | 193,692 | - | |||||||||
|
Net
cash used in investing activities
|
(505,335 | ) | (1,134,947 | ) | (466,971 | ) | ||||||
|
CASH
FLOWS FROM FINANCING ACTIVITIES:
|
||||||||||||
|
Issuance
of 6.25% convertible perpetual preferred stock
|
334,112 | - | - | |||||||||
|
Issuance
of common stock
|
234,753 | - | 210,394 | |||||||||
|
Preferred
stock dividends paid
|
(10,302 | ) | - | - | ||||||||
|
Long-term
borrowings under credit agreement
|
490,000 | 1,105,000 | 384,400 | |||||||||
|
Repayments
of long-term borrowings under credit agreement
|
(950,000 | ) | (735,000 | ) | (514,400 | ) | ||||||
|
Repayments
to Alliant Energy Corporation
|
(2,701 | ) | (3,236 | ) | (3,019 | ) | ||||||
|
Debt
issuance costs
|
(23,141 | ) | - | (75 | ) | |||||||
|
Restricted
stock used for tax withholdings
|
(662 | ) | - | - | ||||||||
|
Tax
effect from restricted stock vesting
|
- | - | 45 | |||||||||
|
Net
cash provided by financing activities
|
72,059 | 366,764 | 77,345 | |||||||||
|
NET
CHANGE IN CASH AND CASH EQUIVALENTS
|
2,336 | (5,154 | ) | 4,406 | ||||||||
|
CASH
AND CASH EQUIVALENTS:
|
||||||||||||
|
Beginning
of period
|
9,624 | 14,778 | 10,372 | |||||||||
|
End
of period
|
$ | 11,960 | $ | 9,624 | $ | 14,778 | ||||||
|
See
notes to consolidated financial statements.
|
(Continued)
|
|||||||||||
WHITING
PETROLEUM CORPORATION AND SUBSIDIARIES
CONSOLIDATED
STATEMENTS OF CASH FLOWS
(In
thousands)
|
Year
Ended December 31,
|
||||||||||||
|
2009
|
2008
|
2007
|
||||||||||
|
SUPPLEMENTAL
CASH FLOW DISCLOSURES:
|
||||||||||||
|
Cash paid (refunded) for income taxes
|
$ | (1,408 | ) | $ | 1,667 | $ | 1,446 | |||||
|
Cash paid for interest
|
$ | 52,754 | $ | 60,578 | $ | 63,861 | ||||||
|
NONCASH
INVESTING ACTIVITIES:
|
||||||||||||
|
Accrued capital expenditures during the year
|
$ | 29,998 | $ | 84,960 | $ | 58,988 | ||||||
|
See
notes to consolidated financial statements.
|
(Concluded)
|
|||||||||||
WHITING PETROLEUM CORPORATION AND SUBSIDIARIES
CONSOLIDATED
STATEMENTS OF STOCKHOLDERS’ EQUITY AND COMPREHENSIVE INCOME
(In
thousands)
|
Preferred
Stock
|
Common
Stock
|
|||||||||||||||||||||||||||||||||||
|
Shares
|
Amount
|
Shares
|
Amount
|
Additional
Paid-in Capital
|
Accumulated
Other Comprehensive Income (Loss)
|
Retained
Earnings
|
Total
Stockholders’ Equity
|
Comprehensive
Income
(Loss)
|
||||||||||||||||||||||||||||
|
BALANCES-January
1, 2007
|
- | $ | - | 36,948 | $ | 37 | $ | 754,788 | $ | (5,902 | ) | $ | 437,747 | $ | 1,186,670 | |||||||||||||||||||||
|
Adoption
of FIN 48
|
- | - | - | - | - | - | (323 | ) | (323 | ) | ||||||||||||||||||||||||||
|
Net
income
|
- | - | - | - | - | - | 130,600 | 130,600 | $ | 130,600 | ||||||||||||||||||||||||||
|
Change
in derivative fair values, net of taxes of $31,012
|
- | - | - | - | - | (53,637 | ) | - | (53,637 | ) | (53,637 | ) | ||||||||||||||||||||||||
|
Realized
loss on settled derivative contracts, net of taxes of
$7,766
|
- | - | - | - | - | 13,423 | - | 13,423 | 13,423 | |||||||||||||||||||||||||||
|
Total
comprehensive income
|
$ | 90,386 | ||||||||||||||||||||||||||||||||||
|
Issuance
of stock, secondary offering
|
- | - | 5,425 | 5 | 210,389 | - | - | 210,394 | ||||||||||||||||||||||||||||
|
Restricted
stock issued
|
- | - | 150 | - | - | - | - | - | ||||||||||||||||||||||||||||
|
Restricted
stock forfeited
|
- | - | (12 | ) | - | - | - | - | - | |||||||||||||||||||||||||||
|
Restricted
stock used for tax withholdings
|
- | - | (31 | ) | - | (1,403 | ) | - | - | (1,403 | ) | |||||||||||||||||||||||||
|
Tax
effect from restricted stock vesting
|
- | - | - | - | 45 | - | - | 45 | ||||||||||||||||||||||||||||
|
Stock-based
compensation
|
- | - | - | - | 5,057 | - | - | 5,057 | ||||||||||||||||||||||||||||
|
BALANCES-December
31, 2007
|
- | - | 42,480 | 42 | 968,876 | (46,116 | ) | 568,024 | 1,490,826 | |||||||||||||||||||||||||||
|
Net
income
|
- | - | - | - | - | - | 252,143 | 252,143 | $ | 252,143 | ||||||||||||||||||||||||||
|
Change
in derivative fair values, net of taxes of $1,812
|
- | - | - | - | - | (3,072 | ) | - | (3,072 | ) | (3,072 | ) | ||||||||||||||||||||||||
|
Realized
loss on settled derivative contracts, net of taxes of
$39,903
|
- | - | - | - | - | 67,652 | - | 67,652 | 67,652 | |||||||||||||||||||||||||||
|
Ineffectiveness
gain on hedging activities, net of taxes of $703
|
- | - | - | - | - | (1,193 | ) | - | (1,193 | ) | (1,193 | ) | ||||||||||||||||||||||||
|
Total
comprehensive income
|
$ | 315,530 | ||||||||||||||||||||||||||||||||||
|
Restricted
stock issued
|
- | - | 139 | 1 | - | - | - | 1 | ||||||||||||||||||||||||||||
|
Restricted
stock forfeited
|
- | - | (7 | ) | - | - | - | - | - | |||||||||||||||||||||||||||
|
Restricted
stock used for tax withholdings
|
- | - | (30 | ) | - | (1,743 | ) | - | - | (1,743 | ) | |||||||||||||||||||||||||
|
Stock-based
compensation
|
- | - | - | - | 4,177 | - | - | 4,177 | ||||||||||||||||||||||||||||
|
BALANCES-December 31,
2008
|
- | - | 42,582 | 43 | 971,310 | 17,271 | 820,167 | 1,808,791 | ||||||||||||||||||||||||||||
|
Net
loss
|
- | - | - | - | - | - | (106,882 | ) | (106,882 | ) | $ | (106,882 | ) | |||||||||||||||||||||||
|
Change
in derivative fair values, net of taxes of $7,799
|
- | - | - | - | - | 13,348 | - | 13,348 | 13,348 | |||||||||||||||||||||||||||
|
Realized
gain on settled derivatives, net of taxes of $4,933
|
- | - | - | - | - | (8,517 | ) | - | (8,517 | ) | (8,517 | ) | ||||||||||||||||||||||||
|
Ineffectiveness
loss on hedging activities, net of taxes of $8,355
|
- | - | - | - | - | 14,300 | - | 14,300 | 14,300 | |||||||||||||||||||||||||||
|
OCI
amortization on de-designated hedges, net of taxes of
$9,337
|
- | - | - | - | - | (15,989 | ) | - | (15,989 | ) | (15,989 | ) | ||||||||||||||||||||||||
|
Total
comprehensive loss
|
$ | (103,740 | ) | |||||||||||||||||||||||||||||||||
|
Issuance
of 6.25% convertible perpetual preferred stock
|
3,450 | 3 | - | - | 334,109 | - | - | 334,112 | ||||||||||||||||||||||||||||
|
Issuance
of stock, secondary offering
|
- | - | 8,450 | 8 | 234,745 | - | - | 234,753 | ||||||||||||||||||||||||||||
|
Restricted
stock issued
|
- | - | 364 | - | - | - | - | - | ||||||||||||||||||||||||||||
|
Restricted
stock forfeited
|
- | - | (5 | ) | - | - | - | - | - | |||||||||||||||||||||||||||
|
Restricted
stock used for tax withholdings
|
- | - | (27 | ) | - | (662 | ) | - | - | (662 | ) | |||||||||||||||||||||||||
|
Tax
effect from restricted stock vesting
|
- | - | - | - | (517 | ) | - | - | (517 | ) | ||||||||||||||||||||||||||
|
Stock-based
compensation
|
- | - | - | - | 7,650 | - | - | 7,650 | ||||||||||||||||||||||||||||
|
Preferred
dividends paid
|
- | - | - | - | - | - | (10,302 | ) | (10,302 | ) | ||||||||||||||||||||||||||
|
BALANCES-December
31, 2009
|
3,450 | $ | 3 | 51,364 | $ | 51 | $ | 1,546,635 | $ | 20,413 | $ | 702,983 | $ | 2,270,085 | ||||||||||||||||||||||
|
See
notes to consolidated financial statements.
|
||||||||||||||||||||||||||||||||||||
WHITING PETROLEUM CORPORATION AND SUBSIDIARIES
NOTES
TO CONSOLIDATED FINANCIAL STATEMENTS
|
1.
|
SUMMARY
OF SIGNIFICANT ACCOUNTING POLICIES
|
Description of
Operations—Whiting Petroleum Corporation, a Delaware corporation, is an
independent oil and gas company that acquires, exploits, develops and explores
for crude oil, natural gas and natural gas liquids primarily in the Permian
Basin, Rocky Mountains, Mid-Continent, Gulf Coast and Michigan regions of the
United States. Unless otherwise specified or the context otherwise
requires, all references in these notes to “Whiting” or the “Company” are to
Whiting Petroleum Corporation and its consolidated subsidiaries.
Basis of
Presentation of Consolidated Financial Statements—The consolidated
financial statements include the accounts of Whiting Petroleum Corporation, its
consolidated subsidiaries, all of which are wholly-owned, and Whiting’s pro rata
share of the accounts of Whiting USA Trust I pursuant to Whiting’s 15.8%
ownership interest. Investments in entities which give Whiting
significant influence, but not control, over the investee are accounted for
using the equity method. Under the equity method, investments are
stated at cost plus the Company’s equity in undistributed earnings and
losses. All intercompany balances and transactions have been
eliminated in consolidation.
Use of
Estimates—The preparation of financial statements in conformity with
generally accepted accounting principles requires management to make estimates
and assumptions that affect the reported amounts of assets and liabilities, the
disclosure of contingent assets and liabilities at the date of the financial
statements, and the reported amounts of revenues and expenses during the
reporting period. Items subject to such estimates and assumptions
include (1) oil and natural gas reserves; (2) cash flow estimates used in
impairment tests of long-lived assets; (3) depreciation, depletion and
amortization; (4) asset retirement obligations; (5) assigning fair value and
allocating purchase price in connection with business combinations; (6) income
taxes; (7) Production Participation Plan and other accrued liabilities; (8)
valuation of derivative instruments; and (9) accrued revenue and related
receivables. Although management believes these estimates are
reasonable, actual results could differ from these estimates.
Cash and Cash
Equivalents—Cash equivalents consist of demand deposits and highly liquid
investments which have an original maturity of three months or
less.
Accounts
Receivable Trade—Whiting’s accounts receivable trade consists mainly of
receivables from oil and gas purchasers and joint interest owners on properties
the Company operates. For receivables from joint interest owners,
Whiting typically has the ability to withhold future revenue disbursements to
recover any non-payment of joint interest billings. Generally, the
Company’s oil and gas receivables are collected within two months, and to date,
the Company has had minimal bad debts.
The
Company routinely assesses the recoverability of all material trade and other
receivables to determine their collectability. At December 31, 2009
and 2008, the Company had an allowance for doubtful accounts of $1.3 million and
$0.6 million, respectively.
Inventories—Materials
and supplies inventories consist primarily of tubular goods and production
equipment, carried at weighted-average cost. Materials and supplies
are included in other property and equipment. Crude oil in tanks
inventory is carried at the lower of the estimated cost to produce or market
value and is included in prepaid expenses and other.
Oil
and Gas Properties
Proved. The
Company follows the successful efforts method of accounting for its oil and gas
properties. Under this method of accounting, all property acquisition
costs and development costs are capitalized when incurred and depleted on a
unit-of-production basis over the remaining life of proved reserves and proved
developed reserves, respectively. Costs of drilling exploratory wells
are initially capitalized but are charged to expense if the well is determined
to be unsuccessful.
The
Company assesses its proved oil and gas properties for impairment whenever
events or circumstances indicate that the carrying value of the assets may not
be recoverable. The impairment test compares undiscounted future net
cash flows to the assets’ net book value. If the net capitalized
costs exceed future net cash flows, then the cost of the property is written
down to “fair value”. Fair value for oil and gas properties is
generally determined based on discounted future net cash
flows. Impairment expense for proved properties is reported in
exploration and impairment expense.
Net
carrying values of retired, sold or abandoned properties that constitute less
than a complete unit of depreciable property are charged or credited, net of
proceeds, to accumulated depreciation, depletion and amortization unless doing
so significantly affects the unit-of-production amortization rate, in which case
a gain or loss is recognized in income. Gains or losses from the
disposal of complete units of depreciable property are recognized in
income.
Interest
cost is capitalized as a component of property cost for development projects
that require greater than six months to be readied for their intended
use. During 2009, 2008 and 2007, the Company capitalized interest of
$3.4 million, $3.1 million and $3.7 million, respectively.
Unproved. Unproved
properties consist of costs incurred to acquire undeveloped leases as well as
costs to acquire unproved reserves. Undeveloped lease costs and
unproved reserve acquisition costs are capitalized, and individually
insignificant unproved properties are amortized on a composite basis, based on
past success, experience and average lease-term lives. The Company
evaluates significant unproved properties for impairment based on remaining
lease term, drilling results, reservoir performance, seismic interpretation or
future plans to develop acreage. Unproved property costs related to
successful exploratory drilling are reclassified to proved properties and
depleted on a unit-of-production basis. Impairment expense for
unproved properties is reported in exploration and impairment
expense.
Exploratory. Geological
and geophysical costs,
including exploratory seismic studies, and the costs of carrying and retaining
unproved acreage are expensed as incurred. Costs of seismic studies
that are utilized in development drilling within an area of proved reserves are
capitalized as development costs. Amounts of seismic costs
capitalized are based on only those blocks of data used in determining
development well locations. To the extent that a seismic project
covers areas of both development and exploratory drilling, those seismic costs
are proportionately allocated between development costs and exploration
expense.
Costs of
drilling exploratory wells are initially capitalized, pending determination of
whether the well has found proved reserves. If an exploratory well
has not found proved reserves, the costs of drilling the well and other
associated costs are charged to expense. Cost incurred for
exploratory wells that find reserves, which cannot yet be classified as proved,
continue to be capitalized if (a) the well has found a sufficient quantity
of reserves to justify completion as a producing well, and (b) the Company
is making sufficient progress assessing the reserves and the economic and
operating viability of the project. If either condition is not met,
or if the Company obtains information that raises substantial doubt about the
economic or operational viability of the project, the exploratory well costs,
net of any salvage value, are expensed.
Tertiary recovery
activities. The Company carries out tertiary recovery methods
on certain of its oil and gas properties in order to recover additional
hydrocarbons that are not recoverable from primary or secondary recovery
methods. Costs for tertiary recovery activities that are incurred
during a project’s pilot phase, or prior to a project’s technical and economic
viability, are expensed immediately. After a project has been
determined to be technically feasible and economically viable, all costs to
construct improved recovery systems are capitalized and depleted on a
units-of-production basis. At such point of technical and economic
feasibility, acquisition costs of tertiary injectants, such as purchased CO2, are also capitalized as
development costs and depleted, as they are incurred solely for obtaining access
to reserves not otherwise recoverable and have future economic benefits over the
life of the project. As CO2 is recovered together with oil
and gas production, it is extracted and re-injected, and all of the associated
costs are expensed as incurred. Likewise costs incurred to maintain
reservoir pressure are also expensed.
Other Property and
Equipment. Other property and equipment consists mainly of
materials and supplies inventories which are not depreciated. Also
included in other property and equipment are an oil pipeline, furniture and
fixtures, leasehold improvements and automobiles, which are stated at cost and
depreciated using the straight-line method over their estimated useful lives
ranging from 4 to 33 years.
Debt Issuance
Costs—Debt issuance costs related to the Company’s Senior Subordinated
Notes are amortized to interest expense using the effective interest method over
the term of the related debt. Debt issuance costs related to the
credit facility are amortized to interest expense on a straight-line basis over
the borrowing term.
Asset Retirement
Obligations and Environmental Costs—Asset retirement obligations relate
to future costs associated with the plugging and abandonment of oil and gas
wells, removal of equipment and facilities from leased acreage and returning
such land to its original condition. The fair value of a liability
for an asset retirement obligation is recorded in the period in which it is
incurred (typically when the asset is installed at the production location), and
the cost of such liability increases the carrying amount of the related
long-lived asset by the same amount. The liability is accreted each
period through charges to depreciation, depletion and amortization expense, and
the capitalized cost is depleted on a units-of-production basis over the proved
developed reserves of the related asset. Revisions to estimated
retirement obligations result in adjustments to the related capitalized asset
and corresponding liability.
Liabilities
for environmental costs are recorded on an undiscounted basis when it is
probable that obligations have been incurred and the amounts can be reasonably
estimated. These liabilities are not reduced by possible recoveries
from third parties.
Derivative
Instruments—The Company enters into derivative contracts, primarily
costless collars, to manage its exposure to commodity price risk and also enters
into derivatives, interest rate swaps, to manage its exposure to interest rate
risk. All derivative instruments, other than those that meet the
normal purchase and sales exceptions are recorded on the balance sheet as either
an asset or liability measured at fair value. Gains and losses from
changes in the fair value of derivative instruments are recognized immediately
in earnings, unless the derivative meets specific hedge accounting criteria, and
the derivative has been designated as a hedge. Cash flows from
derivatives used to manage commodity price risk and interest rate risk are
classified in operating activities along with the cash flows of the underlying
hedged transactions. The Company does not enter into derivative
instruments for speculative or trading purposes.
For
derivatives qualifying as hedges of future cash flows, the effective portion of
any changes in fair value is recognized in accumulated other comprehensive
income (loss) and is reclassified to net income when the
underlying forecasted
transaction occurs. Any ineffective portion of such hedges is
recognized in (gain) loss on mark-to-market derivatives as it
occurs. The ineffective portion of the hedge, if any, is calculated
as the difference between the change in fair value of the derivative and the
estimated change in cash flows from the item hedged. For discontinued
cash flow hedges, prospective changes in the fair value of the derivative are
recognized in earnings. The accumulated gain or loss recognized in
accumulated other comprehensive income (loss) at the time a hedge is
discontinued continues to be deferred until the original forecasted transaction
occurs. However, if it is determined that the likelihood of the
original forecasted transaction occurring is no longer probable, the entire
accumulated gain or loss recognized in accumulated other comprehensive income
(loss) is immediately reclassified into earnings.
For
derivatives designated as hedges of the fair value of recognized assets,
liabilities or firm commitments, changes in the fair values of both the hedged
item and the related derivative are recognized immediately in net income with an
offsetting effect included in the basis of the hedged item. The net
effect is to report in earnings the extent to which the hedge is not effective,
if any, in achieving offsetting changes in fair value.
The
Company formally documents all relationships between hedging instruments and
hedged items, as well as the risk management objectives and strategy for
undertaking the hedge. This process includes specific identification
of the hedging instrument and the hedged item, the nature of the risk being
hedged and the manner in which the hedging instrument’s effectiveness will be
assessed. To designate a derivative as a cash flow hedge, the Company
documents at the hedge’s inception its assessment as to whether the derivative
will be highly effective in offsetting expected changes in cash flows from the
item hedged. This assessment, which is updated at least quarterly, is
generally based on the most recent relevant historical correlation between the
derivative and the item hedged. If, during the derivative’s term, the
Company determines that the hedge is no longer highly effective, hedge
accounting is prospectively discontinued.
Deferred Gain on
Sale—The deferred gain on sale of 11,677,500 Whiting USA Trust I units is
amortized to income based on the units-of-production method.
Revenue
Recognition—Oil and gas revenues are recognized when production is sold
to a purchaser at a fixed or determinable price, when delivery has occurred and
title has transferred, and if the collectability of the revenue is
probable. Revenues from the production of gas properties in which the
Company has an interest with other producers are recognized on the basis of the
Company’s net working interest (entitlement method). Net deliveries
in excess of entitled amounts are recorded as liabilities, while net under
deliveries are reflected as receivables. Gas imbalance receivables or
payables are valued at the lowest of (i) the current market price; (ii) the
price in effect at the time of production; or (iii) the contract price, if a
contract is in hand. As of December 31, 2009 and 2008, the Company
was in a net under (over) produced imbalance position of (12,889) Mcf and 54,215
Mcf, respectively.
General and
Administrative Expenses—General and administrative expenses are reported
net of reimbursements of overhead costs that are allocated to working interest
owners in the oil and gas properties operated by Whiting.
Maintenance and
Repairs—Maintenance and repair costs which do not extend the useful lives
of property and equipment are charged to expense as incurred. Major
replacements, renewals and betterments are capitalized.
Income
Taxes—Income taxes are recognized based on earnings reported for tax
return purposes in addition to a provision for deferred income
taxes. Deferred income taxes are accounted for using the liability
method. Under this method, deferred tax assets and liabilities are
determined by applying the enacted statutory tax rates in effect at the end of a
reporting period to the cumulative temporary differences between the tax bases
of assets and liabilities and their reported amounts in the Company’s financial
statements. The effect on deferred taxes for a change in tax rates is
recognized in income in the period that includes the enactment
date. A valuation allowance for deferred tax assets is established
when it is more likely than not that some portion of the benefit from deferred
tax assets will not be realized. The Company’s income tax positions
must meet a more-likely-than-not recognition threshold to be recognized, and any
potential accrued interest and penalties related to unrecognized tax benefits
are recognized within income tax expense.
Earnings Per
Share—Basic earnings per common share is calculated by dividing adjusted
net income available to common shareholders by the weighted average number of
common shares outstanding during each period. Diluted earnings per
common share is calculated by dividing adjusted net income by the weighted
average number of diluted common shares outstanding, which includes the effect
of potentially dilutive securities. Potentially dilutive securities
for the diluted earnings per share calculations consist of unvested restricted
stock awards and outstanding stock options using the treasury method, and
convertible perpetual preferred stock using the if-converted
method. When a loss from continuing operations exists, all
potentially dilutive securities are anti-dilutive and are therefore excluded
from the computation of diluted earnings per share accordingly.
Industry Segment
and Geographic Information—The Company has evaluated how it is organized
and managed and has identified only one operating segment, which is the
exploration and production of crude oil, natural gas and natural gas
liquids. The Company considers its gathering, processing and
marketing functions as ancillary to its oil and gas producing
activities. All of the Company’s operations and assets are located in
the United States, and substantially all of its revenues are attributable to
United States customers.
Fair Value of
Financial Instruments—The Company has included fair value information in
these notes when the fair value of our financial instruments is materially
different from their book value. Cash and cash equivalents, accounts
receivable and payable are carried at cost, which approximates their fair value
because of the short-term maturity of these instruments. The
Company’s credit agreement has a recorded value that approximates its fair value
since its variable interest rate is tied to current market rates. The
Company’s derivative financial instruments are recorded at fair value and
include a measure of the Company’s own nonperformance risk or that of its
counterparties as appropriate.
Concentration of
Credit Risk—Whiting is exposed to credit risk in the event of nonpayment
by counterparties, a significant portion of which are concentrated in energy
related industries. The creditworthiness of customers and other
counterparties is subject to continuing review, including the use of master
netting agreements, where appropriate. During 2009, sales to Shell
Western E&P, Inc., Plains Marketing LP and EOG Resources, Inc. accounted for
18%, 15% and 13%, respectively, of the Company’s total oil and gas production
revenue. During 2008, sales to Plains Marketing LP and Valero Energy
Corporation accounted for 15% and 14%, respectively, of the Company’s total oil
and gas production revenue. During 2007, sales to Valero Energy
Corporation and Plains Marketing LP accounted for 14% and 13%, respectively, of
the Company’s total oil and gas production revenue. Commodity
derivative contracts held by the Company are with seven counterparties, all of
which are part of Whiting’s credit facility and all of which have
investment-grade ratings from Moody’s and Standard & Poor. As of
December 31, 2009, outstanding derivative contracts with JP Morgan and Key
National Bank represent 34% and 30%, respectively, of total crude oil volumes
hedged, while outstanding derivative contracts with JP Morgan represent 100% of
total gas volumes hedged.
New Accounting
Pronouncements—In January 2010, the FASB issued Accounting Standards
Update No. 2010-06, Improving
Disclosures about Fair Value Measurements (“ASU 2010-06”), which provides
amendments to FASB ASC topic Fair Value Measurements and
Disclosures that will provide more robust disclosures about (i) the
different classes of assets and liabilities measured at fair value, (ii) the
valuation techniques and inputs used, (iii) the activity in Level 3 fair value
measurements, and (iv) the transfers between Levels 1, 2 and 3. ASU
2010-06 is effective for fiscal years and interim periods beginning after
December 15, 2009. The Company is currently assessing the impact that
the adoption will have on its disclosures.
In
December 2008, the SEC issued Modernization of Oil and Gas
Reporting: Final Rule, which published the final rules and
interpretations updating its oil and gas reporting requirements. The final
rule includes updates to definitions in the existing oil and gas rules to make
them consistent with the petroleum resource management system, which is a widely
accepted standard for the management of petroleum resources that was developed
by several industry organizations. Key revisions include the ability to
include nontraditional resources in reserves, the use of new technology for
determining reserves, permitting disclosure of probable and possible reserves,
and changes to the pricing used to determine reserves in that companies must use
a 12-month average price. The average is calculated using the
first-day-of-the-month price for each of the 12 months that make up the
reporting period. The Company adopted the new rules effective
December 31, 2009, and as a result, Whiting (i) prepared its reserve estimates
as of December 31, 2009 based on the new reserve definitions, (ii) reported its
year-end probable and possible reserve quantities in Item I and Item II of this
annual report, (iii) has estimated its December 31, 2009 reserve quantities
using the 12-month average price and (iv) included additional disclosures as
required by the new rule. As a result of the change in reserve
pricing from using year-end oil and gas prices to now using 12-month average
prices, the Company’s total proved reserves at December 31, 2009 were 20.4 MMBOE
lower than they would have otherwise been if year-end oil and gas prices were
used. Oil and gas reserve quantities or their values are a
significant component of the Company’s depreciation, depletion and amortization,
asset retirement obligation, impairment analyses and Production Participation
Plan liability calculations. Due to the number of estimates that rely
upon reserve quantities and values, any significant changes to the Company’s oil
and gas reserves has a pervasive effect on Whiting’s consolidated financial
statements, and it is therefore impracticable to estimate the effect that the
adoption of the SEC’s Modernization of Oil and Gas
Reporting: Final Rule had on the Company’s financial
statements.
In
January 2010, the FASB issued Accounting Standards Update No. 2010-03, Oil and Gas Reserve Estimation and
Disclosures (“ASU 2010-03”), which provides amendments to FASB ASC topic
Extractive Activities-Oil and
Gas. The objective of ASU 2010-03 is to align the oil and gas reserve
estimation and disclosure requirements of the FASB ASC with the requirements in
the SEC’s Modernization of Oil
and Gas Reporting: Final Rule. The Company adopted ASU 2010-03
effective December 31, 2009, and as a result, Whiting (i) has estimated its
December 31, 2009 reserve quantities using the 12-month average price, (ii)
prepared its reserve estimates as of December 31, 2009 based on the new and
amended reserve definitions in ASU 2010-03 that conform to the SEC’s revised
reserve definitions, and (iii) reported proved undeveloped reserve quantities in
Disclosure About Oil and Gas Producing Activities. As a result of the
change in reserve pricing from using year-end oil and gas prices to now using
12-month average prices, the Company’s total proved reserves at December 31,
2009 were 20.4 MMBOE lower than they would have otherwise been if year-end oil
and gas prices were used. Oil and gas reserve quantities or their
values are a significant component of the Company’s depreciation, depletion and
amortization, asset retirement obligation, proved property impairment analyses
and Production Participation Plan liability calculations. Due to the
number of estimates that rely upon reserve quantities and values, any
significant changes to the Company’s oil and gas reserves has a pervasive effect
on Whiting’s consolidated financial statements, and it is therefore
impracticable to estimate the effect that the adoption of ASU 2010-03 had on the
Company’s financial statements.
In June
2009, the FASB issued SFAS No. 168, The FASB Accounting Standards
Codification and the Hierarchy of Generally Accepted Accounting
Principles, as codified in FASB ASC topic Generally Accepted Accounting
Principles, a replacement of FASB Statement No. 162. This
standard establishes only two levels of GAAP, authoritative and
nonauthoritative. The FASB ASC was not intended to change or alter
existing GAAP, and the Company’s adoption effective July 1, 2009 did not
therefore have any impact on its consolidated financial statements other than to
modify certain existing disclosures. The FASB ASC will become the
source of authoritative, nongovernmental GAAP, except for rules and interpretive
releases of the SEC, which are sources of authoritative GAAP for SEC
registrants. All other nongrandfathered, non-SEC accounting
literature not included in the FASB ASC will become
nonauthoritative. FASB ASC is effective for financial statements for
interim or annual reporting periods ending after September 15,
2009. Upon adoption the Company began to use the new guidelines and
numbering system prescribed by the FASB ASC when referring to GAAP in the third
quarter of fiscal 2009.
In May
2009, the FASB issued SFAS No. 165, Subsequent Events (“SFAS
165”), as codified in FASB ASC topic Subsequent
Events. The Company adopted SFAS 165 effective April 1, 2009,
which did not have an impact on its consolidated financial statements, other
than additional disclosures. This standard is intended to establish
general standards of accounting for and disclosure of events that occur after
the balance sheet date but before financial statements are issued or are
available to be issued. Specifically, this standard sets forth the
period after the balance sheet date during which management of a reporting
entity should evaluate events or transactions that may occur for potential
recognition or disclosure in the financial statements, the circumstances under
which an entity should recognize events or transactions occurring after the
balance sheet date in its financial statements, and the disclosures that an
entity should make about events or transactions that occurred after the balance
sheet date. SFAS 165 was effective for fiscal years and interim
periods ended after June 15, 2009.
In April
2009, the FASB issued two FASB Staff Positions (“FSP”) intended to provide
additional application guidance and enhanced disclosures regarding fair value
measurements and impairments of securities. FSP No. FAS 157-4, Determining Fair Value When the
Volume or Level of Activity for the Asset or Liability Have Significantly
Decreased and Identifying Transactions That Are Not Orderly, as codified
in FASB ASC topic Fair Value
Measurement and Disclosure, provides additional guidelines for estimating
fair value in accordance with FASB SFAS No. 157, Fair Value Measurements
(“SFAS 157”). The Company adopted these FSPs effective April
1, 2009, which did not have an impact on its consolidated financial statements,
other than additional disclosures. FSP No. 107-1 and APB 28-1, Interim Disclosures about Fair Value
of Financial Instruments, increases the frequency of fair value
disclosures. These FSPs were effective for fiscal years and interim
periods ended after June 15, 2009.
The
Company elected to implement SFAS 157 with the one-year deferral permitted by
FSP No. FAS 157-2, Effective
Date of FASB Statement No. 157 (“FSP 157-2”), issued February 2008
and codified in FASB ASC topic Fair Value Measurement and
Disclosure. FSP 157-2 deferred the effective date of SFAS 157
for one year for certain non-financial assets and non-financial liabilities
measured at fair value. Accordingly, the Company adopted SFAS 157 on
January 1, 2009 for its non-financial assets and non-financial liabilities
measured at fair value on a non-recurring basis. This deferred
adoption of SFAS 157, however, did not have an impact on the Company’s
consolidated financial statements other than additional
disclosures. As it relates to the Company, this delayed adoption
applies to certain non-financial assets and liabilities as may be acquired in a
business combination and thereby measured at fair value; impaired oil and gas
property assessments; and the initial recognition of asset retirement
obligations for which fair value is used.
In
December 2007, the FASB issued SFAS No. 141(R), Business Combinations (“SFAS
141(R)”), which replaces SFAS No. 141, as codified in FASB ASC topic Business
Combinations. SFAS 141(R) is effective for business
combinations with acquisition dates on or after fiscal years beginning after
December 15, 2008, and the Company adopted SFAS 141(R) effective January 1,
2009. However, because the value of consideration paid was equal to
the fair value of assets and liabilities acquired in Whiting’s business
combinations executed during the year ended December 31, 2009, the adoption of
SFAS 141(R) did not have a material impact on its consolidated
financials. SFAS 141(R) establishes principles and requirements for
how an acquirer recognizes and measures in its financial statements the
identifiable assets acquired, the liabilities assumed, any noncontrolling
interest in the acquiree and the goodwill acquired. SFAS 141(R) also
establishes disclosure requirements that will enable users to evaluate the
nature and financial effects of the business combination.
|
2.
|
ACQUISITIONS
AND DIVESTITURES
|
2009
Acquisitions
During
2009, Whiting acquired additional royalty and overriding royalty interests in
the North Ward Estes field and various other fields in the Permian Basin in two
separate transactions with private owners. Also included in these
transactions were contractual rights, including an option to participate for an
aggregate 10% working interest and right to back in after payout for an
additional aggregate 15% working interest in the development of deeper pay zones
on acreage under and adjoining the North Ward Estes field.
Whiting
completed the first additional royalty and overriding interests acquisition in
November 2009, with a purchase price of $38.7 million and an effective date of
October 1, 2009. The Company completed the second additional royalty
and overriding interests acquisition in December 2009, with a purchase price of
$27.4 million and an effective date of November 1, 2009. Reserves
attributable to royalty and overriding royalty interests are not burdened by
operating expenses or any additional capital costs, including CO2 costs, which are paid by the
working interest owners. These two acquisitions totaled $66.1 million
and were funded primarily with net cash provided by operating
activities. Substantially all of the purchase price was allocated to
the properties acquired.
2009 Participation
Agreement
In June
2009, Whiting entered into a participation agreement with a privately held
independent oil company covering twenty-five 1,280-acre units and one 640-acre
unit located primarily in the western portion of the Sanish field in Mountrail
County, North Dakota. Under the terms of the agreement, the private
company agreed to pay 65% of Whiting’s net drilling and well completion costs to
receive 50% of Whiting’s working interest and net revenue interest in the first
and second wells planned for each of the units. Pursuant to the
agreement, Whiting will remain the operator for each unit.
At the
closing of the agreement, the private company paid Whiting $107.3 million,
representing $6.4 million for acreage costs, $65.8 million for 65% of Whiting’s
cost in 18 wells drilled or drilling and $35.1 million for a 50% interest in
Whiting’s Robinson Lake gas plant and oil and gas gathering
system. Whiting used these proceeds to repay a portion of the debt
outstanding under its credit agreement.
2008
Acquisition
In May
2008, Whiting acquired interests in 31 producing gas wells, development acreage
and gas gathering and processing facilities on approximately 22,000 gross
(11,500 net) acres in the Flat Rock field in Uintah County, Utah for an
aggregate unadjusted purchase price of $365.0 million.
This
acquisition was recorded using the purchase method of accounting. The
table below summarizes the allocation of the $359.4 million adjusted purchase
price, based on the acquisition date fair value of the assets acquired and the
liabilities assumed (in thousands).
|
Flat
Rock
|
||||
|
Purchase
price
|
$ | 359,380 | ||
|
Allocation
of purchase price:
|
||||
|
Proved
properties
|
$ | 251,895 | ||
|
Unproved
properties
|
79,498 | |||
|
Gas
gathering and processing facilities
|
35,736 | |||
|
Liabilities
assumed
|
(7,749 | ) | ||
|
Total
|
$ | 359,380 | ||
2008
Divestiture
On
April 30, 2008, the Company completed an initial public offering of units
of beneficial interest in Whiting USA Trust I (the “Trust”), selling
11,677,500 Trust units at $20.00 per Trust unit, providing net proceeds of
$193.8 million after underwriters’ fees, offering expenses and post-close
adjustments. The Company used the net offering proceeds to repay a
portion of the debt outstanding under its credit agreement. The net
proceeds from the sale of Trust units to the public resulted in a deferred gain
on sale of $100.2 million. Immediately prior to the closing of the
offering, Whiting conveyed a term net profits interest in certain of its oil and
gas properties to the Trust in exchange for 13,863,889 Trust
units. The Company has retained 15.8%, or 2,186,389 Trust units, of
the total Trust units issued and outstanding.
The net
profits interest entitles the Trust to receive 90% of the net proceeds from the
sale of oil and natural gas production from the underlying
properties. The net profits interest will terminate at the time when
9.11 MMBOE have been produced and sold from the underlying
properties. This is the equivalent of 8.2 MMBOE in respect of the
Trust’s right to receive 90% of the net proceeds from such production pursuant
to the net profits interest, and these reserve quantities are projected to be
produced by August 31, 2018, based on the reserve report for the underlying
properties as of December 31, 2009.
2007
Acquisitions
There
were no significant acquisitions during the year ended December 31,
2007.
2007
Divestitures
On
July 17, 2007, the Company sold its approximate 50% non-operated working
interest in several gas fields located in the LaSalle and Webb Counties of Texas
for total cash proceeds of $40.1 million, resulting in a pre-tax gain on sale of
$29.7 million.
During
2007, the Company sold its interests in several additional non-core oil and gas
producing properties for an aggregate amount of $12.5 million in cash for
total estimated proved reserves of 0.6 MMBOE as of the divestitures’ effective
dates. The divested properties are located in Colorado, Louisiana,
Michigan, Montana, New Mexico, North Dakota, Oklahoma, Texas and
Wyoming.
|
3.
|
LONG-TERM
DEBT
|
Long-term
debt consisted of the following at December 31, 2009 and 2008 (in
thousands):
|
December
31,
|
||||||||
|
2009
|
2008
|
|||||||
|
Credit
agreement
|
$ | 160,000 | $ | 620,000 | ||||
|
7%
Senior Subordinated Notes due 2014
|
250,000 | 250,000 | ||||||
|
7.25%
Senior Subordinated Notes due 2013, net of unamortized debt discount of
$1,147 and $1,541, respectively
|
218,853 | 218,459 | ||||||
|
7.25%
Senior Subordinated Notes due 2012, net of unamortized debt discount of
$268 and $398, respectively
|
150,732 | 151,292 | ||||||
|
Total
debt
|
$ | 779,585 | $ | 1,239,751 | ||||
Credit
Agreement—As of December 31, 2009, Whiting Oil and Gas Corporation
(“Whiting Oil and Gas”), the Company’s wholly-owned subsidiary, had a credit
agreement with a syndicate of banks, and this credit facility has a borrowing
base of $1.1 billion with $939.7 million of available borrowing capacity, which
is net of $160.0 million in borrowings and $0.3 million in letters of credit
outstanding. The credit agreement provides for interest only payments
until April 2012, when the agreement expires and all outstanding borrowings are
due.
The
borrowing base under the credit agreement is determined at the discretion of the
lenders, based on the collateral value of the proved reserves that have been
mortgaged to the lenders, and is subject to regular redeterminations on May 1
and November 1 of each year, as well as special redeterminations described in
the credit agreement, in each case which may reduce the amount of the borrowing
base. Whiting Oil and Gas may, throughout the term of the credit
agreement, borrow, repay and reborrow up to the borrowing base in effect at any
given time. A portion of the revolving credit agreement in an
aggregate amount not to exceed $50.0 million may be used to issue letters of
credit for the account of Whiting Oil and Gas or other designated subsidiaries
of the Company. As of December 31, 2009, $49.7 million was available
for additional letters of credit under the agreement.
Interest
accrues at the Company’s option at either (i) a base rate for a base rate loan
plus the margin in the table below, where the base rate is defined as the
greatest of the prime rate, the federal funds rate plus 0.50% or an adjusted
LIBOR rate plus 1.00%, or (ii) an adjusted LIBOR rate for a Eurodollar loan plus
the margin in the table below. The Company also incurs commitment
fees of 0.50% on the unused portion of the lesser of the aggregate commitments
of the lenders or the borrowing base, and are included as a component of
interest expense. At December 31, 2009, the weighted average interest
rate on the outstanding principal balance under the credit agreement was
2.4%.
|
Ratio of Outstanding Borrowings to Borrowing
Base
|
Applicable
Margin for Base Rate
Loans
|
Applicable
Margin for Eurodollar
Loans
|
|
Less
than 0.25 to 1.0
|
1.1250%
|
2.00%
|
|
Greater
than or equal to 0.25 to 1.0 but less than 0.50 to 1.0
|
1.1375%
|
2.25%
|
|
Greater
than or equal to 0.50 to 1.0 but less than 0.75 to 1.0
|
1.6250%
|
2.50%
|
|
Greater
than or equal to 0.75 to 1.0 but less than 0.90 to 1.0
|
1.8750%
|
2.75%
|
|
Greater
than or equal to 0.90 to 1.0
|
2.1250%
|
3.00%
|
The
credit agreement contains restrictive covenants that may limit the Company’s
ability to, among other things, incur additional indebtedness, sell assets, make
loans to others, make investments, enter into mergers, enter into hedging
contracts, incur liens and engage in certain other transactions without the
prior consent of its lenders. The credit agreement requires the
Company, as of the last day of any quarter, (i) to not exceed a total debt to
EBITDAX ratio (as defined in the credit agreement) of 4.5 to 1.0 for the last
four quarters ending prior to and on September 30, 2010, 4.25 to 1.0 for
quarters ending December 31, 2010 to June 30, 2011 and 4.0 to 1.0 for
quarters ending September 30, 2011 and thereafter, (ii) to have a consolidated
current assets to consolidated current liabilities ratio (as defined in the
credit agreement and which includes an add back of the available borrowing
capacity under the credit agreement) of not less than 1.0 to 1.0 and (iii) to
not exceed a senior secured debt to EBITDAX ratio (as defined in the credit
agreement) of 2.75 to 1.0 for the last four quarters ending prior to and on
December 31, 2009 and 2.5 to 1.0 for quarters ending March 31, 2010 and
thereafter. Except for limited exceptions, which include the payment
of dividends on the Company’s 6.25% convertible perpetual preferred stock, the
credit agreement restricts its ability to make any dividends or distributions on
its common stock or principal payments on its senior notes. The
Company was in compliance with its covenants under the credit agreement as of
December 31, 2009.
The
obligations of Whiting Oil and Gas under the credit agreement are secured by a
first lien on substantially all of Whiting Oil and Gas’ properties included in
the borrowing base for the credit agreement. Whiting Petroleum
Corporation has guaranteed the obligations of Whiting Oil and Gas under the
credit agreement and pledged the stock of Whiting Oil and Gas as security for
its guarantee.
Senior
Subordinated Notes—In October 2005, the Company issued at par
$250.0 million of 7% Senior Subordinated Notes due 2014. The
estimated fair value of these notes was $251.3 million as of
December 31, 2009, based on quoted market prices for these same debt
securities.
In
April 2005, the Company issued $220.0 million of 7.25% Senior
Subordinated Notes due 2013. These notes were issued at 98.507% of
par, and the associated discount of $3.3 million is being amortized to interest
expense over the term of these notes, yielding an effective interest rate of
7.4%. The estimated fair value of these notes was $221.1 million
as of December 31, 2009, based on quoted market prices for these same debt
securities.
In
May 2004, the Company issued $150.0 million of 7.25% Senior
Subordinated Notes due 2012. These notes were issued at 99.26% of
par, and the associated discount of $1.1 million is being amortized to interest
expense over the term of these notes, yielding an effective interest rate of
7.3%. The estimated fair value of these notes was $151.1 million
as of December 31, 2009, based on quoted market prices for these same debt
securities.
The notes
are unsecured obligations of Whiting Petroleum Corporation and are subordinated
to all of the Company’s senior debt, which currently consists of Whiting Oil and
Gas’ credit agreement. The Company’s obligations under the notes are
fully, unconditionally, jointly and severally guaranteed by all of the Company’s
wholly-owned operating subsidiaries, Whiting Oil and Gas and Whiting Programs,
Inc. (the “Guarantors”). Any subsidiaries other than the Guarantors are
minor subsidiaries as defined by Rule 3-10(h)(6) of Regulation S-X of
the Securities and Exchange Commission (“SEC”). Whiting Petroleum
Corporation has no assets or operations independent of this debt and its
investments in guarantor subsidiaries.
Interest Rate
Swap— In August 2004, the Company entered into an interest rate swap
contract to hedge the fair value of $75.0 million of its 7.25% Senior
Subordinated Notes due 2012. The interest rate swap was a fixed for
floating swap in that the Company received the fixed rate of 7.25% and paid the
floating rate. In March 2009, the counterparty exercised its option
to cancel the swap contract effective May 1, 2009, resulting in a
cancellation fee of $1.4 million paid to the Company.
|
4.
|
ASSET
RETIREMENT OBLIGATIONS
|
The
Company’s asset retirement obligations represent the estimated future costs
associated with the plugging and abandonment of oil and gas wells, removal of
equipment and facilities from leased acreage, and land restoration (including
removal of certain onshore and offshore facilities in California) in accordance
with applicable local, state and federal laws. The Company determines
its asset retirement obligation amounts by calculating the present value of the
estimated future cash outflows associated with its plug and abandonment
obligations. The current portions at December 31, 2009 and December
31, 2008 were $10.3 million and $6.5 million, respectively, and were recorded in
accrued liabilities. The following table provides a reconciliation of
the Company’s asset retirement obligations for the year ended December 31,
2009 (in thousands):
|
Year
Ended December 31,
|
||||||||
|
2009
|
2008
|
|||||||
|
Beginning
asset retirement obligation at January 1
|
$ | 54,348 | $ | 37,192 | ||||
|
Additional
liability incurred
|
538 | 3,503 | ||||||
|
Revisions
in estimated cash flows
|
19,793 | 16,287 | ||||||
|
Accretion
expense
|
7,126 | 3,236 | ||||||
|
Obligations
on sold or conveyed properties
|
(93 | ) | (536 | ) | ||||
|
Liabilities
settled
|
(4,526 | ) | (5,334 | ) | ||||
|
Ending
asset retirement obligation at December 31
|
$ | 77,186 | $ | 54,348 | ||||
|
5.
|
DERIVATIVE
FINANCIAL INSTRUMENTS
|
The
Company is exposed to certain risks relating to its ongoing business
operations. The risks managed by using derivative instruments are
commodity price risk and interest rate risk.
Commodity
derivative contracts—Historically, prices
received for crude oil and natural gas production have been volatile because of
seasonal weather patterns, supply and demand factors, worldwide political
factors and general economic conditions. Whiting enters into
derivative contracts, primarily costless collars, to achieve a more predictable
cash flow by reducing its exposure to commodity price
volatility. Commodity derivative contracts are also used to ensure
adequate cash flow to fund our capital programs and to manage price risks and
returns on acquisitions and drilling programs. Costless collars are
designed to establish floor and ceiling prices on anticipated future oil and gas
production. While the use of these derivative instruments limits the
downside risk of adverse price movements, they may also limit future revenues
from favorable price movements. The Company does not enter into
derivative contracts for speculative or trading purposes.
Whiting derivatives—The table
below details the Company’s costless collar derivatives, including its
proportionate share of Trust hedges, entered into to hedge forecasted crude oil
and natural gas production revenues, as of February 16, 2010.
|
Whiting
Petroleum Corporation
|
||||||||||||||||
|
Contracted
Volumes
|
NYMEX
Price Collar Ranges
|
|||||||||||||||
|
Period
|
Crude
Oil
(Bbl)
|
Natural
Gas (Mcf)
|
Crude
Oil
(per
Bbl)
|
Natural
Gas
(per
Mcf)
|
||||||||||||
|
Jan
– Dec 2010
|
7,446,289 | 495,390 | $ | 63.65 - $87.07 | $ | 6.50 - $15.06 | ||||||||||
|
Jan
– Dec 2011
|
4,435,039 | 436,510 | $ | 58.01 - $89.37 | $ | 6.50 - $14.62 | ||||||||||
|
Jan
– Dec 2012
|
4,065,091 | 384,002 | $ | 57.70 - $91.02 | $ | 6.50 - $14.27 | ||||||||||
|
Jan
– Nov 2013
|
3,090,000 | - | $ | 55.30 - $85.68 | n/a | |||||||||||
|
Total
|
19,036,419 | 1,315,902 | ||||||||||||||
Derivatives conveyed to Whiting USA
Trust I—In connection with the Company’s conveyance on April 30, 2008 of
a term net profits interest to the Trust and related sale of 11,677,500 Trust
units to the public (as further explained in the note on Acquisitions and
Divestitures), the right to any future hedge payments made or received by
Whiting on certain of its derivative contracts have been conveyed to the Trust,
and therefore such payments will be included in the Trust’s calculation of net
proceeds. Under the terms of the aforementioned conveyance, Whiting
retains 10% of the net proceeds from the underlying
properties. Whiting’s retention of 10% of these net proceeds,
combined with its ownership of 2,186,389 Trust units, results in third-party
public holders of Trust units receiving 75.8%, and Whiting retaining 24.2%, of
the future economic results of commodity derivative contracts conveyed to the
Trust. The relative ownership of the future economic results of such
commodity derivatives is reflected in the tables below. No additional
hedges are allowed to be placed on Trust assets.
The 24.2%
portion of Trust derivatives that Whiting has retained the economic rights to
(and which are also included in the table above) are as follows:
|
Whiting
Petroleum Corporation
|
||||||||||||||||
|
Contracted
Volumes
|
NYMEX
Price Collar Ranges
|
|||||||||||||||
|
Period
|
Crude
Oil
(Bbl)
|
Natural
Gas (Mcf)
|
Crude
Oil
(per
Bbl)
|
Natural
Gas
(per
Mcf)
|
||||||||||||
|
Jan
– Dec 2010
|
126,289 | 495,390 | $ | 76.00 - $134.98 | $ | 6.50 - $15.06 | ||||||||||
|
Jan
– Dec 2011
|
115,039 | 436,510 | $ | 74.00 - $140.15 | $ | 6.50 - $14.62 | ||||||||||
|
Jan
– Dec 2012
|
105,091 | 384,002 | $ | 74.00 - $141.72 | $ | 6.50 - $14.27 | ||||||||||
|
Total
|
346,419 | 1,315,902 | ||||||||||||||
The 75.8%
portion of Trust derivative contracts for which Whiting has transferred the
economic rights to third-party public holders of Trust units (and which have not
been reflected in the above tables) are as follows:
|
Third-party
Public Holders of Trust Units
|
||||||||||||||||
|
Contracted
Volumes
|
NYMEX
Price Collar Ranges
|
|||||||||||||||
|
Period
|
Crude
Oil
(Bbl)
|
Natural
Gas
(Mcf)
|
Crude
Oil
(per
Bbl)
|
Natural
Gas
(per
Mcf)
|
||||||||||||
|
Jan
– Dec 2010
|
395,567 | 1,551,678 | $ | 76.00 - $134.98 | $ | 6.50 - $15.06 | ||||||||||
|
Jan
– Dec 2011
|
360,329 | 1,367,249 | $ | 74.00 - $140.15 | $ | 6.50 - $14.62 | ||||||||||
|
Jan
– Dec 2012
|
329,171 | 1,202,785 | $ | 74.00 - $141.72 | $ | 6.50 - $14.27 | ||||||||||
|
Total
|
1,085,067 | 4,121,712 | ||||||||||||||
Discontinuance of
cash flow hedge accounting—Prior to April 1, 2009, the
Company designated a portion of its commodity derivative contracts as cash flow
hedges, whose unrealized fair value gains and losses were recorded to other
comprehensive income, while the Company’s remaining commodity derivative
contracts were not designated as hedges, with gains and losses from changes in
fair value recognized immediately in earnings. Effective April 1,
2009, however, the Company elected to de-designate all of its commodity
derivative contracts that had been previously designated as cash flow hedges as
of March 31, 2009 and has elected to discontinue hedge accounting
prospectively. As a result, subsequent to March 31, 2009 the Company
recognizes all gains and losses from prospective changes in commodity derivative
fair values immediately in earnings rather than deferring any such amounts in
accumulated other comprehensive income.
At March
31, 2009, accumulated other comprehensive income consisted of $59.8 million
($36.5 million net of tax) of unrealized gains, representing the mark-to-market
value of the Company’s open commodity contracts designated as cash flow hedges
as of that date, less any ineffectiveness recognized. As a result of
discontinuing hedge accounting on April 1, 2009, such mark-to-market values at
March 31, 2009 are frozen in accumulated other comprehensive income as of the
de-designation date and reclassified into earnings as the original hedged
transactions affect income. During the year ended December 31, 2009,
$25.3 million ($16.0 million net of tax) of derivative gains relating to
de-designated commodity hedges were reclassified from accumulated other
comprehensive income into earnings.
As of
December 31, 2009, accumulated other comprehensive income amounted to $32.3
million ($20.4 million net of tax), which consisted entirely of unrealized
deferred gains on commodity derivative contracts that had been previously
designated as cash flow hedges. The Company expects to reclassify
into earnings from accumulated other comprehensive income net after-tax gains of
$14.6 million related to de-designated commodity hedges during the next twelve
months.
Interest rate
derivative contract—In August 2004, the Company
entered into an interest rate swap agreement to manage its exposure to interest
rate risk on a portion of its fixed-rate borrowings. The interest
rate swap effectively modified the Company’s exposure to interest rate risk by
converting the fixed rate on $75.0 million of the Company’s Senior Subordinated
Notes due 2012 to a floating rate. This agreement involved the
receipt of fixed rate amounts in exchange for floating rate interest payments
over the life of the agreement without an exchange of the underlying notional
amount. The interest rate swap was designated as a fair value
hedge. In March 2009, the counterparty exercised its option to cancel
the swap contract effective May 1, 2009, resulting in a cancellation fee of
$1.4 million paid to the Company.
SFAS
161—Effective January 1, 2009, the Company adopted Financial Accounting
Standard Board (“FASB”) Statement No. 161, Disclosure about Derivative
Instruments and Hedging Activities – an amendment to FASB Statement No.
133 (“SFAS 161”), as codified in FASB ASC topic 815, Derivatives and Hedges (“FASB
ASC 815”). SFAS 161 expands interim and annual disclosures about
derivative and hedging activities that are intended to better convey the purpose
of derivative use and the risks managed. The adoption of SFAS 161 did
not have an impact on the Company’s consolidated financial statements, other
than additional disclosures which are set forth below.
All
derivative instruments are recorded on the consolidated balance sheet at fair
value, other than the derivative instruments that meet the normal purchase
normal sales exclusion. The following tables summarize the location
and fair value amounts of all derivative instruments in the consolidated balance
sheets (in thousands).
|
Fair
Value
|
|||||||||
|
Designated
as ASC 815 Hedges
|
Balance
Sheet Classification
|
December
31, 2009
|
December
31, 2008
|
||||||
|
Derivative
assets
|
|||||||||
|
Commodity
contracts
|
Current
derivative assets
|
$ | - | $ | 30,198 | ||||
|
Commodity
contracts
|
Non-current
derivative assets
|
- | 13,163 | ||||||
|
Interest
rate swap contract
|
Other
long-term assets
|
- | 1,690 | ||||||
|
Total
derivative assets
|
$ | - | $ | 45,051 | |||||
|
Derivative
liabilities
|
|||||||||
|
Commodity
contracts
|
Current
derivative liabilities
|
$ | - | $ | 4,784 | ||||
|
Commodity
contracts
|
Non-current
derivative liabilities
|
- | 9,224 | ||||||
|
Total
derivative liabilities
|
$ | - | $ | 14,008 | |||||
|
Not
Designated as ASC 815 Hedges
|
|||||||||
|
Derivative
assets
|
|||||||||
|
Commodity
contracts
|
Current
derivative assets
|
$ | 4,723 | $ | 16,582 | ||||
|
Commodity
contracts
|
Non-current
derivative assets
|
8,473 | 24,941 | ||||||
|
Total
derivative assets
|
13,196 | 41,523 | |||||||
|
Derivative
liabilities
|
|||||||||
|
Commodity
contracts
|
Current
derivative liabilities
|
$ | 49,551 | $ | 12,570 | ||||
|
Commodity
contracts
|
Non-current
derivative liabilities
|
137,621 | 18,907 | ||||||
|
Total
derivative liabilities
|
$ | 187,172 | $ | 31,477 | |||||
Commodity derivative
contracts—The following tables summarize the effects of commodity
derivatives instruments on the consolidated statements of income for the twelve
months ended December 31, 2009 and 2008 (in thousands).
|
Gain
(Loss) Recognized in OCI (Effective Portion)
|
|||||||||
|
ASC
815 Cash Flow
|
Location
of Gain (Loss) Not
|
Year
Ended December 31,
|
|||||||
|
Hedging
Relationships
|
Recognized in
Income
|
2009
|
2008
|
||||||
|
Commodity
contracts
|
Other
comprehensive income
|
$ | 21,147 | $ | (4,884 | ) | |||
|
Gain
(Loss) Reclassified from AOCI into Income
(Effective
Portion)
|
|||||||||
|
ASC
815 Cash Flow
|
Year
Ended December 31,
|
||||||||
|
Hedging
Relationships
|
Income Statement
Classification
|
2009
|
2008
|
||||||
|
Commodity
contracts
|
Gain
(loss) on hedging activities
|
$ | 38,776 | $ | (107,555 | ) | |||
|
(Gain)
Loss Recognized in Income
(Ineffective
Portion)
|
|||||||||
|
ASC
815 Cash Flow
|
Year
Ended December 31,
|
||||||||
|
Hedging
Relationships
|
Income
Statement Classification
|
2009
|
2008
|
||||||
|
Commodity
contracts
|
Commodity
derivative (gain) loss, net
|
$ | 22,655 | $ | (1,896 | ) | |||
|
(Gain)
Loss Recognized in Income
|
|||||||||
|
Not
Designated as
|
Year
Ended December 31,
|
||||||||
|
ASC
815 Hedges
|
Income
Statement Classification
|
2009
|
2008
|
||||||
|
Commodity
contracts
|
Commodity
derivative (gain) loss, net
|
$ | 239,560 | $ | (5,192 | ) | |||
Fair value hedge—In March
2009, the Company’s derivative counterparty exercised its option to cancel the
Company’s interest rate swap contract effective May 1, 2009. Prior to
the cancellation, the gain or loss on the hedged item ($75.0 million of
fixed-rate borrowings under the Company’s Senior Subordinated Notes due 2012)
attributable to the hedged benchmark interest rate risk (risk of changes in the
LIBOR swap rate) and the offsetting gain or loss on the related interest rate
swap for the twelve months ended December 31, 2009 and 2008 were as follows
(in thousands):
|
Gain
(Loss) on Swap
|
Gain
(Loss) on Borrowing
|
|||||||||||||||
|
Year
Ended December 31,
|
Year
Ended December 31,
|
|||||||||||||||
|
Income
Statement Classification
|
2009
|
2008
|
2009
|
2008
|
||||||||||||
|
Interest
expense
|
$ | (330 | ) | $ | 939 | $ | 330 | $ | (939 | ) | ||||||
There was
no difference, or therefore ineffectiveness, between the gain (loss) on swap and
gain (loss) on borrowing amounts in the above table because this swap met the
criteria to qualify for the “short cut” method of assessing
effectiveness. Accordingly, the change in fair value of the debt was
assumed to equal the change in the fair value of the interest rate
swap. In addition, the net swap settlements that accrued each period
were also reported in interest expense.
Contingent features in derivative
instruments—None of the Company’s derivative instruments contain
credit-risk-related contingent features. Counterparties to the
Company’s derivative contracts are high credit quality financial institutions
that are lenders under Whiting’s credit agreement. Whiting uses only
credit agreement participants to hedge with, since these institutions are
secured equally with the holders of Whiting’s bank debt, which eliminates the
potential need to post collateral when Whiting is in a large derivative
liability position. As a result, the Company is not required to post
letters of credit or corporate guarantees for the counterparty to secure
contract performance obligations.
|
6.
|
FAIR
VALUE MEASUREMENTS
|
The
Company follows the Fair Value
Measurement and Disclosure topic of the FASB ASC, which establishes a
three-level valuation hierarchy for disclosure of fair value
measurements. The valuation hierarchy categorizes assets and
liabilities measured at fair value into one of three different levels depending
on the observability of the inputs employed in the measurement. The
three levels are defined as follows:
|
·
|
Level
1: Quoted Prices in Active Markets for Identical Assets – inputs to the
valuation methodology are quoted prices (unadjusted) for identical
assets or liabilities in active
markets.
|
|
·
|
Level
2: Significant Other Observable Inputs – inputs to the valuation
methodology include quoted prices for similar assets and liabilities in
active markets, and inputs that are observable for the asset or liability,
either directly or indirectly, for substantially the full term of the
financial instrument.
|
|
·
|
Level
3: Significant Unobservable Inputs – inputs to the valuation methodology
are unobservable and significant to the fair value
measurement.
|
A
financial instrument’s categorization within the valuation hierarchy is based
upon the lowest level of input that is significant to the fair value
measurement. The Company’s assessment of the significance of a
particular input to the fair value measurement in its entirety requires judgment
and considers factors specific to the asset or liability. The
following tables present information about the Company’s financial assets and
liabilities measured at fair value on a recurring basis as of December 31, 2009
and 2008, and indicate the fair value hierarchy of the valuation techniques
utilized by the Company to determine such fair values (in
thousands):
|
Level
1
|
Level
2
|
Level
3
|
Total
Fair Value
December
31, 2009
|
|||||||||||||
|
Financial
Assets
|
||||||||||||||||
|
Commodity
derivatives - current
|
$ | - | $ | 4,723 | $ | - | $ | 4,723 | ||||||||
|
Commodity
derivatives - non-current
|
- | 8,473 | - | 8,473 | ||||||||||||
|
Total
financial assets
|
$ | - | $ | 13,196 | $ | - | $ | 13,196 | ||||||||
|
Financial
Liabilities
|
||||||||||||||||
|
Commodity
derivatives - current
|
$ | - | $ | 49,551 | $ | - | $ | 49,551 | ||||||||
|
Commodity
derivatives - non-current
|
- | 137,621 | - | 137,621 | ||||||||||||
|
Total
financial liabilities
|
$ | - | $ | 187,172 | $ | - | $ | 187,172 | ||||||||
|
Level
1
|
Level
2
|
Level
3
|
Total
Fair Value December 31, 2008
|
|||||||||||||
|
Financial
Assets
|
||||||||||||||||
|
Commodity
derivatives - current
|
$ | - | $ | 46,780 | $ | - | $ | 46,780 | ||||||||
|
Commodity
derivatives - non-current
|
- | 38,104 | - | 38,104 | ||||||||||||
|
Other
long-term assets (1)
|
- | 1,690 | - | 1,690 | ||||||||||||
|
Total
financial assets
|
$ | - | $ | 86,574 | $ | - | $ | 86,574 | ||||||||
|
Financial
Liabilities
|
||||||||||||||||
|
Commodity
derivatives - current
|
$ | - | $ | 17,354 | $ | - | $ | 17,354 | ||||||||
|
Commodity
derivatives - non-current
|
- | 28,131 | - | 28,131 | ||||||||||||
|
Long-term
debt (1)
|
- | 1,690 | - | 1,690 | ||||||||||||
|
Total
financial liabilities
|
$ | - | $ | 47,175 | $ | - | $ | 47,175 | ||||||||
________________
|
|
(1) Amount
represents interest rate swap (see note on Long-Term
Debt).
|
The
following methods and assumptions were used to estimate the fair values of the
assets and liabilities in the tables above:
Commodity Derivative
Instruments—Commodity derivative instruments consist primarily of
costless collars for crude oil and natural gas. The Company’s
costless collars are valued using industry-standard models that consider various
assumptions, including quoted forward prices for commodities, time value,
volatility factors and contractual prices for the underlying instruments, as
well as other relevant economic measures. Substantially all of these
assumptions are observable in the marketplace throughout the full term of the
contract, can be derived from observable data or are supported by observable
levels at which transactions are executed in the marketplace, and are therefore
designated as Level 2 within the valuation hierarchy. The
discount rate used in the fair values of these instruments includes a measure of
nonperformance risk. The Company utilizes the counterparties’
valuations to assess the reasonableness of its own valuations.
Interest Rate Swap—The
Company’s interest rate swap was valued using modeling techniques that include
market inputs such as publicly available interest rate yield curves, and is
designated as Level 2 within the valuation hierarchy. The
Company utilizes the counterparty’s valuations to assess the reasonableness of
its own valuations.
Non-Recurring Fair Value
Measurements—The Company did not apply fair value measurement guidance to
any of its 2008 non-recurring, non-financial fair value measurements as
permitted by the FASB. Effective January 1, 2009, the Company began
applying the provisions of the fair value measurement to its non-recurring,
non-financial measurements including business combinations, proved oil and gas
property impairments and asset retirement obligations. These assets
and liabilities are not measured at fair value on an ongoing basis but are
subject to fair value adjustments only in certain circumstances. The
following table presents information about the Company’s non-financial assets
and liabilities measured at fair value on a non-recurring basis as of December
31, 2009, and indicates the fair value hierarchy of the valuation techniques
utilized by the Company to determine such fair values (in
thousands):
|
Fair
Value Measurements Using
|
||||||||||||||||||||
|
Net
carrying value as of December 31, 2009
|
Level
1
|
Level
2
|
Level
3
|
Loss
(Before Tax) Year Ended December 31, 2009
|
||||||||||||||||
|
Business
combinations (1)(2)
|
$ | 65,697 | $ | - | $ | - | $ | 66,120 | $ | - | ||||||||||
|
Proved
oil and gas property (2)
|
7,849 | - | - | 8,218 | 9,420 | |||||||||||||||
|
Asset
retirement obligations (3)
|
519 | - | - | 538 | - | |||||||||||||||
|
Total
non-recurring assets at fair value
|
$ | 74,065 | $ | - | $ | - | $ | 74,876 | $ | 9,420 | ||||||||||
________________
|
|
(1)
|
The
business combinations relate to the additional royalty and overriding
royalty interests in the North Ward Estes field and various other fields
in the Permian Basin.
|
|
|
(2)
|
The
net carrying value as of December 31, 2009 did not equal our fair value
measurement at the time of impairment due to the subsequent recognition of
depreciation expense.
|
|
|
(3)
|
The
net carrying value as of December 31, 2009 did not equal our fair value
measurement at the time of inception due to the subsequent recognition of
accretion expense.
|
The
following methods and assumptions were used to estimate the fair values of the
non-financial assets and liabilities in the table above:
Business Combinations—The
Company primarily values business combinations using the present value of
estimated future cash flows discounted at a rate that reflects market
participant assumptions based on the risk of the asset
acquired. Given the unobservable nature of the inputs, business
combinations are deemed to use Level 3 inputs.
Proved Oil and Gas
Property—The Company reviews oil and gas properties for potential
impairment by comparing future net undiscounted cash flows to the net book value
at the end of each period. If the net capitalized cost exceeds
undiscounted future cash flows, the cost of the property is written down to
“fair value,” which is determined using net discounted future cash flows from
the producing property. The Company uses estimated future cash flows
discounted at a rate consistent with those used to evaluate cash flows of
similar assets. Given the unobservable nature of the inputs, proved
oil and gas properties are deemed to use Level 3 inputs.
Asset Retirement
Obligations—The Company estimates the fair value of asset retirement
obligations at the point they are incurred by calculating the present value of
estimated future plug and abandonment costs. Such present value
calculations include various assumptions such as estimated amounts and timing of
settlements, the Company’s credit-adjusted risk-free discount rate and future
inflation rates. Given the unobservable nature of most of these
inputs, the initial measurement of the asset retirement obligation liability is
deemed to use Level 3 inputs.
|
7.
|
DEFERRED
COMPENSATION
|
Production
Participation Plan—The Company has a Production Participation Plan (the
“Plan”) in which all employees participate. On an annual basis,
interests in oil and gas properties acquired, developed or sold during the year
are allocated to the Plan as determined annually by the Compensation
Committee. Once allocated, the interests (not legally conveyed) are
fixed. Interest allocations prior to 1995 consisted of 2%-3%
overriding royalty interests. Interest allocations since 1995 have
been 2%-5% of oil and gas sales less lease operating expenses and production
taxes.
Payments
of 100% of the year’s Plan interests to employees and the vested percentages of
former employees in the year’s Plan interests are made annually in cash after
year-end. Accrued compensation expense under the Plan for the years
ended December 31, 2009, 2008 and 2007 amounted to $15.8 million, $33.5 million
and $15.8 million, respectively, charged to general and administrative expense
and $2.4 million, $5.2 million and $2.8 million, respectively, charged to
exploration expense.
Employees
vest in the Plan ratably at 20% per year over a five year
period. Pursuant to the terms of the Plan, (i) employees who
terminate their employment with the Company are entitled to receive their vested
allocation of future Plan year payments on an annual basis; (ii) employees will
become fully vested at age 62, regardless of when their interests would
otherwise vest; and (iii) any forfeitures inure to the benefit of the
Company.
The
Company uses average historical prices to estimate the vested long-term
Production Participation Plan liability. At December 31, 2009, the
Company used three-year average historical NYMEX prices of $77.97 for crude oil
and $6.60 for natural gas to estimate this liability. If the Company
were to terminate the Plan or upon a change in control (as defined in the Plan),
all employees fully vest, and the Company would distribute to each Plan
participant an amount based upon the valuation method set forth in the Plan in a
lump sum payment twelve months after the date of termination or within one month
after a change in control event. Based on prices at December 31,
2009, if the Company elected to terminate the Plan or if a change of control
event occurred, it is estimated that the fully vested lump sum cash payment to
employees would approximate $136.3 million. This amount includes
$24.0 million attributable to proved undeveloped oil and gas properties and
$18.2 million relating to the short-term portion of the Plan liability, which
has been accrued as a current payable to be paid in February
2010. The ultimate sharing contribution for proved undeveloped oil
and gas properties will be awarded in the year of Plan termination or change of
control. However, the Company has no intention to terminate the
Plan.
The
following table presents changes in the estimated long-term liability related to
the Plan (in thousands):
|
Year
Ended December 31,
|
||||||||
|
2009
|
2008
|
|||||||
|
Beginning
long-term Production Participation Plan liability
|
$ | 66,166 | $ | 34,042 | ||||
|
Change
in liability for accretion, vesting and change in
estimates
|
21,472 | 70,811 | ||||||
|
Reduction
in liability for cash payments accrued and recognized as compensation
expense
|
(18,205 | ) | (38,687 | ) | ||||
|
Ending
long-term Production Participation Plan liability
|
$ | 69,433 | $ | 66,166 | ||||
The
Company records the expense associated with changes in the present value of
estimated future payments under the Plan as a separate line item in the
consolidated statements of income. The amount recorded is not
allocated to general and administrative expense or exploration expense because
the adjustment of the liability is associated with the future net cash flows
from the oil and gas properties rather than current period
performance. The following table presents the estimated allocation of
the change in the liability if the Company did allocate the adjustment to these
specific line items (in thousands):
|
Year
Ended December 31,
|
||||||||||||
|
2009
|
2008
|
2007
|
||||||||||
|
General
and administrative expense
|
$ | 2,842 | $ | 27,852 | $ | 7,293 | ||||||
|
Exploration
expense
|
425 | 4,272 | 1,306 | |||||||||
|
Total
|
$ | 3,267 | $ | 32,124 | $ | 8,599 | ||||||
401(k)
Plan—The Company has a defined contribution retirement plan for all
employees. The plan is funded by employee contributions and
discretionary Company contributions. The Company’s contributions for
2009, 2008 and 2007 were $3.7 million, $3.0 million and $2.4 million,
respectively. Employees vest in employer contributions at 20% per
year of completed service.
|
8.
|
STOCKHOLDERS’
EQUITY
|
6.25% Convertible
Perpetual Preferred Stock Offering—In June 2009, the Company completed a
public offering of 6.25% convertible perpetual preferred stock, selling
3,450,000 shares at a price of $100.00 per share and providing net proceeds of
$334.1 million after underwriters’ fees and offering expenses. The
Company used the net proceeds to repay a portion of the debt outstanding under
its credit agreement.
Each
holder of the convertible perpetual preferred stock is entitled to an annual
dividend of $6.25 per share to be paid quarterly in cash, common stock or a
combination thereof on March 15, June 15, September 15 and December 15, when and
if such dividend has been declared by Whiting’s board of
directors. During 2009, the Company paid dividends of $4.9 million
and $5.4 million on September 15, 2009 and December 15, 2009,
respectively. Each share of convertible perpetual preferred stock has
a liquidation preference of $100.00 per share plus accumulated and unpaid
dividends and is convertible, at a holder’s option, into shares of Whiting’s
common stock based on an initial conversion price of $43.4163, subject to
adjustment upon the occurrence of certain events. The convertible
perpetual preferred stock is not redeemable by the Company. At any
time on or after June 15, 2013, the Company may cause all outstanding shares of
this preferred stock to be converted into shares of common stock if the closing
price of our common stock equals or exceeds 120% of the then-prevailing
conversion price for at least 20 trading days in a period of 30 consecutive
trading days. The holders of convertible preferred stock have no
voting rights unless dividends payable on the convertible preferred stock are in
arrears for six or more quarterly periods.
Common Stock
Offering—In February 2009, the Company completed a public offering of its
common stock, selling 8,450,000 shares of common stock at a price of $29.00 per
share and providing net proceeds of $234.8 million after underwriters’ fees and
offering expenses. The Company used the net proceeds to repay a
portion of the debt outstanding under its credit agreement.
Common Stock
Offering—In July 2007, the Company completed a public offering of its
common stock, selling 5,425,000 shares of common stock at a price of $40.50 per
share and providing net proceeds of $210.4 million. The Company used
the net proceeds to repay a portion of the debt outstanding under its credit
agreement.
Equity Incentive
Plan—The Company maintains the Whiting Petroleum Corporation 2003 Equity
Incentive Plan (the “Equity Plan”), pursuant to which two million shares of the
Company’s common stock have been reserved for issuance. No employee
or officer participant may be granted options for more than 300,000 shares of
common stock, stock appreciation rights relating to more than 300,000 shares of
common stock, or more than 150,000 shares of restricted stock during any
calendar year. As of December 31, 2009, 1,058,116 shares of
common stock remained available for grant under the Plan.
Restricted Shares—Restricted
stock awards for executive officers, directors and employees generally vest
ratably over three years. The Company uses historical data and
projections to estimate expected employee behaviors related to restricted stock
forfeitures. The expected forfeitures are then included as part of
the grant date estimate of compensation cost. For service-based
restricted stock awards, the grant date fair value is determined based on the
closing bid price of the Company’s common stock on the grant date.
In
February 2007, 79,227 shares of restricted stock, subject to certain internal
performance metrics in addition to the standard three-year service condition,
were granted to executive officers under the Equity Plan. These
internal performance conditions must be met in order for the stock awards to
vest. It is therefore possible that no shares could vest in one or
more of the three-year vesting periods. The Company recognizes
compensation expense for awards subject to performance conditions when it
becomes probable that these conditions will be achieved. However, any
such compensation expense recognized is reversed if vesting does not actually
occur.
In
February 2009 and 2008, 209,649 shares and 74,542 shares, respectively, of
restricted stock, subject to certain market-based vesting criteria in addition
to the standard three-year service condition, were granted to executive officers
under the Equity Plan. The market-based conditions must be met in
order for the stock awards to vest, and it is therefore possible that no shares
could vest in one or more of the three-year vesting periods. However,
the Company recognizes compensation expense for awards subject to market
conditions regardless of whether it becomes probable that these conditions will
be achieved or not, and compensation expense is not reversed if vesting does not
actually occur.
For these
awards subject to market conditions, the grant date fair value was estimated
using a Monte Carlo valuation model. The Monte Carlo model is based
on random projections of stock price paths and must be repeated numerous times
to achieve a probabilistic assessment. Expected volatility was
calculated based on the historical volatility of Whiting’s common stock, and the
risk-free interest rate is based on U.S. Treasury yield curve rates with
maturities consistent with the three-year vesting period. The key
assumptions used in valuing the market-based restricted shares were as
follows:
|
2009
|
2008
|
|||||||
|
Number
of simulations
|
100,000 | 100,000 | ||||||
|
Expected
volatility
|
70.0% | 36.3% | ||||||
|
Risk-free
rate
|
1.33% | 2.24% | ||||||
The total
grant date fair value of the market-based restricted stock as determined by the
Monte Carlo valuation model was $1.4 million in February 2009 and $1.8 million
in February 2008 and is recognized ratably over the three-year vesting
period.
The
following table shows a summary of the Company’s nonvested restricted stock as
of December 31, 2007, 2008 and 2009 as well as activity during the years
then ended (share and per share data, not presented in thousands):
|
Number
of
Shares
|
Weighted
Average
Grant
Date
Fair
Value
|
|||||||
|
Restricted
stock awards nonvested, January 1, 2007
|
203,264 | $ | 39.33 | |||||
|
Granted
|
150,815 | $ | 45.24 | |||||
|
Vested
|
(101,985 | ) | $ | 36.13 | ||||
|
Forfeited
|
(12,438 | ) | $ | 44.28 | ||||
|
Restricted
stock awards nonvested, December 31, 2007
|
239,656 | $ | 44.15 | |||||
|
Granted
|
138,518 | $ | 40.67 | |||||
|
Vested
|
(112,384 | ) | $ | 43.46 | ||||
|
Forfeited
|
(7,026 | ) | $ | 50.66 | ||||
|
Restricted
stock awards nonvested, December 31, 2008
|
258,764 | $ | 42.41 | |||||
|
Granted
|
364,226 | $ | 15.66 | |||||
|
Vested
|
(99,241 | ) | $ | 42.26 | ||||
|
Forfeited
|
(5,485 | ) | $ | 35.44 | ||||
|
Restricted
stock awards nonvested, December 31, 2009
|
518,264 | $ | 23.71 | |||||
As of
December 31, 2009, there was $3.6 million of total unrecognized compensation
cost related to unvested restricted stock granted under the stock incentive
plans. That cost is expected to be recognized over a weighted average
period of 1.9 years. For the years ended December 31, 2009, 2008 and 2007, the
total fair value of restricted stock vested was $2.5 million, $6.6 million and
$4.7 million, respectively.
Stock Options—In February
2009, 120,607 stock options were granted under the Equity Plan to certain
executive officers of the Company with exercise prices equal to the closing
market price of the Company’s common stock on the grant date. These
stock options vest ratably over a three-year service period from the grant date
and are exercisable immediately upon vesting through the tenth anniversary of
the grant date.
The
Company uses a Black-Scholes option-pricing model to estimate the fair value of
stock option awards. Because the Company has not previously granted
stock options, it does not have historical exercise data upon which to estimate
the expected term of the options. As such, the Company has elected to
estimate the expected term of the stock options granted using the “simplified”
method for “plain vanilla” options. The expected volatility at the
grant date is based on the historical volatility of Whiting’s common stock, and
the risk-free interest rate is determined using the U.S. Treasury yield curve
rates with maturities similar to those of the expected term of the stock
options. The following table summarizes the assumptions used to
estimate the grant date fair value of stock options awarded in February
2009:
|
Stock
Options
2009
|
||||
|
Risk-free
interest rate
|
2.0% | |||
|
Expected
volatility
|
58.1% | |||
|
Expected
term
|
6.0
yrs.
|
|||
|
Dividend
yield
|
- | |||
The grant
date fair value of the stock options awarded, as determined by the Black-Scholes
valuation model, was $1.4 million and will be recognized ratably over the
three-year vesting period.
The
following table shows a summary of the Company’s stock options outstanding as of
December 31, 2009 as well as activity during the year then ended (share and per
share data, not presented in thousands):
|
Number
of Options
|
Weighted
Average Exercise Price per Share
|
|||||||
|
Options
outstanding at January 1, 2009
|
- | - | ||||||
|
Granted
|
120,607 | $ | 25.51 | |||||
|
Exercised
|
- | - | ||||||
|
Forfeited
or expired
|
- | - | ||||||
|
Options
outstanding at December 31, 2009
|
120,607 | $ | 25.51 | |||||
At
December 31, 2009, no options were eligible for exercise. The
weighted average grant-date fair value of options granted during 2009 was $11.85
per share. The 120,607 options outstanding in the table above are all
expected to vest, have a remaining contractual term of 9.1 years and an
aggregate intrinsic value of $5.5 million as of December 31,
2009. Unrecognized compensation cost as of December 31, 2009
related to unvested stock option awards was $0.7 million, which is expected to
be recognized over a period of 2.2 years.
For the
years ended December 31, 2009, 2008 and 2007, total stock compensation expense
recognized for restricted share awards and stock options was $7.7 million, $4.2
million and $5.1 million, respectively.
Rights
Agreement—In 2006, the Board of Directors of the Company declared a
dividend of one preferred share purchase right (a “Right”) for each outstanding
share of common stock of the Company payable to the stockholders of record as of
March 2, 2006. Each Right entitles the registered holder to
purchase from the Company one one-hundredth of a share of Series A Junior
Participating Preferred Stock, par value $0.001 per share (“Preferred Shares”),
of the Company at a price of $180.00 per one one-hundredth of a Preferred Share,
subject to adjustment. If any person becomes a 15% or more
stockholder of the Company, then each Right (subject to certain limitations)
will entitle its holder to purchase, at the Right’s then current exercise price,
a number of shares of common stock of the Company or of the acquirer having a
market value at the time of twice the Right’s per share exercise
price. The Company’s Board of Directors may redeem the Rights for
$0.001 per Right at any time prior to the time when the Rights become
exercisable. Unless the Rights are redeemed, exchanged or terminated
earlier, they will expire on February 23, 2016.
|
9.
|
INCOME
TAXES
|
Income
tax expense consists of the following (in thousands):
|
Year
Ended December 31,
|
||||||||||||
|
2009
|
2008
|
2007
|
||||||||||
|
Current
income tax expense (refund):
|
||||||||||||
|
Federal
|
$ | 741 | $ | - | $ | 32 | ||||||
|
State
|
(505 | ) | 2,361 | 518 | ||||||||
|
Total
current income tax expense
|
236 | 2,361 | 550 | |||||||||
|
Deferred
income tax expense (benefit):
|
||||||||||||
|
Federal
|
(56,136 | ) | 142,393 | 72,937 | ||||||||
|
State
|
(53 | ) | 11,923 | 3,075 | ||||||||
|
Total
deferred income tax expense (benefit)
|
(56,189 | ) | 154,316 | 76,012 | ||||||||
|
Total
|
$ | (55,953 | ) | $ | 156,677 | $ | 76,562 | |||||
Income
tax expense differed from amounts that would result from applying the U.S.
statutory income tax rate (35%) to income before income taxes as follows (in
thousands):
|
Year
Ended December 31,
|
||||||||||||
|
2009
|
2008
|
2007
|
||||||||||
|
U.S.
statutory income tax expense (benefit)
|
$ | (56,992 | ) | $ | 143,087 | $ | 72,506 | |||||
|
State
income taxes, net of federal benefit
|
(1,228 | ) | 13,458 | 4,176 | ||||||||
|
Tax
credits
|
- | - | 330 | |||||||||
|
Statutory
depletion
|
(394 | ) | (583 | ) | (405 | ) | ||||||
|
Enacted
changes in state tax laws
|
711 | - | (599 | ) | ||||||||
|
Change
in valuation allowance
|
- | - | 67 | |||||||||
|
Permanent
items
|
1,482 | 715 | 570 | |||||||||
|
Other
|
468 | - | (83 | ) | ||||||||
|
Total
|
$ | (55,953 | ) | $ | 156,677 | $ | 76,562 | |||||
The
principal components of the Company’s deferred income tax assets and liabilities
at December 31, 2009 and 2008 were as follows (in thousands):
|
Year
Ended December 31,
|
||||||||
|
2009
|
2008
|
|||||||
|
Deferred
income tax assets:
|
||||||||
|
Net
operating loss carryforward
|
$ | 126,934 | $ | 124,560 | ||||
|
Derivative
instruments
|
75,870 | - | ||||||
|
Production
Participation Plan liability
|
25,690 | 24,548 | ||||||
|
Tax
sharing liability
|
9,362 | 11,109 | ||||||
|
Asset
retirement obligations
|
11,487 | 13,050 | ||||||
|
Underwriter
fees
|
5,736 | 6,935 | ||||||
|
Restricted
stock compensation
|
2,009 | 1,979 | ||||||
|
Enhanced
oil recovery credit carryforwards
|
7,946 | 7,946 | ||||||
|
Alternative
minimum tax credit carryforwards
|
10,393 | 9,653 | ||||||
|
State
deductibles
|
- | 2,215 | ||||||
|
Foreign
tax credit carryforwards
|
1,230 | 1,230 | ||||||
|
Other
|
509 | 655 | ||||||
|
Total
deferred income tax assets
|
277,166 | 203,880 | ||||||
|
Less
valuation allowances
|
(1,230 | ) | (1,230 | ) | ||||
|
Net
deferred income tax assets
|
275,936 | 202,650 | ||||||
|
Deferred
income tax liabilities:
|
||||||||
|
Oil
and gas properties
|
604,808 | 548,596 | ||||||
|
Derivative
instruments
|
- | 12,482 | ||||||
|
Trust
distributions
|
23,490 | 47,869 | ||||||
|
Other
|
- | - | ||||||
|
Total
deferred income tax liabilities
|
628,298 | 608,947 | ||||||
|
Total
net deferred income tax liabilities
|
$ | 352,362 | $ | 406,297 | ||||
As of
December 31, 2009, we had federal net operating loss carryforwards of $350.0
million and various state net operating loss carryforwards. The
determination of the state net operating loss carryforwards is dependent upon
apportionment percentages and state laws that can change from year to year and
impact the amount of such carryforwards. If unutilized, the federal
net operating loss will expire in 2027 and 2028, and the state net operating
loss will expire between 2012 and 2028.
EOR
credits are a credit against federal income taxes for certain costs related to
extracting high-cost oil, utilizing certain prescribed “enhanced” tertiary
recovery methods. As of December 31, 2009, the Company had recognized
aggregate enhanced oil recovery credits of $7.9 million that are available to
offset regular federal income taxes in the future. These credits can
be carried forward and will expire between 2023 and 2025. Federal EOR
credits are subject to phase-out according to the level of average domestic
crude oil prices. The EOR credit has been phased-out since
2006.
The
Company is subject to the alternative minimum tax (“AMT”) principally due to its
significant intangible drilling cost deductions. As of December 31,
2009, the Company had AMT credits totaling $10.4 million that are available to
offset future regular federal income taxes. These credits do not
expire and can be carried forward indefinitely.
At
December 31, 2009, the Company’s foreign tax credit carryforwards totaled $1.2
million, which will expire between 2014 and 2016. As of December 31,
2009, a valuation allowance of $1.2 million was established in full for the
foreign tax credit carryforwards because the Company determined that it was more
likely than not that the benefit from these deferred tax assets will not be
realized due to the divestiture of all foreign operations.
Net
deferred income tax liabilities were classified in the consolidated balance
sheets as follows (in thousands):
|
Year
Ended December 31,
|
||||||||
|
2009
|
2008
|
|||||||
|
Assets:
|
||||||||
|
Current
deferred income taxes
|
$ | - | $ | - | ||||
|
Liabilities:
|
||||||||
|
Current
deferred income taxes
|
11,325 | 15,395 | ||||||
|
Non-current
deferred income taxes
|
341,037 | 390,902 | ||||||
|
Net
deferred income tax liabilities
|
$ | 352,362 | $ | 406,297 | ||||
The
following table summarizes the activity related to the Company's liability for
unrecognized tax benefits (in thousands):
|
Year
Ended December 31,
|
||||||||||||
|
2009
|
2008
|
2007
|
||||||||||
|
Beginning
balance at January 1
|
$ | 299 | $ | 170 | $ | 396 | ||||||
|
Increases
related to tax position taken in the current year
|
- | 129 | 96 | |||||||||
|
Decreases
associated with accounting method change
|
- | - | (322 | ) | ||||||||
|
Ending
balance at December 31
|
$ | 299 | $ | 299 | $ | 170 | ||||||
Included
in the unrecognized tax benefit balance at December 31, 2009, are $0.3
million of tax positions, the allowance of which would positively affect the
annual effective income tax rate. For the year ended
December 31, 2009, the Company did not recognize any interest or penalties
with respect to unrecognized tax benefits, nor did the Company have any such
interest or penalties previously accrued.
The
Company files income tax returns in the U.S. Federal jurisdiction, in various
states, and previously filed in two foreign jurisdictions each with varying
statutes of limitations. The 2006 through 2009 tax years generally
remain subject to examination by federal and state tax
authorities. The foreign jurisdictions generally remain subject to
examination by their respective authorities for 2003 through 2006.
|
10.
|
EARNINGS
PER SHARE
|
The
reconciliations between basic and diluted earnings per share are as follows (in
thousands, except per share data):
|
Year
Ended December
31, 2009
|
Year
Ended December
31, 2008
|
|||||||||||||||||||||||
|
Income
|
Weighted
Avg Shares Outstanding
|
Per
Share Amount
|
Income
|
Weighted
Avg Shares Outstanding
|
Per
Share Amount
|
|||||||||||||||||||
|
Net
income (loss)
|
$ | (106,882 | ) | $ | 252,143 | |||||||||||||||||||
|
Less:
|
||||||||||||||||||||||||
|
Preferred
stock dividends declared
|
(10,302 | ) | - | |||||||||||||||||||||
|
Preferred
stock dividends accumulated
|
(945 | ) | - | |||||||||||||||||||||
|
Basic:
|
||||||||||||||||||||||||
|
Adjusted
net income (loss) available to common stockholders
|
$ | (118,129 | ) | 50,044 | $ | (2.36 | ) | $ | 252,143 | 42,310 | $ | 5.96 | ||||||||||||
|
Effect
of dilutive securities
|
||||||||||||||||||||||||
|
Restricted
stock and stock options
|
- | - | - | 137 | ||||||||||||||||||||
|
Diluted:
|
||||||||||||||||||||||||
|
Adjusted
net income (loss) available to common stockholders plus assumed
conversions
|
$ | (118,129 | ) | 50,044 | $ | (2.36 | ) | $ | 252,143 | 42,447 | $ | 5.94 | ||||||||||||
For the
year ended December 31, 2009, the Company had a net loss. Therefore,
the diluted earnings per share calculation for that period excludes the effect
of 348,729 shares of restricted stock and stock options because their effect was
anti-dilutive, as well as 4,158,214 weighted average common shares issuable upon
the assumed conversion of the 6.25% perpetual preferred stock.
|
11.
|
RELATED
PARTY TRANSACTIONS
|
Whiting USA Trust
I—As a result of
Whiting’s retained ownership of 15.8%, or 2,186,389 units in Whiting USA Trust
I, the Trust is a related party of the Company. The following table
summarizes the related party receivable and payable balances between the Company
and the Trust as of December 31, 2009 and 2008 (in thousands):
|
December
31, 2009
|
December
31, 2008
|
|||||||
|
Assets
|
||||||||
|
Unit
distributions due from Trust (1)
|
$ | 1,023 | $ | 1,596 | ||||
|
Total
|
$ | 1,023 | $ | 1,596 | ||||
|
Liabilities
|
||||||||
|
Unit
distributions payable to Trust (2)
|
$ | 6,485 | $ | 10,120 | ||||
|
Current
portion of derivative liability
|
3,580 | 12,570 | ||||||
|
Non-current
derivative liability
|
6,423 | 18,907 | ||||||
|
Total
|
$ | 16,488 | $ | 41,597 | ||||
________________
|
|
(1)
|
This
amount represents Whiting’s 15.8% interest in the net proceeds due from
the Trust and is included within Accounts Receivable Trade, Net in the
Company’s consolidated balance
sheets.
|
|
|
(2)
|
This
amount represents net proceeds from the Trust’s underlying properties as
well as realized cash settlements on Trust derivatives, that the Company
has received between the last Trust distribution date and December 31,
2009, but which the Company has not yet distributed to the Trust as of
December 31, 2009. Due to ongoing processing of Trust revenues
and expenses after December 31, 2009, the amount of Whiting’s next
scheduled distribution to the Trust, and the related distribution by the
Trust to its unit holders, will differ from this amount. This
amount is included within Accounts Payable in the Company’s consolidated
balance sheet.
|
For the
year ended December 31, 2009, Whiting paid $38.2 million, net of state tax
withholdings, in unit distributions to the Trust and received $5.9 million in
distributions back from the Trust pursuant to its retained ownership in
2,186,389 Trust units.
Tax Sharing
Liability—Prior to Whiting’s initial public offering in November 2003, it
was a wholly-owned indirect subsidiary of Alliant Energy Corporation (“Alliant
Energy”), a holding company whose primary businesses are utility
companies. When the transactions discussed below were entered into,
Alliant Energy was a related party of the Company. As of December 31,
2004 and thereafter, Alliant Energy was no longer a related party.
In
connection with Whiting’s initial public offering in November 2003, the Company
entered into a Tax Separation and Indemnification Agreement with Alliant
Energy. Pursuant to this agreement, the Company and Alliant Energy
made a tax election with the effect that the tax bases of Whiting’s assets were
increased to their deemed purchase price immediately prior to such initial
public offering. Whiting has adjusted deferred taxes on its balance
sheet to reflect the new tax bases of its assets. The additional
bases are expected to result in increased future income tax deductions and,
accordingly, may reduce income taxes otherwise payable by Whiting.
Under
this agreement, the Company has agreed to pay to Alliant Energy 90% of the
future tax benefits the Company realizes annually as a result of this step-up in
tax basis for the years ending on or prior to December 31, 2013. Such
tax benefits will generally be calculated by comparing the Company’s actual
taxes to the taxes that would have been owed by the Company had the increase in
basis not occurred. In 2014, Whiting will be obligated to pay Alliant
Energy the present value of the remaining tax benefits, assuming all such tax
benefits will be realized in future years. The Company has estimated
total payments to Alliant will approximate $30.6 million on an undiscounted
basis.
During
2009, 2008 and 2007, the Company made payments of $2.7 million, $3.2 million and
$3.0 million, respectively, under this agreement and recognized interest expense
of $1.6 million, $1.3 million and $1.5 million, respectively. The
Company’s estimated payment of $1.9 million to be made in 2010 under this
agreement is reflected as a current liability at December 31, 2009.
The Tax
Separation and Indemnification Agreement provides that if tax rates were to
increase or decrease, the resulting tax benefit or detriment would cause a
corresponding adjustment of the tax sharing liability. For purposes
of this calculation, management has assumed that no such future changes will
occur during the term of this agreement.
The
Company periodically evaluates its estimates and assumptions as to future
payments to be made under this agreement. If non-substantial changes
(less than 10% on a present value basis) are made to the anticipated payments
owed to Alliant Energy, a new effective interest rate is determined for this
debt based on the carrying amount of the liability as of the modification date
and based on the revised payment schedule. However, if there are
substantial changes to the estimated payments owed under this agreement, then a
gain or loss is recognized in the consolidated statements of income during the
period in which the modification has been made.
Alliant Energy
Guarantee—The Company holds a 6% working interest in three offshore
platforms in California and the related onshore plant and
equipment. Alliant Energy has guaranteed the Company’s obligation in
the abandonment of these assets.
|
12.
|
COMMITMENTS
AND CONTINGENCIES
|
Non-cancelable
Leases—The Company leases 107,400 square feet of administrative office
space in Denver, Colorado under an operating lease arrangement through 2013 and
an additional 46,700 square feet of office space in Midland, Texas until
2012. Rental expense for 2009, 2008 and 2007 amounted to $3.0
million, $2.2 million and $2.1 million, respectively. Minimum lease
payments under the terms of non-cancelable operating leases as of December 31,
2009 are as follows (in thousands):
|
2010
|
$ | 2,677 | ||
|
2011
|
3,383 | |||
|
2012
|
2,931 | |||
|
2013
|
2,382 | |||
|
Total
|
$ | 11,373 |
Purchase
Contracts—The Company has entered into two take-or-pay purchase
agreements, one agreement expiring in March 2014 and one agreement expiring in
December 2014, whereby the Company has committed to buy certain volumes of
CO2 for a fixed fee subject
to annual escalation. The purchase agreements are with different
suppliers, and the CO2 is
for use in the Company’s enhanced recovery projects in Oklahoma and
Texas. Under the terms of the agreements, the Company is obligated to
purchase a minimum daily volume of CO2 (as calculated on an annual
basis) or else pay for any deficiencies at the price in effect when delivery was
to have occurred. The CO2 volumes planned for use in the
Company’s enhanced recovery projects currently exceed the minimum daily volumes
provided in these take-or-pay purchase agreements. Therefore, the
Company expects to avoid any payments for deficiencies. As of
December 31, 2009, future commitments under the purchase agreements amounted to
$156.8 million through 2014.
Drilling
Contracts—The Company currently has six drilling rigs under long-term
contract, of which three drilling rigs expire in 2010, one in 2011, one in 2012
and one in 2013. All of these rigs are operating in the Rocky
Mountains region. As of December 31, 2009, early termination of the
remaining contracts would require termination penalties of $49.1 million, which
would be in lieu of paying the remaining drilling commitments of $76.7
million. Other drilling rigs working for the Company are not under
long-term contracts but instead are under contracts that can be terminated at
the end of the well that is currently being drilled.
Litigation—The
Company is subject to litigation, claims and governmental and regulatory
proceedings arising in the ordinary course of business. It is the
opinion of the Company’s management that all claims and litigation involving the
Company are not likely to have a material adverse effect on its consolidated
financial position, cash flows or results of operations.
|
13.
|
SUBSEQUENT
EVENT
|
The
Company has evaluated subsequent events through the date that these financial
statements were issued. The following information is disclosed as a
nonrecognized subsequent event:
On
February 15, 2010, the Company declared a dividend of $1.5625 per share on its
6.25% convertible perpetual preferred stock. The dividend is payable
on March 15, 2010 to holders of record on March 1, 2010.
|
14.
|
OIL
AND GAS ACTIVITIES
|
The
Company’s oil and gas activities for 2009, 2008 and 2007 were entirely within
the United States. Costs incurred in oil and gas producing activities
were as follows (in thousands):
|
Year
Ended December 31,
|
||||||||||||
|
2009
|
2008
|
2007
|
||||||||||
|
Development
|
$ | 436,721 | $ | 914,616 | $ | 506,057 | ||||||
|
Proved
property acquisition
|
78,800 | 294,056 | 8,128 | |||||||||
|
Unproved
property acquisition
|
12,872 | 98,841 | 13,598 | |||||||||
|
Exploration
|
50,970 | 42,621 | 56,741 | |||||||||
|
Total
|
$ | 579,363 | $ | 1,350,134 | $ | 584,524 | ||||||
During
2009, 2008 and 2007, additions to oil and gas properties of $0.5 million, $3.5
million and $1.5 million were recorded for the estimated costs of future
abandonment related to new wells drilled or acquired.
Net
capitalized costs related to the Company’s oil and gas producing activities were
as follows (in thousands):
|
Year
Ended December 31,
|
||||||||
|
2009
|
2008
|
|||||||
|
Proved
oil and gas properties
|
$ | 4,870,688 | $ | 4,423,197 | ||||
|
Unproved
oil and gas properties
|
100,706 | 106,436 | ||||||
|
Accumulated
depreciation, depletion and amortization
|
(1,258,141 | ) | (873,233 | ) | ||||
|
Oil
and gas properties, net
|
$ | 3,713,253 | $ | 3,656,400 | ||||
Exploratory
well costs that are incurred and expensed in the same annual period have not
been included in the table below. The net changes in capitalized
exploratory well costs were as follows (in thousands):
|
Year
Ended December 31,
|
||||||||||||
|
2009
|
2008
|
2007
|
||||||||||
|
Beginning
balance at January 1
|
$ | - | $ | 525 | $ | 10,194 | ||||||
|
Additions
to capitalized exploratory well costs pending the determination of proved
reserves
|
4,095 | 12,794 | 19,203 | |||||||||
|
Reclassifications
to wells, facilities and equipment based on the determination of
proved reserves
|
(4,095 | ) | (13,319 | ) | (28,872 | ) | ||||||
|
Capitalized
exploratory well costs charged to expense
|
- | - | - | |||||||||
|
Ending
balance at December 31
|
$ | - | $ | - | $ | 525 | ||||||
At
December 31, 2009, the Company had no costs capitalized for exploratory wells in
progress for a period of greater than one year after the completion of
drilling.
|
15.
|
DISCLOSURES
ABOUT OIL AND GAS PRODUCING ACTIVITIES
(UNAUDITED)
|
For all
years presented, the estimates of proved reserves and related valuations were
based 100% on reports prepared by the Company’s independent petroleum
engineers. The estimates of proved reserves and related valuations as
of December 31, 2009 were based on reports prepared by Cawley, Gillespie &
Associates, Inc., the Company’s independent petroleum
engineers. Proved reserve estimates included herein conform to the
definitions prescribed by the U.S. Securities and Exchange
Commission. The estimates of proved reserves are inherently imprecise
and are continually subject to revision based on production history, results of
additional exploration and development, price changes and other
factors.
As of
December 31, 2009, all of the Company’s oil and gas reserves are attributable to
properties within the United States. A summary of the Company’s
changes in quantities of proved oil and gas reserves for the years ended
December 31, 2007, 2008 and 2009, are as follows:
|
Oil
(MBbl)
|
Natural
Gas
(MMcf)
|
Total
(MBOE)
|
||||||||||
|
Balance—January
1, 2007
|
195,035 | 318,873 | 248,180 | |||||||||
|
Extensions
and discoveries
|
10,973 | 40,936 | 17,795 | |||||||||
|
Sales
of minerals in place
|
(1,194 | ) | (10,382 | ) | (2,924 | ) | ||||||
|
Purchases
of minerals in place
|
691 | - | 691 | |||||||||
|
Production
|
(9,579 | ) | (30,764 | ) | (14,706 | ) | ||||||
|
Revisions
to previous estimates
|
392 | 8,079 | 1,739 | |||||||||
|
Balance—December
31, 2007
|
196,318 | 326,742 | 250,775 | |||||||||
|
Extensions
and discoveries
|
20,395 | 57,093 | 29,911 | |||||||||
|
Sales
of minerals in place
|
(3,919 | ) | (14,277 | ) | (6,299 | ) | ||||||
|
Purchases
of minerals in place
|
513 | 90,329 | 15,568 | |||||||||
|
Production
|
(12,448 | ) | (30,419 | ) | (17,518 | ) | ||||||
|
Revisions
to previous estimates
|
(20,851 | ) | (74,689 | ) | (33,299 | ) | ||||||
|
Balance—December
31, 2008
|
180,008 | 354,779 | 239,138 | |||||||||
|
Extensions
and discoveries
|
25,115 | 41,969 | 32,110 | |||||||||
|
Sales
of minerals in place
|
(2,689 | ) | (1,559 | ) | (2,949 | ) | ||||||
|
Purchases
of minerals in place
|
3,177 | 4,155 | 3,870 | |||||||||
|
Production
|
(15,381 | ) | (29,333 | ) | (20,270 | ) | ||||||
|
Revisions
to previous estimates
|
33,566 | (62,618 | ) | 23,130 | ||||||||
|
Balance—December
31, 2009
|
223,796 | 307,393 | 275,029 | |||||||||
|
Proved
developed reserves:
|
||||||||||||
|
December
31, 2006
|
122,496 | 226,516 | 160,249 | |||||||||
|
December
31, 2007
|
127,291 | 237,030 | 166,796 | |||||||||
|
December
31, 2008
|
120,961 | 229,224 | 159,165 | |||||||||
|
December
31, 2009
|
144,813 | 178,782 | 174,610 | |||||||||
|
Proved
undeveloped reserves:
|
||||||||||||
|
December
31, 2006
|
72,539 | 92,357 | 87,932 | |||||||||
|
December
31, 2007
|
69,027 | 89,712 | 83,979 | |||||||||
|
December
31, 2008
|
59,047 | 125,555 | 79,973 | |||||||||
|
December
31, 2009
|
78,983 | 128,611 | 100,418 | |||||||||
Notable
changes in proved reserves for the year ended December 31, 2009
included:
|
·
|
Revisions
to previous estimates. In 2009, revisions to previous estimates
increased proved developed and undeveloped reserves by a net amount of
23.1 MMBOE. Included in these revisions were (i) 17.3 MMBOE of
net upward adjustments caused by higher crude oil prices incorporated into
the Company’s reserve estimates at December 31, 2009 as compared to
December 31, 2008 that were partially offset by lower natural gas prices
as of December 31, 2009, and (ii) 5.8 MMBOE of net upward adjustments
attributable to reservoir analysis and well performance. The
liquids component of the 5.8 MMBOE revision consisted of a 14.8 MMBOE
increase that was primarily related to North Ward Estes, where additional
field areas are now planned for CO2 injection and where the
total amount of CO2
planned for injection into previously identified flood pattern areas has
been increased. The gas component of the 5.8 MMBOE revision
consisted of a 9.0 MMBOE decrease that was primarily related to the
Sulphur Creek field, where reserve assignments for proved developed
producing as well as proved undeveloped well locations were adjusted
downward to reflect the current performance of producing
wells.
|
|
·
|
Extensions
and discoveries. In 2009, total extensions and discoveries of
32.1 MMBOE were primarily attributable to successful drilling in the
Sanish and Parshall fields and related proved undeveloped well locations
added during the year, which in turn extended the proved acreage in those
areas.
|
Notable
changes in proved reserves for the year ended December 31, 2008
included:
|
·
|
Revisions
to previous estimates. In 2008, negative revisions to previous
estimates decreased proved reserve quantities by a net amount of 33.3
MMBOE. Included in these revisions were 39.0 MMBOE of negative
adjustments caused by lower commodity prices at December 31, 2008 as
compared to December 31, 2007, and 5.7 MMBOE of net positive adjustments
primarily due to production performance and updated technical evaluations
at Whiting’s CO2
enhanced recovery projects.
|
|
·
|
Extensions
and discoveries. In 2008, total extensions and discoveries of
29.9 MMBOE resulted from successful drilling primarily in the Sanish,
Sulphur Creek, and Parshall fields that extended the proved acreage in
those fields.
|
As
discussed in Deferred Compensation, all of the Company’s employees participate
in the Company’s Production Participation Plan (“Plan”). The reserve
disclosures above include oil and natural gas reserve volumes that have been
allocated to the Plan. Once allocated to Plan participants, the
interests are fixed. Allocations prior to 1995 consisted of 2%–3%
overriding royalty interest, while allocations since 1995 have been 2%–5% of oil
and gas sales less lease operating expenses and production taxes from the
production allocated to the Plan.
The
standardized measure of discounted future net cash flows relating to proved oil
and gas reserves and the changes in standardized measure of discounted future
net cash flows relating to proved oil and natural gas reserves were prepared in
accordance with the provisions of SFAS No. 69, as codified in FASB ASC topic
Extractive
Activities—Oil and
Gas. Future cash inflows as of December 31, 2009 were computed
by applying average fiscal-year prices (calculated as the unweighted arithmetic
average of the first-day-of-the-month price for each month within the 12-month
period ended December 31, 2009) to estimated future
production. Future cash inflows as of December 31, 2008 and 2007,
however, were computed by applying prices at year end to estimated future
production. Future production and development costs are computed by
estimating the expenditures to be incurred in developing and producing the
proved oil and natural gas reserves at year end, based on year-end costs and
assuming the continuation of existing economic conditions.
Future
income tax expenses are calculated by applying appropriate year-end tax rates to
future pretax net cash flows relating to proved oil and natural gas reserves,
less the tax basis of properties involved. Future income tax expenses
give effect to permanent differences, tax credits and loss carryforwards
relating to the proved oil and natural gas reserves. Future net cash
flows are discounted at a rate of 10% annually to derive the standardized
measure of discounted future net cash flows. This calculation does
not necessarily result in an estimate of the fair value of the Company’s oil and
gas properties.
The
standardized measure of discounted future net cash flows relating to proved oil
and natural gas reserves is as follows (in thousands):
|
December
31,
|
||||||||||||
|
2009
|
2008
|
2007
|
||||||||||
|
Future
cash flows
|
$ | 13,077,148 | $ | 8,558,178 | $ | 19,747,430 | ||||||
|
Future
production costs
|
(5,668,889 | ) | (4,220,329 | ) | (6,022,667 | ) | ||||||
|
Future
development costs
|
(1,405,734 | ) | (982,193 | ) | (1,186,826 | ) | ||||||
|
Future
income tax expense
|
(1,292,719 | ) | (474,332 | ) | (3,952,146 | ) | ||||||
|
Future
net cash flows
|
4,709,806 | 2,881,324 | 8,585,791 | |||||||||
|
10%
annual discount for estimated timing of cash flows
|
(2,366,264 | ) | (1,504,876 | ) | (4,574,125 | ) | ||||||
|
Standardized
measure of discounted future net cash flows
|
$ | 2,343,542 | $ | 1,376,448 | $ | 4,011,666 | ||||||
Future
cash flows as shown above are reported without consideration for the effects of
open hedge contracts at each period end. If the effects of hedging
transactions were included in the computation, then undiscounted future cash
flows would have increased by $24.6 million in 2009, increased by $345.9 million
in 2008 and decreased by $81.8 million in 2007.
The
changes in the standardized measure of discounted future net cash flows relating
to proved oil and natural gas reserves are as follows (in
thousands):
|
December
31,
|
||||||||||||
|
2009
|
2008
|
2007
|
||||||||||
|
Beginning
of year
|
$ | 1,376,448 | $ | 4,011,665 | $ | 2,392,242 | ||||||
|
Sale
of oil and gas produced, net of production costs
|
(615,597 | ) | (987,682 | ) | (547,744 | ) | ||||||
|
Sales
of minerals in place
|
(40,673 | ) | (54,735 | ) | (72,360 | ) | ||||||
|
Net
changes in prices and production costs
|
1,233,813 | (4,059,904 | ) | 2,261,006 | ||||||||
|
Extensions,
discoveries and improved recoveries
|
442,879 | 259,930 | 440,337 | |||||||||
|
Previously
estimated development costs incurred during the period
|
260,350 | 263,491 | 247,789 | |||||||||
|
Changes
in estimated future development costs
|
(452,480 | ) | (154,569 | ) | (251,819 | ) | ||||||
|
Purchases
of mineral in place
|
53,372 | 135,288 | 17,098 | |||||||||
|
Revisions
of previous quantity estimates
|
319,028 | (289,381 | ) | 43,019 | ||||||||
|
Net
change in income taxes
|
(371,243 | ) | 1,851,178 | (757,127 | ) | |||||||
|
Accretion
of discount
|
137,645 | 401,167 | 239,224 | |||||||||
|
End
of year
|
$ | 2,343,542 | $ | 1,376,448 | $ | 4,011,665 | ||||||
Future
net revenues included in the standardized measure of discounted future net cash
flows relating to proved oil and natural gas reserves incorporate calculated
weighted average sales prices (inclusive of adjustments for quality and
location) in effect at December 31, 2009, 2008 and 2007 as follows:
|
2009
|
2008
|
2007
|
||||||||||
|
Oil
(per Bbl)
|
$ | 52.19 | $ | 38.51 | $ | 88.62 | ||||||
|
Natural
Gas (per Mcf)
|
$ | 3.77 | $ | 4.58 | $ | 6.31 | ||||||
|
16.
|
QUARTERLY
FINANCIAL DATA (UNAUDITED)
|
The
following is a summary of the unaudited quarterly financial data for the years
ended December 31, 2009 and 2008 (in thousands, except per share
data):
|
Three
Months Ended
|
||||||||||||||||
|
March
31,
2009
|
June
30,
2009
|
September
30,
2009
|
December
31,
2009
|
|||||||||||||
|
Year ended December 31,
2009:
|
||||||||||||||||
|
Oil
and natural gas sales
|
$ | 146,175 | $ | 214,303 | $ | 256,074 | $ | 300,989 | ||||||||
|
Operating
profit (loss) (1)
|
(24,332 | ) | 41,492 | 77,202 | 126,445 | |||||||||||
|
Net
income (loss)
|
(43,759 | ) | (93,163 | ) | 30,944 | (11,206 | ) | |||||||||
|
Basic
earnings (loss) per share
|
(0.92 | ) | (1.83 | ) | 0.59 | (0.24 | ) | |||||||||
|
Diluted
earnings (loss) per share
|
(0.92 | ) | (1.83 | ) | 0.59 | (0.24 | ) | |||||||||
|
Three
Months Ended
|
||||||||||||||||
|
March
31,
2008
|
June
30,
2008
|
September
30,
2008
|
December
31,
2008
|
|||||||||||||
|
Year ended December 31,
2008:
|
||||||||||||||||
|
Oil
and natural gas sales
|
$ | 286,731 | $ | 390,536 | $ | 425,392 | $ | 213,821 | ||||||||
|
Operating
profit (1)
|
162,828 | 252,198 | 258,224 | 36,986 | ||||||||||||
|
Net
income
|
62,314 | 80,449 | 112,417 | (3,037 | ) | |||||||||||
|
Basic
earnings (loss) per share
|
1.47 | 1.90 | 2.66 | (0.07 | ) | |||||||||||
|
Diluted
earnings (loss) per share
|
1.47 | 1.90 | 2.65 | (0.07 | ) | |||||||||||
(1) Oil
and natural gas sales less lease operating expense, production taxes and
depreciation, depletion and amortization.
******
|
Item 9.
|
Changes in and Disagreements with Accountants on
Accounting and Financial
Disclosure
|
None.
|
Item 9A.
|
Controls and
Procedures
|
Evaluation of disclosure controls
and procedures. In accordance with Rule 13a-15(b) of the
Securities Exchange Act of 1934 (the “Exchange Act”), our management evaluated,
with the participation of our Chairman, President and Chief Executive Officer
and our Chief Financial Officer, the effectiveness of the design and operation
of our disclosure controls and procedures (as defined in Rule 13a-15(e) under
the Exchange Act) as of the end of the year ended December 31,
2009. Based upon their evaluation of these disclosures controls and
procedures, the Chairman, President and Chief Executive Officer and the Chief
Financial Officer concluded that the disclosure controls and procedures were
effective as of the end of the year ended December 31, 2009 to ensure that
information required to be disclosed by us in the reports that we file or submit
under the Exchange Act is recorded, processed, summarized and reported within
the time periods specified in the rules and forms of the Securities and Exchange
Commission, and to ensure that information required to be disclosed by us in the
reports we file or submit under the Exchange Act is accumulated and communicated
to our management, including our principal executive and principal financial
officers, as appropriate, to allow timely decisions regarding required
disclosure.
Management’s Annual Report on
Internal Control Over Financial Reporting. The report of
management required under this Item 9A is contained in Item 8 of this Annual
Report on Form 10-K under the caption “Management’s Annual Report on Internal
Control Over Financial Reporting”.
Attestation Report of Registered
Public Accounting Firm. The attestation report required under
this Item 9A is contained in Item 8 of this Annual Report on Form 10-K under the
caption “Report of Independent Registered Public Accounting Firm”.
Changes in internal control over
financial reporting. There was no change in our internal
control over financial reporting that occurred during the quarter ended December
31, 2009 that has materially affected, or is reasonably likely to materially
affect, our internal control over financial reporting.
|
Item 9B.
|
Other
Information
|
None.
PART
III
|
Item 10.
|
Directors, Executive Officers and Corporate
Governance
|
The
information included under the captions “Election of Directors,” “Board of
Directors and Corporate Governance” and “Section 16(a) Beneficial Ownership
Reporting Compliance” in our definitive Proxy Statement for Whiting Petroleum
Corporation’s 2010 Annual Meeting of Stockholders (the “Proxy Statement”) is
hereby incorporated herein by reference. Information with respect to
our executive officers appears in Part I of this Annual Report on
Form 10-K.
We have
adopted the Whiting Petroleum Corporation Code of Business Conduct and Ethics
that applies to our directors, our Chairman, President and Chief Executive
Officer, our Chief Financial Officer, our Controller and Treasurer and other
persons performing similar functions. We have posted a copy of the
Whiting Petroleum Corporation Code of Business Conduct and Ethics on our website
at www.whiting.com. The
Whiting Petroleum Corporation Code of Business Conduct and Ethics is also
available in print to any stockholder who requests it in writing from the
Corporate Secretary of Whiting Petroleum Corporation. We intend to
satisfy the disclosure requirements under Item 5.05 of Form 8-K
regarding amendments to, or waivers from, the Whiting Petroleum Corporation Code
of Business Conduct and Ethics by posting such information on our website at
www.whiting.com.
We are
not including the information contained on our website as part of, or
incorporating it by reference into, this report.
|
Item 11.
|
Executive
Compensation
|
The
information required by this Item is included under the captions “Board of
Directors and Corporate Governance – Compensation Committee Interlocks and
Insider Participation,” “Board of Directors and Corporate Governance – Director
Compensation,” “Compensation Discussion and Analysis,” “Compensation Committee
Report” and “Executive Compensation” in the Proxy Statement and is hereby
incorporated herein by reference.
|
Item 12.
|
Security Ownership of Certain Beneficial Owners
and Management and Related Stockholder
Matters
|
The
information required by this Item with respect to security ownership of certain
beneficial owners and management is included under the caption “Principal
Stockholders” in the Proxy Statement and is hereby incorporated by
reference. The following table sets forth information with respect to
compensation plans under which equity securities of Whiting Petroleum
Corporation are authorized for issuance as of December 31,
2009.
Equity
Compensation Plan Information
|
Plan
Category
|
Number
of securities to be issued upon exercise of outstanding options, warrants
and rights
|
Weighted-average
exercise price of outstanding options, warrants and
rights
|
Number
of securities remaining available for future issuance under equity
compensation plans (excluding securities reflected in the first
column)
|
|||||||||
|
Equity
compensation plans approved by security holders(1)
|
120,607 | $ | 25.51 | 937,509 | (2) | |||||||
|
Equity
compensation plans not approved by security holders
|
- | N/A | - | |||||||||
|
Total
|
120,607 | $ | 25.51 | 937,509 | (2) | |||||||
|
|
_____________
|
|
(1)
|
Includes
only the Whiting Petroleum Corporation 2003 Equity Incentive
Plan.
|
|
(2)
|
Excludes
518,264 shares of restricted common stock previously issued for which the
restrictions have not lapsed.
|
|
Item 13.
|
Certain Relationships, Related Transactions and
Director Independence
|
The
information required by this Item is included under the caption “Board of
Directors and Corporate Governance – Transactions with Related Persons” and
“Board of Directors and Corporate Governance – Independence of Directors” in the
Proxy Statement and is hereby incorporated by reference.
|
Item 14.
|
Principal Accounting Fees and
Services
|
The
information required by this Item is included under the caption “Ratification of
Appointment of Independent Registered Public Accounting Firm” in the Proxy
Statement and is hereby incorporated by reference.
PART
IV
|
Item 15.
|
Exhibits, Financial Statement
Schedules
|
|
(a)
|
1.
|
Financial
statements – The following financial statements and the report of
independent registered public accounting firm are contained in Item
8.
|
|
|
a.
|
Report
of Independent Registered Public Accounting
Firm
|
|
|
b.
|
Consolidated
Balance Sheets as of December 31, 2009 and
2008
|
|
|
c.
|
Consolidated
Statements of Income for the Years ended December 31, 2009, 2008 and
2007
|
|
|
d.
|
Consolidated
Statements of Cash Flows for the Years ended December 31, 2009, 2008
and 2007
|
|
|
e.
|
Consolidated
Statements of Stockholders’ Equity and Comprehensive Income for the Years
ended December 31, 2009, 2008 and
2007
|
|
|
f.
|
Notes
to Consolidated Financial
Statements
|
|
|
2.
|
Financial
statement schedules – The following financial statement schedule is filed
as part of this Annual Report on Form
10-K:
|
|
|
a.
|
Schedule
I – Condensed Financial Information of
Registrant
|
All other
schedules are omitted since the required information is not present, or is not
present in amounts sufficient to require submission of the schedule, or because
the information required is included in the consolidated financial statements or
the notes thereto.
|
|
3.
|
Exhibits
– The exhibits listed in the accompanying index to exhibits are filed as
part of this Annual Report on Form
10-K.
|
|
(b)
|
Exhibits
|
|
|
The
exhibits listed in the accompanying exhibit index are filed (except where
otherwise indicated) as part of this
report.
|
|
(c)
|
Financial
Statement Schedules.
|
SCHEDULE I
- CONDENSED FINANCIAL INFORMATION OF REGISTRANT
WHITING
PETROLEUM CORPORATION
CONDENSED
FINANCIAL STATEMENTS OF THE PARENT COMPANY
CONDENSED
BALANCE SHEETS
(In
thousands)
|
December
31,
|
||||||||
|
2009
|
2008
|
|||||||
|
ASSETS
|
||||||||
|
Current
assets
|
$ | 1,216 | $ | 2,859 | ||||
|
Investment
in subsidiaries
|
1,080,146 | 1,187,019 | ||||||
|
Intercompany
receivable
|
1,814,787 | 1,249,869 | ||||||
|
Total
assets
|
$ | 2,896,149 | $ | 2,439,747 | ||||
|
LIABILITIES
AND STOCKHOLDERS’ EQUITY
|
||||||||
|
Current
liabilities
|
$ | 6,849 | $ | 8,292 | ||||
|
Long-term
debt
|
618,585 | 618,061 | ||||||
|
Other
long-term liabilities
|
21,043 | 21,874 | ||||||
|
Stockholders’
equity
|
2,249,672 | 1,791,520 | ||||||
|
Total
liabilities and stockholders’ equity
|
$ | 2,896,149 | $ | 2,439,747 | ||||
CONDENSED
STATEMENTS OF OPERATIONS
(In
thousands)
|
Year
Ended December 31,
|
||||||||||||
|
2009
|
2008
|
2007
|
||||||||||
| Operating expenses: | ||||||||||||
| General and administrative | $ | (6,659 | ) | $ | (3,619 | ) | $ | (4,290 | ) | |||
|
Interest
expense
|
(2,139 | ) | (1,830 | ) | (2,112 | ) | ||||||
|
Equity
in earnings (losses) of subsidiaries
|
(101,107 | ) | 255,504 | 134,636 | ||||||||
|
Income
(loss) before income taxes
|
(109,905 | ) | 250,055 | 128,234 | ||||||||
|
Income
tax benefit
|
3,023 | 2,088 | 2,366 | |||||||||
|
Net
income (loss)
|
$ | (106,882 | ) | $ | 252,143 | $ | 130,600 | |||||
|
See
notes to condensed financial statements.
|
||||||||||||
Schedule
I
WHITING
PETROLEUM CORPORATION
CONDENSED
FINANCIAL STATEMENTS OF THE PARENT COMPANY
CONDENSED
STATEMENTS OF CASH FLOWS
(In
thousands)
|
Year
Ended December 31,
|
||||||||||||
|
2009
|
2008
|
2007
|
||||||||||
|
Cash
flows provided by operating activities
|
$ | 2,961 | $ | 8,883 | $ | 4,633 | ||||||
|
Cash
flows from investing activities
|
||||||||||||
|
Investment
in subsidiaries
|
- | - | - | |||||||||
|
Cash
flows from financing activities:
|
||||||||||||
|
Intercompany
receivable
|
(260 | ) | (5,647 | ) | (1,659 | ) | ||||||
|
Other
financing activities
|
(2,701 | ) | (3,236 | ) | (2,974 | ) | ||||||
|
Net
cash used in financing activities
|
(2,961 | ) | (8,883 | ) | (4,633 | ) | ||||||
|
Net
change in cash and cash equivalents
|
- | - | - | |||||||||
|
Cash
and cash equivalents:
|
||||||||||||
|
Beginning
of period
|
- | - | - | |||||||||
|
End
of period
|
$ | - | $ | - | $ | - | ||||||
|
NONCASH
INVESTING ACTIVITES:
|
||||||||||||
|
Conveyance
to Whiting USA Trust I increasing investment in
subsidiaries
|
$ | - | $ | 111,223 | $ | - | ||||||
|
Sale
of Whiting USA Trust I units decreasing investment in
subsidiaries
|
$ | - | $ | (93,683 | ) | $ | - | |||||
|
Distributions
from Whiting USA Trust I decreasing investment in
subsidiaries
|
$ | (5,766 | ) | $ | (5,212 | ) | $ | - | ||||
|
NONCASH
FINANCING ACTIVITES:
|
||||||||||||
|
Issuance
of preferred stock increasing stockholders’ equity
|
$ | 334,112 | $ | - | $ | - | ||||||
|
Issuance
of preferred stock increasing intercompany receivable
|
$ | (334,112 | ) | $ | - | $ | - | |||||
|
Issuance
of common stock increasing stockholders’ equity
|
$ | 234,753 | $ | - | $ | 210,394 | ||||||
|
Issuance
of common stock increasing intercompany receivable
|
$ | (234,753 | ) | $ | - | $ | (210,394 | ) | ||||
|
Preferred
stock dividends paid decreasing stockholders’ equity
|
$ | (10,302 | ) | $ | - | $ | - | |||||
|
Preferred
stock dividends paid decreasing intercompany receivable
|
$ | 10,302 | $ | - | $ | - | ||||||
|
Distributions
from Whiting USA Trust I increasing intercompany
receivable
|
$ | 5,766 | $ | 5,212 | $ | - | ||||||
|
Conveyance
to Whiting USA Trust I decreasing intercompany receivable
|
$ | - | $ | (111,223 | ) | $ | - | |||||
|
Sale
of Whiting USA Trust I units increasing intercompany
receivable
|
$ | - | $ | 93,683 | $ | - | ||||||
|
See
notes to condensed financial statements.
|
||||||||||||
WHITING
PETROLEUM CORPORATION
NOTES
TO CONDENSED FINANCIAL STATEMENTS OF THE PARENT COMPANY
|
1.
|
BASIS
OF PRESENTATION
|
Condensed
Financial Statements—The condensed financial statements of Whiting
Petroleum Corporation (the “Registrant” or “Parent Company”) do not include all
of the information and notes normally included with financial statements
prepared in accordance with GAAP. These condensed financial
statements, therefore, should be read in conjunction with the consolidated
financial statements and notes thereto of the Registrant, included elsewhere in
this 2009 Annual Report on Form 10-K. For purposes of these condensed
financial statements, the Parent Company’s investments in wholly-owned
subsidiaries are accounted for under the equity method.
Restricted Assets
of Registrant—Except for limited exceptions, including the payment of
interest on the senior notes, Whiting Oil and Gas Corporation’s (“Whiting Oil
and Gas”) credit agreement restricts the ability of the subsidiaries to make any
dividends, distributions or other payments to the Parent Company. The
restrictions apply to all of the net assets of the
subsidiaries. Accordingly, these condensed financial statements have
been prepared pursuant to Rule 5-04 of Regulation S-X of the Securities Exchange
Act of 1934, as amended.
|
2.
|
LONG-TERM
DEBT AND OTHER LONG-TERM
LIABILITIES
|
The
Parent Company’s long-term debt and other long-term liabilities consisted of the
following at December 31, 2009 and 2008 (in thousands):
|
December
31,
|
||||||||
|
2009
|
2008
|
|||||||
|
Long-term
debt:
|
||||||||
|
7%
Senior Subordinated Notes due 2014
|
$ | 250,000 | $ | 250,000 | ||||
|
7.25%
Senior Subordinated Notes due 2013, net of unamortized debt discount of
$1,147 and $1,541, respectively
|
218,853 | 218,459 | ||||||
|
7.25%
Senior Subordinated Notes due 2012, net of unamortized debt discount of
$268 and $398, respectively
|
149,732 | 149,602 | ||||||
|
Other
long-term liabilities:
|
||||||||
|
Tax
sharing liability
|
20,744 | 21,575 | ||||||
|
Other
|
299 | 299 | ||||||
|
Total
long-term debt and other long-term liabilities
|
$ | 639,628 | $ | 639,935 | ||||
Scheduled
maturities of the Parent Company’s long-term debt and other long-term
liabilities as of December 31, 2009, were as follows (in
thousands):
|
2010
|
2011
|
2012
|
2013
|
2014
|
Thereafter
|
Total
|
|
$ 1,857
|
$
1,728
|
$
151,592
|
$
221,488
|
$
265,936
|
$
299
|
$
642,900
|
For
further information on the Senior Subordinated Notes and tax sharing liability,
refer to the Long-Term Debt and Related Party Transactions notes to the
consolidated financial statements of the Registrant.
|
3.
|
STOCKHOLDERS’
EQUITY
|
6.25% Convertible
Perpetual Preferred Stock Offering—In June 2009, the Parent Company
completed a public offering of 6.25% convertible perpetual preferred stock,
selling 3,450,000 shares at a price of $100.00 per share and providing net
proceeds of $334.1 million after underwriters’ fees and offering expenses.
The net proceeds were used to repay a portion of the debt outstanding
under Whiting Oil and Gas’ credit agreement.
Common Stock
Offering—In February 2009, the Parent Company completed a public offering
of its common stock, selling 8,450,000 shares of common stock at a price of
$29.00 per share and providing net proceeds of $234.8 million after
underwriters’ fees and offering expenses. The net proceeds were used to
repay a portion of the debt outstanding under Whiting Oil and Gas’ credit
agreement.
For
further information on the convertible perpetual preferred stock offering and
the common stock offering, refer to the Stockholders’ Equity note to the
consolidated financial statements of the Registrant.
|
4.
|
WHITING
USA TRUST I
|
On April
30, 2008, the Parent Company completed an initial public offering of units of
beneficial interest in Whiting USA Trust I (the “Trust”), selling
11,677,500 Trust units at $20.00 per Trust unit, and providing net proceeds of
$193.7 million after underwriters’ fees, offering expenses and post-close
adjustments. The Parent Company used the offering net proceeds to
repay a portion of the debt outstanding under Whiting Oil and Gas’ credit
agreement. Immediately prior to the closing of the offering, Whiting
Oil and Gas conveyed a term net profits interest in certain of its oil and
natural gas properties to the Trust in exchange for 13,863,889 Trust units,
which Trust units were in turn transferred from Whiting Oil and Gas to the
Parent Company. The Parent Company retained 15.8%, or 2,186,389 Trust
units, of the total Trust units issued and outstanding.
The net
profits interest entitles the Trust to receive 90% of the net proceeds from the
sale of oil and natural gas production from the underlying
properties. The net profits interest will terminate at the time when
9.11 MMBOE have been produced and sold from the underlying
properties. This is the equivalent of 8.20 MMBOE in respect of the
Trust’s right to receive 90% of the net proceeds from such production pursuant
to the net profits interest, and these reserve quantities are projected to be
produced by August 31, 2018, based on the reserve report for the underlying
properties as of December 31, 2009. The Trust will soon thereafter
wind up its affairs and terminate.
|
5.
|
SUBSEQUENT
EVENT
|
The
Parent Company has evaluated subsequent events through the date that these
financial statements were issued. The following information is
disclosed as a nonrecognized subsequent event:
On
February 15, 2010, the Parent Company declared a dividend of $1.5625 per share
on its 6.25% convertible perpetual preferred stock. The dividend is
payable on March 15, 2010 to holders of record on March 1, 2010.
******
SIGNATURES
Pursuant
to the requirements of Section 13 or 15(d) of the Securities Exchange Act of
1934, the Registrant has duly caused this report to be signed on its behalf by
the undersigned, thereunto duly authorized, on this 1st day of March,
2010.
|
WHITING
PETROLEUM CORPORATION
|
||
|
By
|
/s/
James J. Volker
|
|
|
James
J. Volker
|
||
|
Chairman,
President and Chief Executive
Officer
|
Pursuant
to the requirements of the Securities Exchange Act of 1934, this report has been
signed below by the following persons on behalf of the Registrant and in the
capacities and on the dates indicated.
|
Signature
|
Title
|
Date
|
|
/s/ James
J.
Volker
James
J. Volker
|
Chairman,
President, Chief
Executive
Officer and Director
(Principal
Executive Officer)
|
March
1, 2010
|
|
/s/
Michael J.
Stevens
Michael
J. Stevens
|
Vice
President and
Chief
Financial Officer
(Principal
Financial Officer)
|
March
1, 2010
|
|
/s/ Brent
P.
Jensen
Brent
P. Jensen
|
Controller
and Treasurer
(Principal
Accounting Officer)
|
March
1, 2010
|
|
/s/
Thomas L.
Aller
Thomas
L. Aller
|
Director
|
March
1, 2010
|
|
/s/ D.
Sherwin
Artus
D.
Sherwin Artus
|
Director
|
March
1, 2010
|
|
/s/
Thomas P.
Briggs
Thomas
P. Briggs
|
Director
|
March
1, 2010
|
|
/s/
William N.
Hahne
William
N. Hahne
|
Director
|
March
1, 2010
|
|
/s/
Graydon D.
Hubbard
Graydon
D. Hubbard
|
Director
|
March
1, 2010
|
|
/s/
Palmer L.
Moe
Palmer
L. Moe
|
Director
|
March
1, 2010
|
EXHIBIT INDEX
|
Exhibit
Number
|
Exhibit Description
|
|
(3.1)
|
Amended
and Restated Certificate of Incorporation of Whiting Petroleum Corporation
[Incorporated by reference to Exhibit 3.1 to Whiting Petroleum
Corporation’s Registration Statement on Form S-1 (Registration No.
333-107341)].
|
|
(3.2)
|
Amended
and Restated By-laws of Whiting Petroleum Corporation [Incorporated by
reference to Exhibit 3.1 to Whiting Petroleum Corporation’s Quarterly
Report on Form 10-Q for the quarter ended September 30, 2008 (File No.
001-31899)].
|
|
(3.3)
|
Certificate
of Designations of the Board of Directors Establishing the Series and
Fixing the Relative Rights and Preferences of Series A Junior
Participating Preferred Stock [Incorporated by reference to Exhibit 3.1 to
Whiting Petroleum Corporation’s Current Report on Form 8-K dated February
23, 2006 (File No. 001-31899)].
|
|
(3.4)
|
Certificate
of Designations of 6.25% Convertible Perpetual Preferred Stock of Whiting
Petroleum Corporation [Incorporated by reference to Exhibit 3.1 to Whiting
Petroleum Corporation’s Current Report on Form 8-K dated June 17, 2009
(File No. 001- 31899)].
|
|
(4.1)
|
Fourth
Amended and Restated Credit Agreement, dated as of April 28, 2009, among
Whiting Petroleum Corporation, Whiting Oil and Gas Corporation, the
lenders party thereto, JPMorgan Chase Bank, N.A., as Administrative Agent,
and the various other agents party thereto [Incorporated by reference to
Exhibit 4 to Whiting Petroleum Corporation’s Current Report on Form 8-K
dated April 28, 2009 (File No. 001-31899)].
|
|
(4.2)
|
First
Amendment to Fourth Amended and Restated Credit Agreement, dated as of
June 15, 2009, among Whiting Petroleum Corporation, Whiting Oil and Gas
Corporation, JPMorgan Chase Bank, N.A., as Administrative Agent, and the
other agents and lenders party thereto [Incorporated by reference to
Exhibit 4.1 to Whiting Petroleum Corporation’s Current Report on Form 8-K
dated June 15, 2009 (File No. 001- 31899)].
|
|
(4.3)
|
Indenture,
dated May 11, 2004, by and among Whiting Petroleum Corporation, Whiting
Oil and Gas Corporation, Whiting Programs, Inc., Equity Oil Company and
The Bank of New York Trust Company, N.A., as successor trustee
[Incorporated by reference to Exhibit 4.1 to Whiting Petroleum
Corporation’s Quarterly Report on Form 10-Q for the quarter ended
March 31, 2004 (File No. 001-31899)].
|
|
(4.4)
|
Subordinated
Indenture, dated as of April 19, 2005, by and among Whiting Petroleum
Corporation, Whiting Oil and Gas Corporation, Whiting Programs, Inc.,
Equity Oil Company and The Bank of New York Trust Company, N.A., as
successor trustee [Incorporated by reference to Exhibit 4.4 to Whiting
Petroleum Corporation’s Registration Statement on Form S-3 (Reg. No.
333-121615)].
|
|
(4.5)
|
First
Supplemental Indenture, dated as of April 19, 2005, by and among Whiting
Petroleum Corporation, Whiting Oil and Gas Corporation, Equity Oil
Company, Whiting Programs, Inc. and The Bank of New York Trust Company,
N.A., as successor trustee [Incorporated by reference to Exhibit 4.2 to
Whiting Petroleum Corporation’s Current Report on Form 8-K dated April 11,
2005 (File No. 001-31899)].
|
|
(4.6)
|
Indenture,
dated October 4, 2005, by and among Whiting Petroleum Corporation, Whiting
Oil and Gas Corporation, Whiting Programs, Inc. and The Bank of New York
Trust Company, N.A., as successor trustee [Incorporated by reference to
Exhibit 4.1 to Whiting Petroleum Corporation’s Current Report on Form 8-K
dated October 4, 2005 (File No. 001-31899)].
|
|
(4.7)
|
Rights
Agreement, dated as of February 23, 2006, between Whiting Petroleum
Corporation and Computershare Trust Company, Inc. [Incorporated by
reference to Exhibit 4.1 to Whiting Petroleum Corporation’s Current Report
on Form 8-K dated February 23, 2006 (File No.
001-31899)].
|
|
(10.1)*
|
Whiting
Petroleum Corporation 2003 Equity Incentive Plan, as amended through
October 23, 2007 [Incorporated by reference to Exhibit 10.2 to Whiting
Petroleum Corporation’s Current Report on Form 8-K dated October 23, 2007
(File No. 001-31899)].
|
|
(10.2)*
|
Form
of Restricted Stock Agreement pursuant to the Whiting Petroleum
Corporation 2003 Equity Incentive Plan for time-based vesting awards prior
to October 23, 2007 [Incorporated by reference to Exhibit 10.1 to Whiting
Petroleum Corporation’s Quarterly Report on Form 10-Q for the quarter
ended September 30, 2004 (File No. 001-31899)].
|
|
(10.3)*
|
Form
of Restricted Stock Agreement pursuant to the Whiting Petroleum
Corporation 2003 Equity Incentive Plan for performance vesting awards
prior to October 23, 2007 [Incorporated by reference to Exhibit
10.1 to Whiting Petroleum Corporation’s Quarterly Report on Form 10-Q for
the quarter ended March 31, 2007 (File No. 001-31899)].
|
|
(10.4)*
|
Form
of Restricted Stock Agreement pursuant to the Whiting Petroleum
Corporation 2003 Equity Incentive Plan for performance vesting awards on
and after October 23, 2007 and prior to February 23, 2008 [Incorporated by
reference to Exhibit 10.3 to Whiting Petroleum Corporation’s Current
Report on Form 8-K dated October 23, 2007 (File No.
001-31899)].
|
|
(10.5)*
|
Form
of Restricted Stock Agreement pursuant to the Whiting Petroleum
Corporation 2003 Equity Incentive Plan for time-based vesting awards on
and after October 23, 2007 [Incorporated by reference to Exhibit 10.4 to
Whiting Petroleum Corporation’s Current Report on Form 8-K dated October
23, 2007 (File No. 001-31899)].
|
|
(10.6)*
|
Form
of Restricted Stock Agreement pursuant to the Whiting Petroleum
Corporation 2003 Equity Incentive Plan for performance vesting awards on
and after February 23, 2008 [Incorporated by reference to Exhibit 10.1 to
Whiting Petroleum Corporation’s Quarterly Report on Form 10-Q for the
quarter ended March 31, 2008 (File No. 001-31899)].
|
|
(10.7)*
|
Whiting
Petroleum Corporation Production Participation Plan, as amended and
restated February 4, 2008 [Incorporated by reference to Exhibit 10.6 to
Whiting Petroleum Corporation’s Annual Report on Form 10-K for the year
ended December 31, 2007 (File No. 001-31899)].
|
|
(10.8)
|
Tax
Separation and Indemnification Agreement between Alliant Energy
Corporation, Whiting Petroleum Corporation and Whiting Oil and Gas
Corporation [Incorporated by reference to Exhibit 10.3 to Whiting
Petroleum Corporation’s Registration Statement on Form S-1 (Registration
No. 333-107341)].
|
|
(10.9)*
|
Summary
of Non-Employee Director Compensation for Whiting Petroleum Corporation
[Incorporated by reference to Exhibit 10.9 to Whiting Petroleum
Corporation’s Annual Report on Form 10-K for the year ended December 31,
2008 (File No. 001-31899)].
|
|
(10.10)*
|
Production
Participation Plan Credit Service Agreement, dated February 23, 2007,
between Whiting Petroleum Corporation and James J. Volker [Incorporated by
reference to Exhibit 10.7 to Whiting Petroleum Corporation’s Annual Report
on Form 10-K for the year ended December 31, 2006 (File No.
001-31899)].
|
|
(10.11)*
|
Amended
and Restated Production Participation Plan Supplemental Payment Agreement,
dated January 14, 2008, between Whiting Petroleum Corporation and J.
Douglas Lang [Incorporated by reference to Exhibit 10.6 to Whiting
Petroleum Corporation’s Annual Report on Form 10-K for the year ended
December 31, 2007 (File No. 001-31899)].
|
|
(10.12)*
|
Form
of Indemnification Agreement for directors and executive officers of
Whiting Petroleum Corporation [Incorporated by reference to Exhibit 10.10
to Whiting Petroleum Corporation’s Quarterly Report on Form 10-Q for the
quarter ended September 30, 2008 (File No. 001-31899)].
|
|
(10.13)*
|
Form
of Executive Excise Tax Gross-Up Agreement for executive officers of
Whiting Petroleum Corporation [Incorporated by reference to Exhibit 10.1
to Whiting Petroleum Corporation’s Current Report on Form 8-K dated
January 13, 2009 (File No. 001-31899)].
|
|
(10.14)*
|
Form
of Stock Option Agreement pursuant to the Whiting Petroleum Corporation
2003 Equity Incentive Plan [Incorporated by reference to Exhibit 10.14 to
Whiting Petroleum Corporation’s Annual Report on Form 10-K for the year
ended December 31, 2008 (File No. 001-31899)].
|
|
(12.1)
|
Statement
regarding computation of ratios of earnings to fixed
charges.
|
|
(21)
|
Subsidiaries
of Whiting Petroleum Corporation.
|
|
(23.1)
|
Consent
of Deloitte & Touche LLP.
|
|
(23.2)
|
Consent
of Cawley, Gillespie & Associates, Inc., Independent Petroleum
Engineers.
|
|
(31.1)
|
Certification
by the Chairman, President and Chief Executive Officer pursuant to Section
302 of the Sarbanes-Oxley Act.
|
|
(31.2)
|
Certification
by the Vice President and Chief Financial Officer pursuant to Section 302
of the Sarbanes-Oxley Act.
|
|
(32.1)
|
Certification
of the Chairman, President and Chief Executive Officer pursuant to 18
U.S.C. Section 1350.
|
|
(32.2)
|
Certification
of the Vice President and Chief Financial Officer pursuant to
18 U.S.C. Section 1350.
|
|
(99.1)
|
Proxy
Statement for the 2010 Annual Meeting of Stockholders, to be filed within
120 days of December 31, 2009 [To be filed with the Securities and
Exchange Commission under Regulation 14A within 120 days after December
31, 2009; except to the extent specifically incorporated by reference, the
Proxy Statement for the 2010 Annual Meeting of Stockholders shall not be
deemed to be filed with the Securities and Exchange Commission as part of
this Annual Report on Form 10-K].
|
|
(99.2)
|
Report
of Cawley, Gillespie & Associates, Inc., Independent Petroleum
Engineers.
|
* A
management contract or compensatory plan or arrangement.
120