Attached files
| file | filename |
|---|---|
| EX-21 - SUBSIDIARIES OF THE REGISTRANT - TENNANT CO | exhibit_21.htm |
| EX-31.1 - CERTIFICATION OF CEO PURSUANT TO SECTION 302 - TENNANT CO | exhibit_31-1.htm |
| EX-23.1 - INDEPENDENT AUDITOR'S CONSENT - TENNANT CO | exhibit_23-1.htm |
| EX-32.2 - CERTIFICATION OF CFO PURSUANT TO SECTION 906 - TENNANT CO | exhibit_32-2.htm |
| EX-32.1 - CERTIFICATION OF CEO PURSUANT TO SECTION 906 - TENNANT CO | exhibit_32-1.htm |
| EX-31.2 - CERTIFICATION OF CFO PURSUANT TO SECTION 302 - TENNANT CO | exhibit_31-2.htm |
UNITED
STATES
SECURITIES
AND EXCHANGE COMMISSION
Washington,
D.C. 20549
FORM
10-K
(Mark
One)
|
[ü]
|
ANNUAL
REPORT PURSUANT TO SECTION 13 OR 15(d) OF THE SECURITIES EXCHANGE ACT OF
1934
For
the fiscal year ended December 31, 2009
|
|
OR
|
|
|
[ ]
|
TRANSITION
REPORT PURSUANT TO SECTION 13 OR 15(d) OF THE SECURITIES EXCHANGE ACT OF
1934
For
the transition period from __________ to
__________.
|
Commission
File Number 001-16191
TENNANT
COMPANY
(Exact
name of registrant as specified in its charter)
|
Minnesota
|
41-0572550
|
|
|
State
or other jurisdiction of
|
(I.R.S.
Employer
|
|
|
incorporation
or organization
|
Identification
No.)
|
|
701
North Lilac Drive, P.O. Box 1452
Minneapolis,
Minnesota 55440
|
|
(Address
of principal executive offices) (Zip
Code)
|
Registrant’s
telephone number, including area code 763-540-1200
Securities
registered pursuant to Section 12(b) of the Act:
|
Name
of exchange on which registered
|
||
|
Common
Stock, par value $0.375 per share
|
New
York Stock Exchange
|
|
|
Preferred
Share Purchase Rights
|
New
York Stock Exchange
|
|
Securities registered pursuant
to Section 12(g) of the Act: None
|
||||
|
Indicate
by check mark if the registrant is a well-known seasoned issuer, as
defined by Rule 405 of the Securities Act.
|
Yes
|
ü
|
No
|
|
|
Indicate
by check mark if the registrant is not required to file reports pursuant
to Section 13 or Section 15(d) of the Act.
|
Yes
|
ü
|
No
|
|
|
Indicate
by check mark whether the registrant (1) has filed all reports required to
be filed by Section 13 or 15(d) of the Securities Exchange Act of 1934
during the preceding 12
months
|
||||
|
(or for
such shorter period that the registrant was required to file such
reports), and (2) has been subject to such filing requirements for
the past 90 days.
|
ü
|
Yes
|
No
|
|
| Indicate by check mark whether the registrant has submitted electronically and posted on its corporate Web site, if any, every Interactive Data File required to be submitted and | ||||
| posted pursuant to Rule 405 of Regulation S-T (§232.405 of this chapter) during the preceding 12 months (or for such shorter period that the registrant was required to submit | ||||
| and post such files). | Yes |
No
|
||
|
Indicate
by check mark if disclosure of delinquent filers pursuant to Item 405 of
Regulation S-K is not contained herein, and will not be contained, to the
best of registrant’s knowledge, in definitive proxy or information
statements incorporated by reference in Part III of this Form 10-K or any
amendment to this Form
10-K. [ü
]
|
||||
|
Indicate
by check mark whether the registrant is a large accelerated filer, an
accelerated filer, a non-accelerated filer, or a smaller reporting
company. See definitions of “large accelerated filer,” "accelerated filer"
and "smaller reporting company" in Rule 12b-2 of the Exchange Act. (Check
one):
|
|||||
|
Large
accelerated filer
|
Accelerated
filer
|
ü | |||
|
Non-accelerated filer
|
(Do not check if a smaller reporting company) |
Smaller reporting
company
|
|||
|
Indicate
by check mark whether the registrant is a shell company (as defined in
Rule 12b-2 of the Act).
|
Yes
|
ü
|
No
|
|
|
The
aggregate market value of the voting and non-voting common equity held by
non-affiliates as of June 30, 2009, was approximately
$339,083,805.
|
||||
|
As
of February 24, 2010, there were 18,800,981 shares of Common Stock
outstanding.
|
||||
DOCUMENTS
INCORPORATED BY REFERENCE
Portions
of the registrant’s Proxy Statement for its 2010 annual meeting of shareholders
(the “2010 Proxy Statement”) are incorporated by reference in Part
III.
Tennant
Company
Form
10–K
Table of Contents
|
PART I
|
Page
|
|||||
|
Item
1
|
||||||
|
Item
1A
|
||||||
|
Item
1B
|
||||||
|
Item
2
|
||||||
|
Item
3
|
||||||
|
Item
4
|
||||||
|
PART
II
|
||||||
|
Item
5
|
||||||
|
Item
6
|
||||||
|
Item
7
|
||||||
|
Item
7A
|
||||||
|
Item
8
|
||||||
|
1
|
||||||
|
2
|
||||||
|
3
|
||||||
|
4
|
||||||
|
5
|
||||||
|
6
|
||||||
|
7
|
||||||
|
8
|
||||||
|
9
|
||||||
|
10
|
||||||
|
11
|
||||||
|
12
|
||||||
|
13
|
||||||
|
14
|
||||||
|
15
|
||||||
|
16
|
||||||
|
17
|
||||||
|
18
|
||||||
|
19
|
||||||
|
20
|
||||||
|
Item
9
|
||||||
|
Item
9A
|
||||||
|
Item
9B
|
||||||
|
PART
III
|
||||||
|
Item
10
|
||||||
|
Item
11
|
||||||
|
Item
12
|
||||||
|
Item
13
|
||||||
|
Item
14
|
||||||
|
PART
IV
|
||||||
|
Item
15
|
||||||
TENNANT
COMPANY
2009
ANNUAL
REPORT
Form
10–K
(Pursuant
to Securities Exchange Act of 1934)
PART
I
ITEM 1 – Business
General
Development of Business
Tennant
Company, a Minnesota corporation incorporated in 1909, is a world leader in
designing, manufacturing and marketing solutions that help create a cleaner,
safer world. The Company’s floor maintenance and outdoor cleaning equipment,
chemical-free cleaning technologies, specialty surface coatings and related
products are used to clean and coat surfaces in factories, office buildings,
parking lots and streets, airports, hospitals, schools, warehouses, shopping
centers and more. Customers include building service contract cleaners to whom
organizations outsource facilities maintenance, as well as end-user businesses,
healthcare facilities, schools and local, state and federal governments who
handle facilities maintenance themselves. We reach these customers through the
industry’s largest direct sales and service organization and through a strong
and well-supported network of authorized distributors worldwide.
Industry
Segments, Foreign and Domestic Operations and Export Sales
The
Company has one reportable business segment. The Company sells its products
domestically and internationally. Financial information on the Company’s
geographic areas is provided in Note 18, Segment Reporting. Nearly all of the
Company’s foreign investments in assets reside within The Netherlands,
Australia, the United Kingdom, France, Germany, Canada, Austria, Japan, Spain,
Brazil and China.
Principal
Products, Markets and Distribution
The
Company offers products and solutions mainly consisting of motorized cleaning
equipment targeted at commercial and industrial markets; parts, consumables and
service maintenance and repair; business solutions such as pay-for-use
offerings, rental and leasing programs; and technologies such as chemical-free
cleaning technologies that enhance the performance of Tennant cleaning
equipment. Adjacent products include specialty surface coatings and floor
preservation products. In 2009, the Company launched its S20, a compact sweeper,
and extended the availability of its proprietary electrically converted water
technology (“ec-water”), which cleans without chemicals, to five rider scrubber
machines. In addition, the Company licensed this technology for use in a
hand-held spray bottle for commercial and consumer cleaning applications. The
Company’s products are sold through direct and distribution channels in various
regions around the world. In North America, products are sold through a direct
sales organization and independent distributors; in Australia, Japan and many
countries principally in Western Europe, products are sold primarily through
direct sales organizations; and in more than 80 other countries, Tennant relies
on a broad network of independent distributors.
Raw
Materials and Purchased Components
The
Company has not experienced any significant or unusual problems in the
availability of raw materials or other product components. The Company has
sole-source vendors for certain components. A disruption in supply from such
vendors may disrupt the Company’s operations. However, the Company believes that
it can find alternate sources in the event there is a disruption in supply from
such vendors.
Patents
and Trademarks
The
Company applies for and is granted United States and foreign patents and
trademarks in the ordinary course of business, none of which is of material
importance in relation to the business as a whole.
Seasonality
Although
the Company’s business is not seasonal in the traditional sense, historically
revenues and earnings have been more concentrated in the fourth quarter of each
year reflecting the tendency of customers to increase capital spending during
such quarter and the Company’s efforts to close orders and reduce order
backlogs. In addition, the Company offers annual distributor rebates and sales
commissions which tend to drive sales in the fourth quarter. Typical seasonality
did not occur in the 2008 fourth quarter due to the deterioration of the
worldwide economy and global credit crisis. Typical seasonality also did not
occur during 2009. The Company’s focus and accomplishment during 2009 was to
increase sales sequentially each quarter beginning with the increase from the
2009 first quarter to the 2009 second quarter.
Working
Capital
The
Company funds operations through a combination of cash and cash equivalents and
cash flows from operations. Wherever possible, cash management is centralized
and intercompany financing is used to provide working capital to subsidiaries as
needed. In addition, credit facilities are available for additional working
capital needs or investment opportunities.
Major
Customers
The
Company sells its products to a wide variety of customers, none of which is of
material importance in relation to the business as a whole. The customer base
includes several governmental entities; however, these customers generally have
terms similar to other customers.
Backlog
The
Company processes orders within two weeks on average. Therefore, no significant
backlogs existed at December 31, 2009 or December 31, 2008.
Competition
While
there is no industry association or industry data, the Company believes, through
its own market research, that it is a world-leading manufacturer of floor
maintenance and cleaning equipment. Significant competitors exist in all key
geographic regions. However, the key competitors vary by region. The Company
competes primarily on the basis of offering a broad line of high-quality;
innovative products supported by an extensive sales and service network in major
markets.
Product
Research and Development
The
Company strives to be an industry leader in innovation and is committed to
investing in research and development. The Company’s Global Innovation Center is
dedicated to various activities including development of new products and
technologies, improvements of existing product design or manufacturing processes
and new product applications. In 2009, 2008 and 2007, the Company spent $23.0
million, $24.3 million and $23.9 million on research and development,
respectively.
Environmental
Protection
Compliance
with federal, state and local provisions regulating the discharge of materials
into the environment, or otherwise relating to the protection of the
environment, has not had, and the Company does not expect it to have, a material
effect upon the Company’s capital expenditures, earnings or competitive
position.
Employment
The
Company employed 2,786 people in worldwide operations as of December 31,
2009.
Access
to Information on the Company’s Website
The
Company makes available free of charge, through the Company’s website at
www.tennantco.com, its Annual Reports on Form 10-K, quarterly reports on Form
10-Q, current reports on Form 8-K, and amendments to those reports filed or
furnished pursuant to Section 13(a) or Section 15(d) of the Exchange Act
simultaneously when such reports are filed electronically with, or furnished to,
the Securities and Exchange Commission (“SEC”).
ITEM 1A – Risk Factors
The
following are significant factors known to us that could materially adversely
affect our business, financial condition, or operating results.
We
may encounter additional financial difficulties if the United States or other
global economies continue to experience a significant long-term economic
downturn, decreasing the demand for our products.
To the
extent that the U.S. and other global economies experience a continued
significant long-term economic downturn, our revenues could decline to the point
that we may have to take additional cost saving measures to reduce our fixed
costs to a level that is in line with a lower level of sales in order to stay in
business long-term in a depressed economic environment. Our product
sales are sensitive to declines in capital spending by our customers.
Decreased demand for our products could result in decreased revenues,
profitability and cash flows and may impair our ability to maintain our
operations and fund our obligations to others.
We
may not be able to effectively manage organizational changes which could
negatively impact our operating results or financial condition.
We are
continuing to integrate acquired companies into our business and adjust to
reduced staffing levels as a result of our workforce reduction. This
consolidation and reallocation of resources is part of our ongoing efforts to
optimize our cost structure in the current economy. Our operating
results may be negatively impacted if we are unable to manage these
organizational changes either by failing to incorporate new employees from
acquired businesses or failing to assimilate the work of the positions that are
eliminated as part of our actions to reduce headcount. In addition, if we do not
effectively manage the transition of our reduced headcount, we may not fully
realize the anticipated savings of these actions or they may negatively impact
our ability to serve our customers or meet our strategic
objectives.
We
may not be able to effectively optimize the allocation of Company resources to
our strategic objectives, which could adversely affect our operating
results.
The
decline in the global economy has constrained resources that are available to
allocate among strategic business objectives. If we are not able to
appropriately prioritize our objectives, we risk allocating our resources to
projects that do not accomplish our strategic objectives most effectively, which
could result in increased costs and could adversely impact our operating
results.
We are subject to
competitive risks associated with developing innovative products and
technologies, which generally cost more than our competitors’
products.
Our
products are sold in competitive markets throughout the world. Competition is
based on product features and design, brand recognition, reliability,
durability, technology, breadth of product offerings, price, customer
relationships, and after-sale service. Although we believe that the performance
and price characteristics of our products will provide competitive solutions for
our customers’ needs, because of our dedication to innovation and continued
investments in research and development, our products generally cost more than
our competitor’s products. We believe that customers will pay for the innovation
and quality in our products; however, in the current economic environment, it
may be difficult for us to compete with lower cost products offered by our
competitors and there can be no assurance that our customers will continue to
choose our products over products offered by our competitors. If our products,
markets and services are not competitive, we may experience a decline in sales,
pricing, and market share, which adversely impacts revenues, margin, and the
success of our operations.
We may not be
able to adequately acquire, retain and protect our proprietary intellectual
property rights which could put us at a competitive
disadvantage.
We rely
on trade secret, copyright, trademark and patent laws and contractual
protections to protect our proprietary technology and other proprietary rights.
Our competitors may attempt to copy our products or gain access to our trade
secrets. Our efforts to secure patent protection on our inventions may be
unsuccessful. Notwithstanding the precautions we take to protect our
intellectual property rights, it is possible that third parties may illegally
copy or otherwise obtain and use our proprietary technology without our consent.
Any litigation concerning infringement could result in substantial cost to us
and diversions of our resources, either of which could adversely affect our
business. In some cases, there may be no effective legal recourse against
duplication of products or services by competitors. Intellectual property rights
in foreign jurisdictions may be limited or unavailable. Patents of third parties
also have an important bearing on our ability to offer some of our products and
services. Our competitors may obtain patents related to the types of products
and services we offer or plan to offer. Any infringement by us on intellectual
property rights of others could result in litigation and adversely affect our
ability to continue to provide, or could increase the cost of providing, our
products and services.
We may encounter
difficulties as we invest in changes to our processes and computer systems that
are foundational to our ability to maintain and manage our systems
data.
We rely
on our computer systems to effectively manage our business, serve our customers
and report financial data. Our current systems are adequate for our current
business operations; however, we are in the process of standardizing our
processes and the way we utilize our computer systems with the objective that we
will improve our ability to effectively maintain and manage our systems data so
that as our business grows, our processes will be able to more efficiently
handle this growth. There are inherent risks in changing processes and systems
data and if we are not successful in our attempts to improve our data and system
processes, we may experience higher costs or an interruption in our business
which could adversely impact our ability to serve our customers and our
operating results.
We may be unable
to conduct business if we experience a significant business interruption in our
computer systems, manufacturing plants or distribution facilities for a
significant period of time.
We rely
on our computer systems, manufacturing plants and distribution facilities to
efficiently operate our business. If we experience an interruption in the
functionality in any of these items for a significant period of time, we may not
have adequate business continuity planning contingencies in place to allow us to
continue our normal business operations on a long-term basis. Significant
long-term interruption in our business could cause a decline in sales, an
increase in expenses and could adversely impact our operating
results.
We are subject to
product liability claims and product quality issues that could adversely affect
our operating results or financial condition.
Our
business exposes us to potential product liability risks that are inherent in
the design, manufacturing and distribution of our products. If products are used
incorrectly by our customers, injury may result leading to product liability
claims against us. Some of our products or product improvements may have defects
or risks that we have not yet identified that may give rise to product quality
issues, liability and warranty claims. If product liability claims are brought
against us for damages that are in excess of our insurance coverage or for
uninsured liabilities and it is determined we are liable, our business could be
adversely impacted. Any losses we suffer from any liability claims, and the
effect that any product liability litigation may have upon the reputation and
marketability of our products, may have a negative impact on our business and
operating results. We could experience a material design or manufacturing
failure in our products, a quality system failure, other safety issues, or
heightened regulatory scrutiny that could warrant a recall of some of our
products. Any unforeseen product quality problems could result in loss of market
share, reduced sales, and higher warranty expense.
We may encounter
difficulties obtaining raw materials or component parts needed to manufacture
our products and the prices of these materials are subject to
fluctuation.
Raw materials and commodity-based
components. As a manufacturer, our sales and profitability are dependent
upon availability and cost of raw materials, which are subject to price
fluctuations, and the ability to control or pass on an increase in costs of raw
materials to our customers. We purchase raw materials, such as steel, rubber,
lead and petroleum-based resins and components containing these commodities for
use in our manufacturing operations. The availability of these raw materials is
subject to market forces beyond our control. Under normal circumstances, these
materials are generally available on the open market from a variety of sources.
From time to time, however, the prices and availability of these raw materials
and components fluctuate due to global market demands, which could impair our
ability to procure necessary materials, or increase the cost of such materials.
Inflationary and other increases in the costs of these raw materials and
components have occurred in the past and may recur from time to time, and our
financial performance depends in part on our ability to incorporate changes in
costs into the selling prices for our products.
Freight
costs associated with shipping and receiving product and sales and service
vehicle fuel costs are impacted by fluctuations in the cost of oil and gas. We
do not use derivative commodity instruments to manage our exposure to changes in
commodity prices such as steel, oil, gas and lead. Any fluctuations in the
supply or prices for any of these commodities could have a material adverse
affect on our profit margins and financial condition.
Single-source supply. We
depend on many suppliers for the necessary parts to manufacture our products.
However, there are some components that are purchased from a single supplier due
to price, quality, technology or other business constraints. These components
cannot be quickly or inexpensively re-sourced to another supplier. If we are
unable to purchase on acceptable terms or experience significant delays or
quality issues in the delivery of these necessary parts or components from a
particular vendor and we need to locate a new supplier for these parts and
components, shipments for products impacted could be delayed, which could have a
material adverse affect on our business, financial condition and results of
operations.
We are subject to
a number of regulatory and legal risks associated with doing business in the
United States and international markets.
Our
business and our products are subject to a wide range of international, federal,
state and local laws, rules and regulations, including, but not limited to, data
privacy laws, anti-trust regulations, employment laws, product labeling and
regulatory requirements, and the Foreign Corrupt Practices Act and similar
anti-bribery regulations. Many of these requirements are challenging to comply
with as there are frequent changes and many inconsistencies across the various
jurisdictions. Any violation of these laws or regulations could lead to
significant fines and/or penalties could limit our ability to conduct business
in those jurisdictions and could cause us to incur additional operating and
compliance costs.
We are subject to
risks associated with changes in foreign currency exchange
rates.
We are
exposed to market risks from changes in foreign currency exchange rates. As a
result of our increasing international presence, we have experienced an increase
in transactions and balances denominated in currencies other than the U.S.
dollar. There is a direct financial impact of foreign currency exchange when
translating profits from local currencies to U.S. dollars. Our primary exposure
is to transactions denominated in the Euro, British pound, Australian and
Canadian dollar, Japanese yen, Chinese yuan and Brazilian real. Any significant
change in the value of the currencies of the countries in which we do business
against the U.S. dollar could affect our ability to sell products competitively
and control our cost structure. Because a substantial portion of our products
are manufactured in the United States, a stronger U.S. dollar generally has a
negative impact on results from operations outside the United States while a
weaker dollar generally has a positive effect. Unfavorable changes in exchange
rates between the U.S. dollar and these currencies impact the cost of our
products sold internationally and could significantly reduce our reported sales
and earnings. We periodically enter into contracts, principally forward exchange
contracts, to protect the value of certain of our foreign currency-denominated
assets and liabilities. The gains and losses on these contracts generally
approximate changes in the value of the related assets and liabilities. However,
all foreign currency exposures cannot be fully hedged, and there can be no
assurances that our future results of operations will not be adversely affected
by currency fluctuation.
ITEM 1B – Unresolved Staff Comments
None.
ITEM 2 – Properties
The
Company’s corporate offices are owned by the Company and are located in the
Minneapolis, Minnesota, metropolitan area. Manufacturing facilities are located
in the states of Minnesota, Michigan, Kentucky and in Uden, The Netherlands; the
United Kingdom; São Paulo, Brazil; and Shanghai, China. Sales offices, warehouse
and storage facilities are leased in various locations in North America, Europe,
Japan, China, Asia, Australia and Latin America. The Company’s facilities are in
good operating condition, suitable for their respective uses and adequate for
current needs. Further information regarding the Company’s property and lease
commitments is included in the Contractual Obligations section of Item 7 and in
Note 13, Commitments and Contingencies.
ITEM 3 – Legal Proceedings
There are
no material pending legal proceedings other than ordinary routine litigation
incidental to the Company’s business.
ITEM 4 – Submission of Matters to a Vote of Security
Holders
No
matters were submitted to a vote of security holders during the fourth quarter
of 2009.
PART
II
ITEM 5 – Market for Registrant’s Common Equity, Related
Shareholder Matters and Issuer Purchases of Equity Securities
STOCK
MARKET INFORMATION – Tennant common stock is traded on the New York Stock
Exchange, under the ticker symbol TNC. As of January 29, 2010, there were
approximately 500 shareholders of record and 4,400 beneficial shareholders. The
common stock price was $23.93 per share on January 29, 2010.
STOCK
SPLIT – On April 26, 2006, the Board of Directors declared a two-for-one common
stock split effective July 26, 2006. As a result of the stock split,
shareholders of record received one additional common share for every share held
at the close of business on July 12, 2006. All share and per share data has been
retroactively adjusted to reflect the stock split.
QUARTERLY
PRICE RANGE – The accompanying chart shows the quarterly price range of the
Company’s shares over the past two years:
|
First
|
Second
|
Third
|
Fourth
|
||||
|
2009
|
$7.76-16.41
|
$9.89-21.26
|
$15.79-30.79
|
$26.16-31.92
|
|||
|
2008
|
$31.88-45.41 |
$30.07-41.00
|
$24.90-40.48
|
$15.33-33.26
|
DIVIDEND
INFORMATION – Cash dividends on Tennant’s common stock have been paid for 65
consecutive years. Tennant’s annual cash dividend payout increased for the
38th
consecutive year to $0.53 per share in 2009, an increase of $0.01 per share over
2008. Dividends generally are declared each quarter. The Company announced a
quarterly cash dividend of $0.14 per share payable March 15, 2010, to
shareholders of record on February 26, 2010. Following are the anticipated
remaining record dates for 2010: June 15, 2010, September 15, 2010 and December
15, 2010.
DIVIDEND
REINVESTMENT OR DIRECT DEPOSIT OPTIONS – Shareholders have the option of
reinvesting quarterly dividends in additional shares of Company stock or having
dividends deposited directly to a bank account. The Transfer Agent should be
contacted for additional information.
TRANSFER
AGENT AND REGISTRAR – Shareholders with a change of address or questions about
their account may contact:
Wells
Fargo Bank, N.A.
Shareowner
Services
P.O. Box
64854
South St.
Paul, MN 55164-0854
(800)
468-9716
SHARE
REPURCHASES – On May 3, 2007, the Board of Directors authorized the repurchase
of 1,000,000 shares of our common stock. Share repurchases are made from time to
time in the open market or through privately negotiated transactions, primarily
to offset the dilutive effect of shares issued through our stock-based
compensation programs. In order to preserve cash, we had temporarily suspended
these repurchases effective September 2008. Our March 4, 2009 amendment to our
Credit Agreement prohibited us from conducting share repurchases during the 2009
fiscal year and limits the payment of dividends and repurchases of stock in
fiscal years after 2009 to an amount ranging from $12.0 million to $40.0 million
based on our leverage ratio after giving effect to such payments.
|
For
the Quarter Ended
December
31, 2009
|
Total
Number of Shares Purchased
(1)
|
Average
Price Paid Per Share
|
Total
Number of Shares Purchased as Part of Publicly Announced Plans or
Programs
|
Maximum
Number of Shares that May Yet Be Purchased Under the Plans or
Programs
|
|||||
|
October
1–31, 2009
|
33
|
$ 29.03
|
-
|
288,874
|
|||||
|
November
1–30, 2009
|
-
|
-
|
-
|
288,874
|
|||||
|
December
1–31, 2009
|
988
|
26.82
|
-
|
288,874
|
|||||
|
Total
|
1,021
|
$ 26.89
|
-
|
288,874
|
|||||
(1)
Includes 1,021 shares delivered or attested to in satisfaction of the exercise
price and/or tax withholding obligations by employees who exercised stock
options or restricted stock under employee stock compensation
plans.
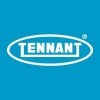
COMPARATIVE
STOCK PERFORMANCE – The following graph compares the cumulative total
shareholder return on the common stock of the Company for the last five fiscal
years with the cumulative total return over the same period on the Overall Stock
Market Performance Index (Morningstar Index) and the Industry Index (Hemscott
Group Index 62 – Industrial Goods, Manufacturing).
This
assumes an investment of $100 in the Company’s common stock, the Morningstar
Index and the Hemscott Group Index on December 31, 2004, with reinvestment of
all dividends.
COMPARISON
OF 5-YEAR CUMULATIVE TOTAL RETURN
AMONG
TENNANT COMPANY
MORNINGSTAR
INDEX AND HEMSCOTT GROUP INDEX
|
2004
|
2005
|
2006
|
2007
|
2008
|
2009
|
|||||||||||||||||||
|
Tennant
Company
|
100.00 | 134.05 | 152.19 | 235.51 | 83.28 | 146.00 | ||||||||||||||||||
|
Morningstar
Index
|
100.00 | 106.52 | 123.24 | 130.53 | 82.19 | 105.58 | ||||||||||||||||||
|
Hemscott
Manufacturing Index
|
100.00 | 110.13 | 132.56 | 174.13 | 94.15 | 143.81 | ||||||||||||||||||
ITEM 6 – Selected Financial Data
(In
thousands, except shares and per share data)
|
Years
Ended December 31
|
2009
|
2008
|
2007
|
2006
|
2005
|
|||||||||||||||
|
Year
End Financial Results
|
||||||||||||||||||||
|
Net
Sales
|
$ | 595,875 | 701,405 | 664,218 | 598,981 | 552,908 | ||||||||||||||
|
Cost
of Sales
|
$ | 349,767 | 415,155 | 385,234 | 347,402 | 318,044 | ||||||||||||||
|
Gross
Margin – %
|
41.3 | 40.8 | 42.0 | 42.0 | 42.5 | |||||||||||||||
|
Research
and Development Expense
|
$ | 22,978 | 24,296 | 23,869 | 21,939 | 19,351 | ||||||||||||||
|
%
of Net Sales
|
3.9 | 3.5 | 3.6 | 3.7 | 3.5 | |||||||||||||||
|
Selling
and Administrative Expense
|
$ | 245,623 |
(1)
|
243,385 | (2) | 200,270 | (3) | 189,676 | 180,676 | |||||||||||
|
%
of Net Sales
|
41.2 | 34.7 | 30.2 | 31.7 | 32.7 | |||||||||||||||
|
(Loss)
Profit from Operations
|
$ | (22,493 | ) (1) | 18,569 | (2) | 54,845 | (3) | 39,964 | 34,837 | |||||||||||
|
%
of Net Sales
|
(3.8 | ) | 2.6 | 8.3 | 6.7 | 6.3 | ||||||||||||||
|
Total
Other (Expense) Income, Net
|
$ | (1,827 | ) | (994 | ) | 2,867 | (3) | 3,338 | 157 | |||||||||||
|
Income
Tax Expense
|
$ | 1,921 | (1) | 6,951 | (2) | 17,845 | (3) | 13,493 | 12,058 | |||||||||||
|
%
of (Loss) Profit Before Income Taxes
|
7.9 | 39.6 | 30.9 | 31.2 | 34.5 | |||||||||||||||
|
Net
(Loss) Earnings
|
$ | (26,241 | ) (1) | 10,624 | (2) | 39,867 | (3) | 29,809 | 22,936 | |||||||||||
|
%
of Net Sales
|
(4.4 | ) | 1.5 | 6.0 | 5.0 | 4.2 | ||||||||||||||
|
Return
on beginning Shareholders’ Equity – %
|
(12.5 | ) | 4.2 | 17.4 | 15.4 | 13.2 | ||||||||||||||
|
Per
Share Data
|
||||||||||||||||||||
|
Basic
(Loss) Earnings
|
$ | (1.42 | ) (1) | 0.58 | (2) | 2.14 | (3) | 1.61 | 1.27 | |||||||||||
|
Diluted
(Loss) Earnings
|
$ | (1.42 | ) (1) | 0.57 | (2) | 2.08 | (3) | 1.57 | 1.26 | |||||||||||
|
Cash
Dividends
|
$ | 0.53 | 0.52 | 0.48 | 0.46 | 0.44 | ||||||||||||||
|
Shareholders’
Equity (ending)
|
$ | 9.83 | 11.48 | 13.65 | 12.25 | 10.50 | ||||||||||||||
|
Year-End
Financial Position
|
||||||||||||||||||||
|
Cash
and Cash Equivalents
|
$ | 18,062 | 29,285 | 33,092 | 31,021 | 41,287 | ||||||||||||||
|
Total
Current Assets
|
$ | 215,912 | 250,419 | 240,724 | 235,404 | 211,601 | ||||||||||||||
|
Property,
Plant and Equipment, Net
|
$ | 97,217 | 103,730 | 96,551 | 82,835 | 72,588 | ||||||||||||||
|
Total
Assets
|
$ | 377,726 | 456,604 | 382,070 | 354,250 | 311,472 | ||||||||||||||
|
Total
Current Liabilities
|
$ | 116,152 | 107,159 | 96,673 | 94,804 | 88,965 | ||||||||||||||
|
Total
Long-Term Liabilities
|
$ | 77,295 | 139,541 | 32,966 | 29,782 | 29,405 | ||||||||||||||
|
Shareholders’
Equity
|
$ | 184,279 | 209,904 | 252,431 | 229,664 | 193,102 | ||||||||||||||
|
Current
Ratio
|
1.9 | 2.3 | 2.5 | 2.5 | 2.4 | |||||||||||||||
|
Debt:
|
||||||||||||||||||||
|
Current
|
$ | 4,019 | 3,946 | 2,127 | 1,812 | 2,232 | ||||||||||||||
|
Long-Term
|
$ | 30,192 | 91,393 | 2,470 | 1,907 | 1,608 | ||||||||||||||
|
Debt-to-Capital
ratio
|
15.7 | 31.2 | 1.8 | 1.6 | 1.9 | |||||||||||||||
|
Cash
Flows
|
||||||||||||||||||||
|
Net
Cash Provided by Operating Activities
|
$ | 75,185 | 37,394 | 39,640 | 40,319 | 44,237 | ||||||||||||||
|
Net
Cash Used for Investing Activities
|
$ | (13,334 | ) | (101,827 | ) | (10,357 | ) | (45,959 | ) | (11,781 | ) | |||||||||
|
Net
Cash (Used for) Provided by Financing Activities
|
$ | (74,068 | ) | 62,075 | (26,679 | ) | (4,876 | ) | (8,111 | ) | ||||||||||
|
Other
Data
|
||||||||||||||||||||
|
Interest
Income
|
$ | 393 | 1,042 | 1,854 | 2,698 | 1,691 | ||||||||||||||
|
Interest
Expense
|
$ | 2,830 | 3,944 | 898 | 737 | 564 | ||||||||||||||
|
Depreciation
and Amortization
|
$ | 22,803 | 22,959 | 18,054 | 14,321 | 13,039 | ||||||||||||||
|
Purchases
of Property, Plant and Equipment
|
$ | 11,483 | 20,790 | 28,720 | 23,872 | 20,880 | ||||||||||||||
|
Proceeds
from disposals of Property, Plant and Equipment
|
$ | 311 | 808 | 7,254 | 632 | 3,049 | ||||||||||||||
|
Number
of employees at year-end
|
2,786 | 3,002 | 2,774 | 2,653 | 2,496 | |||||||||||||||
|
Diluted
Weighted Average Shares Outstanding
|
18,507,772 | 18,581,840 | 19,146,025 | 18,989,248 | 18,209,888 | |||||||||||||||
|
Closing
share price at year-end
|
$ | 26.19 | 15.40 | 44.29 | 29.00 | 26.00 | ||||||||||||||
|
Common
stock price range during year
|
$ | 7.76-31.92 | 15.33-45.41 | 27.84-49.32 | 21.71–29.88 | 17.39-26.23 | ||||||||||||||
|
Closing
Price/Earnings ratio
|
(18.4 | ) | 27.0 | 21.3 | 18.5 | 20.6 | ||||||||||||||
The
results of operations from our 2009 and 2008 acquisitions have been included in
the Consolidated Financial Statements, as well as the Selected Financial Data
presented above, since each of their respective dates of acquisition. Refer
to additional information in Note 4, Acquisitions and Divestitures.
(1) 2009 includes a goodwill impairment
charge of $43,363 pretax ($42,289 aftertax or $2.29 per diluted share), a
benefit from a revision during the first quarter of 2009 to the 2008 workforce
reduction charge of $1,328 pretax ($1,249 aftertax or $0.07 per diluted share)
and a net tax benefit, primarily from a United Kingdom business reorganization
of $1,864 aftertax (or $0.10 per diluted share). (2) 2008 includes a workforce
reduction charge and associated expenses of $14,551 pretax ($12,003 aftertax or
$0.65 per diluted share), increase in Allowance for Doubtful Accounts of $3,361
pretax ($3,038 aftertax or $0.16 per diluted share), write-off of technology
investments of $1,842 pretax ($1,246 aftertax or $0.07 per diluted share), and a
gain on sale of Centurion assets of $229 pretax ($143 aftertax or $0.01 per
diluted share). (3) 2007 includes a restructuring charge and associated expenses
of $2,507 pretax ($1,656 aftertax or $0.09 per diluted share), a one-time tax
benefit relating to a reduction in valuation reserves, net of the impact of tax
rate changes in foreign jurisdictions on deferred taxes of $3,644 aftertax (or
$0.19 per diluted share) and a gain on the sale of the Maple Grove, Minnesota
facility of $5,972 pretax ($3,720 aftertax or $0.19 per diluted
share).
ITEM 7 – Management’s Discussion and Analysis of
Financial Condition and Results of Operations
Overview
Tennant
Company is a world leader in designing, manufacturing and marketing solutions
that help create a cleaner, safer world. We provide floor maintenance and
outdoor cleaning equipment, chemical-free cleaning technologies, specialty
surface coatings and related products that are used to clean and coat surfaces
in factories, office buildings, parking lots and streets, airports, hospitals,
schools, warehouses, shopping centers and more. We sell our products through our
direct sales and service organization and a network of authorized distributors
worldwide. Geographically, our customers are primarily located in North America,
Europe, the Middle East, Africa, Asia-Pacific and Latin America. We strive to be
an innovator in our industry through our commitment to understanding our
customers’ needs and using our expertise to create innovative products and
solutions.
Net Loss
for 2009 was $26.2 million, or $1.42 loss per diluted share, compared to Net
Earnings of $10.6 million, or $0.57 per diluted share for 2008. Net Loss was
impacted by a non-cash pretax goodwill impairment charge of $43.4 million, or
$2.29 loss per diluted share, taken during the first quarter of 2009 as well as
a significant year over year decline in Net Sales due to ongoing unfavorable
global economic conditions. Net Sales totaled $595.9 million, down 15.0% from
2008 driven primarily by a decline in equipment unit sales volume. Gross Margins
increased 50 basis points to 41.3%. Benefits from commodity price deflation,
cost reductions, flexible production management and workforce reductions more
than offset the impact of lower sales and the unfavorable impact of lower
production volume through our manufacturing facilities. Selling and
Administrative Expense (“S&A Expense”) decreased 80 basis points as a
percentage of Net Sales to 33.9% compared to 34.7% in 2008 due to benefits from
our workforce reduction program, reductions in volume-related expenses, and
delays in discretionary spending to align expenses with the lower level of
sales.
Tennant
continues to invest in innovative product development, with 3.9% of Net Sales
spent on Research and Development in 2009. We launched one new product in 2009
in addition to the continued global rollout of our electrically converted water
technology (“ec-water”) on five of our rider scrubbers. Sales of new products
introduced in the past three years generated approximately 41% of our equipment
sales during 2009, exceeding our long-term goal of 30%.
In
addition, Net Loss was also impacted by a benefit from net favorable discrete
tax items, which contributed $0.03 per diluted share, and a tax benefit from a
United Kingdom business reorganization which contributed $0.10 per diluted
share.
We ended
2009 with a Debt-to-Capital ratio of 15.7%, $18.1 million in Cash and Cash
Equivalents and Shareholders’ Equity of $184.3 million. During 2009 we generated
operating cash flows of $75.2 million. Total debt was $34.2 million as of
December 31, 2009, a significant decrease from $95.3 million at the same time
last year.
Historical
Results
The
following table compares the historical results of operations for the years
ended December 31, 2009, 2008 and 2007 in dollars and as a percentage
of Net Sales (in thousands, except per share amounts):
|
2009
|
%
|
2008
|
%
|
2007
|
%
|
|||||||||||||||||||
|
Net
Sales
|
$ | 595,875 | 100.0 | $ | 701,405 | 100.0 | $ | 664,218 | 100.0 | |||||||||||||||
|
Cost
of Sales
|
349,767 | 58.7 | 415,155 | 59.2 | 385,234 | 58.0 | ||||||||||||||||||
|
Gross
Profit
|
246,108 | 41.3 | 286,250 | 40.8 | 278,984 | 42.0 | ||||||||||||||||||
|
Operating
Expense:
|
||||||||||||||||||||||||
|
Research
and Development
Expense
|
22,978 | 3.9 | 24,296 | 3.5 | 23,869 | 3.6 | ||||||||||||||||||
|
Selling
and Administrative
Expense
|
202,260 | 33.9 | 243,614 | 34.7 | 206,242 | 31.1 | ||||||||||||||||||
|
Goodwill
Impairment Charge
|
43,363 | 7.3 | - | - | - | - | ||||||||||||||||||
|
Gain
on Divestiture of Assets
|
- | - | (229 | ) | - | - | - | |||||||||||||||||
|
Gain
on Sale of Facility
|
- | - | - | - | (5,972 | ) | (0.9 | ) | ||||||||||||||||
|
Total
Operating Expenses
|
268,601 | 45.1 | 267,681 | 38.2 | 224,139 | 33.7 | ||||||||||||||||||
|
(Loss)
Profit from Operations
|
(22,493 | ) | (3.8 | ) | 18,569 | 2.6 | 54,845 | 8.3 | ||||||||||||||||
|
Other
Income (Expense):
|
||||||||||||||||||||||||
|
Interest
Income
|
393 | 0.1 | 1,042 | 0.1 | 1,854 | 0.3 | ||||||||||||||||||
|
Interest
Expense
|
(2,830 | ) | (0.5 | ) | (3,944 | ) | (0.6 | ) | (898 | ) | (0.1 | ) | ||||||||||||
|
Net
Foreign Currency Transaction
(Losses) Gains
|
(412 | ) | (0.1 | ) | 1,368 | 0.2 | 39 | - | ||||||||||||||||
|
ESOP
Income
|
990 | 0.2 | 2,219 | 0.3 | 2,568 | 0.4 | ||||||||||||||||||
|
Other
Income (Expense), Net
|
32 | - | (1,679 | ) | (0.2 | ) | (696 | ) | (0.1 | ) | ||||||||||||||
|
Total
Other (Expense) Income, Net
|
(1,827 | ) | (0.3 | ) | (994 | ) | (0.1 | ) | 2,867 | 0.4 | ||||||||||||||
|
(Loss)
Profit Before Income Taxes
|
(24,320 | ) | (4.1 | ) | 17,575 | 2.5 | 57,712 | 8.7 | ||||||||||||||||
|
Income
Tax Expense
|
1,921 | 0.3 | 6,951 | 1.0 | 17,845 | 2.7 | ||||||||||||||||||
|
Net
(Loss) Earnings
|
$ | (26,241 | ) | (4.4 | ) | $ | 10,624 | 1.5 | $ | 39,867 | 6.0 | |||||||||||||
|
Net
(Loss) Earnings per Share
|
$ | (1.42 | ) | $ | 0.57 | $ | 2.08 | |||||||||||||||||
Consolidated
Financial Results
Net Loss
for 2009 was $26.2 million, or $1.42 loss per diluted share, compared to Net
Earnings of $10.6 million, or $0.57 per diluted share for 2008. Net Loss was
impacted by:
|
§
|
A
decline in Net Sales of 15.0%, primarily due to a decrease in equipment
unit sales volume experienced during
2009.
|
|
§
|
A
50 basis point increase in Gross Margins to 41.3% due to benefits from
commodity price deflation, cost reductions, flexible production management
and workforce reductions which more than offset the decline in equipment
unit sales volume.
|
|
§
|
A
decrease in S&A Expense as a percentage of Net Sales of 80 basis
points due to benefits from our workforce reduction program, reductions in
volume-related expenses and delays in discretionary
spending.
|
|
§
|
Non-cash
pretax goodwill impairment charge of $43.4 million during the first
quarter of 2009.
|
|
§
|
A
benefit from net favorable discrete tax items contributed $0.03 per
diluted share and a tax benefit from a United Kingdom business
reorganization contributed $0.10 per diluted
share.
|
In 2008,
Net Earnings declined 73.4% to $10.6 million or $0.57 per diluted share as
compared to 2007. Net Earnings were impacted by:
|
§
|
Growth
in Net Sales of 5.6% to $701.4 million, driven by 2008 acquisitions and
increases in Other International.
|
|
§
|
A
120 basis point decline in Gross Margins to 40.8% as fixed manufacturing
costs within our plants were not fully leveraged due to a significant
equipment unit volume decline of $22.9 million experienced in the fourth
quarter of 2008.
|
|
§
|
An
increase in S&A Expense as a percentage of Net Sales of 360 basis
points due to the inclusion of $19.8 million of expenses associated with
the fourth quarter workforce reduction charge and other charges as well as
expenses incurred earlier in the year to expand international market
coverage and support new product
launches.
|
|
§
|
The
inclusion of a $2.7 million net foreign currency gain from settlement of
forward contracts related to a British pound denominated
loan.
|
|
§
|
A
net benefit from discrete tax items, primarily related to U.S. federal tax
settlements, added $0.07 per diluted
share.
|
|
§
|
A
dilutive impact to Net Earnings related to our 2008 acquisitions of $2.8
million.
|
For 2009,
we used operating profit and cash flows from operations as key indicators of
financial performance and the primary metrics for performance-based incentives.
Other key drivers we focus on to measure how effectively we utilize net assets
in the business include “Accounts Receivable Days Sales Outstanding” (DSO),
“Days Inventory on Hand” (DIOH) and capital expenditures. These key drivers are
discussed in greater depth throughout Management’s Discussion and
Analysis.
Net
Sales
In 2009,
consolidated Net Sales were $595.9 million, a decrease of 15.0% as compared to
2008. Consolidated Net Sales were $701.4 million in 2008, an increase of 5.6%
over 2007.
The
components of the consolidated Net Sales change for 2009 as compared to 2008 and
2008 compared to 2007 were as follows:
|
%
Change
|
%
Change
|
|||
|
Growth
Elements
|
from
2008
|
from
2007
|
||
|
Organic
(Decline) Growth:
|
||||
|
Volume
|
(14%)
|
(5%)
|
||
|
Price
|
1%
|
4%
|
||
|
Organic
Decline
|
(13%)
|
(1%)
|
||
|
Foreign
Currency
|
(3%)
|
2%
|
||
|
Acquisitions
|
1%
|
5%
|
||
|
Total
|
(15%)
|
6%
|
||
The 15.0%
decrease in consolidated Net Sales for 2009 from 2008 was primarily driven
by:
|
§
|
An
organic decline of 13%, which includes a decline in base business
equipment sales volume experienced in almost all geographic regions,
slightly offset by the net benefit from higher year-over-year selling
prices.
|
|
§
|
An
unfavorable direct foreign currency exchange impact of
3%.
|
The 5.6%
increase in consolidated Net Sales for 2008 from 2007 was primarily driven
by:
|
§
|
An
increase of 5% in sales volume due to our March 28, 2008 acquisition of
Sociedade Alfa Ltda. (“Alfa”), our February 29, 2008 acquisition of
Applied Sweepers, Ltd. (“Applied Sweepers”) and our February 1, 2007
acquisition of Floorep Limited
(“Floorep”).
|
|
§
|
A
favorable direct foreign currency exchange impact of
2%.
|
|
§
|
An
organic decline of 1%, which includes a decline in base business volume,
primarily within North America, partially offset by the net benefit from
price increases implemented during the
year.
|
The
following table sets forth annual Net Sales by geography and the related percent
change from the prior year (in thousands, except percentages):
|
2009
|
%
|
2008
|
%
|
2007
|
%
|
|||||||||||||||||||
|
North
America
|
$ | 345,766 | (14.0 | ) | $ | 402,174 | (3.7 | ) | $ | 417,757 | 6.8 | |||||||||||||
| Europe, Middle East and Africa |
177,829
|
(18.3 | ) | 217,594 | 18.8 | 183,188 | 17.6 | |||||||||||||||||
|
Other
International
|
72,280 | (11.5 | ) | 81,637 | 29.0 | 63,273 | 21.8 | |||||||||||||||||
|
Total
|
$ | 595,875 | (15.0 | ) | $ | 701,405 | 5.6 | 664,218 | 10.9 | |||||||||||||||
North America – In 2009, North
America Net Sales declined 14.0% to $345.8 million compared with $402.2 million
in 2008. The primary driver of the decrease in Net Sales is attributable to a
decline in equipment unit volume, during the first three quarters of 2009,
somewhat offset by benefits from slightly higher selling prices. There was no
impact from foreign currency translation during 2009.
In 2008,
North America Net Sales declined 3.7% to $402.2 million compared with $417.8
million in 2007. The primary driver of the decrease in Net Sales is attributable
to a decline in equipment unit volume, with the most significant declines
occurring in the fourth quarter as a result of the credit crisis and its impact
on an already sluggish U.S. economy. Partially offsetting these declines were
benefits from pricing actions taken during the year and a net favorable impact
from foreign currency translation. Our acquisition of Applied Sweepers
contributed approximately 1% to North America’s 2008 Net Sales.
Europe, Middle East and Africa
– Europe, Middle East and Africa (“EMEA”) Net Sales in 2009 decreased
18.3% to $177.8 million compared to 2008 Net Sales of $217.6 million.
Unfavorable direct foreign currency exchange effects decreased EMEA Net Sales by
approximately 7% in 2009. Our Applied Sweepers acquisition contributed
approximately 1% to EMEA Net Sales in 2009. EMEA’s organic sales decline of
approximately 12% was primarily due to lower equipment unit volume in most
regions due to weak economic conditions somewhat offset by higher equipment unit
volume in the UK and Italy and slightly higher selling prices.
EMEA Net
Sales in 2008 increased 18.8% to $217.6 million compared to 2007 Net Sales of
$183.2 million. Favorable direct foreign currency exchange effects increased
EMEA Net Sales by approximately 6% in 2008. Our Applied Sweepers acquisition
contributed approximately 14% to EMEA’s 2008 Net Sales. EMEA’s organic sales
were essentially flat in 2008 when compared to 2007. Pricing increases and
volume growth in emerging markets were offset by lower sales of equipment in the
mature markets within Europe. The majority of the equipment unit volume decline
occurred in the fourth quarter following the global credit crisis and a
significant slowdown in these economies.
Other International – Our
Other International markets are comprised of the following key geographic
regions: China and other Asia Pacific markets, Japan, Australia and Latin
America. Other
International Net Sales in 2009 decreased 11.5% to $72.3 million over 2008 Net
Sales of $81.6 million. Our Alfa acquisition contributed approximately 2% to
Other International Net Sales in 2009, while unfavorable direct foreign currency
exchange effects decreased Net Sales by approximately 1% in 2009. Other
International’s organic sales decline of approximately 12% was primarily due to
lower equipment unit volume in Latin America due to weak economic conditions
somewhat offset by higher equipment unit volume in Australia and
China.
Other
International Net Sales in 2008 increased 29.0% to $81.6 million over 2007 Net
Sales of $63.3 million. Growth in Net Sales was driven in part by organic
growth, resulting from expanded market coverage in Brazil and China as well as a
net benefit from pricing actions taken during the year. Our acquisitions
contributed approximately 12% to Other International’s 2008 Net Sales. Price
increases also contributed to the 2008 growth in Net Sales. Favorable direct
foreign currency exchange effects increased Net Sales in Other International
markets by approximately 3% in 2008.
Gross
Profit
Gross
Margin was 41.3% in 2009, an increase of 50 basis points as compared to 2008.
Gross Margin was unfavorably impacted by the decline in equipment unit volume as
compared to the prior year; however, this was more than offset by commodity
price deflation, cost reductions, flexible production management and savings
from workforce reductions.
Gross
Margin was 40.8% in 2008, down 120 basis points as compared to 2007. Although
benefits from pricing actions and cost reduction initiatives were able to
essentially offset higher raw material and purchased component costs during
2008, the inability to leverage the fixed manufacturing costs in our plants, due
to the significant decline in unit volume experienced in the fourth quarter,
drove a decline in margins year over year. Gross Margin was also impacted by an
unfavorable sales mix and by the inclusion of $1.2 million in expense from the
flow-through of fair market value inventory step-up from our acquisitions of
Applied Sweepers and Alfa.
Operating
Expenses
Research and Development Expense –
Research and Development Expense (“R&D Expense”) decreased $1.3
million, or 5.4%, in 2009 compared to 2008 and increased 40 basis points to 3.9%
as a percentage of Net Sales. Despite lower sales levels in 2009 investments
continued to be made in key research and development projects and
technologies.
R&D
Expense increased $0.4 million, or 1.8%, in 2008 compared to 2007 and decreased
10 basis points to 3.5% as a percentage of Net Sales.
Selling and Administrative Expense –
S&A Expense decreased by $41.4 million, or 17.0%, in 2009 compared to
2008. As a percentage of Net Sales, 2009 S&A Expense decreased 80 basis
points to 33.9%. S&A Expense benefited from decreased headcount in 2009 due
to the fourth quarter 2008 workforce reduction, decreased selling costs
associated with a lower level of sales and delays in discretionary spending,
partially offset by higher incentives as compared to the prior period due to
strong operating profit results and cash flows from operations. Favorable
foreign currency exchange was approximately $3.4 million in 2009.
S&A
Expense increased by $37.4 million, or 18.1%, in 2008 compared to 2007. The
inclusion of expense from our 2008 acquisitions of Applied Sweepers, Alfa and
Shanghai ShenTan Mechanical and Electrical Equipment Co. Ltd. (“Shanghai
ShenTan”) added $10.7 million to S&A Expense during 2008. S&A Expense
included a $14.6 million workforce reduction charge as discussed in Note 3 to
the Consolidated Financial Statements. S&A Expense was also impacted by a
significant increase in bad debt expense of $3.4 million resulting from
increased Accounts Receivable reserves due to the global credit crisis and a
write-off of $1.8 million related to technology investments that will be
replaced by new solutions. Unfavorable foreign currency exchange was
approximately $4.5 million in 2008.
Goodwill Impairment Charge
– During the first
quarter of 2009, we recorded a non-cash pretax goodwill impairment charge of
$43.4 million related to our EMEA reporting unit. All but $3.8 million of this
charge is not tax deductible.
Gain on Divestiture of Assets
– We sold assets
related to our Centurion line of sweepers during the second quarter of 2008 for
a pretax gain of $0.2 million.
Gain on Sale of Facility
– We
completed the sale of our Maple Grove, Minnesota facility during the fourth
quarter of 2007 for a net pretax gain of $6.0 million.
Total
Other Income (Expense), Net
Interest Income – Interest
Income was $0.4 million in 2009, a decrease of $0.6 million from 2008. The
decrease reflects the impact of a lower level of cash on hand during 2009 as
compared to 2008 as well as a slightly lower interest rate.
Interest
Income was $1.0 million in 2008, a decrease of $0.8 million from 2007. The
decrease between 2008 and 2007 reflects the impact of a decline in interest
rates between periods on lower average cash levels.
Interest Expense – Interest
Expense was $2.8 million in 2009 as compared to $3.9 million in 2008. This
decline is primarily due to significant repayments of debt during 2009 as
compared to 2008.
Interest
Expense was $3.9 million in 2008 as we became a net debtor during the first
quarter of 2008 borrowing against our revolving credit facility, primarily to
fund the two acquisitions that closed during the first quarter of
2008.
Net Foreign Currency Transaction
Gains (Losses) – Net Foreign Currency Transaction Gains decreased $1.8
million between 2009 and 2008 from a $1.4 million net gain in 2008 to a $0.4
million net loss during 2009. Included in the 2008 net gain of $1.4 million was
a $2.7 million net foreign currency gain from the settlement of forward
contracts related to a British pound denominated loan, partially offset by a
$0.9 million unfavorable movement in the foreign currency exchange rates related
to a deal contingent non-speculative forward contract. There were no
individually significant transactions in the 2009 activity, resulting in a net
unfavorable impact from other foreign currency fluctuations between
years.
Net
Foreign Currency Transaction Gains increased $1.3 million between 2008 and
2007. A
$2.7 million net foreign currency gain from the settlement of forward contracts
related to a British pound denominated loan was the most significant contributor
to the change between years. This gain was partially offset by the $0.9 million
unfavorable movement in the foreign currency exchange rates related to a deal
contingent non-speculative forward contract that we entered into that fixed the
cash outlay in U.S. dollars for the Alfa acquisition in the first quarter of
2008. The remaining change was due to a net favorable impact from other foreign
currency fluctuations between years.
ESOP Income – ESOP Income decreased
$1.2 million between 2009 and 2008 due to a lower average stock price. We
benefit from ESOP Income when the shares held by Tennant’s ESOP Plan are
utilized and the basis of those shares is lower than the current average stock
price. This benefit is offset in periods when the number of shares needed
exceeds the number of shares available from the ESOP as the shortfall must be
issued at the current market rate, which is generally higher than the basis of
the ESOP shares. We issued additional shares throughout 2009 as we experienced a
lower average stock price during 2009 as compared to 2008. On December 31, 2009,
the ESOP loan matured and was repaid to us, completing the twenty year term for
this plan.
ESOP
Income decreased $0.3 million between 2008 and 2007 due to a lower average stock
price. We benefit from ESOP Income when the shares held by Tennant’s ESOP Plan
are utilized and the basis of those shares is lower than the current average
stock price. This benefit is offset in periods when the number of shares needed
exceeds the number of shares available from the ESOP as the shortfall must be
issued at the current market rate, which is generally higher than the basis of
the ESOP shares. During the year ended 2008 compared to 2007, we experienced a
lower average stock price and issued additional shares during the fourth quarter
of 2008.
Other Income (Expense), Net –
The $1.7 million decrease in Other Expense, Net between 2009 and 2008 was
primarily due to a decrease in discretionary contributions to Tennant’s
charitable foundation.
Other
Expense, Net increased $1.0 million between 2008 and 2007. The increase in Other
Expense, Net was primarily due to an increase in discretionary contributions to
Tennant’s charitable foundation.
Income
Taxes
Our
effective income tax rate was 7.9%, 39.6% and 30.9% in 2009, 2008 and 2007,
respectively. The 2009 tax expense includes only a $1.1 million tax benefit
associated with the $43.4 million impairment of Goodwill recorded in the first
quarter, materially impacting the overall rate. Excluding the $1.1 million tax
benefit associated with the first quarter goodwill impairment, the 2009
effective tax rate would have been 15.7%. The 2009 tax expense also includes a
$2.3
11
million
tax benefit associated with a United Kingdom business reorganization in the
fourth quarter, also materially impacting the overall rate. Excluding the tax
benefit associated with the first quarter goodwill impairment and the fourth
quarter United Kingdom business reorganization, the 2009 effective tax rate
would have been 27.8%. The decrease in the 2009 effective tax rate excluding
these items was substantially related to changes in our operating profit by
taxing jurisdiction.
During
2008, we had a negative impact due to a correction of an immaterial error
related to reserves for uncertain tax positions covering tax years 2004 to 2006.
The change in the 2008 rate as compared to 2007 was also negatively impacted due
to the 2007 favorable one-time discrete item related to the reversal of a German
valuation allowance, as noted below.
During
2007, a favorable one-time discrete item of $3.6 million related to the reversal
of a German valuation allowance, net of the impact of tax rate changes in
foreign jurisdictions on deferred taxes, was recognized in the third quarter. It
was determined that it was now more likely than not that a tax loss carryforward
in Germany will be utilized in the future and accordingly the valuation
allowance on the related deferred tax asset was reduced to zero.
Liquidity
and Capital Resources
Liquidity – Cash and Cash
Equivalents totaled $18.1 million at December 31, 2009, as compared to $29.3
million of Cash and Cash Equivalents as of December 31, 2008. Cash and Cash
Equivalents held by our foreign subsidiaries totaled $10.1 million as of
December 31, 2009 as compared to $14.6 million of Cash and Cash Equivalents held
by our foreign subsidiaries as of December 31, 2008. Wherever possible, cash
management is centralized and intercompany financing is used to provide working
capital to subsidiaries as needed. Our current ratio was 1.9 and 2.3 as of
December 31, 2009 and 2008, based on working capital of $99.8 million and $143.3
million, respectively.
Our
Debt-to-Capital ratio was 15.7% as of December 31, 2009, compared with 31.2% as
of December 31, 2008. Our capital structure was comprised of $34.2
million of Long-Term Debt and $184.3 million of Shareholders’ Equity as of
December 31, 2009.
On July
29, 2009, we filed a shelf registration statement with the SEC to facilitate any
future issuances of debt securities, preferred stock, depository shares and
common stock up to $175.0 million. This shelf registration statement was
declared effective by the SEC on December 15, 2009.
On July
29, 2009, we entered into a Private Shelf Agreement (the “Shelf Agreement”) with
Prudential Investment Management, Inc. (“Prudential”) and Prudential affiliates
from time to time party thereto. The Shelf Agreement provides us and our
subsidiaries access to uncommitted, senior secured, debt capital with a maximum
aggregate principal amount of $80.0 million. There was no balance outstanding
under this credit facility as of December 31, 2009.
Cash Flow Summary – Cash
provided by (used in) our operating, investing and financing activities is
summarized as follows (in thousands):
|
2009
|
2008
|
2007
|
||||||||||
|
Operating
Activities
|
$ | 75,185 | $ | 37,394 | $ | 39,640 | ||||||
|
Investing
Activities:
|
||||||||||||
|
Purchases
of Property, Plant and
Equipment, Net of Disposals
|
(11,172 | ) | (19,982 | ) | (21,466 | ) | ||||||
|
Acquisitions
of Businesses, Net
of Cash Acquired
|
(2,162 | ) | (81,845 | ) | (3,141 | ) | ||||||
|
Change
in Short-Term Investments
|
- | - | 14,250 | |||||||||
|
Financing
Activities
|
(74,068 | ) | 62,075 | (26,679 | ) | |||||||
|
Effect
of Exchange Rate Changes on
Cash and Cash Equivalents
|
994 | (1,449 | ) | (533 | ) | |||||||
|
Net
Increase (Decrease) in Cash
and Cash Equivalents
|
$ | (11,223 | ) | $ | (3,807 | ) | $ | 2,071 | ||||
Operating Activities – Cash
provided by operating activities was $75.2 million in 2009, $37.4 million in
2008 and $39.6 million in 2007. In 2009, cash provided by operating activities
was driven by strong working capital management, offset somewhat by a decrease
in Employee Compensation and Benefits and Other Accrued Expenses due in part to
the cash payments in 2009 for the workforce reduction, which were accrued in
2008. Cash flow provided by operating activities was $37.8 million higher
in 2009 compared to 2008. This increase was primarily driven by a reduction in
Inventories and an increase in Income Taxes Payable and Accounts Payable, offset
by a decrease in Employee Compensation and Benefits and Other Accrued
Expenses.
In 2008,
cash provided by operating activities was driven by Net Earnings, as well as
increases in Employee Compensation and Benefits and Other Accrued Expenses and
Accounts Receivable, partially offset by a decrease in Income Taxes
Payable/Prepaid.
As
discussed previously, two metrics used by management to evaluate how effectively
we utilize our net assets are “Accounts Receivable Days Sales Outstanding” (DSO)
and “Days Inventory on Hand” (DIOH), on a FIFO basis. The metrics are calculated
on a rolling three month basis in order to more readily reflect changing trends
in the business. These metrics for the quarters ended December 31 were as
follows (in days):
|
2009
|
2008
|
2007
|
||||
|
DSO
|
67
|
77
|
61
|
|||
|
DIOH
|
87
|
101
|
83
|
DSO
decreased 10 days in 2009 compared to 2008 primarily due to our proactive
management of risk in this area by increasing focus on credit reviews and credit
limits and more aggressively pursuing collection of past due balance in light of
the more difficult economic environment.
DIOH
decreased 14 days in 2009 compared to 2008 primarily due to lower levels of
inventory as a result of inventory reduction initiatives.
Investing Activities – Net
cash used for investing activities was $13.3 million in 2009, $101.8 million in
2008 and $10.4 million in 2007. The primary use of cash in investing activities
during 2009 was net capital expenditures, which totaled $11.2
million.
Net
capital expenditures were $11.2 million during 2009 compared to $20.0 million in
2008. Net capital expenditures were $21.5 million in 2007. Capital expenditures
in 2009 included technology upgrades, tooling related to new product development
and investments in our Minnesota facilities to complete the Global Innovation
Center to support new product innovation efforts. Net capital expenditures in
2008 included upgrades to our information technology systems and related
infrastructures and investments in tooling in support of new products, as well
as investment in our corporate facilities to create a Global Innovation Center
for research and development. Net capital expenditures in 2007 included
continued investments in our footprint consolidation initiative, new product
tooling and capital spending related to our global expansion
initiatives.
On
February 27, 2009, we acquired certain assets of Applied Cleansing Solutions Pty
Ltd ("Applied Cleansing"), a long-term importer and distributor for Green
Machines™ products in Australia and New Zealand, in a business combination for
an initial purchase price of $0.4 million in cash. This acquisition provides us
with the opportunity to accelerate our growth in the city cleaning business
within the Asia Pacific region. The purchase agreement also provides for
additional contingent consideration to be paid for each of the four quarters
following the acquisition date if certain future revenue targets are met. We
recorded additional contingent consideration of approximately $0.2 million,
which represented our best estimate of these probable quarterly payments. As of
December 31, 2009, we have paid additional consideration of $0.2 million for the
first three quarters following the date of acquisition. The acquisition of
Applied Cleansing is accounted for as a business combination and the results of
operations have been included in the Consolidated Financial Statements since the
date of acquisition. The purchase price allocation is preliminary and will be
12
adjusted
retroactively based upon the final determination of fair value of assets
acquired and liabilities assumed.
On
December 1, 2008, we entered into an asset purchase agreement with Hewlett
Equipment (“Hewlett”) for a purchase price of $0.6 million in cash. The purchase
of Hewlett’s existing rental fleet of industrial equipment will accelerate
Tennant’s strategy to grow its direct sales and service business in the
Brisbane, Australia area. Hewlett will continue as a distributor and service
agent of Tennant’s commercial equipment.
On August
15, 2008, we acquired Shanghai ShenTan Mechanical and Electrical Equipment Co.
Ltd. (“Shanghai ShenTan”) for a purchase price including transaction costs of
$0.6 million in cash. The purchase agreement provides for additional contingent
consideration to be paid in each of the three one-year periods following the
acquisition date if certain future revenue targets are met and if other future
events occur. Amounts paid under this earn-out will be considered additional
purchase price. The potential earn-out is denominated in foreign currency which
approximates $0.6 million in the aggregate and is calculated based on 1) growth
in revenues and 2) visits to specified customer locations during each of the
three one-year periods following the acquisition date. During 2009, we recorded
$0.1 million for the earn-out related to the first one-year period following the
acquisition.
On March
28, 2008, we acquired Alfa for an initial purchase price including transaction
costs of $12.3 million in cash and $1.4 million in debt assumed. Alfa
manufactures the Alfa brand of commercial cleaning machines, is based in São
Paulo, Brazil, and is recognized as the market leader in the Brazilian cleaning
equipment industry. The purchase agreement with Alfa also provides for
additional contingent consideration up to approximately $6.8 million to be paid
if certain revenue targets are met based on growth in revenues during the 2009
calendar year. Amounts paid under this earn-out will be considered additional
purchase price. During the first quarter of 2009, we paid the maximum earn-out
amount of $1.2 million related to the interim period calculation based on growth
in 2008 revenues. As of December 31, 2009, we do not anticipate that there will
be any additional earn-out payments.
On
February 29, 2008, we acquired Applied Sweepers, a privately-held company based
in Falkirk, Scotland, for a purchase price of $68.9 million in cash. Applied
Sweepers is the manufacturer of Green Machines™ and is recognized as the leading
manufacturer of sub-compact outdoor sweeping machines in the United Kingdom.
Applied Sweepers also has locations in the United States, France and Germany and
sells through a broad distribution network around the world.
In
February 2007, we acquired Floorep, a distributor of cleaning equipment based in
Scotland, for a purchase price of $3.6 million in cash. The results of Floorep’s
operations have been included in the Consolidated Financial Statements since
February 2, 2007, the date of acquisition.
Financing Activities – Net
cash used for financing activities was $74.1 million in 2009. Net cash provided
by financing activities was $62.1 million in 2008. Net cash used for financing
activities was $26.7 million in 2007. In 2009, payments of Long-Term Debt used
$67.2 million and dividend payments used $9.9 million. In 2008, issuance of
Long-Term Debt for our 2008 acquisitions provided $87.5 million and significant
uses of cash included $14.3 million in repurchases of Common Stock related to
our share repurchase program and $9.6 million of dividends paid. Our annual cash
dividend payout increased for the 38th
consecutive year to $0.53 per share in 2009, an increase of $0.01 per share over
2008.
Proceeds
from the issuance of Common Stock generated $0.9 million in 2009, $1.9 million
in 2008 and $8.7 million in 2007. Proceeds are due to employees’ stock option
exercises which have declined over the past two years as our average stock price
has declined.
On May 3,
2007, the Board of Directors authorized the repurchase of 1,000,000 shares of
our Common Stock. At December 31, 2009, there remained approximately 288,874
shares authorized for repurchase.
There
were no shares repurchased during 2009 and 450,100 and 735,900 shares were
repurchased during the years ended 2008 and 2007, respectively, at average
repurchase prices of $31.62 and $39.34, respectively. Beginning in September
2008, repurchases were temporarily suspended in order to conserve cash and on
March 4, 2009, our amendment to our Credit Agreement prohibited us from
conducting share repurchases during 2009 and also limited the payment of
dividends and repurchases of stock in future years to amounts ranging from $12.0
million to $40.0 million based on our leverage ratio after giving effect to such
payments.
Indebtedness – As of December
31, 2009, we had committed lines of credit totaling approximately $134.3
million and uncommitted lines of credit totaling $80.0 million. There was $25.0
million in outstanding borrowings under our JPMorgan facility and no borrowings
under any other facilities as of December 31, 2009. In addition, we had stand
alone letters of credit of approximately $2.1 million outstanding and bank
guarantees in the amount of approximately $1.0 million. Commitment fees on
unused lines of credit for the year ended December 31, 2009 were $0.5
million.
Our most
restrictive covenants are part of our Credit Agreement with JPMorgan, which are
the same covenants in the Shelf Agreement with Prudential, and require us to
maintain an indebtedness to EBITDA ratio of not greater than 3.50 to 1 and to
maintain an EBITDA to interest expense ratio of no less than 3.50 to 1 as of the
end of each quarter. As of December 31, 2009, our indebtedness to EBITDA ratio
was 0.88 to 1 and our EBITDA to interest expense ratio was 14.94 to
1.
JPMorgan
Chase Bank, National Association
On June
19, 2007, we entered into a Credit Agreement (the “Credit Agreement”) with
JPMorgan Chase Bank, National Association (“JPMorgan”), as administrative agent,
Bank of America, N.A., as syndication agent, BMO Capital Markets Financing, Inc.
and U.S. Bank National Association, as Co-Documentation Agents and the Lenders
from time to time party thereto. The Credit Agreement provides us and certain of
our foreign subsidiaries access to a $125.0 million revolving credit facility
until June 19, 2012. Borrowings may be denominated in U.S. dollars or certain
other currencies. The facility is available for general corporate purposes,
working capital needs, share repurchases and acquisitions. The Credit
Agreement contains customary representations, warranties and covenants,
including but not limited to covenants restricting our ability to incur
indebtedness and liens and to merge or consolidate with another entity. Further,
the Credit Agreement initially contains a covenant requiring us to maintain an
indebtedness to EBITDA ratio as of the end of each quarter of not greater than
3.50 to 1 and to maintain an EBITDA to interest expense ratio of no less than
3.50 to 1.
On
February 21, 2008, we amended the Credit Agreement to increase the sublimit on
foreign currency borrowings from $75.0 million to $125.0 million and to increase
the sublimit on borrowings by the foreign subsidiaries from $50.0 million to
$100.0 million.
On March
4, 2009, we entered into a second amendment to the Credit Agreement. This
amendment principally provided: (i) an exclusion from our EBITDA calculation for
all non-cash losses and charges, up to $15.0 million cash restructuring charges
during the 2008 fiscal year and up to $3.0 million cash restructuring charges
during the 2009 fiscal year, (ii) an amendment of the indebtedness to EBITDA
financial ratio required for the second and third quarters of 2009 to not
greater than 4.00 to 1 and 5.50 to 1, respectively, (iii) an amendment to the
EBITDA to interest expense financial ratio for the third quarter of 2009 to not
less than 3.25 to 1, and (iv) the ability for us to incur up to an additional
$80.0 million of indebtedness pari passu with the lenders under the Credit
Agreement. The revolving credit facility available under the Credit
Agreement remains at $125.0 million, but the amendment reduced the expansion
feature under the Credit Agreement from $100.0 million to $50.0 million. The
amendment put a cap on permitted new acquisitions of $2.0 million for the 2009
fiscal year and the amount of permitted new acquisitions in fiscal years after
2009 will be limited according to our then current leverage ratio. The amendment
prohibited us from conducting share repurchases during the 2009
13
fiscal
year and limits the payment of dividends and repurchases of stock in fiscal
years after 2009 to an amount ranging from $12.0 million to $40.0 million based
on our leverage ratio after giving effect to such payments. Finally, if we
obtain additional indebtedness as permitted under the amendment, to the extent
that any revolving loans under the credit agreement are then outstanding we are
required to prepay the revolving loans in an amount equal to 100% of the
proceeds from the additional indebtedness. Additionally, proceeds over $25.0
million and under $35.0 million will reduce the revolver commitment on a 50%
dollar for dollar basis and proceeds over $35.0 million will reduce the revolver
commitment on a 100% dollar for dollar basis.
In
conjunction with the amendment to the Credit Agreement, we gave the lenders a
security interest on most of our personal property and pledged 65% of the stock
of all domestic and first tier foreign subsidiaries. The obligations under the
Credit Agreement are also guaranteed by our domestic subsidiaries and those
subsidiaries also provide a security interest in their similar personal
property.
Included
in the amendment were increased interest spreads and increased facility fees.
The fee for committed funds under the Credit Agreement now ranges from an annual
rate of 0.30% to 0.50%, depending on our leverage ratio. Borrowings under the
Credit Agreement bear interest at an annual rate of, at our option, either
(i) between LIBOR plus 2.20% to LIBOR plus 3.00%, depending on our leverage
ratio; or (ii) the highest of (A) the prime rate, (B) the federal funds rate
plus 0.50%, and (C) the adjusted LIBOR rate for a one month period plus 1.00%;
plus, in any such case under this clause (ii), an additional spread of 1.20% to
2.00%, depending on our leverage ratio.
We were
in compliance with all covenants under the Credit Agreement as of December 31,
2009. There was $25.0 million in outstanding borrowings under this facility at
December 31, 2009, with a weighted average interest rate of 2.44%.
Prudential
Investment Management, Inc.
On July
29, 2009, we entered into a Shelf Agreement with Prudential and Prudential
affiliates from time to time party thereto. The Shelf Agreement provides us and
our subsidiaries access to an uncommitted, senior secured, maximum aggregate
principal amount of $80.0 million of debt capital.
The
minimum principal amount of the private shelf notes that can be issued at any
time under the Shelf Agreement is $5.0 million with an issuance fee of 0.10% of
the U.S. dollar equivalent of the principal amount of the issued shelf notes,
payable on the date of issuance. The Shelf Agreement also provides for other
fees, including a fee of an additional 1.00% per annum, in addition to the
interest accruing on the shelf notes, in the event the amount of capital
required to be held in reserve by a holder of the shelf notes in respect of such
shelf notes is greater than the amount which would be required to be held in
reserve with respect to promissory notes rated investment grade by a nationally
recognized rating agency. Any private shelf note issued during the issuance
period may have a maturity of up to 12 years, provided that the average life for
each private shelf note issued is no more than 10 years after the original
issuance date. Prepayments of the shelf notes will be subject to payment of
yield maintenance amounts to the holders of the shelf notes.
The Shelf
Agreement contains representations, warranties and covenants, including but not
limited to covenants restricting our ability to incur indebtedness and liens and
merge or consolidate with another entity. Further, the Shelf Agreement contains
a covenant requiring us to maintain an indebtedness to EBITDA ratio for the
second and third quarters of 2009 of not greater than 4.00 to 1 and 5.50 to 1,
respectively, and thereafter as of the end of each quarter of not greater than
3.50 to 1. The Shelf Agreement also contains a covenant requiring us to maintain
an EBITDA to interest expense ratio for the third quarter of 2009 to not less
than 3.25 to 1, and thereafter of no less than 3.50 to 1. The Shelf Agreement
contains a cap on permitted acquisitions of $2.0 million for the 2009 fiscal
year and other limitations on the permitted acquisitions amount based on our
leverage ratio in fiscal years after 2009. Finally, the Shelf Agreement
prohibits us from conducting share repurchases during the 2009 fiscal year and
limits the payment of dividends or repurchases of stock in fiscal years after
2009 to an amount ranging from $12.0 million to $40.0 million based on our
leverage ratio after giving effect to such payments.
As of
December 31, 2009, there was no balance outstanding on this facility and
therefore no requirement to be in compliance with the financial covenants under
this facility. However, the financial covenants under this facility are the same
as the financial covenants in the Credit Agreement, all of which we were in
compliance with as of December 31, 2009. Should notes be issued under the Shelf
Agreement, such notes will be pari passu with outstanding debt under the Credit
Facility.
ABN AMRO
Bank N.V.
We have a
revolving credit facility with ABN AMRO Bank N.V. (“ABN AMRO”) of 5.0 million
Euros, or approximately $7.2 million, for general working capital purposes.
Borrowings under this facility incur interest generally at a rate of 1.25% over
the ABN AMRO base rate as calculated daily on the cleared account balance. This
facility may also be used for short-term loans up to 3.0 million Euros, or
approximately $4.3 million. The terms and conditions of these loans would be
incorporated in a separate short-term loan agreement at the time of the
transaction. As of December 31, 2009, bank guarantees of $1.0 million reduced
the amount available on this credit facility to $6.2 million.
Bank of
America, National Association
On August
17, 2009, we renewed our revolving credit facility with Bank of America,
National Association, Shanghai Branch. This agreement will expire on August 28,
2010 and is denominated in renminbi (“RMB”) in the amount of 13,400 RMB, or
approximately $2.0 million, and is available for general corporate purposes,
including working capital needs of our China location. As part of the March 4,
2009 amendment to the Credit Agreement with JPMorgan Chase Bank, this facility
with Bank of America was secured with the same assets as noted above under the
JPMorgan Chase section. The interest rate on borrowed funds is equal to the
People’s Bank of China’s base rate. This facility also allows for the issuance
of standby letters of credit, performance bonds and other similar instruments
over the term of the facility for a fee of 0.95% of the amount issued. There was
no balance outstanding on this facility at December 31, 2009.
Bank of
Scotland
On March
31, 2009, we cancelled our committed credit facility with the Bank of
Scotland.
Unibanco
Bank
During
the third quarter of 2009 our revolving credit facility with Unibanco Bank in
Brazil expired.
Contractual Obligations – Our
contractual cash obligations and commitments as of December 31, 2009, are
summarized by period due in the following table (in thousands):
|
Total
|
Less
Than
1
Year
|
1
- 3 Years
|
3
- 5 Years
|
More
Than 5 Years
|
||||||||||||||||
|
Long-term
debt (1)
|
$ | 25,174 | $ | 73 | $ | 25,071 | $ | 30 | $ | - | ||||||||||
|
Interest
payments on long-term debt (1)
|
1,595 | 618 | 977 | - | - | |||||||||||||||
|
Collateralized
borrowings(2)
|
1,342 | 823 | 519 | - | - | |||||||||||||||
|
Capital
leases
|
7,688 | 3,477 | 4,163 | 48 | - | |||||||||||||||
|
Interest
payments on capital leases
|
570 | 299 | 269 | 2 | - | |||||||||||||||
|
Residual
value guarantees(3)
|
891 | 625 | 264 | 2 | - | |||||||||||||||
|
Retirement
benefit plans(4)
|
1,198 | 1,198 | - | - | - | |||||||||||||||
|
Deferred
compensation
arrangements(5)
|
6,815 | 1,146 | 1,248 | 888 | 3,533 | |||||||||||||||
|
Other
long-term employee
benefits(6)
|
- | - | - | - | - | |||||||||||||||
|
Unrecognized
tax benefits (7)
|
- | - | - | - | - | |||||||||||||||
|
Operating
leases (8)
|
21,139 | 8,450 | 9,291 | 2,142 | 1,256 | |||||||||||||||
|
Purchase
obligations
(9)
|
39,410 | 38,207 | 1,203 | - | - | |||||||||||||||
|
Total
contractual obligations
|
$ | 105,824 | $ | 54,907 | $ | 42,655 | $ | 3,471 | $ | 4,791 | ||||||||||
(1)
Long-term debt represents bank borrowings and borrowings through our Credit
Agreement. Our Credit Agreement does not have specified repayment terms;
therefore, repayment is due upon expiration of the agreement on June 19, 2012.
Interest payments on our Credit Agreement were calculated using the
December 31, 2009 LIBOR rate based on the assumption that the principal
would be repaid in full upon the expiration of the
agreement.
(2)
Collateralized borrowings represent deferred sales proceeds on certain leasing
transactions with third-party leasing companies. These transactions are
accounted for as borrowings in accordance with GAAP. We would be expected to
fund these obligations only as a result of a default in lease payments by the
purchaser.
(3)
Certain operating leases for vehicles contain residual value guarantee
provisions, which would become due at the expiration of the operating lease
agreement if the fair value of the leased vehicles is less than the guaranteed
residual value. Of those leases that contain residual value guarantees, the
aggregate residual value at lease expiration is $9.2 million, of which we have
guaranteed $7.3 million. As of December 31, 2009, we have recorded a liability
for the estimated end-of-term loss related to this residual value guarantee of
$0.9 million for certain vehicles within our fleet.
(4) Our
retirement benefit plans, as described in Note 11 to the Consolidated Financial
Statements, require us to make contributions to the plans from time to time. Our
plan obligations totaled $24.5 million as of December 31, 2009. Contributions to
the various plans are dependent upon a number of factors including the market
performance of plan assets, if any, and future changes in interest rates, which
impact the actuarial measurement of plan obligations. As a result, we have only
included our $1.2 million of 2009 expected contributions in the contractual
obligations table.
(5) The
unfunded deferred compensation arrangements covering certain current and retired
management employees totaled $6.8 million as of December 31, 2009. Our estimated
distributions in the contractual obligations table are based upon a number of
assumptions including termination dates and participant distribution
elections.
(6) Other
long-term employee benefit arrangements are comprised of long-term incentive
compensation arrangements with certain key management, foreign defined
contribution plans and other long-term arrangements totaling $1.8 million. We
cannot predict the timing or amount of our future payments associated with these
arrangements; as a result, these obligations are not included in the table
above.
(7)
Approximately $7.8 million of unrecognized tax benefits have been recorded as
liabilities in accordance with the Financial Accounting Standards Board (“FASB”)
guidance on accounting for uncertainty in income taxes, and we are uncertain as
to if or when such amounts may be settled; as a result, these obligations are
not included in the table above.
(8)
Operating lease commitments consist primarily of office and warehouse
facilities, vehicles and office equipment as discussed in Note 13 to the
Consolidated Financial Statements.
(9)
Unconditional purchase obligations include purchase orders entered into in the
ordinary course of business and contractual purchase commitments. During 2008,
we amended our 2003 purchase commitment with a third-party manufacturer to
extend the terms of the agreement to remain in effect until the remaining
commitment has been satisfied. The remaining commitment under this agreement
totaled $0.1 million as of December 31, 2009. On November 9, 2009 we entered
into a purchase agreement with a third-party manufacturer. Under this agreement
we have a minimum purchase obligation of $1.6 million through 2012. The
remaining commitment under this agreement as of December 31, 2009 was $1.6
million. These purchase commitments have been included in the contractual
obligations table along with purchase orders entered into in the ordinary course
of business.
Recently
Issued Accounting Pronouncements
Multiple-Deliverable
Revenue Arrangements
In
October 2009, the FASB issued new guidance that sets forth the requirement that
must be met for an entity to recognize revenue for the sale of a delivered item
that is part of a multiple-element arrangement when other elements have not yet
been delivered. The new guidance is effective for fiscal years beginning on or
after June 15, 2010. We are currently evaluating the impact the adoption of the
new guidance will have on our Consolidated Financial Statements.
Critical
Accounting Estimates
Our
Consolidated Financial Statements are based on the selection and application of
accounting principals generally accepted in the United States of America, which
require us to make estimates and assumptions about future events that affect the
amounts reported in our Consolidated Financial Statements and the accompanying
notes. Future events and their effects cannot be determined with absolute
certainty. Therefore, the determination of estimates requires the exercise of
judgment. Actual results could differ from those estimates, and any such
differences may be material to the Consolidated Financial Statements. We believe
that the following policies may involve a higher degree of judgment and
complexity in their application and represent the critical accounting policies
used in the preparation of our Consolidated Financial Statements. If different
assumptions or conditions were to prevail, the results could be materially
different from our reported results.
Allowance for Doubtful
Accounts – We record a reserve for accounts receivable that are
potentially uncollectible. A considerable amount of judgment is required in
assessing the realization of these receivables including the current
creditworthiness of each customer and related aging of the past-due balances. In
order to assess the collectibility of these receivables, we perform ongoing
credit evaluations of our customers’ financial condition. Through these
evaluations, we may become aware of a situation where a customer may not be able
to meet its financial obligations due to deterioration of its financial
viability, credit ratings or bankruptcy. The reserve requirements are based on
the best facts available to us and are reevaluated and adjusted as additional
information becomes available. Our reserves are also based on amounts determined
by using percentages applied to trade receivables. These percentages are
determined by a variety of factors including, but not limited to, current
economic trends, historical payment and bad debt write-off experience. We are
not able to predict changes in the financial condition of our customers and if
circumstances related to these customers deteriorate, our estimates of the
recoverability of accounts receivable could be materially affected and we may be
required to record additional allowances. Alternatively, if more allowances are
provided than are ultimately required, we may reverse a portion of such
provisions in future periods based on the actual collection experience. Bad debt
write-offs as a percentage of Net Sales were approximately 0.7% in 2009, 0.0% in
2008 and 0.1% in 2007. As of December 31, 2009, we had $4.0 million reserved
against our Accounts Receivable for doubtful accounts.
Inventory Reserves – We value
our inventory at the lower of the cost of inventory or fair market value through
the establishment of a reserve for excess, slow moving and obsolete inventory.
In assessing the ultimate realization of inventories, we are required to make
judgments as to future demand requirements compared with inventory levels.
Reserve requirements are developed by comparing our inventory levels to our
projected demand requirements based on historical demand, market conditions and
technological and product life cycle changes. It is possible that an increase in
our reserve may be required in the future if there are significant declines in
demand for certain products. This reserve creates a new cost basis for these
products and is considered permanent.
We also
record a reserve for inventory shrinkage. Our inventory shrinkage reserve
represents anticipated physical inventory losses that are recorded and adjusted
as a part of our cycle counting and physical inventory procedures. The reserve
amount is based on historical loss trends, historical physical and cycle-count
adjustments as well as inventory levels. Changes in the reserve result from the
completed cycle counts and physical Inventories. As of December 31, 2009, we had
$4.0 million reserved against Inventories.
Goodwill – Goodwill represents
the excess of cost over the fair value of net assets of businesses acquired and
is allocated to our reporting units at the time of the acquisition. We test
goodwill on an annual basis and when an event occurs or circumstances change
that may reduce the fair value of one of our reporting units below its carrying
amount. A goodwill impairment loss occurs if the carrying amount of a reporting
unit’s goodwill exceeds its fair value.
Goodwill
impairment testing is a two-step process. The first step is used as an indicator
to identify if there is potential goodwill impairment. If the first step
indicates there may be an impairment, the second step is performed which
measures the amount of the goodwill impairment, if any. We perform our goodwill
impairment test as of year end and use our judgment to develop assumptions for
the discounted cash flow model that we use. Management assumptions include
forecasting revenues and margins, estimating capital expenditures, depreciation,
amortization and discount rates.
If our
goodwill impairment testing resulted in one or more of our reporting units’
carrying amount exceeding its fair value, we would write down our reporting
units’ carrying amount to its fair value and would record an impairment charge
in our results of operations in the period such determination is made.
Subsequent reversal of goodwill impairment charges is not permitted. During the
first quarter of 2009, we recorded a goodwill impairment loss of $43.4 million.
Each of our reporting units were tested for impairment as of December 31, 2009
and based upon our analysis, the estimated fair values of our reporting units
substantially exceeded their carrying amounts and therefore we have not recorded
any further impairment loss as of December 31, 2009. We had Goodwill of $20.2
million as of December 31, 2009.
Warranty Reserves – We record
a liability for warranty claims at the time of sale. The amount of the liability
is based on the trend in the historical ratio of claims to net sales, the
historical length of time between the sale and resulting warranty claim, new
product introductions and other factors. Future claims experience could be
materially different from prior results because of the introduction of new, more
complex products, a change in our warranty policy in response to industry
trends, competition or other external forces, or manufacturing changes that
could impact product quality. In the event we determine that our current or
future product repair and replacement costs exceed our estimates, an adjustment
to these reserves would be charged to earnings in the period such determination
is made. Warranty expense as a percentage of Net Sales was 1.4% in 2009, 1.2% in
2008 and 1.2% in 2007. As of December 31, 2009, we had $6.0 million reserved for
future estimated warranty costs.
Income Taxes – When preparing
our Consolidated Financial Statements, we are required to estimate our income
taxes in each of the jurisdictions in which we operate. This process involves
estimating our actual current tax obligations based on expected income,
statutory tax rates and tax planning opportunities in the various jurisdictions.
We also establish reserves for uncertain tax matters that are complex in nature
and uncertain as to the ultimate outcome. Although we believe that our tax
return positions are fully supportable, we consider our ability to ultimately
prevail in defending these matters when establishing these reserves. We adjust
our reserves in light of changing facts and circumstances, such as the closing
of a tax audit. We believe that our current reserves are adequate. However, the
ultimate outcome may differ from our estimates and assumptions and could impact
the income tax expense reflected in our Consolidated Statements of
Earnings.
Tax law
requires certain items to be included in our tax return at different times than
the items are reflected in our results of operations. Some of these differences
are permanent, such as expenses that are not deductible in our tax returns, and
some differences will reverse over time, such as depreciation expense on
property, plant and equipment. These temporary differences result in deferred
tax assets and liabilities, which are included within our Consolidated Balance
Sheets. Deferred tax assets generally represent items that can be used as a tax
deduction or credit in our tax returns in future years but have already been
recorded as an expense in our Consolidated Statements of Earnings. We assess the
likelihood that our deferred tax assets will be recovered from future taxable
income, and, based on management’s judgment, to the extent we believe that
recovery is not more likely than not, we establish a valuation reserve against
those deferred tax assets. The deferred tax asset valuation allowance could be
materially different from actual results because of changes in the mix of future
taxable income, the relationship between book and taxable income and our tax
planning strategies. As of December 31, 2009, a valuation allowance of $9.1
million was recorded against foreign tax loss carryforwards.
Cautionary
Factors Relevant to Forward-Looking Information
Certain
statements contained in this document as well as other written and oral
statements made by us from time to time are considered “forward-looking
statements” within the meaning of the Private Securities Litigation Reform Act
of 1995. These statements do not relate to strictly historical or current facts
and provide current expectations or forecasts of future events. Any such
expectations or forecasts of future events are subject to a variety of factors.
These include factors that affect all businesses operating in a global market as
well as matters specific to us and the markets we serve. Particular risks and
uncertainties presently facing us include:
|
·
|
Geopolitical
and economic uncertainty throughout the
world.
|
|
·
|
Ability
to effectively manage organizational
changes.
|
|
·
|
Ability
to optimize the allocation of resources to our strategic
objectives.
|
|
·
|
Competition
in our business.
|
|
·
|
Ability
to acquire, retain and protect proprietary intellectual property
rights.
|
|
·
|
Ability
to maintain and manage our computer systems and
data.
|
|
·
|
Occurrence
of a significant business
interruption.
|
|
·
|
Unforeseen
product liability claims or product quality
issues.
|
|
·
|
Fluctuations
in the cost or availability of raw materials and purchased
components.
|
|
·
|
Ability
to comply with laws and
regulations.
|
|
·
|
Relative
strength of the U.S. dollar, which affects the cost of our materials and
products purchased and sold
internationally.
|
We
caution that forward-looking statements must be considered carefully and that
actual results may differ in material ways due to risks and uncertainties both
known and unknown. Shareholders, potential investors and other readers are urged
to consider these factors in evaluating forward-looking statements and are
cautioned not to place undue reliance on such forward-looking statements. For
additional information about factors that could materially affect Tennant’s
results, please see our other Securities and Exchange Commission filings,
including disclosures under “Risk Factors” in this document.
We
do not undertake to update any forward-looking statement, and investors are
advised to consult any further disclosures by us on this matter in our filings
with the Securities and Exchange Commission and in other written statements we
make from time to time. It is not possible to anticipate or foresee all risk
factors, and investors should not consider any list of such factors to be an
exhaustive or complete list of all risks or uncertainties.
ITEM 7A – Quantitative and Qualitative Disclosures
About Market Risk
Commodity Risk – We are subject to
exposures resulting from potential cost increases related to our purchase of raw
materials or other product components. We do not use derivative commodity
instruments to manage our exposures to changes in commodity prices such as
steel, oil, gas, lead and other commodities.
Various
factors beyond our control affect the price of oil and gas, including but not
limited to worldwide and domestic supplies of oil and gas, political instability
or armed conflict in oil-producing regions, the price and level of foreign
imports, the level of consumer demand, the price and availability of alternative
fuels, domestic and foreign governmental regulation, weather-related factors and
the overall economic environment. We purchase petroleum-related component parts
for use in our manufacturing operations. In addition, our freight costs
associated with shipping and receiving product and sales and service vehicle
fuel costs are impacted by fluctuations in the cost of oil and gas.
Increases
in worldwide demand and other factors affect the price for lead, steel and
related products. We do not maintain an inventory of raw or fabricated steel or
batteries in excess of near-term production requirements. As a result, increases
in the price of lead or steel can significantly increase the cost of our lead
and steel-based raw materials and component parts.
During
2009, our raw materials and other purchased component costs were favorably
impacted by commodity prices. We continue to focus on mitigating the risk of
continued future raw material or other product component cost increases through
product pricing, negotiations with our vendors and cost reduction actions. The
success of these efforts will depend upon our ability to increase our selling
prices in a competitive market and our ability to achieve cost savings. If the
commodity prices increase, our results may be unfavorably impacted in
2010.
Foreign Currency Exchange Risk
– Due to the
global nature of our operations, we are subject to exposures resulting from
foreign currency exchange fluctuations in the normal course of business. Our
primary exchange rate exposures are with the Euro, British pound, Australian and
Canadian dollars, Japanese yen, Chinese yuan and Brazilian real against the U.S.
dollar. The direct financial impact of foreign currency exchange includes the
effect of translating profits from local currencies to U.S. dollars, the impact
of currency fluctuations on the transfer of goods between Tennant operations in
the United States and abroad and transaction gains and losses. In addition to
the direct financial impact, foreign currency exchange has an indirect financial
impact on our results, including the effect on sales volume within local
economies and the impact of pricing actions taken as a result of foreign
exchange rate fluctuations.
Because a
substantial portion of our products are manufactured or sourced primarily from
the United States, a stronger U.S. dollar generally has a negative impact on
results from operations outside the United States while a weaker dollar
generally has a positive effect. Our objective in managing the exposure to
foreign currency fluctuations is to minimize the earnings effects associated
with foreign exchange rate changes on certain of our foreign
currency-denominated assets and liabilities. We periodically enter into various
contracts, principally forward exchange contracts, to protect the value of
certain of our foreign currency-denominated assets and liabilities. The gains
and losses on these contracts generally approximate changes in the value of the
related assets and liabilities. We had forward exchange contracts outstanding in
the notional amounts of approximately $51 million and $63 million at the end of
2009 and 2008, respectively. The potential for material loss in fair value of
foreign currency contracts outstanding and the related underlying exposures as
of December 31, 2009, from a 10% adverse change is unlikely due to the
short-term nature of our forward contracts. Our policy prohibits us from
entering into transactions for speculative purposes.
Other Matters – Management regularly
reviews our business operations with the objective of improving financial
performance and maximizing our return on investment. As a result of this ongoing
process to improve financial performance, we may incur additional restructuring
charges in the future which, if taken, could be material to our financial
results.
ITEM 8 – Financial Statements and
Supplementary Data
REPORT OF INDEPENDENT REGISTERED PUBLIC ACCOUNTING
FIRM
The Board
of Directors and Shareholders
Tennant
Company:
We have
audited the accompanying consolidated balance sheets of Tennant Company and
subsidiaries as of December 31, 2009 and 2008, and the related consolidated
statements of operations, shareholders’ equity and comprehensive income (loss),
and cash flows for each of the years in the three-year period ended December 31,
2009. We also have audited Tennant Company’s internal control over financial
reporting as of December 31, 2009, based on criteria established in Internal
Control—Integrated Framework issued by the Committee of Sponsoring Organizations
of the Treadway Commission (COSO). Tennant Company’s management is responsible
for these consolidated financial statements, for maintaining effective internal
control over financial reporting, and for its assessment of the effectiveness of
internal control over financial reporting, included in the accompanying
Management’s Report on Internal Control over Financial Reporting. Our
responsibility is to express an opinion on these consolidated financial
statements and an opinion on the Company’s internal control over financial
reporting based on our audits.
We
conducted our audits in accordance with the standards of the Public Company
Accounting Oversight Board (United States). Those standards require that we plan
and perform the audits to obtain reasonable assurance about whether the
consolidated financial statements are free of material misstatement and whether
effective internal control over financial reporting was maintained in all
material respects. Our audits of the consolidated financial statements included
examining, on a test basis, evidence supporting the amounts and disclosures in
the consolidated financial statements, assessing the accounting principles used
and significant estimates made by management, and evaluating the overall
financial statement presentation. Our audit of internal control over financial
reporting included obtaining an understanding of internal control over financial
reporting, assessing the risk that a material weakness exists, and testing and
evaluating the design and operating effectiveness of internal control based on
the assessed risk. Our audits also included performing such other procedures as
we considered necessary in the circumstances. We believe that our audits provide
a reasonable basis for our opinions.
A
company’s internal control over financial reporting is a process designed to
provide reasonable assurance regarding the reliability of financial reporting
and the preparation of financial statements for external purposes in accordance
with generally accepted accounting principles. A company’s internal control over
financial reporting includes those policies and procedures that (1) pertain to
the maintenance of records that, in reasonable detail, accurately and fairly
reflect the transactions and dispositions of the assets of the company; (2)
provide reasonable assurance that transactions are recorded as necessary to
permit preparation of financial statements in accordance with generally accepted
accounting principles, and that receipts and expenditures of the company are
being made only in accordance with authorizations of management and directors of
the company; and (3) provide reasonable assurance regarding prevention or timely
detection of unauthorized acquisition, use, or disposition of the company’s
assets that could have a material effect on the financial
statements.
Because
of its inherent limitations, internal control over financial reporting may not
prevent or detect misstatements. Also, projections of any evaluation of
effectiveness to future periods are subject to the risk that controls may become
inadequate because of changes in conditions, or that the degree of compliance
with the policies or procedures may deteriorate.
In our
opinion, the consolidated financial statements referred to above present fairly,
in all material respects, the financial position of Tennant Company and
subsidiaries as of December 31, 2009 and 2008, and the results of their
operations and their cash flows for each of the years in the three-year period
ended December 31, 2009, in conformity with U.S. generally accepted accounting
principles. Also in our opinion, Tennant Company maintained, in all material
respects, effective internal control over financial reporting as of December 31,
2009, based on criteria established in Internal Control—Integrated Framework
issued by the Committee of Sponsoring Organizations of the Treadway
Commission.
/s/ KPMG
LLP
Minneapolis,
MN
February
26, 2010
Consolidated Statements of Operations
TENNANT
COMPANY AND SUBSIDIARIES
(In thousands, except shares and per share data)
|
Years
ended December 31
|
2009
|
2008
|
2007
|
|||||||||
|
Net
Sales
|
$ | 595,875 | $ | 701,405 | $ | 664,218 | ||||||
|
Cost
of Sales
|
349,767 | 415,155 | 385,234 | |||||||||
|
Gross
Profit
|
246,108 | 286,250 | 278,984 | |||||||||
|
Operating
Expense:
|
||||||||||||
|
Research
and Development Expense
|
22,978 | 24,296 | 23,869 | |||||||||
|
Selling
and Administrative Expense
|
202,260 | 243,614 | 206,242 | |||||||||
|
Goodwill
Impairment Charge
|
43,363 | - | - | |||||||||
|
Gain
on Divestiture of Assets
|
- | (229 | ) | - | ||||||||
|
Gain
on Sale of Facility
|
- | - | (5,972 | ) | ||||||||
|
Total
Operating Expenses
|
268,601 | 267,681 | 224,139 | |||||||||
|
(Loss)
Profit from Operations
|
(22,493 | ) | 18,569 | 54,845 | ||||||||
|
Other
Income (Expense):
|
||||||||||||
|
Interest
Income
|
393 | 1,042 | 1,854 | |||||||||
|
Interest
Expense
|
(2,830 | ) | (3,944 | ) | (898 | ) | ||||||
|
Net
Foreign Currency Transaction (Losses) Gains
|
(412 | ) | 1,368 | 39 | ||||||||
|
ESOP
Income
|
990 | 2,219 | 2,568 | |||||||||
|
Other
Income (Expense), Net
|
32 | (1,679 | ) | (696 | ) | |||||||
|
Total
Other (Expense) Income, Net
|
(1,827 | ) | (994 | ) | 2,867 | |||||||
|
(Loss)
Profit Before Income Taxes
|
(24,320 | ) | 17,575 | 57,712 | ||||||||
|
Income
Tax Expense
|
1,921 | 6,951 | 17,845 | |||||||||
|
Net
(Loss) Earnings
|
$ | (26,241 | ) | $ | 10,624 | $ | 39,867 | |||||
|
Net
(Loss) Earnings per Share
|
||||||||||||
|
Basic
|
$ | (1.42 | ) | $ | 0.58 | $ | 2.14 | |||||
|
Diluted
|
$ | (1.42 | ) | $ | 0.57 | $ | 2.08 | |||||
|
Weighted
Average Shares Outstanding:
|
||||||||||||
|
Basic
|
18,507,772 | 18,303,137 | 18,640,882 | |||||||||
|
Diluted
|
18,507,772 | 18,581,840 | 19,146,025 | |||||||||
|
Cash
Dividends Declared per Common Share
|
$ | 0.53 | $ | 0.52 | $ | 0.48 | ||||||
|
See
accompanying Notes to Consolidated Financial Statements.
|
||||||||||||
TENNANT
COMPANY AND SUBSIDIARIES
(In thousands, except shares and per share data)
|
December
31
|
2009
|
2008
|
||||||
|
Assets
|
||||||||
|
CURRENT
ASSETS
|
||||||||
|
Cash
and Cash Equivalents
|
$ | 18,062 | $ | 29,285 | ||||
|
Receivables:
|
||||||||
|
Trade,
less Allowances for Doubtful Accounts and Returns ($5,077 in 2009 and
$7,319 in 2008)
|
117,146 | 120,331 | ||||||
|
Other
|
4,057 | 3,481 | ||||||
|
Net
Receivables
|
121,203 | 123,812 | ||||||
|
Inventories
|
56,646 | 66,828 | ||||||
|
Prepaid
Expenses
|
10,295 | 18,131 | ||||||
|
Deferred
Income Taxes, Current Portion
|
9,362 | 12,048 | ||||||
|
Other
Current Assets
|
344 | 315 | ||||||
|
Total
Current Assets
|
215,912 | 250,419 | ||||||
|
Property,
Plant and Equipment
|
287,915 | 278,812 | ||||||
|
Accumulated
Depreciation
|
(190,698 | ) | (175,082 | ) | ||||
|
Property,
Plant and Equipment, Net
|
97,217 | 103,730 | ||||||
|
Deferred
Income Taxes, Long-Term Portion
|
7,911 | 6,388 | ||||||
|
Goodwill
|
20,181 | 62,095 | ||||||
|
Intangible
Assets, Net
|
29,243 | 28,741 | ||||||
|
Other
Assets
|
7,262 | 5,231 | ||||||
|
Total
Assets
|
$ | 377,726 | $ | 456,604 | ||||
|
Liabilities
and Shareholders' Equity
|
||||||||
|
CURRENT
LIABILITIES
|
||||||||
|
Current
Debt
|
$ | 4,019 | $ | 3,946 | ||||
|
Accounts
Payable
|
42,658 | 26,536 | ||||||
|
Employee
Compensation and Benefits
|
28,092 | 23,334 | ||||||
|
Income
Taxes Payable
|
3,982 | 3,154 | ||||||
|
Other
Current Liabilities
|
37,401 | 50,189 | ||||||
|
Total
Current Liabilities
|
116,152 | 107,159 | ||||||
|
LONG-TERM
LIABILITIES
|
||||||||
|
Long-Term
Debt
|
30,192 | 91,393 | ||||||
|
Employee-Related
Benefits
|
31,848 | 29,059 | ||||||
|
Deferred
Income Taxes, Long-Term Portion
|
7,417 | 11,671 | ||||||
|
Other
Liabilities
|
7,838 | 7,418 | ||||||
|
Total
Long-Term Liabilities
|
77,295 | 139,541 | ||||||
|
Total
Liabilities
|
193,447 | 246,700 | ||||||
|
COMMITMENTS
AND CONTINGENCIES (Note 13)
|
||||||||
|
SHAREHOLDERS’
EQUITY
|
||||||||
|
Preferred
Stock of $0.02 par value per share,
1,000,000
shares authorized; no shares issued or outstanding
|
- | - | ||||||
|
Common
Stock, $0.375 par value per share, 60,000,000 shares
authorized;
18,750,828
and 18,284,746 issued and outstanding, respectively
|
7,032 | 6,857 | ||||||
|
Additional
Paid-In Capital
|
7,772 | 6,649 | ||||||
|
Retained
Earnings
|
192,584 | 223,692 | ||||||
|
Accumulated
Other Comprehensive Loss
|
(23,109 | ) | (26,391 | ) | ||||
|
Receivable
from ESOP
|
- | (903 | ) | |||||
|
Total
Shareholders’ Equity
|
184,279 | 209,904 | ||||||
|
Total
Liabilities and Shareholders’ Equity
|
$ | 377,726 | $ | 456,604 | ||||
|
See
accompanying Notes to Consolidated Financial Statements.
|
||||||||
TENNANT COMPANY AND
SUBSIDIARIES
|
Years
ended December 31
|
2009
|
2008
|
2007
|
|||||||||
|
OPERATING
ACTIVITIES
|
||||||||||||
|
Net
(Loss) Earnings
|
$ | (26,241 | ) | $ | 10,624 | $ | 39,867 | |||||
|
Adjustments
to Net (Loss) Earnings to arrive at operating cash flow:
|
||||||||||||
|
Depreciation
|
19,632 | 20,360 | 16,901 | |||||||||
|
Amortization
|
3,171 | 2,599 | 1,153 | |||||||||
|
Deferred
Tax Benefit
|
(1,433 | ) | (3,525 | ) | (1,510 | ) | ||||||
|
Goodwill
Impairment Charge
|
43,363 | - | - | |||||||||
|
Stock-Based
Compensation (Benefit) Expense
|
1,809 | (1,227 | ) | 3,140 | ||||||||
|
ESOP
Income (Expense)
|
426 | (498 | ) | (659 | ) | |||||||
|
Tax
Benefit on ESOP
|
6 | 29 | 46 | |||||||||
|
Provision
for Doubtful Accounts and Returns
|
1,253 | 4,007 | 1,690 | |||||||||
|
Gain
on Sale of Facility
|
- | - | (5,972 | ) | ||||||||
|
Other,
Net
|
(77 | ) | 1,344 | 585 | ||||||||
|
Changes
in Operating Assets and Liabilities, Excluding the Impact
of Acquisitions:
|
||||||||||||
|
Accounts
Receivable
|
1,889 | 5,574 | (11,258 | ) | ||||||||
|
Inventories
|
10,476 | (2,258 | ) | (82 | ) | |||||||
|
Accounts
Payable
|
18,679 | (8,620 | ) | (2,337 | ) | |||||||
|
Employee
Compensation and Benefits and Other Accrued Expenses
|
(3,061 | ) | 16,302 | (1,849 | ) | |||||||
|
Income
Taxes Payable/Prepaid
|
4,320 | (11,247 | ) | 2,056 | ||||||||
|
Other
Assets and Liabilities
|
973 | 3,930 | (2,131 | ) | ||||||||
|
Net
Cash Provided by Operating Activities
|
75,185 | 37,394 | 39,640 | |||||||||
|
INVESTING
ACTIVITIES
|
||||||||||||
|
Purchases
of Property, Plant and Equipment
|
(11,483 | ) | (20,790 | ) | (28,720 | ) | ||||||
|
Proceeds
from Disposals of Property, Plant and Equipment
|
311 | 808 | 7,254 | |||||||||
|
Acquisition
of Businesses, Net of Cash Acquired
|
(2,162 | ) | (81,845 | ) | (3,141 | ) | ||||||
|
Purchases
of Short-Term Investments
|
- | - | (7,925 | ) | ||||||||
|
Sales
of Short-Term Investments
|
- | - | 22,175 | |||||||||
|
Net
Cash Used for Investing Activities
|
(13,334 | ) | (101,827 | ) | (10,357 | ) | ||||||
|
FINANCING
ACTIVITIES
|
||||||||||||
|
Change
in Short-Term Borrowings, Net
|
3 | (1,039 | ) | 205 | ||||||||
|
Payments
of Long-Term Debt
|
(67,212 | ) | (4,969 | ) | (2,505 | ) | ||||||
|
Issuance
of Long-Term Debt
|
82 | 87,500 | - | |||||||||
|
Purchases
of Common Stock
|
- | (14,349 | ) | (28,951 | ) | |||||||
|
Proceeds
from Issuances of Common Stock
|
914 | 1,872 | 8,734 | |||||||||
|
Tax
Benefit on Stock Plans
|
114 | 892 | 3,255 | |||||||||
|
Dividends
Paid
|
(9,861 | ) | (9,551 | ) | (8,979 | ) | ||||||
|
Principal
Payment from ESOP
|
1,892 | 1,719 | 1,562 | |||||||||
|
Net
Cash (Used for) Provided by Financing Activities
|
(74,068 | ) | 62,075 | (26,679 | ) | |||||||
|
Effect
of Exchange Rate Changes on Cash and Cash Equivalents
|
994 | (1,449 | ) | (533 | ) | |||||||
|
NET
(DECREASE) INCREASE IN CASH AND CASH EQUIVALENTS
|
(11,223 | ) | (3,807 | ) | 2,071 | |||||||
|
Cash
and Cash Equivalents at Beginning of Year
|
29,285 | 33,092 | 31,021 | |||||||||
|
CASH
AND CASH EQUIVALENTS AT END OF YEAR
|
$ | 18,062 | $ | 29,285 | $ | 33,092 | ||||||
|
SUPPLEMENTAL
CASH FLOW INFORMATION
|
||||||||||||
|
Cash
Paid (Received) During the Year for:
|
||||||||||||
|
Income
Taxes
|
$ | (4,319 | ) | $ | 15,329 | $ | 14,543 | |||||
|
Interest
|
$ | 2,779 | $ | 3,615 | $ | 479 | ||||||
|
Supplemental
Non-Cash Investing and Financing Activities:
|
||||||||||||
|
Capital
Expenditures Funded Through Capital Leases
|
$ | 5,784 | $ | 4,823 | $ | 2,441 | ||||||
|
Collateralized
Borrowings Incurred for Operating Lease Equipment
|
$ | 1,342 | $ | 1,758 | $ | 696 | ||||||
|
See
accompanying Notes to Consolidated Financial Statements.
|
||||||||||||
TENNANT
COMPANY AND SUBSIDIARIES
|
Common
Shares
|
Common
Stock
|
Additional
Paid-in Capital
|
Retained
Earnings
|
Accumulated
Other Comprehensive Income (Loss)
|
Receivable
from ESOP
|
Total
Shareholders' Equity
|
||||||||||||||||||||||
|
Balance,
December 31, 2006
|
18,753,648 | $ | 7,045 | $ | 14,223 | $ | 210,457 | $ | 647 | $ | (2,708 | ) | $ | 229,664 | ||||||||||||||
|
Net
Earnings
|
- | - | - | 39,867 | - | - | 39,867 | |||||||||||||||||||||
|
Foreign
Currency
Translation
Adjustments
|
- | - | - | - | 2,630 | - | 2,630 | |||||||||||||||||||||
|
Pension
Adjustments,
net
of tax of $(1,256)
|
- | - | - | - | 2,230 | - | 2,230 | |||||||||||||||||||||
|
Comprehensive
Income
|
44,727 | |||||||||||||||||||||||||||
|
Issue
Stock for Directors,
Employee Benefit and Stock Plans
|
481,710 | 168 | 8,661 | - | - | - | 8,829 | |||||||||||||||||||||
|
Share-Based
Compensation
|
- | - | 2,753 | - | - | - | 2,753 | |||||||||||||||||||||
|
Dividends
paid,
$0.48 per Common Share
|
- | - | - | (8,979 | ) | - | - | (8,979 | ) | |||||||||||||||||||
|
Tax
Benefit on Stock Plans
|
- | - | 3,255 | - | - | - | 3,255 | |||||||||||||||||||||
|
Tax
Benefit on ESOP
|
- | - | - | 46 | - | - | 46 | |||||||||||||||||||||
|
Adjustment
Related to
FIN
48 Adoption
|
- | - | - | 184 | - | - | 184 | |||||||||||||||||||||
|
Purchases
of Common Stock
|
(735,900 | ) | (276 | ) | (28,675 | ) | - | - | - | (28,951 | ) | |||||||||||||||||
|
Principal
Payments from ESOP
|
- | - | - | - | - | 1,562 | 1,562 | |||||||||||||||||||||
|
Shares
Allocated
|
- | - | - | - | - | (659 | ) | (659 | ) | |||||||||||||||||||
|
Reclassification
|
- | - | 8,048 | (8,048 | ) | - | - | - | ||||||||||||||||||||
|
Balance,
December 31, 2007
|
18,499,458 | $ | 6,937 | $ | 8,265 | $ | 233,527 | $ | 5,507 | $ | (1,805 | ) | $ | 252,431 | ||||||||||||||
|
Net
Earnings
|
- | - | - | 10,624 | - | - | 10,624 | |||||||||||||||||||||
|
Foreign
Currency
Translation
Adjustments
|
- | - | - | - | (26,455 | ) | - | (26,455 | ) | |||||||||||||||||||
|
Pension
Adjustments,
net of tax of $2,070
|
- | - | - | - | (5,443 | ) | - | (5,443 | ) | |||||||||||||||||||
|
Comprehensive
Loss
|
(21,274 | ) | ||||||||||||||||||||||||||
|
Issue
Stock for Directors,
Employee Benefit and Stock Plans
|
235,388 | 89 | 1,498 | - | - | - | 1,587 | |||||||||||||||||||||
|
Share-Based
Compensation
|
- | - | (763 | ) | - | - | - | (763 | ) | |||||||||||||||||||
|
Dividends
paid,
$0.52 per Common Share
|
- | - | - | (9,551 | ) | - | - | (9,551 | ) | |||||||||||||||||||
|
Tax
Benefit on Stock Plans
|
- | - | 892 | - | - | - | 892 | |||||||||||||||||||||
|
Tax
Benefit on ESOP
|
- | - | - | 29 | - | - | 29 | |||||||||||||||||||||
|
Purchases
of Common Stock
|
(450,100 | ) | (169 | ) | (14,180 | ) | - | - | - | (14,349 | ) | |||||||||||||||||
|
Principal
Payments from ESOP
|
- | - | - | - | - | 1,719 | 1,719 | |||||||||||||||||||||
|
Shares
Allocated
|
- | - | - | - | - | (817 | ) | (817 | ) | |||||||||||||||||||
|
Reclassification
|
- | - | 10,937 | (10,937 | ) | - | - | - | ||||||||||||||||||||
|
Balance,
December 31, 2008
|
18,284,746 | $ | 6,857 | $ | 6,649 | $ | 223,692 | $ | (26,391 | ) | $ | (903 | ) | $ | 209,904 | |||||||||||||
|
Net
Loss
|
- | - | - | (26,241 | ) | - | - | (26,241 | ) | |||||||||||||||||||
|
Foreign
Currency
Translation Adjustments
|
- | - | - | - | 5,104 | - | 5,104 | |||||||||||||||||||||
|
Pension
Adjustments,
net of tax of $3,117
|
- | - | - | - | (1,822 | ) | - | (1,822 | ) | |||||||||||||||||||
|
Comprehensive
Loss
|
(22,959 | ) | ||||||||||||||||||||||||||
|
Issue
Stock for Directors,
Employee Benefit and Stock Plans
|
466,082 | 175 | 4,355 | - | - | - | 4,530 | |||||||||||||||||||||
|
Share-Based
Compensation
|
- | - | 1,642 | - | - | - | 1,642 | |||||||||||||||||||||
|
Dividends
paid,
$0.53 per Common Share
|
- | - | - | (9,861 | ) | - | - | (9,861 | ) | |||||||||||||||||||
|
Tax
Benefit on Stock Plans
|
- | - | 114 | - | - | - | 114 | |||||||||||||||||||||
|
Tax
Benefit on ESOP
|
- | - | - | 6 | - | - | 6 | |||||||||||||||||||||
|
Principal
Payments from ESOP
|
- | - | - | - | - | 1,892 | 1,892 | |||||||||||||||||||||
|
Shares
Allocated
|
- | - | - | - | - | (989 | ) | (989 | ) | |||||||||||||||||||
|
Reclassification
|
- | - | (4,988 | ) | 4,988 | - | - | |||||||||||||||||||||
|
Balance,
December 31, 2009
|
18,750,828 | $ | 7,032 | $ | 7,772 | $ | 192,584 | $ | (23,109 | ) | $ | - | $ | 184,279 | ||||||||||||||
The Company had 60,000,000 authorized shares of Common Stock as of
December 31, 2009, 2008 and 2007.
See
accompanying Notes to Consolidated Financial Statements.
22
NOTES
TO THE CONSOLIDATED FINANCIAL STATEMENTS
(in
thousands, except shares and per share data)
|
1.
|
Summary of Significant Accounting
Policies
|
Nature of Operations – Our
primary business is the design, manufacture and sale of products used primarily
in the maintenance of nonresidential surfaces. We provide equipment, parts and
consumables and specialty surface coatings to contract cleaners, corporations,
healthcare facilities, schools and local, state and federal governments. We sell
our products through our direct sales and service organization and a network of
authorized distributors worldwide. Geographically, our customers are primarily
located in North America, Europe, the Middle East, Africa, Asia-Pacific and
Latin America.
Consolidation – The
Consolidated Financial Statements include the accounts of Tennant Company and
its subsidiaries. All material intercompany transactions and balances have been
eliminated. In these Notes to the Consolidated Financial Statements, Tennant
Company is referred to as “Tennant,” “we,” “us,” or “our.”
Translation of Non-U.S.
Currency – Foreign currency-denominated assets and liabilities have been
translated to U.S. dollars at year-end exchange rates, while income and expense
items are translated at average exchange rates prevailing during the year. Gains
or losses resulting from translation are included as a separate component of
Shareholders’ Equity. Foreign currency transaction gains or losses are included
in Other Income (Expense), Net.
Use of Estimates – In
preparing the consolidated financial statements in conformity with U.S.
generally accepted accounting principles, management must make decisions that
impact the reported amounts of assets, liabilities, revenues, expenses, and the
related disclosures, including disclosures of contingent assets and liabilities.
Such decisions include the selection of the appropriate accounting principles to
be applied and the assumptions on which to base accounting estimates. Estimates
are used in determining, among other items, sales promotions and incentives
accruals, inventory valuation, warranty reserves, allowance for doubtful
accounts, pension and postretirement accruals, useful lives for intangible
assets, and future cash flows associated with impairment testing for goodwill
and other long-lived assets. These estimates and assumptions are based on
management’s best estimates and judgments. Management evaluates its estimates
and assumptions on an ongoing basis using historical experience and other
factors that management believes to be reasonable under the circumstances,
including the current economic environment. We adjust such estimates and
assumptions when facts and circumstances dictate. A number of these factors
include, among others, the continued recessionary economic conditions, tight
credit markets, foreign currency, commodity cost volatility, and a decline in
consumer spending and confidence, all of which have combined to increase the
uncertainty inherent in such estimates and assumptions. As future events and
their effects cannot be determined with precision, actual amounts could differ
significantly from those estimated at the time the consolidated financial
statements are prepared. Changes in those estimates resulting from continuing
changes in the economic environment will be reflected in the financial
statements in future periods.
Cash and Cash Equivalents – We
consider all highly liquid investments with maturities of three months or less
from the date of purchase to be cash equivalents.
Short-term Investments –
Short-term investments with maturities of less than one year are classified and
accounted for as available-for-sale and carried at fair value. Changes in fair
value are reported as Accumulated Other Comprehensive Loss. There were no
short-term investments at December 31, 2009 and 2008. There were no unrealized
gains or losses during the years ended December 31, 2009 and 2008.
Receivables – Credit is
granted to our customers in the normal course of business. Receivables are
recorded at original carrying value less reserves for estimated uncollectible
accounts and sales returns. To assess the collectibility of these receivables,
we perform ongoing credit evaluations of our customers’ financial condition.
Through these evaluations, we may become aware of a situation where a customer
may not be able to meet its financial obligations due to deterioration of its
financial viability, credit ratings or bankruptcy. The reserve requirements are
based on the best facts available to us and are reevaluated and adjusted as
additional information becomes available. Our reserves are also based on amounts
determined by using percentages applied to trade receivables. These percentages
are determined by a variety of factors including, but not limited to, current
economic trends, historical payment and bad debt write-off experience. An
account is considered past-due or delinquent when it has not been paid within
the contractual terms. Uncollectible accounts are written off against the
reserves when it is deemed that a customer account is
uncollectible.
Inventories – Inventories are
valued at the lower of cost or market. For Inventories in Europe and China, cost
is determined on a first-in, first-out basis. Cost is determined on a last-in,
first-out basis for substantially all other locations.
Property, Plant and Equipment
– Property, plant and equipment is carried at cost. Additions and improvements
that extend the lives of the assets are capitalized while expenditures for
repairs and maintenance are expensed as incurred. We generally depreciate
buildings and improvements by the straight-line method over a life of 30 years.
Other property, plant and equipment are generally depreciated using the
straight-line method based on lives of 3 years to 15 years.
Goodwill – Goodwill represents
the excess of cost over the fair value of net assets of businesses acquired. We
test Goodwill on an annual basis and when an event occurs or circumstances
change that may reduce the fair value of one of our reporting units below its
carrying amount. A Goodwill impairment occurs if the carrying amount of a
reporting unit’s Goodwill exceeds its fair value. In assessing the
recoverability of Goodwill, we use a discounted cash flow model to estimate the
reporting unit’s fair value to compare to its carrying amount. Management uses
judgment to develop assumptions for the discounted cash flow model including
forecasting revenues and margins, estimating capital expenditures, depreciation,
amortization and discount rates.
Intangible Assets – Intangible
Assets consist of definite lived customer lists, service contracts, an acquired
trade name, technology and an order book. Intangible Assets with a definite life
are amortized on a straight-line basis.
Impairment of Long-lived
Assets – We periodically review our intangible and long-lived assets for
impairment and assess whether events or circumstances indicate that the carrying
amount of the assets may not be recoverable. We generally deem an asset group to
be impaired if an estimate of undiscounted future operating cash flows is less
than its carrying amount. If impaired, an impairment loss is recognized based on
the excess of the carrying amount of the asset group over its fair
value.
Purchases of Common Stock – We
repurchase our Common Stock under a 2007 repurchase program authorized by our
Board of Directors. This program allows us to repurchase up to 1,000,000 shares
of our Common Stock. Upon repurchase, par value is charged to Common Stock and
the remaining purchase price is charged to Additional Paid-in Capital. If the
amount of the remaining purchase price causes the Additional Paid-in Capital
account to be in a debit position, this amount is then reclassified to Retained
Earnings. Common Stock repurchased is included in shares authorized but is not
included in shares outstanding.
Warranty – We record a
liability for estimated warranty claims at the time of sale. The amount of the
liability is based on the trend in the historical ratio of claims to sales, the
historical length of time between the sale and resulting warranty claim, new
product introductions and other factors. In the event we determine that our
current or future product repair and replacement costs exceed our estimates, an
adjustment to these reserves would be charged to earnings in the period such
determination is made. Warranty terms on machines range from one to four
years.
Environmental – We record a
liability for environmental clean-up on an undiscounted basis when a loss is
probable and can be reasonably estimated.
Pension and Profit Sharing
Plans – We have pension and/or profit sharing plans covering
substantially all of our employees. Pension plan costs are
23
NOTES
TO THE CONSOLIDATED FINANCIAL STATEMENTS
(in
thousands, except shares and per share data)
accrued
based on actuarial estimates with the required pension cost funded annually, as
needed.
Postretirement Benefits – We
recognize the cost of retiree health benefits over the employees’ period of
service.
Derivative Financial
Instruments – We use derivative instruments to manage exposures to
foreign currency only in an attempt to limit underlying exposures from currency
fluctuations and not for trading purposes. We periodically enter into various
contracts, principally forward exchange contracts, to protect the value of
certain of our foreign currency-denominated assets and liabilities (principally
the Euro, Australian and Canadian dollars, British pound, Japanese yen, Chinese
yuan and Brazilian real). We have elected not to apply hedge accounting
treatment to these contracts as our contracts are for a short duration. These
contracts are marked-to-market with the related asset or liability recorded in
Other Current Assets or Other Current Liabilities, as applicable. The gains and
losses on these contracts generally approximate changes in the value of the
related assets and liabilities. Gains or losses on forward foreign exchange
contracts to economically hedge foreign currency-denominated net assets and
liabilities are recognized in Other Income (Expense) under Net Foreign Currency
Transaction Gains (Losses) within the Consolidated Statements of
Earnings.
Revenue Recognition – We
recognize revenue when persuasive evidence of an arrangement exists, title and
risk of ownership have passed, the sales price is fixed or determinable and
collectibility is probable. Generally, these criteria are met at the time the
product is shipped. Provisions for estimated returns, rebates and discounts are
provided for at the time the related revenue is recognized. Freight revenue
billed to customers is included in Net Sales and the related shipping expense is
included in Cost of Sales. Service revenue is recognized in the period the
service is performed, or ratably over the period of the related service
contract.
Customers
may obtain financing through third-party leasing companies to assist in their
acquisition of our equipment products. Certain lease transactions classified as
operating leases contain retained ownership provisions or guarantees, which
results in recognition of revenue over the lease term. As a result, we defer the
sale of these transactions and record the sales proceeds as collateralized
borrowings or deferred revenue. The underlying equipment relating to operating
leases is depreciated on a straight-line basis, not to exceed the equipment’s
estimated useful life.
Revenues
from contracts with multiple element arrangements are recognized as each element
is earned. We offer service contracts in conjunction with equipment sales in
addition to selling equipment and service contracts separately. Sales proceeds
related to service contracts are deferred if the proceeds are received in
advance of the service and recognized ratably over the contract
period.
Stock-based Compensation – We
account for employee stock-based compensation using the fair value based method.
Our stock-based compensation plans are more fully described in Note
15.
Research and Development –
Research and development costs are expensed as incurred.
Advertising Costs – We advertise products,
technologies, and solutions to customers and prospective customers through a
variety of marketing campaign and promotional efforts. These efforts include
tradeshows, online advertising, email marketing, mailings, sponsorships, and
telemarketing. Advertising costs are expensed as incurred. In 2009, 2008 and
2007 such activities amounted to $4,380, $6,440 and $4,929,
respectively.
Income Taxes – Deferred tax
assets and liabilities are recognized for the expected future tax consequences
of temporary differences between the book and tax bases of existing assets and
liabilities. A valuation allowance is provided when, in management’s judgment,
it is more likely than not that some portion or all of the deferred tax asset
will not be realized. We have established contingent tax liabilities using
management’s best judgment. We adjust these liabilities as facts and
circumstances change. Interest Expense is recognized in the first period the
interest would begin accruing. Penalties are recognized in the period we claim
or expect to claim the position in our tax return. Interest and penalties
expenses are classified as an income tax expense.
On
January 1, 2007 we adopted the requirements of new accounting guidance which
clarifies accounting for income taxes by prescribing the minimum threshold a tax
position is required to meet before being recognized in the financial
statements. Guidance was also provided on derecognition, measurement,
classification, interest and penalties, accounting in interim periods,
disclosure and transition. See Note 14 for further information.
Sales Tax – Sales taxes collected
from customers and remitted to governmental authorities are presented on a net
basis.
Earnings per Share – Basic
earnings per share is computed by dividing net earnings (loss) by the weighted
average number of common shares outstanding during the period. Diluted earnings
per share assume conversion of potentially dilutive stock options and restricted
share awards. Performance-based shares are included in the calculation of
diluted earnings per share in the quarter in which the performance targets have
been achieved.
Subsequent Events - Events
that have occurred subsequent to December 31, 2009 have been
evaluated.
Reclassifications - We have
reclassified certain prior period amounts to conform to the proper current
period presentation. For the period ended December 31, 2008, we decreased cash
used for operating activities and increased cash used for investing activities
by $152 to properly reflect the non-cash transfers between Inventory and
Property, Plant and Equipment. These reclassifications are not material and
had no effect on previously reported consolidated Net (Loss) Earnings or
Shareholders' Equity.
|
2.
|
Newly Adopted Accounting
Pronouncements
|
Generally
Accepted Accounting Principles
In June
2009, the Financial Accounting Standards Board (“FASB”) issued Statement of
Financial Accounting Standards (“FAS”) No. 168, “The FASB Accounting Standards
Codification (“ASC”) and the Hierarchy of Generally Accepted Accounting
Principles – a replacement of FASB Statement No. 162” (“FAS No. 168”). FAS
No. 168 reorganized existing U.S. accounting and reporting standards issued by
the FASB and other related private sector standard setters into a single source
of authoritative accounting principles arranged by topic. The ASC has become the
source of authoritative U.S. generally accepted accounting principles (“GAAP”).
FAS No. 168 was effective on a prospective basis for interim and annual
reporting periods ending after September 15, 2009. The adoption of the FAS No.
168 changed our references to U.S. GAAP but does not have an impact on our
financial position or results of operations.
Intangibles
– Goodwill and Other
In
April 2008, the FASB issued revised guidance on determining the useful life
of intangible assets. The revised guidance amends the factors that should be
considered in developing renewal or extension assumptions used to determine the
useful life of a recognized intangible asset. The revised guidance is effective
for fiscal years beginning on or after December 15, 2008 and should be
applied prospectively to intangible assets acquired after the effective date.
The adoption of the revised guidance did not have an impact on our financial
position or results of operations.
Compensation
– Retirement Benefits
In
December 2008, the FASB issued new guidance that requires an employer to make
certain disclosures about plan assets of a defined benefit pension or other
postretirement plan. The requirements are effective for fiscal years ending
after December 15, 2009. The new guidance pertains only to the disclosures and
does not affect the accounting for defined benefit pensions or
24
NOTES
TO THE CONSOLIDATED FINANCIAL STATEMENTS
(in
thousands, except shares and per share data)
other
postretirement plans. The additional disclosures required by this standard are
included in Note 11.
Business
Combinations
In
December 2007, the FASB issued guidance for business combinations that requires
most identifiable assets, liabilities, noncontrolling interests and goodwill
acquired to be recorded at full fair value. It also establishes disclosure
requirements that will enable users to evaluate the nature and financial effects
of the business combination. The provisions are effective for fiscal years
beginning on or after December 15, 2008. The adoption of the new guidance
applies prospectively to business combinations completed on or after January 1,
2009. The adoption of the new guidance did not have a material impact on our
financial position or results of operations.
In April
2009, the FASB issued revised guidance which amends and clarifies the accounting
for business combinations to address application issues raised by preparers,
auditors and members of the legal profession on initial recognition and
measurement, subsequent measurement and accounting, and disclosure of assets and
liabilities arising from contingencies in a business combination. The provisions
are effective for fiscal years beginning on or after December 15, 2008. The
adoption of the revised guidance applies prospectively to business combinations
completed on or after January 1, 2009. The adoption of the revised guidance did
not have an impact on our financial position or results of
operations.
Fair
Value Measurements and Disclosures
In
September 2006, the FASB issued guidance that establishes a framework for
measuring fair value under GAAP and expands disclosure about fair value
measurements. In February 2008, the FASB issued additional guidance which states
that the earlier guidance does not address fair value measurements for purposes
of lease classification or measurement. In February 2008, the FASB deferred the
implementation for certain nonfinancial assets and liabilities. We adopted the
required provisions as of January 1, 2008 and adopted the deferred provisions on
January 1, 2009. The adoptions of these provisions did not have an impact on our
financial position or results of operations. The additional disclosures required
by this standard are included in Note 10.
In April
2009, the FASB issued guidance on how to determine the fair value of assets and
liabilities in the current economic environment and reemphasizes that the
objective of fair-value measurement remains an exit price. The requirements are
effective for interim and annual periods ending after June 15, 2009. The
adoption of the new guidance did not have an impact on our financial position or
results of operations.
In
August 2009, the FASB issued new guidance that provides clarification in
certain circumstances in which a quoted price in an active market for the
identical liability is not available; a company is required to measure fair
value using an alternative valuation technique. The new guidance is effective
for interim and annual periods beginning after August 27, 2009. The
adoption of the new guidance did not have an impact on our financial position or
results of operations.
Financial
Instruments
In April
2009, the FASB issued guidance related to the disclosure of the fair value of
financial instruments. The guidance requires publicly traded companies to
disclose the fair value of financial instruments in interim financial
statements, adding to the current requirement to make those disclosures in
annual financial statements. The provisions of the guidance are effective for
interim periods ending after June 15, 2009. The adoption of the guidance did not
have an impact on our financial position or results of operations. The
additional disclosures required by this standard are included in Note
10.
Subsequent
Events
In May
2009, the FASB issued guidance that establishes general standards of accounting
for and disclosures of events that occur after the balance sheet date but before
the financial statements are issued or are available to be issued. We have
adopted the guidance, which is effective for interim and annual periods ending
after June 15, 2009. The adoption of the new guidance did not have an impact on
our financial position or results of operations. The additional disclosures
required by this standard are included in Note 1.
|
3.
|
Management Actions
|
During
the fourth quarter of 2008, we announced a workforce reduction program to reduce
our worldwide employee base by approximately 8%, or about 240 people. A pretax
charge of $14,551, including other associated costs of $290, was recognized in
the fourth quarter of 2008 as a result of this program. The workforce reduction
was accomplished primarily through the elimination of salaried positions across
the organization. The pretax charge consisted primarily of severance and
outplacement services and was included within Selling and Administrative Expense
in the 2008 Consolidated Statement of Operations.
The
components of the 2008 restructuring action were as follows:
|
Severance,
Early Retirement and Related Costs
|
||||
|
2008
workforce reduction action
|
$ | 14,261 | ||
|
Cash
payments
|
(355 | ) | ||
|
Foreign
currency adjustments
|
5 | |||
|
December
31, 2008 balance
|
$ | 13,911 | ||
|
2009
utilization:
|
||||
|
Cash
payments
|
(11,206 | ) | ||
|
Foreign
currency adjustments
|
(56 | ) | ||
|
Change
in estimate
|
(2,003 | ) | ||
|
December
31, 2009 balance
|
$ | 646 | ||
The
change in estimate was primarily the result of an adjustment during the first
quarter of 2009 due to lower than anticipated severance costs in Europe both on
an employee settlement basis and also the opportunity to eliminate open
positions due to employee turnover thereby avoiding some severance payments.
Additional adjustments during the second, third and fourth quarters of 2009 were
due to small fluctuations between estimated and actual payments made to date, as
well as the reversal of certain outplacement services not utilized by these
employees.
|
4.
|
Acquisitions and
Divestitures
|
Acquisitions
On
February 27, 2009, we acquired certain assets of Applied Cleansing Solutions Pty
Ltd ("Applied Cleansing"), a long-term importer and distributor for Green
Machines™ products in Australia and New Zealand, in a business combination for
an initial purchase price of $379 in cash. This acquisition provides us with the
opportunity to accelerate our growth in the city cleaning business within the
Asia Pacific region. The purchase agreement also provides for additional
contingent consideration to be paid for each of the four quarters following the
acquisition date if certain future revenue targets are met. We recorded
additional contingent consideration of approximately $207, which represented our
best estimate of these probable quarterly payments. As of December 31, 2009, we
have paid additional consideration of $152 for the first three quarters
following the date of acquisition. The acquisition of Applied Cleansing is
accounted for as a business combination and the results of operations have been
included in the Consolidated Financial Statements since the date of acquisition.
The purchase price allocation is preliminary and will be adjusted retroactively
based upon the final determination of fair value of assets acquired and
liabilities assumed.
On
December 1, 2008, we entered into an asset purchase agreement with Hewlett
Equipment (“Hewlett”) for a purchase price of $625 in cash. The assets purchased
consist of industrial equipment. The purchase of Hewlett’s existing
25
NOTES
TO THE CONSOLIDATED FINANCIAL STATEMENTS
(in
thousands, except shares and per share data)
rental
fleet of industrial equipment will accelerate Tennant’s strategy to grow its
direct sales and service business in the Brisbane, Australia area. Hewlett will
continue as a distributor and service agent of Tennant’s commercial
equipment.
On August
15, 2008, we acquired Shanghai ShenTan Mechanical and Electrical Equipment Co.
Ltd. (“Shanghai ShenTan”) for a purchase price including transaction costs of
$598 in cash. The purchase agreement provides for additional contingent
consideration to be paid in each of the three one-year periods following the
acquisition date if certain future revenue targets are met and if other future
events occur. Amounts paid under this earn-out will be considered additional
purchase price. The potential earn-out is denominated in foreign currency which
approximates $600 in the aggregate and is calculated based on 1) growth in
revenues and 2) visits to specified customer locations during each of the three
one-year periods following the acquisition date. During 2009, we recorded $100
for the earn-out related to the first one-year period following the
acquisition.
On March
28, 2008, we acquired Sociedade Alfa Ltda. (“Alfa”) for an initial purchase
price including transaction costs of $12,252 in cash and $1,445 in debt assumed.
Alfa manufactures the Alfa brand of commercial cleaning machines, is based in
São Paulo, Brazil, and is recognized as the market leader in the Brazilian
cleaning equipment industry. The purchase agreement with Alfa also provides for
additional contingent consideration up to approximately $6,800 to be paid if
certain revenue targets are met based on growth in revenues during the 2009
calendar year. Amounts paid under this earn-out will be considered additional
purchase price. During the first quarter of 2009, we paid the maximum earn-out
amount of $1,167 related to the interim period calculation based on growth in
2008 revenues.
On
February 29, 2008, we acquired Applied Sweepers, Ltd. (“Applied Sweepers”), a
privately-held company based in Falkirk, Scotland, for a purchase price
including transaction costs of $68,900 in cash. Applied Sweepers is the
manufacturer of Green Machines™ and is recognized as the leading manufacturer of
sub-compact outdoor sweeping machines in the United Kingdom. Applied Sweepers
also had locations in the United States, France and Germany and sells through a
broad distribution network around the world.
The
components of the purchase prices of the business combinations described above
have been allocated as follows:
|
Current
Assets
|
$ | 15,148 | ||
|
Identified
Intangible Assets
|
35,144 | |||
|
Goodwill
|
47,615 | |||
|
Other
Long-Term Assets
|
6,126 | |||
|
Total
Assets Acquired
|
104,033 | |||
|
Current
Liabilities
|
11,211 | |||
|
Long-Term
Liabilities
|
9,203 | |||
|
Total
Liabilities Assumed
|
20,414 | |||
|
Net
Assets Acquired
|
$ | 83,619 |
The
following unaudited Pro Forma Consolidated Financial Results of Operations for
the periods ended December 31, 2009 and 2008 are presented as if the Applied
Sweepers and Alfa acquisitions had been completed at the beginning of each
period presented. Hewlett was not a business combination and therefore was not
included, and Shanghai ShenTan and Applied Cleansing have been excluded from the
unaudited Pro Forma Consolidated Condensed Financial Results of Operations for
the period ended December 31, 2009 as these entities were distributors of
Tennant or Applied Sweepers products prior to their respective acquisition dates
and therefore have no impact to Pro Forma Net Sales and an insignificant impact
to Pro Forma Net (Loss) Earnings and Pro Forma (Loss) Earnings per
Share.
|
2009
|
2008
|
|||||||
|
Pro
Forma Net Sales
|
$ | 595,875 | $ | 708,231 | ||||
|
Pro
Forma Net (Loss) Earnings
|
(26,241 | ) | 10,685 | |||||
|
Pro
Forma (Loss) Earnings per Share:
|
||||||||
|
Basic
|
(1.42 | ) | 0.58 | |||||
|
Diluted
|
(1.42 | ) | 0.58 | |||||
|
Weighted
Average Shares Outstanding:
|
||||||||
|
Basic
|
18,507,772 | 18,303,137 | ||||||
|
Diluted
|
18,507,772 | 18,581,840 | ||||||
These
unaudited Pro Forma Condensed Consolidated Financial Results have been prepared
for comparative purposes only and include certain adjustments, such as increased
interest expense on acquisition debt and amortization of Intangible Assets. The
adjustments do not reflect the effect of synergies that would have been expected
to result from the integration of these acquisitions. The unaudited pro forma
information does not purport to be indicative of the results of operations that
actually would have resulted had the combination occurred on January 1 of each
period presented or of future results of the consolidated entities.
Divestitures
On June
20, 2008, we completed the sale of certain assets related to our Centurion
product to Wayne Sweepers LLC (“Wayne Sweepers”) and agreed not to compete with
this specific type of product in North America for a period of two years from
the date of sale. In exchange for these assets, we received $100 in cash and
financed the remaining purchase price of $525 to Wayne Sweepers, with an
effective interest rate of 7.00%, over a period of three and a half years and
began receiving equal quarterly payments of approximately $38 in the fourth
quarter of 2008. As a result of this divestiture, we recorded a pretax gain of
$229 in Profit from Operations in our 2008 Consolidated Statement of Earnings
and a reduction primarily to Property, Plant and Equipment. We will also
receive approximately an additional $900 in royalty payments on the first
approximately 250 units manufactured and sold by Wayne Sweepers. These royalty
payments will be received and recognized quarterly as the units are
sold.
|
5.
|
Inventories
|
The
composition of Inventories at December 31, were as follows:
|
2009
|
2008
|
|||||||
|
Inventories
carried at LIFO:
|
||||||||
|
Finished
goods
|
$ | 36,528 | $ | 52,289 | ||||
|
Raw
materials, production parts and work-in-process
|
16,210 | 17,468 | ||||||
|
LIFO
reserve
|
(28,873 | ) | (32,481 | ) | ||||
|
Total
LIFO inventories
|
23,865 | 37,276 | ||||||
|
Inventories
carried at FIFO:
|
||||||||
|
Finished
goods
|
17,063 | 17,200 | ||||||
|
Raw
materials, production parts and work-in-process
|
15,718 | 12,352 | ||||||
|
Total
FIFO inventories
|
32,781 | 29,552 | ||||||
|
Total
Inventories
|
$ | 56,646 | $ | 66,828 | ||||
The LIFO
reserve approximates the difference between LIFO carrying cost and
FIFO.
26
NOTES
TO THE CONSOLIDATED FINANCIAL STATEMENTS
(in
thousands, except shares and per share data)
During
2009, LIFO inventory layers were reduced. This reduction resulted in charging
lower inventory costs prevailing in previous years to cost of sales, thus
reducing cost of sales by $3,608 below the amount that would have resulted from
replacing the liquidated inventory at end of year prices.
|
6.
|
Property, Plant and
Equipment
|
Property,
Plant and Equipment and related Accumulated Depreciation, including equipment
under capital leases, at December 31, consisted of the following:
|
2009
|
2008
|
|||||||
|
Land
|
$ | 4,430 | $ | 4,416 | ||||
|
Buildings
and improvements
|
49,572 | 47,179 | ||||||
|
Machinery
and equipment
|
229,845 | 221,814 | ||||||
|
Work
in progress
|
4,068 | 5,403 | ||||||
|
Total
Property, Plant and Equipment
|
287,915 | 278,812 | ||||||
|
Less:
Accumulated Depreciation
|
(190,698 | ) | (175,082 | ) | ||||
|
Net
Property, Plant and Equipment
|
$ | 97,217 | $ | 103,730 | ||||
|
7.
|
Goodwill and Intangible
Assets
|
During
the first quarter of 2009, the price of our stock decreased to the point that
our carrying amount exceeded our market capitalization for a period of time
leading up to and including March 31, 2009. Accordingly, we performed interim
impairment tests as of March 31, 2009 on our goodwill and other intangible
assets. For purposes of performing our interim goodwill impairment analysis,
consistent with our year end 2008 annual impairment analysis, we identified our
reporting units as North America; Europe, Middle East, Africa (“EMEA”); Asia
Pacific; and Latin America. As quoted market prices are not available for
our reporting units, estimated fair value was determined using an average
weighting of both projected discounted future cash flows and the use of
comparative market multiples. The use of comparative market multiples (the
market approach) compares us to other comparable companies based on valuation
multiples to arrive at a fair value. The use of projected discounted future cash
flows (discounted cash flow approach) is based on management’s assumptions
including forecasted revenues and margins, estimated capital expenditures,
depreciation, amortization and discount rates. Changes in economic and operating
conditions that occur after the annual impairment analysis or an interim
impairment analysis, and that impact these assumptions, may result in a future
goodwill impairment charge.
Upon
performing the first step test for the interim impairment analysis, the
estimated fair values of the North America, Asia Pacific, and Latin America
reporting units exceeded their carrying amounts. However, we determined that the
fair value of the EMEA reporting unit was below its carrying amount, indicating
a potential goodwill impairment existed. Having determined that the goodwill of
the EMEA reporting unit was potentially impaired, we performed Step 2 of the
goodwill impairment analysis which involved calculating the implied fair value
of its goodwill by allocating the fair value of the reporting unit to all of its
assets and liabilities other than goodwill (including both recognized and
unrecognized intangible assets) and comparing the residual value to the carrying
amount of goodwill. As of March 31, 2009, as a result of our interim impairment
tests, we recorded an impairment loss related to our EMEA reporting unit, which
totaled $43,363, representing 100% of the goodwill for this reporting unit.
There was no impairment of our other intangible assets.
The
income tax benefit associated with the 2009 first quarter goodwill impairment
was $1,074 which relates to the tax deductible portion of the goodwill
impairment.
Each of
our reporting units were tested for impairment as of December 31, 2009 and based
upon our analysis, the estimated fair values of our reporting units
substantially exceeded their carrying amounts and therefore we have not recorded
any further impairment loss as of December 31, 2009. We had Goodwill of $20,181
as of December 31, 2009.
The
changes in the carrying amount of Goodwill as of December 31, are as
follows:
| Accumulated | ||||||||||||
| Impairment | ||||||||||||
|
Goodwill
|
Losses
|
Total
|
||||||||||
|
Balance
as of December 31, 2008
|
$ | 62,095 | $ | - | $ | 62,095 | ||||||
|
Additions
|
909 | - | 909 | |||||||||
|
Impairment
losses
|
- | (43,363 | ) | (43,363 | ) | |||||||
|
Foreign
currency fluctuations
|
5,702 | (5,162 | ) | 540 | ||||||||
|
Balance
as of December 31, 2009
|
$ | 68,706 | $ | (48,525 | ) | $ | 20,181 | |||||
|
Balance
as of December 31, 2007
|
$ | 29,053 | $ | - | $ | 29,053 | ||||||
|
Additions
|
43,877 | - | 43,877 | |||||||||
|
Impairment
losses
|
- | - | - | |||||||||
|
Foreign
currency fluctuations
|
(10,835 | ) | - | (10,835 | ) | |||||||
|
Balance
as of December 31, 2008
|
$ | 62,095 | $ | - | $ | 62,095 | ||||||
The
balances of acquired Intangible Assets, excluding Goodwill, as of December 31,
are as follows:
|
Customer
|
||||||||||||||||
| Lists, Service |
|
|||||||||||||||
| Contracts and |
Trade
|
|||||||||||||||
| Order Book |
Name
|
Technology
|
Total
|
|||||||||||||
|
Balance
as of December 31, 2009
|
||||||||||||||||
|
Original
cost
|
$ | 27,018 | $ | 4,999 | $ | 3,684 | $ | 35,701 | ||||||||
|
Accumulated
amortization
|
(4,911 | ) | (594 | ) | (953 | ) | (6,458 | ) | ||||||||
|
Carrying
amount
|
$ | 22,107 | $ | 4,405 | $ | 2,731 | $ | 29,243 | ||||||||
| Weighted-average original life (in years) | 14 | 14 | 11 | |||||||||||||
|
Balance
as of December 31, 2008
|
||||||||||||||||
|
Original
cost
|
$ | 23,520 | $ | 4,927 | $ | 3,770 | $ | 32,217 | ||||||||
|
Accumulated
amortization
|
(2,184 | ) | (474 | ) | (818 | ) | (3,476 | ) | ||||||||
|
Carrying
amount
|
$ | 21,336 | $ | 4,453 | $ | 2,952 | $ | 28,741 | ||||||||
|
Weighted-average
original life (in years)
|
14 | 14 | 12 | |||||||||||||
The
additions to Goodwill and Intangible Assets during 2009 were based on the
preliminary purchase price allocations of Applied Cleansing as described in Note
4, plus adjustments related to our acquisitions of Applied Sweepers, Alfa and
Shanghai ShenTan. The Shanghai ShenTan Intangible Asset consisted of a customer
list and is amortized over a useful life of 8 years.
The
additions to Goodwill and Intangible Assets during 2008 were based on the
preliminary purchase price allocations of Applied Sweepers, Alfa and Shanghai
ShenTan, plus adjustments to Goodwill related to the Floorep acquisition in
February 2007. The Applied Sweepers Intangible Assets consisted of customer
lists and service contracts, a trade name and technology with weighted average
amortization periods of 15 years, 14 years and 11 years, respectively. The Alfa
Intangible Asset consisted of a customer list and is
amortized
over a useful life of 9 years. The total weighted average amortization period
for acquired Intangible Assets during the period is 14 years.
27
NOTES
TO THE CONSOLIDATED FINANCIAL STATEMENTS
(in
thousands, except shares and per share data)
Amortization
expense on Intangible Assets was $3,120, $2,543 and $821 for the years ended
December 31, 2009, 2008 and 2007, respectively.
Estimated
aggregate amortization expense based on the current carrying amount of
amortizable Intangible Assets for each of the five succeeding years is as
follows:
|
2010
|
$ | 3,158 | ||
|
2011
|
3,156 | |||
|
2012
|
2,622 | |||
|
2013
|
2,496 | |||
|
2014
|
2,345 | |||
|
Thereafter
|
15,466 | |||
|
Total
|
$ | 29,243 |
|
8.
|
Short-term
borrowings and Long-Term Debt as of December 31:
|
2009
|
2008
|
|||||||
|
Short-term
borrowings:
|
||||||||
|
Bank
borrowings
|
$ | 7 | $ | - | ||||
|
Long-Term
Debt:
|
||||||||
|
Bank
borrowings
|
174 | 63 | ||||||
|
Credit
facility borrowings
|
25,000 | 87,500 | ||||||
|
Collateralized
borrowings
|
1,342 | 1,758 | ||||||
|
Capital
lease obligations
|
7,688 | 6,018 | ||||||
|
Total
Long-Term Debt
|
34,204 | 95,339 | ||||||
|
Less:
current portion
|
4,012 | 3,946 | ||||||
|
Long-term
portion
|
$ | 30,192 | $ | 91,393 | ||||
As of
December 31, 2009, we had committed lines of credit totaling approximately
$134,336 and uncommitted lines of credit totaling $80,000. There was $25,000 in
outstanding borrowings under our JPMorgan facility and no borrowings under any
other facilities as of December 31, 2009. In addition, we had stand alone
letters of credit of approximately $2,101 outstanding and bank guarantees in the
amount of approximately $998. Commitment fees on unused lines of credit for the
year ended December 31, 2009 were $512.
Our most
restrictive covenants are part of our Credit Agreement with JPMorgan, which are
the same covenants in our Shelf Agreement with Prudential described below, and
require us to maintain an indebtedness to EBITDA ratio of not greater than 3.50
to 1 and to maintain an EBITDA to interest expense ratio of no less than 3.50 to
1 as of the end of each quarter. As of December 31, 2009, our indebtedness to
EBITDA ratio was 0.88 to 1 and our EBITDA to interest expense ratio was 14.94 to
1.
Credit
Facilities
JPMorgan
Chase Bank, National Association
On June
19, 2007, we entered into a Credit Agreement (the “Credit Agreement”) with
JPMorgan Chase Bank, National Association (“JPMorgan”), as administrative agent,
Bank of America, N.A., as syndication agent, BMO Capital Markets Financing, Inc.
and U.S. Bank National Association, as Co-Documentation Agents and the Lenders
from time to time party thereto. The Credit Agreement provides us and certain of
our foreign subsidiaries access to a $125,000 revolving credit facility until
June 19, 2012. Borrowings may be denominated in U.S. dollars or certain other
currencies. The facility is available for general corporate purposes, working
capital needs, share repurchases and acquisitions. The Credit Agreement
contains customary representations, warranties and covenants, including but not
limited to covenants restricting our ability to incur indebtedness and liens and
to merge or consolidate with another entity. Further, the Credit Agreement
initially contained a covenant requiring us to maintain an indebtedness to
EBITDA ratio as of the end of each quarter of not greater than 3.50 to 1 and to
maintain an EBITDA to interest expense ratio of no less than 3.50 to
1.
On
February 21, 2008, we amended the Credit Agreement to increase the sublimit on
foreign currency borrowings from $75,000 to $125,000 and to increase the
sublimit on borrowings by the foreign subsidiaries from $50,000 to
$100,000.
On March
4, 2009, we entered into a second amendment to the Credit Agreement. This
amendment principally provided: (i) an exclusion from our EBITDA calculation for
all non-cash losses and charges, up to $15,000 cash restructuring charges during
the 2008 fiscal year and up to $3,000 cash restructuring charges during the 2009
fiscal year, (ii) an amendment of the indebtedness to EBITDA financial ratio
required for the second and third quarters of 2009 to not greater than 4.00 to 1
and 5.50 to 1, respectively, (iii) an amendment to the EBITDA to interest
expense financial ratio for the third quarter of 2009 to not less than 3.25 to
1, and (iv) the ability for us to incur up to an additional $80,000 of
indebtedness pari passu with the lenders under the Credit Agreement. The
revolving credit facility available under the Credit Agreement remains at
$125,000, but the amendment reduced the expansion feature under the Credit
Agreement from $100,000 to $50,000. The amendment put a cap on permitted new
acquisitions of $2,000 for the 2009 fiscal year and the amount of permitted new
acquisitions in fiscal years after 2009 will be limited according to our then
current leverage ratio. The amendment prohibited us from conducting share
repurchases during the 2009 fiscal year and limits the payment of dividends and
repurchases of stock in fiscal years after 2009 to an amount ranging from
$12,000 to $40,000 based on our leverage ratio after giving effect to such
payments. Finally, if we obtain additional indebtedness as permitted under the
amendment, to the extent that any revolving loans under the credit agreement are
then outstanding we are required to prepay the revolving loans in an amount
equal to 100% of the proceeds from the additional indebtedness. Additionally,
proceeds over $25,000 and under $35,000 will reduce the revolver commitment on a
50% dollar for dollar basis and proceeds over $35,000 will reduce the revolver
commitment on a 100% dollar for dollar basis.
In
conjunction with the amendment to the Credit Agreement, we gave the lenders a
security interest on most of our personal property and pledged 65% of the stock
of all domestic and first tier foreign subsidiaries. The obligations under the
Credit Agreement are also guaranteed by our domestic subsidiaries and those
subsidiaries also provide a security interest in their similar personal
property.
Included
in the amendment were increased interest spreads and increased facility fees.
The fee for committed funds under the Credit Agreement now ranges from an annual
rate of 0.30% to 0.50%, depending on our leverage ratio. Borrowings under the
Credit Agreement bear interest at an annual rate of, at our option, either
(i) between LIBOR plus 2.20% to LIBOR plus 3.00%, depending on our leverage
ratio; or (ii) the highest of (A) the prime rate, (B) the federal funds rate
plus 0.50%, and (C) the adjusted LIBOR rate for a one month period plus 1.00%;
plus, in any such case under this clause (ii), an additional spread of 1.20% to
2.00%, depending on our leverage ratio.
We were
in compliance with all covenants under the Credit Agreement as of December 31,
2009. There was $25,000 in outstanding borrowings under this facility at
December 31, 2009, with a weighted average interest rate of 2.44%.
28
NOTES
TO THE CONSOLIDATED FINANCIAL STATEMENTS
(in
thousands, except shares and per share data)
Prudential
Investment Management, Inc.
On July
29, 2009, we entered into a Private Shelf Agreement (the “Shelf Agreement”) with
Prudential Investment Management, Inc. (“Prudential”) and Prudential affiliates
from time to time party thereto. The Shelf Agreement provides us and our
subsidiaries access to uncommitted, senior secured, debt capital with a maximum
aggregate principal amount of $80,000.
The
minimum principal amount of the private shelf notes that can be issued at any
time under the Shelf Agreement is $5,000 with an issuance fee of 0.10% of the
U.S. dollar equivalent of the principal amount of the issued shelf notes,
payable on the date of issuance. The Shelf Agreement also provides for other
fees, including a fee of an additional 1.00% per annum, in addition to the
interest accruing on the shelf notes, in the event the amount of capital
required to be held in reserve by a holder of the shelf notes in respect of such
shelf notes is greater than the amount which would be required to be held in
reserve with respect to promissory notes rated investment grade by a nationally
recognized rating agency. Any private shelf note issued during the issuance
period may have a maturity of up to 12 years, provided that the average life for
each private shelf note issued is no more than 10 years after the original
issuance date. Prepayments of the shelf notes will be subject to payment of
yield maintenance amounts to the holders of the shelf notes.
The Shelf
Agreement contains representations, warranties and covenants, including but not
limited to covenants restricting our ability to incur indebtedness and liens and
merge or consolidate with another entity. Further, the Shelf Agreement contains
a covenant requiring us to maintain an indebtedness to EBITDA ratio for the
second and third quarters of 2009 of not greater than 4.00 to 1 and 5.50 to 1,
respectively, and thereafter as of the end of each quarter of not greater than
3.50 to 1. The Shelf Agreement also contains a covenant requiring us to maintain
an EBITDA to interest expense ratio for the third quarter of 2009 to not less
than 3.25 to 1, and thereafter of no less than 3.50 to 1. The Shelf Agreement
contains a cap on permitted acquisitions of $2,000 for the 2009 fiscal year and
other limitations on the permitted acquisitions amount based on our leverage
ratio in fiscal years after 2009. Finally, the Shelf Agreement prohibits us from
conducting share repurchases during the 2009 fiscal year and limits the payment
of dividends or repurchases of stock in fiscal years after 2009 to an amount
ranging from $12,000 to $40,000 based on our leverage ratio after giving effect
to such payments.
As of
December 31, 2009, there was no balance outstanding under this credit facility
and therefore no requirement to be in compliance with the financial covenants
under this facility. However, the financial covenants under this facility are
the same as the financial covenants in the Credit Agreement, all of which we
were in compliance with as of December 31, 2009. Should notes be issued under
the Shelf Agreement, such notes will be pari passu with outstanding debt under
the Credit Facility.
ABN AMRO
Bank N.V.
We have a
revolving credit facility with ABN AMRO Bank N.V. (“ABN AMRO”) of 5,000 Euros,
or approximately $7,158, for general working capital purposes. Borrowings under
the Facility incur interest generally at a rate of 1.25% over the ABN AMRO base
rate as calculated daily on the cleared account balance. This facility may also
be used for short-term loans up to 3,000 Euros, or $4,295. The terms and
conditions of these loans would be incorporated in a separate short-term loan
agreement at the time of the transaction. As of December 31, 2009, bank
guarantees of $998 reduced the amount available on this credit facility to
$6,160.
Bank of
America, National Association
On August
17, 2009, we renewed our revolving credit facility with Bank of America,
National Association, Shanghai Branch. This agreement will expire on August 28,
2010 and is denominated in renminbi (“RMB”) in the amount of 13,400 RMB, or
approximately $1,963, and is available for general corporate purposes, including
working capital needs of our China location. As part of the March 4, 2009
amendment to the Credit Agreement with JPMorgan Chase Bank, this facility with
Bank of America was secured with the same assets as noted above under the
JPMorgan Chase section. The interest rate on borrowed funds is equal to the
People’s Bank of China’s base rate. This facility also allows for the issuance
of standby letters of credit, performance bonds and other similar instruments
over the term of the facility for a fee of 0.95% of the amount issued. There was
no balance outstanding on this facility at December 31, 2009.
Bank of
Scotland
On March
31, 2009, we cancelled our committed credit facility with the Bank of
Scotland.
Unibanco
Bank
During
the third quarter of 2009 our revolving credit facility with Unibanco Bank in
Brazil expired.
Collateralized
Borrowings
Collateralized
borrowings represent deferred sales proceeds on certain leasing transactions
with third-party leasing companies. These transactions are accounted for as
borrowings, with the related assets capitalized as property, plant and equipment
and depreciated straight-line over the lease term.
Capital
Lease Obligations
Capital
lease obligations outstanding are primarily related to sale-leaseback
transactions with third-party leasing companies whereby we sell our manufactured
equipment to the leasing company and lease it back. The equipment covered by
these leases is rented to our customers over the lease term.
The
aggregate maturities of our outstanding debt including capital lease obligations
as of December 31, 2009, are as follows:
|
2010
|
$ | 5,300 | ||
|
2011
|
4,154 | |||
|
2012
|
26,863 | |||
|
2013
|
64 | |||
|
2014
|
23 | |||
|
Thereafter
|
- | |||
|
Total
minimum obligations
|
$ | 36,404 | ||
|
Less:
amount representing interest
|
(2,200 | ) | ||
|
Total
|
$ | 34,204 |
|
9.
|
Other Current
Liabilities
|
Other
Current Liabilities at December 31, consisted of the following:
|
2009
|
2008
|
|||||||
|
Taxes,
other than income taxes
|
$ | 5,374 | $ | 2,936 | ||||
|
Warranty
|
5,985 | 6,018 | ||||||
|
Deferred
revenue
|
2,574 | 3,662 | ||||||
|
Rebates
|
5,773 | 5,014 | ||||||
|
Restructuring
|
1,824 | 13,911 | ||||||
|
Miscellaneous
accrued expenses
|
9,637 | 10,465 | ||||||
|
Other
|
6,234 | 8,183 | ||||||
|
Total
|
$ | 37,401 | $ | 50,189 | ||||
29
NOTES
TO THE CONSOLIDATED FINANCIAL STATEMENTS
(in
thousands, except shares and per share data)
The
changes in warranty reserves for the three years ended December 31 were as
follows:
|
2009
|
2008
|
2007
|
||||||||||
|
Beginning
balance
|
$ | 6,018 | $ | 6,950 | $ | 6,868 | ||||||
|
Product
warranty provision
|
8,092 | 8,157 | 7,695 | |||||||||
|
Acquired
reserves
|
17 | 192 | - | |||||||||
|
Foreign
currency
|
133 | (88 | ) | 193 | ||||||||
|
Claims
paid
|
(8,275 | ) | (9,193 | ) | (7,806 | ) | ||||||
|
Ending
balance
|
$ | 5,985 | $ | 6,018 | $ | 6,950 | ||||||
|
10.
|
Fair Value of Financial Instruments &
Derivatives
|
Estimates
of fair value for financial assets and financial liabilities are based on the
framework established in the accounting guidance for fair value measurements.
The framework defines fair value, provides guidance for measuring fair value and
requires certain disclosures. The framework discusses valuation techniques, such
as the market approach (comparable market prices), the income approach (present
value of future income or cash flow), and the cost approach (cost to replace the
service capacity of an asset or replacement cost). The framework utilizes a fair
value hierarchy that prioritizes the inputs to valuation techniques used to
measure fair value into three broad levels. The following is a brief description
of those three levels:
|
§
|
Level
1: Observable inputs such as quoted prices (unadjusted) in active markets
for identical assets or
liabilities.
|
|
§
|
Level
2: Inputs other than quoted prices that are observable for the asset or
liability, either directly or indirectly. These include quoted prices for
similar assets or liabilities in active markets and quoted prices for
identical or similar assets or liabilities in markets that are not
active.
|
|
§
|
Level
3: Unobservable inputs that reflect the reporting entity’s own
assumptions.
|
Our
population of financial assets and liabilities subject to fair value
measurements at December 31, 2009 included foreign currency forward contracts
with a Level 2 fair value asset balance of $259. Our foreign currency forward
exchange contracts are valued at fair market value, which is the amount we would
receive or pay to terminate the contracts at the reporting date.
We use
derivative instruments to manage exposures to foreign currency only in an
attempt to limit underlying exposures from currency fluctuations and not for
trading purposes. As of December 31, 2009 and 2008, the fair value of such
contracts outstanding was a net gain of $259 and $346, respectively. At December
31, 2009 and 2008, the notional amounts of foreign currency forward
exchange contracts outstanding were $50,781 and $62,825,
respectively.
The
carrying amounts reported in the Consolidated Balance Sheets for Cash and Cash
Equivalents, Receivables, Other Current Assets, Accounts Payable and Other
Current Liabilities approximate fair value.
The fair
market value of our Long-Term Debt approximates cost, based on the borrowing
rates currently available to us for bank loans with similar terms and remaining
maturities.
|
11.
|
Retirement Benefit
Plans
|
Substantially
all U.S. employees are covered by various retirement benefit plans maintained by
Tennant. Retirement benefits for eligible employees in foreign locations are
funded principally through defined benefit plans, annuity or government
programs. The total cost of benefits for our U.S. and foreign plans was $10,087,
$9,329 and $9,604 in 2009, 2008 and 2007, respectively.
We have a
401(k) plan that covers substantially all U.S. employees. Under this plan, the
employer contribution matches up to 3% of the employee’s compensation in the
form of Tennant stock. We also make a profit sharing contribution to the 401(k)
plan for employees with more than one year of service in accordance with our
Profit Sharing Plan. This contribution can be in the form of Tennant stock or
cash and is based upon our financial performance. Matching contributions have
been primarily funded by our ESOP Plan, while profit sharing contributions are
generally paid in cash or stock, or a combination of both. Expenses for the
401(k) plan were $6,676, $5,906 and $6,184 during 2009, 2008 and 2007,
respectively.
We have a
U.S. nonqualified supplemental benefit plan (the “U.S. Nonqualified Plan”) to
provide additional retirement benefits for certain employees whose benefits
under our 401(k) plan or U.S. Pension Plan are limited by either the Employee
Retirement Income Security Act or the Internal Revenue Code.
We have a
U.S. postretirement medical benefit plan (the “U.S. Retiree Plan”) to provide
certain healthcare benefits for U.S. employees hired before January 1, 1999.
Eligibility for those benefits is based upon a combination of years of service
with Tennant and age upon retirement.
We have a
qualified, funded defined benefit retirement plan (the “U.S. Pension Plan”) in
the U.S. covering certain current and retired employees. Plan benefits are based
on the years of service and compensation during the highest five consecutive
years of service in the final ten years of employment. No new participants have
entered the plan since 2000. The plan has approximately 450 participants
including 136 active employees as of December 31, 2009.
We also
have defined pension benefit plans in the United Kingdom and Germany (the “U.K.
Pension Plan” and the “German Pension Plan”). The U.K. Pension Plan and German
Pension Plan both cover certain current and retired employees and neither plan
is accepting new participants.
We expect
to contribute approximately $122 to our U.S. Nonqualified Plan, approximately
$1,035 to our U.S. Retiree Plan, approximately $246 to our U.K. Pension Plan,
and approximately $41 to our German Pension Plan in 2010. No contributions to
the U.S. Pension Plan are expected to be required during 2010.
30
NOTES
TO THE CONSOLIDATED FINANCIAL STATEMENTS
(in
thousands, except shares and per share data)
Weighted-average
asset allocations by asset category of the U.S. and U.K. Pension Plans as of
December 31, are as follows:
|
Asset
Category
|
Total
|
Quoted
Prices in Active Markets for Identical Assets
(Level
1)
|
Significant
Observable Inputs
(Level
2)
|
Significant
Unobservable Inputs
(Level
3)
|
||||||||||||
|
Cash
and Cash Equivalents
|
$ | 1,209 | $ | 1,209 | $ | - | $ | - | ||||||||
|
Equity
Securities:
|
||||||||||||||||
|
U.S.
Small-Cap (1)
|
3,294 | 3,294 | - | - | ||||||||||||
|
International
Small-Cap (2)
|
131 | 131 | - | - | ||||||||||||
|
Mutual
Funds:
|
||||||||||||||||
|
Corporate
Bonds
|
11,771 | - | 11,771 | - | ||||||||||||
|
International
Fixed Interest
|
2,168 | 2,168 | ||||||||||||||
|
U.S.
Large-Cap
(3)
|
2,857 | 2,857 | - | - | ||||||||||||
|
Index
Funds
|
9,651 | 9,651 | ||||||||||||||
|
International
Equity
|
2,754 | 2,754 | - | - | ||||||||||||
|
Total
|
$ | 33,835 | $ | 22,064 | $ | 11,771 | $ | - | ||||||||
|
(1)
|
This
category is comprised of actively managed domestic common
stocks.
|
|
(2)
|
This
category is comprised of actively managed international common
stocks.
|
|
(3)
|
This
category is comprised of funds not actively managed that track the S&P
500.
|
The
primary objective of our U.S. and U.K. Pension Plans is to meet retirement
income commitments to plan participants at a reasonable cost to Tennant and to
maintain a sound actuarially funded status. This objective is accomplished
through growth of capital and safety of funds invested. The pension plan assets
are invested in securities to achieve growth of capital over inflation through
appreciation and accumulation and reinvestment of dividend and interest income.
Investments are diversified to control risk. The overall return objective is to
achieve an annualized return equal to or greater than the return expectations in
the actuarial valuation. The target allocation for the U.S. Pension Plan is 60%
equity and 40% debt securities. Equity securities within the U.S. Pension Plan
do not include any investments in Tennant Company Common Stock. The U.K. Pension
Plan is invested in an insurance contract with underlying investments primarily
in equity and fixed income securities. Our German Pension Plan is unfunded,
which is customary in that country.
Weighted-average
assumptions used to determine benefit obligations as of December 31 are as
follows:
| Non-U.S. | Postretirement | |||||||||||||||||||||||
| U.S. Pension Benefits | Pension Benefits | Medical Benefits | ||||||||||||||||||||||
|
2009
|
2008
|
2009
|
2008
|
2009
|
2008
|
|||||||||||||||||||
|
Discount
rate
|
5.88 | % | 6.90 | % | 5.69 | % | 6.16 | % | 5.60 | % | 6.90 | % | ||||||||||||
|
Rate
of compensation increase
|
3.00 | % | 4.00 | % | 5.10 | % | 4.50 | % | - | - | ||||||||||||||
Weighted-average
assumptions used to determine net periodic benefit costs as of December 31 are
as follows:
|
|
Non-U.S. |
Postretirement
|
||||||||||||||||||||||
| U.S. Pension Benefits | Pension Benefits |
Medical
Benefits
|
||||||||||||||||||||||
|
2009
|
2008
|
2009
|
2008
|
2009
|
2008
|
|||||||||||||||||||
|
Discount
rate
|
6.90 | % | 6.60 | % | 6.16 | % | 5.79 | % | 6.90 | % | 6.60 | % | ||||||||||||
|
Expected
long-term rate of return on plan assets
|
8.75 | % | 8.75 | % | 4.90 | % | 5.50 | % | - | - | ||||||||||||||
|
Rate
of compensation increase
|
4.00 | % | 4.00 | % | 4.50 | % | 4.80 | % | - | - | ||||||||||||||
The
discount rate is used to discount future benefit obligations back to today’s
dollars. Our discount rates were determined based on high-quality fixed income
investments. The resulting discount rates are consistent with the duration of
plan liabilities. The Citigroup Above Median Yield Curve is used in determining
the discount rate for the U.S. Plans.
31
NOTES
TO THE CONSOLIDATED FINANCIAL STATEMENTS
(in
thousands, except shares and per share data)
The
accumulated benefit obligations as of December 31, for all defined benefit plans
are as follows:
|
2009
|
2008
|
|||||||
|
U.S.
defined benefit plans
|
$ | 34,410 | $ | 30,154 | ||||
|
U.K.
Pension Plan
|
6,968 | 5,313 | ||||||
|
German
Pension Plan
|
699 | 662 | ||||||
Information
for our plans with an accumulated benefit obligation in excess of plan assets is
as follows:
|
U.S.
Pension Plans
|
Non-U.S.
Plans
|
|||||||||||||||
|
2009
|
2008
|
2009
|
2008
|
|||||||||||||
|
Projected
benefit obligation
|
$ | 36,034 | $ | 32,486 | $ | 7,994 | $ | 6,179 | ||||||||
|
Accumulated
benefit obligation
|
34,410 | 30,154 | 7,667 | 5,976 | ||||||||||||
|
Fair
value of plan assets
|
27,438 | 24,130 | 6,451 | 5,191 | ||||||||||||
As of
December 31, 2009 and 2008, the U.S. Pension Plan, the U.S. Nonqualified, U.K.
Pension and German Pension Plans had an accumulated benefit obligation in excess
of plan assets.
Assumed
healthcare cost trend rates at December 31, 2009 and 2008 are as follows:
|
2009
|
2008
|
|||||||
|
Healthcare
cost trend rate assumption for the next year
|
11.1 | % | 11.3 | % | ||||
|
Rate
to which the cost trend rate is assumed to decline (the ultimate
trend rate)
|
5.0 | % | 5.0 | % | ||||
|
Year
that the rate reaches the ultimate trend rate
|
2030 | 2029 | ||||||
Assumed
healthcare cost trend rates have a significant effect on the amounts reported
for healthcare plans. To illustrate, a one-percentage-point change in assumed
healthcare cost trends would have the following effects:
|
1-Percentage-
|
1-Percentage-
|
|||||||
|
Point
|
Point
|
|||||||
|
Decrease
|
Increase
|
|||||||
|
Effect
on total of service and interest cost components
|
$ | (85,000 | ) | $ | 82,000 | |||
|
Effect
on postretirement benefit obligation
|
$ | (1,230,000 | ) | $ | 1,170,000 | |||
32
NOTES
TO THE CONSOLIDATED FINANCIAL STATEMENTS
(in
thousands, except shares and per share data)
Summaries
related to changes in benefit obligations and plan assets and to the funded
status of our defined benefit and postretirement medical benefit plans are as
follows:
|
U.S.
Pension Benefits
|
Non-U.S.
Pension
Benefits
|
Postretirement
Medical
Benefits
|
||||||||||||||||||||||
|
2009
|
2008
|
2009
|
2008
|
2009
|
2008
|
|||||||||||||||||||
|
Change
in benefit obligation:
|
||||||||||||||||||||||||
|
Benefit
obligation at beginning of year
|
$ | 32,486 | $ | 32,395 | $ | 6,179 | $ | 8,977 | $ | 12,480 | $ | 12,763 | ||||||||||||
|
Service
cost
|
648 | 741 | 97 | 154 | 141 | 128 | ||||||||||||||||||
|
Interest
cost
|
2,116 | 2,061 | 406 | 486 | 854 | 791 | ||||||||||||||||||
|
Plan
participants' contributions
|
- | - | 25 | 35 | - | - | ||||||||||||||||||
|
Actuarial
(gain) loss
|
2,603 | (1,307 | ) | 769 | (933 | ) | 1,823 | (344 | ) | |||||||||||||||
|
Foreign
exchange
|
- | - | 646 | (2,073 | ) | - | - | |||||||||||||||||
|
Benefits
paid
|
(1,819 | ) | (1,404 | ) | (128 | ) | (467 | ) | (975 | ) | (858 | ) | ||||||||||||
|
Benefit
obligation at end of year
|
$ | 36,034 | $ | 32,486 | $ | 7,994 | $ | 6,179 | $ | 14,323 | $ | 12,480 | ||||||||||||
|
Change
in fair value of plan assets and net accrued liabilities:
|
||||||||||||||||||||||||
|
Fair
value of plan assets at beginning of year
|
$ | 24,130 | $ | 33,100 | $ | 5,191 | $ | 7,356 | $ | - | $ | - | ||||||||||||
|
Actual
return on plan assets
|
4,983 | (7,681 | ) | 543 | (154 | ) | - | - | ||||||||||||||||
|
Employer
contributions
|
144 | 115 | 241 | 317 | 975 | 858 | ||||||||||||||||||
|
Plan
participants' contributions
|
- | - | 25 | 35 | - | - | ||||||||||||||||||
|
Foreign
exchange
|
- | - | 579 | (1,896 | ) | - | - | |||||||||||||||||
|
Benefits
paid
|
(1,819 | ) | (1,404 | ) | (128 | ) | (467 | ) | (975 | ) | (858 | ) | ||||||||||||
|
Fair
value of plan assets at end of year
|
27,438 | 24,130 | 6,451 | 5,191 | - | - | ||||||||||||||||||
|
Funded
status at end of year
|
$ | (8,596 | ) | $ | (8,356 | ) | $ | (1,543 | ) | $ | (988 | ) | $ | (14,323 | ) | $ | (12,480 | ) | ||||||
|
Amounts
recognized in the consolidated balance sheets consisted
of:
|
||||||||||||||||||||||||
|
Noncurrent
assets
|
$ | - | $ | - | $ | - | $ | - | $ | - | $ | - | ||||||||||||
|
Current
liabilities
|
(122 | ) | (126 | ) | (41 | ) | (40 | ) | (1,035 | ) | (927 | ) | ||||||||||||
|
Noncurrent
liabilities
|
(8,474 | ) | (8,230 | ) | (1,502 | ) | (948 | ) | (13,288 | ) | (11,553 | ) | ||||||||||||
|
Net
accrued liability
|
$ | (8,596 | ) | $ | (8,356 | ) | $ | (1,543 | ) | $ | (988 | ) | $ | (14,323 | ) | $ | (12,480 | ) | ||||||
|
Amounts
recognized in accumulated other comprehensive income consist
of:
|
||||||||||||||||||||||||
|
Prior
service cost
|
$ | 1,477 | $ | 2,032 | $ | - | $ | - | $ | (1,848 | ) | $ | (2,428 | ) | ||||||||||
|
Transition
asset
|
- | (20 | ) | - | - | - | - | |||||||||||||||||
|
Net
(gain) loss
|
5,780 | 5,243 | 159 | (343 | ) | 2,741 | 919 | |||||||||||||||||
|
Accumulated
other comprehensive income (loss)
|
$ | 7,257 | $ | 7,255 | $ | 159 | $ | (343 | ) | $ | 893 | $ | (1,509 | ) | ||||||||||
33
NOTES
TO THE CONSOLIDATED FINANCIAL STATEMENTS
(in
thousands, except shares and per share data)
Components
of net periodic benefit cost for the three years ended
December 31, were as follows:
|
U.S.
Pension Benefits
|
Non-U.S.
Pension
Benefits
|
Postretirement
Medical
Benefits
|
||||||||||||||||||||||||||||||||||
|
2009
|
2008
|
2007
|
2009
|
2008
|
2007
|
2009
|
2008
|
2007
|
||||||||||||||||||||||||||||
|
Service
cost
|
$ | 648 | $ | 741 | $ | 785 | $ | 97 | $ | 154 | $ | 228 | $ | 141 | $ | 128 | $ | 142 | ||||||||||||||||||
|
Interest
cost
|
2,116 | 2,061 | 1,859 | 406 | 486 | 519 | 854 | 791 | 734 | |||||||||||||||||||||||||||
|
Expected
return on plan assets
|
(2,767 | ) | (2,831 | ) | (2,651 | ) | (276 | ) | (373 | ) | (375 | ) | - | - | - | |||||||||||||||||||||
|
Amortization
actuarial (gain) loss
|
(151 | ) | (216 | ) | (14 | ) | - | - | 101 | - | - | 34 | ||||||||||||||||||||||||
|
Amortization
of transition asset
|
(20 | ) | (22 | ) | (22 | ) | - | - | - | - | - | - | ||||||||||||||||||||||||
|
Amortization
of prior service cost
|
555 | 556 | 562 | - | - | - | (580 | ) | (580 | ) | (580 | ) | ||||||||||||||||||||||||
|
Foreign
currency
|
- | - | - | 61 | (183 | ) | 76 | - | - | - | ||||||||||||||||||||||||||
|
Net
periodic cost
|
$ | 381 | $ | 289 | $ | 519 | $ | 288 | $ | 84 | $ | 549 | $ | 415 | $ | 339 | $ | 330 | ||||||||||||||||||
Changes
in accumulated other comprehensive income for the three years ended December 31,
were as follows:
|
U.S.
Pension Benefits
|
Non-U.S.
Pension
Benefits
|
Postretirement
Medical
Benefits
|
||||||||||||||||||||||||||||||||||
|
2009
|
2008
|
2007
|
2009
|
2008
|
2007
|
2009
|
2008
|
2007
|
||||||||||||||||||||||||||||
|
Net
(gain) loss
|
$ | 387 | $ | 9,205 | $ | 330 | $ | 502 | $ | (406 | ) | $ | (1,857 | ) | $ | 1,823 | $ | (343 | ) | $ | (1,800 | ) | ||||||||||||||
|
Amortization
of unrecognized prior service cost
|
(555 | ) | (556 | ) | (562 | ) | - | - | - | 580 | 580 | 580 | ||||||||||||||||||||||||
|
Amortization
of unrecognized prior transition asset
|
20 | 22 | 22 | - | - | - | - | - | - | |||||||||||||||||||||||||||
|
Amortization
of unrecognized actuarial (gain) loss
|
151 | 216 | (14 | ) | - | - | (101 | ) | - | - | (34 | ) | ||||||||||||||||||||||||
|
Total
recognized in other comprehensive income
|
$ | 3 | $ | 8,887 | $ | (224 | ) | $ | 502 | $ | (406 | ) | $ | (1,958 | ) | $ | 2,403 | $ | 237 | $ | (1,254 | ) | ||||||||||||||
|
Total
recognized in net periodic
benefit
cost and other comprehensive income
|
$ | 384 | $ | 9,176 | $ | 295 | $ | 790 | $ | (322 | ) | $ | (1,409 | ) | $ | 2,818 | $ | 576 | $ | (924 | ) | |||||||||||||||
The
following benefit payments, which reflect expected future service, are expected
to be paid for our U.S. and foreign plans:
|
Postretirement
Medical
Benefits
|
||||||||||||
|
U.S.
Pension
Benefits
|
Non-U.S.
Pension
Benefits
|
|||||||||||
|
2010
|
$ | 1,954 | $ | 135 | $ | 1,035 | ||||||
|
2011
|
1,877 | 143 | 1,170 | |||||||||
|
2012
|
1,749 | 151 | 1,183 | |||||||||
|
2013
|
1,923 | 159 | 1,215 | |||||||||
|
2014
|
2,142 | 170 | 1,328 | |||||||||
|
2015
to 2019
|
11,338 | 858 | 6,807 | |||||||||
|
Total
|
$ | 20,983 | $ | 1,616 | $ | 12,738 | ||||||
The
following amounts are included in accumulated other comprehensive income as of
December 31, 2009 and are expected to be recognized as components of net
periodic benefit cost during 2010:
|
Postretirement
|
||||||||
|
Pension
|
Medical
|
|||||||
|
Benefits
|
Benefits
|
|||||||
|
Net
(gain) loss
|
$ | 20 | $ | 149 | ||||
|
Net
prior service cost (credit)
|
554 | (580 | ) | |||||
34
NOTES
TO THE CONSOLIDATED FINANCIAL STATEMENTS
(in
thousands, except shares and per share data)
|
12.
|
Shareholders’
Equity
|
Authorized
Shares
We are
authorized to issue an aggregate of 61,000,000 shares; 60,000,000 are designated
as Common Stock, having a par value of $0.375 per share, and 1,000,000 are
designated as Preferred Stock, having a par value of $0.02 per share. The Board
of Directors is authorized to establish one or more series of preferred stock,
setting forth the designation of each such series, and fixing the relative
rights and preferences of each such series.
Purchase
Rights
On
November 10, 2006, the Board of Directors approved a Rights Agreement and
declared a dividend of one preferred share purchase right for each outstanding
share of Common Stock. Each right entitles the registered holder to purchase
from us one one-hundredth of a Series A Junior Participating Preferred Share of
the par value of $0.02 per share at a price of $100 per one one-hundredth of a
Preferred Share, subject to adjustment. The rights are not exercisable or
transferable apart from the Common Stock until the earlier of: (i) the close of
business on the fifteenth day following a public announcement that a person or
group of affiliated or associated persons has become an “Acquiring Person”
(i.e., has become, subject to certain exceptions, including for stock ownership
by employee benefit plans, the beneficial owner of 20% or more of the
outstanding Common Stock), or (ii) the close of business on the fifteenth day
following the first public announcement of a tender offer or exchange offer the
consummation of which would result in a person or group of affiliated or
associated persons becoming, subject to certain exceptions, the beneficial owner
of 20% or more of the outstanding Common Stock (or such later date as may be
determined by our Board of Directors prior to a person or group of affiliated or
associated persons becoming an Acquiring Person). After a person or group
becomes an Acquiring Person, each holder of a Right (other than an Acquiring
Person) will be able to exercise the right at the current exercise price of the
Right and receive the number of shares of Common Stock having a market value of
two times the exercise price of the right, or, depending upon the circumstances
in which the rights became exercisable, the number of common shares of the
acquiring company having a market value of two times the exercise price of the
right. At no time do the rights have any voting power. We may redeem the rights
for $0.001 per right at any time prior to a person or group acquiring 20% or
more of the Common Stock. Under certain circumstances, the Board of Directors
may exchange the rights for our Common Stock or reduce the 20% thresholds to not
less than 10%. The rights will expire on December 26, 2016, unless extended or
earlier redeemed or exchanged by us.
Accumulated
Other Comprehensive Loss
The
components of Accumulated Other Comprehensive Loss at December 31, 2009, 2008
and 2007 are as follows:
|
Cumulative
Translation Adjustments
|
Pension
Liability
|
Accumulated
Other Comprehensive Income (Loss)
|
||||||||||
|
Balance
at December 31, 2006
|
$ | 814 | $ | (167 | ) | $ | 647 | |||||
|
Net
current period change
|
2,630 | 2,230 | 4,860 | |||||||||
|
Balance
at December 31, 2007
|
$ | 3,444 | $ | 2,063 | $ | 5,507 | ||||||
|
Net
current period change
|
(26,455 | ) | (5,443 | ) | (31,898 | ) | ||||||
|
Balance
at December 31, 2008
|
$ | (23,011 | ) | $ | (3,380 | ) | $ | (26,391 | ) | |||
|
Net
current period change
|
5,104 | (1,822 | ) | 3,282 | ||||||||
|
Balance
at December 31, 2009
|
$ | (17,907 | ) | $ | (5,202 | ) | $ | (23,109 | ) | |||
Translation
adjustments are not adjusted for income taxes as substantially all translation
adjustments related to permanent investments in non-U.S.
subsidiaries.
|
13.
|
Commitments and
Contingencies
|
We lease
office and warehouse facilities, vehicles and office equipment under operating
lease agreements, which include both monthly and longer-term arrangements.
Leases with initial terms of one year or more expire at various dates through
2018 and generally provide for extension options. Rent expense under the leasing
agreements (exclusive of real estate taxes, insurance and other expenses payable
under the leases) amounted to $14,809, $15,345 and $13,647 in 2009, 2008 and
2007, respectively.
The
minimum rentals for aggregate lease commitments with an initial term of one year
or more at December 31, 2009, were as follows:
|
2010
|
$ | 8,450 | ||
|
2011
|
6,013 | |||
|
2012
|
3,278 | |||
|
2013
|
1,368 | |||
|
2014
|
774 | |||
|
Thereafter
|
1,256 | |||
|
Total
|
$ | 21,139 |
Certain
operating leases for vehicles contain residual value guarantee provisions, which
would become due at the expiration of the operating lease agreement if the fair
value of the leased vehicles is less than the guaranteed residual value. Of
those leases that contain residual value guarantees, the aggregate residual
value at lease expiration is $9,156, of which we have guaranteed $7,349. As of
December 31, 2009, we have recorded a liability for the estimated end-of-term
loss related to this residual value guarantee of $891 for certain vehicles
within our fleet. Our fleet also contains vehicles we estimate will settle at a
gain. Gains on these vehicles will be recognized at the end of the lease
term.
On
November 9, 2009 we entered into a purchase agreement with a third-party
manufacturer. Under this agreement we have a minimum purchase obligation of
$1,580 through 2012. The remaining commitment under this agreement as of
December 31, 2009 was $1,580.
During
2008, we amended our 2003 purchase commitment with a third-party manufacturer to
extend the terms of the agreement to remain in effect until the remainder of the
commitment has been satisfied. The remaining commitment under this agreement
totaled $87 as of December 31, 2009.
In the
ordinary course of business, we may become liable with respect to pending and
threatened litigation, tax, environmental and other matters. While the ultimate
results of current claims, investigations and lawsuits involving us are unknown
at this time, we do not expect that these matters will have a material adverse
effect on our consolidated financial position or results of operations. Legal
costs associated with such matters are expensed as incurred.
|
14.
|
Income Taxes
|
Income
from continuing operations for the three years ended December 31, was as
follows:
|
2009
|
2008
|
2007
|
||||||||||
|
U.S.
operations
|
$ | 12,103 | $ | 14,858 | $ | 50,561 | ||||||
|
Foreign
operations
|
(36,423 | ) | 2,717 | 7,151 | ||||||||
|
Total
|
$ | (24,320 | ) | $ | 17,575 | $ | 57,712 | |||||
35
NOTES
TO THE CONSOLIDATED FINANCIAL STATEMENTS
(in
thousands, except shares and per share data)
Income
tax expense (benefit) for the three years ended December 31, was as
follows:
|
2009
|
2008
|
2007
|
||||||||||
|
Current:
|
||||||||||||
|
Federal
|
$ | (337 | ) | $ | 1,771 | $ | 14,927 | |||||
|
Foreign
|
1,284 | 4,155 | 3,135 | |||||||||
|
State
|
236 | 595 | 1,305 | |||||||||
| $ | 1,183 | $ | 6,521 | $ | 19,367 | |||||||
|
Deferred:
|
||||||||||||
|
Federal
|
$ | 1,897 | $ | 1,384 | $ | 1,978 | ||||||
|
Foreign
|
(1,444 | ) | (1,201 | ) | (3,605 | ) | ||||||
|
State
|
285 | 247 | 105 | |||||||||
| $ | 738 | $ | 430 | $ | (1,522 | ) | ||||||
|
Total:
|
||||||||||||
|
Federal
|
$ | 1,560 | $ | 3,155 | $ | 16,905 | ||||||
|
Foreign
|
(160 | ) | 2,954 | (470 | ) | |||||||
|
State
|
521 | 842 | 1,410 | |||||||||
| $ | 1,921 | $ | 6,951 | $ | 17,845 | |||||||
U.S.
income taxes have not been provided on approximately $34,232 of undistributed
earnings of non-U.S. subsidiaries. We plan to indefinitely reinvest these
undistributed earnings.
We have
Dutch and German tax loss carryforwards of approximately $31,019 and $17,343,
respectively. If unutilized, the Dutch tax loss carryforward will begin expiring
in 2012. The German tax loss carryforward has no expiration date. Because of the
uncertainty regarding realization of the Dutch tax loss carryforward, a
valuation allowance was established. This valuation allowance decreased in 2009
due to improved operating profits.
We have
foreign tax credit and research and development tax credit carryforwards of
approximately $1,925 and $460, respectively. If unutilized, foreign tax credit
and research and development tax credit carryforwards will expire in 2019 and
2029, respectively. Based upon evaluation, as of December 31, 2009, no valuation
allowance has been recorded.
A
valuation allowance for the remaining deferred tax assets is not required since
it is more likely than not that they will be realized through carryback to
taxable income in prior years, future reversals of existing taxable temporary
differences and future taxable income.
Our
effective income tax rate varied from the U.S. federal statutory tax rate for
the three years ended December 31, as follows:
|
2009
|
2008
|
2007
|
||||||||||
|
Tax
at statutory rate
|
(35.0 | %) | 35.0 | % | 35.0 | % | ||||||
|
Increases
(decreases) in the tax rate from:
|
||||||||||||
|
State
and local taxes, net of federal benefit
|
1.1 | 4.6 | 1.8 | |||||||||
|
Effect
of foreign operations
|
(16.4 | ) | (0.7 | ) | 0.5 | |||||||
|
Goodwill
impairment - non-deductible
|
56.9 | - | - | |||||||||
|
Effect
of changes in valuation allowances
|
(0.7 | ) | 6.3 | (4.9 | ) | |||||||
|
Domestic
production activities deduction
|
0.8 | (3.3 | ) | (1.2 | ) | |||||||
|
Other,
net
|
1.2 | (2.3 | ) | (0.3 | ) | |||||||
|
Effective
income tax rate
|
7.9 | % | 39.6 | % | 30.9 | % | ||||||
Deferred
tax assets and liabilities were comprised of the following as of
December 31:
|
2009
|
2008
|
2007
|
||||||||||
|
Deferred
tax assets:
|
||||||||||||
|
Inventories,
principally due to additional costs inventoried for tax
purposes
and changes in inventory reserves
|
$ | 867 | $ | 1,509 | $ | 848 | ||||||
|
Employee
wages and benefits, principally due to
accruals for financial reporting purposes
|
16,050 | 16,557 | 13,062 | |||||||||
|
Warranty
reserves accrued for financial reporting purposes
|
1,803 | 1,947 | 1,856 | |||||||||
|
Accounts
receivable, principally due to allowance for doubtful
accounts
and tax accounting method for equipment rentals
|
1,396 | 1,151 | 658 | |||||||||
|
Tax
loss carryforwards
|
12,987 | 13,860 | 13,106 | |||||||||
|
Valuation
allowance
|
(9,131 | ) | (9,303 | ) | (8,197 | ) | ||||||
|
Tax
credit carryforwards
|
2,385 | - | - | |||||||||
|
Other
|
1,177 | 836 | 562 | |||||||||
|
Total
deferred tax assets
|
$ | 27,534 | $ | 26,557 | $ | 21,895 | ||||||
|
Deferred
tax liabilities:
|
||||||||||||
|
Property,
Plant and Equipment, principally due to
differences in depreciation and related gains
|
$ | 8,592 | $ | 7,714 | $ | 5,895 | ||||||
|
Goodwill
and Intangible Assets
|
9,086 | 12,078 | 6,006 | |||||||||
|
Total
deferred tax liabilities
|
$ | 17,678 | $ | 19,792 | $ | 11,901 | ||||||
|
Net
deferred tax assets
|
$ | 9,856 | $ | 6,765 | $ | 9,994 | ||||||
The
valuation allowance at December 31, 2009, principally applies to Dutch tax loss
carryforwards that, in the opinion of management, are more likely than not to
expire unutilized. However, to the extent that tax benefits related to these
carryforwards are realized in the future, the reduction in the valuation
allowance will reduce income tax expense.
In 2009,
2008 and 2007, we recorded tax benefits directly to Shareholders’ Equity of
$120, $921 and $3,301, respectively, relating to our ESOP and stock
plans.
On
January 1, 2007 we adopted new accounting guidance for uncertain tax positions.
The cumulative effect of adopting this guidance was a decrease in reserves for
uncertain tax positions and an increase to the January 1, 2007 balance of
Retained Earnings of $184. Consistent with this guidance, we reclassified the
reserves for uncertain tax positions from other current liabilities to
non-current liabilities unless the liability is expected to be paid within one
year.
36
NOTES
TO THE CONSOLIDATED FINANCIAL STATEMENTS
(in
thousands, except shares and per share data)
A
reconciliation of the beginning and ending amount of unrecognized tax benefits
is as follows:
|
Balance
at January 1, 2009
|
$ | 7,324 | ||
|
Increases
as a result of tax positions taken during a prior
period
|
946 | |||
|
Increases
as a result of tax positions taken during the current
year
|
756 | |||
|
Reductions
as a result of a lapse of the applicable statute of
limitations
|
(1,401 | ) | ||
|
Decreases
as a result of foreign currency fluctuations
|
163 | |||
|
Balance
at December 31, 2009
|
$ | 7,788 |
Included
in the balance of unrecognized tax benefits at December 31, 2009 are potential
benefits of $4,726 that, if recognized, would affect the effective tax rate from
continuing operations.
We
recognize potential accrued interest and penalties related to unrecognized tax
benefits as a component of income tax expense. Included in the liability of
$7,788 for unrecognized tax benefits as of December 31, 2009 was approximately
$567 for accrued interest and penalties. To the extent interest and penalties
are not assessed with respect to uncertain tax positions, the amounts accrued
will be revised and reflected as an adjustment to income tax
expense.
We are
subject to U.S. federal income tax as well as income tax of numerous state and
foreign jurisdictions. We are generally no longer subject to U.S. federal tax
examinations for taxable years before 2007 and with limited exceptions, state
and foreign income tax examinations for taxable years before 2004.
We are
currently undergoing income examinations in various state and foreign
jurisdictions covering 2004 to 2007. Although the final outcome of these
examinations cannot be currently determined, we believe that we have adequate
reserves with respect to these examinations.
We do not
anticipate that total unrecognized tax benefits will change significantly within
the next 12 months.
|
15.
|
Stock-Based
Compensation
|
We have
four remaining plans under which we have awarded share-based compensation
grants. The 1995 Stock Incentive Plan (“1995 Plan”) and 1999 Amended and
Restated Stock Incentive Plan (“1999 Plan”), which provided for stock-based
compensation grants to our executives and key employees, the 1997 Non-Employee
Directors Option Plan (“1997 Plan”), which provided for stock option grants to
our non-employee Directors, and the 2007 Stock Incentive Plan (the “2007 Plan”),
which was adopted as a continuing step toward aggregating our equity
compensation programs to reduce the complexity of our equity compensation
programs.
The 1992
Stock Incentive Plan (“1992 Plan”), the 1993 Restricted Stock Plan for
Non-Employee Directors (“1993 Plan”), and the 1998 Management Incentive Plan
(“1998 Plan”) have all expired or were terminated in prior years and do not have
any remaining outstanding awards as of December 31, 2009.
The 1995
and 1997 Plans were terminated in 2006 and all remaining shares were transferred
to the Amended and Restated 1999 Stock Incentive Plan as approved by the
shareholders in 2006. Awards granted under the 1995 and 1997 Plans prior to 2006
that remain outstanding continue to be governed by the respective plan under
which the grant was made. Upon approval of the Amended and Restated Stock
Incentive Plan in 2006, we ceased making grants of future awards under these
plans and subsequent grants of future awards were made from the 1999 Plan and
governed by its terms.
The 2007
Plan terminated our rights to grant awards under the 1999 Plan except that the
1999 Plan will remain available for grants of reload options upon exercise of
previously granted options with one-time reload features. We have not granted
options with reload features since March 1, 2004. Awards previously granted
under the 1999 Plan remain outstanding and continue to be governed by the terms
of that plan. A total of 1,500,000 shares were authorized for future awards
under the 2007 Plan.
A maximum
of 6,200,000 shares have been available under these plans. As of December 31,
2009, there were 544,394 shares reserved for issuance under the 1995 Plan, the
1997 Plan and the 1999 Plan for outstanding compensation awards and 507,162
shares were available for issuance under the 2007 Plan for current and future
equity awards. The Compensation Committee of the Board of Directors determines
the number of shares awarded and the grant date, subject to the terms of our
equity award policy.
The
following table presents the components of stock-based compensation expense
(benefit) for the above described plans for the years ended December 31, 2009,
2008 and 2007:
|
2009
|
2008
|
2007
|
||||||||||
|
Stock
options and stock appreciation rights
|
$ | 812 | $ | 218 | $ | 778 | ||||||
|
Restricted
share awards
|
841 | 878 | 1,144 | |||||||||
|
Performance
share awards
|
- | (2,086 | ) | 1,084 | ||||||||
|
Share-based
liabilities
|
156 | (237 | ) | 134 | ||||||||
|
Total
Stock-Based Compensation Expense (Benefit)
|
$ | 1,809 | $ | (1,227 | ) | $ | 3,140 | |||||
The total
income tax benefit recognized in the income statement for share-based
compensation arrangements during the years ended 2009, 2008 and 2007 was $114,
$892 and $3,255, respectively.
Stock
Option and Stock Appreciation Right Awards
We
determined the fair value of our stock option awards using the Black-Scholes
option pricing model.
The
following assumptions were used for the 2009, 2008 and 2007 grants:
|
2009
|
2008
|
2007
|
||||||||||
|
Expected
volatility
|
38 - 66 | % | 29 - 37 | % | 26 - 35 | % | ||||||
|
Weighted-average
expected volatility
|
39 | % | 30 | % | 30 | % | ||||||
|
Expected
dividend yield
|
2.0 - 4.7 | % | 1.2 - 1.5 | % | 1.3 - 1.8 | % | ||||||
|
Weighted-average
expected dividend yield
|
4.7 | % | 1.3 | % | 1.8 | % | ||||||
|
Expected
term, in years
|
2 - 6 | 2 - 8 | 1 - 9 | |||||||||
|
Risk-free
interest rate
|
1.1 - 2.8 | % | 1.8 - 3.5 | % | 3.7 - 5.1 | % | ||||||
The
expected life selected for stock options granted during the year represents the
period of time that the stock options are expected to be outstanding based on
historical data of stock option holder exercise and termination behavior of
similar grants. The risk-free interest rate for periods within the contractual
life of the stock option is based on the U.S. Treasury rate over the expected
life at the time of grant. Expected volatilities are based upon historical
volatility of our stock over a period equal to the expected life of each stock
option grant. Dividend yield is estimated over the expected life based on our
dividend policy and historical dividends paid. We use historical data to
estimate pre-vesting forfeiture rates and revise those estimates in subsequent
periods if actual forfeitures differ from those estimates.
Employee
stock option awards prior to 2005 include a reload feature for options granted
to key employees. This feature allows employees to exercise options through a
stock-for-stock exercise using mature shares, and employees
are
granted a new stock option (reload option) equal to the number of shares of
Common Stock used to satisfy both the exercise price of the option and the
minimum tax withholding requirements. The reload options granted have an
exercise price equal to the fair market value of the Common Stock on the grant
date. Stock options granted in conjunction with reloads vest immediately and
have a term equal to the remaining life of the initial grant.
37
NOTES
TO THE CONSOLIDATED FINANCIAL STATEMENTS
(in
thousands, except shares and per share data)
Beginning
in 2004, new stock option awards granted vest one-third each year over a
three-year period and have a ten-year contractual term. These grants do not
contain a reload feature. Compensation expense equal to the grant date fair
value is recognized for these awards over the vesting period. Compensation
expense is fully recognized for reload stock options as of the reload
date.
In
addition to stock options, we also occasionally grant cash-settled stock
appreciation rights (“SARs”) to employees in certain foreign locations. Total
outstanding SARs were 2,000 as of December 31, 2009. No SARs were granted during
2009, 2008 or 2007.
The
following table summarizes the activity during the year ended December 31, 2009,
for stock option and SARs awards:
|
Shares
|
Weighted-Average
Exercise Price
|
|||||||
|
Outstanding
at beginning of year
|
951,191 | $ | 20.33 | |||||
|
Granted
|
711,957 | 10.68 | ||||||
|
Exercised
|
(69,130 | ) | 17.90 | |||||
|
Forfeited
|
- | - | ||||||
|
Expired
|
(168,086 | ) | 17.54 | |||||
|
Outstanding
at end of year
|
1,425,932 | $ | 15.96 | |||||
|
Exercisable
at end of year
|
719,015 | $ | 21.00 | |||||
The
weighted-average grant date fair value of stock options granted during the years
ended December 31, 2009, 2008 or 2007 was $2.59, $10.57 and $10.26,
respectively. The total intrinsic value of stock options exercised during the
years ended December 31, 2009, 2008 or 2007 was $631, $1,910 and $8,370,
respectively.
The
aggregate intrinsic value of options outstanding and exercisable at December 31,
2009 was $14,963 and $4,002, respectively. The weighted-average remaining
contractual life for options outstanding and exercisable as of December 31,
2009, was 6 years and 4 years, respectively.
As of
December 31, 2009, there was unrecognized compensation cost for nonvested
options and rights of $1,331 which is expected to be recognized over a
weighted-average period of 1.5 years.
Restricted Share
Awards
Restricted
share awards for employees typically have a two or three year vesting period
from the effective date of the grant. Restricted share awards to non-employee
directors vest upon a change of control or upon termination of service as a
director occurring at least six months after grant date of award so long as
termination is for one of the following reasons: death; disability; retirement
in accordance with Company policy (e.g., age, term limits, etc.); resignation at
request of Board (other than for gross misconduct); resignation following at
least six months advance notice; failure to be re-nominated (unless due to
unwillingness to serve) or re-elected by shareholders; or removal by
shareholders.
The
following table summarizes the activity during the year ended December 31, 2009,
for nonvested restricted share awards:
|
Shares
|
Weighted-Average
Grant Date Fair Value
|
|||||||
|
Nonvested
at beginning of year
|
96,543 | $ | 29.33 | |||||
|
Granted
|
44,205 | 12.80 | ||||||
|
Vested
|
(26,502 | ) | 23.73 | |||||
|
Forfeited
|
(881 | ) | 31.16 | |||||
|
Nonvested
at end of year
|
113,365 | $ | 23.94 | |||||
The total
fair value of shares vested during the year ended December 31, 2009, 2008 and
2007 was $629, $1,095 and $877, respectively. As of December 31, 2009, there was
$955 of total unrecognized compensation cost related to nonvested shares which
is expected to be recognized over a weighted-average period of 1.6
years.
Performance Share
Awards
We grant
performance share awards to key employees as a part of our management
compensation program. These awards are earned based upon achievement of certain
financial performance targets. We determine the fair value of these awards as of
the date of grant and recognize the expense over a three year performance
period.
The 2007
performance share award covers the three year performance period from the
beginning of fiscal year 2007 to the end of fiscal year 2009. Performance shares
granted in 2007 vest solely upon achievement of certain financial performance
targets during this three year period. During 2007, we expensed $712 related to
the 2007 performance share award as we deemed payment of the award to be
probable during the prior year. During 2008, the $712 expensed in 2007 related
to the 2007 performance share award was subsequently reversed as we no longer
deemed the achievement of the predetermined financial performance targets
to be probable. During 2008, we also reversed $1,657 related to the 2006
performance share award for the same reason. Of the $1,657 total, $1,416 was
expensed in 2006 and $241 was expensed in 2007.
The 2008
performance share award covers the three year performance period from the
beginning of fiscal year 2008 to the end of fiscal year 2010. Performance shares
granted in 2008 vest solely upon achievement of certain financial performance
targets during this three year period.
For the
years ended 2009 and 2008, we did not recognize any expense for the 2008 or
the 2007 performance share awards as we do not deem the achievement of
these predetermined financial performance targets to be
probable
In 2009,
we granted a combination of stock options, restricted stock awards and
restricted stock units payable in cash to key employees as part of our
management compensation program and did not grant performance share awards.
These stock options and restricted share awards vest over a three year period
and do not contain a performance requirement.
Share-Based
Liabilities
As of
December 31, 2009, we had $304 in total share-based liabilities recorded on our
Balance Sheet. During the years ended December 31, 2009 and 2008 we paid out $22
and $738 related to 2008 and 2007 share-based liability awards, respectively.
$655 related to 2006 share-based liability awards was paid during the year ended
December 31, 2007.
38
NOTES
TO THE CONSOLIDATED FINANCIAL STATEMENTS
(in
thousands, except shares and per share data)
|
16.
|
Employee Stock Ownership
Plan
|
We
established a leveraged Employee Stock Ownership Plan (“ESOP”) in 1990. The ESOP
covered substantially all domestic employees. The shares required for our 401(k)
matching contribution program were provided principally by our ESOP,
supplemented as needed by newly issued shares. We made annual contributions to
the ESOP equal to the ESOP’s debt service less dividends and Company match
contributions received by the ESOP. All dividends received by the ESOP were used
to pay debt service. The ESOP shares initially were pledged as collateral for
its debt. As the debt was repaid, shares were released from collateral and
allocated to employees who made 401(k) contributions that year, in the form of a
matching contribution, based on the proportion of debt service paid in the year.
Shares pledged as collateral were reported as unearned ESOP shares in the
Consolidated Balance Sheets. As shares were released from collateral, we
reported compensation expense equal to the cost of the shares to the ESOP. All
ESOP shares were considered outstanding in earnings-per-share computations, and
dividends on allocated and unallocated shares were recorded as a reduction of
Retained Earnings.
The
following table summarizes ESOP activity during the years ended December
31:
|
2009
|
2008
|
2007
|
||||||||||
|
Cash
contributions
|
$ | 1,717 | $ | 1,621 | $ | 1,530 | ||||||
|
Net
benefit provided by ESOP
|
989 | 2,219 | 2,568 | |||||||||
|
Interest
earned and received on loan
|
190 | 363 | 520 | |||||||||
|
Dividends
|
359 | 427 | 486 | |||||||||
The
benefit provided through the ESOP was net of expenses and was recorded in Other
Income. On December 31, 2009, the ESOP’s twenty year loan matured and was repaid
to us, completing the term for this ESOP.
The
ESOP shares as of December 31, were as follows:
|
2009
|
2008
|
2007
|
||||||||||
|
Allocated
shares
|
1,938,132 | 1,838,171 | 1,738,210 | |||||||||
|
Unreleased
shares
|
- | 99,961 | 199,922 | |||||||||
|
Total
ESOP shares
|
1,938,132 | 1,938,132 | 1,938,132 | |||||||||
|
17.
|
Earnings (Loss) Per
Share
|
The
computations of basic and diluted earnings (loss) per share for the years ended
December 31, were as follows:
|
2009
|
2008
|
2007
|
||||||||||
|
Numerator:
|
||||||||||||
|
Net
(Loss) Earnings
|
$ | (26,241 | ) | $ | 10,624 | $ | 39,867 | |||||
|
Denominator:
|
||||||||||||
|
Basic
- Weighted Average Shares Outstanding
|
18,507,772 | 18,303,137 | 18,640,882 | |||||||||
|
Effect
of dilutive securities:
|
||||||||||||
|
Employee
stock options
|
- | 278,703 | 505,143 | |||||||||
|
Diluted
- Weighted Average Shares Outstanding
|
18,507,772 | 18,581,840 | 19,146,025 | |||||||||
|
Basic
(Loss) Earnings per Share
|
$ | (1.42 | ) | $ | 0.58 | $ | 2.14 | |||||
|
Diluted
(Loss) Earnings per Share
|
$ | (1.42 | ) | $ | 0.57 | $ | 2.08 | |||||
Options
to purchase 502,103, 46,016 and 20,697 shares of Common Stock were outstanding
during 2009, 2008, and 2007, respectively, but were not included in the
computation of diluted earnings per share. These exclusions are made if the
exercise prices of these options are greater than the average market price of
our Common Stock for the period, if the number of shares we can repurchase
exceeds the weighted shares outstanding in the options, or if we have a net
loss, as the effects are anti-dilutive.
|
18.
|
Segment Reporting
|
We are
organized into four operating segments: North America; Europe, Middle East,
Africa; Asia Pacific and Latin America. In accordance with the objective and
basic principles of the applicable accounting guidance, we aggregate our
operating segments into one reportable segment that consists of the design,
manufacture and sale of products used primarily in the maintenance of
nonresidential surfaces.
The
following sets forth Net Sales and long-lived assets by geographic
area:
|
2009
|
2008
|
2007
|
||||||||||
|
Net
Sales:
|
||||||||||||
|
North
America
|
$ | 345,766 | $ | 402,174 | $ | 417,757 | ||||||
|
Europe,
Middle East and Africa
|
177,829 | 217,594 | 183,188 | |||||||||
|
Other
International
|
72,280 | 81,637 | 63,273 | |||||||||
|
Total
|
$ | 595,875 | $ | 701,405 | $ | 664,218 | ||||||
| 2009 | 2008 | |||||||||||
|
Long-lived
assets:
|
||||||||||||
|
North
America
|
$ | 93,402 | $ | 99,022 | ||||||||
|
Europe,
Middle East and Africa
|
41,016 | 87,815 | ||||||||||
|
Other
International
|
17,384 | 15,114 | ||||||||||
|
Total
|
$ | 151,802 | $ | 201,951 | ||||||||
Accounting
policies of the operations in the various geographic areas are the same as those
described in Note 1. Net Sales are attributed to each geographic area based on
the country to which the product is shipped and are net of intercompany sales.
North America sales include sales in the United States and Canada. Sales in
Canada comprise less than 10% of consolidated sales and are interrelated with
our U.S. operations. No single customer represents more than 10% of our
consolidated sales. Long-lived assets consist of property and equipment,
Goodwill, Intangible Assets and certain other assets.
The
following table presents revenues for groups of similar products and
services:
|
2009
|
2008
|
2007
|
||||||||||
|
Net
Sales:
|
||||||||||||
|
Equipment
|
$ | 329,871 | $ | 411,765 | $ | 393,270 | ||||||
|
Parts
and consumables
|
151,932 | 168,699 | 161,334 | |||||||||
|
Service
and other
|
95,046 | 97,292 | 84,429 | |||||||||
|
Specialty
surface coatings
|
19,026 | 23,649 | 25,185 | |||||||||
|
Total
|
$ | 595,875 | $ | 701,405 | $ | 664,218 | ||||||
|
19.
|
Consolidated Quarterly Data
(Unaudited)
|
|
Net
Sales
|
Gross
Profit
|
|||||||||||||||
|
Quarter
|
2009
|
2008
|
2009
|
2008
|
||||||||||||
|
First
|
$ | 128,647 | $ | 168,600 | $ | 52,725 | $ | 69,640 | ||||||||
|
Second
|
148,578 | 193,584 | 60,099 | 82,203 | ||||||||||||
|
Third
|
154,427 | 185,935 | 64,888 | 78,552 | ||||||||||||
|
Fourth
|
164,223 | 153,286 | 68,396 | 55,855 | ||||||||||||
|
Year
|
$ | 595,875 | $ | 701,405 | $ | 246,108 | $ | 286,250 | ||||||||
39
NOTES
TO THE CONSOLIDATED FINANCIAL STATEMENTS
(in
thousands, except shares and per share data)
| Basic (Loss) Earnings | Diluted (Loss) Earnings | |||||||||||||||||||||
| Net (Loss) Earnings | per Share |
|
per Share | |||||||||||||||||||
|
Quarter
|
2009
|
2008
|
2009
|
2008
|
2009
|
2008
|
||||||||||||||||
|
First
|
$ | (41,746 | ) | $ | 5,235 | $ | (2.29 | ) | $ | 0.28 | $ | (2.29 | ) | $ | 0.28 | |||||||
|
Second
|
3,007 | 8,292 | 0.16 | 0.45 | 0.16 | 0.44 | ||||||||||||||||
|
Third
|
5,783 | 13,985 | 0.31 | 0.77 | 0.31 | 0.76 | ||||||||||||||||
|
Fourth
|
6,715 | (16,888 | ) | 0.36 | (0.93 | ) | 0.35 | (0.93 | ) | |||||||||||||
|
Year
|
$ | (26,241 | ) | $ | 10,624 | $ | (1.42 | )(1) |
|
$ | 0.58 | (1) |
|
$ | (1.42 | )(1) |
|
$ | 0.57 | (1) | ||
Regular
quarterly dividends aggregated $0.53 per share in 2009, or $0.13 per share for
the first three quarters of 2009 and $0.14 for the fourth quarter of 2009, and
$0.52 per share in 2008, or $0.13 per share for each of the four quarters of
2008.
|
20.
|
Related Party
Transactions
|
On May
18, 2009, we announced an exclusive technology license agreement with Activeion
Cleaning Solutions, LLC (“Activeion”) a company in which a current employee of
Tennant owns a minority interest. Royalties under this license agreement are not
material to our financial position or results of operations.
In June
2008, we entered into a settlement agreement with a former member of the Board
of Directors to resolve a disputed claim alleging that we failed to provide
adequate notice of the expiration of stock options upon resignation from the
Board. The payment represents a portion of the value of the vested stock
options that expired upon resignation from the Board. This settlement
payment is not material to our financial position or results of
operations.
During
the first quarter of 2008, we acquired Applied Sweepers and Alfa and entered
into lease agreements for certain properties owned by or partially owned by the
former owners of these entities. These individuals are now current employees of
Tennant. Lease payments made under these lease agreements are not material to
our financial position or results of operations.
ITEM 9 – Changes in and Disagreements
with Accountants on Accounting and Financial Disclosure
None.
ITEM 9A – Controls and Procedures
Disclosure
Controls and Procedures
Our
management, with the participation of our Chief Executive Officer and our
Principal Financial and Accounting Officer, have evaluated the effectiveness of
our disclosure controls and procedures for the period ended December 31, 2009
(as defined in Rules 13a-15(e) and 15d-15(e) under the Securities Exchange Act
of 1934 (the “Exchange Act”)). Based on that evaluation, our Chief Executive
Officer and our Principal Financial and Accounting Officer have concluded that
our disclosure controls and procedures are effective to ensure that information
required to be disclosed by us in reports that we file or submit under the
Exchange Act is recorded, processed, summarized and reported within the time
periods specified in Securities and Exchange Commission rules and forms, and
that such information is accumulated and communicated to our management,
including our principal executive and our principal financial officers, as
appropriate to allow timely decisions regarding required
disclosure.
Changes
in Internal Control
There
were no significant changes in our internal control over financial reporting
during the most recently completed fiscal quarter that have materially affected,
or are reasonably likely to materially affect, our internal control over
financial reporting.
Management’s
Report on Internal Control over Financial Reporting
Our
management is responsible for establishing and maintaining adequate internal
control over financial reporting, as such term is defined in Exchange Act Rule
13a-15(f). Under the supervision and with the participation of our management,
including our principal executive officer and principal accounting and financial
officer, we conducted an assessment of the effectiveness of our internal control
over financial reporting based on the framework in Internal Control – Integrated
Framework issued by the Committee of Sponsoring Organizations of the
Treadway Commission. Based on our assessment under the framework in Internal Control – Integrated
Framework (COSO), our management concluded that our internal control over
financial reporting was effective as of December 31, 2009.
KPMG LLP,
an independent registered public accounting firm, has audited the consolidated
financial statements included in this Annual Report on Form 10-K and, as a
part of this audit, has issued their report, included in Item 8, on the
effectiveness of our internal control over financial reporting.
|
/s/
H. Chris Killingstad
|
|||
|
H.
Chris Killingstad
President
and Chief Executive Officer
|
|||
|
/s/
Thomas Paulson
|
|||
|
Thomas
Paulson
Vice
President and Chief Financial Officer
(Principal
Financial and Accounting Officer)
|
Attestation
Report of Independent Registered Public Accounting Firm
The
attestation report required under this item is contained in Item 8 of this
Annual Report on Form 10-K.
ITEM 9B – Other Information
None.
PART
III
ITEM 10 – Directors, Executive Officers and Corporate
Governance
The
sections entitled “Board of Directors Information” and “Section 16(a) Beneficial
Ownership Reporting Compliance” in our 2010 Proxy Statement are incorporated
herein by reference.
The list
below identifies those persons designated as executive officers of the Company,
including their age, position with the Company and positions held by them during
the past five or more years.
Thomas J.
Dybsky, Vice President, Administration
Thomas J.
Dybsky (60) joined the Company in September 1998 as Vice President of Human
Resources and was named Vice President of Administration in 2004. From June 1995
to September 1998, he was Vice President/Senior Consultant for MDA
Consulting.
Andrew J.
Eckert, Vice President, Americas
Andrew J.
Eckert (46) joined Tennant in 2002 as General Manager, North America. He was
promoted to Vice President, North America Sales in 2005, and now serves as Vice
President, The Americas. From 2000 to 2002, he was the Senior Vice President of
Operations at Storecast Merchandising Company, a national retail merchandising
service contractor for the grocery industry. Prior to that, he was Director of
Strategic Planning at General Mills and led the automation and cost-reduction
efforts for U.S. trade promotional spending. He began his sales career in 1985
at General Mills in Houston, TX, and held a variety of increasing
responsibilities including Customer Sales Manager for Fleming Companies and
American Stores.
Karel
Huijser, Vice President, International
Karel
Huijser (49) joined the Company in 2006 as Vice President, International. Prior
to joining Tennant, he was President and CEO of Asia Pacific for GE
Infrastructure Shanghai, China, from 2005 to November 2006. From 2003 to 2005,
he was General Manager of Asia Pacific, GE Water and Process Technologies
(Asia). From 2001 to 2003, he was Global Marketing Director for GE Plastics
Division based in The Netherlands. His career at GE began in 1992, following six
years at Daf Trucks in The Netherlands.
H. Chris
Killingstad, President and Chief Executive Officer
H. Chris
Killingstad (54) joined the Company in April 2002 as Vice President, North
America and was named President and CEO in 2005. From 1990 to 2000, he was
employed by The Pillsbury Company, a consumer foods manufacturer. From 1999 to
2000 he served as Sr. Vice President and General Manager of Frozen Products for
Pillsbury North America; from 1996 to 1999 he served as Regional Vice President
and Managing Director of Pillsbury Europe, and from 1990 to 1996 was Regional
Vice President of Haagen-Dazs Asia Pacific.
Thomas
Paulson, Vice President and Chief Financial Officer
Thomas
Paulson (53) joined Tennant in March 2006. Prior to joining Tennant, Paulson was
Chief Financial Officer and Senior Vice President of Innovex from 2001 to 2006.
Prior to joining Innovex, a manufacturer of electronic interconnect solutions,
Paulson worked for The Pillsbury Company for over 19 years. Paulson became a
Vice President at Pillsbury in 1995 and was the Vice President of Finance for
the $4 billion North American Foods Division for over two years before joining
Innovex.
Michael
W. Schaefer, Vice President, Chief Technical Officer
Mike
Schaefer (49) joined the Company in January 2008 as Vice President, Chief
Technical Officer. From 2000 to January 2008, he was Vice President of
Dispensing Systems, Lean Six Sigma and Quality at Ecolab, Inc., a provider of
cleaning, sanitizing, food safety and infection prevention products and
services, where he led R&D efforts for their equipment business, continuous
improvement and standardization of R&D processes. Prior to that he held
various management positions at Alticor Corporation and Kraft General
Foods.
Don B.
Westman, Vice President, Global Operations
Don B.
Westman (56) joined the Company in November 2006 as Vice President, Global
Operations. Prior to joining Tennant, he was Vice President of Operations – Pump
Division for Pentair, Inc., a provider of products and services for the
movement, treatment and storage of water, from 2005 to November 2006. From 2003
to 2005, he was Vice President of Operations – Pentair Water. From 1997 to 2003,
Westman was Vice President of Operations for Hoffmans Enclosures, where he began
in 1982 as a manufacturing engineering manager.
Heidi M.
Wilson, Vice President, General Counsel and Secretary
Heidi M.
Wilson (59) joined Tennant in 2003 as Assistant General Counsel and Assistant
Secretary and was named General Counsel in 2005. She was a partner with General
Counsel Ltd. during 2003. From 1995 to 2001, she was Vice President, General
Counsel and Secretary at Musicland Group, Inc. From 1993 to 1995, she was Senior
Legal Counsel at Medtronic, Inc. Prior to that, she was a partner at Faegre
& Benson L.L.P., a Minneapolis law firm, which she joined in
1976.
Business
Ethics Guide
We have
adopted the Tennant Company Business Ethics Guide, which applies to all of our
employees, directors, consultants, agents and anyone else acting on our behalf.
The Business Ethics Guide includes particular provisions applicable to our
senior financial management, which includes our Chief Executive Officer, Chief
Financial Officer, Controller and other employees performing similar functions.
A copy of our Business Ethics Guide is available on the Investor Relations page
of our website, www.tennantco.com, and a copy will be mailed upon request to
Investor Relations, Tennant Company, P.O. Box 1452, Minneapolis, MN 55440-1452.
We intend to post on our website any amendment to, or waiver from, a provision
of our Business Ethics Guide that applies to our Principal Executive Officer,
Principal Financial Officer, Principal Accounting Officer, Controller and other
persons performing similar functions promptly following the date of such
amendment or waiver. In addition, we have also posted copies of our Corporate
Governance Principles and the Charters for our Audit, Compensation, Governance
and Executive Committees on our website.
ITEM 11 – Executive Compensation
The
sections entitled “Director Compensation for 2009” and “Executive Compensation
Information” in our 2010 Proxy Statement are incorporated herein by
reference.
ITEM 12 – Security Ownership of Certain
Beneficial Owners and Management and Related Shareholder Matters
The
sections entitled “Equity Compensation Plan Information” and “Security Ownership
of Certain Beneficial Owners and Management” in our 2010 Proxy Statement are
incorporated herein by reference.
ITEM 13 – Certain Relationships and Related
Transactions, and Director Independence
The
sections entitled “Director Independence” and “Related Person Transaction
Approval Policy” in our 2010 Proxy Statement are incorporated herein by
reference.
ITEM 14 – Principal Accountant Fees and
Services
The
section entitled “Fees Paid to Independent Registered Public Accounting Firm” in
our 2010 Proxy Statement is incorporated herein by reference.
PART
IV
ITEM 15 – Exhibits and Financial Statement
Schedules
|
A.
|
The
following documents are filed as a part of this
report:
|
|
1.
|
Financial Statements
|
Consolidated
Financial Statements filed as part of this report are contained in Item 8 of
this Annual Report on Form 10-K.
|
2.
|
Financial
Statement Schedule
|
|
|
Schedule
II – Valuation and Qualifying
Accounts
|
|
(In
thousands)
|
2009
|
2008
|
2007
|
|||||||||
|
Allowance
for Doubtful Accounts and Returns:
|
||||||||||||
|
Balance
at beginning of period
|
$ | 7,319 | $ | 3,264 | $ | 3,347 | ||||||
|
Charged
to costs and expenses
|
996 | 4,083 | 1,622 | |||||||||
|
Charged
to other accounts
|
257 | (76 | ) | 68 | ||||||||
|
Deductions
(1)
|
(3,495 | ) | 48 | (1,773 | ) | |||||||
|
Balance
at end of period
|
$ | 5,077 | $ | 7,319 | $ | 3,264 | ||||||
|
Inventory
Reserves:
|
||||||||||||
|
Balance
at beginning of period
|
$ | 5,127 | $ | 4,427 | $ | 4,403 | ||||||
|
Charged
to costs and expenses
|
2,847 | 4,523 | 4,731 | |||||||||
|
Deductions
|
(3,977 | ) | (3,823 | ) | (4,707 | ) | ||||||
|
Balance
at end of period
|
$ | 3,997 | $ | 5,127 | $ | 4,427 | ||||||
|
Valuation
Allowance for Deferred Tax Assets:
|
||||||||||||
|
Balance
at beginning of period
|
$ | 9,303 | $ | 8,197 | $ | 11,034 | ||||||
|
Charged
to costs and expenses
|
- | - | (3,644 | ) | ||||||||
|
Charged
to other accounts
|
(172 | ) | 1,106 | 807 | ||||||||
|
Balance
at end of period
|
$ | 9,131 | $ | 9,303 | $ | 8,197 | ||||||
(1) Includes
accounts determined to be uncollectible and charged against reserves, net of
collections on accounts previously charged against reserves, as well as the
effect of foreign currency on these reserves.
All other
schedules are omitted because they are not applicable or the required
information is shown in the Consolidated Financial Statements or notes
thereto.
REPORT OF INDEPENDENT REGISTERED
PUBLIC ACCOUNTING FIRM ON FINANCIAL STATEMENT SCHEDULE
The Board
of Directors and Shareholders
Tennant
Company:
Under
date of February 26, 2010, we reported on the consolidated balance sheets of
Tennant Company and subsidiaries as of December 31, 2009 and 2008, and the
related consolidated statements of operations, cash flows, and shareholders’
equity and comprehensive income (loss) for each of the years in the three-year
period ended December 31, 2009, which are included in Item 15.A.1. In connection
with our audits of the aforementioned consolidated financial statements, we also
audited the related consolidated financial statement schedule as included in
Item 15.A.2. This financial statement schedule is the responsibility of the
Company’s management. Our responsibility is to express an opinion on this
financial statement schedule based on our audits.
In our
opinion, such financial statement schedule, when considered in relation to the
basic consolidated financial statements taken as a whole, presents fairly, in
all material respects, the information set forth therein.
/s/ KPMG
LLP
Minneapolis,
Minnesota
February
26, 2010
|
3.
|
Exhibits
|
|||
|
Item
#
|
Description
|
Method
of Filing
|
||
|
Rider
A:
|
||||
|
2.1
|
Share Purchase Agreement dated February 15, 2008 among the Sellers identified therein and Tennant Scotland Limited (excluding schedules and exhibits, which the Company agrees to furnish supplementally to the Securities and Exchange Commission upon request) |
|
Incorporated
by reference to Exhibit 2.1 to the Company's Form 8-K dated February 29,
2008.
|
|
|
3i
|
Restated
Articles of Incorporation
|
Incorporated
by reference to Exhibit 3i to the Company’s report on Form 10-Q for the
quarterly period ended June 30, 2006.
|
||
|
3ii
|
Certificate
of Designation
|
Incorporated
by reference to Exhibit 3.1 to the Company's Form 10-K for the year ended
December 31, 2006.
|
||
|
3iii
|
Amended
and Restated By-Laws
|
Incorporated
by reference to Exhibit 4(c) to the Company’s Registration Statement on
Form S-3, Registration No. 333-160887 filed on July 30,
2009.
|
||
|
4.1
|
Rights Agreement, dated as of November 10, 2006, between the Company and Wells Fargo Bank, N.A., as Rights Agent |
Incorporated
by reference to Exhibit 1 to Form 8-A dated
November 14, 2006.
|
||
|
10.1
|
Tennant
Company 1995 Stock Incentive Plan*
|
Incorporated
by reference to Exhibit 4.4 to the Company’s Registration Statement No.
33-62003, Form S-8, dated August 22, 1995.
|
||
|
10.2
|
Tennant Company Executive Nonqualified Deferred Compensation Plan, as restated effective January 1, 2005* |
Incorporated
by reference to Exhibit 10.4 to the Company’s Form 10-K for the year ended
December 31, 2007.
|
||
|
10.3
|
Form of Management Agreement and Executive Employment Agreement* |
|
Incorporated
by reference to Exhibit 10.5 to the Company’s Form 10-K for the year ended
December 31, 2008.
|
|
|
10.4
|
Schedule
of parties to Management and Executive Employment
Agreement
|
Incorporated
by reference to Exhibit 10.5 to the Company’s Form 10-K for the year ended
December 31, 2008.
|
||
|
10.5
|
Tennant
Company Non-Employee Director Stock Option Plan (as amended and restated
effective May 6, 2004)*
|
Incorporated
by reference to Exhibit 10.6 to the Company’s Form 10-Q for the quarterly
period ended June 30, 2004.
|
||
|
10.6
|
Tennant
Company Amended and Restated 1999 Stock Incentive Plan*
|
Incorporated
by reference to Appendix A to the Company’s proxy statement for the 2006
Annual Meeting of Shareholders filed on March 15, 2006.
|
||
|
10.7
|
Long-Term
Incentive Plan 2007*
|
Incorporated
by reference to Exhibit 10.12 to the Company’s Form 10-K for the year
ended December 31, 2006.
|
||
|
10.8
|
Long-Term
Incentive Plan 2008*
|
Incorporated
by reference to Exhibit 10.2 to the Company’s Form 10-Q for the quarterly
period ended March 31, 2008.
|
||
|
10.9
|
Short-Term
Incentive Plan 2008*
|
Incorporated
by reference to Exhibit 10.3 to the Company’s Form 10-Q for the quarterly
period ended March 31, 2008.
|
||
|
10.10
|
Deferred
Stock Unit Agreement (awards prior to 2008)*
|
Incorporated
by reference to Exhibit 10.14 to the Company's Form 10-K for the year
ended December 31, 2006.
|
||
|
10.11
|
Services
Agreement and Management Agreement between the Company and Karel
Huijser*
|
|
Incorporated
by reference to Exhibit 10.15 to the Company’s Form 10-K for the year
ended December 31, 2008.
|
|
|
10.12
|
Amendment
No. 1 dated as of December 17, 2008 to Services Agreement and Management
Agreement between the Company and Karel Huijser*
|
|
Incorporated
by reference to Exhibit 10.16 to the Company’s Form 10-K for the year
ended December 31, 2008.
|
|
|
10.13
|
Tennant
Company 2007 Stock Incentive Plan*
|
Incorporated
by reference to Appendix A to the Company’s proxy statement for the 2007
Annual Meeting of Shareholders filed on March 15, 2007.
|
||
|
10.14
|
Credit
Agreement dated as of June 19, 2007
|
Incorporated
by reference to Exhibit 10.1 to the Company's Form 8-K dated June 21,
2007.
|
||
|
10.15
|
Deferred
Stock Unit Agreement (awards in and after 2008)*
|
Incorporated
by reference to Exhibit 10.17 to the Company’s Form 10-K for the year
ended December 31, 2007.
|
||
|
10.16
|
Amendment
No. 1 dated as of February 21, 2008 to Credit Agreement dated as of June
19, 2007
|
Incorporated
by reference to Exhibit 10.1 to the Company's Form 10-Q for the quarterly
period ended March 31, 2008.
|
||
|
10.17
|
Tennant
Company 2009 Short-Term Incentive Plan*
|
Incorporated
by reference to Appendix A to the Company's Proxy statement for the 2008
Annual Meeting of Shareholder's filed on March 14,
2008.
|
||
|
10.18
|
Amendment
No. 2 to the Credit Agreement dated as of March 4, 2009
|
Incorporated
by reference to Exhibit 10.1 to the Company's Form 8-K dated March 10,
2009.
|
||
|
10.19
|
Pledge
and Security Agreement dated as of March 4, 2009
|
Incorporated
by reference to Exhibit 10.2 to the Company’s Form 8-K dated March 4,
2009.
|
||
|
10.20
|
Private
Shelf Agreement dated as of July 29, 2009
|
Incorporated
by reference to Exhibit 10.1 to the Company's Current Report on Form 8-K
filed on July 30, 2009.
|
||
|
21
|
Subsidiaries
of the Registrant
|
Filed
herewith electronically.
|
||
|
23.1
|
Consent
of KPMG, LLP Independent Registered Public Accounting Firm
|
Filed
herewith electronically.
|
||
|
31.1
|
Rule
13a-14(a)/15d-14(a) Certification of Chief Executive
Officer
|
Filed
herewith electronically.
|
||
|
31.2
|
Rule
13a-14(a)/15d-14(a) Certification of Chief Financial
Officer
|
Filed
herewith electronically.
|
||
|
32.1
|
Section
1350 Certification of Chief Executive Officer
|
Filed
herewith electronically.
|
||
|
32.2
|
Section
1350 Certification of Chief Financial Officer
|
Filed
herewith electronically.
|
||
*Management
contract or compensatory plan or arrangement required to be filed as an exhibit
to this Annual Report on Form 10-K.
46
SIGNATURES
Pursuant
to the requirements of Section 13 or 15(d) of the Securities Exchange Act of
1934, the Registrant has duly caused this report to be signed on its behalf by
the undersigned, thereunto duly authorized.
|
TENNANT
COMPANY
|
||||||
|
By
|
/s/
H. Chris Killingstad
|
|||||
|
H.
Chris Killingstad
President,
CEO and
Board
of Directors
|
||||||
|
Date
|
February
26, 2010
|
|||||
Pursuant
to the requirements of Section 13 or 15(d) of the Securities Exchange Act of
1934, this report has been signed by the following persons on behalf of the
Registrant and in the capacities and on the dates indicated.
|
By
|
/s/
H. Chris Killingstad
|
By
|
/s/
David Mathieson
|
|||||
|
H.
Chris Killingstad
President,
CEO and
Board
of Directors
|
David
Mathieson
Board
of Directors
|
|||||||
|
Date
|
February
26, 2010
|
Date
|
February
26, 2010
|
|||||
|
By
|
/s/
Thomas Paulson
|
By
|
/s/
Donal L. Mulligan
|
|||||
|
Thomas
Paulson
Vice
President and Chief Financial Officer
(Principal
Financial and Accounting Officer)
|
Donal
L. Mulligan
Board
of Directors
|
|||||||
|
Date
|
February
26, 2010
|
Date
|
February
26, 2010
|
|||||
|
By
|
/s/
William F. Austen
|
By
|
/s/
Stephen G. Shank
|
|||||
|
William
F. Austen
Board
of Directors
|
Stephen
G. Shank
Board
of Directors
|
|||||||
|
Date
|
February
26, 2010
|
Date
|
February
26, 2010
|
|||||
|
By
|
/s/
Jeffrey A. Balagna
|
By
|
/s/
Steven A. Sonnenberg
|
|||||
|
Jeffrey
A. Balagna
Board
of Directors
|
Steven
A. Sonnenberg
Board
of Directors
|
|||||||
|
Date
|
February
26, 2010
|
Date
|
February
26, 2010
|
|||||
|
By
|
/s/
Carol S. Eicher
|
By
|
/s/
David S. Wichmann
|
|||||
|
Carol
S. Eicher
Board
of Directors
|
David
S. Wichmann
Board
of Directors
|
|||||||
|
Date
|
February
26, 2010
|
Date
|
February
26, 2010
|
|||||
|
By
|
/s/
James T. Hale
|
|||||||
|
James
T. Hale
Board
of Directors
|
||||||||
|
Date
|
February
26, 2010
|
47