Attached files
Table of Contents
UNITED STATES
SECURITIES AND EXCHANGE COMMISSION
Washington, D.C. 20549
FORM 10-K
| x | ANNUAL REPORT PURSUANT TO SECTION 13 OR 15(d) OF THE SECURITIES EXCHANGE ACT OF 1934 |
For the fiscal year ended December 31, 2009
OR
| ¨ | TRANSITION REPORT PURSUANT TO SECTION 13 OR 15(d) OF THE SECURITIES EXCHANGE ACT OF 1934 |
For the transition period from to
Commission File Number 1-34004
SCRIPPS NETWORKS INTERACTIVE, INC.
(Exact name of registrant as specified in its charter)
| Ohio | 61-1551890 | |
| (State or other jurisdiction of incorporation or organization) |
(IRS Employer Identification Number) | |
| 312 Walnut Street Cincinnati, Ohio |
45202 | |
| (Address of principal executive offices) | (Zip Code) | |
Registrant’s telephone number, including area code: (513) 824-3200
| Title of each class |
Name of each exchange on which registered | |
| Securities registered pursuant to Section 12(b) of the Act: Class A Common shares, $.01 par value |
New York Stock Exchange |
Securities registered pursuant to Section 12(g) of the Act: Not applicable
Indicate by check mark if the registrant is a well-known seasoned issuer, as defined in Rule 405 of the Securities
Act. Yes x No ¨
Indicate by check mark if the registrant is not required to file reports pursuant to Section 13 of Section 15(d) of the
Act. Yes ¨ No x
Indicate by check mark whether the registrant (1) has filed all reports required to be filed by Section 13 or 15(d) of the Securities Exchange Act of 1934 during the preceding 12 months (or for such shorter period that the registrant was required to file such reports), and (2) has been subject to such filing requirements for the past 90 days. Yes x No ¨
Indicate by check mark whether the registrant has submitted electronically and posted on its corporate Web site, if any, every Interactive Data File required to be submitted and posted pursuant to Rule 405 of Regulation S-T (§232.405 of this chapter) during the preceding 12 months (or for such shorter period that the registrant was required to submit and post such files). Yes ¨ No ¨
Indicate by check mark if disclosure of delinquent filers pursuant to Item 405 of Regulation S-K is not contained herein, and will not be contained, to the best of the registrant’s knowledge, in definitive proxy or information statements incorporated by reference in Part III of this Form 10-K or any amendment to this Form 10-K. ¨
Indicate by check mark whether the registrant is a large accelerated filer, an accelerated filer, non-accelerated filer, or a smaller reporting company (as defined in Rule 12b-2 of the Exchange Act).
| Large accelerated filer | x | Accelerated filer | ¨ | |||
| Non-accelerated filer | ¨ | Smaller reporting company | ¨ | |||
Indicate by check mark whether the registrant is a shell company (as defined in Rule 12b-2 of the Act). Yes ¨ No x
The aggregate market value of Class A Common shares of the registrant held by non-affiliates of the registrant on June 30, 2009, was approximately $2,560,980,469. All Class A Common shares beneficially held by executives and directors of the registrant and The Edward W. Scripps Trust have been deemed, solely for the purpose of the foregoing calculation, to be held by affiliates of the registrant. There is no active market for our Common Voting shares.
As of January 29, 2010, there were 129,538,215 of the registrant’s Class A Common shares, $.01 par value per share, outstanding and 36,338,226 of the registrant’s Common Voting shares, $.01 par value per share, outstanding.
Certain information required for Part III of this report is incorporated herein by reference to the proxy statement for the 2010 annual meeting of shareholders.
Table of Contents
Index to Scripps Networks Interactive, Inc. Annual Report on Form 10-K for the Year Ended December 31, 2009
2
Table of Contents
As used in this Annual Report on Form 10-K, the terms “SNI,” “we,” “our” or “us” may, depending on the context, refer to Scripps Networks Interactive, Inc., to one or more of its consolidated subsidiary companies, or to all of them taken as a whole.
Our Company Web site is www.scrippsnetworksinteractive.com. Copies of all of our SEC filings filed or furnished pursuant to Section 13(a) or 15(d) of the Securities Exchange Act of 1934 are available free of charge on our Web site as soon as reasonably practicable after we electronically file the material with, or furnish it to, the SEC. Our Web site also includes copies of the charters for our Compensation, Nominating & Governance and Audit Committees, our Corporate Governance Principles, our Insider Trading Policy, our Ethics Policy and our Code of Ethics for the CEO and Senior Financial Officers. All of these documents are also available to shareholders in print upon request.
Our Annual Report on Form 10-K contains certain forward-looking statements related to our businesses that are based on our current expectations. Forward-looking statements are subject to certain risks, trends and uncertainties that could cause actual results to differ materially from the expectations expressed in the forward-looking statements. Such risks, trends and uncertainties, which in most instances are beyond our control, include changes in advertising demand and other economic conditions; consumers’ tastes; program costs; labor relations; technological developments; competitive pressures; interest rates; regulatory rulings; the risk that the benefits from the separation transaction may not be fully realized or may take longer to realize than expected; and reliance on third-party vendors for various products and services. The words “believe,” “expect,” “anticipate,” “estimate,” “intend” and similar expressions identify forward-looking statements. All forward-looking statements, which are as of the date of this filing, should be evaluated with the understanding of their inherent uncertainty. We undertake no obligation to publicly update any forward-looking statements to reflect events or circumstances after the date the statement is made.
| Item 1. | Business |
Separation from The E. W. Scripps Company
As previously disclosed in our registration statement on Form 10 filed with the U.S. Securities and Exchange Commission, Scripps Networks Interactive, Inc. was formed on July 1, 2008 and became a publicly traded company as the result of the separation of The E. W. Scripps Company (our “Former Parent” or “E. W. Scripps”) into two publicly traded companies. The separation was completed through a tax free distribution of Scripps Networks Interactive shares to E. W. Scripps shareholders following the close of business on June 30, 2008.
Business Overview
Scripps Networks Interactive is a leading lifestyle content and interactive services company with respected, high-profile television and interactive brands. Our businesses engage audiences and efficiently serve advertisers by delivering entertaining and highly useful content that focuses on specifically defined topics of interest.
We manage our operations through two reportable operating segments: Lifestyle Media and Interactive Services. Lifestyle Media, includes Home and Garden Television (“HGTV”), Food Network, Travel Channel, DIY Network (“DIY”), Fine Living Network (“FLN”), which will be re-branded as the Cooking Channel in 2010, Great American Country (“GAC”), and associated Web sites that are part of the aforementioned television brands, and other Internet-based businesses serving food or shelter related categories such as RecipeZaar.com, HGTVPro.com and FrontDoor.com. Interactive Services includes online comparison shopping and consumer information services, bizrate, Shopzilla, and beso.
Our Lifestyle Media segment earns revenue principally from advertising sales, affiliate fees and ancillary sales, including the sale and licensing of consumer products. Revenues from the Interactive Services segment are generated primarily from referral fees and commissions paid by merchants and service providers for online leads generated by the company’s comparison shopping Web sites. Revenues from the Lifestyle Media segment accounted for 89 percent, 85 percent and 84 percent of our consolidated revenues for 2009, 2008 and 2007, respectively, and revenues from the Interactive Services segment accounted for 11 percent, 15 percent and 16 percent of our consolidated revenues for those periods, respectively.
We seek to engage audiences that are highly desirable to advertisers with entertaining and informative lifestyle content that is produced for television, the Internet and any other media platforms consumers choose. We intend to expand and enhance our Lifestyle Media brands through the creation of popular new programming and content, the use of new distribution platforms, such as mobile phones and video-on-demand,
3
Table of Contents
the licensing and sale of branded consumer products and through international expansion. At our Interactive Services businesses, we aggregate large audiences on the Internet by organizing searchable and highly useful consumer information. We intend to enhance our Interactive Services businesses by improving the overall search comprehensiveness and usefulness of our Web sites, diversifying sources of revenue, increasing the volume of user-generated consumer information and entering new geographic markets.
Business Segments
Our Lifestyle Media business segment includes six national television networks and our portfolio of related interactive lifestyle brands. The segment generates revenue principally from the sale of advertising time on national television networks and interactive media platforms and from affiliate fees paid by cable television operators, direct-to-home satellite services and other distributors that carry our network programming. In 2009, revenues from advertising sales and affiliate fees were approximately 74 percent and 24 percent, respectively, of total revenue for the Lifestyle Media segment. Our Lifestyle Media segment also earns revenue from the licensing of its content to third parties, primarily in international markets, and the licensing of its brands for consumer products such as videos, books, kitchenware and tools.
The advertising revenue generated by our national television networks depends on the number of households subscribing to each service and on viewership ratings as determined by Nielsen Media Research and other third-party research companies.
HGTV and Food Network and their targeted home and food programming categories appeal strongly to women viewers with higher incomes in the 18 to 49 age range, an audience demographic that is traditionally valued by advertisers. Travel Channel and its targeted travel programming categories appeal to viewers who are more affluent than the average cable viewer and skews slightly to adult men in the 18 to 49 range. GAC appeals to women viewers, while DIY typically has a higher percentage of adult male viewers. FLN, originally intended to appeal to both higher income men and women, will likely appeal more to women with higher incomes in the 18 to 49 age range under the Cooking Channel brand. Advertising revenue can fluctuate relative to the popularity of specific programs and blocks of programming during defined periods of the day.
Affiliate fee revenues are negotiated with individual cable television and direct-to-home satellite operators and other distributors. The negotiations typically result in multi-year carriage agreements with scheduled, graduated rate increases. As an incentive to obtain long-term distribution agreements for our newer networks, we may make cash payments to cable and direct-to-home satellite operators, provide an initial period during which a distributor’s affiliate fee payments are waived, or both. The amount of the fee we receive is determined by the number of subscribers with access to our network programming.
As consumer acceptance of high-definition television grows, the company is developing an increasing amount of original programming in high-definition format. Lifestyle Media operates three high-definition channels, HGTV-HD, Food Network-HD, and Travel Channel-HD, and plans to debut DIY-HD and Cooking Channel-HD in 2010. The company’s high-definition television networks are accessible by an estimated 32 million U.S. households.
The company is also executing its growth strategy internationally. The company, through equity ownership positions in joint ventures and other partnerships, seeks to become a world leader in lifestyle media and brand-related products and services. The company’s objective is to broaden its brand authority to include lifestyle interests beyond food, home and travel, and to invest in a mix of mature and emerging markets. The company initiated its international strategy with the launch of Food Network on B-Sky-B in the United Kingdom, reaching 10 million households. The Food Network’s distribution in the U.K., other European markets, the Middle East and Africa is supported by a joint venture the company entered into and controls with Liberty Global Inc.’s Chello Zone. The company is considering entering or creating partnerships in other international markets including the Asia-Pacific, India and Latin America.
The company’s lifestyle-oriented interactive businesses are focused on the internal development and acquisition of interactive, media brands that are intended to diversify sources of revenue and enhance our competitive advantage as a leading provider of food, home and lifestyle content. Revenue generated by our lifestyle interactive businesses is derived primarily from the sale of display, banner, rich media and video advertising and sponsorships.
The lifestyle-oriented interactive businesses consist of multiple Web sites, including our six network-branded Web sites, FoodNetwork.com, HGTV.com, TravelChannel.com, DIYNetwork.com, FineLiving.com and GACTV.com. In addition to serving as the home Web sites for the segment’s television programming networks, the Web sites provide informational and instructional content on specific topics within their broader lifestyle content categories. Features such as HGTV KitchenDesign, HGTV BathDesign, and DIY Home Improvement are intended to aggregate engaged audiences with interests in specific lifestyle topics. All of the segment’s interactive services benefit from archived television network programming of which approximately 90 percent is owned by the company. Our ownership of programming enables us to efficiently and economically repurpose it for use on the Internet and other interactive distribution channels, including mobile and video-on-demand.
The lifestyle Web sites also consist of other digital services including HGTVPro.com, which appeals to construction professionals and advanced do-it-yourself enthusiasts; RecipeZaar.com, a recipe-sharing social networking Web site; and
4
Table of Contents
FrontDoor.com, a local real estate search and consumer information site that features millions of home listings and thousands of videos. The lifestyle Web sites accounted for about 6 percent of the segment’s total revenue in 2009. The strategic focus of the lifestyle interactive businesses is to grow advertising and sponsorship revenues by increasing the number of page views and video plays and attracting more unique visitors to our Web sites through site enhancements, adding more video, new tools, etc. Our strategy also includes attracting a broader audience through the placement of our video programming on national video streaming sites, and developing new sources of revenue that capitalize on traffic growth at our Web sites.
HGTV
HGTV is America’s leader in home television programming and is one of cable and satellite television’s top-rated networks. HGTV reaches about 99 million domestic households via cable and direct satellite television services. The network’s companion Web site is one of the nation’s leading online home and garden destinations, attracting an average of about 3 million unique visitors per month. The network’s programming also can be seen in 96 countries and territories.
HGTV television programming and Internet content commands an audience interested specifically in home and shelter-related topics. HGTV is television’s only network dedicated solely to such topics as decorating, interior design, home remodeling, landscape design and real estate. HGTV strives to engage audiences by creating original programming that is entertaining, instructional and informative.
The network ended 2009 with its highest ever annual prime-time ratings. Programming highlights included HGTV Design Star, House Hunters, and My First Place. The network also has developed successful programming events, including the HGTV Dream Home Giveaway and HGTV Green Home Giveaway and annual live coverage of the Rose Bowl Parade.
FOOD NETWORK
Food Network is a leading cable and satellite television network that has been credited with redefining the television food genre. The network engages viewers with likable hosts and personalities who explore interesting and different ways to approach food and food-related topics. Food Network is available in 99 million U.S. television households and its programming can be seen internationally in 150 countries and territories. The network’s Web site, FoodNetwork.com, consistently ranks as one of America’s top food and cooking Internet destinations, with an average of about 13 million unique visitors per month. The company owns approximately 69 percent of the Food Network and is the managing partner. The Tribune Company has a noncontrolling interest of approximately 31 percent in Food Network.
Food Network programming and Internet content attracts audiences interested in food-related topics. Food Network is television’s only network dedicated solely to such topics as food preparation, dining out, entertaining, food manufacturing, nutrition and healthy eating. Food Network engages audiences by creating original programming that is entertaining, instructional and informative.
Food Network achieved record growth in viewership in 2009. Programming highlights included Next Food Network Star, Ace of Cakes, Diners, Drive-ins and Dives, and Iron Chef America. Many of the programs on Food Network feature or are hosted by high-profile television personalities such as Bobby Flay, Rachael Ray, Giada De Laurentiis, Alton Brown, Guy Fieri and Paula Deen.
TRAVEL CHANNEL
We acquired a controlling interest in the Travel Channel business in December 2009, giving the company its third fully-distributed lifestyle network. Travel Channel is a leading travel multi-media brand, offering quality television, video, Internet and mobile entertainment and information to travel enthusiasts. The network has grown into one of the largest specialty cable networks in the U.S., available in 95 million domestic television households.
Travel Channel finished 2009 with a record year in primetime and total-day ratings.
Programming highlights in 2009 included Samantha Brown’s Great Weekends, Anthony Bourdain: No Reservations, Andrew Zimmern’s Bizarre World, Man v. Food, Ghost Adventures, and Dhani Tackles the Globe. Many of the programs on Travel Channel feature or are hosted by high-profile television personalities such as Samantha Brown, Anthony Bourdain, Andrew Zimmern, Adam Richman, and Dhani Jones.
DIY NETWORK (DIY)
DIY is America’s only television network and Web site dedicated solely to presenting entertaining and informational programming and content across a broad range of do-it-yourself categories including home building; home improvement; automotive restoration and repair; crafts; gardening; landscaping, hobbies and woodworking. The network is available in approximately 53 million U.S. households via cable and direct-to-home satellite television services. DIY programming also is distributed internationally in 21 countries and territories. The television network’s companion Web site – DIYNetwork.com – consistently ranks among America’s top 15 home and garden Internet destinations with an average of about 2 million unique visitors per month.
FINE LIVING NETWORK (FLN)
FLN will be rebranded the Cooking Channel in 2010 to take advantage of the expanding interest in food and cooking in America. Cooking Channel will be a 24-hour network that caters to avid food lovers by focusing on food information and instructional cooking programming. Offered in both standard
5
Table of Contents
and high definition, the rebranded network will debut with a Video-on-demand (“VOD”) offering and a fully interactive Internet and broadband platform as it delivers more content focused on baking, ethnic cuisine, wine and spirits, healthy and vegetarian cooking and kids' foods. We expect Cooking Channel to be available in about 56 million households. Currently FLN television programming also can be seen internationally in 37 countries and territories.
GREAT AMERICAN COUNTRY (GAC)
Distributed in the U.S. via cable and direct-to-home satellite television services, the network reaches about 58 million households with original programming, special musical performances and live concerts. GAC operates a companion Web site, GACTV.com. GAC is the only network operated by the company with direct competition to its programming. The network strives to provide its viewers with a more focused country music experience.
HGTVPro.com
HGTVPro.com is a video-rich interactive service delivered via the Internet which appeals to professional builders, remodelers and contractors. Content includes professional-level best practices, tips and techniques, new product information and industry trends. HGTVPro.com attracts about 1 million unique visitors per month. HGTVPro.com is an authoritative source of information on the Internet for home construction professionals and advanced do-it-yourself, home-improvement enthusiasts. The Web site features original video content, industry news and detailed tips and instructions on a wide variety of home construction topics.
RECIPEZAAR.com
RecipeZaar.com is a leading user-generated recipe and community Internet site featuring nearly 400,000 recipes. RecipeZaar.com provides food enthusiasts with a browsing tool, search capabilities and personalized features. RecipeZaar.com is one of the Internet’s top 10 food and cooking category sites, attracting about 4 million unique visitors per month. RecipeZaar.com aggregates an audience on the Internet by creating an engaged community of food enthusiasts interested in home recipes, menu planning and other food-related topics. The social-networking Web site features volumes of user-generated content, including recipes, photos, menus and reviews.
FRONTDOOR.com
FrontDoor.com is an online real estate listing service that provides localized, in-depth information on homes in neighborhoods and communities across the U.S. The interactive service provides consumers with original video content, financial tools and calculators. FrontDoor.com is a comprehensive resource on the Internet for home buyers and home sellers. The Web site features searchable national real estate listings, video of featured properties for sale, buyers’ and sellers’ guides, calculators and other tools, and a library of video content on real estate-related topics.
Our Interactive Services segment includes Internet-based businesses that strive to simplify online shopping for consumers by aggregating, organizing, ranking and displaying relevant and searchable consumer information. Consumers who use our Interactive Services Web sites are presented with easy-to-use search results generated from continuously growing databases of information on a wide range of products that are offered for sale on the Internet by third-party retailers. Our Interactive Services brands include bizrate, Shopzilla and beso in the United States; Shopzilla.co.uk and bizrate.co.uk in the United Kingdom; Shopzilla.fr and PrixMoinsCher.fr in France; and Shopzilla.de and SparDeinGeld.de in Germany. The Web sites collectively attract approximately 30 million unique visitors each month.
Bizrate.com and Shopzilla.com are among the leading online search and comparison shopping Web sites and aggregate one of the Internet’s largest organized indexes of products and services. The sites are free to consumers who access the index via simplified, intuitively designed Internet pages that feature prominently displayed and easy-to-use search boxes. The bizrate brand also operates a consumer feedback network that annually collects and publishes on its Web sites millions of consumer reviews of stores and products.
The bizrate Web site’s proprietary shopping search logic system and patented relevance function, ShopRank, make it possible for consumers to instantly obtain accurate search results for specific products and services. Search query results are organized and displayed on graphically designed, layered presentation pages that include product listings, images, comparative pricing information, links to online merchants and service providers and user-generated and professional product reviews. Search results also include merchant reliability rankings based on the shared experiences of bizrate users.
The index of products and services serves as the primary database for bizrate. The database is aggregated using a highly automated system for identifying products, building online catalogs and classifying and organizing product information feeds from merchants and service providers. Bizrate builds advertising relationships with participating online merchants by providing them with a scalable, self-service sign-up process, an efficient cost-per-click pricing structure and a real-time reporting system that enables them to manage the return on the investment they are making to advertise on bizrate.
Bizrate devotes considerable time and financial resources to continuously improving the user experience, the effectiveness of its proprietary search logic system for consumers and merchant advertisers, the design of its Web sites and the expansion of its searchable index of products and services.
Beso is a taste-based shopping Web site where consumers can browse the latest products and sales from their preferred retailers and favorite brands in one place.
The segment’s businesses strive to help online consumers make educated purchasing decisions by ranking products on such factors as comparative pricing, availability,
6
Table of Contents
quality and reliability. The quality and reliability of individual online merchants are ranked based on the collective, shared experiences of consumers using the segment’s Web sites. Users also are presented with supporting consumer news and information, user-generated and professional product reviews, calculators and other tools that are intended to help them complete their purchasing decisions.
The Interactive Services segment derives the largest percentage of its revenue from direct referral fees paid by online merchants and service providers (advertisers) that enter into contractual agreements allowing them to place text-based, linked advertisements on the segment’s Web sites. The referral fees paid by advertisers are based on a cost-per-click pricing structure, which means that advertisers pay only when consumers click on their linked ads. Cost-per-click pricing provides advertisers with an efficient means of evaluating the effectiveness of their advertising. Of particular importance for advertisers is the number of sales resulting from users clicking on their linked advertising. The segment’s search businesses encourage sustained advertising relationships with merchants and service providers by demonstrating a measurable return on investment for the referral fees they pay.
The advertising links placed by merchants and service providers serve as the primary database of information for the segment’s Web sites. Because the success of our Interactive Services businesses depends largely on a quality user experience and repeated visits by users, ad links are intentionally presented in an unobtrusive and uniform format that provides users with impartial and factual information on products and services.
The Interactive Services segment also derives revenue from contractual advertising agreements with general search engines. The agreements allow the general search engines to leverage relationships with their respective advertisers by placing sponsored links on our Interactive Services Web sites. Similar to our direct advertising relationships with merchants and service providers, the general search engines pay referral fees on a cost-per-click basis.
Revenue categories as a percentage of total Interactive Services segment revenue are as follows:
| • | Direct referral fees from advertising merchants, 70 percent in 2009 vs. 56 percent in 2008. |
| • | Sponsored link referral fees from general search engines, 30 percent in 2009 vs. 44 percent in 2008. |
The Interactive Services segment measures operating performance in terms of net revenue, which is defined as total revenue minus traffic acquisition costs. Traffic acquisition costs are those marketing expenses related to generating user traffic to the segment’s Web sites. The success of the segment’s businesses is largely dependent on the ability to efficiently and economically attract a high volume of user traffic.
The segment’s businesses use a combination of online and off-line strategies to increase consumer awareness and subsequently generate user traffic. They include:
| • | Search Engine Marketing. Search Engine Marketing refers to the purchase of text-based advertising links on general search engines such as Google and Yahoo!. The positioning and display of those paid advertising links is dependent on the acquisition of relevant keywords that determine the quality and effectiveness of general search results. The segment’s businesses participate in continuous keyword bidding auctions that are hosted by general search engines with the objective of acquiring keywords that result in the most advantageous positioning and display of purchased advertising links adjacent to general search results. |
| • | Search Engine Optimization. Search Engine Optimization refers to the continuous, algorithmic selection of relevant keywords that, when used by general search engine users, result in the most advantageous positioning and display of links to the segment’s Web sites within general search results. Traffic generated by Search Engine Optimization generally results in higher net revenues for the segment’s businesses than traffic generated by Search Engine Marketing. |
| • | Offline advertising and marketing techniques, which refers to the purchase of television, newspaper, magazine, and other more traditional forms of advertising, and the execution of effective public relations campaigns, to increase brand awareness for the segment’s businesses. |
The company expects its Interactive Services businesses to benefit from the growth in online shopping and overall consumer acceptance of Internet commerce in the United States and internationally.
As of December 31, 2009, we had approximately 1,800 full-time equivalent employees, of whom approximately 1,400 were with Lifestyle Media.
7
Table of Contents
| Item 1A. | Risk Factors |
A number of significant risk factors could materially affect our specific business operations, and cause our performance to differ materially from any future results projected or implied by our prior statements. The risk factors generally have been separated into three groups: (i) risks relating to the separation; (ii) risks relating to our common shares; and (iii) risks relating to our business. Based on the information currently known to us, we believe that the following information identifies the most significant risk factors affecting our company in each category of risk. The risks and uncertainties our company faces, however, are not limited to those set forth in the risk factors described below. Additional risks and uncertainties not presently known to us or that we currently believe to be immaterial may also adversely affect our business.
In addition, past financial performance may not be a reliable indicator of future performance, and historical trends should not be used to anticipate results or trends in future periods.
If any of the following risks or uncertainties develops into actual events, these events could have a material adverse effect on our business, financial condition or results of operations. In such case, the trading price of our common shares could decline.
Risks Relating to the Separation
The tax rules applicable to the separation could restrict us from engaging in certain corporate transactions for a period of time after the separation.
To preserve the tax-free treatment to E. W. Scripps of the distribution, under the Tax Allocation Agreement that we entered into with E. W. Scripps, for the two-year period following the distribution, we are subject to restrictions with respect to:
| • | entering into any transaction pursuant to which all or a portion of our shares would be acquired, whether by merger or otherwise, unless certain tests are met; |
| • | issuing equity securities beyond certain thresholds; |
| • | repurchasing Scripps Networks Interactive common shares beyond certain thresholds; |
| • | ceasing to actively conduct the Scripps Networks Interactive business; and |
| • | taking any other action that prevents the spin-off and related transactions from being tax-free. |
These restrictions could limit our ability to pursue strategic transactions or engage in new businesses or other transactions that might increase the value of our business.
In connection with the separation, E. W. Scripps will indemnify us for certain liabilities. There can be no assurance that the indemnity will be sufficient to insure us against the full amount of such liabilities, or that E. W. Scripps’ ability to satisfy its indemnification obligations will not be impaired in the future.
Pursuant to the Separation and Distribution Agreement, E. W. Scripps agreed to indemnify us from certain liabilities with respect to events that took place prior to, on or after the distribution date relating to its business or for which it has otherwise retained responsibility in whole or in part. The potential liabilities subject to such indemnity from E. W. Scripps cannot be predicted or quantified, and such indemnification obligation of E. W. Scripps is not limited to any maximum amount. There can be no assurance that the indemnity from E. W. Scripps will be sufficient to protect us against the full amount of such liabilities, or that E. W. Scripps will be able to fully satisfy its indemnification obligations. Moreover, even if we ultimately succeed in recovering from E. W. Scripps any amounts for which we are held liable, we will be temporarily required to bear those losses ourselves until such recovery.
Until the Edward W. Scripps Trust terminates, our pension plan and the E. W. Scripps pension plan operate under a “controlled-group” status, potentially subjecting us to liability in the event that E. W. Scripps is unable to satisfy its long-term pension obligations.
Any of these circumstances could adversely affect our business, results of operations and financial condition.
Certain of our directors may have actual or potential conflicts of interest because of their positions in Scripps Networks Interactive and E. W. Scripps.
Three directors of Scripps Networks Interactive are also members of the E. W. Scripps Board of Directors. These directors are trustees of The Edward W. Scripps Trust. These common directors could create, or appear to create, potential conflicts of interest when Scripps Networks Interactive’s and E. W. Scripps’ management and directors face decisions that could have different implications for the two companies.
8
Table of Contents
Risks Relating to Our Class A Common Shares
Common Voting Shares are principally held by The Edward W. Scripps Trust, and this could inhibit potential changes of control.
We have two classes of shares: Common Voting Shares and Class A Common Shares. Holders of Class A Common Shares are entitled to elect one-third of the board of directors, but are not permitted to vote on any other matters except as required by Ohio law. Holders of Common Voting Shares are entitled to elect the remainder of the Board and to vote on all other matters. The Edward W. Scripps Trust (“Trust”) holds approximately 88 percent of the Common Voting Shares. As a result, the Trust has the ability to elect two-thirds of the board of directors and to direct the outcome of any matter that does not require a vote of the Class A Common Shares. Because this concentrated control could discourage others from initiating any potential merger, takeover or other change of control transaction that may otherwise be beneficial to our business, the market price of our Class A Common Shares could be adversely affected.
Following termination of the Edward W. Scripps Trust, descendants of Edward W. Scripps will control us.
Certain descendants of Robert Paine Scripps who are beneficiaries of the Edward W. Scripps Trust and certain descendants of John P. Scripps are parties to an agreement (“Scripps Family Agreement”) to restrict the transfer and govern the voting of E. W. Scripps Common Voting Shares that such persons (and trusts of which they are trustees) may acquire or own at or after the termination of the Trust. This agreement has been amended to restrict the transfer and govern the voting of our Common Voting Shares that such persons and trusts may acquire or own at or after the termination of the Trust. E. W. Scripps is a party to the Scripps Family Agreement, and we have become a party thereto by executing the amendment. Our obligations under this agreement generally will relate to facilitating meetings of the signatories to the agreement to enable them to decide how to vote their shares at annual or special meetings of our shareholders. The Scripps Family Agreement facilitates the ability of its signatories to control us and E. W. Scripps following termination of the Trust.
Federal law and Federal Communications Commission (“FCC”) regulations applicable because of E. W. Scripps’ and Scripps Networks Interactive’s common directors and voting shareholders may limit Scripps Networks Interactive’s activities, including the ability to own or operate media properties it does not presently own or operate.
For FCC purposes, the common directors and five percent or greater voting shareholders of E. W. Scripps and Scripps Networks Interactive are deemed to hold attributable interests in each of the companies. As a result, the business and conduct of one company may have the effect of limiting the activities or strategic business alternatives available to the other company.
Risks Relating to Our Business
A wide range of factors could materially affect future developments and performance. The most significant factors affecting our operations include those listed below.
Changes in public and consumer tastes and preferences could reduce demand for our services and reduce profitability of our businesses.
Each of our businesses provides content and services whose success is primarily dependent upon acceptance by the public. We must consistently create and distribute offerings that appeal to the prevailing consumer tastes at any point in time. Audience preferences change frequently and it is a challenge to anticipate what content will be successful at any point. Other factors, including the availability of alternative forms of entertainment and leisure time activities, general economic conditions and the growing competition for consumer discretionary spending may also affect the audience for our content and services. If our Lifestyle Media businesses do not achieve sufficient consumer acceptance, our revenue from advertising sales, which are based in part on network ratings, may decline and adversely affect our profitability. If our Interactive Services businesses are unable to provide service and content popular with the public, traffic to the sites will decrease, which may result in a decrease in referral revenue and profitability.
If we are unable to maintain distribution agreements with cable and satellite distributors at acceptable rates and terms, our revenues and profitability could be negatively affected.
We enter into long-term contracts for the distribution of our national television networks on cable and satellite television systems. Our long-term distribution arrangements enable us to reach a large percentage of cable and direct broadcast satellite households across the United States. As these contracts expire, we must renew or renegotiate them. If we are unable to renew them on acceptable terms or at rates similar to those in other affiliate contracts, we may lose distribution rights and/or affiliate fee revenues..
The loss of a significant number of affiliation arrangements on basic programming tiers could reduce the distribution of our national television networks, thereby adversely affecting affiliate fee revenue, and potentially impacting our ability to sell advertising or the rates we charge for such advertising.
Networks that are carried on digital tiers are dependent upon the continued upgrade of cable systems to digital capability and the public’s continuing acceptance of, and willingness to pay for upgrades to digital cable as well as our ability to negotiate favorable carriage agreements on widely accepted digital tiers.
9
Table of Contents
Consolidation among cable television system operators has given the largest cable and satellite television systems considerable leverage in their relationship with programmers. The two largest cable television system operators provide service to approximately 40 percent of households receiving cable or satellite television service today, while the two largest satellite television operators provide service to an additional 30 percent of such households.
Continued consolidation within the industry could reduce the number of distributors available to carry our programming, subject our affiliate fee revenue to greater volume discounts, and further increase the negotiating leverage of the cable and satellite television system operators.
Advertising and marketing spending by our customers is subject to seasonal and cyclical variations.
Revenues in our Lifestyle Media segment are influenced by advertiser demand and are generally higher in the second and fourth quarters due to the increased demand in the spring and holiday seasons. Referral fee revenues in our Interactive Services segment are highest in the fourth quarter primarily due to the increased online shopping activity during the holiday season. If a short-term negative impact on our business were to occur during a time of high seasonal demand, there could be a disproportionate effect on the operating results of that business for the year.
Our businesses face significant competitive pressures related to attracting consumers and advertisers, and failure by us to maintain our competitive advantage may affect the profitability of the businesses.
We face substantial competition in our Lifestyle Media and Interactive Services businesses from alternative providers of similar services. Our national television networks compete for viewers with other broadcast and national television networks as well as with home video products and Internet usage, and they compete for carriage of their programming with other programming providers. Additionally, our national television networks compete for advertising revenues with a variety of other media alternatives including other broadcast and national television networks, the Internet, newspapers, radio stations, and billboards. Our Lifestyle Media branded Web sites compete for visitors and advertising dollars with other forms of media aimed at attracting similar audiences and must maintain popular content in order to maintain and increase site traffic. Our Interactive Services businesses compete for marketing service revenues with other comparison shopping services, general search engines, and other providers of information on shopping and essential home services. Our ability to maintain our relationship with participating retailers and service providers is largely dependent on our ability to provide them a cost effective means of attracting customers. Competition in each of these areas may divert consumers from our services, which could reduce the profitability of our businesses.
Changes in consumer behavior resulting from new technologies and distribution platforms may impact the performance of our businesses.
We must adapt to advances in technologies and distribution platforms related to content transfer and storage to ensure that our content remains desirable and widely available to our audiences. The ability to anticipate and take advantage of new and future sources of revenue from technological developments will affect our ability to continue to increase our revenue and expand our business. Additionally, we must adapt to the changing consumer behavior driven by advances such as video-on-demand, devices providing consumers the ability to view content from remote locations, and general preferences for user-generated and interactive content. Changes of these types may impact our traditional distribution methods for our services and content. If we cannot ensure that our distribution methods and content are responsive to our target audiences, there could be a negative effect on our business.
Our Lifestyle Media business is subject to risks of adverse changes in laws and regulations, which could result in reduced distribution of certain of our national television networks.
Our programming services, and the distributors of the services, including cable operators, satellite operators and Internet companies, are regulated by U.S. federal laws and regulations issued and administered by various federal agencies, including the FCC, as well as by state and local governments. The U.S. Congress and the FCC currently have under consideration, and may in the future adopt, new laws, regulations and policies regarding a wide variety of matters that could, directly or indirectly, affect our operations. For example, legislators and regulators continue to consider rules that would effectively require cable television operators to offer all programming on an à la carte basis (which would allow viewers to subscribe to individual networks rather than a package of channels) and/or require programmers to sell channels to distributors on an à la carte basis. Certain cable television operators and other distributors have already introduced tiers, or more targeted channel packages, to their customers that may or may not include some or all of our networks. The unbundling of program services at the retail and/or wholesale level could reduce distribution of certain of our program services, thereby leading to reduced viewership and increased marketing expenses, and could affect our ability to compete for or attract the same level of advertising dollars or distribution fees.
We purchase keyword advertising on general search engines to attract consumers to our interactive services Web sites, and changes to our contracts with the search engines or the search engines’ practices could make it more difficult and/or costly to attract traffic to our sites.
We attract traffic to our Interactive Services Web sites through search results displayed by Google, Yahoo! and other
10
Table of Contents
popular general search engines. Search engines typically provide two types of search results, algorithmic listings and sponsored listings. We rely on both algorithmic and sponsored listings to attract consumers to our comparison shopping Internet sites.
Algorithmic listings cannot be purchased, and instead are determined and displayed solely by a set of formulas designed and controlled by the search engine. Search engines revise their algorithms from time to time in an attempt to optimize their search result listings. Modification of such algorithms may result in fewer consumers clicking through to our Internet sites.
We also rely on purchased listings to attract consumers to our Web sites. Many general search engines also operate Internet shopping services. Modification or termination of our contractual relationships with general search engines to purchase keyword advertising could result in fewer consumers clicking through to our Internet site. We may incur additional expenses to replace this traffic.
Approximately 30 percent of our 2009 referral fee revenue came from one general search engine and a change in this relationship could reduce the revenue of the business.
We are currently operating under an agreement with Google to participate in its sponsored links program. Under the agreement, we display listings from the search engine’s advertisers as a part of our service and we receive a share of the revenues earned by the search engine when consumers visit the advertisers’ Web sites. Our revenues could be negatively impacted if this agreement is not renewed upon expiration or if the agreement is not renewed on similar terms.
Changes in economic conditions in the United States, the regional economies in which we operate or in specific economic sectors could adversely affect the profitability of our businesses.
Approximately 80 percent of our consolidated revenues in 2009 were derived from marketing and advertising spending by businesses operating in the United States. Advertising and marketing spending is sensitive to economic conditions, and tends to decline in recessionary periods. A decline in economic conditions could reduce advertising prices and volume, resulting in a decrease in our advertising revenues. A decline in economic conditions could also impact consumer discretionary spending. Such a reduction in consumer spending may impact the volume of online shopping, which could adversely affect our comparison shopping businesses.
We may not be able to protect intellectual property rights upon which our business relies, and if we lose intellectual property protection, we may lose valuable assets.
Our business depends on our intellectual property, including internally developed technology, data resources and brand identification. We attempt to protect these intellectual property rights through a combination of copyright, trade secret, patent and trademark law and contractual restrictions, such as confidentiality agreements. We also depend on our trade names and domain names. We file applications for patents, trademarks, and other intellectual property registrations, but we may not be granted such intellectual property protections. In addition, even if such registrations are issued, they may not fully protect all important aspects of our business and there is no guarantee that our business does not or will not infringe upon intellectual property rights of others. Furthermore, intellectual property laws vary from country to country, and it may be more difficult to protect and enforce our intellectual property rights in some foreign jurisdictions. In the future, we may need to litigate in the United States or elsewhere to enforce our intellectual property rights or determine the validity and scope of the proprietary rights of others. This litigation could potentially be expensive and possibly divert the attention of our management.
Despite our efforts to protect our proprietary rights, unauthorized parties may attempt to copy or otherwise obtain and use our service, technology and other intellectual property, and we cannot be certain that the steps we have taken will prevent any misappropriation or confusion among consumers and merchants, or unauthorized use of these rights. If we are unable to protect and enforce our intellectual property rights, then we may not realize the full value of these assets, and our business may suffer.
We may be subject to claims of infringement of third-party intellectual property rights, which could harm our business.
From time to time, third parties may assert against us or our customers alleged patent, copyright, trademark, or other intellectual property rights to technologies that are important to our business. We may be subject to intellectual property infringement claims from certain individuals and companies who have acquired patent portfolios for the sole purpose of asserting such claims against other companies. Any claims that our products or processes infringe the intellectual property rights of others, regardless of the merit or resolution of such claims, could cause us to incur significant costs in responding to, defending, and resolving such claims, and may divert the efforts and attention of our management and technical personnel away from our business. In addition, if we are unable to continue use of certain intellectual property rights, our revenue could be negatively impacted.
Our Interactive Services businesses are subject to online security risks, including security breaches and identity theft.
Our Interactive Services businesses transmit confidential information over public networks. A significant number of participating retailers authorize us to bill their credit cards directly for referrals provided to the retailer. We rely upon encryptions
11
Table of Contents
and authentication technology provided by third parties to secure transmission of such confidential information.
Our Web site infrastructure is vulnerable to computer viruses and similar disruptions, and we may be subject to “denial-of-service” attacks that might make our Web sites unavailable for periods of time.
If we are unable to successfully integrate key acquisitions, such as Travel Channel, our business results could be negatively impacted.
We may grow through acquisitions in certain markets. Acquisitions involve risks, including difficulties in integrating acquired operations, diversions of management resources, debt incurred in financing such acquisitions and other unanticipated problems and liabilities. If we are unable to mitigate these risks, the integration and operations of an acquired business could be adversely impacted.
Recent turmoil in the financial markets may impede access to or increase the cost of financing our operations and investments.
U.S. and global credit and equity markets have recently undergone significant disruption, making it more difficult for many businesses to obtain financing on acceptable terms. If these conditions continue or worsen, our cost for borrowing for operations or investments may increase the cost of obtaining financing. In addition, our borrowing costs can be affected by short and long-term debt ratings assigned by independent rating agencies which are based, in significant part, on our performance as measured by credit metrics such as interest coverage and leverage ratios. A decrease in these ratings could increase our cost of borrowing or make it more difficult for us to obtain financing.
We could suffer losses due to asset impairment charges.
We test our goodwill and intangible assets for impairment during the fourth quarter of every year and on an interim date should factors or indicators become apparent that would require an interim test. If the fair value of a reporting unit or an intangible asset is revised downward due to declines in business performance, impairment could result and a non-cash charge could be required. This could materially affect our reported net earnings.
| Item 1B. | Unresolved Staff Comments |
None.
| Item 2. | Properties |
Lifestyle Media operates from an owned production and office facility in Knoxville. We also operate from a leased office facility in Knoxville and leased facilities in New York, Nashville, and Washington, DC. Substantially all equipment is owned by Lifestyle Media.
Interactive Services operates from leased facilities in Los Angeles and London, as well as separate leased co-location facilities in Los Angeles, Houston and Seattle. Substantially all of our equipment is owned by our Interactive Services’ businesses.
Our corporate office headquarters operate from a leased facility in Cincinnati and we also lease facilities in London that support our international operations.
Management believes its properties are adequate to support the business efficiently and that the properties and equipment have been well maintained.
| Item 3. | Legal Proceedings |
From time to time, the Company receives notices from third parties claiming that it infringes their intellectual property rights. Claims of intellectual property infringement could require us to enter into royalty or licensing agreements on unfavorable terms, incur substantial monetary liability or be enjoined preliminarily or permanently from further use of the intellectual property in question. In addition, certain agreements entered into by the Company may require the Company to indemnify the other party for certain third-party intellectual property infringement claims, which could increase the Company’s damages and its costs of defending against such claims. Even if the claims are without merit, defending against the claims can be time-consuming and costly.
The costs and other effects of pending or future litigation, governmental investigations, legal and administrative cases and proceedings (whether civil or criminal), settlements, judgments and investigations, claims and changes in those matters (including those matters described above), and developments or assertions by or against the Company relating to intellectual property rights and intellectual property licenses, could have a material adverse effect on the Company’s business, financial condition and operating results. No current legal matters are expected to result in any material loss.
| Item 4. | [Removed and Reserved]. |
12
Table of Contents
Executive Officers of the Company - Executive officers serve at the pleasure of the Board of Directors.
| Name |
Age | Position | ||
| Kenneth W. Lowe | 59 | Chairman of the Board, President and Chief Executive Officer (since July 2008); President, Chief Executive Officer and Director, The E. W. Scripps Company (2000 to 2008) | ||
| Anatolio B. Cruz III |
51 | Chief Legal Officer and Corporate Secretary (since July 2008); Executive Vice President and General Counsel, The E. W. Scripps Company (2007 to 2008); Senior Vice President and General Counsel, The E. W. Scripps Company (2004 to 2007); Vice President, Deputy General Counsel and Assistant Secretary, BET Holdings, Inc. (1999 to 2004) | ||
| John F. Lansing |
52 | President, Scripps Networks, LLC (since January 2005); Senior Vice President/Scripps Networks, The E. W. Scripps Company (2006 to 2008); Senior Vice President/Television, The E. W. Scripps Company (2002 to 2005) | ||
| Joseph G. NeCastro |
53 | Chief Administrative Officer and Chief Financial Officer (since February 2010); Executive Vice President and Chief Financial Officer (2008 to 2010); Executive Vice President and Chief Financial Officer, The E. W. Scripps Company (2006-2008); Senior Vice President and Chief Financial Officer, The E. W. Scripps Company (2002 to 2006) | ||
| Mark S. Hale |
51 | Executive Vice President and Chief Technology Officer (since February 2010); Senior Vice President, Technology Operations and Chief Technology Officer (2008 to 2010); Senior Vice President/Technology Operations, The E. W. Scripps Company (2006 to 2008); Vice President/Technology Operations, The E. W. Scripps Company (2005 to 2006); Executive Vice President of Scripps Networks, LLC (1998 to 2005) | ||
| Lori A. Hickok |
46 | Executive Vice President, Finance (since February 2010); Senior Vice President, Finance (2008 to 2010); Vice President and Controller, The E. W. Scripps Company (2002 to 2008) | ||
13
Table of Contents
| Item 5. | Market for Registrant’s Common Equity, Related Stockholder Matters and Issuer Purchases of Equity Securities |
Our Class A Common shares are traded on the New York Stock Exchange (“NYSE”) under the ticker symbol “SNI.” As of December 31, 2009, there were approximately 37,100 owners of our Class A Common shares, based on security position listings, and 19 owners of our Common Voting shares (which do not have a public market).
The following table reflects the range of high and low selling prices of our common stock by quarterly period since our common stock began trading on the NYSE on June 12, 2008.
| 2009 |
High | Low | ||||
| First quarter |
$ | 24.37 | $ | 18.51 | ||
| Second quarter |
$ | 30.43 | $ | 23.60 | ||
| Third quarter |
$ | 37.41 | $ | 26.58 | ||
| Fourth quarter |
$ | 42.21 | $ | 36.36 | ||
| 2008 |
||||||
| Second quarter * |
$ | 43.49 | $ | 38.00 | ||
| Third quarter |
$ | 44.98 | $ | 34.88 | ||
| Fourth quarter |
$ | 37.14 | $ | 20.00 | ||
| * | Represents “when issued” trading on the NYSE for the period from June 12, 2008 through June 30, 2008 when our separation from E. W. Scripps was completed. |
Under a share repurchase program authorized by the Board of Directors on July 29, 2008, we are authorized to repurchase up to 5 million Class A Common shares. As of December 31, 2009, no shares have been repurchased against the July 29, 2008, authorization. There is no expiration date for the program and we are under no commitment or obligation to repurchase any particular amount of Class A Common shares under the program.
There were no sales of unregistered equity securities during the quarter for which this report is filed.
Dividends – Our Board of Directors declared quarterly cash dividends of 7.5 cents per share that have been paid for each of the quarters in 2008 and 2009 following the separation from E. W. Scripps. We currently expect that comparable quarterly cash dividends will continue to be paid in the future. Future dividends are, however, subject to our earnings, financial condition and capital requirements.
Performance Graph – The following graph compares the cumulative total stockholder return on our Class A Common shares with the comparable cumulative return of the NYSE market index and an index based on a peer group of media companies for the period from June 12, 2008, the date our common shares began trading on the NYSE, to December 31, 2009. The performance graph assumes that the value of the investment in our common shares, the NYSE market index, and peer group of media companies was $100 on June 12, 2008 and that all dividends were reinvested.
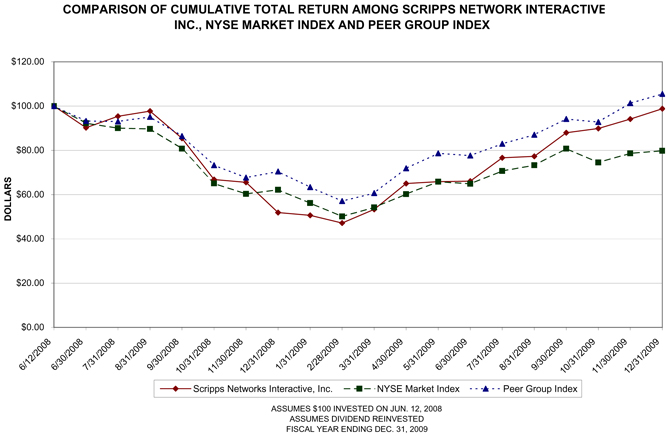
The companies that comprise our peer group are Discovery Holding Company, The Walt Disney Company, Time Warner Inc., Viacom, Inc., and EBay.
The peer group index is weighted based on market capitalization.
| Item 6. | Selected Financial Data |
The Selected Financial Data required by this item is filed as part of this Form 10-K. See Index to Consolidated and Combined Financial Statement Information at page F-1 of this Form 10-K.
| Item 7. | Management’s Discussion and Analysis of Financial Condition and Results of Operations |
Management’s Discussion and Analysis of Financial Condition and Results of Operations required by this item is filed as part of this Form 10-K. See Index to Consolidated and Combined Financial Statement Information at page F-1 of this Form 10-K.
| Item 7A. | Quantitative and Qualitative Disclosures About Market Risk |
The market risk information required by this item is filed as part of this Form 10-K. See Index to Consolidated and Combined Financial Statement Information at page F-1 of this Form 10-K.
14
Table of Contents
| Item 8. | Financial Statements and Supplementary Data |
The Financial Statements and Supplementary Data required by this item are filed as part of this Form 10-K. See Index to Consolidated and Combined Financial Statement Information at page F-1 of this Form 10-K.
| Item 9. | Changes in and Disagreements With Accountants on Accounting and Financial Disclosure |
None.
| Item 9A. | Controls and Procedures |
The Controls and Procedures required by this item are filed as part of this Form 10-K. See Index to Consolidated and Combined Financial Statement Information at page F-1 of this Form 10-K.
| Item 9B. | Other Information |
None.
15
Table of Contents
| Item 10. | Directors, Executive Officers and Corporate Governance |
Information regarding executive officers is included in Part I of this Form 10-K as permitted by General Instruction G(3).
Information required by Item 10 of Form 10-K relating to directors is incorporated by reference to the material captioned “Election of Directors” in our definitive proxy statement for the Annual Meeting of Shareholders (“Proxy Statement”). Information regarding Section 16(a) compliance is incorporated by reference to the material captioned “Report on Section 16(a) Beneficial Ownership Compliance” in the Proxy Statement.
We have adopted a code of ethics that applies to all employees, officers and directors of SNI. We also have a code of ethics for the CEO and Senior Financial Officers. This code of ethics meets the requirements defined by Item 406 of Regulation S-K and the requirement of a code of business conduct and ethics under NYSE listing standards. Copies of our codes of ethics are posted on our Web site at www.scrippsnetworksinteractive.com.
Information regarding our audit committee financial expert is incorporated by reference to the material captioned “Corporate Governance” in the Proxy Statement.
The Proxy Statement will be filed with the Securities and Exchange Commission in connection with our 2010 Annual Meeting of Stockholders.
| Item 11. | Executive Compensation |
The information required by Item 11 of Form 10-K is incorporated by reference to the material captioned “Compensation Discussion and Analysis” and “Executive Compensation Tables” in the Proxy Statement.
| Item 12. | Security Ownership of Certain Beneficial Owners and Management and Related Stockholder Matters |
The information required by Item 12 of Form 10-K is incorporated by reference to the material captioned “Report on the Security Ownership of Certain Beneficial Owners” and “Equity Compensation Plan Information” in the Proxy Statement.
| Item 13. | Certain Relationships and Related Transactions, and Director Independence |
The information required by Item 13 of Form 10-K is incorporated by reference to the materials captioned “Corporate Governance” and “Report on Related Party Transactions” in the Proxy Statement.
| Item 14. | Principal Accounting Fees and Services |
The information required by Item 14 of Form 10-K is incorporated by reference to the material captioned “Independent Auditors” in the Proxy Statement.
| Item 15. | Exhibits and Financial Statement Schedules |
Financial Statements and Supplemental Schedule
| (a) | The consolidated and combined financial statements of SNI are filed as part of this Form 10-K. See Index to Consolidated and Combined Financial Statement Information at page F-1. |
The reports of Deloitte & Touche LLP, an Independent Registered Public Accounting Firm, dated March 1, 2010, are filed as part of this Form 10-K. See Index to Consolidated and Combined Financial Statement Information at page F-1.
| (b) | The Company’s consolidated and combined supplemental schedules are filed as part of this Form 10-K. See Index to Consolidated and Combined Financial Statement Schedules at page S-1. |
Exhibits
The information required by this item appears at page E-1 of this Form 10-K.
16
Table of Contents
Signatures
Pursuant to the requirements of Section 13 or 15(d) of the Securities Exchange Act of 1934, the registrant has duly caused this report to be signed on its behalf by the undersigned, thereunto duly authorized.
| SCRIPPS NETWORKS INTERACTIVE, INC. | ||||||
| Dated: March 1, 2010 | By: | /s/ Kenneth W. Lowe | ||||
| Kenneth W. Lowe | ||||||
| Chairman of the Board of Directors, President and Chief Executive Officer | ||||||
Pursuant to the requirements of the Securities Exchange Act of 1934, this report has been signed below by the following persons on behalf of the registrant in the capacities indicated, on March 1, 2010.
| Signature |
Title | |||
| /s/ Kenneth W. Lowe Kenneth W. Lowe |
Chairman of the Board of Directors, President and Chief Executive Officer (Principal Executive Officer) | |||
| /s/ Joseph G. NeCastro Joseph G. NeCastro |
Chief Administrative Officer and Chief Financial Officer | |||
| /s/ John H. Burlingame John H. Burlingame |
Director | |||
| /s/ Michael R. Costa Michael R. Costa |
Director | |||
| /s/ David A. Galloway David A. Galloway |
Director | |||
| /s/ Jarl Mohn Jarl Mohn |
Director | |||
| /s/ Nicholas B. Paumgarten Nicholas B. Paumgarten |
Director | |||
| /s/ Mary Peirce Mary Peirce |
Director | |||
| /s/ Dale Pond Dale Pond |
Director | |||
| /s/ Jeffrey Sagansky Jeffrey Sagansky |
Director | |||
| /s/ Nackey E. Scagliotti Nackey E. Scagliotti |
Director | |||
| /s/ Ronald W. Tysoe Ronald W. Tysoe |
Director | |||
17
Table of Contents
Scripps Networks Interactive, Inc.
Index to Consolidated and Combined Financial Statement Information
| Item No. |
Page | |||
| 1. |
F-2 | |||
| 2. |
Management’s Discussion and Analysis of Financial Condition and Results of Operations |
|||
| F-3 | ||||
| F-3 | ||||
| F-4 | ||||
| F-5 | ||||
| F-6 | ||||
| F-6 | ||||
| F-6 | ||||
| F-7 | ||||
| F-7 | ||||
| F-9 | ||||
| F-10 | ||||
| F-11 | ||||
| 3. |
F-14 | |||
| 4. |
F-15 | |||
| 5. |
F-17 | |||
| 6. |
F-19 | |||
| 7. |
F-20 | |||
| 8. |
F-21 | |||
| 9. |
F-22 | |||
| 10. |
F-23 | |||
F-1
Table of Contents
The selected consolidated and combined statements of operations data for the three years ended December 31, 2009 and the consolidated balance sheet data at December 31, 2009 and 2008 should be read in conjunction with the audited financial statements and related “Management’s Discussion and Analysis of Financial Condition and Results of Operations” and other financial information presented elsewhere in this annual report. The selected consolidated and combined statement of operations data for the year ended December 31, 2005 and the consolidated and combined balance sheet data at December 31, 2006 and 2005 have been derived from financial statements contained in the Registration Statement filed on Form 10 that is not included herein.
Five-Year Financial Highlights
| (in millions, except per share data) |
||||||||||||||||||||
| 2009 | 2008 | 2007 | 2006 | 2005 (3) | ||||||||||||||||
| Summary of Operations |
||||||||||||||||||||
| Operating revenues (1): |
||||||||||||||||||||
| Lifestyle Media |
$ | 1,367 | $ | 1,312 | $ | 1,185 | $ | 1,052 | $ | 903 | ||||||||||
| Interactive Services |
174 | 238 | 220 | 228 | 99 | |||||||||||||||
| Total operating revenues |
$ | 1,541 | $ | 1,551 | $ | 1,405 | $ | 1,281 | $ | 1,002 | ||||||||||
| Segment profit (loss) (1)(2): |
||||||||||||||||||||
| Lifestyle Media |
$ | 637 | $ | 632 | $ | 587 | $ | 504 | $ | 403 | ||||||||||
| Interactive Services |
31 | 63 | 47 | 53 | 28 | |||||||||||||||
| Corporate |
(66 | ) | (49 | ) | (35 | ) | (33 | ) | (25 | ) | ||||||||||
| Total segment profit |
$ | 602 | $ | 645 | $ | 599 | $ | 524 | $ | 406 | ||||||||||
| Income from continuing operations attributable to SNI common shareholders (4) |
$ | 273 | $ | 23 | $ | 268 | $ | 235 | $ | 176 | ||||||||||
| Per Share Data |
||||||||||||||||||||
| Income from continuing operations attributable to SNI common shareholders (4) |
$ | 1.65 | $ | .14 | $ | 1.64 | $ | 1.44 | $ | 1.08 | ||||||||||
| Cash dividends (5) |
.30 | .15 | ||||||||||||||||||
| Balance Sheet Data |
||||||||||||||||||||
| Total assets (7) |
$ | 2,963 | $ | 1,773 | $ | 2,018 | $ | 2,385 | $ | 2,011 | ||||||||||
| Long-term debt (6)(7) |
884 | 80 | 503 | 765 | 824 | |||||||||||||||
| Redeemable noncontrolling interests |
114 | 9 | 23 | 23 | 23 | |||||||||||||||
| Total SNI shareholders’ equity |
1,384 | 1,132 | 991 | 1,164 | 775 | |||||||||||||||
| Noncontrolling interest |
151 | 147 | 137 | 117 | 83 | |||||||||||||||
| Total equity |
$ | 1,535 | $ | 1,279 | $ | 1,128 | $ | 1,281 | $ | 858 | ||||||||||
Certain amounts may not foot since each is rounded independently.
Notes to Selected Financial Data
The selected consolidated and combined statements of operations data for all periods prior to July 1, 2008 are presented on a carve-out basis and reflect the results of operations and financial position of our businesses when they were a part of The E. W. Scripps Company. Results for those periods include estimates of our portion of The E. W. Scripps Company’s corporate expenses. The financial information for those years do not reflect what our results of operations and financial position would have been had we been a separate, stand-alone publically-traded company.
| (1) | Operating revenues and segment profit (loss) represent the revenues and the profitability measures used to evaluate the operating performance of our business segments in accordance with financial accounting standards for disclosures about segments of an enterprise and related information. See page F-7. |
| (2) | Segment profit is a supplemental non-GAAP financial measure. GAAP means generally accepted accounting principles in the United States. Our chief operating decision maker evaluates the operating performance of our reportable segments and makes decisions about the allocation of resources to our reportable segments using a measure we call segment profit. Segment profit excludes interest, income taxes, depreciation and amortization, divested operating units, restructuring activities, investment results and certain other items that are included in net income determined in accordance with accounting principles generally accepted in the United States of America. For a reconciliation of this financial measure to operating income see the table on page F-8. |
| (3) | In June 2005, we acquired Shopzilla, a Web-based product comparison shopping service. |
| (4) | Operating results in 2008 include a non-cash charge to write-down the goodwill related to our Shopzilla business. Income from continuing operations was reduced $244 million, $1.49 per share. |
| (5) | Our first dividend as a stand-alone public company was paid in the third quarter of 2008. Accordingly, there are no dividends reported for the first two quarters of 2008 or the prior year periods. |
| (6) | The E. W. Scripps Company utilized a centralized approach to cash management and financing of its operations. Based on the historical funding requirements of our company, specifically the costs to fund acquisitions, fund investments in programming and support the expansion of Scripps Networks Interactive businesses, all of E. W. Scripps’ consolidated third party debt was allocated to us for all periods prior to the July 1, 2008 separation date. |
| (7) | On December 15, 2009, we acquired a 65% controlling interest in the Travel Channel. In connection with the acquisition, TCM Sub, LLC, a majority-owned subsidiary of SNI, completed a private placement of $885 million aggregate principal Senior Notes that mature in 2015. |
F-2
Table of Contents
Management’s Discussion and Analysis of Financial Condition and Results of Operations
This discussion and analysis of financial condition and results of operations is based upon the consolidated and combined financial statements and the notes thereto. You should read this discussion in conjunction with those financial statements.
This discussion and the information contained in the notes to the consolidated and combined financial statements contain certain forward-looking statements that are based on our current expectations. Forward-looking statements are subject to certain risks, trends and uncertainties that could cause actual results to differ materially from the expectations expressed in the forward-looking statements. Such risks, trends and uncertainties, which in most instances are beyond our control, include changes in advertising demand and other economic conditions; consumers’ tastes; program costs; labor relations; technological developments; competitive pressures; interest rates; regulatory rulings; and reliance on third-party vendors for various products and services. The words “believe,” “expect,” “anticipate,” “estimate,” “intend” and similar expressions identify forward-looking statements. All forward-looking statements, which are as of the date of this filing, should be evaluated with the understanding of their inherent uncertainty. We undertake no obligation to publicly update any forward-looking statements to reflect events or circumstances after the date the statement is made.
On July 1, 2008, Scripps Networks Interactive spun off from The E. W. Scripps Company (“E. W. Scripps”) and began operations as a separate publicly-traded company. Scripps Networks Interactive is a leading lifestyle content and Internet search company with respected, high-profile television and interactive brands.
We manage our operations through two reportable operating segments: (i) Lifestyle Media, which includes Home and Garden Television (“HGTV”), Food Network, DIY Network (“DIY”), Fine Living Network (“FLN”) – soon to be rebranded as the Cooking Channel, Great American Country (“GAC”) and, as of December 15, 2009, Travel Channel (“Travel”). Also within Lifestyle Media is SN Digital which includes Web sites that are associated with the aforementioned television brands and other Internet-based businesses serving food, home, and travel related categories such as RecipeZaar.com, HGTVPro.com and FrontDoor.com. HGTV, Food Network and Travel are the only television channels in the United States that dedicate their entire programming schedules to the home, food, and travel lifestyle content categories. All three networks are considered to be fully distributed in the United States along with other leading cable and direct-to-home programming services.Our Lifestyle Media branded Web sites consistently rank at or near the top in their respective lifestyle categories on a unique visitor basis.
We acquired a 65% controlling interest in the Travel Channel in December 2009.
In October 2009, we announced plans to rebrand FLN as the Cooking Channel. FLN currently reaches more than 55 million households providing the Cooking Channel with the potential for significant reach when the rebranding is complete in the second quarter of 2010. The Cooking Channel will be a 24-hour network that caters to avid food lovers by focusing on food information and instructional cooking programming.
We also announced in October 2009 that we will be launching food channels in Europe, the Middle East, and Africa (“EMEA”) through a venture with an international broadcaster based in London. These new food channels will be programmed and versioned for specific countries. A food channel launched in the United Kingdom during the fourth quarter of 2009 and we expect to roll out to other EMEA territories in 2010. We have an 80% controlling interest in the venture.
Our Interactive Services operating segment includes our online comparison shopping service, Shopzilla, and its related online comparison shopping brands, bizrate and beso. Shopzilla sites collectively rank among the top comparison shopping Web sites in the United States and among the country’s top 10 general retail sites.
Looking at operating results for 2009, consolidated revenues decreased slightly to $1.54 billion when compared with $1.55 billion for 2008. Segment profit for 2009 was $602 million compared with $645 million for 2008, a 6.8 percent decrease.
Lifestyle Media revenues in 2009 increased 4.2 percent to $1.4 billion compared with 2008. Segment profit in 2009 was $637 million compared with $632 million in 2008, a one percent increase. Segment profit in 2009 was impacted by a $21.1 million dollar write-off of FLN’s programming. The programming write-off was the result of a programming evaluation undertaken as part of the company’s plan to rebrand FLN as the Cooking Channel.
General rate increases and subscriber growth drove double digit increases in affiliate fee revenues that contributed to the four percent year-over-year increase in total Lifestyle Media revenues. While the economic recession and its corresponding effect on advertising sales contributed to a decline in advertising revenues during the first half of 2009, advertising revenue for the back half of 2009 compared with the same period in 2008 increased due to an improving advertising marketplace and strong audience ratings growth at our networks. In 2009, Food Network had the highest rated year in the history of the network. Viewership at Food Network increased 22 percent in primetime and 14 percent in total day compared with 2008. For both the month of December and the fourth quarter of 2009, viewing among young adults grew 27 percent when compared with 2008. At HGTV, 2009 represented the network’s best year for primetime and total-day viewing. For the year, adult impressions rose five percent in primetime over 2008. DIY Network viewership also grew in 2009 with total households up 27 percent in primetime and 28 percent in total day when compared with 2008. Lifestyle Media continues to focus on driving ratings growth for all our national television networks through popular programming and identifying opportunities
F-3
Table of Contents
to extend our nationally recognized brands to create new revenue streams.
At the Company’s other business segment (Interactive Services), revenues in 2009 were $174 million compared with $238 million in 2008. Shopzilla’s results were negatively affected during 2009 by a challenging retail market that held down volume and cost per click prices and a less favorable sponsored-link contract with Google. In addition, we continued to implement our strategy to competitively reposition the Shopzilla business for long-term growth. While affecting near-term operating results, our strategy is to improve the consumer experience on Shopzilla sites by getting consumers more deeply engaged in the product for which they are shopping. Such changes include making the sites more comprehensive by adding more of the popular retail brands that consumers seek.
In the second quarter of 2009, we reached a strategic decision to pursue the sale of our uSwitch business in the United Kingdom. On December 23, 2009, we completed the sale of the business for total cash consideration of $10.3 million, subject to certain closing adjustments. uSwitch is presented as discontinued operations in our financial statements for all periods presented.
Critical Accounting Policies and Estimates
The preparation of financial statements in accordance with accounting principles generally accepted in the United States of America (“GAAP”) requires us to make a variety of decisions which affect reported amounts and related disclosures, including the selection of appropriate accounting principles and the assumptions on which to base accounting estimates. In reaching such decisions, we apply judgment based on our understanding and analysis of the relevant circumstances, including our historical experience, actuarial studies and other assumptions. We are committed to incorporating accounting principles, assumptions and estimates that promote the representational faithfulness, verifiability, neutrality and transparency of the accounting information included in the financial statements.
Note 2-Summary of Significant Accounting Policies to the consolidated and combined financial statements describes the significant accounting policies we have selected for use in the preparation of our financial statements and related disclosures. We believe the following to be the most critical accounting policies, estimates and assumptions affecting our reported amounts and related disclosures.
Programs and Program Licenses — Production costs for programs produced by us or for us are capitalized as program assets. Such costs include direct costs, production overhead, development costs and acquired production costs. Capitalized program assets are amortized to expense over the estimated useful lives of the programs based on expected future cash flows. Estimated future cash flows can change based upon market acceptance, advertising and network affiliate fee rates, the number of cable and satellite television subscribers receiving our networks and program usage. Accordingly, we periodically review revenue estimates and planned usage and revise our assumptions if necessary. If actual demand or market conditions are less favorable than projected, a write-down to fair value may be required. Development costs for programs that we have determined will not be produced are written off.
Program licenses, which represent approximately 10 percent of our program assets, generally have fixed terms and require payments over the terms of the licenses. Licensed program assets and liabilities are recorded when the programs become available for broadcast. Program licenses are amortized based upon expected cash flows over the term of the license agreement.
Programs and program licenses are reviewed for impairment using a day-part methodology. A day-part is defined as an aggregation of programs broadcast during a particular time of day or programs of a similar type. Our day-parts are: early morning, daytime, late night, and primetime. The net realizable value of programs and program licenses is calculated by estimating the planned future airings of a program and the related day-part in which it is aired to determine an estimate of the remaining revenues to be earned by the program. Estimates are based upon a program’s current ratings as well as assumptions about future market acceptance. If actual demand or market conditions are less favorable than our projections, programming cost write-downs may be required.
Programs and program licenses are also reviewed for impairment when the intended use of a program is altered or we have a fundamental change in programming strategy on any of our networks. Changes in management’s assumptions, such as changes in expected use, could significantly alter our estimates for write-offs. During the fourth quarter of 2009, we announced that FLN will be rebranded as The Cooking Channel. As a result of the decision to rebrand FLN, we completed an analysis of FLN’s programming library and recorded a charge of $21.1 million in 2009 to write-off FLN’s programming rights.
Revenue Recognition — Revenue is recognized when persuasive evidence of a sales arrangement exists, delivery occurs or services are rendered, the sales price is fixed or determinable, and collectability is reasonably assured. Revenue is reported net of our remittance of sales taxes, value added taxes, and other taxes collected from our customers.
We have revenue recognition policies for our operating segments that are specific to the circumstances of each business. See Note 2-Summary of Significant Accounting Policies to the consolidated and combined financial statements for a summary of these revenue recognition policies.
Acquisitions — Assets acquired and liabilities assumed in a business combination are recorded at fair value. We generally determine fair values using comparisons to market transactions and discounted cash flow analyses. The use of a discounted cash flow analysis requires significant judgment to estimate the future cash flows derived from the asset and the expected period of time over which those cash flows will occur
F-4
Table of Contents
and to determine an appropriate discount rate. Changes in such estimates could affect the amounts allocated to individual identifiable assets. While we believe our assumptions are reasonable, if different assumptions were made, the amount allocated to intangible assets could differ substantially from the reported amounts.
Goodwill — Goodwill for each reporting unit is tested for impairment on an annual basis or when events occur or circumstances change that would indicate the fair value of a reporting unit is below its carrying value. For purposes of performing the impairment test for goodwill, our reporting units are Lifestyle Media and Shopzilla. If the fair value of the reporting unit is less than its carrying value, an impairment loss is recorded to the extent that the fair value of the goodwill within the reporting unit is less than its carrying value.
To determine the fair value of our reporting units and indefinite-lived intangible assets, we generally use market data, appraised values and discounted cash flow analyses. The use of a discounted cash flow analysis requires significant judgment to estimate the future cash flows derived from the asset or business and the period of time over which those cash flows will occur and to determine an appropriate discount rate. Changes in our estimates and projections or changes in our established reporting units could materially affect the determination of fair value for each reporting unit.
Our annual goodwill impairment analysis, which was completed during the fourth quarter, did not result in an impairment charge in 2009. A 10% decrease in the estimated fair value of any of our reporting units would have no impact on the carrying value of goodwill.
Upon completing our impairment test in the fourth quarter of 2008, we determined that the goodwill recorded for our Shopzilla business was impaired. The impairment was attributed to the changing environment for online comparison shopping services and the subsequent repositioning of Shopzilla that adversely impacts our short-term forecast for Shopzilla’s future results.
Finite-Lived Intangible Assets — Finite-lived intangible assets (e.g., customer lists, trade names, patents, technology, network distribution relationships) are tested for impairment when a triggering event occurs. Such triggering events include the significant disposal of a portion of such assets or the occurrence of an adverse change in the market involving the business employing the related asset. Once a triggering event has occurred, the impairment test employed is based on whether the intent is to hold the asset for continued use or to hold the asset for sale. If the intent is to hold the asset for continued use, the impairment test first requires a comparison of undiscounted future cash flows against the carrying value of the asset. If the carrying value of such asset exceeds the undiscounted cash flows, the asset would be deemed to be impaired. Impairment would then be measured as the difference between the fair value of the asset and its carrying value. Fair value is generally determined by discounting the future cash flows associated with that asset. If the intent is to hold the asset for sale and certain other criteria are met (e.g., the asset can be disposed of currently, appropriate levels of authority have approved the sale or there is an actively pursuing buyer), the impairment test involves comparing the asset’s carrying value to its fair value. To the extent the carrying value is greater than the asset’s fair value, an impairment loss is recognized for the difference.
Significant judgments in this area involve determining whether a triggering event has occurred and the determination of the cash flows for the assets involved and the discount rate to be applied in determining fair value.
Income Taxes — The application of income tax law is inherently complex. As such, we are required to make many assumptions and judgments regarding our income tax positions and the likelihood whether such tax positions would be sustained if challenged. Interpretations and guidance surrounding income tax laws and regulations change over time. As such, changes in our assumptions and judgments can materially affect amounts recognized in the consolidated and combined financial statements.
We have deferred tax assets primarily related to state net operating loss carryforwards and capital loss carryforwards. We record a tax valuation allowance to reduce such deferred tax assets to the amount that is more likely than not to be realized. We consider ongoing prudent and feasible tax planning strategies in assessing the need for a valuation allowance. In the event we determine the deferred tax asset we would realize would be greater or less than the net amount recorded, an adjustment would be made to the tax provision in that period.
New Accounting Standards
A discussion of recently issued accounting pronouncements is described in Note 3-Accounting Standards Updates and Recently Issued Accounting Standards Updates, of the Notes to Consolidated and Combined Financial Statements in Item 8 of Part II of this Report, and we incorporate such discussion in this MD&A by reference and make it a part hereof.
The trends and underlying economic conditions affecting the operating performance and future prospects differ for each of our business segments, although the competitive landscape in both segments is affected by multiple media platforms competing for consumers and advertising dollars. In our Lifestyle Media division, we need to continue to create popular programming that resonates across a variety of demographic groups, develop new brands and find additional channels through which we can capitalize on the recognition of our existing brands and distribute our lifestyle-related content. In the Interactive Services division we must continually find ways to attract and monetize traffic to our sites, both by making changes to enhance the consumer experience and by finding ways to efficiently attract traffic. We believe the following discussion of our consolidated and combined results of operations should be read in conjunction with the discussion
F-5
Table of Contents
of the operating performance of our business segments that follows on pages F-7 through F-10.
Consolidated and Combined Results of Operations – Results of operations were as follows:
| For the years ended December 31, | ||||||||||||||||||
| (in thousands) |
2009 | Change | 2008 | Change | 2007 | |||||||||||||
| Operating revenues |
$ | 1,541,248 | (0.6 | )% | $ | 1,550,699 | 10.4 | % | $ | 1,404,787 | ||||||||
| Costs and expenses |
(939,600 | ) | 3.8 | % | (905,284 | ) | 12.4 | % | (805,621 | ) | ||||||||
| Depreciation and amortization of intangible assets |
(81,470 | ) | 22.8 | % | (66,337 | ) | 0.3 | % | (66,113 | ) | ||||||||
| Write-down of goodwill and other intangible assets |
(243,700 | ) | ||||||||||||||||
| Losses on disposal of PP&E |
(2,509 | ) | (788 | ) | 80.3 | % | (437 | ) | ||||||||||
| Operating income |
517,669 | 54.7 | % | 334,590 | (37.2 | )% | 532,616 | |||||||||||
| Interest expense |
(2,810 | ) | (80.2 | )% | (14,207 | ) | (61.4 | )% | (36,769 | ) | ||||||||
| Travel Channel financing costs |
(12,118 | ) | ||||||||||||||||
| Equity in earnings of affiliates |
18,626 | 20.2 | % | 15,498 | (12.0 | )% | 17,603 | |||||||||||
| Gains (losses) on repurchases of debt |
(26,380 | ) | 1,245 | |||||||||||||||
| Miscellaneous, net |
(1,110 | ) | 804 | (64.4 | )% | 2,261 | ||||||||||||
| Income from continuing operations before income taxes |
520,257 | 67.7 | % | 310,305 | (40.0 | )% | 516,956 | |||||||||||
| Provision for income taxes |
(161,474 | ) | (17.1 | )% | (194,710 | ) | 17.0 | % | (166,388 | ) | ||||||||
| Income from continuing operations, net of tax |
358,783 | 115,595 | (67.0 | )% | 350,568 | |||||||||||||
| Income (loss) from discontinued operations, net of tax |
26,091 | 353 | (394,441 | ) | ||||||||||||||
| Net income (loss) |
384,874 | 115,948 | (43,873 | ) | ||||||||||||||
| Less: net income attributable to noncontrolling interests |
(85,548 | ) | (7.4 | )% | (92,391 | ) | 11.9 | % | (82,534 | ) | ||||||||
| Net income (loss) attributable to SNI |
$ | 299,326 | $ | 23,557 | $ | (126,407 | ) | |||||||||||
Discontinued Operations – Discontinued operations include the uSwitch business that was sold in December 2009 and the two Shop At Home-affiliated television stations that were sold in April 2007.
Results of discontinued operations were as follows:
| For the years ended December 31, | ||||||||||||
| (in thousands) |
2009 | 2008 | 2007 | |||||||||
| Operating revenues: |
||||||||||||
| uSwitch |
$ | 22,732 | $ | 39,938 | $ | 36,478 | ||||||
| Shop At Home |
1,323 | |||||||||||
| Total operating revenues |
$ | 22,732 | $ | 39,938 | $ | 37,801 | ||||||
| Income (loss) from discontinued operations, before tax: |
||||||||||||
| uSwitch: |
||||||||||||
| Loss from operations |
$ | (4,131 | ) | $ | (986 | ) | $ | (438,403 | ) | |||
| Gain on divestiture |
28,668 | |||||||||||
| Total uSwitch |
24,537 | (986 | ) | (438,403 | ) | |||||||
| Shop At Home |
891 | |||||||||||
| Income (loss) from discontinued operations, before tax |
24,537 | (986 | ) | (437,512 | ) | |||||||
| Income taxes (benefit) |
(1,554 | ) | (1,339 | ) | (43,071 | ) | ||||||
| Income (loss) from discontinued operations, net of tax |
$ | 26,091 | $ | 353 | $ | (394,441 | ) | |||||
The gain on the uSwitch divestiture reflects the recognition of $44.4 million in foreign currency translation gains that were previously recognized in equity as a component of accumulated other comprehensive income (loss). The foreign currency translation gains was partially offset by a $6.8 million charge recorded for lease obligations we retained in the sale and a $8.9 million loss that was recognized on the sale of uSwitch’s net assets.
Operating results of our discontinued operations in 2007 include a non-cash charge of $411 million to write-down uSwitch’s goodwill and intangible assets.
Operating revenues in 2009 decreased slightly when compared with 2008. The decrease was attributed to lower referral fee revenues at our Interactive Services division reflecting a challenging retail market, the decision to competitively reposition Shopzilla for long-term growth and a less favorable sponsored-link contract with Google. These decreases in Interactive Services revenues were partially offset by significant increases in affiliate fee revenue at our national television networks. Excluding the impact of Travel Channel’s advertising revenues for the 16 days owned by us in 2009, Lifestyle Media advertising revenues were effectively flat compared with 2008 reflecting the effects of the economic recession and its related impact on advertising rates.
Costs and expenses in 2009 include a $21.1 million charge to write-off FLN’s programming rights and approximately $14 million of costs related to the Travel Channel acquisition and international investments. Excluding these items, costs and expenses decreased slightly when compared with 2008. Reductions in marketing and promotion costs at both our Lifestyle Media and Interactive Services
F-6
Table of Contents
business segment were partially offset by increases in programming costs at our national networks.
Depreciation incurred on capitalized software development costs and capitalized Web site costs contributed to the increase in depreciation and amortization.
In conjunction with our annual impairment tests of goodwill and intangible assets, we recorded a goodwill impairment charge of $244 million for our Shopzilla business during 2008.
Interest expense decreased in 2009 compared with 2008 due to lower average debt levels. Outstanding borrowings incurred under our credit facility were repaid in the first quarter of 2009. In December of 2009, TCM Sub LLC, a majority-owned subsidiary of SNI, issued $885 million of Senior Notes in conjunction with our acquisition of the Travel Channel. The notes bear interest at 3.55%.
Travel Channel financing costs reflect fees incurred on the Travel Channel debt structuring.
In the second quarter of 2008, E. W. Scripps redeemed their outstanding notes which were previously allocated to us in our consolidated and combined financial statements. The associated loss on extinguishment of $26.4 million from such redemption has been allocated to us in our statement of operations.
Our effective tax rate was 31.0 percent in 2009 and 62.7 percent in 2008. The income tax provision in 2009 includes $10.6 million of favorable adjustments that were primarily attributed to differences identified between our prior year tax provision and tax returns. The effective tax rate in 2008 was impacted by the impairment charge recorded for the write-down of Shopzilla’s goodwill and the allocated loss on extinguishment of debt, both of which were not deductible for income tax purposes.
Our effective income tax rate is also affected by the profitability of Food Network. Food Network is operated pursuant to the terms of a general partnership in which we maintain a 69 percent controlling interest. Income taxes on partnership income accrue to the individual partners. While the income before income tax reported in our financial statements includes all of the income before tax of the partnership, our income tax provision does not include income taxes on the portion of Food Network income that is attributable to the noncontrolling interest.
Net income attributable to noncontrolling interests in 2009 reflect noncontrolling interests’ share of the Food Network, Travel Channel, FLN and the food international venture. Noncontrolling interests hold a 31% interest in Food Network, 35% interest in Travel Channel, and 20% interest in the food international venture. In January 2010, we acquired the 6% noncontrolling interest in FLN.
The increase in operating revenues in 2008 compared with 2007 was primarily attributed to growth in advertising sales and affiliate fee revenue at our national television networks. The increase in advertising sales at Lifestyle Media reflected the improved audience viewership at HGTV and Food Network.
The increase in costs and expenses during 2008 was primarily attributed to the strategic investment in our interactive lifestyle businesses (SN Digital) and continuing investment in the improved quality and variety of programming at our national networks. Lower costs and expenses at our Interactive Services division partially offset the increase at Lifestyle Media. Interactive Services’ costs and expenses in 2007 include approximately $7 million of costs attributed to a leadership transition at Shopzilla.
Interest expense decreased in 2008 compared with 2007 due to lower average debt levels and lower interest rates. The average balance of outstanding borrowings during 2008 was $372 million at an average rate of 3.2 percent compared with $649 million at an average rate of 5.0 percent in 2007.
In the second quarter of 2008, E. W. Scripps redeemed their outstanding notes which were previously allocated to us in our consolidated and combined financial statements. The associated loss on extinguishment of $26.4 million from such redemption has been allocated to us in our statement of operations.
Our effective tax rate was 62.7 percent in 2008 and 32.2 percent in 2007. The effective tax rate in 2008 was impacted by the impairment charge recorded for the write-down of Shopzilla’s goodwill and the allocated loss on extinguishment of debt, both of which were not deductible for income tax purposes.
Net income attributable to noncontrolling interests increased year-over-year due to the increased profitability of the Food Network. Food Network’s profits are allocated in proportion to each partner’s interests in the partnership.
Business Segment Results – As discussed in Note 21-Segment Information to the consolidated and combined financial statements, our chief operating decision maker evaluates the operating performance of our business segments using a measure we call segment profit. Segment profit excludes interest, income taxes, depreciation and amortization, divested operating units, restructuring activities, investment results and certain other items that are included in net income determined in accordance with accounting principles generally accepted in the United States of America.
Items excluded from segment profit generally result from decisions made in prior periods or from decisions made by corporate executives rather than the managers of the business segments. Depreciation and amortization charges are the result of decisions made in prior periods regarding the allocation of resources and are therefore excluded from the measure. Financing, tax structure and divestiture decisions are generally made by corporate executives. Excluding these items from our business segment performance measure enables us to evaluate business segment operating performance based upon current economic conditions and decisions made by the managers of those business segments in the current period.
F-7
Table of Contents
Information regarding the operating performance of our business segments and a reconciliation of such information to the consolidated and combined financial statements is as follows:
| (in thousands) |
For the years ended December 31, | |||||||||||||||||
| 2009 | Change | 2008 | Change | 2007 | ||||||||||||||
| Segment operating revenue: |
||||||||||||||||||
| Lifestyle Media |
$ | 1,366,802 | 4.2 | % | $ | 1,312,313 | 10.8 | % | $ | 1,184,901 | ||||||||
| Interactive Services |
173,920 | (27.1 | )% | 238,469 | 8.5 | % | 219,886 | |||||||||||
| Corporate |
675 | 86 | ||||||||||||||||
| Intersegment eliminations |
(149 | ) | (169 | ) | ||||||||||||||
| Total operating revenues |
$ | 1,541,248 | (0.6 | )% | $ | 1,550,699 | 10.4 | % | $ | 1,404,787 | ||||||||
| Segment profit (loss): |
||||||||||||||||||
| Lifestyle Media |
$ | 636,865 | 0.8 | % | $ | 632,059 | 7.6 | % | $ | 587,411 | ||||||||
| Interactive Services |
30,735 | (50.9 | )% | 62,534 | 33.7 | % | 46,761 | |||||||||||
| Corporate |
(65,952 | ) | 34.1 | % | (49,178 | ) | 40.5 | % | (35,006 | ) | ||||||||
| Total segment profit |
601,648 | (6.8 | )% | 645,415 | 7.7 | % | 599,166 | |||||||||||
| Depreciation and amortization of intangible assets |
(81,470 | ) | (66,337 | ) | (66,113 | ) | ||||||||||||
| Write-down of goodwill and other intangible assets |
(243,700 | ) | ||||||||||||||||
| Losses on disposal of PP&E |
(2,509 | ) | (788 | ) | (437 | ) | ||||||||||||
| Interest expense |
(2,810 | ) | (14,207 | ) | (36,769 | ) | ||||||||||||
| Travel Channel financing costs |
(12,118 | ) | ||||||||||||||||
| Equity in earnings of affiliates |
18,626 | 15,498 | 17,603 | |||||||||||||||
| Gains (losses) on repurchases of debt |
(26,380 | ) | 1,245 | |||||||||||||||
| Miscellaneous, net |
(1,110 | ) | 804 | 2,261 | ||||||||||||||
| Income from continuing operations before income taxes |
$ | 520,257 | $ | 310,305 | $ | 516,956 | ||||||||||||
Corporate costs in 2009 include transaction costs of $10.2 million that were incurred related to the Travel acquisition. Corporate also includes the operating results of the joint venture we formed with Chello Zone Media in the fourth quarter of 2009 as well as international development spending. The joint venture of which we own 80% was formed to launch food channels in Europe, the Middle East, and Africa.
Corporate costs for the first six months of 2008 and the full-year period of 2007 reflect an estimate of SNI’s portion of E. W. Scripps Company’s corporate expenses for the periods prior to the July 1, 2008 separation date. Such estimates are not necessarily representative of our costs as a stand-alone, publicly-traded company.
A reconciliation of segment profit to operating income determined in accordance with accounting principles generally accepted in the United States of America for each business segment was as follows:
| For the years ended December 31, | |||||||||||
| (in thousands) |
2009 | 2008 | 2007 | ||||||||
| Operating income |
$ | 517,669 | $ | 334,590 | $ | 532,616 | |||||
| Depreciation and amortization: |
|||||||||||
| Lifestyle Media |
38,822 | 28,309 | 23,192 | ||||||||
| Interactive Services |
40,862 | 37,769 | 41,919 | ||||||||
| Corporate |
1,786 | 259 | 1,002 | ||||||||
| Losses (gains) on disposal of PP&E: |
|||||||||||
| Lifestyle Media |
755 | 721 | 172 | ||||||||
| Interactive Services |
1,754 | (3 | ) | 266 | |||||||
| Corporate |
70 | (1 | ) | ||||||||
| Write-down of goodwill and other intangible assets |
243,700 | ||||||||||
| Total segment profit |
$ | 601,648 | $ | 645,415 | $ | 599,166 | |||||
F-8
Table of Contents
Lifestyle Media – Lifestyle Media includes six national television networks, Internet businesses and other electronic content services primarily in the United States. Our networks also operate domestically and internationally through licensing agreements and joint ventures with other entities. We own approximately 69% of Food Network and 65% of Travel Channel.
Our Lifestyle Media division earns revenue primarily from the sale of advertising time on our national television networks, affiliate fees paid by cable and satellite television operators that carry our network programming, the licensing of its content to third parties, the licensing of its brands for consumer products such as books and kitchenware, and from the sale of advertising on our Lifestyle Media affiliated Web sites (SN Digital). Employee costs and programming costs are Lifestyle Media’s primary expenses. The demand for national television advertising is the primary economic factor that impacts the operating performance of our networks.
Operating results for Lifestyle Media were as follows:
| For the years ended December 31, | |||||||||||||||
| (in thousands) |
2009 | Change | 2008 | Change | 2007 | ||||||||||
| Segment operating revenues: |
|||||||||||||||
| Advertising |
$ | 1,009,496 | 0.4 | % | $ | 1,005,330 | 8.3 | % | $ | 928,221 | |||||
| Network affiliate fees, net |
325,885 | 17.5 | % | 277,370 | 17.9 | % | 235,248 | ||||||||
| Other |
31,421 | 6.1 | % | 29,613 | 38.2 | % | 21,432 | ||||||||
| Total segment operating revenues |
1,366,802 | 4.2 | % | 1,312,313 | 10.8 | % | 1,184,901 | ||||||||
| Segment costs and expenses: |
|||||||||||||||
| Employee compensation and benefits |
183,667 | 5.8 | % | 173,667 | 18.5 | % | 146,576 | ||||||||
| Programs and program licenses |
328,616 | 17.5 | % | 279,767 | 16.9 | % | 239,343 | ||||||||
| Other segment costs and expenses |
217,654 | (4.0 | )% | 226,820 | 7.2 | % | 211,571 | ||||||||
| Total segment costs and expenses |
729,937 | 7.3 | % | 680,254 | 13.9 | % | 597,490 | ||||||||
| Segment profit |
$ | 636,865 | 0.8 | % | $ | 632,059 | 7.6 | % | $ | 587,411 | |||||
| Supplemental Information: |
|||||||||||||||
| Billed network affiliate fees |
$ | 361,665 | $ | 308,456 | $ | 255,874 | |||||||||
| Program payments |
284,409 | 280,893 | 291,713 | ||||||||||||
| Depreciation and amortization |
38,822 | 28,309 | 23,192 | ||||||||||||
| Capital expenditures |
66,112 | 57,074 | 35,306 | ||||||||||||
Lifestyle Media includes Travel Channel results for the 16 days of 2009 that it was owned by the Company. Excluding Travel Channel operating results, Lifestyle Media revenues increased 3.3 percent in 2009 compared with 2008. The discussion that follows excludes Travel Channel’s results for the period SNI owned it in 2009.
Lifestyle Media demonstrated strong viewership growth in 2009 compared with 2008. Total household viewership at Food Network increased 22 percent in primetime and 14 percent in total day compared with 2008. Food Network’s successful ratings were boosted by successful programming that included Chopped, Next Food Network Star, Iron Chef America, Ultimate Recipe Showdown, and Diners, Drive-Ins and Dives. Due particularly to a strong second half of 2009, HGTV had its best year ever for prime time and total day viewership. DIY’s young adult audience grew 27 percent in prime time, 28 percent in total day, and 22 percent in weekend daytime over 2008.
Despite positive audience trends and strong advertising revenue growth in the fourth quarter of 2009, the effects of the economic recession and its effect on advertising rates resulted in a slight decrease in advertising revenues in 2009 compared with 2008. General weakness in scatter advertising relative to strong growth in the first six months of 2008 also contributed to the year-over-year reduction in advertising revenues.
Improved ratings and viewership, particularly at Food Network, and also strong pricing in the scatter advertising market during the first half of 2008 contributed to the increase in advertising revenues during 2008 compared with 2007.
Distribution agreements with cable and satellite television systems require the payment of affiliate fees over the terms of the agreements. The increase in network affiliate fees over each of the last three years reflects both scheduled rate increases and wider distribution of the networks. During the fourth quarter of 2009, the Company successfully renewed the majority of their existing Food Network affiliate agreements. Including increases obtained in the Food Network renewals and about $100 million related to Travel Channel, network affiliate fee revenue is expected to be $530 to $540 million in 2010.
SN Digital online revenues were $81.7 million in 2009, $81.9 million in 2008, and $75.4 million in 2007. Effects of the economic recession and related softness in online advertising demand for the majority of 2009 contributed to the slight decline in SN Digital’s revenues in 2009 compared with 2008.
The hiring of additional employees in 2007 and throughout the first six months of 2008 to support the growth of Lifestyle Media contributed to the year-over-year increases in employee compensation and benefits. Employee compensation and benefit costs in 2008 also include $4.4 million of employee severance costs.
During the fourth quarter of 2009, we announced that FLN will be rebranded as The Cooking Channel. As a result of the decision to rebrand, we completed an analysis of FLN’s programming library and recorded a non-cash charge of $21.1 million to write-down the value of FLN’s programming rights to their expected fair value. Excluding this charge, programs and program licenses increased 10% in 2009 compared with 2008. The increase in programs and program licenses in 2009 and 2008 compared with respective previous
F-9
Table of Contents
years reflects the investment in the improved quality and variety of programming at our networks in recent periods. Including Travel Channel for the full year, programming expenses in 2010 are expected to be $380 million to $400 million. Non-programming expenses for Lifestyle Media are expected to be $550 million to $570 million, including one-time transition costs related to Travel Channel.
Capital expenditures for each year reported include the costs related to the expansion of Lifestyle Media’s headquarters in Knoxville, Tennessee.
Supplemental financial information for Lifestyle Media is as follows:
| For the years ended December 31, | |||||||||||||||
| (in thousands) |
2009 | Change | 2008 | Change | 2007 | ||||||||||
| Operating revenues: |
|||||||||||||||
| HGTV |
$ | 616,278 | 3.3 | % | $ | 596,584 | 8.5 | % | $ | 549,641 | |||||
| Food Network |
507,513 | 4.4 | % | 485,914 | 11.4 | % | 436,354 | ||||||||
| Travel Channel |
11,334 | ||||||||||||||
| DIY |
69,670 | 8.9 | % | 64,005 | 30.9 | % | 48,879 | ||||||||
| FLN |
46,115 | (12.1 | )% | 52,464 | 21.8 | % | 43,061 | ||||||||
| GAC |
26,864 | 6.7 | % | 25,175 | 2.8 | % | 24,496 | ||||||||
| SN Digital |
81,804 | (0.1 | )% | 81,894 | 8.6 | % | 75,410 | ||||||||
| Other / eliminations |
7,224 | 15.1 | % | 6,277 | (11.1 | )% | 7,060 | ||||||||
| Total segment operating revenues |
$ | 1,366,802 | 4.2 | % | $ | 1,312,313 | 10.8 | % | $ | 1,184,901 | |||||
| Homes reached in December (1): |
|||||||||||||||
| HGTV |
98,700 | 1.0 | % | 97,700 | 2.0 | % | 95,800 | ||||||||
| Food Network |
99,200 | 1.3 | % | 97,900 | 2.2 | % | 95,800 | ||||||||
| Travel Channel |
95,200 | 1.5 | % | 93,800 | 2.6 | % | 91,400 | ||||||||
| DIY |
53,200 | 7.7 | % | 49,400 | 5.3 | % | 46,900 | ||||||||
| FLN |
56,400 | 4.6 | % | 53,900 | 8.0 | % | 49,900 | ||||||||
| GAC |
58,500 | 6.2 | % | 55,100 | 3.8 | % | 53,100 | ||||||||
| (1) | Approximately 100 million homes in the United States receive cable or satellite television. Homes reached are according to the Nielsen Homevideo Index (“Nielsen”), with the exception of FLN in 2008 and 2007, which was not yet rated by Nielsen and represented comparable amounts calculated by us. |
Interactive Services – Interactive Services includes our online comparison shopping service, Shopzilla, and its related online comparison shopping brands bizrate and beso.
Our product comparison shopping services help consumers find products offered for sale on the Web by online retailers. Shopzilla also operates a Web-based consumer feedback network within the bizrate brand that collects millions of consumer reviews of stores and products each year.
Our Interactive Services businesses earn revenue primarily from referral fees paid by participating online retailers.
Financial information for Interactive Services is as follows:
| For the years ended December 31, | |||||||||||||||
| (in thousands) |
2009 | Change | 2008 | Change | 2007 | ||||||||||
| Segment operating revenues |
$ | 173,920 | (27.1 | )% | $ | 238,469 | 8.5 | % | $ | 219,886 | |||||
| Segment costs and expenses: |
|||||||||||||||
| Employee compensation and benefits |
41,515 | (12.3 | )% | 47,343 | (12.0 | )% | 53,810 | ||||||||
| Marketing and advertising |
84,934 | (22.9 | )% | 110,117 | 11.6 | % | 98,704 | ||||||||
| Other segment costs and expenses |
16,736 | (9.4 | )% | 18,475 | (10.4 | )% | 20,611 | ||||||||
| Total segment costs and expenses |
143,185 | (18.6 | )% | 175,935 | 1.6 | % | 173,125 | ||||||||
| Segment profit |
$ | 30,735 | (50.9 | )% | $ | 62,534 | 33.7 | % | $ | 46,761 | |||||
| Supplemental Information: |
|||||||||||||||
| Depreciation and amortization |
$ | 40,862 | $ | 37,769 | $ | 41,919 | |||||||||
| Write-down of goodwill and other intangible assets |
243,700 | ||||||||||||||
| Capital expenditures |
20,677 | 17,878 | 22,800 | ||||||||||||
Interactive Services’ results in 2009 compared with 2008 have been affected by the downturn in the economy, a less favorable sponsored-link contract with Google and the decision to competitively reposition Shopzilla for long-term growth. Reduced spending by customers resulted in lower volume and cost per click prices during the year. As a result of the repositioning, we are foregoing near-term margin with the underlying intention of engaging consumers more deeply in the product.
The increases in operating revenues in 2008 compared with 2007 reflected growth in revenues from Western European markets and Shopzilla’s effectiveness in increasing and monetizing user traffic. The downturn in the economy and its related impact on the retail marketplace in the fourth quarter of 2008 partially offset these increases in operating revenues.
The decrease in segment costs and expenses for 2009 compared with 2008 reflects efforts to align costs with the current business conditions.
In the fourth quarter of 2008, we recorded a goodwill impairment charge of $244 million for our Shopzilla business. The write-down was a function of both the changing competitive environment for online comparison shopping services and our subsequent decision to reposition Shopzilla within that marketplace for maximum long-term growth. The repositioning, which involves some meaningful changes in our existing business model, coupled with Shopzilla’s exposure to the slowing retail market negatively impacted our near-term operating outlook for the business.
Interactive Services is expected to generate segment profits of approximately $33 million to $35 million for the full-year of 2010.
Capital expenditures primarily relate to capitalized software development costs.
F-10
Table of Contents
Liquidity and Capital Resources
Our primary source of liquidity is our cash flow from operating activities. Marketing services, including advertising and referral fees, provide approximately 80 percent of total operating revenues, so cash flow from operating activities is adversely affected during recessionary periods. Information about our use of cash flow from operating activities is presented in the following table:
| For the years ended December 31, | ||||||||||||
| (in thousands) |
2009 | 2008 | 2007 | |||||||||
| Net cash provided by continuing operating activities |
$ | 537,635 | $ | 538,067 | $ | 384,742 | ||||||
| Net cash provided by (used in) discontinued operations |
(5,968 | ) | 9,235 | 30,150 | ||||||||
| Dividends paid, including to noncontrolling interest |
(138,443 | ) | (107,211 | ) | (62,968 | ) | ||||||
| Employee stock option proceeds |
27,735 | 5,873 | ||||||||||
| Other, net |
(12,991 | ) | (3,332 | ) | (3,305 | ) | ||||||
| Change in parent company investment, net |
93,958 | (3,557 | ) | |||||||||
| Cash flow available for acquisitions, investments, debt repayment |
407,968 | 536,590 | 345,062 | |||||||||
| Sources and uses of available cash flow: |
||||||||||||
| Business acquisitions and net investment activity |
(877,801 | ) | (15,702 | ) | (29,880 | ) | ||||||
| Capital expenditures |
(90,006 | ) | (74,630 | ) | (60,329 | ) | ||||||
| Preminum payment on repurchases of debt |
(22,517 | ) | ||||||||||
| Increase (decrease) in long-term debt, net |
804,239 | (426,303 | ) | (261,282 | ) | |||||||
| Increase (decrease) in cash and cash equivalents |
$ | 244,400 | $ | (2,562 | ) | $ | (6,429 | ) | ||||
Our cash flow has been used primarily to fund acquisitions and investments, develop new businesses, and repay debt. We expect cash flow from operating activities in 2010 will provide sufficient liquidity to continue the development of our emerging brands and to fund the capital expenditures necessary to support our business.
In December 2009, we completed the sale of uSwitch which provided cash consideration of approximately $10 million.
In December 2009, we acquired a 65% controlling interest in Travel Channel through a transaction structured as a leveraged joint venture between SNI and Cox TMI, Inc., a wholly owned subsidiary of Cox Communications, Inc. (“Cox”). Pursuant to the terms of the transaction, Cox contributed the Travel Channel business, valued at $975 million, and SNI contributed $181 million in cash to the joint venture. The joint venture also issued $885 million aggregate principal amount of 3.55% Senior Notes due 2015 at a price equal to 99.914% of the principal amount. The Notes were guaranteed by SNI. Cox has agreed to indemnify SNI for payments made in respect of SNI’s guarantee. Net proceeds from the issuance of the Notes totaling $877.5 million were distributed to Cox in the Travel Channel transaction.
In July 2007, we reached agreements to acquire the Web sites Recipezaar.com and Pickle.com for total cash consideration of approximately $30 million.
On April 24, 2007, we completed the sale of two Shop At Home-affiliated television stations located in Lawrence, MA, and Bridgeport, CT, which provided cash consideration of approximately $61 million.
On June 30, 2008, we entered into a Competitive Advance and Revolving Credit Facility that permits $550 million in aggregate borrowings and expires in June 2013. We borrowed $325 million under the credit facility on June 30, 2008. Utilizing existing cash on hand and the proceeds from these borrowings, we paid a dividend of $430 million to E. W. Scripps prior to the consummation of the spin-off. As of December 31, 2009, the Credit Facility balance has been reduced to zero as a result of payments made against the Facility in 2008 and 2009.
Pursuant to the terms of the Food Network general partnership agreement, the partnership is required to distribute available cash to the general partners. Cash distributions to Food Network’s non-controlling interest was $88.9 million in 2009, $82.7 million in 2008 and $63.0 million in 2007.
Management does not believe that the costs associated with the Employee Matters Agreement with E. W. Scripps will have a material impact on the future results of operations, financial condition or liquidity. We incurred expenses of $3.0 million and recorded income of $0.6 million under the Transition Services Agreement for 2009 (see Note 18—Related Party Transactions). The general terms of the Tax Allocation Agreement between us and The E. W. Scripps Company, provides that each company is responsible for income taxes for periods before the spin-off as it relates to their respective businesses. In connection with the reconciliation of the income tax provision to the stub period tax returns (six month period in 2008 prior to the separation), determination was made that we owe payment to E. W. Scripps for tax related matters totaling $6.5 million. We paid this amount to E. W. Scripps in the first quarter of 2010.
F-11
Table of Contents
Off-Balance Sheet Arrangements and Contractual Obligations
Off-Balance Sheet Arrangements
Off-balance sheet arrangements include the following four categories: obligations under certain guarantees or contracts; retained or contingent interests in assets transferred to an unconsolidated entity or similar arrangements; obligations under certain derivative instruments; and obligations under material variable interests.
We may use derivative financial instruments to manage exposure to interest rate and foreign exchange rate fluctuations. We held no interest rate or foreign currency derivative financial instruments at December 31, 2009.
We have not entered into any material arrangements which would fall under any of these four categories and which would be reasonably likely to have a current or future material effect on our results of operations, liquidity or financial condition.
Our contractual obligations under certain contracts are included in the following table.
F-12
Table of Contents
Contractual Obligations
A summary of our contractual cash commitments, as of December 31, 2009, is as follows:
| (in thousands) |
Less than 1 Year |
Years 2 & 3 |
Years 4 & 5 |
Over 5 Years |
Total | ||||||||||
| Long-term debt: |
|||||||||||||||
| Principal amounts |
$ | 885,000 | $ | 885,000 | |||||||||||
| Interest on long-term debt |
$ | 31,418 | $ | 62,836 | $ | 62,836 | 1,309 | 158,399 | |||||||
| Network launch incentives: |
|||||||||||||||
| Network launch incentive offers accepted |
3,758 | 3,758 | |||||||||||||
| Incentives offered to cable television systems |
2,009 | 2,009 | |||||||||||||
| Programming: |
|||||||||||||||
| Available for broadcast |
20,350 | 20,350 | |||||||||||||
| Not yet available for broadcast |
72,579 | 27,922 | 189 | 100,690 | |||||||||||
| Employee compensation and benefits: |
|||||||||||||||
| Deferred compensation and benefits |
600 | 1,200 | 1,200 | 11,143 | 14,143 | ||||||||||
| Employment and talent contracts |
18,415 | 10,075 | 535 | 29,025 | |||||||||||
| Operating leases: |
|||||||||||||||
| Noncancelable |
18,115 | 33,635 | 34,840 | 44,392 | 130,982 | ||||||||||
| Cancelable |
2,422 | 7,885 | 5,475 | 6,632 | 22,414 | ||||||||||
| Pension obligations: |
|||||||||||||||
| Minimum pension funding |
2,575 | 7,521 | 7,268 | 15,218 | 32,582 | ||||||||||
| Redeemable noncontrolling interest: |
|||||||||||||||
| Purchase noncontrolling interest in FLN |
14,400 | 14,400 | |||||||||||||
| Other commitments: |
|||||||||||||||
| Distribution agreements |
13,700 | 5,550 | 5,113 | 24,363 | |||||||||||
| Satellite transmission |
10,873 | 20,836 | 19,560 | 37,039 | 88,308 | ||||||||||
| Noncancelable purchase and service commitments |
16,851 | 20,794 | 9,901 | 10,167 | 57,713 | ||||||||||
| Other purchase and service commitments |
37,962 | 21,036 | 7,797 | 66,795 | |||||||||||
| Total contractual cash obligations |
$ | 266,027 | $ | 219,290 | $ | 154,714 | $ | 1,010,900 | $ | 1,650,931 | |||||
In the ordinary course of business, we enter into long-term contracts to obtain distribution of our networks, to license or produce programming, to secure on-air talent, to lease office space and equipment, to obtain satellite transmission rights, and to purchase other goods and services.
Long-Term Debt – Principal payments on long-term debt reflect the repayment of our fixed-rate notes assuming repayment will occur upon the expiration of the fixed-rate notes in January 2015.
Interest payments on our fixed-rate notes are projected based on the notes’ contractual rate and maturity.
Network Launch Incentives – We may offer incentives to cable and satellite television systems in exchange for long-term contracts to distribute our networks. Such incentives may be in the form of cash payments or an initial period in which the payment of affiliate fees is waived. We become obligated for such incentives at the time a cable or satellite television system launches our programming.
Amounts included in the above table for network launch incentive offers accepted by cable and satellite television systems include both amounts due to systems that have launched our networks and estimated incentives due to systems that have agreed to launch our networks in future periods.
We have offered launch incentives to cable and satellite television systems that have not yet agreed to carry our networks. Such offers generally expire if the system does not launch our programming by a specified date. We expect to make additional launch incentive offers to cable and satellite television systems to expand the distribution of our networks.
Programming – Program licenses generally require payments over the terms of the licenses. Licensed programming includes both programs that have been delivered and are available for telecast and programs that have not yet been produced. If the programs are not produced, our commitments would generally expire without obligation.
We also enter into contracts with certain independent producers for the production of programming that airs on our national television networks. Production contracts generally require us to purchase a specified number of episodes of the program.
We expect to enter into additional program licenses and production contracts to meet our future programming needs.
Talent Contracts – We secure on-air talent for our national television networks through multi-year talent agreements. Certain agreements may be terminated under certain circumstances or at certain dates prior to expiration. We expect our employment and talent contracts will be renewed or replaced with similar agreements upon their expiration. Amounts due under the contracts, assuming the contracts are not terminated prior to their expiration, are included in the contractual commitments table.
Operating Leases – We obtain certain office space under multi-year lease agreements. Leases for office space are generally not cancelable prior to their expiration.
Leases for operating and office equipment are generally cancelable by either party on 30 to 90 day notice. However, we expect such contracts will remain in force throughout the terms of the leases. The amounts included in the table above represent the amounts due under the agreements assuming the agreements are not canceled prior to their expiration.
We expect our operating leases will be renewed or replaced with similar agreements upon their expiration.
F-13
Table of Contents
Pension Funding – We sponsor a qualified defined benefit pension plan that covers substantially all employees. We also have a non-qualified Supplemental Executive Retirement Plan (“SERP”).
Contractual commitments summarized in the contractual obligations table include payments to meet minimum funding requirements of our defined benefit pension plans in 2010 and estimated benefit payments for our unfunded non-qualified SERP plan. Estimated payments for the SERP plan have been estimated over a ten-year period. Accordingly, the amounts in the over 5 years column include estimated payments for the periods of 2015-2019. While benefit payments under these plans are expected to continue beyond 2019, we believe it is not practicable to estimate payments beyond this period.
Income Tax Obligations – The contractual obligations table does not include any reserves for income taxes due to the fact that we are unable to reasonably predict the ultimate amount or timing of settlement of our reserves for income taxes. As of December 31, 2009, our reserves for income taxes totaled $42.4 million which is reflected in other liabilities in our consolidated balance sheets. (See Note 7-Income Taxes to the consolidated and combined financial statements for additional information on income taxes).
Purchase Commitments – We obtain satellite transmission, audience ratings, market research and certain other services under multi-year agreements. These agreements are generally not cancelable prior to expiration of the service agreement. We expect such agreements will be renewed or replaced with similar agreements upon their expiration.
We may also enter into contracts with certain vendors and suppliers. These contracts typically do not require the purchase of fixed or minimum quantities and generally may be terminated at any time without penalty. Included in the table of contractual commitments are purchase orders placed as of December 31, 2009. Purchase orders placed with vendors, including those with whom we maintain contractual relationships, are generally cancelable prior to shipment. While these vendor agreements do not require us to purchase a minimum quantity of goods or services, and we may generally cancel orders prior to shipment, we expect expenditures for goods and services in future periods will approximate those in prior years.
Redemption of Noncontrolling Interests in Subsidiary Companies – In January 2010, we reached agreement with the minority owner of FLN to acquire their 6% interest in the network for cash consideration of $14.4 million.
The minority owners of Travel and the food international venture have the right to require us to repurchase their respective interests. The minority owners will receive fair market value for their interest at the time their options are exercised. The table of contractual commitments does not include amounts for the repurchase of noncontrolling interests.
The Food Network general partnership agreement is due to expire on December 31, 2012, unless amended or extended prior to that date. In the event of such expiration, the assets of the partnership are to be liquidated and distributed to the partners in proportion to their partnership interests.
Quantitative and Qualitative Disclosures about Market Risk
Earnings and cash flow can be affected by, among other things, economic conditions, interest rate changes and foreign currency fluctuations.
Our objectives in managing interest rate risk are to limit the impact of interest rate changes on our earnings and cash flows, and to reduce overall borrowing costs. We manage interest rate risk primarily by maintaining a mix of fixed-rate and variable-rate debt.
We are subject to interest rate risk associated with our credit facility as borrowings are available on a committed revolving credit basis at our choice of three short-term rates or through an auction procedure at the time of our financing needs. TCM Sub, LLC, a majority-owned subsidiary of SNI, issued $885 million of Senior Notes in conjunction with our acquisition of a controlling interest in the Travel Channel. A one percent increase or decrease in the level of interest rates, respectively, would decrease or increase the fair value of the Senior Notes by approximately $38.1 million and $41.4 million.
The following table presents additional information about market-risk-sensitive financial instruments:
| As of December 31, 2009 | As of December 31, 2008 | |||||||||||
| (in thousands) |
Cost Basis |
Fair Value |
Cost Basis |
Fair Value | ||||||||
| Financial instruments subject to interest rate risk: |
||||||||||||
| Variable rate credit facility |
$ | 80,000 | $ | 80,000 | ||||||||
| 3.55% notes due in 2015 |
$ | 884,239 | $ | 875,600 | ||||||||
| Total long-term debt |
$ | 884,239 | $ | 875,600 | $ | 80,000 | $ | 80,000 | ||||
Our primary exposure to foreign currencies is the exchange rates between the U.S. dollar and the British pound and the Euro. Reported earnings and assets may be reduced in periods in which the U.S. dollar increases in value relative to those currencies.
Our objective in managing exposure to foreign currency fluctuations is to reduce volatility of earnings and cash flow. Accordingly, we may enter into foreign currency derivative instruments that change in value as foreign exchange rates change, such as foreign currency forward contracts or foreign currency options. We held no foreign currency derivative financial instruments at December 31, 2009.
F-14
Table of Contents
Evaluation of Disclosure Controls and Procedures
The effectiveness of the design and operation of our disclosure controls and procedures (as defined in Rule 13a-15(e) under the Securities Exchange Act of 1934) was evaluated as of the date of the financial statements. This evaluation was carried out under the supervision of and with the participation of management, including the Chief Executive Officer and the Chief Financial Officer. Based upon that evaluation, the Chief Executive Officer and the Chief Financial Officer concluded that the design and operation of these disclosure controls and procedures are effective. There were no changes to the company’s internal controls over financial reporting (as defined in Exchange Act Rule 13a-15(f)) during the period covered by this report that have materially affected, or are reasonably likely to materially affect, the company’s internal control over financial reporting.
F-15
Table of Contents
Management’s Report on Internal Control Over Financial Reporting
SNI’s management is responsible for establishing and maintaining adequate internal controls designed to provide reasonable assurance regarding the reliability of financial reporting and the preparation of financial statements for external purposes in accordance with accounting principles generally accepted in the United States of America (“GAAP”). The company’s internal control over financial reporting includes those policies and procedures that:
| 1. | pertain to the maintenance of records that, in reasonable detail, accurately and fairly reflect the transactions and dispositions of the assets of the company; |
| 2. | provide reasonable assurance that transactions are recorded as necessary to permit preparation of financial statements in accordance with GAAP and that receipts and expenditures of the company are being made only in accordance with authorizations of management and the directors of the company; and |
| 3. | provide reasonable assurance regarding prevention or timely detection of unauthorized acquisition, use or disposition of the company’s assets that could have a material effect on the financial statements. |
All internal control systems, no matter how well designed, have inherent limitations, including the possibility of human error, collusion and the improper overriding of controls by management. Accordingly, even effective internal control can only provide reasonable but not absolute assurance with respect to financial statement preparation. Further, because of changes in conditions, the effectiveness of internal control may vary over time.
As required by Section 404 of the Sarbanes Oxley Act of 2002, management assessed the effectiveness of Scripps Networks Interactive and subsidiaries (the “Company”) internal control over financial reporting as of December 31, 2009. Management’s assessment is based on the criteria established in the Internal Control – Integrated Framework issued by the Committee of Sponsoring Organizations of the Treadway Commission. Based upon our assessment, management believes that the company maintained effective internal control over financial reporting as of December 31, 2009.
We acquired a 65% controlling interest in Travel Channel on December 15, 2009. This business has total assets of approximately $1.2 billion, subject to final asset valuation. We have excluded this business from management’s report on internal control over financial reporting, as permitted by SEC guidance, for the year ended December 31, 2009.
The company’s independent registered public accounting firm has issued an attestation report on our internal control over financial reporting as of December 31, 2009. This report appears on page F-17.
Date: March 1, 2010
| BY: |
| /s/ Kenneth W. Lowe |
| Kenneth W. Lowe |
| Chairman of the Board of Directors, President and |
| Chief Executive Officer |
| /s/ Joseph G. NeCastro |
| Joseph G. NeCastro |
| Chief Administrative Officer and Chief Financial Officer |
F-16
Table of Contents
REPORT OF INDEPENDENT REGISTERED PUBLIC ACCOUNTING FIRM
To the Board of Directors and Shareholders Scripps Networks Interactive, Inc.
We have audited the internal control over financial reporting of Scripps Networks Interactive, Inc. and subsidiaries (the "Company") as of December 31, 2009, based on criteria established in Internal Control — Integrated Framework issued by the Committee of Sponsoring Organizations of the Treadway Commission. As described in Management’s Report on Internal Control Over Financial Reporting, the Company acquired a 65% controlling interest in Travel Channel on December 15, 2009. This business has total assets of approximately $1.2 billion, subject to final asset valuation. Management has excluded this business from its report on internal control over financial reporting, as permitted by SEC guidance, for the year ended December 31, 2009. Accordingly, our audit did not include the internal control over financial reporting at Travel Channel. The Company's management is responsible for maintaining effective internal control over financial reporting and for its assessment of the effectiveness of internal control over financial reporting, included in the accompanying Management’s Report on Internal Control Over Financial Reporting. Our responsibility is to express an opinion on the Company's internal control over financial reporting based on our audit.
We conducted our audit in accordance with the standards of the Public Company Accounting Oversight Board (United States). Those standards require that we plan and perform the audit to obtain reasonable assurance about whether effective internal control over financial reporting was maintained in all material respects. Our audit included obtaining an understanding of internal control over financial reporting, assessing the risk that a material weakness exists, testing and evaluating the design and operating effectiveness of internal control based on the assessed risk, and performing such other procedures as we considered necessary in the circumstances. We believe that our audit provides a reasonable basis for our opinion.
A company’s internal control over financial reporting is a process designed by, or under the supervision of, the company's principal executive and principal financial officers, or persons performing similar functions, and effected by the company's board of directors, management, and other personnel to provide reasonable assurance regarding the reliability of financial reporting and the preparation of financial statements for external purposes in accordance with generally accepted accounting principles. A company's internal control over financial reporting includes those policies and procedures that (1) pertain to the maintenance of records that, in reasonable detail, accurately and fairly reflect the transactions and dispositions of the assets of the company; (2) provide reasonable assurance that transactions are recorded as necessary to permit preparation of financial statements in accordance with generally accepted accounting principles, and that receipts and expenditures of the company are being made only in accordance with authorizations of management and directors of the company; and (3) provide reasonable assurance regarding prevention or timely detection of unauthorized acquisition, use, or disposition of the company's assets that could have a material effect on the financial statements.
Because of the inherent limitations of internal control over financial reporting, including the possibility of collusion or improper management override of controls, material misstatements due to error or fraud may not be prevented or detected on a timely basis. Also, projections of any evaluation of the effectiveness of the internal control over financial reporting to future periods are subject to the risk that the controls may become inadequate because of changes in conditions, or that the degree of compliance with the policies or procedures may deteriorate.
In our opinion, the Company maintained, in all material respects, effective internal control over financial reporting as of December 31, 2009, based on the criteria established in Internal Control — Integrated Framework issued by the Committee of Sponsoring Organizations of the Treadway Commission.
We have also audited, in accordance with the standards of the Public Company Accounting Oversight Board (United States), the consolidated financial statements and financial statement schedule as of and for the year ended December 31, 2009 of the Company and our report dated March 1, 2010 expressed an unqualified opinion on those financial statements and financial statement schedule and included explanatory paragraphs regarding the allocation of certain general corporate overhead expenses from The E.W. Scripps Company for periods prior to the Separation of Scripps Networks Interactive, Inc., the retrospective application of Accounting Standards Codification (ASC) 810, Consolidation (formerly Statement of Financial Accounting Standards (SFAS) No. 160, Noncontrolling Interests in Consolidated Financial Statements), which became effective January 1, 2009, the retrospective presentation of the Company’s uSwitch business as discontinued operations and the adoption of the provisions of ASC 740, Income Taxes (formerly FASB Interpretation No. 48 (“FIN 48”), Accounting for Uncertainty in Income Taxes an Interpretation of FASB Statement No. 109), effective January 1, 2007.
/s/ DELOITTE & TOUCHE LLP
Cincinnati, Ohio
March 1, 2010
F-17
Table of Contents
REPORT OF INDEPENDENT REGISTERED PUBLIC ACCOUNTING FIRM
To the Board of Directors and Shareholders
Scripps Networks Interactive, Inc.
We have audited the accompanying consolidated balance sheets of Scripps Networks Interactive, Inc. and subsidiaries (the “Company”) as of December 31, 2009 and 2008, and the related consolidated and combined statements of operations, accumulated other comprehensive income (loss) and shareholders' equity, and cash flows for each of the three years in the period ended December 31, 2009. Our audits also included the financial statement schedule at Page S-2. These financial statements and financial statement schedule are the responsibility of the Company's management. Our responsibility is to express an opinion on the financial statements and financial statement schedule based on our audits.
We conducted our audits in accordance with the standards of the Public Company Accounting Oversight Board (United States). Those standards require that we plan and perform the audit to obtain reasonable assurance about whether the financial statements are free of material misstatement. An audit includes examining, on a test basis, evidence supporting the amounts and disclosures in the financial statements. An audit also includes assessing the accounting principles used and significant estimates made by management, as well as evaluating the overall financial statement presentation. We believe that our audits provide a reasonable basis for our opinion.
In our opinion, such consolidated and combined financial statements present fairly, in all material respects, the financial position of Scripps Networks Interactive, Inc. and subsidiaries as of December 31, 2009 and 2008, and the results of their operations and their cash flows for each of the three years in the period ended December 31, 2009, in conformity with accounting principles generally accepted in the United States of America. Also, in our opinion, such financial statement schedule, when considered in relation to the basic consolidated and combined financial statements taken as a whole, presents fairly, in all material respects, the information set forth therein.
As discussed in Note 1 to the consolidated and combined financial statements, prior to its separation from The E.W. Scripps Company (“E.W. Scripps”), the Company reflects the combined financial position, results of operations and cash flows of the Scripps Networks and Interactive Media businesses of E.W. Scripps. The combined financial statements also include allocations of certain general corporate overhead expenses from E.W. Scripps. These costs may not be reflective of the actual level of costs which would have been incurred had the Company operated as a separate, stand-alone public company apart from E.W. Scripps.
As disclosed in Note 3 and Note 5 to the consolidated and combined financial statements, the consolidated and combined financial statements have been adjusted for the retrospective application of Accounting Standards Codification (ASC) 810, Consolidation (formerly Statement of Financial Accounting Standards (SFAS) No. 160, Noncontrolling Interests in Consolidated Financial Statements), which became effective January 1, 2009 and the retrospective presentation of the Company’s uSwitch business as discontinued operations. Additionally, as discussed in Note 3 to the consolidated and combined financial statements, the Company adopted the provisions of ASC 740, Income Taxes (formerly FASB Interpretation No. 48 (“FIN 48”), Accounting for Uncertainty in Income Taxes an Interpretation of FASB Statement No. 109), effective January 1, 2007.
We have also audited, in accordance with the standards of the Public Company Accounting Oversight Board (United States), the Company's internal control over financial reporting as of December 31, 2009, based on the criteria established in Internal Control—Integrated Framework issued by the Committee of Sponsoring Organizations of the Treadway Commission and our report dated March 1, 2010 expressed an unqualified opinion on the Company’s internal control over financial reporting.
/s/ DELOITTE & TOUCHE LLP
Cincinnati, Ohio
March 1, 2010
F-18
Table of Contents
Scripps Networks Interactive, Inc.
Consolidated Balance Sheets
| As of December 31, | ||||||||
| ( in thousands, except share data ) |
2009 | 2008 | ||||||
| ASSETS |
||||||||
| Current assets: |
||||||||
| Cash and cash equivalents |
$ | 254,370 | $ | 9,970 | ||||
| Short-term investments |
2,703 | |||||||
| Accounts and notes receivable (less allowances - 2009, $5,587; 2008, $5,014) |
430,410 | 368,593 | ||||||
| Programs and program licenses |
271,773 | 238,319 | ||||||
| Assets of discontinued operations |
22,068 | |||||||
| Other current assets |
25,716 | 13,651 | ||||||
| Total current assets |
982,269 | 655,304 | ||||||
| Investments |
46,395 | 40,279 | ||||||
| Property, plant and equipment, net |
239,644 | 191,414 | ||||||
| Goodwill and other intangible assets: |
||||||||
| Goodwill |
670,494 | 424,213 | ||||||
| Other intangible assets, net |
681,312 | 103,628 | ||||||
| Total goodwill and other intangible assets, net |
1,351,806 | 527,841 | ||||||
| Other assets: |
||||||||
| Programs and program licenses (less current portion) |
255,839 | 235,967 | ||||||
| Unamortized network distribution incentives |
71,266 | 107,796 | ||||||
| Other non-current assets |
15,843 | 14,607 | ||||||
| Total other assets |
342,948 | 358,370 | ||||||
| Total Assets |
$ | 2,963,062 | $ | 1,773,208 | ||||
| LIABILITIES AND EQUITY |
||||||||
| Current liabilities: |
||||||||
| Accounts payable |
$ | 27,538 | $ | 13,231 | ||||
| Program rights payable |
20,350 | 15,240 | ||||||
| Customer deposits and unearned revenue |
16,865 | 11,045 | ||||||
| Accrued liabilities: |
||||||||
| Employee compensation and benefits |
43,377 | 35,259 | ||||||
| Accrued marketing and advertising costs |
13,477 | 16,695 | ||||||
| Liabilities of discontinued operations |
10,905 | |||||||
| Other accrued liabilities |
89,101 | 66,277 | ||||||
| Total current liabilities |
210,708 | 168,652 | ||||||
| Deferred income taxes |
119,515 | 131,903 | ||||||
| Long-term debt |
884,239 | 80,000 | ||||||
| Other liabilities (less current portion) |
99,662 | 104,239 | ||||||
| Total liabilities |
1,314,124 | 484,794 | ||||||
| Commitments and contingencies (Note 22) |
||||||||
| Redeemable noncontrolling interests (Note 17) |
113,886 | 9,400 | ||||||
| Equity: |
||||||||
| SNI shareholders’ equity: |
||||||||
| Preferred stock, $.01 par - authorized: 25,000,000 shares; none outstanding |
||||||||
| Common stock, $.01 par: |
||||||||
| Class A - authorized: 240,000,000 shares; issued and outstanding: 2009 - 129,443,195 shares; 2008 - 127,184,107 shares |
1,295 | 1,272 | ||||||
| Voting - authorized: 60,000,000 shares; issued and outstanding: 2009 - 36,338,226 shares; 2008 - 36,568,226 shares |
363 | 366 | ||||||
| Total |
1,658 | 1,638 | ||||||
| Additional paid-in capital |
1,271,209 | 1,219,930 | ||||||
| Retained earnings (deficit) |
113,853 | (120,774 | ) | |||||
| Accumulated other comprehensive income (loss) |
(3,004 | ) | 31,487 | |||||
| Total SNI shareholders’ equity |
1,383,716 | 1,132,281 | ||||||
| Noncontrolling interest |
151,336 | 146,733 | ||||||
| Total equity |
1,535,052 | 1,279,014 | ||||||
| Total Liabilities and Equity |
$ | 2,963,062 | $ | 1,773,208 | ||||
See notes to consolidated and combined financial statements.
F-19
Table of Contents
Scripps Networks Interactive, Inc.
Consolidated and Combined Statements of Operations
| For the years ended December 31, | ||||||||||||
| (in thousands, except per share data) |
2009 | 2008 | 2007 | |||||||||
| Operating Revenues: |
||||||||||||
| Advertising |
$ | 1,018,114 | $ | 1,007,631 | $ | 928,758 | ||||||
| Network affiliate fees, net |
326,467 | 277,370 | 235,248 | |||||||||
| Referral fees |
165,437 | 235,097 | 217,865 | |||||||||
| Other |
31,230 | 30,601 | 22,916 | |||||||||
| Total operating revenues |
1,541,248 | 1,550,699 | 1,404,787 | |||||||||
| Costs and Expenses: |
||||||||||||
| Employee compensation and benefits |
252,380 | 254,839 | 226,679 | |||||||||
| Programs and program licenses |
328,688 | 279,767 | 239,343 | |||||||||
| Marketing and advertising |
143,576 | 174,246 | 162,571 | |||||||||
| Other costs and expenses |
214,956 | 196,432 | 177,028 | |||||||||
| Total costs and expenses |
939,600 | 905,284 | 805,621 | |||||||||
| Depreciation, Amortization, and Losses: |
||||||||||||
| Depreciation |
58,555 | 45,426 | 36,717 | |||||||||
| Amortization of intangible assets |
22,915 | 20,911 | 29,396 | |||||||||
| Write-down of goodwill and other intangible assets |
243,700 | |||||||||||
| Losses on disposal of property, plant and equipment |
2,509 | 788 | 437 | |||||||||
| Total depreciation, amortization, and losses |
83,979 | 310,825 | 66,550 | |||||||||
| Operating income |
517,669 | 334,590 | 532,616 | |||||||||
| Interest expense |
(2,810 | ) | (14,207 | ) | (36,769 | ) | ||||||
| Travel Channel financing costs |
(12,118 | ) | ||||||||||
| Equity in earnings of affiliates |
18,626 | 15,498 | 17,603 | |||||||||
| Gains (losses) on repurchases of debt |
(26,380 | ) | 1,245 | |||||||||
| Miscellaneous, net |
(1,110 | ) | 804 | 2,261 | ||||||||
| Income from continuing operations before income taxes |
520,257 | 310,305 | 516,956 | |||||||||
| Provision for income taxes |
161,474 | 194,710 | 166,388 | |||||||||
| Income from continuing operations, net of tax |
358,783 | 115,595 | 350,568 | |||||||||
| Income (loss) from discontinued operations, net of tax |
26,091 | 353 | (394,441 | ) | ||||||||
| Net income (loss) |
384,874 | 115,948 | (43,873 | ) | ||||||||
| Less: net income attributable to noncontrolling interests |
85,548 | 92,391 | 82,534 | |||||||||
| Net income (loss) attributable to SNI |
$ | 299,326 | $ | 23,557 | $ | (126,407 | ) | |||||
| Basic income (loss) per share: |
||||||||||||
| Income from continuing operations attributable to SNI common shareholders |
$ | 1.66 | $ | .14 | $ | 1.64 | ||||||
| Income (loss) from discontinued operations attributable to SNI common shareholders |
.16 | .00 | (2.41 | ) | ||||||||
| Net income (loss) attributable to SNI common shareholders |
$ | 1.81 | $ | .14 | $ | (.77 | ) | |||||
| Diluted income (loss) per share: |
||||||||||||
| Income from continuing operations attributable to SNI common shareholders |
$ | 1.65 | $ | .14 | $ | 1.64 | ||||||
| Income (loss) from discontinued operations attributable to SNI common shareholders |
.16 | .00 | (2.41 | ) | ||||||||
| Net income (loss) attributable to SNI common shareholders |
$ | 1.81 | $ | .14 | $ | (.77 | ) | |||||
| Amounts attributable to SNI: |
||||||||||||
| Income from continuing operations |
$ | 273,235 | $ | 23,204 | $ | 268,034 | ||||||
| Income (loss) from discontinued operations |
26,091 | 353 | (394,441 | ) | ||||||||
| Net income (loss) attributable to SNI |
$ | 299,326 | $ | 23,557 | $ | (126,407 | ) | |||||
| Weighted average shares outstanding: |
||||||||||||
| Basic |
164,921 | 163,245 | 163,466 | |||||||||
| Diluted |
165,381 | 164,131 | 163,466 | |||||||||
Net income per share amounts may not foot since each is calculated independently.
See notes to consolidated and combined financial statements.
F-20
Table of Contents
Scripps Networks Interactive, Inc.
Consolidated and Combined Statements of Cash Flows
| For the years ended December 31, | ||||||||||||
| (in thousands) |
2009 | 2008 | 2007 | |||||||||
| Cash Flows from Operating Activities: |
||||||||||||
| Net income (loss) |
$ | 384,874 | $ | 115,948 | $ | (43,873 | ) | |||||
| Loss (income) from discontinued operations |
(26,091 | ) | (353 | ) | 394,441 | |||||||
| Depreciation and intangible assets amortization |
81,470 | 66,337 | 66,113 | |||||||||
| Write-down of goodwill and other intangible assets |
243,700 | |||||||||||
| Amortization of network distribution costs |
37,830 | 33,391 | 27,016 | |||||||||
| Losses (gains) on repurchases of debt |
26,380 | (1,245 | ) | |||||||||
| Programs and program licenses costs |
328,688 | 279,767 | 230,420 | |||||||||
| Equity in earnings of affiliates |
(18,626 | ) | (15,498 | ) | (17,603 | ) | ||||||
| Program payments |
(284,409 | ) | (280,893 | ) | (291,713 | ) | ||||||
| Capitalized network distribution incentives |
(7,455 | ) | (6,853 | ) | (10,085 | ) | ||||||
| Dividends received from equity investments |
21,702 | 9,774 | 5,365 | |||||||||
| Prepaid and accrued pension expense |
6,548 | 10,577 | 5,426 | |||||||||
| Deferred income taxes |
(22,983 | ) | 29,863 | 46,189 | ||||||||
| Stock and deferred compensation plans |
20,549 | 16,443 | 13,437 | |||||||||
| Changes in certain working capital accounts (excluding the effects of acquisitions): |
||||||||||||
| Accounts receivable |
(5,164 | ) | (13,974 | ) | (34,324 | ) | ||||||
| Other assets |
(4,346 | ) | (2,348 | ) | 2,967 | |||||||
| Accounts payable |
(1,609 | ) | 1,813 | (452 | ) | |||||||
| Accrued employee compensation and benefits |
6,483 | 7,229 | 4,104 | |||||||||
| Accrued income taxes |
13,710 | 10,500 | (4,910 | ) | ||||||||
| Other liabilities |
10,438 | (1,723 | ) | (16,416 | ) | |||||||
| Other, net |
(3,974 | ) | 7,987 | 9,885 | ||||||||
| Net cash provided by continuing operating activities |
537,635 | 538,067 | 384,742 | |||||||||
| Net cash provided by (used in) discontinued operating activities |
(15,296 | ) | 12,041 | (17,702 | ) | |||||||
| Net operating activities |
522,339 | 550,108 | 367,040 | |||||||||
| Cash Flows from Investing Activities: |
||||||||||||
| Additions to property, plant and equipment |
(90,006 | ) | (74,630 | ) | (60,329 | ) | ||||||
| Decrease (increase) in short-term investments |
3,084 | (4,167 | ) | |||||||||
| Purchase of subsidiary companies and noncontrolling interests |
(877,500 | ) | (9,034 | ) | (29,880 | ) | ||||||
| Purchase of long-term investments |
(3,385 | ) | (2,501 | ) | ||||||||
| Other, net |
(1,638 | ) | 1,312 | (452 | ) | |||||||
| Net cash used in continuing investing activities |
(969,445 | ) | (89,020 | ) | (90,661 | ) | ||||||
| Net cash provided by (used in) discontinued investing activities |
9,328 | (2,806 | ) | 47,852 | ||||||||
| Net investing activities |
(960,117 | ) | (91,826 | ) | (42,809 | ) | ||||||
| Cash Flows from Financing Activities: |
||||||||||||
| Proceeds from long-term debt |
884,239 | 80,000 | ||||||||||
| Payments on long-term debt (including dividend to E. W. Scripps in 2008) |
(80,000 | ) | (506,303 | ) | (261,282 | ) | ||||||
| Premium payment on repurchases of debt |
(22,517 | ) | ||||||||||
| Dividends paid |
(49,507 | ) | (24,554 | ) | ||||||||
| Dividends paid to noncontrolling interest |
(88,936 | ) | (82,657 | ) | (62,968 | ) | ||||||
| Change in parent company investment, net |
93,958 | (3,557 | ) | |||||||||
| Proceeds from employee stock options |
27,735 | 5,873 | ||||||||||
| Deferred loan costs |
(6,981 | ) | (820 | ) | ||||||||
| Other, net |
(2,374 | ) | 135 | |||||||||
| Net cash provided by (used in) continuing financing activities |
684,176 | (456,885 | ) | (327,807 | ) | |||||||
| Effect of exchange rate changes on cash and cash equivalents |
(1,998 | ) | (3,959 | ) | (2,853 | ) | ||||||
| Increase (decrease) in cash and cash equivalents |
244,400 | (2,562 | ) | (6,429 | ) | |||||||
| Cash and cash equivalents: |
||||||||||||
| Beginning of year |
9,970 | 12,532 | 18,961 | |||||||||
| End of year |
$ | 254,370 | $ | 9,970 | $ | 12,532 | ||||||
| Supplemental Cash Flow Disclosures: |
||||||||||||
| Interest paid, excluding amounts capitalized |
$ | 902 | $ | 13,043 | $ | 38,472 | ||||||
| Income taxes paid |
177,708 | 155,845 | 115,925 | |||||||||
See notes to consolidated and combined financial statements.
F-21
Table of Contents
Scripps Networks Interactive, Inc.
Consolidated and Combined Statements of Accumulated Other Comprehensive Income (Loss) and Shareholders’ Equity
| (in thousands, except share data) |
Common Stock |
Additional Paid-in Capital |
Retained Earnings (Deficit) |
Parent Company’s Net Investment |
Accumulated Other Comprehensive Income (Loss) |
Noncontrolling Interest |
Total Equity |
Redeemable Noncontrolling Interests (Temporary Equity) |
||||||||||||||||||||||
| Balance as of December 31, 2006 |
$ | 1,119,754 | $ | 43,923 | $ | 117,433 | $ | 1,281,110 | $ | 23,400 | ||||||||||||||||||||
| Net income (loss) generated prior to separation |
(126,407 | ) | 82,534 | (43,873 | ) | |||||||||||||||||||||||||
| Other comprehensive income (loss), net of tax: |
||||||||||||||||||||||||||||||
| Change in foreign currency translation, net of tax of ($1,185) |
8,248 | 8,248 | ||||||||||||||||||||||||||||
| Pension liability adjustment, net of tax of $6,301 |
(10,772 | ) | (10,772 | ) | ||||||||||||||||||||||||||
| Other comprehensive income (loss) |
(2,524 | ) | ||||||||||||||||||||||||||||
| Total comprehensive income (loss) |
(46,397 | ) | ||||||||||||||||||||||||||||
| Fin 48 transition adjustment |
(29,724 | ) | (29,724 | ) | ||||||||||||||||||||||||||
| Dividends paid to noncontrolling interest |
(62,968 | ) | (62,968 | ) | ||||||||||||||||||||||||||
| Net transfer from parent |
(13,635 | ) | (13,635 | ) | ||||||||||||||||||||||||||
| As of December 31, 2007 |
949,988 | 41,399 | 136,999 | 1,128,386 | 23,400 | |||||||||||||||||||||||||
| Net income generated prior to separation |
119,777 | 46,700 | 166,477 | |||||||||||||||||||||||||||
| Net income (loss) generated after separation |
$ | (96,220 | ) | 45,691 | (50,529 | ) | ||||||||||||||||||||||||
| Other comprehensive income (loss), net of tax: |
||||||||||||||||||||||||||||||
| Change in foreign currency translation, net of tax of $2,241 |
(14,311 | ) | (14,311 | ) | ||||||||||||||||||||||||||
| Pension liability adjustment, net of tax of ($2,043) |
4,399 | 4,399 | ||||||||||||||||||||||||||||
| Other comprehensive income (loss) |
(9,912 | ) | ||||||||||||||||||||||||||||
| Total comprehensive income (loss) |
106,036 | |||||||||||||||||||||||||||||
| Net transfer from parent |
552,966 | 552,966 | ||||||||||||||||||||||||||||
| Dividend to parent |
(430,306 | ) | (430,306 | ) | ||||||||||||||||||||||||||
| Distribution of SNI common stock to effect the spin-off |
$ | 1,635 | 1,635 | |||||||||||||||||||||||||||
| Transfer of net investment to additional paid-in-capital |
$ | 1,190,790 | (1,192,425 | ) | (1,635 | ) | ||||||||||||||||||||||||
| Dividends: declared and paid - $.15 per share |
(24,554 | ) | (24,554 | ) | ||||||||||||||||||||||||||
| Compensation plans, net: 278,274 shares issued; 17,109 shares repurchased; 16,297 shares forfeited |
3 | 16,627 | 16,630 | |||||||||||||||||||||||||||
| Tax benefits of compensation plans |
12 | 12 | ||||||||||||||||||||||||||||
| Reverse EITF D-98 adoption adjustments relating to FLN interest acquired |
7,501 | 1,499 | 9,000 | (9,000 | ) | |||||||||||||||||||||||||
| Purchase of additional interest in FLN |
(1,499 | ) | (1,499 | ) | ||||||||||||||||||||||||||
| Redeemable noncontrolling interest fair value adjustment |
5,000 | 5,000 | (5,000 | ) | ||||||||||||||||||||||||||
| Dividends paid to noncontrolling interest |
(82,657 | ) | (82,657 | ) | ||||||||||||||||||||||||||
| As of December 31, 2008 |
1,638 | 1,219,930 | (120,774 | ) | 31,487 | 146,733 | 1,279,014 | 9,400 | ||||||||||||||||||||||
| Net income (loss) |
299,326 | 93,223 | 392,549 | (7,675 | ) | |||||||||||||||||||||||||
| Other comprehensive income (loss), net of tax: |
||||||||||||||||||||||||||||||
| Foreign currency translations arising during period, net of tax of ($1,929) |
5,344 | 316 | 5,660 | (19 | ) | |||||||||||||||||||||||||
| Reclassification adjustment for foreign currency translation gains included in net income |
(44,423 | ) | (44,423 | ) | ||||||||||||||||||||||||||
| Pension liability adjustment, net of tax of ($3,036) |
4,588 | 4,588 | ||||||||||||||||||||||||||||
| Other comprehensive income (loss) |
(34,175 | ) | (19 | ) | ||||||||||||||||||||||||||
| Total comprehensive income (loss) |
358,374 | (7,694 | ) | |||||||||||||||||||||||||||
| Recognize redeemable noncontrolling interests from transactions |
99,505 | |||||||||||||||||||||||||||||
| Redeemable noncontrolling interests fair value adjustment |
2,517 | (15,192 | ) | (12,675 | ) | 12,675 | ||||||||||||||||||||||||
| Dividends paid to noncontrolling interest |
(88,936 | ) | (88,936 | ) | ||||||||||||||||||||||||||
| Dividends: declared and paid - $.30 per share |
(49,507 | ) | (49,507 | ) | ||||||||||||||||||||||||||
| Settlements with former parent for pre-separation adjustments |
3,696 | 3,696 | ||||||||||||||||||||||||||||
| Convert 230,000 Voting Shares to |
||||||||||||||||||||||||||||||
| Class A Common Shares |
||||||||||||||||||||||||||||||
| Compensation plans, net: 2,089,040 shares issued; 55,655 shares repurchased; 4,287 shares forfeited |
20 | 44,996 | 45,016 | |||||||||||||||||||||||||||
| Tax benefits of compensation plans |
70 | 70 | ||||||||||||||||||||||||||||
| As of December 31, 2009 |
$ | 1,658 | $ | 1,271,209 | $ | 113,853 | $ | $ | (3,004 | ) | 151,336 | 1,535,052 | $ | 113,886 | ||||||||||||||||
See notes to consolidated and combined financial statements.
F-22
Table of Contents
NOTES TO CONSOLIDATED AND COMBINED FINANCIAL STATEMENTS
1. Formation of the Company and Basis of Presentation
As used in the Notes to the Consolidated and Combined Financial Statements, the terms “we”, “our”, “us” or “the Company” may, depending on the context, refer to Scripps Networks Interactive, Inc., to one or more of its consolidated subsidiary companies or to all of them taken as a whole.
The Separation – On October 16, 2007, The E. W. Scripps Company (“E. W. Scripps”) announced that its Board of Directors had authorized E. W. Scripps management to pursue a plan to separate E. W. Scripps into two independent, publicly-traded companies (the “Separation”) through the spin-off of Scripps Networks Interactive, Inc. (“SNI”) to the E. W. Scripps shareholders. To effect the Separation, Scripps Networks Interactive, Inc., an Ohio corporation, was incorporated on October 23, 2007, as a wholly-owned subsidiary of E. W. Scripps. On June 30, 2008, the assets and liabilities of the Scripps Networks and Interactive Media businesses of E. W. Scripps were transferred to Scripps Networks Interactive, Inc. On July 1, 2008, the spin-off was completed upon E. W. Scripps distributing all of its shares of Scripps Networks Interactive to its common shareholders.
Description of Business – The Company operates in the media industry and has interests in national television networks and internet based media outlets. The Company’s reportable segments include Lifestyle Media and Interactive Services. The Lifestyle Media segment is anchored by two of America’s most-watched national television networks, HGTV and the Food Network as well as their affiliated Web sites, and also has popular lifestyle television and Internet brands DIY Network (“DIY”), Fine Living Network (“FLN”) (to be rebranded as the Cooking Channel), Great American Country (“GAC”) and, as of December 15, 2009, Travel Channel (“Travel”). The Interactive Services segment operates our online comparison shopping service, Shopzilla, and its related online comparison shopping brands, bizrate and beso. See Note 21- Segment Information for additional information about the Company’s reportable segments.
Basis of Presentation – The financial statements for periods prior to June 30, 2008 reflect the combined financial position, results of operations and cash flows of the Scripps Networks and Interactive Media businesses of E. W. Scripps. The financial statements for periods as of and subsequent to June 30, 2008 reflect the consolidated financial position, results of operations and cash flows for the Company. Various agreements between SNI and E. W. Scripps became effective as of July 1, 2008 as further described in Note 18—Related Party Transactions.
For periods prior to the July 1, 2008 Separation date, the combined statements of operations reflect certain general corporate overhead expenses and interest expenses allocated by E. W. Scripps to the Company. Management believes that such allocations are reasonable; however, they are not necessarily indicative of the actual results of the Company had the Company been operating as a separate, stand-alone public company for the periods presented.
Use of Estimates – The preparation of financial statements in accordance with accounting principles generally accepted in the United States of America requires us to make a variety of decisions that affect the reported amounts and the related disclosures. Such decisions include the selection of accounting principles that reflect the economic substance of the underlying transactions and the assumptions on which to base accounting estimates. In reaching such decisions, we apply judgment based on our understanding and analysis of the relevant circumstances, including our historical experience, actuarial studies and other assumptions.
Our financial statements include estimates and assumptions used in accounting for pension plans, determining the periods over which long-lived assets are depreciated or amortized as well as the fair value of such long-lived assets, evaluating the collectability of accounts receivable, recognizing certain revenues and accounting for income taxes.
While we re-evaluate our estimates and assumptions on an ongoing basis, actual results could differ from those estimated at the time of preparation of the financial statements.
Principles of Consolidation – The consolidated financial statements include the accounts of Scripps Networks Interactive, Inc. and its majority-owned subsidiary companies after elimination of intercompany accounts and transactions. Consolidated subsidiary companies include general partnerships and limited liability companies in which more than a 50% residual interest is owned. Investments in 20%-to-50%-owned companies and partnerships or companies and partnerships in which we exercise significant influence over the operating and financial policies are accounted for using the equity method. We do not hold any interests in variable interest entities. The results of companies acquired or disposed of are included in the consolidated and combined financial statements from the effective date of acquisition or up to the date of disposal.
Concentration Risks – Approximately 80% of our operating revenues are derived from marketing services, including advertising and referral fees. Operating results can be affected by changes in the demand for such services both nationally and in individual markets.
The six largest cable television systems and the two largest satellite television systems provide service to more than 95% of homes receiving HGTV and Food Network. The loss of distribution by any of these cable and satellite television systems could adversely affect our business.
We are currently operating under an agreement with a general search engine that generates approximately 30% of our referral fee revenues. Our revenues could be affected if this agreement is not renewed upon expiration or if the agreement is not renewed on similar terms.
F-23
Table of Contents
Foreign Currency Translation – Substantially all of our international subsidiaries use the local currency of their respective country as their functional currency. Assets and liabilities of such international subsidiaries are translated using end-of-period exchange rates while results of operations are translated based on the average exchange rates throughout the year. Equity is translated at historical exchange rates, with the resulting cumulative translation adjustment included as a component of accumulated other comprehensive income (loss) in shareholders’ equity, net of applicable taxes.
Monetary assets and liabilities denominated in currencies other than the functional currency are remeasured into the functional currency using end-of-period exchange rates. Gains or losses resulting from such remeasurement are recorded in income. Foreign exchange gains and losses are included in Miscellaneous, net in the consolidated and combined statements of operations.
2. Summary of Significant Accounting Policies
Cash and Cash Equivalents – Cash and cash equivalents consist of cash on hand and marketable securities with an original maturity of less than three months. Cash equivalents are carried at cost plus accrued income, which approximates fair value.
Trade Receivables – We extend credit to customers based upon our assessment of the customer’s financial condition. Collateral is generally not required from customers. Allowances for credit losses are generally based upon trends, economic conditions, review of aging categories, specific identification of customers at risk of default and historical experience.
Investments – The Company maintains investments in certain private companies. The value of these investments can be impacted by various market risks, including interest rate risk, credit risk and overall market volatility.
Property, Plant and Equipment – Property, plant and equipment, which includes internal use software, is carried at historical cost less depreciation. Costs incurred in the preliminary project stage to develop or acquire internal use software or Internet sites are expensed as incurred. Upon completion of the preliminary project stage and upon management authorization of the project, costs to acquire or develop internal use software, which primarily include coding, designing system interfaces, and installation and testing, are capitalized if it is probable the project will be completed and the software will be used for its intended function. Costs incurred after implementation, such as maintenance and training, are expensed as incurred.
Depreciation is computed using the straight-line method over estimated useful lives as follows:
| Buildings and improvements | 35 years | |
| Leasehold improvements | Term of lease or useful life | |
| Program production equipment | 3 to 15 years | |
| Computer hardware and software | 3 to 5 years | |
| Office and other equipment | 3 to 10 years |
Programs and Program Licenses – Programming is either produced by us or for us by independent production companies, or is licensed under agreements with independent producers.
Costs of programs produced by us or for us include capitalizable direct costs, production overhead, development costs and acquired production costs. Costs to produce live programming that is not expected to be rebroadcast are expensed as incurred. Production costs for programs produced by us or for us are capitalized. Production costs for television series are charged to expense over estimated useful lives based upon expected future cash flows. Estimated future cash flows can change based upon market acceptance, advertising and network affiliate fee rates, the number of cable and satellite television subscribers receiving our networks and program usage. Accordingly, we periodically review revenue estimates and planned usage and revise our assumptions if necessary. If actual demand or market conditions are less favorable than projected, a write-down to fair value may be required. Development costs for programs that we have determined will not be produced are written off.
Program licenses generally have fixed terms, limit the number of times we can air the programs and require payments over the terms of the licenses. Licensed program assets and liabilities are recorded when the programs become available for broadcast. Program licenses are not discounted for imputed interest. Program licenses are amortized based upon expected cash flows over the term of the license agreement.
Programs and program licenses are reviewed for impairment using a day-part methodology. A day-part is defined as an aggregation of programs broadcast during a particular time of day or programs of a similar type. Our day-parts are: early morning, daytime, late night, and primetime. The net realizable value of programs and program licenses is calculated by estimating the planned future airings of a program and the related day-part in which it is aired to determine an estimate of the remaining revenues to be earned by the program. Estimates are based upon a program’s current ratings as well as assumptions about future market acceptance. If actual demand or market conditions are less favorable than our projections, programming cost write-downs may be required.
The portion of the unamortized balance expected to be amortized within one year is classified as a current asset.
Program rights liabilities payable within the next twelve months are included in accounts payable. Noncurrent program rights liabilities are included in other noncurrent liabilities. The carrying value of our program rights liabilities approximate fair value.
Goodwill – Goodwill represents the cost of acquisitions in excess of the fair value of the acquired businesses’ tangible assets and separately identifiable intangible assets acquired. Goodwill is not amortized but is reviewed for impairment at least annually at the reporting unit level. We perform our annual impairment review during the fourth quarter. A reporting unit is defined as operating segments or groupings of businesses one level below the operating segment level. The
F-24
Table of Contents
Company’s reporting units are Lifestyle Media and Interactive Services.
Amortizable Intangible Assets–The Company’s amortizable intangible assets consist, mainly, of the value assigned to acquired network distribution relationships, customer lists and trade names.
Network distribution intangible assets represent the value assigned to an acquired programming service’s relationships with cable and satellite television systems that distribute its programs. These relationships and distribution provide the opportunity to deliver advertising to viewers. We amortize these contractual relationships on a straight line basis, over the terms of the distribution contracts and expected renewal periods, which approximates 20 years.
Customer lists, trade names and other intangible assets are amortized in relation to their expected future cash flows over estimated useful lives of up to 20 years.
Impairment of Long-Lived Assets–Long-lived assets (primarily property, plant and equipment, amortizable intangible assets and network distribution incentives) are reviewed for impairment whenever events or circumstances indicate the carrying amounts of the assets may not be recoverable. Recoverability is determined by comparing the forecasted undiscounted cash flows of the operation to which the assets relate to the carrying amount of the assets. If the undiscounted cash flow is less than the carrying amount of the assets, then amortizable intangible assets are written down first, followed by other long-lived assets of the operation, to fair value. Fair value is determined based on a combination of discounted cash flows, market multiples and other indicators. Long-lived assets to be disposed of are reported at the lower of carrying amount or fair value less costs to sell.
Income Taxes – Consolidated subsidiary companies include general partnerships and limited liability companies which are treated as partnerships for tax purposes. Income taxes on partnership income and losses accrue to the individual partners. Accordingly, our financial statements do not include a provision (benefit) for income taxes on the non-controlling partners’ share of the income (loss) of those consolidated subsidiary companies.
No provision for U.S. or foreign income taxes that could result from remittance of undistributed earnings of our foreign subsidiaries has been made as management intends to reinvest these earnings outside the United States indefinitely.
Deferred income taxes are provided for temporary differences between the tax basis and reported amounts of assets and liabilities that will result in taxable or deductible amounts in future years. Our temporary differences primarily result from accelerated depreciation and amortization for tax purposes, investment gains and losses not yet recognized for tax purposes and accrued expenses not deductible for tax purposes until paid. A valuation allowance is provided if it is more likely than not that some or all of the deferred tax assets will not be realized.
We report a liability for unrecognized tax benefits resulting from uncertain tax positions taken or expected to be taken in a tax return. Interest and penalties associated with such tax positions are included in the tax provision. The liability for additional taxes and interest is included in Other Long-term Obligations.
Revenue Recognition – Revenue is recognized when persuasive evidence of a sales arrangement exists, delivery occurs or services are rendered, the sales price is fixed or determinable and collectability is reasonably assured. Revenue is reported net of our remittance of sales taxes, value added taxes and other taxes collected from our customers.
Our primary sources of revenue are from:
| • | The sale of television and Internet advertising. |
| • | Referral fees from retailers. |
| • | Fees for programming services (“network affiliate fees”). |
Revenue recognition policies for each source of revenue are described below.
Advertising: Advertising revenue is recognized, net of agency commissions, when the advertisements are displayed. Internet advertising includes fixed duration campaigns whereby a banner, text or other advertisement appears for a specified period of time for a fee, impression-based campaigns where the fee is based upon the number of times the advertisement appears in Web pages viewed by a user, and click-through based campaigns where the fee is based upon the number of users who click on an advertisement and are directed to the advertisers’ Web site. Advertising revenue from fixed duration campaigns are recognized over the period in which the advertising appears. Internet advertising revenue that is based upon the number of impressions delivered or the number of click-throughs is recognized as impressions are delivered or click-throughs occur.
Advertising contracts may guarantee the advertiser a minimum audience for the programs in which their advertisements are broadcast over the term of the advertising contracts. We provide the advertiser with additional advertising time if we do not deliver the guaranteed audience size. The amount of additional advertising time is generally based upon the percentage shortfall in audience size. If we determine we have not delivered the guaranteed audience, an accrual for “make-good” advertisements is recorded as a reduction of revenue. The estimated make-good accrual is adjusted throughout the terms of the advertising contracts.
Referral fees: Referral fee revenue is recorded based upon the terms of the agreements with participating retailers. Referral fees that are based upon click-throughs to the retailers’ Web sites are recognized when the click-through occurs.
Network Affiliate Fees: Cable and satellite television systems generally pay a per-subscriber fee (“network affiliate fees”) for the right to distribute our programming under the terms of long-term distribution contracts. Network affiliate fees are reported net of volume discounts earned by cable and satellite television system operators and net of incentive costs offered to system operators in exchange for initial long-term distribution contracts. Such incentives may include an initial period in which the payment of network affiliate fees by the system is waived (“free period”), cash payments to system operators (“network launch incentives”), or both. We recognize network affiliate fees as revenue
F-25
Table of Contents
over the terms of the contracts, including any free periods. Network launch incentives are capitalized as assets upon launch of our programming on the cable or satellite television system and are amortized against network affiliate fees based upon the ratio of each period’s revenue to expected total revenue over the terms of the contracts.
Network affiliate fees due to us, net of applicable discounts, are reported to us by cable and satellite television systems. Such information is generally not received until after the close of the reporting period. Therefore, reported network affiliate fee revenues are based upon our estimates of the number of subscribers receiving our programming and the amount of volume-based discounts each cable and satellite television provider is entitled to receive. We subsequently adjust these estimated amounts based upon the actual amounts of network affiliate fees received.
Marketing and Advertising Costs – Marketing and advertising costs include costs incurred to promote our businesses and to attract traffic to our Internet sites. Advertising production costs are deferred and expensed the first time the advertisement is shown. Other marketing and advertising costs are expensed as incurred.
Stock-Based Compensation – We have a Long-Term Incentive Plan (the “Plan”) which is described more fully in Note 23 -Capital Stock and Stock Compensation Plans. The Plan provides for the award of incentive and nonqualified stock options, stock appreciation rights, restricted and unrestricted Class A Common shares and performance units to key employees and non-employee directors.
Compensation cost is based on the grant-date fair value of the award. The fair value of awards that grant the employee the right to the appreciation of the underlying shares, such as stock options, is measured using a binomial lattice model. The fair value of awards that grant the employee the underlying shares is measured by the fair value of a Class A Common share.
Certain awards of Class A Common shares have performance conditions under which the number of shares granted is determined by the extent to which such performance conditions are met (“Performance Shares”). Compensation costs for such awards are measured by the grant-date fair value of a Class A Common share and the number of shares earned. In periods prior to completion of the performance period, compensation costs are based upon estimates of the number of shares that will be earned.
Compensation costs, net of estimated forfeitures due to termination of employment or failure to meet performance targets, are recognized on a straight-line basis over the requisite service period of the award. The requisite service period is generally the vesting period stated in the award. However, because stock compensation grants vest upon the retirement of the employee, grants to retirement-eligible employees are expensed immediately and grants to employees who will become retirement eligible prior to the end of the stated vesting period are expensed over such shorter period.
Net Income Per Share – The computation of basic earnings per share (“EPS”) is calculated by dividing earnings available to common shareholders by the weighted-average number of common shares outstanding. Diluted EPS is similar to basic EPS, but adjusts for the effect of the potential issuance of common shares. The calculation of basic and diluted EPS and shares outstanding for the periods presented prior to July 1, 2008 is based on the number of shares outstanding at June 30, 2008. There is no dilutive impact from common stock equivalents for periods prior to July 1, 2008, as we had no dilutive equity awards outstanding. The dilutive effect of our share-based awards issued in connection with the conversion (refer to Note 23— Capital Stock and Stock Compensation Plans for further discussion of conversion of E. W. Scripps awards upon separation) and for future Company grants are included in the computation of diluted EPS in periods subsequent to June 30, 2008.
The following table presents information about basic and diluted weighted-average shares outstanding:
| For the years ended December 31, | ||||||
| (in thousands) |
2009 | 2008 | 2007 | |||
| Basic weighted-average shares outstanding |
164,921 | 163,245 | 163,466 | |||
| Effect of dilutive securities: |
||||||
| Unvested restricted stock and share units held by employees |
147 | 344 | ||||
| Stock options held by employees and directors |
313 | 542 | ||||
| Diluted weighted-average shares outstanding |
165,381 | 164,131 | 163,466 | |||
| Anti-dilutive stock securities |
6,214 | 13,245 | ||||
3. Accounting Standards Updates and Recently Issued Accounting Standards Updates
Accounting Standards Updates
In June 2009, the Financial Accounting Standards Board (“FASB”) issued its final Financial Accounting Standard (“FAS”) No. 168, “The FASB Accounting Standards Codification and the Hierarchy of Generally Accepted Accounting Principles—A Replacement of FAS No. 162” (“FAS 168”). FAS 168 made the FASB Accounting Standards Codification (“ASC”), collectively known as the “Codification”, the single source of authoritative U.S. GAAP used by nongovernmental entities in the preparation
F-26
Table of Contents
of financial statements, except for rules and interpretive releases of the Securities and Exchange Commission (“SEC”), which are also sources of authoritative GAAP for SEC registrants. The Codification is meant to simplify user access to all authoritative accounting guidance by reorganizing U.S. GAAP pronouncements into accounting topics within a consistent structure. FAS 168 was effective for the Company July 1, 2009 and supersedes all then-existing non-SEC accounting and reporting standards. Following FAS 168, the FASB will not issue new standards in the form of FASs, Staff Positions or Emerging Issues Task Force Abstracts; instead, the FASB will issue Accounting Standards Updates (“ASU”). The FASB will not consider ASUs as authoritative in their own right; these updates will serve only to update the Codification, provide background information about the guidance, and provide the bases for conclusions on the change(s) in the Codification. The Codification is organized by topic, subtopic, section, and paragraph, each of which is identified by a numerical designation. All accounting references have been updated, and therefore FAS references have been replaced with ASC references.
In December 2007, an update was made to the Consolidation Topic, ASC 810 (“ASC 810 Update”), which establishes accounting and reporting standards for the noncontrolling interest in a subsidiary and also requires that a retained noncontrolling interest upon the deconsolidation of a subsidiary be initially measured at its fair value. We adopted the ASC 810 Update on January 1, 2009 and reported our noncontrolling interests (previously reported as minority interest liability) as a separate component of shareholders’ equity. Net income allocable to the noncontrolling interests and net income attributable to the shareholders of the Company are also presented separately in the consolidated and combined statements of operations. The ASC 810 Update also requires retrospective adoption of the presentation and disclosure requirements for existing noncontrolling interests; while all other requirements of the update are to be applied prospectively.
The December 2007 ASC 810 Update also provides transition guidance for the Distinguishing Liabilities from Equity Topic, ASC 480 (“ASC 480 Transition”). The ASC 480 Transition guidance is applicable for all noncontrolling interests where the Company is subject to a put option under which it may be required to repurchase an interest in a consolidated subsidiary from the noncontrolling interest holder. As of January 1, 2009, the Company was subject to a redeemable put option for a residual interest in Fine Living Network (“FLN”). The ASC 480 Transition guidance requires these redemption rights to be recorded retrospectively for all periods presented with the offset being recorded against a company’s additional paid-in capital or retained earnings balance. As a result of adoption, our consolidated balance sheet at January 1, 2009, included a redeemable noncontrolling interest balance of $9.4 million.
F-27
Table of Contents
In December 2007, an update was made to the Business Combinations Topic, ASC 805 (“ASC 805 Update”), which provides guidance relating to recognition of assets acquired and liabilities assumed in a business combination and establishes expanded disclosure requirements for business combinations. The update was effective for fiscal years beginning after December 15, 2008. The update is to be applied prospectively to business combinations that occur subsequent to our January 1, 2009 effective date except for the accounting for valuation allowances on deferred taxes and acquired tax contingencies associated with acquisitions. The ASC 805 Update also amends the Accounting for Income Taxes Topic, ASC 740, such that adjustments made to valuation allowances on deferred taxes and acquired tax contingencies associated with acquisitions that closed prior to the ASC 805 Update effective date would also apply the provisions of ASC 805. We applied the ASC 805 Update to all of our 2009 business combinations, including the Travel Channel acquisition (refer to Note 4— Acquisitions for further discussion on the Travel Channel acquisition).
In December 2008, an update was made to the Retirement Benefits Topic, ASC 715, which provides guidance on an employer’s disclosures about plan assets of a defined benefit pension or other postretirement plan. The required disclosures about plan assets are effective for fiscal years ending after December 15, 2009. The Company implemented the update as of December 31, 2009 (see Note 19—Employee Benefit Plans).
In 2006, an update was made to the Accounting for Income Taxes Topic, ASC 740 (“ASC 740 Update”), which clarified the accounting for tax positions recognized in the financial statements. The update provides guidance on the financial statement recognition and measurement of a tax position taken or expected to be taken in a tax return. The update also provides guidance on de-recognition, classification, interest and penalties, accounting in interim periods, disclosures, and transition. The adoption of the update as of January 1, 2007 reduced shareholders’ equity $29.7 million.
In September 2006, an update was made to the Fair Value Measurements and Disclosures Topic, ASC 820 (“September 2006 Update”), which defines fair value, establishes a framework for measuring fair value, and expands disclosures about fair value measurements. In February 2008, an update (“February 2008 Update”) to delay the September 2006 Update was made which delayed the effective date for non-financial assets and liabilities, except for those that are recognized at fair value in the financial statements on a recurring basis, until January 1, 2009. Under the provisions of the February 2008 Update, we delayed the adoption of the September 2006 Update for fair value measurements used in the impairment testing of goodwill and indefinite-lived intangible assets and eligible non-financial assets and liabilities included within a business combination. The adoption of the September 2006 Update did not have a material impact on our consolidated and combined financial statements.
In June 2008, an update was made to the Earnings Per Share Topic, ASC 260, which addresses whether instruments granted in share-based payment transactions are participating securities prior to vesting and, therefore, need to be included in the earnings allocation in computing EPS under the two-class method. In addition, prior-period EPS data would be adjusted retrospectively. The update was effective for us on January 1, 2009 and the adoption of the update did not have a material impact on our consolidated and combined financial statements.
F-28
Table of Contents
Recently Issued Accounting Standards Updates
In June 2009, an update was issued to the Consolidation Topic, ASC 810, which changes how a reporting entity determines when an entity that is insufficiently capitalized or is not controlled through voting (or similar rights) should be consolidated. The determination of whether a reporting entity is required to consolidate another entity is based on, among other things, the other entity’s purpose and design and the reporting entity’s ability to direct the activities of the other entity that most significantly impact the other entity’s economic performance. The update also requires ongoing assessments as to whether an entity is the primary beneficiary of an entity (previously, reconsideration was only required upon the occurrence of specific events). The update will require a reporting entity to provide additional disclosures about its involvement with variable interest entities and any significant changes in risk exposure due to that involvement. A reporting entity will be required to disclose how its involvement with a variable interest entity affects the reporting entity’s financial statements. The update is effective for fiscal years beginning after November 15, 2009, and interim periods within those fiscal years. This update will be effective for us on January 1, 2010 and we are currently evaluating the impact of this update on our consolidated and combined financial statements.
In January 2010, an update was issued to the Fair Value Measurements Disclosures Topic, ASC 820, which requires new disclosures for fair value measurements and provides clarification for existing disclosures requirements. More specifically, this update will require (a) an entity to disclose separately the amounts of significant transfers in and out of Levels 1 and 2 fair value measurements and to describe the reasons for the transfers; and (b) information about purchases, sales, issuances and settlements to be presented separately (i.e. present the activity on a gross basis rather than net) in the reconciliation for fair value measurements using significant unobservable inputs (Level 3 inputs). This update clarifies existing disclosure requirements for the level of disaggregation used for classes of assets and liabilities measured at fair value and requires disclosures about the valuation techniques and inputs used to measure fair value for both recurring and nonrecurring fair value measurements using Level 2 and Level 3 inputs. This update will be effective for us on April 1, 2010 and we do not anticipate that the adoption of this statement will materially expand our consolidated and combined financial statement footnote disclosures.
4. Acquisitions
2009– On December 15, 2009 we acquired a 65 percent controlling interest in the Travel Channel. The transaction was structured as a leveraged joint venture between SNI and Cox TMI, Inc., a wholly owned subsidiary of Cox Communications, Inc. (“Cox”). Pursuant to the terms of the transaction, Cox contributed the Travel Channel, valued at $975 million, and SNI contributed $181 million in cash to a newly created partnership. The partnership also completed a private placement of $885 million aggregate principal amount of notes (“Senior Notes”) that were guaranteed by SNI. Cox has agreed to indemnify SNI for payments made in respect of SNI’s guarantee (see Note 15—Long-Term Debt for additional details). Proceeds from the issuance of the Senior Notes totaling $877.5 million were distributed to Cox. In connection with the transaction, SNI received a 65% controlling interest in Travel Channel and Cox retained a 35% non-controlling interest in the business. This transaction provides a unique opportunity to meaningfully expand SNI’s portfolio into a lifestyle category that’s highly desirable to media consumers, advertisers and programming distributors. As part of the transaction, the partnership incurred financing and transaction related costs of approximately $22.3 million. Approximately $10.2 million of these costs is included in the caption other costs and expenses and $12.1 million are included in the caption Travel Channel financing costs in our consolidated and combined statement of operations for the year ended December 31, 2009. Debt issuance costs of $6.1 million were incurred in connection with the issuance of the Senior Notes and were capitalized in the caption other assets in our consolidated balance sheet.
Pending the finalization of a third-party valuation, the following table summarizes the preliminary allocation amounts for the Travel Channel assets acquired and liabilities assumed recognized at the closing date, as well as the fair value at the closing date of the noncontrolling interest.
| 2009 | ||||
| (in thousands) |
Travel Channel |
|||
| Accounts receivable |
$ | 54,066 | ||
| Other current assets |
352 | |||
| Programs and program licenses |
80,979 | |||
| Property, plant and equipment |
17,350 | |||
| Amortizable intangible assets |
598,257 | |||
| Other assets |
117 | |||
| Current liabilities |
(20,226 | ) | ||
| Other long-term obligations |
(2,176 | ) | ||
| Total identifiable net assets |
728,719 | |||
| Goodwill |
246,281 | |||
| Fair value of Travel Channel net assets |
975,000 | |||
| Noncontrolling interest |
(97,500 | ) | ||
| Total consideration distributed to Cox |
$ | 877,500 | ||
The goodwill of $246.3 million arising from the acquisition consists largely of the synergies and economies of scale expected from combining the operations of SNI and Travel Channel. All of the goodwill was assigned to SNI’s Lifestyle Media segment and is expected to be deductible for income tax purposes.
We determine deferred taxes with regard to investments in partnerships based on the difference between the outside tax basis and the investment account balance. At the time of this transaction there was no outside basis difference and, therefore, no corresponding deferred tax asset or liability was recognized as an adjustment to the aggregate fair value of the Travel Channel net assets.
Although the Travel Channel transaction did not result in a step up of the tax basis of Travel Channel’s assets, through special partnership allocations, we will receive tax deductions
F-29
Table of Contents
generally equivalent in amount to the deductions that would have resulted from a step up in tax basis.
The following table presents the amounts of Travel’s revenue and earnings included in SNI’s consolidated and combined statement of operations for the year ended December 31, 2009, and the revenue and income from continuing operations of the combined entity had the acquisition date been January 1, 2009, or January 1, 2008. These pro forma results include adjustments for interest expense that would have been incurred to finance the transaction and reflect purchase accounting adjustments for additional amortization expense on acquired intangible assets. The pro forma results exclude the $22.3 million of financing and other transaction related costs that were expensed in conjunction with the transaction. The pro forma information is not necessarily indicative of the results that would have occurred had the acquisition been completed at the beginning of each period.
| (in thousands) (unaudited) |
Revenue | Income (loss) from continuing operations attributable to SNI |
Earnings per SNI common shareholders | |||||||
| Actual from 12/15/2009 - 12/31/2009 |
$ | 11,481 | $ | (4,450 | ) | |||||
| Supplemental pro forma 1/1/2009 - 12/31/2009 |
1,758,119 | 269,679 | $ | 1.63 | ||||||
| Supplemental pro forma 1/1/2008 - 12/31/2008 |
1,760,580 | 17,683 | 0.11 | |||||||
Pro forma results are not presented for all other acquisitions completed during 2009, 2008 and 2007 because the consolidated and combined results of operations would not be significantly different from reported amounts.
2008 – In the third quarter, we acquired an additional 4% interest in FLN increasing our residual ownership interest to approximately 94%.
2007 – In July 2007, we reached an agreement to acquire Fum Machineworks, Inc. d/b/a Recipezaar.com, a user-generated recipe and community site featuring more than 230,000 recipes, for cash consideration of approximately $25 million. We also acquired Incando Corporation d/b/a Pickle.com, a Web site that enables users to easily organize and share photos and videos from any camera or mobile phone device, for cash consideration of approximately $4.7 million. These acquisitions are part of our broader strategy at SNI to move our online businesses beyond extensions of our networks to become multi-branded, user-centric applications that create communities of online consumers in the home, food and lifestyle categories.
The following table summarizes the fair values of the assets acquired and liabilities assumed recognized at the acquisition date for certain of our acquisitions. The allocation of these purchase prices reflects final values assigned which may differ from preliminary values reported in the financial statements for prior periods.
| 2007 | ||||
| (in thousands) |
Recipezaar/ Pickle |
|||
| Accounts receivable |
$ | 135 | ||
| Other current assets |
95 | |||
| Property, plant and equipment |
4,787 | |||
| Amortizable intangible assets |
6,640 | |||
| Current liabilities |
(71 | ) | ||
| Deferred income tax liability |
(1,865 | ) | ||
| Total identifiable net assets |
$ | 9,721 | ||
| Goodwill |
20,193 | |||
| Net purchase price |
$ | 29,914 | ||
5. Discontinued Operations
During the second quarter of 2009, the board of directors authorized management to pursue the sale of our uSwitch business, which culminated in the sale of the operations of uSwitch during the fourth quarter of 2009 for approximately $10.3 million in cash.
During 2006 and 2007, we completed the sales of our Shop At Home business and its related Shop At Home-affiliated broadcast television stations.
These businesses’ assets, liabilities and results of operations have been retrospectively presented as discontinued operations within our consolidated and combined financial statements for all periods presented. The results of our uSwitch business have also been excluded from Interactive Services’ segment results for all periods presented.
Operating results of our discontinued operations were as follows:
| For the years ended December 31, | ||||||||||||
| (in thousands) |
2009 | 2008 | 2007 | |||||||||
| Operating revenues: |
||||||||||||
| uSwitch |
$ | 22,732 | $ | 39,938 | $ | 36,478 | ||||||
| Shop At Home |
1,323 | |||||||||||
| Total operating revenues |
$ | 22,732 | $ | 39,938 | $ | 37,801 | ||||||
| Income (loss) from discontinued operations, before tax: |
||||||||||||
| uSwitch: |
||||||||||||
| Income (loss) |
$ | (4,131 | ) | $ | (986 | ) | $ | (438,403 | ) | |||
| Gain on divestiture |
28,668 | |||||||||||
| Total uSwitch |
24,537 | (986 | ) | (438,403 | ) | |||||||
| Shop At Home |
891 | |||||||||||
| Income (loss) from discontinued operations, before tax |
24,537 | (986 | ) | (437,512 | ) | |||||||
| Income taxes (benefit) |
(1,554 | ) | (1,339 | ) | (43,071 | ) | ||||||
| Income (loss) from discontinued operations, net of tax |
$ | 26,091 | $ | 353 | $ | (394,441 | ) | |||||
F-30
Table of Contents
The gain on the uSwitch divestiture reflects the recognition of $44.4 million in foreign currency translation gains that were previously recognized in equity as a component of accumulated other comprehensive income. The foreign currency translation gain was partially offset by a $6.8 million charge recorded for lease obligations we retained in the sale and an $8.9 million loss that was recognized on the sale of uSwitch’s net assets.
Operating results of our discontinued operations in 2007 include a non-cash charge of $411 million to write-down uSwitch’s goodwill and intangible assets. In 2007, we also changed our estimate of the realizable value of certain uSwitch tax benefits recorded in prior periods. Loss from discontinued operations was increased by $9.5 million.
6. Transaction Costs and Other Charges and Credits
Income from continuing operations was affected by the following:
2009 – During the fourth quarter of 2009, we incurred financing and other transaction related costs of $22.3 million associated with our acquisition of a 65% controlling interest in the Travel Channel and $4.0 million of costs related to international investments. These items reduced net income attributable to SNI $13.9 million.
During the fourth quarter of 2009, we announced that FLN will be rebranded as The Cooking Channel. The Cooking Channel rebranding is expected to be completed in the second quarter of 2010. As a result of the decision to rebrand FLN, we completed an analysis of FLN’s programming library and recorded a non-cash charge of $21.1 million in the fourth quarter of 2009 to write-off of FLN’s programming rights. The charge reduced net income attributable to SNI $12.1 million.
Our tax provision in 2009 includes adjustments that were primarily attributed to differences identified between our prior year tax provision and tax returns. Net income attributable to SNI was increased by $10.6 million.
2008 – In conjunction with impairment tests of goodwill and intangible assets, we determined that the carrying value of our Shopzilla business exceeded its fair value. Accordingly, our 2008 results included a write-down of Shopzilla goodwill totaling and reducing net income attributable to SNI by $244 million.
As a result of the distribution of SNI to the shareholders of E. W. Scripps, SNI employees holding share-based equity awards, including share options and restricted shares, received modified awards in our Company’s stock. Under share-based equity accounting guidance, the adjustment to the outstanding share-based equity awards is considered a modification and incremental stock-based compensation expense is recognized to the extent that the fair value of the awards immediately prior to the modification is less than the fair value of the awards immediately after the modification. In 2008, we recorded a non-cash charge of $4.9 million related to the modification of these stock-based awards. Net income attributable to SNI was reduced by $3.2 million.
In the second quarter of 2008, E. W. Scripps redeemed their outstanding notes which were previously allocated to us in our combined financial statements. The associated loss on extinguishment from such redemption, which was not deductible for income tax purposes, has been allocated to us in our statement of operations resulting in a reduction to net income attributable to SNI of $26.4 million.
7. Income Taxes
We file a consolidated U.S. federal income tax return, unitary tax returns in certain states, and separate state income tax returns for certain of our subsidiary companies in other states. Included in our federal and state income tax returns is our proportionate share of the taxable income or loss of partnerships and limited liability companies that are treated as partnerships for tax purposes (“pass-through entities”). Our financial statements do not include any provision (benefit) for income taxes on the income (loss) of pass-through entities attributed to the non-controlling interests.
Food Network is operated under the terms of a general partnership agreement. FLN and the Travel Channel are Limited Liability companies and are treated as partnerships for tax purposes.
A reconciliation of amounts included in income from continuing operations before income taxes and the income (loss) allocated to us for tax purposes is as follows:
| For the years ended December 31, | |||||||||
| (in thousands) |
2009 | 2008 | 2007 | ||||||
| Income allocated to SNI |
$ | 430,923 | $ | 217,698 | $ | 434,273 | |||
| Income of pass-through entities allocated to non-controlling interests |
89,334 | 92,607 | 82,683 | ||||||
| Income from continuing operations before income taxes |
$ | 520,257 | $ | 310,305 | $ | 516,956 | |||
F-31
Table of Contents
The provision for income taxes consisted of the following:
| For the years ended December 31, | ||||||||||||
| (in thousands) |
2009 | 2008 | 2007 | |||||||||
| Current: |
||||||||||||
| Federal |
$ | 171,494 | $ | 150,609 | $ | 112,552 | ||||||
| Tax benefits from NOLs |
(85 | ) | (3,003 | ) | (7,489 | ) | ||||||
| Federal, net |
171,409 | 147,606 | 105,063 | |||||||||
| State and local |
17,808 | 26,382 | 16,536 | |||||||||
| Tax benefits from NOLs |
(5,097 | ) | (2,744 | ) | (12,292 | ) | ||||||
| State and local, net |
12,711 | 23,638 | 4,244 | |||||||||
| Foreign |
268 | (4,899 | ) | (1,371 | ) | |||||||
| Total |
184,388 | 166,345 | 107,936 | |||||||||
| Tax benefits of compensation plans allocated to additional paid-in capital |
70 | 12 | 514 | |||||||||
| Total current income tax provision |
184,458 | 166,357 | 108,450 | |||||||||
| Deferred: |
||||||||||||
| Federal |
(22,548 | ) | 22,573 | 37,974 | ||||||||
| Other |
4,529 | 5,582 | 14,848 | |||||||||
| Total |
(18,019 | ) | 28,155 | 52,822 | ||||||||
| Deferred tax allocated to other comprehensive income |
(4,965 | ) | 198 | 5,116 | ||||||||
| Total deferred income tax provision |
(22,984 | ) | 28,353 | 57,938 | ||||||||
| Provision for income taxes |
$ | 161,474 | $ | 194,710 | $ | 166,388 | ||||||
The difference between the statutory rate for federal income tax and the effective income tax rate was as follows:
| For the years ended December 31, | |||||||||
| 2009 | 2008 | 2007 | |||||||
| U.S. federal statutory income tax rate |
35.0 | % | 35.0 | % | 35.0 | % | |||
| Effect of: |
|||||||||
| U.S. state and local income taxes, net of federal income tax benefit |
3.2 | 2.9 | 2.8 | ||||||
| Income of pass-through entities allocated to non-controlling interests |
(5.8 | ) | (5.6 | ) | (5.6 | ) | |||
| Section 199 - Production Activities Deduction |
(1.9 | ) | (1.4 | ) | (1.7 | ) | |||
| Non-deductible debt extinguishment loss |
1.6 | ||||||||
| Miscellaneous |
0.5 | 2.6 | 1.7 | ||||||
| Effective income tax rate excluding effects of impairment |
31.0 | % | 35.1 | % | 32.2 | % | |||
| Impact of goodwill and other intangible asset impairments |
27.6 | ||||||||
| Effective income tax rate |
31.0 | % | 62.7 | % | 32.2 | % | |||
We believe adequate provision has been made for all open tax years.
The approximate effect of the temporary differences giving rise to deferred income tax liabilities (assets) were as follows:
| As of December 31, | ||||||||
| (in thousands) |
2009 | 2008 | ||||||
| Deferred tax assets: |
||||||||
| Accrued expenses not deductible until paid |
$ | (4,198 | ) | $ | (4,594 | ) | ||
| Deferred compensation and retiree benefits not deductible until paid |
(38,277 | ) | (37,084 | ) | ||||
| Tax basis capital loss and credit carryforwards |
(140,477 | ) | ||||||
| Federal net operating loss carryforwards |
(2,292 | ) | ||||||
| State and foreign net operating loss carryforwards |
(18,002 | ) | (23,897 | ) | ||||
| Other temporary differences, net |
(1,980 | ) | ||||||
| (202,934 | ) | (67,867 | ) | |||||
| Deferred tax liabilities: |
||||||||
| Property, plant and equipment |
3,362 | 6,364 | ||||||
| Goodwill and other intangible assets |
44,317 | 45,562 | ||||||
| Investments, primarily gains and losses not yet recognized for tax purposes |
73,711 | 74,838 | ||||||
| Programs and program licenses |
41,182 | 55,145 | ||||||
| Other temporary differences, net |
3,785 | |||||||
| 162,572 | 185,694 | |||||||
| Valuation allowance for deferred tax assets |
154,246 | 14,076 | ||||||
| Net deferred tax liability |
$ | 113,884 | $ | 131,903 | ||||
Total state net operating loss carryforwards were $84 million at December 31, 2009. Our state tax loss carryforwards expire between 2019 and 2026.
State net operating loss carryforwards are recognized as deferred tax assets, subject to valuation allowances. At each balance sheet date, we evaluate whether all or some portion of these deferred tax assets will not be realized. The tax effect of the carryforwards that are not expected to be realized is included in the valuation allowance.
At December 31, 2009, we had $51.5 million of net operating loss and non-deductible interest expense carryforwards related to our U.K. subsidiaries. Although these carryforwards are subject to unlimited carryforward periods, the deferred tax asset for these items have been reduced by a valuation allowance of $14.4 million as it is more likely than not that these loss carryforwards will not be realized.
uSwitch was sold December 23, 2009 resulting in a capital loss of $374 million. No capital gains were realized in 2009 and none are expected in the available carryforward period. Therefore, a valuation allowance of $139.8 million has been recorded on the deferred tax asset for the loss as it is more likely than not that the capital loss will not be utilized.
Undistributed earnings of foreign subsidiaries not included in our consolidated federal income tax returns that could be subject to additional U.S. or foreign tax if remitted totaled $3.4 million as of December 31, 2009. No provision for U.S. or foreign income tax has been made on these undistributed earnings as management intends to remit only the portion of such earnings that would be offset by U.S. foreign tax credits. It intends to reinvest the remainder outside the U.S. indefinitely. It is not practicable to estimate the amount of deferred income taxes related to permanently reinvested amounts.
F-32
Table of Contents
A reconciliation of the beginning and ending balances of the total amounts of gross unrecognized tax benefits is as follows:
| (in thousands) |
2009 | 2008 | 2007 | |||||||||
| Gross unrecognized tax benefits - beginning of year |
$ | 62,136 | $ | 51,380 | $ | 42,614 | ||||||
| Increases in tax positions for prior years |
11,141 | 7,499 | 345 | |||||||||
| Decreases in tax positions for prior years |
(16,337 | ) | (2,215 | ) | (719 | ) | ||||||
| Increases in tax positions for current year |
16,787 | 15,424 | 13,853 | |||||||||
| Settlements |
(1,309 | ) | (721 | ) | ||||||||
| Lapse in statute of limitations |
(11,217 | ) | (9,231 | ) | (4,713 | ) | ||||||
| Gross unrecognized tax benefits - end of year |
$ | 61,201 | $ | 62,136 | $ | 51,380 | ||||||
The total amount of net unrecognized tax benefits that, if recognized, would affect the effective tax rate was $44.5 million at December 31, 2009, $40.9 million at December 31, 2008 and $35.1 million at December 31, 2007. We accrue interest and penalties related to unrecognized tax benefits in our provision for income taxes. Related to the amounts above, we recognized an interest benefit of $0.2 million in 2009 and $1.1 million in 2008. During 2007, we accrued interest of $3.7 million. Included in the balance of unrecognized tax benefits at December 31, 2009, December 31, 2008, and December 31, 2007, respectively, are $7.6 million, $7.9 million, and $8.2 million of liabilities for interest.
We file income tax returns in the U.S. and in various state, local and foreign jurisdictions. We are routinely examined by tax authorities in these jurisdictions. As of December 31, 2009, we had been examined by the Internal Revenue Service (“IRS”) through calendar year 2006. In addition, several state examinations are currently ongoing. It is possible that these examinations may be resolved within twelve months. Due to the potential for resolution of these examinations, and the expiration of various statutes of limitation, it is reasonably possible that our gross unrecognized tax benefits balance may change within the next twelve months by a range of zero to $15.1 million.
Our tax years for 2006 and forward are subject to examination by the tax authorities. With a few exceptions, the Company is no longer subject to federal, state, local or foreign examinations by tax authorities for years prior to 2005.
8. Investments
The approximate ownership interest in each of our equity method investments and their respective investment balances were as follows:
| (in thousands) |
Ownership Interest |
As of December 31, | |||||||
| 2009 | 2008 | ||||||||
| HGTV Canada |
33.00 | % | $ | 25,667 | $ | 21,052 | |||
| Food Canada |
29.00 | % | 12,986 | 10,457 | |||||
| Fox-BRV Southern Sports Holdings |
7.25 | % | 7,562 | 8,251 | |||||
| Other |
180 | 519 | |||||||
| Total investments |
$ | 46,395 | $ | 40,279 | |||||
We regularly review our investments to determine if there have been any other-than-temporary declines in value. These reviews require management judgments that often include estimating the outcome of future events and determining whether factors exist that indicate impairment has occurred. We evaluate among other factors, the extent to which costs exceed fair value; the duration of the decline in fair value below cost; and the current cash position, earnings and cash forecasts and near term prospects of the investee. No impairments were recognized on any of our equity method investments in 2009, 2008, or 2007.
In 2008, we entered into a joint venture with Hearst Corporation for the publication of the Food Network Magazine. We have a 50% ownership interest in the joint venture.
In 2007, we contributed our 12% interest in Fox Sports Net South for a 7.25% interest in Fox-BRV Southern Sports Holdings, LLC (“Fox-BRV”). Fox-BRV manages and operates both the Sports South and Fox Sports Net South regional television networks.
9. Fair Value Measurement
Fair value is an exit price, representing the amount that would be received to sell an asset or paid to transfer a liability in an orderly transaction between market participants at the measurement date. Financial assets and liabilities carried at fair value are classified in one of the three categories which are described below:
| • | Level 1 — Quoted prices in active markets for identical assets or liabilities. |
| • | Level 2 — Inputs, other than quoted market prices in active markets, that are observable either directly or indirectly. |
| • | Level 3 — Unobservable inputs based on our own assumptions. |
The following table sets forth our liabilities that are measured at fair value on a recurring basis at December 31, 2009:
| (in thousands) |
Total | Level 1 | Level 2 | Level 3 | ||||||||
| Temporary equity: |
||||||||||||
| Redeemable noncontrolling interests |
$ | 113,886 | $ | $ | $ | 113,886 | ||||||
The following table sets forth our financial assets and liabilities that are measured at fair value on a recurring basis at December 31, 2008:
| (in thousands) |
Total | Level 1 | Level 2 | Level 3 | ||||||||
| Assets: |
||||||||||||
| Short-term investments |
$ | 2,703 | $ | 2,703 | $ | $ | ||||||
| Temporary equity: |
||||||||||||
| Redeemable noncontrolling interest |
$ | 9,400 | $ | $ | $ | 9,400 | ||||||
The fair value of the redeemable noncontrolling interests were determined based upon negotiated values and recent transactions involving the redeemable noncontrolling interests (refer to Note 17—Redeemable Noncontrolling Interests and Noncontrolling Interests for additional information).
F-33
Table of Contents
The following table summarizes the activity for account balances whose fair value measurements are estimated utilizing level 3 inputs:
| Redeemable Noncontrolling Interests As of December 31, |
||||||||
| ( in thousands ) |
2009 | 2008 | ||||||
| Beginning period balance |
$ | 9,400 | $ | 23,400 | ||||
| Record redeemable interests in Travel |
||||||||
| Channel and food international venture |
99,505 | |||||||
| Redemption of noncontrolling interest |
(9,000 | ) | ||||||
| Net loss |
(7,675 | ) | ||||||
| Noncontrolling interests’ share of foreign currency translation |
(19 | ) | ||||||
| Fair value adjustment |
12,675 | (5,000 | ) | |||||
| Ending period balance |
$ | 113,886 | $ | 9,400 | ||||
The net loss amounts reflected in the table above are reported within the “net income attributable to noncontrolling interests” line in our statements of operations.
10. Property, Plant and Equipment
Property, plant and equipment consisted of the following:
| As of December 31, | ||||||
| (in thousands) |
2009 | 2008 | ||||
| Land and improvements |
$ | 11,865 | $ | 11,865 | ||
| Buildings and improvements |
114,822 | 78,707 | ||||
| Equipment |
153,027 | 138,910 | ||||
| Computer software |
168,061 | 125,601 | ||||
| Total |
447,775 | 355,083 | ||||
| Accumulated depreciation |
208,131 | 163,669 | ||||
| Property, plant and equipment |
$ | 239,644 | $ | 191,414 | ||
11. Goodwill and Other Intangible Assets
Goodwill and other intangible assets consisted of the following:
| As of December 31, | ||||||||
| (in thousands) |
2009 | 2008 | ||||||
| Goodwill |
$ | 914,194 | $ | 667,913 | ||||
| Accumulated Impairments |
(243,700 | ) | (243,700 | ) | ||||
| Goodwill, net |
670,494 | 424,213 | ||||||
| Other intangible assets: |
||||||||
| Amortizable intangible assets: |
||||||||
| Carrying amount: |
||||||||
| Acquired network distribution |
504,847 | 43,415 | ||||||
| Customer lists |
194,003 | 111,230 | ||||||
| Copyrights and other trade names |
78,167 | 22,136 | ||||||
| Other |
20,478 | 21,013 | ||||||
| Total carrying amount |
797,495 | 197,794 | ||||||
| Accumulated amortization: |
||||||||
| Acquired network distribution |
(17,155 | ) | (13,377 | ) | ||||
| Customer lists |
(71,472 | ) | (59,196 | ) | ||||
| Copyrights and other trade names |
(11,491 | ) | (8,878 | ) | ||||
| Other |
(16,065 | ) | (12,715 | ) | ||||
| Total accumulated amortization |
(116,183 | ) | (94,166 | ) | ||||
| Total other intangible assets |
681,312 | 103,628 | ||||||
| Total goodwill and other intangible assets |
$ | 1,351,806 | $ | 527,841 | ||||
In the course of performing our 2008 impairment review, we determined that the goodwill of our Shopzilla business was impaired. The impairment was a function of both the changing competitive environment for online comparison shopping services and our subsequent decision to reposition Shopzilla within that marketplace for maximum long-term growth. The goodwill impairment charge totaling $244 million was recorded in 2008.
To determine the fair value of our reporting units, we used market data and discounted cash flow analyses. No other impairment losses were recorded in 2009 or 2008.
F-34
Table of Contents
Activity related to goodwill, amortizable intangible assets and indefinite-lived intangible assets by business segment was as follows:
| (in thousands) |
Lifestyle Media |
Interactive Services |
Corporate | Total | ||||||||||||
| Goodwill: |
||||||||||||||||
| Balance as of December 31, 2007 |
$ | 265,436 | $ | 399,718 | $ | 665,154 | ||||||||||
| Business acquisitions |
7,500 | 7,500 | ||||||||||||||
| Adjustment of purchase price allocations |
(4,741 | ) | (4,741 | ) | ||||||||||||
| Write-down of Shopzilla |
(243,700 | ) | (243,700 | ) | ||||||||||||
| Balance as of December 31, 2008 |
268,195 | 156,018 | 424,213 | |||||||||||||
| Business acquisitions |
246,281 | 246,281 | ||||||||||||||
| Balance as of December 31, 2009 |
$ | 514,476 | $ | 156,018 | $ | 670,494 | ||||||||||
| Amortizable intangible assets: |
||||||||||||||||
| Balance as of December 31, 2007 |
$ | 35,438 | $ | 82,202 | $ | 117,640 | ||||||||||
| Adjustment of purchase price allocations |
6,640 | 6,640 | ||||||||||||||
| Other additions |
76 | 76 | ||||||||||||||
| Foreign currency translation adjustment |
183 | 183 | ||||||||||||||
| Amortization |
(3,979 | ) | (16,932 | ) | (20,911 | ) | ||||||||||
| Balance as of December 31, 2008 |
38,175 | 65,453 | 103,628 | |||||||||||||
| Business acquisitions |
598,257 | $ | 245 | 598,502 | ||||||||||||
| Additions |
2,025 | 130 | 2,155 | |||||||||||||
| Other |
(55 | ) | (55 | ) | ||||||||||||
| Foreign currency translation adjustment |
(3 | ) | (3 | ) | ||||||||||||
| Amortization |
(6,632 | ) | (16,283 | ) | (22,915 | ) | ||||||||||
| Balance as of December 31, 2009 |
$ | 631,825 | $ | 49,245 | $ | 242 | $ | 681,312 | ||||||||
Estimated amortization expense of intangible assets for each of the next five years is expected to be $59.1 million in 2010, $54.8 million in 2011, $51.0 million in 2012, $45.6 million in 2013, $43.9 million in 2014 and $426.9 million in later years.
F-35
Table of Contents
12. Programs and Program Licenses
Programs and program licenses consisted of the following:
| (in thousands) |
As of December 31, | |||||
| 2009 | 2008 | |||||
| Cost of programs available for broadcast |
$ | 1,290,128 | $ | 1,057,686 | ||
| Accumulated amortization |
899,209 | 717,256 | ||||
| Total |
390,919 | 340,430 | ||||
| Progress payments on programs not yet available for broadcast |
136,693 | 133,856 | ||||
| Total programs and program licenses |
$ | 527,612 | $ | 474,286 | ||
In addition to the programs owned or licensed by us included in the table above, we have commitments to license certain programming that is not yet available for broadcast. Such program licenses are recorded as assets when the programming is delivered to us and is available for broadcast. These contracts may require progress payments or deposits prior to the program becoming available for broadcast. Remaining obligations under contracts to purchase or license programs not yet available for broadcast totaled approximately $91.5 million at December 31, 2009. If the programs are not produced, our commitment to license the programs would generally expire without obligation.
Progress payments on programs not yet available for broadcast and the cost of programs and program licenses capitalized totaled $287 million in 2009, $280 million in 2008, and $287 million in 2007.
Estimated amortization of recorded program assets and program commitments for each of the next five years is as follows:
| (in thousands) |
Programs Available for Broadcast |
Programs Not Yet Available for Broadcast |
Total | ||||||
| 2010 |
$ | 218,760 | $ | 91,513 | $ | 310,273 | |||
| 2011 |
106,785 | 67,205 | 173,990 | ||||||
| 2012 |
51,573 | 38,343 | 89,916 | ||||||
| 2013 |
13,343 | 25,073 | 38,416 | ||||||
| 2014 |
458 | 5,778 | 6,236 | ||||||
| Later years |
272 | 272 | |||||||
| Total |
$ | 390,919 | $ | 228,184 | $ | 619,103 | |||
Actual amortization in each of the next five years will exceed the amounts presented above as our national television networks will continue to produce and license additional programs.
13. Unamortized Network Distribution Incentives
Unamortized network distribution incentives consisted of the following:
| (in thousands) |
As of December 31, | |||||
| 2009 | 2008 | |||||
| Network launch incentives |
$ | 42,013 | $ | 69,957 | ||
| Unbilled affiliate fees |
29,253 | 37,839 | ||||
| Total unamortized network distribution incentives |
$ | 71,266 | $ | 107,796 | ||
We capitalized launch incentive payments totaling $3.5 million in 2008 and $0.4 million in 2007.
Amortization recorded as a reduction to affiliate fee revenue in the consolidated and combined financial statements, and estimated amortization of recorded network distribution incentives for each of the next five years, is presented below.
| (in thousands) |
|||
| Amortization for the year ended December 31: |
|||
| 2009 |
$ | 37,830 | |
| 2008 |
33,391 | ||
| 2007 |
27,016 | ||
| Estimated amortization for the year ending December 31: |
|||
| 2010 |
$ | 28,216 | |
| 2011 |
24,036 | ||
| 2012 |
13,105 | ||
| 2013 |
1,825 | ||
| 2014 |
2,030 | ||
| Later years |
2,054 | ||
| Total |
$ | 71,266 | |
Actual amortization could be greater than the above amounts as additional incentive payments may be capitalized as we expand distribution of our networks.
14. Other Accrued Current Liabilities
Other accrued current liabilities consisted of the following:
| (in thousands) |
As of December 31, | |||||
| 2009 | 2008 | |||||
| Accrued rent |
$ | 12,346 | $ | 9,269 | ||
| Accrued taxes |
13,328 | 6 | ||||
| Payable to E. W. Scripps |
6,500 | 13,543 | ||||
| Accrued license and copyright fees |
4,207 | 2,975 | ||||
| Accrued expenses |
52,720 | 40,484 | ||||
| Total |
$ | 89,101 | $ | 66,277 | ||
F-36
Table of Contents
15. Long-Term Debt
Long-term debt consisted of the following:
| (in thousands) |
As of December 31, | |||||
| 2009 | 2008 | |||||
| Revolving credit facility |
$ | 80,000 | ||||
| Senior notes |
$ | 884,239 | ||||
| Total |
$ | 884,239 | $ | 80,000 | ||
| Fair value of long-term debt * |
$ | 875,600 | $ | 80,000 | ||
| * | Fair value was estimated based on current rates available to the Company for debt of the same remaining maturity. |
On December 15, 2009, TCM Sub, LLC, a majority-owned subsidiary of SNI, issued a total of $885 million of senior notes through a private placement (the “Senior Notes”). The Senior Notes mature on January 15, 2015 bearing interest at 3.55%. Beginning on July 15, 2010, interest will be paid on the notes on January 15th and July 15th of each year. The Senior Notes are guaranteed by SNI. Cox has agreed to indemnify SNI for payments made in respect of SNI’s guarantee. Substantially all of the proceeds from the issuance of the notes were distributed to Cox in the Travel Channel transaction.
On June 30, 2008, we entered into a Competitive Advance and Revolving Credit Facility (the “Revolving Credit Facility”) that permits $550 million in aggregate borrowings and expires in June 2013. Borrowings under the Revolver are available on a committed revolving credit basis at our choice of three short-term rates or through an auction procedure at the time of each borrowing. The Company borrowed $325 million under the Revolving Credit Facility on June 30, 2008. The weighted-average interest rate on borrowings under the Revolving Credit Facility was 0.3% at December 31, 2009.
E. W. Scripps utilized a centralized approach to cash management to finance its operations. Based on the historical funding requirements of the Company, specifically the costs to fund acquisitions, fund investments in programming and otherwise support the expansion of Scripps Networks Interactive businesses, all E. W. Scripps third party debt and related interest expense has been allocated to the Company for periods prior to June 30, 2008.
Management believes the allocation basis for debt and interest expense is reasonable based on the historical financing needs of the Company. However, such estimates are not necessarily representative of our costs as a stand-alone public company for the periods presented.
The revolving credit facility and Senior Notes include certain affirmative and negative covenants, including the incurrence of additional indebtedness and maintenance of a minimum leverage ratio. We are in compliance with all debt covenants.
As of December 31, 2009, we had outstanding letters of credit totaling $1.8 million.
Capitalized interest was $0.2 million in 2009 and $0.5 million in 2008.
16. Other Liabilities
Other liabilities consisted of the following:
| (in thousands) |
As of December 31, | |||||
| 2009 | 2008 | |||||
| Liability for pension and post employment benefits |
$ | 40,298 | $ | 44,558 | ||
| Network distribution incentives |
992 | |||||
| Deferred compensation |
13,543 | 9,814 | ||||
| Liability for uncertain tax positions |
42,404 | 46,039 | ||||
| Other |
3,417 | 2,836 | ||||
| Other liabilities (less current portion) |
$ | 99,662 | $ | 104,239 | ||
F-37
Table of Contents
17. Redeemable Noncontrolling Interests and Noncontrolling Interests
As of December 31, 2009, noncontrolling interests held an approximate 6% residual interest in FLN. The noncontrolling interests of FLN had the right to require us to repurchase their interests. In January 2010, we reached agreement with the noncontrolling interest owner to acquire their 6% residual interest in FLN for cash consideration of $14.4 million. In 2008, we had previously acquired the 3.75% interest in FLN from a noncontrolling owner of FLN for cash consideration of $9.0 million.
A noncontrolling interest holds a 35% residual interest in the Travel Channel. The noncontrolling interest has the right to require us to repurchase their interest and we have an option to acquire their interest. The noncontrolling interest will receive the fair value for their interest at the time their option is exercised. The put options on the noncontrolling interest in the Travel Channel become exercisable in 2014. The call options become exercisable in 2015.
A noncontrolling interest holds a 20% residual interest in the food international venture. The noncontrolling interest has the right to require us to repurchase their interest and we have an option to acquire their interest. The noncontrolling interest will receive the fair value for their interest at the time their option is exercised. The put and call options on the noncontrolling interest in the food international venture become exercisable in 2012.
Our consolidated balance sheets include a redeemable noncontrolling interest balance of $113.9 million at December 31, 2009 and $9.4 million at December 31, 2008.
Noncontrolling interests hold an approximate 31% residual interest in Food Network. The Food Network general partnership agreement is due to expire on December 31, 2012, unless amended or extended prior to that date. In the event of such termination, the assets of the partnership are to be liquidated and distributed to the partners in proportion to their partnership interests.
18. Related Party Transactions
Cash Management
Prior to the separation, E. W. Scripps used a centralized approach for cash management to finance its operations. The Company’s cash was available for use and was regularly “swept” by E. W. Scripps to a concentration account at its discretion.
Transfers of cash both to and from E. W. Scripps’ cash management system were reflected as a component of Parent Company Net Investment within Shareholders’ Equity on the consolidated and combined balance sheets. Subsequent to the separation, SNI uses a similar cash management approach with the exception that the cash is swept to SNI’s concentration account and there are no longer transfers between the Company and E. W. Scripps.
Debt and Related Items
The Company was allocated the entire amount of consolidated debt and net interest expense of E. W. Scripps prior to June 30, 2008. See Note 15 -Long-Term Debt, for further information regarding these allocations.
Allocated Expenses
For periods prior to our separation from E. W. Scripps on July 1, 2008, the Company was allocated estimates of Scripps Networks Interactive’s portion of E. W. Scripps corporate expenses for those periods based on a pro-rata percentage of E. W. Scripps’ combined net revenue, headcount and usage. General corporate overhead expenses primarily related to centralized corporate functions, which included finance, legal, internal audit, human resources, information technology, and various other functions historically provided by E. W. Scripps. For the first six months of 2008, the Company was allocated $27.7 million of general corporate overhead expenses incurred by E. W. Scripps. During 2007, the Company was allocated $47.2 million of general corporate overhead expenses.
As discussed in Note 1—Formation of the Company and Basis of Presentation to the consolidated and combined financial statements, the Company believes the assumptions and methodologies underlying the allocation of general corporate overhead expenses from E. W. Scripps are reasonable. However, such estimates are not necessarily representative of our costs as a stand-alone public company for the periods presented.
As such, the financial information herein may not necessarily reflect the combined financial position, results of operations, and cash flows of the Company in the future or what it would have been had the Company been an independent, publicly-traded company during the periods presented.
Dividend
On June 30, 2008 Scripps Networks Interactive paid a cash dividend totaling $430 million to E. W. Scripps.
Agreements with E. W. Scripps
In connection with the Separation, the following agreements between Scripps Networks Interactive and E. W. Scripps became effective on July 1, 2008:
| • | Separation and Distribution Agreement |
| • | Transition Services Agreement |
| • | Employee Matters Agreement |
| • | Tax Allocation Agreement |
Separation and Distribution Agreement
The Separation and Distribution Agreement set forth the agreements between E. W. Scripps and the Company with respect to the principal corporate transactions required to effect the separation and the distribution of the Company’s shares to E. W. Scripps’ shareholders and other agreements governing the relationship between E. W. Scripps and the Company. The distribution agreement provides that Scripps Networks Interactive and E. W. Scripps and its subsidiaries (other than Scripps Networks Interactive and its subsidiaries) will release and discharge each other from all liabilities, of any sort, including in connection with the transactions contemplated by the distribution agreement, except as expressly set forth in the agreement. The releases do not release any party from, among other matters, liabilities assumed or allocated to the party pursuant to the distribution agreement or the other agreements entered into in
F-38
Table of Contents
connection with the separation or from the indemnification and contribution obligations under the distribution agreement or such other agreements.
Transition Services Agreement
The Transition Services Agreement provided for E. W. Scripps and Scripps Networks Interactive to provide services to each other on a compensated basis for a period of up to two years. Compensation will be on an arms-length basis. E. W. Scripps provided services or support to Scripps Networks Interactive, including information technology, human resources, accounting and finance, and facilities. The Company incurred expenses of $3.0 million in 2009 and $5.5 million in 2008 related to these services, which are reported in other costs and expenses in the consolidated and combined statements of operations. SNI provided information technology support and services to E. W. Scripps. The Company recorded revenue of $0.6 million in 2009 and $1.7 million in 2008 related to these services, which are reported in other revenues in the consolidated and combined statements of operations.
Employee Matters Agreement
The Employee Matters Agreement provided for the allocation of the liabilities and responsibilities relating to employee compensation and benefit plans and programs, including the treatment of outstanding incentive awards, deferred compensation obligations and retirement and welfare benefit obligations between E. W. Scripps and Scripps Networks Interactive. The agreement provided that E. W. Scripps and Scripps Networks Interactive would each be responsible for all employment and benefit related obligations and liabilities for employees that work for the respective companies. The agreement also provided that Scripps Networks Interactive employees will continue to participate in certain of the E. W. Scripps benefit plans during a transition period through December 31, 2008. After the transition period, the account balances or actuarially determined values of assets and liabilities of Scripps Networks Interactive employees were transferred to the benefit plans of Scripps Networks Interactive in 2009. The agreement also governs the treatment of outstanding E. W. Scripps share-based equity awards (refer to Note 23—Capital Stock and Stock Compensation Plans for additional discussion).
Tax Allocation Agreement
The Tax Allocation Agreement sets forth the allocations and responsibilities of E. W. Scripps and Scripps Networks Interactive with respect to liabilities for federal, state, local and foreign income taxes for periods before and after the spin-off, tax deductions related to compensation arrangements, preparation of income tax returns, disputes with taxing authorities and indemnification of income taxes that would become due if the spin-off were taxable. Generally, E. W. Scripps and Scripps Networks Interactive will be responsible for income taxes for periods before the spin-off for their respective businesses. In connection with year-end analysis of our tax accounts and the reconciliations of the tax provision to respective tax returns, determination was made that we owed payment to E. W. Scripps for tax related matters totaling $6.5 million and $13.5 million as of December 31, 2009 and 2008, respectively. The liability to E. W. Scripps as of December 31, 2009 and 2008 is included within other accrued liabilities in the consolidated balance sheets.
Other Agreements
E. W. Scripps and Scripps Networks Interactive have also entered into various other agreements which management believes have been negotiated on an arms-length basis and that individually or in the aggregate do not constitute material agreements.
F-39
Table of Contents
19. Employee Benefit Plans
Defined Benefit Plans
We sponsor a defined benefit pension plan covering a majority of our employees. Expense recognized in relation to this defined benefit retirement plan is based upon actuarial valuations and inherent in those valuations are key assumptions including discount rates, and where applicable, expected returns on assets and projected future salary rates. The discount rates used in the valuation of our defined benefit pensions are evaluated annually based on current market conditions. Benefits are generally based upon the employee’s compensation and years of service.
We also have a nonqualified supplemental executive retirement plan (“SERP”). The SERP, which is unfunded, provides defined pension benefits in addition to the defined benefit from the defined benefit pension plan to eligible executives based on average earnings, years of service and age at retirement.
For periods prior to July 1, 2008, our financial statements were presented on a carve-out basis, and reported pension costs and obligations included amounts attributed to E. W. Scripps’ historical Lifestyle Media and Interactive Services businesses as well as estimates to account for the inclusion of corporate employees.
Following the Separation, The Employee Matters Agreement provided for the participation of our employees in certain benefit plans of E. W. Scripps, including the E.W. Scripps pension, retirement and investment and supplemental executive retirement plans, during a transition period ending on December 31, 2008. Following the Separation, our pension costs and pension obligations were actuarially determined based upon the actual number of individuals employed by SNI. Since the actuarially determined amounts differ from the estimates that are being reported in our carve-out financial statements for periods prior to July 1, 2008, the footnote presentation below reflects the actual number of individuals employed by SNI for each period presented. The lines captioned “actuarial adjustments related to the separation”, that are reported in the tables below, reflect the impacts of E. W. Scripps corporate employees that became employees of SNI effective July 1, 2008.
The Employee Matters Agreement also provided a structural framework for the employee benefit plans and programs established by us. During 2009, the Scripps Networks Interactive, Inc. Pension Plan (“SNI Pension Plan”) and the Scripps Networks Interactive, Inc. SERP were established, after which the actuarial-determined values of the assets and liabilities attributable to certain plan assets or account balances related to SNI employees were transferred to our new plans. The line captioned “actuarial adjustments related to the separation” for 2009 reflects the difference in the actual plan assets transferred to the SNI pension plan and the plan asset amounts that were estimated as of December 31, 2008.
In the fourth quarter of 2009, we amended the SNI Pension Plan. In accordance with the provisions of the SNI Pension Plan amendment, no additional service benefits will be earned by participants in the SNI Pension Plan after December 31, 2009. The amount of eligible compensation that is used to calculate a plan participant’s pension benefit will continue to include any compensation earned by the employee through December 31, 2019. After December 31, 2019, all plan participants will have a frozen pension benefit.
The measurement date used for the retirement plans is December 31. The components of the expense consisted of the following:
| (in thousands) |
For the years ended December 31, | |||||||||||||||||||||||
| Defined Benefit Plans | SERP | |||||||||||||||||||||||
| 2009 | 2008 | 2007 | 2009 | 2008 | 2007 | |||||||||||||||||||
| Service cost |
$ | 5,137 | $ | 5,403 | $ | 3,292 | $ | 1,680 | $ | 2,211 | $ | 1,038 | ||||||||||||
| Interest cost |
3,539 | 3,221 | 1,748 | 1,650 | 1,786 | 678 | ||||||||||||||||||
| Expected return on plan assets |
(1,971 | ) | (2,591 | ) | (2,285 | ) | ||||||||||||||||||
| Amortization of prior service cost (credit) |
163 | 163 | 61 | (82 | ) | (81 | ) | (66 | ) | |||||||||||||||
| Amortization of net (gain)/loss |
632 | 341 | 561 | 1,418 | 350 | |||||||||||||||||||
| Curtailments |
993 | (447 | ) | |||||||||||||||||||||
| Total for defined benefit plans |
$ | 8,493 | $ | 6,537 | $ | 2,816 | $ | 3,362 | $ | 5,334 | $ | 2,000 | ||||||||||||
F-40
Table of Contents
Assumptions used in determining the annual retirement plans expense were as follows:
| Defined Benefit Plans | SERP | |||||||||||||||||
| 2009 | 2008 | 2007 | 2009 | 2008 | 2007 | |||||||||||||
| Discount rate |
6.25 | % | 6.25 | % | 6.00 | % | 6.25 | % | 6.25 | % | 6.00 | % | ||||||
| Long-term rate of return on plan assets |
7.50 | % | 8.25 | % | 8.25 | % | N / A | N / A | N / A | |||||||||
| Increase in compensation levels |
4.40 | % | 7.40 | % | 5.00 | % | 4.40 | % | 7.40 | % | 5.00 | % | ||||||
The discount rate used to determine our future pension obligations is based on a dedicated bond portfolio approach that includes securities rated Aa or better with maturities matching our expected benefit payments from the plans. The increase in compensation levels assumption is based on actual past experience and the near-term outlook.
The expected long-term rate of return on plan assets is based upon the weighted-average expected rate of return and capital market forecasts for each asset class employed. Our expected rate of return on plan assets also considers our historical compounded return on plan assets for 10 and 15 year periods, which exceed our current forward-looking assumption.
Obligations and Funded Status – Defined benefit plans pension obligations and funded status are actuarially valued as of the end of each fiscal year. The following table presents information about our employee benefit plan assets and obligations:
| (in thousands) |
For the years ended December 31, | |||||||||||||||
| Defined Benefit Plans | SERP | |||||||||||||||
| 2009 | 2008 | 2009 | 2008 | |||||||||||||
| Accumulated benefit obligation |
$ | 42,754 | $ | 36,414 | $ | 22,159 | $ | 19,949 | ||||||||
| Change in projected benefit obligation: |
||||||||||||||||
| Projected benefit obligation at beginning of year |
$ | 47,076 | $ | 40,944 | $ | 22,127 | $ | 19,257 | ||||||||
| Service cost |
5,137 | 5,403 | 1,680 | 2,211 | ||||||||||||
| Interest cost |
3,539 | 3,221 | 1,650 | 1,786 | ||||||||||||
| Benefits paid |
(225 | ) | (143 | ) | (2,318 | ) | (225 | ) | ||||||||
| Actuarial losses (gains) |
5,439 | (6,395 | ) | 5,180 | (6,294 | ) | ||||||||||
| Prior service cost |
292 | |||||||||||||||
| Curtailments |
(9,671 | ) | (2,778 | ) | ||||||||||||
| Actuarial adjustment related to separation |
3,754 | 5,392 | ||||||||||||||
| Projected benefit obligation at end of year |
51,295 | 47,076 | 25,541 | 22,127 | ||||||||||||
| Plan assets: |
||||||||||||||||
| Fair value at beginning of year |
24,339 | 29,623 | ||||||||||||||
| Actual return on plan assets |
5,656 | (6,989 | ) | |||||||||||||
| Company contributions |
3,000 | 2,318 | 225 | |||||||||||||
| Benefits paid |
(225 | ) | (143 | ) | (2,318 | ) | (225 | ) | ||||||||
| Actuarial adjustment related to separation |
1,193 | 1,848 | ||||||||||||||
| Fair value at end of year |
33,963 | 24,339 | — | — | ||||||||||||
| Over / (under) funded status |
$ | (17,332 | ) | $ | (22,737 | ) | $ | (25,541 | ) | $ | (22,127 | ) | ||||
| Amounts recognized as assets and liabilities in consolidated and combined balance sheets: |
||||||||||||||||
| Current liabilities |
$ | (2,575 | ) | $ | (305 | ) | ||||||||||
| Non-current liabilities |
$ | (17,332 | ) | $ | (22,737 | ) | (22,966 | ) | (21,822 | ) | ||||||
| Total |
$ | (17,332 | ) | $ | (22,737 | ) | $ | (25,541 | ) | $ | (22,127 | ) | ||||
| Amounts recognized in accumulated other comprehensive loss (income) consist of: |
||||||||||||||||
| Net (gain) / loss |
$ | 517 | $ | 9,065 | $ | 6,968 | $ | 5,416 | ||||||||
| Prior service cost (credit) |
1,156 | (528 | ) | |||||||||||||
| Total |
$ | 517 | $ | 10,221 | $ | 6,968 | $ | 4,888 | ||||||||
Other changes in plan assets and benefit obligations recognized in other comprehensive loss (income) consist of:
| (in thousands) |
For the years ended December 31, | |||||||||||||||
| Defined Benefit Plans | SERP | |||||||||||||||
| 2009 | 2008 | 2009 | 2008 | |||||||||||||
| Net actuarial loss (gain) |
$ | 1,755 | $ | 3,184 | $ | 5,180 | $ | (6,294 | ) | |||||||
| Amortization of net gain (loss) |
(10,303 | ) | (341 | ) | (3,628 | ) | (1,418 | ) | ||||||||
| Prior service cost |
292 | |||||||||||||||
| Amortization of prior service credit (cost) |
(1,156 | ) | (163 | ) | 528 | 81 | ||||||||||
| Actuarial adjustment related to separation |
1,587 | 2,572 | ||||||||||||||
| Total recognized in other comprehensive loss (income) |
(9,704 | ) | 4,559 | 2,080 | (5,059 | ) | ||||||||||
| Net periodic benefit cost |
8,493 | 6,537 | 3,362 | 5,334 | ||||||||||||
| Total recognized in net periodic benefit cost and other comprehensive income |
$ | (1,211 | ) | $ | 11,096 | $ | 5,442 | $ | 275 | |||||||
F-41
Table of Contents
Related to our non-qualified SERP plan, we expect to recognize amortization from accumulated other comprehensive income into net periodic benefit costs of $0.2 million for the net actuarial loss during 2010.
Information for pension plans with an accumulated benefit obligation in excess of plan assets was as follows:
| (in thousands) |
For the years ended December 31, | |||||||||||
| Defined Benefit Plans | SERP | |||||||||||
| 2009 | 2008 | 2009 | 2008 | |||||||||
| Accumulated benefit obligation |
$ | 42,754 | $ | 36,414 | $ | 22,159 | $ | 19,949 | ||||
| Fair value of plan assets |
33,963 | 24,339 | — | — | ||||||||
Information for pension plans with a projected benefit obligation in excess of plan assets was as follows:
| (in thousands) |
For the years ended December 31, | |||||||||||
| Defined Benefit Plans | SERP | |||||||||||
| 2009 | 2008 | 2009 | 2008 | |||||||||
| Projected benefit obligation |
$ | 51,295 | $ | 47,076 | $ | 25,541 | $ | 22,127 | ||||
| Fair value of plan assets |
33,963 | 24,339 | — | — | ||||||||
Assumptions used to determine the defined benefit plans benefit obligations were as follows:
| For the years ended December 31, | ||||||||||||
| Defined Benefit Plans | SERP | |||||||||||
| 2009 | 2008 | 2009 | 2008 | |||||||||
| Discount rate |
6.20 | % | 6.25 | % | 6.00 | % | 6.25 | % | ||||
| Rate of compensation increases |
4.30 | % | 4.40 | % | 4.30 | % | 4.40 | % | ||||
Plan Assets – Our investment policy is to maximize the total rate of return on plan assets to meet the long-term funding obligations of the plan. Plan assets are invested using a combination of active management and passive investment strategies. Risk is controlled through diversification among multiple asset classes, managers, styles, and securities. Risk is further controlled both at the manager and asset class level by assigning return targets and evaluating performance against these targets. Information related to our pension plan asset allocations by asset category were as follows:
| Target Allocations as of December 31, |
Percentage of plan assets as of December 31, |
||||||||
| 2010 | 2009 | 2008 | |||||||
| US equity securities |
45 | % | 54 | % | 49 | % | |||
| Non-US equity securities |
20 | 13 | 12 | ||||||
| Real estate |
5 | 2 | 5 | ||||||
| Fixed-income securities |
30 | 31 | 34 | ||||||
| Total |
100 | % | 100 | % | 100 | % | |||
F-42
Table of Contents
U.S. equity securities include common stocks of large, medium, and small companies which are predominantly U.S. based. Non-U.S. equity securities include companies domiciled outside the U.S. which are in various industries and countries and through a range of market capitalizations. Fixed-income securities include securities issued or guaranteed by the U.S. government and corporate debt obligations, as well as investments in hedge fund products. Real estate investments include but are not limited to investments in office, retail, apartment and industrial properties.
Fair Value Measurements – The following table sets forth our plan asset categories that are measured at fair value on a recurring basis at December 31, 2009 and the level of inputs utilized for fair value. Plan assets are classified in one of the three levels which are described below:
| • | Level 1 — Quoted prices in active markets for identical assets or liabilities. |
| • | Level 2 — Inputs, other than quoted market prices in active markets, that are observable either directly or indirectly. |
| • | Level 3 — Unobservable inputs based on our own assumptions. |
| (in thousands) |
As of December 31, 2009 | |||||||||||
| Total | Level 1 | Level 2 | Level 3 | |||||||||
| US equity securities |
||||||||||||
| Common/collective trust funds |
$ | 18,368 | $ | 18,368 | ||||||||
| Non-US equity securities |
||||||||||||
| Common/collective trust funds |
4,436 | 4,436 | ||||||||||
| Fixed income securities |
||||||||||||
| Common/collective trust funds |
10,236 | 10,236 | ||||||||||
| Hedge funds |
169 | $ | 169 | |||||||||
| Real estate |
||||||||||||
| Common/collective trust funds |
733 | 733 | ||||||||||
| Subtotal |
$ | 33,942 | $ | 33,040 | $ | 902 | ||||||
| Cash |
21 | $ | 21 | |||||||||
| Total |
$ | 33,963 | $ | 21 | $ | 33,040 | $ | 902 | ||||
Common/collective trust funds are typically valued at their net asset values that are calculated by the investment manager or sponsor of the fund and have daily or monthly liquidity.
Some of our assets, real estate and hedge funds, do not have readily determinable market values given the specific investment structures involved and the nature of the underlying investments. For assets without readily determinable values, estimates were derived from investment manager discussions focusing on underlying fundamentals and significant events. For those investments reported on a one-quarter lagged basis (real estate) we use net asset values, adjusted for subsequent cash flows and significant events. The following table presents a reconciliation of Level 3 assets held during the year ended December 31, 2009:
| (in thousands) |
January 1, 2009 Balance |
Net Realized and Unrealized Gains/ (Losses) |
Net Purchases, Issuances and Settlements |
Net Transfers Into/(Out of) Level 3 |
December 31, 2009 Balance | ||||||||||||
| Fixed income securities |
|||||||||||||||||
| Hedge funds |
$ | 432 | $ | (85 | ) | $ | (178 | ) | $ | $ | 169 | ||||||
| Real estate |
|||||||||||||||||
| Common/collective trust funds |
1,225 | (492 | ) | 733 | |||||||||||||
| Total |
$ | 1,657 | $ | (577 | ) | $ | (178 | ) | $ | $ | 902 | ||||||
Cash Flows - We anticipate contributing $2.6 million to fund current benefit payments for the non-qualified SERP plan in 2010. We have met the minimum funding requirements for our SNI Pension Plan. However, we anticipate making discretionary contributions to the SNI Pension Plan totaling $6.0 million in 2010.
The estimated future benefit payments expected to be paid for the next ten years are as follows:
| (in thousands) |
Defined Benefit Plans |
SERP | ||||
| 2010 |
$ | 2,927 | $ | 2,575 | ||
| 2011 |
3,023 | 2,955 | ||||
| 2012 |
3,799 | 4,566 | ||||
| 2013 |
3,832 | 3,880 | ||||
| 2014 |
3,792 | 3,388 | ||||
| 2015 - 2019 |
21,582 | 15,218 | ||||
F-43
Table of Contents
Defined Contribution Retirement Plans
Substantially all employees of the Company are also covered by a company-sponsored defined contribution plan (“DC Plan”). The Company matches a portion of employees’ voluntary contribution to this plan. Additionally, effective January 1, 2010, the Company will begin making additional contributions to eligible employee’s 401K accounts in accordance with enhanced provisions to the DC Plan. The amounts contributed to each employee’s account will be a percentage of the employee’s total eligible compensation based upon their age and service with the Company as of the first day of each year. Expense related to our defined contribution plans was $3.6 million in 2009, $3.4 million in 2008, and $2.5 million in 2007.
F-44
Table of Contents
20. Comprehensive Income (Loss)
Comprehensive income (loss) is as follows:
| ( in thousands ) |
For the years ended December 31, |
|||||||
| 2009 | 2008 | |||||||
| Comprehensive Income (Loss): |
||||||||
| Net income (loss) |
$ | 384,874 | $ | 115,948 | ||||
| Other comprehensive income (loss): |
||||||||
| Currency translation, net of income tax |
(38,782 | ) | (14,311 | ) | ||||
| Pension liability adjustments, net of income tax |
4,588 | 4,399 | ||||||
| Total comprehensive income (loss) |
350,680 | 106,036 | ||||||
| Comprehensive income attributable to noncontrolling interest |
85,845 | 92,391 | ||||||
| Comprehensive income (loss) attributable to SNI |
$ | 264,835 | $ | 13,645 | ||||
21. Segment Information
The Company determines its business segments based upon our management and internal reporting structure. Our reportable segments are strategic businesses that offer different products and services.
Lifestyle Media includes our national television networks, HGTV, Food Network, Travel Channel, DIY, GAC, FLN (soon to be rebranded as the Cooking Channel), and SN Digital which includes Web sites that are associated with the aforementioned television brands and other Internet-based businesses serving food or shelter related categories such as RecipeZaar.com, HGTVPro.com, and FrontDoor.com. Our networks also operate internationally through licensing agreements with other entities. We own approximately 69% of Food Network and 65% of Travel. Each of our networks is distributed by cable, telecommunications and satellite television systems. Lifestyle Media earns revenue primarily from the sale of advertising time and from affiliate fees from cable and satellite television systems.
Interactive Services includes our online comparison shopping service, Shopzilla, and its related online comparison shopping brands, bizrate and beso. Our product comparison shopping services help consumers find products offered for sale on the Web by online retailers. Shopzilla also operates a Web-based consumer feedback network within the bizrate brand that collects millions of consumer reviews of stores and products each year. The Interactive Services businesses earn revenue primarily from referral fees and commissions paid by participating online retailers.
The accounting policies of each of our business segments are those described in Note 2-Summary of Significant Accounting Policies.
Each of our segments may provide advertising, programming or other services to our other reportable segments. In addition, certain corporate costs and expenses, including information technology, pensions and other employee benefits, and other shared services, are allocated to our business segments. The allocations are generally amounts agreed upon by management, which may differ from amounts that would be incurred if such services were purchased separately by the business segment. Corporate assets are primarily cash and cash equivalents, property and equipment primarily used for corporate purposes, and deferred income taxes.
Our chief operating decision maker evaluates the operating performance of the reportable segments and makes decisions about the allocation of resources to the reportable segments using a measure we call segment profit. Segment profit excludes interest, income taxes, depreciation and amortization, divested operating units, restructuring activities, investment results and certain other items that are included in net income determined in accordance with accounting principles generally accepted in the United States of America.
F-45
Table of Contents
Information regarding our business segments is as follows:
| (in thousands) |
For the years ended December 31, | |||||||||||
| 2009 | 2008 | 2007 | ||||||||||
| Segment operating revenues: |
||||||||||||
| Lifestyle Media |
$ | 1,366,802 | $ | 1,312,313 | $ | 1,184,901 | ||||||
| Interactive Services |
173,920 | 238,469 | 219,886 | |||||||||
| Corporate |
675 | 86 | ||||||||||
| Intersegment eliminations |
(149 | ) | (169 | ) | ||||||||
| Total operating revenues |
$ | 1,541,248 | $ | 1,550,699 | $ | 1,404,787 | ||||||
| Segment profit (loss): |
||||||||||||
| Lifestyle Media |
$ | 636,865 | $ | 632,059 | $ | 587,411 | ||||||
| Interactive Services |
30,735 | 62,534 | 46,761 | |||||||||
| Corporate |
(65,952 | ) | (49,178 | ) | (35,006 | ) | ||||||
| Depreciation and amortization of intangibles |
(81,470 | ) | (66,337 | ) | (66,113 | ) | ||||||
| Write-down of goodwill and other intangible assets |
(243,700 | ) | ||||||||||
| Losses on disposal of property, plant and equipment |
(2,509 | ) | (788 | ) | (437 | ) | ||||||
| Interest expense |
(2,810 | ) | (14,207 | ) | (36,769 | ) | ||||||
| Travel Channel financing costs |
(12,118 | ) | ||||||||||
| Equity in earnings of affiliates |
18,626 | 15,498 | 17,603 | |||||||||
| Gains (losses) on repurchases of debt |
(26,380 | ) | 1,245 | |||||||||
| Miscellaneous, net |
(1,110 | ) | 804 | 2,261 | ||||||||
| Income from continuing operations before income taxes |
$ | 520,257 | $ | 310,305 | $ | 516,956 | ||||||
| Depreciation: |
||||||||||||
| Lifestyle Media |
$ | 32,190 | $ | 24,330 | $ | 19,923 | ||||||
| Interactive Services |
24,579 | 20,837 | 15,792 | |||||||||
| Corporate |
1,786 | 259 | 1,002 | |||||||||
| Total depreciation |
$ | 58,555 | $ | 45,426 | $ | 36,717 | ||||||
| Amortization of intangible assets: |
||||||||||||
| Lifestyle Media |
$ | 6,632 | $ | 3,979 | $ | 3,269 | ||||||
| Interactive Services |
16,283 | 16,932 | 26,127 | |||||||||
| Total amortization of intangible assets |
$ | 22,915 | $ | 20,911 | $ | 29,396 | ||||||
| (in thousands) |
For the years ended December 31, | ||||||||
| 2009 | 2008 | 2007 | |||||||
| Additions to property, plant and equipment: |
|||||||||
| Lifestyle Media |
$ | 66,112 | $ | 57,074 | $ | 35,306 | |||
| Interactive Services |
20,677 | 17,878 | 22,800 | ||||||
| Corporate |
4,925 | 3,283 | 2,223 | ||||||
| Total additions to property, plant and equipment |
$ | 91,714 | $ | 78,235 | $ | 60,329 | |||
| Business acquisitions and other additions to long-lived assets: |
|||||||||
| Lifestyle Media |
$ | 1,271,264 | $ | 290,871 | $ | 317,566 | |||
| Interactive Services |
130 | ||||||||
| Total |
$ | 1,271,394 | $ | 290,871 | $ | 317,566 | |||
| Assets: |
|||||||||
| Lifestyle Media |
$ | 2,620,095 | $ | 1,439,731 | $ | 1,404,188 | |||
| Interactive Services |
269,755 | 296,505 | 535,517 | ||||||
| Corporate |
73,212 | 14,904 | 38,348 | ||||||
| Total assets of continuing operations |
2,963,062 | 1,751,140 | 1,978,053 | ||||||
| Discontinued operations |
22,068 | 39,774 | |||||||
| Total assets |
$ | 2,963,062 | $ | 1,773,208 | $ | 2,017,827 | |||
No single customer provides more than 10% of our revenue. The Company earns international revenues from its Shopzilla business. It also earns international revenue from HGTV, Food Network and DIY programming in international markets.
Other additions to long-lived assets include investments, capitalized intangible assets, and Lifestyle Media’s capitalized programs and network launch incentives.
22. Commitments and Contingencies
We are involved in litigation arising in the ordinary course of business, none of which is expected to result in material loss.
Minimum payments on noncancelable leases at December 31, 2009, were: 2010, $18.1 million; 2011, $16.7 million; 2012, $16.9 million; 2013, $17.3 million; 2014, $17.5 million; and later years, $44.4 million. We expect our operating leases will be replaced with leases for similar facilities upon their expiration. Rental expense for cancelable and noncancelable leases was $20.1 million in 2009, $20.3 million in 2008 and $15.7 million in 2007.
In the ordinary course of business, we enter into long-term contracts to obtain satellite transmission rights or to obtain other services. Liabilities for such commitments are recorded when the related services are rendered. Minimum payments on such contractual commitments at December 31, 2009, were: 2010, $59.8 million; 2011, $31.8 million; 2012, $25.4 million;
F-46
Table of Contents
2013, $19.7 million; 2014, $15.4 million; and later years, $47.2 million. We expect these contracts will be replaced with similar contracts upon their expiration.
23. Capital Stock and Stock Compensation Plans
Capital Stock – SNI’s capital structure includes Common Voting Shares and Class A Common shares. The articles of incorporation provide that the holders of Class A Common shares, who are not entitled to vote on any other matters except as required by Ohio law, are entitled to elect the greater of three or one-third of the directors. The Common Voting Shares and Class A Common shares have equal dividend distribution rights.
Incentive Plans – In connection with the Separation, we implemented a new stock based compensation plan (Scripps Networks Interactive, Inc. 2008 Long-Term Incentive Plan) (the “Plan”) and registered 19,000,000 common shares available for issuance under the Plan. E. W. Scripps share based awards, which included stock options and restricted stock awards, held by our employees and certain former employees of E. W. Scripps were converted to equivalent share based awards of Scripps Networks Interactive, Inc. The conversions were based on the ratio of the market price of each company’s publicly traded common stock at the time of Separation. The Plan is administered by our Board of Directors. As of December 31, 2009, options with respect to 8,016,108 shares are outstanding under the Plan. In addition, a total of 1,095,147 restricted stock awards are outstanding under the Plan as of December 31, 2009.
The Plan provides for long-term performance compensation for key employees and members of the Board of Directors. A variety of discretionary awards for employees and non-employee directors are authorized under the Plan, including incentive or non-qualified stock options, stock appreciation rights, restricted or nonrestricted stock awards and performance awards. The vesting of such awards may be conditioned upon either a specified period of time or the attainment of specific performance goals as determined by the administrator of the plan. The option price and term are also subject to determination by the administrator with respect to each grant. Option prices are generally expected to be set at the market price of our common stock at date of grant and option terms are not expected to exceed ten years. The Plan expires in 2018, except for options then outstanding.
We satisfy stock option exercises and vested stock awards with newly issued shares. Shares available for future stock compensation grants totaled 7.9 million as of December 31, 2009.
Stock Options – Stock options grant the recipient the right to purchase Class A Common shares at not less than 100% of the fair market value on the date the option is granted. Stock options granted to employees generally vest over a three year period, conditioned upon the individual’s continued employment through that period. Vesting of awards is immediately accelerated upon the retirement, death or disability of the employee or upon a change in control of the Company or in the business in which the individual is employed. Unvested awards are forfeited if employment is terminated for other reasons. Options granted to employees prior to 2005 generally expire 10 years after grant, while options granted in 2005 and later generally have 8-year terms. Stock options granted to non-employee directors generally vest over a one-year period and have a 10-year term.
On June 1, 2009 the Company offered eligible participants, the opportunity to exchange certain outstanding vested or unvested stock options (the “Exchange Offer”) for a lesser number of restricted Class A Common Shares of equal value to the options. Each share of restricted stock granted in the option exchange will vest over two years, with 50 percent vesting on each of the first and second anniversaries of the restricted shares’ issue date. Pursuant to the Exchange Offer, 834,946 shares of restricted stock were issued in exchange for 4,147,951 options surrendered.
The following table summarizes information about stock option transactions:
| (shares in thousands) |
Number of Shares |
Weighted- Average Exercise Price |
Range of Exercise Prices | ||||||
| Outstanding at December 31, 2008 |
11,890 | $ | 38.75 | $ | 20 - $50 | ||||
| Granted in 2009 |
1,717 | $ | 21.41 | $ | 20 - $37 | ||||
| Exercised in 2009 |
(1,142 | ) | $ | 24.30 | $ | 21 - $40 | |||
| Exchanged in 2009 |
(4,148 | ) | $ | 41.85 | $ | 35 - $50 | |||
| Forfeited in 2009 |
(301 | ) | $ | 34.82 | $ | 20 - $40 | |||
| Outstanding at December 31, 2009 |
8,016 | $ | 36.20 | $ | 20 - $49 | ||||
| Options exercisable at December 31, 2009 |
6,156 | $ | 40.09 | $ | 20 - $49 | ||||
The following table presents additional information about exercises of stock options:
| (in thousands) |
For the years ended December 31, | ||||||||
| 2009 | 2008 | 2007 | |||||||
| Cash received upon exercise |
$ | 27,735 | $ | 5,873 | $ | 3,257 | |||
| Intrinsic value (market value on date of exercise less exercise price) |
6,863 | 4,068 | 1,447 | ||||||
F-47
Table of Contents
Substantially all options granted prior to 2008 are exercisable. Options generally become exercisable over a three-year period. Information about options outstanding and options exercisable by year of grant is as follows:
| ( dollars in millions, except per share amounts ) | Range of Exercise Prices |
Average Remaining Term (in years) |
|||||||||||||||||||
| Options Outstanding | Options Exercisable | ||||||||||||||||||||
| Year of Grant |
Options on Shares Outstanding |
Weighted Average Exercise Price |
Aggregate Intrinsic Value (in millions) |
Options on Shares Exercisable |
Weighted Average Exercise Price |
Aggregate Intrinsic Value (in millions) | |||||||||||||||
| 2000 - expire in 2010 |
$ | 20 - 28 | 0.50 | 69,175 | $ | 23.56 | $ | 0.5 | 69,175 | $ | 23.56 | $ | 0.5 | ||||||||
| 2001 - expire in 2011 |
27 - 33 | 1.52 | 899,156 | 30.00 | 0.4 | 899,156 | 30.00 | 0.4 | |||||||||||||
| 2002 - expire in 2012 |
35 - 36 | 2.57 | 843,834 | 35.17 | — | 843,834 | 35.17 | — | |||||||||||||
| 2003 - expire in 2013 |
37 - 43 | 3.43 | 868,131 | 37.46 | — | 868,131 | 37.46 | — | |||||||||||||
| 2004 - expire in 2014 |
43 - 49 | 4.38 | 1,243,317 | 45.85 | — | 1,243,317 | 45.85 | — | |||||||||||||
| 2005 - expire in 2013 |
43 - 48 | 3.47 | 882,501 | 43.73 | — | 882,501 | 43.73 | — | |||||||||||||
| 2006 - expire in 2014 |
40 - 46 | 4.47 | 881,184 | 45.21 | — | 881,184 | 45.21 | — | |||||||||||||
| 2007 - expire in 2015 |
39 - 46 | 5.36 | 430,743 | 44.81 | — | 380,460 | 44.71 | — | |||||||||||||
| 2008 - expire in 2016 |
40 - 43 | 6.38 | 220,746 | 40.00 | — | 87,778 | 40.24 | — | |||||||||||||
| 2009 - expire in 2017 |
20 - 37 | 7.28 | 1,677,321 | 21.43 | |||||||||||||||||
| Total |
$ | 20 - 49 | 3.94 | 8,016,108 | $ | 36.20 | $ | 0.9 | 6,155,536 | $ | 40.09 | $ | 0.9 | ||||||||
Restricted Stock – Awards of Class A Common shares (“restricted stock”) generally require no payment by the employee. Restricted stock awards generally vest over a three-year period, conditioned upon the individual’s continued employment through that period. The vesting of certain awards may also be accelerated if certain performance targets are met. Vesting of awards is immediately accelerated upon the retirement, death or disability of the employee or upon a change in control of SNI or in the business in which the individual is employed. Unvested awards are forfeited if employment is terminated for other reasons. Awards are nontransferable during the vesting period, but the shares are entitled to all the rights of an outstanding share. There are no post-vesting restrictions on shares granted to employees and non-employee directors.
At the election of the employee, restricted stock awards may be converted to restricted stock units (“RSU”) prior to vesting. RSUs are convertible into equal number of Class A Common shares at a specified time or times or upon the occurrence of a specified event, such as upon retirement, at the election of the employee.
Information related to restricted stock transactions is presented below:
| Number of Shares |
Grant Date Fair Value | ||||||||
| (shares in thousands) |
Weighted Average |
Range of Prices | |||||||
| Unvested shares at December 31, 2008 |
366 | $ | 44.71 | $ | 25 - $49 | ||||
| Shares awarded in 2009 |
67 | 26.78 | $ | 21 - $41 | |||||
| Shares awarded in connection with option exchange in 2009 |
835 | 27.84 | $ | 27.84 | |||||
| Shares vested in 2009 |
(169 | ) | 45.30 | $ | 25 - $49 | ||||
| Shares forfeited in 2009 |
(4 | ) | 29.89 | $ | 28 - $44 | ||||
| Unvested shares at December 31, 2009 |
1,095 | $ | 31.05 | $ | 21 - $49 | ||||
The following table presents additional information about restricted stock vesting:
| (in thousands) |
For the years ended December 31, | ||||||||
| 2009 | 2008 | 2007 | |||||||
| Fair value of shares vested |
$ | 3,735 | $ | 1,225 | $ | 5,373 | |||
Performance share awards with a target of 262,065 Class A Common shares were granted in 2009. The weighted-average price of an underlying Class A Common share on the dates of grant was $21.53. Performance share awards represent the right to receive a grant of restricted shares if certain performance measures are met. Each award specifies a target number of shares to be issued and the specific performance criteria that must be met. The number of shares that an employee receives may be less or more than the target number of shares depending on the extent to which the specified performance measures are met or exceeded. The shares earned are issued as restricted shares following the annual performance period and vest over a two year service period from the date of issuance.
Stock-Based Compensation – In accordance with share-based payment accounting guidance, compensation cost is based on the grant-date fair value of the award. The fair value of awards that grant the employee the right to the appreciation of the underlying shares, such as share options, is measured using a lattice-based binomial model. The fair value of awards that grant the employee the underlying shares is measured by the fair value of a Class A Common share.
Compensation costs, net of estimated forfeitures due to termination of employment or failure to meet performance targets, are recognized on a straight-line basis over the requisite service period of the award. The requisite service period is generally the vesting period stated in the award. However, because share compensation grants vest upon the retirement of the employee, grants to retirement-eligible employees are expensed immediately and grants to employees who will become retirement eligible prior to the end of the stated vesting period are expensed over such shorter period. The vesting of certain awards is also accelerated if performance measures are met. If it is expected those performance measures will be met, compensation costs are expensed over the accelerated vesting period.
F-48
Table of Contents
Compensation costs of stock options are estimated on the date of grant using a binomial lattice model. The weighted-average assumptions E. W. Scripps used in the model for pre-Separation grants in 2008 and 2007 are as follows:
| 2008 | 2007 | |||||||
| Weighted-average fair value of stock options granted |
$ | 9.18 | $ | 12.58 | ||||
| Assumptions used to determine fair value: |
||||||||
| Dividend yield |
1.3 | % | 1.0 | % | ||||
| Risk-free rate of return |
3.1 | % | 4.7 | % | ||||
| Expected life of options (years) |
6.00 | 5.35 | ||||||
| Expected volatility |
19.3 | % | 20.6 | % | ||||
The weighted-average assumptions Scripps Networks Interactive, Inc. used in the model for post-Separation grants are as follows:
| 2009 | 2008 | |||||||
| Weighted-average fair value of stock options granted |
$ | 6.10 | $ | 8.46 | ||||
| Assumptions used to determine fair value: |
||||||||
| Dividend yield |
1.5 | % | 0.8 | % | ||||
| Risk-free rate of return |
1.9 | % | 3.4 | % | ||||
| Expected life of options (years) |
5 | 5.45 | ||||||
| Expected volatility |
34.0 | % | 23.0 | % | ||||
Dividend yield considers our historical dividend yield paid and expected dividend yield over the life of the options. The risk-free rate is based on the U.S. Treasury yield curve in effect at the time of grant. The expected life of employee stock options represents the weighted-average period the stock options are expected to remain outstanding and is a derived output of the valuation model. Expected volatility is based on a combination of historical share price volatility for a longer period and the implied volatility of exchange-traded options on our Class A Common shares.
For periods presented prior to the Separation, stock-based compensation expense attributable to employees of the Company has been allocated in the consolidated and combined statements of operations. In addition, stock-based compensation expense attributable to E. W. Scripps corporate employees has been allocated to the Company based on revenue. For periods after the separation, stock-based compensation costs represent expenses from newly issued SNI awards and expenses from E. W. Scripps awards converted to equivalent share based awards in SNI stock. A summary of stock-based compensation costs is as follows:
| (in thousands) |
For the years ended December 31, | ||||||||
| 2009 | 2008 | 2007 | |||||||
| Allocated stock-based compensation costs |
$ | 8,157 | $ | 21,300 | |||||
| Compensation cost on SNI stock awards |
$ | 17,487 | 11,035 | ||||||
| Total stock-based compensation costs |
$ | 17,487 | $ | 19,192 | $ | 21,300 | |||
As of December 31, 2009, $5.8 million of total unrecognized stock-based compensation cost related to stock options is expected to be recognized over a weighted-average period of 1.9 years. In addition, $5.2 million of total unrecognized stock-based compensation cost related to restricted stock is expected to be recognized over a weighted-average period of 1.4 years.
As a result of the distribution of SNI to the shareholders of E. W. Scripps, SNI employees holding share-based equity awards, including share options and restricted shares, have received modified awards in our Company’s stock. A charge of $4.9 million was recorded at the time of modification related to our employees. As of December 31, 2009, the modification also created approximately $0.9 million of unrecognized stock based compensation associated with our unvested stock options which is expected to be recognized over a range of 1 to 2 years.
As of December 31, 2009, the Exchange Offer created approximately $0.3 million of unrecognized stock based compensation as a result of the Exchange Offer that will be recognized over the modified two year vesting period of the newly issued restricted stock.
F-49
Table of Contents
24. Summarized Quarterly Financial Information (Unaudited)
Summarized financial information is as follows:
| (in thousands, except per share data) 2009 |
1st Quarter |
2nd Quarter |
3rd Quarter |
4th Quarter |
Total | |||||||||||||||
| Operating revenues |
$ | 355,776 | $ | 391,272 | $ | 364,461 | $ | 429,739 | $ | 1,541,248 | ||||||||||
| Costs and expenses |
(216,553 | ) | (225,129 | ) | (220,197 | ) | (277,721 | ) | (939,600 | ) | ||||||||||
| Depreciation and amortization of intangible assets |
(18,401 | ) | (19,503 | ) | (20,666 | ) | (22,900 | ) | (81,470 | ) | ||||||||||
| Gains (losses) on disposal of PP&E |
(71 | ) | 2 | (898 | ) | (1,542 | ) | (2,509 | ) | |||||||||||
| Interest expense |
(337 | ) | (399 | ) | (285 | ) | (1,789 | ) | (2,810 | ) | ||||||||||
| Travel Channel financing costs |
(12,118 | ) | (12,118 | ) | ||||||||||||||||
| Equity in earnings of affiliates |
2,093 | 5,868 | 4,873 | 5,792 | 18,626 | |||||||||||||||
| Miscellaneous, net |
360 | 240 | (1,321 | ) | (389 | ) | (1,110 | ) | ||||||||||||
| Provision for income taxes |
(41,401 | ) | (47,504 | ) | (41,544 | ) | (31,025 | ) | (161,474 | ) | ||||||||||
| Income from continuing operations, net of tax |
81,466 | 104,847 | 84,423 | 88,047 | 358,783 | |||||||||||||||
| Income (loss) from discontinued operations, net of tax |
(1,567 | ) | (994 | ) | 676 | 27,976 | 26,091 | |||||||||||||
| Net income |
79,899 | 103,853 | 85,099 | 116,023 | 384,874 | |||||||||||||||
| Less: net income attributable to noncontrolling interests |
(19,771 | ) | (24,329 | ) | (19,779 | ) | (21,669 | ) | (85,548 | ) | ||||||||||
| Net income attributable to SNI |
$ | 60,128 | $ | 79,524 | $ | 65,320 | $ | 94,354 | $ | 299,326 | ||||||||||
| Basic income (loss) per share: |
||||||||||||||||||||
| Income from continuing operations attributable to SNI common shareholders |
$ | .38 | $ | .49 | $ | .39 | $ | .40 | $ | 1.66 | ||||||||||
| Income (loss) from discontinued operations, net of tax, attributable to SNI common shareholders |
(.01 | ) | (.01 | ) | .00 | .17 | .16 | |||||||||||||
| Net income attributable to SNI common shareholders |
$ | .37 | $ | .49 | $ | .40 | $ | .57 | $ | 1.81 | ||||||||||
| Diluted income (loss) per share: |
||||||||||||||||||||
| Income from continuing operations attributable to SNI common shareholders |
$ | .38 | $ | .49 | $ | .39 | $ | .40 | $ | 1.65 | ||||||||||
| Income (loss) from discontinued operations, net of tax, attributable to SNI common shareholders |
(.01 | ) | (.01 | ) | .00 | .17 | .16 | |||||||||||||
| Net income attributable to SNI common shareholders |
$ | .37 | $ | .48 | $ | .39 | $ | .57 | $ | 1.81 | ||||||||||
| Amounts attributable to SNI: |
||||||||||||||||||||
| Income from continuing operations |
$ | 61,695 | $ | 80,518 | $ | 64,644 | $ | 66,378 | $ | 273,235 | ||||||||||
| Income (loss) from discontinued operations |
(1,567 | ) | (994 | ) | 676 | 27,976 | 26,091 | |||||||||||||
| Net income attributable to SNI |
$ | 60,128 | $ | 79,524 | $ | 65,320 | $ | 94,354 | $ | 299,326 | ||||||||||
| Weighted average shares outstanding: |
||||||||||||||||||||
| Basic |
163,516 | 163,954 | 165,329 | 164,574 | 164,921 | |||||||||||||||
| Diluted |
163,907 | 164,396 | 165,736 | 165,608 | 165,381 | |||||||||||||||
| Cash dividends per share of common stock |
$ | .08 | $ | .08 | $ | .08 | $ | .08 | $ | .30 | ||||||||||
| 2008 |
1st Quarter |
2nd Quarter |
3rd Quarter |
4th Quarter |
Total | |||||||||||||||
| Operating revenues |
$ | 374,711 | $ | 406,460 | $ | 364,187 | $ | 405,341 | $ | 1,550,699 | ||||||||||
| Costs and expenses |
(224,184 | ) | (227,572 | ) | (230,468 | ) | (223,060 | ) | (905,284 | ) | ||||||||||
| Depreciation and amortization of intangible assets |
(15,730 | ) | (16,242 | ) | (16,683 | ) | (17,682 | ) | (66,337 | ) | ||||||||||
| Write-down of Shopzilla goodwill |
(243,700 | ) | (243,700 | ) | ||||||||||||||||
| Gains (losses) on disposal of PP&E |
(764 | ) | (71 | ) | 47 | (788 | ) | |||||||||||||
| Interest expense |
(5,837 | ) | (5,273 | ) | (2,199 | ) | (898 | ) | (14,207 | ) | ||||||||||
| Equity in earnings of affiliates |
3,676 | 5,083 | 5,418 | 1,321 | 15,498 | |||||||||||||||
| Losses on repurchases of debt |
(26,380 | ) | (26,380 | ) | ||||||||||||||||
| Miscellaneous, net |
(994 | ) | (108 | ) | 1,113 | 793 | 804 | |||||||||||||
| Provision for income taxes |
(43,271 | ) | (58,647 | ) | (43,841 | ) | (48,951 | ) | (194,710 | ) | ||||||||||
| Income (loss) from continuing operations, net of tax |
87,607 | 77,250 | 77,527 | (126,789 | ) | 115,595 | ||||||||||||||
| Income (loss) from discontinued operations, net of tax |
1,165 | 455 | (879 | ) | (388 | ) | 353 | |||||||||||||
| Net income (loss) |
88,772 | 77,705 | 76,648 | (127,177 | ) | 115,948 | ||||||||||||||
| Less: net income attributable to noncontrolling interest |
(22,267 | ) | (24,433 | ) | (19,321 | ) | (26,370 | ) | (92,391 | ) | ||||||||||
| Net income (loss) attributable to SNI |
$ | 66,505 | $ | 53,272 | $ | 57,327 | $ | (153,547 | ) | $ | 23,557 | |||||||||
| Basic income (loss) per share: |
||||||||||||||||||||
| Income (loss) from continuing operations attributable to SNI common shareholders |
$ | .40 | $ | .32 | $ | .36 | ($ | .94 | ) | $ | .14 | |||||||||
| Income (loss) from discontinued operations, net of tax, attributable to SNI common shareholders |
.01 | .00 | (.01 | ) | .00 | .00 | ||||||||||||||
| Net income (loss) attributable to SNI common shareholders |
$ | .41 | $ | .33 | $ | .35 | ($ | .94 | ) | $ | .14 | |||||||||
| Diluted income (loss) per share: |
||||||||||||||||||||
| Income (loss) from continuing operations attributable to SNI common shareholders |
$ | .40 | $ | .32 | $ | .35 | ($ | .94 | ) | $ | .14 | |||||||||
| Income (loss) from discontinued operations, net of tax, attributable to SNI common shareholders |
.01 | .00 | (.01 | ) | .00 | .00 | ||||||||||||||
| Net income (loss) attributable to SNI common shareholders |
$ | .41 | $ | .33 | $ | .35 | ($ | .94 | ) | $ | .14 | |||||||||
| Amounts attributable to SNI: |
||||||||||||||||||||
| Income (loss) from continuing operations |
$ | 65,340 | $ | 52,817 | $ | 58,206 | $ | (153,159 | ) | $ | 23,204 | |||||||||
| Income (loss) from discontinued operations |
1,165 | 455 | (879 | ) | (388 | ) | 353 | |||||||||||||
| Net income (loss) attributable to SNI |
$ | 66,505 | $ | 53,272 | $ | 57,327 | $ | (153,547 | ) | $ | 23,557 | |||||||||
| Weighted average shares outstanding: |
||||||||||||||||||||
| Basic |
163,466 | 163,466 | 163,152 | 163,338 | 163,245 | |||||||||||||||
| Diluted |
163,466 | 163,466 | 164,472 | 163,338 | 164,131 | |||||||||||||||
| Cash dividends per share of common stock |
$ | .08 | $ | .08 | $ | .15 | ||||||||||||||
The sum of the quarterly net income per share amounts may not equal the reported annual amount because each is computed independently based upon the weighted-average number of shares outstanding for the period.
F-50
Table of Contents
Scripps Networks Interactive, Inc.
Index to Consolidated and Combined Financial Statement Schedules
| Valuation and Qualifying Accounts |
S-2 |
S-1
Table of Contents
| Valuation and Qualifying Accounts for the Years Ended December 31, 2009, 2008 and 2007 | Schedule II |
| Column A | Column B | Column C | Column D | Column E | Column F | |||||||||
| (in thousands) | Increase | |||||||||||||
| Classification |
Balance Beginning of Period |
Additions Charged to Revenues, Costs, Expenses |
Deductions Amounts Charged Off-Net |
(Decrease) Recorded Acquisitions (Divestitures) |
Balance End of Period | |||||||||
| Allowance for Doubtful Accounts Receivable Year Ended December 31: |
||||||||||||||
| 2009 |
$ | 5,014 | $ | 1,896 | $ | 1,323 | $ | 5,587 | ||||||
| 2008 |
3,945 | 1,825 | 756 | 5,014 | ||||||||||
| 2007 |
10,444 | 2,075 | 8,574 | 3,945 | ||||||||||
S-2
Table of Contents
Scripps Networks Interactive, Inc.
Index to Exhibits
| Exhibit Number |
Description of Item |
Footnote | Exhibit No Incorporated | |||
| 2.1 | Separation and Distribution Agreement between Scripps Networks Interactive, Inc. and The E. W. Scripps Company | (1) | 2.01 | |||
| 2.2 | Contribution Agreement among TCM Parent, LLC, TCM Sub, LLC, Gulliver Media Holdings, LLC, Scripps Networks Interactive, Inc., Cox TMI, Inc., and Cox Communications, Inc. |
(10) | 2.1 | |||
| 3.1 | Amended and Restated Articles of Incorporation of Scripps Networks Interactive, Inc. | (9) | 3.1 | |||
| 3.2 | Amended and Restated Code of Regulations of Scripps Networks Interactive, Inc. | (9) | 3.2 | |||
| 4.1 | Specimen Certificate of Class A Common Shares of Scripps Networks Interactive, Inc. | (5) | 4.1 | |||
| 4.10 | Indenture (3.55% Senior Notes Due 2015) Among TCM Sub LLC and Scripps Networks Interactive, Inc., as guarantor |
(12) | 4.1 | |||
| 10.1 | Transition Services Agreement between Scripps Networks Interactive, Inc. and The |
(2) | 10.11 | |||
| 10.2 | Tax Allocation Agreement between Scripps Networks Interactive, Inc. and The |
(2) | 10.13 | |||
| 10.3 | Employee Matters Agreement between Scripps Networks Interactive, Inc. and The |
(2) | 10.12 | |||
| 10.4 | 2008 Long-Term Incentive Plan | (5) | 10.4 | |||
| 10.5 | Form of Nonqualified Stock Option Agreement | (4) | 10.4 | |||
| 10.6 | Form of Performance-Based Restricted Share Award Agreement | (5) | 10.6 | |||
| 10.7 | Form of Restricted Share Award Agreement | (5) | 10.7 | |||
| 10.8 | Form of Performance-Based Restricted Stock-Unit Agreement | (4) | 10.3 | |||
| 10.9 | Executive Annual Incentive Plan | (5) | 10.9 | |||
| 10.10 | Executive Deferred Compensation Plan | (5) | 10.10 | |||
| 10.10.B | Amendment to Executive Deferred Compensation Plan | |||||
| 10.11 | 2008 Deferred Compensation and Stock Plan for Directors | (5) | 10.11 | |||
| 10.12 | Executive Change in Control Plan (as amended and restated on February 19, 2009) | (4) | 10.2 | |||
| 10.13 | Assignment and Assumption Agreement and Consent for Kenneth W. Lowe | (5) | 10.13 | |||
| 10.20 | Supplemental Executive Retirement Plan. | (5) | 10.20 | |||
| 10.20.B | Amendment to Supplemental Executive Retirement Plan | |||||
| 10.21 | Employee Stock Purchase Plan. | (5) | 10.21 | |||
| 10.22 | Scripps Family Agreement. | (5) | 10.22 | |||
| 10.23 | Scripps Networks Interactive, Inc. Supplemental Contribution Plan | |||||
| 10.30 | Employment Agreement between the Company and Kenneth W. Lowe | (6) | 10.63 | |||
| 10.30.B | Amendment No. 2 to Employment Agreement between the Company and Kenneth W. Lowe | (7) | 10.63.B | |||
| 10.30.C | Amendment No. 3 to Employment Agreement between the Company and Kenneth W. Lowe | (8) | 10.63.C | |||
| 10.30.D | Amendment No. 4 to Employment Agreement between the Company and Kenneth W. Lowe | (9) | 10.30.D | |||
| 10.30.E | Amendment No. 5 to Employment Agreement between the Company and Kenneth W. Lowe | (4) | 10.1 | |||
Table of Contents
Scripps Networks Interactive, Inc.
Index to Exhibits (continued)
| Exhibit |
Description of Item |
Footnote | Exhibit No Incorporated | |||
| 10.31 | Employment Agreement between the Company and Anatolio B. Cruz III | (3) | 10.31 | |||
| 10.32 | Employment Agreement between the Company and Joseph G. NeCastro | (3) | 10.32 | |||
| 10.33 | Employment Agreement between the Company and Mark S. Hale | (3) | 10.33 | |||
| 10.34 | Employment Agreement between the Company and John F. Lansing | (3) | 10.34 | |||
| 10.40 | Five-Year Competitive Advance and Revolving Credit Facility Agreement | (2) | 10.20 | |||
| 10.40.B | Amendment No. 1 to the Five-Year Competitive Advance and Revolving Credit Facility Agreement |
(11) | 10.1 | |||
| 14 | Code of Ethics for CEO and Senior Financial Officers | (5) | 14 | |||
| 21 | Material Subsidiaries of the Company | |||||
| 23 | Consent of Independent Registered Public Accounting Firm | |||||
| 31(a) | Section 302 Certifications | |||||
| 31(b) | Section 302 Certifications | |||||
| 32(a) | Section 906 Certifications | |||||
| 32(b) | Section 906 Certifications | |||||
| (1) | Incorporated by reference to the Scripps Networks Interactive, Inc. Current Report on Form 8-K dated June 12, 2008. |
| (2) | Incorporated by reference to the Scripps Networks Interactive, Inc. Current Report on Form 8-K dated June 30, 2008. |
| (3) | Incorporated by reference to the Scripps Networks Interactive, Inc. Quarterly Report on Form 10-Q for the quarterly period ended September 30, 2008. |
| (4) | Incorporated by reference to the Scripps Networks Interactive, Inc. Current Report on Form 8-K dated February 19, 2009. |
| (5) | Incorporated by reference to Registration Statement on Form 10 dated June 11, 2008. |
| (6) | Incorporated by reference to The E. W. Scripps Company Annual Report on Form 10-K for the year ended December 31, 2003. |
| (7) | Incorporated by reference to The E. W. Scripps Company Quarterly Report on Form 10-Q for the quarterly period ended June 30, 2006. |
| (8) | Incorporated by reference to The E. W. Scripps Company Current Report on Form 8-K dated July 31,2007. |
| (9) | Incorporated by reference to the Scripps Networks Interactive, Inc. Report on Form 10-K for the year ended December 31, 2008. |
| (10) | Incorporated by reference to the Scripps Networks Interactive, Inc. Current Report on Form 8-K dated November 10, 2009. |
| (11) | Incorporated by reference to the Scripps Networks Interactive, Inc. Current Report on Form 8-K dated December 11, 2009. |
| (12) | Incorporated by reference to the Scripps Networks Interactive, Inc. Current Report on Form 8-K dated December 21, 2009. |