Attached files
| file | filename |
|---|---|
| EX-23 - SOTHEBYS | c60513_ex23.htm |
| EX-24 - SOTHEBYS | c60513_ex24.htm |
| EX-21 - SOTHEBYS | c60513_ex21.htm |
| EX-32.2 - SOTHEBYS | c60513_ex32-2.htm |
| EX-31.1 - SOTHEBYS | c60513_ex31-1.htm |
| EX-32.1 - SOTHEBYS | c60513_ex32-1.htm |
| EX-31.2 - SOTHEBYS | c60513_ex31-2.htm |
| EX-10.18 - SOTHEBYS | c60513_ex10-18.htm |
UNITED STATES
SECURITIES AND EXCHANGE COMMISSION
WASHINGTON,
D.C. 20549
|
|
FORM 10-K
|
|
|
|
|
(Mark One) |
||
|
x |
|
ANNUAL REPORT PURSUANT TO SECTION 13 OR 15(d) OF THE SECURITIES EXCHANGE ACT OF 1934 |
|
|
|
FOR THE FISCAL YEAR ENDED DECEMBER 31, 2009. |
|
OR |
||
|
o |
|
TRANSITION REPORT PURSUANT TO SECTION 13 OR 15(d) OF THE SECURITIES EXCHANGE ACT OF 1934 |
|
|
|
FOR THE TRANSITION PERIOD FROM TO |
|
|
|
|
|
|
|
|

|
|
|
|
|
|
|
Delaware |
|
38-2478409 |
|
(State or other jurisdiction of |
|
(I.R.S. Employer |
|
incorporation or organization) |
|
Identification No.) |
|
1334 York Avenue |
|
10021 |
|
New York, New York |
|
(Zip Code) |
|
(Address of principal executive offices) |
|
|
(212) 606-7000
(Registrant’s telephone number, including area code)
Securities
registered pursuant to Section 12(b) of the Act:
|
|
|
|
|
Title of each class |
|
Name of
each exchange |
|
Common Stock, |
|
New York Stock Exchange |
|
$0.01 Par Value |
|
|
|
|
Securities registered pursuant to Section 12(g) of the Act: None
|
|
Indicate by check mark if the registrant is a well-known seasoned issuer, as defined in Rule 405 of the Act. Yes þ No o
Indicate by check mark if the registrant is not required to file reports pursuant to Section 13 or Section 15(d) of the Act. Yes o No þ
Indicate by check mark whether the registrant (1) has filed all reports required to be filed by Section 13 or 15(d) of the Act during the preceding 12 months (or for such shorter periods that the registrant was required to file such reports), and (2) has been subject to such filing requirements for the past 90 days. Yes þ No o
Indicate by check mark if disclosure of delinquent filers pursuant to Item 405 of Regulation S-K is not contained herein, and will not be contained, to the best of registrant’s knowledge, in definitive proxy or information statements incorporated by reference in Part III of this Form 10-K or any amendment to this Form 10-K. þ
Indicate by check mark whether the registrant is a large accelerated filer, an accelerated filer, a non-accelerated filer, or a smaller reporting company (as defined in Rule 12b-2 of the Act). Large accelerated filer þ Accelerated filer o Non-accelerated filer o (Do not check if a smaller reporting company) Smaller reporting company o
Indicate by check mark whether the registrant is a shell company (as defined in Rule 12b-2 of the Act) Yes o No þ
As of June 30, 2009, the aggregate market value of the 65,786,882 shares of Common Stock held by non-affiliates of the registrant was $928,252,905 based upon the closing price ($14.11) on the New York Stock Exchange composite tape on such date for the Common Stock.
As of February 17, 2010, there were outstanding 67,354,274 shares of Common Stock.
DOCUMENTS INCORPORATED BY REFERENCE
Portions of the registrant’s proxy statement for the 2010 annual meeting of shareholders are incorporated by reference into Part III of this Form 10-K.
TABLE OF CONTENTS
ITEM 1: DESCRIPTION OF BUSINESS
Overview
Sotheby’s is one of the world’s two largest auctioneers of authenticated fine and decorative art, jewelry and collectibles (collectively, “art” or “works of art” or “artwork” or “property”). In 2009, Sotheby’s accounted for $2.3 billion, or 44%, of the total aggregate auction sales of the two major auction houses within the global auction market. In this report, the terms “Company,” “we,” “us,” or “our” mean Sotheby’s and all entities included in its consolidated financial statements.
Sotheby’s operations are organized under three segments: Auction, Finance and Dealer. Our Auction segment functions principally as an agent offering authenticated works of art for sale at auction. In addition, our Auction segment provides a number of related services including the brokering of private sales of artwork. Sotheby’s also operates as a dealer in works of art through our Dealer segment, conducts art-related financing activities through our Finance segment and is engaged, to a lesser extent, in licensing activities. A more detailed explanation of the activities of each of our segments, as well as our licensing activities is provided below.
Sotheby’s was initially incorporated in Michigan in August 1983. In October 1983, the Company acquired Sotheby Parke Bernet Group Limited, which was then a publicly held company listed on the International Stock Exchange of the United Kingdom and which, through its predecessors, had been engaged in the auction business since 1744. In 1988, Sotheby’s issued shares of Class A Limited Voting Common Stock, par value $0.10 per share (the “Class A Stock”), to the public, which were listed on the New York Stock Exchange (the “NYSE”). As successor to the business that began in 1744, Sotheby’s is the oldest company listed on the NYSE.
In June 2006, Sotheby’s (then named Sotheby’s Holdings, Inc.) reincorporated in the State of Delaware (the “Reincorporation”). The Reincorporation and related proposals were approved by the shareholders of Sotheby’s Holdings, Inc. at the annual meeting of shareholders on May 8, 2006. The Reincorporation was completed by means of a merger of Sotheby’s Holdings, Inc. with and into Sotheby’s Delaware, Inc., a Delaware corporation and a wholly-owned subsidiary of Sotheby’s Holdings, Inc. incorporated for the purpose of effecting the Reincorporation (“Sotheby’s Delaware”), with Sotheby’s Delaware being the surviving corporation. Sotheby’s Delaware was renamed “Sotheby’s” upon completion of the merger.
In the merger, each outstanding share of Class A Stock was converted into one share of Common Stock of Sotheby’s Delaware (“Sotheby’s Delaware Stock”). As a result, holders of Class A Stock became holders of Sotheby’s Delaware Stock, and their rights as holders thereof became governed by the General Corporation Law of the State of Delaware and the Certificate of Incorporation and By-Laws of Sotheby’s Delaware.
The Reincorporation was accounted for as a reverse merger, whereby, for accounting purposes, Sotheby’s Holdings, Inc. was considered the acquiror and the surviving corporation was treated as the successor to the historical operations of Sotheby’s Holdings, Inc. Accordingly, the historical financial statements of Sotheby’s Holdings, Inc. which were previously reported to the Securities and Exchange Commission (the “SEC”) on Forms 10-K and 10-Q, among other forms, are treated as the financial statements of the surviving corporation.
The Reincorporation did not result in any change in the business or principal facilities of Sotheby’s Holdings, Inc. Additionally, immediately after the Reincorporation, Sotheby’s Holdings, Inc. management and Board of Directors continued as the management and Board of Directors of Sotheby’s Delaware and Sotheby’s Delaware stock continued to trade on the NYSE under the symbol “BID.”
Auction Segment
Description of Business
The sale of works of art in the international art market is primarily effected through the major auction houses, numerous art dealers, smaller auction houses and also directly between collectors. Although art dealers and smaller auction houses generally do not report sales figures publicly, we believe that art dealers account for the majority of the volume of transactions in the international art market.
Our Auction segment functions principally as an agent offering authenticated works of art for sale at auction. In addition, our Auction segment provides a number of related services including the brokering of private sales of artwork. Sotheby’s principal role as an auctioneer or broker is to identify, evaluate and appraise works of art through its international staff of experts; to stimulate buyer interest through professional marketing techniques; and to match sellers and buyers. The evaluation and appraisal of works of art by our experts involves significant presale due diligence activities to authenticate and determine the ownership history of the property being sold.
3
In our role as auctioneer, we represent sellers of artworks accepting property on consignment and match sellers to buyers through the auction process. We invoice the buyer for the purchase price of the property (including the commission owed by the buyer), collect payment from the buyer and remit to the seller the net sale proceeds after deducting our commissions, expenses and applicable taxes and royalties. Our commissions include those paid by the buyer (“buyer’s premium”) and those paid by the seller (“seller’s commission”) (collectively, “auction commission revenue”), both of which are calculated as a percentage of the hammer price of the property sold at auction. In 2009, 2008 and 2007, auction commission revenue accounted for 82%, 91% and 83%, respectively, of Sotheby’s consolidated revenues.
Under the standard terms and conditions of our auction sales, we are not obligated to pay sellers for items that have not been paid for by buyers. If a buyer defaults on payment, the sale may be cancelled and the property will be returned to the consignor. Alternatively, the consignor may reoffer the property at a future auction or negotiate a private sale. However, at times, we pay the seller before payment is collected from the buyer and/or allow the buyer to take possession of the property before payment is made. In these situations, we are liable to the seller for the net sale proceeds whether or not the buyer makes payment.
From time to time in the ordinary course of our business, we will guarantee to sellers a minimum price in connection with the sale of property at auction (an “auction guarantee”). In the event that the property sells for less than the minimum guaranteed price, we must perform under the auction guarantee by funding the difference between the sale price at auction and the amount of the auction guarantee. We are generally entitled to a share of the excess proceeds (the “overage”) if the property under the auction guarantee sells above a minimum price. If the property does not sell, the amount of the guarantee must be paid, but title to the property generally transfers to Sotheby’s and we may recover a portion, all or more than the amount paid under the guarantee through the future sale of the property, whether or not we take title to the property.
In certain situations, we reduce our financial exposure under an auction guarantee through a risk and reward sharing arrangement with a partner. Such auction guarantee risk and reward sharing arrangements include:
|
|
|
|
|
|
• |
Arrangements under which an unaffiliated counterparty contractually commits to bid a predetermined price on the guaranteed property (an “irrevocable bid”). If the irrevocable bid is the winning bid, the counterparty purchases the property at the predetermined price plus the applicable buyer’s premium and pays the same amount as any other successful bidder would pay. If the irrevocable bid is not the winning bid, the counterparty is generally entitled to a negotiated share of the auction commission earned on the sale and/or a share of any overage. |
|
|
|
|
|
|
• |
Arrangements under which an unaffiliated counterparty contractually commits to fund: (i) a share of the difference between the sale price at auction and the amount of the auction guarantee if the property sells for less than the minimum guaranteed price or (ii) a share of the minimum guaranteed price if the property does not sell while taking ownership of a proportionate share of the unsold property. In exchange for accepting a share of the financial exposure under the auction guarantee, the counterparty is entitled to receive a share of the auction commission earned if the property sells and/or a share of any overage. |
The counterparties to these auction guarantee risk and reward sharing arrangements are typically major international art dealers or major art collectors. Sotheby’s could be exposed to credit-related losses in the event of nonperformance by these counterparties.
In response to the uncertain economic environment and the downturn in the international art market that was evident for most of 2009, we have substantially reduced our use of auction guarantees. We expect to continue to significantly limit our use of auction guarantees for the foreseeable future.
Seasonality
The worldwide art auction market has two principal selling seasons, which generally occur in the second and fourth quarters of the year. Accordingly, our auction business is seasonal, with peak revenues and operating income generally occurring in those quarters. Consequently, first and third quarter results have historically reflected a lower volume of auction activity when compared to the second and fourth quarters and, typically, a net loss due to the fixed nature of many of our operating expenses. (See “Seasonality” under “Management’s Discussion and Analysis of Financial Condition and Results of Operations” and Note X of Notes to Consolidated Financial Statements.)
4
The Auction Market and Competition
Competition in the international art market is intense. A fundamental challenge facing any auctioneer or art dealer is to obtain high quality and valuable property for sale either as agent or as principal. Sotheby’s primary auction competitor is Christie’s International, PLC (“Christie’s”), a privately held, French-owned, auction house. To a much lesser extent, Sotheby’s also faces competition from smaller auction houses such as Phillips de Pury & Company, regional auction houses such as Bonhams and a variety of art dealers across all collecting categories.
The owner of a work of art wishing to sell it has four principal options: (1) sale or consignment to, or private sale by, an art dealer; (2) consignment to, or private sale by, an auction house; (3) private sale to a collector or museum without the use of an intermediary; or (4) for certain categories of property (in particular, collectibles) consignment to, or private sale through, an internet-based service. The more valuable the property, the more likely it is that the owner will consider more than one option and will solicit proposals from more than one potential purchaser or agent, particularly if the seller is a fiduciary representing an estate or trust. A complex array of factors may influence the seller’s decision. These factors, which are not ranked in any particular order, include:
|
|
|
|
|
|
• |
The level and breadth of expertise of the art dealer or auction house with respect to the property; |
|
|
|
|
|
|
• |
The extent of the prior relationship, if any, between the art dealer or auction house and its staff and the seller; |
|
|
|
|
|
|
• |
The reputation and historic level of achievement by the art dealer or auction house in attaining high sale prices in the property’s specialized category; |
|
|
|
|
|
|
• |
The client’s desire for privacy; |
|
|
|
|
|
|
• |
The amount of cash offered by an art dealer, auction house or other purchaser to purchase the property outright, which is greatly influenced by the amount and cost of capital resources available to such parties; |
|
|
|
|
|
|
• |
The availability and terms of financial options offered by auction houses including auction guarantees, short-term financing and auction commission sharing arrangements; |
|
|
|
|
|
|
• |
The level of pre-sale estimates; |
|
|
|
|
|
|
• |
The desirability of a public auction in order to achieve the maximum possible price (a particular concern for fiduciary sellers, such as trustees and estate executors); |
|
|
|
|
|
|
• |
The amount of commission charged by art dealers or auction houses to sell a work on consignment; |
|
|
|
|
|
|
• |
The cost, style and extent of pre-sale marketing and promotion to be undertaken by an art dealer or auction house; |
|
|
|
|
|
|
• |
Recommendations by third parties consulted by the seller; |
|
|
|
|
|
|
• |
The desire of clients to conduct business with a publicly traded company; and |
|
|
|
|
|
|
• |
The availability and extent of related services, such as tax or insurance appraisals. |
It is not possible to measure with any particular accuracy the entire international art market or to reach any conclusions regarding overall competition because art dealers and auction firms frequently do not publicly report annual totals for auction sales, revenues or profits, and the amounts reported may not be verifiable.
Auction Regulation
Regulation of the auction business varies from jurisdiction to jurisdiction. In many jurisdictions, Sotheby’s is subject to laws and regulations that are not directed solely toward the auction business, including, but not limited to, import and export regulations, antitrust laws, cultural property ownership laws, data protection and privacy laws, anti-money laundering laws and value added sales taxes. In addition, Sotheby’s is subject to local auction regulations, such as New York City Auction Regulations Subchapter M of Title 6 §§ 2-121–2-125, et. seq. Such regulations do not impose a material impediment to Sotheby’s business but do affect the market generally, and a material adverse change in such regulations could affect our business. In addition, failure to comply with such local laws and regulations could subject us to civil and/or criminal penalties in such jurisdictions. Sotheby’s has a Compliance Department which, amongst other activities, develops and updates compliance policies and audits, monitors, and provides training to our employees on compliance with many of these laws and regulations.
5
Finance Segment
Description of Business
Our Finance segment provides certain collectors and art dealers with financing, generally secured by works of art that we either have in our possession or permit borrowers to possess. Our Finance segment’s loans are predominantly variable interest rate loans.
Our Finance segment generally makes two types of secured loans: (1) advances secured by consigned property to borrowers who are contractually committed, in the near term, to sell the property at auction (a “consignor advance”); and (2) general purpose term loans secured by property not presently intended for sale (a “term loan”). A consignor advance allows a seller to receive funds upon consignment for an auction that will occur up to one year in the future, while preserving for the benefit of the seller the potential of the auction process. Term loans allow us to establish or enhance mutually beneficial relationships with borrowers and are intended to generate future auction consignments, though they might not always do so. Secured loans are made with full recourse against the borrower. Collection of our loans can be adversely impacted by a decline in the art market in general or in the value of the particular collateral. In addition, in situations where a borrower becomes subject to bankruptcy or insolvency laws, our ability to realize on our collateral may be limited or delayed by the application of such laws.
The target loan-to-value ratio (principal loan amount divided by the low auction estimate of the collateral) for our Finance segment secured loans is 50% or lower. However, certain loans are made at initial loan-to-value ratios higher than 50%. In addition, as a result of our normal periodic revaluation of loan collateral, the loan-to-value ratio of certain loans may increase above the 50% target loan-to-value ratio due to decreases in the low auction estimates of the collateral. As of December 31, 2009, Finance segment loans with loan-to-value ratios above 50% totaled $69.4 million and represented 42% of net Notes Receivable. The collateral related to such loans has a low auction estimate of approximately $95 million.
Our Finance segment activities, which are conducted through our wholly-owned subsidiaries, are generally funded through operating cash flows supplemented, on occasion, by credit facility borrowings. (See “Liquidity and Capital Resources” under “Management’s Discussion and Analysis of Financial Condition and Results of Operations.”)
(See Notes F and M of Notes to Consolidated Financial Statements.)
The Finance Market and Competition
A considerable number of traditional lending sources offer conventional loans at a lower cost to borrowers than the average cost of loans offered by our Finance segment. Additionally, many traditional lenders offer borrowers a variety of integrated financial services such as wealth management services, which are not offered by Sotheby’s. Few lenders, however, are willing to accept works of art as sole collateral as they do not possess the ability to both appraise and sell works of art within a vertically integrated organization. We believe that through a combination of our art expertise and skills in international law and finance, we have the ability to tailor attractive financing packages for clients who wish to obtain immediate access to liquidity from their art assets.
Dealer Segment
Description of Business
Our Dealer segment’s activities principally include the activities of Noortman Master Paintings (or “NMP”), an art dealer specializing in Dutch and Flemish Old Master Paintings, as well as French Impressionist and Post-Impressionist paintings. As an art dealer, NMP sells works of art directly to private collectors and museums and, from time-to-time, acts as a broker in private purchases and sales of art. To a lesser extent, Dealer segment activities also include the investment in and resale of artworks directly by Sotheby’s and the activities of certain equity investees, including Acquavella Modern Art (or “AMA”) (See Note H of Notes to Consolidated Financial Statements.)
The Dealer Market and Competition
Our Dealer segment operates in the same market as our Auction segment and is impacted to varying degrees by many of the same competitive factors (as discussed above under “The Auction Market and Competition”). Additionally, the most prominent competitive factors impacting our Dealer segment, which are not ranked in any particular order, include: (i) relationships and personal interaction between the buyer or seller and the art dealer; (ii) access to, and participation in, art fairs; (iii) the level of specialized expertise of the art dealer; (iv) the ability of the art dealer to locate and purchase quality works of art for resale; and (v) the ability of the art dealer to finance purchases of art.
6
Licensing
Prior to 2004, we were engaged in the marketing and brokerage of luxury residential real estate sales through Sotheby’s International Realty (“SIR”). In 2004, we sold SIR to a subsidiary of Realogy Corporation (“Realogy”), formerly Cendant Corporation. In conjunction with the sale, we entered into an agreement with Realogy to license the SIR trademark and certain related trademarks for an initial 50-year term with a 50-year renewal option (the “Realogy License Agreement”). Initially, the Realogy License Agreement was applicable to the United States (“U.S.”), Canada, Israel, Mexico and certain Caribbean countries.
Also in conjunction with the sale, Realogy received options to acquire most of the other non-U.S. offices of our real estate brokerage business and to expand the Realogy License Agreement to cover the related trademarks in other countries outside the U.S., excluding Australia and New Zealand (the “International Options”). The International Options were exercised by Realogy and the Realogy License Agreement was amended to cover New Zealand during 2004.
The Realogy License Agreement provides for an ongoing license fee during its term based on the volume of commerce transacted under the licensed trademarks. In 2009, 2008 and 2007, we earned $2.4 million, $2.8 million and $2.8 million, respectively, in license fee revenue related to the Realogy License Agreement.
We also license the Sotheby’s name for use in connection with the art auction business in Australia and art education services in the U.S. and the United Kingdom (“U.K.”). We continue to consider additional opportunities to license the Sotheby’s brand in businesses where appropriate.
Strategic Initiatives
Continued Focus on Sotheby’s Most Valuable Relationships
Our focus on the high-end of the art market has been an important contributor to our success. Accordingly, we are continuing to dedicate significant time, energy and resources to broadening and extending the breadth and depth of relationships with major clients. These efforts are part of a multi-year strategy to invest in those areas which serve our major clients best.
Over the past several years, we have made substantial investments in information technology designed to improve client service. A new portfolio of enterprise systems anchored by SAP has been deployed across the organization, which has enhanced the quality of information and the processing of sales and inventory tracking, as well as data management. In 2008, we launched our web-based client portal, “mySothebys,” which provides clients with real-time access to their account data, as well as auction tracking services and enhanced media content. We plan on significant improvements to the Sothebys.com website and mySothebys in 2010. Also, in 2010, we will launch proprietary software that will significantly reengineer and improve our post-sale client service. Client relationships are a key driver of our success, and our clients expect a consistently high level of service. We believe these initiatives will have a meaningful impact on the future of our business.
Realign Operations to Enhance Profitability
In line with our strategy to focus on major clients, we have implemented significant changes to our business portfolio to enhance the long-term value of the franchise. This resulted in the discontinuation of auctions at Olympia, Sotheby’s former secondary salesroom in London, which had traditionally processed sales at a substantially lower price point than Sotheby’s other salesrooms. We have reduced low-end sales categories in New York, Amsterdam and Milan and increased Sotheby’s minimum lot thresholds to $5,000, €4,000 and £3,000, depending on the location. As a result of these actions, we have reduced the quantity of lots offered for sale at auction annually. Additionally, Sotheby’s has invested in new staff in order to strengthen client relationships and grow revenues. (See “Restructuring Plan and Related Charges” under “Management’s Discussion and Analysis of Financial Condition and Results of Operations” and statement on Forward Looking Statements.)
Increase Exposure to Emerging Markets
We are making significant efforts to grow our presence in emerging markets such as Russia, Asia and the Middle East and have opened offices in Beijing, Moscow, and Doha, Qatar.
Capitalize on Brand Extension Opportunities
As discussed above, we have licensed the SIR trademark and certain related trademarks in connection with the sale of our real estate business to Realogy in 2004. We intend to continue to further leverage the Sotheby’s brand in other luxury goods categories.
Financial and Geographical Information about Segments
See Note E of Notes to Consolidated Financial Statements for financial and geographical information about Sotheby’s segments.
7
Employees
As of December 31, 2009, Sotheby’s had 1,323 employees with 528 located in North America; 474 in the U.K.; 235 in Continental Europe; and 86 in Asia. We regard our relations with our employees as good. The table below provides a breakdown of our employees by segment as of December 31, 2009 and 2008.
|
|
|
|
|
|
|
|
|
|
|
|
December 31 |
|
2009 |
|
2008 |
|
||
|
|
|
|
|
|||||
|
|
Auction |
|
1,160 |
|
|
1,452 |
|
|
|
|
Finance |
|
7 |
|
10 |
|
||
|
|
Dealer |
|
5 |
|
|
9 |
|
|
|
|
All Other |
|
151 |
|
167 |
|
||
|
|
|
|
|
|
||||
|
|
Total |
|
1,323 |
|
|
1,638 |
|
|
|
|
|
|
|
|
||||
Employees classified within “All Other” principally relate to Sotheby’s central corporate and information technology departments.
(See “Restructuring Plan and Related Charges” under “Management’s Discussion and Analysis of Financial Condition and Results of Operations.”)
Website Address
We make available free of charge our annual report on Form 10-K, quarterly reports on Form 10-Q and current reports on Form 8-K through a hyperlink from our website, http://investor.shareholder.com/bid/sec.cfm, a website maintained by an unaffiliated third-party service. Such reports are made available on the same day that they are electronically filed with or furnished to the SEC.
Sotheby’s operating results and liquidity are significantly influenced by a number of risk factors, many of which are not within its control. These factors, which are not ranked in any particular order, are discussed below.
The supply of and demand for works of art can be adversely impacted by weakness in the global economy and the financial markets of various countries.
The international art market is influenced over time by the overall strength and stability of the global economy and the financial markets of various countries, although this correlation may not be immediately evident. Sotheby’s business can be particularly influenced by the economies and financial markets of the U.S., the U.K., and the major countries or territories of Continental Europe and Asia. Accordingly, weakness in those economies and financial markets can adversely affect the supply and demand of works of art and Sotheby’s business.
Fluctuations in benchmark interest rates may increase the cost of credit facility borrowings.
Fluctuations in benchmark interest rates influence the cost of borrowings under Sotheby’s senior secured credit facility, which is used on occasion to finance working capital needs and, in particular, the Finance segment’s client loan portfolio. An increase in certain benchmark interest rates would increase the cost of Sotheby’s credit facility borrowings, if any.
Government laws and regulations may restrict or limit Sotheby’s business.
Many of Sotheby’s activities are subject to laws and regulations including, but not limited to, import and export regulations, cultural property ownership laws, data protection and privacy laws, anti-money laundering laws, antitrust laws and value added sales taxes. In addition, Sotheby’s is subject to local auction regulations, such as New York City Auction Regulations Subchapter M of Title 6 §§ 2-121–2-125, et. seq. Such regulations do not impose a material impediment to the worldwide business of Sotheby’s, but do affect the market generally, and a material adverse change in such regulations could affect the business. Additionally, export and import laws and cultural property ownership laws could affect the availability of certain kinds of property for sale at Sotheby’s principal auction locations or could increase the cost of moving property to such locations.
Global political conditions and world events may negatively affect Sotheby’s business and customers.
Global political conditions and world events may affect Sotheby’s business through their effect on the economies of various countries, as well as on the willingness of potential buyers and sellers to purchase and sell art in the wake of economic uncertainty. Global political conditions may also influence the enactment of legislation that could adversely affect Sotheby’s business.
8
Foreign currency exchange rate movements can significantly increase or decrease Sotheby’s results of operations.
Sotheby’s has operations throughout the world, with approximately 58% of its revenues earned outside of the U.S. in 2009. Revenues and expenses relating to Sotheby’s foreign operations are translated using weighted average monthly exchange rates during the year in which they are recognized. Accordingly, fluctuations in foreign currency exchange rates can significantly increase or decrease Sotheby’s results of operations.
Competition in the international art market is intense and may adversely impact Sotheby’s results of operations.
Sotheby’s competes with other auctioneers and art dealers to obtain valuable consignments to offer for sale either at auction or through private sale. The level of competition is intense and can adversely impact Sotheby’s ability to obtain valuable consignments for sale, as well as the commission margins achieved on such consignments.
Sotheby’s cannot be assured of the amount and quality of property consigned for sale at auction, which may cause significant variability in its financial results.
The amount and quality of property consigned for sale is influenced by a number of factors not within Sotheby’s control. Many major consignments, and specifically single-owner sale consignments, often become available as a result of the death or financial or marital difficulties of the owner, all of which are unpredictable and may cause significant variability in Sotheby’s financial results from period to period.
The demand for art is unpredictable, which may cause significant variability in Sotheby’s financial results.
The demand for art is influenced not only by overall economic conditions, but also by changing trends in the art market as to which collecting categories and artists are most sought after and by the collecting preferences of individual collectors, all of which are difficult to predict and which may adversely impact the ability of Sotheby’s to obtain and sell consigned property, potentially causing significant variability in Sotheby’s financial results from period to period.
The loss of key personnel could adversely impact Sotheby’s ability to compete.
Sotheby’s business is largely a service business in which the ability of its employees to develop and maintain relationships with potential sellers and buyers of works of art is essential to its success. Moreover, Sotheby’s business is complex, making it important to retain key specialists and members of management. Accordingly, Sotheby’s business is highly dependent upon its success in attracting and retaining qualified personnel.
Sotheby’s relies on a small number of clients who make a significant contribution to its revenues and profitability.
Sotheby’s relies on a small number of important clients who make a significant contribution to its revenues and profitability. Accordingly, Sotheby’s success is highly dependent upon its ability to develop and maintain relationships with this small group of important clients.
Demand for art-related financing is unpredictable, which may cause significant variability in the financial results of Sotheby’s Finance segment.
Sotheby’s Finance segment is dependent on the demand for art-related financing, which can be significantly influenced by overall economic conditions and by the often unpredictable financial requirements of owners of major art collections. Accordingly, the financial results of Sotheby’s Finance segment are subject to significant variability from period to period.
The strategic initiatives and restructuring plans being implemented by Sotheby’s may not succeed.
Sotheby’s is implementing certain strategic initiatives and restructuring plans, which are being relied on to improve profitability. Accordingly, Sotheby’s future operating results are dependent in part on management’s success in implementing these plans. Additionally, the implementation of Sotheby’s strategic plans and restructuring plans could unfavorably impact its short-term operating results. (See statement on Forward Looking Statements.) (See “Strategic Initiatives” under “Description of Business” and “Restructuring Plans and Related Charges” under “Management’s Discussion and Analysis of Financial Condition and Results of Operations.”)
9
The value of art is subjective and often fluctuates, exposing Sotheby’s to losses in the value of its inventory and loan collateral and significant variability in its financial results.
The art market is not a highly liquid trading market. As a result, the valuation of art is inherently subjective and the realizable value of art often fluctuates over time. Accordingly, Sotheby’s is at risk both as to the realizable value of art held in inventory and as to the realizable value of art pledged as collateral for Finance segment loans.
In determining the realizable value of art, management relies upon the opinions of Sotheby’s specialists, who consider the following complex array of factors when valuing art: (i) whether the artwork is expected to be offered at auction or sold privately; (ii) the current and expected future demand for works of art, taking into account economic conditions and changing trends in the art market as to which collecting categories and artists are most sought after; and (iii) recent sale prices achieved in the art market for comparable works of art within a particular collecting category and/or by a particular artist.
If management determines that the estimated realizable value of a specific artwork held in inventory is less than its carrying value, a loss is recorded to reduce the carrying value of the artwork to management’s estimate of realizable value. In addition, if management determines that the realizable value of the art pledged as collateral for Finance segment loans is less than the corresponding loan balance, management would be required to assess whether a loss should be recorded to reduce the carrying value of the loan, after taking into account the ability of the borrower to repay any shortfall in the value of the collateral when compared to the amount of the loan. These factors may cause significant variability in Sotheby’s financial results from period to period.
Auction guarantees create the risk of loss resulting from the potential inaccurate valuation of art.
As discussed above, the art market is not a highly liquid trading market and, as a result, the valuation of art is inherently subjective. Accordingly, Sotheby’s is at risk with respect to management’s ability to estimate the likely selling prices of works of art offered with auction guarantees. If management’s judgments about the likely selling prices of works of art offered with auction guarantees prove to be inaccurate, there could be a significant adverse impact on Sotheby’s results of operations, financial condition and liquidity.
Sotheby’s could be exposed to credit-related losses in the event of nonperformance by its counterparties in auction guarantee risk and reward sharing arrangements.
In certain situations, Sotheby’s reduces its financial exposure under auction guarantees through risk and reward sharing arrangements with partners. Sotheby’s counterparties to these risk and reward sharing arrangements are typically major international art dealers or major art collectors. Sotheby’s could be exposed to credit-related losses in the event of nonperformance by these counterparties.
Future costs and obligations related to the Sotheby’s U.K. Pension Plan are dependent on unpredictable factors, which may cause significant variability in employee benefit costs.
Future costs and obligations related to Sotheby’s defined benefit pension plan in the U.K. are heavily influenced by changes in interest rates, investment performance in the debt and equity markets and actuarial assumptions, each of which are unpredictable and may cause significant variability in Sotheby’s employee benefit costs.
Tax matters may cause significant variability in Sotheby’s financial results.
Sotheby’s operates in many tax jurisdictions throughout the world and the provision for income taxes involves a significant amount of management judgment regarding interpretation of relevant facts and laws in the jurisdictions in which Sotheby’s operates. Accordingly, Sotheby’s effective income tax rate can vary significantly between periods due to a number of complex factors including, but not limited to (i) future changes in applicable laws; (ii) projected levels of taxable income; (iii) pre-tax income being lower than anticipated in countries with lower statutory rates or higher than anticipated in countries with higher statutory rates; (iv) increases to valuation allowances recorded against deferred tax assets; (v) tax audits conducted by various tax authorities; (vi) adjustments to income taxes upon finalization of income tax returns; (vii) the ability to claim foreign tax credits; (viii) the repatriation of non-U.S. earnings for which Sotheby’s has not previously provided for income taxes; and (ix) tax planning.
Similarly, Sotheby’s clients reside in various tax jurisdictions throughout the world. To the extent that there are changes to tax laws in any of these jurisdictions, such changes could adversely impact the ability and/or willingness of Sotheby’s clients to purchase or sell works of art.
10
Insurance coverage for artwork may become more difficult to obtain, exposing Sotheby’s to losses for artwork in Sotheby’s possession.
Sotheby’s maintains insurance coverage for the works of art it owns and for works of art consigned to it by its clients, which are stored at Sotheby’s facilities around the world. An inability to adequately insure such works of art due to limited capacity of the global art insurance market in the future could have an adverse impact on Sotheby’s business.
ITEM 1B: UNRESOLVED STAFF COMMENTS
None.
Our North American Auction, Dealer and Finance operations, as well as our corporate offices, are headquartered at 1334 York Avenue, New York, New York (the “York Property”). The York Property contains approximately 439,000 square feet of building area and is home to our sole North American Auction salesroom and our principal North American exhibition space. We purchased the York Property on February 6, 2009 for $370 million. Prior to this purchase, we occupied the York Property subject to a 20-year lease which was entered into in conjunction with a sale-leaseback transaction in February 2003. (See “York Property” under “Management’s Discussion and Analysis of Financial Condition and Results of Operations.”) We also lease office and exhibition space in several other major cities throughout the U.S.
11
Our U.K. operations (primarily Auction) are principally centered at New Bond Street, London, where the main salesrooms, exhibition space and administrative offices are located. Between 2006 and 2008, we invested approximately $15 million on the refurbishment of the New Bond Street premises to enhance its exhibition and client entertainment facilities, as well as to partially compensate for the loss of space under a lease related to a small portion of the New Bond Street complex that expired in September 2008. Almost the entire New Bond Street complex is either owned or held under various freehold and long-term lease arrangements. Below is a table summarizing our ownership, freehold and lease arrangements related to our London premises as of December 31, 2009 (in thousands of dollars, except for square footage):
|
|
|
|
|
|
|
|
|
|
|
|
|
|
|
|
|
|
|
|
|
|
|
|
|
Square |
|
Net
Book Value |
|
Net
Book Value |
|
Net
Book Value of |
|
Total |
||||||||||
|
|
|
|
|
|
|
|||||||||||||||
|
Owned property |
|
|
11,376 |
|
$ |
5,849 |
|
$ |
2,615 |
|
$ |
— |
|
$ |
8,464 |
|
||||
|
Freeholds (a) |
|
|
85,614 |
|
|
— |
|
|
— |
|
|
24,785 |
|
|
24,785 |
|
||||
|
Leases with a remaining term greater than 20 years (b) |
|
|
55,726 |
|
|
— |
|
|
— |
|
|
4,721 |
|
|
4,721 |
|
||||
|
All other leases (c) |
|
|
91,650 |
|
|
— |
|
|
— |
|
|
2,446 |
|
|
2,446 |
|
||||
|
|
|
|
|
|
||||||||||||||||
|
Total |
|
|
244,366 |
|
$ |
5,849 |
|
$ |
2,615 |
|
$ |
31,952 |
|
$ |
40,416 |
|
||||
|
|
|
|
|
|
|
|||||||||||||||
|
|
|
|
|
|
|
(a) |
Freeholds are occupancy arrangements in which there is no rent paid, and the arrangement has no termination date. |
|
|
|
|
(b) |
Consists of a lease for 26,006 square feet of space, due to expire in 2034, and a lease for 29,720 square feet of space, due to expire in 2060. These leases do not have any escalation terms and provide for fixed monthly payments through each lease termination date. |
|
|
|
|
(c) |
Includes leased office and warehouse space elsewhere in London. Our existing lease for warehouse space in London expires in the first quarter of 2011. We have reached an agreement in principle to lease a new London warehouse facility, which we expect to occupy beginning in the first quarter of 2011. We anticipate signing this lease in the first quarter of 2010, subject to obtaining planning permission for the buildout of the facility. Total capital expenditures for the new warehouse are expected to be approximately $12 million, with approximately $10 million to be spent in 2010. (See statement on Forward Looking Statements.) |
We also lease space primarily for Auction operations in various locations throughout Continental Europe and Asia, including salesrooms in Geneva and Zurich, Switzerland; Milan, Italy; Paris, France; Amsterdam, The Netherlands; and Hong Kong, China. In addition, we lease gallery space for Noortman Master Paintings in Amsterdam, The Netherlands.
We believe our worldwide premises are adequate for the current conduct of our business. However, we continually analyze our worldwide premises for both our current and future business needs as part of our ongoing efforts to manage infrastructure and other overhead costs. Where appropriate, we will continue to make any necessary changes to address our premises requirements. (See “Restructuring Plan and Related Charges” under “Management’s Discussion and Analysis of Financial Condition and Results of Operations.”)
12
Sotheby’s becomes involved in various claims and lawsuits incidental to the ordinary course of its business, including the matter described below. While it is not possible to predict the outcome of litigation, management does not believe that the outcome of any of these pending claims or proceedings will have a material adverse effect on Sotheby’s consolidated results of operations, financial condition and/or cash flows.
Sotheby’s Inc. v. Halsey Minor is an action commenced by a subsidiary of Sotheby’s in September 2008 in the U.S. District Court for the Southern District of New York, seeking to collect approximately $18 million for three paintings (of which approximately $12 million has been collected as of the date of this filing) that Mr. Minor purchased in auctions conducted by Sotheby’s in the spring of 2008. Mr. Minor filed a counterclaim in that action alleging that Sotheby’s had failed to disclose that the consignor of one of those paintings had an outstanding loan from Sotheby’s and asserting that the sale should, therefore, be rescinded or the price of the painting reduced. In October 2008, Mr. Minor commenced a separate action in the U.S. District Court for the Northern District of California seeking recovery for alleged losses on behalf of a purported class of purchasers of properties that were subject to alleged undisclosed loans from Sotheby’s. That action also asserted breaches of fiduciary duties arising from alleged art consulting advice provided to Mr. Minor by a Sotheby’s employee. The California action that Mr. Minor had commenced against Sotheby’s has been dismissed. In April 2009, Mr. Minor filed a motion in the New York action seeking to amend his answer and counterclaim to (i) broaden his rescission claim to cover an additional painting, (ii) add claims for alleged breach of fiduciary duty and alleged violations of a New York State consumer protection statute and (iii) seek injunctive relief. In May 2009, Sotheby’s opposed that motion and, in addition, moved for summary judgment against certain of Mr. Minor’s claims. In July 2009, Sotheby’s moved for summary judgment against the remainder of Mr. Minor’s claims, and Mr. Minor moved for summary judgment in favor of certain of his claims. In October 2009, the Magistrate Judge assigned to this action issued an opinion and order denying Mr. Minor’s motion for leave to file an amended answer and counterclaim to the extent that Mr. Minor sought to assert claims for breach of fiduciary duty and violations of the New York State consumer protection statute. We are awaiting a decision from the Court on the remaining motions. Management believes that there are meritorious defenses to the claims asserted in the counterclaim to the New York action and it is being vigorously defended.
(See statement on Forward Looking Statements.)
ITEM 4: SUBMISSION TO A VOTE OF SECURITY HOLDERS
No matters were submitted to a vote of Sotheby’s shareholders during the fourth quarter of 2009.
13
ITEM 5: MARKET FOR THE REGISTRANT’S COMMON EQUITY AND RELATED SHAREHOLDER MATTERS
Market Information
The principal market for Sotheby’s common stock is the NYSE (symbol: BID). As of February 17, 2010, there were 1,706 holders of record of Sotheby’s common stock. The quarterly price ranges on the NYSE of Sotheby’s common stock during 2009 and 2008 were as follows:
|
|
|
|
|
|
|
|
|
|
|
|
|
2009 |
||||||
|
|
|
|||||||
|
Quarter Ended |
|
High |
|
Low |
||||
|
|
|
|||||||
|
March 31 |
|
$ |
10.39 |
|
$ |
6.05 |
|
|
|
June 30 |
|
$ |
15.09 |
|
$ |
8.75 |
|
|
|
September 30 |
|
$ |
17.95 |
|
$ |
11.14 |
|
|
|
December 31 |
|
$ |
24.95 |
|
$ |
15.20 |
|
|
|
|
|
|
|
|
|
|
|
|
|
|
|
2008 |
||||||
|
|
|
|||||||
|
Quarter Ended |
|
High |
|
Low |
||||
|
|
|
|||||||
|
March 31 |
|
$ |
39.67 |
|
$ |
25.30 |
|
|
|
June 30 |
|
$ |
30.18 |
|
$ |
23.75 |
|
|
|
September 30 |
|
$ |
28.98 |
|
$ |
18.63 |
|
|
|
December 31 |
|
$ |
20.18 |
|
$ |
7.24 |
|
|
Sotheby’s is party to a credit agreement with an international syndicate of lenders led by General Electric Capital Corporation that contains a financial covenant limiting dividend payments to the lesser of $0.05 per share or $4 million. The maximum level of quarterly dividend payments may be increased depending on a fixed charge coverage ratio covenant in this credit agreement. (See “Liquidity and Capital Resources” under “Management’s Discussion and Analysis of Financial Condition and Results of Operations” and Note M of Notes to Consolidated Financial Statements for more detailed information related to this credit agreement.)
The following table summarizes dividends declared and paid for each of the quarterly periods in 2009 and 2008 (in thousands of dollars, except per share amounts):
|
|
|
|
|
|
|
|
|
|
|
|
|
2009 |
|
|||||
|
|
|
|||||||
|
Quarter Ended |
|
Per Share |
|
Amount |
||||
|
|
|
|||||||
|
March 31 |
|
$ |
0.15 |
|
$ |
10,231 |
|
|
|
June 30 |
|
$ |
0.05 |
|
$ |
3,399 |
|
|
|
September 30 |
|
$ |
0.05 |
|
$ |
3,399 |
|
|
|
December 31 |
|
$ |
0.05 |
|
$ |
3,405 |
|
|
|
|
|
|
||||||
|
Total dividends declared and paid in 2009 |
|
$ |
0.30 |
|
$ |
20,434 |
|
|
|
|
|
|
||||||
|
|
|
|
|
|
|
|
|
|
|
|
|
2008 |
|
|||||
|
|
|
|||||||
|
Quarter Ended |
|
Per Share |
|
Amount |
||||
|
|
|
|||||||
|
March 31 |
|
$ |
0.15 |
|
$ |
10,167 |
|
|
|
June 30 |
|
$ |
0.15 |
|
$ |
10,165 |
|
|
|
September 30 |
|
$ |
0.15 |
|
$ |
10,145 |
|
|
|
December 31 |
|
$ |
0.15 |
|
$ |
10,174 |
|
|
|
|
|
|
||||||
|
Total dividends declared and paid in 2008 |
|
$ |
0.60 |
|
$ |
40,651 |
|
|
|
|
|
|
||||||
Management continually assesses Sotheby’s quarterly dividend based upon operating results and capital requirements. Additionally, the declaration and payment of future dividends to shareholders remains at the discretion of Sotheby’s Board of Directors and is dependent upon many factors, including Sotheby’s financial condition, cash flows, legal requirements and other factors as the Board of Directors deem relevant. (See statement on Forward Looking Statements.)
On February 26, 2010, Sotheby’s Board of Directors declared a quarterly dividend of $0.05 per share (approximately $3.4 million), to be paid on March 16, 2010 to shareholders of record as of March 9, 2010.
14
Equity Compensation Plans
The following table provides information as of December 31, 2009 with respect to shares of Sotheby’s common stock that may be issued under its existing equity compensation plans, including the Sotheby’s 1997 Stock Option Plan (the “Stock Option Plan”), the Sotheby’s Restricted Stock Unit Plan (the “Restricted Stock Unit Plan”) and the Sotheby’s Amended and Restated Stock Compensation Plan for Non-Employee Directors (the “Directors Stock Plan”):
|
|
|
|
|
|
|
|
|
|
|
|
|
|
|
(A) |
|
(B) |
|
(C) |
||||||
|
|
|
|
|||||||||
Plan Category (1) |
|
Number of |
|
Weighted Average |
|
Number of Securities |
||||||
|
|
|
||||||||||
|
|
(In thousands, except per share data) |
||||||||||
Equity compensation plans approved by shareholders |
|
|
3,254 |
|
$ |
16.12 |
|
|
2,577 |
|
||
Equity compensation plans not approved by shareholders |
|
|
— |
|
|
— |
|
|
— |
|
||
|
|
|
|
|||||||||
Total |
|
|
3,254 |
|
$ |
16.12 |
|
|
2,577 |
|
||
|
|
|
|
|||||||||
|
|
|
|
|
|
|
(1) |
See Note Q of Notes to Consolidated Financial Statements for a description of the material features of Sotheby’s equity compensation plans. |
|
|
|
|
(2) |
Includes 2,620,544 shares awarded under the Restricted Stock Unit Plan on which the restrictions have not yet lapsed and 633,000 stock options. |
|
|
|
|
(3) |
The weighted-average exercise price does not take into account 2,620,544 shares awarded under the Restricted Stock Unit Plan, which have no exercise price. |
|
|
|
|
(4) |
Includes 2,037,391 shares available for future issuance under the Restricted Stock Unit Plan, 517,000 shares available for issuance under the Stock Option Plan and 22,887 shares available for issuance under the Directors Stock Plan. |
15
Performance Graph
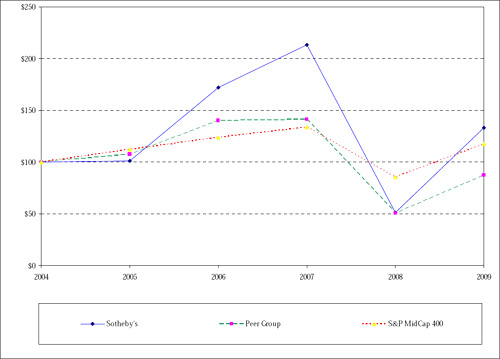
The following graph compares the cumulative total shareholder return on Sotheby’s common stock for the five-year period from December 31, 2004 to December 31, 2009 with the cumulative return of the Standard & Poor’s MidCap 400 Stock Index (“S&P MidCap 400”) and Sotheby’s Peer Group (“the Peer Group”). The Peer Group consists of Nordstrom, Inc., Saks Holdings, Inc., Tiffany & Co. and Movado, Inc. We believe the members of the Peer Group to be purveyors of luxury goods appealing to a segment of the population consistent with our own clientele as no other auction house of comparable market share or capitalization is publicly traded.
The graph reflects an investment of $100 in Sotheby’s common stock, the S&P MidCap 400, which includes Sotheby’s, and its Peer Group, respectively, on December 31, 2004, and a reinvestment of dividends at the average of the closing stock prices at the beginning and end of each quarter.
Comparison of Five-Year Cumulative Total
Return Among
Sotheby’s, the Peer Group Index and the S&P MidCap 400
as of December 31, 2009
|
|
|
|
|
|
|
|
|
|
|
|
|
|
|
|
|
|
|
|
|
|
|
|
|
|
|
|
|
12/31/04 |
|
12/31/05 |
|
12/31/06 |
|
12/31/07 |
|
12/31/08 |
|
12/31/09 |
||||||||||||
|
|
|
|
|
|
|
|
||||||||||||||||||
|
Sotheby’s |
|
$ |
100.00 |
|
$ |
101.10 |
|
$ |
171.94 |
|
$ |
213.63 |
|
$ |
51.19 |
|
$ |
132.95 |
|
|||||
|
Peer Group |
|
$ |
100.00 |
|
$ |
107.56 |
|
$ |
140.15 |
|
$ |
141.37 |
|
$ |
50.49 |
|
$ |
87.28 |
|
|||||
|
S&P MidCap 400 |
|
$ |
100.00 |
|
$ |
112.37 |
|
$ |
123.97 |
|
$ |
133.86 |
|
$ |
85.28 |
|
$ |
117.15 |
|
|||||
16
|
|
|
|
SELECTED FINANCIAL DATA |
|
|
|
|
|
|
|
|
|
|
|
|
|
|
|
|
|
|
|
|
|
|
|
|
Year ended December 31 |
|
2009 |
|
2008 |
|
2007 |
|
2006 |
|
|
2005 |
|
|||||||||
|
|
|
|
|
|
|
||||||||||||||||
|
|
|
(Thousands of dollars, except per share data) |
|
||||||||||||||||||
|
Key Performance Indicator: |
|
|
|
|
|
|
|
|
|
|
|
|
|
|
|
|
|
|
|
|
|
|
Net Auction Sales (1) |
|
$ |
1,912,589 |
|
|
$ |
4,189,735 |
|
|
$ |
4,625,914 |
|
|
$ |
3,234,526 |
|
|
$ |
2,361,830 |
|
|
|
Statement of Operations Data: |
|
|
|
|
|
|
|
|
|
|
|
|
|
|
|
|
|
|
|
|
|
|
Auction and related revenues |
|
$ |
448,768 |
|
|
$ |
616,625 |
|
|
$ |
833,128 |
|
|
$ |
631,344 |
|
|
$ |
496,899 |
|
|
|
Finance revenues |
|
|
9,073 |
|
|
|
14,183 |
|
|
|
17,025 |
|
|
|
15,864 |
|
|
|
8,302 |
|
|
|
Dealer revenues |
|
|
22,339 |
|
|
|
55,596 |
|
|
|
62,766 |
|
|
|
12,776 |
|
|
|
5,131 |
|
|
|
License fee revenues |
|
|
3,270 |
|
|
|
3,438 |
|
|
|
2,960 |
|
|
|
2,922 |
|
|
|
1,404 |
|
|
|
Other revenues |
|
|
1,508 |
|
|
|
1,717 |
|
|
|
1,843 |
|
|
|
1,903 |
|
|
|
2,117 |
|
|
|
|
|
|
|
|
|
|
|||||||||||||||
|
Total revenues |
|
$ |
484,958 |
|
|
$ |
691,559 |
|
|
$ |
917,722 |
|
|
$ |
664,809 |
|
|
$ |
513,853 |
|
|
|
|
|
|
|
|
|
|
|||||||||||||||
|
Net interest expense |
|
$ |
(40,351 |
) |
|
$ |
(31,652 |
) |
(2) |
$ |
(14,166 |
) |
|
$ |
(27,148 |
) |
|
$ |
(27,738 |
) |
|
|
|
|
|
|
|
|
|
|||||||||||||||
|
(Loss) income from continuing operations |
|
$ |
(6,528 |
) |
|
$ |
26,456 |
|
(2) |
$ |
213,139 |
|
|
$ |
107,359 |
|
|
$ |
63,217 |
|
|
|
|
|
|
|
|
|
|
|||||||||||||||
|
Net (loss) income |
|
$ |
(6,528 |
) |
|
$ |
26,456 |
|
(2) |
$ |
213,139 |
|
|
$ |
107,049 |
|
|
$ |
61,602 |
|
|
|
|
|
|
|
|
|
|
|||||||||||||||
|
Basic (loss) earnings per share from continuing operations |
|
$ |
(0.10 |
) |
|
$ |
0.39 |
|
(2) |
$ |
3.22 |
|
(2) |
$ |
1.72 |
|
(2) |
$ |
1.02 |
|
(2) |
|
|
|
|
|
|
|
|
|||||||||||||||
|
Basic (loss) earnings per share |
|
$ |
(0.10 |
) |
|
$ |
0.39 |
|
(2) |
$ |
3.22 |
|
(2) |
$ |
1.72 |
|
(2) |
$ |
0.99 |
|
(2) |
|
|
|
|
|
|
|
|
|||||||||||||||
|
Diluted (loss) earnings per share from continuing operations |
|
$ |
(0.10 |
) |
|
$ |
0.38 |
|
(2) |
$ |
3.22 |
|
(2) |
$ |
1.70 |
|
(2) |
$ |
1.01 |
|
(2) |
|
|
|
|
|
|
|
|
|||||||||||||||
|
Diluted (loss) earnings per share |
|
$ |
(0.10 |
) |
|
$ |
0.38 |
|
(2) |
$ |
3.20 |
|
(2) |
$ |
1.69 |
|
(2) |
$ |
0.98 |
|
(2) |
|
|
|
|
|
|
|
|
|||||||||||||||
|
Cash dividends declared per share |
|
$ |
0.30 |
|
|
$ |
0.60 |
|
|
$ |
0.50 |
|
|
$ |
0.20 |
|
|
$ |
— |
|
|
|
|
|
|
|
|
|
|
|||||||||||||||
|
Balance Sheet data: |
|
|
|
|
|
|
|
|
|
|
|
|
|
|
|
|
|
|
|
|
|
|
Working capital |
|
$ |
525,892 |
|
|
$ |
662,993 |
|
|
$ |
490,740 |
|
|
$ |
258,636 |
|
|
$ |
141,711 |
|
|
|
Total assets |
|
$ |
1,586,123 |
|
|
$ |
1,662,968 |
|
(2) |
$ |
2,020,104 |
|
|
$ |
1,477,165 |
|
|
$ |
1,060,752 |
|
|
|
Credit facility borrowings |
|
$ |
— |
|
|
$ |
— |
|
|
$ |
— |
|
|
$ |
— |
|
|
$ |
34,542 |
|
|
|
Long-term debt (net) |
|
$ |
512,939 |
|
|
$ |
294,473 |
|
(2) |
$ |
99,888 |
|
|
$ |
99,791 |
|
|
$ |
99,701 |
|
|
|
York Property capital lease obligation |
|
$ |
— |
|
|
$ |
167,190 |
|
|
$ |
168,986 |
|
|
$ |
170,605 |
|
|
$ |
172,044 |
|
|
|
Shareholders’ equity |
|
$ |
576,985 |
|
|
$ |
572,093 |
|
(2) |
$ |
604,017 |
|
|
$ |
301,687 |
|
|
$ |
126,276 |
|
|
|
|
|
|
|
|
||
|
|
|
|
|
(1) |
Represents the hammer (sale) price of property sold at auction. |
|
|
|
|
|
|
(2) |
This amount has been adjusted as the result of the retrospective application of accounting rules that became effective in 2009. See “Adjustments to Prior Period Presentation” in Item 7, “Management’s Discussion and Analysis of Financial Condition and Results of Operations,” and Notes B and D of Notes to Consolidated Financial Statements for detailed information regarding the adoption of these accounting rules and the resulting impact on the amounts previously reported. |
|
17
|
|
|
|
MANAGEMENT’S DISCUSSION AND ANALYSIS OF FINANCIAL CONDITION AND RESULTS OF OPERATIONS |
Seasonality
The worldwide art auction market has two principal selling seasons, which generally occur in the second and fourth quarters of the year. Accordingly, our auction business is seasonal, with peak revenues and operating income generally occurring in those quarters. Consequently, first and third quarter results have historically reflected a lower volume of auction activity when compared to the second and fourth quarters and, typically, a net loss due to the fixed nature of many of our operating expenses. (See Note X of Notes to Consolidated Financial Statements for information on our quarterly results for 2009 and 2008.)
Adjustments to Prior Period Presentation
As explained below, certain prior period amounts in this Form 10-K have been adjusted as the result of the retrospective application of accounting rules that became effective in 2009.
Earnings (Loss) Per Share—Our presentation of basic and diluted earnings per share for 2008 and 2007 has been retroactively adjusted as a result of the adoption on January 1, 2009 of a new accounting rule, which clarified that share-based payments with nonforfeitable rights to dividends should be considered participating securities in the computation of earnings (loss) per share. See Notes B and D of Notes to Consolidated Financial Statements for detailed information on the impact of adopting this new accounting rule.
Convertible Notes—On January 1, 2009, a new accounting rule came into effect for certain convertible debt instruments that may be settled entirely or partially in cash upon conversion. Pursuant to this rule, the liability and equity components of convertible debt instruments within its scope must be separately accounted for in a manner that will reflect the borrower’s nonconvertible debt borrowing rate when interest expense is recognized in subsequent periods. The adoption of this new accounting rule required retrospective application for all prior periods presented.
The 3.125% Convertible Senior Notes (the “Convertible Notes”) that were issued on June 17, 2008 are within the scope of this accounting rule. Accordingly, interest expense for 2008 has been restated to reflect our nonconvertible debt borrowing rate. See Note B of Notes to Consolidated Financial Statements for detailed information on the impact of adopting this new accounting rule. Additionally, see Note M of Notes to Consolidated Financial Statements for more detailed information on the Convertible Notes.
Use of Non-GAAP Financial Measures
GAAP refers to generally accepted accounting principles in the United States of America. Included in Management’s Discussion and Analysis of Financial Condition and Results of Operations (or “MD&A”) are financial measures presented in accordance with GAAP and also on a non-GAAP basis.
EBITDA, as presented in MD&A under “Key Performance Indicators” is a supplemental measure of our performance that is not required by or presented in accordance with GAAP. EBITDA is not a measure of our financial performance under GAAP and should not be considered as an alternative to net income (loss) or any other performance measure derived in accordance with GAAP or as an alternative to cash flows from operating activities as a measure of our liquidity.
We define EBITDA as net income (loss), excluding income tax expense (benefit), net interest expense and depreciation and amortization expense. We caution users of our financial statements that amounts presented in accordance with our definition of EBITDA may not be comparable to similar measures disclosed by other companies, because not all companies and analysts calculate EBITDA in the same manner. We believe that EBITDA provides an important supplemental measure of our performance and that it is a measure frequently used by securities analysts, investors and other interested parties in the evaluation of Sotheby’s. We also utilize EBITDA in analyzing our performance and in the determination of annual incentive compensation. A reconciliation of EBITDA to net income (loss) derived in accordance with GAAP is presented below in “Reconciliation of Non-GAAP Financial Measures.”
18
Critical Accounting Estimates
The preparation of financial statements and related disclosures in conformity with GAAP requires management to make judgments, assumptions and estimates that affect the amounts reported in the Consolidated Financial Statements and accompanying notes. Actual results may ultimately differ from management’s original estimates as future events and circumstances sometimes do not develop as expected. Note C of Notes to Consolidated Financial Statements describes the significant accounting policies and methods used in the preparation of the Consolidated Financial Statements. In addition, management believes that the following are the most critical accounting estimates, which are not ranked in any particular order, which may affect Sotheby’s financial condition and/or results of operations.
|
|
|
|
|
|||
|
(1) |
Valuation of Art—The art market is not a highly liquid trading market. As a result, the valuation of art is inherently subjective and the realizable value of art often fluctuates over time. Accordingly, certain amounts reported in our Consolidated Financial Statements and accompanying notes are dependent upon management’s estimates of the realizable value of art held in inventory and art pledged as collateral for Finance segment loans. |
|||||
|
|
|
|||||
|
|
If management determines that the estimated realizable value of a specific artwork held in inventory is less than its carrying value, a loss is recorded to reduce the carrying value of the artwork to management’s estimate of realizable value. As of December 31, 2009 and 2008, the carrying value of our inventory was $142.6 million (approximately 9% of total assets) and $186.6 million (approximately 11% of total assets), respectively. |
|||||
|
|
|
|||||
|
|
If management determines that the value of the art pledged as collateral for Finance segment loans is less than the corresponding loan balance, management would be required to assess whether it is necessary to record a loss to reduce the carrying value of the loan, after taking into account the ability of the borrower to repay any shortfall in the value of the collateral when compared to the amount of the loan. As of December 31, 2009, net notes receivable had a carrying value of $164.5 million and the related collateral was valued at approximately $340.4 million. As of December 31, 2008, net notes receivable had a carrying value of $176.9 million, respectively, and the related collateral was valued at approximately $344.5 million. |
|||||
|
|
|
|||||
|
|
In determining the realizable value of art, management relies on the opinions of Sotheby’s specialists, who consider the following complex array of factors when valuing art: |
|||||
|
|
|
|
|
|||
|
|
|
• |
Whether the artwork is expected to be offered at auction or sold privately. |
|||
|
|
|
|
|
|||
|
|
|
• |
The current and expected future demand for works of art, taking into account economic conditions and changing trends in the art market as to which collecting categories and artists are most sought after. |
|||
|
|
|
|
|
|||
|
|
|
• |
Recent sale prices achieved in the art market for comparable works of art within a particular collecting category and/or by a particular artist. |
|||
|
|
|
|
|
|||
|
|
Due to the inherent subjectivity involved in estimating the realizable value of art, management’s judgments about the estimated realizable value of art held in inventory and the realizable value of art pledged as collateral for Finance segment loans may prove, with the benefit of hindsight, to be inaccurate. |
|||||
|
|
|
|
|
|||
|
|
(See Notes F and G of Notes to Consolidated Financial Statements.) |
|||||
|
|
|
|
|
|||
|
(2) |
Pension Obligations—The pension obligations related to our U.K. defined benefit pension plan (the “U.K. Pension Plan”) are developed from an actuarial valuation. Inherent in this valuation are key assumptions and estimates, including the discount rate, expected long-term return on plan assets, future expectations of inflation, future compensation increases, mortality assumptions and other factors, which are updated on at least an annual basis. In developing these assumptions and estimates, management considers current market conditions, market indices and other relevant data. |
|||||
|
|
|
|
|
|||
|
|
The discount rate assumption represents the approximate weighted average rate at which the obligations of the U.K. Pension Plan could be effectively settled and is based on a hypothetical portfolio of high-quality corporate bonds with maturity dates approximating the length of time remaining until individual benefit payment dates. The discount rate used to calculate the $2.3 million net pension credit related to the U.K. Pension Plan in 2009 was 6.0%. A hypothetical increase or decrease of 0.1% in this assumption would result in a decrease or increase in net annual pension cost of approximately $0.2 million. As of the date of the most recent plan actuarial valuation (December 31, 2009), the discount rate used to calculate the $257.4 million benefit obligation related to the U.K. Pension Plan was 5.7%. A hypothetical increase or decrease of 0.1% in this assumption would result in a decrease or increase in the benefit obligation of approximately $5.2 million. |
|||||
19
|
|
|
|
|
The assumption for the expected long-term return on plan assets is based on expected future appreciation, as well as dividend and interest yields available in equity and bond markets as of the measurement date and weighted according to the composition of invested plan assets. The expected long-term return on plan assets used to calculate the $2.3 million net pension credit related to the U.K. Pension Plan in 2009 was 7.4%. A hypothetical increase or decrease of 0.25% in this assumption would result in a decrease or increase in net annual pension cost of approximately $0.7 million. |
|
|
|
|
|
The assumption for future average annual compensation increases is established after considering historical salary data for our U.K. employees and current economic data for inflation, as well as management’s expectations for future salary growth. The assumption for future average annual compensation increases used to calculate the $2.3 million net pension credit related to the U.K. Pension Plan in 2009 was 4.8%. A hypothetical increase or decrease of 0.25% in this assumption would result in an increase or decrease in net annual pension cost of approximately $0.2 million. As of the date of the most recent plan actuarial valuation (December 31, 2009), the assumption for future annual compensation increases used to calculate the $257.4 million benefit obligation related to the U.K. Pension Plan was 5.5%. A hypothetical increase or decrease of 0.25% in this assumption would result in an increase or decrease in the benefit obligation of approximately $1.6 million. |
|
|
|
|
|
The mortality assumptions used in the actuarial valuation represent the approximate life expectancies for plan members based upon standardized data tables used by actuaries in the U.K. that include allowances for longer future life expectancies. A hypothetical 5% increase or decrease in life expectancies would result in an increase or decrease in net pension cost of approximately $0.2 million. Additionally, a hypothetical 5% increase or decrease in life expectancies would result in an increase or decrease in the benefit obligation of approximately $2.3 million. |
|
|
|
|
|
As of the December 31, 2009 and December 31, 2008 actuarial valuations for the U.K. Pension Plan, pre-tax net actuarial losses totaled $26.1 million ($17.3 million, after tax) and $18.3 million ($13.2 million, after tax). These losses accumulated over several years as a result of differences in actual experience compared to projected experience. Between December 31, 2008 and December 31, 2009, a decrease in bond yields resulted in a lower discount rate used to measure plan liabilities and market expectations of inflation increased, causing an increase in the net actuarial loss. However, also during this period, the strength of the global equity markets resulted in a better than expected return on plan assets, which partially offset the impact of the lower discount rate and higher inflation. The net actuarial loss which is reflected in the Consolidated Balance Sheets on an after-tax basis within accumulated other comprehensive loss, is being systematically recognized as an increase in future net annual pension cost. Such pre-tax losses in excess of 10% of the greater of the market-related value of plan assets or the plan’s projected benefit obligation are recognized over a period of approximately 14.2 years, which represents the average remaining service period of active employees expected to receive benefits under the plan. |
|
|
|
|
|
(See Note R of Notes to Consolidated Financial Statements for additional information related to the U.K. Pension Plan, as well as Sotheby’s other material pension arrangements.) |
|
|
|
|
(3) |
Income Taxes—The provision for income taxes involves a significant amount of management judgment regarding interpretation of relevant facts and laws in the jurisdictions in which Sotheby’s operates. Future changes in applicable laws, projected levels of taxable income, and tax planning could change the effective tax rate and the tax balances recorded. |
|
|
|
|
|
As of December 31, 2009, we had net deferred tax assets of $58.7 million, primarily resulting from deductible temporary differences which will reduce taxable income in future periods over a number of years. Included in this net deferred tax asset is a valuation allowance of $19.5 million to reduce our deferred tax assets to the amount that is more likely than not to be realized. In assessing the need for the valuation allowance, we consider, among other things, our projections of future taxable income and ongoing prudent and feasible tax planning strategies. If our projections of future taxable income and other positive evidence considered in evaluating the need for a valuation allowance prove, with the benefit of hindsight, to be inaccurate, it will be more difficult to support the realization of these deferred tax assets. As a result, an additional valuation allowance may be required, which would have an adverse impact on our results. Conversely, should we determine that we would be able to realize our deferred tax assets in the future in excess of its net recorded amount, an adjustment to the deferred tax asset would have a favorable impact on our results in the period such determination was made. |
|
|
|
|
|
Additionally, liabilities are recorded to address potential exposures involving uncertain tax positions that we have taken, or expect to take, on income tax returns that could be challenged by taxing authorities. These potential exposures result from the varying applications of statutes, rules, regulations and interpretations. Inherent in our liabilities for uncertain tax positions are assumptions based on past experiences and judgments about potential actions by taxing jurisdictions. The cost of the ultimate resolution of these matters may be greater or less than the liability that we have recorded. |
|
|
|
|
|
(See discussion of “Income Tax Expense” below, as well as Notes N and O of Notes to Consolidated Financial Statements.) |
20
|
|
|
|
(4) |
Goodwill—Goodwill is not amortized, but is tested annually for impairment at the reporting unit level as of October 31 and between annual tests if indicators of impairment exist. These indicators could include a significant change in the outlook for our business, legal factors, lower than expected operating results, increased competition, or the sale or disposition of a significant portion of a reporting unit. Application of the goodwill impairment test requires management judgment, including the identification of reporting units, the assignment of assets and liabilities to reporting units, the assignment of goodwill to reporting units, and the determination of the fair value of each reporting unit. The fair value of each reporting unit is estimated using a discounted cash flow methodology. This methodology requires significant judgments including the estimation by management of future cash flows, which is dependent on internal forecasts. Changes in the estimates and assumptions used by management could materially affect the determination of fair value and/or impairment. |
|
|
|
|
|
Our goodwill balance is entirely attributable to the Auction reporting unit. We performed our latest annual impairment test for goodwill as of October 31, 2009. The results of this impairment test indicate that the estimated fair value of the Auction reporting unit significantly exceeds its book value as of October 31, 2009. |
|
|
|
|
|
(See Notes J and K of Notes to Consolidated Financial Statements.) |
|
|
|
|
(5) |
Share-Based Payments—We grant share-based payment awards as compensation to certain employees. Compensation expense recognized for share-based payments is dependent upon the valuation of the underlying award. Inherent in this valuation are assumptions, including management’s estimates of future earnings, employee forfeitures, the expected life of the award, the expected volatility of Sotheby’s stock price and dividend yield. In developing these assumptions, management considers historical data, current market conditions and other relevant data. Changes in the assumptions used by management could materially affect the determination of a share-based payment award’s fair value and the amount of compensation expense recognized in a period. (See Note Q of Notes to Consolidated Financial Statements.) |
RESULTS OF OPERATIONS FOR THE YEARS ENDED DECEMBER 31, 2009 AND 2008
This discussion should be read in conjunction with Note E (“Segment Reporting”) of Notes to Consolidated Financial Statements.
Overview
In 2009, we reported a net loss of ($6.5) million, as compared to net income of $26.5 million in 2008. The net loss in 2009 was largely the result of a 54% decrease in Net Auction Sales caused by a downturn in the international art market, which resulted from a weakening of the global economy and the associated turbulence in global financial and credit markets that began in September 2008. In addition, our 2009 results were adversely impacted by a significant increase in our effective income tax rate. The impact of the downturn in the international art market on our 2009 results was significantly mitigated by a $185.3 million, or 30%, decrease in expenses, as well as the absence of $60.2 million in auction guarantee losses recognized in the prior year and a 37% improvement in auction commission margin. The significant decrease in expenses in 2009 is due to an array of factors, including our cost reduction initiatives, a lower volume of auction offerings and favorable changes in foreign currency exchange rates.
While we experienced a decline in our year-over-year results in 2009, our fourth quarter net income of $73.6 million marked a substantial improvement from our net loss of ($9.3) million in the fourth quarter of 2008. This significant improvement in profitability, which was achieved despite a 7% decrease in Net Auction Sales, was primarily the result of a 27.4% improvement in auction commission margin and a $47.5 million decrease in expenses. Also favorably impacting the comparison of fourth quarter results are $20.5 million of principal activity losses in the fourth quarter of 2008 primarily due to inventory writedowns and auction guarantee losses that were not repeated in the current quarter.
See below for a more detailed discussion of each of the significant factors impacting our 2009 results and the comparison to the prior year.
21
Outlook
In the fourth quarter of 2008, the international art market began a significant decline that continued well into 2009 resulting in sales levels drastically lower than those experienced in the three years prior. However, we believe there are indications that the international art market has stabilized and begun to recover. We are very encouraged by the level of Net Auction Sales beginning in the fourth quarter of 2009 and through the end of February 2010. This is especially true of our London series of Impressionist and Contemporary Art sales in February, which achieved our highest total ever for this group of sales in London.
With the international art market showing signs of recovery, improved margins and a significantly reduced cost base, we believe that Sotheby’s is well-positioned to improve upon its financial results in 2010. However, because there is still uncertainty in the global economy, we acknowledge the potential for further art market volatility that could limit the extent of our improvement on 2009’s results. We are also mindful of the fact that we now have year to date market share in 2010 of over 60% versus our principal competitor, who has consistently defined itself by market share leadership. Consequently, there is the prospect that they could take competitive actions in such areas as pricing and guarantees that could adversely affect our margins in 2010.
(See statement on Forward Looking Statements.)
22
Results of Operations for the Years Ended December 31, 2009 and 2008
The table below presents a summary of our results of operations for 2009 and 2008, as well as a comparison between the two periods (in thousands of dollars):
|
|
|
|
|
|
|
|
|
|
|
|
|
|
|
|
|
|
|
|
|
|
|
|
|
|
|
|
|
Favorable/(Unfavorable) |
|
|||||
|
|
|
|
|
|
|
|
|
|
|
|||||||
|
|
|
2009 |
|
2008 |
|
$ Change |
|
% Change |
||||||||
|
|
|
|
|
|
||||||||||||
|
Revenues: |
|
|
|
|
|
|
|
|
|
|
|
|
|
|
|
|
|
Auction and related revenues |
|
$ |
448,768 |
|
|
$ |
616,625 |
|
|
$ |
(167,857 |
) |
|
|
(27.2% |
) |
|
Finance revenues |
|
|
9,073 |
|
|
|
14,183 |
|
|
|
(5,110 |
) |
|
|
(36.0% |
) |
|
Dealer revenues |
|
|
22,339 |
|
|
|
55,596 |
|
|
|
(33,257 |
) |
|
|
(59.8% |
) |
|
License fee revenues |
|
|
3,270 |
|
|
|
3,438 |
|
|
|
(168 |
) |
|
|
(4.9% |
) |
|
Other revenues |
|
|
1,508 |
|
|
|
1,717 |
|
|
|
(209 |
) |
|
|
(12.2% |
) |
|
|
|
|
|
|
||||||||||||
|
Total revenues |
|
|
484,958 |
|
|
|
691,559 |
|
|
|
(206,601 |
) |
|
|
(29.9% |
) |
|
Expenses ** |
|
|
431,824 |
|
|
|
617,141 |
|
|
|
185,317 |
|
|
|
30.0% |
|
|
|
|
|
|
|
||||||||||||
|
Operating income |
|
|
53,134 |
|
|
|
74,418 |
|
|
|
(21,284 |
) |
|
|
(28.6% |
) |
|
Net interest expense |
|
|
(40,351 |
) |
|
|
(31,652 |
) |
|
|
(8,699 |
) |
|
|
(27.5% |
) |
|
Extinguishment of debt (net) |
|
|
1,039 |
|
|
|
5,364 |
|
|
|
(4,325 |
) |
|
|
(80.6% |
) |
|
Write-off of credit facility amendment fees |
|
|
(3,750 |
) |
|
|
— |
|
|
|
(3,750 |
) |
|
|
N/A |
|
|
Other income (expense) |
|
|
5,323 |
|
|
|
(2,956 |
) |
|
|
8,279 |
|
|
|
* |
|
|
|
|
|
|
|
||||||||||||
|
Income before taxes |
|
|
15,395 |
|
|
|
45,174 |
|
|
|
(29,779 |
) |
|
|
(65.9% |
) |
|
Equity in earnings of investees, net of taxes |
|
|
239 |
|
|
|
2,139 |
|
|
|
(1,900 |
) |
|
|
(88.8% |
) |
|
Income tax expense |
|
|
22,162 |
|
|
|
20,857 |
|
|
|
(1,305 |
) |
|
|
(6.3% |
) |
|
|
|
|
|
|
||||||||||||
|
Net (loss) income |
|
$ |
(6,528 |
) |
|
$ |
26,456 |
|
|
$ |
(32,984 |
) |
|
|
* |
|
|
|
|
|
|
|
||||||||||||
|
Key performance indicators: |
|
|
|
|
|
|
|
|
|
|
|
|
|
|
|
|
|
Aggregate Auction Sales (a) |
|
$ |
2,278,525 |
|
|
$ |
4,905,504 |
|
|
$ |
(2,626,979 |
) |
|
|
(53.6% |
) |
|
Net Auction Sales (b) |
|
$ |
1,912,589 |
|
|
$ |
4,189,735 |
|
|
$ |
(2,277,146 |
) |
|
|
(54.4% |
) |
|
Private Sales (c) |
|
$ |
472,603 |
|
|
$ |
373,721 |
|
|
$ |
98,882 |
|
|
|
26.5% |
|
|
Consolidated Sales (d) |
|
$ |
2,773,467 |
|
|
$ |
5,334,821 |
|
|
$ |
(2,561,354 |
) |
|
|
(48.0% |
) |
|
Auction commission margin (e) |
|
|
20.7 |
% |
|
|
15.1 |
% |
|
|
N/A |
|
|
|
37.4% |
|
|
Average loan portfolio (f) |
|
$ |
154,619 |
|
|
$ |
185,545 |
|
|
$ |
(30,926 |
) |
|
|
(16.7% |
) |
|
EBITDA (g) |
|
$ |
77,674 |
|
|
$ |
105,560 |
|
|
$ |
(27,886 |
) |
|
|
(26.4% |
) |
Legend:
|
|
|
|
|
* |
|
Represents a change in excess of 100%. |
|
|
|
|
|
** |
|
Expenses for 2009 include net restructuring charges of $12.2 million. Expenses for 2008 include a benefit of $18.4 million recognized as a result of the reversal of the remaining liability related to the vendor’s commission discount certificates issued by Sotheby’s in 2003 in conjunction with the settlement of antitrust related civil litigation, an impairment loss of $13.2 million and $4.3 million in restructuring charges. See below for a more detailed discussion of each of these amounts. |
|
|
|
|
|
(a) |
|
Represents the hammer (sale) price of property sold at auction plus buyer’s premium. |
|
|
|
|
|
(b) |
|
Represents the hammer (sale) price of property sold at auction. |
|
|
|
|
|
(c) |
|
Represents the total purchase price of property sold in private sales brokered by Sotheby’s. |
|
|
|
|
|
(d) |
|
Represents the sum of Aggregate Auction Sales, Private Sales and Dealer revenues. |
|
|
|
|
|
(e) |
|
Represents total auction commission revenues as a percentage of Net Auction Sales. |
|
|
|
|
|
(f) |
|
Represents the average loan portfolio of Sotheby’s Finance segment. |
|
|
|
|
|
(g) |
|
See “Use of Non-GAAP Financial Measures” above and “Reconciliation of Non-GAAP Financial Measures” below. |
23
Impact of Changes in Foreign Currency Exchange Rates
In 2009, changes in foreign currency exchange rates had a net favorable impact of approximately $4.3 million on our results, as summarized in the following table (in thousands of dollars):
|
|
|
|
|
|
|
|
|
Favorable
/ |
|
|
|
|
|
|||
|
Total revenues |
|
$ |
(23,093 |
) |
|
Total expenses |
|
|
26,243 |
|
|
|
|
|||
|
Operating income |
|
|
3,150 |
|
|
Net interest expense and other |
|
|
1,176 |
|
|
|
|
|||
|
Impact of changes in foreign currency exchange rates |
|
$ |
4,326 |
|
|
|
|
|||
Revenues
In 2009 and 2008, revenues consisted of the following (in thousands of dollars):
|
|
|
|
|
|
|
|
|
|
|
|
|
|
|
|
|
|
|
|
|
|
|
|
|
|
|
Favorable/(Unfavorable) |
||||||||
|
|
|
|
|
|
|
|
|
|||||||||
|
Year Ended December 31 |
|
2009 |
|
2008 |
|
$ Change |
|
% Change |
||||||||
|
|
|
|
|
|||||||||||||
|
Auction and related revenues: |
|
|
|
|
|
|
|
|
|
|
|
|
|
|
|
|
|
Auction commission revenues |
|
$ |
396,772 |
|
|
$ |
632,772 |
|
|
$ |
(236,000 |
) |
|
|
(37.3% |
) |
|
Auction expense recoveries |
|
|
8,184 |
|
|
|
15,245 |
|
|
|
(7,061 |
) |
|
|
(46.3% |
) |
|
Private sale commissions |
|
|
37,462 |
|
|
|
33,799 |
|
|
|
3,663 |
|
|
|
10.8% |
|
|
Principal activities |
|
|
(5,735 |
) |
|
|
(82,743 |
) |
|
|
77,008 |
|
|
|
93.1% |
|
|
Catalogue subscription revenues |
|
|
5,028 |
|
|
|
6,955 |
|
|
|
(1,927 |
) |
|
|
(27.7% |
) |
|
Other |
|
|
7,057 |
|
|
|
10,597 |
|
|
|
(3,540 |
) |
|
|
(33.4% |
) |
|
|
|
|
|
|
||||||||||||
|
Total auction and related revenues |
|
|
448,768 |
|
|
|
616,625 |
|
|
|
(167,857 |
) |
|
|
(27.2% |
) |
|
|
|
|
|
|
||||||||||||
|
Other revenues: |
|
|
|
|
|
|
|
|
|
|
|
|
|
|
|
|
|
Finance revenues |
|
|
9,073 |
|
|
|
14,183 |
|
|
|
(5,110 |
) |
|
|
(36.0% |
) |
|
Dealer revenues |
|
|
22,339 |
|
|
|
55,596 |
|
|
|
(33,257 |
) |
|
|
(59.8% |
) |
|
License fee revenues |
|
|
3,270 |
|
|
|
3,438 |
|
|
|
(168 |
) |
|
|
(4.9% |
) |
|
Other |
|
|
1,508 |
|
|
|
1,717 |
|
|
|
(209 |
) |
|
|
(12.2% |
) |
|
|
|
|
|
|
||||||||||||
|
Total other revenues |
|
|
36,190 |
|
|
|
74,934 |
|
|
|
(38,744 |
) |
|
|
(51.7% |
) |
|
|
|
|
|
|
||||||||||||
|
Total revenues |
|
$ |
484,958 |
|
|
$ |
691,559 |
|
|
$ |
(206,601 |
) |
|
|
(29.9% |
) |
|
|
|
|
|
|
||||||||||||
Auction and Related Revenues
In 2009, auction and related revenues decreased $167.9 million, or 27%, principally due to a 37% reduction in auction commission revenues, partially offset by a substantially lower level of principal activity losses. The comparison to 2008 is also impacted by changes in foreign currency exchange rates, which contributed approximately $20.4 million to the net decrease. See the discussion below for a more detailed explanation of the significant factors contributing to the net decrease in auction and related revenues in 2009.
Auction Commission Revenues—In our role as auctioneer, we represent sellers of artworks accepting property on consignment and match sellers to buyers through the auction process. We invoice the buyer for the purchase price of the property (including the commission owed by the buyer), collect payment from the buyer and remit to the seller the net sale proceeds after deducting our commissions, expenses and applicable taxes and royalties. Our commissions include those paid by the buyer (“buyer’s premium”) and those paid by the seller (“seller’s commission”) (collectively, “auction commission revenue”), both of which are calculated as a percentage of Net Auction Sales.
In 2009, auction commission revenues decreased $236 million, or 37%, due to a 54% reduction in Net Auction Sales, partially offset by a 37% improvement in auction commission margin. The comparison to 2008 is also impacted by changes in foreign currency exchange rates, which contributed approximately $18.3 million to the net decrease.
See “Net Auction Sales” and “Auction Commission Margin” below for a more detailed discussion of these key performance indicators.
24
Net Auction Sales—In 2009, Net Auction Sales decreased $2.3 billion, or 54%, largely due to the downturn in the international art market, which prevented us from achieving auction consignment levels and selling prices comparable to the levels attained in 2008.
The downturn in the international art market impacted virtually all collecting categories, but was felt most significantly in our Impressionist and Contemporary Art departments, which experienced decreases in Net Auction Sales of $536 million (55%) and $946 million (72%), respectively, as significantly fewer objects were offered at these auctions and objects that sold achieved substantially lower prices. A significant contributor to the decrease in sales of Contemporary Art is the unprecedented September 2008 Beautiful Inside My Head Forever sale, which featured the sale of new Contemporary Art works by Damien Hirst.
In addition to the lower level of Impressionist and Contemporary Art sales, 2009 results are also impacted by decreased sales of Asian Art (↓ $146 million), Decorative Arts and Furniture (↓$81 million), Russian Art (↓$74 million), Old Master Paintings (↓$55 million) and American Paintings (↓$52 million), as well as changes in foreign currency exchange rates, which contributed approximately $90 million to the net decrease.
Despite the overall decrease in Net Auction Sales in 2009, we witnessed the stabilization and improvement in the art market in our autumn sales season as evidenced by the steady improvement in the percentage of lots successfully sold when compared to the fourth quarter of 2008. Additionally, in the second half of 2009, our auction offerings have achieved a significantly higher percentage of presale low estimates as compared to results for the first half of 2009.
Auction Commission Margin—Auction commission margin represents total auction commission revenues as a percentage of Net Auction Sales. Typically, auction commission margins are higher for lower value works of art or collections, while higher valued property earns lower margins.
Auction commission margins may also be adversely impacted by the use of auction guarantees. In situations when the guaranteed property sells for less than the minimum guaranteed price, all or a portion of the auction commissions earned are used to reduce our principal loss on the transaction.
In certain situations, auction commission margins are adversely impacted by arrangements whereby our auction commission is shared with a consignor or with a partner in an auction guarantee. In such situations, in an effort to reduce our financial exposure under an auction guarantee, we may: (a) share our auction commission with a consignor in order to secure a high value consignment without issuing an auction guarantee or (b) enter into a risk and reward sharing arrangement with an unaffiliated counterparty whereby we reduce our financial exposure under the auction guarantee in exchange for sharing our auction commission. Additionally, we may also share our auction commission with a consignor as part of an auction guarantee, typically in exchange for a portion of the hammer (sale) price in excess of a negotiated amount.
In response to the uncertain economic environment and the downturn in the international art market that was evident for most of 2009, we have substantially reduced our use of auction guarantees in 2009. We expect to continue to significantly limit our use of auction guarantees for the foreseeable future. (See statement on Forward Looking Statements.)
Partly as a result of reduced auction commission margins in early 2008, we implemented a buyer’s premium rate increase that became effective on June 1, 2008. In salesrooms in the U.S., the buyer’s premium became 25% on the first $50,000 of hammer (sale) price; 20% on the portion of hammer price above $50,000 up to and including $1 million; and 12% on any remaining amount above $1 million. Generally, in foreign salesrooms, these U.S. dollar thresholds were translated into an appropriate fixed local currency amount. For auction sales conducted through May 31, 2008, the buyers’ premium charged was generally 25% of the hammer price on the first $20,000, 20% of the hammer price above $20,000 up to and including $500,000 and 12% of any remaining amount over $500,000.
In 2009, auction commission margin increased approximately 37% (from 15.1% to 20.7%) as a result of the following factors:
|
|
|
|
|
|
• |
A change in sales mix, as a substantially lower portion of Net Auction Sales in 2009 was at the high-end of our business. |
|
|
|
|
|
|
• |
A significant decrease in our use of auction guarantees and related risk reduction arrangements and strategies. |
|
|
|
|
|
|
• |
The impact of the increased buyer’s premium rate structure that became effective in June 2008. |
25
Principal Activities—Principal activities consist mainly of gains and losses related to auction guarantees including: (i) any share of overage or shortfall recognized when the guaranteed property is offered or sold at auction; (ii) any subsequent writedowns to the carrying value of guaranteed property that initially failed to sell at auction; and (iii) any subsequent recoveries and losses on the sale of guaranteed property that initially failed to sell at auction. To a much lesser extent, principal activities include gains and losses related to the sale of other Auction segment inventory, as well as any writedowns to the carrying value of such inventory, which consists mainly of objects obtained incidental to the auction process primarily as a result of defaults by purchasers after a consignor has been paid.
As the market for high-end collecting categories grew considerably from 2005 through September 2008, competition with our principal competitor, Christie’s, greatly increased. As a result, our use of auction guarantees as a means of securing consignments increased significantly during this period and peaked in 2007. As discussed above, in response to the uncertain economic environment and the downturn in the international art market that was evident for most of 2009, we have substantially reduced our use of auction guarantees. The table below summarizes the total amount of auction guarantees issued by Sotheby’s, net of the impact of risk and reward sharing arrangements with partners, during the period 2005 to 2009 (in millions of dollars):
|
|
|
|
|
|
|
|
|
|
|
|
|
|
|
|
|
|
|
|
2005 |
|
2006 |
|
2007 |
|
2008 |
|
2009 |
|
||||||
|
|
|
|
|
|
|
|||||||||||
|
Net Auction Guarantees Issued |
$ |
131 |
|
$ |
450 |
|
$ |
902 |
|
$ |
626 |
|
$ |
7 |
|
|
In 2009, principal activity losses decreased $77 million, or 93%, as 2008 results include the impact of significant auction guarantee losses, as well as a higher level of inventory writedowns, both of which were largely attributable to the downturn in the international art market that began after September 15, 2008.
Private Sale Commissions—The level of private sale commissions earned by Sotheby’s can vary significantly from period to period. In 2009, private sale commissions increased $3.7 million, or 11%, despite the downturn in the international art market and the resulting challenging economic environment. This increase reflects our continued focus and commitment to capitalizing on this source of revenue.
Finance Revenues
In 2009, Finance revenues decreased $5.1 million, or 36%, principally due to lower benchmark interest rates earned on the loan portfolio and lower average loan portfolio balances in the periods. (Note: For the purposes of Management’s Discussion and Analysis, Finance revenues are presented on a consolidated basis and do not include intercompany revenues earned by the Finance segment from Sotheby’s Auction segment, which are eliminated in consolidation. See Note F of Notes to Consolidated Financial Statements.)
Dealer Revenues and Cost of Sales
Dealer revenues consist of revenues earned from the sale of property held by Noortman Master Paintings and objects purchased for investment purposes, as well as our share of gains resulting from the sale of property purchased by art dealers through unsecured loans from Sotheby’s. Dealer cost of sales includes the net book value of Dealer inventory sold during the period and any writedowns to the carrying value of Dealer inventory. The table below summarizes Dealer revenues, cost of sales and gross loss for the Dealer segment for 2009 and 2008 (in thousands of dollars):
|
|
|
|
|
|
|
|
|
|
|
|
|
|
|
|
|
|
|
|
|
|
|
|
|
|
|
Favorable/(Unfavorable) |
||||||||
|
|
|
|
|
|
|
|
|
|||||||||
|
|
|
2009 |
|
2008 |
|
$ Change |
|
% Change |
||||||||
|
|
|
|
|
|
||||||||||||
|
Dealer revenues |
|
$ |
22,339 |
|
|
$ |
55,596 |
|
|
$ |
(33,257 |
) |
|
|
(59.8% |
) |
|
Dealer cost of sales |
|
|
(24,516 |
) |
|
|
(61,978 |
) |
|
|
37,462 |
|
|
|
60.4% |
|
|
|
|
|
|
|
||||||||||||
|
Dealer gross loss |
|
$ |
(2,177 |
) |
|
$ |
(6,382 |
) |
|
$ |
4,205 |
|
|
|
65.9% |
|
|
|
|
|
|
|
||||||||||||
The improvement in Dealer segment results is primarily attributable to a significantly lower level of inventory writedowns in the current year. In 2009 and 2008, Dealer inventory writedowns totaled $4.7 million and $12.2 million, respectively.
26
Expenses
In 2009 and 2008, expenses consisted of the following (in thousands of dollars):
|
|
|
|
|
|
|
|
|
|
|
|
|
|
|
|
|
|
|
|
|
|
|
|
|
|
|
Favorable/(Unfavorable) |
||||||||
|
|
|
|
|
|
|
|||||||||||
|
Year Ended December 31 |
|
2009 |
|
2008 |
|
$ Change |
|
% Change |
||||||||
|
|
|
|
|
|||||||||||||
|
Direct costs of services |
|
$ |
43,429 |
|
|
$ |
95,410 |
|
|
$ |
51,981 |
|
|
|
54.5% |
|
|
Dealer cost of sales |
|
|
24,516 |
|
|
|
61,978 |
|
|
|
37,462 |
|
|
|
60.4% |
|
|
Marketing expenses |
|
|
10,541 |
|
|
|
19,662 |
|
|
|
9,121 |
|
|
|
46.4% |
|
|
Salaries and related costs |
|
|
196,269 |
|
|
|
240,126 |
|
|
|
43,857 |
|
|
|
18.3% |
|
|
General and administrative expenses |
|
|
123,350 |
|
|
|
176,004 |
|
|
|
52,654 |
|
|
|
29.9% |
|
|
Depreciation and amortization expense |
|
|
21,560 |
|
|
|
24,845 |
|
|
|
3,285 |
|
|
|
13.2% |
|
|
Restructuring charges (net) |
|
|
12,159 |
|
|
|
4,312 |
|
|
|
(7,847 |
) |
|
|
* |
|
|
Impairment loss |
|
|
— |
|
|
|
13,189 |
|
|
|
13,189 |
|
|
|
100.0% |
|
|
Antitrust related matters |
|
|
— |
|
|
|
(18,385 |
) |
|
|
(18,385 |
) |
|
|
(100.0% |
) |
|
|
|
|
|
|
||||||||||||
|
Total expenses |
|
$ |
431,824 |
|
|
$ |
617,141 |
|
|
$ |
185,317 |
|
|
|
30.0% |
|
|
|
|
|
|
|
||||||||||||
|
|
|
|
|
|
* |
Represents a change in excess of 100%. |
Direct Costs of Services
Direct costs of services consists largely of sale specific marketing costs such as auction catalogue production and distribution expenses, sale advertising and promotion expenses and traveling exhibition costs. Also included in direct costs of services are sale-related shipping expenses. The level of direct costs incurred in any period is generally dependent upon the volume and composition of our auction offerings. For example, direct costs attributable to single-owner or other high-value collections are typically higher than those associated with standard various-owner sales, mainly due to higher promotional costs for catalogues, special events and traveling exhibitions, as well as higher shipping expenses.
In 2009, direct costs of services decreased $52 million, or 55%, largely due to the downturn in the international art market, which resulted in a substantially lower level of Net Auction Sales and volume of property offered at auction during the year. Additionally, throughout 2009, we implemented a number of cost reduction initiatives, especially in catalogue production and distribution, other direct sale promotional costs and shipping, which were a significant contributor to the year-over-year savings.
Marketing Expenses
Marketing expenses are costs related to the promotion of the Sotheby’s brand and consist of the cost of corporate marketing activities (including the cost of client service initiatives) and the cost of strategic sponsorships of cultural institutions. In 2009, marketing expenses decreased by $9.1 million, or 46%, primarily as a result of our efforts to reduce discretionary spending in response to the downturn in the international art market.
27
Salaries and Related Costs
In 2009 and 2008, salaries and related costs consisted of the following (in thousands of dollars):
|
|
|
|
|
|
|
|
|
|
|
|
|
|
|
|
|
|
|
|
|
|
|
|
|
|
|
Favorable/(Unfavorable) |
||||||||
|
|
|
|
|
|
|
|
|
|||||||||
|
Year Ended December 31 |
|
2009 |
|
2008 |
|
$ Change |
|
% Change |
||||||||
|
|
|
|
|
|||||||||||||
|
Full-time salaries |
|
$ |
114,467 |
|
|
$ |
139,653 |
|
|
$ |
25,186 |
|
|
|
18.0% |
|
|
Share-based payments |
|
|
20,750 |
|
|
|
30,180 |
|
|
|
9,430 |
|
|
|
31.2% |
|
|
Incentive compensation |
|
|
18,255 |
|
|
|
27,464 |
|
|
|
9,209 |
|
|
|
33.5% |
|
|
Payroll taxes |
|
|
14,369 |
|
|
|
19,486 |
|
|
|
5,117 |
|
|
|
26.3% |
|
|
Employee benefits |
|
|
17,679 |
|
|
|
8,857 |
|
|
|
(8,822 |
) |
|
|
(99.6% |
) |
|
Option Exchange |
|
|
— |
|
|
|
216 |
|
|
|
216 |
|
|
|
100.0% |
|
|
Other * |
|
|
10,749 |
|
|
|
14,270 |
|
|
|
3,521 |
|
|
|
24.7% |
|
|
|
|
|
|
|
||||||||||||
|
Total salaries and related costs |
|
$ |
196,269 |
|
|
$ |
240,126 |
|
|
$ |
43,857 |
|
|
|
18.3% |
|
|
|
|
|
|
|
||||||||||||
|
|
|
|
|
|
|
|
|
|
|
|
|
|
|
|
|
|
|
Key Performance Indicator: |
|
|
|
|
|
|
|
|
|
|
|
|
|
|
|
|
|
Salaries and related costs as a % of total revenues |
|
|
40.5 |
% |
|
|
34.7 |
% |
|
|
N/A |
|
|
|
(16.6% |
) |
|
|
|
|
|
|
Legend: |
|
|
|
|
|
|
|
* |
Principally includes the cost of temporary labor and overtime. |
In 2009, salaries and related costs decreased $43.9 million, or 18%, principally due to lower levels of full-time salaries, share-based payments, incentive compensation and payroll taxes, partially offset by higher employee benefit costs. The comparison to the prior year is also impacted by changes in foreign currency exchange rates, which contributed approximately $11.4 million to the net decrease.
See below for a more detailed discussion of the significant factors contributing to the overall decrease in salaries and related costs. Also, see “Restructuring Plans and Related Charges” below for information on expected future savings in salaries and related costs.
Full-Time Salaries—In 2009, full-time salaries decreased $25.2 million, or 18%, primarily due to the impact of headcount reductions resulting from the implementation of our restructuring plans (see “Restructuring Plans and Related Charges” below), as well as changes in foreign currency exchange rates, which contributed approximately $8.3 million to the net decrease. To a lesser extent, the decrease in full-time salaries is also attributable to other cost savings initiatives enacted in response to the downturn in the international art market including unpaid employee furloughs and temporary pay reductions for certain senior employees.
Share-Based Payments—Share-based payments consist of the amortization of compensation expense for awards of restricted stock and restricted stock units. Such equity-based awards are granted annually each February and the value of such awards is generally dependent upon Sotheby’s financial results for the year prior to the grant date. (See Note Q of Notes to Consolidated Financial Statements for more detailed information on our share-based compensation programs.)
In 2009, share-based payments decreased $9.4 million, or 31%, principally due to a substantially lower value of restricted stock awarded to employees in February 2009 as a result of our lower profitability in 2008 when compared to 2007.
In 2010, share-based payments are expected to decrease approximately $1 million when compared to 2009. (See statement on Forward Looking Statements.)
Incentive Compensation—Incentive compensation consists of expense related to the Sotheby’s incentive compensation programs. The amount of incentive compensation expense recorded in a period is largely dependent upon the level of Sotheby’s profitability and is awarded at the discretion of the Compensation Committee of Sotheby’s Board of Directors. In addition, incentive compensation includes amounts related to private sale transactions conducted by Sotheby’s. In 2009, incentive compensation decreased $9.2 million, or 34%, principally due to our decrease in earnings.
Employee Benefits—Employee benefits include the cost of our retirement plans and health and welfare programs, as well as employee severance costs (excluding severance costs related to the restructuring plans discussed below). Our material retirement plans include defined benefit and defined contribution pension plans for U.K. employees and defined contribution and deferred compensation plans for U.S. employees.
28
Generally, the level of employee benefit costs is dependent upon headcount and compensation levels, as well as Sotheby’s financial performance. Additionally, expenses related to the U.K. Pension Plan are significantly influenced by interest rates, investment performance in the debt and equity markets and actuarial assumptions. Furthermore, the expense recorded for the Sotheby’s Deferred Compensation Plan (the “DCP”) is dependent upon changes in the fair value of our DCP liability during a period, which result from gains and losses in deemed participant investments. Gains in deemed participant investments increase our DCP liability, as well as our employee benefit costs. Losses in deemed participant investments decrease our DCP liability, as well as our employee benefit costs. (See Note R of Notes to Consolidated Financial Statements for a more detailed discussion of our material pension plans).
In 2009, employee benefit costs increased $8.8 million, or 100%, primarily due to a $10.5 million increase in expense associated with the DCP resulting from a $4.5 million gain in deemed participant investments. This expense is substantially offset by a $3.6 million gain in the trust assets related to the DCP liability, which is reflected within other income (expense), as discussed below. By contrast, in 2008, employee benefit costs included a $6 million credit related to the DCP resulting from a substantial loss in the value of deemed participant investments in 2008, which was largely offset by a loss of $5.1 million in the trust assets related to the DCP liability, reflected within other income (expense).
The overall increase in employee benefit costs in 2009 is also impacted by a $1.4 million decrease in the net pension credit related to the U.K. Pension Plan. This decrease is attributable to differences in the market-based assumptions used to determine the net pension credit between the periods.
The net increase in employee benefit costs described above is partially offset by the following factors:
|
|
|
|
|
|
• |
The impact of our restructuring-related headcount reductions implemented late in 2008 and throughout 2009. |
|
|
|
|
|
|
• |
A decrease in contributions to our U.S retirement plans as a result of (i) a lower level of incentive compensation costs and (ii) a May 2009 amendment to the Sotheby’s, Inc. Retirement Savings Plan, which reduced our matching contributions by 50%. |
In 2010, the net pension credit related to the U.K. Pension Plan is expected to increase by approximately $1.5 million when compared to 2009, primarily as a result of updated market-based assumptions used in determining the net pension credit. (See statement on Forward Looking Statements.)
General and Administrative Expenses
In 2009, general and administrative expenses decreased $52.7 million, or 30%, to $123.4 million. During 2009, the favorable impact of foreign currency translations on general and administrative expenses was approximately $7.1 million. Excluding the favorable impact of foreign currency translations, general and administrative expenses decreased $45.6 million, or 26%, to $130.5 million. The decrease in general and administrative expenses is largely due to cost savings initiatives enacted in response to the downturn in the international art market which achieved reductions in travel and entertainment costs (↓$14.4 million or 46%), professional fees (↓$11.7 million or 21%) and facilities-related costs (↓$6.3 million or 11%). Also contributing to the decrease in general and administrative expenses were favorable collection efforts related to accounts receivable that were previously thought to be uncollectible. In 2010, we will continue to focus on containing general and administrative expenditures, especially with regards to travel and entertainment costs and professional fees. (See statement on Forward Looking Statements.)
Depreciation and Amortization Expense
In 2009, depreciation and amortization expense decreased $3.3 million, or 13%, principally due to the difference between the depreciable lives utilized in accounting for the York Property building, which was purchased in February 2009 and is being depreciated over a 50-year life. Prior to this purchase, we occupied the York Property subject to a capital lease with the related asset being amortized over the initial 20-year term of the lease. See “York Property” below.
29
Restructuring Plans and Related Charges
In 2009, we recorded net Restructuring Charges of $12.2 million related to the restructuring plans described below.
2008 Restructuring Plan—Due to a downturn in the international art market, on December 1, 2008 and February 26, 2009, Sotheby’s Board of Directors approved restructuring actions impacting the Auction segment, as well as certain corporate departments. These restructuring actions (collectively, the “2008 Restructuring Plan”) are the result of a strategic review of our operations conducted by management between November 2008 and February 2009. The 2008 Restructuring Plan contemplates a 15% decrease in global headcount, a reduction in our selling activities and leased premises in Amsterdam and the vacating of other premises principally in the U.K. as a result of a reorganization of our European operations.
The 2008 Restructuring Plan includes $2.0 million of facility related costs associated with exiting certain leased facilities in the Netherlands and the U. K.. These facility related Restructuring Charges represent the future rental costs (net of estimated sub-lease income) that we remain obligated to pay subsequent to the cease use date for each facility. The cease use date for the Amsterdam facility was in December 2009 and the underlying lease expires in September 2014. The cease use date for the U.K. facility was in June 2009 and the underlying lease expired in December 2009.
2009 Restructuring Plan—In March and April 2009, in response to a continued downturn in the international art market, management conducted a further strategic review of our operations, and on April 27, 2009, the Executive Committee of the Board of Directors approved additional restructuring actions (the “2009 Restructuring Plan”). The 2009 Restructuring Plan impacts all areas of our global operations through additional significant cost reductions resulting from a further 5% decrease in global headcount. In 2009, we recorded net Restructuring Charges of $3.5 million for employee termination benefits related to the 2009 Restructuring Plan.
Restructuring activities resulting from the 2008 Restructuring Plan and 2009 Restructuring Plan are summarized as follows:
| Employee | Facility | ||||||||||||||
| Termination | Related | Other | |||||||||||||
| Benefits | Costs | Costs | Total | ||||||||||||
| Liability at January 1, 2008 | $ | - | $ | - | $ | - | $ | - | |||||||
| Charges for 2008 Restructuring Plan | 4,312 | - | - | 4,312 | |||||||||||
| Liability at December 31, 2008 | 4,312 | - | - | 4,312 | |||||||||||
| Charges for 2008 Restructuring Plan | 6,446 | 2,085 | 427 | 8,958 | |||||||||||
| Charges for 2009 Restructuring Plan | 3,578 | - | 3 | 3,581 | |||||||||||
| Cash payments | (12,844 | ) | (1,144 | ) | (359 | ) | (14,347 | ) | |||||||
| Adjustments to liability | (251 | ) | (129 | ) | - | (380 | ) | ||||||||
| Foreign currency exchange rate changes | 317 | 54 | 5 | 376 | |||||||||||
| Liability at December 31, 2009 | $ | 1,558 | $ | 866 | $ | 76 | $ | 2,500 |
As of December 31, 2009, the liability related to our restructuring activities was $2.5 million. The current portion of the liability of $1.8 million is recorded in the Consolidated Balance Sheets within Accounts Payable and Accrued Liabilities, and the non-current portion of $0.7 million is recorded with Other Liabilities. The majority of the liability related to employee termination benefits is expected to be paid by March 31, 2010. The liability for the facility related costs will be paid monthly according to the terms of the underlying lease through September 2014.
Cost Savings—In total, the 2008 Restructuring Plan and the 2009 Restructuring Plan are expected to result in aggregate annual cost savings of approximately $25 million. Of this amount, approximately $15 million was realized in 2009, almost entirely due to the headcount reductions.
In addition to the 2008 Restructuring Plan and 2009 Restructuring Plan, we implemented a number of other cost savings initiatives impacting all areas of expense. For example, in the second quarter of 2009, we initiated temporary pay reductions for certain staff and a reduction in U.S. pension contributions, and, in the third and fourth quarters of 2009, initiated unpaid furloughs for employees in certain operating locations. As a result of these cost savings initiatives and the actions taken in conjunction with the restructuring plans discussed above, we achieved aggregate cost savings of approximately $160 million in 2009 when compared to 2008 in direct cost of services, marketing expenses, salaries and related costs and general and administrative expenses. A portion of these savings was the result of favorable changes in foreign currency exchange rates and a lower volume of auction sales, when compared to the prior year.
(See Note L of Notes to Consolidated Financial Statements for additional information regarding the 2008 Restructuring Plan and 2009 Restructuring Plan.) (See statement on Forward Looking Statements.)
Impairment Loss and Insurance Recovery
Based on the results of our 2008 annual impairment test of the goodwill and indefinite-lived intangible assets related to Noortman Master Paintings, we recognized an impairment loss of $13.2 million in the fourth quarter of 2008. This impairment loss was principally due to a reduction in our future cash flow estimates for NMP. (See Notes J and K of Notes to Consolidated Financial Statements.)
30
Antitrust Related Matters
In April 1997, the U.S. Department of Justice (the “DOJ”) began an investigation of certain art dealers and major auction houses, including Sotheby’s and its principal competitor, Christie’s. In October 2000, Sotheby’s pled guilty to a violation of U.S. antitrust laws in connection with a conspiracy to fix auction commission rates charged to sellers in the U.S. and elsewhere.
In conjunction with the settlement of certain civil litigation related to the investigation by the DOJ, in May 2003, Sotheby’s and Christie’s issued to the class of plaintiffs vendor’s commission discount certificates (“Discount Certificates”) with a face value of $125 million, of which Sotheby’s was responsible for funding the redemption of $62.5 million. The court determined that the $62.5 million face value had a fair value of not less than $50 million, which is the amount of expense recognized as a Special Charge in the third quarter of 2000. The $12.5 million discount on the face value of the Discount Certificates was amortized to interest expense over the four-year period between the date of issuance and May 15, 2007, the date after which any unused Discount Certificates were redeemable for cash.
The Discount Certificates were fully redeemable in connection with any auction conducted by Sotheby’s or Christie’s in the U.S. or in the U.K. and could have been used to satisfy consignment charges involving vendor’s commission, risk of loss and/or catalogue illustration. Additionally, any unused Discount Certificates were redeemable for cash at their face value at any time between May 15, 2007 and May 14, 2008.
The Discount Certificates expired on May 14, 2008 and thereafter could no longer be redeemed. As a result of the expiration of the Discount Certificates, we reversed the remaining related liability and recognized a benefit of $18.4 million in the second quarter of 2008.
Net Interest Expense
In 2009, net interest expense increased $8.7 million, or 28%, primarily due to the incremental interest expense related to the Convertible Notes and the 7.75% Senior Notes issued on June 17, 2008 (see Note M of Notes to Consolidated Financial Statements), partially offset by the retirement in July 2008 of our 6.98% Senior Notes issued in 1999. The unfavorable variance in net interest expense when compared to 2008 is also attributable to lower interest income in 2009 resulting from lower average cash balances in the current year due to a lower level of operating results, as well as an $85 million payment made in February 2009 in conjunction with our purchase of the York Property, and the funding of auction guarantee losses in the fourth quarter of 2008.
Write-Off of Credit Facility Amendment Fees
As discussed in more detail under “Liquidity and Capital Resources” below, on August 31, 2009, we terminated our senior secured revolving credit facility with Bank of America, N.A. (the “BofA Credit Agreement”). As a result, we recorded a non-cash $2.5 million charge in the third quarter of 2009 to write-off the remaining balance of arrangement and amendment fees related to the BofA Credit Agreement. Additionally, as a result of amendments to the BofA Credit Agreement made in the first half of 2009, we recorded a non-cash $1.3 million charge in the second quarter of 2009 to partially write-off a portion of arrangement and amendment fees related to the BofA Credit Agreement. (See Note M of Notes to Consolidated Financial Statements.)
Extinguishment of Debt (Net)
Repurchase of 7.75% Senior Notes—On January 27, 2009, we repurchased $2.8 million of our 7.75% Senior Notes for a purchase price of $1.6 million (representing 59% of the aggregate principal amount repurchased). This repurchase resulted in a non-cash benefit of $1 million, net of fees, which was recognized in the first quarter of 2009.
On December 23, 2008, we repurchased an aggregate principal amount of $19 million of our 7.75% Senior Notes for a purchase price of $10.5 million (representing 56% of the aggregate principal amount repurchased). This repurchase resulted in a non-cash benefit of $7.8 million, net of fees, which was recognized in the fourth quarter of 2008.
Redemption of 6.98% Senior Notes—On July 18, 2008, we redeemed our 6.98% Senior Notes with a face value of $100 million for $105.7 million. The $105.7 million paid upon redemption includes $102.5 million for the present value of the remaining principal and interest and $3.2 million for accrued and unpaid interest through the date of redemption. As a result, we recognized a bond redemption cost of $2.5 million in the third quarter of 2008.
(See Note M of Notes to Consolidated Financial Statements.)
31
Other Income (Expense)
In 2009, our results include other income of $5.3 million, as compared to other expense of $3 million in 2008. Other income in 2009 includes a $3.6 million gain from changes in the fair value of the DCP trust assets. In 2008, other expense includes a net loss of $5.1 related to the DCP trust assets. Also included in 2009’s results is a gain of approximately $4 million related to the sale of Sotheby’s Australia. The majority of this gain was the result of the realization of the cumulative translation adjustment related to this entity. These factors were partially offset by unfavorable experience related to the settlement of certain derivative contracts when compared to 2008.
Income Tax Expense
The effective income tax rate was approximately 144% in 2009, compared to approximately 46.2% in 2008. The increase in the effective income tax rate is primarily the result of the recording of a valuation allowance in 2009 of $18.2 million against certain state, local and foreign deferred tax assets and loss carryforwards. The rate is also significantly influenced by the level and mix of current year earnings and losses by taxing jurisdiction, foreign tax rate differentials and the relative impact of permanent book to tax differences (i.e., non-deductible expenses) on lower pre-tax results by taxing jurisdiction as compared to the prior years. These factors are partially offset by the mix of income earned at tax rates lower than the U.S. tax rate and the favorable settlement of tax audits.
(See Notes N and O of Notes to Consolidated Financial Statements.)
Reconciliation of Non-GAAP Financial Measures
The following is a reconciliation of net (loss) income to EBITDA for 2009 and 2008 (in thousands of dollars):
|
|
|
|
|
|
|
|
|
|
|
|
|
2009 |
|
|
2008 |
|
||
|
|
|
|
||||||
|
Net (loss) income |
|
$ |
(6,528 |
) |
|
$ |
26,456 |
|
|
Income tax expense |
|
|
22,162 |
|
|
|
20,857 |
|
|
Income tax expense related to earnings from equity investees |
|
|
129 |
|
|
|
1,750 |
|
|
Net interest expense |
|
|
40,351 |
|
|
|
31,652 |
|
|
Depreciation and amortization expense |
|
|
21,560 |
|
|
|
24,845 |
|
|
|
|
|
||||||
|
EBITDA |
|
$ |
77,674 |
|
|
$ |
105,560 |
|
|
|
|
|
||||||
RESULTS OF OPERATIONS FOR THE YEARS ENDED DECEMBER 31, 2008 AND 2007
This discussion should be read in conjunction with Note E (“Segment Reporting”) of Notes to Consolidated Financial Statements.
Overview
In 2008, net income decreased $186.7 million, or 88%, primarily as a result of lower Net Auction Sales, significant auction guarantee losses and inventory writedowns, all attributable to the downturn in the international art market which resulted from a weakening global economy and the associated turbulence in the global financial and credit markets that began in September 2008. Also contributing to our decreased profitability in 2008 was a lower level of private sale commissions, higher net interest expense and a higher effective tax rate, partially offset by lower salaries and related costs.
32
Results of Operations for the Years Ended December 31, 2008 and 2007
The table below presents a summary of our results of operations for 2008 and 2007, as well as a comparison between the two periods (in thousands of dollars):
|
|
|
|
|
|
|
|
|
|
|
|
|
|
|
|
|
|
|
|
|
|
|
|
|
|
|
|
|
Favorable/(Unfavorable) |
||||||
|
|
|
|
|
|
|
|
|
|
|
|||||||
|
Year Ended December 31 |
|
2008 |
|
|
2007 |
|
|
$ Change |
|
|
% Change |
|||||
|
|
|
|
|
|||||||||||||
|
Revenues: |
|
|
|
|
|
|
|
|
|
|
|
|
|
|
|
|
|
Auction and related revenues |
|
$ |
616,625 |
|
|
$ |
833,128 |
|
|
$ |
(216,503 |
) |
|
|
(26.0% |
) |
|
Finance revenues |
|
|
14,183 |
|
|
|
17,025 |
|
|
|
(2,842 |
) |
|
|
(16.7% |
) |
|
Dealer revenues |
|
|
55,596 |
|
|
|
62,766 |
|
|
|
(7,170 |
) |
|
|
(11.4% |
) |
|
License fee revenues |
|
|
3,438 |
|
|
|
2,960 |
|
|
|
478 |
|
|
|
16.1% |
|
|
Other revenues |
|
|
1,717 |
|
|
|
1,843 |
|
|
|
(126 |
) |
|
|
(6.8% |
) |
|
|
|
|
|
|
||||||||||||
|
Total revenues |
|
|
691,559 |
|
|
|
917,722 |
|
|
|
(226,163 |
) |
|
|
(24.6% |
) |
|
Expenses ** |
|
|
617,141 |
|
|
|
641,940 |
|
|
|
24,799 |
|
|
|
3.9% |
|
|
|
|
|
|
|
||||||||||||
|
Operating income |
|
|
74,418 |
|
|
|
275,782 |
|
|
|
(201,364 |
) |
|
|
(73.0% |
) |
|
Net interest expense |
|
|
(31,652 |
) |
|
|
(14,166 |
) |
|
|
(17,486 |
) |
|
|
* |
|
|
Extinguishment of debt (net) |
|
|
5,364 |
|
|
|
— |
|
|
|
5,364 |
|
|
|
N/A |
|
|
Insurance recovery |
|
|
— |
|
|
|
20,000 |
|
|
|
(20,000 |
) |
|
|
(100.0% |
) |
|
Other (expense) income |
|
|
(2,956 |
) |
|
|
1,403 |
|
|
|
(4,359 |
) |
|
|
* |
|
|
|
|
|
|
|
||||||||||||
|
Income before taxes |
|
|
45,174 |
|
|
|
283,019 |
|
|
|
(237,845 |
) |
|
|
(84.0% |
) |
|
Income tax expense |
|
|
20,857 |
|
|
|
72,512 |
|
|
|
51,655 |
|
|
|
71.2% |
|
|
Equity in earnings of investees, net of taxes |
|
|
2,139 |
|
|
|
2,632 |
|
|
|
(493 |
) |
|
|
(18.7% |
) |
|
|
|
|
|
|
||||||||||||
|
Net income |
|
$ |
26,456 |
|
|
$ |
213,139 |
|
|
$ |
(186,683 |
) |
|
|
(87.6% |
) |
|
|
|
|
|
|
||||||||||||
|
Key performance indicators: |
|
|
|
|
|
|
|
|
|
|
|
|
|
|
|
|
|
Aggregate Auction Sales (a) |
|
$ |
4,905,504 |
|
|
$ |
5,391,628 |
|
|
$ |
(486,124 |
) |
|
|
(9.0% |
) |
|
Net Auction Sales (b) |
|
$ |
4,189,735 |
|
|
$ |
4,625,914 |
|
|
$ |
(436,179 |
) |
|
|
(9.4% |
) |
|
Private Sales (c) |
|
$ |
373,721 |
|
|
$ |
729,988 |
|
|
$ |
(356,267 |
) |
|
|
(48.8% |
) |
|
Consolidated Sales (d) |
|
$ |
5,334,821 |
|
|
$ |
6,184,382 |
|
|
$ |
(849,561 |
) |
|
|
(13.7% |
) |
|
Auction commission margin (e) |
|
|
15.1 |
% |
|
|
16.5 |
% |
|
|
N/A |
|
|
|
(8.5% |
) |
|
Average loan portfolio (f) |
|
$ |
185,545 |
|
|
$ |
171,286 |
|
|
$ |
14,259 |
|
|
|
8.3% |
|
|
EBITDA (g) |
|
$ |
105,560 |
|
|
$ |
323,606 |
|
|
$ |
(218,046 |
) |
|
|
(67.4% |
) |
Legend:
|
|
|
|
|
* |
|
Represents a change in excess of 100%. |
|
|
|
|
|
** |
|
Expenses for 2008 include a benefit of $18.4 million recognized as a result of the reversal of the remaining liability related to the vendor’s commission discount certificates issued by Sotheby’s in 2003 in conjunction with the settlement of antitrust related civil litigation, an impairment loss of $13.2 million and $4.3 million in restructuring charges. Expenses for 2007 include an impairment loss of $15 million and a $4.8 million gain on the sale of land and buildings. See below for a more detailed discussion of each of these amounts. |
|
|
|
|
|
(a) |
|
Represents the hammer (sale) price of property sold at auction plus buyer’s premium. |
|
|
|
|
|
(b) |
|
Represents the hammer (sale) price of property sold at auction. |
|
|
|
|
|
(c) |
|
Represents the total purchase price of property sold in private sales brokered by Sotheby’s. |
|
|
|
|
|
(d) |
|
Represents the sum of Aggregate Auction Sales, Private Sales and Dealer revenues. |
|
|
|
|
|
(e) |
|
Represents total auction commission revenues as a percentage of Net Auction Sales. |
|
|
|
|
|
(f) |
|
Represents the average loan portfolio of Sotheby’s Finance segment. |
|
|
|
|
|
(g) |
|
See “Use of Non-GAAP Financial Measures” above and “Reconciliation of Non-GAAP Financial Measures” below. |
33
Impact of Changes in Foreign Currency Exchange Rates
In 2008, changes in foreign currency exchange rates had a net unfavorable impact of approximately $6.5 million on our results, as summarized in the following table (in thousands of dollars):
|
|
|
|
|
|
|
Year Ended December 31, 2008 |
|
Favorable/
|
||
|
|
||||
|
Total revenues |
|
$ |
(12,599 |
) |
|
Total expenses |
|
|
6,367 |
|
|
|
|
|||
|
Operating income |
|
|
(6,232 |
) |
|
Net interest expense and other |
|
|
(287 |
) |
|
|
|
|||
|
Impact of changes in foreign currency exchange rates |
|
$ |
(6,519 |
) |
|
|
|
|||
Revenues
In 2008 and 2007, revenues consisted of the following (in thousands of dollars):
|
|
|
|
|
|
|
|
|
|
|
|
|
|
|
|
|
|
|
|
|
|
|
|
|
|
|
Favorable/(Unfavorable) |
||||||||
|
|
|
|
|
|
|
|
|
|||||||||
|
Year Ended December 31 |
|
2008 |
|
|
2007 |
|
|
$ Change |
|
|
% Change |
|||||
|
|
|
|
|
|||||||||||||
|
Auction and related revenues: |
|
|
|
|
|
|
|
|
|
|
|
|
|
|
|
|
|
Auction commission revenues |
|
$ |
632,772 |
|
|
$ |
761,181 |
|
|
$ |
(128,409 |
) |
|
|
(16.9% |
) |
|
Auction expense recoveries |
|
|
15,245 |
|
|
|
18,269 |
|
|
|
(3,024 |
) |
|
|
(16.6% |
) |
|
Private sale commissions |
|
|
33,799 |
|
|
|
54,821 |
|
|
|
(21,022 |
) |
|
|
(38.3% |
) |
|
Principal activities |
|
|
(82,743 |
) |
|
|
(22,409 |
) |
|
|
(60,334 |
) |
|
|
* |
|
|
Catalogue subscription revenues |
|
|
6,955 |
|
|
|
8,452 |
|
|
|
(1,497 |
) |
|
|
(17.7% |
) |
|
Other |
|
|
10,597 |
|
|
|
12,814 |
|
|
|
(2,217 |
) |
|
|
(17.3% |
) |
|
|
|
|
|
|
||||||||||||
|
Total auction and related revenues |
|
|
616,625 |
|
|
|
833,128 |
|
|
|
(216,503 |
) |
|
|
(26.0% |
) |
|
|
|
|
|
|
||||||||||||
|
Other revenues: |
|
|
|
|
|
|
|
|
|
|
|
|
|
|
|
|
|
Finance revenues |
|
|
14,183 |
|
|
|
17,025 |
|
|
|
(2,842 |
) |
|
|
(16.7% |
) |
|
Dealer revenues |
|
|
55,596 |
|
|
|
62,766 |
|
|
|
(7,170 |
) |
|
|
(11.4% |
) |
|
License fee revenues |
|
|
3,438 |
|
|
|
2,960 |
|
|
|
478 |
|
|
|
16.1% |
|
|
Other |
|
|
1,717 |
|
|
|
1,843 |
|
|
|
(126 |
) |
|
|
(6.8% |
) |
|
|
|
|
|
|
||||||||||||
|
Total other revenues |
|
|
74,934 |
|
|
|
84,594 |
|
|
|
(9,660 |
) |
|
|
(11.4% |
) |
|
|
|
|
|
|
||||||||||||
|
Total revenues |
|
$ |
691,559 |
|
|
$ |
917,722 |
|
|
$ |
(226,163 |
) |
|
|
(24.6% |
) |
|
|
|
|
|
|
||||||||||||
Legend:
|
|
|
|
|
|
* |
Represents a change in excess of 100%. |
Auction and Related Revenues
In 2008, auction and related revenues decreased $216.5 million, or 26%, principally due to lower auction commission revenues, a higher level of principal activity losses and lower private sale commissions. Also impacting the comparison of auction and related revenues to 2007 were changes in foreign currency exchange rates, which contributed approximately $14.9 million to the decrease. See the discussion below for a more detailed explanation of the significant factors contributing to the decrease in auction and related revenues in 2008.
Auction Commission Revenues—In 2008, auction commission revenues decreased $128.4 million, or 17%, principally due to a $436.2 million, or 9%, decrease in Net Auction Sales and a lower auction commission margin. Also impacting the comparison of auction commission revenues to 2007 were changes in foreign currency exchange rates, which contributed approximately $14.8 million to the decrease.
See “Net Auction Sales” and “Auction Commission Margin” below for a more detailed discussion of these key performance indicators.
34
Net Auction Sales—In 2008, Net Auction Sales decreased $436.2 million, or 9%, largely due to the downturn in the international art market discussed above. In addition, Net Auction Sales were impacted by changes in foreign currency exchange rates, which contributed $76.2 million to the decrease. More specifically, the decline in Net Auction Sales in 2008 was due to the following factors:
|
|
|
|
|
|
• |
A $52 million, or 2%, decrease in recurring Impressionist and Contemporary Art sales, mostly attributable to the performance of the November 2008 sales in New York, which decreased $303.7 million, or 46%, when compared to the sales conducted in November 2007. |
|
|
|
|
|
|
• |
An $84 million decrease in sales of Antiquities in New York as 2007 results for this collecting category included the record sales of a bronze figure of Artemis and the Stag for $25.5 million and The Guennol Lioness for $51 million. There were no comparably priced Antiquities works sold in 2008. |
|
|
|
|
|
|
• |
A $69 million, or 54%, decrease in Asian Art sales in New York, primarily attributable to a lower volume of property offered and sold in 2008, as well as lower average selling prices in 2008. The lower volume of property offered and sold in 2008 was due, in part, to $22.1 million of Net Auction Sales in the first quarter of 2007 attributable to property consigned by the Albright-Knox Art Gallery, for which there was no comparable consignment in the current period. |
|
|
|
|
|
|
• |
A $61 million, or 24%, decrease in Jewelry sales. 2007 results include the sale in Switzerland of the “Chloe Diamond” for $14.4 million, which is the second highest price ever for a diamond sold at auction. There was no comparably priced Jewelry consignment sold in 2008. |
|
|
|
|
|
|
• |
The cessation of auction sales conducted at our former Olympia salesroom in West London, which had traditionally processed property at a substantially lower price point than our other auction salesrooms. In 2007, approximately $66 million of Net Auction Sales were conducted at Olympia. In line with our strategic focus on major clients and the related shift in our business portfolio toward high-end consignments, no auctions were held at Olympia after the third quarter of 2007. |
|
|
|
|
|
|
• |
A $51 million, or 19%, decrease in sales of Old Master Paintings and Drawings. In 2007, the results from this collecting category included the sale of Rembrandt’s St. James the Greater for $23 million. There was no comparably priced work sold in this collecting category in 2008. |
|
|
|
|
|
|
• |
Significant decreases across most other regional collecting categories, most notably in sales of Decorative Arts and Furniture ($72 million, or 24%, decrease), British Paintings and Pictures ($40 million, or 28%, decrease) and Books and Manuscripts ($39 million, or 42%, decrease). These decreases were primarily the result of single-owner sales in 2007 that were not repeated in 2008. |
|
|
|
|
|
|
The overall decrease in Net Auction Sales in 2008 was partially offset by the following factors: |
|
|
|
|
|
|
|
• |
$176 million of Net Auction Sales attributable to the unprecedented Beautiful Inside My Head Forever sale held in London in September 2008, which featured the sale of new Contemporary Art works by Damien Hirst. This sale was the first ever auction dedicated to the work of a single living artist. |
|
|
|
|
|
|
• |
$38.6 million of Net Auction Sales attributable to the (RED) charity auction held in New York in February 2008, the proceeds of which (including our auction commission revenues) were donated to the United Nations Foundation to support HIV/AIDS relief programs in Africa conducted by the Global Fund to Fight AIDS, Tuberculosis and Malaria. There was no equivalent charitable auction conducted in 2007. |
Auction Commission Margin—Effective September 1, 2007, we increased our buyer’s premium charged on certain auction sales. In salesrooms in the U.S., the buyer’s premium became 25% of the hammer price on the first $20,000, 20% of the hammer price above $20,000 up to and including $500,000 and 12% of any remaining amount over $500,000. In foreign salesrooms, with certain exceptions, these U.S. dollar thresholds were translated into an appropriate fixed local currency amount. This pricing structure was effective through May 31, 2008. For auction sales conducted during the first eight months of 2007, the buyer’s premium charged was generally 20% on the first $500,000 of the hammer (sale) price and 12% on any remaining amount over $500,000.
Partly as a result of the factors discussed below that reduced auction commission margins in 2008, we implemented a buyer’s premium rate increase that became effective on June 1, 2008. Generally, this pricing structure is 25% on the first $50,000 of hammer (sale) price; 20% on the portion of hammer price above $50,000 up to and including $1 million; and 12% on any remaining amount above $1 million.
35
As detailed in the chart above under “Key Performance Indicators,” in 2008, we experienced a decrease of approximately 9% (from 16.5% to 15.1%) in auction commission margin when compared to 2007. The decrease in auction commission margin was principally due to the following factors:
|
|
|
|
|
|
• |
Competitive pressures and market conditions, which in certain cases caused us to accept lower auction commission margins in order to win consignments. |
|
|
|
|
|
|
• |
An increase in risk reduction arrangements and strategies in an effort to reduce our exposure to auction guarantees in response to the challenging economic environment. When we employ such risk reduction arrangements and strategies, we share our auction commissions with consignors or with our partners in auction guarantees. |
|
|
|
|
|
|
• |
A change in sales mix, as a more significant portion of Net Auction Sales in 2008 was at the high-end of our business where auction commission margins are traditionally lower. |
These unfavorable factors were partially offset by the impact of the increased buyer’s premium rate structures, as described above, that became effective in September 2007 and June 2008.
Principal Activities—As the market for high-end collecting categories grew considerably from 2005 through September 2008, competition between Sotheby’s and its principal competitor, Christie’s, greatly increased. As a result of this competitive landscape, our use of auction guarantees as a means of securing consignments increased significantly during this period and peaked in 2007. Accordingly, in 2008, 2007, 2006 and 2005, the total amount of auction guarantees issued by Sotheby’s, net of the impact of risk sharing arrangements with partners, was approximately $626 million, $902 million, $450 million and $131 million, respectively.
In 2008, principal activity losses increased $60.3 million to $82.7 million, when compared to 2007. The higher level of principal activity losses in 2008 was largely attributable to the downturn in the international art market.
Included in the $82.7 million of principal activity losses in 2008 were $60.2 million of net losses related to property offered or sold under auction guarantees, of which $52.6 million relates to our autumn sales of Contemporary, Impressionist, and Asian Art in New York, London and Hong Kong. Also included in the $82.7 million of principal activity losses in 2008 were $17.4 million of subsequent writedowns to the carrying value of guaranteed property that initially failed to sell at auction. A considerable portion of these writedowns relate to works that were obtained at the recent peak of the international art market in 2007 and the first half of 2008.
When evaluating the performance of our portfolio of auction guarantees, we take into consideration the overall revenues earned on guarantees, which includes auction commission revenues, as well as any net guarantee gains or losses reflected in principal activities. Accordingly, the impact of the $60.2 million of net auction guarantee losses recognized in 2008 was partially offset by $43.8 million in auction commission revenues earned from property sold under auction guarantees during the period. Therefore, in 2008, our overall loss related to property offered or sold under auction guarantees was approximately $16.4 million, including the impact of auction commission revenues. By comparison, in 2007, we recognized net revenues related to property offered or sold under auction guarantees of approximately $57.8 million, consisting of $76.9 million in auction commission revenues partially offset by $19.9 million of net auction guarantee losses. (Auction commission revenues are reported in the table above within “Auction Commission Revenues” and are not a component of “Principal Activities.”)
Private Sale Commissions—In 2008, private sale commissions decreased $21 million, or 38%, primarily due to a lower volume of high-end private sales in 2008. In particular, private sale commissions in 2007 included the landmark private sale of the Rostropovich-Vishnevskaya Collection of Russian Art in September 2007, for which there was no comparable individual private sale in 2008.
Finance Revenues
In 2008, Finance revenues decreased $2.8 million, or 17%, when compared to 2007. This decrease was principally due to lower interest rates earned on the portfolio as a result of lower benchmark interest rates, partially offset by a higher average portfolio balance. (Note: For the purposes of Management’s Discussion and Analysis, Finance revenues are presented on a consolidated basis and do not include intercompany revenues earned by the Finance segment from our Auction segment, which are eliminated in consolidation. See Note F of Notes to Consolidated Financial Statements.)
36
Dealer Revenues and Cost of Sales
The table below summarizes Dealer revenues, cost of sales and gross (loss) profit for the Dealer segment in 2008 and 2007 (in thousands of dollars:)
|
|
|
|
|
|
|
|
|
|
|
|
|
|
|
|
|
|
|
|
|
|
|
|
|
|
|
Favorable/(Unfavorable) |
||||||||
|
|
|
|
|
|
|
|
|
|||||||||
|
Year Ended December 31 |
|
2008 |
|
|
2007 |
|
|
$ Change |
|
|
% Change |
|||||
|
|
|
|
|
|||||||||||||
|
Dealer revenues |
|
$ |
55,596 |
|
|
$ |
62,766 |
|
|
$ |
(7,170 |
) |
|
|
(11.4% |
) |
|
Dealer cost of sales |
|
|
(61,978 |
) |
|
|
(49,161 |
) |
|
|
(12,817 |
) |
|
|
(26.1% |
) |
|
|
|
|
|
|
||||||||||||
|
Dealer gross (loss) profit |
|
$ |
(6,382 |
) |
|
$ |
13,605 |
|
|
$ |
(19,987 |
) |
|
|
* |
|
|
|
|
|
|
|
||||||||||||
Legend:
|
|
|
|
|
|
* |
Represents a change in excess of 100%. |
In 2008, Dealer segment performance declined significantly primarily due to $12.2 million of Dealer inventory writedowns recorded in 2008 and lower levels of profitability on sales of investment property.
Expenses
In 2008 and 2007, expenses consisted of the following (in thousands of dollars):
|
|
|
|
|
|
|
|
|
|
|
|
|
|
|
|
|
|
|
|
|
|
|
|
|
|
|
Favorable/(Unfavorable) |
||||||||
|
|
|
|
|
|
|
|
|
|||||||||
|
Year Ended December 31 |
|
2008 |
|
|
2007 |
|
|
$ Change |
|
|
% Change |
|||||
|
|
|
|
|
|||||||||||||
|
Direct costs of services |
|
$ |
95,410 |
|
|
$ |
80,400 |
|
|
$ |
(15,010 |
) |
|
|
(18.7% |
) |
|
Dealer cost of sales |
|
|
61,978 |
|
|
|
49,161 |
|
|
|
(12,817 |
) |
|
|
(26.1% |
) |
|
Marketing expenses |
|
|
19,662 |
|
|
|
19,792 |
|
|
|
130 |
|
|
|
0.7% |
|
|
Salaries and related costs |
|
|
240,126 |
|
|
|
293,720 |
|
|
|
53,594 |
|
|
|
18.2% |
|
|
General and administrative expenses |
|
|
176,004 |
|
|
|
166,539 |
|
|
|
(9,465 |
) |
|
|
(5.7% |
) |
|
Depreciation and amortization expense |
|
|
24,845 |
|
|
|
22,101 |
|
|
|
(2,744 |
) |
|
|
(12.4% |
) |
|
Impairment loss |
|
|
13,189 |
|
|
|
14,979 |
|
|
|
1,790 |
|
|
|
12.0% |
|
|
Restructuring charges (net) |
|
|
4,312 |
|
|
|
— |
|
|
|
(4,312 |
) |
|
|
N/A |
|
|
Antitrust related matters |
|
|
(18,385 |
) |
|
|
— |
|
|
|
18,385 |
|
|
|
N/A |
|
|
Gain on sale of land and buildings |
|
|
— |
|
|
|
(4,752 |
) |
|
|
(4,752 |
) |
|
|
(100.0% |
) |
|
|
|
|
|
|
||||||||||||
|
Total expenses |
|
$ |
617,141 |
|
|
$ |
641,940 |
|
|
$ |
24,799 |
|
|
|
3.9% |
|
|
|
|
|
|
|
||||||||||||
Legend:
|
|
|
|
|
|
* |
Represents a change in excess of 100%. |
Direct Costs of Services
In 2008, direct costs of services increased $15 million, or 19%, when compared to 2007. This increase was consistent with the composition of our auction offerings during 2008 and, in particular, was primarily attributable to the following factors:
|
|
|
|
|
|
• |
Costs related to the promotion of the Beautiful Inside My Head Forever sale ($3.7 million) and the (RED) charity auction ($1 million). There were no comparable sale events in 2007. |
|
|
|
|
|
|
• |
Increased sale venue rental costs in Hong Kong. |
|
|
|
|
|
|
• |
Higher catalogue and sale promotion costs related to recurring Impressionist and Contemporary Art Sales in New York and London. |
|
|
|
|
|
|
• |
Increased traveling exhibition costs reflecting our efforts to promote our sales globally, including in emerging markets. |
|
|
|
|
|
|
• |
Unfavorable experience with property loss and damage claims. |
The comparison of direct costs of services to the prior period was favorably impacted by the cessation of auction sales conducted at our former Olympia salesroom, as discussed above. Additionally, 2007 results include costs to promote and execute the landmark private sale of the Rostropovich-Vishnevskaya Collection of Russian Art, for which there was no comparable private sale or related costs in 2008. The overall increase in direct costs of services was also partially offset by changes in foreign currency exchange rates, which reduced direct costs of services by approximately $2.4 million when compared to 2007.
Marketing Expenses
In 2008, marketing expenses were unchanged when compared to 2007 as higher costs to promote the Sotheby’s brand
37
globally, especially in emerging markets such as the Middle East, India, Russia and Turkey, were offset by the costs of several strategic client service initiatives that were implemented in 2007.
Salaries and Related Costs
In 2008 and 2007, salaries and related costs consisted of the following (in thousands of dollars):
|
|
|
|
|
|
|
|
|
|
|
|
|
|
|
|
|
|
|
|
|
|
|
|
|
|
|
|
Favorable/(Unfavorable) |
|
||||||||||||
|
|
|
|
|
|
|
|
|||||||||||||
|
Year Ended December 31 |
|
2008 |
|
2007 |
|
$ Change |
|
% Change |
|
||||||||||
|
|
|
|
|
|
|||||||||||||||
|
Full-time salaries |
|
|
$ |
139,653 |
|
|
|
$ |
126,737 |
|
|
|
$ |
(12,916 |
) |
|
(10.2 |
%) |
|
|
Share-based payments |
|
|
|
30,180 |
|
|
|
|
26,995 |
|
|
|
|
(3,185 |
) |
|
(11.8 |
%) |
|
|
Incentive bonus costs |
|
|
|
27,464 |
|
|
|
|
65,844 |
|
|
|
|
38,380 |
|
|
58.3 |
% |
|
|
Payroll taxes |
|
|
|
19,486 |
|
|
|
|
21,160 |
|
|
|
|
1,674 |
|
|
7.9 |
% |
|
|
Employee benefits |
|
|
|
8,857 |
|
|
|
|
36,241 |
|
|
|
|
27,384 |
|
|
75.6 |
% |
|
|
Option Exchange * |
|
|
|
216 |
|
|
|
|
1,168 |
|
|
|
|
952 |
|
|
81.5 |
% |
|
|
Other ** |
|
|
|
14,270 |
|
|
|
|
15,575 |
|
|
|
|
1,305 |
|
|
8.4 |
% |
|
|
|
|
|
|
|
|
||||||||||||||
|
Total salaries and related costs |
|
|
$ |
240,126 |
|
|
|
$ |
293,720 |
|
|
|
$ |
53,594 |
|
|
18.2 |
% |
|
|
|
|
|
|
|
|
||||||||||||||
|
Key Performance Indicator: |
|
|
|
|
|
|
|
|
|
|
|
|
|
|
|
|
|
|
|
|
Salaries and related costs as a % of total revenues |
|
|
|
34.7 |
% |
|
|
|
32.0 |
% |
|
|
|
N/A |
|
|
(8.4 |
%) |
|
Legend:
|
|
|
|
|
|
|
* |
|
Includes the amortization of costs related to an exchange offer in 2004 of cash or restricted stock for certain stock options held by eligible employees under the Stock Option Plan. |
|
|
|
|
|
|
|
** |
|
Principally includes the cost of temporary labor and overtime. |
As discussed above in Management’s Discussion and Analysis of Results of Operations for the years ended December 31, 2009 and 2008, our compensation strategy provides for variability in pay, commensurate with our financial performance. Accordingly, salaries and related costs for 2008 reflected a $53.6 million, or 18%, decrease versus 2007 largely due to a $38.4 million, or 58%, decrease in accrued incentive compensation costs as a result of our significantly lower profitability in 2008. Also contributing to the decrease in salaries and related costs were substantially lower employee benefit costs. The overall decrease in salaries and related costs was partially offset by higher costs for full-time salaries and share-based payments.
See discussion below for a more detailed explanation of the significant factors contributing to the overall decrease in salaries and related costs versus 2007.
Incentive Bonus Costs—In 2008, accrued incentive bonus costs decreased $38.4 million, or 58%, when compared to 2007, due to our significantly lower profitability in 2008.
Employee Benefits—In February 2008, we agreed with the trustees of the U.K. Pension Plan (the “Trustees”) to cease advance funding of future discretionary benefit increases to retirees. On an annual basis, Sotheby’s, in consultation with the Trustees, now determines an appropriate level of funding of discretionary benefit increases to retirees for a particular year based on specific objective criteria related to the financial status of Sotheby’s and the pension plan. As a result of this agreement, an updated actuarial valuation was prepared as of February 29, 2008 reflecting a new assumption for the funding of discretionary benefit increases to retirees. In addition to this change, a number of the other actuarial assumptions were updated in the February 29, 2008 actuarial valuation to reflect then current market conditions.
In 2008, employee benefit costs decreased $27.4 million, or 76%, when compared to 2007. This decrease was primarily attributable to the following factors:
|
|
|
|
|
|
• |
A $15.7 million reduction in costs related to our U.K. Pension Plan, resulting in a net pension credit of $4 million in 2008. This reduction was primarily due to the cessation of advance funding of future discretionary benefit increases to retirees, as discussed above, and the higher discount rate assumptions used to calculate pension costs in the January 1, 2008 and February 29, 2008 actuarial valuations, when compared to 2007. |
|
|
|
|
|
|
• |
A decrease of $8 million in costs associated with the DCP resulting from a $6 million loss in deemed participant investments during 2008. This reduction in employee benefit expense was substantially offset by a loss of $5.1 million in trust assets related to the DCP Liability, which is reflected within other (expense) income, as discussed below. |
|
|
|
|
|
|
• |
A $2.8 million decrease in profit sharing costs related to our U.S. defined contribution plan. As a result of our lower profitability, there was no profit sharing accrual in 2008. |
|
|
|
|
|
Full-Time Salaries—In 2008, full-time salaries increased $12.9 million, or 10%, when compared to 2007 principally due to strategic headcount additions, as well as limited salary increases to existing employees. |
||
38
Share-Based Payments—In 2008, share-based payments (excluding costs related to the Option Exchange) increased $3.2 million, or 12%, when compared to 2007. This increase was attributable to the following factors:
|
|
|
|
|
|
• |
Incremental costs related to a higher value of Executive Bonus Plan (“EBP”) restricted stock awarded in February 2008, when compared to 2007. The value of these awards was based on our financial performance in 2007. |
|
|
|
|
|
|
• |
Incremental costs related to restricted stock grants in February 2008 to a broader base of employees than in prior years as part of a new incentive compensation structure that was implemented in 2008 to align with our client-focused strategic initiatives. Under this new structure, such restricted stock grants, although at the sole discretion of the Compensation Committee, are awarded in relation to prior year profitability and are subject to future service requirements. |
|
|
|
|
|
|
• |
The incremental impact of costs related to restricted stock awarded in 2007. |
The overall increase in share-based payments versus 2007 was partially offset by a credit of $2.2 million recorded in the fourth quarter of 2008 related to the revaluation of restricted stock awarded to certain senior executives in July 2006 that would only vest if certain net income or share price targets were achieved. It was not expected that the net income targets would be achieved by the respective vesting dates.
General and Administrative Expenses
In 2008, general and administrative expenses increased $9.5 million, or 6%, when compared to 2007. The comparison of general and administrative expenses to 2007 was influenced by the following factors:
|
|
|
|
|
|
• |
A $6.6 million increase in premises rental and other facilities-related costs, primarily as a result of U.K. premises initiatives. |
|
|
|
|
|
|
• |
A $3.9 million, or 7%, increase in professional fees, partially due to a $1.8 million increase in costs associated with our outsourced tax compliance function, as well as higher legal, consulting and audit fees. The overall increase in professional fees versus 2007 was partially offset by $3.7 million in one-time costs recorded in 2007 associated with our assessment of our rights and options with respect to the York Property (see “York Property” below). |
|
|
|
|
|
|
• |
A $3.9 million increase in bad debt expense. |
|
|
|
|
|
|
• |
An increase of $1.2 million in travel and entertainment costs principally due to a higher level of travel in pursuit of business opportunities and, also as a result of, the increasing globalization of our client base. |
The overall increase in general and administrative expenses was partially offset by a $1.3 million benefit to general and administrative expenses recognized in the third quarter of 2008 as a result of a real estate tax rebate in the U.K., for which there was no comparable event in 2007. Also impacting the comparison to 2007 were changes in foreign currency exchange rates, which reduced general and administrative expenses by approximately $4.7 million.
Depreciation and Amortization Expense
In 2008, depreciation and amortization expense increased $2.7 million, or 12%, when compared to 2007. This increase was primarily attributable to a higher rate of capital expenditures over the last two years, due in part to the refurbishment of our premises in the U.K., as well as additional investments in information technology designed to improve client service. Additionally, results for 2008 included amortization expense of approximately $0.7 million related to intangible assets recognized in connection with the acquisition of an auction house in France, for which there was no comparable expense in 2007 (see Notes K and I of Notes to Consolidated Financial Statements).
Impairment Loss and Insurance Recovery
Robert C. Noortman, who was the Managing Director of Noortman Master Paintings, died unexpectedly on January 14, 2007. As a result of Mr. Noortman’s death, in the first quarter of 2007, we recorded an impairment loss of approximately $15 million in the Dealer segment related to NMP’s goodwill ($7.3 million), customer relationships ($6 million) and trade name ($0.8 million), as well as Mr. Noortman’s non-compete agreement ($0.9 million).
Also as a result of Mr. Noortman’s death, Sotheby’s became entitled to a $20 million death benefit under a key man life insurance policy that it had purchased in conjunction with the acquisition of NMP. Accordingly, in the first quarter of 2007, we recognized a $20 million insurance recovery within other income.
39
We
performed our annual impairment tests of NMP’s goodwill and trade name as of
October 31, 2008. The fair value of NMP’s goodwill and trade name was estimated
using a discounted cash flow methodology based on management’s judgments about
NMP’s expected future cash flows. Based on the results of these annual
impairment tests, we recognized a further impairment loss of $13.2 million in
the fourth quarter of 2008 related to NMP’s goodwill ($11.1 million) and trade
name ($2.1 million). This impairment loss was principally due to a reduction in
management’s future cash flow estimates for NMP.
(See Notes J and K of Notes to
Consolidated Financial Statements.)
Restructuring Plan and Related Charges
Due to a downturn in the international art market, in the fourth quarter of 2008, management began a strategic review of our operations with the goal of materially recalibrating Sotheby’s cost base through a restructuring plan impacting our operations globally (defined above as the “2008 Restructuring Plan”). On December 1, 2008, the Executive Committee of Sotheby’s Board of Directors approved the first phase of the 2008 Restructuring Plan resulting in headcount reductions impacting our Auction segment in North America, as well as certain corporate departments. This decision resulted in $4.3 million in restructuring charges related to employee termination benefits recorded in the fourth quarter of 2008.
Antitrust Related Matters
In conjunction with the settlement of certain civil litigation related to the investigation by the DOJ, in May 2003, Sotheby’s and Christie’s issued Discount Certificates to the class of plaintiffs with a face value of $125 million, of which Sotheby’s was responsible for funding the redemption of $62.5 million. The court determined that the $62.5 million face value had a fair market value of not less than $50 million, which was the amount of expense recognized as a Special Charge in the third quarter of 2000. The Discount Certificates were fully redeemable in connection with any auction conducted by Sotheby’s or Christie’s in the U.S. or in the U.K. and could have been used to satisfy consignment charges involving vendor’s commission, risk of loss and/or catalogue illustration. The Discount Certificates expired on May 14, 2008 and, therefore, could no longer be redeemed. As a result of the expiration of the Discount Certificates, we reversed the remaining related liability and recognized a benefit of $18.4 million in the second quarter of 2008.
Gain on Sale of Land and Buildings
In March 2007, we completed the sale of our land and buildings at Billingshurst, West Sussex, which previously housed a U.K. auction salesroom. As a result of this sale, we recognized a gain of $4.8 million in the first quarter of 2007, for which there was no comparable transaction or gain in 2008.
Net Interest Expense
For the year ended December 31, 2008, net interest expense increased $17.5 million, when compared to 2007 primarily due to the incremental interest expense related to the Convertible Notes and Senior Notes issued on June 17, 2008, as well as lower interest income which was a direct result of lower average balances of cash and short-term investments and lower interest rates earned on these balances throughout 2008. The lower average balances of cash and short-term investments were the result of the funding requirements for the advance and settlement of auction guarantees, the timing of the settlement of certain client receivables and the $50 million initial payment made in January 2008 as part of the contract to purchase the York Property.
40
Extinguishment of Debt (Net)
In 2008, we recognized a $5.4 million net benefit on the extinguishment of debt related to the events described below.
Redemption of 6.98% Senior Notes—On July 18, 2008, we redeemed our 6.98% Senior Notes with a face value of $100 million for $105.7 million. The $105.7 million paid upon redemption includes $102.5 million for the present value of the remaining principal and interest and $3.2 million for accrued and unpaid interest through the date of redemption. As a result, we recognized a bond redemption cost of $2.5 million in the third quarter of 2008.
Repurchase of 7.75% Senior Notes—On December 23, 2008, we repurchased an aggregate principal amount of $19 million of our outstanding 7.75% Senior Notes for a purchase price of $10.5 million (representing 56% of the aggregate principal amount repurchased). This repurchase resulted in a non-cash benefit of $7.8 million, net of fees, which was recognized in the fourth quarter of 2008.
Other (Expense) Income
In 2008, our results included other expense of $3 million, as compared to other income of $1.4 million in 2007. The comparison to 2007 was unfavorably impacted by net losses in 2008 of $5.1 million in the fair value of trust assets related to the DCP (see Note R of Notes to Consolidated Financial Statements for more information on the DCP). In 2007, other income included gains of $1.9 million from the changes in the fair value of these assets.
Income Tax Expense
The effective tax rate was approximately 46.2% in 2008, compared to approximately 25.6% in 2007. The increase in the effective tax rate was primarily the result of increased income tax reserves related to various U.S. and international tax issues, the non-deductible goodwill impairment loss related to NMP and a non-recurring benefit recognized in 2007. These factors were offset by a shift in the mix of income earned at tax rates lower than the U.S. tax rate. The non-recurring benefit recognized in 2007 was related to the reversal of the valuation allowance established against state operating losses and other deferred tax assets in prior years.
(See Notes N and O of Notes to Consolidated Financial Statements.)
Reconciliation of Non-GAAP Financial Measures
The following is a reconciliation of net income to EBITDA for 2008 and 2007 (in thousands of dollars):
|
|
|
|
|
|
|
|
|
||||
|
Year Ended December 31 |
|
2008 |
|
2007 |
|
||||||
|
|
|
|
|||||||||
|
Net income |
|
|
$ |
26,456 |
|
|
|
$ |
213,139 |
|
|
|
Income tax expense |
|
|
|
20,857 |
|
|
|
|
72,512 |
|
|
|
Income tax expense related to earnings from equity investees |
|
|
|
1,750 |
|
|
|
|
1,688 |
|
|
|
Net interest expense |
|
|
|
31,652 |
|
|
|
|
14,166 |
|
|
|
Depreciation and amortization expense |
|
|
|
24,845 |
|
|
|
|
22,101 |
|
|
|
|
|
|
|
|
|
||||||
|
EBITDA |
|
|
$ |
105,560 |
|
|
|
$ |
323,606 |
|
|
|
|
|
|
|
|
|
||||||
YORK PROPERTY
The York Property is home to our sole North American auction salesroom and our principal North American exhibition space. On February 7, 2003, we sold the York Property to an affiliate of RFR Holding Corp. (“RFR”). In conjunction with this sale, we leased the York Property back from RFR for an initial 20-year term, with options for us to extend the lease for two additional 10-year terms. The resulting lease was accounted for as a capital lease, with the related asset being amortized over the initial 20-year lease term.
On January 11, 2008, we entered into a contract to reacquire the York Property from RFR for a purchase price of $370 million (the “Purchase and Sale Agreement”). We also agreed to give the principals of RFR favorable consignment terms for the future sale of art at Sotheby’s auctions. We estimated the value of these terms to be approximately $3.8 million.
We financed the $370 million purchase price through an initial $50 million cash payment made in conjunction with the signing of the Purchase and Sale Agreement on January 11, 2008, an $85 million cash payment made when the purchase was consummated on February 6, 2009 and the assumption of an existing $235 million mortgage on the York Property (the “York Property Mortgage”).
41
The York Property Mortgage matures on July 1, 2035, but has an optional pre-payment date of July 1, 2015 and bears an annual rate of interest of approximately 5.6%, which increases subsequent to July 1, 2015. It is our current intention to pre-pay the mortgage on or about July 1, 2015. In conjunction with the final accounting for the York Property purchase in February 2009, the York Property Mortgage was recorded in the Consolidated Balance Sheet at its $212.1 million fair value. The fair value of the York Property Mortgage was computed using a discounted cash flow approach based on a market rate of interest, which was estimated by management. The resulting $22.9 million debt discount is being amortized to interest expense over the remaining expected term of the loan. We paid fees of $2.4 million in conjunction with the assumption of the York Property Mortgage, which are also being amortized to interest expense over the remaining expected term of the loan. The December 31, 2009 carrying value of the York Property Mortgage was $215.4 million and its fair value was approximately $227.5 million. (See Notes I and M of Notes to Consolidated Financial Statements.)
As a result of the consummation of the York Property purchase on February 6, 2009, the existing capital lease obligation of $167 million, which had an effective interest rate of 10.4%, and the related $122 million net capital lease asset, as well as a $16 million deferred gain related to the sale of the York Property in 2003 were derecognized and the net effect was deducted from the initial carrying value of the York Property. Accordingly, the land and building acquired in conjunction with the purchase of the York Property was recorded at an initial carrying value of approximately $292.3 million, computed as follows (in thousands of dollars):
|
|
|
|
|
|
|
Fair value of York Property Mortgage |
|
$ |
212,130 |
|
|
Cash payments (including direct transaction costs) |
|
|
137,480 |
|
|
Fair value of consignment terms |
|
|
3,750 |
|
|
Derecognition of net capital lease obligation |
|
|
(45,171 |
) |
|
Derecognition of deferred gain |
|
|
(15,894 |
) |
|
|
|
|||
|
Initial carrying value of York Property |
|
$ |
292,295 |
|
|
|
|
The York Property and the York Property Mortgage are held by 1334 York, LLC, a separate legal entity of Sotheby’s that maintains its own books and records and whose results are ultimately consolidated into Sotheby’s financial statements. The assets of 1334 York, LLC are not available to satisfy the obligations of other Sotheby’s affiliates or any other entity.
42
CONTRACTUAL OBLIGATIONS AND COMMITMENTS
The following table summarizes our material contractual obligations and commitments as of December 31, 2009:
|
|
|
|
|
|
|
|
|
|
|
|
|
|
|
|
|
|
|
|
|
|
|
|
|
Payments Due by Period |
||||||||||||||||||
|
|
|
|||||||||||||||||||
|
|
|
Total |
|
Less Than |
|
1 to 3 Years |
|
3 to 5 |
|
After 5 |
||||||||||
|
|
|
|
|
|
|
|||||||||||||||
|
|
|
(Thousands of dollars) |
||||||||||||||||||
|
York Property Mortgage (1): |
|
|
|
|
|
|
|
|
|
|
|
|
|
|
|
|
|
|
|
|
|
Principal |
|
$ |
235,000 |
|
|
$ |
1,203 |
|
|
$ |
6,305 |
|
|
$ |
7,068 |
|
|
$ |
220,424 |
|
|
Interest |
|
|
70,787 |
|
|
|
13,051 |
|
|
|
25,702 |
|
|
|
24,940 |
|
|
|
7,094 |
|
|
|
|
|
|
|
|
|||||||||||||||
|
Sub-total |
|
|
305,787 |
|
|
|
14,254 |
|
|
|
32,007 |
|
|
|
32,008 |
|
|
|
227,518 |
|
|
|
|
|
|
|
|
|||||||||||||||
|
Unsecured debt (2): |
|
|
|
|
|
|
|
|
|
|
|
|
|
|
|
|
|
|
|
|
|
Principal payments |
|
|
328,250 |
|
|
|
— |
|
|
|
— |
|
|
|
200,000 |
|
|
|
128,250 |
|
|
Interest payments |
|
|
75,911 |
|
|
|
16,189 |
|
|
|
32,379 |
|
|
|
22,760 |
|
|
|
4,583 |
|
|
|
|
|
|
|
|
|||||||||||||||
|
Sub-total |
|
|
404,161 |
|
|
|
16,189 |
|
|
|
32,379 |
|
|
|
222,760 |
|
|
|
132,833 |
|
|
|
|
|
|
|
|
|||||||||||||||
|
Other commitments: |
|
|
|
|
|
|
|
|
|
|
|
|
|
|
|
|
|
|
|
|
|
Operating lease obligations (3) |
|
|
89,358 |
|
|
|
14,375 |
|
|
|
19,457 |
|
|
|
15,895 |
|
|
|
39,631 |
|
|
Employment arrangements (4) |
|
|
11,017 |
|
|
|
4,905 |
|
|
|
6,112 |
|
|
|
— |
|
|
|
— |
|
|
Uncertain tax positions (5) |
|
|
— |
|
|
|
— |
|
|
|
— |
|
|
|
— |
|
|
|
— |
|
|
|
|
|
|
|
|
|||||||||||||||
|
Sub-total |
|
|
100,375 |
|
|
|
19,280 |
|
|
|
25,569 |
|
|
|
15,895 |
|
|
|
39,631 |
|
|
|
|
|
|
|
|
|||||||||||||||
|
Total |
|
$ |
810,323 |
|
|
$ |
49,723 |
|
|
$ |
89,955 |
|
|
$ |
270,663 |
|
|
$ |
399,982 |
|
|
|
|
|
|
|
|
|||||||||||||||
|
|
|
|
|
|
||
|
|
|
|
|
(1) |
Represents the outstanding principal and monthly interest payments due on the York Property Mortgage. The York Property Mortgage matures on July 1, 2035, has an optional pre-payment date of July 1, 2015, and bears an annual interest rate of approximately 5.6%, which increases subsequent to July 1, 2015. It is our current intention to pre-pay the York Property Mortgage on or about July 1, 2015. The payments reflected in the table above assume that pre-payment will be made on that date. |
|
|
|
|
|
|
(2) |
Represents the aggregate outstanding principal and semi-annual interest payments due on our 3.125% Convertible Notes, due June 15, 2013 (the “Convertible Notes”), and our 7.75% Senior Notes, due June 15, 2015 (the “Senior Notes”). (See Note M of Notes to Consolidated Financial Statements for additional information on the Convertible Notes and the Senior Notes.) |
|
|
|
|
|
|
(3) |
Represents rental payments due under our operating lease obligations. Our existing lease for warehouse space in London expires in the first quarter of 2011. We have reached an agreement in principle to lease a new London warehouse facility, which we expect to occupy beginning in the first quarter of 2011. We anticipate signing this lease in the first quarter of 2010, subject to obtaining planning permission for the buildout of the facility. Not included in the table above are rental payments for this facility are expected to be approximately $0.9 million annually from 2010 through 2014 and $12.9 million, in total, thereafter. |
|
|
|
|
|
|
(4) |
Represents the remaining commitment for future salaries and other cash compensation (excluding any participation in Sotheby’s incentive compensation and share-based payment programs) related to employment arrangements with certain senior employees, which expire at various points between March 2011 and February 2012. Such arrangements provide, among other benefits, for minimum salary levels and for incentive compensation under our incentive compensation programs which is payable only if specified company and individual goals are attained. Additionally, certain of these arrangements provide for annual equity grants, the accelerated vesting of certain equity grants, severance payments, other cash compensation and continuation of benefits upon termination of employment under certain circumstances. |
|
|
|
|
|
|
(5) |
Excludes the $16.9 million liability recorded for uncertain tax positions that would be settled by cash payments to the respective taxing authorities, which are classified as long-term liabilities in our December 31, 2009 Consolidated Balance Sheet. This liability is excluded from the table above because we are unable to make reliable estimates of the period of settlement with the respective taxing authorities. (See Note O of Notes to the Consolidated Financial Statements for more detailed information on uncertain tax positions.) |
|
43
OFF-BALANCE SHEET ARRANGEMENTS
Auction Guarantees
From time to time in the ordinary course of our business, we will guarantee to sellers a minimum price in connection with the sale of property at auction (an “auction guarantee”). In the event that the property sells for less than the minimum guaranteed price, we must perform under the auction guarantee by funding the difference between the sale price at auction and the amount of the auction guarantee. We are generally entitled to a share of the excess proceeds (the “overage”) if the property under the auction guarantee sells above a minimum price. If the property does not sell, the amount of the guarantee must be paid, but title to the property generally transfers to Sotheby’s, and we may recover a portion, all or more than the amount paid under the guarantee through the future sale of the property, whether or not we take title to the property.
In certain situations, we reduce our financial exposure under an auction guarantee through a risk and reward sharing arrangement with a partner. Such auction guarantee risk and reward sharing arrangements include:
|
|
|
|
|
|
• |
Arrangements under which an unaffiliated counterparty contractually commits to bid a predetermined price on the guaranteed property (an “irrevocable bid”). If the irrevocable bid is the winning bid, the counterparty purchases the property at the predetermined price plus the applicable buyer’s premium and pays the same amount as any other successful bidder would pay. If the irrevocable bid is not the winning bid, the counterparty is generally entitled to a negotiated share of the auction commission earned on the sale and/or a share of any overage. |
|
|
|
|
|
|
• |
Arrangements under which an unaffiliated counterparty contractually commits to fund: (i) a share of the difference between the sale price at auction and the amount of the auction guarantee if the property sells for less than the minimum guaranteed price or (ii) a share of the minimum guaranteed price if the property does not sell while taking ownership of a proportionate share of the unsold property. In exchange for accepting a share of the financial exposure under the auction guarantee, the counterparty is entitled to receive a share of the auction commission earned if the property sells and/or a share of any overage. |
The counterparties to these auction guarantee risk and reward sharing arrangements are typically major international art dealers or major art collectors. Sotheby’s could be exposed to credit-related losses in the event of nonperformance by these counterparties.
As of December 31, 2009, we had one outstanding auction guarantee of $4.5 million, the property relating to which had pre-sale low and high estimates (1) of $5 million and $7 million, respectively. Our financial exposure under this auction guarantee was fully hedged as a result of an irrevocable bid of $4.5 million from an unaffiliated counterparty.
(1) Pre-sale estimates are not always accurate predictions of auction sale results or the fair value of the guaranteed property.
In response to the uncertain economic environment and the downturn in the international art market that was evident for most of 2009, we have substantially reduced our use of auction guarantees. We expect to continue to significantly limit our use of auction guarantees for the foreseeable future. (See statement on Forward Looking Statements.)
DERIVATIVE FINANCIAL INSTRUMENTS
We utilize forward exchange contracts to hedge cash flow exposures related to foreign currency exchange rate movements, which primarily arise from short-term foreign currency denominated intercompany balances and, to a lesser extent, foreign currency denominated client payable balances. Such forward exchange contracts are typically short-term with settlement dates less than six months from their inception. Additionally, on rare occasions, we purchase foreign currency option contracts to hedge foreign currency risks associated with amounts payable to consignors as a result of the sale of property at auction. All derivative financial instruments are entered into by our global treasury function, which is responsible for managing Sotheby’s exposure to foreign currency exchange rate movements.
As of December 31, 2009, the notional value of outstanding forward exchange contracts was $51.7 million. Notional values do not quantify risk or represent assets or liabilities of Sotheby’s, but are used to calculate cash settlements under outstanding forward exchange contracts. We are exposed to credit-related losses in the event of nonperformance by the two counterparties to our outstanding forward exchange contracts. We do not expect either of these counterparties to fail to meet their obligations given their high short-term (A1/P1) credit ratings.
44
As of December 31, 2009, the $0.1 million aggregate carrying value of our outstanding forward exchange contracts was recorded as an asset in the Consolidated Balance Sheets within Prepaid Expenses and Other Current Assets. As of December 31, 2008, the $2.6 million aggregate carrying value of our outstanding forward exchange contracts was recorded as a liability in the Consolidated Balance Sheets within Accounts Payable and Accrued Liabilities. These carrying values reflect the aggregate fair values of the outstanding derivative instruments on each balance sheet date based on referenced market rates. For more information related to our derivative financial instruments, see Notes C and V in Notes to Consolidated Financial Statements.
CONTINGENCIES
For
information related to Contingencies, see Notes F, O, S and T of Notes to
Consolidated Financial Statements.
UNCERTAIN TAX POSITIONS
For information
related to Uncertain Tax Positions, see Note O of Notes to Consolidated
Financial Statements.
FINANCIAL CONDITION AS OF DECEMBER 31, 2009
This discussion should be read in conjunction with our Consolidated Statements of Cash Flows (see Item 8, “Financial Statements and Supplementary Data”). In 2009, total cash and cash equivalents increased approximately $68.1 million to $321.6 million primarily due to the factors discussed below.
Cash Provided by Operating Activities—Net cash provided by operating activities of $158.5 million in 2009 is principally attributable to our results for the period, a $104.2 million net increase in amounts collected from clients and proceeds from the sale of inventory. These operating cash inflows are partially offset by a $42.3 million decrease in accounts payable and accrued liabilities.
Cash Used by Investing Activities—Net cash used by investing activities of $65.8 million in 2009 is principally due to the $85 million payment made in conjunction with the York Property purchase in February 2009 (see “York Property” above) and the funding of other capital expenditures ($13 million). These investing cash outflows are partially offset by a $27.1 million net decrease in client loans.
Cash Used by Financing Activities—Net cash used by financing activities of $24.2 million in 2009 is principally due to $20.4 million in dividend payments and $1.6 million for the repurchase of a portion of our 7.75% Senior Notes.
LIQUIDITY AND CAPITAL RESOURCES
Cash and Cash Equivalents—As of December 31, 2009, Sotheby’s had cash and cash equivalents of approximately $321.6 million, which are invested on a short-term basis in the highest rated overnight deposits with major banks.
Revolving Credit Facility—On August 31, 2009, Sotheby’s and certain of its wholly-owned subsidiaries (collectively, the “Borrowers”), entered into a credit agreement (the “Credit Agreement”) with an international syndicate of lenders led by General Electric Capital Corporation (“GE Capital”), which acted as fronting lender and agent. The following summary does not purport to be a complete summary of the Credit Agreement and is qualified in its entirety by reference to the Credit Agreement, a copy of which was filed as Exhibit 10.1 to Sotheby’s Form 8-K filed with the SEC on September 1, 2009. Terms used, but not defined in this summary, have the meanings set forth in the Credit Agreement.
The Credit Agreement has a maturity date of August 31, 2012 and provides for a $200 million revolving credit facility (the “Revolving Credit Facility”), with a sub-limit of $50 million for U.K. based borrowings. The borrowings available under the Credit Agreement are limited by a borrowing base equal to 85% of Eligible Art Loans, plus 30% of Eligible Art Inventory, plus 15% of Consolidated Net Tangible Assets, subject to certain limitations and reserves.
Borrowings under the Revolving Credit Facility may be used for general corporate purposes. In addition, up to $10 million of the Revolving Credit Facility may be used to issue letters of credit. As of December 31, 2009, there were no borrowings or letters of credit outstanding under the Revolving Credit Facility and the amount of available borrowings was approximately $129 million, as calculated under the borrowing base.
Borrowings under the Revolving Credit Facility are available in either Dollars to U.S. Borrowers or Pounds Sterling to U.K. Borrowers. The U.S. Borrowers and, subject to certain limitations, the U.K. Borrowers, are jointly and severally liable for all obligations under the Credit Agreement. In addition, certain subsidiaries of the Borrowers guarantee the obligations of the Borrowers under the Credit Agreement. The obligations under the Credit Agreement are secured by liens on all or substantially all of the personal property of the Borrowers and the guarantors.
45
Borrowings are, at the Borrowers’ option, either Dollar Index Rate Loans (for U.S. Borrowers only) or LIBOR Loans. Dollar Index Rate Loans bear interest from the applicable borrowing date at an annual rate equal to (a) the highest of (i) the “Prime Rate” as quoted in The Wall Street Journal, (ii) the Federal Funds Rate plus 3%, or (iii) the LIBOR Rate based upon the offered rate for deposits in such currency for a period equal to such interest period on the Reuters Screen LIBOR01 Page plus 1.0%, plus (b) the Applicable Margin, which is generally 3.0% to 3.5% based upon the level of outstanding borrowings under the Revolving Credit Facility. The LIBOR Rate for Dollars or Pounds Sterling, as the case may be, for an interest period is equal to (x) the highest of (i) the offered rate for deposits in such currency for a period equal to such interest period on the Reuters Screen LIBOR01 Page, (ii) if the interest period is less than three months, the offered rate for deposits in such currency on the Reuters Screen for an Interest Period of three months, and (iii) 2%, plus (y) the Applicable Margin, which is generally 4.0% to 4.5% based upon the level of outstanding borrowings under the Revolving Credit Facility.
The Credit Agreement contains certain customary affirmative and negative covenants including, but not limited to, limitations on capital expenditures, limitations on net outstanding auction guarantees, limitations on the use of proceeds from borrowings under the Credit Agreement, limitations on the ability to merge, liquidate, consolidate, dispose of assets or capital stock, and limitations on material changes to the nature of Sotheby’s business. The Credit Agreement also restricts quarterly dividend payments to the lesser of $0.05 per share or $4 million. The maximum level of quarterly dividend payments may be increased depending on the Fixed Charge Coverage Ratio covenant. Management believes that Sotheby’s is in compliance with the covenants and terms of the Credit Agreement.
The Credit Agreement also contains the following financial covenants, which are only applicable during certain compliance periods:
|
|
|
|
|
|
• |
A minimum Fixed Charge Coverage Ratio, which requires the maintenance of a sufficient level of specifically defined cash flows to cover certain debt and equity related cash requirements. |
|
|
|
|
|
|
• |
A minimum EBITDA, which requires the maintenance of certain minimum levels of specifically defined operating cash flows. |
These financial covenants were not applicable for the twelve month period ending December 31, 2009.
Sotheby’s incurred approximately $7.5 million in fees related to the Credit Agreement, which are being amortized on a straight-line basis to interest expense over the three-year term of the facility. Additionally, commitment fees are 1.00% per year for undrawn amounts committed under the Revolving Credit Facility.
In conjunction with entering into the Credit Agreement, on August 31, 2009, we terminated our senior secured revolving credit facility with Bank of America, N.A. (the “BofA Credit Agreement”). The BofA Credit Agreement had a maturity date of September 7, 2010 and provided for borrowings of up to $150 million, subject to a borrowing base.
Liquidity Requirements—We generally rely on operating cash flows supplemented, on occasion, by borrowings to meet our liquidity requirements.
Our short-term operating needs and capital requirements include the funding of working capital, the funding of notes receivable and consignor advances, the funding of other short-term commitments to consignors, the funding of capital expenditures and the payment of dividends, as well as the funding of the short-term commitments due on or before December 31, 2010 as summarized in the table of contractual obligations and commitments above.
Our long-term operating needs and capital requirements include the funding of working capital, the funding of notes receivable and consignor advances, the funding of capital expenditures, as well as the funding of the presently anticipated long-term contractual obligations and commitments summarized in the table of contractual obligations and commitments above.
We believe that operating cash flows, cash balances and borrowings available under the Credit Agreement will be adequate to meet our anticipated short-term and long-term commitments, operating needs and capital requirements through the August 31, 2012 expiration of the Credit Agreement. (See statement on Forward Looking Statements.)
46
QUANTITATIVE AND QUALITATIVE DISCLOSURES ABOUT MARKET RISK
We continually evaluate market risk associated with our financial instruments and derivative financial instruments through the course of our business. As of December 31, 2009, our financial instruments include:
|
|
|
|
|
|
• |
Cash and cash equivalents; |
|
|
|
|
|
|
• |
Restricted cash; |
|
|
|
|
|
|
• |
Notes receivable (see Note F of Notes to Consolidated Financial Statements); |
|
|
|
|
|
|
• |
Trust assets related to the deferred compensation liability (see Note R of Notes to Consolidated Financial Statements); |
|
|
|
|
|
|
• |
The York Property Mortgage (see Notes I and M of Notes to Consolidated Financial Statements); |
|
|
|
|
|
|
• |
The Senior Notes (see Note M of Notes to Consolidated Financial Statements); |
|
|
|
|
|
|
• |
The Convertible Notes (see Note M of Notes to Consolidated Financial Statements); and |
|
|
|
|
|
|
• |
The deferred compensation liability. |
We believe that our interest rate risk is minimal as a hypothetical 10% increase or decrease in interest rates is immaterial to our cash flow, earnings, and fair value related to our financial instruments. (See statement on Forward Looking Statements.)
As of December 31, 2009, a hypothetical 10% strengthening or weakening of the U.S. dollar relative to all other currencies would result in a decrease or increase in cash flow of approximately $28.9 million.
As discussed above, we utilize forward exchange contracts to hedge cash flow exposures related to foreign currency exchange rate movements, which primarily arise from short-term foreign currency denominated intercompany balances and, to a lesser extent, foreign currency denominated client payable balances. Such forward exchange contracts are typically short-term with settlement dates less than six months from their inception. Additionally, on rare occasions, we purchase foreign currency option contracts to hedge foreign currency risks associated with amounts payable to consignors as a result of the sale of property at auction. All derivative financial instruments are entered into by our global treasury function, which is responsible for managing Sotheby’s exposure to foreign currency exchange rate movements.
At December 31, 2009, we had $51.7 million of notional value forward exchange contracts outstanding. Notional amounts do not quantify risk or represent assets or liabilities, but are used in the calculation of cash settlements under such contracts. We are exposed to credit-related losses in the event of nonperformance by the two counterparties to our forward exchange contracts, but we do not expect any counterparties to fail to meet their obligations given their high credit ratings. (See “Derivative Instruments” above and Note V of Notes to Consolidated Financial Statements.)
FUTURE IMPACT OF RECENTLY ISSUED ACCOUNTING STANDARDS
In April 2009, the SEC Staff issued Staff Accounting Bulletin (“SAB”) No. 111. SAB No. 111 amends and replaces SAB Topic 5.M. in the SAB Series entitled “Other Than Temporary Impairment of Certain Investments in Debt and Equity Securities.” SAB No. 111 maintains the SEC Staff’s previous views related to equity securities and amends Topic 5.M. to exclude debt securities
47
from its scope. Sotheby’s adopted SAB No. 111 in the second quarter of 2009. The adoption of SAB No. 111 has not had an impact on Sotheby’s results or financial position in 2009.
In April 2009, the Financial Accounting Standards Board (the “FASB”) issued FSP No. 141(R)-1, “Accounting for Assets Acquired and Liabilities Assumed in a Business Combination That Arise from Contingencies,” which is now codified under Accounting Standards Codification (“ASC”) 805 (Business Combinations). This standard amends and clarifies previous accounting principles regarding business combinations to address application issues raised by preparers, auditors, and members of the legal profession on initial recognition and measurement, subsequent measurement and accounting, and disclosure of assets and liabilities arising from contingencies in a business combination. This standard was effective for assets or liabilities arising from contingencies in business combinations for which the acquisition date is on or after the beginning of the first annual reporting period beginning on or after December 15, 2008. The adoption of this standard has not impacted Sotheby’s results of operations or financial condition in 2009 as there have been no business combinations on or after its effective date.
In May 2009, the FASB issued Statements of Financial Accounting Standards (“SFAS”) No. 165, “Subsequent Events,” which is now codified under ASC 855 (Subsequent Events). This standard establishes the general principles of accounting for, and disclosure of, events that occur after the balance sheet date but before financial statements are issued or are available to be issued. Sotheby’s adopted this standard, effective for the period ended June 30, 2009. The adoption of this standard has not impacted Sotheby’s results of operations or financial position in 2009. See Note Q of Notes to Consolidated Financial Statements for subsequent events impacting Sotheby’s.
In June 2009, the FASB issued SFAS No. 166, “Accounting for Transfers of Financial Assets, an amendment to SFAS No. 140.” This pronouncement has not yet been incorporated into the Codification. This standard eliminates the concept of a “qualifying special-purpose entity,” changes the requirements for derecognizing financial assets and requires additional disclosures in order to enhance information reported to users of financial statements by providing greater transparency about transfers of financial assets, including securitization transactions, and an entity’s continuing involvement in and exposure to the risks related to transferred financial assets. This standard is effective for fiscal years beginning after November 15, 2009. Management is evaluating the potential impact of adopting this standard on Sotheby’s consolidated financial statements.
In June 2009, the FASB issued SFAS No. 167, “Amendments to FASB Interpretation No. 46(R).” This pronouncement has not yet been incorporated into the Codification. This standard changes how companies determine whether an entity that is insufficiently capitalized or is controlled through voting (or similar rights) should be consolidated. This standard will become effective for Sotheby’s on January 1, 2010. Management is evaluating the impact of adopting this standard on Sotheby’s consolidated financial statements.
In October 2009, the FASB issued Accounting Standards Update 2009–13, “Multiple-Deliverable Revenue Arrangements,” which is codified in ASC 605 (Revenue Recognition). This update addresses the unit of accounting for arrangements involving multiple deliverables and how to allocate arrangement consideration to one or more units of accounting. It eliminates the criteria that objective and reliable evidence of the fair value of any undelivered items must exist for the delivered items to be considered separate units of accounting. This update will be effective prospectively for fiscal years beginning on or after June 15, 2010. Early application as well as retrospective application is also permitted. Management is evaluating the potential impact of adopting this standard on Sotheby’s consolidated financial statements.
FORWARD LOOKING STATEMENTS
This Form 10-K contains certain forward looking statements; as such term is defined in Section 21E of the Securities Exchange Act of 1934, as amended, relating to future events and the financial performance of Sotheby’s. Such statements are only predictions and involve risks and uncertainties, resulting in the possibility that the actual events or performance will differ materially from such predictions. Major factors which we believe could cause the actual results to differ materially from the predicted results in the forward looking statements include, but are not limited to, the factors listed above under Part I, Item 1A, “Risk Factors,” which are not ranked in any particular order.
ITEM 7A: QUANTITATIVE AND QUALITATIVE DISCLOSURES ABOUT MARKET RISK
See the discussion under the caption contained in Item 7.
48
ITEM 8: FINANCIAL STATEMENTS AND SUPPLEMENTARY DATA
REPORT OF INDEPENDENT REGISTERED PUBLIC ACCOUNTING FIRM
To the Board
of Directors and Shareholders of
Sotheby’s
New York, New York
We have audited the accompanying consolidated balance sheets of Sotheby’s and subsidiaries (the “Company”) as of December 31, 2009 and 2008, and the related consolidated statements of operations, cash flows, and changes in shareholders’ equity for each of the three years in the period ended December 31, 2009. Our audits also included the financial statement schedule listed in the Index at Item 15. These consolidated financial statements and financial statement schedule are the responsibility of the Company’s management. Our responsibility is to express an opinion on the consolidated financial statements and financial statement schedule based on our audits.
We conducted our audits in accordance with the standards of the Public Company Accounting Oversight Board (United States). Those standards require that we plan and perform the audit to obtain reasonable assurance about whether the financial statements are free of material misstatement. An audit includes examining, on a test basis, evidence supporting the amounts and disclosures in the financial statements. An audit also includes assessing the accounting principles used and significant estimates made by management, as well as evaluating the overall financial statement presentation. We believe that our audits provide a reasonable basis for our opinion.
In our opinion, such consolidated financial statements present fairly, in all material respects, the financial position of Sotheby’s and subsidiaries as of December 31, 2009 and 2008, and the results of their operations and their cash flows for each of the three years in the period ended December 31, 2009, in conformity with accounting principles generally accepted in the United States of America. Also, in our opinion, such financial statement schedule, when considered in relation to the basic consolidated financial statements taken as a whole, presents fairly, in all material respects, the information set forth therein.
As discussed in Note B to the consolidated financial statements, the accompanying consolidated financial statements have been retrospectively adjusted for the adoption of new accounting guidance for the treatment of the liability and equity components of convertible debt instruments that may be settled entirely or partially in cash upon conversion.
We have also audited, in accordance with the standards of the Public Company Accounting Oversight Board (United States), the Company’s internal control over financial reporting as of December 31, 2009, based on the criteria established in Internal Control—Integrated Framework issued by the Committee of Sponsoring Organizations of the Treadway Commission and our report dated March 1, 2010, expressed an unqualified opinion on the Company’s internal control over financial reporting.
|
|
|
|
| /s/ DELOITTE & TOUCHE LLP |
|
Deloitte & Touche LLP |
|
|
|
New York, New York |
|
March 1, 2010 |
49
SOTHEBY’S
CONSOLIDATED STATEMENTS OF OPERATIONS
(Thousands of dollars, except per share data)
|
|
|
|
|
|
|
|
|
|
|
|
|
|
|
|
|
|
|
|
|
|
|
|
|
|||
|
Year Ended December 31 |
|
2009 |
|
2008 |
|
2007 |
||||||
|
|
|
|
||||||||||
|
|
||||||||||||
|
Revenues: |
|
|
|
|
|
|
|
|
|
|
|
|
|
Auction and related revenues |
|
$ |
448,768 |
|
|
$ |
616,625 |
|
|
$ |
833,128 |
|
|
Finance revenues |
|
|
9,073 |
|
|
|
14,183 |
|
|
|
17,025 |
|
|
Dealer revenues |
|
|
22,339 |
|
|
|
55,596 |
|
|
|
62,766 |
|
|
License fee revenues |
|
|
3,270 |
|
|
|
3,438 |
|
|
|
2,960 |
|
|
Other revenues |
|
|
1,508 |
|
|
|
1,717 |
|
|
|
1,843 |
|
|
|
|
|
|
|||||||||
|
Total revenues |
|
|
484,958 |
|
|
|
691,559 |
|
|
|
917,722 |
|
|
|
|
|
|
|||||||||
|
Expenses: |
|
|
|
|
|
|
|
|
|
|
|
|
|
Direct costs of services |
|
|
43,429 |
|
|
|
95,410 |
|
|
|
80,400 |
|
|
Dealer cost of sales |
|
|
24,516 |
|
|
|
61,978 |
|
|
|
49,161 |
|
|
Marketing expenses |
|
|
10,541 |
|
|
|
19,662 |
|
|
|
19,792 |
|
|
Salaries and related costs |
|
|
196,269 |
|
|
|
240,126 |
|
|
|
293,720 |
|
|
General and administrative expenses |
|
|
123,350 |
|
|
|
176,004 |
|
|
|
166,539 |
|
|
Depreciation and amortization expense |
|
|
21,560 |
|
|
|
24,845 |
|
|
|
22,101 |
|
|
Restructuring charges (net) |
|
|
12,159 |
|
|
|
4,312 |
|
|
|
— |
|
|
Impairment loss |
|
|
— |
|
|
|
13,189 |
|
|
|
14,979 |
|
|
Antitrust related matters |
|
|
— |
|
|
|
(18,385 |
) |
|
|
— |
|
|
Gain on sale of land and buildings |
|
|
— |
|
|
|
— |
|
|
|
(4,752 |
) |
|
|
|
|
|
|||||||||
|
Total expenses |
|
|
431,824 |
|
|
|
617,141 |
|
|
|
641,940 |
|
|
|
|
|
|
|||||||||
|
|
|
|
|
|
|
|
|
|
|
|
|
|
|
Operating income |
|
|
53,134 |
|
|
|
74,418 |
|
|
|
275,782 |
|
|
|
|
|
|
|
|
|
|
|
|
|
|
|
|
Interest income |
|
|
5,357 |
|
|
|
8,333 |
|
|
|
14,456 |
|
|
Interest expense |
|
|
(45,708 |
) |
|
|
(39,985 |
) |
|
|
(28,622 |
) |
|
Extinguishment of debt (net) |
|
|
1,039 |
|
|
|
5,364 |
|
|
|
— |
|
|
Insurance recovery |
|
|
— |
|
|
|
— |
|
|
|
20,000 |
|
|
Write-off of credit facility amendment fees |
|
|
(3,750 |
) |
|
|
— |
|
|
|
— |
|
|
Other income (expense) |
|
|
5,323 |
|
|
|
(2,956 |
) |
|
|
1,403 |
|
|
|
|
|
|
|||||||||
|
|
|
|
|
|
|
|
|
|
|
|
|
|
|
Income before taxes |
|
|
15,395 |
|
|
|
45,174 |
|
|
|
283,019 |
|
|
Equity in earnings of investees, net of taxes |
|
|
239 |
|
|
|
2,139 |
|
|
|
2,632 |
|
|
Income tax expense |
|
|
22,162 |
|
|
|
20,857 |
|
|
|
72,512 |
|
|
|
|
|
|
|||||||||
|
|
|
|
|
|
|
|
|
|
|
|
|
|
|
Net (loss) income |
|
($ |
6,528 |
) |
|
$ |
26,456 |
|
|
$ |
213,139 |
|
|
|
|
|
|
|||||||||
|
|
|
|
|
|
|
|
|
|
|
|
|
|
|
Basic (loss) earnings per share - Sotheby’s common shareholders |
|
($ |
0.10 |
) |
|
$ |
0.39 |
|
|
$ |
3.22 |
|
|
|
|
|
|
|||||||||
|
|
|
|
|
|
|
|
|
|
|
|
|
|
|
Diluted (loss) earnings per share - Sotheby’s common shareholders |
|
($ |
0.10 |
) |
|
$ |
0.38 |
|
|
$ |
3.20 |
|
|
|
|
|
|
|||||||||
|
|
|
|
|
|
|
|
|
|
|
|
|
|
|
Cash dividends paid per common share |
|
$ |
0.30 |
|
|
$ |
0.60 |
|
|
$ |
0.50 |
|
|
|
|
|
|
|||||||||
See accompanying Notes to Consolidated Financial Statements
50
SOTHEBY’S
CONSOLIDATED BALANCE SHEETS
(Thousands of dollars)
|
|
|
|
|
|
|
|
|
|
|
|
|
December 31, |
|
December 31, |
||||
|
|
|
2009 |
|
2008 |
||||
|
|
|
|
||||||
|
ASSETS |
|
|
|
|
|
|
|
|
|
Current Assets: |
|
|
|
|
|
|
|
|
|
Cash and cash equivalents |
|
$ |
321,579 |
|
|
$ |
253,468 |
|
|
Restricted cash |
|
|
24,115 |
|
|
|
25,561 |
|
|
Accounts receivable, net of allowance for doubtful accounts of $5,183 and $9,906 |
|
|
373,717 |
|
|
|
544,324 |
|
|
Notes receivable, net of allowance for credit losses of $1,028 and $1,213 |
|
|
64,461 |
|
|
|
152,224 |
|
|
Inventory |
|
|
142,565 |
|
|
|
186,589 |
|
|
Deferred income taxes |
|
|
14,589 |
|
|
|
23,315 |
|
|
Income tax receivable |
|
|
8,130 |
|
|
|
20,767 |
|
|
Prepaid expenses and other current assets |
|
|
19,211 |
|
|
|
20,537 |
|
|
|
|
|
||||||
|
Total Current Assets |
|
|
968,367 |
|
|
|
1,226,785 |
|
|
|
|
|
||||||
|
Non-Current Assets: |
|
|
|
|
|
|
|
|
|
Notes receivable |
|
|
100,008 |
|
|
|
24,668 |
|
|
Fixed assets, net of accumulated depreciation and amortization of $139,814 and $182,271 |
|
|
370,224 |
|
|
|
206,206 |
|
|
Goodwill |
|
|
14,591 |
|
|
|
14,202 |
|
|
Intangible assets, net of accumulated amortization of $5,332 and $3,412 |
|
|
1,765 |
|
|
|
3,471 |
|
|
Equity method investments |
|
|
17,121 |
|
|
|
18,416 |
|
|
Deferred income taxes |
|
|
44,889 |
|
|
|
59,171 |
|
|
Trust assets related to deferred compensation liability |
|
|
37,451 |
|
|
|
33,191 |
|
|
Pension asset |
|
|
12,789 |
|
|
|
11,221 |
|
|
York Property deposit |
|
|
— |
|
|
|
50,000 |
|
|
Other assets |
|
|
18,918 |
|
|
|
15,637 |
|
|
|
|
|
||||||
|
Total Assets |
|
$ |
1,586,123 |
|
|
$ |
1,662,968 |
|
|
|
|
|
||||||
|
LIABILITIES AND SHAREHOLDERS’ EQUITY |
|
|
|
|
|
|
|
|
|
Current Liabilities: |
|
|
|
|
|
|
|
|
|
Due to consignors |
|
$ |
348,303 |
|
|
$ |
411,713 |
|
|
Accounts payable and accrued liabilities |
|
|
54,298 |
|
|
|
101,856 |
|
|
Accrued salaries and related costs |
|
|
28,612 |
|
|
|
26,713 |
|
|
Accrued income taxes |
|
|
2,831 |
|
|
|
13,606 |
|
|
Deferred income taxes |
|
|
603 |
|
|
|
1,293 |
|
|
Other current liabilities |
|
|
7,828 |
|
|
|
8,611 |
|
|
|
|
|
||||||
|
Total Current Liabilities |
|
|
442,475 |
|
|
|
563,792 |
|
|
|
|
|
||||||
|
Long-Term Liabilities: |
|
|
|
|
|
|
|
|
|
Long-term debt, net of unamortized discount of $49,107 and $36,419 |
|
|
512,939 |
|
|
|
294,473 |
|
|
York Property capital lease obligation |
|
|
— |
|
|
|
163,808 |
|
|
Deferred gain on sale of York Property |
|
|
— |
|
|
|
14,859 |
|
|
Deferred income taxes |
|
|
452 |
|
|
|
2,947 |
|
|
Accrued income taxes |
|
|
11,231 |
|
|
|
13,658 |
|
|
Deferred compensation liability |
|
|
34,472 |
|
|
|
31,469 |
|
|
Other liabilities |
|
|
7,569 |
|
|
|
5,869 |
|
|
|
|
|
||||||
|
Total Liabilities |
|
|
1,009,138 |
|
|
|
1,090,875 |
|
|
|
|
|
||||||
|
Commitments and contingencies (see Note S) |
|
|
|
|
|
|
|
|
|
Shareholders’ Equity: |
|
|
|
|
|
|
|
|
|
Common stock, $0.01 par value |
|
|
672 |
|
|
|
672 |
|
|
Authorized shares at December 31, 2009—200,000,000 |
|
|
|
|
|
|
|
|
|
Issued and outstanding shares 67,157,342 and 67,279,925 |
|
|
|
|
|
|
|
|
|
Additional paid-in capital |
|
|
317,081 |
|
|
|
298,984 |
|
|
Retained earnings |
|
|
297,579 |
|
|
|
323,665 |
|
|
Accumulated other comprehensive loss |
|
|
(38,347 |
) |
|
|
(51,228 |
) |
|
|
|
|
||||||
|
Total Shareholders’ Equity |
|
|
576,985 |
|
|
|
572,093 |
|
|
|
|
|
||||||
|
Total Liabilities and Shareholders’ Equity |
|
$ |
1,586,123 |
|
|
$ |
1,662,968 |
|
|
|
|
|
||||||
See accompanying Notes to Consolidated Financial Statements
51
SOTHEBY’S
CONSOLIDATED STATEMENTS OF CASH FLOWS
(Thousands of dollars)
|
|
|
|
|
|
|
|
|
|
|
|
|
|
|
Year Ended December 31 |
|
2009 |
|
2008 |
|
2007 |
||||||
|
|
|
|
||||||||||
|
Operating Activities: |
|
|
|
|
|
|
|
|
|
|
|
|
|
Net (loss) income |
|
$ |
(6,528 |
) |
|
$ |
26,456 |
|
|
$ |
213,139 |
|
|
Adjustments to reconcile net (loss) income to net cash provided (used) by operating activities: |
|
|
|
|
|
|
|
|
|
|
|
|
|
Depreciation and amortization expense |
|
|
21,560 |
|
|
|
24,845 |
|
|
|
22,101 |
|
|
Gain on sale of land and buildings |
|
|
— |
|
|
|
— |
|
|
|
(4,752 |
) |
|
Gain on sale of business |
|
|
(4,146 |
) |
|
|
— |
|
|
|
— |
|
|
Gain on extinguishment of debt |
|
|
(1,039 |
) |
|
|
(7,841 |
) |
|
|
— |
|
|
Impairment loss |
|
|
— |
|
|
|
13,189 |
|
|
|
14,979 |
|
|
Equity in earnings of investees |
|
|
(239 |
) |
|
|
(2,139 |
) |
|
|
(2,632 |
) |
|
Deferred income tax expense (benefit) |
|
|
13,707 |
|
|
|
(872 |
) |
|
|
(25,608 |
) |
|
Shared-based compensation |
|
|
20,586 |
|
|
|
30,396 |
|
|
|
28,163 |
|
|
Net pension (benefit) expense |
|
|
(2,288 |
) |
|
|
(4,045 |
) |
|
|
11,605 |
|
|
Asset provisions |
|
|
6,480 |
|
|
|
34,081 |
|
|
|
6,790 |
|
|
Antitrust related matters |
|
|
— |
|
|
|
(18,385 |
) |
|
|
— |
|
|
Amortization of discount related to antitrust matters |
|
|
— |
|
|
|
— |
|
|
|
941 |
|
|
Amortization of discount on long-term debt |
|
|
10,255 |
|
|
|
3,303 |
|
|
|
— |
|
|
Excess tax benefits from share-based compensation |
|
|
— |
|
|
|
(1,086 |
) |
|
|
(15,693 |
) |
|
Other |
|
|
803 |
|
|
|
(163 |
) |
|
|
(205 |
) |
|
Changes in assets and liabilities: |
|
|
|
|
|
|
|
|
|
|
|
|
|
Accounts receivable |
|
|
178,670 |
|
|
|
198,020 |
|
|
|
(443,307 |
) |
|
Due to consignors |
|
|
(74,472 |
) |
|
|
(301,073 |
) |
|
|
200,080 |
|
|
Inventory |
|
|
35,857 |
|
|
|
(20,923 |
) |
|
|
(84,859 |
) |
|
Prepaid expenses and other current assets |
|
|
2,979 |
|
|
|
(614 |
) |
|
|
732 |
|
|
Other long-term assets |
|
|
(601 |
) |
|
|
(1,470 |
) |
|
|
787 |
|
|
Trust assets related to the deferred compensation liability |
|
|
(4,260 |
) |
|
|
(1,374 |
) |
|
|
(30,492 |
) |
|
Settlement liabilities |
|
|
— |
|
|
|
(4,266 |
) |
|
|
(24,065 |
) |
|
Income tax receivable and deferred income tax assets |
|
|
20,223 |
|
|
|
(20,489 |
) |
|
|
(1,546 |
) |
|
Accrued income taxes and deferred income tax liabilities |
|
|
(16,722 |
) |
|
|
(47,465 |
) |
|
|
62,951 |
|
|
Accounts payable and accrued liabilities and other liabilities |
|
|
(42,304 |
) |
|
|
(73,563 |
) |
|
|
33,746 |
|
|
|
|
|
|
|||||||||
|
Net cash provided (used) by operating activities |
|
|
158,521 |
|
|
|
(175,478 |
) |
|
|
(37,145 |
) |
|
|
|
|
|
|||||||||
|
Investing Activities: |
|
|
|
|
|
|
|
|
|
|
|
|
|
Funding of notes receivable and consignor advances |
|
|
(152,179 |
) |
|
|
(377,216 |
) |
|
|
(306,241 |
) |
|
Collections of notes receivable and consignor advances |
|
|
179,289 |
|
|
|
371,388 |
|
|
|
352,381 |
|
|
Purchases of short-term investments |
|
|
— |
|
|
|
— |
|
|
|
(385,275 |
) |
|
Proceeds from maturities of short-term investments |
|
|
— |
|
|
|
— |
|
|
|
511,317 |
|
|
Capital expenditures |
|
|
(100,879 |
) |
|
|
(74,192 |
) |
|
|
(17,396 |
) |
|
Proceeds from the sale of land and buildings |
|
|
2,450 |
|
|
|
— |
|
|
|
6,163 |
|
|
Acquisition, net of cash acquired |
|
|
— |
|
|
|
(193 |
) |
|
|
(1,728 |
) |
|
Distributions from equity investee |
|
|
1,664 |
|
|
|
5,333 |
|
|
|
7,568 |
|
|
Decrease (increase) in restricted cash |
|
|
1,404 |
|
|
|
(8,828 |
) |
|
|
(3,049 |
) |
|
Proceeds from sale of business |
|
|
2,462 |
|
|
|
— |
|
|
|
— |
|
|
|
|
|
|
|||||||||
|
Net cash (used) provided by investing activities |
|
|
(65,789 |
) |
|
|
(83,708 |
) |
|
|
163,740 |
|
|
|
|
|
|
|||||||||
|
Financing Activities: |
|
|
|
|
|
|
|
|
|
|
|
|
|
Proceeds from revolving credit facility borrowings |
|
|
— |
|
|
|
390,000 |
|
|
|
— |
|
|
Repayments of revolving credit facility borrowings |
|
|
— |
|
|
|
(390,000 |
) |
|
|
— |
|
|
Repayment of 6.98% Senior Unsecured Debt |
|
|
— |
|
|
|
(100,000 |
) |
|
|
— |
|
|
Proceeds from 3.125% Convertible Senior Notes, net of debt issuance costs of $5,700 |
|
|
— |
|
|
|
194,300 |
|
|
|
— |
|
|
Proceeds from 7.75% Senior Notes, net of debt issuance costs and discount of $4,145 |
|
|
— |
|
|
|
145,855 |
|
|
|
— |
|
|
Repayment of 7.75% Senior Notes |
|
|
(1,647 |
) |
|
|
(10,578 |
) |
|
|
— |
|
|
Premiums paid for convertible note hedges |
|
|
— |
|
|
|
(40,600 |
) |
|
|
— |
|
|
Proceeds received from sale of common stock warrants |
|
|
— |
|
|
|
22,300 |
|
|
|
— |
|
|
Dividends paid |
|
|
(20,434 |
) |
|
|
(40,651 |
) |
|
|
(33,326 |
) |
|
Decrease in York Property capital lease obligation |
|
|
(49 |
) |
|
|
(1,796 |
) |
|
|
(1,619 |
) |
|
Proceeds from exercise of employee stock options |
|
|
1,269 |
|
|
|
339 |
|
|
|
18,557 |
|
|
Excess tax benefits from share-based compensation |
|
|
— |
|
|
|
1,086 |
|
|
|
15,693 |
|
|
Other financing activities |
|
|
(3,385 |
) |
|
|
— |
|
|
|
— |
|
|
|
|
|
|
|||||||||
|
Net cash (used) provided by financing activities |
|
|
(24,246 |
) |
|
|
170,255 |
|
|
|
(695 |
) |
|
|
|
|
|
|||||||||
|
Effect of exchange rate changes on cash and cash equivalents |
|
|
(375 |
) |
|
|
(5,854 |
) |
|
|
1,259 |
|
|
Increase (decrease) in cash and cash equivalents |
|
|
68,111 |
|
|
|
(94,785 |
) |
|
|
127,159 |
|
|
Cash and cash equivalents at beginning of period |
|
|
253,468 |
|
|
|
348,253 |
|
|
|
221,094 |
|
|
|
|
|
|
|||||||||
|
Cash and cash equivalents at end of period |
|
$ |
321,579 |
|
|
$ |
253,468 |
|
|
$ |
348,253 |
|
|
|
|
|
|
|||||||||
|
|
||||||||||||
|
Supplemental information on non-cash investing and financing activities: |
|
|
|
|
|
|
|
|
|
|
|
|
|
|
|
|
|
|
|
|
|
|
|
|
|
|
|
On February 6, 2009, Sotheby’s purchased the York Property, which was financed in part, through the assumption of an existing $235 million mortgage (see Note I). |
||||||||||||
See accompanying Notes to Consolidated Financial Statements
52
SOTHEBY’S
CONSOLIDATED STATEMENTS OF CHANGES IN SHAREHOLDERS’ EQUITY
YEARS ENDED DECEMBER 31, 2009, 2008 and 2007
(Thousands of dollars)
|
|
|
|
|
|
|
|
|
|
|
|
|
|
|
|
|
|
|
|
|
|
|
|
|
Common |
|
Additional |
|
Retained |
|
Accumulated |
|
Total |
||||||||||
|
|
|
|
|
|
|
|||||||||||||||
|
Balance at January 1, 2007 |
|
$ |
648 |
|
|
$ |
202,872 |
|
|
$ |
160,055 |
|
|
$ |
(61,888 |
) |
|
$ |
301,687 |
|
|
Comprehensive income: |
|
|
|
|
|
|
|
|
|
|
|
|
|
|
|
|
|
|
|
|
|
Net income |
|
|
|
|
|
|
|
|
|
|
213,139 |
|
|
|
|
|
|
|
213,139 |
|
|
Other comprehensive income, net of tax: |
|
|
|
|
|
|
|
|
|
|
|
|
|
|
|
|
|
|
|
|
|
Foreign currency translation adjustments |
|
|
|
|
|
|
|
|
|
|
|
|
|
|
16,625 |
|
|
|
16,625 |
|
|
Net unrealized gains related to defined benefit pension plans |
|
|
|
|
|
|
|
|
|
|
|
|
|
|
50,804 |
|
|
|
50,804 |
|
|
Amortization of previously unrecognized prior service costs and net losses related to defined benefit pension plans |
|
|
|
|
|
|
|
|
|
|
|
|
|
|
4,372 |
|
|
|
4,372 |
|
|
|
|
|
|
|
|
|
|
|
|
|
|
|
|
|
|
|
|
|||
|
Total comprehensive income |
|
|
|
|
|
|
|
|
|
|
|
|
|
|
|
|
|
|
284,940 |
|
|
|
|
|
|
|
|
|
|
|
|
|
|
|
|
|
|
|
|
|||
|
Cumulative effect of change in accounting for uncertainty in income taxes |
|
|
|
|
|
|
|
|
|
|
(1,864 |
) |
|
|
|
|
|
|
(1,864 |
) |
|
Stock options exercised |
|
|
12 |
|
|
|
18,545 |
|
|
|
|
|
|
|
|
|
|
|
18,557 |
|
|
Amortization of share-based payments |
|
|
|
|
|
|
26,692 |
|
|
|
|
|
|
|
|
|
|
|
26,692 |
|
|
Restricted stock shares issued |
|
|
7 |
|
|
|
616 |
|
|
|
|
|
|
|
|
|
|
|
623 |
|
|
Common stock shares withheld to satisfy employee tax obligations |
|
|
(2 |
) |
|
|
(9,344 |
) |
|
|
|
|
|
|
|
|
|
|
(9,346 |
) |
|
Net tax benefit associated with stock option exercises and the vesting of restricted stock shares |
|
|
|
|
|
|
15,693 |
|
|
|
|
|
|
|
|
|
|
|
15,693 |
|
|
Shares issued to directors |
|
|
|
|
|
|
361 |
|
|
|
|
|
|
|
|
|
|
|
361 |
|
|
Cash dividends declared, $0.50 per common share |
|
|
|
|
|
|
|
|
|
|
(33,326 |
) |
|
|
|
|
|
|
(33,326 |
) |
|
|
|
|
|
|
|
|||||||||||||||
|
Balance at December 31, 2007 |
|
|
665 |
|
|
|
255,435 |
|
|
|
338,004 |
|
|
|
9,913 |
|
|
|
604,017 |
|
|
|
|
|
|
|
|
|||||||||||||||
|
Comprehensive loss: |
|
|
|
|
|
|
|
|
|
|
|
|
|
|
|
|
|
|
|
|
|
Net income |
|
|
|
|
|
|
|
|
|
|
26,456 |
|
|
|
|
|
|
|
26,456 |
|
|
Other comprehensive loss, net of tax: |
|
|
|
|
|
|
|
|
|
|
|
|
|
|
|
|
|
|
|
|
|
Foreign currency translation adjustments |
|
|
|
|
|
|
|
|
|
|
|
|
|
|
(55,062 |
) |
|
|
(55,062 |
) |
|
Net unrealized losses related to defined benefit pension plans |
|
|
|
|
|
|
|
|
|
|
|
|
|
|
(6,341 |
) |
|
|
(6,341 |
) |
|
Amortization of previously unrecognized prior service costs and net losses related to defined benefit pension plans |
|
|
|
|
|
|
|
|
|
|
|
|
|
|
63 |
|
|
|
63 |
|
|
|
|
|
|
|
|
|
|
|
|
|
|
|
|
|
|
|
|
|||
|
Total comprehensive loss |
|
|
|
|
|
|
|
|
|
|
|
|
|
|
|
|
|
|
(34,884 |
) |
|
|
|
|
|
|
|
|
|
|
|
|
|
|
|
|
|
|
|
|||
|
Impact of change in measurement date for defined benefit pension plan |
|
|
|
|
|
|
|
|
|
|
(144 |
) |
|
|
199 |
|
|
|
55 |
|
|
Impact of retrospective application of new acocunting rule for convertible debt |
|
|
|
|
|
|
20,244 |
|
|
|
|
|
|
|
|
|
|
|
20,244 |
|
|
Stock options exercised |
|
|
|
|
|
|
302 |
|
|
|
|
|
|
|
|
|
|
|
302 |
|
|
Amortization of share-based payments |
|
|
|
|
|
|
29,964 |
|
|
|
|
|
|
|
|
|
|
|
29,964 |
|
|
Restricted stock shares issued |
|
|
10 |
|
|
|
1,112 |
|
|
|
|
|
|
|
|
|
|
|
1,122 |
|
|
Common stock shares withheld to satisfy employee tax obligations |
|
|
(3 |
) |
|
|
(8,177 |
) |
|
|
|
|
|
|
|
|
|
|
(8,180 |
) |
|
Net tax shortfall associated with the vesting of restricted stock shares and stock option exercises |
|
|
|
|
|
|
(148 |
) |
|
|
|
|
|
|
|
|
|
|
(148 |
) |
|
Shares issued to directors |
|
|
|
|
|
|
451 |
|
|
|
|
|
|
|
|
|
|
|
451 |
|
|
Purchases of common stock call options, net of tax |
|
|
|
|
|
|
(22,499 |
) |
|
|
|
|
|
|
|
|
|
|
(22,499 |
) |
|
Sale of common stock warrants |
|
|
|
|
|
|
22,300 |
|
|
|
|
|
|
|
|
|
|
|
22,300 |
|
|
Cash dividends declared, $0.60 per common share |
|
|
|
|
|
|
|
|
|
|
(40,651 |
) |
|
|
|
|
|
|
(40,651 |
) |
|
|
|
|
|
|
|
|||||||||||||||
|
Balance at December 31, 2008 |
|
|
672 |
|
|
|
298,984 |
|
|
|
323,665 |
|
|
|
(51,228 |
) |
|
|
572,093 |
|
|
|
|
|
|
|
|
|||||||||||||||
|
Comprehensive income: |
|
|
|
|
|
|
|
|
|
|
|
|
|
|
|
|
|
|
|
|
|
Net loss |
|
|
|
|
|
|
|
|
|
|
(6,528 |
) |
|
|
|
|
|
|
(6,528 |
) |
|
Other comprehensive income, net of tax: |
|
|
|
|
|
|
|
|
|
|
|
|
|
|
|
|
|
|
|
|
|
Foreign currency translation adjustments |
|
|
|
|
|
|
|
|
|
|
|
|
|
|
20,159 |
|
|
|
20,159 |
|
|
Realized gain from cumulative translation adjustment on disposal of foreign business |
|
|
|
|
|
|
|
|
|
|
|
|
|
|
(3,414 |
) |
|
|
(3,414 |
) |
|
Net unrealized losses related to defined benefit pension plans |
|
|
|
|
|
|
|
|
|
|
|
|
|
|
(3,873 |
) |
|
|
(3,873 |
) |
|
Amortization of previously unrecognized prior service costs and net losses related to defined benefit pension plans |
|
|
|
|
|
|
|
|
|
|
|
|
|
|
9 |
|
|
|
9 |
|
|
|
|
|
|
|
|
|
|
|
|
|
|
|
|
|
|
|
|
|||
|
Total comprehensive income |
|
|
|
|
|
|
|
|
|
|
|
|
|
|
|
|
|
|
6,353 |
|
|
|
|
|
|
|
|
|
|
|
|
|
|
|
|
|
|
|
|
|||
|
Stock options exercised |
|
|
3 |
|
|
|
5,335 |
|
|
|
|
|
|
|
|
|
|
|
5,338 |
|
|
Common stock shares withheld to satisfy employee tax obligations |
|
|
(3 |
) |
|
|
(3,382 |
) |
|
|
|
|
|
|
|
|
|
|
(3,385 |
) |
|
Restricted stock units issued as per contractual employment arrangements |
|
|
|
|
|
|
848 |
|
|
|
|
|
|
|
|
|
|
|
848 |
|
|
Amortization of share-based payments |
|
|
|
|
|
|
19,330 |
|
|
|
876 |
|
|
|
|
|
|
|
20,206 |
|
|
Net tax shortfall associated with the vesting of restricted stock shares and stock option exercises |
|
|
|
|
|
|
(4,472 |
) |
|
|
|
|
|
|
|
|
|
|
(4,472 |
) |
|
Shares issued to directors |
|
|
|
|
|
|
438 |
|
|
|
|
|
|
|
|
|
|
|
438 |
|
|
Cash dividends declared, $0.30 per common share |
|
|
|
|
|
|
|
|
|
|
(20,434 |
) |
|
|
|
|
|
|
(20,434 |
) |
|
|
|
|
|
|
|
|||||||||||||||
|
Balance at December 31, 2009 |
|
$ |
672 |
|
|
$ |
317,081 |
|
|
$ |
297,579 |
|
|
$ |
(38,347 |
) |
|
$ |
576,985 |
|
|
|
|
|
|
|
|
|||||||||||||||
See accompanying Notes to Consolidated Financial Statements
53
SOTHEBY’S
NOTES TO CONSOLIDATED FINANCIAL STATEMENTS
Note A—Organization and Business
Sotheby’s is one of the world’s two largest auctioneers of authenticated fine and decorative art, jewelry and collectibles (collectively, “art” or “works of art” or “artwork” or “property”). Sotheby’s operations are organized under three segments: Auction, Finance and Dealer. Sotheby’s Auction segment functions principally as an agent offering works of art for sale at auction. In addition, Sotheby’s Auction segment provides a number of related services including the brokering of private sales of artwork. Sotheby’s also operates as a dealer in works of art through its Dealer segment, conducts art-related financing activities through its Finance segment and is engaged, to a lesser extent, in licensing activities. (See Note E for additional information related to Sotheby’s segments.)
Note B—Adjustments to Prior Period Presentation
Earnings (Loss) Per Share—Sotheby’s presentation of basic and diluted earnings per share for 2008 and 2007 has been retroactively adjusted as a result of the adoption on January 1, 2009 of a new accounting rule which clarified that share-based payments with nonforfeitable rights to dividends should be considered participating securities in the computation of earnings (loss) per share. See Note D for detailed information on the impact of adopting this new accounting rule.
Convertible Notes—On January 1, 2009, a new accounting rule came into effect for certain convertible debt instruments that may be settled entirely or partially in cash upon conversion. Pursuant to this rule, the liability and equity components of convertible debt instruments within its scope must be separately accounted for in a manner that will reflect the borrower’s nonconvertible debt borrowing rate when interest expense is recognized in subsequent periods. The adoption of this accounting rule required retrospective application for all prior periods presented.
Sotheby’s 3.125% Convertible Senior Notes (the “Convertible Notes”), which were issued on June 17, 2008, are within the scope of this accounting rule (see Note M). Accordingly, Interest Expense for 2008 has been restated to reflect Sotheby’s nonconvertible debt borrowing rate. Additionally, the December 31, 2008 balance of the Convertible Notes reported within Long-Term Debt was adjusted to reflect the impact of this new accounting rule. In conjunction with the adoption of this rule, management estimated that the equity and liability components of the Convertible Notes had initial fair values of $38.2 million and $161.8 million, respectively.
Prior Period Restatements Within Shareholders’ Equity—On June 30, 2006, Sotheby’s Holdings, Inc., a Michigan corporation (“Sotheby’s Michigan”), completed a reincorporation into the State of Delaware (the “Reincorporation”). The Reincorporation was completed by means of a merger of Sotheby’s Michigan with and into Sotheby’s Delaware, Inc., a Delaware corporation (“Sotheby’s Delaware”) and a wholly-owned subsidiary of Sotheby’s Michigan incorporated for the purpose of effecting the Reincorporation, with Sotheby’s Delaware being the surviving corporation. Sotheby’s Delaware was renamed “Sotheby’s” upon completion of the merger.
In conjunction with the Reincorporation, each outstanding share of Class A Limited Voting Common Stock, $0.10 par value, of Sotheby’s Michigan stock (“Sotheby’s Michigan Stock”) was converted into one share of Common Stock, $0.01 par value, of Sotheby’s Delaware stock (“Sotheby’s Delaware Stock”). As a result, holders of Sotheby’s Michigan Stock became holders of Sotheby’s Delaware Stock, and their rights as holders thereof became governed by the General Corporation Law of the State of Delaware and the Certificate of Incorporation and By-Laws of Sotheby’s Delaware.
Sotheby’s has restated its previously reported balances of Common Stock and Additional Paid-in Capital as of December 31, 2008, December 31, 2007 and January 1, 2007 to reflect the correct $0.01 per share par value of Sotheby’s Delaware Stock. Previously, Common Stock and Additional Paid-in Capital were incorrectly recorded on the basis of a $0.10 per share par value.
54
Summary of Adjustments and Restatements to Prior Period Presentation—The tables below summarize the effect of the adjustments and restatements to the prior periods, as described above, on Sotheby’s Consolidated Financial Statements (in thousands of dollars, except per share data):
| Year Ended December 31, 2008 | |||||||||||
| Statement of Operations: |
As Previously Reported |
Convertible
Debt Adjustments |
As Adjusted | ||||||||
| Interest expense | $ | (36,682 | ) | $ | (3,303 | ) | $ | (39,985 | ) | ||
| Income before taxes | $ | 48,477 | $ | (3,303 | ) | $ | 45,174 | ||||
| Income tax expense | $ | 22,347 | $ | (1,490 | ) | $ | 20,857 | ||||
| Net income | $ | 28,269 | $ | (1,813 | ) | $ | 26,456 | ||||
| Basic earnings per share—Sotheby’s common shareholders | $ | 0.44 | $ | (0.05 | ) | $ | 0.39 | ||||
| Diluted earnings per share—Sotheby’s common shareholders | $ | 0.43 | $ | (0.05 | ) | $ | 0.38 | ||||
| December 31, 2008 | |||||||||||||||
| Balance Sheet: |
As Previously Reported |
Par Value Restatement |
Convertible Debt Adjustments |
As Adjusted | |||||||||||
| Current Assets: | |||||||||||||||
|
Prepaid expenses and other current assets |
$ | 20,661 | $ | — | $ | (124 | ) | $ | 20,537 | ||||||
| Non-Current Assets: | |||||||||||||||
|
Deferred income taxes |
$ | 74,332 | $ | — | $ | (15,161 | ) | $ | 59,171 | ||||||
|
Other assets |
$ | 16,715 | $ | — | $ | (1,078 | ) | $ | 15,637 | ||||||
| Total Assets | $ | 1,679,331 | $ | — | $ | (16,363 | ) | $ | 1,662,968 | ||||||
| Long-Term Liabilities: | |||||||||||||||
|
Long-term debt |
$ | 329,267 | $ | — | $ | (34,794 | ) | $ | 294,473 | ||||||
| Total Liabilities | $ | 1,125,669 | $ | — | $ | (34,794 | ) | $ | 1,090,875 | ||||||
| Shareholders’ Equity: | |||||||||||||||
|
Common stock, $0.01 par value |
$ | 6,718 | $ | (6,046 | ) | $ | — | $ | 672 | ||||||
|
Additional paid-in capital |
272,694 | 6,046 | 20,244 | 298,984 | |||||||||||
|
Retained earnings |
325,478 | — | (1,813 | ) | 323,665 | ||||||||||
|
Accumulated other comprehensive loss |
(51,228 | ) | — | — | (51,228 | ) | |||||||||
|
Total Shareholders’ Equity |
$ | 553,662 | $ | — | $ | 18,431 | $ | 572,093 | |||||||
55
|
|
|
|
|
|
|
|
|
|
|
|
|
|
|
|
|
December 31, 2007 |
||||||||||
|
|
|
|||||||||||
|
|
|
Originally |
|
Par
Value |
|
As Adjusted |
||||||
|
|
|
|
|
|||||||||
|
|
|
(Thousand of dollars) |
||||||||||
|
Shareholders’ Equity: |
|
|
|
|
|
|
|
|
|
|
|
|
|
Common Stock, $0.01 par value |
|
$ |
6,647 |
|
|
$ |
(5,982 |
) |
|
$ |
665 |
|
|
Additional paid-in capital |
|
|
249,453 |
|
|
|
5,982 |
|
|
|
255,435 |
|
|
Retained earnings |
|
|
338,004 |
|
|
|
— |
|
|
|
338,004 |
|
|
Accumulated other comprehensive loss |
|
|
9,913 |
|
|
|
— |
|
|
|
9,913 |
|
|
|
|
|
|
|||||||||
|
Total Shareholders’ Equity |
|
$ |
604,017 |
|
|
$ |
— |
|
|
$ |
604,017 |
|
|
|
|
|
|
|||||||||
|
|
|
|
|
|
|
|
|
|
|
|
|
|
|
|
|
January 1, 2007 |
||||||||||
|
|
|
|||||||||||
|
|
|
Originally |
|
Par
Value |
|
As Adjusted |
||||||
|
|
|
|
|
|||||||||
|
|
|
(Thousand of dollars) |
||||||||||
|
Shareholders’ Equity: |
|
|
|
|
|
|
|
|
|
|
|
|
|
Common Stock, $0.01 par value |
|
$ |
6,473 |
|
|
$ |
(5,825 |
) |
|
$ |
648 |
|
|
Additional paid-in capital |
|
|
197,047 |
|
|
|
5,825 |
|
|
|
202,872 |
|
|
Retained earnings |
|
|
160,055 |
|
|
|
— |
|
|
|
160,055 |
|
|
Accumulated other comprehensive loss |
|
|
(61,888 |
) |
|
|
— |
|
|
|
(61,888 |
) |
|
|
|
|
|
|||||||||
|
Total Shareholders’ Equity |
|
$ |
301,687 |
|
|
$ |
— |
|
|
$ |
301,687 |
|
|
|
|
|
|
|||||||||
|
|
|
|
|
|
|
|
|
|
|
|
|
|
Year Ended December 31, 2008 |
||||||||||||
|
Statement of Cash Flows: |
|
As
Previously |
|
Convertible Debt |
|
As Adjusted |
||||||
|
|
|
|
|
|||||||||
|
Cash flows from operating activities |
|
|
|
|
|
|
|
|
|
|
|
|
|
Net income |
|
$ |
28,269 |
|
|
$ |
(1,813 |
) |
|
$ |
26,456 |
|
|
|
|
|
|
|
|
|
|
|
|
|
|
|
|
Adjustments to reconcile net income to net cash used by operating activities: |
|
|
|
|
|
|
|
|
|
|
|
|
|
Deferred income tax expense |
|
$ |
618 |
|
|
$ |
(1,490 |
) |
|
$ |
(872 |
) |
|
Amortization of long-term debt discount |
|
$ |
— |
|
|
$ |
3,303 |
|
|
$ |
3,303 |
|
|
Net cash used by operating activities |
|
$ |
(175,478 |
) |
|
$ |
— |
|
|
$ |
(175,478 |
) |
56
Note C—Summary of Significant Accounting Policies
Accounting Standards Codification—In June 2009, the Financial Accounting Standards Board (the “FASB”) established the FASB Accounting Standards CodificationTM (the “Codification”) as the sole source of authoritative accounting principles in conformity with generally accepted accounting principles in the United States of America (“GAAP”). The rules and interpretive releases of the Securities and Exchange Commission (the “SEC”) under authority of federal securities laws are also sources of authoritative GAAP for SEC registrants. All other non-grandfathered, non-SEC accounting literature not included in the Codification is now considered non-authoritative. As required, Sotheby’s adopted the Codification as the sole source of authoritative GAAP effective as of September 30, 2009. As the Codification is not intended to change or alter existing GAAP, its adoption did not impact Sotheby’s Consolidated Financial Statements.
Principles of Consolidation—The Consolidated Financial Statements include the accounts of Sotheby’s and its wholly-owned subsidiaries. Prior to May 12, 2008, the Consolidated Financial Statements also included the accounts of an art dealer with whom Sotheby’s had outstanding loans and to whom Sotheby’s provided management consulting services. Sotheby’s was considered to be the primary beneficiary of this entity under GAAP. The remaining loan to this entity was repaid on May 12, 2008 and Sotheby’s other existing arrangements with this entity terminated. Accordingly, this entity’s accounts were no longer included in Sotheby’s Consolidated Financial Statements subsequent to May 12, 2008. Intercompany transactions and balances have been eliminated.
Equity investments in which Sotheby’s has significant influence over the investee, but does not have control and is not the primary beneficiary, are accounted for using the equity method. Under the equity method, Sotheby’s share of investee earnings or losses is recorded, net of taxes, within Equity in Earnings of Investees in the Consolidated Statements of Operations. Additionally, Sotheby’s interest in the net assets of its equity method investees is reflected in Investments in the Consolidated Balance Sheets. (See Note H for more detailed information related to Sotheby’s equity method investments.)
Foreign Currency Translation—Assets and liabilities of Sotheby’s foreign subsidiaries are translated at year-end exchange rates. Amounts in the Statements of Operations are translated using weighted average monthly exchange rates during the year. Gains and losses resulting from translating foreign currency financial statements are recorded in the Consolidated Balance Sheets within Accumulated Other Comprehensive Income (Loss) until the subsidiary is sold or liquidated.
Cash Equivalents—As of December 31, 2009, cash equivalents consisted of investments in the highest rated overnight deposits with major banks. As of December 31, 2008, cash equivalents included liquid investments consisting of United States (“U.S.”) Treasury money market funds with original maturities of three months or less and the highest rated overnight time deposits with major banks. These investments are carried at cost, which approximates fair value.
Restricted Cash—Restricted Cash principally consists of amounts or deposits whose use is restricted by either law or contract. As of December 31, 2009 and 2008, Restricted Cash included $20.9 million and $25.4 million of net auction proceeds owed to consignors in certain non-U.S. jurisdictions.
Valuation of Art—The art market is not a highly liquid trading market. As a result, the valuation of art is inherently subjective, and the realizable value of art often fluctuates over time. Accordingly, certain amounts reported in the Consolidated Financial Statements and accompanying notes are dependent upon management’s estimates of the realizable value of art held in inventory and art pledged as collateral for Finance segment loans. In determining the realizable value of art, management relies on the opinions of Sotheby’s specialists, who consider the following complex array of factors when valuing art: (i) whether the artwork is expected to be offered at auction or sold privately; (ii) the current and expected future demand for works of art, taking into account economic conditions and changing trends in the art market as to which collecting categories and artists are most sought after; and (iii) recent sale prices achieved in the art market for comparable works of art within a particular collecting category and/or by a particular artist. Due to the inherent subjectivity involved in estimating the realizable value of art, management’s judgments about the realizable value of art held in inventory and the realizable value of art pledged as collateral for Finance segment loans may prove, with the benefit of hindsight, to be inaccurate. (See below for a more detailed discussion of Sotheby’s accounting policies with respect to Notes Receivable and Inventory.)
Accounts Receivable and Allowance for Doubtful Accounts—In its role as auctioneer, Sotheby’s represents sellers of artworks accepting property on consignment and matches sellers to buyers through the auction process. Sotheby’s invoices the buyer for the purchase price of the property (including the commission owed by the buyer), collects payment from the buyer and remits to the seller the net sale proceeds after deducting its commissions, expenses, applicable taxes and royalties. The amounts billed to buyers are recorded as Accounts Receivable in the Consolidated Balance Sheets. Under the standard terms and conditions of its auction sales, Sotheby’s is not obligated to pay sellers for property that has not been paid for by buyers. However, at times, Sotheby’s pays the seller before payment is collected from the buyer and / or allows the buyer to take possession of the property before payment is made. In these situations, Sotheby’s is liable to the seller for the net sale proceeds whether or not the buyer makes payment. The Allowance for Doubtful Accounts includes management’s estimate of probable losses related to such situations, as well as an estimate of probable losses inherent in the remainder of the accounts receivable balance. The amount of the required allowance is based on the facts available to management, including the value of any property held as collateral, and is reevaluated and adjusted as additional information is received. Based on available information, management believes that the allowance for doubtful accounts as of December 31, 2009 is adequate to cover uncollectible balances. However, actual losses related to uncollected debts may ultimately exceed the recorded allowance. (See Note F for more detailed information related to Accounts Receivable.)
57
Notes Receivable and Allowance for Credit Losses—Through its Finance segment, Sotheby’s provides certain collectors and art dealers with financing, generally secured by works of art that it either has in its possession or permits borrowers to possess. Management evaluates its allowance for credit losses regularly and also evaluates specific loans when it becomes aware of a situation where a borrower may not be able to repay the loan. The amount of the required allowance is based on the facts available to management and is reevaluated and adjusted as additional information is received. Secured loans that may not be collectible are analyzed based on the estimated realizable value of the collateral securing each loan, as well as the ability of the borrower to repay any shortfall in the value of the collateral when compared to the amount of the loan. An allowance is established for secured loans that management believes are under-collateralized, and with respect to which the under-collateralized amount may not be collectible from the borrower. Unsecured loans are analyzed based on management’s estimate of the collectability of each loan, taking into account the ability of the borrower to repay the loan. An allowance is also established for probable losses inherent in the remainder of the loan portfolio based on historical data related to loan losses. (See Note F for more detailed information related to Notes Receivable.)
Inventory—Inventory is valued on a specific identification basis at the lower of cost or management’s estimate of realizable value. Management expects that the items held in Inventory will be sold or otherwise disposed of during the course of the normal operating cycle for works of art. If management determines that the estimated realizable value of a specific artwork held in inventory is less than its carrying value, a loss is recorded to reduce the carrying value of the artwork to management’s estimate of realizable value. Any losses related to Auction segment Inventory are recorded within Auction and Related Revenues and any losses related to Dealer segment Inventory are recorded within Dealer Cost of Sales. (See Note G for more detailed information related to Inventory.)
Fixed Assets—Fixed Assets are stated at cost less accumulated depreciation and amortization. Depreciation is calculated using the straight-line method over the estimated useful lives of the assets. Leasehold improvements are amortized using the straight-line method over the lesser of the life of the related lease or the estimated useful life of the improvement. Computer software consists of the capitalized cost of purchased computer software, as well as direct external and internal computer software development costs incurred in the acquisition or development of software for internal use. These costs are amortized on a straight-line basis over the estimated useful life of the software. (See Note I for more detailed information related to Fixed Assets.)
Goodwill—Goodwill represents the excess of the purchase price paid over the fair value of net assets acquired in a business combination. Goodwill is not amortized, but it is tested annually for impairment at the reporting unit level as of October 31 and between annual tests if indicators of potential impairment exist. These indicators could include a decline in Sotheby’s stock price and market capitalization, a significant change in the outlook for the reporting unit’s business, legal factors, lower than expected operating results, increased competition, or the sale or disposition of a significant portion of a reporting unit. An impairment loss is recognized for any amount by which the carrying amount of a reporting unit’s goodwill exceeds its fair value. The fair value of a reporting unit is estimated by management using a discounted cash flow methodology. (See Note J for more detailed information related to Goodwill.)
Intangible Assets—Intangible assets are amortized over their estimated useful lives unless such lives are deemed indefinite. If indicators of potential impairment exist, intangible assets with defined useful lives are tested for impairment based on management’s estimates of undiscounted cash flows and, if impaired, written down to fair value based on either discounted cash flows or appraised values. Factors that could lead to the impairment of intangible assets include a significant adverse change in the business climate and declines in the financial condition of operations related to the intangible asset. Intangible assets with indefinite lives are tested annually for impairment as of October 31 and written down to fair value as required. (See Note K for more detailed information related to Intangible Assets.)
Impairment of Long-Lived Assets—Long-lived assets are reviewed for impairment whenever events or changes in circumstances indicate that the carrying amount of the asset may not be recoverable. In such situations, long-lived assets are considered impaired when estimated future cash flows (undiscounted and without interest charges) resulting from the use of the asset and its eventual disposition are less than the asset’s carrying amount. In such situations, the asset is written down to the present value of the estimated future cash flows. Factors that are considered when evaluating long-lived assets for impairment include a current expectation that it is more likely than not that the long-lived asset will be sold significantly before the end of its useful life, a significant decrease in the market price of the long-lived asset and a significant change in the extent or manner in which the long-lived asset is being used.
Valuation of Deferred Tax Assets—A valuation allowance is recorded to reduce Sotheby’s deferred tax assets to the amount that is more likely than not to be realized. In assessing the need for the valuation allowance, management considers, among other
58
things, its projections of future taxable income and ongoing prudent and feasible tax planning strategies. (See Note N for more detailed information related to Income Taxes.)
Auction Guarantees—The liability related to auction guarantees represents the estimated fair value of Sotheby’s obligation to perform under its auction guarantees and is recorded within Accounts Payable and Accrued Liabilities in the Consolidated Balance Sheets. The fair value of the auction guarantee liability is estimated by management based on an analysis of historical loss experience related to auction guarantees. (See Note T for more detailed information related to Auction Guarantees.)
Financial Instruments—Sotheby’s financial instruments include Cash and Cash Equivalents, Restricted Cash, Notes Receivable, the Deferred Compensation Liability, the Trust Assets related to the Deferred Compensation Liability, Long-Term Debt and forward exchange contracts. The carrying amounts of Cash and Cash Equivalents, Restricted Cash and Notes Receivable do not materially differ from their estimated fair values due to their nature and the variable interest rates associated with each of these financial instruments. (See Notes M, R and V for information on the fair value of financial instruments.)
Derivative Financial Instruments—Sotheby’s utilizes forward exchange contracts and, to a much lesser extent, foreign currency option contracts to hedge cash flow exposures related to foreign currency exchange rate movements. Sotheby’s derivative financial instruments are not designated as hedging instruments under GAAP and are recorded in the Consolidated Balance Sheets at their fair values. Changes in the fair value of Sotheby’s derivative financial instruments are recognized in the Consolidated Statements of Operations within Other Income (Expense). (See Note V for more detailed information on derivative financial instruments.)
Revenue Recognition (Auction and Related Revenues)—Sotheby’s principally functions as an agent offering authenticated works of art for sale at auction. In addition, Sotheby’s provides a number of related services including the brokering of private sales of artwork. Sotheby’s principal role as an auctioneer or broker is to identify, evaluate and appraise works of art through its international staff of experts; to stimulate buyer interest through professional marketing techniques; and to match sellers and buyers. The evaluation and appraisal of works of art by Sotheby’s experts involves significant presale due diligence activities to authenticate and determine the ownership history of the property being sold. The principal components of Auction and Related Revenues are: (1) auction commission revenue, (2) private sale commissions and (3) principal activities. The revenue recognition policy for each of these is described below.
(1) Auction Commission Revenue—In its role as auctioneer, Sotheby’s represents sellers of artworks accepting property on consignment and matches sellers to buyers through the auction process. Sotheby’s invoices the buyer for the purchase price of the property (including the commission owed by the buyer), collects payment from the buyer and remits to the seller the net sale proceeds after deducting its commissions, expenses and applicable taxes and royalties. Sotheby’s commissions include those paid by the buyer (“buyer’s premium”) and those paid by the seller (“seller’s commission”) (collectively, “auction commission revenue”), both of which are calculated as a percentage of the hammer price of the property sold at auction.
On the fall of the auctioneer’s hammer, the highest bidder becomes legally obligated to pay the full purchase price, which includes the hammer price of the property purchased plus the buyer’s premium, and the seller is legally obligated to relinquish the property in exchange for the hammer price less any seller’s commissions. Auction commission revenue is recognized at the time of the auction sale (i.e., when the auctioneer’s hammer falls), which is the point in time when Sotheby’s has substantially accomplished what it must do to be entitled to the benefits represented by the auction commission revenue. Subsequent to the date of the auction sale, Sotheby’s remaining activities relate only to the collection of the purchase price from the buyer and the remittance of the net sale proceeds to the seller. These remaining service obligations are not an essential part of the auction services provided by Sotheby’s. Management continually evaluates the collectability of amounts due from buyers and only recognizes auction commission revenue to the extent that it is probable that the buyer will be able to meet its financial obligations to Sotheby’s.
Auction commission revenue is recorded net of commissions owed to third parties. Commissions owed to third parties are principally the result of situations when auction commissions are shared with consignors or with Sotheby’s partners in auction guarantees. Additionally, in certain situations, commissions are shared with third parties who introduce Sotheby’s to consignors who sell property at auction.
(2) Private Sale Commissions—Private sale commissions are earned through the direct brokering of purchases and sales of art. Similar to auction sales, the principal service that Sotheby’s provides in a private sale transaction is the matching of the seller to a buyer. Private sales are initiated either by a client wishing to sell property with Sotheby’s acting as its exclusive agent in the transaction or a prospective buyer who is interested in purchasing a certain work of art privately. Such arrangements are evidenced by a legally binding agreement between Sotheby’s and the seller (a “Seller Agreement”), which outlines the terms of the arrangement including the desired sale price and the amount or rate of commission to be earned. In certain situations, Sotheby’s also executes a legally binding agreement with the buyer stipulating the terms of the transaction (a “Buyer Agreement”).
The timing of revenue recognition for private sale commissions is evaluated on a case-by-case basis and in large part is dependent upon whether an executed Buyer Agreement is in place. Additionally, a careful analysis of the individual facts and
59
circumstances is performed for each transaction to fully understand Sotheby’s obligations and performance requirements related to the transaction.
In transactions with a Buyer Agreement, Sotheby’s services are performed on the date that the Buyer Agreement is executed. At this point, any remaining service obligations are inconsequential and perfunctory. Such remaining service obligations normally relate only to the collection of the purchase price from the buyer and the remittance of the net sale proceeds to the seller. These remaining service obligations are not an essential part of the services that Sotheby’s provides in a private sale transaction. In the absence of an executed Buyer Agreement, revenue recognition is deferred until Sotheby’s has performed its substantive service obligations in the transaction, the buyer has paid the full purchase price evidencing the terms of the arrangement and the exchange between the buyer and the seller has occurred.
(3) Principal Activities—Principal activities consist mainly of gains and losses related to auction guarantees including: (i) any share of overage or shortfall recognized when the guaranteed property is offered or sold at auction, (ii) any subsequent writedowns to the carrying value of guaranteed property that initially failed to sell at auction and (iii) any subsequent recoveries and losses on the sale of guaranteed property that initially failed to sell at auction.
The overage or shortfall related to guaranteed property is generally recognized in the period in which the property is offered at auction. However, a shortfall is recognized prior to the date of the auction if management determines that a loss related to an auction guarantee is probable. In such situations, the amount of the loss is estimated by management based on the difference between the amount of the auction guarantee and the expected selling price of the property, including buyer’s premium.
Writedowns to the carrying value of previously guaranteed property that is held in inventory by Sotheby’s are recognized in the period in which management determines that an unrecoverable decline in the estimated realizable value of the property has occurred. Recoveries or losses resulting from the subsequent sale of previously guaranteed property are recognized in the period in which the sale is completed, title to the property passes to the purchaser and Sotheby’s has fulfilled its obligations with respect to the transaction. The amount of any such recovery or loss, which is recorded on a net basis within Auction and Related Revenues, is calculated as the difference between the proceeds received from the subsequent sale and the carrying value of the property held in inventory.
Revenue Recognition (Finance Revenues)—Finance revenues consist principally of interest income earned on Notes Receivable. Such interest income is recognized when earned, based on the amount of the outstanding loan and the length of time the loan is outstanding during the period. Where there is doubt regarding ultimate collectability of the principal for impaired loans, interest income is no longer recognized and any cash receipts subsequently received are thereafter directly applied to reduce the recorded investment in the loan.
Revenue Recognition (Dealer Revenues)—Dealer revenues consist principally of proceeds from the sale of Dealer segment inventory and are recognized in the period in which the sale is completed, title to the property passes to the purchaser and Sotheby’s has fulfilled its obligations with respect to the transaction. The carrying value of Dealer Inventory sold during a period is recorded within Dealer Cost of Sales.
Sales, Use and Value Added Taxes—Sales, use and value added taxes assessed by governmental authorities that are both imposed on and concurrent with revenue-producing transactions between Sotheby’s and its clients are reported on a net basis within revenues.
Direct Costs of Services—Direct costs of services, which consist largely of sale specific marketing costs such as auction catalogue production and distribution expenses and sale advertising and promotion expenses, are expensed in the period of the corresponding auction sale. Also included in direct costs of services are sale-related shipping expenses, which are expensed when incurred.
Share-Based Payments—Sotheby’s grants share-based payment awards as compensation to certain employees. Compensation expense recognized for share-based payments is dependent upon the valuation of the underlying award. Inherent in this valuation are assumptions, including management’s estimates of future earnings, employee forfeitures, the expected life of the award, the expected volatility of Sotheby’s stock price and dividend yield. In developing these assumptions, management considers historical data, current market conditions and other relevant data.
Compensation expense related to share-based payments is amortized according to a graded vesting schedule over the corresponding employee service period. Compensation expense is also recognized for the value of certain share-based payment awards that are contractually guaranteed according to the terms of certain employment arrangements. The guaranteed value of such awards is amortized over the corresponding employee service period, which begins on the effective date of the employment arrangement and ends on the final legal vesting date of the award.
60
Certain share-based payment awards only vest if Sotheby’s achieves predetermined profitability targets. Compensation expense related to such share-based payments is recognized only if management determines that it is probable that the relevant profitability targets will be met.
(See Note Q for more detailed information related to share-based payments.)
Comprehensive Income (Loss)—Comprehensive Income (Loss) reflects the net income (loss) for the period, as well as Other Comprehensive Income (Loss), and is reported in the Consolidated Statements of Changes in Shareholders’ Equity. Other Comprehensive Income (Loss) principally includes unrealized gains and losses related to Sotheby’s defined benefit pension plans, as well as the change in the foreign currency translation adjustment account during the period. Such amounts are reported on a cumulative basis in Accumulated Other Comprehensive Income (Loss) in the Consolidated Balance Sheets. Unrealized gains or losses recognized in Accumulated Other Comprehensive Income (Loss) related to Sotheby’s defined benefit plans are adjusted as they are subsequently recognized as components of net pension cost.
Use of Estimates—The preparation of financial statements in conformity with accounting principles generally accepted in the U.S. requires management to make estimates and assumptions that affect the reported amounts of assets and liabilities and the disclosure of contingent assets and liabilities at the date of the financial statements, as well as the reported amounts of revenues and expenses during the reporting period. Actual results could differ materially from those estimates and could change in the short-term.
Note D—Earnings (Loss) Per Share
Basic earnings (loss) per share—Basic earnings (loss) per share attributable to Sotheby’s common shareholders is computed under the two-class method using the weighted average number of common shares outstanding during the period. Net income attributable to participating securities is deducted from consolidated net income in the computation of basic earnings per share. In periods with a net loss, the net loss attributable to participating securities is excluded from the computation of basic loss per share. Participating securities include unvested restricted stock and unvested restricted stock units, which have nonforfeitable rights to dividends.
Diluted earnings (loss) per share—Diluted earnings (loss) per share attributable to Sotheby’s common shareholders is computed in a similar manner to basic (loss) earnings per share under the two-class method, using the weighted average number of common shares outstanding during the period and, if dilutive, potential common shares outstanding during the period. Potential common shares consist of unvested restricted stock, unvested restricted stock units, incremental common shares issuable upon the exercise of stock options and deferred stock units issued pursuant to the Sotheby’s Stock Compensation Plan for Non-Employee Directors. The number of such potential common shares included in the computation of diluted earnings per share is determined using the treasury stock method. Additionally, in periods with a net loss, the net loss attributable to participating securities is excluded from the computation of diluted loss per share.
In 2009 and 2008, 3.4 million and 1.2 million shares of potentially dilutive common shares, respectively, were excluded from the computation of diluted earnings per share because their inclusion would have been anti-dilutive.
61
The following table sets forth the computation of basic and diluted (loss) earnings per share for 2009, 2008 and 2007 (in thousands of dollars, except per share amounts):
|
|
|
|
|
|
|
|
|
|
|
|
|
|
|
|
|
Years Ended December 31, |
||||||||||
|
|
|
|||||||||||
|
|
|
2009 |
|
2008 |
|
2007 |
||||||
|
|
|
|
|
|||||||||
|
Basic: |
|
|
|
|
|
|
|
|
|
|
|
|
|
Numerator: |
|
|
|
|
|
|
|
|
|
|
|
|
|
Net (loss) income attributable to Sotheby’s |
|
$ |
(6,528 |
) |
|
$ |
26,456 |
|
|
$ |
213,139 |
|
|
Less: Net income attributable to participating securities |
|
|
— |
|
* |
|
1,570 |
|
|
|
7,449 |
|
|
|
|
|
|
|||||||||
|
Net (loss) income attributable to Sotheby’s common shareholders |
|
$ |
(6,528 |
) |
|
$ |
24,886 |
|
|
$ |
205,690 |
|
|
|
|
|
|
|||||||||
|
|
|
|
|
|
|
|
|
|
|
|
|
|
|
Denominator: |
|
|
|
|
|
|
|
|
|
|
|
|
|
Weighted average common shares outstanding |
|
|
65,208 |
|
|
|
64,630 |
|
|
|
63,800 |
|
|
|
|
|
|
|||||||||
|
Basic (loss) earnings per share - Sotheby’s common shareholders |
|
$ |
(0.10 |
) |
|
$ |
0.39 |
|
|
$ |
3.22 |
|
|
|
|
|
|
|||||||||
|
|
|
|
|
|
|
|
|
|
|
|
|
|
|
Diluted: |
|
|
|
|
|
|
|
|
|
|
|
|
|
Numerator: |
|
|
|
|
|
|
|
|
|
|
|
|
|
Net (loss) income attributable to Sotheby’s |
|
$ |
(6,528 |
) |
|
$ |
26,456 |
|
|
$ |
213,139 |
|
|
Less: Net income attributable to participating securities |
|
|
— |
|
* |
|
1,570 |
|
|
|
7,393 |
|
|
|
|
|
|
|||||||||
|
Net (loss) income attributable to Sotheby’s common shareholders |
|
$ |
(6,528 |
) |
|
$ |
24,886 |
|
|
$ |
205,749 |
|
|
|
|
|
|
|||||||||
|
|
|
|
|
|
|
|
|
|
|
|
|
|
|
Denominator: |
|
|
|
|
|
|
|
|
|
|
|
|
|
Weighted average common shares outstanding |
|
|
65,208 |
|
|
|
64,630 |
|
|
|
63,800 |
|
|
Weighted average dilutive potential common shares outstanding |
|
|
— |
|
|
|
291 |
|
|
|
589 |
|
|
|
|
|
|
|||||||||
|
Denominator for calculation of diluted earnings (loss) per share |
|
|
65,208 |
|
|
|
64,921 |
|
|
|
64,389 |
|
|
|
|
|
|
|||||||||
|
Diluted (loss) earnings per share - Sotheby’s common shareholders |
|
$ |
(0.10 |
) |
|
$ |
0.38 |
|
|
$ |
3.20 |
|
|
|
|
|
|
|||||||||
|
||||||||||||
|
|
|
|
* |
In periods with a net loss, the amount of the net loss attributable to participating securities is excluded from the computation of basic and diluted loss per share. |
62
As discussed in Note B, the presentation of basic and diluted earnings per share for 2008 and 2007 has been retroactively adjusted as a result of the adoption on January 1, 2009 of a new accounting rule, which clarified that share-based payments with nonforfeitable rights to dividends should be considered participating securities in the computation of earnings (loss) per share. The following table summarizes the impact of adopting this new accounting rule on basic and diluted earnings per share for 2008 and 2007:
|
|
|
|
|
|
|
|
|
||
|
|
|
2008 |
|
2007 |
|
||||
|
|
|
|
|
||||||
|
Basic earnings per share - Sotheby’s common shareholders: |
|
|
|
|
|
|
|
|
|
|
As reported |
|
$ |
0.44 |
|
|
$ |
3.34 |
|
|
|
As computed under the two-class method |
|
$ |
0.39 |
|
|
$ |
3.22 |
|
|
|
Diluted earnings per share - Sotheby’s common shareholders: |
|
|
|
|
|
|
|
|
|
|
As reported |
|
$ |
0.43 |
|
|
$ |
3.25 |
|
|
|
As computed under the two-class method |
|
$ |
0.38 |
|
|
$ |
3.20 |
|
|
|
|
|
|
Note: The adjusted basic and diluted earnings per share amounts for 2008 in the table above reflect the impact of adopting the new accounting rule relating to the computation of earnings (loss) per share, as well as the impact of adopting the new accounting rule for convertible debt instruments (see Note B). |
|
Note E—Segment Reporting
Sotheby’s operations are organized under three segments—Auction, Finance and Dealer. Each segment is a business unit that offers different services and requires different resources and strategies. Sotheby’s chief operating decision making group, which is comprised of its Chief Executive Officer, the Chief Financial Officer, the Chief Operating Officer and certain other senior executives, regularly evaluates financial information about each segment in deciding how to allocate resources and in assessing performance. The performance of each segment is measured based on its profit or loss from operations before taxes, excluding the unallocated items highlighted below in the reconciliation of segment income before taxes to income before taxes.
The Auction segment functions principally as an agent offering authenticated works of art for sale at auction. In addition, the Auction segment provides a number of related services including the brokering of private sales of artwork. Sotheby’s principal role as an auctioneer or broker is to identify, evaluate and appraise works of art through its international staff of experts; to stimulate buyer interest through professional marketing techniques; and to match sellers and buyers. The evaluation and appraisal of works of art by Sotheby’s experts involves significant presale due diligence activities to authenticate and determine the ownership history of the property being sold.
The Finance segment provides certain collectors and art dealers with financing, generally secured by works of art that Sotheby’s either has in its possession or permits borrowers to possess. The Dealer segment’s activities principally include the activities of Noortman Master Paintings (or “NMP”), an art dealer specializing in Dutch and Flemish Old Master Paintings, as well as French Impressionist and Post-Impressionist paintings. As an art dealer, NMP sells works of art directly to private collectors and museums and, from time-to-time, acts as a broker in private purchases and sales of art. To a lesser extent, Dealer segment activities also include the investment in and resale of artworks directly by Sotheby’s and the activities of certain equity investees, including Acquavella Modern Art (or “AMA”) (see Note H). All Other primarily includes the results of Sotheby’s licensing activities and other ancillary businesses.
The accounting policies of Sotheby’s segments are the same as those described in the summary of significant accounting policies (see Note C). Auction segment revenues are generally attributed to geographic areas based on the location of the actual sale. Dealer segment revenues are generally attributed to geographic areas based on the location of the entity that holds legal title to the property sold. Finance segment revenues are attributed to geographic areas based on the location of the entity that originated the loan.
In the first quarter of 2009, management changed the methodology by which it allocates the intercompany cost of borrowing charged by the Auction segment to the Finance segment. Finance segment results for 2009 reflect a higher level of profitability when compared to 2008 and 2007, primarily as a result of this change in methodology, as well as lower costs incurred to fund the loan portfolio as a result of lower benchmark interest rates.
63
The following tables present Sotheby’s segment information for 2009, 2008 and 2007:
|
|
|
|
|
|
|
|
|
|
|
|
|
|
|
|
|
|
|
|
|
|
|
|
|
|
|
|
Year ended December 31, 2009 |
|
Auction |
|
Finance |
|
Dealer* |
|
All Other |
|
Reconciling |
|
Total |
|
||||||||||||
|
|
|
|
|
|
|
|
|||||||||||||||||||
|
|
|
(Thousands of dollars) |
|
||||||||||||||||||||||
|
Revenues |
|
$ |
448,768 |
|
|
$ |
12,671 |
|
|
$ |
22,339 |
|
|
$ |
4,778 |
|
|
$ |
(3,598 |
) |
|
$ |
484,958 |
|
|
|
Interest income |
|
$ |
5,952 |
|
|
$ |
— |
|
|
$ |
— |
|
|
$ |
1 |
|
|
$ |
(596 |
) |
|
$ |
5,357 |
|
|
|
Interest expense |
|
$ |
45,616 |
|
|
$ |
— |
|
|
$ |
92 |
|
|
$ |
— |
|
|
$ |
— |
|
|
$ |
45,708 |
|
|
|
Depreciation and amortization |
|
$ |
18,594 |
|
|
$ |
140 |
|
|
$ |
2,810 |
|
|
$ |
16 |
|
|
$ |
— |
|
|
$ |
21,560 |
|
|
|
Segment income (loss) before taxes |
|
$ |
15,427 |
|
|
$ |
7,244 |
|
|
$ |
(10,359 |
) |
|
$ |
2,413 |
|
|
$ |
670 |
|
|
$ |
15,395 |
|
|
|
Year ended December 31, 2008 |
|
|
|
|
|
|
|
|
|
|
|
|
|
|
|
|
|
|
|
|
|
|
|
|
|
|
Revenues |
|
$ |
616,625 |
|
|
$ |
17,496 |
|
|
$ |
55,596 |
|
|
$ |
5,155 |
|
|
$ |
(3,313 |
) |
|
$ |
691,559 |
|
|
|
Interest income |
|
$ |
14,205 |
|
|
$ |
(9 |
) |
|
$ |
— |
|
|
$ |
2 |
|
|
$ |
(5,865 |
) |
|
$ |
8,333 |
|
|
|
Interest expense |
|
$ |
39,512 |
|
|
$ |
— |
|
|
$ |
473 |
|
|
$ |
— |
|
|
$ |
— |
|
|
$ |
39,985 |
|
|
|
Depreciation and amortization |
|
$ |
22,679 |
|
|
$ |
178 |
|
|
$ |
1,967 |
|
|
$ |
21 |
|
|
$ |
— |
|
|
$ |
24,845 |
|
|
|
Segment income (loss) before taxes |
|
$ |
47,280 |
|
|
$ |
4,920 |
|
|
$ |
(28,149 |
) |
|
$ |
1,264 |
|
|
$ |
19,859 |
|
|
$ |
45,174 |
|
|
|
Year ended December 31, 2007 |
|
|
|
|
|
|
|
|
|
|
|
|
|
|
|
|
|
|
|
|
|
|
|
|
|
|
Revenues |
|
$ |
833,128 |
|
|
$ |
19,129 |
|
|
$ |
62,766 |
|
|
$ |
4,803 |
|
|
$ |
(2,104 |
) |
|
$ |
917,722 |
|
|
|
Interest income |
|
$ |
23,745 |
|
|
$ |
1 |
|
|
$ |
— |
|
|
$ |
321 |
|
|
$ |
(9,611 |
) |
|
$ |
14,456 |
|
|
|
Interest expense |
|
$ |
26,799 |
|
|
$ |
— |
|
|
$ |
802 |
|
|
$ |
80 |
|
|
$ |
941 |
|
|
$ |
28,622 |
|
|
|
Depreciation and amortization |
|
$ |
19,898 |
|
|
$ |
220 |
|
|
$ |
1,968 |
|
|
$ |
15 |
|
|
$ |
— |
|
|
$ |
22,101 |
|
|
|
Segment income (loss) before taxes |
|
$ |
268,351 |
|
|
$ |
4,198 |
|
|
$ |
(9,940 |
) |
|
$ |
1,020 |
|
|
$ |
19,390 |
|
|
$ |
283,019 |
|
|
|
|
|
|
|
|
|
|
||
|
|
|
|
|
|
* |
|
Dealer segment results in 2008 and 2007 include impairment losses of $13.2 million and $15 million, respectively related to NMP’s Goodwill and Intangible Assets (see Notes J and K). |
|
|
|
|
|
|
|
** |
|
The reconciling items related to Revenues and Interest Income represent charges between the Finance and Auction segments for client loans. Such charges are eliminated in consolidation. The reconciling items related to segment income before taxes are explained in the table below, which presents segment income before taxes, as well as a reconciliation of segment income before taxes to Income Before Taxes reported in the Consolidated Statements of Operations for 2009, 2008 and 2007. |
|
|
|
|
|
|
|
|
|
|
|
|
|
|
|
|
|
|
|
2009 |
|
2008 |
|
2007 |
|
||||||
|
|
|
|
|
|
|||||||||
|
|
|
(Thousands of dollars) |
|
||||||||||
|
Auction |
|
$ |
15,427 |
|
|
$ |
47,280 |
|
|
$ |
268,351 |
|
|
|
Finance |
|
|
7,244 |
|
|
|
4,920 |
|
|
|
4,198 |
|
|
|
Dealer |
|
|
(10,359 |
) |
|
|
(28,149 |
) |
|
|
(9,940 |
) |
|
|
All Other |
|
|
2,413 |
|
|
|
1,264 |
|
|
|
1,020 |
|
|
|
|
|
|
|
|
|||||||||
|
Segment income before taxes |
|
|
14,725 |
|
|
|
25,315 |
|
|
|
263,629 |
|
|
|
Unallocated amounts and reconciling items: |
|
|
|
|
|
|
|
|
|
|
|
|
|
|
Insurance recovery (see Note J) * |
|
|
— |
|
|
|
— |
|
|
|
20,000 |
|
|
|
Gain on sale of land and buildings (see Note I) |
|
|
— |
|
|
|
— |
|
|
|
4,752 |
|
|
|
Extinguishment of debt, net (see Note M) |
|
|
1,039 |
|
|
|
5,364 |
|
|
|
— |
|
|
|
Antitrust related matters, net (see Note U) |
|
|
— |
|
|
|
18,385 |
|
|
|
(1,042 |
) |
|
|
Equity in earnings of investees ** |
|
|
(369 |
) |
|
|
(3,890 |
) |
|
|
(4,320 |
) |
|
|
|
|
|
|
|
|||||||||
|
Income before taxes |
|
$ |
15,395 |
|
|
$ |
45,174 |
|
|
$ |
283,019 |
|
|
|
|
|
|
|
|
|||||||||
|
|
|
|
|
|
|
|
||
|
* |
|
In conjunction with the acquisition of Noortman Master Paintings, Sotheby’s purchased a key man life insurance policy of $20 million covering Robert C. Noortman, who was the Managing Director of NMP. Mr. Noortman died unexpectedly on January 14, 2007. As a result of Mr. Noortman’s death, Sotheby’s became entitled to the $20 million death benefit under the policy and, accordingly, recorded this amount as non-operating income in its Consolidated Statement of Operations in the first quarter of 2007. |
|
|
|
|
|
|
|
** |
|
Represents Sotheby’s pre-tax share of earnings related to its equity investees. Such amounts are included above in Dealer segment loss, but are presented net of taxes in the Consolidated Statements of Operations below Income Before Taxes. |
|
64
The table below presents geographic information about Sotheby’s revenues for 2009, 2008 and 2007:
|
|
|
|
|
|
|
|
|
|
|
|
|
|
|
|
|
|
2009 |
|
2008 |
|
2007 |
|
||||||
|
|
|
|
|
|
|||||||||
|
|
|
(Thousands of dollars) |
|
||||||||||
|
United States |
|
$ |
203,092 |
|
|
$ |
227,603 |
|
|
$ |
371,514 |
|
|
|
United Kingdom |
|
|
145,301 |
|
|
|
296,657 |
|
|
|
352,458 |
|
|
|
China |
|
|
50,061 |
|
|
|
52,331 |
|
|
|
59,550 |
|
|
|
France |
|
|
29,217 |
|
|
|
41,582 |
|
|
|
30,803 |
|
|
|
Other Countries * |
|
|
60,885 |
|
|
|
76,699 |
|
|
|
105,501 |
|
|
|
Reconciling item: |
|
|
|
|
|
|
|
|
|
|
|
|
|
|
Intercompany revenue earned by Finance from Auction |
|
|
(3,598 |
) |
|
|
(3,313 |
) |
|
|
(2,104 |
) |
|
|
|
|
|
|
|
|||||||||
|
Total |
|
$ |
484,958 |
|
|
$ |
691,559 |
|
|
$ |
917,722 |
|
|
|
|
|
|
|
|
|||||||||
| * No other individual country exceeds 5% of total revenues for any of the periods presented. | |||||||||||||
The table below presents assets for Sotheby’s segments, as well as a reconciliation of segment assets to consolidated assets as of December 31, 2009 and 2008:
|
|
|
|
|
|
|
|
|
|
|
|
|
|
2009 |
|
2008 |
|
||||
|
|
|
|
|
||||||
|
|
|
(Thousands of dollars) |
|
||||||
|
Auction |
|
$ |
1,244,210 |
|
|
$ |
1,257,266 |
|
|
|
Finance |
|
|
161,510 |
|
|
|
182,976 |
|
|
|
Dealer |
|
|
112,692 |
|
|
|
119,320 |
|
|
|
All Other |
|
|
103 |
|
|
|
153 |
|
|
|
|
|
|
|
||||||
|
Total segment assets |
|
|
1,518,515 |
|
|
|
1,559,715 |
|
|
|
Unallocated amounts: |
|
|
|
|
|
|
|
|
|
|
Deferred tax asset and income tax receivable |
|
|
67,608 |
|
|
|
103,253 |
|
|
|
|
|
|
|
||||||
|
Consolidated assets |
|
$ |
1,586,123 |
|
|
$ |
1,662,968 |
|
|
|
|
|
|
|
||||||
Note F—Receivables
Accounts Receivable—In its role as auctioneer, Sotheby’s represents sellers of artworks accepting property on consignment and matching sellers to buyers through the auction process. Sotheby’s invoices the buyer for the purchase price of the property (including the commission owed by the buyer), collects payment from the buyer and remits to the seller the net sale proceeds after deducting its commissions, expenses, applicable taxes and royalties. The amounts billed to buyers are recorded as Accounts Receivable in the Consolidated Balance Sheets.
Under Sotheby’s standard payment terms, payments from buyers are due no more than 30 days from the sale date and consignor payments are made 35 days from the sale date. However, for specific collecting categories, extended payment terms are provided to buyers who are well-known to Sotheby’s in order to support and market a sale. Such terms typically extend the payment due date from 30 days to a date that is no greater than one year from the sale date. When providing extended payment terms, Sotheby’s attempts to match the timing of receipt from the buyer with payment to the consignor, but is not always successful in doing so.
Under the standard terms and conditions of its auction sales, Sotheby’s is not obligated to pay sellers for property that has not been paid for by buyers. If a buyer defaults on payment, the sale may be cancelled and the property will be returned to the consignor. Alternatively, the consignor may reoffer the property at a future auction or negotiate a private sale. However, at times, Sotheby’s pays the consignor before payment is collected from the buyer and/or allows the buyer to take possession of the property before payment is made. In these situations, Sotheby’s is liable to the seller for the net sale proceeds whether or not the buyer makes payment. As of December 31, 2009, net Accounts Receivable of $373.7 million includes $67.9 million related to transactions in which Sotheby’s has allowed the buyer to take possession of the property before payment is made. Included in this amount is $21.2 million related to transactions when Sotheby’s has paid the consignor before payment is collected from the buyer in addition to allowing the buyer to take possession of the property.
65
As of December 31, 2009, Accounts Receivable includes an overdue amount of approximately $5 million owed by one buyer in a situation when Sotheby’s has paid the consignors. Management believes it is reasonably possible that this amount will not be paid, but the amount of any possible loss could be partially mitigated by the future sale of collateral valued between approximately $2 million and $3 million. Accordingly, management believes it is reasonably possible that Sotheby’s may incur a loss between $2 million and $3 million related to this overdue receivable. As of December 31, 2009, Sotheby’s has not recorded an allowance for doubtful accounts against this receivable balance.
Management believes that adequate allowances have been established to provide for potential losses on any uncollected amounts.
Notes Receivable—The Finance segment provides certain collectors and art dealers with financing, generally secured by works of art that Sotheby’s either has in its possession or permits borrowers to possess. The Finance segment’s loans are predominantly variable interest rate loans. Accordingly, the carrying value of these loans approximates fair value.
The Finance segment generally makes two types of secured loans: (1) advances secured by consigned property to borrowers who are contractually committed, in the near term, to sell the property at auction (a “consignor advance”); and (2) general purpose term loans secured by property not presently intended for sale (a “term loan”). A consignor advance allows a seller to receive funds upon consignment for an auction that will occur up to one year in the future, while preserving for the benefit of the seller the potential of the auction process. Term loans allow Sotheby’s to establish or enhance mutually beneficial relationships with borrowers and are intended to generate future auction consignments, though they might not always do so. Secured loans are made with full recourse against the borrower. The collection of the secured loans made by Sotheby’s can be adversely impacted by a decline in the art market in general or in the value of the particular collateral. In addition, in situations where a borrower becomes subject to bankruptcy or insolvency laws, Sotheby’s ability to realize on its collateral may be limited or delayed by the application of such laws.
The target loan-to-value ratio (principal loan amount divided by the low auction estimate of the collateral) for Finance segment secured loans is 50% or lower. However, certain loans are made at initial loan-to-value ratios higher than 50%. In addition, as a result of the normal periodic revaluation of loan collateral, the loan-to-value ratio of certain loans may increase above the 50% target loan-to-value ratio due to decreases in the low auction estimates of the collateral. As of December 31, 2009, Finance segment loans with loan-to-value ratios above 50% totaled $69.4 million and represented 42% of net Notes Receivable. The collateral related to such loans has a low auction estimate of approximately $95 million.
In addition, Sotheby’s Auction segment has an unsecured loan outstanding of $2.6 million as of December 31, 2009. Sotheby’s expects this loan to be repaid by future auction consignments in 2010.
As of December 31, 2009, three loans of $24.2 million, $20.6 million and $20.3 million comprised approximately 15%, 13% and 12%, respectively, of the net Notes Receivable balance. Of these amounts, $24.2 million is classified as current Notes Receivable and $40.9 million is classified as non-current Notes receivable as of December 31, 2009.
As of December 31, 2009 and 2008, Notes Receivable consisted of the following:
|
|
|
|
|
|
|
|
|
|
|
|
|
2009 |
|
2008 |
||||
|
|
|
|
||||||
|
|
|
(Thousands of dollars) |
|
|||||
|
Current |
|
$ |
65,489 |
|
|
$ |
153,437 |
|
|
Allowance for credit losses |
|
|
(1,028 |
) |
|
|
(1,213 |
) |
|
|
|
|
||||||
|
Sub-total |
|
|
64,461 |
|
|
|
152,224 |
|
|
|
|
|
||||||
|
Non-Current* |
|
|
100,008 |
|
|
|
24,668 |
|
|
|
|
|
||||||
|
Notes receivable (net) |
|
$ |
164,469 |
|
|
$ |
176,892 |
|
|
|
|
|
||||||
|
|
|
|
* |
Represents management’s estimate of notes receivable that will be collected more than a year from the balance sheet date. |
The weighted average interest rates earned on Notes Receivable were 4.8% and 5.6% in 2009 and 2008, respectively.
66
Note G—Inventory
Inventory consists of works of art owned by the Dealer and Auction segments. Included in Dealer inventory is art owned by Noortman Master Paintings (see Note E), as well as other artworks purchased for the purpose of investment and resale. Auction inventory consists principally of artworks obtained as a result of the failure of guaranteed property to sell at auction and, to a lesser extent, objects obtained incidental to the auction process primarily as a result of defaults by buyers after the consignor has been paid. As of December 31, 2009 and 2008, Inventory consisted of the following:
|
|
|
|
|
|
|
|
|
|
|
|
|
|
|
|
|
2009 |
|
|
2008 |
|
||||
|
|
|
|
|
|
|
||||||
|
|
|
(Thousands of dollars) |
|
||||||||
|
Dealer |
|
|
$ |
79,629 |
|
|
|
$ |
93,677 |
|
|
|
Auction |
|
|
|
62,936 |
|
|
|
|
92,912 |
|
|
|
|
|
|
|
||||||||
|
Total |
|
|
$ |
142,565 |
|
|
|
$ |
186,589 |
|
|
|
|
|
|
|
||||||||
In 2009, 2008 and 2007, Sotheby’s recognized total Inventory writedowns of $9.8 million, $33.7 million and $8.2 million, respectively.
Note H—Equity Method Investments
On May 23, 1990, Sotheby’s purchased the common stock of the Pierre Matisse Gallery Corporation (“Matisse”) for approximately $153 million. The assets of Matisse consisted of a collection of fine art (the “Matisse Inventory”). Upon consummation of the purchase, Sotheby’s entered into an agreement with Acquavella Contemporary Art, Inc. (“ACA”) to form Acquavella Modern Art (“AMA”), a partnership through which the Matisse Inventory would be sold. Sotheby’s contributed the Matisse Inventory to AMA in exchange for a 50% interest in the partnership. Although the original term of the AMA partnership agreement was for ten years and was due to expire in 2000, it has been renewed on an annual basis since then.
Pursuant to the AMA partnership agreement, upon the death of the majority shareholder of ACA, the successors-in-interest to ACA have the right, but not the obligation, to require Sotheby’s to purchase their interest in AMA at a price equal to the fair market value of such interest. The fair market value shall be determined pursuant to a process and a formula set forth in the partnership agreement that includes an appraisal of the works of art held by AMA at such time. Upon dissolution of AMA, if Sotheby’s and ACA elect not to liquidate the property and assets of AMA, any assets remaining after the payment of expenses and any other liabilities of AMA will be distributed to Sotheby’s and AMA as tenants-in-common or in some other reasonable manner. The net assets of AMA consist almost entirely of the Matisse Inventory. At December 31, 2009, the carrying value of the Matisse Inventory was $50.7 million.
To the extent that AMA requires cash to fund working capital, Sotheby’s has agreed to lend the same to AMA. Sotheby’s has not provided any such loans to AMA since 1993. Additionally, from time-to-time, Sotheby’s transacts with the principal shareholder of ACA in the normal course of its business.
As of December 31, 2009 and 2008, the carrying value of Sotheby’s investment in AMA was $13.3 million and $14.3 million, respectively. In 2009, 2008 and 2007, Sotheby’s share of AMA’s earnings, net of taxes, was $0.4 million, $1.9 million and $2.1 million, respectively.
As of December 31, 2009 and 2008, the carrying value of Sotheby’s 49% interest in another equity method investee was $3.9 million and $4.1 million, respectively. In 2009, 2008 and 2007, Sotheby’s share of this affiliate’s (loss) earnings, net of taxes, was ($0.2) million, $0.3 million and $0.5 million, respectively.
67
Note I—Fixed Assets
As of December 31, 2009 and 2008, Fixed Assets consisted of the following:
|
|
|
|
|
|
|
|
|
|
|
|
|
|
|
|
2009 |
|
2008 |
|
||||||
|
|
|
|
|
||||||||
|
|
|
(Thousands of dollars) |
|
||||||||
|
Land |
|
|
$ |
93,548 |
|
|
|
$ |
5,954 |
|
|
|
York Property capital lease |
|
|
|
— |
|
|
|
|
173,866 |
|
|
|
Buildings and building improvements |
|
|
|
212,548 |
|
|
|
|
8,505 |
|
|
|
Leasehold improvements |
|
|
|
68,457 |
|
|
|
|
65,608 |
|
|
|
Computer hardware and software |
|
|
|
58,334 |
|
|
|
|
62,774 |
|
|
|
Furniture, fixtures and equipment |
|
|
|
68,775 |
|
|
|
|
63,230 |
|
|
|
Construction in progress |
|
|
|
7,670 |
|
|
|
|
6,179 |
|
|
|
Other |
|
|
|
706 |
|
|
|
|
2,361 |
|
|
|
|
|
|
|
||||||||
|
|
|
|
|
510,038 |
|
|
|
|
388,477 |
|
|
|
Less: accumulated depreciation and amortization |
|
|
|
(139,814 |
) |
|
|
|
(182,271 |
) |
|
|
|
|
|
|
||||||||
|
Total |
|
|
$ |
370,224 |
|
|
|
$ |
206,206 |
|
|
|
|
|
|
|
||||||||
The land and building located at 1334 York Avenue, New York, N.Y. (the “York Property”) is home to Sotheby’s sole North American auction salesroom and its principal North American exhibition space. On February 7, 2003, Sotheby’s sold the York Property to an affiliate of RFR Holding Corp. (“RFR”). In conjunction with this sale, Sotheby’s leased the York Property back from RFR for an initial 20-year term, with options for Sotheby’s to extend the lease for two additional 10-year terms. The resulting lease was accounted for as a capital lease, with the related asset being amortized over the initial 20-year lease term.
On January 11, 2008, Sotheby’s entered into a contract to reacquire the York Property from RFR for a purchase price of $370 million (the “Purchase and Sale Agreement”). Sotheby’s also agreed to give the principals of RFR favorable consignment terms for the future sale of art at Sotheby’s auctions. Management estimated the value of these terms to be approximately $3.8 million.
Sotheby’s financed the $370 million purchase price through an initial $50 million cash payment made in conjunction with the signing of the Purchase and Sale Agreement on January 11, 2008, an $85 million cash payment made when the purchase was consummated on February 6, 2009 and the assumption of an existing $235 million mortgage on the York Property (the “York Property Mortgage”).
The York Property Mortgage matures on July 1, 2035, but has an optional pre-payment date of July 1, 2015 and bears an annual rate of interest of approximately 5.6%, which increases subsequent to July 1, 2015. It is management’s current intention to prepay the mortgage on or about July 1, 2015. In conjunction with the final accounting for the York Property purchase in February 2009, Sotheby’s recorded the York Property Mortgage at its $212.1 million fair value. The fair value of the York Property Mortgage was computed using a discounted cash flow approach based on a market rate of interest, which was estimated by management. The resulting $22.9 million debt discount is being amortized to interest expense over the remaining expected term of the loan. Sotheby’s paid fees of $2.4 million in conjunction with the assumption of the York Property Mortgage, which are also being amortized to interest expense over the remaining expected term of the loan. The December 31, 2009 carrying value of the York Property Mortgage was $215.4 million and its fair value was approximately $227.5 million. (See Note M.)
As a result of the consummation of the York Property purchase on February 6, 2009, the existing capital lease obligation of $167 million, which had an effective interest rate of 10.4%, and the related $122 million net capital lease asset, as well as a $16 million deferred gain related to the sale of the York Property in 2003 were derecognized and the net effect was deducted from the initial carrying value of the York Property. Accordingly, the land and building acquired in conjunction with the purchase of the York Property was recorded at an initial carrying value of approximately $292.3 million, computed as follows (in thousands of dollars):
|
|
|
|
|
|
|
|
|
Fair value of York Property Mortgage |
|
|
$ |
212,130 |
|
|
|
Cash payments (including direct transaction costs) |
|
|
|
137,480 |
|
|
|
Fair value of consignment terms |
|
|
|
3,750 |
|
|
|
Derecognition of net capital lease obligation |
|
|
|
(45,171 |
) |
|
|
Derecognition of deferred gain |
|
|
|
(15,894 |
) |
|
|
|
|
|
||||
|
Initial carrying value of York Property |
|
|
$ |
292,295 |
|
|
|
|
|
|
68
The York Property and the York Property Mortgage are held by 1334 York, LLC, a separate legal entity of Sotheby’s that maintains its own books and records and whose results are ultimately consolidated into Sotheby’s financial statements. The assets of 1334 York, LLC are not available to satisfy the obligations of other Sotheby’s affiliates or any other entity.
In 2009, 2008 and 2007, Depreciation and Amortization Expense related to Fixed Assets was $19.8 million, $22.6 million and $20.6 million, respectively. As of December 31, 2008, approximately $51.2 million of Accumulated Depreciation and Amortization related to the York Property capital lease.
In March 2007, Sotheby’s completed the sale of land and buildings at Billingshurst, West Sussex in the United Kingdom (the “U.K.”), which previously housed an auction salesroom. As a result of this sale, Sotheby’s recognized a gain of $4.8 million in the first quarter of 2007.
Note J—Goodwill
During 2009 and 2008, changes in the carrying value of Goodwill were as follows (in thousands of dollars):
|
|
|
|
|
|
|
|
|
|
|
|
|
|
|
|
|
|
|
|
|
|
|
|
|
|
|
|
|
|
|
|
|
|
|
|
2009 |
|
2008 |
|
||||||||||||||||||||||||||
|
|
|
|
|
||||||||||||||||||||||||||||
|
|
|
Auction |
|
Dealer |
|
Total |
|
Auction |
|
Dealer |
|
Total |
|
||||||||||||||||||
|
|
|
|
|
|
|
|
|
||||||||||||||||||||||||
|
Balance as of January 1 |
|
|
$ |
14,202 |
|
|
|
$ |
— |
|
|
|
$ |
14,202 |
|
|
|
$ |
15,920 |
|
|
|
$ |
12,160 |
|
|
|
$ |
28,080 |
|
|
|
Goodwill |
|
|
|
— |
|
|
|
|
— |
|
|
|
|
— |
|
|
|
|
710 |
|
|
|
|
— |
|
|
|
|
710 |
|
|
|
Allocation of purchase price |
|
|
|
— |
|
|
|
|
— |
|
|
|
|
— |
|
|
|
|
(2,212 |
) |
|
|
|
— |
|
|
|
|
(2,212 |
) |
|
|
Impairment loss |
|
|
|
— |
|
|
|
|
— |
|
|
|
|
— |
|
|
|
|
— |
|
|
|
|
(11,106 |
) |
|
|
|
(11,106 |
) |
|
|
Foreign currency exchange rate changes |
|
|
|
389 |
|
|
|
|
— |
|
|
|
|
389 |
|
|
|
|
(216 |
) |
|
|
|
(1,054 |
) |
|
|
|
(1,270 |
) |
|
|
|
|
|
|
|
|
|
|
||||||||||||||||||||||||
|
Balance as of December 31 |
|
|
$ |
14,591 |
|
|
|
$ |
— |
|
|
|
$ |
14,591 |
|
|
|
$ |
14,202 |
|
|
|
$ |
— |
|
|
|
$ |
14,202 |
|
|
|
|
|
|
|
|
|
|
|
||||||||||||||||||||||||
Prior to December 31, 2008, Dealer segment Goodwill was solely attributable to Noortman Master Paintings (or “NMP”), which was acquired by Sotheby’s in June 2006. Based on the results of the October 31, 2008 annual impairment test for goodwill, Sotheby’s recognized an impairment loss of $11.1 million in the fourth quarter of 2008 in the Dealer segment, eliminating the remainder of NMP’s goodwill. This impairment loss was principally due to a reduction in management’s future cash flow estimates for NMP.
Since the adoption of Statement of Financial Accounting Standards (“SFAS”) No. 142, “Goodwill and Other Intangible Assets,” (now codified under ASC 350, Intangibles-Goodwill and Other) and through January 1, 2009, Sotheby’s has incurred total goodwill impairment losses of $18.4 million, all of which are attributable to NMP goodwill.
Note K—Intangible Assets
Sotheby’s has intangible assets as a result of its acquisitions of NMP in June 2006 and an auction house in Paris, France in March 2007. As of December 31, 2009 and 2008, Intangible Assets consisted of the following (in thousands of dollars):
|
|
|
|
|
|
|
|
|
|
|
|
|
|
|
|
2009 |
|
2008 |
|
||||||
|
|
|
|
|
||||||||
|
Indefinite lived intangible assets: |
|
|
|
|
|
|
|
|
|
|
|
|
Trade name and other |
|
|
$ |
324 |
|
|
|
$ |
324 |
|
|
|
Amortizable intangible assets: |
|
|
|
|
|
|
|
|
|
|
|
|
Customer relationships |
|
|
|
6,773 |
|
|
|
|
6,559 |
|
|
|
Accumulated amortization |
|
|
|
(5,332 |
) |
|
|
|
(3,412 |
) |
|
|
|
|
|
|
||||||||
|
Sub-total |
|
|
|
1,441 |
|
|
|
|
3,147 |
|
|
|
|
|
|
|
||||||||
|
Total |
|
|
$ |
1,765 |
|
|
|
$ |
3,471 |
|
|
|
|
|
|
|
||||||||
Based on the results of the October 31, 2008 annual impairment test for Sotheby’s indefinite lived intangible assets, management determined that the NMP trade name was impaired and recorded an impairment loss of $2.1 million in the fourth quarter of 2008. This impairment loss was principally due to a reduction in management’s future cash flow estimates for NMP.
In 2009, 2008 and 2007, amortization expense related to Intangible Assets was approximately $1.7 million, $2.2 million and $1.5 million, respectively. The customer relationships have a weighted average remaining useful life of 1.6 years and the related amortization expense is expected to be approximately $0.9 million, $0.4 million and $0.1 million in 2010, 2011 and 2012, respectively.
69
Note L—Restructuring Plans and Related Charges
In 2009, Sotheby’s recorded net Restructuring Charges of $12.2 million related to the restructuring plans described below.
2008 Restructuring Plan— Due to a downturn in the international art market, on December 1, 2008 and February 26, 2009, Sotheby’s Board of Directors approved restructuring actions impacting the Auction segment, as well as certain corporate departments. These restructuring actions (collectively, the “2008 Restructuring Plan”) are the result of a strategic review of Sotheby’s operations conducted by management between November 2008 and February 2009. The 2008 Restructuring Plan contemplates a 15% decrease in global headcount, a reduction in Sotheby’s selling activities and leased premises in Amsterdam and the vacating of other premises principally in the U.K. as a result of a reorganization of Sotheby’s European operations.
The 2008 Restructuring Plan includes $2.0 million of facility related costs associated with exiting certain leased facilities in the Netherlands and the U. K.. These facility related Restructuring Charges represent the future rental costs (net of estimated sub-lease income) that Sotheby’s remains obligated to pay subsequent to the cease use date for each facility. The cease use date for the Amsterdam facility was in December 2009 and the underlying lease expires in September 2014. The cease use date for the U.K. facility was in June 2009 and the underlying lease expired in December 2009.
2009 Restructuring Plan—In March and April 2009, in response to a continued downturn in the international art market, management conducted a further strategic review of Sotheby’s operations, and on April 27, 2009, the Executive Committee of the Board of Directors approved additional restructuring actions (the “2009 Restructuring Plan”). The 2009 Restructuring Plan impacts all areas of Sotheby’s global operations through additional significant cost reductions resulting from a further 5% decrease in global headcount. In 2009, Sotheby’s recorded net Restructuring Charges of $3.5 million for employee termination benefits related to the 2009 Restructuring Plan.
Restructuring activities resulting from the 2008 Restructuring Plan and 2009 Restructuring Plan are summarized as follows:
|
Employee Termination Benefits |
Facility Related Costs |
Other Costs |
Total | ||||||||||||
| Liability at January 1, 2008 | $ | — | $ | — | $ | — | $ | — | |||||||
| Charges for 2008 Restructuring Plan | 4,312 | — | — | 4,312 | |||||||||||
| Liability at December 31, 2008 | 4,312 | — | — | 4,312 | |||||||||||
| Charges for 2008 Restructuring Plan | 6,446 | 2,085 | 427 | 8,958 | |||||||||||
| Charges for 2009 Restructuring Plan | 3,578 | — | 3 | 3,581 | |||||||||||
| Cash payments | (12,844 | ) | (1,144 | ) | (359 | ) | (14,347 | ) | |||||||
| Adjustments to liability | (251 | ) | (129 | ) | — | (380 | ) | ||||||||
| Foreign currency exchange rate changes | 317 | 54 | 5 | 376 | |||||||||||
| Liability at December 31, 2009 | $ | 1,558 | $ | 866 | $ | 76 | $ | 2,500 |
As of December 31, 2009, the liability related to Sotheby’s restructuring activities was $2.5 million. The current portion of the liability of $1.8 million is recorded in the Consolidated Balance Sheets within Accounts Payable and Accrued Liabilities, and the non-current portion of $0.7 million is recorded with Other Liabilities. The majority of the liability related to employee termination benefits is expected to be paid by March 31, 2010. The liability for the facility related costs will be paid monthly according to the terms of the underlying lease through September 2014.
70
Note M—Debt
Revolving Credit Facility—On August 31, 2009, Sotheby’s and certain of its wholly-owned subsidiaries (collectively, the “Borrowers”) entered into a credit agreement (the “Credit Agreement”) with an international syndicate of lenders led by General Electric Capital Corporation (“GE Capital”), which acted as fronting lender and agent. The following summary does not purport to be a complete summary of the Credit Agreement and is qualified in its entirety by reference to the Credit Agreement, a copy of which was filed as Exhibit 10.1 to Sotheby’s Form 8-K filed with the SEC on September 1, 2009. Terms used, but not defined in this summary, have the meanings set forth in the Credit Agreement.
The Credit Agreement has a maturity date of August 31, 2012 and provides for a $200 million revolving credit facility (the “Revolving Credit Facility”), with a sub-limit of $50 million for U.K. based borrowings. The borrowings available under the Credit Agreement are limited by a borrowing base equal to 85% of Eligible Art Loans, plus 30% of Eligible Art Inventory, plus 15% of Consolidated Net Tangible Assets, subject to limitations and certain reserves.
Borrowings under the Revolving Credit Facility may be used for general corporate purposes. In addition, up to $10 million of the Revolving Credit Facility may be used to issue letters of credit. As of December 31, 2009, there were no borrowings or letters of credit outstanding under the Revolving Credit Facility and the amount of available borrowings was approximately $129 million, as calculated under the borrowing base.
Borrowings under the Revolving Credit Facility are available in either Dollars to U.S. Borrowers or Pounds Sterling to U.K. Borrowers. The U.S. Borrowers and, subject to certain limitations, the U.K. Borrowers, are jointly and severally liable for all obligations under the Credit Agreement. In addition, certain subsidiaries of the Borrowers guarantee the obligations of the Borrowers under the Credit Agreement. The obligations under the Credit Agreement are secured by liens on all or substantially all of the personal property of the Borrowers and the guarantors.
Borrowings are, at the Borrowers’ option, either Dollar Index Rate Loans (for U.S. Borrowers only) or LIBOR Loans. Dollar Index Rate Loans bear interest from the applicable borrowing date at an annual rate equal to (a) the highest of (i) the “Prime Rate” as quoted in The Wall Street Journal, (ii) the Federal Funds Rate plus 3%, or (iii) the LIBOR Rate based upon the offered rate for deposits in such currency for a period equal to such interest period on the Reuters Screen LIBOR01 Page plus 1.0%, plus (b) the Applicable Margin, which is generally 3.0% to 3.5% based upon the level of outstanding borrowings under the Revolving Credit Facility. The LIBOR Rate for Dollars or Pounds Sterling, as the case may be, for an interest period is equal to (x) the highest of (i) the offered rate for deposits in such currency for a period equal to such interest period on the Reuters Screen LIBOR01 Page, (ii) if the interest period is less than three months, the offered rate for deposits in such currency on the Reuters Screen for an Interest Period of three months, and (iii) 2%, plus (y) the Applicable Margin, which is generally 4.0% to 4.5% based upon the level of outstanding borrowings under the Revolving Credit Facility.
71
The Credit Agreement contains certain customary affirmative and negative covenants including, but not limited to, limitations on capital expenditures, limitations on net outstanding auction guarantees, limitations on the use of proceeds from borrowings under the Credit Agreement, limitations on the ability to merge, liquidate, consolidate, dispose of assets or capital stock, and limitations on material changes to the nature of Sotheby’s business. The Credit Agreement also restricts quarterly dividend payments to the lesser of $0.05 per share or $4 million. The maximum level of quarterly dividend payments may be increased depending on the Fixed Charge Coverage Ratio covenant. Management believes that Sotheby’s is in compliance with the covenants and terms of the Credit Agreement.
The Credit Agreement also contains the following financial covenants, which are only applicable during certain compliance periods:
|
|
|
|
|
|
• |
A minimum Fixed Charge Coverage Ratio, which requires the maintenance of a sufficient level of specifically defined cash flows to cover certain debt and equity related cash requirements. |
|
|
|
|
|
|
• |
A minimum EBITDA, which requires the maintenance of certain minimum levels of specifically defined operating cash flows. |
|
|
||
|
|
These financial covenants were not applicable for the twelve month period ending December 31, 2009. |
|
Sotheby’s incurred approximately $7.5 million in fees related to the Credit Agreement, which are being amortized on a straight-line basis to Interest Expense over the three-year term of the facility. Additionally, commitment fees are 1.00% per year for undrawn amounts committed under the Revolving Credit Facility.
In conjunction with entering into the Credit Agreement, on August 31, 2009, Sotheby’s terminated its senior secured revolving credit facility with Bank of America, N.A. (the “BofA Credit Agreement”). The BofA Credit Agreement had a maturity date of September 7, 2010 and provided for borrowings of up to $150 million, subject to a borrowing base. As a result of this termination, Sotheby’s recorded a $2.5 million non-cash charge in the third quarter of 2009 to write-off the remaining balance of arrangement and amendment fees related to the BofA Credit Agreement. Additionally, as a result of amendments to the BofA Credit Agreement made in the first half of 2009, Sotheby’s recorded a $1.3 million non-cash charge in the second quarter of 2009 to write-off a portion of the arrangement and amendment fees related to the BofA Credit Agreement.
Long-Term Debt—As of December 31, 2009 and 2008, Long-Term Debt consisted of the following:
|
|
|
|
|
|
|
|
|
|
|
|
|
|
|
December
31, |
|
December
31, |
||||||
|
|
|
|
||||||||
|
|
|
(Thousands of dollars) |
||||||||
|
York Property Mortgage, net of unamortized discount of $19,603 |
|
|
$ |
214,193 |
|
|
|
$ |
— |
|
|
7.75% Senior Notes, net of unamortized discount of $1,503 and $1,625 |
|
|
|
126,747 |
|
|
|
|
129,267 |
|
|
Convertible Notes, net of unamortized discount of $28,001 and $34,794 |
|
|
|
171,999 |
|
|
|
|
165,206 |
|
|
|
|
|
||||||||
|
Total |
|
|
$ |
512,939 |
|
|
|
$ |
294,473 |
|
|
|
|
|
||||||||
The amount of principal expected to be paid on the York Property Mortgage in 2010 is $1.2 million. Accordingly, this amount is included in Other Current Liabilities as of December 31, 2009 in the Consolidated Balance Sheets. See Note I for further information related to the York Property Mortgage. See the captioned sections below for information related to the Convertible Notes and the Senior Notes.
Senior Notes—On June 17, 2008, Sotheby’s issued $150 million aggregate principal amount of 7.75% Senior Notes (the “Senior Notes”), due June 15, 2015. The net proceeds from the issuance of the Senior Notes were approximately $145.9 million, after deducting the initial purchasers’ discounts and fees. The Senior Notes have an effective interest rate of 8%. Interest on the Senior Notes is payable semi-annually in cash on June 15 and December 15 of each year.
On December 23, 2008, Sotheby’s repurchased an aggregate principal amount of $19 million of its Senior Notes for a purchase price of $10.5 million (representing 56% of the aggregate principal amount repurchased). This repurchase resulted in a non-cash gain of $7.8 million, net of fees, which was recognized in the fourth quarter of 2008 and reported within Extinguishment of Debt (Net) in the Consolidated Statements of Operations.
72
On January 27, 2009, Sotheby’s repurchased an additional $2.8 million of its Senior Notes for a purchase price of $1.6 million (representing 59% of the aggregate principal amount repurchased). This repurchase resulted in a non-cash gain of $1 million, net of fees, which was recognized in the first quarter of 2009 and reported within Extinguishment of Debt (Net) in the Consolidated Statements of Operations.
As of December 31, 2009, the Senior Notes had a fair value of approximately $119.3 million based on a broker quoted price.
Convertible Notes—On June 17, 2008, Sotheby’s issued $200 million aggregate principal amount of 3.125% Convertible Notes, due June 15, 2013. The net proceeds from the issuance of the Convertible Notes were approximately $194.3 million, after deducting transaction costs. Interest on the Convertible Notes is payable semi-annually in cash on June 15 and December 15 of each year. Sotheby’s may not redeem the Convertible Notes prior to their stated maturity date. As of December 31, 2009, the Convertible Notes had a fair value of approximately $195.1 million based on a broker quoted price.
The principal amount of the Convertible Notes is payable in cash, shares of Sotheby’s Common Stock (“Common Stock”), or a combination thereof, at the option of Sotheby’s, based on an initial conversion rate of 29.4122 shares of Common Stock per $1,000 principal amount of Convertible Notes, which is equivalent to a conversion price of approximately $34 per share (the “Conversion Price”). The maximum number of shares of Common Stock that may be issued upon conversion is approximately 5.8 million shares. The conversion rate for the Convertible Notes is subject to adjustment for certain events. The Convertible Notes may be converted at any time beginning on March 15, 2013 and ending on the close of business on June 14, 2013. Prior to March 15, 2013, the Convertible Notes may only be converted: (1) during any fiscal quarter after the fiscal quarter ending September 30, 2008 (and only during such fiscal quarter), if the closing price of the Common Stock exceeds 130% of the Conversion Price during a defined period at the end of the previous quarter, (2) if the trading price of Convertible Notes falls below a certain threshold over a defined period, or (3) upon the occurrence of certain specified corporate transactions (as set forth in the Convertible Notes Indenture). None of these conversion criteria have been met during the period that the Convertible Notes have been outstanding.
Upon conversion, Sotheby’s will pay or deliver, as the case may be, cash, shares of Common Stock or a combination thereof at its election. It is Sotheby’s current intent and policy to settle up to the principal amount of the Convertible Notes in cash. Accordingly, the Convertible Notes have no impact on diluted shares outstanding until the average price of the Common Stock for a period exceeds the Conversion Price.
Each of Sotheby’s existing and future domestic subsidiaries have jointly, severally, fully and unconditionally guaranteed the Convertible Notes on a senior unsecured basis to the extent such subsidiaries guarantee borrowings under the Credit Agreement.
On January 1, 2009, new accounting rules came into effect for certain convertible debt instruments that may be settled entirely or partially in cash upon conversion. Pursuant to these rules, the liability and equity components of convertible debt instruments within their scope must be separately accounted for in a manner that will reflect the borrower’s nonconvertible debt borrowing rate when interest expense is recognized in subsequent periods. The resulting equity component (the conversion option) is not remeasured as long as it continues to meet the conditions for equity classification under GAAP and represents the original issue discount for the purposes of accounting for the liability component of the convertible debt instrument.
The Convertible Notes are within the scope of these new accounting rules which were adopted by Sotheby’s on January 1, 2009. Accordingly, Interest Expense for 2008 has been restated to reflect Sotheby’s nonconvertible debt borrowing rate. Additionally, the December 31, 2008 balance of the Convertible Notes reported within Long-Term Debt has been adjusted to reflect the impact of these new accounting rules as if they were effective on June 17, 2008, the day on which the Convertible Notes were issued. In conjunction with the adoption of these rules, management estimated that the equity and liability components of the Convertible Notes had initial fair values of $38.2 million (approximately $21 million, net of taxes) and $161.8 million, respectively. As a result of the recording of the liability and equity components at their fair values, the Convertible Notes have an effective interest rate of 7.75%. (See Note B for more detailed information on the retrospective application of these new accounting rules.)
As of December 31, 2009, the unamortized discount related to the Convertible Notes was $28 million and will be amortized to Interest Expense over the 41.5 months remaining until maturity using the effective interest rate method.
As of December 31, 2009, management evaluated the embedded conversion option in the Convertible Notes and concluded that it should not be accounted for separately because the conversion option is indexed to Sotheby’s Common Stock and is classified as Shareholders’ Equity. Accordingly, the embedded conversion option in the Convertible Notes has not been remeasured and remains recorded as a component of Additional Paid-in Capital.
73
In 2009 and 2008, Interest Expense related to the Convertible Notes consisted of the following (in thousands of dollars):
|
|
|
|
|
|
|
|
|
|
|
|
|
|
|
2009 |
|
2008 |
||||||
|
|
|
|
||||||||
|
Contractual coupon interest expense |
|
|
$ |
6,250 |
|
|
|
$ |
3,368 |
|
|
Discount amortization |
|
|
|
6,791 |
|
|
|
|
3,448 |
|
|
|
|
|
||||||||
|
Total |
|
|
$ |
13,041 |
|
|
|
$ |
6,816 |
|
|
|
|
|
||||||||
Convertible Note Hedge and Warrant Transactions—On June 11, 2008, in conjunction with the issuance of the Convertible Notes, Sotheby’s entered into convertible note hedge transactions (the “Convertible Note Hedges”) that will allow Sotheby’s to purchase its Common Stock from affiliates of Bank of America and Goldman, Sachs & Co. (collectively the “Counterparties”) at a price equal to the Conversion Price of the Convertible Notes. The Convertible Note Hedges will cover, subject to customary anti-dilution adjustments, approximately 5.8 million shares of Common Stock. The Convertible Note Hedges are intended to offset potential dilution to Sotheby’s Common Stock upon potential future conversion of the Convertible Notes. The Convertible Note Hedges will expire upon the maturity of the Convertible Notes.
On June 11, 2008, Sotheby’s also entered into warrant transactions, whereby it sold to the Counterparties warrants (the “Warrants”) to acquire, subject to customary anti-dilution adjustments, approximately 5.8 million shares of Common Stock at $44.905 per share.
These contracts meet all of the applicable criteria under GAAP for equity classification and, as a result, the $40.6 million cost of the Convertible Note Hedges ($22.5 million, net of taxes) and the $22.3 million in net proceeds received from the sale of the Warrants are recorded within Additional Paid-In Capital in Shareholders’ Equity. In addition, because both of these contracts are classified as shareholders’ equity and are indexed to Sotheby’s Common Stock, they are not accounted for as derivatives under GAAP.
The Warrants have no impact on diluted shares outstanding until the average price of the Common Stock for a period exceeds the Warrant’s $44.905 exercise price. The Convertible Note Hedges are anti-dilutive and therefore have no impact on diluted shares outstanding.
Redemption of 6.98% Notes—In February 1999, Sotheby’s issued a tranche of 10-year long-term debt securities for an aggregate offering price of $100 million (the “Notes”). The Notes had an effective interest rate of 6.98% payable semi-annually in cash each February and August. On July 18, 2008, the Company redeemed the Notes for $105.7 million, using a portion of the net proceeds from the issuance of the Senior Notes and Convertible Notes. The $105.7 million paid upon redemption includes $102.5 million for the present value of the remaining principal and interest and $3.2 million for accrued and unpaid interest through the date of redemption. As a result, a bond redemption loss of $2.5 million was recognized in the third quarter of 2008 and reported within Extinguishment of Debt (Net) in the Consolidated Statements of Operations.
Future Principal and Interest Payments—As of December 31, 2009, the aggregate future principal and interest payments due under the York Property Mortgage, the Convertible Notes and the Senior Notes are as follows (in thousands of dollars):
|
|
|
|
|
|
|
|
2010 |
|
|
$ |
30,443 |
|
|
2011 |
|
|
|
32,193 |
|
|
2012 |
|
|
|
32,193 |
|
|
2013 |
|
|
|
228,825 |
|
|
2014 |
|
|
|
25,943 |
|
|
Thereafter |
|
|
|
360,351 |
|
|
|
|
||||
|
Total future principal and interest payments |
|
|
$ |
709,948 |
|
|
|
|
||||
74
Interest Expense—In 2009, 2008 and 2007, interest expense consisted of the following:
|
|
|
|
|
|
|
|
|
|
|
|
|
|
|
|
|
|
|
|
2009 |
|
2008 |
|
2007 |
|||||||||
|
|
|
|
|
||||||||||||
|
|
|
(Thousands of dollars) |
|||||||||||||
|
Senior secured credit facility: |
|
|
|
|
|
|
|
|
|
||||||
|
Interest expense on outstanding borrowings |
|
|
$ |
— |
|
|
|
$ |
1,740 |
|
|
|
$ |
— |
|
|
Amortization of amendment and arrangement fees |
|
|
|
2,346 |
|
|
|
|
736 |
|
|
|
|
582 |
|
|
Commitment fees |
|
|
|
1,703 |
|
|
|
|
787 |
|
|
|
|
765 |
|
|
|
|
|
|
||||||||||||
|
Sub-total |
|
|
|
4,049 |
|
|
|
|
3,263 |
|
|
|
|
1,347 |
|
|
|
|
|
|
||||||||||||
|
York Property capital lease obligation |
|
|
|
1,657 |
|
|
|
|
17,491 |
|
|
|
|
17,666 |
|
|
York Property Mortgage |
|
|
|
15,400 |
|
|
|
|
— |
|
|
|
|
— |
|
|
6.98% Notes (redeemed July 18, 2008) |
|
|
|
— |
|
|
|
|
3,767 |
|
|
|
|
6,971 |
|
|
Senior Notes |
|
|
|
10,154 |
|
|
|
|
6,381 |
|
|
|
|
— |
|
|
Convertible Notes |
|
|
|
13,041 |
|
|
|
|
6,816 |
|
|
|
|
— |
|
|
Other interest expense * |
|
|
|
1,407 |
|
|
|
|
2,267 |
|
|
|
|
2,638 |
|
|
|
|
|
|
||||||||||||
|
Total interest expense |
|
|
$ |
45,708 |
|
|
|
$ |
39,985 |
|
|
|
$ |
28,622 |
|
|
|
|
|
|
||||||||||||
|
|
|
|
* |
In 2009, other interest expense consists primarily of the amortization of debt issuance costs related to the Senior Notes and Convertible Notes. In 2008 and 2007, other interest expense consists primarily of amortization of the discount on other short and long-term obligations and other miscellaneous interest expense. |
Interest Paid—In 2009, 2008 and 2007, interest paid totaled $42.3 million, $35.9 million and $25.3 million, respectively. Interest paid consists of cash payments related to the York Property Mortgage, Sotheby’s long-term debt securities, credit facility borrowings (including fees), as well as the portion of the payments for the York Property capital lease attributable to interest.
Note N—Income Taxes
In 2009, 2008 and 2007, the significant components of income tax expense consisted of the following:
|
|
|
|
|
|
|
|
|
|
|
|
|
|
|
|
|
|
|
|
2009 |
|
2008 |
|
2007 |
|||||||||
|
|
|
|
|
||||||||||||
|
|
|
(Thousands of dollars) |
|||||||||||||
|
Income (loss) before taxes: |
|
|
|
|
|
|
|
|
|
||||||
|
Domestic |
|
|
$ |
(33,709 |
) |
|
|
$ |
(70,097 |
) |
|
|
$ |
66,923 |
|
|
Foreign |
|
|
|
49,104 |
|
|
|
|
115,271 |
|
|
|
|
216,096 |
|
|
|
|
|
|
||||||||||||
|
Total |
|
|
$ |
15,395 |
|
|
|
$ |
45,174 |
|
|
|
$ |
283,019 |
|
|
|
|
|
|
||||||||||||
|
Income tax expense (benefit) — current: |
|
|
|
|
|
|
|
|
|
|
|
|
|
|
|
|
Domestic |
|
|
$ |
(5,138 |
) |
|
|
$ |
(8,342 |
) |
|
|
$ |
43,453 |
|
|
State and Local |
|
|
|
945 |
|
|
|
|
(1,325 |
) |
|
|
|
723 |
|
|
Foreign |
|
|
|
12,648 |
|
|
|
|
31,396 |
|
|
|
|
53,944 |
|
|
|
|
|
|
||||||||||||
|
Sub-total |
|
|
|
8,455 |
|
|
|
|
21,729 |
|
|
|
|
98,120 |
|
|
|
|
|
|
||||||||||||
|
Income tax expense (benefit)—deferred: |
|
|
|
|
|
|
|
|
|
|
|
|
|
|
|
|
Domestic |
|
|
|
(9,880 |
) |
|
|
|
(2,092 |
) |
|
|
|
(2,315 |
) |
|
State and Local |
|
|
|
25,054 |
|
|
|
|
(1,358 |
) |
|
|
|
(23,624 |
) |
|
Foreign |
|
|
|
(1,467 |
) |
|
|
|
2,578 |
|
|
|
|
331 |
|
|
|
|
|
|
||||||||||||
|
Sub-total |
|
|
|
13,707 |
|
|
|
|
(872 |
) |
|
|
|
(25,608 |
) |
|
|
|
|
|
||||||||||||
|
Total |
|
|
$ |
22,162 |
|
|
|
$ |
20,857 |
|
|
|
$ |
72,512 |
|
|
|
|
|
|
||||||||||||
In 2009, 2008 and 2007, income tax expense related to Sotheby’s equity earnings of investees was approximately $0.1 million, $1.8 million and $1.7 million, respectively.
75
As of December 31, 2009 and 2008, the components of deferred tax assets and liabilities consisted of the following (in thousands of dollars):
|
|
|
|
|
|
|
|
|
|
|
|
|
|
|
2009 |
|
2008 |
||||||
|
|
|
|
||||||||
|
Deferred Tax Assets: |
|
|
|
|
||||||
|
Asset provisions and accrued liabilities |
|
|
$ |
56,257 |
|
|
|
$ |
65,768 |
|
|
Capital lease obligation |
|
|
|
— |
|
|
|
|
75,548 |
|
|
Tax loss and credit carryforwards |
|
|
|
6,076 |
|
|
|
|
2,621 |
|
|
Difference between book and tax basis of depreciable and amortizable assets |
|
|
|
25,496 |
|
|
|
|
— |
|
|
|
|
|
||||||||
|
Sub-Total |
|
|
|
87,829 |
|
|
|
|
143,937 |
|
|
Valuation allowance |
|
|
|
(19,516 |
) |
|
|
|
(1,328 |
) |
|
|
|
|
||||||||
|
Total deferred tax assets |
|
|
|
68,313 |
|
|
|
|
142,609 |
|
|
|
|
|
||||||||
|
Deferred Tax Liabilities: |
|
|
|
|
|
|
|
|
|
|
|
Difference between book and tax basis of depreciable and amortizable assets |
|
|
|
— |
|
|
|
|
55,337 |
|
|
Step up in acquired assets |
|
|
|
603 |
|
|
|
|
843 |
|
|
Pension obligations |
|
|
|
3,223 |
|
|
|
|
2,083 |
|
|
Basis differences in equity method investments |
|
|
|
5,790 |
|
|
|
|
6,100 |
|
|
|
|
|
||||||||
|
Total deferred tax liabilities |
|
|
|
9,616 |
|
|
|
|
64,363 |
|
|
|
|
|
||||||||
|
Total |
|
|
$ |
58,697 |
|
|
|
$ |
78,246 |
|
|
|
|
|
||||||||
Sotheby’s has deferred tax assets related to various foreign and state loss and tax credit carryforwards totaling $6.1 million that begin to expire in 2010.
As of December 31, 2009 and 2008, Sotheby’s has provided valuation allowances of $19.5 million and $1.3 million, respectively, for certain deferred tax assets primarily related to foreign tax credits and state and foreign losses. During 2009, the valuation allowance increased by $18.2 million primarily due to management’s reassessment of Sotheby’s ability to utilize certain foreign, state and local deferred tax assets including state and foreign losses against projected income. During 2008, the valuation allowance increased by $0.9 million, primarily due to management’s reassessment of Sotheby’s ability to utilize foreign tax credits and net operating losses against current and projected income.
In 2009, 2008 and 2007, the effective income tax rate varied from the statutory rate as follows:
|
|
|
|
|
|
|
|
|
|
|
|
|
|
2009 |
|
2008 |
|
2007 |
|||
|
|
|
|
|
||||||
|
Statutory federal income tax rate |
|
35.00% |
|
|
35.00% |
|
|
35.00% |
|
|
State and local taxes, net of federal tax benefit* |
|
109.77% |
|
|
(4.61% |
) |
|
(5.27% |
) |
|
Foreign taxes at rates different from U.S. rates |
|
(45.17% |
) |
|
(24.70% |
) |
|
(8.45% |
) |
|
Deemed income from foreign subsidiaries, net |
|
42.86% |
|
|
7.25% |
|
|
4.82% |
|
|
Impairment losses |
|
0.00% |
|
|
6.34% |
|
|
0.72% |
|
|
Tax reserves |
|
0.79% |
|
|
17.38% |
|
|
0.95% |
|
|
Corporate-owned life insurance |
|
(8.05% |
) |
|
4.21% |
|
|
(2.61% |
) |
|
Valuation allowance |
|
2.48% |
|
|
2.19% |
|
|
0.00% |
|
Non-deductible compensation |
|
3.36% |
|
|
2.60% |
|
|
0.58% |
|
Other non-deductible expenses |
|
1.89% |
|
|
2.29% |
|
|
0.33% |
|
|
Other |
|
1.03% |
|
|
(1.78% |
) |
|
(0.45% |
) |
|
|
|
|
|
||||||
|
Effective income tax rate |
|
143.96% |
|
|
46.17% |
|
|
25.62% |
|
|
|
|
|
|
||||||
|
|||||||||
* The 2009 state and local tax expense is primarily attributable to the recording of a state and local valuation allowance of approximately $17 million. |
|||||||||
The comparison of the effective income tax rate between periods is significantly influenced by the level and mix of earnings and losses by taxing jurisdiction, foreign tax rate differentials, the relative impact of permanent book to tax differences (i.e., non-deductible expenses) on lower pre-tax results by taxing jurisdictions and the recording of a valuation allowance against certain state and foreign deferred tax assets and loss carryfowards. These factors are partially offset by the mix of income earned at tax rates lower than the U.S. tax rate and a favorable audit settlement. The effective income tax rate for 2008 has been adjusted to reflect the retrospective application of an accounting rule that impacted the accounting for the Convertible Notes. Income taxes have not been provided on a cumulative total of $263.5 million and $226.6 million of undistributed earnings of certain foreign subsidiaries that are intended to be indefinitely reinvested outside of the U.S. as of December 31, 2009 and 2008, respectively. It is not practicable to determine the income tax liability that might be incurred if these earnings were to be distributed. As of December 31, 2009, Sotheby’s has provided income taxes of $0.4 million on undistributed earnings of certain foreign subsidiaries that are not intended to be indefinitely reinvested outside of the U.S..
76
Total net income tax payments during 2009, 2008 and 2007 were $6.8 million, $81.6 million and $38.5 million, respectively.
Note O—Uncertain Tax Positions
In July 2006, new accounting rules were issued, which clarified the accounting for uncertainty in income taxes recognized in an entity’s financial statements and prescribed a recognition threshold and measurement attributes for financial statement disclosure of tax positions taken or expected to be taken on a tax return. Under these rules, the impact of an uncertain income tax position on the income tax return must be recognized at the largest amount that is more likely-than-not to be sustained upon audit by the relevant taxing authority. An uncertain income tax position will not be recognized if there is less than a 50% likelihood of its being sustained. Additionally, these rules provide guidance on derecognition, classification, interest and penalties, accounting in interim periods, disclosure and transition.
As of December 31, 2009, 2008 and 2007, the liability for unrecognized tax benefits, excluding interest and penalties, was $50.1 million, $43.6 million and $32.6 million, respectively. The December 31, 2009, 2008 and 2007 balances are reflected in the Consolidated Balance Sheets as follows (in thousands of dollars):
|
|
|
|
|
|
|
|
|
|
|
|
|
|
|
|
|
|
|
|
2009 |
|
2008 |
|
2007 |
|||||||||
|
|
|
|
|
||||||||||||
|
Current Liabilities: |
|
|
|
|
|
|
|
|
|
||||||
|
Accrued income taxes |
|
|
$ |
— |
|
|
|
$ |
— |
|
|
|
$ |
13,311 |
|
|
Non-Current Liabilities: |
|
|
|
|
|
|
|
|
|
|
|
|
|
|
|
|
Deferred income taxes (contra assets) |
|
|
|
14,390 |
|
|
|
|
28,887 |
|
|
|
|
12,898 |
|
|
Accrued income taxes |
|
|
|
35,674 |
|
|
|
|
14,738 |
|
|
|
|
6,406 |
|
|
|
|
|
|
||||||||||||
|
Total liability for unrecognized tax benefits |
|
|
$ |
50,064 |
|
|
|
$ |
43,625 |
|
|
|
$ |
32,615 |
|
|
|
|
|
|
||||||||||||
As of December 31, 2009 and 2008, the total amount of unrecognized tax benefits that, if recognized, would favorably affect Sotheby’s effective income tax rate are $33.5 million and $33.6 million, respectively.
The table below presents a reconciliation of the beginning and ending balances of the liability for unrecognized tax benefits, excluding interest and penalties, for the years ended December 31, 2009, 2008 and 2007 (in thousands of dollars):
|
|
|
|
|
|
|
|
|
|
|
|
|
|
|
|
|
|
|
|
2009 |
|
2008 |
|
2007 |
|||||||||
|
|
|
|
|
||||||||||||
|
Balance at January 1 |
|
|
$ |
43,625 |
|
|
|
$ |
32,615 |
|
|
|
$ |
16,837 |
|
|
Increases in unrecognized tax benefits related to the current year |
|
|
|
6,373 |
|
|
|
|
12,731 |
|
|
|
|
6,427 |
|
|
Increases in unrecognized tax benefits related to prior years |
|
|
|
3,546 |
|
|
|
|
8,775 |
|
|
|
|
11,440 |
|
|
Decreases in unrecognized tax benefits related to prior years |
|
|
|
(137 |
) |
|
|
|
(8,935 |
) |
|
|
|
(2,089 |
) |
|
Decreases in unrecognized tax benefits related to settlements |
|
|
|
(3,200 |
) |
|
|
|
(1,486 |
) |
|
|
|
— |
|
|
Decreases in unrecognized tax benefits due to lapse of the applicable statute of limitations |
|
|
|
(143 |
) |
|
|
|
(75 |
) |
|
|
|
— |
|
|
|
|
|
|
||||||||||||
|
Balance at December 31 |
|
|
$ |
50,064 |
|
|
|
$ |
43,625 |
|
|
|
$ |
32,615 |
|
|
|
|
|
|
||||||||||||
The net increases in the liability for unrecognized tax benefits related to current and prior years is primarily attributable to increased reserves related to foreign earnings, transfer pricing and loss carryforwards, partially offset by the reduction of the liability for unrecognized tax benefits due to the settlement of a federal tax audit.
77
Sotheby’s recognizes interest expense and penalties related to unrecognized tax benefits as a component of income tax expense. In addition to the adjustment above, upon the adoption of the new accounting rules that became effective in the first quarter of 2007, Sotheby’s increased its accrual for such interest to $1.2 million, an increase of $0.5 million from December 31, 2006. In 2009, Sotheby’s increased its accrual for interest and penalties by $0.6 million. In 2008, Sotheby’s decreased its accrual for interest and penalties by $1.5 million, after recognizing an increase of $1.5 million in 2007. As of December 31, 2009, 2008 and 2007, the liability for tax related interest and penalties included in the Consolidated Balance Sheets was $1.8 million, $1.2 million and $2.7 million, respectively. The net increase in 2009 is primarily due to the accrual of an additional year of interest. The net decrease in 2008 is primarily due to the resolution of a New York City tax audit for tax years 1997 through 2001 and a change in the tax accounting method related to inventory valuation that was adopted in 2008.
Sotheby’s policy is to record interest expense related to sales, value added and other taxes as Interest Expense in the Consolidated Statements of Operations. Penalties related to such taxes are recorded as General and Administrative Expenses in the Consolidated Statements of Operations. Interest expense and penalties related to income taxes are recorded as a component of Income Tax Expense in the Consolidated Statements of Operations.
Sotheby’s is subject to taxation in the U.S. and various state and foreign jurisdictions. Sotheby’s tax years that are open for audit for federal purposes and for major state, local and foreign jurisdictions are as follows:
Federal:
|
|
|
|
|
|
• |
1998 to 2009 |
|
|
|
|
|
|
Major state and local jurisdictions: |
|
|
|
|
|
|
|
• |
New York State: 2004 to 2009 |
|
|
|
|
|
|
• |
New York City: 2002 to 2009 |
|
|
|
|
|
|
• |
California: 2002 to 2009 |
|
|
|
|
|
|
Major foreign jurisdictions: |
|
|
|
|
|
|
|
• |
Hong Kong: 1998 and 2002 to 2009 |
|
|
|
|
|
|
• |
U.K.: 2005 to 2009 |
Management believes it is reasonably possible that a decrease of $9.8 million in the balance of unrecognized tax benefit can occur within 12 months of the December 31, 2009 balance sheet date as a result of the tolling of the expiration of the statute of limitations and an expected settlement of an ongoing tax audit.
Note P—Lease Commitments
Sotheby’s conducts business on premises leased in various locations under long-term operating leases expiring at various dates through 2060. In 2009, 2008 and 2007, net rental expense under Sotheby’s operating leases was $16.4 million, $17.5 million and $14.7 million, respectively.
Future minimum lease payments due under noncancelable operating leases in effect at December 31, 2009 are as follows (in thousands of dollars):
|
|
|
|
|
|
|
|
2010 |
|
|
$ |
14,375 |
|
|
2011 |
|
|
|
10,623 |
|
|
2012 |
|
|
|
8,834 |
|
|
2013 |
|
|
|
8,234 |
|
|
2014 |
|
|
|
7,661 |
|
|
Thereafter |
|
|
|
39,631 |
|
|
|
|
||||
|
Total future minimum lease payments |
|
|
$ |
89,358 |
|
|
|
|
Sotheby’s has an existing lease for warehouse space in London which expires in the first quarter of 2011. The table above does not include rental payments for a lease related to a new London warehouse facility which we anticipate signing in the first quarter of 2010. Rental payments for this facility are expected to be approximately $0.9 million annually from 2010 through 2014 and $12.9 million, in total, thereafter.
78
The future minimum lease payments in the table above exclude future minimum sublease rental receipts of $6.5 million owed to Sotheby’s under non-cancelable subleases.
In addition to the operating lease payments in the table above, under the terms of certain leases, Sotheby’s is required to pay real estate taxes and utility costs and may be subject to escalations in the amount of future minimum lease payments based on certain contractual provisions.
Note Q—Shareholders’ Equity and Share-Based Payments
Common Stock—The principal U.S. market for Sotheby’s Common Stock is the New York Stock Exchange (the “NYSE”) (Symbol: BID). Each share of Common Stock is entitled to one vote.
Preferred Stock—Sotheby’s has the authority to issue 50 million shares of no par value preferred stock. No shares of preferred stock were outstanding as of December 31, 2009, 2008 and 2007.
Dividends—The following table summarizes dividends declared and paid in 2009, 2008 and 2007 (in thousands of dollars, except per share amounts):
|
|
|
|
|
|
|
Year |
|
Per Share |
|
Total |
|
|
|
|||
|
2009 |
|
$0.30 |
|
$20,434 |
|
2008 |
|
$0.60 |
|
$40,651 |
|
2007 |
|
$0.50 |
|
$33,326 |
On February 26, 2010, Sotheby’s Board of Directors declared a quarterly dividend on its common stock of $0.05 per share (approximately $3.4 million) to be paid on March 16, 2010 to shareholders of record as of March 9, 2010. (See Note M.)
Share-Based Payments—Share-based payments to employees include restricted stock, restricted stock units and stock options. The table below summarizes the compensation expense recorded in 2009, 2008 and 2007 for such share-based payments:
|
|
|
|
|
|
|
|
|
|
|
|
|
|
|
2009 |
|
2008 |
|
2007 |
|
|||
|
|
|
|
|
|
||||||
|
|
|
(Thousands of dollars) |
|
|||||||
|
Pre-Tax |
|
$ |
20,750 |
|
$ |
30,396 |
|
$ |
28,163 |
|
|
After-Tax |
|
$ |
14,210 |
|
$ |
20,778 |
|
$ |
19,574 |
|
In 2008 and 2007, the cash value of excess tax benefits related to share-based payment arrangements was approximately $1.1 million and $15.7 million, respectively. These excess tax benefits are recognized in Additional Paid-in Capital in the Consolidated Balance Sheets and reflected within cash provided by financing activities in the Consolidated Statements of Cash Flows and represent the amount by which Sotheby’s tax deduction from the vesting and exercising of equity awards exceeds the tax benefit recorded for book purposes.
Stock Options— Stock options issued pursuant to the Sotheby’s 1997 Stock Option Plan (the “Stock Option Plan”) are exercisable into authorized but unissued shares of Common Stock. Stock options generally vest evenly over four years and generally expire ten years after the date of grant. Stock options vest immediately upon a change in control of Sotheby’s (as defined in the plan document for the Stock Option Plan, as amended). The fair value of a stock option is estimated using a Black-Scholes option valuation model, which utilizes assumptions for:
|
|
|
|
|
|
• |
Expected life: The expected life is the length of time the stock option is expected to be outstanding and is estimated using historical data for exercises and forfeitures. |
|
|
|
|
|
|
• |
Risk-free rate of return: The risk-free rate of return is based on the available yield for U.S. Treasury securities with a maturity that approximates the expected life of the stock option. |
|
|
|
|
|
|
• |
Expected volatility: The expected volatility is based on historic stock price volatility for a period approximately equal to the expected life of the stock option. |
|
|
|
|
|
|
• |
Dividend yield: The dividend yield is the expected rate of dividends to be paid throughout the expected life of the stock option. |
As of December 31, 2009, 0.5 million shares of Common Stock were available for the issuance of stock options under the Stock Option Plan. No stock options were granted by Sotheby’s in 2009, 2008 and 2007. On February 9, 2010, the Compensation Committee of Sotheby’s Board of Directors (the “Compensation Committee”) approved a grant of 0.5 million stock options to five senior executives. These stock options have an exercise price of $22.11 and vest evenly over four years.
79
Changes in the number of stock options outstanding during 2009 were as follows (shares and aggregate intrinsic value in thousands):
|
|
|
|
|
|
|
|
|
|
|
|
|
|
|
|
|
|
|
|
|
Options |
|
Weighted |
|
Weighted |
|
Aggregate |
||||||||
|
|
|
|
|
|
||||||||||||
|
Outstanding at January 1, 2009 |
|
942 |
|
|
|
$ |
16.79 |
|
|
|
|
|
|
|
|
|
|
Expired |
|
(7 |
) |
|
|
$ |
36.43 |
|
|
|
|
|
|
|
|
|
|
Exercised |
|
(302 |
) |
|
|
$ |
17.72 |
|
|
|
|
|
|
|
|
|
|
|
|
|
|
|
|
|
|
|
|
|
||||||
|
Outstanding at December 31, 2009 |
|
633 |
|
|
|
$ |
16.12 |
|
|
2.8 |
|
|
|
$ |
4,032 |
|
|
|
|
|
|
|
||||||||||||
|
Exercisable at December 31, 2009 |
|
633 |
|
|
|
$ |
16.12 |
|
|
2.8 |
|
|
|
$ |
4,032 |
|
|
|
|
|
|
|
||||||||||||
The aggregate intrinsic value of options exercised during 2009, 2008 and 2007 was $0.8 million, $0.4 million and $33.8 million, respectively. Cash received from stock options that were exercised in 2009 totaled $5.3 million. Of this amount, $1.2 million was received in 2009 and $4.1 million was received in January 2010. Cash received from the exercise of stock options in 2008 and 2007 was $0.3 million and $18.6 million, respectively. In 2009, 2008 and 2007, the tax benefit realized from the exercise of stock options totaled $0.3 million, $0.1 million and $11 million, respectively.
Restricted Stock and Restricted Stock Units— In February 2003, the Compensation Committee approved the adoption of the Restricted Stock Plan, effective May 1, 2003. The Restricted Stock Plan was approved by a vote of shareholders on April 29, 2003. The Restricted Stock Plan was amended, effective February 1, 2009, to become the Sotheby’s Restricted Stock Unit Plan (the “Restricted Stock Unit Plan”), whereby awards granted under the Restricted Stock Unit Plan may be in the form of Restricted Stock Units (“RSU’s”), rather than unvested shares of common stock (“Restricted Stock”). The award of RSU’s in lieu of Restricted Stock shares offers certain tax advantages and flexibility to recipients. The purpose of the Restricted Stock Unit Plan is to enable Sotheby’s to retain valued employees and to continue to attract the finest executives.
In making awards under the Restricted Stock Unit Plan, the Compensation Committee takes into account the nature of the services rendered by employees, their present and potential contributions to Sotheby’s success, and such other factors as the Compensation Committee in its discretion deems relevant.
Restricted Stock and RSU’s generally vest evenly over four years; however, Restricted Stock issued through 2008 in connection with the Sotheby’s Executive Bonus Plan (the “EBP”) vest evenly over three years and certain shares issued to William F. Ruprecht, Sotheby’s President and Chief Executive Officer, vest over three and five-year periods subject to the achievement of certain company profitability or share price targets. Prior to vesting, holders of Restricted Stock have voting rights and are entitled to receive dividends, while holders of RSU’s do not have voting rights, but are entitled to receive dividend equivalents. Dividends and dividend equivalents paid to holders of Restricted Stock and RSU’s are not forfeitable. Restricted Stock and RSU’s may not be sold, assigned, transferred, pledged or otherwise encumbered until they vest.
In February 2009, the Compensation Committee approved the issuance of the following Restricted Stock Unit awards, which vest ratably after each of the first, second, third and fourth years following the date of grant:
|
|
|
|
|
|
• |
709,655 RSU’s with a fair value of $5.9 million related to Sotheby’s incentive compensation program. |
|
|
|
|
|
|
• |
192,407 RSU’s with a fair value of $1.6 million related to executive employment arrangements, including 168,878 RSU’s with a fair value of $1.4 million issued to Mr. Ruprecht, as discussed below. |
|
|
|
|
|
|
• |
86,208 RSU’s with a value of $0.7 million issued at the discretion of the Compensation Committee. |
In 2009, changes in the number of outstanding Restricted Stock and RSU’s were as follows (shares in thousands):
|
|
|
|
|
|
|
|
|
|
|
|
|
Restricted
Stock |
|
Weighted
Average |
||||
|
|
|
|
||||||
|
Outstanding at January 1, 2009 |
|
2,537 |
|
|
|
$ |
31.36 |
|
|
Granted |
|
988 |
|
|
|
$ |
8.28 |
|
|
Vested |
|
(864 |
) |
|
|
$ |
30.99 |
|
|
Canceled |
|
(40 |
) |
|
|
$ |
25.26 |
|
|
|
|
|
||||||
|
Outstanding at December 31, 2009 |
|
2,621 |
|
|
|
$ |
22.80 |
|
|
|
|
|
||||||
80
The aggregate fair value of Restricted Stock that vested during 2009, 2008 and 2007 was $8.7 million, $21.2 million and $23.4 million, respectively, based on the closing stock price on the dates the shares vested. As of December 31, 2009, unrecognized compensation expense related to the unvested portion of share-based payments was $13.2 million. This compensation expense is expected to be recognized over a weighted-average period of approximately 1.9 years. Sotheby’s does not capitalize any compensation expense related to share-based payments to employees. As of December 31, 2009, 2 million shares were available for future awards granted pursuant to the Restricted Stock Unit Plan.
On February 9, 2010 the Compensation Committee approved the issuance of 38,451 RSU’s with a fair value of $0.9 million related to certain executive employment arrangements.
Performance Share Units (2010)—Performance Share Units (or “PSU’s”) are RSU’s that vest over four years only if Sotheby’s achieves certain profitability targets. Prior to vesting, holders of PSU’s do not have voting rights and are not entitled to receive dividend equivalents. Dividend equivalents will be credited to holders of PSU’s, but will only be paid for the portion of PSU’s that vest. PSU’s may not be sold, assigned, transferred, pledged or otherwise encumbered until they vest. The Compensation Committee believes that PSU’s better aligns Sotheby’s variable compensation strategy with its financial performance and the cyclical nature of the art market and further aligns the interests of Sotheby’s management with its shareholders. Accordingly, with limited exceptions, Sotheby’s intends to grant future equity awards in the form of PSU’s with performance and service conditions, rather than RSU’s with service conditions only.
On February 9, 2010, the Compensation Committee approved the issuance of the following PSU’s pursuant to the Restricted Stock Unit Plan:
|
|
|
|
|
|
• |
542,743 PSU’s with a fair value of $12 million related to Sotheby’s incentive compensation programs. |
|
|
|
|
|
|
• |
320,500 PSU’s with a fair value of $2.4 million to replace certain prior Restricted Stock awards that management determined were unlikely to vest because the underlying company profitability and/or stock price targets would not be achieved. See “Modification of Prior Restricted Stock Awards” below. |
|
|
|
|
|
|
• |
99,503 PSU’s with a fair value of $2.2 million issued to Mr. Ruprecht in relation to his employment arrangement. See “Chief Executive Officer Employment Arrangement” below. |
Modification of Prior Restricted Stock Awards—In conjunction with employment arrangements entered into with certain senior executives in the third quarter of 2006, Sotheby’s granted 427,531 Restricted Stock shares that would vest over three and five-year periods concurrent with the terms of their employment arrangements if certain company profitability or share price targets were achieved as of June 30, 2009 and/or June 30, 2011. Sotheby’s did not meet either of the profitability or share price targets as of June 30, 2009. As a result, 256,519 of these Restricted Stock shares that were available to vest on June 30, 2009 did not vest. Additionally, management did not expect any of the 427,531 Restricted Stock shares that were available to vest on June 30, 2011 to vest.
On February 9, 2010, the Compensation Committee approved the cancellation of these awards and the simultaneous issuance of 320,500 PSU’s with a fair value of $2.4 million. The purpose of these actions is to provide continued motivation and additional years of retention incentives to the senior executives receiving the awards. These PSU’s will vest evenly over four years only if Sotheby’s achieves certain profitability targets. As per the relevant accounting rules regarding share-based payments, the issuance of a new equity award to replace an existing equity award is treated as a modification of the existing award. Accordingly, the fair value of these new PSU awards is the excess of the fair value of the new award when compared to the fair value of the cancelled award at the date of simultaneous cancellation and issuance.
Chief Executive Officer Employment Arrangement—On April 1, 2006, in conjunction with his employment arrangement and in an effort to encourage and reward the growth of shareholder value, Sotheby’s granted Mr. Ruprecht a one-time award of 300,000 Restricted Stock shares that would only vest for Mr. Ruprecht over three and five-year periods concurrent with the term of his employment arrangement if certain company profitability or share price targets were achieved as of December 31, 2008 and/or December 31, 2010. The three-year profitability target was achieved on December 31, 2008. Accordingly, 180,000 of these Restricted Stock shares vested on May 9, 2009. Management does not expect the remaining 120,000 Restricted Stock shares to vest.
81
Also in conjunction with his employment arrangement, beginning in 2007, Mr. Ruprecht is entitled to an annual award under the Restricted Stock Unit Plan, subject to agreed annual minimum ($1.4 million) and maximum ($2.2 million) levels, the value of which is determined at the discretion of the Compensation Committee. Pursuant to this provision of his employment arrangement, Mr. Ruprecht received the following awards:
|
|
|
|
|
|
• |
57,277 Restricted Stock shares granted on February 9, 2007 with a fair value of $2.2 million. |
|
|
|
|
|
|
• |
71,267 Restricted Stock shares granted on February 10, 2008 with a fair value of $2.2 million. |
|
|
|
|
|
|
• |
168,868 RSU’s granted on February 11, 2009 with a fair value of $1.4 million. |
Mr. Ruprecht requested that he not receive cash incentive compensation in respect to 2009 and that he receive his contractually mandated RSU award in the form of PSU’s. Accordingly, on February 8, 2010, the Compensation Committee, at its discretion, granted to Mr. Ruprecht 99,503 PSU’s with a fair value of $2.2 million that will vest over four years only if Sotheby’s achieves certain profitability targets.
Stock Compensation Plan for Non-Employee Directors—Effective May 7, 2007, Sotheby’s amended Sotheby’s Stock Compensation Plan for Non-Employee Directors. As of December 31, 2009, Sotheby’s had reserved 22,887 shares available in connection with this plan. In 2009, 2008 and 2007, the number of shares issued to non-employee directors under this plan (including deferred stock units) was 36,266, 24,761 and 8,528, respectively.
Note R—Pension Arrangements
Retirement Savings Plan—Sotheby’s sponsors a qualified defined contribution plan for its U.S. employees who have met certain minimum length of service requirements (the “Retirement Savings Plan”). Participants in the Retirement Savings Plan may elect to contribute between 2% and 20% of their eligible pre-tax compensation, up to the maximum amount allowable under Internal Revenue Service (“IRS”) regulations. Prior to May 2009, participant savings were matched by a contribution from Sotheby’s of up to 6% of each participant’s eligible compensation. In May 2009, the Retirement Savings Plan was amended to reduce the level of Sotheby’s maximum matching contributions to 3% of each participant’s eligible compensation. Sotheby’s may also contribute an annual discretionary amount to the Retirement Savings Plan, which varies as a percentage of each participant’s eligible compensation depending on company profitability and subject to the maximum amount allowable under IRS regulations. In 2009 and 2008, Sotheby’s did not make a discretionary contribution to the Retirement Savings Plan due to the lower level of company financial results in those years. In 2007, Sotheby’s made a discretionary contribution of $2 million to the Retirement Savings Plan, which was equal to 4% of each participant’s eligible compensation. In 2009, 2008 and 2007, pension expense recorded within Salaries and Related Costs related to the Retirement Savings Plan, net of forfeitures, was $1.4 million, $2.4 million and $5.3 million, respectively.
Deferred Compensation Plan—Through December 31, 2006, Sotheby’s sponsored an unfunded deferred compensation plan, the Sotheby’s, Inc. 2005 Benefit Equalization Plan (the “2005 BEP”). The 2005 BEP was available to certain officers of Sotheby’s for whom contributions to the Retirement Savings Plan were limited by IRS regulations. On December 7, 2006, the Sotheby’s Deferred Compensation Plan (the “DCP”) was adopted, effective January 1, 2007. The DCP replaced the 2005 BEP and its predecessor, the Sotheby’s, Inc. 1988 Benefit Equalization Plan. The DCP provides participants with a broad menu of investment crediting options which track a portfolio of various deemed investment funds. Sotheby’s provides matching and discretionary contributions on the same basis as the Retirement Savings Plan, as discussed above. In 2009 and 2008, Sotheby’s did not make a discretionary contribution to the DCP due to the lower level of company financial results in those years. In 2007, Sotheby’s made a discretionary contribution of $0.8 million to the DCP, which was equal to 4% of each participant’s eligible compensation.
82
Employee deferrals and Sotheby’s contributions to the DCP are informally funded into a rabbi trust which provides benefit security by sheltering assets in the event of a change-in-control of Sotheby’s and certain other situations. DCP liabilities are financed through the trust almost entirely by using company-owned variable life insurance (or “COLI”), and, to a much lesser extent, investments in mutual funds. As of December 31, 2009 and 2008, the DCP liability was $34.5 million and $31.5 million, respectively, and the assets held in the rabbi trust consisted of the following:
|
|
|
|
|
|
|
|
|
|
|
|
|
|
|
December 31, 2009 |
|
December 31, 2008 |
||||||
|
|
|
|
||||||||
|
|
|
(in thousands of dollars) |
||||||||
|
Company-owned variable life insurance * |
|
|
$ |
36,996 |
|
|
|
$ |
18,820 |
|
|
Mutual fund investments ** |
|
|
|
455 |
|
|
|
|
14,371 |
|
|
|
|
|
|
|||||||
|
Total |
|
|
$ |
37,451 |
|
|
|
$ |
33,191 |
|
|
|
|
|
|
|||||||
|
|
|
|
|
|
* |
The COLI is reflected at its cash surrender value in the Consolidated Balance Sheets within Trust Assets Related to Deferred Compensation Liability. |
|
|
|
|
|
|
** |
The mutual fund investments are classified as trading securities and reflected at fair value in the Consolidated Balance Sheets within Trust Assets Related to Deferred Compensation Liability (see Note V). |
Changes in the fair value of the DCP liability, which result from gains and losses in deemed participant investments, are recognized in earnings within Salaries and Related Costs in the period in which they occur. Gains in deemed participant investments increase the DCP liability, as well as Salaries and Related Costs. Losses in deemed participant investments decrease the DCP liability, as well as Salaries and Related Costs. In 2009, 2008 and 2007, net gains (losses) in deemed participant investments totaled $4.5 million, ($6) million and $1.9 million, respectively.
Gains and losses resulting from changes in the fair value of the cash surrender value of the COLI and the mutual fund investments are recognized in earnings below Operating Income within Other Income (Expense) in the period in which they occur. In 2009, 2008 and 2007, net gains (losses) related to the COLI and the mutual fund investments were $3.6 million, ($5.1) million and $1.9 million, respectively. The net loss for 2008 includes a $1.8 million life insurance benefit realized as the result of the death of a DCP participant.
Defined Benefit Plan (U.K.)—Sotheby’s sponsors a defined benefit pension plan covering a portion of its U.K. employees. Effective April 1, 2004, the U.K. Pension Plan was closed to new employees. From that date, a defined contribution plan was made available to new employees in the U.K.
On December 31, 2006 and January 1, 2008, new accounting rules became effective which changed the balance sheet recognition and measurement date requirements for defined benefit pension plans. On December 31, 2006, Sotheby’s adopted the balance sheet recognition provision of the new rules and recognized the funded status of the U.K. Pension Plan in its Consolidated Balance Sheet. On January 1, 2008, Sotheby’s adopted the measurement date provision of the new rules, which requires the measurement of plan assets and obligations as of the date of the employer’s fiscal year-end balance sheet (December 31 for Sotheby’s).
Prior to the adoption of the measurement date provision of the new rules, Sotheby’s used a September 30 measurement date for the U.K. Pension Plan. As a result of the change in the measurement date for the U.K. Pension Plan, Sotheby’s revalued the assets and benefit obligations of the U.K Pension Plan as of January 1, 2008. To account for the financial statement effect of the difference in measurement dates, the new accounting rules require that the net pension cost for the period between the measurement date that was used for the immediately preceding fiscal year-end (September 30, 2007 for Sotheby’s) and the beginning of the fiscal year that the measurement date provisions are first applied (January 1, 2008 for Sotheby’s), be recognized, net of taxes, as an adjustment to the opening balance of Retained Earnings. Accordingly, as a result of the adoption of the measurement date provision of the new rules for the U.K. Pension Plan, net pension cost of $0.2 million ($0.1 million, net of taxes) was recorded in the first quarter of 2008 as an adjustment to the January 1, 2008 balance of Retained Earnings.
The new accounting rules also require that other changes in the fair value of plan assets and benefit obligations (for example, actuarial and asset gains and losses) for the period between the measurement date that was used for the immediately preceding fiscal year end and the beginning of the fiscal year that the measurement date provision is first applied be recognized, net of taxes, as an adjustment of the opening balance of Accumulated Other Comprehensive Income (Loss). Accordingly, as a result of the adoption of the measurement date provision of the new rules for the U.K. Pension Plan, a $0.3 million gain ($0.2 million, net of taxes) was recorded in the first quarter of 2008 as an adjustment to the January 1, 2008 balance of Accumulated Other Comprehensive Income.
83
In February 2008, Sotheby’s agreed with the trustees of the U.K. Pension Plan (the “Trustees”) to cease advance funding of future discretionary benefit increases to retirees. On an annual basis, Sotheby’s, in consultation with the Trustees, now determines an appropriate level of funding of discretionary benefit increases to retirees for a particular year based on specific objective criteria related to the financial status of Sotheby’s and the U.K. Pension Plan. As a result of this agreement, an updated actuarial valuation was prepared as of February 29, 2008 reflecting a new assumption for the funding of discretionary benefit increases to retirees. In addition to this change, a number of the other actuarial assumptions were updated in the February 29, 2008 actuarial valuation to reflect then current market conditions.
Benefit Obligation
The table below details the change in the benefit obligation, the change in the fair value of plan assets, the funded status and the amounts recognized in the Consolidated Balance Sheets as of December 31, 2009 and 2008 for the U.K. Pension Plan:
|
|
|
|
|
|
|
|
|
|
|
|
|
December 31 |
|
2009 |
|
2008 |
||||||
|
|
|
|||||||||
|
|
|
(Thousands of dollars) |
||||||||
|
|
|
|
||||||||
|
Reconciliation of benefit obligation |
|
|
|
|
|
|
|
|
|
|
|
Benefit obligation at beginning of year |
|
|
$ |
192,190 |
|
|
|
$ |
310,410 |
|
|
Service cost for the transition period * |
|
|
|
— |
|
|
|
|
1,465 |
|
|
Interest cost for the transition period * |
|
|
|
— |
|
|
|
|
4,080 |
|
|
Employee contributions for the transition period * |
|
|
|
— |
|
|
|
|
224 |
|
|
Actuarial gain for the transition period * |
|
|
|
— |
|
|
|
|
(1,502 |
) |
|
Benefit payments for the transition period * |
|
|
|
— |
|
|
|
|
(1,079 |
) |
|
Service cost |
|
|
|
3,849 |
|
|
|
|
4,723 |
|
|
Interest cost |
|
|
|
12,334 |
|
|
|
|
15,044 |
|
|
Contributions by plan participants |
|
|
|
920 |
|
|
|
|
825 |
|
|
Actuarial loss (gain) |
|
|
|
30,712 |
|
|
|
|
(61,169 |
) |
|
Benefits paid |
|
|
|
(6,063 |
) |
|
|
|
(4,620 |
) |
|
Special termination benefits |
|
|
|
394 |
|
|
|
|
— |
|
|
Foreign currency exchange rate changes |
|
|
|
23,112 |
|
|
|
|
(76,211 |
) |
|
|
|
|
||||||||
|
Benefit obligation at end of year |
|
|
|
257,448 |
|
|
|
|
192,190 |
|
|
|
|
|
||||||||
|
|
|
|
|
|
|
|
|
|
|
|
|
Reconciliation of plan assets |
|
|
|
|
|
|
|
|
|
|
|
Fair value of plan assets at beginning of year |
|
|
|
203,411 |
|
|
|
|
324,420 |
|
|
Employee contributions for the transition period * |
|
|
|
— |
|
|
|
|
224 |
|
|
Benefit payments for the transition period * |
|
|
|
— |
|
|
|
|
(1,079 |
) |
|
Expected return on assets in the transition period * |
|
|
|
— |
|
|
|
|
4,137 |
|
|
Actual return on plan assets |
|
|
|
44,079 |
|
|
|
|
(45,975 |
) |
|
Employer contributions |
|
|
|
3,496 |
|
|
|
|
5,845 |
|
|
Contributions by plan participants |
|
|
|
920 |
|
|
|
|
825 |
|
|
Benefits paid |
|
|
|
(6,063 |
) |
|
|
|
(4,620 |
) |
|
Foreign currency exchange rate changes |
|
|
|
24,394 |
|
|
|
|
(80,366 |
) |
|
|
|
|
||||||||
|
Fair value of plan assets at end of year |
|
|
|
270,237 |
|
|
|
|
203,411 |
|
|
|
|
|
||||||||
|
Funded Status |
|
|
|
|
|
|
|
|
|
|
|
Net pension asset recognized |
|
|
$ |
12,789 |
|
|
|
$ |
11,221 |
|
|
|
|
|
||||||||
|
|
|
|
|
|
||
|
|
|
|
|
* |
Represents amounts recorded in conjunction with the adoption of the measurement date provision of the new accounting rules discussed above. |
|
84
Components of Net Pension (Benefit) Cost
In 2009, 2008 and 2007, the components of net pension (benefit) cost related to the U.K. Pension Plan were:
|
|
|
|
|
|
|
|
|
|
|
|
|
|
|
|
|
|
Year ended December 31 |
|
2009 |
|
2008 |
|
2007 |
|||||||||
|
|
|
|
|||||||||||||
|
|
|
(Thousands of dollars) |
|||||||||||||
|
Service cost |
|
|
$ |
3,849 |
|
|
|
$ |
4,723 |
|
|
|
$ |
8,456 |
|
|
Interest cost |
|
|
|
12,334 |
|
|
|
|
15,044 |
|
|
|
|
16,749 |
|
|
Expected return on plan assets |
|
|
|
(18,878 |
) |
|
|
|
(23,899 |
) |
|
|
|
(20,093 |
) |
|
Amortization of prior service cost |
|
|
|
13 |
|
|
|
|
15 |
|
|
|
|
90 |
|
|
Amortization of net loss |
|
|
|
— |
|
|
|
|
72 |
|
|
|
|
6,155 |
|
|
|
|
|
|
||||||||||||
|
Sub-total |
|
|
|
(2,682 |
) |
|
|
|
(4,045 |
) |
|
|
|
11,357 |
|
|
Special termination benefits |
|
|
|
394 |
|
|
|
|
— |
|
|
|
|
248 |
|
|
|
|
|
|
||||||||||||
|
Net pension (benefit) cost |
|
|
$ |
(2,288 |
) |
|
|
$ |
(4,045 |
) |
|
|
$ |
11,605 |
|
|
|
|
|
|
||||||||||||
In the table above, special termination benefits primarily relate to additional pension benefits owed to certain participants in the U.K. Pension Plan who were impacted by the 2009 Restructuring Plan (see Note L). The cost of such benefits is reflected in the Consolidated Statements of Operations within Restructuring Charges (net).
Amounts Recognized in Comprehensive Loss
The table below details the amounts recognized in Comprehensive Loss, net of taxes, related to the U.K. Pension Plan in 2009 and 2008:
|
|
|
|
|
|
|
|
|
|
|
|
|
Year ended December 31 |
|
2009 |
|
2008 |
||||||
|
|
|
|||||||||
|
|
|
(Thousands of dollars) |
||||||||
|
Net loss |
|
|
$ |
(3,873 |
) |
|
|
$ |
(6,142 |
) |
|
Amortization of prior service cost |
|
|
|
9 |
|
|
|
|
11 |
|
|
Amortization of net loss |
|
|
|
— |
|
|
|
|
52 |
|
|
|
|
|
||||||||
|
Total |
|
|
$ |
(3,864 |
) |
|
|
$ |
(6,079 |
) |
|
|
|
|
|
|||||||
In the table above, net loss is the change in the value of the benefit obligation and/or plan assets resulting from experience different from that assumed or from a change in actuarial assumptions.
Amounts Included in Accumulated Other Comprehensive Loss
The table below details the amounts included in Accumulated Other Comprehensive Loss, net of taxes, related to the U.K. Pension Plan that have not yet been recognized as components of net pension (benefit) cost as of December 31, 2009 and 2008:
|
|
|
|
|
|
|
|
|
|
|
|
|
December 31 |
|
2009 |
|
2008 |
||||||
|
|
|
|||||||||
|
|
|
(Thousands of dollars) |
||||||||
|
Net loss |
|
|
$ |
17,243 |
|
|
|
$ |
13,183 |
|
|
Prior service cost |
|
|
|
8 |
|
|
|
|
16 |
|
|
|
|
|
||||||||
|
Total |
|
|
$ |
17,251 |
|
|
|
$ |
13,199 |
|
|
|
|
|
|
|||||||
The net loss is being recognized over the expected remaining service lives of the active employees in the U.K. Pension Plan. As of December 31, 2009, this was estimated to be approximately 14.2 years. For the year ended December 31, 2009, prior service cost of approximately $8 thousand, net of taxes, is expected to be recognized as a component of the net pension benefit for the year. Accordingly, Accumulated Other Comprehensive Loss will be reduced by this amount.
85
Assumptions
The following assumptions were used in determining the benefit obligation and net pension (benefit) cost related to the U.K. Pension Plan:
|
|
|
|
|
|
|
|
|
|
|
|
|
Benefit Obligation |
|
2009 |
|
2008 |
||||||
|
|
|
|||||||||
|
Weighted average discount rate |
|
5.70% |
|
6.00% |
||||||
|
Weighted average rate of compensation increase |
|
5.50% |
|
4.80% |
||||||
|
|
|
|
|
|
|
|
|
Net Pension (Benefit) Cost |
|
2009 |
|
2008 |
|
2007 |
|
|
|
|
||||
|
Weighted average discount rate |
|
6.00% |
|
6.30% |
|
4.80% |
|
Weighted average rate of compensation increase |
|
4.80% |
|
5.30% |
|
4.75% |
|
Weighted average expected long-term rate of return on plan assets |
|
7.40% |
|
8.30% |
|
7.50% |
The expected long-term rate of return on plan assets is based on expected future appreciation, as well as dividend and interest yields currently available on equity and bond markets as of the measurement date and weighted according to the composition of invested assets as of that date.
Plan Assets
The investment policy for the U.K. Pension Plan is established by the Trustees in consultation with the management of Sotheby’s. The Trustees’ investment objective is to maximize the return on assets while controlling the level of risk so as to ensure that sufficient assets are available to pay participants’ benefits as and when they arise. The Trustees have agreed that a diversified portfolio of assets with a relatively high concentration of equity securities is appropriate. In order to avoid an undue concentration of risk, a diverse spread of assets is held. The diversification is both within and across asset categories. In setting specific asset allocation targets, the Trustees take expert advice as required from professional investment advisors. Additionally, the Trustees require that the majority of the assets be realizable at short notice. The Trustees’ current investment strategy includes target allocation percentages of approximately 68% for growth assets and approximately 32% for debt securities and other assets. These target allocation percentages are spread across different categories within each asset class and permit actual allocation percentages to fall within a reasonable range of these targets.
The investment managers for the U.K. Pension Plan have full discretion in making investment decisions, subject to broad guidelines established by the Trustees. It is the Trustees’ policy not to invest in shares of Sotheby’s or any of its subsidiaries. The performance of the investment managers is benchmarked against suitable indices.
The table below presents the components of the U.K. Pension Plan assets as of December 31, 2009 and 2008 (in thousands of dollars):
|
|
|
|
|
|
|
|
|
|
|
|
|
|
|
|
|
|
|
|
|
2009 |
|
% of total |
|
2008 |
|
% of total |
||||||||
|
|
|
|
|
|
||||||||||||
|
Equity securities |
|
|
$ |
189,210 |
|
|
70 |
% |
|
|
$ |
129,447 |
|
|
64 |
% |
|
Debt securities: |
|
|
|
|
|
|
|
|
|
|
|
|
|
|
|
|
|
Government |
|
|
|
17,131 |
|
|
6 |
% |
|
|
|
17,350 |
|
|
8 |
% |
|
Corporate |
|
|
|
21,284 |
|
|
8 |
% |
|
|
|
17,992 |
|
|
9 |
% |
|
Indexed-linked |
|
|
|
37,310 |
|
|
14 |
% |
|
|
|
31,956 |
|
|
16 |
% |
|
|
|
|
|
|
|
|
|
|
||||||||
|
Total debt securities |
|
|
|
75,725 |
|
|
28 |
% |
|
|
|
67,298 |
|
|
33 |
% |
|
|
|
|
|
|
|
|
|
|
||||||||
|
Real estate mutual funds |
|
|
|
3,989 |
|
|
1 |
% |
|
|
|
3,702 |
|
|
2 |
% |
|
Cash and cash equivalents |
|
|
|
1,313 |
|
|
1 |
% |
|
|
|
2,964 |
|
|
1 |
% |
|
|
|
|
|
|
|
|
|
|
||||||||
|
Total fair value of plan assets |
|
|
$ |
270,237 |
|
|
|
|
|
|
$ |
203,411 |
|
|
|
|
|
|
|
|
|
|
|
|
|
|
|
|||||||
As of December 31, 2009, Sotheby’s adopted a new accounting rule that requires enhanced disclosures about pension plan assets that are measured at fair value. This new accounting rule is aligned with the hierarchical disclosure framework for financial instruments measured and reported at fair value adopted in January 2008 that prioritizes and ranks the level of market price observability used in measuring assets at fair value.
86
Assets measured at fair value are classified and disclosed according to one of the following categories:
|
|
|
|
|
|
• |
Level 1—Quoted prices are available in active markets for identical assets or liabilities as of the reporting date. Level 1 inputs generally provide the most reliable evidence of fair value. |
|
|
|
|
|
|
• |
Level 2—Pricing inputs are other than quoted prices in active markets, which are either directly or indirectly observable as of the reporting date, and fair value may be determined through the use of models or other valuation methodologies. |
|
|
|
|
|
|
• |
Level 3—Pricing inputs are unobservable for the asset or liability and include situations where there is little, if any, market activity for the investment. The inputs into the determination of fair value require significant management judgment or estimation. |
The table below provides fair value measurement information for the U.K. Pension Plan assets as of December 31, 2009 (in thousands of dollars):
|
|
|
|
|
|
|
|
|
|
|
|
|
|
|
|
|
|
|
|
|
|
|
|
|
|
|
|
Fair Value Measurements Using: |
|||||||||||||||||
|
|
|
|
|
||||||||||||||||||
|
|
|
Total Fair |
|
Quoted |
|
Significant Other |
|
Significant |
|||||||||||||
|
|
|
|
|
|
|||||||||||||||||
|
|
Equity securities |
|
|
$ |
189,210 |
|
|
|
$ |
189,210 |
|
|
|
$ |
— |
|
|
|
$ |
— |
|
|
|
Debt securities: |
|
|
|
|
|
|
|
|
|
|
|
|
|
|
|
|
|
|
|
|
|
|
Government |
|
|
|
17,131 |
|
|
|
|
17,131 |
|
|
|
|
— |
|
|
|
|
— |
|
|
|
Corporate |
|
|
|
21,284 |
|
|
|
|
21,284 |
|
|
|
|
— |
|
|
|
|
— |
|
|
|
Indexed-linked |
|
|
|
37,310 |
|
|
|
|
37,310 |
|
|
|
|
— |
|
|
|
|
— |
|
|
|
|
|
|
|
|
||||||||||||||||
|
|
Total debt securities |
|
|
|
75,725 |
|
|
|
|
75,725 |
|
|
|
|
— |
|
|
|
|
— |
|
|
|
|
|
|
|
|
||||||||||||||||
|
|
Real estate mutual funds |
|
|
|
3,989 |
|
|
|
|
— |
|
|
|
|
3,989 |
|
|
|
|
— |
|
|
|
Cash and cash equivalents |
|
|
|
1,313 |
|
|
|
|
1,313 |
|
|
|
|
— |
|
|
|
|
— |
|
|
|
|
|
|
|
|
||||||||||||||||
|
|
Total fair value of plan assets |
|
|
$ |
270,237 |
|
|
|
$ |
266,248 |
|
|
|
$ |
3,989 |
|
|
|
$ |
— |
|
|
|
|
|
|
|
|
||||||||||||||||
Level 1 Fair Value Measurements
Equity securities—The U.K. Pension Plan assets include investments in publicly-traded equity mutual funds and other publicly-traded stocks, the fair values of which are based on exchange quoted prices in active markets.
Debt securities—The U.K. Pension Plan assets include investments in publicly-traded bond mutual funds and other publicly-traded bonds, the fair values of which are based on exchange quoted prices in active markets.
Cash and cash equivalents—The U.K. Pension Plan assets include investments in cash and money market instruments that are highly liquid and for which book value approximates fair value.
Level 2 Fair Value Measurements
Real Estate Mutual Funds—The U.K. Pension Plan assets include investments in real estate mutual funds, the fair value of which are based on directly and indirectly observable real estate prices, including comparable prices.
87
Estimated Future Benefit Payments
Estimated future benefit payments related to the U.K. Pension Plan, which reflect expected future service, as appropriate, are as follows (in thousands of dollars):
|
|
|
|
|
|
|
|
Year |
|
Benefit |
|||
|
|
|||||
|
2010 |
|
|
$ |
7,608 |
|
|
2011 |
|
|
$ |
7,732 |
|
|
2012 |
|
|
$ |
8,032 |
|
|
2013 |
|
|
$ |
7,088 |
|
|
2014 |
|
|
$ |
8,132 |
|
|
2015-2019 |
|
|
$ |
59,855 |
|
Contributions
In 2009, Sotheby’s contributed $3.5 million to the U.K. Pension Plan and expects to contribute approximately $3.2 million to the plan in 2010.
Note S—Commitments and Contingencies
Employment Arrangements—As of December 31, 2009, Sotheby’s had employment arrangements with certain senior employees, which expire at various points between March 2011 and February 2012. Such arrangements provide, among other benefits, for minimum salary levels and for incentive compensation under Sotheby’s incentive compensation programs which are payable only if specified Sotheby’s and individual goals are attained. Additionally, certain of these arrangements provide annual equity grants, the accelerated vesting of certain equity grants, severance payments, other cash compensation and continuation of benefits upon termination of employment under certain circumstances. The aggregate remaining commitment for salaries and other cash compensation related to these employment arrangements, excluding any participation in Sotheby’s incentive compensation and share-based payment programs, was approximately $11 million as of December 31, 2009.
Lending Commitments— Sotheby’s enters into legally binding arrangements to lend, primarily on a collateralized basis and subject to certain limitations and conditions, to potential consignors and other individuals who have collections of art. Unfunded commitments to extend additional credit were $7.2 million on December 31, 2009, of which $1 million is committed to an employee of Sotheby’s.
Legal Actions—Sotheby’s becomes involved in various claims and lawsuits incidental to the ordinary course of its business, including the matter described below. While it is not possible to predict the outcome of litigation, management does not believe that the outcome of any of these pending claims or proceedings will have a material adverse effect on Sotheby’s consolidated results of operations, financial condition and/or cash flows.
Sotheby’s Inc. v. Halsey Minor is an action commenced by a subsidiary of Sotheby’s in September 2008 in the U.S. District Court for the Southern District of New York, seeking to collect approximately $18 million for three paintings (of which approximately $12 million has been collected as of the date of this filing) that Mr. Minor purchased in auctions conducted by Sotheby’s in the spring of 2008. Mr. Minor filed a counterclaim in that action alleging that Sotheby’s had failed to disclose that the consignor of one of those paintings had an outstanding loan from Sotheby’s and asserting that the sale should, therefore, be rescinded or the price of the painting reduced. In October 2008, Mr. Minor commenced a separate action in the U.S. District Court for the Northern District of California seeking recovery for alleged losses on behalf of a purported class of purchasers of properties that were subject to alleged undisclosed loans from Sotheby’s. That action also asserted breaches of fiduciary duties arising from alleged art consulting advice provided to Mr. Minor by a Sotheby’s employee. The California action that Mr. Minor had commenced against Sotheby’s has been dismissed. In April 2009, Mr. Minor filed a motion in the New York action seeking to amend his answer and counterclaim to (i) broaden his rescission claim to cover an additional painting, (ii) add claims for alleged breach of fiduciary duty and alleged violations of a New York State consumer protection statute and (iii) seek injunctive relief. In May 2009, Sotheby’s opposed that motion and, in addition, moved for summary judgment against certain of Mr. Minor’s claims. In July 2009, Sotheby’s moved for summary judgment against the remainder of Mr. Minor’s claims, and Mr. Minor moved for summary judgment in favor of certain of his claims. In October 2009, the Magistrate Judge assigned to this action issued an opinion and order denying Mr. Minor’s motion for leave to file an amended answer and counterclaim to the extent that Mr. Minor sought to assert claims for breach of fiduciary duty and violations of the New York State consumer protection statute. We are awaiting a decision from the Court on the remaining motions. Management believes that there are meritorious defenses to the claims asserted in the counterclaim to the New York action and it is being vigorously defended.
88
Noortman Master Paintings—On June 7, 2006, Sotheby’s entered into a sale and purchase agreement (the “Purchase Agreement”) with Arcimboldo S.A. (“Arcimboldo”) pursuant to which Sotheby’s acquired all of the issued and outstanding shares of capital stock of NMP. Pursuant to the Purchase Agreement, Sotheby’s paid initial consideration (the “Initial Consideration”) in the form of 1,946,849 shares of Sotheby’s Common Stock. If NMP fails to achieve a minimum level of financial performance during the five years following the closing of the transaction, up to 20% of the Initial Consideration will be transferred back to Sotheby’s.
In addition to the Initial Consideration, an additional 486,712 shares of Sotheby’s Common Stock (the “Additional Consideration”) was issued and placed in escrow, to be released only if NMP achieves certain targeted performance and service criteria specified in the Purchase Agreement during the five years following the closing of the transaction. Based on the closing price of Sotheby’s Common Stock on the NYSE of $24.18 per share on February 17, 2010, the Additional Consideration had a fair value of approximately $11.8 million. The Additional Consideration is being held in escrow pursuant to an escrow agreement among the parties to the Purchase Agreement and LaSalle Bank N.A., dated June 7, 2006.
(See Notes H, L, M and T for other commitments. See Notes F, O and T for other contingencies.)
Note T—Auction Guarantees
From time to time in the ordinary course of its business, Sotheby’s will guarantee to sellers a minimum price in connection with the sale of property at auction (an “auction guarantee”). In the event that the property sells for less than the minimum guaranteed price, Sotheby’s must perform under the auction guarantee by funding the difference between the sale price at auction and the amount of the auction guarantee. Sotheby’s is generally entitled to a share of the excess proceeds (the “overage”) if the property under the auction guarantee sells above a minimum price. If the property does not sell, the amount of the guarantee must be paid, but title to the property generally transfers to Sotheby’s and a portion, all or more than the amount paid under the guarantee may be recovered through the future sale of the property, whether or not we take title to the property.
In certain situations, Sotheby’s will reduce its financial exposure under an auction guarantee through a risk and reward sharing arrangement with a partner. Such auction guarantee risk and reward sharing arrangements include:
|
|
|
|
|
|
• |
Arrangements under which an unaffiliated counterparty contractually commits to bid a predetermined price on the guaranteed property (an “irrevocable bid”). If the irrevocable bid is the winning bid, the counterparty purchases the property at the predetermined price plus the applicable buyer’s premium and pays the same amount as any other successful bidder would pay. If the irrevocable bid is not the winning bid, the counterparty is generally entitled to a negotiated share of the auction commission earned on the sale and/or share of any overage. |
|
|
|
|
|
|
• |
Arrangements under which an unaffiliated counterparty contractually commits to fund: (i) a share of the difference between the sale price at auction and the amount of the auction guarantee if the property sells for less than the minimum guaranteed price or (ii) a share of the minimum guaranteed price if the property does not sell while taking ownership of a proportionate share of the unsold property. In exchange for accepting a share of the financial exposure under the auction guarantee, the counterparty is entitled to receive a share of the auction commission earned if the property sells and/or a share of any overage. |
The counterparties to these auction guarantee risk and reward sharing arrangements are typically major international art dealers or major art collectors. Sotheby’s could be exposed to credit-related losses in the event of nonperformance by these counterparties.
As of December 31, 2009, Sotheby’s had one outstanding auction guarantee of $4.5 million, the property relating to which had pre-sale low and high estimates (1) of $5 million and $7 million, respectively. Sotheby’s financial exposure under this auction guarantee was fully hedged as a result of an irrevocable bid of $4.5 million from an unaffiliated counterparty. As of December 31, 2009, $2.5 million of the guaranteed amount had been advanced by Sotheby’s and was recorded within Notes Receivable in the Consolidated Balance Sheet (see Note F).
(1) Pre-sale estimates are not always accurate predictions of auction sale results or the fair value of the guaranteed property.
89
Note U—Antitrust Related Matters
In April 1997, the U.S. Department of Justice (the “DOJ”) began an investigation of certain art dealers and major auction houses, including Sotheby’s and its principal competitor, Christie’s International, PLC (“Christie’s”). In October 2000, Sotheby’s pled guilty to a violation of U.S. antitrust laws in connection with a conspiracy to fix auction commission rates charged to sellers in the U.S. and elsewhere.
In conjunction with the settlement of certain civil litigation related to the investigation by the DOJ, in May 2003, Sotheby’s and Christie’s issued to the class of plaintiffs vendor’s commission discount certificates (“Discount Certificates”) with a face value of $125 million, of which Sotheby’s was responsible for funding the redemption of $62.5 million. The court determined that the $62.5 million face value had a fair value of not less than $50 million, which is the amount of expense recognized as a Special Charge in the third quarter of 2000. The $12.5 million discount on the face value of the Discount Certificates was amortized to interest expense over the four-year period between the date of issuance and May 15, 2007, the date after which any unused Discount Certificates were redeemable for cash.
The Discount Certificates were fully redeemable in connection with any auction conducted by Sotheby’s or Christie’s in the U.S. or in the U.K. and could have been used to satisfy consignment charges involving vendor’s commission, risk of loss and/or catalogue illustration. Additionally, any unused Discount Certificates were redeemable for cash at their face value at any time between May 15, 2007 and May 14, 2008.
The Discount Certificates expired on May 14, 2008 and thereafter could no longer be redeemed. As a result of the expiration of the Discount Certificates, Sotheby’s reversed the remaining related liability and recognized a benefit of $18.4 million in the Consolidated Statement of Operations in the second quarter of 2008.
During the period January 1, 2007 to December 31, 2008, amounts charged to and cash payments made against Settlement Liabilities with respect to the Discount Certificates were as follows (in thousands of dollars):
|
|
|
|
|
|
|
|
Settlement Liabilities as of January 31, 2007 |
|
|
$ |
45,765 |
|
|
Redemption of Discount Certificates |
|
|
|
(24,065 |
) |
|
Amortization of discount |
|
|
|
941 |
|
|
Loss on redemption of Discount Certificates |
|
|
|
10 |
|
|
|
|
||||
|
Settlement Liabilities as of December 31, 2007 |
|
|
|
22,651 |
|
|
Redemption of Discount Certificates |
|
|
|
(4,266 |
) |
|
Expiration of Discount Certificates |
|
|
|
(18,385 |
) |
|
|
|
||||
|
Settlement Liabilities as of December 31, 2008 |
|
|
$ |
— |
|
|
|
|
Note V—Derivative Financial Instruments
Sotheby’s utilizes forward exchange contracts to hedge cash flow exposures related to foreign currency exchange rate movements, which primarily arise from short-term foreign currency denominated intercompany balances and, to a lesser extent, foreign currency denominated client payable balances. Such forward exchange contracts are typically short-term with settlement dates less than six months from their inception. Additionally, on rare occasions, Sotheby’s purchases foreign currency option contracts to hedge foreign currency risks associated with amounts payable to consignors as a result of the sale of property at auction. All derivative financial instruments are entered into by Sotheby’s global treasury function, which is responsible for managing Sotheby’s exposure to foreign currency exchange rate movements.
As of December 31, 2009, the notional value of outstanding forward exchange contracts was $51.7 million. Notional values do not quantify risk or represent assets or liabilities of Sotheby’s, but are used to calculate cash settlements under outstanding forward exchange contracts. Sotheby’s is exposed to credit-related losses in the event of nonperformance by the two counterparties to its forward exchange contracts. Sotheby’s does not expect either of these counterparties to fail to meet their obligations given their high short-term (A1/P1) credit ratings.
As of December 31, 2009, the $0.1 million aggregate carrying value of Sotheby’s outstanding forward exchange contracts was recorded as an asset in the Consolidated Balance Sheets within Prepaid Expenses and Other Current Assets. As of December 31, 2008, the $2.6 million aggregate carrying value of outstanding forward exchange contracts was recorded as a liability in the Consolidated Balance Sheets within Accounts Payable and Accrued Liabilities. These carrying values reflect the aggregate fair values of the outstanding derivative instruments on each balance sheet date based on referenced market rates.
90
Note W—Recently Issued Accounting Standards
In December 2008, the FASB issued FSP No. FAS 132(R)-1, “Employers’ Disclosures about Post Retirement Benefit Plan Assets,” which is codified under ASC 715-20 (Compensation-Retirement Benefits-Defined Benefit Plans) and requires expanded disclosures about plan assets in employers’ defined benefit pension or other post-retirement plans regarding how investment decisions are made, the major categories of plan assets, the input and valuation techniques used to measure the fair value of plan assets and concentrations of risk within plan assets. Sotheby’s adopted this standard as of December 31, 2009. See Note R.
In April 2009, the FASB issued FSP No. FAS 107 and APB 28-1, “Interim Disclosures about Fair Value of Financial Instruments,” which is codified under ASC 825 (Financial Instruments) and requires publicly traded companies to disclose on an interim and annual basis the fair value and related carrying amounts of their financial instruments, as well as the methods and significant assumptions used to estimate fair value and any changes to such methods and assumptions. Sotheby’s adopted these new disclosure requirements as of June 30, 2009, as applicable. See Note M.
In April 2009, the SEC Staff issued Staff Accounting Bulletin (“SAB”) No. 111. SAB No. 111 amends and replaces SAB Topic 5.M. in the SAB Series entitled “Other Than Temporary Impairment of Certain Investments in Debt and Equity Securities.” SAB No. 111 maintains the SEC Staff’s previous views related to equity securities and amends Topic 5.M. to exclude debt securities from its scope. Sotheby’s adopted SAB No. 111 in the second quarter of 2009. The adoption of SAB No. 111 has not had an impact on Sotheby’s results or financial position in 2009.
In April 2009, the FASB issued FSP No. 141(R)-1, “Accounting for Assets Acquired and Liabilities Assumed in a Business Combination That Arise from Contingencies,” which is now codified under Accounting Standards Codification (“ASC”) 805 (Business Combinations). This standard amends and clarifies previous accounting principles regarding business combinations to address application issues raised by preparers, auditors, and members of the legal profession on initial recognition and measurement, subsequent measurement and accounting, and disclosure of assets and liabilities arising from contingencies in a business combination. This standard was effective for assets or liabilities arising from contingencies in business combinations for which the acquisition date is on or after the beginning of the first annual reporting period beginning on or after December 15, 2008. The adoption of this standard has not impacted Sotheby’s results of operations or financial condition in 2009 as there have been no business combinations on or after its effective date.
In May 2009, the FASB issued SFAS No. 165, “Subsequent Events,” which is now codified under ASC 855 (Subsequent Events). This standard establishes the general principles of accounting for, and disclosure of, events that occur after the balance sheet date but before financial statements are issued or are available to be issued. Sotheby’s adopted this standard, effective for the period ended June 30, 2009. The adoption of this standard has not impacted Sotheby’s results of operations or financial position in 2009. See Note Q for subsequent events impacting Sotheby’s.
In June 2009, the FASB issued SFAS No. 166, “Accounting for Transfers of Financial Assets, an amendment to SFAS No. 140.” This pronouncement has not yet been incorporated into the Codification. This standard eliminates the concept of a “qualifying special-purpose entity,” changes the requirements for derecognizing financial assets and requires additional disclosures in order to enhance information reported to users of financial statements by providing greater transparency about transfers of financial assets, including securitization transactions, and an entity’s continuing involvement in and exposure to the risks related to transferred financial assets. This standard is effective for fiscal years beginning after November 15, 2009. Management is evaluating the potential impact of adopting this standard on Sotheby’s consolidated financial statements.
In June 2009, the FASB issued SFAS No. 167, “Amendments to FASB Interpretation No. 46(R).” This pronouncement has not yet been incorporated into the Codification. This standard changes how companies determine whether an entity that is insufficiently capitalized or is controlled through voting (or similar rights) should be consolidated. This standard will become effective for Sotheby’s on January 1, 2010. Management is evaluating the impact of adopting this standard on Sotheby’s consolidated financial statements.
In October 2009, the FASB issued Accounting Standards Update 2009–13, “Multiple-Deliverable Revenue Arrangements,” which is codified in ASC 605 (Revenue Recognition). This update addresses the unit of accounting for arrangements involving multiple deliverables and how to allocate arrangement consideration to one or more units of accounting. It eliminates the criteria that objective and reliable evidence of the fair value of any undelivered items must exist for the delivered items to be considered separate units of accounting. This update will be effective prospectively for fiscal years beginning on or after June 15, 2010. Early application as well as retrospective application is also permitted. Management is evaluating the potential impact of adopting this standard on Sotheby’s consolidated financial statements.
91
Note X—Quarterly Results (Unaudited)
The worldwide art auction market has two principal selling seasons, which generally occur in the second and fourth quarters of the year. Accordingly, Sotheby’s auction business is seasonal, with peak revenues and operating income generally occurring in those quarters. Consequently, first and third quarter results have historically reflected a lower volume of auction activity when compared to the second and fourth quarters and, typically, a net loss due to the fixed nature of many of Sotheby’s operating expenses.
|
|
|
|
|
|
|
|
|
|
|
|
|
|
|
|
|
|
|
|
|
|
|
|
|
First Quarter |
|
Second Quarter |
|
Third Quarter |
|
Fourth Quarter |
||||||||||||
|
|
|
|
|
|
||||||||||||||||
|
|
|
(Thousands of dollars, except per share data) |
||||||||||||||||||
|
Year Ended December 31, 2009 |
|
|
|
|
|
|
|
|
|
|
|
|
|
|
|
|
|
|
|
|
|
Net Auction Sales (a) |
|
|
$ |
199,654 |
|
|
|
$ |
633,542 |
|
|
|
$ |
130,188 |
|
|
|
$ |
949,205 |
|
|
Income Statement Data |
|
|
|
|
|
|
|
|
|
|
|
|
|
|
|
|
|
|
|
|
|
Revenues: |
|
|
|
|
|
|
|
|
|
|
|
|
|
|
|
|
|
|
|
|
|
Auction and related revenues |
|
|
$ |
45,978 |
|
|
|
$ |
151,007 |
|
|
|
$ |
40,000 |
|
|
|
$ |
211,783 |
|
|
Finance revenues |
|
|
|
2,419 |
|
|
|
|
2,245 |
|
|
|
|
2,240 |
|
|
|
|
2,169 |
|
|
Dealer revenues |
|
|
|
4,746 |
|
|
|
|
13,055 |
|
|
|
|
1,834 |
|
|
|
|
2,704 |
|
|
License fee revenues |
|
|
|
779 |
|
|
|
|
770 |
|
|
|
|
764 |
|
|
|
|
957 |
|
|
Other revenues |
|
|
|
506 |
|
|
|
|
244 |
|
|
|
|
88 |
|
|
|
|
670 |
|
|
|
|
|
|
|
||||||||||||||||
|
Total revenues |
|
|
$ |
54,428 |
|
|
|
$ |
167,321 |
|
|
|
$ |
44,926 |
|
|
|
$ |
218,283 |
|
|
|
|
|
|
|
||||||||||||||||
|
Net (loss) income |
|
|
$ |
(34,492 |
) |
|
|
$ |
12,181 |
|
|
|
$ |
(57,798 |
) |
|
|
$ |
73,581 |
|
|
|
|
|
|
|
||||||||||||||||
|
Per Share Amounts: |
|
|
|
|
|
|
|
|
|
|
|
|
|
|
|
|
|
|
|
|
|
Basic (loss) earnings per share—Sotheby’s common shareholders |
|
|
$ |
(0.53 |
) |
|
|
$ |
0.18 |
|
|
|
$ |
(0.89 |
) |
|
|
$ |
1.09 |
|
|
|
|
|
|
|
||||||||||||||||
|
Diluted (loss) earnings per share—Sotheby’s common shareholders |
|
|
$ |
(0.53 |
) |
|
|
$ |
0.18 |
|
|
|
$ |
(0.89 |
) |
|
|
$ |
1.09 |
|
|
|
|
|
|
|
||||||||||||||||
|
Shares Outstanding: |
|
|
|
|
|
|
|
|
|
|
|
|
|
|
|
|
|
|
|
|
|
Basic |
|
|
|
64,945 |
|
|
|
|
65,207 |
|
|
|
|
65,295 |
|
|
|
|
65,370 |
|
|
Diluted |
|
|
|
64,945 |
|
|
|
|
65,784 |
|
|
|
|
65,295 |
|
|
|
|
66,795 |
|
|
Year Ended December 31, 2008 |
|
|
|
|
|
|
|
|
|
|
|
|
|
|
|
|
|
|
|
|
|
Net Auction Sales (a) |
|
|
$ |
675,684 |
|
|
|
$ |
1,861,039 |
|
|
|
$ |
637,135 |
|
|
|
$ |
1,015,877 |
|
|
Income Statement Data |
|
|
|
|
|
|
|
|
|
|
|
|
|
|
|
|
|
|
|
|
|
Revenues: |
|
|
|
|
|
|
|
|
|
|
|
|
|
|
|
|
|
|
|
|
|
Auction and related revenues |
|
|
$ |
107,938 |
|
|
|
$ |
290,393 |
|
|
|
$ |
62,289 |
|
|
|
$ |
156,005 |
|
|
Finance revenues |
|
|
|
3,512 |
|
|
|
|
3,650 |
|
|
|
|
3,687 |
|
|
|
|
3,334 |
|
|
Dealer revenues |
|
|
|
16,685 |
|
|
|
|
24,791 |
|
|
|
|
8,396 |
|
|
|
|
5,724 |
|
|
License fee revenues |
|
|
|
591 |
|
|
|
|
918 |
|
|
|
|
1,174 |
|
|
|
|
755 |
|
|
Other revenues |
|
|
|
535 |
|
|
|
|
409 |
|
|
|
|
427 |
|
|
|
|
346 |
|
|
|
|
|
|
|
||||||||||||||||
|
Total revenues |
|
|
$ |
129,261 |
|
|
|
$ |
320,161 |
|
|
|
$ |
75,973 |
|
|
|
$ |
166,164 |
|
|
|
|
|
|
|
||||||||||||||||
|
Net (loss) income |
|
|
$ |
(12,395 |
) |
|
|
$ |
95,200 |
|
|
|
$ |
(47,046 |
) |
|
|
$ |
(9,303 |
) |
|
|
|
|
|
|
||||||||||||||||
|
Per Share Amounts: |
|
|
|
|
|
|
|
|
|
|
|
|
|
|
|
|
|
|
|
|
|
Basic (loss) earnings per share—Sotheby’s common shareholders |
|
|
$ |
(0.19 |
) |
|
|
$ |
1.42 |
|
|
|
$ |
(0.73 |
) |
|
|
$ |
(0.14 |
) |
|
|
|
|
|
|
||||||||||||||||
|
Diluted (loss) earnings per share—Sotheby’s common shareholders |
|
|
$ |
(0.19 |
) |
|
|
$ |
1.41 |
|
|
|
$ |
(0.73 |
) |
|
|
$ |
(0.14 |
) |
|
|
|
|
|
|
||||||||||||||||
|
Shares Outstanding: |
|
|
|
|
|
|
|
|
|
|
|
|
|
|
|
|
|
|
|
|
|
Basic |
|
|
|
64,395 |
|
|
|
|
64,663 |
|
|
|
|
64,719 |
|
|
|
|
64,740 |
|
|
Diluted |
|
|
|
64,395 |
|
|
|
|
65,390 |
|
|
|
|
64,719 |
|
|
|
|
64,740 |
|
|
Legend: |
|
|
|
|
|
|
|
|
|
|
|
|
|
|
|
|
|
|
|
|
(a) Net Auction Sales represents the hammer (sale) price of property sold at auction.
92
|
|
|
|
CHANGES IN AND DISAGREEMENTS WITH ACCOUNTANTS ON |
|
|
|
ACCOUNTING AND FINANCIAL DISCLOSURE |
Not applicable.
ITEM 9A: CONTROLS AND PROCEDURES
Disclosure Controls and Procedures
As of December 31, 2009, the Company has carried out an evaluation, under the supervision and with the participation of the Company’s management, including the Company’s Chief Executive Officer and Chief Financial Officer, of the effectiveness of the Company’s disclosure controls and procedures. Based upon that evaluation, the Company’s Chief Executive Officer and Chief Financial Officer have concluded that the Company’s disclosure controls and procedures (as defined in Exchange Act Rule 13a-15(e)) were effective as of December 31, 2009.
Management’s Report on Internal Control over Financial Reporting
The Company’s management is responsible for establishing and maintaining adequate internal control over financial reporting, as such term is defined in Exchange Act Rule 13a-15(f). Management evaluates the effectiveness of the Company’s internal control over financial reporting using the criteria set forth by the Committee of Sponsoring Organizations of the Treadway Commission (COSO) in “Internal Control—Integrated Framework.” Management, under the supervision and with the participation of the Company’s Chief Executive Officer and Chief Financial Officer, assessed the effectiveness of the Company’s internal control over financial reporting as of December 31, 2009 and concluded that it is effective.
The Company’s independent registered public accounting firm, Deloitte & Touche LLP, has audited the effectiveness of the Company’s internal control over financial reporting as of December 31, 2009 and has expressed an unqualified opinion in their report which is included herein.
Changes in Internal Control over Financial Reporting
There was no change in the Company’s internal control over financial reporting that occurred during the Company’s most recent fiscal quarter that has materially affected, or is reasonably likely to materially affect, the Company’s internal control over financial reporting.
93
REPORT OF INDEPENDENT REGISTERED PUBLIC ACCOUNTING FIRM
To the Board
of Directors and Shareholders of
Sotheby’s
New York, New York
We have audited the internal control over financial reporting of Sotheby’s and subsidiaries (the “Company”) as of December 31, 2009, based on criteria established in Internal Control — Integrated Framework issued by the Committee of Sponsoring Organizations of the Treadway Commission. The Company’s management is responsible for maintaining effective internal control over financial reporting and for its assessment of the effectiveness of internal control over financial reporting, included in the accompanying Management’s Report on Internal Control over Financial Reporting. Our responsibility is to express an opinion on the Company’s internal control over financial reporting based on our audit.
We conducted our audit in accordance with the standards of the Public Company Accounting Oversight Board (United States). Those standards require that we plan and perform the audit to obtain reasonable assurance about whether effective internal control over financial reporting was maintained in all material respects. Our audit included obtaining an understanding of internal control over financial reporting, assessing the risk that a material weakness exists, testing and evaluating the design and operating effectiveness of internal control based on the assessed risk, and performing such other procedures as we considered necessary in the circumstances. We believe that our audit provides a reasonable basis for our opinion.
A company’s internal control over financial reporting is a process designed by, or under the supervision of, the company’s principal executive and principal financial officers, or persons performing similar functions, and effected by the company’s board of directors, management, and other personnel to provide reasonable assurance regarding the reliability of financial reporting and the preparation of financial statements for external purposes in accordance with generally accepted accounting principles. A company’s internal control over financial reporting includes those policies and procedures that (1) pertain to the maintenance of records that, in reasonable detail, accurately and fairly reflect the transactions and dispositions of the assets of the company; (2) provide reasonable assurance that transactions are recorded as necessary to permit preparation of financial statements in accordance with generally accepted accounting principles, and that receipts and expenditures of the company are being made only in accordance with authorizations of management and directors of the company; and (3) provide reasonable assurance regarding prevention or timely detection of unauthorized acquisition, use, or disposition of the company’s assets that could have a material effect on the financial statements.
Because of the inherent limitations of internal control over financial reporting, including the possibility of collusion or improper management override of controls, material misstatements due to error or fraud may not be prevented or detected on a timely basis. Also, projections of any evaluation of the effectiveness of the internal control over financial reporting to future periods are subject to the risk that the controls may become inadequate because of changes in conditions, or that the degree of compliance with the policies or procedures may deteriorate.
In our opinion, the Company maintained, in all material respects, effective internal control over financial reporting as of December 31, 2009, based on the criteria established in Internal Control — Integrated Framework issued by the Committee of Sponsoring Organizations of the Treadway Commission.
We have also audited, in accordance with the standards of the Public Company Accounting Oversight Board (United States), the consolidated financial statements and financial statement schedule as of and for the year ended December 31, 2009 of the Company and our report dated March 1, 2010, expressed an unqualified opinion on those consolidated financial statements and financial statement schedule and includes an explanatory paragraph referring to the retrospective adjustment for the adoption of new accounting guidance for the treatment of the liability and equity components of convertible debt instruments that may be settled entirely or partially in cash upon conversion.
|
|
| /s/ DELOITTE & TOUCHE LLP |
|
Deloitte & Touche LLP |
|
|
|
New York, NY |
|
March 1, 2010 |
94
|
|
|
|
DIRECTORS, EXECUTIVE OFFICERS AND CORPORATE GOVERNANCE |
Information required by this item is incorporated herein by reference to the Company’s definitive proxy statement for the annual meeting of shareholders to be held in 2010 (the “Proxy Statement”) under the captions “Proposal 1—Election of Directors,” “Corporate Governance” and “Section 16(a) Beneficial Ownership Reporting Compliance.”
|
|
|
|
EXECUTIVE COMPENSATION |
The information required by this item is incorporated herein by reference to the material appearing in the Proxy Statement under the captions “Compensation of Executive Officers” and “Compensation of Directors.” Notwithstanding anything to the contrary herein, the Report of the Audit Committee and the Report of the Compensation Committee in the Proxy Statement are not incorporated by reference herein.
|
|
|
|
SECURITY OWNERSHIP OF CERTAIN BENEFICIAL OWNERS AND MANAGEMENT AND RELATED STOCKHOLDER MATTERS |
The information required by this item is incorporated herein by reference to the table and related text and footnotes appearing in the Proxy Statement under the caption “Security Ownership of Certain Beneficial Owners and Management.”
|
|
|
|
CERTAIN RELATIONSHIPS AND RELATED TRANSACTIONS AND DIRECTOR INDEPENDENCE |
The information required by this item is incorporated herein by reference to the material appearing in the Proxy Statement under the captions “Certain Relationships and Related Transactions” and “Corporate Governance.”
|
|
|
|
PRINCIPAL ACCOUNTING FEES AND SERVICES |
The information required by this item is incorporated herein by reference to the material appearing in the Proxy Statement under the caption “Proposal 2—Ratification of the Appointment of Registered Public Accounting Firm.”
95
PART IV
ITEM 15: EXHIBITS, FINANCIAL STATEMENT SCHEDULES AND REPORTS ON FORM 8-K
|
15(a)(1) |
— |
The following consolidated financial statements and the related notes thereto of Sotheby’s and subsidiaries are contained in Item 8, “Financial Statements and Supplementary Data”: Consolidated Statements of Operations—Years ended December 31, 2009, 2008 and 2007; Consolidated Balance Sheets—December 31, 2009 and 2008; Consolidated Statements of Cash Flows—Years ended December 31, 2009, 2008 and 2007; Consolidated Statements of Changes in Shareholders’ Equity—Years ended December 31, 2009, 2008 and 2007. |
|
|
|
|
|
15(a)(2) |
— |
The following is the consolidated financial statement schedule of Sotheby’s and subsidiaries required by Item 15(d): Schedule II—Valuation and Qualifying Accounts for the years ended December 31, 2009, 2008 and 2007. |
|
|
|
|
|
15(a)(3) |
|
|
|
|
|
|
|
2.1 |
— |
Agreement and Plan of Merger between Sotheby’s Holdings, Inc., a Michigan corporation and Sotheby’s Delaware, Inc., a Delaware corporation, dated March 31, 2006, incorporated by reference to the Company’s First Quarter Form 10-Q for 2006. |
|
|
|
|
|
2.2 |
— |
Agreement for the Sale and Purchase of All the Issued and Outstanding Shares in Noortman Master Paintings B.V., dated June 7, 2006, incorporated by reference to Exhibit 2.1 to the Company’s Second Quarter Form 10-Q for 2006. |
|
|
|
|
|
3.1 |
— |
Certificate of Incorporation of Sotheby’s, as amended as of June 30, 2006, incorporated by reference to Exhibit 3.1 to the Company’s current report on Form 8-K, filed on July 7, 2006 with the Securities and Exchange Commission. |
|
|
|
|
|
3.2 |
— |
By-Laws of Sotheby’s, amended and restated as of August 4, 2009, incorporated by reference to Exhibit 3.2 to the Company’s Second Quarter Form 10-Q for 2009. |
|
|
|
|
|
3.3 |
|
Form of Indemnity Agreement, as amended and restated as of August 4, 2009, incorporated by reference to Exhibit 10.1 to the Company’s Second Quarter Form 10-Q for 2009. |
|
|
|
|
|
4.1 |
— |
See Exhibits 3.1, 3.2 and 3.3. |
|
|
|
|
|
4.2 |
— |
Specimen Common Stock Certificate of Sotheby’s, incorporated by reference to Exhibit 4.1 to Post-Effective Amendment No. 1 to the Company’s Registration Statement on Form 8-A filed on November 21, 2006. |
|
|
|
|
|
4.3 |
— |
Indenture, dated as of June 17, 2008, for the 3.125% Convertible Senior Notes due 2013 between Sotheby’s, as Issuer, and the Initial Subsidiary Guarantors Party Hereto, and U.S. Bank National Association, as Trustee, incorporated by reference to Exhibit 10.1 to the Company’s Second Quarter Form 10-Q for 2008. |
|
|
|
|
|
4.4 |
— |
Indenture, dated as of June 17, 2008, 7.75% Senior Notes due 2015 between Sotheby’s, as Issuer, and the Initial Subsidiary Guarantors Party Hereto, and U.S. Bank National Association, as Trustee, incorporated by reference to Exhibit 10.2 to the Company’s Second Quarter Form 10-Q for 2008. |
|
|
|
|
|
4.5 |
— |
Registration Rights Agreement dated June 17, 2008, between Sotheby’s and Banc of America Securities LLC, Goldman, Sachs & Co., Comerica Securities, Inc. and HSBC Securities (USA) Inc, incorporated by reference to Exhibit 10.3 to the Company’s Second Quarter Form 10-Q for 2008. |
|
|
|
|
|
10.1* |
— |
Sotheby’s Deferred Compensation Plan, dated December 21, 2006 and effective January 1, 2007, incorporated by reference to Exhibit 10.2 to the Company’s Annual Report on Form 10-K for the year ended December 31, 2006. |
|
|
|
|
|
10.2* |
— |
Sotheby’s Holdings, Inc. 1997 Stock Option Plan Composite Plan Document, effective January 1, 2000, incorporated by reference to Exhibit 10(k) to the Company’s Annual Report on Form 10-K for the year ended December 31, 2000. |
|
|
|
|
|
10.3* |
— |
Seventh Amendment to the Sotheby’s Holdings, Inc. 1997 Stock Option Plan dated November 7, 2005, effective September 8, 2005, incorporated by reference to Exhibit 10.4 to the Company’s Annual Report on Form 10-K for the year ended December 31, 2005. |
96
|
10.4* |
— |
Eighth Amendment to the Sotheby’s 1997 Stock Option Plan Composite Plan Document, dated and effective May 8, 2006, incorporated by reference to Exhibit 10.2 to the Company’s current report on Form 8-K dated May 12, 2006. |
|
|
|
|
|
10.5 |
— |
Agreement of Partnership of Acquavella Modern Art, dated May 29, 1990, between Sotheby’s Nevada, Inc. and Acquavella Contemporary Art, Inc., incorporated by reference to Exhibit 10(b) to the Company’s current report on Form 8-K, filed on June 7, 1990, SEC File No. 1-9750, on file at the Washington, D.C. office of the Securities and Exchange Commission. |
|
|
|
|
|
10.6 |
— |
First Amendment to Agreement of Partnership, dated December 31, 2000, of Acquavella Modern Art, between Sotheby’s Nevada, Inc. and Acquavella Contemporary Art, Inc., incorporated by reference to Exhibit 10(m) to the Company’s Annual Report on Form 10-K for the year ended December 31, 2000. |
|
|
|
|
|
10.7 |
— |
Second Amendment to Agreement of Partnership, dated December 15, 2001, of Acquavella Modern Art, between Sotheby’s Nevada, Inc. and Acquavella Contemporary Art, Inc., incorporated by reference to Exhibit 10(k) to the Company’s Annual Report on Form 10-K for the year ended December 31, 2001. |
|
|
|
|
|
10.8 |
— |
Third Amendment to Agreement of Partnership, dated February 10, 2003, of Acquavella Modern Art, between Sotheby’s Nevada, Inc. and Acquavella Contemporary Art, Inc., incorporated by reference to Exhibit 10(h) to the Company’s Annual Report on Form 10-K for the year ended December 31, 2002. |
|
|
|
|
|
10.9 |
— |
Fourth Amendment to Agreement of Partnership, dated January 13, 2004, of Acquavella Modern Art, between Sotheby’s Nevada, Inc. and Acquavella Contemporary Art, Inc., incorporated by reference to Exhibit 10(i) to the Company’s Annual Report on Form 10-K for the year ended December 31, 2003. |
|
|
|
|
|
10.10 |
— |
Fifth Amendment to Agreement of Partnership, dated December 8, 2004, of Acquavella Modern Art, between Sotheby’s Nevada, Inc. and Acquavella Contemporary Art, Inc., incorporated by reference to Exhibit 10.9 to the Company’s Annual Report on Form 10-K for the year ended December 31, 2004. |
|
|
|
|
|
10.11 |
— |
Sixth Amendment to Agreement of Partnership, dated March 1, 2006, of Acquavella Modern Art, between Sotheby’s Nevada, Inc. and Acquavella Contemporary Art, Inc. incorporated by reference to Exhibit 10.11 to the Company’s Annual Report on Form 10-K for the year ended December 31, 2005. |
|
|
|
|
|
10.12 |
— |
Seventh Amendment to the Agreement of Partnership, dated January 12, 2007, of Acquavella Modern Art, between Sotheby’s Nevada, Inc. and Acquavella Contemporary Art, Inc., incorporated by reference to Exhibit 10.4 to the Company’s First Quarter Form 10-Q for 2007. |
|
|
|
|
|
10.13 |
— |
Eighth Amendment to the Agreement of Partnership, dated January 23, 2008, of Acquavella Modern Art, between Sotheby’s Nevada, Inc. and Acquavella Contemporary Art, Inc., incorporated by reference to Exhibit 10.2 to the Company’s First Quarter Form 10-Q for 2008. |
|
|
|
|
|
10.14 |
— |
Ninth Amendment to the Agreement of Partnership, dated February 11, 2009, of Acquavella Modern Art, between Sotheby’s Nevada, Inc. and Acquavella Contemporary Art, incorporated by reference to Exhibit 10.6 to the Company’s First Quarter Form 10-Q for 2009. |
|
|
|
|
|
10.15* |
— |
Sotheby’s 1998 Stock Compensation Plan for Non-Employee Directors, as amended and restated on April 9, 2007, effective May 7, 2007 (the “Directors Plan”), incorporated by reference to Exhibit 10.2 to the Company’s current report on Form 8-K, filed on May 11, 2007. |
|
|
|
|
|
10.16* |
— |
First Amendment to the Directors Plan, dated November 6, 2007, incorporated by reference to Exhibit 10.14 to the Company’s Annual Report on Form 10-K for the year ended December 31, 2007 (the “2007 Form 10-K”). |
|
|
|
|
|
10.17 |
— |
Credit Agreement dated as of August 31, 2009, among Sotheby’s (a Delaware corporation), Sotheby’s Inc., Sotheby’s Financial Services, Inc., Sotheby’s Financial Services California, Inc., Oberon, Inc., Theta, Inc., Sotheby’s Ventures, LLC, Oatshare Limited, Sotheby’s (a company registered in England) and Sotheby’s Financial Services Limited, as Borrowers and General Electric Capital Corporation, as Agent and a Lender, GE Capital Markets, Inc. and HSBC Bank PLC, as Joint Lead Arrangers and Joint Bookrunners and Other Credit Parties and Lenders Hereto, incorporated by reference to Exhibit 10.1 to the Company’s current report on Form 8-K dated September 1, 2009. |
97
10.18 |
— |
Amendment No. 1 to Credit Agreement, dated as of December 17, 2009, by and among Sotheby’s (a Delaware corporation), Sotheby’s, Inc., Sotheby’s Financial Services, Inc, Sotheby’s Financial Services California, Inc., Oberon, Inc., Theta, Inc., Sotheby’s Ventures, LLC, Oatshare Limited, Sotheby’s (a company registered in England), and Sotheby’s Financial Services Limited, as Borrowers and General Electric Capital Corporation, as a Lender and as Agent for the Lenders and the Fronting Lender, and the other Lenders signatory hereto, amends that certain Credit Agreement, dated as of August 31, 2009, by and among the Borrowers, other Credit Parties signatory thereto, the Agent, the Fronting Lender, and the Lenders. |
|
|
|
10.19 |
— |
Purchase and Sale Agreement, dated January 11, 2008 between 1334 York Avenue L.P., Seller and Sotheby’s, purchaser for 1334 York Avenue, New York, New York 10021, incorporated by reference to Exhibit 10.1 to the Company’s First Quarter Form 10-Q for 2009. |
|
|
|
10.20 |
— |
Consent and Assumption Agreement with Release, dated as of February 6, 2009 between 1334 York, LLC as New Borrower, Sotheby’s as New Guarantor, 1334 York Avenue L.P., as Original Borrower, Aby Rosen and Michael Fuchs as Original Guarantor and Bank of America, N.A. as Agent and certain other parties, incorporated by reference to Exhibit 10.2 to the Company’s First Quarter Form 10-Q for 2009. |
|
|
|
10.21 |
— |
Loan Agreement, dated as of June 22, 2005 between 1334 York Avenue L.P., as Borrower and Bank of America, N.A., as Lender, incorporated by reference to Exhibit 10.3 to the Company’s First Quarter Form 10-Q for 2009. |
|
|
|
10.22 |
— |
First Amendment to Loan Agreement and Other Loan Documents, dated as of September 20, 2005 between 1334 York Avenue L.P., as Borrower, and Bank of America, N.A., as Lender, incorporated by reference to Exhibit 10.4 to the Company’s First Quarter Form 10-Q for 2009. |
|
|
|
10.23 |
— |
Lease between 1334 York Avenue L.P., “Landlord,” and Sotheby’s, Inc., “Tenant,” February 7, 2003; Premises: 1334 York Avenue, New York, New York, incorporated by reference to Exhibit 10(b) to the Company’s First Quarter Form 10-Q for 2003. |
|
|
|
10.24 |
— |
Guaranty of Lease, made by Sotheby’s in favor of 1334 York Avenue L.P., dated as of June 30, 2006 incorporated by reference to Exhibit 10.29 to the Company’s current report on Form 8-K, filed on July 7, 2006. |
|
|
|
10.25* |
— |
Letter Agreement between Sotheby’s Holdings, Inc. and William F. Ruprecht, with related Terms of Employment, dated March 31, 2006, incorporated by reference to Exhibit 10.23 to the 2007 Form 10-K. |
|
|
|
10.26* |
— |
Letter Agreement between Sotheby’s and William F. Ruprecht, dated March 23, 2009, incorporated by reference to Exhibit 10.1 to the Company’s current report on Form 8-K, filed on March 23, 2009. |
|
|
|
10.27* |
— |
Severance Agreement between Sotheby’s and William S. Sheridan, dated August 3, 2006, incorporated by reference to Exhibit 10.1 to the Company’s Third Quarter Form 10-Q for 2006. |
|
|
|
10.28* |
— |
Amendment to the August 3, 2006 Severance Agreement (as amended March 7, 2008) between Sotheby’s and William S. Sheridan, dated April 27, 2009, effective May 1, 2009, incorporated by reference to Exhibit 10.1 to the Company’s current report on Form 8-K filed on April 28, 2009. |
|
|
|
10.29* |
— |
Service Agreement between Sotheby’s and Robin Woodhead, with related Terms of Employment, dated August 15, 2006, incorporated by reference to Exhibit 10.2 to the Company’s Third Quarter Form 10-Q for 2006. |
|
|
|
10.30* |
— |
Amendment to the August 15, 2006 Employment Agreement (as amended March 7, 2008) between Sotheby’s and Robin Woodhead, dated April 27, 2009, effective May 1, 2009, incorporated by reference to Exhibit 10.2 to the Company’s current report on Form 8-K filed on April 28, 2009. |
|
|
|
10.31* |
— |
Letter Agreement between Sotheby’s and Bruno Vinciguerra, with related Terms of Employment, dated April 27, 2009, effective May 1, 2009, incorporated by reference to Exhibit 10.3 to the Company’s current report on Form 8-K filed on April 28, 2009. |
|
|
|
10.32* |
— |
Severance Agreement between Sotheby’s and Bruno Vinciguerra, dated as of December 18, 2009, effective January 1, 2010, incorporated by reference to Exhibit 10.1 to the Company’s current report on Form 8-K filed on December 23, 2009. |
|
|
|
10.33* |
— |
Severance Agreement between Sotheby’s and Gilbert Klemann, dated October 9, 2007, effective February 1, 2008, incorporated by reference to Exhibit 10.28 to the 2007 Form 10-K. |
98
10.34* |
— |
Amendment to October 9, 2007 Severance Agreement between Sotheby’s and Gilbert Klemann, dated as of September 9, 2008, effective September 25, 2008, incorporated by reference to Exhibit 10.2 to the Company’s Third Quarter Form 10-Q for 2008. |
|
|
|
10.35* |
— |
Letter Agreement between Sotheby’s and Mitchell Zuckerman, dated April 27, 2009, effective May 1, 2009, incorporated by reference to Exhibit 10.4 to the Company’s current report on Form 8-K filed on April 28, 2009. |
|
|
|
10.36* |
— |
Severance Agreement between Sotheby’s and Mitchell Zuckerman, dated December 18, 2009, effective January 1, 2010, incorporated by reference to Exhibit 10.2 to the Company’s current report on Form 8-K filed on December 23, 2009. |
|
|
|
10.37* |
— |
Sotheby’s Holdings, Inc. Amended and Restated Restricted Stock Plan, incorporated by reference to Exhibit 10.1 to the Company’s Registration Statement on Form S-8 filed on May 9, 2006. |
|
|
|
10.38* |
— |
First Amendment to Sotheby’s Amended and Restated Restricted Stock Plan, dated July 28, 2006, incorporated by reference to Exhibit 10.1 to the Company’s Second Quarter Form 10-Q for 2007. |
|
|
|
10.39* |
— |
Form of Sotheby’s Amended and Restated Restricted Stock Plan Restricted Stock Agreement, incorporated by reference to Exhibit 10.2 to the Company’s Second Quarter Form 10-Q for 2007. |
|
|
|
10.40* |
— |
Form of Sotheby’s Amended and Restated Restricted Stock Plan Restricted Stock Entitlement Agreement, incorporated by reference to Exhibit 10.3 to the Company’s Second Quarter Form 10-Q for 2007. |
|
|
|
10.41* |
— |
Second Amendment to Sotheby’s Amended and Restated Restricted Stock Plan, dated September 7, 2007, incorporated by reference to Exhibit 10.2 to the Company’s Third Quarter Form 10-Q for 2007. |
|
|
|
10.42* |
— |
Sotheby’s Restricted Stock Unit Plan, (As Amended and Restated Effective As Of February 1, 2009), incorporated by reference to Exhibit 10.5 to the Company’s First Quarter Form 10-Q for 2009. |
|
|
|
10.43 |
— |
Stock Purchase Agreement, dated as of February 17, 2004, by and among NRT Incorporated as the Purchaser, Sotheby’s Holdings, Inc., as the Seller, and Cendant Corporation as the Purchaser Guarantor, incorporated by reference to Exhibit 99.1 to the Company’s current report on Form 8-K, filed on March 2, 2004. |
|
|
|
10.44 |
— |
Trademark License Agreement, dated as of February 17, 2004, among SPTC, Inc., as Licensor, Sotheby’s Holdings, Inc. as Guarantor, Monticello Licensee Corporation, as Licensee, and Cendant Corporation, as Guarantor, incorporated by reference to Exhibit 99.2 to the Company’s current report on Form 8-K, filed on March 2, 2004. |
|
|
|
10.45 |
— |
Amendment No. 1 to Trademark License Agreement, dated as of May 2, 2005, among SPTC Delaware, LLC (as an assignee of SPTC, Inc) and Sotheby’s Holdings, Inc. and Cendant Corporation and Sotheby’s International Realty Licensee Corporation (formerly known as Monticello Licensee Corporation), incorporated by reference to Exhibit 10.1 to the Company’s Second Quarter Form 10-Q for 2005. |
|
|
|
10.46 |
— |
Amendment No. 2 to Trademark License Agreement, dated as of May 2, 2005, among SPTC Delaware, LLC (as an assignee of SPTC, Inc) and Sotheby’s Holdings, Inc. and Cendant Corporation and Sotheby’s International Realty Licensee Corporation (formerly known as Monticello Licensee Corporation), incorporated by reference to Exhibit 10.2 to the Company’s Second Quarter Form 10-Q for 2005. |
|
|
|
10.47* |
— |
Sotheby’s Executive Bonus Plan (as amended and restated effective as of January 1, 2007), dated April 9, 2007, incorporated by reference to Exhibit 10.1 to the Company’s current report on Form 8-K, filed on May 11, 2007. |
|
|
|
10.48 |
— |
Transaction Agreement by and among Sotheby’s Holdings, Inc., and A. Alfred Taubman and Other Parties to the Agreement, dated as of September 7, 2005, incorporated by reference to Exhibit 10.1 to the Company’s Third Quarter Form 10-Q for 2005. |
|
|
|
10.49 |
— |
Convertible Bond Hedge Transaction (Transaction Reference Number: NY-35263), dated June 11, 2008, between Sotheby’s and Bank of America, N.A, incorporated by reference to Exhibit 10.4 to the Company’s Second Quarter Form 10-Q for 2008. |
|
|
|
10.50 |
— |
Convertible Bond Hedge Transaction (Transaction Reference Number: SDB1627455583), dated June 11, 2008, between Sotheby’s and Goldman, Sachs & Co, incorporated by reference to Exhibit 10.5 to the Company’s Second Quarter Form 10-Q for 2008. |
99
|
10.51 |
— |
Issuer Warrant Transaction (Transaction Reference Number: NY-35264), dated June 11, 2008, between Sotheby’s and Bank of America, N.A, incorporated by reference to Exhibit 10.6 to the Company’s Second Quarter Form 10-Q for 2008. |
|
|
|
|
|
10.52 |
— |
Issuer Warrant Transaction (Transaction Reference Number: SDB1627455582), dated June 11, 2008 between Sotheby’s and Goldman, Sachs & Co, incorporated by reference to Exhibit 10.7 to the Company’s Second Quarter Form 10-Q for 2008. |
|
|
|
|
|
21 |
— |
Subsidiaries of the Registrant |
|
|
|
|
|
23 |
— |
Consent of Deloitte & Touche LLP |
|
|
|
|
|
24 |
— |
Powers of Attorney |
|
|
|
|
|
31.1 |
— |
Certification of Chief Executive Officer pursuant to Section 302 of the Sarbanes-Oxley Act of 2002. |
|
|
|
|
|
31.2 |
— |
Certification of Chief Financial Officer pursuant to Section 302 of the Sarbanes-Oxley Act of 2002. |
|
|
|
|
|
32.1 |
— |
Certification of Chief Executive Officer pursuant to Section 906 of the Sarbanes-Oxley Act of 2002. |
|
|
|
|
|
32.2 |
— |
Certification of Chief Financial Officer pursuant to Section 906 of the Sarbanes-Oxley Act of 2002. |
|
|
|
|
|
(15)(b) |
— |
On November 10, 2009, the Company filed a current report on Form 8-K under Item 2.02, “Results of Operations and Financial Condition” and Item 9.01, “Financial Statements and Exhibits.” |
|
|
|
|
|
|
— |
On December 23, 2009, the Company filed a current report on Form 8-K under Item 5.02, “Departure of Directors or Certain Officers; Election of Directors; Appointment of Certain Officers; Compensatory Arrangements of Certain Officers” and Item 9.01, “Financial Statements and Exhibits.” |
|
|
|
|
|
|
— |
The list of exhibits filed with this report is set forth in response to Item 15(a)(3). The required exhibit index has been filed with the exhibits. |
|
|
|
|
|
|
— |
The financial statement schedule of the Company listed in response to Item 15(a)(2) is filed pursuant to this Item 15(d). |
|
* |
A compensatory agreement or plan required to be filed pursuant to Item 15(c) of Form 10-K |
100
SOTHEBY’S
VALUATION AND QUALIFYING ACCOUNTS
YEARS ENDED DECEMBER 31, 2009, 2008 AND 2007
|
|
|
|
|
|
|
|
|
|
|
|
|
|
|
|
|
|
|
|
|
|
|
Column A |
|
Column B |
|
Column C |
|
Column D |
|
Column E |
||||||||||||
|
|
|
|
|
|||||||||||||||||
|
Description |
|
Balance
at |
|
Charged
to |
|
Charged
to |
|
Deductions |
|
Balance |
||||||||||
|
|
|
|
|
|
||||||||||||||||
|
|
|
(Thousands of dollars) |
|
|||||||||||||||||
|
Valuation reserve deducted in the balance sheet from the asset to which it applies: |
|
|
|
|
|
|
|
|
|
|
|
|
|
|
|
|
|
|
|
|
|
Receivables (a): |
|
|
|
|
|
|
|
|
|
|
|
|
|
|
|
|
|
|
|
|
|
2009 Allowance for doubtful accounts and credit losses |
|
$ |
11,119 |
|
|
$ |
1,914 |
|
|
$ |
— |
|
|
$ |
6,822 |
|
|
$ |
6,211 |
|
|
2008 Allowance for doubtful accounts and credit losses |
|
$ |
7,280 |
|
|
$ |
8,740 |
|
|
$ |
— |
|
|
$ |
4,901 |
|
|
$ |
11,119 |
|
|
2007 Allowance for doubtful accounts and credit losses |
|
$ |
7,089 |
|
|
$ |
3,528 |
|
|
$ |
(285 |
) |
|
$ |
3,052 |
|
|
$ |
7,280 |
|
|
Deferred tax assets: |
|
|
|
|
|
|
|
|
|
|
|
|
|
|
|
|
|
|
|
|
|
2009 Valuation allowance |
|
$ |
1,328 |
|
|
$ |
19,060 |
|
|
$ |
— |
|
|
$ |
872 |
|
|
$ |
19,516 |
|
|
2008 Valuation allowance |
|
$ |
439 |
|
|
$ |
991 |
|
|
$ |
— |
|
|
$ |
102 |
|
|
$ |
1,328 |
|
|
2007 Valuation allowance |
|
$ |
29,147 |
|
|
$ |
— |
|
|
$ |
(12,308 |
) |
|
$ |
16,400 |
(b) |
|
$ |
439 |
|
(a) Consists of Accounts Receivable and Notes Receivables.
(b) Includes a benefit of approximately $16.4 million recognized in the Consolidated Income Statements for the year ended December 31, 2007.
101
Pursuant to the requirements of Section 13 or 15(d) of the Securities Exchange Act of 1934, the registrant has duly caused this report to be signed on its behalf by the undersigned, thereunto duly authorized.
|
|
|
|
|
|
|
|
SOTHEBY’S |
|
|
|
|
|
|
|
|
By: |
/s/ WILLIAM F. RUPRECHT |
|
|
|
|
William F. Ruprecht |
|
|
|
|
President and Chief Executive Officer |
|
Date: March 1, 2010
Pursuant to the requirements of the Securities Exchange Act of 1934, this report has been signed below by the following persons on behalf of the registrant and in the capacities and on the dates indicated.
|
|
|
|
|
|
|
Signature |
|
Title |
|
Date |
|
|
|
|||
|
|
|
|
|
|
|
/s/ MICHAEL I. SOVERN* |
|
Chairman of the Board |
|
March 1, 2010 |
|
Michael I. Sovern |
|
|
|
|
|
|
|
|
|
|
|
/s/ DEVONSHIRE* |
|
Deputy Chairman of the Board |
|
March 1, 2010 |
|
Duke of Devonshire |
|
|
|
|
|
|
|
|
|
|
|
/s/ WILLIAM F. RUPRECHT |
|
President, Chief Executive Officer and |
|
March 1, 2010 |
|
William F. Ruprecht |
|
Director |
|
|
|
|
|
|
|
|
|
/s/ ROBIN G. WOODHEAD* |
|
Executive Vice President and Director |
|
March 1, 2010 |
|
Robin G. Woodhead |
|
|
|
|
|
|
|
|
|
|
|
/s/ JOHN ANGELO* |
|
Director |
|
March 1, 2010 |
|
John Angelo |
|
|
|
|
|
|
|
|
|
|
|
/s/ BLAKENHAM* |
|
Director |
|
March 1, 2010 |
|
Michael Blakenham |
|
|
|
|
|
|
|
|
|
|
|
/s/ ALLEN QUESTROM* |
|
Director |
|
March 1, 2010 |
|
Allen Questrom |
|
|
|
|
|
|
|
|
|
|
|
/s/ DONALD H. STEWART* |
|
Director |
|
March 1, 2010 |
|
Donald H. Stewart |
|
|
|
|
|
|
|
|
|
|
|
/s/ DIANA TAYLOR* |
|
Director |
|
March 1, 2010 |
|
Diana Taylor |
|
|
|
|
|
|
|
|
|
|
|
/s/ ROBERT S. TAUBMAN* |
|
Director |
|
March 1, 2010 |
|
Robert S. Taubman |
|
|
|
|
|
|
|
|
|
|
|
/s/ DENNIS WEIBLING* |
|
Director |
|
March 1, 2010 |
|
Dennis Weibling |
|
|
|
|
|
|
|
|
|
|
|
/s/ WILLIAM S. SHERIDAN |
|
Executive Vice President and |
|
March 1, 2010 |
|
William S. Sheridan |
|
Chief Financial Officer |
|
|
|
|
|
|
|
|
|
|
|
|
|
|
|
/s/ KEVIN M. DELANEY |
|
Senior Vice President, Controller and |
|
March 1, 2010 |
|
Kevin M. Delaney |
|
Chief Accounting Officer |
|
|
|
|
|
|
|
|
|
/s/ WILLIAM S. SHERIDAN |
|
|
|
March 1, 2010 |
|
*William S. Sheridan |
|
|
|
|
|
as Attorney-in-Fact |
|
|
|
|
102
EXHIBIT INDEX
|
Exhibit No. |
|
Description |
|
|
|
|
|
2.1 |
— |
Agreement and Plan of Merger between Sotheby’s Holdings, Inc., a Michigan corporation and Sotheby’s Delaware, Inc., a Delaware corporation, dated March 31, 2006, incorporated by reference to the Company’s First Quarter Form 10-Q for 2006. |
|
|
|
|
|
2.2 |
— |
Agreement for the Sale and Purchase of All the Issued and Outstanding Shares in Noortman Master Paintings B.V., dated June 7, 2006, incorporated by reference to Exhibit 2.1 to the Company’s Second Quarter Form 10-Q for 2006. |
|
|
|
|
|
3.1 |
— |
Certificate of Incorporation of Sotheby’s, as amended as of June 30, 2006, incorporated by reference to Exhibit 3.1 to the Company’s current report on Form 8-K, filed on July 7, 2006 with the Securities and Exchange Commission. |
|
|
|
|
|
3.2 |
— |
By-Laws of Sotheby’s, as amended and restated as of August 4, 2009, incorporated by reference to Exhibit 3.2 to the Company’s Second Quarter Form 10-Q for 2009. |
|
|
|
|
|
3.3 |
— |
Form of Indemnity Agreement, as amended and restated as of August 4, 2009, incorporated by reference to Exhibit 10.1 to the Company’s Second Quarter Form 10-Q for 2009. |
|
|
|
|
|
4.1 |
— |
See Exhibits 3.1, 3.2 and 3.3. |
|
|
|
|
|
4.2 |
— |
Specimen Common Stock Certificate of Sotheby’s, incorporated by reference to Exhibit 4.1 to Post-Effective Amendment No. 1 to the Company’s Registration Statement on Form 8-A filed on November 21, 2006. |
|
|
|
|
|
4.3 |
— |
Indenture, dated as of June 17, 2008, for the 3.125% Convertible Senior Notes due 2013 between Sotheby’s, as Issuer, and the Initial Subsidiary Guarantors Party Hereto, and U.S. Bank National Association, as Trustee, incorporated by reference to Exhibit 10.1 to the Company’s Second Quarter Form 10-Q for 2008. |
|
|
|
|
|
4.4 |
— |
Indenture, dated as of June 17, 2008, 7.75% Senior Notes due 2015 between Sotheby’s, as Issuer, and the Initial Subsidiary Guarantors Party Hereto, and U.S. Bank National Association, as Trustee, incorporated by reference to Exhibit 10.2 to the Company’s Second Quarter Form 10-Q for 2008. |
|
|
|
|
|
4.5 |
— |
Registration Rights Agreement dated June 17, 2008, between Sotheby’s and Banc of America Securities LLC, Goldman, Sachs & Co., Comerica Securities, Inc. and HSBC Securities (USA) Inc, incorporated by reference to Exhibit 10.3 to the Company’s Second Quarter Form 10-Q for 2008. |
|
|
|
|
|
10.1* |
— |
Sotheby’s Deferred Compensation Plan, dated December 21, 2006 and effective January 1, 2007, incorporated by reference to Exhibit 10.2 to the Company’s Annual Report on Form 10-K for the year ended December 31, 2006. |
|
|
|
|
|
10.2* |
— |
Sotheby’s Holdings, Inc. 1997 Stock Option Plan Composite Plan Document, effective January 1, 2000, incorporated by reference to Exhibit 10(k) to the Company’s Annual Report on Form 10-K for the year ended December 31, 2000. |
|
|
|
|
|
10.3* |
— |
Seventh Amendment to the Sotheby’s Holdings, Inc. 1997 Stock Option Plan dated November 7, 2005, effective September 8, 2005, incorporated by reference to Exhibit 10.4 to the Company’s Annual Report on Form 10-K for the year ended December 31, 2005. |
|
|
|
|
|
10.4* |
— |
Eighth Amendment to the Sotheby’s 1997 Stock Option Plan Composite Plan Document, dated and effective May 8, 2006, incorporated by reference to Exhibit 10.2 to the Company’s current report on Form 8-K dated May 12, 2006. |
|
|
|
|
|
10.5 |
— |
Agreement of Partnership of Acquavella Modern Art, dated May 29, 1990, between Sotheby’s Nevada, Inc. and Acquavella Contemporary Art, Inc., incorporated by reference to Exhibit 10(b) to the Company’s current report on Form 8-K, filed on June 7, 1990, SEC File No. 1-9750, on file at the Washington, D.C. office of the Securities and Exchange Commission. |
|
|
|
|
|
10.6 |
— |
First Amendment to Agreement of Partnership, dated December 31, 2000, of Acquavella Modern Art, between Sotheby’s Nevada, Inc. and Acquavella Contemporary Art, Inc., incorporated by reference to Exhibit 10(m) to the Company’s Annual Report on Form 10-K for the year ended December 31, 2000. |
103
|
10.7 |
— |
Second Amendment to Agreement of Partnership, dated December 15, 2001, of Acquavella Modern Art, between Sotheby’s Nevada, Inc. and Acquavella Contemporary Art, Inc., incorporated by reference to Exhibit 10(k) to the Company’s Annual Report on Form 10-K for the year ended December 31, 2001. |
|
|
|
|
|
10.8 |
— |
Third Amendment to Agreement of Partnership, dated February 10, 2003, of Acquavella Modern Art, between Sotheby’s Nevada, Inc. and Acquavella Contemporary Art, Inc., incorporated by reference to Exhibit 10(h) to the Company’s Annual Report on Form 10-K for the year ended December 31, 2002. |
|
|
|
|
|
10.9 |
— |
Fourth Amendment to Agreement of Partnership, dated January 13, 2004, of Acquavella Modern Art, between Sotheby’s Nevada, Inc. and Acquavella Contemporary Art, Inc., incorporated by reference to Exhibit 10(i) to the Company’s Annual Report on Form 10-K for the year ended December 31, 2003. |
|
|
|
|
|
10.10 |
— |
Fifth Amendment to Agreement of Partnership, dated December 8, 2004, of Acquavella Modern Art, between Sotheby’s Nevada, Inc. and Acquavella Contemporary Art, Inc., incorporated by reference to Exhibit 10.9 to the Company’s Annual Report on Form 10-K for the year ended December 31, 2004. |
|
|
|
|
|
10.11 |
— |
Sixth Amendment to Agreement of Partnership, dated March 1, 2006, of Acquavella Modern Art, between Sotheby’s Nevada, Inc. and Acquavella Contemporary Art, Inc. incorporated by reference to Exhibit 10.11 to the Company’s Annual Report on Form 10-K for the year ended December 31, 2005. |
|
|
|
|
|
10.12 |
— |
Seventh Amendment to the Agreement of Partnership, dated January 12, 2007, of Acquavella Modern Art, between Sotheby’s Nevada, Inc. and Acquavella Contemporary Art, Inc., incorporated by reference to Exhibit 10.4 to the Company’s First Quarter Form 10-Q for 2007. |
|
|
|
|
|
10.13 |
— |
Eighth Amendment to the Agreement of Partnership, dated January 23, 2008, of Acquavella Modern Art, between Sotheby’s Nevada, Inc. and Acquavella Contemporary Art, Inc., incorporated by reference to Exhibit 10.2 to the Company’s First Quarter Form 10-Q for 2008. |
|
|
|
|
|
10.14 |
— |
Ninth Amendment to the Agreement of Partnership, dated February 11, 2009, of Acquavella Modern Art, between Sotheby’s Nevada, Inc. and Acquavella Contemporary Art, incorporated by reference to Exhibit 10.6 to the Company’s First Quarter Form 10-Q for 2009. |
|
|
|
|
|
10.15* |
— |
Sotheby’s 1998 Stock Compensation Plan for Non-Employee Directors, as amended and restated on April 9, 2007, effective May 7, 2007 (the “Directors Plan”), incorporated by reference to Exhibit 10.2 to the Company’s current report on Form 8-K, filed on May 11, 2007. |
|
|
|
|
|
10.16* |
— |
First Amendment to the Directors Plan, dated November 6, 2007, incorporated by reference to Exhibit 10.14 to the Company’s Annual Report on Form 10-K for the year ended December 31, 2007 (the “2007 Form 10-K”). |
|
|
|
|
|
10.17 |
— |
Credit Agreement dated as of August 31, 2009, among Sotheby’s (a Delaware corporation), Sotheby’s Inc., Sotheby’s Financial Services, Inc., Sotheby’s Financial Services California, Inc., Oberon, Inc., Theta, Inc., Sotheby’s Ventures, LLC, Oatshare Limited, Sotheby’s (a company registered in England) and Sotheby’s Financial Services Limited, as Borrowers and General Electric Capital Corporation, as Agent and a Lender, GE Capital Markets, Inc. and HSBC Bank PLC, as Joint Lead Arrangers and Joint Bookrunners and Other Credit Parties and Lenders Hereto, incorporated by reference to Exhibit 10.1 to the Company’s current report on Form 8-K dated September 1, 2009. |
|
|
|
|
|
10.18 |
— |
Amendment No. 1 to Credit Agreement, dated as of December 17, 2009, by and among Sotheby’s (a Delaware corporation), Sotheby’s, Inc., Sotheby’s Financial Services, Inc, Sotheby’s Financial Services California, Inc., Oberon, Inc., Theta, Inc., Sotheby’s Ventures, LLC, Oatshare Limited, Sotheby’s (a company registered in England), and Sotheby’s Financial Services Limited, as Borrowers and General Electric Capital Corporation, as a Lender and as Agent for the Lenders and the Fronting Lender, and the other Lenders signatory hereto, amends that certain Credit Agreement, dated as of August 31, 2009, by and among the Borrowers, other Credit Parties signatory thereto, the Agent, the Fronting Lender, and the Lenders. |
|
|
|
|
|
10.19 |
— |
Purchase and Sale Agreement, dated January 11, 2008 between 1334 York Avenue L.P., Seller and Sotheby’s, purchaser for 1334 York Avenue, New York, New York 10021, incorporated by reference to Exhibit 10.1 to the Company’s First Quarter Form 10-Q for 2009. |
|
|
|
|
|
10.20 |
— |
Consent and Assumption Agreement with Release, dated as of February 6, 2009 between 1334 York, LLC as New Borrower, Sotheby’s as New Guarantor, 1334 York Avenue L.P., as Original Borrower, Aby Rosen and Michael Fuchs as Original Guarantor and Bank of America, N.A. as Agent and certain other parties, incorporated by reference to Exhibit 10.2 to the Company’s First Quarter Form 10-Q for 2009. |
104
|
10.21 |
— |
Loan Agreement, dated as of June 22, 2005 between 1334 York Avenue L.P., as Borrower and Bank of America, N.A., as Lender, incorporated by reference to Exhibit 10.3 to the Company’s First Quarter Form 10-Q for 2009. |
|
|
|
|
|
10.22 |
— |
First Amendment to Loan Agreement and Other Loan Documents, dated as of September 20, 2005 between 1334 York Avenue L.P., as Borrower, and Bank of America, N.A., as Lender, incorporated by reference to Exhibit 10.4 to the Company’s First Quarter Form 10-Q for 2009. |
|
|
|
|
|
10.23 |
— |
Lease between 1334 York Avenue L.P., “Landlord,” and Sotheby’s, Inc., “Tenant,” February 7, 2003; Premises: 1334 York Avenue, New York, New York, incorporated by reference to Exhibit 10(b) to the Company’s First Quarter Form 10-Q for 2003. |
|
|
|
|
|
10.24 |
— |
Guaranty of Lease, made by Sotheby’s in favor of 1334 York Avenue L.P., dated as of June 30, 2006 incorporated by reference to Exhibit 10.29 to the Company’s current report on Form 8-K, filed on July 7, 2006. |
|
|
|
|
|
10.25* |
— |
Letter Agreement between Sotheby’s Holdings, Inc. and William F. Ruprecht, with related Terms of Employment, dated March 31, 2006, incorporated by reference to Exhibit 10.23 to the 2007 Form 10-K. |
|
|
|
|
|
10.26* |
— |
Letter Agreement between Sotheby’s and William F. Ruprecht, dated March 23, 2009, incorporated by reference to Exhibit 10.1 to the Company’s current report on Form 8-K, filed on March 23, 2009. |
|
|
|
|
|
10.27* |
— |
Severance Agreement between Sotheby’s and William S. Sheridan, dated August 3, 2006, incorporated by reference to Exhibit 10.1 to the Company’s Third Quarter Form 10-Q for 2006. |
|
|
|
|
|
10.28* |
— |
Amendment to the August 3, 2006 Severance Agreement (as amended March 7, 2008) between Sotheby’s and William S. Sheridan, dated April 27, 2009, effective May 1, 2009, incorporated by reference to Exhibit 10.1 to the Company’s current report on Form 8-K filed on April 28, 2009. |
|
|
|
|
|
10.29* |
— |
Service Agreement between Sotheby’s and Robin Woodhead, with related Terms of Employment, dated August 15, 2006, incorporated by reference to Exhibit 10.2 to the Company’s Third Quarter Form 10-Q for 2006. |
|
|
|
|
|
10.30* |
— |
Amendment to the August 15, 2006 Employment Agreement (as amended March 7, 2008) between Sotheby’s and Robin Woodhead, dated April 27, 2009, effective May 1, 2009, incorporated by reference to Exhibit 10.2 to the Company’s current report on Form 8-K filed on April 28, 2009. |
|
|
|
|
|
10.31* |
— |
Letter Agreement between Sotheby’s and Bruno Vinciguerra, with related Terms of Employment, dated April 27, 2009, effective May 1, 2009, incorporated by reference to Exhibit 10.3 to the Company’s current report on Form 8-K filed on April 28, 2009. |
|
|
|
|
|
10.32* |
— |
Severance Agreement between Sotheby’s and Bruno Vinciguerra, dated as of December 18, 2009, effective January 1, 2010, incorporated by reference to Exhibit 10.1 to the Company’s current report on Form 8-K filed on December 23, 2009. |
|
|
|
|
|
10.33* |
— |
Severance Agreement between Sotheby’s and Gilbert Klemann, dated October 9, 2007, effective February 1, 2008, incorporated by reference to Exhibit 10.28 to the 2007 Form 10-K. |
|
|
|
|
|
10.34* |
— |
Amendment to October 9, 2007 Severance Agreement between Sotheby’s and Gilbert Klemann, dated as of September 9, 2008, effective September 25, 2008, incorporated by reference to Exhibit 10.2 to the Company’s Third Quarter Form 10-Q for 2008. |
|
|
|
|
|
10.35* |
— |
Letter Agreement between Sotheby’s and Mitchell Zuckerman, dated April 27, 2009, effective May 1, 2009, incorporated by reference to Exhibit 10.4 to the Company’s current report on Form 8-K filed on April 28, 2009. |
|
|
|
|
|
10.36* |
— |
Severance Agreement between Sotheby’s and Mitchell Zuckerman, dated December 18, 2009, effective January 1, 2010, incorporated by reference to Exhibit 10.2 to the Company’s current report on Form 8-K filed on December 23, 2009. |
|
|
|
|
|
10.37* |
— |
Sotheby’s Holdings, Inc. Amended and Restated Restricted Stock Plan, incorporated by reference to Exhibit 10.1 to the Company’s Registration Statement on Form S-8 filed on May 9, 2006. |
|
|
|
|
|
10.38* |
— |
First Amendment to Sotheby’s Amended and Restated Restricted Stock Plan, dated July 28, 2006, incorporated by reference to Exhibit 10.1 to the Company’s Second Quarter Form 10-Q for 2007. |
105
|
10.39* |
— |
Form of Sotheby’s Amended and Restated Restricted Stock Plan Restricted Stock Agreement, incorporated by reference to Exhibit 10.2 to the Company’s Second Quarter Form 10-Q for 2007. |
|
|
|
|
|
10.40* |
— |
Form of Sotheby’s Amended and Restated Restricted Stock Plan Restricted Stock Entitlement Agreement, incorporated by reference to Exhibit 10.3 to the Company’s Second Quarter Form 10-Q for 2007. |
|
|
|
|
|
10.41* |
— |
Second Amendment to Sotheby’s Amended and Restated Restricted Stock Plan, dated September 7, 2007, incorporated by reference to Exhibit 10.2 to the Company’s Third Quarter Form 10-Q for 2007. |
|
|
|
|
|
10.42* |
— |
Sotheby’s Restricted Stock Unit Plan, (As Amended and Restated Effective As Of February 1, 2009), incorporated by reference to Exhibit 10.5 to the Company’s First Quarter Form 10-Q for 2009. |
|
|
|
|
|
10.43 |
— |
Stock Purchase Agreement, dated as of February 17, 2004, by and among NRT Incorporated as the Purchaser, Sotheby’s Holdings, Inc., as the Seller, and Cendant Corporation as the Purchaser Guarantor, incorporated by reference to Exhibit 99.1 to the Company’s current report on Form 8-K, filed on March 2, 2004. |
|
|
|
|
|
10.44 |
— |
Trademark License Agreement, dated as of February 17, 2004, among SPTC, Inc., as Licensor, Sotheby’s Holdings, Inc. as Guarantor, Monticello Licensee Corporation, as Licensee, and Cendant Corporation, as Guarantor, incorporated by reference to Exhibit 99.2 to the Company’s current report on Form 8-K, filed on March 2, 2004. |
|
|
|
|
|
10.45 |
— |
Amendment No. 1 to Trademark License Agreement, dated as of May 2, 2005, among SPTC Delaware, LLC (as an assignee of SPTC, Inc) and Sotheby’s Holdings, Inc. and Cendant Corporation and Sotheby’s International Realty Licensee Corporation (formerly known as Monticello Licensee Corporation), incorporated by reference to Exhibit 10.1 to the Company’s Second Quarter Form 10-Q for 2005. |
|
|
|
|
|
10.46 |
— |
Amendment No. 2 to Trademark License Agreement, dated as of May 2, 2005, among SPTC Delaware, LLC (as an assignee of SPTC, Inc) and Sotheby’s Holdings, Inc. and Cendant Corporation and Sotheby’s International Realty Licensee Corporation (formerly known as Monticello Licensee Corporation), incorporated by reference to Exhibit 10.2 to the Company’s Second Quarter Form 10-Q for 2005. |
|
|
|
|
|
10.47* |
— |
Sotheby’s Executive Bonus Plan (as amended and restated effective as of January 1, 2007), dated April 9, 2007, incorporated by reference to Exhibit 10.1 to the Company’s current report on Form 8-K, filed on May 11, 2007. |
|
|
|
|
|
10.48 |
— |
Transaction Agreement by and among Sotheby’s Holdings, Inc., and A. Alfred Taubman and Other Parties to the Agreement, dated as of September 7, 2005, incorporated by reference to Exhibit 10.1 to the Company’s Third Quarter Form 10-Q for 2005. |
|
|
|
|
|
10.49 |
— |
Convertible Bond Hedge Transaction (Transaction Reference Number: NY-35263), dated June 11, 2008, between Sotheby’s and Bank of America, N.A, incorporated by reference to Exhibit 10.4 to the Company’s Second Quarter Form 10-Q for 2008. |
|
|
|
|
|
10.50 |
— |
Convertible Bond Hedge Transaction (Transaction Reference Number: SDB1627455583), dated June 11, 2008, between Sotheby’s and Goldman, Sachs & Co, incorporated by reference to Exhibit 10.5 to the Company’s Second Quarter Form 10-Q for 2008. |
|
|
|
|
|
10.51 |
— |
Issuer Warrant Transaction (Transaction Reference Number: NY-35264), dated June 11, 2008, between Sotheby’s and Bank of America, N.A, incorporated by reference to Exhibit 10.6 to the Company’s Second Quarter Form 10-Q for 2008. |
|
|
|
|
|
10.52 |
— |
Issuer Warrant Transaction (Transaction Reference Number: SDB1627455582), dated June 11, 2008 between Sotheby’s and Goldman, Sachs & Co, incorporated by reference to Exhibit 10.7 to the Company’s Second Quarter Form 10-Q for 2008. |
|
|
|
|
|
21 |
— |
Subsidiaries of the Registrant |
|
|
|
|
|
23 |
— |
Consent of Deloitte & Touche LLP |
|
|
|
|
|
24 |
— |
Powers of Attorney |
|
|
|
|
|
31.1 |
— |
Certification of Chief Executive Officer pursuant to Section 302 of the Sarbanes-Oxley Act of 2002. |
|
|
|
|
|
31.2 |
— |
Certification of Chief Financial Officer pursuant to Section 302 of the Sarbanes-Oxley Act of 2002. |
|
|
|
|
|
32.1 |
— |
Certification of Chief Executive Officer pursuant to Section 906 of the Sarbanes-Oxley Act of 2002. |
|
|
|
|
|
32.2 |
— |
Certification of Chief Financial Officer pursuant to Section 906 of the Sarbanes-Oxley Act of 2002. |
|
* |
A compensatory agreement or plan required to be filed pursuant to Item 15(c) of Form 10-K |
106