Attached files
| file | filename |
|---|---|
| EX-21 - EXHIBIT 21 - SEALED AIR CORP/DE | a2196675zex-21.htm |
| EX-32 - EXHIBIT 32 - SEALED AIR CORP/DE | a2196675zex-32.htm |
| EX-23.1 - EXHIBIT 23.1 - SEALED AIR CORP/DE | a2196675zex-23_1.htm |
| EX-31.2 - EXHIBIT 31.2 - SEALED AIR CORP/DE | a2196675zex-31_2.htm |
| EX-31.1 - EXHIBIT 31.1 - SEALED AIR CORP/DE | a2196675zex-31_1.htm |
| EX-12.1 - EXHIBIT 12.1 - SEALED AIR CORP/DE | a2196675zex-12_1.htm |
| EX-10.16 - EXHIBIT 10.16 - SEALED AIR CORP/DE | a2196675zex-10_16.htm |
| EX-10.44 - EXHIBIT 10.44 - SEALED AIR CORP/DE | a2196675zex-10_44.htm |
| EX-10.21 - EXHIBIT 10.21 - SEALED AIR CORP/DE | a2196675zex-10_21.htm |
UNITED STATES
SECURITIES AND EXCHANGE COMMISSION
Washington, D.C. 20549
FORM 10-K
| (Mark One) | ||
ý |
ANNUAL REPORT PURSUANT TO SECTION 13 OR 15(d) OF THE SECURITIES EXCHANGE ACT OF 1934 |
|
For the fiscal year ended December 31, 2009 |
||
or |
||
o |
TRANSITION REPORT PURSUANT TO SECTION 13 OR 15(d) OF THE SECURITIES EXCHANGE ACT OF 1934 |
|
For the transition period from to |
||
Commission file number 1-12139
SEALED AIR CORPORATION
(Exact name of registrant as specified in its charter)
| Delaware (State or other jurisdiction of incorporation or organization) |
65-0654331 (I.R.S. Employer Identification Number) |
|
200 Riverfront Boulevard, Elmwood Park, New Jersey (Address of principal executive offices) |
07407-1033 (Zip Code) |
Registrant's telephone number, including area code: (201) 791-7600
Securities registered pursuant to Section 12(b) of the Act:
| Title of each class | Name of each exchange on which registered | |
|---|---|---|
| Common Stock, par value $0.10 per share | New York Stock Exchange |
Securities registered pursuant to Section 12(g) of the Act: None
Indicate by check mark if the registrant is a well-known seasoned issuer, as defined in Rule 405 of the Securities Act. Yes ý No o
Indicate by check mark if the registrant is not required to file reports pursuant to Section 13 or Section 15(d) of the Exchange Act. Yes o No ý
Indicate by check mark whether the registrant (1) has filed all reports required to be filed by Section 13 or 15(d) of the Securities Exchange Act of 1934 during the preceding 12 months (or for such shorter period that the registrant was required to file such reports), and (2) has been subject to such filing requirements for the past 90 days. Yes ý No o
Indicate by check mark whether the registrant has submitted electronically and posted on its corporate Web site, if any, every Interactive Data File required to be submitted and posted pursuant to Rule 405 of Regulation S-T (§232.405 of this chapter) during the preceding 12 months (or for such shorter period that the registrant was required to submit and post such files). Yes o No o
Indicate by check mark if disclosure of delinquent filers pursuant to Item 405 of Regulation S-K is not contained herein, and will not be contained, to the best of registrant's knowledge, in definitive proxy or information statements incorporated by reference in Part III of this Form 10-K or any amendment to this Form 10-K. ý
Indicate by check mark whether the registrant is a large accelerated filer, an accelerated filer, a non-accelerated filer, or a smaller reporting company. See definitions of "large accelerated filer," "accelerated filer" and "smaller reporting company" in Rule 12b-2 of the Exchange Act.
| Large accelerated filer ý | Accelerated filer o | Non-accelerated filer o (Do not check if a smaller reporting company) |
Smaller reporting company o |
Indicate by check mark whether the registrant is a shell company (as defined in Rule 12b-2 of the Exchange Act). Yes o No ý
As of the last business day of the registrant's most recently completed second fiscal quarter, June 30, 2009, the aggregate market value of the registrant's common stock held by non-affiliates of the registrant was approximately $2,872,000,000, based on the closing sale price as reported on the New York Stock Exchange.
There were 158,938,174 shares of the registrant's common stock, par value $0.10 per share, issued and outstanding as of January 31, 2010.
DOCUMENTS INCORPORATED BY REFERENCE: Portions of the registrant's definitive proxy statement for its 2010 Annual Meeting of Stockholders, to be held on May 19, 2010, are incorporated by reference into Part III of this Form 10-K.
SEALED AIR CORPORATION AND SUBSIDIARIES
Table of Contents
i
Beginning with the invention of Bubble Wrap® fifty years ago, Sealed Air Corporation has become a leading global innovator and manufacturer of a wide range of packaging and performance-based materials and equipment systems that now serve an array of food, industrial, medical and consumer applications. Today, we maintain business operations in 51 countries and sell products under widely recognized brands such as our Bubble Wrap® brand cushioning, Jiffy® protective mailers, Instapak® foam-in-place systems and Cryovac® packaging technology. Our operations allows us to generate approximately 54% of our revenue from outside the United States and approximately 16% of our revenue from developing regions. These developing regions are Latin America, Central and Eastern Europe, Commonwealth of Independent States, Middle East, Africa, Southeast Asia, China and India.
We conduct substantially all of our business through two direct wholly-owned subsidiaries, Cryovac, Inc. and Sealed Air Corporation (US). These two subsidiaries, directly and indirectly, own substantially all of the assets of the business and conduct operations themselves and through subsidiaries around the world. Throughout this report, when we refer to "Sealed Air," the "Company," "we," "us" or "our," we are referring to Sealed Air Corporation and all of our subsidiaries, except where the context indicates otherwise.
Our Business Strategies
We are dedicated to key strategic priorities to develop our business and to build upon our strengths to enhance our leadership position. These priorities are:
- •
- Innovation leadership with ongoing solution and service
development: We continue to expand our presence in both existing and new end market applications by focusing on innovative solutions
that bring measurable value to our customers and to end-consumers. Our distinctive systems approach accommodates ongoing innovation in differentiated materials, products and equipment
systems, as well as in integrated packaging solutions and other services.
- •
- Growth in developing regions: With an international focus
and extensive geographic footprint, we will leverage our broad portfolio and strengths in innovation to lead growth in developing regions, as well as complement our efforts to enhance our position in
more developed regions. Growing trends in urbanization, global trade, increased protein consumption and the conversion to safe and hygienic packaged goods allows all of our businesses to benefit from
developing region growth.
- •
- Focus on cash flow and return on assets: We focus on the
management of the business to generate substantial operating cash flow so that we may continue to spend on innovative research and development and to continue to invest in the business and its
strategies.
- •
- Optimize processes and operations to maximize
profitability: We are focused on deriving greater efficiencies by leveraging our global supply chain structure by maximizing scale and
collaboration and minimizing complexity and costs.
- •
- Sustainability: We are dedicated to responsible management
of our business, minimizing risks and being good stewards of the environment and the communities we live in and serve, while maximizing benefits and responsiveness to our stakeholders. We focus on
source reduction, recyclability and the growing use of renewable content, as well as efficient use of energy and other resources.
- •
- Develop our people: A core strength is our people. We will grow our business through ongoing development of key skills in a diverse workforce that operates consistent with our code of conduct.
Segments
We report our business publicly in four parts: three reportable segments and an "Other" category.
Our reportable segments are:
- 1.
- Food
Packaging;
- 2.
- Food
Solutions; and
- 3.
- Protective Packaging, which includes Shrink Packaging.
1
Our Other category includes:
- (a)
- Specialty
Materials;
- (b)
- Medical
Applications; and
- (c)
- New Ventures.
Information concerning our reportable segments, including net sales, depreciation and amortization, operating profit and assets, appears in Note 3, "Segments," of Notes to Consolidated Financial Statements.
Descriptions of the Reportable Segments and Other Category
We offer a broad range of solutions across leading brands worldwide. Approximately 60% of our total net sales in each of the fiscal years 2009, 2008 and 2007 were in our food businesses, while approximately 30% of our total net sales were in our industrial packaging businesses. The balance of our net sales has been in our specialty materials and medical applications business.
Food Packaging
In this segment, we focus on the automated packaging of perishable foods. Our products are primarily focused on fresh and processed meats and cheeses that are sold primarily to food processors, distributors, supermarket retailers and foodservice businesses. We market these products mostly under the Cryovac® trademark. This segment's growth opportunities are targeted toward developments in technologies that enable our customers to package and ship their meat and cheese products effectively through their supply chain. These technologies focus on automation and packaging integration solutions, innovation in material science and expansion of the sale of our products into developing regions, where consumers continue to expand their protein consumption and are transitioning to packaged products.
Our Food Packaging segment offerings include:
- •
- shrink bags to vacuum package many fresh food products, including beef, lamb, pork, poultry and seafood, as well as cheese
and smoked and processed meats;
- •
- packaging materials for cook-in applications, predominately for the deli and foodservice businesses;
- •
- a wide range of laminated and coextruded rollstock packaging materials utilized in thermoforming and form, fill and seal
applications, which provide an effective packaging alternative for a variety of fresh meats, smoked and processed meats, seafood, poultry and cheese applications;
- •
- packaging trays; and
- •
- associated packaging equipment and systems, including bag loaders, dispensers and vacuum chamber systems.
Some of our more recent new product offerings in this segment are:
- •
- Oven Ease™ ovenable bag for bone-in or boneless meat and poultry products;
- •
- Cryovac Roboloader® system, which combines a product-detecting conveyor, which measures a product's width,
and, using a robotic arm, selects and opens the corresponding bag for the product's size from one of up to six dispensing units;
- •
- PakFormance™ integrated packaging solutions—systems combining hardware, software, equipment and
services that give food processors control and oversight of the food packaging process;
- •
- Multi-Seal® package, an easy open and reclosable deli package;
- •
- Freshness Plus™ oxygen scavenging systems and odor scavenging materials;
- •
- Cryovac Grip & Tear® bags, easy-open end-seal bags for fresh meats, poultry, and smoked and processed products;
2
- •
- Cryovac® BL145 and BL175 automatic loaders for roll-serrated bags; and
- •
- Cryovac® CNP310 heavy bags for post-packaging pasteurization of smoked and processed products.
Food Solutions
In this segment, we target advancements in food packaging technologies that provide consumers convenient access to fresh, consistently prepared, high-quality meals, either from foodservice outlets or from expanding retail cases at grocery stores. We sell the products in this reportable segment primarily to food processors, distributors, supermarket retailers and foodservice businesses. We sell products in this segment under the Cryovac®, Simple Steps®, Darfresh®, and other trademarks. This segment's growth strategy is focused on developing convenience-oriented solutions through material science and innovative end applications that serve both consumers and the commercial chef.
Our Food Solutions segment offerings include:
- •
- case-ready packaging offerings that are utilized in the centralized packaging of various proteins, including
beef, lamb, poultry, smoked and processed meats, seafood and cheese, for retail sale at the consumer level;
- •
- ready meals packaging, including our Simple Steps® package, a microwavable package designed with vacuum skin
packaging technology and a unique self-venting feature, and also our flex-tray-flex package, which is an oven-compatible package that utilizes
skin-pack technology;
- •
- vertical pouch packaging for packaging flowable food products, including soups and sauces, salads, meats, toppings and
syrups, including film and filling equipment systems for products utilizing hot and ambient, retort and aseptic processing methods;
- •
- packaging solutions for produce, bakery goods and pizza, including our Cryovac PizzaFresh® offering;
- •
- Entapack® intermediate bulk container products, which are used in the food, beverage and industrial processing
industries for storage and transportation of primarily liquid material;
- •
- foam and solid plastic trays and containers that customers use to package a wide variety of food products;
- •
- absorbent products used for food packaging, such as our Dri-Loc® absorbent pads;
and
- •
- related packaging equipment systems, including vertical pouch packaging systems and vacuum chamber systems.
Some of our more recent new product offerings in this segment are:
- •
- Cryovac® Deli-Snap™, a high-barrier lidstock,
snap-on-lidded tray for processed deli-meats and cheeses; and
- •
- Cryovac® OFT ovenable foam trays for pizza.
Outsourced Products
Included in this segment are products produced in our facilities as well as products fabricated by other manufacturers, which we refer to as outsourced products. Outsourced products include, among others, foam and solid plastic trays and containers fabricated primarily in North America and Europe and selected equipment. We have strategically opted to use third-party manufacturers for technically less complex products in order to offer customers a broader range of solutions. We have benefited from this strategy with increased net sales and operating profit requiring minimal capital expenditures. See "Outsourced Products," included in Item 7. "Management's Discussion and Analysis of Financial Condition and Results of Operations," for further information.
Protective Packaging
This segment includes our air cellular packaging materials, the product on which we were founded fifty years ago. This segment comprises our core protective packaging technologies and solutions aimed at traditional industrial applications as well as consumer-oriented packaging solutions. We aggregate our
3
protective packaging products and shrink packaging products into our Protective Packaging segment for reporting purposes. We sell products in this segment primarily to distributors and manufacturers in a wide variety of industries as well as to retailers and to e-commerce and mail order fulfillment firms. This segment's growth is focused on providing a broader range of protective packaging products and solutions worldwide by focusing on advancements in material science, automation, and the development of reliable customer equipment. We target markets that serve both developed and developing regions.
Our Protective Packaging segment offerings include:
- •
- Bubble Wrap® brand and AirCap® brand air cellular packaging materials, which employ a "barrier
layer" that retains air for longer lasting protection, forming a pneumatic cushion to protect products from damage through shock or vibration during shipment;
- •
- Cryovac®, Opti® and CorTuff® performance shrink films for product display and
merchandising applications, which customers use to "shrink-wrap" a wide assortment of industrial and consumer products as well as produce;
- •
- Shanklin® and Opti® shrink packaging equipment systems;
- •
- Instapak® polyurethane foam packaging systems, which consist of proprietary blends of polyurethane chemicals,
high performance polyolefin films and specially designed dispensing equipment that provide protective packaging for a wide variety of applications;
- •
- Jiffy® mailers and bags, including lightweight, tear-resistant mailers lined with air cellular
cushioning material that are marketed under the Jiffylite® and TuffGard® trademarks, Jiffy® padded mailers made from recycled kraft paper padded with macerated
recycled newspaper, and Jiffy® ShurTuff® bags composed of multi-layered polyolefin film;
- •
- PackTiger® paper cushioning system, a versatile high-speed paper packaging solution that includes
both recycled paper and automated dispensing equipment;
- •
- Kushion Kraft®, Custom Wrap™, Jiffy Packer® and Void Kraft™ paper
packaging products;
- •
- Korrvu® suspension and retention packaging;
- •
- inflatable packaging systems, including our Fill-Air® inflatable packaging system, which converts
rolls of polyethylene film into continuous perforated chains of air-filled cushions, our Fill-Air® RF system, which consists of a compact, portable inflator and
self-sealing inflatable plastic bags, which is also available in a fully automated model, and our NewAir I.B.® 200 and high speed 600 packaging systems, which provide
on-site, on-demand Barrier Bubble® cushioning material;
- •
- PriorityPak® system, a high-speed product containment and protective packaging solution with
advanced sensor technology, used for mail-order and internet fulfillment applications;
- •
- systems that convert some of our packaging materials, such as air cellular cushioning materials, thin polyethylene foam
and paper, into sheets of a pre-selected size and quantity; and
- •
- FillTeck™ line of equipment and materials marketed by us for applications requiring on-site production of high performance, air-filled, quilted cushioning material.
Some of our more recent new product offerings in this segment are:
- •
- Cryovac® CT-301™ ultra thin high performance shrink film;
- •
- Instapak Complete™ foam-in-bag packaging system for the production of continuous foam
tubes;
- •
- Fill-Air® Cyclone™ inflatable packaging system, which produces high volume void fill
packaging materials from a compact footprint;
- •
- Rapid Fill® Automated Void Fill System, which offers automated void detection and inflation inside the carton;
- •
- PackTiger Hybrid™ paper packaging system, which offers selectable void-fill or cushioning
material;
- •
- FasFil™ packaging system, which creates void-fill pads from 100% recycled paper;
4
- •
- NewAir I.B.® Express inflatable cushioning system for Barrier Bubble® material;
and
- •
- Yesterday's News® padded mailers made with recycled paper fibers.
Other
We also focus on growth by utilizing our technologies in new market segments. This category includes specialty materials for non-packaging applications and medical products and applications. Additionally, this category focuses on new ventures, such as products made from renewable materials.
Specialty Materials
Our specialty materials operations seek to expand our product portfolio and core competencies into specialized and non-packaging applications and new market segments. We sell specialty materials products primarily to fabricators and manufacturers, encompassing a wide array of businesses and end uses.
Our specialty materials offerings include:
- •
- Cellu-Cushion®, Stratocell® and Ethafoam® family of foams, which are available in a
variety of densities and with a wide range of performance characteristics, including anti-static, acoustic, formable, moisture barrier, gas barrier, printable, shrinkable and adhesive
applications;
- •
- foams, films and composites for non-packaging markets, including transportation, construction, sports and
leisure, and personal care;
- •
- temperature controlled supply chain products, including our TurboTag® system, a temperature monitoring product
for pharmaceutical, biological and food industry customers; and
- •
- super-insulation products utilizing thermal insulation in the form of vacuum insulated panels that provide energy efficiency for specialized packaging, such as aerospace, pharmaceutical and biological applications, and non-packaging applications.
One of our newest products in this category is our Ethafoam® HRC (High Recycled Content) polyethylene foam, containing a minimum of 65% pre-consumer recycled content.
Medical Applications
The goal of our medical applications business is to provide solutions offering superior protection and reliability to the medical, pharmaceutical and medical device industries. We sell medical applications products directly to medical device manufacturers and pharmaceutical companies and to the contract packaging firms that supply them.
Our medical applications offerings include:
- •
- flexible films, tubing and connectors for use in the manufacture of bags and pouches for a wide variety of medical
applications including ostomy, I-V and solution drug therapies;
- •
- custom designed, rigid thermoformed packaging materials for medical devices and technical products;
and
- •
- equipment to seal thermoformed trays to lidding materials.
New Ventures
Our new ventures businesses include products sourced from renewable materials. Through our Biosphere venture, we offer an expanding line of renewable food and industrial packaging products, including Renew-a-Pak® biodegradable trays and pans for bakeries.
5
Foreign Operations
We operate through our subsidiaries in the United States and in the 50 other countries listed below, and our products are distributed in these countries as well as in other parts of the world.
| Americas | Europe, Middle East and Africa | Asia-Pacific | ||||
|---|---|---|---|---|---|---|
| Argentina | Belgium | Norway | Australia | |||
| Brazil | Czech Republic | Poland | China | |||
| Canada | Denmark | Portugal | India | |||
| Chile | Finland | Romania | Indonesia | |||
| Colombia | France | Russia | Japan | |||
| Costa Rica | Germany | South Africa | Malaysia | |||
| Ecuador | Greece | Spain | New Zealand | |||
| Guatemala | Hungary | Sweden | Philippines | |||
| Mexico | Ireland | Switzerland | Singapore | |||
| Peru | Israel | Turkey | South Korea | |||
| Uruguay | Italy | Ukraine | Taiwan | |||
| Venezuela | Luxembourg | United Kingdom | Thailand | |||
| Netherlands | Vietnam | |||||
In maintaining our foreign operations, we face risks inherent in these operations, such as currency fluctuations. Information on currency exchange risk appears in Part II, Item 7A of this Annual Report on Form 10-K, which information is incorporated herein by reference. Other risks attendant to our foreign operations are set forth in Part I, Item 1A, "Risk Factors," of this Annual Report on Form 10-K, which information is incorporated herein by reference. Financial information showing net sales and total long-lived assets by geographic region for each of the three years ended December 31, 2009 appears in Note 3, "Segments," of Notes to Consolidated Financial Statements in Part II, Item 8 of this Annual Report on Form 10-K, which information is incorporated herein by reference. We maintain programs to comply with the various laws, rules and regulations related to the protection of the environment that we may be subject to in the many countries in which we operate. See "Environmental Matters," below.
Employees
As of December 31, 2009, we had approximately 16,200 employees worldwide. Approximately 6,800 of these employees were in the U.S., with approximately 100 of these employees covered by collective bargaining agreements. Of the approximately 9,400 employees who were outside the U.S., approximately 6,200 were covered by collective bargaining agreements. Outside of the U.S., many of the covered employees are represented by works councils or industrial boards, as is customary in the jurisdictions in which they are employed. We believe that our employee relations are satisfactory.
Marketing, Distribution and Customers
At December 31, 2009, we employed approximately 2,600 sales, marketing and customer service personnel throughout the world who sell and market our products to and through a large number of distributors, fabricators, converters, e-commerce and mail order fulfillment firms, and contract packaging firms as well as directly to end-users such as food processors, food service businesses, supermarket retailers, pharmaceutical companies, medical device manufacturers and other manufacturers.
To support our food packaging, food solutions and new ventures customers, we operate two food science laboratories and three Packforum® innovation and learning centers across three regions that assist customers in identifying the appropriate packaging materials and systems to meet their needs. We also offer ideation services and customized graphic design services to our customers.
To assist our marketing efforts for our protective packaging products and to provide specialized customer services, we operate 33 package design and development laboratories worldwide within our facilities. These laboratories are staffed by professional packaging engineers and equipped with drop-testing and other equipment used to develop and test cost-effective package designs to meet the particular protective packaging requirements of each customer.
6
In support of many of our businesses, we operate five equipment design centers in four countries that focus on equipment and parts design and innovation. We also provide field technical services to our customers worldwide. These services include system installation, integration and monitoring systems, repair and upgrade, operator training in the efficient use of packaging systems, qualification of various consumable and system combinations, and packaging line layout and design.
We have no material long-term contracts for the distribution of our products. In 2009, no customer or affiliated group of customers accounted for 10% or more of our consolidated net sales.
Seasonality
We do not consider seasonality to be material to our consolidated net sales or to any reportable business segment net sales. Historically, net sales in our food businesses have tended to be slightly lower in the first quarter and slightly higher towards the end of the third quarter through the fourth quarter, due to holiday events. Our Protective Packaging segment has tended to also be slightly lower in the first quarter and higher during the "back-to-school" season in the mid-third quarter and through the fourth quarter due to the holiday shopping season.
Competition
Competition for most of our packaging products is based primarily on packaging performance characteristics, service and price. Since competition is also based upon innovations in packaging technology, we maintain ongoing research and development programs to enable us to maintain technological leadership. We invest approximately double the industry average on research and development as a percentage of net sales per year. There are also other companies producing competing products that are well established.
There are other manufacturers of food packaging and food solutions products, some of which are companies offering similar products that operate across regions and others that operate in a single region or single country. Competing manufacturers produce a wide variety of food packaging based on plastic, metals and other materials. We believe that we are one of the leading suppliers of (i) flexible food packaging materials and related systems in the principal geographic areas in which we offer those products, (ii) barrier trays for case-ready meat products in the principal geographic areas in which we offers those trays, and (iii) absorbent pads for food products to supermarkets and to meat and poultry processors in the United States.
Our protective packaging products compete with similar products made by other manufacturers and with a number of other packaging materials that customers use to provide protection against damage to their products during shipment and storage. Among the competitive materials are various forms of paper packaging products, expanded plastics, corrugated die cuts, strapping, envelopes, reinforced bags, boxes and other containers, and various corrugated materials, as well as various types of molded foam plastics, fabricated foam plastics, mechanical shock mounts, and wood blocking and bracing systems. We believe that we are one of the leading suppliers of air cellular cushioning materials containing a barrier layer, inflatable packaging, suspension and retention packaging, shrink films for industrial and commercial applications, protective mailers, polyethylene foam and polyurethane foam packaging systems in the principal geographic areas in which we sell these products.
Competition in specialty materials is focused on performance characteristics and price. Competition for most of our medical applications products is based primarily on performance characteristics, service and price. Technical design capability is an additional competitive factor for the rigid packaging offered by the medical applications business.
Raw Materials
The principal raw materials used in each of our reportable business segments are polyolefin and other petrochemical-based resins and films, and paper and wood pulp products. We also purchase corrugated materials, cores for rolls of products such as films and Bubble Wrap® brand cushioning, inks for printed materials, and blowing agents used in the expansion of foam packaging products. In addition, we offer a wide variety of specialized packaging equipment, some of which we manufacture or have manufactured to our specifications, some of which we assemble and some of which we purchase from other suppliers.
7
The raw materials for our products generally have been readily available on the open market and in most cases are available from several suppliers. However, we have some sole-source suppliers, and the lack of availability of supplies could have a material negative impact on our business. Natural disasters such as hurricanes, as well as political instability and terrorist activities, may negatively impact the production or delivery capabilities of refineries and natural gas and petrochemical suppliers in the future. These factors could lead to increased prices for our raw materials, curtailment of supplies and allocation of raw materials by our suppliers. We source some materials used in our packaging products from materials recycled in our manufacturing operations or obtained through participation in recycling programs.
Sourcing
We have a centralized supply chain organization, which includes centralized management of procurement and logistics. Our objective is to leverage our global scale to achieve sourcing efficiencies and reduce our total delivered cost across all our regions. We do this while adhering to strategic performance metrics and stringent sourcing practices.
Research and Development Activities
We maintain a continuing effort to develop new products and to improve our existing products and processes, including developing new packaging and non-packaging applications for our products. From time to time, we also acquire and commercialize new packaging and other products or techniques developed by others. Our research and development projects rely on our technical capabilities in the areas of food science, materials science, package design and equipment engineering. We spent $81.2 million in 2009, $85.6 million in 2008 and $90.8 million in 2007 on research and development.
Patents and Trademarks
We are the owner or licensee of an aggregate of over 3,000 United States and foreign patents and patent applications, as well as an aggregate of over 3,000 United States and foreign trademark registrations and trademark applications that relate to many of our products, manufacturing processes and equipment. We believe that our patents and trademarks collectively provide a competitive advantage. As such, each year we continue to file, in the aggregate an average of 200 United States and foreign patent applications and 250 United States and foreign trademark applications. None of our reportable segments is dependent upon any single patent or trademark alone. Rather, we believe that our success depends primarily on our sales and service, marketing, engineering and manufacturing skills and on our ongoing research and development efforts. We believe that the expiration or unenforceability of any of our patents, applications, licenses or trademark registrations would not be material to our business or consolidated financial position.
Environmental, Health and Safety Matters
As a manufacturer, we are subject to various laws, rules and regulations in the countries, jurisdictions and localities in which we operate covering the safe storage and use of raw materials and production chemicals and the release of materials into the environment, regarding standards for the treatment, storage and disposal of solid and hazardous wastes or otherwise relating to the protection of the environment. We review environmental, health and safety laws and regulations pertaining to our operations and believe that compliance with current environmental and workplace health and safety laws and regulations has not had a material effect on our capital expenditures or consolidated financial position.
In some jurisdictions in which our packaging products are sold or used, laws and regulations have been adopted or proposed that seek to regulate, among other things, recycled or reprocessed content and sale or disposal of packaging materials. In addition, customer demand continues to evolve for packaging materials that incorporate renewable materials or that are otherwise viewed as being "environmentally sound." Our new ventures activities, described above, emphasize the development of packaging products from renewable resources. We maintain programs designed to comply with these laws and regulations, to monitor their evolution, and to meet this customer demand. One advantage inherent in many of our products is that thin, lightweight packaging solutions reduce waste and transportation costs in comparison to available alternatives. We continue to evaluate and implement new technologies in this area as they become available.
We also support our customers' interests in eliminating waste by offering or participating in collection programs for some of our products or product packaging and for materials used in some of our products.
8
When possible, materials collected through these programs are reprocessed and either reused in our protective packaging operations or offered to other manufacturers for use in other products. In addition, gains that we have made in internal recycling programs have allowed us to improve our net raw material yield, thus mitigating the impact of resin costs, while lowering solid waste disposal costs and controlling waste disposal environmental liability risks.
Our emphasis on environmental, health and safety compliance provides us with risk reduction opportunities and cost savings through asset protection and protection of employees, for which we are recognized as leaders in our industry. Our website, www.sealedair.com/citizenship, contains additional detailed information about our corporate citizenship initiatives.
Available Information
Our Internet address is www.sealedair.com. We make available, free of charge, on or through our web site at www.sealedair.com, our Annual Report on Form 10-K, quarterly reports on Form 10-Q, current reports on Form 8-K, and amendments to those reports that we file or furnish pursuant to Section 13(a) or 15(d) of the Securities Exchange Act of 1934, or the Exchange Act, as soon as reasonably practicable after we electronically file these materials with, or furnish them to, the Securities and Exchange Commission, or the SEC.
Introduction
Investors should carefully consider the risks described below before making an investment decision. These are the most significant risk factors; however, they are not the only risk factors that you should consider in making an investment decision.
This Annual Report on Form 10-K also contains and may incorporate by reference from our Proxy Statement for our 2010 Annual Meeting of Stockholders, or from exhibits, forward-looking statements that involve risks and uncertainties. See the "Cautionary Notice Regarding Forward-Looking Statements" below. Our actual results could differ materially from those anticipated in these forward-looking statements as a result of many factors, including the risks that we face, which are described below and elsewhere in this Annual Report on Form 10-K or in documents incorporated by reference in this report.
Our business, consolidated financial position or results of operations could be materially adversely affected by any of these risks. The trading price of our securities could decline due to any of these risks, and investors in our securities may lose all or part of their investment.
Weakened global economic conditions have had and could continue to have an adverse effect on our consolidated financial position and results of operations.
Weakened global economic conditions have had and may continue to have an adverse impact on our business in the form of lower net sales due to weakened demand, unfavorable changes in product price/mix, or in lower profit margins.
During periods of economic recession, there can be a heightened competition for sales and increased pressure to reduce selling prices. If we lose significant sales volume or reduce selling prices significantly, then there could be a negative impact on our consolidated revenue, profitability and cash flows.
Also, reduced availability of credit may adversely affect the ability of some of our customers and suppliers to obtain funds for operations and capital expenditures. This could negatively impact our ability to obtain necessary supplies as well as our sales of materials and equipment to affected customers. This could result in reduced or delayed collections of outstanding accounts receivable.
The global nature of our operations in the United States and in 50 foreign countries exposes us to numerous risks that could materially adversely affect our consolidated financial position and results of operations.
We operate in the United States and in 50 other countries, and our products are distributed in those countries as well as in other parts of the world. A large portion of our manufacturing operations are located outside of the United States. Operations outside of the United States, particularly operations in developing regions, are subject to various risks that may not be present or as significant for our U.S. operations.
9
Economic uncertainty in some of the geographic regions in which we operate, including developing regions, could result in the disruption of commerce and negatively impact cash flows from our operations in those areas.
Risks inherent in our international operations include social plans that prohibit or increase the cost of certain restructuring actions; exchange controls; foreign currency exchange rate fluctuations including devaluations; the potential for changes in local economic conditions including local inflationary pressures; restrictive governmental actions such as those on transfer or repatriation of funds and trade protection matters, including antidumping duties, tariffs, embargoes and prohibitions or restrictions on acquisitions or joint ventures; changes in laws and regulations, including the laws and policies of the United States affecting trade and foreign investment; the difficulty of enforcing agreements and collecting receivables through certain foreign legal systems; variations in protection of intellectual property and other legal rights; more expansive legal rights of foreign unions or works councils; the potential for nationalization of enterprises or facilities; and unsettled political conditions and possible terrorist attacks against United States or other interests. In addition, there are potential tax inefficiencies in repatriating funds from our non-U.S. subsidiaries.
These and other factors may have a material adverse effect on our international operations and, consequently, on our consolidated financial position and results of operations.
If the settlement of the asbestos-related claims that we have agreed to (the "Settlement agreement") is not implemented, we will not be released from the various asbestos-related, fraudulent transfer, successor liability, and indemnification claims made against us arising from a 1998 transaction with W. R. Grace & Co. We are also a defendant in a number of asbestos-related actions in Canada arising from W. R. Grace & Co.'s activities in Canada prior to the 1998 transaction.
On November 27, 2002, we reached an agreement in principle with the Official Committee of Asbestos Personal Injury Claimants (the "ACC") and the Official Committee of Asbestos Property Damage Claimants appointed to represent asbestos claimants in the W. R. Grace & Co. ("Grace") bankruptcy case to resolve all current and future asbestos-related claims made against us and our affiliates. The Settlement agreement will also resolve the fraudulent transfer claims and successor liability claims, as well as indemnification claims by Fresenius Medical Care Holdings, Inc. and affiliated companies in connection with the Cryovac transaction. The Cryovac transaction was a multi-step transaction, completed on March 31, 1998, which brought the Cryovac packaging business and the former Sealed Air Corporation's business under the common ownership of the Company. The parties to the agreement in principle signed the definitive Settlement agreement as of November 10, 2003 consistent with the terms of the agreement in principle. On June 27, 2005, the U.S. Bankruptcy Court for the District of Delaware, where the Grace bankruptcy case is pending, signed an order approving the definitive Settlement agreement. Although Grace is not a party to the Settlement agreement, under the terms of the order, Grace is directed to comply with the Settlement agreement subject to limited exceptions. On September 19, 2008, Grace, the ACC, the Asbestos PI Future Claimants' Representative (the "FCR"), and the Official Committee of Equity Security Holders (the "Equity Committee") filed, as co-proponents, a plan of reorganization (as filed and amended from time to time, the "PI Settlement Plan") and several exhibits and associated documents, including a disclosure statement (as filed and amended from time to time, the "PI Settlement Disclosure Statement"), with the Bankruptcy Court. As filed, the PI Settlement Plan would provide for the establishment of two asbestos trusts under Section 524(g) of the United States Bankruptcy Code to which present and future asbestos-related claims would be channeled. The PI Settlement Plan also contemplates that the terms of our definitive Settlement agreement will be incorporated into the PI Settlement Plan and that we will pay the amount contemplated by that agreement.
If confirmed, the PI Settlement Plan may implement the terms of the Settlement agreement, but there can be no assurance that this will be the case. The terms of the PI Settlement Plan remain subject to amendment. Moreover, the PI Settlement Plan is subject to the satisfaction of a number of conditions, including the availability of exit financing and the approval of both the Bankruptcy Court and United States District Court for the District of Delaware (the "District Court"). A number of objections to the PI Settlement Plan have been filed and remain unresolved, and certain of these objections concern injunctions, releases and provisions as applied to us and/or that are contemplated by the Settlement agreement.
The Bankruptcy Court has conducted hearings to consider confirmation of the PI Settlement Plan and has heard closing arguments with respect to the PI Settlement Plan, but additional hearings may be held by
10
the Bankruptcy Court and the District Court to consider matters related to the PI Settlement Plan. We do not know whether or when a final plan of reorganization will become effective. Assuming that a final plan of reorganization (whether the PI Settlement Plan or another plan of reorganization) is confirmed by the Bankruptcy Court, approved by the District Court, and does become effective, we do not know whether the final plan of reorganization will be consistent with the terms of the Settlement agreement and if the other conditions to our obligation to pay the Settlement agreement amount will be met. If these conditions are not satisfied or not waived by us, we will not be obligated to pay the amount contemplated by the Settlement agreement. However, if we do not pay the Settlement agreement amount, we and our affiliates will not be released from the various claims against us.
If the Settlement agreement does not become effective, either because Grace fails to emerge from bankruptcy or because Grace does not emerge from bankruptcy with a plan of reorganization that is consistent with the terms of the Settlement agreement, then we and our affiliates will not be released from the various asbestos-related, fraudulent transfer, successor liability, and indemnification claims made against us and our affiliates noted above, and all of these claims would remain pending and would have to be resolved through other means, such as through agreement on alternative settlement terms or trials. In that case, we could face liabilities that are significantly different from our obligations under the Settlement agreement. We cannot estimate at this time what those differences or their magnitude may be. In the event these liabilities are materially larger than the current existing obligations, they could have a material adverse effect on our consolidated financial position and results of operations.
Since November 2004, the Company and specified subsidiaries have been named as defendants in a number of cases, including a number of putative class actions, brought in Canada as a result of Grace's alleged marketing, manufacturing or distributing of asbestos or asbestos-containing products in Canada prior to the Cryovac transaction in 1998. Grace has agreed to defend and indemnify us and our subsidiaries in these cases. The Canadian cases are currently stayed. A global settlement of these Canadian claims to be funded by Grace has been approved by the Canadian court, and the PI Settlement Plan provides for payment of these claims. We do not have any positive obligations under the Canadian settlement, but we are a beneficiary of the release of claims. The release in favor of the Grace parties (including us) will become operative upon the effective date of a plan of reorganization in Grace's United States Chapter 11 bankruptcy proceeding. As filed, the PI Settlement Plan contemplates that the claims released under the Canadian settlement will be subject to injunctions under Section 524(g) of the Bankruptcy Code. By its terms, the Canadian settlement will, unless amended, become null and void if a confirmation order in the Grace U.S. bankruptcy proceeding is not granted prior to December 31, 2010. We can give no assurance that the PI Settlement Plan (or any other plan of reorganization) will be confirmed by the Bankruptcy Court, approved by the District Court, or will become effective. Assuming that a final plan of reorganization (whether the PI Settlement Plan or another plan of reorganization) is confirmed by the Bankruptcy Court, approved by the District Court, and does become effective, if the final plan of reorganization does not incorporate the terms of the Canadian settlement or if the Canadian courts refuse to enforce the final plan of reorganization in the Canadian courts, and if in addition Grace is unwilling or unable to defend and indemnify us and our subsidiaries in these cases, then we could be required to pay substantial damages, which we cannot estimate at this time and which could have a material adverse effect on our consolidated financial position and results of operations.
For further information concerning these matters, see Note 16, "Commitments and Contingencies," of Notes to Consolidated Financial Statements under the caption "Cryovac Transaction Commitments and Contingencies."
A downgrade of our credit ratings could have a negative impact on our costs and ability to access credit markets.
Our long-term senior unsecured debt is currently rated BB+ (stable outlook) by Standard & Poor's Financial Services LLC. This rating is considered below investment grade. Our long-term senior unsecured debt is currently rated Baa3 (negative outlook) by Moody's Investor Service, Inc. This rating is considered investment grade. If our credit ratings are further downgraded, there could be a negative impact on our ability to access capital markets, and our borrowing costs could increase.
11
Raw material pricing, availability and allocation by suppliers as well as energy-related costs may negatively impact our results of operations, including our profit margins.
We use petrochemical-based raw materials to manufacture many of our products. Increases in market demand or fluctuations in the global trade for petrochemical-based raw materials and energy could increase our costs. We also have some sole-source suppliers, and the lack of availability of supplies could have a material adverse effect on our consolidated financial condition and results of operations.
Natural disasters such as hurricanes, as well as political instability and terrorist activities, may negatively impact the production or delivery capabilities of refineries and natural gas and petrochemical suppliers in the future. These factors could lead to increased prices for our raw materials, curtailment of supplies and allocation of raw materials by our suppliers, which could reduce revenues and profit margins and harm relations with our customers and which could have a material adverse effect on our consolidated financial condition and results of operations.
The effects of animal and food-related health issues such as bovine spongiform encephalopathy, also known as "mad cow" disease, foot-and-mouth disease and avian influenza or "bird-flu," as well as other health issues affecting the food industry, may lead to decreased revenues.
We manufacture and sell food packaging products, among other products. Various health issues affecting the food industry have in the past and may in the future have a negative effect on the sales of food packaging products. In recent years, occasional cases of mad cow disease have been confirmed and incidents of bird flu have surfaced in various countries. Outbreaks of animal diseases such as mad cow or foot-and-mouth disease, for example, may lead governments to restrict exports and imports of potentially affected animals and food products, leading to decreased demand for our products and possibly also to the culling or slaughter of significant numbers of the animal population otherwise intended for food supply. Also, consumers may change their eating habits as a result of perceived problems with certain types of food. These factors may lead to reduced sales of food packaging products, which could have a material adverse effect on our consolidated financial position and results of operations.
Concerns about greenhouse gas (GHG) emissions and climate change and the resulting governmental and market responses to these issues could increase costs that we incur and could otherwise affect our consolidated financial position and results of operations.
Numerous legislative and regulatory initiatives have been enacted and proposed in response to concerns about GHG emissions and climate change. We are a manufacturing entity that utilizes petrochemical-based raw materials to produce many of our products, including plastic packaging materials. Increased environmental legislation or regulation could result in higher costs for us in the form of higher raw materials and freight and energy costs. We could also incur additional compliance costs for monitoring and reporting emissions and for maintaining permits.
Disruption and volatility of the financial and credit markets could affect our external liquidity sources.
Our principal sources of liquidity are accumulated cash and cash equivalents, short-term investments, cash flow from operations and amounts available under our existing lines of credit, including our global credit facility, our European credit facility, and our accounts receivable securitization program, as described in Management's Discussion and Analysis of Financial Condition and Results of Operations, which is included in Part II, Item 7 of this Annual Report on Form 10-K. Our accounts receivable securitization program includes a bank financing commitment that must be renewed annually prior to the expiration date. The bank commitment is scheduled to expire on December 3, 2010. While the bank is not obligated to renew the bank financing commitment, we have negotiated annual renewals since the commencement of the program in 2001.
Additionally, recent conditions in financial markets, including the bankruptcy and restructuring of some financial institutions, could affect financial institutions with which we have relationships and could result in adverse effects on our ability to utilize fully our committed borrowing facilities. For example, a lender under our global credit facility or the European credit facility may be unwilling or unable to fund a borrowing request, and we may not be able to replace such lender.
12
Covenant restrictions under our credit arrangements may pose a risk.
We have a number of credit facilities, including our global credit facility and our European credit facility, and also have an accounts receivable securitization program, as well as debt securities we have issued to manage liquidity and fund operations as described in Management's Discussion and Analysis of Financial Condition and Results of Operations, which is included in Part II, Item 7 of this Annual Report on Form 10-K. The agreements relating to these facilities and securities generally contain certain restrictive covenants, including the incurrence of additional indebtedness, restriction of liens and sale and leaseback transactions, financial covenants relating to interest coverage, debt leverage and minimum liquidity, and restrictions on consolidation and merger transactions, as well as, in some cases, restrictions on amendments to the Settlement agreement. In addition, amounts available under our accounts receivable securitization program can be impacted by a number of factors, including but not limited to our credit ratings, accounts receivable balances, the creditworthiness of our customers and our receivables collection experience. As a result of the impact of some of these factors, the amount available to us under the program has decreased. Although we do not believe that any of these covenants or other restrictive provisions presently materially restricts our liquidity position, a breach of one or more of the covenants or an event that triggers other restrictive provisions could result in material adverse consequences that could negatively impact our business, consolidated results of operations and financial position. This in turn could result in a further decline in amounts available under the accounts receivable securitization program or termination of the program. Such adverse consequences may include the acceleration of amounts outstanding under certain of the facilities, triggering the obligation to redeem certain debt securities, termination of existing unused commitments by our lenders or the bank commitment related to our accounts receivable securitization program, refusal by lenders to extend further credit under one or more of the facilities or to enter into new facilities, or the lowering or modification of our credit ratings.
Strengthening of the U.S. dollar and other foreign currency exchange rate fluctuations could materially impact our consolidated financial position and results of operations.
During 2009, approximately 54% of our sales originated outside the United States. We translate sales and other results denominated in foreign currency into U.S. dollars for our consolidated financial statements. During periods of a strengthening U.S. dollar, our reported international sales and net earnings could be reduced because foreign currencies may translate into fewer U.S. dollars.
Also, while we often produce in the same geographic markets as our products are sold, expenses are relatively concentrated in the United States compared with sales, so that in a time of strengthening of the U.S. dollar, our profit margins could be reduced. While we use financial instruments to hedge certain foreign currency exposures, this does not insulate us completely from currency effects.
We may have to recognize foreign exchange gains and/or losses related to the recent currency devaluation in Venezuela and its designation as a highly inflationary economy under generally accepted accounting principles in the United States of America, or U.S. GAAP, effective January 1, 2010. See "Foreign Currency Exchange Rate Risk," of Item 7A, "Quantitative and Qualitative Disclosures About Market Risk," for further discussion.
We may use financial instruments from time to time to manage exposure to foreign exchange rate fluctuations, which use exposes us to counterparty credit risk for nonperformance. See Note 12, "Derivatives and Hedging Activities," of Notes to Consolidated Financial Statements for further discussion, which is contained in Part II, Item 8 of this Annual Report on Form 10-K.
The full realization of our deferred tax assets, including primarily those related to the Settlement agreement and the other than temporary impairment of our investments in auction rate securities, may be affected by a number of factors.
We have deferred tax assets related to the Settlement agreement, the other than temporary impairment of our investments in auction rate securities, other accruals not yet deductible for tax purposes, foreign net operating loss carry forwards and investment tax allowances, employee benefit items, and other items. We have established valuation allowances to reduce those deferred tax assets to an amount that is more likely than not to be realized. Our ability to utilize these deferred tax assets depends in part upon our future operating results. We expect to realize these assets over an extended period. Consequently, changes in tax laws could cause actual results to differ from projections.
13
Our largest deferred tax asset relates to our Settlement agreement, including accrued interest. The value of this asset may be affected by our tax situation at the time of the payment under the Settlement agreement as well as by the value of our common stock at that time. The deferred tax asset reflects the fair market value of 18 million shares of our common stock at a post-split price of $17.86 per share based on the price when the Settlement agreement was reached in 2002.
Our annual effective tax rate can materially change as a result of changes in our U.S. and foreign mix of earnings and other factors including changes in tax laws and changes by regulatory authorities.
Our overall effective tax rate is equal to our total tax expense as a percentage of total earnings before tax. However, tax expense and benefits are not recognized on a global basis but rather on a jurisdictional or legal entity basis. Changes in statutory tax rates and laws, as well as ongoing audits by domestic and international authorities, could affect the amount of income taxes and other taxes paid by us. For example, recent legislative proposals to change U.S. taxation of non-U.S. earnings or a failure to extend the U.S. research and experimentation credit could increase our effective tax rate. Also, changes in the mix of earnings between jurisdictions and assumptions used in the calculation of income taxes, among other factors, could have a significant effect on our overall effective tax rate.
We experience competition in our operating segments and in the geographic areas in which we operate.
Our products compete with similar products made by other manufacturers and with a number of other types of materials or products. We compete on the basis of performance characteristics of our products, as well as service, price and innovations in technology. A number of competing domestic and foreign companies are strong, well established companies. Our inability to maintain a competitive advantage could result in lower prices or lower sales volume, which would have a negative impact on our consolidated financial position and results of operations.
A slowing pipeline of new technologies and solutions at favorable margins could adversely affect our performance and prospects for future growth.
Our competitive advantage is due in part to our ability to develop and introduce new products in a timely manner at favorable margins. The development and introduction cycle of new products can be lengthy and involve high levels of investment. New products may not meet sales expectations or margin expectations due to many factors, including our inability to; accurately predict demand, end-user preferences and evolving industry standards; resolve technical and technological challenges in a timely and cost-effective manner; and achieve manufacturing efficiencies.
A major loss of or disruption in our manufacturing and distribution operations or our information systems and telecommunication resources could adversely affect our business.
If we experienced a natural disaster, such as a tornado, hurricane, earthquake or other severe weather event, or a casualty loss from an event such as a fire or flood, at one of our larger strategic facilities or if such event affected a key supplier, our supply chain, or our information systems and telecommunication resources, then there could be a material adverse effect on our consolidated results of operations.
The price of our common stock has on occasion experienced significant price and volume fluctuations. The sale of substantial amounts of our common stock could adversely affect the price of the common stock. One stockholder has beneficial ownership of approximately 37% of our common shares.
The market price of our common stock has experienced and may continue to experience significant price and volume fluctuations greater than those experienced by the broader stock market. In addition, our announcements of our quarterly operating results, future developments relating to the W. R. Grace & Co. bankruptcy, additional litigation against us, the effects of animal and food-related health issues, spikes in raw material and energy related costs, changes in general conditions in the economy or the financial markets and other developments affecting us, our customers, suppliers and competitors could cause the market price of our common stock to fluctuate substantially.
14
The sale or the availability for sale of a large number of shares of our common stock in the public market could adversely affect the price of the common stock. According to a Schedule 13G/A filed with the SEC on February 12, 2010, Davis Selected Advisers, L.P. reported beneficial ownership of 58,959,652 shares, or approximately 37%, of the outstanding shares of our common stock. As such, Davis Selected Advisers has a significant voting block with respect to matters submitted to a stockholder vote, including the election of directors and the approval of potential business combination transactions.
While the Schedule 13G/A filed by Davis Selected Advisers, L.P. indicates that the beneficially owned shares of our common stock were not acquired for the purpose of changing or influencing the control of the Company, if that stockholder were to change its purpose for holding our common stock from investment to attempting to change or influence our management, this concentration of our common stock could potentially affect the Company and the price of our common stock.
Weakness in the financial and credit markets and other factors could potentially lead to the impairment of the carrying amount of our goodwill and other long-lived assets and our investments in auction rate securities.
We have seven reporting units that are included in our segment reporting structure. The six reporting units with goodwill balances allocated to them are Food Packaging, Food Solutions, Protective Packaging, Shrink Packaging, Specialty Materials and Medical Applications.
We test goodwill for impairment on a reporting unit basis annually during the fourth quarter of each year and at other times if events or changes in circumstances exist that indicate the carrying value of goodwill may no longer be recoverable. Prior to our 2009 annual testing, we tested the goodwill of some of our reporting units at certain times earlier in the year, but no impairment charges were recorded.
In the fourth quarter of 2009, we completed step one of our annual impairment test and fair value analysis for goodwill, and there were no impairments present and no impairment charge was recorded. We had the estimated fair values updated for all of our reporting units, except for the New Ventures reporting unit because this reporting unit does not have any goodwill included in its net asset value.
Although we determined that there was no goodwill impairment in 2009, the future occurrence of a potential indicator of impairment, such as a decrease in our expected net earnings, adverse equity market conditions, a decline in current market multiples, a decline in our common stock price, a significant adverse change in legal factors or business climates, an adverse action or assessment by a regulator, unanticipated competition, strategic decisions made in response to economic or competitive conditions, or a more-likely-than-not expectation that a reporting unit or a significant portion of a reporting unit will be sold or disposed of, could require an interim assessment for some or all of the reporting units before the next required annual assessment. In the event of significant adverse changes of the nature described above, we might have to recognize a non-cash impairment of goodwill, which could have a material adverse effect on our consolidated financial position and results of operations.
We recorded a total of $38.0 million of pre-tax charges in 2009 and 2008 as a result of recognizing impairment related to other than temporary declines in the estimated fair market value of our auction rate securities investments. This impairment was due to the continuing decline in the creditworthiness of the issuers of these securities and the lack of a market for auction rate securities generally. The original cost of our auction rate securities investments was $44.7 million and the estimated remaining fair market value was $13.7 million at December 31, 2009 and $10.7 million at December 31, 2008. We continue to monitor developments in the market for auction rate securities including the specific securities in which we have invested. If liquidity conditions relating to these securities or the issuers worsen, we may recognize additional other than temporary impairments, which would result in the recognition of additional losses on our consolidated statement of operations.
Product liability claims or regulatory actions could adversely affect our financial results or harm our reputation or the value of our brands.
Claims for losses or injuries purportedly caused by some of our products arise in the ordinary course of our business. In addition to the risk of substantial monetary judgments, product liability claims or regulatory actions could result in negative publicity that could harm our reputation in the marketplace or adversely impact the value of our brands or our ability to sell our products in certain jurisdictions. We could also be required to recall possibly defective products, which could result in adverse publicity and significant expenses.
15
Although we maintain product liability insurance coverage, potential product liability claims could be excluded or exceed coverage limits under the terms of our insurance policies or could result in increased costs for such coverage.
Our subsidiaries hold substantially all of our assets and conduct substantially all of our operations, and as a result we rely on distributions or advances from our subsidiaries.
We conduct substantially all of our business through two direct wholly-owned subsidiaries, Cryovac, Inc. and Sealed Air Corporation (US). These two subsidiaries, directly and indirectly, own substantially all of the assets of our business and conduct operations themselves and through other subsidiaries around the globe. Therefore, we depend on distributions or advances from our subsidiaries to meet our debt service and other obligations and to pay dividends with respect to shares of our common stock. Contractual provisions, laws or regulations to which we or any of our subsidiaries may become subject, tax inefficiencies and the financial condition and operating requirements of subsidiaries may reduce funds available for service of our indebtedness, dividends, and general corporate purposes.
Cautionary Notice Regarding Forward-Looking Statements
The SEC encourages companies to disclose forward-looking statements so that investors can better understand a company's future prospects and make informed investment decisions. Some of our statements in this report, in documents incorporated by reference into this report and in our future oral and written statements, may be forward-looking. These statements reflect our beliefs and expectations as to future events and trends affecting our business, our consolidated financial position and our results of operations. These forward-looking statements are based upon our current expectations concerning future events and discuss, among other things, anticipated future financial performance and future business plans. Forward-looking statements are identified by such words and phrases as "anticipates," "believes," "could be," "estimates," "expects," "intends," "may," "plans to," "will" and similar expressions. Forward-looking statements are necessarily subject to risks and uncertainties, many of which are outside our control that could cause actual results to differ materially from these statements.
The following are important factors that we believe could cause actual results to differ materially from those in our forward-looking statements: the implementation of our Settlement agreement regarding the various asbestos-related, fraudulent transfer, successor liability, and indemnification claims made against it arising from a 1998 transaction with W. R. Grace & Co.; general economic conditions, particularly as they affect packaging use; credit ratings; raw material pricing and availability; changes in the value of foreign currencies against the U.S. dollar; the effects of animal and food-related health issues; pandemics; legal and environmental matters involving us; and the other risk factors set forth above. Except as required by the federal securities laws, we undertake no obligation to update or revise any forward-looking statement, whether as a result of new information, future events or otherwise.
Item 1B. Unresolved Staff Comments
None.
We manufacture products in 107 facilities, with 43 of those facilities serving more than one of our business segments and our Other category of products. The geographic dispersion of our manufacturing facilities is as follows:
Geographic Region
|
Number of Manufacturing Facilities |
|||
|---|---|---|---|---|
North America |
44 | |||
Europe, Middle East and Africa (EMEA) |
32 | |||
Latin America |
10 | |||
Asia Pacific |
21 | |||
Total |
107 | |||
16
Manufacturing Facilities by Reportable Segment and Other
Food Packaging: We produce Food Packaging products in 39 manufacturing facilities, of which 13 are in North America, 10 in the EMEA region, 7 in Latin America, and 9 in the Asia-Pacific region.
Food Solutions: We produce Food Solutions products in 38 manufacturing facilities, of which 13 are in North America, 12 in the EMEA region, 7 in Latin America, and 6 in the Asia Pacific region.
Protective Packaging: We produce Protective Packaging products in 72 manufacturing facilities, of which 30 are in North America, 22 in the EMEA region, 9 in Latin America, and 11 in the Asia-Pacific region.
Other Products: We produce Other products in 24 manufacturing facilities, of which 9 are in North America, 12 in the EMEA region, 1 in Latin America, and 2 in the Asia-Pacific region.
Other Property Information
We own the large majority of our manufacturing facilities. Some of these facilities are subject to secured or other financing arrangements. We lease the balance of our manufacturing facilities, which are generally smaller sites. Our manufacturing facilities are usually located in general purpose buildings that house our specialized machinery for the manufacture of one or more products. Because of the relatively low density of our air cellular, polyethylene foam and protective mailer products, we realize significant freight savings by locating our manufacturing facilities for these products near our customers and distributors.
We also occupy facilities containing sales, distribution, technical, warehouse or administrative functions at a number of locations in the United States and in many foreign countries. Some of these facilities are located on the manufacturing sites that we own and some on those that we lease. Stand-alone facilities of these types are generally leased. Our global headquarters are located in a leased property in Elmwood Park, New Jersey. For a list of those countries outside of the United States where we have operations, see "Foreign Operations" above. Our website, www.sealedair.com, contains additional information about our worldwide business.
We believe that our manufacturing, warehouse and office facilities are well maintained, suitable for their purposes and adequate for our needs.
The information set forth in Part II, Item 8 of this Annual Report on Form 10-K in Note 16, "Commitments and Contingencies," of Notes to Consolidated Financial Statements under the captions "Cryovac Transaction Commitments and Contingencies," "MPERS Lawsuit" and "Other Litigation and Claims" is incorporated herein by reference.
At December 31, 2009, we were a party to, or otherwise involved in, several federal, state and foreign environmental proceedings and private environmental claims for the cleanup of "Superfund" sites under the Comprehensive Environmental Response, Compensation, and Liability Act of 1980 and other sites. We may have potential liability for investigation and cleanup of some of these sites. It is our policy to accrue for environmental cleanup costs if it is probable that a liability has been incurred and if we can reasonably estimate an amount or range of costs associated with various alternative remediation strategies, without giving effect to any possible future insurance proceeds. As assessments and cleanups proceed, we review these liabilities periodically and adjust our reserves as additional information becomes available. At December 31, 2009, environmental related reserves were not material to our consolidated financial position or results of operations. While it is often difficult to estimate potential liabilities and the future impact of environmental matters, based upon the information currently available to us and our experience in dealing with these matters, we believe that our potential future liability with respect to these sites is not material to our consolidated financial position and results of operations.
We are also involved in various other legal actions incidental to our business. We believe, after consulting with counsel, that the disposition of these other legal proceedings and matters will not have a material effect on our consolidated financial position and results of operations.
17
Executive Officers of the Registrant
The information appearing in the table below sets forth the current position or positions held by each of our executive officers, the officer's age as of January 31, 2010, the year in which the officer was first elected to the position currently held with us or with the former Sealed Air Corporation, now known as Sealed Air Corporation (US) and a wholly-owned subsidiary of the Company, and the year in which such person was first elected an officer (as indicated in the footnote to the table).
All of our officers serve at the pleasure of the Board of Directors. We have employed all officers for more than five years except for Ms. Davis, who was first elected an officer effective August 10, 2006, and Dr. Savoca, who was first elected an officer effective July 23, 2008.
Prior to joining us in August 2006, Ms. Davis was Vice President, People/Development, at the Sun Chemical Company, a global inks and pigment company, where she was a Corporate Leadership Team Member and provided Human Resources functional leadership, from July 2002 until October 2005.
Before joining us in July 2008, Dr. Savoca was Vice President, Technology, of the Specialty Polymers Group of Akzo Nobel, a manufacturer of paints, coatings and specialty chemicals from January 2008 through May 2008, and prior to that was Vice President, Technology, of National Starch and Chemical Company, a manufacturer of specialty chemicals and starches for use in industrial and commercial applications from January 2003 through December 2007. In January 2008, Akzo Nobel acquired National Starch and Chemical Company.
There are no family relationships among any of our officers or directors.
18
Name and Current Position
|
Age as of January 31, 2010 |
First Elected to Current Position* |
First Elected An Officer* |
|||||||
|---|---|---|---|---|---|---|---|---|---|---|
William V. Hickey |
65 | 2000 | 1980 | |||||||
President, Chief Executive Officer and Director |
||||||||||
David H. Kelsey |
58 |
2003 |
2002 |
|||||||
Senior Vice President and Chief Financial Officer |
||||||||||
Jonathan B. Baker |
56 |
1994 |
1994 |
|||||||
Vice President |
||||||||||
Mary A. Coventry |
56 |
1994 |
1994 |
|||||||
Vice President |
||||||||||
Cheryl Fells Davis |
57 |
2006 |
2006 |
|||||||
Vice President |
||||||||||
Karl R. Deily |
52 |
2006 |
2006 |
|||||||
Vice President |
||||||||||
Jean-Marie Deméautis |
59 |
2006 |
2006 |
|||||||
Vice President |
||||||||||
J. Ryan Flanagan |
46 |
2009 |
2009 |
|||||||
Vice President |
||||||||||
Warren J. Kudman |
47 |
2009 |
2009 |
|||||||
Vice President |
||||||||||
James P. Mix |
58 |
1994 |
1994 |
|||||||
Vice President |
||||||||||
Manuel Mondragón |
60 |
1999 |
1999 |
|||||||
Vice President |
||||||||||
Ruth Roper |
55 |
2004 |
2004 |
|||||||
Vice President |
||||||||||
Hugh L. Sargant |
61 |
1999 |
1999 |
|||||||
Vice President |
||||||||||
Ann C. Savoca |
51 |
2008 |
2008 |
|||||||
Vice President |
||||||||||
H. Katherine White |
64 |
2003 |
1996 |
|||||||
Vice President, General Counsel and Secretary |
||||||||||
Christopher C. Woodbridge |
58 |
2005 |
2005 |
|||||||
Vice President |
||||||||||
Tod S. Christie |
51 |
1999 |
1999 |
|||||||
Treasurer |
||||||||||
Jeffrey S. Warren |
56 |
1996 |
1996 |
|||||||
Controller |
||||||||||
- *
- All persons listed in the table who were first elected officers before 1998 were executive officers of the former Sealed Air Corporation, now known as Sealed Air Corporation (US), prior to the Cryovac transaction in March 1998. Mr. Hickey was first elected President in 1996, first elected Chief Executive Officer in 2000 and first elected a director in 1999. Mr. Kelsey was first elected Senior Vice President in 2003 and first elected Chief Financial Officer in 2002. Ms. White was first elected Vice President in 2003, first elected General Counsel in 1998, and first elected Secretary in 1996.
19
Item 5. Market for Registrant's Common Equity, Related Stockholder Matters and Issuer Purchases of Equity Securities
Market Information
Our common stock is listed on the New York Stock Exchange under the trading symbol SEE. The table below shows the quarterly high and low closing sales prices of the common stock for 2009 and 2008.
2009
|
High | Low | |||||
|---|---|---|---|---|---|---|---|
First Quarter |
$ | 15.70 | $ | 10.43 | |||
Second Quarter |
21.24 | 14.12 | |||||
Third Quarter |
21.62 | 17.93 | |||||
Fourth Quarter |
22.65 | 18.78 | |||||
2008
|
High | Low | |||||
|---|---|---|---|---|---|---|---|
First Quarter |
$ | 26.41 | $ | 20.33 | |||
Second Quarter |
28.18 | 19.01 | |||||
Third Quarter |
25.01 | 18.27 | |||||
Fourth Quarter |
22.50 | 12.61 | |||||
As of January 31, 2010, there were approximately 6,950 holders of record of our common stock.
Dividends
Currently there are no restrictions that materially limit our ability to pay dividends or that we reasonably believe are likely to materially limit the future payment of dividends on our common stock.
On January 30, 2006, we announced that we were initiating the payment of quarterly cash dividends. We used cash of $49 million during 2006 to pay quarterly cash dividends of $0.15 per common share.
In February 2007, our Board of Directors declared a two-for-one stock split of our common stock that was effected in the form of a stock dividend. The stock dividend was paid on March 16, 2007 at the rate of one additional share of our common stock for each share of our common stock issued and outstanding to stockholders of record at the close of business on March 2, 2007. In addition, nine million additional shares of our common stock were reserved for the Settlement agreement.
Also in February 2007, our Board of Directors increased our quarterly cash dividend by 33% to $0.20 per common share, declaring a quarterly cash dividend payable on pre-split shares of our common stock on March 16, 2007 to stockholders of record at the close of business on March 2, 2007. During 2007, we declared and paid quarterly cash dividends on post-split shares of our common stock of $0.10 per share. We used cash of $65 million to pay quarterly dividends in 2007.
During 2008, our Board of Directors increased our quarterly cash dividend by 20.0% to $0.12 per common share and declared quarterly cash dividends on our common stock. We used cash of $76 million to pay quarterly dividends in 2008. During 2009, we paid quarterly cash dividends of $0.12 per common share using $76 million of available cash.
On February 18, 2010, our Board of Directors declared a quarterly cash dividend of $0.12 per common share payable on March 19, 2010 to stockholders of record at the close of business on March 5, 2010. The estimated amount of this dividend payment is expected to be $19 million based on 159 million shares of our common stock issued and outstanding as of January 31, 2010.
The dividend payments discussed above are recorded as reductions to retained earnings on our consolidated balance sheets. From time to time, we may consider other means of returning value to our stockholders based on our consolidated financial position and results of operations. There is no guarantee that our Board of Directors will declare any further dividends.
20
Common Stock Performance Comparisons
The following graph shows, for the five years ended December 31, 2009, the cumulative total return on an investment of $100 assumed to have been made on December 31, 2004 in our common stock. The graph compares this return ("SEE") with that of comparable investments assumed to have been made on the same date in: (a) the Standard & Poor's 500 Stock Index ("Composite S&P 500") and (b) a self-constructed peer group ("Peer Group").
The Peer Group includes us and the following other companies: Aptar Group Inc., Avery Dennison Corporation, Ball Corporation, Bemis Company, Inc., Crown Holdings, Inc., MeadWestvaco Corporation, Pactiv Corporation, Rexam PLC, Silgan Holdings Inc., Sonoco Products Co., and Spartech Corporation. The Peer Group represents public companies in packaging and related industries that are comparable to us based on sales, total assets, numbers of employees and market capitalization. The Organization and Compensation Committee of our Board of Directors has used the same Peer Group to benchmark executive compensation since early 2007.
Total return for each assumed investment assumes the reinvestment of all dividends on December 31 of the year in which the dividends were paid.
5-Year Compound Annual Total Return
SEE: (-2.3%)
Composite S&P 500: (+0.4%)
Peer Group: (+1.2%)
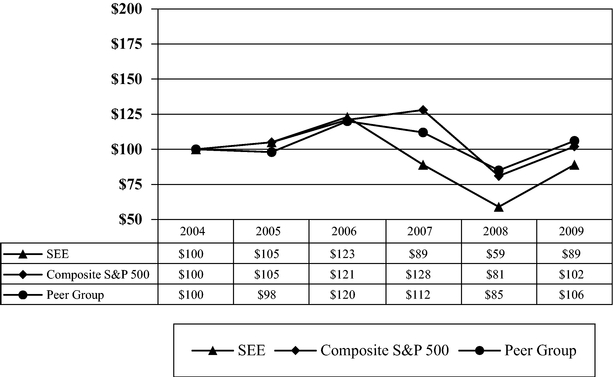
21
Issuer Purchases of Equity Securities
During the quarter ended December 31, 2009, we did not repurchase any shares of our common stock, par value $0.10 per share. The maximum number of shares that may yet be purchased under our plans or programs is set forth below.
Period
|
Total Number of Shares Purchased(1) (a) |
Average Price Paid per Share(1) (b) |
Total Number of Shares Purchased as Part of Publicly Announced Plans or Programs(1) (c) |
Maximum Number of Shares that May Yet Be Purchased Under the Plans or Programs(2) (d) |
|||||||||
|---|---|---|---|---|---|---|---|---|---|---|---|---|---|
Balance as of September 30, 2009 |
15,975,600 | ||||||||||||
October 1, 2009 through October 31, 2009 |
— | — | — | 15,975,600 | |||||||||
November 1, 2009 through November 30, 2009 |
— | — | — | 15,975,600 | |||||||||
December 1, 2009 through December 31, 2009 |
— | — | — | 15,975,600 | |||||||||
Total |
— | — | — | 15,975,600 | |||||||||
- (1)
- We
did not purchase any shares during the quarter ended December 31, 2009 pursuant to our publicly announced program (described below and under the
caption "Repurchases of Capital Stock," in "Management's Discussion and Analysis of Financial Condition and Results of Operations" in Part II, Item 7 of this Annual Report on
Form 10-K).
- (2)
- On August 9, 2007, we announced that our Board of Directors had approved a share repurchase program, authorizing us to repurchase in the aggregate up to 20 million shares of our issued and outstanding common stock. This program replaced our prior share repurchase program, which we have terminated. Through December 31, 2009, we repurchased 4,024,400 shares of our common stock under the current program, leaving 15,975,600 shares of common stock authorized for repurchase under the program. The program has no set expiration date.
22
Item 6. Selected Financial Data
| |
Year Ended December 31, | |||||||||||||||||
|---|---|---|---|---|---|---|---|---|---|---|---|---|---|---|---|---|---|---|
| |
2009 | 2008 | 2007 | 2006 | 2005 | |||||||||||||
| |
(In millions, except per common share data) |
|||||||||||||||||
Consolidated Statements of Operations Data(1): |
||||||||||||||||||
Net sales |
$ | 4,242.8 | $ | 4,843.5 | $ | 4,651.2 | $ | 4,327.9 | $ | 4,085.1 | ||||||||
Gross profit |
1,218.5 | 1,236.6 | 1,301.1 | 1,240.1 | 1,158.0 | |||||||||||||
Operating profit |
492.3 | 396.5 | 549.3 | 526.1 | 510.4 | |||||||||||||
Earnings before income tax provision |
329.9 | 222.3 | 456.0 | 400.1 | 376.6 | |||||||||||||
Net earnings |
244.3 | 179.9 | 353.0 | 274.1 | 255.8 | |||||||||||||
Basic and diluted net earnings per common share(2): |
||||||||||||||||||
Basic |
$ | 1.54 | $ | 1.13 | $ | 2.19 | $ | 1.69 | $ | 1.56 | ||||||||
Diluted |
$ | 1.35 | $ | 0.99 | $ | 1.88 | $ | 1.46 | $ | 1.35 | ||||||||
Common stock dividends paid(3) |
$ |
76.2 |
$ |
76.4 |
$ |
64.6 |
$ |
48.6 |
$ |
— |
||||||||
Consolidated Balance Sheets Data: |
||||||||||||||||||
Cash and cash equivalents |
$ | 694.5 | $ | 128.9 | $ | 430.3 | $ | 373.1 | $ | 455.8 | ||||||||
Goodwill |
1,948.7 | 1,938.1 | 1,969.7 | 1,957.1 | 1,908.8 | |||||||||||||
Total assets |
5,420.1 | 4,986.0 | 5,438.3 | 5,020.9 | 4,864.2 | |||||||||||||
Settlement agreement and related accrued interest |
746.8 | 707.8 | 670.9 | 636.0 | 602.8 | |||||||||||||
Long-term debt, less current portion(4) |
1,626.3 | 1,289.9 | 1,531.6 | 1,826.6 | 1,813.0 | |||||||||||||
Total stockholders' equity |
2,200.3 | 1,925.6 | 2,025.5 | 1,660.7 | 1,392.1 | |||||||||||||
Working capital |
639.6 | 50.5 | 194.5 | 350.6 | 161.9 | |||||||||||||
Consolidated Cash Flows Data: |
||||||||||||||||||
Net cash provided by operating activities |
$ | 552.0 | $ | 404.4 | $ | 378.1 | $ | 432.9 | $ | 363.3 | ||||||||
Net cash used in investing activities |
(70.3 | ) | (176.7 | ) | (274.1 | ) | (202.5 | ) | (88.9 | ) | ||||||||
Net cash provided by (used in) financing activities |
90.3 | (562.9 | ) | (59.5 | ) | (350.0 | ) | (118.4 | ) | |||||||||
Other Financial Data: |
||||||||||||||||||
Depreciation and amortization(5) |
$ | 154.5 | $ | 155.0 | $ | 150.4 | $ | 154.1 | $ | 162.6 | ||||||||
Share-based compensation(5) |
38.8 | 16.5 | 15.9 | 13.9 | 12.0 | |||||||||||||
Capital expenditures |
80.3 | 180.7 | 210.8 | 167.9 | 96.9 | |||||||||||||
- (1)
- See
Item 7, Management's Discussion and Analysis of Financial Condition and Results of Operations, for a discussion of the factors that contributed
to our consolidated operating results for the three years ended December 31, 2009.
- (2)
- In
February 2007, our Board of Directors declared a two-for-one stock split effected in the form of a stock dividend. All per share
data has been restated to reflect the two-for-one stock split. See Note 18, "Net Earnings Per Common Share," of Notes to Consolidated Financial Statements, for the
calculation of basic and diluted net earnings per common share and information on our adoption of the two-class method of calculating basic and diluted net earnings per common share
effective January 1, 2009. All calculations have been adjusted to reflect this adoption, and this change did not have a material impact.
- (3)
- In
January 2006, we initiated the payment of quarterly cash dividends. See the discussion of dividends above and Note 17, "Stockholders' Equity," of
Notes to Consolidated Financial Statements, for further discussion of our dividend activity.
- (4)
- See
Note 11, "Debt and Credit Facilities," for a discussion of our outstanding debt and available lines of credit.
- (5)
- The depreciation and amortization amounts for 2005 through 2008 have been adjusted to exclude share-based compensation expense to conform to the 2009 presentation. Depreciation and amortization expense and share-based compensation expense are included in marketing, administrative and development expenses on our consolidated statements of operations for all periods.
23
Item 7. Management's Discussion and Analysis of Financial Condition and Results of Operations
The information in Management's Discussion and Analysis of Financial Condition and Results of Operations should be read together with our consolidated financial statements and related notes set forth in Part II, Item 8, as well as the discussion included in Part I, Item 1A, "Risk Factors," of this Annual Report on Form 10-K. All amounts and percentages are approximate due to rounding.
Non-U.S. GAAP Information
In Management's Discussion and Analysis of Financial Condition and Results of Operations, we present financial information in accordance with U.S. GAAP, but we also present financial measures that do not conform to U.S. GAAP, or non-U.S. GAAP. As discussed below, we provide this supplemental information as our management believes it is useful to investors. Investors should use caution, however, when reviewing our non-U.S. GAAP presentations. The non-U.S. GAAP information is not a substitute for U.S. GAAP information. It does not purport to represent the similarly titled U.S. GAAP information, should not be considered as a substitute for the U.S. GAAP information and is not an indicator of our performance under U.S. GAAP. Further, non-U.S. GAAP financial measures that we present may not be comparable with similarly titled measures used by others.
In our "2010 Outlook" below, we present anticipated full year 2010 diluted net earning per common share on a U.S. GAAP basis, but also on a non-U.S. GAAP adjusted basis—excluding an estimated $0.02 charge related to GMS. We believe that excluding the anticipated GMS charge from our projected earnings aids in the comparison of our earnings performance between 2010 and prior years. Our management will look at our earnings performance both including the GMS charge and excluding it. Further, we may use adjusted earnings per share results to determine incentive compensation. Thus, our management believes that this information may be useful to investors.
In our "Highlights of Financial Performance" and in our "Net Sales by Segment Reporting Structure" below, we first present our results in accordance with U.S. GAAP, but in the discussions that follow, we exclude the impact of foreign currency translation when presenting net sales information. Changes in net sales excluding the impact of foreign currency translation is a non-U.S. GAAP financial measure, which we define as "constant dollar." Similarly, in "Changes in Working Capital" below, we exclude the impact of foreign currency translation on changes in inventories. As a worldwide business, it is important that we take into account the effects of foreign currency translation when we view our results and plan our strategies. Nonetheless, we cannot directly control changes in foreign currency exchange rates. Consequently, when management looks at our net sales to measure the performance of our business, it typically excludes the impact of foreign currency translation. We also may exclude the impact of foreign currency translation when making incentive compensation determinations. As a result, management believes that these presentations may be useful to investors.
Overview
Beginning with the invention of Bubble Wrap® fifty years ago, we have become a leading global innovator and manufacturer of a wide range of packaging and performance-based materials and equipment systems that now serve an array of food, industrial, medical and consumer applications.
At December 31, 2009, we employed approximately 2,600 sales, marketing and customer service personnel throughout the world who sell and market our products through a large number of distributors, fabricators and converters, as well as directly to end-users such as food processors, food service businesses, supermarket retailers and manufacturers. We have no material long-term contracts for the distribution of our products. In 2009, no customer or affiliated group of customers accounted for 10% or more of our consolidated net sales.
We do not consider seasonality to be material to our consolidated net sales or to any reportable business segment net sales. Historically, net sales in our food businesses have tended to be slightly lower in the first quarter and slightly higher towards the end of the third quarter through the fourth quarter, due to holiday events. Our Protective Packaging segment has tended to also be slightly lower in the first quarter and higher during the "back-to-school" season in the mid-third quarter and through the fourth quarter due to the holiday shopping season.
24
Competition for most of our packaging products is based primarily on packaging performance characteristics, service and price. Competition is also based upon innovations in packaging technology and, as a result, we maintain ongoing research and development programs to enable us to maintain technological leadership. For more details on our competition, see "Competition" included in "Business," of Item 1, of Part I.
Our net sales are sensitive to developments in our customers' business or market conditions, changes in the global economy, and the effects of foreign currency translation. Our costs can vary with changes in input costs, including petrochemical-related costs, which are not within our control. Consequently, our management focuses on reducing those costs that we can control and using petrochemical-based raw materials as efficiently as possible. We also believe that our global presence helps to insulate us from localized changes in business conditions.
Our businesses are managed to generate substantial operating cash flow. We believe that our operating cash flow will permit us to continue to spend on innovative research and development and to invest in our business by means of capital expenditures for property and equipment and acquisitions. Moreover, our ability to generate substantial operating cash flow should provide us with the flexibility to modify our capital structure as the need or opportunity arises.
2010 Outlook
Although a fair amount of uncertainty remains about the pace and timing of economic recovery, we are anticipating a modest recovery in global economic conditions in 2010. We are assuming that the pace and timing of the recovery will be led by developing regions, with more advanced economies experiencing a slower, more modest rate of recovery. As a result, we are anticipating a 4% to 6% growth in our net sales from a combination of unit volume growth and product price/mix.
We also are assuming that we may experience increased raw material costs for North American commodity resins, and we expect to take pricing actions as appropriate to lessen the impact of cost increases. We anticipate marketing, administrative and development expenses to be in the range of 16% to 17% of net sales and a full year 2010 effective tax rate of 27%.
As a result, we anticipate full year 2010 diluted net earnings per common share to be in the range of $1.48 to $1.68, or $1.50 to $1.70 on an adjusted basis to exclude an estimated $0.02 charge related to the remaining portion of our Global Manufacturing Strategy, or GMS.
Significant 2009 Events
GMS
In 2009, we completed the construction phase of GMS with the launch of our manufacturing facility in Duchnice, Poland. This facility along with our other new facilities in Qingpu, China and Monterrey, Mexico substantially finishes the construction and launch of all three greenfield sites related to this program.
In November 2009, we committed to relocating our bagmaking and printing operations presently in Norderstedt, Germany by June 30, 2010 to other existing facilities in Europe. We estimate that we will incur total costs of approximately $7 million, including $5 million recorded in 2009, in connection with this project, which would be future cash expenditures, primarily for costs for one time termination benefits. See "Global Manufacturing Strategy and 2008 Cost Reduction and Productivity Program" below for additional details of GMS.
Financing Activities
In 2009, we completed the following financing activities:
- •
- retirement of the remaining outstanding balance of $136.7 million of our 6.95% Senior Notes;
- •
- redemption of the entire $431.3 million of our 3% Convertible Senior Notes due 2033 in July 2009;
- •
- issuance of $300 million of 12% Senior Notes due February 2014;
- •
- issuance of $400 million of 7.875% Senior Notes due June 2017;
25
- •
- execution of a 150 million Euro senior unsecured revolving credit facility due July 2012, known as our European
credit facility; and
- •
- cancellation of our 170 million Australian dollar revolving credit facility that was due to expire in March 2010.
Further information on these financing activities and on our total debt and available credit is included in Note 11, "Debt and Credit Facilities," of Notes to Consolidated Financial Statements. Also, see "Principal Sources of Liquidity" below for a discussion of our current liquidity position.
Quarterly Cash Dividends
On February 18, 2010, our Board of Directors declared a quarterly cash dividend of $0.12 per common share, which is payable on March 19, 2010 to stockholders of record at the close of business on March 5, 2010. The estimated amount of this dividend payment is $19 million based on 159 million shares of our common stock issued and outstanding as of January 31, 2010.
During 2009 and 2008, we declared and paid quarterly cash dividends of $0.12 per common share in each quarter, using a total of $152 million from available cash.
Highlights of Financial Performance
Highlights of our financial performance for 2009 compared with 2008 and 2007 were:
| |
2009 | 2008 | 2007 | 2009 vs. 2008 % Change |
2008 vs. 2007 % Change |
||||||||||||
|---|---|---|---|---|---|---|---|---|---|---|---|---|---|---|---|---|---|
Net sales: |
|||||||||||||||||
U.S. |
$ | 1,969.1 | $ | 2,185.2 | $ | 2,118.2 | (10 | )% | 3 | % | |||||||
% of total net sales |
46.4 | % | 45.1 | % | 45.5 | % | |||||||||||
International |
2,273.7 | 2,658.3 | 2,533.0 | (15 | ) | 5 | |||||||||||
% of total net sales |
53.6 | % | 54.9 | % | 54.5 | % | |||||||||||
Total net sales |
$ | 4,242.8 | $ | 4,843.5 | $ | 4,651.2 | (12 | )% | 4 | % | |||||||
Gross profit |
$ | 1,218.5 | $ | 1,236.6 | $ | 1,301.1 | (1 | )% | (5 | )% | |||||||
% of total net sales |
28.7 | % | 25.5 | % | 28.0 | % | |||||||||||
Marketing, administrative and development expenses |
$ | 719.2 | $ | 755.0 | $ | 750.2 | (5 | )% | 1 | % | |||||||
% of total net sales |
17.0 | % | 15.6 | % | 16.1 | % | |||||||||||
Restructuring and other charges |
$ | 7.0 | $ | 85.1 | $ | 1.6 | (92 | ) | # | ||||||||
Operating profit |
$ | 492.3 | $ | 396.5 | $ | 549.3 | 24 | % | (28 | )% | |||||||
% of total net sales |
11.6 | % | 8.2 | % | 11.8 | % | |||||||||||
Net earnings |
$ | 244.3 | $ | 179.9 | $ | 353.0 | 36 | % | (49 | )% | |||||||
Net earnings per common share: |
|||||||||||||||||
Basic |
$ | 1.54 | $ | 1.13 | $ | 2.19 | 36 | % | (48 | )% | |||||||
Diluted. |
$ | 1.35 | $ | 0.99 | $ | 1.88 | 36 | % | (47 | )% | |||||||
- #
- Denotes a change equal to or greater than 100%
Our net earnings increased 36% in 2009 compared with 2008 despite a 12% decline in net sales. The primary contributing factors to our net earnings growth were lower input costs and restructuring charges, the incremental benefits generated from our 2008 cost reduction and productivity program and other cost reduction initiatives and incremental benefits from GMS. During the year we experienced lower unit volume results and relatively flat product price/mix.
Our consolidated unit volume results for 2009, detailed below, were lower than comparable periods primarily reflecting weak global economic conditions. Our Protective Packaging segment and our Specialty Materials business, which combined represent approximately 32% of our consolidated net sales in the period, were the most impacted by the recession. These lower unit volumes were judged by management to be
26
consistent with our peers in each segment and with economic indicators of customer demand in each segment and geographic region. We continue to believe that the unit volume declines experienced in these businesses do not represent a shift in our competitiveness or in the quality of our products and solutions.
Comparing the fourth quarter of 2009 with the third quarter of 2009, or sequentially, the Protective Packaging segment and Specialty Materials business experienced a combined 6% reported increase in net sales to $366 million from $346 million. Excluding a 2% favorable impact of foreign currency translation, these businesses recorded a 4% increase in net sales. This increase reflected a combination of a seasonal lift from the holiday shopping season, modest customer inventory restocking and, to a lesser extent, new product placements. Sequentially, our Food Packaging and Food Solutions segments experienced a combined 7% reported increase in net sales to $740 million from $693 million. Excluding a 3% favorable impact of foreign currency translation, these segments recorded a 4% increase in net sales, which primarily reflected a seasonal lift in demand due to the holiday period.
See the discussion below for further details about the material factors that contributed to the changes in net sales by our segment reporting structure and by geographic region and operating profit.
Net Sales by Segment Reporting Structure
The following table presents net sales by our segment reporting structure:
| |
2009 | 2008 | 2007 | 2009 vs. 2008 % Change |
2008 vs. 2007 % Change |
||||||||||||
|---|---|---|---|---|---|---|---|---|---|---|---|---|---|---|---|---|---|
Net sales: |
|||||||||||||||||
Food Packaging |
$ | 1,839.8 | $ | 1,969.4 | $ | 1,882.9 | (7 | )% | 5 | % | |||||||
As a % of total net sales |
43.4 | % | 40.6 | % | 40.5 | % | |||||||||||
Food Solutions |
891.7 | 988.3 | 944.7 | (10 | ) | 5 | |||||||||||
As a % of total net sales |
21.0 | % | 20.4 | % | 20.3 | % | |||||||||||
Protective Packaging |
1,192.9 | 1,480.3 | 1,506.9 | (19 | ) | (2 | ) | ||||||||||
As a % of total net sales |
28.1 | % | 30.6 | % | 32.4 | % | |||||||||||
Other |
318.4 | 405.5 | 316.7 | (21 | ) | 28 | |||||||||||
As a % of total net sales |
7.5 | % | 8.4 | % | 6.8 | % | |||||||||||
Total |
$ | 4,242.8 | $ | 4,843.5 | $ | 4,651.2 | (12 | )% | 4 | % | |||||||
Foreign Currency Translation Impact on Net Sales
For the first nine months of 2009, the U.S. dollar remained strong relative to most foreign currencies. This resulted in an unfavorable foreign currency translation impact on net sales of $242 million in 2009 compared with 2008. This impact includes a favorable foreign currency translation impact of $49 million in the fourth quarter of 2009 as most foreign currencies began to strengthen against the U.S. dollar. Due in part to concerns about the ability of some countries in the Euro-zone to effectively manage sovereign debt obligations and rising budget deficits, the Euro has weakened against the U.S. dollar during the first quarter of 2010.
In 2008, we experienced a strengthening of most foreign currencies against the U.S. dollar, which resulted in a favorable foreign currency translation impact on net sales of $110 million in 2008 compared with 2007. This impact includes an unfavorable foreign currency translation impact of $66 million in the fourth quarter of 2008 due to the strengthening of the U.S. dollar against most foreign currencies, which continued through the first nine months of 2009.
The following tables present the components of change in net sales for the year ended 2009 compared with 2008 and the year ended 2008 compared with 2007. We also present the change in net sales excluding
27
the impact of foreign currency translation, a non-U.S. GAAP measure, which we define as "constant dollar." We believe using constant dollar comparisons aids in the comparability with other periods.
2009 compared with 2008
|
Food Packaging |
Food Solutions |
Protective Packaging |
Other | Total Company | ||||||||||||||||||||||||||
|---|---|---|---|---|---|---|---|---|---|---|---|---|---|---|---|---|---|---|---|---|---|---|---|---|---|---|---|---|---|---|---|
Volume—Units |
$ | (55.4 | ) | (2.8 | )% | $ | (35.4 | ) | (3.6 | )% | $ | (209.4 | ) | (14.1 | )% | $ | (78.5 | ) | (19.3 | )% | $ | (378.7 | ) | (7.8 | )% | ||||||
Volume—Acquired businesses, net of (dispositions) |
— | — | — | — | 2.2 | 0.1 | (3.4 | ) | (0.8 | ) | (1.2 | ) | — | ||||||||||||||||||
Product price/mix |
46.2 | 2.3 | (3.7 | ) | (0.4 | ) | (30.6 | ) | (2.0 | ) | 9.3 | 2.3 | 21.2 | 0.4 | |||||||||||||||||
Foreign currency translation |
(120.4 | ) | (6.1 | ) | (57.5 | ) | (5.8 | ) | (49.6 | ) | (3.4 | ) | (14.5 | ) | (3.6 | ) | (242.0 | ) | (5.0 | ) | |||||||||||
Total change (U.S. GAAP) |
$ | (129.6 | ) | (6.6 | )% | $ | (96.6 | ) | (9.8 | )% | $ | (287.4 | ) | (19.4 | )% | $ | (87.1 | ) | (21.4 | )% | $ | (600.7 | ) | (12.4 | )% | ||||||
Impact of foreign currency translation |
120.4 | 6.1 | 57.5 | 5.8 | 49.6 | 3.4 | 14.5 | 3.6 | 242.0 | 5.0 | |||||||||||||||||||||
Total constant dollar change (Non-U.S. GAAP) |
$ | (9.2 | ) | (0.5 | )% | $ | (39.1 | ) | (4.0 | )% | $ | (237.8 | ) | (16.0 | )% | $ | (72.6 | ) | (17.8 | )% | $ | (358.7 | ) | (7.4 | )% | ||||||
2008 compared with 2007
|
Food Packaging |
Food Solutions |
Protective Packaging |
Other | Total Company | ||||||||||||||||||||||||||
|---|---|---|---|---|---|---|---|---|---|---|---|---|---|---|---|---|---|---|---|---|---|---|---|---|---|---|---|---|---|---|---|
Volume—Units |
$ | (11.2 | ) | (0.6 | )% | $ | (11.2 | ) | (1.2 | )% | $ | (81.6 | ) | (5.4 | )% | $ | 4.5 | 1.4 | % | $ | (99.5 | ) | (2.1 | )% | |||||||
Volume—Acquired businesses, net of (dispositions) |
— | — | — | — | 0.6 | — | 61.5 | 19.4 | 62.1 | 1.3 | |||||||||||||||||||||
Product price/mix |
62.4 | 3.3 | 29.3 | 3.1 | 21.4 | 1.4 | 7.0 | 2.2 | 120.1 | 2.5 | |||||||||||||||||||||
Foreign currency translation |
35.3 | 1.9 | 25.5 | 2.7 | 33.0 | 2.2 | 15.8 | 5.0 | 109.6 | 2.4 | |||||||||||||||||||||
Total change (U.S. GAAP) |
$ | 86.5 | 4.6 | % | $ | 43.6 | 4.6 | % | $ | (26.6 | ) | (1.8 | )% | $ | 88.8 | 28.0 | % | $ | 192.3 | 4.1 | % | ||||||||||
Impact of foreign currency translation |
(35.3 | ) | (1.9 | ) | (25.5 | ) | (2.7 | ) | (33.0 | ) | (2.2 | ) | (15.8 | ) | (5.0 | ) | (109.6 | ) | (2.4 | ) | |||||||||||
Total constant dollar change (Non-U.S. GAAP) |
$ | 51.2 | 2.7 | % | $ | 18.1 | 1.9 | % | $ | (59.6 | ) | (4.0 | )% | $ | 73.0 | 23.0 | % | $ | 82.7 | 1.7 | % | ||||||||||
The following net sales discussion is on a constant dollar basis.
Food Packaging Segment Net Sales
2009 compared with 2008
The $9 million or 1% decrease in net sales in 2009 compared with 2008 was primarily due to:
- •
- decreases in unit volume in Europe of $24 million, or 5%, and in the United States of $19 million, or 2%;
partially offset by:
- •
- favorable impacts of product price/mix in Latin America of $31 million, or 11%.
The decrease in unit volume in Europe was primarily due to lower equipment sales, which was mostly the result of lower capital spending by customers in this region. The decrease in unit volume in the United States was primarily due to the decline in local meat production mostly experienced during the first nine months of 2009. The unit volume declines in Europe and the United States reflected the continuing economic weakness in these regions. The favorable impact of product price/mix in Latin America was primarily due to the timing of pricing actions on most Food Packaging products, in part to cover the weakness of the Venezuelan currency.
2008 compared with 2007
The $51 million, or 3%, increase in net sales in 2008 compared with 2007 was primarily due to:
- •
- favorable impacts of product price/mix in Latin America of $23 million, or 8%, and in the United States of
$36 million, or 4%; and
- •
- increases in unit volume in the United States of $10 million, or 1%, and in Europe of $9 million, or 2%;
28
partially offset by:
- •
- a decrease in unit volume in Latin America of $23 million, or 8%.
The favorable impacts of product price/mix in Latin America and the United States were primarily due to the positive impact of selling price increases implemented in December 2007 and during 2008 for most Food Packaging products.
The increase in unit volume in the United States was primarily attributed to higher pork slaughter rates during the first half of 2008, which in turn resulted in higher sales of our fresh meat packaging products. The increase in unit volume in Europe was primarily attributed to net positive trends in this region during the first half of 2008 in the fresh red meat and cheese markets, which in turn resulted in higher sales of our fresh meat and dairy packaging products.
The decrease in unit volume in Latin America was primarily due to market factors in Brazil. Throughout 2008, Brazilian meat exports to Europe were restricted due to some Brazilian meat processors' lack of compliance with previously issued European food traceability and safety standards. By late 2008, the majority of Brazilian meat processors had complied with the standards, but by this time, end-market demand in Europe had slowed due to a decline in meat consumption attributable to weak economic conditions.
Food Solutions Segment Net Sales
2009 compared with 2008
The $39 million, or 4%, decrease in net sales in 2009 compared with 2008 was primarily due to decreases in unit volume in Europe of $29 million, or 7%, and in the United States of $13 million, or 3%. The decrease in unit volume in Europe was primarily due to the unfavorable impact of reduced consumption of certain meats in some countries, which in turn resulted in lower sales of our case-ready packaging products. The decrease in the United States was primarily due to lower sales of our vertical pouch packaging products to customers in the food service sector. Both declines in Europe and the United States reflected the economic weakness in these regions.
2008 compared with 2007
The $18 million, or 2%, increase in net sales in 2008 compared with 2007 was primarily due to:
- •
- favorable impacts of product price/mix in the United States of $22 million, or 6%, and in Europe of
$8 million, or 2%; and
- •
- an increase in unit volume in the Asia-Pacific region of $9 million, or 7%;
partially offset by:
- •
- decreases in unit volume in Europe of $14 million, or 4%, and in the United States of $11 million, or 3%.
The favorable impacts of product price/mix in both the United States and Europe were primarily attributed to the positive impact of selling price increases implemented in December 2007 and in 2008 for most Food Solutions products.
The increase in unit volume in the Asia-Pacific region was primarily attributed to product adoption by new and existing customers of our case-ready products.
The decrease in unit volume in Europe was primarily due to the unfavorable impact of lower consumption of meats and cheeses in certain countries resulting from deteriorating economic conditions in this region and, to a lesser extent, certain low margin business we decided to withdraw from in the first quarter of 2008. The decrease in unit volume in the United States was primarily due to a large retailer opting in November 2007 to move from a case-ready packaging format to an alternative packaging format for a portion of its meat packaging. This decrease was partially offset by increased flexible food film and vertical pouch packaging products sales to existing customers in this region.
29
Outsourced Products
In addition to net sales from products produced in our facilities, approximately 16% in 2009, 17% in 2008 and 19% in 2007 of net trade sales in this segment were from the sale of products fabricated by other manufacturers, which we refer to as outsourced products. Outsourced products include, among others, foam and solid plastic trays and containers fabricated primarily in North America and in Europe, which largely support our case ready products. We have strategically opted to use third-party manufacturers for technically less complex products and selected equipment in order to offer customers a broader range of solutions. We have benefited from this strategy with increased net sales and operating profit requiring minimal capital expenditures. Net sales of outsourced products included in this segment amounted to $147 million in 2009, $170 million in 2008 and $181 million in 2007. Additional sales of $90 million in 2009, $70 million in 2008 and $83 million in 2007 from the sales of outsourced products were primarily in our Protective Packaging segment.
Protective Packaging Segment Net Sales
2009 compared with 2008
The $238 million, or 16%, decrease in net sales in 2009 compared with 2008 was primarily the result of lower unit volume in the United States of $113 million, or 14%, and in Europe of $70 million, or 16%. These declines were principally attributable to continuing economic weakness in these regions, which were consistent with manufacturing output and export and shipping trends.
2008 compared with 2007
The $60 million, or 4%, decrease in net sales in 2008 compared with 2007 was primarily the result of lower unit volume in the United States of $48 million, or 6%, and in Europe of $19 million, or 4%, which was principally attributable to weakening regional economic conditions and was consistent with manufacturing output, shipping and retail indicators.
Partially offsetting this decrease in unit volume was the favorable impact of product price/mix in the United States of $14 million, or 2%, primarily attributed to the positive impact of selling price increases implemented in December 2007 and during 2008 for most Protective Packaging products.
Other Net Sales
2009 compared with 2008
The $73 million, or 18%, decrease in 2009 compared with 2008 was primarily attributed to lower unit volumes in North America of $44 million, or 29%, and in Europe of $27 million, or 14%. These declines were primarily attributed to lower unit volumes for some of our Specialty Materials products, which were principally the result of continuing economic weakness in these regions consistent with manufacturing output and export and shipping trends.
2008 compared with 2007
Other net sales increased $73 million, or 23%, in 2008 compared with 2007. Excluding $62 million in net sales resulting from the November 2007 acquisition of certain assets relating to Ethafoam® and related polyethylene foam product lines and the August 2007 acquisition of Alga Plastics, Other net sales would have increased $12 million, or 4%, primarily due to:
- •
- a favorable impact of product price/mix in North America of $11 million, or 10%, primarily attributed to the
positive impact of selling price increases for most of our Specialty Materials products; and
- •
- an increase in unit volume in Asia of $7 million, or 18%, primarily due to adoption of medical applications products by new and existing customers mainly in the first half of 2008.
These increases were partially offset by a decrease in unit volume in the United States of $3 million, or 3%, primarily attributed to lower unit volume in some of our Specialty Materials products, which was principally the result of weakening regional economic conditions and was consistent with manufacturing output indicators.
30
Net Sales by Geographic Region
The following table shows net sales by geographic region.
| |
2009 | 2008 | 2007 | 2009 vs. 2008 % Change |
2008 vs. 2007 % Change |
||||||||||||
|---|---|---|---|---|---|---|---|---|---|---|---|---|---|---|---|---|---|
Net sales: |
|||||||||||||||||
U.S. |
$ | 1,969.1 | $ | 2,185.2 | $ | 2,118.2 | (10 | )% | 3 | % | |||||||
As a % of total net sales |
46.4 | % | 45.1 | % | 45.5 | % | |||||||||||
International |
2,273.7 | 2,658.3 | 2,533.0 | (15 | ) | 5 | |||||||||||
As a % of total net sales |
53.6 | % | 54.9 | % | 54.5 | % | |||||||||||
Total net sales |
$ | 4,242.8 | $ | 4,843.5 | $ | 4,651.2 | (12 | )% | 4 | % | |||||||
By geographic region, the components of the decrease in net sales for 2009 compared with 2008 were as follows:
2009 compared with 2008
| |
U.S. | International | Total Company | ||||||||||||||||
|---|---|---|---|---|---|---|---|---|---|---|---|---|---|---|---|---|---|---|---|
Volume—Units |
$ | (186.4 | ) | (8.5 | )% | $ | (192.3 | ) | (7.2 | )% | $ | (378.7 | ) | (7.8 | )% | ||||
Volume—Acquired businesses, net of dispositions |
2.2 | 0.1 | (3.4 | ) | (0.1 | ) | (1.2 | ) | — | ||||||||||
Product price/mix |
(32.0 | ) | (1.5 | ) | 53.2 | 2.0 | 21.2 | 0.4 | |||||||||||
Foreign currency translation |
— | — | (242.0 | ) | (9.1 | ) | (242.0 | ) | (5.0 | ) | |||||||||
Total |
$ | (216.2 | ) | (9.9 | )% | $ | (384.5 | ) | (14.4 | )% | $ | (600.7 | ) | (12.4 | )% | ||||
By geographic region, the components of the increase in net sales for 2008 compared with 2007 were as follows:
2008 compared with 2007
| |
U.S. | International | Total Company | ||||||||||||||||
|---|---|---|---|---|---|---|---|---|---|---|---|---|---|---|---|---|---|---|---|
Volume—Units |
$ | (52.0 | ) | (2.5 | )% | $ | (47.5 | ) | (1.9 | )% | $ | (99.5 | ) | (2.1 | )% | ||||
Volume—Acquired businesses, net of dispositions |
40.9 | 1.9 | 21.2 | 0.8 | 62.1 | 1.3 | |||||||||||||
Product price/mix |
78.1 | 3.8 | 42.0 | 1.7 | 120.1 | 2.5 | |||||||||||||
Foreign currency translation |
— | — | 109.6 | 4.3 | 109.6 | 2.4 | |||||||||||||
Total |
$ | 67.0 | 3.2 | % | $ | 125.3 | 4.9 | % | $ | 192.3 | 4.1 | % | |||||||
See "Net Sales by Segment Reporting Structure" above for details of the major factors, trends and regions that contributed to the changes in net sales in the periods mentioned above.
Cost of Sales
Our primary input costs include resins, direct and indirect labor, other raw materials and other energy-related costs (including transportation costs.) We utilize petrochemical-based resins in the manufacture of many of our products. The costs for these raw materials are impacted by the rise and fall in crude oil and natural gas prices, since they serve as feedstocks utilized in the production of most resins. The prices for these feedstocks have been particularly volatile in recent years. Although changes in the prices of crude oil and natural gas are not perfect benchmarks, they are indicative of the variations in raw materials and other input costs we face. We continue to monitor changes in raw material and energy-related costs as they occur and take pricing actions as appropriate to lessen the impact of cost increases when they occur.
The following table shows our cost of sales for the three years ended December 31, 2009:
| |
2009 | 2008 | 2007 | 2009 vs. 2008 % Change |
2008 vs. 2007 % Change |
||||||||||||
|---|---|---|---|---|---|---|---|---|---|---|---|---|---|---|---|---|---|
Cost of sales |
$ | 3,024.3 | $ | 3,606.9 | $ | 3,350.1 | (16 | )% | 8 | % | |||||||
As a % of net sales |
71.3 | % | 74.5 | % | 72.0 | % | |||||||||||
31
2009 compared with 2008
The $583 million decrease in cost of sales in 2009 compared with 2008 was primarily due to:
- •
- favorable average petrochemical-based raw material expenditures of approximately $200 million, which was primarily
experienced in the first nine months of 2009;
- •
- the favorable impact of foreign currency translation of $185 million;
- •
- other lower input costs, including favorable freight and energy-related costs in 2009 of approximately $45 million;
and
- •
- estimated benefits from our expense control initiatives and other cost control measures in 2009, including approximately $40 million of incremental benefits from our 2008 cost reduction and productivity program and from GMS.
Expenses included in cost of sales related to the implementation of GMS were $10 million in 2009, compared with $7 million in 2008.
2008 compared with 2007
The $257 million increase in cost of sales in 2008 compared with 2007 was primarily due to:
- •
- unfavorable average petrochemical-based raw material expenditures of approximately $125 million, which was
experienced in the first nine months of 2008;
- •
- the unfavorable impact of foreign currency translation of $73 million; and
- •
- other higher input costs, including unfavorable freight and energy-related costs in 2008 of approximately $26 million.
Also contributing to the increase in cost of sales was incremental expenses in 2008 related to the 2007 acquisitions of Ethafoam® and related polyethylene foam product lines and Alga Plastics, which amounted to approximately $54 million. Expenses included in cost of sales related to the implementation of GMS were $7 million in 2008 compared with $11 million in 2007. These items were partially offset by the impact of expense control initiatives in 2008.
Marketing, Administrative and Development Expenses
The following table shows our marketing, administrative and development expenses for the three years ended December 31, 2009:
| |
2009 | 2008 | 2007 | 2009 vs. 2008 % Change |
2008 vs. 2007 % Change |
||||||||||||
|---|---|---|---|---|---|---|---|---|---|---|---|---|---|---|---|---|---|
Marketing, administrative and development expenses |
$ | 719.2 | $ | 755.0 | $ | 750.2 | (5 | )% | 1 | % | |||||||
As a % of net sales |
17.0 | % | 15.6 | % | 16.1 | % | |||||||||||
2009 compared with 2008
Marketing, administrative and development expenses decreased $36 million in 2009 compared with 2008. These expenses decreased due to the following:
- •
- estimated benefits from our expense control initiatives and other cost control measures in 2009, including approximately
$40 million of incremental benefits from our 2008 cost reduction and productivity program, lower travel and entertainment expenses and GMS; and
- •
- the favorable impact of foreign currency translation of $31 million.
These decreases were partially offset by higher management incentive compensation expenses of approximately $55 million in 2009, of which approximately $30 million occurred in the fourth quarter of 2009, because we exceeded our 2009 financial performance goals but did not meet our 2008 financial performance goals.
32
Our management incentive compensation expense includes annual cash incentives, our annual U.S. profit sharing contribution, and long-term, share-based compensation. The table below shows the increase in these expenses in 2009 compared with 2008.
| |
2009 | 2008 | 2009 vs. 2008 Change |
|||||||
|---|---|---|---|---|---|---|---|---|---|---|
Annual cash incentive compensation |
$ | 35.0 | $ | 13.0 | $ | 22.0 | ||||
Annual U.S. profit sharing contribution |
29.0 | 18.0 | 11.0 | |||||||
Share-based compensation |
38.8 | 16.5 | 22.3 | |||||||
Total |
$ | 102.8 | $ | 47.5 | $ | 55.3 | ||||
2008 compared with 2007
Marketing, administrative and development expenses increased $5 million in 2008 compared with 2007. These expenses increased due to the following:
- •
- the unfavorable impact of foreign currency translation of $19 million;
- •
- additional expenses of $5 million in 2008 related to businesses acquired in the second half of 2007;
- •
- an increase in provision for bad debt expense of $5 million (substantially all in the fourth quarter of 2008),
primarily related to credit conditions affecting some of our Food Packaging and Protective Packaging customers; and
- •
- additional operating expenses of $3 million in 2008 related to our New Ventures businesses, which includes spending related to innovation and new product introductions including spending related to renewable products.
These increases were largely offset by:
- •
- lower management incentive compensation expenses of $22 million, of which $14 million occurred in the fourth
quarter of 2008 because we did not meet our 2008 financial performance goals; and
- •
- a decrease in information systems expenses of $6 million, primarily due to expense control initiatives in 2008.
GMS and 2008 Cost Reduction and Productivity Program
GMS
Our GMS expands our production capabilities in regions where demand for our products and services has been growing significantly. Additionally, we are optimizing certain manufacturing platforms in North America and Europe into centers of excellence. The goals of this multi-year program have been to expand capacity in growing markets, further improve our operating efficiencies, and implement new technologies more effectively. By taking advantage of new technologies and streamlining production on a global scale, we have continued to enhance our profitable growth and our global leadership position and have produced meaningful benefits.
We announced the first phase of this multi-year global manufacturing strategy in July 2006. In 2009, we substantially finished the construction phase of GMS with the launch of our manufacturing facility in Duchnice, Poland. This facility along with our other new facilities in Qingpu, China and Monterrey, Mexico substantially completes the construction and launch of all three greenfield sites related to this program.
We estimate that we have realized benefits of approximately $25 million from GMS in 2008, which increased to $45 million in 2009. We expect to realize an additional $10 million of benefits in 2010 bringing total estimated annual benefits to $55 million in 2010 and thereafter. These benefits were primarily realized in cost of sales. We anticipate pre-tax charges related to this program to be approximately $4 million in 2010. The actual timing of any future related costs is subject to change due to a variety of factors that may cause a portion of the spending and benefits to occur in future periods.
33
The capital expenditures, associated costs and related restructuring charges and the total amounts incurred since inception of this multi-year strategy are included in the table below.
| |
Year Ended December 31, | |
|||||||||||
|---|---|---|---|---|---|---|---|---|---|---|---|---|---|
| |
Cumulative Through December 31, 2009 |
||||||||||||
| |
2009 | 2008 | 2007 | ||||||||||
Capital expenditures |
$ | 20.0 | $ | 59.5 | $ | 58.5 | $ | 152.7 | |||||
Associated costs(1) |
9.8 | 7.4 | 11.4 | 32.4 | |||||||||
Restructuring and other charges(2) |
6.5 | 19.3 | 0.7 | 38.3 | |||||||||
- (1)
- The associated costs principally include facility start-up costs, which are primarily included in cost of sales on the consolidated statements of operations. These charges by our reporting structure were as follows:
| |
2009 | 2008 | 2007 | |||||||
|---|---|---|---|---|---|---|---|---|---|---|
Food Packaging |
$ | 7.6 | $ | 4.0 | $ | 10.2 | ||||
Food Solutions |
1.3 | 0.6 | — | |||||||
Protective Packaging |
0.9 | 2.6 | 0.9 | |||||||
Other |
— | 0.2 | 0.3 | |||||||
Total |
$ | 9.8 | $ | 7.4 | $ | 11.4 | ||||
- (2)
- The restructuring and other charges were primarily for costs for termination benefits, the majority of which were related to the Food Packaging segment. These charges were included in restructuring and other charges on the consolidated statements of operations. See Note 3, "Segments," for restructuring and other charges by reportable segment and Other. A reconciliation of the restructuring accrual for GMS is included below.
Of the $6.5 million of restructuring and other charges related to GMS in 2009, $5.2 million was for costs for termination benefits in connection with our decision to cease some of our manufacturing operations in Norderstedt, Germany. We intend to relocate our bagmaking and printing operations to other existing facilities in Europe and plan to continue our production of medical products and maintain support functions in the Norderstedt facility. We estimate that we will incur total costs of approximately $7.0 million, all of which will be paid in 2010 or later. These estimated costs in connection with this action, by major type, consist of the following:
Costs for termination benefits |
$ | 5.2 | ||
Other associated restructuring costs, primarily for equipment relocation |
1.2 | |||
Other non-restructuring associated costs |
0.6 | |||
Total |
$ | 7.0 | ||
During 2009, we also recorded restructuring and other charges of $1.3 million primarily related to costs for termination benefits incurred in connection with other projects associated with GMS.
During 2008, the restructuring and other charges of $19.3 million related to this program were primarily for costs for termination benefits related to our decision to close our manufacturing facility in Cedar Rapids, Iowa. This facility's manufacturing operations were moved to existing facilities in North America.
The components of the restructuring accrual for GMS through December 31, 2009 and the accrual balance remaining on our consolidated balance sheet at December 31, 2009 were as follows:
Restructuring accrual at December 31, 2008 |
$ | 14.4 | ||
Provision for termination benefits |
5.9 | |||
Adjustment to accrual for termination benefits |
(1.4 | ) | ||
Cash payments during 2009 |
(9.8 | ) | ||
Effect of changes in foreign currency rates |
0.3 | |||
Restructuring accrual at December 31, 2009 |
$ | 9.4 | ||
We expect to pay $9.3 million of the accrual balance remaining at December 31, 2009 in 2010. This amount is included in other current liabilities on our consolidated balance sheet at December 31, 2009. The
34
remaining accrual of $0.1 million is expected to be paid in 2011 and is included in other liabilities on our consolidated balance sheet at December 31, 2009.
2008 Cost Reduction and Productivity Program
In the third quarter of 2008, we implemented a cost reduction and productivity program. As a result, we recorded $65.8 million of pre-tax charges primarily for costs for termination benefits in 2008. The components of the restructuring accrual through December 31, 2009 and the accrual balance remaining on our consolidated balance sheet at December 31, 2009 related to this program are included in the table below. We expect to incur additional modest costs associated with this program during 2010.
Restructuring accrual at December 31, 2008 |
$ | 43.7 | ||
Provision for termination benefits |
0.8 | |||
Cash payments made during 2009 |
(37.8 | ) | ||
Effect of changes in foreign currency rates |
(0.1 | ) | ||
Restructuring accrual at December 31, 2009 |
$ | 6.6 | ||
We expect to pay $6.5 million of the accrual balance remaining at December 31, 2009 in 2010. This amount is included in other current liabilities on the consolidated balance sheet at December 31, 2009. The remaining accrual of $0.1 million is expected to be paid in 2011 and is included in other liabilities on the consolidated balance sheet at December 31, 2009.
See "Cost of Sales" and "Marketing, Administrative and Development Expenses" above for a discussion of the benefits realized from this program in 2009.
Operating Profit by Business Segment and Other
Management evaluates the performance of each reportable segment based on its operating profit. Operating profit by our segment reporting structure for the three years ended December 31, 2009 was as follows:
| |
2009 | 2008 | 2007 | 2009 vs. 2008% Change |
2008 vs. 2007% Change |
||||||||||||
|---|---|---|---|---|---|---|---|---|---|---|---|---|---|---|---|---|---|
Food Packaging |
$ | 251.7 | $ | 217.5 | $ | 228.2 | 16 | % | (5 | )% | |||||||
As a % of Food Packaging net sales |
13.7 | % | 11.0 | % | 12.1 | % | |||||||||||
Food Solutions |
85.7 | 80.0 | 86.1 | 7 | (7 | ) | |||||||||||
As a % of Food Solutions net sales |
9.6 | % | 8.1 | % | 9.1 | % | |||||||||||
Protective Packaging |
150.0 | 169.1 | 208.6 | (11 | ) | (19 | ) | ||||||||||
As a % of Protective Packaging net sales |
12.6 | % | 11.4 | % | 13.8 | % | |||||||||||
Other |
11.9 | 15.0 | 28.0 | (21 | ) | (46 | ) | ||||||||||
As a % of Other net sales |
3.7 | % | 3.7 | % | 8.8 | % | |||||||||||
Total segments and other |
499.3 | 481.6 | 550.9 | 4 | (13 | ) | |||||||||||
As a % of total net sales |
11.8 | % | 9.9 | % | 11.8 | % | |||||||||||
Restructuring and other charges(1) |
7.0 | 85.1 | 1.6 | (92 | ) | # | |||||||||||
Total operating profit |
$ | 492.3 | $ | 396.5 | $ | 549.3 | 24 | (28 | ) | ||||||||
As a % of total net sales |
11.6 | % | 8.2 | % | 11.8 | % | |||||||||||
- #
- Denotes
a change equal to or greater than 100%
- (1)
- Restructuring and other charges by our segment reporting structure were as follows:
| |
2009 | 2008 | 2007 | |||||||
|---|---|---|---|---|---|---|---|---|---|---|
Food Packaging |
$ | 6.0 | $ | 46.2 | $ | 0.5 | ||||
Food Solutions |
1.0 | 15.1 | 0.1 | |||||||
Protective Packaging |
(0.1 | ) | 18.8 | 1.0 | ||||||
Other |
0.1 | 5.0 | — | |||||||
Total |
$ | 7.0 | $ | 85.1 | $ | 1.6 | ||||
See "Global Manufacturing Strategy and 2008 Cost Reduction and Productivity Program," above for further discussion of restructuring and other charges.
35
Food Packaging Segment Operating Profit
2009 compared with 2008
The increase in operating profit in 2009 compared with 2008 was primarily due to lower input costs including favorable average petrochemical-based raw material expenditures of approximately $80 million, the favorable impact of product price/mix of $46 million and freight and utilities costs of approximately $16 million. Operating profit was also favorably impacted from benefits from GMS and our expense control initiatives and other cost control measures in 2009 and 2008 as discussed above. These items were partially offset by the decline in unit volume discussed above.
Expenses in this segment related to the implementation of GMS were $8 million in 2009 compared with $4 million in 2008.
2008 compared with 2007
The decrease in operating profit in 2008 compared with 2007 was primarily due to higher input costs including unfavorable average petrochemical-based raw material expenditures of approximately $60 million and freight and utilities costs of approximately $14 million. These items were partially offset by the favorable impact of product price/mix of $62 million discussed above. Expenses in this segment related to the implementation of GMS were $4 million in 2008 compared with $10 million in 2007.
Food Solutions Segment Operating Profit
2009 compared with 2008
The increase in operating profit in 2009 compared with 2008 was primarily due to lower input costs including favorable average petrochemical-based raw material expenditures of approximately $40 million and freight and utilities costs of approximately $7 million. Operating profit was also favorably impacted by benefits from our expense control initiatives and other cost control measures in 2009 and 2008 as discussed above. These items were partially offset by the decline in unit volume discussed above.
2008 compared with 2007
The decrease in operating profit in 2008 compared with 2007 was primarily due to higher input costs, including unfavorable average petrochemical-based raw material expenditures of approximately $20 million and freight and utilities costs of approximately $4 million. These items were partially offset by the favorable impact product price/mix of $29 million discussed above.
Protective Packaging Segment Operating Profit
2009 compared with 2008
The decrease in operating profit in 2009 compared with 2008 was primarily due to the decline in unit volume and unfavorable product price/mix, both discussed above. These items were partially offset by favorable average petrochemical-based raw material expenditures of approximately $60 million, freight and utilities costs of approximately $30 million. Operating profit was also favorably impacted from benefits from our expense control initiatives and other cost control measures in 2009 and 2008, as discussed above.
2008 compared with 2007
The decrease in operating profit in 2008 compared with 2007 was primarily due to higher input costs, including unfavorable average petrochemical-based raw material expenditures of approximately $30 million and freight and utilities costs of approximately $5 million. Also contributing to this decrease was the decline in unit volume, which was partially offset by the favorable product price/mix of $21 million discussed above.
Other Operating Profit
2009 compared with 2008
The decrease in operating profit in 2009 compared with 2008 was primarily due to the decline in unit volume in our Specialty Materials products discussed above. Partially offsetting this decline was favorable
36
average petrochemical-based raw material expenditures of approximately $20 million, favorable product price/mix of approximately $9 million, and favorable freight and utilities costs of approximately $7 million.
2008 compared with 2007
The decrease in operating profit in 2008 compared with 2007 was primarily due to higher input costs including unfavorable average petrochemical-based raw material expenditures of approximately $10 million and freight and utilities costs of approximately $10 million, which included additional freight costs related to the Ethafoam® foam product lines. These higher input costs were partially offset by the favorable impact of product price/mix shown above. This business's operating profit was also unfavorably impacted by an interim supply and distribution agreement for the Ethafoam® foam product lines. We completed the construction of additional capacity in the United States to produce these products before the end of the interim agreement. This business's operating profit was also unfavorably impacted by the additional expenses related to innovation and new product introductions discussed above in "Marketing, Administrative and Development Expenses."
Interest Expense
Interest expense includes the stated interest rate on our outstanding debt, as well as the net impact of capitalized interest, the effects of interest rate swaps and the amortization of capitalized senior debt issuance costs, bond discounts, and terminated treasury locks. We expect to incur approximately $160 million of interest expense in 2010, which includes approximately $41 million of interest expense for a full year of accrued interest on the cash portion of the Settlement agreement.
Interest expense for the three years ended December 31, 2009 was as follows:
| |
2009 | 2008 | 2007 | 2009 vs. 2008 Change |
2008 vs. 2007 Change |
||||||||||||
|---|---|---|---|---|---|---|---|---|---|---|---|---|---|---|---|---|---|
Interest expense on the amount payable for the Settlement agreement |
$ | 39.0 | $ | 36.9 | $ | 35.0 | $ | 2.1 | $ | 1.9 | |||||||
Interest expense on our senior notes: |
|||||||||||||||||
12% Senior Notes due February 2014 |
30.9 | — | — | 30.9 | — | ||||||||||||
7.875% Senior Notes due June 2017 |
17.6 | — | — | 17.6 | — | ||||||||||||
6.875% Senior Notes due July 2033 |
30.9 | 30.9 | 30.9 | — | — | ||||||||||||
5.625% Senior Notes due July 2013 |
21.9 | 21.9 | 21.9 | — | — | ||||||||||||
3% Convertible Senior Notes redeemed July 2009 |
8.0 | 14.4 | 14.4 | (6.4 | ) | — | |||||||||||
6.95% Senior Notes matured May 2009 |
3.6 | 16.1 | 16.1 | (12.5 | ) | — | |||||||||||
5.375% Senior Notes matured April 2008 |
— | 7.1 | 24.8 | (7.1 | ) | (17.7 | ) | ||||||||||
Other interest expense |
9.7 | 10.1 | 7.0 | (0.4 | ) | 3.1 | |||||||||||
Less: capitalized interest |
(6.7 | ) | (9.3 | ) | (9.5 | ) | 2.6 | 0.2 | |||||||||
Total |
$ | 154.9 | $ | 128.1 | $ | 140.6 | $ | 26.8 | $ | (12.5 | ) | ||||||
Loss on Debt Redemption
In the third quarter of 2009, we redeemed the entire $431.3 million of our 3% Convertible Senior Notes due 2033 and recorded a $3 million pre-tax loss. This loss represented a 0.429% call premium of $2 million and a write-down of the remaining debt issuance costs of $1 million related to the issuance of these senior notes in July 2003. See Note 11, "Debt and Credit Facilities," of Notes to Consolidated Financial Statements for further discussion.
Impairment of Available-for-Sale Securities
Our valuation of our auction rate security investments resulted in the recognition of other than temporary impairment of $4 million ($2 million, net of taxes) in 2009 and $34 million ($22 million, net of taxes) in 2008. See Note 5, "Available-for-Sale Investments," of Notes to Consolidated Financial Statements for further discussion.
37
Gain on Sale of Equity Method Investment
In the first quarter of 2007, we sold our 50-percent investment in PolyMask Corporation to our joint venture partner, 3M Company (the "PolyMask transaction"). The joint venture was formed in 1991 to produce and sell non-packaging surface protection films. Before the sale, we accounted for this joint venture under the equity method of accounting. We received an aggregate cash amount of $36 million for the transaction and other related assets and recorded a pre-tax gain of $35 million ($22 million, net of taxes) in the first quarter of 2007. This gain was included in gain on the sale of equity method investment on the consolidated statement of operations. Our investment in this joint venture was not material to our consolidated financial position or results of operations.
Other (Expense) Income, Net
The following table provides details of our other (expense) income, net:
| |
2009 | 2008 | 2007 | 2009 vs. 2008 Change |
2008 vs. 2007 Change |
|||||||||||
|---|---|---|---|---|---|---|---|---|---|---|---|---|---|---|---|---|
Interest and dividend income |
$ | 7.1 | $ | 14.1 | $ | 19.9 | $ | (7.0 | ) | $ | (5.8 | ) | ||||
Net foreign exchange transaction losses |
(1.1 | ) | (16.0 | ) | (6.4 | ) | 14.9 | (9.6 | ) | |||||||
Settlement agreement and related costs |
(1.8 | ) | (1.5 | ) | (0.7 | ) | (0.3 | ) | (0.8 | ) | ||||||
Noncontrolling interests |
1.8 | 1.2 | 0.7 | 0.6 | 0.5 | |||||||||||
Advisory expenses incurred before ceasing work on an acquisition |
— | — | (7.5 | ) | — | 7.5 | ||||||||||
Net loss on sale of small product lines |
(0.2 | ) | — | (6.8 | ) | (0.2 | ) | 6.8 | ||||||||
Gain on termination of forward starting interest rate swaps |
— | — | 3.7 | — | (3.7 | ) | ||||||||||
Costs associated with our accounts receivable securitization program |
(0.7 | ) | (3.4 | ) | (0.4 | ) | 2.7 | (3.0 | ) | |||||||
Other, net |
(5.2 | ) | (6.5 | ) | 9.5 | 1.3 | (16.0 | ) | ||||||||
Other (expense) income, net |
$ | (0.1 | ) | $ | (12.1 | ) | $ | 12.0 | $ | 12.0 | $ | (24.1 | ) | |||
Interest and dividend income decreased in 2009 compared with 2008 primarily due to lower interest rates received on our invested cash and, to a lesser extent, lower cash balances in interest bearing accounts.
Interest and dividend income decreased in 2008 compared with 2007 primarily due to the use of available cash and cash equivalents to retire the 5.375% Senior Notes on the date of their maturity and, to a lesser extent, lower interest rates received on our invested cash.
Net foreign exchange transaction losses decreased in 2009 compared with 2008 primarily due to the favorable impact of foreign exchange rates in 2009.
Net foreign exchange transaction losses increased in 2008 compared with 2007 primarily due to the strengthening of the U.S. dollar during the latter part of 2008, particularly against foreign currencies in developing markets.
Income Taxes
Our effective income tax rate was 25.9% for 2009, 19.1% for 2008 and 22.6% for 2007. As described below, in each of those years, we recognized benefits for items that may not recur to the same extent in future years. As such, we expect an effective income tax rate of approximately 27% for 2010. Our 2010 effective tax rate may be higher if we fund the Settlement agreement in 2010. We anticipate that funding the Settlement agreement in 2010 will result in a loss for U.S. income tax return purposes. This loss will eliminate some tax benefits in 2010, primarily the domestic manufacturing deduction.
For 2009, our effective income tax rate was lower than the statutory U.S. federal income tax rate of 35% primarily due to the lower net effective income tax rate on foreign earnings and income tax benefits from tax credits and the domestic manufacturing deduction, partially offset by state income taxes and an increase in accruals relating to uncertain tax positions. See Note 15, "Income Taxes," for a reconciliation of the U.S. federal statutory rate to our effective tax rate which also shows the major components of the year over year changes.
38
For 2008, the effective income tax rate was lower than the statutory U.S. federal income tax rate of 35% primarily due to the lower net effective income tax rate on foreign earnings and, to a lesser extent, the following items:
- •
- a reduction in the estimated cost of repatriating certain foreign earnings,
- •
- a change in assertion made with regard to certain undistributed foreign earnings,
- •
- the reversal of tax accruals and related interest for contingencies that did not materialize following the completion of
tax audits, and
- •
- the utilization of loss carryforwards in a foreign jurisdiction for which no benefit had previously been recognized for financial reporting purposes.
For 2007, the effective income tax rate was lower than the statutory U.S. federal income tax rate of 35% primarily due to the reversal of tax accruals and related interest and, to a lesser extent, the lower net effective income tax rate on foreign earnings, partially offset by state income taxes.
Liquidity and Capital Resources
The discussion that follows contains:
- •
- a description of our material commitments and contingencies;
- •
- a description of our principal sources of liquidity;
- •
- a description of our outstanding indebtedness;
- •
- an analysis of our historical cash flows and changes in working capital;
- •
- a description of our derivative financial instruments; and
- •
- a description of changes in our stockholders' equity.
Material Commitments and Contingencies
Settlement Agreement and Related Costs
We recorded a charge of $850.1 million in the fourth quarter of 2002, of which $512.5 million represents a cash payment that we are required to make (subject to the satisfaction of the terms and conditions of the Settlement agreement) upon the effectiveness of a plan of reorganization in the bankruptcy of W.R. Grace & Co. We did not use cash in any period with respect to this liability. The Bankruptcy Court has conducted hearings to consider confirmation of the PI Settlement Plan and has heard closing arguments with respect to the PI Settlement Plan but additional hearings may be held by the Bankruptcy Court and the District Court to consider matters related to the PI Settlement Plan. We do not know whether or when a final plan of reorganization will become effective or whether the final plan will be consistent with the terms of the Settlement agreement. We currently expect to fund this payment by using a combination of accumulated cash and cash equivalents, future cash flows from operations and funds available under our global credit facility, our European facility, or our accounts receivable securitization program, described below. The cash payment of $512.5 million accrues interest at a 5.5% annual rate, which is compounded annually, from December 21, 2002 to the date of payment. We have recorded this accrued interest in Settlement agreement and related accrued interest on our consolidated balance sheets, and these amounts were $234.3 at December 31, 2009 and $195.3 million at December 31, 2008.
The information set forth in Part II, Item 8 of this Annual Report on Form 10-K in Note 16, "Commitments and Contingencies," under the caption "Settlement Agreement and Related Costs" is incorporated herein by reference.
Cryovac Transaction Commitments and Contingencies
The information set forth in Part II, Item 8 of this Annual Report on Form 10-K in Note 16, "Commitments and Contingencies," of Notes to Consolidated Financial Statements under the caption "Cryovac Transaction Commitments and Contingencies" is incorporated herein by reference.
39
MPERS Lawsuit and Other Litigation and Claims
The information set forth in Part II, Item 8 of this Annual Report on Form 10-K in Note 16, "Commitments and Contingencies," of Notes to Consolidated Financial Statements under the captions "MPERS Lawsuit" and "Other Litigation and Claims" are incorporated herein by reference.
Contractual Obligations
The following table summarizes our principal contractual obligations and sets forth the amounts of required or contingently required cash outlays in 2010 and future years (amounts in millions):
| |
Payments Due by Years | |||||||||||||||
|---|---|---|---|---|---|---|---|---|---|---|---|---|---|---|---|---|
Contractual Obligations
|
Total | 2010 | 2011-2012 | 2013-2014 | Thereafter | |||||||||||
Short-term borrowings |
$ | 28.2 | $ | 28.2 | $ | — | $ | — | $ | — | ||||||
Current portion of long-term debt exclusive of debt discounts |
6.5 | 6.5 | — | — | — | |||||||||||
Long-term debt, exclusive of debt discounts |
1,636.7 | — | 86.7 | 700.0 | 850.0 | |||||||||||
Total debt(1) |
1,671.4 | 34.7 | 86.7 | 700.0 | 850.0 | |||||||||||
Interest payments due on long-term debt(2) |
1,191.0 | 120.9 | 241.9 | 177.3 | 650.9 | |||||||||||
Operating leases |
138.6 | 34.0 | 47.7 | 24.8 | 32.1 | |||||||||||
Cash portion of the Settlement agreement, including accrued interest at December 31, 2009(3) |
746.8 | 746.8 | — | — | — | |||||||||||
First quarter 2010 quarterly cash dividend declared |
19.1 | 19.1 | — | — | — | |||||||||||
Other principal contractual obligations |
179.9 | 114.3 | 62.7 | 2.9 | — | |||||||||||
Total contractual cash obligations |
$ | 3,946.8 | $ | 1,069.8 | $ | 439.0 | $ | 905.0 | $ | 1,533.0 | ||||||
- (1)
- These
amounts include principal maturities (at face value) only. These amounts also include our contractual obligations under capital leases of
$6.3 million in 2010, $7.6 million in 2011-2012 and $0.3 million in 2013-2014.
- (2)
- Includes
interest payments required under our senior notes issuances only.
- (3)
- This liability is reflected as a current liability due to the uncertainty of the timing of payment. Interest accrues on this amount at a rate of 5.5% per annum, compounded annually, until it becomes due and payable.
Current Portion of Long-Term Debt and Long-Term Debt—The debt shown in the above table excludes unamortized bond discounts as of December 31, 2009 and therefore represents the principal amount of the debt required to be repaid in each period.
Operating Leases—The contractual operating lease obligations listed in the table above represent estimated future minimum annual rental commitments primarily under non-cancelable real and personal property leases as of December 31, 2009.
Cash Portion of the Settlement Agreement—The Settlement agreement is described more fully in "Settlement Agreement and Related Costs," of Note 16, "Commitments and Contingencies," of Notes to Consolidated Financial Statements.
Other Principal Contractual Obligations—Other principal contractual obligations include agreements to purchase an estimated amount of goods, including raw materials, or services, including energy, in the normal course of business that are enforceable and legally binding and specify all significant terms, including fixed or minimum quantities to be purchased, minimum or variable price provisions and the approximate timing of the purchase.
Liability for Unrecognized Tax Benefits
At December 31, 2009, we had liabilities for unrecognized tax benefits and related interest of $11 million, which is included in other liabilities on the consolidated balance sheet. At December 31, 2009,
40
we cannot reasonably estimate the future period or periods of cash settlement of these liabilities. See Note 15, "Income Taxes," of Notes to Consolidated Financial Statements for further discussion.
Off-Balance Sheet Arrangements
We have reviewed our off-balance sheet arrangements and have determined that none of those arrangements have or are reasonably likely to have a material current or future effect on our consolidated financial statements, liquidity, capital expenditures or capital resources. At December 31, 2009, we had no amounts outstanding under our accounts receivable securitization program. See Note 6, "Accounts Receivable Securitization Program," of Notes to Consolidated Financial Statements for further information.
Income Tax Payments
We currently expect to pay between $100 million and $110 million in income taxes in 2010. This range would be adjusted if the Settlement agreement were to become effective in 2010.
Contributions to Defined Benefit Pension Plans
We maintain defined benefit pension plans for a limited number of our U.S. employees and for some of our non-U.S. employees. We currently expect employer contributions to be approximately $12 million in 2010.
Termination Benefit Payments
In connection with our GMS and 2008 cost reduction and productivity program, we currently expect to pay approximately $16 million of termination benefits in 2010.
Environmental Matters
We are subject to loss contingencies resulting from environmental laws and regulations, and we accrue for anticipated costs associated with investigatory and remediation efforts when an assessment has indicated that a loss is probable and can be reasonably estimated. These accruals do not take into account any discounting for the time value of money and are not reduced by potential insurance recoveries, if any. We do not believe that it is reasonably possible that the liability in excess of the amounts that we have accrued for environmental matters will be material to our consolidated statements of operations, balance sheets or cash flows. We reassess environmental liabilities whenever circumstances become better defined or we can better estimate remediation efforts and their costs. We evaluate these liabilities periodically based on available information, including the progress of remedial investigations at each site, the current status of discussions with regulatory authorities regarding the methods and extent of remediation and the apportionment of costs among potentially responsible parties. As some of these issues are decided (the outcomes of which are subject to uncertainties) or new sites are assessed and costs can be reasonably estimated, we adjust the recorded accruals, as necessary. We believe that these exposures are not material to our consolidated financial position and results of operations. We believe that we have adequately reserved for all probable and estimable environmental exposures.
Principal Sources of Liquidity
We require cash to fund our operating expenses, capital expenditures, interest, taxes and dividend payments and to pay our debt obligations and other long-term liabilities as they come due. Our principal sources of liquidity are cash flows from operations, accumulated cash and amounts available under our existing lines of credit described below, including the global credit facility and the European credit facility, and our accounts receivable securitization program.
In 2009, we redeemed the entire $431.3 million of our 3% Convertible Senior Notes, retired all of our outstanding 6.95% Senior Notes and issued $400 million of 7.875% Senior Notes and $300 million of 12% Senior Notes. We believe that our current liquidity position and future cash flows from operations will enable us to fund our operations, including all of the items mentioned above and the cash payment under the Settlement agreement should it become payable within the next 12 months.
41
With respect to the Settlement agreement, we do not know whether or when a final plan of reorganization for Grace will become effective or whether the final plan will be consistent with the terms of the Settlement agreement. Grace's PI Settlement Plan is subject to the satisfaction of a number of conditions, including the availability of exit financing and the approval of both the Bankruptcy Court and United States District Court for the District of Delaware, resulting in uncertainty as to when the plan might become effective.
Tax benefits resulting from the payment made under the Settlement agreement, which are currently recorded as deferred tax assets on our consolidated balance sheets, are anticipated to provide approximately $350 million of current and future cash tax benefits at the time the payment under the Settlement agreement is made. The amount and timing of future cash tax benefits could vary, depending on the amount of cash paid by us and various facts and circumstances at the time of payment under the Settlement agreement, including the price of our common stock, our tax position and the applicable tax codes.
Cash and Cash Equivalents
The following table summarizes our accumulated cash and cash equivalents:
| |
December 31, 2009 |
December 31, 2008 |
|||||
|---|---|---|---|---|---|---|---|
Cash and cash equivalents |
$ | 694.5 | $ | 128.9 | |||
See "Analysis of Historical Cash Flows" below.
Lines of Credit
The following table summarizes our available lines of credit and committed and uncommitted lines of credit, including the global credit facility and the European credit facility discussed below, at December 31, 2009 and 2008:
| |
December 31, | ||||||
|---|---|---|---|---|---|---|---|
| |
2009 | 2008 | |||||
Used lines of credit |
$ | 107.1 | $ | 46.7 | |||
Unused lines of credit |
846.3 | 773.4 | |||||
Total available lines of credit |
$ | 953.4 | $ | 820.1 | |||
Available lines of credit—committed |
$ | 686.1 | $ | 588.8 | |||
Available lines of credit—uncommitted |
267.3 | 231.3 | |||||
Total available lines of credit |
$ | 953.4 | $ | 820.1 | |||
Our principal credit lines were committed and consisted of the global credit facility and the European credit facility. We are not subject to any material compensating balance requirements in connection with our lines of credit.
Global Credit Facility
The global credit facility is available for general corporate purposes, including the payment of amounts required to be paid upon the effectiveness of the Settlement agreement. We may re-borrow amounts repaid under the global credit facility from time to time before the expiration or earlier termination of the global credit facility. Our obligations under the global credit facility bear interest at floating rates, which are generally determined by adding the applicable borrowing margin to the base rate or the interbank rate for the relevant currency and time period. The global credit facility provides for changes in borrowing margins based on our long-term senior unsecured debt ratings. The facility has an expiration date of July 26, 2012.
The terms of this facility include a requirement that, upon the occurrence of specified events that would adversely affect the Settlement agreement or would materially increase our liability in respect of the Grace bankruptcy or the asbestos liability arising from the Cryovac transaction, we would be required to repay any amounts outstanding under the global credit facility or refinance the facility within 60 days.
Before December 10, 2009, the global credit facility commitments included $28 million provided by Lehman Commercial Paper Inc., a subsidiary of Lehman Brothers Holdings Inc. As a result of the
42
bankruptcy filing of Lehman Brothers Holdings Inc. and certain of its subsidiaries in September 2008, Lehman Commercial Paper was no longer funding borrowing requests under the global credit facility. Effective December 10, 2009, we removed Lehman Commercial Paper's commitments from the global credit facility and as a result, as of December 31, 2009, the total amount available under the global credit facility was approximately $472 million.
While the current total amount available for borrowing under the global credit facility is approximately $472 million, the facility also provides a mechanism to increase the total facility size to a maximum of $750 million. This does not represent a commitment by the lenders to increase the facility size; rather, it provides us with a simplified method of requesting an increase at a later date if desired and market conditions permit. This mechanism is not included in the available lines of credit table above.
Facility fees are payable at the rate of 0.20% per annum on the total amounts available under the revolving credit facility. The global credit facility provides for changes in facility fees based on our long-term senior unsecured debt ratings. Also, the facility provides for springing subsidiary guarantees if our long-term senior unsecured debt ratings by both Moody's and Standard & Poor's fall below investment grade.
During 2009, we borrowed funds from time to time under this facility. Interest expense related to the funds drawn in 2009 was $0.2 million. The related weighted average interest rate for these borrowings was 1.7%. At December 31, 2009 there were no amounts outstanding under this facility.
European Credit Facility
In November 2009, we entered into a €150 million European credit facility, equivalent to U.S. $214 million at December 31, 2009. The facility has an expiration date of July 26, 2012. A syndicate of banks made this facility available to Sealed Air and a group of our European subsidiaries for general corporate purposes, including the payment of amounts required to be paid upon effectiveness of the Settlement agreement. We may re-borrow amounts repaid under the European credit facility from time to time before the expiration or earlier termination of the facility. The terms of this facility are substantially similar to the terms of our global credit facility. As of December 31, 2009, we had an outstanding balance of €45 million, which was equivalent to U.S. $64 million. We repaid this outstanding balance in January 2010. Interest expense related to the funds drawn in 2009 was $0.1 million and had a weighted average interest rate of 3.625%.
In December 2009, after entering into the European credit facility, we cancelled our 170 million Australian dollar revolving credit facility, which was scheduled to expire in March 2010. We did not utilize the Australian facility in 2009.
Other Lines of Credit
Substantially all our short-term borrowings of $28 million at December 31, 2009 and $38 million at December 31, 2008 were outstanding under lines of credit available to several of our foreign subsidiaries. The following table details our other lines of credit at December 31, 2009 and 2008:
| |
December 31, | ||||||
|---|---|---|---|---|---|---|---|
| |
2009 | 2008 | |||||
Available lines of credit |
$ | 252.6 | $ | 222.2 | |||
Unused lines of credit |
224.4 | 191.1 | |||||
Weighted average interest rate |
5.5 | % | 11.2 | % | |||
See Note 11, "Debt and Credit Facilities," of Notes to Consolidated Financial Statements for further information on our outstanding long-term debt and available lines of credit.
Accounts Receivable Securitization Program
We and a group of our U.S. subsidiaries maintain an accounts receivable securitization program with a bank and an issuer of commercial paper administered by the bank. As of December 31, 2009, the maximum purchase limit for receivable interests was $125 million. The amounts available from time to time under the program may be less than $125 million due to a number of factors, including but not limited to our credit ratings, accounts receivable balances, the creditworthiness of our customers and our receivables collection experience.
43
During 2009, the level of eligible assets available under the program declined primarily due to our current credit rating. As a result, the amount available to us under the program was approximately $74 million at December 31, 2009. Although we do not believe that these restrictive provisions presently materially restrict our operations, if an event occurs that triggers one of these restrictive provisions, we could experience a further decline in the amounts available under the program or termination of the program.
The program is scheduled to expire in December 2012. The program includes a bank financing commitment that must be renewed annually before the expiration date. The bank financing commitment is scheduled to expire on December 3, 2010. We plan to seek an additional 364 day renewal of the bank financing commitment before its expiration, but the bank is not obligated to renew the bank financing commitment.
At December 31, 2009, we had no amounts outstanding under this program.
See Note 6, "Accounts Receivable Securitization Program," of Notes to Consolidated Financial Statements for additional information concerning this program.
Covenants
At December 31, 2009, we were in compliance with our financial covenants and limitations, as discussed in "Covenants," of Note 11, "Debt and Credit Facilities," of Notes to Consolidated Financial Statements.
Debt Ratings
Our cost of capital and ability to obtain external financing may be affected by our debt ratings, which the credit rating agencies review periodically. The Company and our long-term senior unsecured debt are currently rated BB+ (stable outlook) by Standard & Poor's. This rating is considered non-investment grade. The Company and our long-term senior unsecured debt are currently rated Baa3 (negative outlook) by Moody's. This rating is considered investment grade. If our credit ratings are downgraded, there could be a negative impact on our ability to access capital markets and borrowing costs could increase. A credit rating is not a recommendation to buy, sell or hold securities and may be subject to revision or withdrawal at any time by the rating organization. Each rating should be evaluated independently of any other rating.
Outstanding Indebtedness
At December 31, 2009 and 2008, our total debt outstanding consisted of the amounts set forth in the following table. See Note 11, "Debt and Credit Facilities," of Notes to Consolidated Financial Statements for further information on our debt.
| |
December 31, | ||||||
|---|---|---|---|---|---|---|---|
| |
2009 | 2008 | |||||
Short-term borrowings |
$ | 28.2 | $ | 37.6 | |||
Current portion of long-term debt |
6.5 | 151.5 | |||||
Total current debt |
34.7 | 189.1 | |||||
Total long-term debt, less current portion |
1,626.3 | 1,289.9 | |||||
Total debt |
$ | 1,661.0 | $ | 1,479.0 | |||
Analysis of Historical Cash Flow
The following table summarizes the changes in our cash flows for the three years ended December 31, 2009:
| |
2009 | 2008 | 2007 | 2009 vs. 2008 % Change |
2008 vs. 2007 % Change |
|||||||||||
|---|---|---|---|---|---|---|---|---|---|---|---|---|---|---|---|---|
Net cash provided by operating activities |
$ | 552.0 | $ | 404.4 | $ | 378.1 | 36 | % | 7 | % | ||||||
Net cash used in investing activities |
(70.3 | ) | (176.7 | ) | (274.1 | ) | (60 | ) | (35 | ) | ||||||
Net cash provided by (used in) financing activities |
90.3 | (562.9 | ) | (59.5 | ) | # | # | |||||||||
- #
- Denotes a variance greater than 100%
44
Net Cash Provided by Operating Activities
2009 compared with 2008
The $148 million increase in cash provided by operating activities in 2009 was primarily due to the following factors:
- •
- a decrease in receivables, net, of $156 million in 2009, which was attributable to both lower sales and a decline
in days-sales-outstanding in 2009;
- •
- a decrease in inventories of $141 million in 2009, primarily due to management's efforts to maintain lower
inventory levels and the benefit of lower average petrochemical-based raw material expenditures experienced in 2009; and
- •
- an increase in net earnings adjusted for non-cash items of $77 million in 2009.
These factors were partially offset by the following:
- •
- a decrease of net cash of $160 million resulting from the repurchases in 2009 and sales in 2008 of receivable
interests under our accounts receivable securitization program. We used available cash of $80 million to fund the repurchase of receivable interests in 2009, compared with the receipt of
$80 million in cash from the sale of receivable interests in 2008;
- •
- an increase in cash used for accounts payable of $40 million due to the timing of payments;
- •
- an increase in accrued interest related to the Settlement agreement of $39 million; and
- •
- an increase in cash used for the payment of termination benefits of $24 million in 2009 in connection with our 2008 cost reduction and productivity program and GMS. Cash payments for termination benefits were $48 million in 2009, compared with $24 million in 2008.
2008 compared with 2007
The $26 million increase in cash provided by operating activities in 2008 was primarily due to the following factors:
- •
- an increase in other current liabilities of $114 million in 2008, primarily due to the
following:
- •
- a decrease in cash used for income taxes payable of $93 million in 2008. Income tax payments were
$91 million in 2008 compared with $202 million in 2007. The decrease in income tax payments in 2008 primarily resulted from lower estimated taxable income for 2008;
and
- •
- an increase in accrued restructuring costs of $44 million in 2008, primarily reflecting additional net accrued termination costs recorded in connection with our 2008 cost reduction program and, to a lesser extent, GMS;
- •
- a decrease in accrued payroll of $23 million in 2008, primarily reflecting lower management incentive compensation
in 2008; and
- •
- the utilization of $80 million available to us under our accounts receivable securitization program in 2008 as discussed above.
partially offset by:
These items were partially offset by:
- •
- a decrease in net earnings adjusted for non-cash items of $118 million in 2008; and
- •
- an increase in cash used for accounts payable of $46 million in 2008, primarily due to the timing of payments.
Net Cash Used in Investing Activities
2009 compared with 2008
The $106 million decrease in cash used in investing activities in 2009 was primarily due to lower capital expenditures of $100 million in 2009 compared with 2008. During 2009, we completed the construction phase of GMS with the launch of our manufacturing facility in Poland.
45
2008 compared with 2007
The $97 million decrease in cash used for investing activities was primarily due to the following:
- •
- a decrease in cash used for acquisitions of $73 million in 2008; and
- •
- a decrease of $30 million in capital expenditures in 2008, primarily due to the timing of the completion of some new capacity projects in 2008.
These items were partially offset by cash received of $36 million in 2007 from the PolyMask transaction.
We expect to continue to invest capital as we deem appropriate to expand our business, to maintain or replace depreciating property, plant and equipment, to acquire new manufacturing technology and to improve productivity. Since we have substantially finished the construction phase associated with GMS, we expect total capital expenditures in 2010 to be in the range of $80 million to $100 million. This projected range is comparable to the annual level of capital expenditures incurred before commencing GMS in 2006. This projection is based upon our capital expenditure budget for 2010, the status of approved but not yet completed capital projects, anticipated future projects and historic spending trends.
Net Cash Provided By (Used in) Financing Activities
2009 compared with 2008
In 2009, our financing activities provided a net $90 million of cash and cash equivalents, primarily due to the following activities:
- •
- issuance of $400 million of 7.875% Senior Notes due June 2017;
- •
- issuance of $300 million of 12% Senior Notes due February 2014;
- •
- funds drawn of $64 million under our European credit facility;
partially offset by:
- •
- redemption of the entire $431.3 million of our 3% Convertible Senior Notes;
- •
- retirement of the remaining outstanding balance of $137 million of our 6.95% Senior Notes; and
- •
- dividend payments of $76 million.
In 2008, our financing activities resulted in a net usage of $563 million of cash and cash equivalents, which was primarily due to:
- •
- retirement of our 5.375% Senior Notes with a face value of $300 million;
- •
- purchase of $91 million in aggregate principal amount of the 6.95% Senior Notes;
- •
- repurchases of our common stock of $95 million; and
- •
- dividend payments of $76 million.
2008 compared with 2007
The $503 million increase in cash used for financing activities was primarily due to the following:
- •
- an increase in net long-term debt repayments of $390 million in 2008, primarily due to the retirement
of our 5.375% Senior Notes with a face value of $300 million in April 2008 and the purchase of $91 million in aggregate principal amount of our 6.95% Senior Notes;
- •
- an increase in cash used for the repurchase of our common stock of $88 million in 2008, as discussed below; and
- •
- an increase in cash used for the payment of common stock dividends of $12 million in 2008, primarily due to the increase in dividends paid per common share in 2008.
Repurchases of Capital Stock
During 2009, we did not repurchase any shares of common stock. During 2008, we repurchased 4 million shares of our common stock, par value $0.10 per share, in open market purchases at a cost of
46
$95 million. The average price per share of these common stock repurchases was $23.64. During 2007, we repurchased 0.2 million shares of our common stock in open market purchases at a cost of $7 million. The average price per share of these common stock repurchases was $31.58. All repurchases have been adjusted for the two-for-one stock split in March 2007.
We made the share repurchases in 2008 under the share repurchase program adopted by our Board of Directors in August 2007 when the Board of Directors authorized us to repurchase in the aggregate up to 20 million shares of its issued and outstanding common stock. This program replaced our prior share repurchase program, which ended in August 2007. The current program has no set expiration date, and we may from time to time continue to repurchase our common stock. See Item 5, "Issuer Purchases of Equity Securities," for further information on the share repurchase program.
Changes in Working Capital
| |
December 31, 2009 |
December 31, 2008 |
Increase | |||||||
|---|---|---|---|---|---|---|---|---|---|---|
Working capital (current assets less current liabilities) |
$ | 639.6 | $ | 50.5 | $ | 589.1 | ||||
Current ratio (current assets divided by current liabilities) |
1.4x | 1.0x | ||||||||
Quick ratio (current assets, less inventories divided by current liabilities) |
1.1x | 0.7x | ||||||||
The increase in working capital in 2009 compared with 2008 was primarily due to the following:
- •
- an increase in cash and cash equivalents of $566 million. See "Analysis of Historical Cash Flows" above for details
of the factors that contributed to the increase in cash and cash equivalents;
- •
- a decrease in current portion of long-term debt of $145 million. This decrease was primarily due to the
retirement of the remaining $136.7 million 6.95% Senior Notes in May 2009; and
- •
- a decrease in accounts payable of $63 million, which primarily reflected lower purchases of raw materials as a
result of lower volumes of net sales and lower raw material unit costs experienced in 2009; and
- •
- a decrease in accrued restructuring costs of $34 million, primarily due to payments made for termination benefits accrued in connection with our 2008 cost reduction and productivity program.
These items were partially offset by:
- •
- a decrease in inventories of $95 million. Excluding the impact of foreign currency translation of
$21 million, inventories would have decreased $116 million, primarily due to management's efforts to maintain lower inventory levels and the benefit of lower average petrochemical-based
raw material expenditures experienced in 2009;
- •
- a decrease in deferred taxes of $54 million, due to a reclassification of a portion of the deferred tax asset
related to the Settlement agreement to non-current based on the current anticipated timing of the related tax benefit;
- •
- an increase in accrued interest of $39 million related to the Settlement agreement; and
- •
- an increase in other current liabilities of $27 million, primarily due to an increase in accrued payroll reflecting higher 2009 accruals for management incentive compensation expenses.
Foreign currency translation had a net favorable impact on working capital of approximately $32 million.
Derivative Financial Instruments
Interest Rate Swaps
The information set forth in Part II, Item 8 of this Annual Report on Form 10-K in Note 12, "Derivatives and Hedging Activities," of Notes to Consolidated Financial Statements under the caption "Interest Rate Swaps" is incorporated herein by reference.
47
Foreign Currency Forward Contracts
At December 31, 2009, we were party to foreign currency forward contracts, which did not have a significant impact on our liquidity.
The information set forth in Part II, Item 8 of this Annual Report on Form 10-K in Note 12, "Derivatives and Hedging Activities," of Notes to Consolidated Financial Statements under the caption "Foreign Currency Forward Contracts" is incorporated herein by reference.
For further discussion about these contracts and other financial instruments, see Item 7A, "Quantitative and Qualitative Disclosures About Market Risk."
Stockholders' Equity
Our stockholders' equity was $2,200 million at December 31, 2009 and $1,926 million at December 31, 2008. Stockholders' equity increased $274 million, or 14%, in 2009 compared with 2008 primarily due to the following:
- •
- net earnings of $244 million; and
- •
- positive foreign currency translation of $72 million.
The items above were partially offset by dividends paid and accrued on our common stock of $78 million in 2009.
Recently Issued Statements of Financial Accounting Standards, Accounting Guidance and Disclosure Requirements
We are subject to numerous recently issued statements of financial accounting standards, accounting guidance and disclosure requirements. Note 2, "Summary of Significant Accounting Policies and Recently Issued Accounting Standards," of Notes to Consolidated Financial Statements, which is contained in Part II, Item 8 of this Annual Report on Form 10-K, describes these new accounting standards and is incorporated herein by reference.
Critical Accounting Policies and Estimates
Our discussion and analysis of our consolidated financial position and results of operations are based upon our consolidated financial statements, which are prepared in accordance with U.S. GAAP. The preparation of consolidated financial statements in conformity with U.S. GAAP requires management to make estimates and assumptions that affect the reported amounts of assets, liabilities, revenues and expenses and the disclosure of contingent assets and liabilities.
Estimates and assumptions are evaluated on an ongoing basis and are based on all available evidence, including historical experience and other factors believed to be reasonable under the circumstances. To derive these estimates and assumptions, management draws from those available sources that can best contribute to its efforts. These sources include our officers and other employees, outside consultants and legal counsel, experts and actuaries. In addition, we use internally generated reports and statistics, such as aging of accounts receivable, as well as outside sources such as government statistics, industry reports and third-party research studies. The results of these estimates and assumptions may form the basis of the carrying value of assets and liabilities and may not be readily apparent from other sources. Actual results may differ from estimates under conditions and circumstances different from those assumed, and any such differences may be material to our consolidated financial statements.
We believe the following accounting policies are critical to understanding our consolidated results of operations and affect the more significant judgments and estimates used in the preparation of our consolidated financial statements. The critical accounting policies discussed below should be read together with our significant accounting policies set forth in Note 2, "Summary of Significant Accounting Policies and Recently Issued Accounting Standards," of Notes to Consolidated Financial Statements.
48
Accounts Receivable and Allowance for Doubtful Accounts
In the normal course of business, we extend credit to our customers if they satisfy pre-defined credit criteria. We maintain an accounts receivable allowance for estimated losses resulting from the failure of our customers to make required payments. An additional allowance may be required if the financial condition of our customers deteriorates. The allowance for doubtful accounts is maintained at a level that management assesses to be appropriate to absorb estimated losses in the accounts receivable portfolio. The allowance for doubtful accounts is reviewed quarterly, and changes to the allowance are made through the provision for bad debts, which is included in marketing, administrative and development expenses on our consolidated statements of operations. These changes may reflect changes in economic, business and market conditions. The allowance is increased by the provision for bad debts and decreased by the amount of charge-offs, net of recoveries.
The provision for bad debts charged against operating results is based on several factors including, but not limited to, a regular assessment of the collectibility of specific customer balances, the length of time a receivable is past due and our historical experience with our customers. In circumstances where a specific customer's inability to meet its financial obligations is known, we record a specific provision for bad debt against amounts due thereby reducing the receivable to the amount we reasonably assess will be collected. If circumstances change, such as higher than expected defaults or an unexpected material adverse change in a major customer's ability to pay, our estimates of recoverability could be reduced by a material amount.
Fair Value Measurements
In determining fair value of financial instruments, we utilize valuation techniques that maximize the use of observable inputs and minimize the use of unobservable inputs to the extent possible and consider counterparty credit risk in our assessment of fair value. We determine fair value of our financial instruments based on assumptions that market participants would use in pricing an asset or liability in the principal or most advantageous market. When considering market participant assumptions in fair value measurements, the following fair value hierarchy distinguishes between observable and unobservable inputs, which are categorized in one of the following levels:
- •
- Level 1 Inputs: Unadjusted quoted prices in active markets for identical assets or liabilities accessible to the
reporting entity at the measurement date.
- •
- Level 2 Inputs: Other than quoted prices included in Level 1 inputs that are observable for the asset or
liability, either directly or indirectly, for substantially the full term of the asset or liability.
- •
- Level 3 Inputs: Unobservable inputs for the asset or liability used to measure fair value to the extent that observable inputs are not available, thereby allowing for situations in which there is little, if any, market activity for the asset or liability at measurement date.
Our fair value measurements for our financial instruments, such as our investments in auction rate securities, are subjective and involve uncertainties and matters of significant judgment. Changes in assumptions could significantly affect our estimates. See Note 13, "Fair Value Measurements and Other Financial Instruments," of Notes to Consolidated Financial Statement for further details on our fair value measurements.
Commitments and Contingencies—Litigation
On an ongoing basis, we assess the potential liabilities and costs related to any lawsuits or claims brought against us. We accrue a liability when we believe a loss is probable and when the amount of loss can be reasonably estimated. Litigation proceedings are evaluated on a case-by-case basis considering the available information, including that received from internal and outside legal counsel, to assess potential outcomes. While it is typically very difficult to determine the timing and ultimate outcome of these actions, we use our best judgment to determine if it is probable that we will incur an expense related to the settlement or final adjudication of these matters and whether a reasonable estimation of the probable loss, if any, can be made. In assessing probable losses, we consider insurance recoveries, if any. We expense legal costs, including those legal costs expected to be incurred in connection with a loss contingency, as incurred. We have in the past adjusted existing accruals as proceedings have continued, been settled or otherwise provided further information on which we could review the likelihood of outflows of resources and their measurability, and we expect to do so in future periods. Due to the inherent uncertainties related to the
49
eventual outcome of litigation and potential insurance recovery, it is possible that disputed matters may be resolved for amounts materially different from any provisions or disclosures that we have previously made.
Impairment of Long-Lived Assets
The determination of the value of long-lived assets requires management to make assumptions and estimates that affect our consolidated financial statements. We periodically review long-lived assets other than goodwill for impairment whenever there is evidence that events or changes in circumstances indicate that the carrying amount of an asset or asset group may not be recoverable.
Assumptions and estimates used in the determination of impairment losses, such as future cash flows, which are based on operational performance, market conditions and other factors, and disposition costs, may affect the carrying value of long-lived assets and result in possible impairment expense in our consolidated financial statements. As assumptions and estimates change in the future, we may be required to record an impairment charge.
Goodwill
Goodwill is reviewed for possible impairment at least annually on a reporting unit level during the fourth quarter of each year. A review of goodwill may be initiated before or after conducting the annual analysis if events or changes in circumstances indicate the carrying value of goodwill may no longer be recoverable.
A reporting unit is the operating segment unless, at businesses one level below that operating segment—the "component" level—discrete financial information is prepared and regularly reviewed by management, and the component has economic characteristics that are different from the economic characteristics of the other components of the operating segment, in which case the component is the reporting unit.
We use a fair value approach to test goodwill for impairment. We must recognize a non-cash impairment charge for the amount, if any, by which the carrying amount of goodwill exceeds its implied fair value. We derive an estimate of fair values for each of our reporting units using a combination of an income approach and two market approaches, each based on an applicable weighting. We assess the applicable weighting based on such factors as current market conditions and the quality and reliability of the data. Absent an indication of fair value from a potential buyer or similar specific transactions, we believe that the use of these methods provides a reasonable estimate of a reporting unit's fair value. Fair value computed by these methods is arrived at using a number of factors, including projected future operating results, anticipated future cash flows, effective income tax rates, comparable marketplace data within a consistent industry grouping, and the cost of capital. There are inherent uncertainties, however, related to these factors and to our judgment in applying them to this analysis. Nonetheless, we believe that the combination of these methods provides a reasonable approach to estimate the fair value of our reporting units. Assumptions for sales, net earnings and cash flows for each reporting unit were consistent among these methods.
Income Approach Used to Determine Fair Values
The income approach is based upon the present value of expected cash flows. Expected cash flows are converted to present value using factors that consider the timing and risk of the future cash flows. The estimate of cash flows used is prepared on an unleveraged debt-free basis. We use a discount rate that reflects a market-derived weighted average cost of capital. We believe that this approach is appropriate because it provides a fair value estimate based upon the reporting unit's expected long-term operating and cash flow performance. The projections are based upon our best estimates of projected economic and market conditions over the related period including growth rates, estimates of future expected changes in operating margins and cash expenditures. Other significant estimates and assumptions include terminal value long-term growth rates, provisions for income taxes, future capital expenditures and changes in future cashless, debt-free working capital.
Market Approaches Used to Determine Fair Values
We use two market approaches. The first market approach estimates the fair value of the reporting unit by applying multiples of operating performance measures to the reporting unit's operating performance.
50
These multiples are derived from comparable publicly-traded companies with similar investment characteristics to the reporting unit. We believe that this approach is appropriate because it provides a fair value estimate using multiples from entities with operations and economic characteristics comparable to our reporting units and the Company. The second market approach is based on the publicly traded common stock of the Company and the estimate of fair value of the reporting unit is based on the applicable multiples of the Company. The key estimates and assumptions that are used to determine fair value under the two market approaches includes trailing and future 12-month operating performance results and the selection of the relevant multiples to be applied. Under both market approaches, a control premium, or an amount that a buyer is usually willing to pay over the current market price of a publicly traded company, is applied to the calculated equity values to adjust the public trading value upward for a 100% ownership interest, where applicable.
See Note 9, "Goodwill and Identifiable Intangible Assets," of Notes to Consolidated Financial Statements for details of our goodwill balance and the goodwill review performed in 2009 and other related information.
Pensions
We maintain a non-contributory profit sharing plan and a contributory thrift and retirement savings plan in which most U.S. employees are eligible to participate. For a limited number of our U.S. employees and for some of our international employees, we maintain defined benefit pension plans. Under current accounting standards, we are required to make assumptions regarding the valuation of projected benefit obligations and the performance of plan assets for our defined benefit pension plans.
The projected benefit obligation and the net periodic benefit cost are based on third-party actuarial assumptions and estimates that are reviewed and approved by management on a plan-by-plan basis each fiscal year. The principal assumptions concern the discount rate used to measure the projected benefit obligation, the expected future rate of return on plan assets and the expected rate of future compensation increases. We revise these assumptions based on an annual evaluation of long-term trends and market conditions that may have an impact on the cost of providing retirement benefits.
In determining the discount rate, we utilize market conditions and other data sources management considers reasonable based upon the profile of the remaining service life of eligible employees. The expected long-term rate of return on plan assets is determined by taking into consideration the weighted-average expected return on our asset allocation, asset return data, historical return data, and the economic environment. We believe these considerations provide the basis for reasonable assumptions of the expected long-term rate of return on plan assets. The rate of compensation increase is based on our long-term plans for such increases. The measurement date used to determine the benefit obligation and plan assets is December 31.
At December 31, 2009, the projected benefit obligation for our U.S. pension plans was $17 million and the net periodic benefit cost for the year ended December 31, 2009 was $4 million. At December 31, 2009, the projected benefit obligation for our international pension plans was $86 million and the net periodic benefit cost for the year ended December 31, 2009 was $18 million.
In general, material changes to the principal assumptions could have a material impact on the costs and liabilities recognized on our consolidated financial statements. A 25 basis point change in the assumed discount rate and a 100 basis point change in the expected long-term rate of return on plan assets would have resulted in the following increases (decreases) in the projected benefit obligation at December 31, 2009 and the expected net periodic benefit cost for the year ended December 31, 2010 (in millions).
| |
25 Basis Point Increase |
25 Basis Point Decrease |
||||||
|---|---|---|---|---|---|---|---|---|
United States |
||||||||
Discount Rate |
||||||||
Effect on 2009 projected benefit obligation |
$ | (1.8 | ) | $ | 1.9 | |||
Effect on 2010 expected net periodic benefit cost |
(0.2 | ) | 0.2 | |||||
51
| |
100 Basis Point Increase |
100 Basis Point Decrease |
||||||
|---|---|---|---|---|---|---|---|---|
Return on Assets |
||||||||
Effect on 2010 expected net periodic benefit cost |
$ | (0.4 | ) | $ | 0.4 | |||
| |
25 Basis Point Increase |
25 Basis Point Decrease |
||||||
|---|---|---|---|---|---|---|---|---|
International |
||||||||
Discount Rate |
||||||||
Effect on 2009 projected benefit obligation |
$ | (9.6 | ) | $ | 10.1 | |||
Effect on 2010 expected net periodic benefit cost |
(1.2 | ) | 1.2 | |||||
| |
100 Basis Point Increase |
100 Basis Point Decrease |
||||||
|---|---|---|---|---|---|---|---|---|
Return on Assets |
||||||||
Effect on 2010 expected net periodic benefit cost |
$ | (1.9 | ) | $ | 1.9 | |||
Income Taxes
Estimates and judgments are required in the calculation of tax liabilities and in the determination of the recoverability of our deferred tax assets. Our deferred tax assets arise from net deductible temporary differences and tax benefit carry forwards. We evaluate whether our taxable earnings during the periods when the temporary differences giving rise to deferred tax assets become deductible or when tax benefit carry forwards may be utilized should be sufficient to realize the related future income tax benefits. For those jurisdictions where the expiration dates of tax benefit carry forwards or the projected taxable earnings indicate that realization is not likely, we provide a valuation allowance.
In assessing the need for a valuation allowance, we estimate future taxable earnings, with consideration for the feasibility of ongoing tax planning strategies and the realizability of tax benefit carry forwards and past operating results, to determine which deferred tax assets are more likely than not to be realized in the future. Changes to tax laws, statutory tax rates and future taxable earnings can have an impact on valuation allowances related to deferred tax assets. In the event that actual results differ from these estimates in future periods, we may need to adjust the valuation allowance, which could have a material impact on our consolidated financial statements.
In calculating our worldwide provision for income taxes, we also evaluate our tax positions for years where the statutes of limitations have not expired. Based on this review, we may establish reserves for additional taxes and interest that could be assessed upon examination by relevant tax authorities. We adjust these reserves to take into account changing facts and circumstances, including the results of tax audits and changes in tax law. If the payment of additional taxes and interest ultimately proves unnecessary or less than the amount of the reserve, the reversal of the reserves would result in tax benefits being recognized in the period when we determine the reserves are no longer necessary. If an estimate of tax reserves proves to be less than the ultimate assessment, a further charge to income tax provision would result. These adjustments to reserves and related expenses could materially affect our consolidated financial statements.
We recognize the tax benefit from an uncertain tax position only if it is more likely than not that the tax position will be sustained on examination by the taxing authorities, based on the technical merits of the position. The tax benefits recognized in the consolidated financial statements from such positions are measured based on the largest benefit that has a greater than fifty percent likelihood of being realized upon settlement with tax authorities. See Note 15, "Income Taxes," of Notes to Consolidated Financial Statements for further discussion.
52
Summarized Quarterly Financial Information (Unaudited, in millions, except share data)
2009
|
First Quarter |
Second Quarter |
Third Quarter |
Fourth Quarter |
|||||||||
|---|---|---|---|---|---|---|---|---|---|---|---|---|---|
Net sales |
$ | 988.5 | $ | 1,028.0 | $ | 1,079.9 | $ | 1,146.4 | |||||
Gross profit |
285.7 | 288.1 | 311.1 | 333.6 | |||||||||
Net earnings |
58.1 | 60.5 | 60.6 | 65.1 | |||||||||
Basic net earnings per common share |
$ | 0.37 | $ | 0.38 | $ | 0.38 | $ | 0.41 | |||||
Diluted net earnings per common share |
$ | 0.32 | $ | 0.33 | $ | 0.34 | $ | 0.37 | |||||
2008
|
First Quarter |
Second Quarter |
Third Quarter |
Fourth Quarter |
|||||||||
|---|---|---|---|---|---|---|---|---|---|---|---|---|---|
Net sales |
$ | 1,177.4 | $ | 1,278.8 | $ | 1,219.0 | $ | 1,168.3 | |||||
Gross profit |
305.1 | 330.2 | 293.7 | 307.6 | |||||||||
Net earnings |
60.8 | 62.6 | 9.2 | 47.3 | |||||||||
Basic net earnings per common share |
$ | 0.38 | $ | 0.39 | $ | 0.06 | $ | 0.30 | |||||
Diluted net earnings per common share |
$ | 0.33 | $ | 0.34 | $ | 0.05 | $ | 0.26 | |||||
Item 7A. Quantitative and Qualitative Disclosures About Market Risk
We are exposed to market risk from changes in interest rates, foreign currency exchange rates and commodity prices, which may adversely affect our consolidated financial position and results of operations. We seek to minimize these risks through regular operating and financing activities and, when deemed appropriate, through the use of derivative financial instruments. We do not purchase, hold or sell derivative financial instruments for trading purposes.
Interest Rates
From time to time, we may use interest rate swaps, collars or options to manage our exposure to fluctuations in interest rates.
Our interest rate swaps are described in Note 12, "Derivatives and Hedging Activities," of Notes to Consolidated Financial Statements, which is contained in Part II, Item 8 of this Annual Report on Form 10-K and in "Management's Discussion and Analysis of Financial Condition and Results of Operations—Liquidity and Capital Resources—Derivative Financial Instruments—Interest Rate Swaps" contained in Part II, Item 7 of this Annual Report on Form 10-K. Such information is incorporated herein by reference.
At December 31, 2009, we had outstanding interest rate swaps, but no outstanding collars or options. At December 31, 2008, we had no outstanding interest rate swaps, collars or options.
The carrying value of our total debt, which includes the impact of outstanding interest rate swaps in 2009, was $1,661.0 million at December 31, 2009 and $1,479.0 million at December 31, 2008. Our fixed rate debt, including the impact of interest rate swaps in 2009, was $1,568.6 million at December 31, 2009 and $1,430.9 million at December 31, 2008. The fair value of our fixed rate debt varies with changes in interest rates. Generally, the fair value of fixed rate debt will increase as interest rates fall and decrease as interest rates rise. The estimated fair value of our total debt, including the impact of outstanding interest rate swaps in 2009, was $1,774.7 million at December 31, 2009 and $1,204.8 million at December 31, 2008. A hypothetical 10% decrease in interest rates would result in an increase of $66.9 million in the fair value of the total debt balance at December 31, 2009. These changes in the fair value of our fixed rate debt do not alter our obligations to repay the outstanding principal amount of such debt.
See Note 13, "Fair Value Measurements and Other Financial Instruments," of Notes to Consolidated Financial Statements for details of the methodology and inputs used to determine the fair value of our fixed rate debt.
Foreign Currency Exchange Rate Risk
As a large, global organization, we face exposure to changes in foreign currency exchange rates. These exposures may change over time as business practices evolve and could materially impact our consolidated financial position or results of operations in the future.
53
The translation of the financial statements of our non-U.S. operations is impacted by fluctuations in foreign currency exchange rates. The change in net sales and operating income was impacted by the translation of our international financial statements into U.S. dollars. This resulted in a decrease in net sales of $242 million and increased operating profit by $26 million in 2009 compared with 2008.
Recent economic events in Venezuela have exposed us to heightened levels of foreign currency exchange risk. Effective January 1, 2010, Venezuela has been designated as a highly inflationary economy, and the U.S. dollar replaced the Bolivar fuerte as the functional currency for our subsidiary in Venezuela. In accordance with U.S. GAAP, a highly inflationary economy is one that has a cumulative inflation rate of approximately 100 percent or more over a three-year period. We determined the cumulative inflation rate using a blended inflation rate which included the National Consumer Price Index, known as the NCPI, and the consumer price index, known as the CPI. The CPI is only based on the metropolitan areas of Caracas and Maracaibo in Venezuela and the NCPI is based on the entire country of Venezuela.
Once a country is designated to be a highly inflationary economy, the remeasurement method must be used, which is also called the monetary/nonmonetary method. All Bolivar-denominated monetary assets and liabilities are re-measured into U.S. dollars using the current exchange rate and any changes in foreign currency are reflected in other (expense) income on the consolidated statement of operations. All Bolivar-denominated nonmonetary assets and liabilities are re-measured into U.S. dollars using the historical exchange rates.
The potential future impact to our consolidated financial position and results of operations for future Bolivar-denominated transactions will depend on the exchange rates in effect when we enter into, remeasure and settle transactions. Therefore, it is difficult to predict the future impact until each transaction settles at its applicable exchange rate or gets remeasured into U.S. dollars.
At December 31, 2009, our subsidiary in Venezuela had net assets of approximately $8 million. For the year ended December 31, 2009, less than 1% of our consolidated net sales and less than 3% of our consolidated operating profit was derived from our business in Venezuela. Accordingly, we do not expect the devaluation of the Bolivar fuerte to have a material adverse effect on our consolidated financial position or results of operations.
We use foreign currency forward contracts to fix the amount payable on some transactions denominated in foreign currencies. A hypothetical 10% adverse change in foreign exchange rates at December 31, 2009 would have caused us to pay approximately $35.6 million to terminate these contracts.
Our foreign currency forward contracts are described in Note 12, "Derivatives and Hedging Activities," of Notes to Consolidated Financial Statements, which is contained in Part II, Item 8 and in "Management's Discussion and Analysis of Financial Condition and Results of Operations—Liquidity and Capital Resources—Derivative Financial Instruments—Foreign Currency Forward Contracts" contained in Part II, Item 7 of this Annual Report on Form 10-K. Such information is incorporated herein by reference.
We may use other derivative instruments from time to time, such as foreign exchange options to manage exposure due to foreign exchange rates and interest rate and currency swaps related to access to additional sources of international financing. These instruments can potentially limit foreign exchange exposure and limit or adjust interest rate exposure by swapping borrowings denominated in one currency for borrowings denominated in another currency. At December 31, 2009 and 2008, we had no foreign exchange options and currency swap agreements outstanding.
Our outstanding debt is generally denominated in the functional currency of the borrowing subsidiary. We believe that this enables us to better match operating cash flows with debt service requirements and to better match the currency of assets and liabilities. The amount of outstanding debt denominated in a functional currency other than the U.S. dollar was $109.0 million at December 31, 2009 and $48.5 million at December 31, 2008.
Available-for-Sale Investments
Our available-for-sale investments, consisting of auction rate securities at December 31, 2009 and 2008, are exposed to market risk related to changes in conditions in the U.S. financial markets and in the financial condition of the issuers of these securities. Our investment in auction rate securities at December 31, 2009 and 2008 had an original cost of $44.7 million (debt instruments of $24.7 million and non-cumulative
54
perpetual preferred stock of $20.0 million). As of December 31, 2009, the estimated fair value of our investments in auction rate securities was $13.7 million.
These auction rate securities consisted of two contingent capital securities that were converted into perpetual preferred stock of Ambac Assurance Corporation (AMBAC), the issuer, in December 2008, and three debt instruments issued individually by Primus Financial Products LLC (Primus) (maturity date 2021), River Lake Insurance Company (River Lake), a wholly-owned subsidiary of Genworth Financial, Inc. (maturity date 2033) and Ballantyne Re Plc (Ballantyne) (maturity date 2036). We received interest and dividend payments of $1.1 million for the year ended December 31, 2009 and $2.2 million for the year ended December 31, 2008.
These five securities historically were re-auctioned every twenty-eight days, which had provided a liquid market for them. However, as a result of continuing liquidity concerns for these types of asset-backed securities, every auction held by the issuers for these auction rate securities since late 2007 has failed.
We account for these investments as available-for-sale investments on a security-by-security basis and determine whether a decline in fair value below its cost is temporary or other than temporary. The objective of other than temporary impairment analysis under U.S. GAAP is to determine whether the holder of an investment in a debt or equity security for which changes in fair value are not regularly recognized in earnings should recognize a loss in earnings when the investment is impaired. An investment is impaired if the fair value of the investment is less than its amortized cost.
Since August 2007, the estimated fair value of each of our investments in auction rate securities has been less than its original cost. As a result, we have recognized cumulative losses of $38.0 million ($23.8 million, net of taxes) through December 31, 2009 from the decline in market values from the securities' original cost. After considering impairment indicators under U.S. GAAP and the declines in fair value, we determined that these investments were impaired. We evaluated the following factors in determining whether the impairment is temporary or other than temporary:
- •
- the creditworthiness of the issuers and the timelines and level of interest payments received from the issuers;
- •
- downgrades of credit ratings of all of the issuers;
- •
- the severity of the decline in the estimated market value of the securities in 2008 and 2009;
- •
- potential recovery of the investment value;
- •
- AMBAC's December 2008 exercise of its put option to convert its asset backed capital commitment securities into
non-cumulative perpetual preferred stock of AMBAC Assurance (no maturity date);
- •
- AMBAC's December 2008 cancellation of the dividend on its common stock;
- •
- AMBAC's cancellation of the dividend on its non-cumulative preferred stock effective August 1, 2009;
and
- •
- the level of subordination of the Ballantyne securities.
Based on the evaluations discussed above, we determined that the securities incurred other than temporary decline in fair market value. We also recorded $7.0 million of unrealized gains ($4.4 million, net of taxes) in 2009 in other comprehensive income related to an increase in the estimated fair value of the River Lake securities, following their initial decline in value, which was primarily due to an improvement in River Lake's credit spread.
See Note 13, "Fair Value Measurements and Other Financial Instruments," for details on the inputs and valuation methodology used to calculate the estimated fair value of these investments.
We continue to monitor developments in the market for auction rate securities including the specific securities in which we have invested. At December 31, 2009, ratings of the securities held by us by Moody's ranged from Baa3 to unrated and ratings by Standard & Poor's ranged from BBB to D. These ratings are among the ratings assigned by each of these organizations for investment and non-investment grade long-term unsecured debt. Moreover, during the year ended December 31, 2009, we continued to receive all interest payments totaling $0.8 million on a timely basis from the issuers of the three debt securities,
55
Effective August 1, 2009, AMBAC discontinued paying dividends on its perpetual preferred stock. During the year ended December 31, 2009, we received dividend payments totaling $0.3 million from AMBAC.
If credit or liquidity conditions relating to these securities or the issuers worsen, we may recognize additional other than temporary impairments, which would result in the recognition of additional losses on our consolidated statement of operations. We believe that we have sufficient liquidity to meet our operating cash needs without the sale of these securities.
Customer Credit
We are exposed to credit risk from our customers. In the normal course of business we extend credit to our customers if they satisfy pre-defined credit criteria. We maintain an allowance for doubtful accounts for estimated losses resulting from the failure of our customers to make required payments. An additional allowance may be required if the financial condition of our customers deteriorates. The allowance for doubtful accounts is maintained at a level that management assesses to be appropriate to absorb estimated losses in the accounts receivable portfolio.
Our customers may default on their obligations to us due to bankruptcy, lack of liquidity, operational failure or other reasons. Despite uncertainties surrounding global economic conditions and levels of credit risk since the second half of 2007, we have not experienced a significant adverse change in our customers' payment patterns or defaults. Our provision for bad debt expense was $6 million in 2009, $9 million in 2008 and $3 million in 2007.
Pensions
Recent market conditions have resulted in an unusually high degree of volatility and increased risks and short-term liquidity concerns associated with some of the plan assets held by our defined benefit pension plans, which have impacted the performance of some of the plan assets. Based upon the annual valuation of our defined benefit pension plans at December 31, 2009, we expect our net periodic benefit costs to be approximately $20 million in 2010, which is comparable to prior years' costs. See Note 14, "Profit Sharing, Retirement Savings Plans and Defined Benefit Pension Plans," of Notes to Consolidated Financial Statements for further details on our defined benefit pension plans.
Commodities
We use various commodity raw materials such as plastic resins and energy products such as electric power and natural gas in conjunction with our manufacturing processes. Generally, we acquire these components at market prices in the region in which they will be used and do not use financial instruments to hedge commodity prices. Moreover, we seek to maintain appropriate levels of commodity raw material inventories thus minimizing the expense and risks of carrying excess inventories. We do not typically purchase substantial quantities in advance of production requirements. As a result, we are exposed to market risks related to changes in commodity prices of these components.
56
Item 8. Financial Statements and Supplementary Data
The following consolidated financial statements and notes are filed as part of this report.
Sealed Air Corporation
57
Report of Independent Registered Public Accounting Firm
The
Board of Directors and Stockholders
Sealed Air Corporation:
We have audited the accompanying consolidated balance sheets of Sealed Air Corporation and subsidiaries as of December 31, 2009 and 2008, and the related consolidated statements of operations, stockholders' equity, cash flows and comprehensive income for each of the years in the three-year period ended December 31, 2009. In connection with our audits of the consolidated financial statements, we also have audited financial statement schedule II—valuation and qualifying accounts and reserves. We also have audited Sealed Air Corporation's internal control over financial reporting as of December 31, 2009, based on criteria established in Internal Control—Integrated Framework issued by the Committee of Sponsoring Organizations of the Treadway Commission (COSO). Sealed Air Corporation's management is responsible for these consolidated financial statements and financial statement schedule, for maintaining effective internal control over financial reporting, and for its assessment of the effectiveness of internal control over financial reporting, included in the accompanying Management's Annual Report on Internal Control over Financial Reporting. Our responsibility is to express an opinion on these consolidated financial statements and financial statement schedule, and an opinion on the Company's internal control over financial reporting based on our audits.
We conducted our audits in accordance with the standards of the Public Company Accounting Oversight Board (United States). Those standards require that we plan and perform the audits to obtain reasonable assurance about whether the financial statements are free of material misstatement and whether effective internal control over financial reporting was maintained in all material respects. Our audits of the consolidated financial statements included examining, on a test basis, evidence supporting the amounts and disclosures in the financial statements, assessing the accounting principles used and significant estimates made by management, and evaluating the overall financial statement presentation. Our audit of internal control over financial reporting included obtaining an understanding of internal control over financial reporting, assessing the risk that a material weakness exists, and testing and evaluating the design and operating effectiveness of internal control based on the assessed risk. Our audits also included performing such other procedures as we considered necessary in the circumstances. We believe that our audits provide a reasonable basis for our opinions.
A company's internal control over financial reporting is a process designed to provide reasonable assurance regarding the reliability of financial reporting and the preparation of financial statements for external purposes in accordance with generally accepted accounting principles. A company's internal control over financial reporting includes those policies and procedures that (1) pertain to the maintenance of records that, in reasonable detail, accurately and fairly reflect the transactions and dispositions of the assets of the company; (2) provide reasonable assurance that transactions are recorded as necessary to permit preparation of financial statements in accordance with generally accepted accounting principles, and that receipts and expenditures of the company are being made only in accordance with authorizations of management and directors of the company; and (3) provide reasonable assurance regarding prevention or timely detection of unauthorized acquisition, use, or disposition of the company's assets that could have a material effect on the financial statements.
Because of its inherent limitations, internal control over financial reporting may not prevent or detect misstatements. Also, projections of any evaluation of effectiveness to future periods are subject to the risk that controls may become inadequate because of changes in conditions, or that the degree of compliance with the policies or procedures may deteriorate.
In our opinion, the consolidated financial statements referred to above present fairly, in all material respects, the financial position of Sealed Air Corporation and subsidiaries as of December 31, 2009 and 2008, and the results of their operations and their cash flows for each of the years in the three-year period ended December 31, 2009, in conformity with U.S. generally accepted accounting principles. Also in our opinion, the related financial statement schedule, when considered in relation to the basic consolidated financial statements taken as a whole, presents fairly, in all material respects, the information set forth therein. Also in our opinion, Sealed Air Corporation maintained, in all material respects, effective internal control over financial reporting as of December 31, 2009, based on criteria established in Internal Control—Integrated Framework issued by the Committee of Sponsoring Organizations of the Treadway Commission.
/s/ KPMG LLP
Short
Hills, New Jersey
March 1, 2010
58
SEALED AIR CORPORATION AND SUBSIDIARIES
Consolidated Balance Sheets
(in millions, except share data)
| |
December 31, | ||||||||
|---|---|---|---|---|---|---|---|---|---|
| |
2009 | 2008 | |||||||
Assets |
|||||||||
Current assets: |
|||||||||
Cash and cash equivalents |
$ | 694.5 | $ | 128.9 | |||||
Receivables, net of allowance for doubtful accounts of $17.5 in 2009 and $19.5 in 2008 |
666.7 | 682.8 | |||||||
Inventories |
469.4 | 564.3 | |||||||
Deferred tax assets |
176.1 | 230.5 | |||||||
Prepaid expenses and other current assets |
66.7 | 66.2 | |||||||
Total current assets |
2,073.4 | 1,672.7 | |||||||
Property and equipment, net |
1,010.7 | 1,051.4 | |||||||
Goodwill |
1,948.7 | 1,938.1 | |||||||
Non-current deferred tax assets |
146.0 | 84.1 | |||||||
Other assets, net |
241.3 | 239.7 | |||||||
Total assets |
$ | 5,420.1 | $ | 4,986.0 | |||||
Liabilities and stockholders' equity |
|||||||||
Current liabilities: |
|||||||||
Short-term borrowings |
$ | 28.2 | $ | 37.6 | |||||
Current portion of long-term debt |
6.5 | 151.5 | |||||||
Accounts payable |
214.2 | 277.2 | |||||||
Deferred tax liabilities |
8.0 | 11.3 | |||||||
Settlement agreement and related accrued interest |
746.8 | 707.8 | |||||||
Accrued restructuring costs |
15.8 | 49.4 | |||||||
Other current liabilities |
414.3 | 387.4 | |||||||
Total current liabilities |
1,433.8 | 1,622.2 | |||||||
Long-term debt, less current portion |
1,626.3 | 1,289.9 | |||||||
Non-current deferred tax liabilities |
6.4 | 5.8 | |||||||
Other liabilities |
153.3 | 142.5 | |||||||
Total liabilities |
3,219.8 | 3,060.4 | |||||||
Commitments and contingencies |
|||||||||
Stockholders' equity: |
|||||||||
Preferred stock, $0.10 par value per share, 50,000,000 shares authorized; no shares issued in 2009 and 2008 |
— | — | |||||||
Common stock, $0.10 par value per share, 400,000,000 shares authorized; shares issued: 168,749,681 in 2009 and 168,111,815 in 2008; shares outstanding; 158,938,174 in 2009 and 157,882,527 in 2008 |
16.9 | 16.8 | |||||||
Common stock reserved for issuance related to Settlement agreement, $0.10 par value per share, 18,000,000 shares in 2009 and 2008 |
1.8 | 1.8 | |||||||
Additional paid-in capital |
1,127.1 | 1,102.5 | |||||||
Retained earnings |
1,531.1 | 1,364.3 | |||||||
Common stock in treasury, 9,811,507 shares in 2009 and 10,229,288 shares in 2008 |
(364.6 | ) | (383.2 | ) | |||||
Accumulated other comprehensive loss, net of taxes: |
|||||||||
Unrecognized pension items |
(70.4 | ) | (60.2 | ) | |||||
Cumulative translation adjustment |
(50.8 | ) | (122.4 | ) | |||||
Unrealized gain on derivative instruments |
4.1 | 5.0 | |||||||
Unrealized gain on available-for-sale securities |
4.4 | — | |||||||
Total accumulated other comprehensive loss, net of taxes |
(112.7 | ) | (177.6 | ) | |||||
Total parent company stockholders' equity |
2,199.6 | 1,924.6 | |||||||
Noncontrolling interests |
0.7 | 1.0 | |||||||
Total stockholders' equity |
2,200.3 | 1,925.6 | |||||||
Total liabilities and stockholders' equity |
$ | 5,420.1 | $ | 4,986.0 | |||||
See accompanying notes to consolidated financial statements.
59
SEALED AIR CORPORATION AND SUBSIDIARIES
Consolidated Statements of Operations
(in millions, except per share amounts)
| |
Year Ended December 31, | |||||||||||
|---|---|---|---|---|---|---|---|---|---|---|---|---|
| |
2009 | 2008 | 2007 | |||||||||
Net sales: |
||||||||||||
Food Packaging |
$ | 1,839.8 | $ | 1,969.4 | $ | 1,882.9 | ||||||
Food Solutions |
891.7 | 988.3 | 944.7 | |||||||||
Protective Packaging |
1,192.9 | 1,480.3 | 1,506.9 | |||||||||
Other |
318.4 | 405.5 | 316.7 | |||||||||
Total net sales |
4,242.8 | 4,843.5 | 4,651.2 | |||||||||
Cost of sales |
3,024.3 | 3,606.9 | 3,350.1 | |||||||||
Gross profit |
1,218.5 | 1,236.6 | 1,301.1 | |||||||||
Marketing, administrative and development expenses |
719.2 | 755.0 | 750.2 | |||||||||
Restructuring and other charges |
7.0 | 85.1 | 1.6 | |||||||||
Operating profit |
492.3 | 396.5 | 549.3 | |||||||||
Interest expense |
(154.9 | ) | (128.1 | ) | (140.6 | ) | ||||||
Loss on debt redemption |
(3.4 | ) | — | — | ||||||||
Impairment of available-for-sale securities |
(4.0 | ) | (34.0 | ) | — | |||||||
Other (expense) income, net |
(0.1 | ) | (12.1 | ) | 12.0 | |||||||
Gain on sale of equity method investment |
— | — | 35.3 | |||||||||
Earnings before income tax provision |
329.9 | 222.3 | 456.0 | |||||||||
Income tax provision |
85.6 | 42.4 | 103.0 | |||||||||
Net earnings available to common stockholders |
$ | 244.3 | $ | 179.9 | $ | 353.0 | ||||||
Net earnings per common share: |
||||||||||||
Basic |
$ | 1.54 | $ | 1.13 | $ | 2.19 | ||||||
Diluted |
$ | 1.35 | $ | 0.99 | $ | 1.88 | ||||||
Dividends per common share |
$ | 0.48 | $ | 0.48 | $ | 0.40 | ||||||
Weighted average number of common shares outstanding: |
||||||||||||
Basic |
157.2 | 157.6 | 160.0 | |||||||||
Diluted |
182.6 | 188.6 | 190.6 | |||||||||
See accompanying notes to consolidated financial statements.
60
SEALED AIR CORPORATION AND SUBSIDIARIES
Consolidated Statements of Stockholders' Equity
(in millions)
| |
Common Stock |
Common Stock Reserved for Issuance Related to the Settlement agreement |
Additional Paid-in Capital |
Retained Earnings |
Accumulated Other Comprehensive Loss |
Treasury Common Stock |
Total parent company stockholders' equity |
Non- controlling Interests |
Total | |||||||||||||||||||
|---|---|---|---|---|---|---|---|---|---|---|---|---|---|---|---|---|---|---|---|---|---|---|---|---|---|---|---|---|
Balance at January 1, 2007 |
$ | 8.6 | $ | 0.9 | $ | 1,075.9 | $ | 972.4 | $ | (124.8 | ) | $ | (278.2 | ) | $ | 1,654.8 | $ | 5.9 | $ | 1,660.7 | ||||||||
Additional shares available due to two-for-one common stock split |
8.1 | 0.9 | (9.0 | ) | — | — | — | — | — | — | ||||||||||||||||||
Effect of contingent stock transactions, net |
0.1 | — | 17.0 | — | — | (1.9 | ) | 15.2 | — | 15.2 | ||||||||||||||||||
Stock issued for share-based compensation |
— | — | 1.5 | — | — | — | 1.5 | — | 1.5 | |||||||||||||||||||
Exercise of stock options |
— | — | 0.7 | — | — | — | 0.7 | — | 0.7 | |||||||||||||||||||
Purchase of common stock |
— | — | — | — | — | (6.8 | ) | (6.8 | ) | — | (6.8 | ) | ||||||||||||||||
Recognition of deferred pension items, net of taxes |
— | — | — | — | 2.0 | — | 2.0 | — | 2.0 | |||||||||||||||||||
Foreign currency translation |
— | — | — | — | 66.7 | — | 66.7 | — | 66.7 | |||||||||||||||||||
Unrecognized loss on derivative instruments, net of taxes |
— | — | — | — | (0.5 | ) | — | (0.5 | ) | — | (0.5 | ) | ||||||||||||||||
Unrecognized losses on available-for-sale securities, net of taxes |
— | — | — | — | (2.4 | ) | — | (2.4 | ) | — | (2.4 | ) | ||||||||||||||||
Noncontrolling interests |
— | — | — | — | — | — | — | (0.1 | ) | (0.1 | ) | |||||||||||||||||
Net earnings |
— | — | — | 353.0 | — | — | 353.0 | — | 353.0 | |||||||||||||||||||
Dividends on common stock |
— | — | — | (64.6 | ) | — | — | (64.6 | ) | — | (64.6 | ) | ||||||||||||||||
Balance at December 31, 2007 |
$ | 16.8 | $ | 1.8 | $ | 1,086.1 | $ | 1,260.8 | $ | (59.0 | ) | $ | (286.9 | ) | $ | 2,019.6 | $ | 5.8 | $ | 2,025.4 | ||||||||
Effect of contingent stock transactions, net |
— | — | 16.1 | — | — | (1.2 | ) | 14.9 | — | 14.9 | ||||||||||||||||||
Stock issued for share-based compensation |
— | — | 0.3 | — | — | — | 0.3 | — | 0.3 | |||||||||||||||||||
Purchases of common stock |
— | — | — | — | — | (95.1 | ) | (95.1 | ) | — | (95.1 | ) | ||||||||||||||||
Recognition of deferred pension items, net of taxes |
— | — | — | — | (2.0 | ) | — | (2.0 | ) | — | (2.0 | ) | ||||||||||||||||
Foreign currency translation |
— | — | — | — | (118.4 | ) | — | (118.4 | ) | — | (118.4 | ) | ||||||||||||||||
Unrecognized loss on derivative instruments, net of taxes |
— | — | — | — | (0.6 | ) | — | (0.6 | ) | — | (0.6 | ) | ||||||||||||||||
Unrecognized losses on available-for-sale securities, net of taxes, reclassified to net earnings |
— | — | — | — | 2.4 | — | 2.4 | — | 2.4 | |||||||||||||||||||
Noncontrolling interests |
— | — | — | — | — | — | — | (4.8 | ) | (4.8 | ) | |||||||||||||||||
Net earnings |
— | — | — | 179.9 | — | — | 179.9 | — | 179.9 | |||||||||||||||||||
Dividends on common stock |
— | — | — | (76.4 | ) | — | — | (76.4 | ) | — | (76.4 | ) | ||||||||||||||||
Balance at December 31, 2008 |
$ | 16.8 | $ | 1.8 | $ | 1,102.5 | $ | 1,364.3 | $ | (177.6 | ) | $ | (383.2 | ) | $ | 1,924.6 | $ | 1.0 | $ | 1,925.6 | ||||||||
Effect of contingent stock transactions, net |
0.1 | — | 38.3 | — | — | (1.4 | ) | 37.0 | — | 37.0 | ||||||||||||||||||
Stock issued for share-based compensation |
— | — | (13.7 | ) | — | — | 20.0 | 6.3 | — | 6.3 | ||||||||||||||||||
Recognition of deferred pension items, net of taxes |
— | — | — | — | (10.2 | ) | — | (10.2 | ) | — | (10.2 | ) | ||||||||||||||||
Foreign currency translation |
— | — | — | — | 71.6 | — | 71.6 | — | 71.6 | |||||||||||||||||||
Unrecognized loss on derivative instruments, net of taxes |
— | — | — | — | (0.9 | ) | — | (0.9 | ) | — | (0.9 | ) | ||||||||||||||||
Unrecognized gains on available-for-sale securities, net of taxes |
— | — | — | — | 4.4 | — | 4.4 | — | 4.4 | |||||||||||||||||||
Noncontrolling interests |
— | — | — | — | — | — | — | (0.3 | ) | (0.3 | ) | |||||||||||||||||
Net earnings |
— | — | — | 244.3 | — | — | 244.3 | — | 244.3 | |||||||||||||||||||
Dividends on common stock |
— | — | — | (77.5 | ) | — | — | (77.5 | ) | — | (77.5 | ) | ||||||||||||||||
Balance at December 31, 2009 |
$ | 16.9 | $ | 1.8 | $ | 1,127.1 | $ | 1,531.1 | $ | (112.7 | ) | $ | (364.6 | ) | $ | 2,199.6 | $ | 0.7 | $ | 2,200.3 | ||||||||
See accompanying notes to consolidated financial statements.
61
SEALED AIR CORPORATION AND SUBSIDIARIES
Consolidated Statements of Cash Flows
(in millions)
| |
Year Ended December 31, | ||||||||||
|---|---|---|---|---|---|---|---|---|---|---|---|
| |
2009 | 2008 | 2007 | ||||||||
Cash flows from operating activities: |
|||||||||||
Net earnings available to common stockholders |
$ | 244.3 | $ | 179.9 | $ | 353.0 | |||||
Adjustments to reconcile net earnings to net cash provided by operating activities: |
|||||||||||
Depreciation and amortization |
154.5 | 155.0 | 150.4 | ||||||||
Share-based compensation |
38.8 | 16.5 | 15.9 | ||||||||
Amortization of senior debt related items and other |
1.0 | 1.6 | 2.5 | ||||||||
Impairment of available-for-sale securities |
4.0 | 34.0 | — | ||||||||
Provisions for bad debt |
6.8 | 9.0 | 2.8 | ||||||||
Provisions for inventory obsolescence |
6.6 | 7.5 | 6.9 | ||||||||
Deferred taxes, net |
(16.6 | ) | (39.5 | ) | (28.5 | ) | |||||
Loss on debt redemption |
3.4 | — | — | ||||||||
Gain on sale of equity method investment |
— | — | (35.3 | ) | |||||||
Net loss on sales of small product lines |
0.2 | — | 6.8 | ||||||||
Net (gain) loss on disposals of property and equipment and other |
(3.0 | ) | (0.6 | ) | 0.1 | ||||||
Changes in operating assets and liabilities, net of effects of businesses and certain assets acquired: |
|||||||||||
Receivables, net |
115.2 | (40.3 | ) | (23.7 | ) | ||||||
Accounts receivable securitization program |
(80.0 | ) | 80.0 | — | |||||||
Inventories |
109.7 | (31.1 | ) | (56.2 | ) | ||||||
Other current assets |
16.2 | (40.0 | ) | (0.9 | ) | ||||||
Other assets, net |
(6.6 | ) | (13.0 | ) | (0.2 | ) | |||||
Accounts payable |
(68.4 | ) | (28.8 | ) | 16.8 | ||||||
Other current liabilities |
23.9 | 92.8 | (21.1 | ) | |||||||
Other liabilities |
2.0 | 21.4 | (11.2 | ) | |||||||
Net cash provided by operating activities |
552.0 | 404.4 | 378.1 | ||||||||
Cash flows from investing activities: |
|||||||||||
Capital expenditures for property and equipment |
(80.3 | ) | (180.7 | ) | (210.8 | ) | |||||
Proceeds from sales of property and equipment |
7.2 | 3.9 | 1.9 | ||||||||
Other investing activities |
2.8 | 3.0 | (14.2 | ) | |||||||
Purchases of available-for-sale securities |
— | — | (388.3 | ) | |||||||
Sales of available-for-sale securities |
— | — | 377.5 | ||||||||
Businesses acquired in purchase transactions, net of cash and cash equivalents acquired |
— | (2.9 | ) | (32.9 | ) | ||||||
Acquisition of certain assets |
— | — | (43.3 | ) | |||||||
Proceeds from sale of equity method investment |
— | — | 36.0 | ||||||||
Net cash used in investing activities |
(70.3 | ) | (176.7 | ) | (274.1 | ) | |||||
Cash flows from financing activities: |
|||||||||||
Proceeds from long-term debt |
766.6 | — | 1.4 | ||||||||
Payments of long-term debt |
(585.3 | ) | (395.7 | ) | (5.8 | ) | |||||
Net (payments of) proceeds from short-term borrowings |
(8.3 | ) | 5.2 | 15.8 | |||||||
Dividends paid on common stock |
(75.7 | ) | (76.4 | ) | (64.6 | ) | |||||
Proceeds from common stock option exercises |
— | — | 0.7 | ||||||||
Repurchases of common stock |
— | (95.1 | ) | (6.8 | ) | ||||||
Payments of debt issuance costs |
(7.0 | ) | (0.9 | ) | (0.2 | ) | |||||
Net cash provided by (used in) financing activities |
90.3 | (562.9 | ) | (59.5 | ) | ||||||
Effect of foreign currency exchange rate changes on cash and cash equivalents |
(6.4 | ) | 33.8 | 12.7 | |||||||
Cash and cash equivalents: |
|||||||||||
Balance, beginning of period |
$ | 128.9 | $ | 430.3 | $ | 373.1 | |||||
Net change during the period |
565.6 | (301.4 | ) | 57.2 | |||||||
Balance, end of period |
$ | 694.5 | $ | 128.9 | $ | 430.3 | |||||
Supplemental Cash Flow Information: |
|||||||||||
Interest payments, net of amounts capitalized |
$ | 100.9 | $ | 95.1 | $ | 100.6 | |||||
Income tax payments |
$ | 114.3 | $ | 90.7 | $ | 201.8 | |||||
Non-cash items: |
|||||||||||
Unrealized gains (losses) on available-for-sale securities |
$ | 7.0 | $ | 3.9 | $ | (3.9 | ) | ||||
Issuance of shares of our common stock as part of our 2008 employee profit sharing contribution |
$ | 5.9 | $ | — | $ | — | |||||
See accompanying notes to consolidated financial statements.
62
SEALED AIR CORPORATION AND SUBSIDIARIES
Consolidated Statements of Comprehensive Income
(in millions)
| |
Year Ended December 31, | |||||||||
|---|---|---|---|---|---|---|---|---|---|---|
| |
2009 | 2008 | 2007 | |||||||
Net earnings available to common stockholders |
$ | 244.3 | $ | 179.9 | $ | 353.0 | ||||
Other comprehensive income (loss), net of income taxes: |
||||||||||
Recognition of deferred pension items, net of income tax benefit (provision) of $3.6 in 2009, $9.3 in 2008 and $(2.4) in 2007 |
(10.2 | ) | (2.0 | ) | 2.0 | |||||
Unrealized losses on derivative instruments, net of income tax benefit of $0.5 in 2009 and 2008, and $0.4 in 2007 |
(0.9 | ) | (0.6 | ) | (0.5 | ) | ||||
Unrealized gains (losses) on available-for-sale securities, reclassified to net earnings in 2008, net of income tax (provision) benefit of $(2.6) in 2009, $(1.5) in 2008 and $1.5 in 2007 |
4.4 | 2.4 | (2.4 | ) | ||||||
Foreign currency translation adjustments |
71.6 | (118.4 | ) | 66.7 | ||||||
Comprehensive income, net of income taxes |
$ | 309.2 | $ | 61.3 | $ | 418.8 | ||||
See accompanying notes to consolidated financial statements.
63
SEALED AIR CORPORATION AND SUBSIDIARIES
Notes to Consolidated Financial Statements
(Amounts in tables in millions, except share and per share data)
Note 1 Organization and Nature of Operations
We are a leading global innovator and manufacturer of a wide range of packaging and performance-based materials and equipment systems that serve an array of food, industrial, medical and consumer applications.
We conduct substantially all of our business through two direct wholly-owned subsidiaries, Cryovac, Inc. and Sealed Air Corporation (US). These two subsidiaries, directly and indirectly, own substantially all of the assets of the business and conduct operations themselves and through subsidiaries around the world. We adopted this corporate structure in connection with the Cryovac transaction. See "Cryovac Transaction Commitments and Contingencies," of Note 16, "Commitments and Contingencies," for a description of the Cryovac transaction and related terms used in these Notes to Consolidated Financial Statements.
Note 2 Summary of Significant Accounting Policies and Recently Issued Accounting Standards
Summary of Significant Accounting Policies
Basis of Presentation
Our consolidated financial statements include all of the accounts of the Company and our subsidiaries. We have eliminated all significant intercompany transactions and balances in consolidation. All amounts are approximate due to rounding. Some prior period amounts have been reclassified to conform to the current year presentation. These reclassifications, individually and in the aggregate, had no impact on our consolidated financial position, results of operations and cash flows.
We have evaluated subsequent events for recognition or disclosure in these consolidated financial statements through the date these financial statements were issued.
Use of Estimates
The preparation of our consolidated financial statements and related disclosures in conformity with accounting principles generally accepted in the United States of America, or U.S. GAAP, requires our management to make estimates and assumptions that affect the reported amounts of assets and liabilities, the disclosure of contingent assets and liabilities at the date of the financial statements and revenue and expenses during the period reported. These estimates include, among other items, assessing the collectibility of receivables, the use and recoverability of inventory, the estimation of fair value of financial instruments, assumptions used in the calculation of income taxes, useful lives and recoverability of tangible and intangible assets, assumptions used in our defined benefit pension plans, estimates related to self-insurance such as the aggregate liability for uninsured claims using historical experience, insurance and actuarial estimates and estimated trends in claim values and accruals for commitments and contingencies. We review these estimates and assumptions periodically and reflect the effects of revisions in the consolidated financial statements in the period we determine any revisions to be necessary. Actual results could differ from these estimates.
Financial Instruments
We may use financial instruments, such as cross currency swaps, interest rate swaps, caps and collars, U.S. Treasury lock agreements and foreign currency exchange forward contracts and options relating to our borrowing and trade activities. We may use these financial instruments from time to time to manage our exposure to fluctuations in interest rates and foreign currency exchange rates. We do not purchase, hold or sell derivative financial instruments for trading purposes. We face credit risk if the counterparties to these transactions are unable to perform their obligations. Our policy is to have counterparties to these contracts that are rated at least A- by Standard & Poor's and A3 by Moody's.
We report all derivative instruments on our consolidated balance sheets in accordance with current accounting guidance for derivative instruments and hedging activities. We report derivative instruments at
64
SEALED AIR CORPORATION AND SUBSIDIARIES
Notes to Consolidated Financial Statements (Continued)
(Amounts in tables in millions, except share and per share data)
Note 2 Summary of Significant Accounting Policies and Recently Issued Accounting Standards (Continued)
fair value and establish criteria for designation and effectiveness of transactions entered into for hedging purposes. Before entering into any derivative transaction, we identify our specific financial risk, the appropriate hedging instrument to use to reduce this risk, and the correlation between the financial risk and the hedging instrument. We use purchase orders and historical data as the basis for determining the anticipated values of the transactions to be hedged. We do not enter into derivative transactions that do not have a high correlation with the underlying financial risk we are trying to reduce. We regularly review our hedge positions and the correlation between the transaction risks and the hedging instruments.
We account for derivative instruments as hedges of the related underlying risks if we designate these derivative instruments as hedges and the derivative instruments are effective as hedges of recognized assets or liabilities, forecasted transactions, unrecognized firm commitments or forecasted intercompany transactions.
We record gains and losses on derivatives qualifying as cash flow hedges in other comprehensive income, to the extent that hedges are effective and until the underlying transactions are recognized in the consolidated statements of operations, at which time we recognize the gains and losses in the consolidated statements of operations. We recognize gains and losses on qualifying fair value hedges and the related loss or gain on the hedged item attributable to the hedged risk in the consolidated statements of operations.
Our practice is to terminate derivative transactions if the underlying asset or liability matures or is sold or terminated, or if we determine the underlying forecasted transaction is no longer probable of occurring. Any deferred gains or losses associated with derivative instruments are recognized on the consolidated statements of operations over the period in which the income or expense on the underlying hedged transaction is recognized.
See Note 12, "Derivatives and Hedging Activities," for further details.
Fair Value Measurements
In determining fair value of financial instruments, we utilize valuation techniques that maximize the use of observable inputs and minimize the use of unobservable inputs to the extent possible and consider counterparty credit risk in our assessment of fair value. We determine fair value of our financial instruments based on assumptions that market participants would use in pricing an asset or liability in the principal or most advantageous market. When considering market participant assumptions in fair value measurements, the following fair value hierarchy distinguishes between observable and unobservable inputs, which are categorized in one of the following levels:
- •
- Level 1 Inputs: Unadjusted quoted prices in active markets for identical assets or liabilities accessible to the
reporting entity at the measurement date.
- •
- Level 2 Inputs: Other than quoted prices included in Level 1 inputs that are observable for the asset or
liability, either directly or indirectly, for substantially the full term of the asset or liability.
- •
- Level 3 Inputs: Unobservable inputs for the asset or liability used to measure fair value to the extent that observable inputs are not available, thereby allowing for situations in which there is little, if any, market activity for the asset or liability at measurement date.
Our fair value measurements for our financial instruments, such as our investments in auction rate securities, are subjective and involve uncertainties and matters of significant judgment. Changes in assumptions could significantly affect our estimates. See Note 13, "Fair Value Measurements and Other Financial Instruments," of Notes to Consolidated Financial Statement for further details on our fair value measurements.
65
SEALED AIR CORPORATION AND SUBSIDIARIES
Notes to Consolidated Financial Statements (Continued)
(Amounts in tables in millions, except share and per share data)
Note 2 Summary of Significant Accounting Policies and Recently Issued Accounting Standards (Continued)
Foreign Currency Translation
In non-U.S. locations that are not considered highly inflationary, we translate the balance sheets at the end of period exchange rates with translation adjustments accumulated in stockholders' equity on our consolidated balance sheets. We translate the statements of operations at the average exchange rates during the applicable period.
We translate assets and liabilities of our operations in countries with highly inflationary economies at the end of period exchange rates, except that specified financial statement amounts are translated at historical exchange rates. In countries with highly inflationary economies, we translate items reflected in statements of operations at average rates of exchange prevailing during the period, except that specified financial statement amounts are translated at historical exchange rates.
Effective January 1, 2010, Venezuela has been designated as a highly inflationary economy, and the U.S. dollar replaced the Bolivar fuerte as the functional currency for our subsidiary in Venezuela. Accordingly, all Bolivar-denominated monetary assets and liabilities will be re-measured into U.S. dollars using the current exchange rate, and any changes in foreign currency will be reflected in other (expense) income on the consolidated statement of operations. All-Bolivar denominated nonmonetary assets and liabilities are re-measured into U.S. dollars using the historical exchange rates.
The future impact to our consolidated financial position and results of operations will depend on the exchange rates in effect when we enter into, remeasure and settle Bolivar-denominated transactions. At December 31, 2009, the net assets and operating profit of our subsidiary in Venezuela were immaterial to our consolidated financial position and results of operations. Accordingly, we do not expect the devaluation of the Bolivar fuerte to have a material adverse effect on our consolidated financial position or results of operations.
Commitments and Contingencies—Litigation
On an ongoing basis, we assess the potential liabilities related to any lawsuits or claims brought against us. While it is typically very difficult to determine the timing and ultimate outcome of these actions, we use our best judgment to determine if it is probable that we will incur an expense related to the settlement or final adjudication of these matters and whether a reasonable estimation of the probable loss, if any, can be made. In assessing probable losses, we make estimates of the amount of insurance recoveries, if any. We accrue a liability when we believe a loss is probable and the amount of loss can be reasonably estimated. Due to the inherent uncertainties related to the eventual outcome of litigation and potential insurance recovery, it is possible that disputed matters may be resolved for amounts materially different from any provisions or disclosures that we have previously made. We expense legal costs, including those legal costs expected to be incurred in connection with a loss contingency, as incurred.
Revenue Recognition
Our revenue earning activities primarily involve manufacturing and selling products, and we consider revenues to be earned when we have completed the process by which we are entitled to receive consideration. The following criteria are used for revenue recognition: persuasive evidence that an arrangement exists, shipment has occurred, selling price is fixed or determinable, and collection is reasonably assured.
Sales taxes collected from customers and remitted to governmental authorities are accounted for on a net basis and therefore are excluded from net sales on the consolidated statements of operations.
66
SEALED AIR CORPORATION AND SUBSIDIARIES
Notes to Consolidated Financial Statements (Continued)
(Amounts in tables in millions, except share and per share data)
Note 2 Summary of Significant Accounting Policies and Recently Issued Accounting Standards (Continued)
Research and Development
We expense research and development costs as incurred. Research and development costs were $81.2 million in 2009, $85.6 million in 2008 and $90.8 million in 2007.
Share-Based Compensation
Our primary share-based employee compensation program is the 2005 Contingent Stock Plan. See Note 17, "Stockholders' Equity," for further information on these plans.
We record share-based payment awards exchanged for employee services at fair value on the date of grant and expense the awards in marketing, administrative and development expense on our consolidated statement of operations over the requisite employee service period. Share-based compensation expense includes an estimate for forfeitures and is generally recognized over the expected term of the award on a straight-line basis.
Environmental Expenditures
We expense or capitalize environmental expenditures that relate to ongoing business activities, as appropriate. We expense costs that relate to an existing condition caused by past operations and which do not contribute to current or future net sales. We record liabilities when we determine that environmental assessments or remediation expenditures are probable and that we can reasonably estimate the associated cost or a range of costs.
Income Taxes
We file a consolidated U.S. federal income tax return. Our non-U.S. subsidiaries file income tax returns in their respective local jurisdictions. We provide for income taxes on those portions of our foreign subsidiaries' accumulated earnings that we believe are not reinvested indefinitely in our businesses. It is not practicable to estimate the amount of tax that might be payable on the portion of those accumulated earnings that we believe are reinvested indefinitely.
We account for income taxes under the asset and liability method to provide for income taxes on all transactions recorded in the consolidated financial statements. We recognize deferred tax assets and liabilities for the future tax consequences attributable to differences between the financial statement carrying amounts of existing assets and liabilities and their respective tax bases and tax benefit carry forwards. We determine deferred tax assets and liabilities at the end of each period using enacted tax rates.
We recognize the tax benefit from an uncertain tax position only if it is more likely than not that the tax position will be sustained on examination by the taxing authorities, based on the technical merits of the position. The tax benefits recognized in the financial statements from such positions are measured based on the largest benefit that has a greater than fifty percent likelihood of being realized upon settlement with tax authorities. We recognize interest and penalties related to unrecognized tax benefits in income tax expense on our consolidated statements of operations.
See Note 15, "Income Taxes," for further discussion.
Cash and Cash Equivalents
We consider highly liquid investments with original maturities of three months or less at the date of purchase to be cash equivalents. Our policy is to invest cash in excess of short-term operating and debt service requirements in cash equivalents. Cash equivalents are stated at cost, which approximates fair value because of the short term maturity of the instruments. Our policy is to transact with counterparties that are rated at least A- by Standard & Poor's and A3 by Moody's. Some of our operations are located in
67
SEALED AIR CORPORATION AND SUBSIDIARIES
Notes to Consolidated Financial Statements (Continued)
(Amounts in tables in millions, except share and per share data)
Note 2 Summary of Significant Accounting Policies and Recently Issued Accounting Standards (Continued)
countries that are rated below A- or A3. In this case, we try to minimize our risk by holding cash and cash equivalents at financial institutions with which we have existing global relationships whenever possible, diversifying counterparty exposures and minimizing the amount held by each counterparty and within the country in total.
Available-for-Sale Investments
We determine the classification of our investments at the time of purchase and reassess it as of each balance sheet date. Available-for-sale securities are marked-to-market based on quoted market values, when available, of the securities on a security-by-security basis, with the unrealized gains or losses, if any, reported as a component of other comprehensive income, net of tax, until realized. When quoted market values are not available, we determine the fair value using other observable or unobservable inputs. We recognize realized gains and losses on the sales of the securities on a security-by-security basis and include the realized gains or losses in other income, net, in the consolidated statements of operations. We determine whether a decline in fair value below its cost is temporary or other than temporary. The objective of other than temporary impairment analysis under U.S. GAAP is to determine whether the holder of an investment in a debt or equity security for which changes in fair value should recognize a loss in earnings when the investment is impaired. An investment is impaired if the fair value of the investment is less than its amortized cost.
We include interest and dividends on securities classified as available-for-sale in other (expense) income, net, in the consolidated statements of operations. See Note 5, "Available-for-Sale Investments," for further discussion of our auction rate securities investments and "Fair Value Measurements" above for additional information on our fair value measurements.
Accounts Receivable Securitization
Our two primary U.S. operating subsidiaries are party to an accounts receivable securitization program under which they sell eligible U.S. accounts receivable to an indirectly wholly-owned subsidiary that was formed for the sole purpose of entering into this program. The wholly-owned subsidiary in turn may sell an undivided ownership interest in these receivables to a participating bank or an issuer of commercial paper administered by the participating bank. The wholly-owned subsidiary retains the receivables it purchases from the two operating subsidiaries, except those as to which it sells ownership interests to the participating bank or to the issuer of commercial paper. Before January 1, 2010, if the wholly-owned subsidiary sold undivided ownership interests in receivables, we removed the transferred ownership interest amounts from our balance sheet at the time of the sale and reflected the proceeds from the sale in cash provided by operating activities in the consolidated statements of cash flows.
We reflected retained receivables in receivables, net, on our consolidated balance sheets, and the carrying amounts approximated fair value because of the relatively short-term nature of the receivables. We reflected costs associated with the sale of receivables in other (expense) income, net, in the consolidated statements of operations.
See Recently Issued Accounting Standards below for information regarding new accounting standards that will impact our accounting for this program effective January 1, 2010.
Receivables, Net
In the normal course of business, we extend credit to customers that satisfy pre-defined credit criteria. Accounts receivable, which are included in receivables, net, on the consolidated balance sheets, are net of allowances for doubtful accounts. We maintain accounts receivable allowances for estimated losses resulting
68
SEALED AIR CORPORATION AND SUBSIDIARIES
Notes to Consolidated Financial Statements (Continued)
(Amounts in tables in millions, except share and per share data)
Note 2 Summary of Significant Accounting Policies and Recently Issued Accounting Standards (Continued)
from the failure of our customers to make required payments. An additional allowance may be required if the financial condition of our customers deteriorates.
Inventories
We determine the cost of most U.S. inventories on a last-in, first-out or LIFO cost flow basis. The cost of U.S. equipment inventories and most non-U.S. inventories is determined on a first-in, first-out or FIFO cost flow basis. We state inventories at the lower of cost or market. The sale of inventory and the related accounts receivable are classified as an operating activity in our consolidated statements of cash flows.
Property and Equipment, Net
We state property and equipment at cost, except for property and equipment that have been impaired, for which we reduce the carrying amount to the estimated fair value at the impairment date. We capitalize significant improvements, and charge repairs and maintenance costs that do not extend the lives of the assets to expense as incurred. We remove the cost and accumulated depreciation of assets sold or otherwise disposed of from the accounts and recognize any resulting gain or loss upon the disposition of the assets.
We depreciate the cost of property and equipment over its estimated useful life on a straight-line basis as follows: buildings—20 to 40 years; machinery and equipment—5 to 10 years; and other property and equipment—3 to 10 years.
Goodwill and Identifiable Intangible Assets
Goodwill represents the excess of consideration transferred, the fair value of any noncontrolling interest in the acquiree and, if the business combination is achieved in stages, the acquisition-date fair value of our previously held equity interest in the acquiree over the identifiable assets of the acquiree acquired less the liabilities assumed.
We reflect identifiable intangible assets in other assets, net, on our consolidated balance sheets. These assets consist primarily of patents, licenses, trademarks, customer lists and relationships and non-compete agreements. We amortize identifiable intangible assets over the shorter of their stated or statutory duration or their estimated useful lives, generally ranging from 3 to 15 years, on a straight-line basis to their estimated residual values and periodically review them for impairment. Total identifiable intangible assets comprise less than 5% of our consolidated total assets.
We use the acquisition method of accounting for all business combinations and do not amortize goodwill and intangible assets with indefinite useful lives. Intangible assets with indefinite useful lives are tested for possible impairment annually during the fourth quarter of each fiscal year or more frequently if events or changes in circumstances indicate that the asset might be impaired.
Goodwill is reviewed for possible impairment at least annually at a reporting unit level during the fourth quarter of each year. A review of goodwill may be initiated before or after conducting the annual analysis if events or changes in circumstances indicate that the carrying value of goodwill may be no longer recoverable.
A reporting unit is the operating segment unless, at businesses one level below that operating segment—the "component" level—discrete financial information is prepared and regularly reviewed by management, and the component has economic characteristics that are different from the economic characteristics of the other components of the operating segment, in which case the component is the reporting unit.
We use a fair value approach to test goodwill for impairment. We must recognize a non-cash impairment charge for the amount, if any, by which the carrying amount of goodwill exceeds its implied fair value. We derive an estimate of fair values for each of our reporting units using a combination of an income approach and two market approaches, each based on an applicable weighting. We assess the applicable
69
SEALED AIR CORPORATION AND SUBSIDIARIES
Notes to Consolidated Financial Statements (Continued)
(Amounts in tables in millions, except share and per share data)
Note 2 Summary of Significant Accounting Policies and Recently Issued Accounting Standards (Continued)
weighting based on such factors as current market conditions and the quality and reliability of the data. Absent an indication of fair value from a potential buyer or similar specific transactions, we believe that the use of these methods provides a reasonable estimate of a reporting unit's fair value. Fair value computed by these methods is arrived at using a number of factors, including projected future operating results, anticipated future cash flows, effective income tax rates, comparable marketplace data within a consistent industry grouping, and the cost of capital. There are inherent uncertainties, however, related to these factors and to our judgment in applying them to this analysis. Nonetheless, we believe that the combination of these methods provides a reasonable approach to estimate the fair value of our reporting units. Assumptions for sales, net earnings and cash flows for each reporting unit were consistent among these methods.
Income Approach Used to Determine Fair Values
The income approach is based upon the present value of expected cash flows. Expected cash flows are converted to present value using factors that consider the timing and risk of the future cash flows. The estimate of cash flows used is prepared on an unleveraged debt-free basis. We use a discount rate that reflects a market-derived weighted average cost of capital. We believe that this approach is appropriate because it provides a fair value estimate based upon the reporting unit's expected long-term operating and cash flow performance. The projections are based upon our best estimates of projected economic and market conditions over the related period including growth rates, estimates of future expected changes in operating margins and cash expenditures. Other significant estimates and assumptions include terminal value long-term growth rates, provision for income taxes, future capital expenditures and changes in future cashless, debt-free working capital.
Market Approaches Used to Determine Fair Values
We use two market approaches. The first market approach estimates the fair value of the reporting unit by applying multiples of operating performance measures to the reporting unit's operating performance. These multiples are derived from comparable publicly-traded companies with similar investment characteristics to the reporting unit. We believe that this approach is appropriate because it provides a fair value estimate using multiples from entities with operations and economic characteristics comparable to our reporting units and the Company. The second market approach is based on the publicly traded common stock of the Company and the estimate of fair value of the reporting unit is based on the applicable multiples of the Company. The key estimates and assumptions that are used to determine fair value under the two market approaches include trailing and future 12-month operating performance results and the selection of the relevant multiple to be applied. Under both market approaches, a control premium, or an amount that a buyer is usually willing to pay over the current market price of a publicly traded company, is applied to the calculated equity values to adjust the public trading value upward for a 100% ownership interest, where applicable.
See Note 9, "Goodwill and Identifiable Intangible Assets," for further discussion of our goodwill.
Long-Lived Assets
Impairment and Disposal of Long-Lived Assets
We periodically review long-lived assets other than goodwill for impairment whenever there is evidence that events or changes in circumstances indicate that the carrying amount of an asset or asset group may not be recoverable. We recognize impairments when the expected future undiscounted cash flows derived from long-lived assets are less than their carrying value. For these cases, we recognize losses in an amount equal to the difference between the fair value and the carrying amount. We record assets to be disposed of by sale or abandonment, where management has the current ability to remove these assets from operations, at the lower of carrying amount or fair value less cost of disposition. We suspend depreciation for these assets
70
SEALED AIR CORPORATION AND SUBSIDIARIES
Notes to Consolidated Financial Statements (Continued)
(Amounts in tables in millions, except share and per share data)
Note 2 Summary of Significant Accounting Policies and Recently Issued Accounting Standards (Continued)
during the disposal period, which is generally less than one year. Assumptions and estimates used in the determination of impairment losses, such as future cash flows, which are based on operational performances, market conditions and other factors and disposition costs, may affect the carrying value of long-lived assets and possible impairment expense in our consolidated financial statements.
Conditional Asset Retirement Obligations
We recognize a liability for a conditional asset retirement obligation when incurred if the liability can be reasonably estimated. A conditional asset retirement obligation is a legal obligation to perform an asset retirement activity in which the timing and/or method of settlement are conditional on a future event that may or may not be within our control. In addition, we would record a corresponding amount by increasing the carrying amount of the related long-lived asset, which is depreciated over the useful life of such long-lived asset.
Self-Insurance
We retain the obligation for specified claims and losses related to property, casualty, workers' compensation and employee benefit claims. We accrue for outstanding reported claims and claims that have been incurred but not reported based upon management's estimates of the aggregate liability for retained losses using historical experience, insurance company estimates and the estimated trends in claim values. Our estimates include management's and independent insurance companies' assumptions regarding economic conditions, the frequency and severity of claims and claim development patterns and settlement practices. These estimates and assumptions are monitored and evaluated on a periodic basis by management and are adjusted when warranted by changing circumstances. Although management believes it has the ability to adequately project and record estimated claim payments, actual results could differ significantly from the recorded liabilities.
Pensions
We maintain a non-contributory profit sharing plan and a contributory thrift and retirement savings plan in which most U.S. employees are eligible to participate. For a limited number of our U.S. employees and for some of our international employees, we maintain defined benefit pension plans. We are required to make assumptions regarding the valuation of projected benefit obligations and the performance of plan assets for our defined benefit pension plans.
We review and approve the assumptions made by our actuaries regarding the valuation of benefit obligations and performance of plan assets. The principal assumptions concern the discount rate used to measure future obligations, the expected future rate of return on plan assets, the expected rate of future compensation increases and various other actuarial assumptions. The measurement date used to determine benefit obligations and plan assets is December 31. In general, significant changes to these assumptions could have a material impact on the costs and liabilities recorded in our consolidated financial statements.
Net Earnings per Common Share
Basic earnings per common share is calculated by dividing net earnings available to common stockholders by the weighted average number of common shares outstanding for the period. Net earnings available to common stockholders are adjusted to reflect the reduction to interest expense, net of income taxes, that would occur as a result of the assumed conversion of the 3% Convertible Senior Notes for periods prior to the redemption of these notes in July 2009. On January 1, 2009, we adopted a new accounting standard requiring non-vested share-based payment awards that contain non-forfeitable rights to dividends to be treated as participating securities and therefore included in computing earnings per common share using the two-class method. The two-class method is an earnings allocation formula that calculates
71
SEALED AIR CORPORATION AND SUBSIDIARIES
Notes to Consolidated Financial Statements (Continued)
(Amounts in tables in millions, except share and per share data)
Note 2 Summary of Significant Accounting Policies and Recently Issued Accounting Standards (Continued)
basic and diluted net earnings per common share for each class of common stock separately based on dividends declared and participation rights in undistributed earnings. The non-vested restricted stock issued under our 2005 Contingent Stock Plan are considered participating securities since these securities have non-forfeitable rights to dividends when we declare a dividend during the contractual vesting period of the share-based payment award.
When calculating diluted net earnings per common share, the more dilutive effect of applying either of the following is presented: (a) the two-class method assuming that the participating security is not exercised or converted, or, (b) the treasury stock method for the participating security. Our diluted net earnings per common share for all periods presented were calculated using the two-class method since such method was more dilutive.
Our calculations of basic and diluted net earnings per common share for 2008 and 2007 have been adjusted to reflect this change and this change did not have a material impact.
See Note 18, "Net Earnings Per Common Share," for further discussion.
Recently Issued Accounting Standards
Adopted in 2009
In June 2009, the Financial Accounting Standards Board ("FASB") established the FASB Accounting Standards Codification™ as the single source of authoritative U.S. GAAP. While this codification does not change U.S. GAAP, it changes the way we refer to U.S. GAAP in our consolidated financial statements and notes. Our adoption of this guidance did not have any impact on our consolidated financial position or results of operations. Unless necessary to clarify a point to readers, we will refrain from citing specific topic and section references when discussing application of U.S. GAAP or addressing new or pending accounting standard changes.
In May 2009, the FASB issued new accounting standards that establish general standards of accounting for and disclosure of events that occur after the balance sheet date but before the date the financial statements are issued or available to be issued. This accounting standard requires companies to reflect in their financial statements the effects of subsequent events that provide additional evidence about conditions at the balance sheet date. Subsequent events that provide evidence about conditions that arose after the balance sheet date should be disclosed if the financial statements would otherwise be misleading. Disclosures should include the nature of the event and either an estimate of its financial effect or a statement that an estimate cannot be made. We adopted this accounting standard on June 30, 2009.
In April 2009, the FASB issued new accounting standards that provide additional application guidance and enhance disclosure requirements regarding fair value measurements and impairments of securities. We adopted the provisions of these accounting standards as of June 30, 2009. We concluded that the adoption of these accounting standards did not have an impact on our consolidated financial position or results of operations or specifically on our determination of the fair value of our investments in auction rate securities since it has always been and we expect it will continue to be our intent to sell all of our auction rate security investments. See Note 5, "Available-for-Sale Investments," and Note 13, "Fair Value Measurements and Other Financial Instruments," for additional disclosures about the fair value of our financial instruments.
Also in April 2009, the FASB amended and clarified application issues on initial recognition and measurement, subsequent measurement and accounting, and disclosure of assets and liabilities arising from contingencies in a business combination. It is effective for assets or liabilities arising from contingencies in any future business combinations we complete.
72
SEALED AIR CORPORATION AND SUBSIDIARIES
Notes to Consolidated Financial Statements (Continued)
(Amounts in tables in millions, except share and per share data)
Note 2 Summary of Significant Accounting Policies and Recently Issued Accounting Standards (Continued)
In December 2008, the FASB issued new disclosure standards that provide guidance on an employer's disclosures about plan assets of a defined benefit pension plan or other postretirement plan, including disclosure of how investment allocation decisions are made, major categories of plan assets, inputs and valuation techniques used to measure the fair value of plan assets and concentrations of credit risk. The adoption of these new disclosure standards in 2009 did not impact our consolidated financial position or results of operations as they are disclosure-only in nature. See Note 14, "Profit Sharing, Retirement Savings Plans and Defined Benefit Pension Plans," for these new disclosures.
In June 2008, the FASB issued new accounting standards to address whether instruments granted in share-based payment transactions are participating securities before vesting and therefore need to be included in computing earnings per common share under the two-class method. We adopted the provisions of this accounting standard on January 1, 2009. Accordingly, all prior period net earnings per common share data presented have been adjusted to conform to the provisions of this accounting standard. The adoption of this accounting standard did not have a material effect on our previously reported net earnings per common share. See Note 18, "Net Earnings Per Common Share," for further information.
In April 2008, the FASB ratified an amendment to accounting standards addressing the factors that should be considered in developing renewal or extension assumptions used to determine the useful life of a recognized intangible asset. Beginning January 1, 2009, the requirement for determining useful lives must be applied prospectively to intangible assets acquired after January 1, 2009 and the disclosure requirements must be applied prospectively to all intangible assets recognized as of and after January 1, 2009. The impact of this accounting standard will be dependent on any intangible assets that we may acquire in the future.
In March 2008, the FASB ratified an amendment to accounting standards changing the disclosure requirements for derivative instruments and hedging activities. Entities are required to provide enhanced disclosures about (a) how and why an entity uses derivative instruments, (b) how derivative instruments and related hedged items are accounted for, and (c) how derivative instruments and related hedged items affect an entity's financial position, financial performance, and cash flows. We adopted the amended accounting standard on January 1, 2009. See Note 12, "Derivatives and Hedging Activities," for further information.
In February 2008, the FASB issued new accounting standards which delayed the effective date of a previously issued accounting standard for nonfinancial assets and nonfinancial liabilities, except for items that are recognized or disclosed at fair value in the financial statements on a recurring basis (at least annually). We adopted this accounting standard on January 1, 2009 for items within its scope. This accounting standard did not have an impact on our consolidated financial position or results of operations.
In December 2007, the FASB issued new accounting standards establishing principles and requirements for how an acquirer recognizes and measures in its financial statements the identifiable assets acquired, including goodwill, the liabilities assumed and any noncontrolling interest in the acquiree. This accounting standard also establishes disclosure requirements to enable users of the financial statements to evaluate the nature and financial effects of the business combination. This accounting standard was effective for business combinations for which the acquisition date is on or after January 1, 2009. Accordingly, all business combinations that we complete are accounted for under this new accounting standard.
In December 2007, the FASB ratified an amendment to accounting standards establishing accounting and reporting standards for ownership interests in subsidiaries held by parties other than the parent, the amount of consolidated net income attributable to the parent and to the noncontrolling interest, changes in a parent's ownership interest, and the valuation of retained noncontrolling equity investments when a subsidiary is deconsolidated. This accounting standard also establishes disclosure requirements that clearly identify and distinguish between the interests of the parent and the interests of the noncontrolling owners. We adopted this accounting standard on January 1, 2009 and reclassified our noncontrolling interests to stockholders' equity from total liabilities and presented total parent company stockholders' equity as a
73
SEALED AIR CORPORATION AND SUBSIDIARIES
Notes to Consolidated Financial Statements (Continued)
(Amounts in tables in millions, except share and per share data)
Note 2 Summary of Significant Accounting Policies and Recently Issued Accounting Standards (Continued)
separate line item in the consolidated balance sheet. This adoption did not have a material impact on our consolidated financial position or results of operations.
Pending Adoption
In September 2009, the FASB ratified an amendment to accounting standards addressing revenue recognition for arrangements with multiple revenue-generating activities. The amendment addresses how revenue should be allocated to separate elements which could impact the timing of revenue recognition. The amendment is effective on a prospective basis for revenue arrangements entered into or materially modified in fiscal years ending after June 30, 2010 and earlier application is permitted. We may elect, but are not required, to apply the standards retrospectively to all prior periods. We are currently evaluating the impact these standards may have on our consolidated financial position and results of operations.
In June 2009, the FASB issued new accounting standards relating to the transfer of financial assets. These standards require entities to provide more information regarding sales of securitized financial assets and similar transactions, particularly if the entity has continuing exposure to the risks related to transferred financial assets. They also eliminate the concept of a "qualifying special-purpose entity," change the requirements for derecognizing financial assets and require additional disclosures. These accounting standards are effective beginning January 1, 2010 and early application is prohibited. Based on our preliminary evaluation of these new standards, we believe that transfers of ownership interests of receivables under our receivables securitization program to the issuer of commercial paper or to the participating bank would no longer be considered a sale but would be considered a secured borrowing and recorded as a liability on our consolidated balance sheets.
Also, in June 2009, the FASB issued new accounting standards which change how a company determines when an entity that is insufficiently capitalized or is not controlled through voting (or similar rights) should be consolidated. The determination of whether a company is required to consolidate an entity is based on, among other things, an entity's purpose and design and a company's ability to direct the activities of the entity that most significantly impact the entity's economic performance. These standards are effective beginning January 1, 2010 and earlier application is prohibited. We are currently evaluating the impact these standards may have on our consolidated financial position and results of operations.
74
SEALED AIR CORPORATION AND SUBSIDIARIES
Notes to Consolidated Financial Statements (Continued)
(Amounts in tables in millions, except share and per share data)
Note 3 Segments
The following tables show net sales, depreciation and amortization, operating profit and assets by our segment reporting structure:
| |
2009 | 2008 | 2007 | ||||||||
|---|---|---|---|---|---|---|---|---|---|---|---|
Net sales |
|||||||||||
Food Packaging |
$ | 1,839.8 | $ | 1,969.4 | $ | 1,882.9 | |||||
Food Solutions |
891.7 | 988.3 | 944.7 | ||||||||
Protective Packaging |
1,192.9 | 1,480.3 | 1,506.9 | ||||||||
Other |
318.4 | 405.5 | 316.7 | ||||||||
Total |
$ | 4,242.8 | $ | 4,843.5 | $ | 4,651.2 | |||||
Depreciation and amortization(1) |
|||||||||||
Food Packaging |
$ | 69.2 | $ | 67.0 | $ | 70.2 | |||||
Food Solutions |
31.4 | 29.4 | 29.1 | ||||||||
Protective Packaging |
34.1 | 40.6 | 39.2 | ||||||||
Other |
19.8 | 18.0 | 11.9 | ||||||||
Total |
$ | 154.5 | $ | 155.0 | $ | 150.4 | |||||
Operating profit(2) |
|||||||||||
Food Packaging |
$ | 251.7 | $ | 217.5 | $ | 228.2 | |||||
Food Solutions |
85.7 | 80.0 | 86.1 | ||||||||
Protective Packaging |
150.0 | 169.1 | 208.6 | ||||||||
Other |
11.9 | 15.0 | 28.0 | ||||||||
Total segments and other |
499.3 | 481.6 | 550.9 | ||||||||
Restructuring and other charges(3) |
7.0 | 85.1 | 1.6 | ||||||||
Total |
$ | 492.3 | $ | 396.5 | $ | 549.3 | |||||
- (1)
- The
2008 and 2007 depreciation and amortization amounts have been adjusted to exclude share-based compensation expense to conform to the 2009 presentation.
Share-based compensation expense was $38.8 million in 2009, $16.5 million in 2008 and $15.9 million in 2007 and is included in marketing, administrative and development expenses
on our consolidated statement of operations for all periods.
- (2)
- Before
taking into consideration restructuring and other charges.
- (3)
- Restructuring and other charges by our segment reporting structure were as follows:
| |
2009 | 2008 | 2007 | |||||||
|---|---|---|---|---|---|---|---|---|---|---|
Food Packaging |
$ | 6.0 | $ | 46.2 | $ | 0.5 | ||||
Food Solutions |
1.0 | 15.1 | 0.1 | |||||||
Protective Packaging |
(0.1 | ) | 18.8 | 1.0 | ||||||
Other |
0.1 | 5.0 | — | |||||||
Total |
$ | 7.0 | $ | 85.1 | $ | 1.6 | ||||
See Note 4, "Global Manufacturing Strategy and 2008 Cost Reduction and Productivity Program," for further discussion.
Assets by Reportable Segments
The following table shows assets allocated to our reportable segments. Only assets which are identifiable by segment and reviewed by our chief operating decision maker by segment are allocated to the reportable
75
SEALED AIR CORPORATION AND SUBSIDIARIES
Notes to Consolidated Financial Statements (Continued)
(Amounts in tables in millions, except share and per share data)
Note 3 Segments (Continued)
segment assets, which are trade receivables, net, and finished goods inventories, net. All other assets are included in "Assets not allocated." Assets not allocated include goodwill of $1,948.7 million at December 31, 2009 and $1,938.1 million at December 31, 2008 and total property and equipment, net, of $1,010.7 million at December 31, 2009 and $1,051.4 million at December 31, 2008.
| |
2009 | 2008 | 2007 | ||||||||
|---|---|---|---|---|---|---|---|---|---|---|---|
Assets: |
|||||||||||
Trade receivables, net, and finished goods inventory, net |
|||||||||||
Food Packaging |
$ | 401.2 | $ | 443.1 | $ | 476.4 | |||||
Food Solutions |
210.6 | 216.6 | 215.1 | ||||||||
Protective Packaging |
266.1 | 281.2 | 337.5 | ||||||||
Other |
57.9 | 72.5 | 69.5 | ||||||||
Total segments and other |
935.8 | 1,013.4 | 1,098.5 | ||||||||
Assets not allocated |
4,484.3 | 3,972.6 | 4,339.8 | ||||||||
Total |
$ | 5,420.1 | $ | 4,986.0 | $ | 5,438.3 | |||||
Allocation of Goodwill to Reportable Segments
Our management views goodwill as a corporate asset, so we do not allocate our goodwill balance to the reportable segments. However, we are required to allocate goodwill to each reporting unit to perform our annual impairment review of goodwill, which we do during the fourth quarter of the year. See Note 9, "Goodwill and Identifiable Intangible Assets," for the allocation of goodwill, the changes in goodwill balances in the year ended December 31, 2009 by our segment reporting structure, and the details of our annual goodwill impairment review.
Geographic Information
| |
2009 | 2008 | 2007 | ||||||||
|---|---|---|---|---|---|---|---|---|---|---|---|
Net sales:(1) |
|||||||||||
United States |
$ | 1,969.1 | $ | 2,185.2 | $ | 2,118.2 | |||||
Canada |
133.2 | 150.3 | 147.0 | ||||||||
Europe |
1,194.5 | 1,469.6 | 1,384.6 | ||||||||
Latin America |
386.4 | 418.5 | 400.7 | ||||||||
Asia Pacific |
559.6 | 619.9 | 600.7 | ||||||||
Total |
$ | 4,242.8 | $ | 4,843.5 | $ | 4,651.2 | |||||
Total long-lived assets:(1) |
|||||||||||
United States |
$ | 2,363.9 | $ | 2,434.0 | $ | 2,467.8 | |||||
Canada |
12.6 | 17.0 | 24.7 | ||||||||
Europe |
516.7 | 522.7 | 558.1 | ||||||||
Latin America |
100.8 | 86.0 | 91.2 | ||||||||
Asia Pacific |
206.7 | 169.5 | 197.2 | ||||||||
Total(2) |
$ | 3,200.7 | $ | 3,229.2 | $ | 3,339.0 | |||||
- (1)
- Net
sales attributed to the geographic areas represent net sales to external customers. No non-U.S. country had net sales in excess of 10% of
consolidated net sales or long-lived assets in excess of 10% of consolidated long-lived assets at December 31, 2009.
- (2)
- Total long-lived assets are total assets excluding total current assets and deferred tax assets.
76
SEALED AIR CORPORATION AND SUBSIDIARIES
Notes to Consolidated Financial Statements (Continued)
(Amounts in tables in millions, except share and per share data)
Note 4 Global Manufacturing Strategy and 2008 Cost Reduction and Productivity Program
Global Manufacturing Strategy
Our global manufacturing strategy expands our production capabilities in regions where demand for our products and services has been growing significantly. Additionally, we are optimizing certain manufacturing platforms in North America and Europe into centers of excellence. The goals of this multi-year program have been to expand capacity in growing markets, further improve our operating efficiencies, and implement new technologies more effectively. By taking advantage of new technologies and streamlining production on a global scale, we have continued to enhance our profitable growth and our global leadership position and have produced meaningful benefits.
We announced the first phase of this multi-year global manufacturing strategy in July 2006. In 2009, we substantially finished the construction phase of GMS with the launch of our manufacturing facility in Duchnice, Poland. This facility along with our other new facilities in Qingpu, China and Monterrey, Mexico substantially completes the construction and launch of all three greenfield sites related to this program.
The capital expenditures, associated costs and related restructuring charges and the total amounts incurred since inception of this multi-year strategy are included in the table below.
| |
Year Ended December 31, | |
|||||||||||
|---|---|---|---|---|---|---|---|---|---|---|---|---|---|
| |
Cumulative Through December 31, 2009 |
||||||||||||
| |
2009 | 2008 | 2007 | ||||||||||
Capital expenditures |
$ | 20.0 | $ | 59.5 | $ | 58.5 | $ | 152.7 | |||||
Associated costs(1) |
9.8 | 7.4 | 11.4 | 32.4 | |||||||||
Restructuring and other charges(2) |
6.5 | 19.3 | 0.7 | 38.3 | |||||||||
- (1)
- The associated costs principally include facility start-up costs, which are primarily included in cost of sales on the consolidated statements of operations. These charges by our reporting structure were as follows:
| |
2009 | 2008 | 2007 | |||||||
|---|---|---|---|---|---|---|---|---|---|---|
Food Packaging |
$ | 7.6 | $ | 4.0 | $ | 10.2 | ||||
Food Solutions |
1.3 | 0.6 | — | |||||||
Protective Packaging |
0.9 | 2.6 | 0.9 | |||||||
Other |
— | 0.2 | 0.3 | |||||||
Total |
$ | 9.8 | $ | 7.4 | $ | 11.4 | ||||
- (2)
- The restructuring and other charges were primarily for costs for termination benefits, the majority of which were related to the Food Packaging segment. These charges were included in restructuring and other charges on the consolidated statements of operations. See Note 3, "Segments," for restructuring and other charges by reportable segment and Other. A reconciliation of the restructuring accrual for GMS is included below.
Of the $6.5 million of restructuring and other charges related to GMS in 2009, $5.2 million was for costs for termination benefits in connection with our decision to cease some of our manufacturing operations in Norderstedt, Germany. We intend to relocate our bagmaking and printing operations to other existing facilities in Europe and plan to continue our production of medical products and maintain support functions in the Norderstedt facility. We estimate that we will incur total costs of approximately $7.0 million, which will
77
SEALED AIR CORPORATION AND SUBSIDIARIES
Notes to Consolidated Financial Statements (Continued)
(Amounts in tables in millions, except share and per share data)
Note 4 Global Manufacturing Strategy and 2008 Cost Reduction and Productivity Program (Continued)
be future cash expenditures for this action. These estimated costs in connection with this action, by major type, consist of the following:
Costs for termination benefits |
$ | 5.2 | ||
Other associated restructuring costs, primarily for equipment relocation |
1.2 | |||
Other non-restructuring associated costs |
0.6 | |||
Total |
$ | 7.0 | ||
During 2009, we also recorded restructuring and other charges of $1.3 million primarily related to costs for termination benefits incurred in connection with other projects associated with GMS.
The restructuring and other charges of $19.3 million related to this program in 2008 were primarily for costs for termination benefits related to our decision to close our manufacturing facility in Cedar Rapids, Iowa. This facility's manufacturing operations were moved to existing facilities in North America.
The components of the restructuring accrual for GMS through December 31, 2009 and the accrual balance remaining on our consolidated balance sheet at December 31, 2009 were as follows:
Restructuring accrual at December 31, 2008 |
$ | 14.4 | ||
Provision for termination benefits |
5.9 | |||
Adjustment to accrual for termination benefits |
(1.4 | ) | ||
Cash payments during 2009 |
(9.8 | ) | ||
Effect of changes in foreign currency rates |
0.3 | |||
Restructuring accrual at December 31, 2009 |
$ | 9.4 | ||
We expect to pay $9.3 million of the accrual balance remaining at December 31, 2009 within the next year. This amount is included in other current liabilities on our consolidated balance sheet at December 31, 2009. The remaining accrual of $0.1 million is expected to be paid in 2011 and is included in other liabilities on our consolidated balance sheet at December 31, 2009.
2008 Cost Reduction and Productivity Program
In the third quarter of 2008, we implemented a cost reduction and productivity program. As a result, we recorded $65.8 million of pre-tax charges primarily for costs for termination benefits in 2008. The components of the restructuring accrual through December 31, 2009 and the accrual balance remaining on our consolidated balance sheet at December 31, 2009 related to this program are included in the table below. We expect to incur additional modest costs associated with this program during 2010.
Restructuring accrual at December 31, 2008 |
$ | 43.7 | ||
Provision for termination benefits |
0.8 | |||
Cash payments made during 2009 |
(37.8 | ) | ||
Effect of changes in foreign currency rates |
(0.1 | ) | ||
Restructuring accrual at December 31, 2009 |
$ | 6.6 | ||
We expect to pay $6.5 million of the accrual balance remaining at December 31, 2009 within the next year. This amount is included in other current liabilities on the consolidated balance sheet at December 31, 2009. The remaining accrual of $0.1 million is expected to be paid in 2011 and is included in other liabilities on the consolidated balance sheet at December 31, 2009.
78
SEALED AIR CORPORATION AND SUBSIDIARIES
Notes to Consolidated Financial Statements (Continued)
(Amounts in tables in millions, except share and per share data)
Note 5 Available-for-Sale Investments
The following tables summarize our investments in available-for-sale securities:
| |
Estimated Fair Value at December 31, 2008 |
Gross Unrealized Gains |
Gross Other Than Temporary Impairment |
Estimated Fair Value at December 31, 2009 |
||||||||||
|---|---|---|---|---|---|---|---|---|---|---|---|---|---|---|
Auction rate securities: |
||||||||||||||
Debt instruments with contractual maturity dates in 2021, 2033, and 2036 |
$ | 7.7 | $ | 7.0 | $ | (1.2 | ) | $ | 13.5 | |||||
Non-cumulative perpetual preferred stock |
3.0 | — | (2.8 | ) | 0.2 | |||||||||
Total |
$ | 10.7 | $ | 7.0 | $ | (4.0 | ) | $ | 13.7 | |||||
| |
Estimated Fair Value at December 31, 2007 |
Gross Unrealized Gains |
Gross Other Than Temporary Impairment |
Estimated Fair Value at December 31, 2008 |
||||||||||
|---|---|---|---|---|---|---|---|---|---|---|---|---|---|---|
Auction rate securities: |
||||||||||||||
Debt instruments with contractual maturity dates in 2021, 2033, and 2036 |
$ | 24.0 | $ | 0.7 | $ | (17.0 | ) | $ | 7.7 | |||||
Non-cumulative perpetual preferred stock |
16.8 | 3.2 | (17.0 | ) | 3.0 | |||||||||
Total |
$ | 40.8 | $ | 3.9 | $ | (34.0 | ) | $ | 10.7 | |||||
Our available-for-sale investments, consisting of auction rate securities at December 31, 2009 and 2008, are exposed to market risk related to changes in conditions in the U.S. financial markets and in the financial condition of the issuers of these securities. Our investment in auction rate securities at December 31, 2009 and 2008 had an original cost of $44.7 million (debt instruments of $24.7 million and non-cumulative perpetual preferred stock of $20.0 million).
These auction rate securities consisted of two contingent capital securities that were converted into perpetual preferred stock of AMBAC in December 2008, and three debt instruments issued individually by Primus (maturity date 2021), River Lake (maturity date 2033) and Ballantyne (maturity date 2036). We received interest and dividend payments of $1.1 million for the year ended December 31, 2009 and $2.2 million for the year ended December 31, 2008.
These five securities historically were re-auctioned every twenty-eight days, which had provided a liquid market for them. However, as a result of continuing liquidity concerns in the U.S. for these types of asset-backed securities, every auction held by the issuers for these auction rate securities since late 2007 has failed.
Since August 2007, the estimated fair value of each of our investments in auction rate securities has been less than its original cost. As a result, we have recognized cumulative losses of $38.0 million ($23.8 million, net of taxes) through December 31, 2009 from the decline in market values from the securities' original cost. After considering impairment indicators under U.S. GAAP and the declines in fair value, we determined that these investments were impaired. We evaluated the following factors in determining whether the impairment is temporary or other than temporary:
- •
- the creditworthiness of the issuers and the timelines and level of interest payments received from the issuers;
- •
- downgrades of credit ratings of all of the issuers;
- •
- the severity of the decline in the estimated market value of the securities in 2008 and 2009;
- •
- potential recovery of the investment value;
79
SEALED AIR CORPORATION AND SUBSIDIARIES
Notes to Consolidated Financial Statements (Continued)
(Amounts in tables in millions, except share and per share data)
Note 5 Available-for-Sale Investments (Continued)
- •
- AMBAC's December 2008 exercise of its put option to convert its asset backed capital commitment securities into
non-cumulative perpetual preferred stock of AMBAC Assurance (no maturity date);
- •
- AMBAC's December 2008 cancellation of the dividend on its common stock;
- •
- AMBAC's cancellation of the dividend on its non-cumulative preferred stock effective August 1, 2009;
and
- •
- the level of subordination of the Ballantyne securities.
Based on the evaluations discussed above, we determined that the securities incurred other than temporary decline in fair market value. We also recorded $7.0 million of unrealized gains ($4.4 million, net of taxes) in 2009 in other comprehensive income related to an increase in the estimated fair value of the River Lake securities, following their initial decline in value, which was primarily due to an improvement in River Lake's credit spread.
See Note 13, "Fair Value Measurements and Other Financial Instruments," for details on the inputs and valuation methodology used to calculate the estimated fair value of these investments.
We continue to monitor developments in the market for auction rate securities including the specific securities in which we have invested. At December 31, 2009, ratings of these securities held by us by Moody's ranged from Baa3 to unrated and ratings by Standard & Poor's, ranged from BBB to D. These ratings are among the ratings assigned by each of these organizations for investment and non-investment grade long-term unsecured debt. Moreover, during the year ended December 31, 2009, we continued to receive all interest payments totaling $0.8 million on a timely basis from the issuers of the three debt securities, Effective August 1, 2009, AMBAC discontinued paying dividends on its perpetual preferred stock. During the year ended December 31, 2009, we received dividend payments totaling $0.3 million from AMBAC.
If credit or liquidity conditions relating to these securities or the issuers worsen, we may recognize additional other than temporary impairments, which would result in the recognition of additional losses on our consolidated statement of operations.
Note 6 Accounts Receivable Securitization Program
We and a group of our U.S. subsidiaries maintain an accounts receivable securitization program with a bank and an issuer of commercial paper administered by the bank. As of December 31, 2009, the maximum purchase limit for receivable interests was $125.0 million.
The amounts available from time to time under the program may be less than $125.0 million due to a number of factors, including but not limited to our credit ratings, accounts receivable balances, the creditworthiness of our customers and our receivables collection experience.
During 2009, the level of eligible assets available under the program declined primarily due to our current credit rating. As a result, the amount available to us under the program was approximately $74.4 million at December 31, 2009. Although we do not believe that these restrictive provisions presently materially restrict our liquidity position, if an event occurs that triggers one of these restrictive provisions, we could experience a further decline in the amounts available under the program or termination of the program.
The program is scheduled to expire in December 2012. The program includes a bank financing commitment that must be renewed annually. The bank financing commitment is scheduled to expire on December 3, 2010. We plan to seek an additional 364 day renewal of the bank commitment before its expiration, but the bank is not obligated to renew the bank financing commitment.
Under this receivables program, our two primary operating subsidiaries, Cryovac, Inc. and Sealed Air Corporation (US), sell all of their eligible U.S. accounts receivable to Sealed Air Funding Corporation,
80
SEALED AIR CORPORATION AND SUBSIDIARIES
Notes to Consolidated Financial Statements (Continued)
(Amounts in tables in millions, except share and per share data)
Note 6 Accounts Receivable Securitization Program (Continued)
or SA Funding, an indirectly wholly-owned subsidiary of ours that was formed for the sole purpose of entering into the receivables program. SA Funding in turn may sell undivided ownership interests in these receivables to the issuer of commercial paper or to the bank, subject to specified conditions, up to a maximum of $125.0 million of receivables interests outstanding from time to time.
SA Funding retains the receivables it purchases from the operating subsidiaries, except those as to which it sells receivables interests to the purchasers under the program. We have structured the sales of accounts receivable by the operating subsidiaries to SA Funding and the sales of receivables interests from SA Funding to the purchasers as "true sales" under applicable laws. The assets of SA Funding are not available to pay any of our creditors or of other subsidiaries or affiliates. We account for these transactions as sales of receivables.
To secure the performance of their obligations under the receivables program, SA Funding and the operating subsidiaries granted a first priority security interest to the bank that is acting as administrative agent under the program in accounts receivable owned by them, proceeds and collections of those receivables and other collateral. The bank and issuer of commercial paper under the program have no recourse to us, the operating subsidiaries' or SA Funding's other assets for any losses resulting from the financial inability of customers to pay amounts due on the receivables when they become due. As long as a termination event with respect to the receivables program has not occurred, the operating subsidiaries service, administer and collect the receivables under the receivables program as agents on behalf of SA Funding, the bank and the issuer of commercial paper.
Before a termination event under the receivables program, SA Funding uses collections of receivables not otherwise required to be paid to the bank or the issuer of commercial paper to purchase new eligible receivables from the operating subsidiaries. We have undertaken to cause the operating subsidiaries to perform their obligations under the receivables program.
Under limited circumstances, the banks and the issuers of commercial paper can end purchases of receivables interests before the above dates. A downgrade of our long-term senior unsecured debt to BB- or below by Standard & Poor's Rating Services or Ba3 or below by Moody's Investors Service, Inc., or failure to comply with interest coverage, debt leverage ratios or various other ratios related to our receivables collection experience could result in termination of the receivables program. We were in compliance with these ratios at December 31, 2009 and 2008.
At December 31, 2008, we had $80.0 million outstanding under this program. In January 2009, we utilized an additional $51.0 million available to us under this program. Subsequently, in February 2009, we repaid the entire $131.0 million outstanding amount under this program utilizing funds available from our 12% Senior Notes issuance. As of December 31, 2009, we had no amounts outstanding under this program.
The costs associated with the receivables program are reflected in other (expense) income, net, on our consolidated statements of operations for the three years ended December 31, 2009. Other, net, includes the costs associated with our receivables securitization program. These costs primarily relate to the losses on the sale of the undivided ownership interests in 2009 and 2008, program fees, commitment fees and other associated costs, all of which totaled $0.7 million in 2009 and $3.4 million in 2008. The program and commitment fees and other associated costs were $0.4 million in 2007. There were no costs related to losses on the sale of receivables interests in 2007 since we did not sell any receivables interests during 2007 and therefore we did not remove any related amounts from the consolidated assets reflected on our consolidated balance sheet at December 31, 2007.
81
SEALED AIR CORPORATION AND SUBSIDIARIES
Notes to Consolidated Financial Statements (Continued)
(Amounts in tables in millions, except share and per share data)
Note 7 Inventories
The following table details our inventories and the reduction of certain inventories to a LIFO basis:
| |
December 31, | |||||||
|---|---|---|---|---|---|---|---|---|
| |
2009 | 2008 | ||||||
Inventories (at FIFO, which approximates replacement value): |
||||||||
Raw materials |
$ | 90.1 | $ | 98.7 | ||||
Work in process |
97.2 | 116.6 | ||||||
Finished goods |
326.3 | 405.0 | ||||||
Subtotal (at FIFO) |
513.6 | 620.3 | ||||||
Reduction of certain inventories to LIFO basis |
(44.2 | ) | (56.0 | ) | ||||
Total |
$ | 469.4 | $ | 564.3 | ||||
We determine the value of non-equipment U.S. inventories by the last-in, first-out or LIFO inventory method. U.S. inventories determined by the LIFO method were $111.2 million at December 31, 2009 and $134.9 million at December 31, 2008.
Note 8 Property and Equipment, net
The following table details our property and equipment, net, at December 31, 2009 and 2008.
| |
December 31, | ||||||
|---|---|---|---|---|---|---|---|
| |
2009 | 2008 | |||||
Land and improvements |
$ | 49.7 | $ | 45.4 | |||
Buildings |
604.1 | 565.1 | |||||
Machinery and equipment |
2,332.0 | 2,179.0 | |||||
Other property and equipment |
124.1 | 130.4 | |||||
Construction-in-progress |
42.7 | 123.9 | |||||
|
3,152.6 | 3,043.8 | |||||
Accumulated depreciation and amortization |
(2,141.9 | ) | (1,992.4 | ) | |||
Property and equipment, net |
$ | 1,010.7 | $ | 1,051.4 | |||
The following table details our interest cost capitalized and depreciation and amortization expense for property and equipment for the years ended December 31, 2009, 2008 and 2007.
| |
December 31, | |||||||||
|---|---|---|---|---|---|---|---|---|---|---|
| |
2009 | 2008 | 2007 | |||||||
Interest cost capitalized |
$ | 6.7 | $ | 9.3 | $ | 9.5 | ||||
Depreciation and amortization expense for property and equipment |
142.8 | 143.9 | 142.1 | |||||||
82
SEALED AIR CORPORATION AND SUBSIDIARIES
Notes to Consolidated Financial Statements (Continued)
(Amounts in tables in millions, except share and per share data)
Note 9 Goodwill and Identifiable Intangible Assets
Goodwill
The following table shows our goodwill balances at December 31, 2009 and 2008 by our reporting unit structure.
| |
Carrying Value at December 31, 2008 |
Goodwill Acquired |
Foreign Currency Translation and Other |
Carrying Value at December 31, 2009 |
||||||||||
|---|---|---|---|---|---|---|---|---|---|---|---|---|---|---|
Food Packaging segment |
$ | 381.4 | $ | — | $ | 2.2 | $ | 383.6 | ||||||
Food Solutions segment |
147.2 | — | 0.9 | 148.1 | ||||||||||
Protective Packaging segment: |
||||||||||||||
Protective Packaging |
1,140.1 | — | 5.8 | 1,145.9 | ||||||||||
Shrink Packaging |
114.6 | — | 0.7 | 115.3 | ||||||||||
Protective Packaging segment |
1,254.7 | — | 6.5 | 1,261.2 | ||||||||||
Other: |
||||||||||||||
Specialty Materials |
109.0 | 0.5 | 0.6 | 110.1 | ||||||||||
Medical Applications |
45.8 | — | (0.1 | ) | 45.7 | |||||||||
New Ventures |
— | — | — | — | ||||||||||
Total Other |
154.8 | 0.5 | 0.5 | 155.8 | ||||||||||
Total Company |
$ | 1,938.1 | $ | 0.5 | $ | 10.1 | $ | 1,948.7 | ||||||
We test goodwill for impairment on a reporting unit basis annually during the fourth quarter of each year and at other times if events or circumstances exist that indicate the carrying value of goodwill may no longer be recoverable. Prior to our 2009 annual testing, we tested the goodwill of some of our reporting units at certain times earlier in the year, but no impairment charges were recorded.
2009 Annual Goodwill Impairment Test
In the fourth quarter of 2009, we completed step one of our annual impairment test and fair value analysis for goodwill, and there were no impairments present and no impairment charge was recorded. We had the estimated fair values updated for all of our reporting units, except for the New Ventures reporting unit because this reporting unit does not have any goodwill included in its net asset value. See "Goodwill and Identifiable Intangible Assets," of Note 2, "Summary of Significant Accounting Policies and Recently Issued Accounting Standards," for details of our fair value approach for testing goodwill for impairment.
The excess of estimated fair values over carrying value, including goodwill, for each of our reporting units as of the 2009 annual test date were the following:
Reporting Unit
|
% By Which Estimated Fair Value Exceeds Carrying Value |
|||
|---|---|---|---|---|
Food Packaging |
238 |
% |
||
Food Solutions |
206 |
% |
||
Protective Packaging |
16 |
% |
||
Shrink Packaging |
61 |
% |
||
Specialty Materials |
21 |
% |
||
Medical Applications |
95 |
% |
||
83
SEALED AIR CORPORATION AND SUBSIDIARIES
Notes to Consolidated Financial Statements (Continued)
(Amounts in tables in millions, except share and per share data)
Note 9 Goodwill and Identifiable Intangible Assets (Continued)
Although we determined that there was no goodwill impairment in 2009, the future occurrence of a potential indicator of impairment, such as a decrease in expected net earnings, adverse equity market conditions, a decline in current market multiples, a decline in our common stock price, a significant adverse change in legal factors or business climates, an adverse action or assessment by a regulator, unanticipated competition, strategic decisions made in response to economic or competitive conditions, or a more-likely-than-not expectation that a reporting unit or a significant portion of a reporting unit will be sold or disposed of, could require an interim assessment for some or all of the reporting units before the next required annual assessment. In the event of significant adverse changes of the nature described above, we might have to recognize a non-cash impairment of goodwill, which could have a material adverse effect on our consolidated financial position and results of operations.
Identifiable Intangible Assets
The following tables summarize our identifiable intangible assets with definite and indefinite useful lives.
| |
December 31, | ||||||
|---|---|---|---|---|---|---|---|
| |
2009 | 2008 | |||||
Gross carrying value |
$ | 116.8 | $ | 113.7 | |||
Accumulated amortization |
(58.4 | ) | (49.5 | ) | |||
Total |
$ | 58.4 | $ | 64.2 | |||
These identifiable intangible assets are included in other assets, net, on the consolidated balance sheets and include $8.9 million of trademarks that we have determined to have an indefinite useful life.
Amortization expense of identifiable intangible assets was $11.7 million in 2009, $10.9 million in 2008 and $6.5 million in 2007. These expenses are included in marketing, administrative and development expenses on the consolidated statements of operations.
Assuming no change in the gross carrying value of identifiable intangible assets from the value at December 31, 2009, the remaining estimated future amortization expense is as follows:
2010 |
$ | 10.7 | ||
2011 |
7.5 | |||
2012 |
5.9 | |||
2013 |
5.1 | |||
2014 |
4.7 | |||
Thereafter |
15.6 | |||
Total |
$ | 49.5 | ||
84
SEALED AIR CORPORATION AND SUBSIDIARIES
Notes to Consolidated Financial Statements (Continued)
(Amounts in tables in millions, except share and per share data)
Note 10 Other Liabilities
The following tables detail our other current liabilities and other liabilities at December 31, 2009 and 2008:
| |
December 31, | |||||||
|---|---|---|---|---|---|---|---|---|
| |
2009 | 2008 | ||||||
Other current liabilities: |
||||||||
Accrued salaries, wages and related costs |
$ | 165.2 | $ | 132.8 | ||||
Accrued operating expenses |
124.2 | 118.6 | ||||||
Income taxes payable |
18.9 | 33.6 | ||||||
Accrued customer volume rebates |
65.2 | 71.8 | ||||||
Accrued interest |
38.3 | 26.4 | ||||||
Accrued employee benefit liability |
2.5 | 4.2 | ||||||
Total |
$ | 414.3 | $ | 387.4 | ||||
| |
December 31, | |||||||
|---|---|---|---|---|---|---|---|---|
| |
2009 | 2008 | ||||||
Other liabilities: |
||||||||
Accrued employee benefit liability |
$ | 105.1 | $ | 93.3 | ||||
Other postretirement liability |
2.5 | 2.5 | ||||||
Accrued restructuring costs |
0.2 | 9.4 | ||||||
Other various liabilities |
45.5 | 37.3 | ||||||
Total |
$ | 153.3 | $ | 142.5 | ||||
Note 11 Debt and Credit Facilities
Our total debt outstanding consisted of the amounts set forth on the following table:
| |
December 31, | |||||||
|---|---|---|---|---|---|---|---|---|
| |
2009 | 2008 | ||||||
Short-term borrowings |
$ | 28.2 | $ | 37.6 | ||||
Current portion of long-term debt: |
||||||||
6.95% Senior Notes matured May 2009 |
— | 136.7 | ||||||
Other current portion of long-term debt |
6.5 | 14.8 | ||||||
Total current debt |
34.7 | 189.1 | ||||||
12% Senior Notes due February 2014(1) |
299.5 | — | ||||||
7.875% Senior Notes due June 2017, less unamortized discount of $8.2 million in 2009 |
391.8 | — | ||||||
6.875% Senior Notes due July 2033, less unamortized discount of $1.5 in 2009 and 2008 |
448.5 | 448.5 | ||||||
5.625% Senior Notes due July 2013, less unamortized discount of $0.6 in 2009 and $0.7 in 2008 |
399.4 | 399.3 | ||||||
3% Convertible Senior Notes redeemed July 2009 |
— | 431.3 | ||||||
Other |
87.1 | 10.8 | ||||||
Total long-term debt, less current portion |
$ | 1,626.3 | $ | 1,289.9 | ||||
Total debt |
$ | 1,661.0 | $ | 1,479.0 | ||||
- (1)
- Amount includes adjustments due to interest rate swaps. See Note 11, "Derivatives and Hedging Activities," for further discussion.
85
SEALED AIR CORPORATION AND SUBSIDIARIES
Notes to Consolidated Financial Statements (Continued)
(Amounts in tables in millions, except share and per share data)
Note 11 Debt and Credit Facilities (Continued)
Senior Notes
Redemption of 3% Convertible Senior Notes due 2033
In July 2009, we redeemed the entire $431.3 million of our 3% Convertible Senior Notes due 2033. The total redemption cash payment of $433.9 million included a 0.429% call premium of $1.9 million and accrued and unpaid interest of $0.7 million. We used net proceeds of $384.3 million from the June 2009 issuance of 7.875% Senior Notes due June 2017 plus available cash of $49.6 million to redeem these senior notes. In connection with the redemption, we recorded a $3.4 million pre-tax loss on the redemption of debt in the third quarter of 2009. This loss represented the 0.429% call premium mentioned above of $1.9 million and a write-down of the remaining debt issuance costs of $1.5 million related to the issuance of these senior notes in July 2003.
Issuance of 7.875% Senior Notes due 2017
In June 2009, we completed an offering of $400.0 million of senior unsecured notes due 2017 with a coupon of 7.875%. The net proceeds from this issuance after deducting the discount of $8.7 million and debt issuance costs of $7.0 million were $384.3 million. These senior notes rank equally with all of our other unsecured and unsubordinated indebtedness from time to time outstanding. Interest on these notes is payable semiannually in arrears on June 15 and December 15 of each year, commencing on December 15, 2009.
At any time prior to June 15, 2013, we may redeem these notes, in whole or from time to time in part, at a redemption price equal to the greater of (i) 101% of the principal amount of the notes being redeemed or (ii) the sum of the present values of the remaining scheduled payments of principal and interest on the notes being redeemed from the redemption date to the maturity date. On or after June 15, 2013, we may redeem all or part of these notes at a price equal to 103.938% of their aggregate principal amount, declining to 101.969% on June 15, 2014 and 100% on June 15, 2015. In addition, at any time prior to June 15, 2012, we may redeem up to 35% of the aggregate principal amount of these notes from the proceeds of certain equity offerings.
The indenture imposes limitations on our operations and those of specified subsidiaries, including limitations on liens, sale and leaseback transactions and mergers, acquisitions and dispositions. These limitations are substantially equivalent to those in the indentures relating to our other outstanding senior notes.
Retirement of 6.95% Senior Notes
In May 2009, we retired the remaining outstanding 6.95% Senior Notes on their maturity date. The $136.7 million face value of these senior notes, along with $4.7 million of accrued interest, was paid primarily with available cash.
Issuance of 12% Senior Notes
In February 2009, we issued $300 million aggregate principal amount of 12% senior unsecured notes due 2014 in a private offering. The notes were sold pursuant to the Note Purchase Agreement dated February 6, 2009 by and among us, subsidiaries of Berkshire Hathaway Inc. and Davis Selected Advisers, L.P.
86
SEALED AIR CORPORATION AND SUBSIDIARIES
Notes to Consolidated Financial Statements (Continued)
(Amounts in tables in millions, except share and per share data)
Note 11 Debt and Credit Facilities (Continued)
These notes were sold to the purchasers at a price of 100% of the principal amount. Interest on the notes is payable semiannually in arrears on February 15 and August 15 of each year, commencing on August 15, 2009. These senior notes rank equally with all of our other unsecured and unsubordinated indebtedness from time to time outstanding. The indenture imposes limitations on our operations and those of specified subsidiaries, including limitations on liens, sale and leaseback transactions and mergers, acquisitions and dispositions. These limitations are substantially equivalent to those contained in the indentures relating to our other outstanding senior notes. The indenture does not provide for an option for us to redeem these notes prior to their maturity.
As indicated in a Schedule 13G/A dated February 12, 2010 filed with the SEC, Davis Selected Advisers, L.P. indicated that it had sole voting power with respect to 47,828,142 shares and sole dispositive power with respect to 58,959,652 shares of our common stock, which then represented beneficial ownership of approximately 37% of the outstanding shares of our common stock.
Upon receipt of these funds, we repaid amounts outstanding under the global credit facility and accounts receivable securitization program and retained the balance as cash and cash equivalents on our consolidated balance sheet.
Maturity of 5.375% Senior Notes
On April 15, 2008, our 5.375% Senior Notes with a face value of $300.0 million matured. We used $165.0 million of funds drawn under the global credit facility and $135.0 million from the sale of receivable interests under our accounts receivable securitization program to retire this debt.
Before the retirement of the 5.375% Senior Notes, we recorded adjustments to their fair value as a result of our related interest rate hedging. See Note 12, "Derivatives and Hedging Activities," for further discussion.
Lines of Credit
The following table summarizes our available lines of credit and committed and uncommitted lines of credit at December 31, 2009 and 2008 including the global credit facility and European credit facility, which are discussed below:
| |
December 31, | ||||||
|---|---|---|---|---|---|---|---|
| |
2009 | 2008 | |||||
Used lines of credit |
$ | 107.1 | $ | 46.7 | |||
Unused lines of credit |
846.3 | 773.4 | |||||
Total available lines of credit |
$ | 953.4 | $ | 820.1 | |||
Available lines of credit—committed |
$ | 686.1 | $ | 588.8 | |||
Available lines of credit—uncommitted |
267.3 | 231.3 | |||||
Total available lines of credit |
$ | 953.4 | $ | 820.1 | |||
Our principal credit lines were committed and consisted of the global credit facility and the European credit facility. We are not subject to any material compensating balance requirements in connection with our lines of credit.
Global Credit Facility
The global credit facility is available for general corporate purposes, including the payment of amounts required to be paid upon the effectiveness of the Settlement agreement. We may re-borrow amounts repaid
87
SEALED AIR CORPORATION AND SUBSIDIARIES
Notes to Consolidated Financial Statements (Continued)
(Amounts in tables in millions, except share and per share data)
Note 11 Debt and Credit Facilities (Continued)
under the global credit facility from time to time before the expiration or earlier termination of the global credit facility. Our obligations under the global credit facility bear interest at floating rates, which are generally determined by adding the applicable borrowing margin to the base rate or the interbank rate for the relevant currency and time period. The global credit facility provides for changes in borrowing margins based on our long-term senior unsecured debt ratings. The facility has an expiration date of July 26, 2012.
The terms of this facility include a requirement that, upon the occurrence of specified events that would adversely affect the Settlement agreement or would materially increase our liability in respect of the Grace bankruptcy or the asbestos liability arising from the Cryovac transaction, we would be required to repay any amounts outstanding under the global credit facility or refinance the facility within 60 days.
Before December 10, 2009, the global credit facility commitments included $28 million provided by Lehman Commercial Paper Inc., a subsidiary of Lehman Brothers Holdings Inc. As a result of the bankruptcy filing of Lehman Brothers Holdings Inc. and certain of its subsidiaries in September 2008, Lehman Commercial Paper was no longer funding borrowing requests under the global credit facility. Effective December 10, 2009, we removed Lehman Commercial Paper's commitments from the global credit facility and as a result, as of December 31, 2009, the total amount available under the global credit facility was approximately $472 million.
While the current total amount available for borrowing under the global credit facility is approximately $472 million, the facility also provides a mechanism to increase the total facility size to a maximum of $750 million. This does not represent a commitment by the lenders to increase the facility size; rather, it provides us with a simplified method of requesting an increase at a later date if desired and market conditions permit. This mechanism is not included in the available lines of credit table above.
Facility fees are payable at the rate of 0.20% per annum on the total amounts available under the revolving credit facility. The global credit facility provides for changes in facility fees based on our long-term senior unsecured debt ratings. Also, the facility provides for springing subsidiary guarantees if our long-term senior unsecured debt ratings by both Moody's and Standard & Poor's fall below investment grade.
During 2009, we borrowed funds from time to time under this facility. Interest expense related to the funds drawn in 2009 was $0.2 million. The related weighted average interest rate for these borrowings was 1.7%. At December 31, 2009 there were no amounts outstanding under this facility.
European Credit Facility
In November 2009, we entered into a €150 million European credit facility, equivalent to U.S. $214 million at December 31, 2009. The facility has an expiration date of July 26, 2012. A syndicate of banks made this facility available to Sealed Air and a group of our European subsidiaries for general corporate purposes, including the payment of amounts required to be paid upon effectiveness of the Settlement agreement. The terms of this facility are substantially similar to the terms of our global credit facility. We may re-borrow amounts repaid under the European credit facility from time to time before the expiration or earlier termination of the facility.
As of December 31, 2009, we had an outstanding balance of €45 million, which was equivalent to U.S. $64 million. We repaid this outstanding balance in January 2010. Interest expense related to the funds drawn in 2009 under this facility was $0.1 million and had a weighted average interest rate of 3.625%.
In December 2009, after entering into the European credit facility, we cancelled our 170 million Australian dollar revolving credit facility, which was scheduled to expire in March 2010. We did not utilize the Australian facility in 2009.
In December 2008, we borrowed funds under our Australian dollar revolving credit facility, and we had an outstanding balance of 9.4 million Australian dollars, which was equivalent to U.S. $6.5 million at
88
SEALED AIR CORPORATION AND SUBSIDIARIES
Notes to Consolidated Financial Statements (Continued)
(Amounts in tables in millions, except share and per share data)
Note 11 Debt and Credit Facilities (Continued)
December 31, 2008. Interest expense related to the funds drawn in 2008 under this facility was $0.6 million and had a weighted average interest rate of 8.75%.
Other Lines of Credit
Substantially all our short-term borrowings of $28.2 million at December 31, 2009 and $37.6 million at December 31, 2008 were outstanding under lines of credit available to several of our foreign subsidiaries. The following table details our other lines of credit at December 31, 2009 and 2008:
| |
December 31, | ||||||
|---|---|---|---|---|---|---|---|
| |
2009 | 2008 | |||||
Available lines of credit |
$ | 252.6 | $ | 222.2 | |||
Unused lines of credit |
224.4 | 191.1 | |||||
Weighted average interest rate |
5.5 | % | 11.2 | % | |||
Covenants
Each issue of our outstanding senior notes imposes limitations on our operations and those of specified subsidiaries. The principal limitations restrict liens, sale and leaseback transactions and mergers, acquisitions and dispositions. Our global credit facility and our European credit facility contain financial covenants relating to interest coverage, debt leverage and minimum liquidity and restrictions on the creation of liens, the incurrence of additional indebtedness, acquisitions, mergers and consolidations, asset sales, and amendments to the Settlement agreement discussed above. We were in compliance with the above financial covenants and limitations, as applicable, at December 31, 2009 and 2008.
Debt Maturities
Scheduled annual maturities of our long-term debt, including the current portion of long-term debt, exclusive of debt discounts, and our obligations under capital leases for the five years after December 31, 2009 and thereafter are as follows:
2010 |
$ | 6.5 | ||
2011 |
17.0 | |||
2012 |
69.7 | |||
2013 |
400.0 | |||
2014 |
300.0 | |||
Thereafter |
850.0 | |||
Total |
$ | 1,643.2 | ||
Note 12 Derivatives and Hedging Activities
We report all derivative instruments on our balance sheet at fair value and establish criteria for designation and effectiveness of transactions entered into for hedging purposes.
We are exposed to market risk, such as fluctuations in foreign currency exchange rates and changes in interest rates. To manage the volatility relating to these exposures, we enter into various derivative instruments from time to time under our risk management policies. We designate derivative instruments as hedges on a transaction basis to support hedge accounting. The changes in fair value of these hedging instruments offset in part or in whole corresponding changes in the fair value or cash flows of the underlying exposures being hedged. We assess the initial and ongoing effectiveness of our hedging relationships in accordance with our policy. We do not purchase, hold or sell derivative financial instruments for trading
89
SEALED AIR CORPORATION AND SUBSIDIARIES
Notes to Consolidated Financial Statements (Continued)
(Amounts in tables in millions, except share and per share data)
Note 12 Derivatives and Hedging Activities (Continued)
purposes. Our practice is to terminate derivative transactions if the underlying asset or liability matures or is sold or terminated, or if we determine the underlying forecasted transaction is no longer probable of occurring.
Foreign Currency Forward Contracts
We are exposed to market risk, such as fluctuations in foreign currency exchange rates. Our subsidiaries have foreign currency exchange exposure from buying and selling in currencies other than their functional currencies. The primary purposes of our foreign currency hedging activities are to manage the potential changes in value associated with the amounts receivable or payable on transactions denominated in foreign currencies and to minimize the impact of the changes in foreign currencies related to certain foreign currency denominated interest-bearing intercompany loans and receivables and payables. The changes in fair value of these contracts are recognized in other (expense) income, net, on the consolidated statements of operations and are largely offset by the remeasurement of the underlying foreign currency denominated items. These contracts had original maturities of less than 12 months.
At December 31, 2009, we were party to foreign currency forward contracts with an aggregate notional amount of $282.8 million maturing through December 2010. At December 31, 2008, we were party to foreign currency forward contracts with an aggregate notional amount of $421.6 million, which matured by March 2009.
The estimated fair value of these contracts, which represents the estimated net payments that would be paid or that would be received by us in the event of their termination, based on the then current foreign currency exchange rates, was a net payable of $3.6 million at December 31, 2009 and a net receivable of $12.8 million at December 31, 2008. The related net gains and losses were largely offset by the net losses and gains resulting from the remeasurement of the underlying foreign currency denominated transactions.
Cash Flow Hedges
We record gains and losses on foreign currency forward contracts qualifying as cash flow hedges in other comprehensive income to the extent that these hedges are effective and until we recognize the underlying transactions in net earnings, at which time we recognize these gains and losses in other (expense) income, net, on the consolidated statements of operations.
Net unrealized after tax gains (losses) related to these contracts that were included in other comprehensive income for the year ended December 31, 2009 and December 31, 2008 were immaterial. The unrealized amounts in other comprehensive income will fluctuate based on changes in the fair value of open contracts during each reporting period.
Interest Rate Swaps
From time to time, we may use interest rate swaps to manage our mix of fixed and floating rates on our outstanding indebtedness.
At December 31, 2009, we had outstanding interest rate swaps with a total notional amount of $200.0 million that qualified and were designated as fair value hedges. We entered into these interest rate swaps to effectively convert a portion of our 12% Senior Notes into floating rate debt. We recorded a mark to market adjustment to record a decrease of $0.5 million at December 31, 2009 in the carrying amount of the 12% Senior Notes due to changes in interest rates and an offsetting increase to other liabilities at December 31, 2009 to record the fair value of the related interest rate swaps. There was no ineffective portion of the hedges recognized in earnings during the period.
In 2009, under the terms of the $200.0 million (notional amount) outstanding interest rate swap agreements, we received interest at a fixed rate and paid interest at variable rates that were based on the
90
SEALED AIR CORPORATION AND SUBSIDIARIES
Notes to Consolidated Financial Statements (Continued)
(Amounts in tables in millions, except share and per share data)
Note 12 Derivatives and Hedging Activities (Continued)
one-month London Interbank Offered Rate, or LIBOR. As a result, interest expense was reduced by $1.5 million in the year ended December 31, 2009.
Before April 15, 2008, we had outstanding interest rate swaps with a total notional amount of $300.0 million that qualified and were designated as fair value hedges. We entered into these interest rate swaps to effectively convert our 5.375% Senior Notes due April 2008 into floating rate debt. We retired our 5.375% Senior Notes on April 15, 2008, their maturity date. The related interest rate swaps matured on the same day. See Note 11, "Debt and Credit Facilities," for further discussion of the debt retirement. At December 31, 2008, we had no outstanding interest rate swaps.
At December 31, 2007, we recorded a mark-to-market adjustment to record a decrease of $2.1 million in the fair value of the 5.375% Senior Notes due to changes in interest rates and an offsetting increase to other current liabilities to record the fair value of the related interest rate swaps. There was no ineffective portion of the hedges recognized in earnings during the period.
In 2008 and 2007, under the terms of the $300.0 million outstanding interest rate swap agreements, we received interest at a fixed rate and paid interest at variable rates that were based on the six-month LIBOR. As a result, interest expense included $2.1 million in 2008 and $7.7 million in 2007 in connection with these swap agreements.
In 2007, we terminated forward starting interest rate swaps. As a result, we received cash of $3.7 million and recognized a gain for this amount in other (expense) income, net, on the consolidated statement of operations.
Other Derivative Instruments
We may use other derivative instruments from time to time, such as foreign exchange options to manage exposure due to foreign exchange rates and interest rate and currency swaps related to access to international financing transactions. These instruments can potentially limit foreign exchange exposure by swapping borrowings denominated in one currency for borrowings denominated in another currency. At December 31, 2009 and 2008, we had no foreign exchange options or interest rate and currency swap agreements outstanding.
See Note 13, "Fair Value Measurements and Other Financial Instruments," for a discussion of the inputs and valuation techniques used to determine the fair value of our outstanding derivative instruments.
The following table details the fair value of our derivative instruments included on the consolidated balance sheets.
| |
Fair Value of Asset Derivatives(1) | Fair Value of (Liability) Derivatives(1) | ||||||||||||
|---|---|---|---|---|---|---|---|---|---|---|---|---|---|---|
| |
December 31, 2009 |
December 31, 2008 |
December 31, 2009 |
December 31, 2008 |
||||||||||
Derivatives designated as hedging instruments: |
||||||||||||||
Foreign currency forward contracts |
$ | 0.1 | $ | — | $ | (0.2 | ) | $ | (0.1 | ) | ||||
Interest rate swaps |
$ | — | $ | — | $ | (0.5 | ) | $ | — | |||||
Derivatives not designated as hedging instruments: |
||||||||||||||
Foreign currency forward contracts |
$ | 0.1 | $ | 14.6 | $ | (3.6 | ) | $ | (1.8 | ) | ||||
Total |
$ | 0.2 | $ | 14.6 | $ | (4.3 | ) | $ | (1.9 | ) | ||||
- (1)
- Asset derivatives were included in other current assets for the foreign currency forward contracts and other assets for the interest rate swaps. Liability derivatives were included in other current liabilities for
91
SEALED AIR CORPORATION AND SUBSIDIARIES
Notes to Consolidated Financial Statements (Continued)
(Amounts in tables in millions, except share and per share data)
Note 12 Derivatives and Hedging Activities (Continued)
foreign currency forward contracts and other liabilities for interest rate swaps on the consolidated balance sheets.
The following table details the effect of our derivative instruments on the consolidated statements of operations.
| |
Amount of Gain (Loss) Recognized in Net Earnings on Derivatives(1) Year Ended December 31, |
||||||
|---|---|---|---|---|---|---|---|
| |
2009 | 2008 | |||||
Derivatives designated as hedging instruments: |
|||||||
Interest rate swaps |
$ | 1.5 | $ | (2.1 | ) | ||
Foreign currency forward contracts(2) |
0.5 | (0.4 | ) | ||||
Derivatives not designated as hedging instruments: |
|||||||
Foreign currency forward contracts(2) |
(24.1 | ) | (2.9 | ) | |||
Foreign currency option contracts(2) |
— | (0.2 | ) | ||||
Total |
$ | (22.1 | ) | $ | (5.6 | ) | |
- (1)
- Amounts
recognized on the foreign currency forward and option contracts were included in other (expense) income. Amounts recognized on the interest rate
swaps were included in interest expense on the consolidated statements of operations.
- (2)
- The net gains and losses included above were largely offset by the net losses and gains resulting from the remeasurement of underlying foreign currency denominated items.
Note 13 Fair Value Measurements and Other Financial Instruments
Fair Value Measurements
In determining fair value, we utilize valuation techniques that maximize the use of observable inputs and minimize the use of unobservable inputs to the extent possible and consider counterparty credit risk in our assessment of fair value. Fair value measurement should be determined based on assumptions that market participants would use in pricing an asset or liability in the principal or most advantageous market. When considering market participant assumptions in fair value measurements, the following fair value hierarchy distinguishes between observable and unobservable inputs, which are categorized in one of the following levels:
- •
- Level 1 Inputs: Unadjusted quoted prices in active markets for identical assets or liabilities accessible to the
reporting entity at the measurement date.
- •
- Level 2 Inputs: Other than quoted prices included in Level 1 inputs that are observable for the asset or liability, either directly or indirectly, for substantially the full term of the asset or liability.
92
SEALED AIR CORPORATION AND SUBSIDIARIES
Notes to Consolidated Financial Statements (Continued)
(Amounts in tables in millions, except share and per share data)
Note 13 Fair Value Measurements and Other Financial Instruments (Continued)
- •
- Level 3 Inputs: Unobservable inputs for the asset or liability used to measure fair value to the extent that observable inputs are not available, thereby allowing for situations in which there is little, if any, market activity for the asset or liability at measurement date.
December 31, 2009
|
Total Fair Value |
Level 1 | Level 2 | Level 3 | ||||||||||
|---|---|---|---|---|---|---|---|---|---|---|---|---|---|---|
Cash equivalents |
$ | 65.0 | $ | — | $ | 65.0 | $ | — | ||||||
Available-for-sale securities |
$ | 13.7 | $ | — | $ | — | $ | 13.7 | ||||||
Derivative financial instruments net liability: |
||||||||||||||
Interest rate swaps |
$ | 0.5 | $ | — | $ | 0.5 | $ | — | ||||||
Foreign currency forward contracts |
$ | 3.6 | $ | — | $ | 3.6 | $ | — | ||||||
December 31, 2008
|
Total Fair Value |
Level 1 | Level 2 | Level 3 | ||||||||||
|---|---|---|---|---|---|---|---|---|---|---|---|---|---|---|
Cash equivalents |
$ | 32.1 | $ | 1.9 | $ | 30.2 | $ | — | ||||||
Available-for-sale securities |
$ | 10.7 | $ | — | $ | — | $ | 10.7 | ||||||
Derivative financial instruments net asset: |
||||||||||||||
Foreign currency forward contracts |
$ | 12.7 | $ | — | $ | 12.7 | $ | — | ||||||
The following table shows a reconciliation of our available-for-sale securities, which are measured at fair value on a recurring basis using Level 3 inputs, as of December 31, 2009 (in millions):
Estimated fair value as of December 31, 2008 |
$ | 10.7 | |||
Unrealized gains recorded in other comprehensive income in 2009 |
7.0 | ||||
Other than temporary impairment included in earnings in 2009 |
(4.0 | ) | |||
Estimated fair value as of December 31, 2009 |
$ | 13.7 | |||
Cash Equivalents
Our cash equivalents at December 31, 2009 consisted of investments in commercial paper (fair value determined using Level 2 inputs). Our cash equivalents at December 31, 2008 included time deposits (fair value determined using Level 1 inputs) and commercial paper (fair value determined using Level 2 inputs). Since these are short-term highly liquid investments with original maturities of three months or less at the date of purchase, they present negligible risk of changes in fair value due to changes in interest rates.
Available-for-Sale Securities
Available-for-sale securities consist of auction rate securities, which are recorded at fair value on the consolidated balance sheets using an income approach valuation technique based on our observations by analysis and interpretation from related securities in secondary markets (Level 3 inputs).
Since these auction rate securities do not currently have readily available or observable prices, we used the income approach to determine the fair value of these securities. We calculated an estimated fair value for these investments using a bond calculation. The valuation methodology included the following inputs and assumptions:
Maturity—Our debt instruments investments have stated maturities that exceed 11 years, while the other investments are non-cumulative perpetual preferred stock investments with no maturity dates. Our
93
SEALED AIR CORPORATION AND SUBSIDIARIES
Notes to Consolidated Financial Statements (Continued)
(Amounts in tables in millions, except share and per share data)
Note 13 Fair Value Measurements and Other Financial Instruments (Continued)
valuation model assumes that auctions of all of the investments will resume or that a financial resolution will otherwise be achieved within the next 10 years (the "workout period").
Coupon—All of these investments are variable rate instruments, with interest rates resetting every 28 days based on a pre-determined formula. Since the workout period is assumed to be 10 years, we used the 10-year U.S. dollar interest rate swap rate plus an additional issuer credit spread to reflect a fixed coupon for the debt instruments over the 10-year period. Our coupon assumptions for the December 31, 2008 and 2009 fair value valuations include a zero coupon rate for the two perpetual preferred stock investments since AMBAC (the securities' issuer) had an option to cancel the dividends on its common stock as of or after December 31, 2008. On August 1, 2009, AMBAC discontinued its dividend payments on these securities.
Yield-to-Maturity—We used the 10-year U.S. dollar interest rate swap rate plus credit default swap spreads for each issuer. We also included an additional liquidity risk premium of 100 basis points in our yield-to-maturity assumption.
Our valuation methodology calculations are subjective and involve uncertainties and matters of significant judgment. Changes in assumptions could significantly affect our estimates.
See Note 5, "Available-for-Sale Investments," for additional information.
Derivative Financial Instruments
Our foreign currency forward contracts are recorded at fair value on the consolidated balance sheets using the income approach valuation technique based on observable market inputs (Level 2).
Observable market inputs used in the calculation of the fair value of foreign currency forward contracts include foreign currency spot and forward rates obtained from an independent third party market data provider. In addition, other pricing data quoted by various banks and foreign currency dealers involving identical or comparable instruments are included.
Our interest rate swaps are recorded at fair value on the consolidated balance sheet using the income approach valuation technique based on observable market inputs (Level 2).
Observable market inputs used in the calculation of the fair value of interest rate swaps include pricing data from counterparties to these swaps, and a comparison is made to other market data including U.S. Treasury yields and swap spreads involving identical or comparable derivative instruments.
Counterparties to these foreign currency forward contracts and interest rate swaps are rated at least A- by Standard & Poor's and A3 by Moody's. None of these counterparties experienced any significant ratings downgrades in the year ended December 31, 2009. The fair value generally reflects the estimated amounts that we would receive or pay to terminate the contracts at the reporting date.
94
SEALED AIR CORPORATION AND SUBSIDIARIES
Notes to Consolidated Financial Statements (Continued)
(Amounts in tables in millions, except share and per share data)
Note 13 Fair Value Measurements and Other Financial Instruments (Continued)
Other Financial Instruments
The following financial instruments are recorded at fair value or at amounts that approximate fair value: (1) receivables, net, (2) certain other current assets, (3) accounts payable and (4) other current liabilities. The carrying amounts reported on the consolidated balance sheets for the above financial instruments closely approximate their fair value due to the short-term nature of these assets and liabilities.
Other liabilities that are at carrying value on our consolidated balance sheets include our senior notes. To calculate the fair value of our senior notes at December 31, 2009 and December 31, 2008, we utilize a market approach. Due to their limited investor base and the relatively small face value of each issue of the senior notes, they may not be actively traded on the date the fair value is calculated. Therefore, we utilize prices and other relevant information generated by market transactions involving similar securities, reflecting U.S. Treasury yields to calculate the yield to maturity and the price on each of our senior notes. These inputs are provided by an independent third party and are considered to be Level 2 inputs as described above.
We derived the fair value estimates of our various other debt instruments by evaluating the nature and terms of each instrument, considering prevailing economic and market conditions, and examining the cost of similar debt offered at the balance sheet date. We also incorporate our credit default swap rates and currency specific swap rates in the valuation of each debt instrument, as applicable.
These estimates are subjective and involve uncertainties and matters of significant judgment, and therefore we cannot determine them with precision. Changes in assumptions could significantly affect our estimates.
The carrying amounts and estimated fair values of our debt at December 31, 2009 and December 31, 2008 were as follows:
| |
December 31, 2009 | December 31, 2008 | |||||||||||||
|---|---|---|---|---|---|---|---|---|---|---|---|---|---|---|---|
| |
Carrying Amount |
Fair Value |
Carrying Amount |
Fair Value |
|||||||||||
12% Senior Notes due February 2014(1) |
$ | 299.5 | $ | 372.5 | $ | — | $ | — | |||||||
7.875% Senior Notes due June 2017 |
391.8 | 424.0 | — | — | |||||||||||
6.875% Senior Notes due July 2033 |
448.5 | 423.0 | 448.5 | 315.0 | |||||||||||
5.625% Senior Notes due July 2013 |
399.4 | 416.0 | 399.3 | 320.0 | |||||||||||
3% Convertible Senior Notes redeemed July 2009 |
— | — | 431.3 | 374.9 | |||||||||||
6.95% Senior Notes matured May 2009 |
— | — | 136.7 | 135.3 | |||||||||||
Other foreign loans |
109.0 | 115.4 | 48.5 | 48.4 | |||||||||||
Other loans |
12.8 | 23.8 | 14.7 | 11.2 | |||||||||||
Total debt |
$ | 1,661.0 | $ | 1,774.7 | $ | 1,479.0 | $ | 1,204.8 | |||||||
- (1)
- The carrying value and fair value of such debt includes adjustments due to interest rate swaps. See Note 12, "Derivatives and Hedging Activities."
Credit and Market Risk
Financial instruments, including derivatives, expose us to counterparty credit risk for nonperformance and to market risk related to changes in interest or currency exchange rates. We manage our exposure to counterparty credit risk through specific minimum credit standards, diversification of counterparties, and procedures to monitor concentrations of credit risk.
95
SEALED AIR CORPORATION AND SUBSIDIARIES
Notes to Consolidated Financial Statements (Continued)
(Amounts in tables in millions, except share and per share data)
Note 13 Fair Value Measurements and Other Financial Instruments (Continued)
We do not expect any of our counterparties in derivative transactions to fail to perform as it is our policy to have counterparties to these contracts that are rated at least A- by Standard & Poor's and A3 by Moody's. Nevertheless, there is a risk that our exposure to losses arising out of derivative contracts could be material if the counterparties to these agreements fail to perform their obligations.
We regularly monitor the impact of market risk on the fair value and cash flows of our derivative and other financial instruments considering reasonably possible changes in interest and currency exchange rates and restrict the use of derivative financial instruments to hedging activities. We do not use derivative financial instruments for trading or other speculative purposes and do not use leveraged derivative financial instruments.
We continually monitor the creditworthiness of our diverse base of customers to which we grant credit terms in the normal course of business and generally do not require collateral. We consider the concentrations of credit risk associated with our trade accounts receivable to be commercially reasonable and believe that such concentrations do not leave us vulnerable to significant risks of near-term severe adverse impacts. The terms and conditions of our credit sales are designed to mitigate concentrations of credit risk with any single customer. Our sales are not materially dependent on a single customer or a small group of customers.
Note 14 Profit Sharing, Retirement Savings Plans and Defined Benefit Pension Plans
Profit Sharing and Retirement Savings Plans
We have a non-contributory profit sharing plan covering most of our U.S. employees. Contributions to this plan, which are made at the discretion of our board of directors, may be made in cash, shares of our common stock, or in a combination of cash and shares of our common stock. We also maintain a contributory thrift and retirement savings plan in which most of our U.S. employees are eligible to participate. The contributory thrift and retirement savings plan generally provides for our contributions in cash based upon the amount contributed to the plan by the participants. Our contributions to or provisions for the profit sharing plan and thrift and retirement savings plan are charged to operations and amounted to $37.8 million in 2009, $25.2 million in 2008 and $32.8 million in 2007. In 2009, we contributed approximately 0.5 million shares of our common stock as part of our contribution to the profit sharing plan. These shares were issued out of treasury stock. In 2008 and 2007, there were no shares of common stock issued for our contribution to the profit sharing plan.
Defined Benefit Pension Plans
We recognize the funded status of each defined pension benefit plan measured as the difference between the fair value of plan assets and the projected benefit obligations of the employee benefit plans on the consolidated balance sheet, with a corresponding adjustment to accumulated other comprehensive loss, net of taxes. Each over funded plan is recognized as an asset and each under funded plan is recognized as a liability on our consolidated balance sheets. Subsequent changes in the funded status are recognized in unrecognized pension items, a component of accumulated other comprehensive loss, that is included in total stockholders' equity. The amount of unamortized pension items is recorded net of tax. The measurement date used by us to determine projected benefit obligations and plan assets is December 31.
United States
A limited number of our U.S. employees, including some employees who are covered by collective bargaining agreements, participate in defined benefit pension plans. The following table presents our funded
96
SEALED AIR CORPORATION AND SUBSIDIARIES
Notes to Consolidated Financial Statements (Continued)
(Amounts in tables in millions, except share and per share data)
Note 14 Profit Sharing, Retirement Savings Plans and Defined Benefit Pension Plans (Continued)
status for 2009 and 2008 for our U.S. pension plans. The measurement date for the defined benefit pension plans presented below is December 31 of each period.
| |
2009 | 2008 | ||||||
|---|---|---|---|---|---|---|---|---|
Change in benefit obligation: |
||||||||
Projected benefit obligation at beginning of period |
$ | 53.9 | $ | 44.5 | ||||
Service cost |
1.5 | 1.8 | ||||||
Interest cost |
3.1 | 2.7 | ||||||
Actuarial (gain) loss |
(1.7 | ) | 2.8 | |||||
Curtailment |
— | 3.2 | ||||||
Benefits paid |
(1.7 | ) | (1.1 | ) | ||||
Projected benefit obligation at end of period |
$ | 55.1 | $ | 53.9 | ||||
Change in plan assets: |
||||||||
Fair value of plan assets at beginning of period |
$ | 31.8 | $ | 36.9 | ||||
Actual gain (loss) on plan assets |
5.4 | (8.5 | ) | |||||
Employer contributions |
2.4 | 4.5 | ||||||
Benefits paid |
(1.7 | ) | (1.1 | ) | ||||
Fair value of plan assets at end of period |
37.9 | 31.8 | ||||||
Under funded status at end of year |
$ | (17.2 | ) | $ | (22.1 | ) | ||
Amounts included on the consolidated balance sheets consisted of other liabilities of $17.2 million in 2009 and $22.1 million in 2008.
The following table shows the components of our net periodic benefit cost for the three years ended December 31, 2009, for our U.S. pension plans charged to operations.
| |
2009 | 2008 | 2007 | ||||||||
|---|---|---|---|---|---|---|---|---|---|---|---|
Components of net periodic benefit cost: |
|||||||||||
Service cost |
$ | 1.5 | $ | 1.8 | $ | 1.4 | |||||
Interest cost |
3.1 | 2.7 | 2.5 | ||||||||
Expected return on plan assets |
(2.6 | ) | (3.0 | ) | (2.8 | ) | |||||
Amortization of net prior service cost |
0.5 | 0.7 | 0.7 | ||||||||
Amortization of net actuarial loss |
1.4 | 0.7 | 1.1 | ||||||||
Net periodic benefit cost |
$ | 3.9 | $ | 2.9 | $ | 2.9 | |||||
The amounts in accumulated other comprehensive loss, net of taxes, that have not yet been recognized as components of net periodic benefit cost at December 31, 2009, are:
Unrecognized prior service costs |
$ | 1.0 | |||
Unrecognized net actuarial loss |
12.6 | ||||
Total |
$ | 13.6 | |||
97
SEALED AIR CORPORATION AND SUBSIDIARIES
Notes to Consolidated Financial Statements (Continued)
(Amounts in tables in millions, except share and per share data)
Note 14 Profit Sharing, Retirement Savings Plans and Defined Benefit Pension Plans (Continued)