Attached files
UNITED STATES
SECURITIES AND EXCHANGE COMMISSION
WASHINGTON, D.C. 20549
FORM 10-K
[X] ANNUAL REPORT PURSUANT TO SECTION 13 OR 15(d) OF THE SECURITIES EXCHANGE ACT OF 1934 FOR THE FISCAL YEAR ENDED DECEMBER 31, 2009.
[ ] TRANSITION REPORT PURSUANT TO SECTION 13 OR 15(d) OF THE SECURITIES EXCHANGE ACT OF 1934 For the transition period from ____________________ to ____________________
Commission file number: 001-13577
PREMIERE GLOBAL SERVICES, INC.
(Exact name of registrant as specified in its charter)
| Georgia | 59-3074176 |
| (State or other jurisdiction of incorporation or organization) | (I.R.S. Employer Identification No.) |
3280 Peachtree Road, N.W., The Terminus Building, Suite 1000, Atlanta, Georgia 30305
(address of principal executive office)
(Registrant's telephone number, including area code): (404) 262-8400
Securities registered pursuant to Section 12(b) of the Act:
| Common Stock, Par Value $0.01 Per Share | New York Stock Exchange |
| (Title of each class) | (Name of each exchange on which registered) |
Securities registered pursuant to Section 12(g) of the Act:
None
(Title of class)
Indicate by check mark if the registrant is a well-known seasoned issuer, as defined in Rule 405 of the Securities Act. [ ] Yes [X] No
Indicate by check mark if the registrant is not required to file reports pursuant to Section 13 or Section 15(d) of the Act. [ ] Yes [X] No
Indicate by check mark whether the registrant (1) has filed all reports required to be filed by Section 13 or 15(d) of the Securities Exchange Act of 1934 during the preceding 12 months (or for such shorter period that the registrant was required to file such reports), and (2) has been subject to such filing requirements for the past 90 days. Yes [X] No [ ]
Indicate by check mark whether the registrant has submitted electronically and posted on its corporate Web site, if any, every Interactive Data File required to be submitted and posted pursuant to Rule 405 of Regulation S-T (§232.405 of this chapter) during the preceding 12 months (or for such shorter period that the registrant was required to submit and post such files). Yes [ ] No [ ]
Indicate by check mark if disclosure of delinquent filers pursuant to Item 405 of Regulation S-K (§229.405 of this chapter) is not contained herein, and will not be contained, to the best of registrant's knowledge, in definitive proxy or information statements incorporated by reference in Part III of this Form 10-K or any amendment to this Form 10-K. [ ]
Indicate by check mark whether the registrant is a large accelerated filer, an accelerated filer, a non-accelerated filer or a smaller reporting company. See the definitions of “large accelerated filer,” “accelerated filer” and “smaller reporting company” in Rule 12b-2 of the Exchange Act (Check one):
Large accelerated filer [X] Accelerated filer [ ] Non-accelerated filer [ ] Smaller reporting company [ ]
(Do not check if a smaller reporting company)
Indicate by check mark whether the registrant is a shell company (as defined in Rule 12b-2 of the Act). Yes [ ] No [X]
The aggregate market value of the voting and non-voting common equity held by nonaffiliates computed by reference to the price at which the common equity was last sold, or the average bid and asked price of such common equity, on June 30, 2009 as reported by the New York Stock Exchange was approximately $614,677,842.
As of February 23, 2009, 60,048,311 shares of the registrant's common stock were outstanding.
DOCUMENTS INCORPORATED BY REFERENCE
Portions of the registrant’s proxy statement for its 2010 annual meeting of shareholders are incorporated by reference in Part III of this Form 10-K.
FORWARD-LOOKING STATEMENTS
When used in this annual report on Form 10-K and elsewhere by us or by management from time to time, the words “believes,” “anticipates,” “expects,” “will,” “may,” “should,” “intends,” “plans,” “estimates,” “predicts,” “potential,” “continue” and similar expressions are intended to identify forward-looking statements concerning our operations, economic performance and financial condition. For those statements, we claim the protection of the safe harbor for forward-looking statements contained in the Private Securities Litigation Reform Act of 1995. These statements are based on a number of assumptions and estimates that are inherently subject to significant risks and uncertainties, many of which are beyond our control and reflect future business decisions which are subject to change. A variety of factors could cause actual results to differ materially from those anticipated in our forward-looking statements, including the following factors:
-
Our ability to compete based on price and services and against our existing and future competitors;
-
Our ability to respond to rapid technological change and the development of alternatives to our services;
-
Market acceptance of new services and enhancements to existing services;
-
Costs or difficulties related to the integration of any new or acquired businesses and technologies;
-
Concerns regarding the security of transactions and transmitting confidential information over the Internet and public networks;
-
Our ability to upgrade our equipment or increase our network capacity to meet customer demands;
-
Our services may be interrupted due to failure of our or third-party platforms and network infrastructure utilized in providing our services;
-
Continued weakness in our legacy broadcast fax services, which is part of our PGiSend solution;
-
Our ability to efficiently utilize or re-negotiate our telecommunications supply agreements;
-
Increased leverage may harm our financial condition and results of operations;
-
Our dependence on our subsidiaries for cash flow may negatively affect our business and our ability to pay amounts due under our indebtedness;
-
Our financial performance could cause future write-downs of goodwill or other intangible assets in future periods;
-
Assessment of income, state sales and other taxes by government authorities for which we have not accrued;
-
Our ability to attract and retain qualified key personnel;
-
Our ability to successfully identify suitable acquisition candidates, complete acquisitions, integrate acquired operations into our existing operations or expand into new markets;
-
Our ability to protect our proprietary technology and intellectual property rights;
-
Possible adverse results of pending or future litigation or adverse results of current or future infringement claims;
-
Regulatory or legislative changes may adversely affect our business;
i
-
Possible adverse results if our services become subject to government regulations applicable to traditional telecommunications service providers;
-
Risks associated with expansion of our international operations and fluctuations in currency exchange rates;
-
Domestic and international terrorist activity, war and political instability may adversely affect the level of services utilized by our customers and the ability of those customers to pay for services utilized;
-
General economic or business conditions, internationally, nationally or in the local jurisdiction in which we are doing business, may be less favorable than expected;
-
Risks associated with weakening global economic and credit conditions, including customer consolidations, bankruptcies and payment defaults;
-
Changes in and the successful execution of restructuring and cost reduction initiatives and the market reaction thereto;
-
Factors described under the caption Item 1A. “Risk Factors” in this annual report; and
-
Factors described from time to time in our press releases, reports and other filings made with the Securities and Exchange Commission.
We caution that these factors are not exclusive. Consequently, all of the forward-looking statements made in this annual report and in other documents filed with the Securities and Exchange Commission, or SEC, are qualified by these cautionary statements. Readers are cautioned not to place undue reliance on these forward-looking statements, which speak only as of the date of this annual report. We undertake no obligation to publicly release the results of any revisions to these forward-looking statements that may be made to reflect events or circumstances after the date of this annual report, or the date of the statement, if a different date.
ii
INDEX
iii
PART I
Overview
Premiere Global Services, Inc., or PGi, is a leading global provider of conferencing and collaboration solutions that enable companies and individuals to meet and collaborate in a more productive and efficient manner. We have a global presence in 24 countries and an established base of more than 50,000 customers, including nearly 90% of the Fortune 500. Every month, we facilitate approximately 3 million virtual group meetings with greater than 12 million participants worldwide.
We offer our solutions in the on-demand, software-as-a-service, or SaaS, model, meaning our customers are not burdened with the up-front expense and complexity associated with purchasing and installing hardware and software solutions. Further, our model enables customers to avoid the headcount and ongoing operating costs required to support internal solutions, the expense of platform upgrades and the business risk of technology obsolescence.
In 2009, we expanded our offerings to include a managed services model to deliver comprehensive collaboration solutions via SaaS and private, dedicated virtual environments that enable global enterprise customers to consolidate and outsource all of their collaboration technologies. We also began developing a new collaboration platform intended to bring together the benefits of audio, web and video collaboration into a single, browser-based application. We believe both of these initiatives will significantly increase the addressable market opportunity for our solutions by integrating new technologies that are currently outside the conferencing industry as traditionally defined.
Our solutions are scalable and customizable and can be integrated with other technologies, including a customer’s existing voice-over-Internet-protocol, or VoIP, infrastructure. We host our solutions on our secure, enterprise-class platforms that are located around the world in our server and network operations centers and in third-party co-location facilities. This integrated network of platforms, our PGi Communications Operating System, utilizes our proprietary software and a variety of leading third-party applications.
Our solutions are available online through our website at www.pgi.com as well as through mobile device applications and access or jump-off points embedded in third-party applications. We also offer open standards access to our technology, which enables our customers and technology partners to integrate our capabilities directly into their existing systems.
Our collaboration solutions facilitate synchronous, real-time group meetings, as opposed to other technology providers that specialize in point-to-point communications or asynchronous, near-time communications. Our product strategy is focused on continuing to meet evolving user preferences for easier-to-use, visually compelling and more intuitive products. Although our current revenue mix is weighted toward audio conferencing services, we intend to transition our revenue mix toward more integrated, online meetings that deliver higher value to customers and to PGi.
In addition to conferencing and collaboration solutions, we also offer a broad suite of advanced messaging solutions that enable companies to communicate important, time-sensitive information to their constituents. These solutions empower customers to automate their paper-based or manual business processes with email, text messaging, Internet Protocol, or IP, fax, automated speech and other communication technologies.
We market our solutions globally through a multi-channel sales approach, including direct sales, resellers and strategic distribution technology partners, web-based marketing and direct telesales. We group our services into two solution sets: PGiMeet, which includes our conferencing and collaborations services, and PGiSend, which includes our advanced messaging services. In 2009, as part of our efforts to streamline our business, we divested our PGiMarket email marketing solutions, and we integrated our PGiNotify solutions into our PGiSend solutions.
We were incorporated in Florida in 1991 and reincorporated in Georgia in 1995. As of December 31, 2009, we had approximately 2,250 employees conducting business within our three reportable segments, which include North America, Europe and Asia Pacific. See Note 17 to our consolidated financial statements for the year ended December 31, 2009 included in this annual report for information concerning operations in our reportable segments.
1
Our corporate headquarters are located at 3280 Peachtree Road, N.W., The Terminus Building, Suite 1000, Atlanta, GA 30305, and our telephone number is (404) 262-8400.
Industry Background
According to Wainhouse Research, the global conferencing and collaboration market is projected to exceed $6 billion in 2010, with a projected compound annual growth rate through 2013 of approximately 6%. We believe the industry will continue to grow, driven by companies’ increasing reliance on collaboration technologies as a result of recessionary pressures, the growing costs and hassle of business travel, environmental concerns and the constant need to improve productivity to remain competitive, among other factors. Collaboration has become a mission-critical backbone of modern business, as even the most basic tasks rely on the ability of individuals to communicate and share information in a cost-effective, real-time and productive manner.
Collaboration is at the core of our focus and expertise at PGi. Over our more than two decades of experience in this business, we have generated meaningful revenue growth, garnered a world-class customer base of leading companies in nearly every industry and region of the world, increased our market share and helped lead and expand the industry through product innovation. We believe that these strengths, combined with our longstanding history of delivering results to our customers provide us with a significant competitive advantage in the market.
Today, the way in which people meet and collaborate is changing, supported by significant advances in communication technologies and evolving user habits and expectations. The past decade saw widespread adoption of audio conferencing around the world and across almost every industry vertical and business function. We believe the decade ahead will likely be defined by next-generation collaboration technologies that leverage software, the web, and desktop and mobile computing to deliver a more robust and engaging collaborative experience.
Our strategy is to lead this industry transition by leveraging our competitive strengths. In addition, we believe that our continuing innovation of new products, features and capabilities will greatly expand the addressable market for our services.
Solutions
We offer a broad suite of business applications in our two solution sets, including audio and web conferencing and collaboration and webcasting services in our PGiMeet solutions and digital fax, document delivery and notifications services in our PGiSend solutions. Our customers benefit from our anytime/anywhere access, global scalability, the freedom to pick from the precise collaboration tools they need, along with the option to work with SaaS-based or managed services delivery models.
PGiMeet
Our PGiMeet solutions include a full suite of traditional and VoIP-based audio and web conferencing and collaboration services for all forms of real-time group meetings, from large events, such as investor calls and training sessions, to smaller meetings, such as sales planning calls and project team meetings. PGiMeet services include automated reservationless conferencing, global reservationless conferencing with approximately 90 local access points, operator-assisted event conferencing, web collaboration and streaming webcast events. A few examples of meetings our PGiMeet solutions support include team meetings, employee training, company-wide events, sales meetings, customer webcasts, focus groups, investor relations calls and press announcements.
PGiSend
Our PGiSend solutions include fax and document delivery tools integrated with reliable IP fax technology and compelling notifications and reminders between businesses and their constituents delivered via automated speech, email, fax and SMS technologies. Users can send and receive faxes using their computer and existing email account with no additional hardware or software required. Paper documents can be converted into electronic files that can be distributed securely across the enterprise, archived remotely and accessed through an existing email account or web interface. Our PGiSend notifications provide customizable features, including recipient authentication, personalized messages with text-to-speech capabilities, hot key transfer for interactive messaging, data collection and real-time, online summary reports. A few examples of our many PGiSend applications include invoice processing, claims processing, delivery confirmations, travel confirmations, appointment reminders, fraud alerts and accounts receivable management.
2
PGiConnect®
Given our experience integrating and deploying accounts for large enterprises, we identified the need to streamline and better support customer integrations and application development. Our online developer community at www.PGiConnect.com allows developers, partners and customers to access PGi’s open-source, standards-based application program interfaces, or APIs, to facilitate seamless large scale integrations, account provisioning and new product development.
Customers
Our established base of greater than 50,000 customers, including nearly 90% of the Fortune 500, is diverse across industry vertical, region and size of company. Our customers, including leading software and technology companies, commercial and investment banks, retailers, travel and hospitality firms, healthcare companies and logistics companies, utilize our solutions to drive efficiencies and enhanced productivity within their businesses. We are focused on providing greater customer value by innovating new business applications backboned by our existing technologies that address the individual needs and requirements of targeted customer segments.
Most of our customer agreements have initial terms of one to three years, subject to automatic renewal unless a customer sends a notice of non-renewal prior to the end of an initial or renewal term. Customers may generally terminate without penalty, unless their agreement contains a minimum revenue commitment that requires payment by the customer of any unused shortfall amount upon termination.
While our business is generally not seasonal, we typically experience lower levels of sales and usage during periods that have reduced numbers of working days. For example, our operating results have historically decreased during the summer months, particularly in our Europe operations, as well as during the Thanksgiving, December and New Year holidays. We expect our revenues during these periods will not grow at the same rates as compared with other periods of the year because of decreased use of our services by our enterprise customers.
Sales and Marketing
To promote domain expertise and a greater understanding of our enterprise customers’ needs, we have segmented our sales professionals according to our solutions sets. Additionally, we have implemented a multi-channel sales approach to promote the transfer and adoption of best practices. Our current channels of distribution include global, enterprise, small and medium businesses, indirect partners and online web sales:
-
We sell directly to customers through our approximately 720 sales and marketing professionals worldwide;
-
We sell indirectly through distribution partners, including agents and resellers;
-
We actively pursue strategic technology partners to integrate and resell our services with their own; and
-
We employ web-based marketing and direct telesales to generate increased activity for our sales channels.
As a service organization, our customer service teams play a major role in managing customer relationships, as well as selling additional value-added services to existing accounts. We currently employ approximately 750 customer service professionals deployed in local markets around the world.
In 2009, we formed a new managed services sales force within our global accounts channel to meet an increasing customer demand to outsource the overall management of their collaboration technologies. In 2010, we began marketing our services around the world under the brand PGi supported by a new logo, website redesign and enhanced marketing collateral. We believe that these rebranding efforts will help us to build a brand that is a globally recognized asset for our company.
3
Research and Development
We believe that designing, developing, testing, deploying and supporting innovative technology in a timely manner allows us to better meet our customers’ needs and to differentiate and position ourselves in larger market segments. For example, during 2009, our new service launches included our PGiMeet iPhone® application, PGiMeet webcast streaming service and SaaS-based email delivery platform, as well as enhancements to Fax2Mail to integrate with Adobe® PDF functionality and upgrades to Netspoke®. We also deployed our GlobalMeet® 2 platform of media servers, which enables us to smart route traffic around the world using local access points. In 2010, we will continue our development efforts on our new meeting platform, which we intend to launch this year.
We devote significant resources to the innovation and development of new services, enhancements to existing services and to our website. We employ more than 140 research and development professionals, including overseas development teams. Our research and development costs from continuing operations for 2009, 2008 and 2007 were $17.0 million, $15.7 million and $12.5 million, respectively.
Competition
We believe the combination of communication technologies-based solutions supported by our global platforms is unique to the industry and that our broad range of solutions provide us with an advantage over many of our competitors that have more limited service offerings. In addition, our global reach allows us to pursue contract opportunities with multinational enterprises providing an advantage over competitors that only focus on limited geographies.
While we are unaware of any single competitor that provides all of the services we deliver, the markets for our solutions are highly competitive, rapidly evolving and subject to changing technology, shifting customer needs and introductions of new products and services.
In our PGiMeet solutions, we compete with major telecommunications service providers around the world such as AT&T Inc., Verizon Communications, Inc., Global Crossing Limited and international public telephone companies, such as BT Group plc. Additionally, we compete with independent conferencing service providers like West Corporation, ACT Teleconferencing, Inc., Westell Technologies, Inc. and Arkadin, Inc. We also compete with traditional and IP-based equipment manufacturers, business suite software providers and application service providers, such as Cisco Systems, Inc., Microsoft Corp., IBM Corporation, Adobe Systems Incorporated, Oracle Corporation, Saba Software, Inc. and Citrix Systems, Inc., which offer applications that enable web collaboration. These providers may attempt to leverage their dominant market positions through additional technical integration or bundled offerings to further expand their presences in the conferencing and collaboration market. In addition, we have entered into distribution and reseller arrangements with companies, including some of the companies listed above, that offer competitive conferencing and collaboration services that could choose to increase their emphasis on offerings competitive to us, cease to offer some or all of their services or our services, or both. For example, Cisco Systems offers web collaboration functionality within its WebEx suite of products and Microsoft offers Microsoft® Office Live Meeting and web collaboration functionality in its Microsoft® Office Communicator 2007 version. We also face competition for internally developed solutions for companies who choose to insource these needs.
In our PGiSend solutions, we compete with companies like Protus IP Solutions, EasyLink Services International Corporation and j2 Global Communications, Inc. Additionally, we compete with a range of equipment and software providers that enable enterprises to address these requirements internally. For certain of these solutions, we also compete with West Corporation, Varolii Corporation, SoundBite Communications, Inc. and Adeptra Limited.
Suppliers
We purchase telecommunications services pursuant to supply agreements with telecommunications service providers. Some of our agreements with telecommunications service providers contain commitments that require us to purchase a minimum amount of services through 2011. We expect these commitments to total approximately $32.9 million and $28.6 million in 2010 and 2011, respectively.
4
Government Regulation
We are subject to various federal, state, local and international laws regulating the provision of traditional telecommunications services. The following is a brief description of the major laws and regulations that could impact our business and the business of our customers. For a discussion of how these regulations may adversely impact our business, see Item 1A. Risk Factors – “Risks Related to Government Regulation.”
Telecommunications
We believe that we operate as a provider of enhanced information services and not as a common carrier. Consequently, we do not believe that we are subject to all Federal Communications Commission, or FCC, or state public service or utility commission regulations applicable to providers of traditional telecommunications services in the United States. We are subject to certain regulations imposed by the FCC and by international telecommunications regulatory authorities, however, and we may be affected by regulatory decisions, trends or policies issued or implemented by these regulatory authorities. In addition, telecommunications regulatory authorities may conclude that our services are subject to additional regulations and requirements applicable to providers of traditional telecommunications services. For example, on June 30, 2008, the FCC issued an order ruling that audio conferencing providers must contribute directly to the federal Universal Service Fund, or USF, on a prospective basis. In accordance with FCC rules, since August 1, 2008, we have filed quarterly and annual reports of revenues of certain of our conferencing subsidiaries with the Universal Service Administration Company, or USAC, and we make contributions to USF and recover those contributions from our applicable PGiMeet customers. Several providers of audio conferencing services have filed petitions requesting reconsideration of all or portions of the FCC’s order, which are currently pending.
There continues to be regulatory uncertainty as to the imposition of certain traditional common carrier regulations on VoIP services, which we use with respect to the delivery of many of our services. The adoption of, or changes in, such telecommunications laws and regulations could increase our operating costs and may affect the available delivery methods for and costs associated with our services. Regulatory authorities may also seek to regulate aspects of our services under new regulations on VoIP-enabled services, which would require us to comply with laws and regulations that currently are not applicable to us and could adversely affect our business.
Fax
The Telephone Consumer Protection Act of 1991, or TCPA, and the FCC rules implementing the TCPA, as amended by the Junk Fax Prevention Act of 2005, or JFPA, prohibit sending unsolicited fax advertisements and proscribe certain telemarketing practices. The FCC is authorized to take enforcement action against companies that send so-called “junk faxes” and individuals also may have a private cause of action. The FCC retained an exemption from liability for fax broadcast providers that solely transmit such advertisements on behalf of others. Fax broadcast providers, such as our subsidiary, Xpedite Systems, LLC, generally are not liable for their customers’ violations of the TCPA, although fax broadcast providers who have a “high degree of involvement” in their customers’ fax advertisements or “actual knowledge” of a customer’s violation of the TCPA may be held liable under certain circumstances under the TCPA. Although we have conducted our operations to meet the fax broadcaster provider exemption, third parties may seek to challenge this exemption. In addition, we may be subject to state laws and regulations regulating the unsolicited transmission of faxes, which may restrict fax solicitations more broadly than the federal law with respect to intrastate faxes. For example, in October 2005, the state of California passed a law purporting to regulate intrastate and interstate fax advertisements that did not contain an exemption that allowed fax advertisements to be sent to persons or entities with whom a sender had an established business relationship, or EBR, which is allowed with certain exceptions under the JFPA. Together with the U.S. Chamber of Commerce, we challenged this law in federal district court in California, with the court ruling that California’s regulation of interstate fax transmissions was impermissible.
Telemarketing
The FCC, along with the Federal Trade Commission, or FTC, has also instituted a national “do not call” registry for residential and wireless telephone numbers. Telemarketers making telephonic solicitations are barred from calling consumers who register their telephone numbers in the national database, with certain exceptions. Consumers are no longer required to re-register every five years, so numbers will remain on the list unless the consumer affirmatively removes a number or the number is deleted from the database in monthly administrative updates, such as in the case of an abandoned number. In summary, with certain exceptions, telemarketers are
5
required to access the list before engaging in telemarketing in any particular area code. In addition to the federal regulations, numerous state laws and regulations govern telemarketing activities, including state “do not call” list requirements and registration and bonding requirements. For instance, certain states regulate or restrict prerecorded telemarketing and other messages, and certain states may restrict or make political calls subject to “do not call” and other requirements even though such calls are exempt from the federal “do not call” requirements. As a service provider to companies that engage in telemarketing, we subscribe to the federal and certain state “do not call” registries.
Effective September 1, 2009, the FTC rules prohibit prerecorded telemarketing calls except in instances of written prior express consent. The rules also imposed certain other requirements, as of December 1, 2008, for permitted prerecorded telemarketing calls, including providing an interactive or key press opt-out mechanism for recipients to select to be added to an entity-specific “do not call” list. In January 2010, the FCC issued a notice of proposed rulemaking in which it is seeking comment on whether it should harmonize its prerecorded calling rules with those of the FTC. Currently, the FCC allows prerecorded telemarketing calls to residences if there is an EBR or prior consent, which is broader than the FTC's prior express written consent requirement. The FCC's rules also cover entities that are exempt from the FTC's jurisdiction, such as telecommunications carriers, banks, airlines and nonprofits. In addition, the FCC may require that prerecorded telemarketing calls include an automated, interactive mechanism by which a consumer may “opt out" of receiving future calls from the telemarketer. The FCC would continue to exempt non-telemarketing calls such as political, informational and transactional calls. The FTC rules, and if adopted the corresponding FCC proposals, could impact customer use of our broadcast voice services to the extent a customer sought to use these services for marketing messages, distinct from informational, transactional, political or other messages exempt under the agencies' rules.
Federal legislation known as the Can Spam law regulates unsolicited commercial emails, or spam. This law allows the FTC to impose fines and permits states and Internet service providers to bring lawsuits. The Can Spam law requires unsolicited email marketing messages to have a valid postal address. Email marketers may not use false or misleading headers or deceptive subject lines, must identify commercial email and are also required to remove customers from their emailing lists if requested. The Can Spam requirements apply to senders of email messages, but do not apply to entities who engage in “routine conveyance” of email messages, such as the transmission, routing or relaying, through an automatic technical process, emails for which another person has identified the recipients or provided the recipient addresses. We believe that our PGiSend email solutions fall within Can Spam’s routine conveyance exemption. The Can Spam law also preempts state laws in many respects, although it allows states to continue to regulate deceptive emails. A number of states have adopted laws restricting and/or governing the distribution of unsolicited emails, including child protection registry laws. Although we have a policy that prohibits the use of our services to send spam and requires our customers to comply with all laws and regulations pertaining to spam, we can offer no assurance that we are immune to litigation or enforcement actions alleging a violation of applicable federal and state laws.
Data Privacy
A number of legislative and regulatory proposals are under consideration or have already been enacted by federal and state lawmakers and regulatory bodies and may be adopted with respect to the Internet, data protection and privacy. Many states and foreign jurisdictions have passed laws requiring notification to consumers when there is a security breach of personal data, including credit card and other personally identifiable information, and mandating certain data security standards. For example, Massachusetts recently enacted new data privacy requirements for entities that receive, store, maintain, process or otherwise have access to “personal information” concerning Massachusetts residents in connection with the provision of goods or services. We could incur additional costs or be required to change our business practices in order to comply with these laws and regulations by their terms, where applicable, or if our customers seek to have us assume obligations as part of contractual negotiations.
In addition, we provide services to healthcare industry customers that are subject to the Health Insurance Portability and Accountability Act of 1996, or HIPAA, as modified and expanded by the Health Information Technology for Economic and Clinical Health Act, or HITECH Act, that was signed into law in February 2009. The HIPAA privacy and security rules, the recent HITECH Act changes to those rules and the related implementing regulations apply to our services to the extent we may be considered a “business associate” of one of our healthcare customers. These rules impose compliance obligations, breach notification requirements and extensive restrictions on the uses and disclosures of “protected health information,” or PHI. For example, with regard to our PGiSend solutions, there may be circumstances when a healthcare industry customer discloses PHI to us so that we can send notifications or
6
reminders to their clients. Depending on the facts, we arguably may be considered a business associate in such cases. In addition, we may have contractual obligations under business associate provisions with some of our customers. To the extent we are not subject to these rules, the Federal Trade Commission, or FTC, Health Breach Notification Rule, effective September 2009, may impose certain notification obligations on us as it relates to “personal health records,” or PHR, to the extent we are considered a “PHR-related entity” or “third party service provider” under such rule. Regulations to be issued in 2010 are expected to help further clarify the new requirements and their applicability. We are currently in the process of implementing a new privacy and security compliance program, including a risk assessment, policies and procedures, encryption of data to limit our access and outside access to PHI, auditing and notification of breach processes and training of applicable employees.
International Regulations
We are also subject to regulation by various international regulatory authorities, and because our services are accessible worldwide over the web, foreign jurisdictions may claim that we are required to comply with their laws. For example, countries within the European Union have specific regulations related to sending personal information from one country to another. The EU member states adopted a safe harbor arrangement that provides that U.S. organizations can adopt procedures that comply with European privacy regulations and can certify their compliance through notice to the U.S. Department of Commerce. Participation in the safe harbor is voluntary and indicates that the organization provides an adequate level of privacy protection and qualifies the company to receive data from EU member states. U.S. companies that avail themselves of the safe harbor arrangement are subject to oversight and possible enforcement actions by the FTC if they do not comply with the provisions of their certification. Our subsidiaries, Xpedite and American Teleconferencing Services, Ltd., have certified compliance with the EU safe harbor through the U.S. Department of Commerce. The European Privacy and Communications Directive also imposes restrictions on sending unsolicited communications to individuals via automatic calling machines, fax, email and SMS messages. Generally, companies are required to obtain prior explicit, or “opt-in,” consent before they can contact users via this type of marketing. In Canada, the Personal Information and Electronic Documents Act, or PIEDA, similarly regulates the collection and use of personal data and applies broadly to U.S. companies that conduct commercial activities in Canada. As we continue to expand and localize our international activities, we may become obligated to comply with the laws of additional jurisdictions, which may be more stringent or impose more significant burdens on businesses than those in the United States. Compliance in foreign jurisdictions may be more costly or may require us to change or restrict our business practices or services relative to those in the United States.
We monitor and have compliance procedures in place regarding applicable federal and state laws and regulations, and our customer agreements generally provide that our customers are responsible for their compliance with all applicable laws and regulations. We could, nevertheless, be subject to litigation by private parties and governmental bodies, including governmental enforcement actions, alleging a violation of such laws or regulations, which could result in damages, regulatory fines, penalties and possible other relief under such laws and regulations and the accompanying costs and uncertainties of litigation and enforcement actions.
Proprietary Rights and Technology
Our ability to compete is dependent in part upon our proprietary rights and technology. We currently have nine issued U.S. patents and 20 pending U.S. patent applications, as well as one issued international patent and 14 pending international patent applications. Our patents and patent applications relate to our audio and web conferencing, mobile solutions, document generation and delivery and fax distribution. We own and use a number of federally registered trademarks and pending applications for trademarks in the United States and in other countries, including Premiere Global Services & Design®, PGI & Design®, PGiConnect®, Powered by Premiere & Design®, Auditorium®, Fax2Mail (Stylized)®, faxREACH®, GlobalMeet®, iMeet®, Intellisend®, Irgent®, messageREACH®, Netspoke & Design®, ReadyCast®, ReadyConference®, ReadyConference® Plus, SaveOnConferences.com®, Soundpath®, smsREACH®, VisionCast® and voiceREACH®. We rely primarily on a combination of intellectual property laws and contractual provisions to protect our proprietary rights and technology. These laws and contractual provisions provide only limited protection of our proprietary rights and technology, which include confidential information and trade secrets that we attempt to protect through confidentiality and nondisclosure provisions in our agreements. We typically attempt to protect our confidential information and trade secrets through these contractual provisions for the terms of the applicable agreement and, to the extent permitted by applicable law, for some negotiated period of time following termination of the agreement. Despite our efforts to protect our proprietary rights and technology, third parties may misappropriate our proprietary rights or technology or independently develop technologies that are similar or superior to our technology.
7
We believe that our secure, proprietary technology platforms are a key element of our success, and we take substantial precautions to protect ourselves and our customers from events that could interrupt delivery of our services. These precautions include physical security systems, uninterruptible power supplies, on-site power generators, upgraded back-up hardware, fire protection systems and other contingency plans. In addition, some of our networks are designed so that the data on each network server is duplicated on a separate network server.
Available Information
Our website is www.pgi.com. Except as explicitly noted, the information on our website is not incorporated by reference in this annual report, or in any information furnished or submitted to the SEC. We make available, free of charge through our website our annual report on Form 10-K, quarterly reports on Form 10-Q, current reports on Form 8-K and amendments to those reports filed or furnished pursuant to Section 13(a) or 15(d) of the Securities Exchange Act of 1934, as amended, as soon as practicable after such material is electronically filed with, or furnished to, the SEC. Follow the “Investor Relations” tab to “SEC Filings” to access these filings.
Employees
As of December 31, 2009, we employed approximately 2,250 people worldwide. Our employees are not represented by a labor union or covered by any collective bargaining agreements. We consider our employee relations to be good.
Risks Relating to Our Industry
The markets for our services are intensely competitive, and we may not be able to compete successfully against existing and future competitors and, as a result, we may not be able to maintain or increase our market share and revenues.
The markets for our services are intensely competitive, and we expect competition to increase in the future. For information regarding the markets in which we compete, see “Business – Competition.” Many of our current and potential competitors, such as major telecommunications, equipment, software and application service providers, have longer operating histories, greater name recognition, more robust service offerings, more comprehensive support organizations, larger customer bases and substantially greater financial, personnel, marketing, engineering, technical and other resources than we do. As a result, our competitors may be able to respond more quickly than we can to new or emerging technologies and changes in customer demands. They may also be able to devote greater resources than we can to the development, promotion and sale of their products and services. We believe that our current competitors are likely to expand their service offerings and new competitors are likely to enter our markets. Some of our existing and potential competitors may enter into or expand their positions in the markets in which we compete through acquisitions, strategic alliances and the development of integrated service offerings. For example, West acquired several conferencing services providers, including Genesys, Raindance Communications, Inc., InterCall, ConferenceCall.com, ECI Conference Call Services, LLC and Sprint Nextel Corporation’s conferencing division, as well as Televox Software, Incorporated and CenterPost Communications in the automated notifications space. For example, Cisco Systems acquired WebEx Communications to augment its premises-based conferencing offerings, and now offers web collaboration functionality within its WebEx suite of products, and Microsoft acquired PlaceWare, Inc. and integrated PlaceWare’s services into its suite of Office series of applications, and now offers web collaboration capabilities through its Microsoft® Office Live Meeting web conferencing services. Also, we compete with companies with whom we also have distribution relationships or with whom we resell certain of their services, as well as with internally developed solutions for companies who choose to insource these needs. Increased competition could result in price pressure on our products and services and a decrease in our market share in the various markets in which we compete, either of which could hinder our ability to grow our revenues.
8
Technological changes, the development of alternatives to our services and our non-exclusive customer arrangements may cause us to lose market share and may hinder our ability to maintain or grow our revenues.
The market for our services is characterized by rapid technological change, frequent new service introductions and evolving industry standards. We expect new services and enhancements to existing services to be developed and introduced that will compete with our services. Technological advances may result in the development and commercial availability of alternatives to or new methods of delivering our services and pricing options that could be more attractive to our customers. These developments could cause our existing services to become obsolete, result in significant pricing pressure on our services or allow our existing and potential customers to meet their own business communications needs without using our services. Because we do not typically have long-term or exclusive contractual agreements with our customers or revenue commitments, and many of our larger enterprise customers allocate their business among multiple service providers, any of these developments could result in significant customer and associated revenue loss.
We must continually introduce new services and enhancements to existing services in response to technological changes, evolving industry standards and customer demands. Our ability to successfully develop and market such new services and enhancements depends, in part, on our ability to:
-
foresee changes in industry standards;
-
anticipate and apply advances in technologies;
-
enhance our software, applications, equipment, systems and networks; and
-
attract and retain qualified and creative technical personnel.
For example, in 2009, we began developing our new collaboration platform. In order for this new platform to succeed in the future, we believe the demand for collaboration technology will need to shift from the products and services currently offered by our competitors and by us, or from other technologies that facilitate information sharing that are currently outside the collaboration industry as traditionally defined, to this next generation technology. Our new services and enhancements may not be as successful as our competitors’ solutions. In addition, if we are unable to develop new services and enhancements or if we experience delays in their introduction, we will not be able to gain market share and increase our revenues.
We are subject to pricing pressures for our services which could cause us to lose market share and decrease revenues and profitability.
We compete for customers based on several factors, including price. If we cannot compete based on price, we may lose market share. If we reduce our rates without increasing our volume or our market share, our revenues could decrease. For example, we have experienced declines in the average selling price per minute of services across our solution sets, including within our PGiMeet solutions, which we currently expect to continue. In some cases, our competitors may offer their services at reduced rates or free on a trial basis in order to win customers. In addition, telecommunications service providers will generally have lower telecommunications costs as a result of their ownership of an underlying telecommunications network and may offer services similar to ours at reduced rates. Due to competitive factors and the rapidly changing marketplace for our services, we have reduced our pricing in certain circumstances and expect we may be required to further reduce our pricing in the future. Further, an increase in our rates or a reduction in our rates without a proportionate decrease in our associated costs could have a material adverse effect on our results of operations.
Risks Relating to Our Business
Recent global economic trends or a prolonged recession could adversely affect our business and financial results.
As widely reported, the recent disruption in the global financial markets, including severely diminished liquidity and credit availability, stock market volatility, substantially increased unemployment, reduced corporate profits and capital spending and continuing economic uncertainties have significantly adversely impacted global economic conditions. Our business trends and revenue growth continue to be affected by the challenging economic climate, higher global unemployment and lower global business activity. These difficult economic conditions as well as a prolonged recession could adversely affect our business and results of operations, primarily though our access to credit and the adverse impact these conditions may have on our customers. These conditions have resulted in a substantial tightening of the credit markets, including lending by financial institutions, which is our source for borrowing and liquidity, and have increased the cost of capital and reduced the availability of credit. Although we
9
anticipate refinancing our existing credit facility in the first half of 2010, prior to its scheduled maturity in April 2011, we expect pricing to be higher than our current level due to general credit market conditions. Any such refinancing could require significantly more expensive interest rates and covenants that restrict our operations to a significantly greater extent. In addition, a prolonged recession and the uncertainty about future economic conditions may adversely affect our customers’ level of spending, ability to obtain financing for purchases, ability to make timely payments to us for our services and adoption of new technologies, which could require us to increase our allowance for doubtful accounts, negatively impact our days sales outstanding, lead to increased price competition and adversely affect our results of operations. These conditions may also force some of our customers, such as customers in the financial services or other industries, to announce additional layoffs, consolidate or declare bankruptcy, which could decrease the market for our services.
Our future success depends on market acceptance of our new services.
Market acceptance of our new services often requires that individuals and enterprises accept new ways of communicating and exchanging information. Our growth depends on the successful development and introduction of new services and enhancements to our existing services. For example, we recently announced our intention to launch a virtual meeting platform this year. We believe that the success of this new platform will depend on customer perceptions as to the technological and operational benefits or improved user experience associated with it as compared to alternative products and services. A failure to achieve broad market acceptance of or a decline in the demand for our new services could hinder our ability to maintain and increase our revenues. We believe that broad market acceptance of our new services will depend on several factors, including:
-
ease of use;
-
price;
-
reliability;
-
accessibility to our services;
-
quality of service;
-
system security;
-
product functionality; and
-
the effectiveness of our strategic marketing and sales efforts and distribution relationships.
If we do not meet these challenges, our new services may not achieve broad market acceptance or market acceptance may not occur quickly enough to justify our investment in these services.
We believe that continuing to strengthen our current services and brands and effectively launching new services and brands will require continued focus on active marketing efforts. For example, we currently anticipate an increase in selling and marketing expense in 2010 as compared to 2009 relating to the launch of our new meeting platform later this year. The demand for and cost of advertising have been increasing and may continue to increase. Accordingly, we may need to spend increasing amounts of money on, and devote greater resources to, advertising, marketing and other efforts to create and maintain brand loyalty among users. Promotional efforts may not yield increased revenues, and even if they do, any increased revenues may not offset the expenses incurred in building our brand. If we fail to promote and maintain our brand, or if we incur substantial expense in an unsuccessful attempt to promote and maintain our brand, our business could be harmed.
Our success depends on our ability to attract, retain and further penetrate large global enterprise customers.
We must retain and continue to expand our ability to reach and penetrate large global enterprise customers. These customers may request special pricing, such as bundled pricing or volume discounts, and generally have longer sales cycles, which could negatively impact our revenues. In 2009, we formed a new managed services sales force within our global accounts channel to meet an increasing customer demand for this method of delivering our services. Our inability to attract and retain these types of customers could have a material adverse effect on our results of operations, and these efforts may result in additional expenses without proportionally increasing our revenues.
10
If we cannot successfully integrate new technologies, we may not generate sufficient revenues and operational synergies may not develop.
We have experienced and may continue to experience difficulty integrating new technologies into our existing systems. For example, in 2009, we began accepting direct Session Initiation Protocol, or SIP, from our customers, which requires significant coordination and planning. If we cannot successfully integrate new technologies, we may not generate sufficient revenues and operational synergies may not develop.
Concerns regarding security of transactions and transmitting confidential information over the Internet and public networks may have an adverse impact on the use of our web-based services.
Concerns regarding the security of confidential information, such as customers’ business, credit card or other personally identifiable information, transmitted over the Internet and public networks may prevent customers from using our web-based services. Despite the security measures we have taken, our infrastructure is potentially vulnerable to physical or electronic break-ins, viruses or similar problems. If someone is able to circumvent our security measures, they could misappropriate our proprietary information or cause interruption in our operations. Because the techniques used to obtain unauthorized access, disable or degrade service or sabotage systems change frequently and often are not recognized until launched, we may be unable to anticipate these techniques or to implement adequate preventative measures.
Actual or perceived security breaches could damage our reputation, expose us to a risk of loss or liability and result in a loss of confidence in the security of our services that could potentially have an adverse effect on our business. We may be required to make additional significant investments in efforts to protect against and remedy these types of security breaches. In addition, some of our customers are subject to varying degrees of government regulation, particularly in the insurance, healthcare and financial services industries. Increased interest in data privacy protections and information security obligations could impose additional regulatory pressures on our customers’ businesses, and indirectly, on our operations. Some of our customers may seek to impose certain data privacy and information security obligations on us. If we are unable to adequately address these concerns, our business and results of operations could suffer. Compliance with new privacy and security laws, requirements and regulations, where required or undertaken by us, may result in cost increases due to potential systems changes, the development of additional administrative processes and increased enforcement actions and fines and penalties. While we strive to comply with all applicable data protection laws and regulations as well as our own posted privacy policies, any failure or perceived failure to comply or any misappropriation, loss or other unauthorized disclosure of sensitive or confidential information may result in proceedings or actions against us by government entities or others, or could cause us to lose customers, which could potentially have an adverse effect on our business, reputation and results of operations.
Technological obsolescence of our equipment could result in substantial capital expenditures.
Technological advances may result in the development of new equipment and changing industry standards, which could cause our equipment to become obsolete. These events could require us to invest significant capital in upgrading or replacing our equipment. For example, we have significantly increased our number of VoIP ports on a global basis. We believe these media servers effectively address our current requirements and enable us to grow our business effectively; however, new standards could be introduced in the future and may require us to upgrade some of these servers in certain regions around the world.
If we fail to increase our network capacity to meet customer demands, the quality of our service offerings may suffer.
We continuously attempt to predict growth in our network usage and add capacity accordingly. If we do not accurately predict and efficiently manage growth in our network usage, the quality of our service offerings may suffer and we may lose customers. For example, during 2009, we increased capacity requirements as a result of local access arrangements with certain of our large customers.
11
Downtime in our network infrastructure could result in the loss of significant customers and revenues.
We currently maintain facilities with telecommunications equipment in locations throughout the world. The delivery of our services is dependent, in part, upon our ability to protect the equipment and data at our facilities against damage that may be caused by fire, power loss, technical failures, unauthorized intrusion, natural disasters, sabotage and other similar events. Despite taking a variety of precautions, we have experienced downtime in our networks from time to time due to service or network outages and periodic system upgrades, and we may experience downtime in the future. For example, in 2009, we continued to migrate to third-party colocation facilities in order to better service our expanding infrastructure demands. As a result, we may experience configuration demands with these colocation facilities that could impact our service quality. Although we believe that we take substantial precautions to protect ourselves and our customers from events that could interrupt delivery of our services, service interruptions could still occur and result in the loss of significant customers, which could cause us to lose revenues. While we maintain business interruption insurance providing for aggregate coverage of approximately $80 million per policy year, we may not be able to maintain insurance for this risk in the future, or it may not continue to be available at reasonable prices. Even if we maintain insurance for this risk, it may not be sufficient to compensate us for losses that we experience due to our inability to provide services to our customers.
Interruption in third-party services that we use could result in service delays and disruptions and a loss of significant customers and revenues.
Our ability to maintain and expand our business depends, in part, on our ability to continue to obtain telecommunications, financial systems hosting services and web-based services on favorable terms from traditional and VoIP telecommunications service providers, local exchange carriers, financial systems hosting providers and Internet service providers. We do not own a telecommunications network and host a significant portion of our financial systems. As a result, we depend on a variety of third-party providers for telecommunications services, web conferencing services, call origination and termination local transmission, Internet access and financial systems. We have experienced delays and disruptions in our services in the past due to service interruptions from telecommunications service providers. For example, we have experienced interruptions in service as a result of our underlying carriers’ network outages and as a result of increased traffic volumes. Any interruptions in the delivery of our services due to third-party outages could result in a loss of significant customers and revenues.
Continued weakness in our legacy broadcast fax services may negatively impact our financial performance.
We have experienced declines in revenue from our legacy broadcast fax services and expect continued declines in the future. Our future success is dependent in part upon our ability to transition our broadcast fax customers to our newer technologies, such as email and voice delivery services. If we are unable to convert these customers to our alternative solutions, our results of operations could be adversely impacted.
Our inability to efficiently utilize or re-negotiate minimum purchase requirements in our telecommunications supply agreements could decrease our profitability.
Our ability to maintain and expand our business depends, in part, on our ability to continue to obtain telecommunications services on favorable terms from telecommunications service providers. The total amount of our minimum purchase requirements in 2009 was approximately $37.8 million, and we incurred telecommunications costs in excess of these minimums. Agreements with some of our telecommunications service providers contain minimum purchase requirements through 2011. These commitments total approximately $61.5 million, with annual costs of approximately $32.9 million and $28.6 million in 2010 and 2011, respectively. In addition, certain circuits and colocation services that we purchase are subject to term requirements, including penalties for early termination. Other telecommunications suppliers may provide similar services at lower prices, and we may not be able to re-negotiate our current supply agreements to achieve comparable lower rates. Such additional costs may require us to increase the prices for our services to our customers. We can give no assurance that we will be able to utilize the minimum amount of services that we are required to purchase under our telecommunications supply agreements. Moreover, if we are unable to obtain telecommunications services on favorable terms or if we are required to purchase more services than we are able to utilize in the operation of our business, the costs of providing our services would likely increase, which could decrease our profitability and have a material adverse effect on our business, financial condition and results of operations.
12
Our level of indebtedness may harm our financial condition and results of operations.
As of December 31, 2009, we have utilized approximately $260.8 million of indebtedness, including approximately $254.9 million in borrowings and $5.9 million in letters of credit outstanding under our $375.0 million credit facility. From time to time, we enter into interest rate swaps to reduce our exposure to market risk from changes in interest rates on interest payments associated with our credit facility. As of December 31, 2009, we had one $100.0 million interest rate swap, for a three-year period ending in August 2010 with a fixed rate of approximately 4.75%.
Our level of indebtedness will have several important effects on our future operations, including, without limitation:
-
A portion of our cash flows from operations will be dedicated to the payment of any interest or amortization required with respect to outstanding indebtedness;
-
Increases in our outstanding indebtedness and leverage will increase our vulnerability to adverse changes in general economic and industry conditions, as well as to competitive pressure;
-
Depending on the levels of our outstanding debt, our ability to obtain additional financing for working capital, acquisitions, capital expenditures, general corporate and other purposes may be limited; and
-
Recent credit market events and the subsequent tightening of the availability of capital both from financial institutions and the debt markets may have an adverse effect on our ability to access additional capital.
At the scheduled maturity of our credit facility in April 2011 or in the event of an acceleration of the indebtedness under our credit facility following an event of default, the entire outstanding principal amount of the indebtedness under the facility, together with all other amounts payable thereunder from time to time, will become due and payable. It is possible that we may not have sufficient funds to pay such obligations in full at maturity or upon such acceleration. If we default and are not able to pay any such obligations due, our lenders have liens on substantially all of our assets and could foreclose on our assets in order to satisfy our obligations. We anticipate refinancing our existing credit facility in the first half of 2010. However, given the current uncertainty in the credit and financial markets, we may not be able to enter into a new credit facility on substantially similar terms or otherwise on terms favorable to us or, alternatively, extend the tenor of our existing credit facility when it matures, which may affect our future results of operations. In addition, we currently expect pricing on a new credit facility to be higher than current levels due to general credit market conditions.
Our dependence on our subsidiaries for cash flow may negatively affect our business and our ability to meet our debt service obligations.
We conduct substantially all of our business through our subsidiaries. Our ability to pay amounts due under our indebtedness in the future will be dependent upon the ability of our subsidiaries to make cash distributions of earnings, loans or other payments to us based on their earnings and cash flows. Our subsidiaries may not have sufficient funds or may not be able to distribute sufficient funds to us to enable us to service or repay such indebtedness.
We may not realize the anticipated savings of our restructuring and cost reduction initiatives.
To allow us to operate more efficiently and control costs, we incurred several restructuring charges in 2009 related to the consolidation and streamlining of various functions of our workforce. As part of these consolidations, we incurred severance costs related to the elimination of approximately 500 positions and lease termination costs associated with office locations in North America and Europe. We will continue to pay the costs associated with these charges over the next nine years. We may not realize the expected benefits of these initiatives and may incur additional restructuring costs in the future. In addition, we could experience delays, business disruptions, unanticipated employee turnover and increased litigation-related costs in connection with our restructuring efforts. The complex nature of these restructuring initiatives could cause difficulties or delays in the implementation of any such initiative or the impact of the restructuring initiatives may not be immediately apparent. There can be no
13
assurance that our estimates of the savings achievable by these initiatives will be realized, which could have an adverse impact on our financial condition or results of operations.
Our financial performance could cause future write-downs of goodwill or other intangible assets in future periods, which could have a material adverse effect on our results of operations.
As of December 31, 2009, we had $354.6 million of goodwill not subject to amortization and $24.8 million of other intangible assets, net of amortization, reflected in our consolidated financial statements including $22.1 million for which amortization will continue. During 2009, we determined that goodwill and intangible assets with a net book value of approximately $0.9 million and $0.3 million, respectively, were impaired. We wrote off the related assets and recorded the net book value as asset impairments reflected as discontinued operations during the year ended December 31, 2009. Goodwill is not subject to amortization but is subject to an annual impairment review. We are required to exercise significant judgment in identifying and assessing whether impairment indicators exist or if events or changes in circumstances have occurred, including market conditions, operating results, competition and general economic conditions. Any change in our key assumptions could result in an impairment charge that could materially adversely affect our results of operations and financial condition.
We may be subject to assessment of income, state sales and other taxes for which we have not accrued.
We have reserves for certain state sales and excise tax contingencies based on the likelihood of obligation. At December 31, 2009 and 2008, we had reserved $4.4 and $4.6 million, respectively, for certain state sales and excise tax contingencies. These reserved amounts are included in “Accrued taxes, other than income taxes” in our consolidated balance sheets. We believe we have appropriately accrued for these contingencies. In the event that actual results differ from these reserves, we may need to make adjustments, which could materially impact our financial condition and results of operations.
Historically, we have collected and remitted state sales tax from our non-PGiMeet solutions customers in applicable states, but we have not collected and remitted state sales tax from our PGiMeet solutions customers in all applicable jurisdictions. However, we have learned that certain of our PGiMeet solutions may be subject to telecommunications excise tax statutes in certain states. During the years ended December 31, 2009 and 2008, we paid $0.1 million and $2.8 million related to the settlement of certain of these state sales and excise tax contingencies.
In addition, states may disagree with our method of assessing and remitting such taxes or additional states may subject us to inquiries regarding such taxes. For example, in May 2009, one of our former subsidiaries, PTEKVentures.com, Inc., a Nevada corporation formally dissolved in 2002, received a notice of proposed income tax assessment from the Georgia Department of Revenue totaling approximately $22.7 million as of June 15, 2009. Because we are at a preliminary stage of the process for resolving this dispute with the Georgia Department of Revenue, we cannot, at this time, reasonably estimate the amount, if any, of taxes or other interest, penalties or additions to tax that would ultimately be assessed at the conclusion of the process, and therefore have not accrued any amounts related to this assessment. We are also not able to currently estimate when the administrative procedures and review within the Georgia Department of Revenue will be completed. We believe we have meritorious defenses and will continue to vigorously contest this matter. However, if the Georgia Department of Revenue’s initial position is sustained, the amount assessed would result in a material adjustment to our consolidated financial statements and would adversely impact our financial condition and results of operations.
If our quarterly results do not meet the expectations of public market analysts and investors, our stock price may decrease.
Our quarterly revenues are difficult to forecast because the market for our services is rapidly evolving and our services are primarily usage-based and event-driven, as we have operated historically without subscription fees or minimum commitments. Our expense levels are based, in part, on our expectations as to future revenues. If our revenue levels are below expectations, we may be unable or unwilling to reduce expenses proportionately, and our operating results would likely be adversely affected. In addition, we believe that unlike many technology companies, we entered into 2009 with good business momentum and revenue growth in our PGiMeet solutions, which will make quarterly prior period comparisons difficult. As a result, we believe that period-to-period comparisons of our results of operations are not necessarily meaningful and should not be relied upon as indications of future performance. It is possible that our operating results may fail to meet the expectations of public market analysts and investors in a future quarter, which will likely cause the market price of our common stock to decline.
14
Our operating results have varied significantly in the past and may vary significantly in the future. Specific factors that may cause our future operating results to vary include:
-
fluctuations in operating expenses;
-
increased competition and pricing pressure;
-
the reliability and performance of our services;
-
the timing of new service announcements;
-
market acceptance of new and enhanced versions of our services;
-
changes in regulations and legislation that may affect the competitive environment for our services; and
-
general economic and seasonal factors.
Our stock has been volatile and we expect that it will continue to be volatile.
Our stock price has been volatile, and we expect it will continue to be volatile. For example, during the year ended December 31, 2009, the closing price of our common stock ranged from a high of $12.52 to a low of $6.89. The volatility of our stock price can be due to factors such as:
-
fluctuating operating results;
-
announcements by us or our competitors of significant technological innovations, customer contracts, acquisitions, strategic alliances, joint ventures or capital commitments; and
-
changes in security analysts’ estimates of our performance or our failure to meet analysts’ expectations.
Many of these factors are beyond our control. In addition, broad market and industry factors may negatively impact our stock price, regardless of our operating performance.
The performance of our business depends on attracting and retaining qualified key personnel.
Our performance depends on attracting and retaining key personnel, including executive, sales and marketing personnel and customer support, product development and other technical personnel. Failure to do so could have a material adverse effect on the performance of our business and the results of our operations.
Our articles and bylaws and Georgia corporate law may inhibit a takeover which may be in the best interests of our shareholders.
There are several provisions in our articles and bylaws and under Georgia corporate law that may inhibit a takeover, even when a takeover may be in the interests of our shareholders. For example, our board of directors is empowered to issue preferred stock without shareholder action. The existence of this “blank-check” preferred stock could render more difficult or discourage an attempt to obtain control of us by means of a tender offer, merger, proxy contest or otherwise. We are also subject to provisions of the Georgia corporate law that relate to business combinations with interested shareholders, which can serve to inhibit a takeover. In addition to considering the effects of any action on us and our shareholders, our articles permit our board to consider the interests of various constituencies, including employees, customers, suppliers, creditors, communities in which we maintain offices or operations and other factors which they deem pertinent, in carrying out and discharging their duties and responsibilities and in determining what the board believes to be in our best interests.
15
Risks Related to Acquisitions
We face risks in connection with completed or potential acquisitions.
Our growth has been enhanced through acquisitions of businesses, products and technologies that we believe will complement our business. We regularly evaluate acquisition opportunities, frequently engage in acquisition discussions, conduct due diligence activities in connection with possible acquisitions and, if appropriate, engage in acquisition negotiations. We may not be able to successfully identify suitable acquisition candidates, complete acquisitions, integrate acquired operations into our existing operations or expand into new markets. In addition, we compete for acquisitions and expansion opportunities with companies that have substantially greater resources, and competition with these companies for acquisition targets could result in increased prices for possible targets. Acquisitions also involve numerous additional risks to us and our investors, including:
-
risk in retaining key acquired management, employees and acquired customers;
-
difficulties in the assimilation of the operations, services and personnel of the acquired assets or company;
-
outages of operations infrastructure of acquired businesses prior to transition to our infrastructure;
-
diversion of our management’s attention from other business concerns;
-
assumption of known and unknown or contingent liabilities;
-
adverse financial impact from the amortization of expenses related to intangible assets;
-
incurrence of indebtedness;
-
potential adverse financial impact from failure of acquisitions to meet internal revenue and earnings expectations;
-
entry into markets in which we have little or no direct prior experience; and
-
potentially dilutive issuances of equity securities.
If we fail to adequately manage these acquisition risks, the acquisitions may not result in revenue growth, operational synergies or service or technology enhancements, which could adversely affect our financial results. In connection with the integrations of our acquisitions, we have experienced some delays in obtaining anticipated cost savings and increases in past due receivables due to delays in integrations and technology enhancements required of our infrastructure.
Risks Related to Intellectual Property
We may not be able to protect our proprietary technology and intellectual property rights, which could result in the loss of our rights or increased costs.
We rely primarily on a combination of patents, trademarks, trade secrets, copyrights and contractual provisions to protect our proprietary technology and intellectual property rights. These measures provide only limited protection. If we are not able to protect our proprietary technology and intellectual property rights, we could lose those rights and incur substantial costs policing and defending those rights. If our means of protecting these proprietary rights are not adequate, our competitors may independently develop similar or competitive technologies and the perception of our services to customers and potential customers may become confused in the marketplace. In addition, the laws of some foreign countries do not protect our proprietary rights to as great an extent as the laws of the United States.
16
Successful prosecution of claims alleging patent, copyright or trademark infringement against us could result in substantial costs.
Many patents, copyrights and trademarks have been issued in the general areas of information services, telecommunications, computer telephony and the Internet. From time to time, in the ordinary course of our business, we have received and expect to continue to receive notices, or be subject to third-party claims or proceedings, alleging that our current or future products or services infringe the patent, copyright or trademark rights or other intellectual property rights of third parties. In addition, our resellers or customers may allege that we are obligated to indemnify them for similar claims made against them. We evaluate such claims when they arise to determine whether the claims are valid or infringed by our operations and whether it would be more effective to obtain a license or dispute that any infringement is occurring. We have at times in the past obtained licenses from parties claiming to hold patents that they contended were infringed by our services. For example, in June 2008, we settled a lawsuit filed by Ronald A. Katz Technology Licensing, L.P. against three conferencing service providers, including us, alleging patent infringement relating to our automated conferencing services and paid Katz for a non-exclusive, fully paid license and release pursuant to this settlement. We have also received a letter from an affiliate of j2Global Communications, Inc. offering the license of certain of j2 Global’s patents and informing us of the existence and potential applicability of those patents on certain of our PGiSend services. Due to the inherent uncertainties of litigation, we are unable to predict the outcome of any infringement proceedings or claims, and an adverse outcome could have a material effect on our business, financial condition and results of operations. We ultimately may not prevail on any such claims and any claiming parties may have significantly greater resources than we have to pursue litigation of these types of claims. Any infringement claim, whether with or without merit, could:
-
be time consuming and a diversion to management;
-
result in costly litigation;
-
cause delays in introducing new services or enhancements; and
-
result in costly royalty or licensing agreements.
If a successful claim is made against us and we fail to develop non-infringing technology, our business, financial condition and results of operations could be materially adversely affected.
Risks Related to Government Regulation
If our services are subject to further government regulations applicable to traditional telecommunications service providers, our ability to deliver our services could be adversely impacted and our results of operations could be impaired.
Our business is affected by regulatory decisions, trends and policies made by international, federal and state telecommunications regulatory agencies, including the FCC and state public service or utility commissions, as well as state taxing authorities. We do not believe that our enhanced information services are subject to the same regulations as those applicable to traditional telecommunications service providers in the United States. However, it is possible that regulatory authorities may take a different position and may seek to require us to submit to traditional telecommunications carrier regulation under the Communications Act of 1934, as amended. For example, on June 30, 2008, the FCC issued an order ruling that audio conferencing providers must contribute directly to the federal USF on a prospective basis. In accordance with the FCC rules, since August 1, 2008, we have filed quarterly and annual reports of revenues of certain of our conferencing subsidiaries with the USAC and we make contributions to USF and recover those contributions from applicable PGiMeet customers. The extent to which our services are viewed as the provision of telecommunications rather than as an offering of enhanced information services will affect our USF contribution payments, as well as the federal regulations with which we must comply. It is possible that state regulatory authorities may also seek to require us to submit to traditional telecommunications carrier regulation under various state laws and that state taxing authorities may similarly attempt to subject our PGiMeet solutions to their telecommunications excise tax statutes. For example, we accrued approximately $4.0 million in the second quarter of 2008 in connection with one such state’s telecommunications excise tax statutes. It is too early to predict how regulatory requirements may affect customer demand for our PGiMeet solutions or our existing or future competitors, as well as whether regulatory or taxing authorities will
17
impose additional requirements, regulations, charges or taxes on the provision of certain of our services. Although we use reasonable efforts to monitor applicable regulatory requirements, if we fail to comply with any applicable government regulations, or if we were required to submit to the jurisdiction of state government authorities as providers of traditional telecommunications services, we could become subject to additional reporting and compliance obligations and/or could be subject to litigation, fines, forfeitures, taxes, regulatory surcharge remittance requirements or other penalties arising from any noncompliance. Subjecting our services to these regulations would increase our operating costs and could have a material adverse affect on our business, financial condition and results of operations.
Regulatory and legislative changes may discourage our customers from using some of our services and could adversely impact our results of operations.
Regulatory and legislative changes have imposed, or could impose, additional restrictions that may impact our business, including the passage of federal, state, local and international laws, rules and regulations relating to unsolicited fax advertising, telemarketing, spam and data privacy. For example, the TCPA and associated FCC rules prohibit the sending of unsolicited fax advertisements and proscribe certain telemarketing practices. Other federal laws implemented by the FTC also substantially regulate telemarketing, including the establishment of a nationwide “do not call” registry for residential and wireless telephone numbers. The Can Spam law places certain requirements on senders of commercial email, including requiring senders to honor opt-out requests and banning false and deceptive headers and subject lines. In addition to federal laws and regulations, numerous state laws and regulations govern such activities.
Many states and foreign jurisdictions have passed laws requiring notification to consumers when there is a security breach of personal data, including credit card and other personally identifiable information. Failure to comply with any applicable data privacy laws could subject us to lawsuits, fines, criminal penalties, statutory damages, adverse publicity and other losses that could harm our business. Further, any failure by us to protect our users’ privacy and data could result in a loss of user confidence in our services and ultimately in a loss of users, which could adversely affect our business. In addition, to the extent we are considered a “business associate” under HIPAA or the recent HITECH Act changes, violations of these rules could subject us to criminal and civil penalties, as well as possible contractual penalties, tort remedies and other losses that could harm our business. To the extent we are not subject to these rules, we may be subject to the FTC Health Breach Notification Rule to the extent we are considered a “PHR-related entity” or “third party service provider” under such rule, violations of which would be treated as unfair and deceptive acts or practices.
Compliance with applicable laws and regulations could have an adverse impact on the volume of fax, voice and email messages sent utilizing our PGiSend solutions. Although we believe we comply with laws and regulations applicable to us, we could nevertheless be subject to litigation, fines, losses or other penalties under such laws and regulations.
Risks Related to International Operations and Expansion
There are risks inherent in international operations that could hinder our international growth strategy.
Our ability to achieve future success will depend in part on the expansion of our international operations. For example, we are currently in the process of forming subsidiaries in India and China. Conducting our business internationally presents numerous inherent difficulties and risks that could prevent us from selling our services in other countries or hinder our expansion once we have established international operations, including, among other things, the following:
-
burdensome regulatory requirements and unexpected changes in these requirements;
-
export restrictions and controls relating to technology;
-
data privacy laws that may apply to the transmission of our customers’ data to the United States;
-
tariffs and other trade barriers;
-
difficulties in staffing and managing international operations including utilizing foreign telecommunication providers;
18
-
localization of our services, including translation into foreign languages and associated expenses;
-
accounting (including managing internal control over financial reporting in our non-U.S. subsidiaries), tax and legal complexities arising from international operations;
-
longer accounts receivable payment cycles and collection difficulties;
-
political and economic instability, including terrorist activity and war;
-
fluctuations in currency exchange rates;
-
potential difficulties in transferring funds generated overseas to the U.S. in a tax efficient manner;
-
seasonal reductions in business activity during the summer months in Europe and other parts of the world; and
-
potentially adverse tax consequences.
We have experienced, and will likely continue to experience, losses from fluctuations in currency exchange rates.
A risk inherent in our international operations is the exposure to fluctuations in currency exchange rates. We conduct business in 24 countries with approximately 41% of our consolidated net revenues and 35% of our operating expenses generated in countries outside the United States. As a result, we may experience material losses in revenues and earnings from fluctuations in foreign currencies. For example, current global economic conditions have caused extreme and unprecedented volatility in foreign currency exchange rates, which we estimate negatively impacted our consolidated revenues by approximately $11.6 million in the year ended December 31, 2009 as compared to the same period in 2008. We anticipate that such fluctuations will continue to impact our financial results. We cannot predict when this volatility will cease or the extent of its impact on our future financial results. We typically denominate foreign transactions in foreign currencies and have not engaged in hedging transactions, although we may engage in hedging transactions from time to time in the future relating to foreign currency exchange rates.
Item 1B. Unresolved Staff Comments
None.
Our current corporate headquarters occupy approximately 55,000 square feet of office space in Atlanta, Georgia under leases entered into by two of our subsidiaries that are guaranteed by us, which expire in August 2018. We occupy additional space of approximately 94,000 square feet in Colorado Springs, Colorado under a lease expiring in August 2010, approximately 88,000 square feet in Olathe, Kansas under a lease expiring in November 2018 and approximately 45,000 square feet in Tinton Falls, New Jersey under a lease expiring in May 2016. We will move our Colorado Springs operations to another location in Colorado Springs in September 2010 under a lease we entered into for approximately 88,000 square feet expiring in November 2020.
We have also entered into leases for sales offices and server equipment within and outside the United States. We believe that our current facilities and office space are sufficient to meet our present needs and do not anticipate any difficulty securing additional space, as needed, on terms acceptable to us.
In May 2009, one of our former subsidiaries, PTEKVentures.com, Inc., a Nevada corporation formally dissolved in 2002, received a notice of proposed income tax assessment from the Georgia Department of Revenue totaling approximately $22.7 million as of June 15, 2009. Because we are at a preliminary stage of the process for
19
resolving this dispute with the Georgia Department of Revenue, we cannot, at this time, reasonably estimate the amount, if any, of taxes or other interest, penalties or additions to tax that would ultimately be assessed at the conclusion of the process, and therefore have not accrued any amounts related to this assessment. We are also not able to currently estimate when the administrative procedures and review within the Georgia Department of Revenue will be completed. We believe we have meritorious defenses and will continue to vigorously contest this matter. However, if the Georgia Department of Revenue’s initial position is sustained, the amount assessed would result in a material adjustment to our consolidated financial statements and would adversely impact our financial condition and results of operations.
We are involved from time to time in other legal proceedings that we do not believe will have a material adverse effect upon our business, financial condition or results of operations, although we can offer no assurance as to the ultimate outcome of any such proceedings.
Item 4. Submission of Matters to a Vote of Security Holders
No matter was submitted to a vote of our security holders during the fourth quarter of the fiscal year covered by this report.
20
Part II
Item 5. Market for Registrant's Common Equity, Related Stockholder Matters and Issuer Purchases of Equity Securities
Our common stock, $.01 par value per share, is listed on the New York Stock Exchange under the symbol “PGI”. The following table sets forth the high and low sales prices of our common stock as reported on the NYSE for the periods indicated.
| 2009 | High | Low |
|
|
|
|
| Fourth Quarter |
$ 8.34
|
$ 7.20
|
| Third Quarter |
$10.97
|
$ 7.63
|
| Second Quarter |
$12.93
|
$ 8.41
|
| First Quarter |
$10.74
|
$ 6.80
|
| 2008 | High | Low |
|
|
|
|
| Fourth Quarter |
$14.02
|
$ 5.18
|
| Third Quarter |
$16.90
|
$13.48
|
| Second Quarter |
$16.00
|
$13.40
|
| First Quarter |
$15.70
|
$10.64
|
The closing price of our common stock as reported on the NYSE on February 23, 2009 was $8.31. As of February 23, 2009 there were 584 record holders of our common stock.
We have never paid cash dividends on our common stock, and the current policy of our board of directors is to retain any available earnings for use in the operation and expansion of our business. The payment of cash dividends on our common stock is unlikely in the foreseeable future. Any future determination to pay cash dividends will be at the discretion of our board and will depend upon our earnings, capital requirements, financial condition and any other factors deemed relevant by our board.
Our credit facility contains customary prohibitions on our ability to declare any cash dividends on our common stock until all obligations under the credit facility are paid in full and all letters of credit have been terminated. See Item 7. “Management’s Discussion and Analysis of Financial Condition and Results of Operations” in this annual report.
Issuer Purchases of Equity Securities
The following table sets forth repurchases in the fourth quarter of 2009 of our common stock pursuant to our stock repurchase program:
| Period | Total Number of Shares Purchased |
Average Price Paid Per Share |
Total Number of Shares Purchased as Part of Publicly Announced Plans or Programs |
Maximum Number of Shares that May Yet Be Purchased Under the Plans or Programs(1) |
|
|
|
|
|
|
| October 1 - 31, 2009 | 339,600 | $ 7.73 | 339,600 | 2,560,100 |
| November 1-31, 2009 | 810,400 | $ 7.72 | 810,400 | 1,749,700 |
|
|
|
|||
| Total | 1,150,000 | $ 7.72 | 1,150,000 | 1,749,700 |
| (1) |
In June 2006, our board of directors authorized, and we announced, a stock repurchase program under which we could purchase up to 7.0 million shares of our common stock. Through December 31, 2009, we had repurchased 5,250,300 shares pursuant to our stock repurchase program. Our stock repurchase program does not have an expiration date. |
In 2007, we also completed a self-tender offer pursuant to which we repurchased and retired approximately 9.7 million shares of our common stock.
21
Stock Performance Graph
The following graph shows the cumulative total shareholder return on our common stock, the Standard & Poor's 500 Composite Stock Price Index and the S&P 500 Software & Services Index for the period beginning December 31, 2004 and ending December 31, 2009. The graph assumes an investment in our common stock, the S&P 500 and the S&P 500 Software & Services Index of $100 on December 31, 2004, and that all dividends were reinvested. Total return calculations were prepared by the Research Data Group, Inc. The stock price performance in this graph is not necessarily indicative of the future performance of our common stock.
COMPARISON OF 5 YEAR CUMULATIVE TOTAL RETURN
Among Premiere Global Services, Inc., The S&P Index
And The S&P 500 Software & Services Index
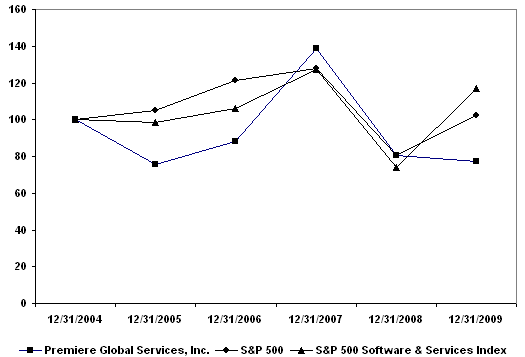
|
12/31/04
|
12/31/05
|
12/31/06
|
12/31/07
|
12/31/08
|
12/31/09
|
|
|
|
|
|
|
|
|
|
| Premiere Global Services, Inc. |
100.00
|
75.91
|
88.14
|
138.66
|
80.39
|
77.03
|
| S&P 500 |
100.00
|
104.91
|
121.48
|
128.16
|
80.74
|
102.11
|
| S&P 500 Software & Services Index |
100.00
|
98.26
|
106.15
|
127.42
|
74.16
|
116.79
|
This performance graph shall not be deemed “filed” for purposes of Section 18 of the Securities Exchange Act of 1934, as amended or incorporated by reference into any of our filings under the Securities Act of 1933, as amended, or the Exchange Act, except as shall be expressly set forth by specific reference in such filing.
22
Item 6. Selected Financial Data
The following selected consolidated statement of operations data, balance sheets data and statement of cash flows data as of and for the years ended December 31, 2009, 2008, 2007, 2006 and 2005 have been derived from our audited consolidated financial statements. The selected consolidated financial data should be read in conjunction with Item 7. “Management's Discussion and Analysis of Financial Condition and Results of Operations" and our consolidated financial statements and the notes hereto in Item 8. “Financial Statements and Supplementary Data” included in this annual report.
|
2009
|
2008
|
2007
|
2006
|
2005
|
|||||||||||
|
|
|
|
|
|
|
|
|
|
|
||||||
| Statement of Operations Data: | |||||||||||||||
| Net revenues | $ | 601,522 | $ | 620,400 | $ | 554,920 | $ | 493,336 | $ | 497,473 | |||||
| Operating income | 44,323 | 76,138 | 66,217 | 48,706 | 75,279 | ||||||||||
| Income from continuing operations attributable to | |||||||||||||||
| common and common equivalent shares for: | |||||||||||||||
| —basic earnings per share | 21,330 | 40,594 | 33,385 | 26,980 | 48,686 | ||||||||||
| —diluted earnings per share | 21,330 | 40,594 | 33,385 | 26,980 | 48,686 | ||||||||||
| Income from continuing operations per common | |||||||||||||||
| and common equivalent shares for: | |||||||||||||||
| —basic (1) | $ | 0.36 | $ | 0.68 | $ | 0.53 | $ | 0.39 | $ | 0.69 | |||||
| —diluted (1) | $ | 0.36 | $ | 0.67 | $ | 0.52 | $ | 0.39 | $ | 0.67 | |||||
| Loss from discontinued operations | (7,721 | ) | (4,491 | ) | (2,943 | ) | (1,471 | ) | (1,269 | ) | |||||
| Net income attributable to common and common | |||||||||||||||
| equivalent shares for: | |||||||||||||||
| —basic earnings per share | 13,609 | 36,103 | 30,442 | 25,509 | 47,417 | ||||||||||
| —diluted earnings per share | 13,609 | 36,103 | 30,442 | 25,509 | 47,417 | ||||||||||
| Net income per common and common | |||||||||||||||
| equivalent shares for: | |||||||||||||||
| —basic (1) | $ | 0.23 | $ | 0.61 | $ | 0.49 | $ | 0.37 | $ | 0.67 | |||||
| —diluted (1) | $ | 0.23 | $ | 0.60 | $ | 0.48 | $ | 0.37 | $ | 0.66 | |||||
| Shares used in computing income from continuing | |||||||||||||||
| operations and earnings per common and | |||||||||||||||
| common equivalent shares for: | |||||||||||||||
| —basic | 58,823 | 59,356 | 62,654 | 68,933 | 70,392 | ||||||||||
| —diluted | 59,310 | 60,477 | 63,940 | 69,787 | 72,366 | ||||||||||
|
Balance Sheets Data (at year end):
|
|||||||||||||||
| Cash and equivalents | $ | 41,402 | $ | 27,535 | $ | 18,259 | $ | 18,977 | $ | 20,508 | |||||
| Working capital | 46,444 | 42,896 | 21,669 | 30,169 | 32,201 | ||||||||||
| Total assets | 678,226 | 661,007 | 625,656 | 549,315 | 495,290 | ||||||||||
| Total debt | 266,523 | 271,489 | 269,481 | 138,782 | 100,474 | ||||||||||
| Total shareholders' equity | 281,042 | 253,834 | 239,294 | 316,291 | 303,750 | ||||||||||
| Statement of Cash Flows Data: | |||||||||||||||
| Cash provided by (used in) operating activities from: | |||||||||||||||
| Continuing operations | $ | 92,360 | $ | 110,112 | $ | 95,322 | $ | 75,802 | $ | 92,582 | |||||
| Discontinued operations | (2,958 | ) | (4,024 | ) | (4,385 | ) | (2,642 | ) | (2,025 | ) | |||||
|
|
|
|
|
|
|
|
|
|
|
||||||
| Total | $ | 89,402 | $ | 106,088 | $ | 90,937 | $ | 73,160 | $ | 90,557 | |||||
| Cash (used in) investing activities from: | |||||||||||||||
| Continuing operations | $ | (46,103 | ) | $ | (76,117 | ) | $ | (91,173 | ) | $ | (79,681 | ) | $ | (107,640 | ) |
| Discontinued operations | (2,650 | ) | (4,605 | ) | (2,917 | ) | (1,285 | ) | — | ||||||
|
|
|
|
|
|
|
|
|
|
|
||||||
| Total | $ | (48,753 | ) | $ | (80,722 | ) | $ | (94,090 | ) | $ | (80,966 | ) | $ | (107,640 | ) |
| Cash (used in) provided by financing activities | $ | (28,012 | ) | $ | (14,025 | ) | $ | 1,901 | $ | 5,712 | $ | 15,447 | |||
| (1) |
Basic earnings per share is computed using the weighted-average number of shares of common stock outstanding during the period. Diluted earnings per share is computed using the weighted-average number of shares of common stock and dilutive common stock equivalents outstanding during the period from unvested restricted shares, stock options and warrants (using the treasury stock method). |
23
Our results of operations include net revenues and associated costs for all acquisitions as discussed in Item 7. “Management’s Discussion and Analysis of Financial Condition and Results of Operations” from the effective date of each acquisition. In addition, unless otherwise stated, current and prior period results reflect our results from continuing operations and exclude the effect of current and prior period discontinued operations.
Item 7. Management’s Discussion and Analysis of Financial Condition and Results of Operations
Overview
PGi is a leading global provider of conferencing and collaboration solutions that enable companies and individuals to meet and collaborate in a more productive and efficient manner. We have a global presence in 24 countries in our three segments in North America, Europe and Asia Pacific.
During the year ended December 31, 2009, we initiated a plan to divest our PGiMarket business and completed its sale on November 5, 2009. Prior period results in the following discussion and analysis have been reclassified to present this business as discontinued operations. As a result, and except as provided herein, the following discussion and analysis reflects our results from continuing operations.
Key highlights of our financial and strategic accomplishments for 2009 include:
-
Generated net cash provided by operating activities from continuing operations of $92.4 million;
-
Decreased capital expenditures by 13.6% from $45.0 million in 2008 to $38.9 million in 2009;
-
Decreased our long-term debt less cash and equivalents by 8.3% from $241.5 million at December 31, 2008 to $221.5 million at December 31, 2009; and
-
Repurchased approximately 1.5 million shares of our common stock in the open market.
Our primary corporate objectives in 2010 are focused on continuing to:
-
Develop and launch innovative products and customer self-service tools that improve our user experience;
-
Transition our customers to more integrated, online collaboration solutions that provide a richer experience; and
-
Further establish our customer-centric PGi brand to broaden our market presence, stengthen our customer relationships and differentiate us from our competitors.
Specifically, in 2010, our strategic plan includes our continued focus on our managed services model and our new collaboration platform to be launched later this year. We believe both of these initiatives will significantly increase the addressable market opportunity for our solutions by integrating new technologies that are currently outside the conferencing industry as traditionally defined.
In 2009, nearly 41% of our consolidated net revenues were generated in countries outside the United States. Because we generate a significant portion of our consolidated net revenues from our international operations, movements in foreign currency exchange rates affect our reported results. We estimate that changes in foreign currency exchange rates during 2009 negatively impacted our consolidated net revenues by approximately $11.6 million as compared to 2008.
We have historically generated net revenue growth in our PGiMeet solutions through increases in volume, offset in part by declines in average selling prices. We believe that this is consistent with industry trends, which we expect will continue in the foreseeable future. Our business trends and revenue growth in our PGiMeet solutions continue to be affected by the challenging economic climate, higher global unemployment and lower global business activity. Net revenue from our PGiMeet solutions in 2009, 2008, and 2007 were $454.0 million, $443.3 million, and $358.6 million, respectively.
24
We have experienced revenue declines in our broadcast fax services, primarily as a result of decreased volume. Net revenue from these services in 2009, 2008 and 2007 were approximately $43.4 million, $58.0 million and $73.7 million, respectively. Although we intend to continue to convert these customers to our alternative solutions, we expect this overall revenue decline to continue.
We have historically used our cash flows from operating activities for debt repayments, acquisitions, capital expenditures and stock repurchases. As of December 31, 2009, borrowings under our credit facility were $254.9 million. We anticipate refinancing our existing credit facility in the first half of 2010, prior to its scheduled maturity in April 2011. We currently expect pricing on this credit facility to be higher than our current level due to general credit market conditions.
In addition, we intend to continue to prudently invest in our PGiMeet solutions, specifically in technology innovation and platform development, as well as new market strategies to better meet the needs of our large, global enterprise customers and to better attract, engage and acquire small- and medium-size business customers. We currently anticipate an increase in selling and marketing expense in 2010 as compared to 2009 relating to the launch of our new meeting platform later this year. We will also continue to evaluate our cost structure in 2010 to ensure that our businesses are operating as efficiently as possible.
The preparation of financial statements in conformity with generally accepted accounting principles in the United States, or GAAP, requires us to make estimates and assumptions that affect the reported amounts of assets and liabilities and disclosure of contingent assets and liabilities at the date of the financial statements and reported amounts of net revenues and expenses during the reporting period. Actual results could differ from the estimates. See the section in this annual report entitled “—Critical Accounting Policies.” The following discussion and analysis provides information which we believe is relevant to an assessment and understanding of our consolidated results of operations and financial condition. This discussion should be read in conjunction with our consolidated financial statements contained herein and notes thereto. All significant intercompany accounts and transactions have been eliminated in consolidation.
25
Results of Operations
The following table presents the percentage relationship of our consolidated statements of operations line items to our consolidated net revenues for the periods indicated:
| Years Ended December 31, | |||
|
| |||
| 2009 | 2008 | 2007 | |
|
|
|
| |
| Net revenues | 100.0% | 100.0% | 100.0% |
| Operating expenses: | |||
| Cost of revenues (exclusive of depreciation and amortization | |||
| shown separately below) | 42.8 | 40.8 | 40.4 |
| Selling and marketing | 23.8 | 24.4 | 24.8 |
| General and administrative (exclusive of expenses shown separately | |||
| below) | 10.9 | 10.6 | 11.8 |
| Research and development | 2.8 | 2.5 | 2.3 |
| Excise tax expense | — | 0.5 | — |
| Depreciation | 6.2 | 5.1 | 5.3 |
| Amortization | 1.8 | 2.4 | 2.7 |
| Restructuring costs | 3.6 | 0.5 | 0.6 |
| Asset impairments | 0.6 | 0.6 | — |
| Net legal settlements and related expenses | 0.1 | 0.4 | 0.1 |
| Acquisition-related costs | 0.1 | — | — |
|
|
|
| |
| Total operating expenses | 92.6 | 87.7 | 88.1 |
|
|
|
| |
| Operating income | 7.4 | 12.3 | 11.9 |
|
|
|
| |
| Other (expense) income | |||
| Interest expense | (2.2) | (3.1) | (2.5) |
| Unrealized gain (loss) on change in fair value of interest rate swaps | 0.6 | (0.0) | (0.8) |
| Interest income | 0.1 | 0.1 | 0.1 |
| Other, net | 0.0 | 0.1 | 0.3 |
|
|
|
| |
| Total other (expense) | (1.7) | (2.9) | (2.9) |
|
|
|
| |
| Income from continuing operations before income taxes | 5.7 | 9.4 | 9.1 |
| Income tax expense | 2.2 | 2.8 | 3.1 |
|
|
|
| |
| Net income from continuing operations | 3.5 | 6.5 | 6.0 |
| Loss from discontinued operations, net of taxes | (1.3) | (0.7) | (0.5) |
| Net income | 2.3% | 5.8% | 5.5% |
|
|
|
| |
26
Net Revenues
The following table presents certain financial information about our segments for the periods presented (in thousands, except percentages):
| Years Ended | |||||||||||||||||
|
|
|||||||||||||||||
| December 31, | Change from 2008 to 2009 |
Change from 2007 to 2008 |
|||||||||||||||
|
|
|
|
|||||||||||||||
| 2009 | 2008 | 2007 | $ | % | $ | % | |||||||||||
|
|
|
|
|
|
|
|
|||||||||||
|
Net revenues:
|
|||||||||||||||||
| North America | |||||||||||||||||
| PGiMeet solutions | $ | 313,860 | $ | 307,802 | $ | 269,616 | 6,058 | 2.0 | 38,186 | 14.2 | |||||||
| Broadcast fax solutions | 7,285 | 12,432 | 17,664 | (5,147 | ) | (41.4 | ) | (5,232 | ) | (29.6 | ) | ||||||
| Other PGiSend solutions | 52,197 | 61,742 | 65,355 | (9,545 | ) | (15.5 | ) | (3,613 | ) | (5.5 | ) | ||||||
|
|
|
|
|
|
|
|
|||||||||||
| Total North America | $ | 373,342 | $ | 381,976 | $ | 352,635 | (8,634 | ) | (2.3 | ) | 29,341 | 8.3 | |||||
|
|
|
|
|
|
|
|
|||||||||||
| Europe | |||||||||||||||||
| PGiMeet solutions | $ | 86,735 | $ | 79,595 | $ | 46,560 | 7,140 | 9.0 | 33,035 | 71.0 | |||||||
| Broadcast fax solutions | 6,979 | 13,225 | 23,630 | (6,246 | ) | (47.2 | ) | (10,405 | ) | (44.0 | ) | ||||||
| Other PGiSend solutions | 22,274 | 29,309 | 32,824 | (7,035 | ) | (24.0 | ) | (3,515 | ) | (10.7 | ) | ||||||
|
|
|
|
|
|
|
|
|||||||||||
| Total Europe | $ | 115,988 | $ | 122,129 | $ | 103,014 | (6,141 | ) | (5.0 | ) | 19,115 | 18.6 | |||||
|
|
|
|
|
|
|
|
|||||||||||
| Asia Pacific | |||||||||||||||||
| PGiMeet solutions | $ | 53,367 | $ | 55,876 | $ | 42,450 | (2,509 | ) | (4.5 | ) | 13,426 | 31.6 | |||||
| Broadcast fax solutions | 29,105 | 32,304 | 32,437 | (3,199 | ) | (9.9 | ) | (133 | ) | (0.4 | ) | ||||||
| Other PGiSend solutions | 29,720 | 28,115 | 24,384 | 1,605 | 5.7 | 3,731 | 15.3 | ||||||||||
|
|
|
|
|
|
|
|
|||||||||||
| Total Asia Pacific | $ | 112,192 | $ | 116,295 | $ | 99,271 | (4,103 | ) | (3.5 | ) | 17,024 | 17.1 | |||||
|
|
|
|
|
|
|
|
|||||||||||
| Consolidated | |||||||||||||||||
| PGiMeet solutions | $ | 453,962 | $ | 443,273 | $ | 358,626 | 10,689 | 2.4 | 84,647 | 23.6 | |||||||
| Broadcast fax solutions | 43,369 | 57,961 | 73,731 | (14,592 | ) | (25.2 | ) | (15,770 | ) | (21.4 | ) | ||||||
| Other PGiSend solutions | 104,191 | 119,166 | 122,563 | (14,975 | ) | (12.6 | ) | (3,397 | ) | (2.8 | ) | ||||||
|
|
|
|
|
|
|
|
|||||||||||
| Total consolidated | $ | 601,522 | $ | 620,400 | $ | 554,920 | (18,878 | ) | (3.0 | ) | 65,480 | 11.8 | |||||
|
|
|
|
|
|
|
|
|||||||||||
|
Operating income:
|
|||||||||||||||||
| North America | $ | 629 | $ | 28,809 | $ | 34,306 | (28,180 | ) | (97.8 | ) | (5,497 | ) | (16.0 | ) | |||
| Europe | 21,722 | 22,451 | 14,386 | (729 | ) | (3.2 | ) | 8,065 | 56.1 | ||||||||
| Asia Pacific | 21,972 | 24,878 | 17,525 | (2,906 | ) | (11.7 | ) | 7,353 | 42.0 | ||||||||
|
|
|
|
|
|
|
|
|||||||||||
| Total operating income | $ | 44,323 | $ | 76,138 | $ | 66,217 | (31,815 | ) | (41.8 | ) | 9,921 | 15.0 | |||||
|
|
|
|
|
|
|
|
|||||||||||
| Percent of net revenues: | |||||||||||||||||
| North America | 62.0 | % | 61.6 | % | 63.5 | % | |||||||||||
| Europe | 19.3 | % | 19.7 | % | 18.6 | % | |||||||||||
| Asia Pacific | 18.7 | % | 18.7 | % | 17.9 | % | |||||||||||
|
|
|
|
|||||||||||||||
| Consolidated net revenues | 100.0 | % | 100.0 | % | 100.0 | % | |||||||||||
|
|
|
|
|||||||||||||||
The following table details the changes in net revenues from the year ended December 31, 2007 to the year ended December 31, 2009 (in millions):
| Consolidated net revenues |
North America net revenue |
Europe net revenue |
Asia Pacific net revenue |
|||||||||
|
|
|
|
|
|||||||||
| 2007 | $ | 554.9 | $ | 352.6 | $ | 103.0 | $ | 99.3 | ||||
| Change in volume | 56.0 | 41.8 | 7.8 | 6.4 | ||||||||
| Change in selling prices | (23.4 | ) | (23.5 | ) | (5.3 | ) | 5.4 | |||||
| Impact of acquisitions | 24.4 | 11.0 | 13.4 | — | ||||||||
| Impact of fluctuations in foreign | ||||||||||||
| currency exchange rates | 8.5 | 0.1 | 3.2 | 5.2 | ||||||||
|
|
|
|
|
|
|
|
|
|||||
| 2008 | 620.4 | 382.0 | 122.1 | 116.3 | ||||||||
| Change in volume | 36.3 | 22.8 | 16.9 | (3.4 | ) | |||||||
| Change in selling prices | (53.5 | ) | (39.2 | ) | (12.8 | ) | (1.5 | ) | ||||
| Impact of acquisitions | 9.9 | 9.9 | — | — | ||||||||
| Impact of fluctuations in foreign | ||||||||||||
| currency exchange rates | (11.6 | ) | (2.2 | ) | (10.2 | ) | 0.8 | |||||
|
|
|
|
|
|
|
|
|
|||||
| 2009 | $ | 601.5 | $ | 373.3 | $ | 116.0 | $ | 112.2 | ||||
|
|
|
|
|
|
|
|
|
|||||
27
With the exception of our Asia Pacific operating segment, volume and pricing changes have followed similar trends. In North America and Europe, volume increases in our net revenue for the years ended December 31, 2009 and 2008 from comparable prior year periods were driven by our PGiMeet solutions, offset in part by volume decreases in our broadcast fax and other PGiSend solutions. Decreases in average selling prices from comparable prior year periods resulted from a higher mix of large volume enterprise customers and price reductions from existing customers, primarily related to our PGiMeet solutions. In 2008, these decreases in average selling prices in Europe were partially offset by pricing increases in our broadcast fax services.
Our Asia Pacific operating segment has experienced different trends than our North America and Europe operating segments. Volume decreases in our Asia Pacific net revenue for the year ended December 31, 2009 from the comparable prior year period was driven by declines in our PGiMeet solutions and broadcast fax services, offset in part by volume increases in our other PGiSend solutions. Volume increases in our Asia Pacific net revenue for the year ended December 31, 2008 from the comparable prior year period was driven by our PGiMeet solutions and other PGiSend solutions, offset in part by volume decreases in our broadcast fax services. In Asia Pacific, the decrease in average selling prices for the year ended December 31, 2009 from the comparable prior year period was primarily associated with our PGiMeet solutions, partially offset by increases in our broadcast fax services. The increases in average selling prices for the year ended December 31, 2008 from the comparable prior year period were primarily associated with our PGiMeet solutions and broadcast fax services.
Cost of Revenues
| Years Ended December 31, |
Change from 2008 to 2009 |
Change from 2007 to 2008 |
||||||||||
|
|
|
|
||||||||||
| 2009 | 2008 | 2007 | $ | % | $ | % | ||||||
|
|
|
|
|
|
|
|
||||||
| North America | $165,035 | $158,197 | $139,125 | 6,838 | 4.3 | 19,072 | 13.7 | |||||
| Europe | 38,459 | 40,891 | 37,031 | (2,432 | ) | (5.9 | ) | 3,860 | 10.4 | |||
| Asia Pacific | 53,700 | 54,052 | 48,276 | (352 | ) | (0.7 | ) | 5,776 | 12.0 | |||
|
|
|
|
|
|
|
|
||||||
| Consolidated | $257,194 | $253,140 | $224,432 | 4,054 | 1.6 | 28,708 | 12.8 | |||||
|
|
|
|
|
|
|
|
||||||
| Years Ended December 31, |
|||
|
|
|||
| 2009 | 2008 | 2007 | |
|
|
|
|
|
| (in percentages) | |||
| Cost of revenues as a percent of net revenues: | |||
| North America | 44.2 | 41.4 | 39.5 |
| Europe | 33.2 | 33.5 | 35.9 |
| Asia Pacific | 47.9 | 46.5 | 48.6 |
| Consolidated | 42.8 | 40.8 | 40.4 |
Consolidated cost of revenues as a percentage of consolidated net revenues increased in 2009 and 2008, each from the previous year, as a result of decreased average selling prices, growth in higher cost of revenue large enterprise customers in our PGiMeet solutions and declines in lower cost of revenue customers in our broadcast fax, transactional fax and email delivery services. The increases in consolidated cost of revenues in 2008 from 2007 were offset in part by cost reductions primarily from our fax service delivery organization re-engineering efforts in North America and Europe which began in the second quarter of 2007, and network upgrades to our fax delivery platform in Asia Pacific during the second half of 2007. Fluctuations in foreign currency exchange rates resulted in a decline in consolidated cost of revenues of approximately $3.8 million in 2009 and growth of approximately $3.1 million in 2008 from the previous year.
The increase in North America cost of revenue as a percentage of operating segment net revenue in 2009 from the previous year was attributable primarily to growth in higher cost of revenue large enterprise customers in our PGiMeet solutions and declines in our lower cost of revenue customers in our broadcast fax, transactional fax, and email delivery services. The increase in North America cost of revenue as a percentage of operating segment net revenue in 2008 from the previous year was attributable primarily to our acquisitions of the U.S.-based audio conferencing businesses of iLinc Communications, Inc. and Soundpath Conferencing Services, LLC, growth in higher cost of revenue large enterprise customers in our PGiMeet solutions and declines in lower cost of revenue customers in our broadcast fax services. Fluctuations in foreign currency exchange rates from our Canadian operations resulted in a decline in North America cost of revenue of approximately $0.6 million in 2009 and growth
28
of approximately $0.1 million in 2008 from the previous year.
The decrease in Europe cost of revenue as a percentage of operating segment net revenue in 2009 from the previous year was attributable primarily to declines in our higher cost of revenue customers in our broadcast fax services, growth in lower cost of revenue customers in our PGiMeet solutions and network upgrades to our fax delivery platform in the first half of 2008. The decrease in Europe cost of revenue as a percentage of operating segment net revenue in 2008 compared to the previous year was attributable primarily to declines in our higher cost of revenue customers in our broadcast fax services, growth in lower cost of revenue customers in our PGiMeet solutions, cost savings associated with our service delivery organization re-engineering efforts in Europe that began in the second quarter of 2007 and network upgrades to our fax delivery platform in the first half of 2008, partially offset by our acquisition of Meet24. Fluctuations in foreign currency exchange rates resulted in a decline in Europe cost of revenue of approximately $3.5 million in 2009 and growth of approximately $1.1 million in 2008 from the previous year.
The increase in Asia Pacific cost of revenue as a percentage of operating segment net revenue in 2009 from the previous year was attributable primarily to growth in higher cost of revenue large enterprise customers in our PGiMeet solutions and our Maritime PGiSend solutions (which we resell from a third party to shipping companies in the region). The decrease in Asia Pacific cost of revenue as a percentage of operating segment net revenue in 2008 from the previous year was attributable primarily to network cost savings related to upgrades in our fax delivery platform during the second half of 2007 and growth in lower cost of revenue customers in our PGiMeet solutions. Fluctuations in foreign currency exchange rates resulted in Asia Pacific cost of revenue growth of approximately $0.3 million in 2009 and $1.9 million in 2008 from the previous year.
Selling and Marketing Expenses
| Years Ended December 31, |
Change from 2008 to 2009 |
Change from 2007 to 2008 |
|||||||||||
|
|
|
|
|||||||||||
| 2009 | 2008 | 2007 | $ | % | $ | % | |||||||
|
|
|
|
|
|
|
|
|||||||
| North America | $ 87,652 | $ 89,414 | $ 84,693 | (1,762 | ) | (2.0 | ) | 4,721 | 5.6 | ||||
| Europe | 31,586 | 36,970 | 31,827 | (5,384 | ) | (14.6 | ) | 5,143 | 16.2 | ||||
| Asia Pacific | 23,704 |
24,794
|
21,371 | (1,090 | ) | (4.4 | ) | 3,423 | 16.0 | ||||
|
|
|
|
|
|
|
|
|||||||
| Consolidated | $142,942 | $151,178 | $137,891 | (8,236 | ) | (5.4 | ) | 13,287 | 9.6 | ||||
|
|
|
|
|
|
|
|
|||||||
| Years Ended December 31, |
|||
|
|
|||
| 2009 | 2008 | 2007 | |
|
|
|
|
|
| (in percentages) | |||
| Selling and marketing expenses as a percent of net revenues: | |||
| North America | 23.5 | 23.4 | 24.0 |
| Europe | 27.2 | 30.3 | 30.9 |
| Asia Pacific | 21.1 | 21.3 | 21.5 |
| Consolidated | 23.8 | 24.4 | 24.8 |
Consolidated selling and marketing expenses decreased in 2009 from the previous year primarily as a result of our expense structure optimization efforts and the weakening of various currencies to the U.S. Dollar, offset in part by our acquisitions of LINK Conference Service, LLC, Soundpath and iLinc. Consolidated selling and marketing expenses increased in 2008 from the previous year primarily as a result of our acquisitions of Budget Conferencing Inc. Meet24, iLinc and Soundpath, our investment in selling and marketing resources in all of our operating segments and the strengthening of various currencies to the U.S. Dollar. Fluctuations in foreign currency exchange rates resulted in a decline in consolidated selling and marketing expense of approximately $4.0 million in 2009 and growth of approximately $2.1 million in 2008 from the previous year.
The decrease in North America selling and marketing expense in 2009 from the previous year was primarily attributable to our expense structure optimization efforts, offset in part by our acquisitions of LINK, Soundpath and iLinc. The increase in North America selling and marketing expense in 2008 from the previous year was primarily attributable to our acquisitions of Budget Conferencing, iLinc and Soundpath, offset in part by increased optimization of selling and marketing expense toward growth in our PGiMeet solutions net revenue. Fluctuations in foreign currency exchange rates from our Canadian operations resulted in a decline in North America selling and marketing expense of approximately
29
$0.5 million in 2009 and had a minimal impact on North America selling and marketing expense in 2008 from the previous year.
The decrease in Europe selling and marketing expense in 2009 from the previous year was primarily attributable to our expense structure optimization efforts and the weakening of the Euro and the British Pound to the U.S. Dollar. The increase in Europe selling and marketing expense in 2008 from the previous year was attributable primarily to our acquisition of Meet24, strengthening of the Euro against the U.S. Dollar and our investment in selling and marketing resources in our PGiMeet solutions. Fluctuations in foreign currency exchange rates resulted in a decline in Europe selling and marketing expense of approximately $3.6 million in 2009 and growth of approximately $1.0 million in 2008 from the previous year.
The decrease in Asia Pacific selling and marketing expense in 2009 from the previous year was primarily attributable to our expense structure optimization efforts. The increase in Asia Pacific selling and marketing expense in 2008 compared to the previous year was attributable primarily to the strengthening of the Japanese Yen to the U.S. Dollar and our investment in selling and marketing resources in our PGiMeet solutions. Fluctuations in foreign currency exchange rates resulted in Asia Pacific selling and marketing expense growth of approximately $0.1 million in 2009 and $1.1 million in 2008 from the previous year.
General and Administrative Expenses
| Years Ended December 31, |
Change from 2008 to 2009 |
Change from 2007 to 2008 |
|||||||||||||
|
|
|
|
|||||||||||||
| 2009 | 2008 | 2007 | $ | % | $ | % | |||||||||
|
|
|
|
|
|
|
|
|||||||||
| North America | $ 44,412 | $ 43,667 | $ 44,401 | 745 | 1.7 | (734 | ) | (1.7 | ) | ||||||
| Europe | 12,087 | 12,532 | 12,551 | (445 | ) | (3.6 | ) | (19 | ) | (0.2 | ) | ||||
| Asia Pacific | 8,979 | 9,327 | 8,388 | (348 | ) | (3.7 | ) | 939 | 11.2 | ||||||
|
|
|
|
|
|
|
|
|||||||||
| Consolidated | $ 65,478 | $ 65,526 | $ 65,340 | (48 | ) | (0.1 | ) | 186 | 0.3 | ||||||
|
|
|
|
|
|
|
|
|||||||||
| Years Ended December 31, |
|||
|
|
|||
| 2009 | 2008 | 2007 | |
|
|
|
|
|
| (in percentages) | |||
| General and administrative expenses as a percent of net revenues: | |||
| North America | 11.9 | 11.4 | 12.6 |
| Europe | 10.4 | 10.3 | 12.2 |
| Asia Pacific | 8.0 | 8.0 | 8.4 |
| Consolidated | 10.9 | 10.6 | 11.8 |
Consolidated general and administrative expenses decreased in 2009 from the previous year primarily as a result of our expense structure optimization efforts, decreased equity-based compensation expense and the weakening of various currencies to the U.S. Dollar, partially offset by our acquisitions of LINK, Soundpath and iLinc. Consolidated general and administrative expenses increased in 2008 from the previous year primarily as a result of our acquisitions of Budget Conferencing, Meet24, iLinc and Soundpath and the strengthening of various currencies to the U.S. Dollar. Fluctuations in foreign currency exchange rates resulted in a decline in consolidated general and administrative expense of approximately $1.0 million in 2009 and growth of approximately $0.8 million in 2008 from the previous year.
The increase in North America general and administrative expense in 2009 from the previous year was attributable primarily to our acquisitions of LINK, Soundpath and iLinc, partially offset by our expense structure optimization efforts. The decrease in North America general and administrative expense in 2008 from the previous year was attributable primarily to our 2007 proxy contest costs, offset in part by our acquisitions of Budget Conferencing, Soundpath and iLinc. Fluctuations in foreign currency exchange rates from our Canadian operations resulted in a decline in North America general and administrative expense of approximately $0.1 million in 2009 and had a minimal impact on North America general and administrative expense in 2008 from the previous year.
The decrease in Europe general and administrative expense in 2009 from the previous year was primarily attributable to the weakening of the Euro and the British Pound against the U.S. Dollar. Europe general and administrative expense was flat in 2008 from the previous year, attributable primarily to the strengthening of the
30
Euro against the U.S. Dollar and our acquisition of Meet24, offset in part by a reduction in finance and accounting costs from our centralization plan that began in the first quarter of 2007. Fluctuations in foreign currency exchange rates resulted in a decline in Europe general and administrative expense of approximately $1.0 million in 2009 and growth of approximately $0.4 million in 2008 from the previous year.
The decrease in Asia Pacific general and administrative expense in 2009 from the previous year was primarily attributable to savings from our expense structure optimization efforts. The increase in Asia Pacific general and administrative expense in 2008 from the previous year was attributable primarily to strengthening of the Japanese Yen against the U.S. Dollar. Fluctuations in foreign currency exchange rates resulted in Asia Pacific general and administrative expense growth of approximately $0.1 million in 2009 and $0.4 million in 2008 from the previous year.
Research and Development Expenses
Consolidated research and development expenses from continuing operations as a percentage of consolidated net revenues were 2.8%, 2.5% and 2.3% in 2009, 2008 and 2007, respectively. Consolidated research and development expenses from continuing operations increased 8.5% to $17.0 million in 2009 from $15.7 million in 2008 and increased 25.4% in 2008 from $12.5 million in 2007. We incurred the majority of research and development costs in North America. The increase in consolidated research and development expenses is primarily associated with additional resources invested in the maintenance and support of our PGiMeet solutions and our non-broadcast fax PGiSend solutions.
Excise Tax Expense
During the second quarter of 2008, we learned that certain of our PGiMeet solutions may be subject to a certain state’s telecommunications excise tax statute. We are currently working with this state’s department of revenue to resolve this matter, which spans tax years 2001 – 2007. Accordingly, we have accrued approximately $4.0 million of excise tax and interest for the applicable time period as of December 31, 2009.
Depreciation Expense
| Years Ended December 31, |
Change from 2008 to 2009 |
Change from 2007 to 2008 |
|||||||||||
|
|
|
|
|||||||||||
| 2009 | 2008 | 2007 | $ | % | $ | % | |||||||
|
|
|
|
|
|
|
|
|||||||
| North America | $ 30,590 | $ 25,621 | $ 23,543 | 4,969 | 19.4 | 2,078 | 8.8 | ||||||
| Europe | 3,870 | 3,611 | 3,359 | 259 | 7.2 | 252 | 7.5 | ||||||
| Asia Pacific | 2,739 | 2,455 | 2,770 | 284 | 11.6 | (315 | ) | (11.4 | ) | ||||
|
|
|
|
|
|
|
|
|||||||
| Consolidated | $ 37,199 | $ 31,687 | $ 29,672 | 5,512 | 17.4 | 2,015 | 6.8 | ||||||
|
|
|
|
|
|
|
|
|||||||
| Years Ended December 31, |
|||
|
|
|||
| 2009 | 2008 | 2007 | |
|
|
|
|
|
| (in percentages) | |||
| Depreciation expense as a percent of net revenues: | |||
| North America | 8.2 | 6.7 | 6.7 |
| Europe | 3.3 | 3.0 | 3.3 |
| Asia Pacific | 2.4 | 2.1 | 2.8 |
| Consolidated | 6.2 | 5.1 | 5.3 |
Consolidated depreciation expense increased in 2009 from the previous year primarily as a result of increases in our productive asset base and as a result of a non-recurring reduction in depreciation expense during 2008 of $0.7 million for revisions made to the estimated remaining economic life of a specific group of assets. Consolidated depreciation expense increased in 2008 from the previous year primarily as a result of increases in our productive asset base, offset in part by the non-recurring $0.7 million adjustment.
31
Amortization Expense
| Years Ended December 31, |
Change from 2008 to 2009 |
Change from 2007 to 2008 |
|||||||||||||
|
|
|
|
|||||||||||||
| 2009 | 2008 | 2007 | $ | % | $ | % | |||||||||
|
|
|
|
|
|
|
|
|||||||||
| North America | $ 8,726 | $ 11,249 | $ 12,884 | (2,523 | ) | (22.4 | ) | (1,635 | ) | (12.7 | ) | ||||
| Europe | 1,673 | 3,484 | 1,739 | (1,811 | ) | (52.0 | ) | 1,745 | 100.3 | ||||||
| Asia Pacific | 238 | 396 | 436 | (158 | ) | (39.9 | ) | (40 | ) | (9.2 | ) | ||||
|
|
|
|
|
|
|
|
|||||||||
| Consolidated | $ 10,637 | $ 15,129 | $ 15,059 | (4,492 | ) | (29.7 | ) | 70 | 0.5 | ||||||
|
|
|
|
|
|
|
|
|||||||||
|
Years Ended
December 31, |
|||
|
|
|||
| 2009 | 2008 | 2007 | |
|
|
|
|
|
| (in percentages) | |||
| Amortization expense as a percent of net revenues: | |||
| North America | 2.3 | 2.9 | 3.7 |
| Europe | 1.4 | 2.9 | 1.7 |
| Asia Pacific | 0.2 | 0.3 | 0.4 |
| Consolidated | 1.8 | 2.4 | 2.7 |
Consolidated amortization expense decreased in 2009 from the previous year as a result of the decrease in North America amortization expense related to customer list intangible assets from acquisitions made in 2003 that have become fully amortized, partially offset by intangible amortization expense resulting from our acquisitions of LINK, Soundpath and iLinc. Consolidated amortization expense was flat in 2008 from the previous year primarily as a result of the decrease in North America amortization expense related to customer list intangible assets from acquisitions made in 2003 that became fully amortized during the year, offset in part by our acquisitions of Budget Conferencing, iLinc and Soundpath.
Restructuring Costs
Consolidated restructuring costs from continuing operations as a percentage of consolidated net revenues were 3.6%, 0.5% and 0.6% in 2009, 2008 and 2007, respectively. Consolidated restructuring costs from continuing operations were $21.8 million, $3.3 million and $3.4 million in 2009, 2008 and 2007, respectively.
Realignment of Workforce – 2009
During the year ended December 31, 2009, we executed a restructuring plan to consolidate and streamline various functions of our work force. As part of these consolidations we eliminated approximately 500 positions. During the year ended December 31, 2009, we recorded total severance and exit costs of $14.8 million, which included the acceleration of vesting of restricted stock with a fair market value of $0.2 million. Severance costs for 2009 included $0.4 million associated with the decision to divest our PGiMarket business. Additionally, during the year ended December 31, 2009, we recorded $4.4 million of lease termination costs associated with office locations in North America and Europe. The expenses associated with these activities are reflected in “Restructuring costs” in our consolidated statements of operations. On a segment basis, these restructuring costs total $12.0 million in North America, $6.6 million in Europe, and $0.6 million in Asia Pacific. Our reserve for the 2009 restructuring costs was $9.3 million at December 31, 2009. We anticipate these severance-related costs will be paid over the next year, and these lease termination costs will be paid over the next nine years.
Realignment of Workforce – 2008
During the year ended December 31, 2008, we executed a restructuring plan to consolidate the senior management of our technology development and network operations functions and to consolidate our corporate communications function into our marketing department. As part of these consolidations, we eliminated 11 positions, including entering into a separation agreement with our president, global operations. During the year ended December 31, 2008, we expensed total restructuring costs of $3.4 million associated with this realignment of our workforce, representing severance costs associated with the elimination of these positions. On a segment basis, the total restructuring costs initially incurred were $2.0 million in North America, $1.3 million in Europe and $0.1 million in Asia Pacific, with total adjustments in 2009 in Europe of $(0.1) million and in North America of $0.1
32
million. As of December 31, 2009 we have completed this restructuring plan and, accordingly, no reserves for the 2008 restructuring costs remain.
Realignment of Workforce – 2007
During the year ended December 31, 2007, we executed a restructuring plan to consolidate our non-PGiMeet solutions service delivery organizations. As part of this consolidation, we eliminated 84 positions. We initially expensed total restructuring costs of $4.2 million, representing $4.1 million in severance costs associated with the elimination of these positions and $0.1 million of lease termination costs associated with our Paris, France office. During the years ended December 31, 2008 and 2007, we adjusted the initially recorded charge by $(0.1) million and $(0.2) million, respectively, related to actual severance payments being less than originally estimated. The expenses associated with these charges are reflected in “Restructuring costs” in our consolidated statements of operations. On a segment basis, the total restructuring costs initially incurred were $1.1 million in North America, $2.7 million in Europe and $0.4 million in Asia Pacific, with total adjustments in Europe of $(0.1) million and $(0.2) million in 2008 and 2007, respectively. As of December 31, 2009, we have completed this restructuring plan and, accordingly, no reserves for the 2007 restructuring costs remain.
Realignment of Workforce – Prior to 2007
Amounts paid in cash during the year ended December 31, 2009 for restructuring costs incurred prior to 2007 totaled $0.9 million. During the year ended December 31, 2009, we revised assumptions used in determining the estimated costs associated with lease terminations incurred prior to 2007. As a result, we recorded an additional $3.2 million of lease termination costs. The expenses associated with these activities are reflected in “Restructuring costs” in our consolidated statements of operations. At December 31, 2009, our reserve for restructuring costs incurred prior to 2007 totaled $3.9 million and is associated with lease termination costs. We anticipate these remaining lease termination costs will be paid over the next seven years.
Asset Impairments
Asset impairments were $3.7 million in 2009 associated primarily with the abandonment of certain software projects previously included in “Property and equipment, net.” Asset impairments were $3.4 million in 2008 associated primarily with the abandonment of billing system software projects in North America associated with our fax delivery services developed in 2005 and 2006 and a customer list in Europe associated with the acquisition of I-Media, SA and its affiliates, a broadcast fax company acquired in December of 2004.
Net Legal Settlements and Related Expenses
Net legal settlements and related expenses were $0.6 million, $2.2 million and $0.3 million in 2009, 2008 and 2007, respectively. Net legal settlements and related expenses in 2009, 2008, and 2007 resulted from our settlement of several litigation matters and disputes, including certain matters as previously disclosed in our “Commitments and Contingencies” note to our consolidated financial statements and in Part II, “Item 1. Legal Proceedings” in our SEC filings.
Interest Expense
The majority of our interest expense from continuing operations is incurred in North America and was $13.5 million, $19.4 million and $13.6 million in 2009, 2008 and 2007, respectively. Interest expense decreased during 2009 primarily as a result of the expiration of one of our $100.0 million interest rate swaps and the reduction of average one-month LIBOR rates as compared to prior years. In addition, 2008 interest expense included $1.1 million of non-recurring excise tax interest. Interest expense increased during 2008 compared to 2007 as a result of $1.1 million in excise tax interest and an increase in the weighted-average outstanding balance on our credit facility. The weighted-average outstanding balance on our credit facility was $282.0 million, $290.0 million and $204.1 million during 2009, 2008 and 2007, respectively.
33
Unrealized Gain (Loss) on Change in Fair Value of Interest Rate Swaps
In August 2007, we entered into two $100.0 million two-year interest rate swaps at a fixed rate of approximately 4.99%. In December 2007, we amended the life of one of the $100.0 million swaps to three years and reduced the fixed rate to approximately 4.75%. One of the swaps matured in August 2009, and one swap remains outstanding at December 31, 2009 with a maturity date of August 2010. We did not initially designate these interest rate swaps as cash flow hedges and, as such, we did not account for them under hedge accounting. During the fourth quarter of 2008, we prospectively designated these interest rate swaps as hedges using the long-haul method of effectiveness testing. Any changes in fair value prior to designation as a hedge and any ineffectiveness subsequent to such designation are recognized as “Unrealized gain (loss) on change in fair value of interest rate swaps” as a component of “Other (expense) income” in our consolidated statements of operations and amounted to a gain of $3.4 million and losses of $0.1 million and $4.5 million during the years ended December 31, 2009, 2008 and 2007, respectively.
Other, Net
Other, net was a loss of $0.3 million and a gain of $0.5 million and $1.4 million in 2009, 2008, and 2007, respectively. Other, net was comprised primarily of foreign currency exchange gains and losses related to cash settlements of intercompany transactions and the revaluation of foreign currency denominated payables and receivables into their respective functional currency.
Income Taxes
Income tax expense for the years ended December 31, 2009, 2008 and 2007 from continuing operations was $13.0 million, $17.4 million and $17.0 million, respectively. The decline in income tax expense between 2009 and 2008 was primarily related to the decrease in income from continuing operations in 2009 partially offset by the impact of establishing an accounting valuation allowance against deferred tax assets for certain foreign subsidiaries. The increase in income tax expense between 2008 and 2007 is primarily due to increased income from continuing operations as well as expenses associated with uncertain tax matters.
As of December 31, 2009 and 2008, we have $5.7 million and $5.4 million, respectively, of unrecognized tax benefits, all of which if recognized would affect our annual effective tax rate. We do not expect our unrecognized tax benefit to change significantly over the next 12 months.
Acquisitions
We seek to acquire complementary companies that increase our market share and provide us with additional customers, technologies, applications and sales personnel. All revenues and related costs from these transactions have been included in our consolidated financial statements as of the effective date of each acquisition.
North America
In February 2009, we acquired certain technology assets of a provider of web collaboration services in exchange for warrants to purchase 105,000 shares of our common stock. We allocated the $0.3 million fair value of the warrant to in-process research and development in other intangible assets. The in-process research and development is not currently being amortized but is subject to periodic impairment testing. We incurred transaction fees and closing costs of $0.2 million, which we expensed as incurred.
In February 2009, we acquired certain assets and assumed certain liabilities of LINK, a U.S.-based provider of audio and web conferencing services. We paid $7.1 million in cash at closing and $0.3 million in transaction fees and closing costs, which we expensed as incurred. We funded the purchase through our credit facility and cash and equivalents on hand. We allocated $0.7 million to accounts receivable, $0.1 million to prepaid assets, $0.3 million to acquired fixed assets, $0.3 million to other acquisition liabilities, $2.4 million to identifiable customer lists and $0.1 million to non-compete agreements, with the customer lists amortized over ten years and the non-compete agreements amortized over five years. We allocated the residual $3.8 million of the purchase price to goodwill, which is subject to a periodic impairment assessment.
34
In July 2008, we acquired certain assets of Soundpath, a U.S.-based provider of audio conferencing services. We paid $20.1 million in cash at closing and $0.3 million in transaction fees and closing costs. We funded the purchase through our credit facility and cash and equivalents on hand. We allocated $6.0 million to identifiable customer lists and $1.0 million to non-compete agreements, with the customer lists amortized over ten years and the non-compete agreements amortized over five years. We allocated the residual $13.4 million of the aggregate purchase price to goodwill, which is subject to a periodic impairment assessment.
In May 2008, we acquired certain assets and assumed certain liabilities of the U.S.-based audio conferencing business of iLinc. We paid $3.9 million in cash at closing and $0.1 million in transaction fees and closing costs. We funded the purchase with cash and equivalents on hand. We allocated $0.6 million to acquired working capital, $0.8 million to other acquisition liabilities and $1.2 million to identifiable intangible assets, which will be amortized over five years. We allocated the residual $3.0 million of the aggregate purchase price to goodwill, which is subject to a periodic impairment assessment.
In July 2007, we acquired the assets and stock of Budget Conferencing, a Canadian-based provider of audio and web conferencing services. We paid $19.8 million in cash at closing and $0.6 million in transaction fees and closing costs. In June 2008, we paid an additional $0.7 million in cash to finalize the working capital component of the purchase price. We funded the purchase through our credit facility. We allocated approximately $0.2 million to acquired fixed assets, $0.1 million to other acquisition liabilities, $6.6 million to identifiable customer lists, $1.3 million to trademarks and $1.4 million to a non-compete agreement, with the identifiable customer lists and non-compete agreements amortized over five years. In addition, we allocated $2.6 million to long-term deferred tax liabilities to record the step-up in basis for the customer lists and developed technology purchased. We allocated the residual $14.3 million of the aggregate purchase price to goodwill, which is subject to a periodic impairment assessment.
Europe
In November 2007, we acquired the stock of Meet24, a Nordic-based provider of conferencing and web collaboration services. We paid $26.3 million in cash at closing and $0.2 million in transaction fees and closing costs. We funded the purchase through our credit facility and cash and equivalents on hand. We allocated approximately $0.2 million to acquired fixed assets, $1.4 million to acquired working capital, $0.9 million to acquired deferred tax assets, $3.8 million to other acquisition liabilities, $8.8 million to identifiable customer lists and $0.7 million to a non-compete agreement, with the identifiable customer lists and non-compete agreements amortized over five years. In addition, we allocated $2.7 million to long-term deferred tax liabilities. We allocated the residual $21.0 million of the aggregate purchase price to goodwill, which is subject to a periodic impairment assessment.
Discontinued Operations
On November 5, 2009, we completed the sale of our PGiMarket business. Prior period results have been reclassified to present this business as discontinued operations. In connection with this divestiture, we recorded a non-cash charge of $7.0 million in discontinued operations to reduce the carrying value of the assets associated with this business to their estimated fair value of $1.4 million, of which $1.0 million was cash received at closing and $0.4 million is an estimate of cash to be received based on the achievement of certain revenue targets in 2010 under an earn-out provision.
As part of the adjustment, we reduced the net book value of property and equipment associated with this business by $6.9 million and adjusted goodwill and other intangibles by $0.9 million and $0.3 million, respectively. In addition, we incurred charges of $0.2 million for costs associated with the sale and recorded a receivable of $0.4 million for the revenue achievement earn-out estimate.
The following amounts associated with our PGiMarket business have been segregated from continuing operations and are reflected as discontinued operations for 2009, 2008 and 2007 (in thousands):
35
| Years Ended December 31, |
|||||||||
|
|
|||||||||
| 2009 | 2008 | 2007 | |||||||
|
|
|
|
|||||||
| Net revenue from discontinued operations | $ | 2,634 | $ | 3,829 | $ | 4,786 | |||
| Operating loss | (4,509 | ) | (6,639 | ) | (4,671 | ) | |||
| Loss on disposal | (6,972 | ) | — | — | |||||
| Income tax benefit | 3,760 | 2,148 | 1,728 | ||||||
|
|
|
|
|
|
|
||||
| Loss from discontinued operations, net of taxes | $ | (7,721 | ) | $ | (4,491 | ) | $ | (2,943 | ) |
|
|
|
|
|
|
|
||||
Liquidity and Capital Resources
At December 31, 2009, we have utilized $260.8 million of our $375.0 million credit facility, with $254.9 million in borrowings and $5.9 million in letters of credit outstanding. From time to time, we enter into interest rate swaps to reduce our exposure to market risk from changes in interest rates on interest payments associated with our credit facility. As of December 31, 2009, we have one $100.0 million interest rate swap outstanding, which has a fixed rate of 4.75% and expires in August 2010.
At the scheduled maturity of our credit facility in April 2011 or in the event of an acceleration of the indebtedness under the credit facility following an event of default, the entire outstanding principal amount of the indebtedness under the facility, together with all other amounts payable thereunder, will become due and payable. We may not have sufficient funds to pay such obligations in full at maturity or upon such acceleration. If we default and are not able to pay any such obligations due, our lenders have liens on substantially all of our assets and could foreclose on our assets in order to satisfy our obligations.
As of December 31, 2009, we had $41.4 million in cash and equivalents compared to $27.5 million as of December 31, 2008. Cash balances residing outside of the United States as of December 31, 2009 were $40.4 million compared to $26.5 million as of December 31, 2008. We repatriate cash for repayment of royalties and management fees charged to international locations from the United States. Therefore, we record foreign currency exchange gains and losses resulting from these transactions in “Other, net” in our consolidated statements of operations. We generally consider intercompany loans with foreign subsidiaries to be permanently invested for the foreseeable future. Therefore, we record foreign currency exchange fluctuations resulting from these transactions in the cumulative translation adjustment account on our consolidated balance sheets. Based on our potential cash position and potential conditions in the capital markets, we could require repayment of these intercompany loans despite the long-term intention to hold them as permanent investments.
Cash Provided by Operating Activities
Consolidated operating cash flows were $92.4 million, $110.1 million and $95.3 million for the years ended December 31, 2009, 2008 and 2007, respectively. The decrease in net cash provided by operating activities in 2009 from the prior year was primarily due to higher restructuring cost payments and higher income tax payments net of income tax refunds in 2009 compared to 2008. The increase in net cash provided by operating activities in 2008 from the prior year was primarily due to increased net income, the deferral of income tax payments and decreased restructuring cost payments, offset in part by working capital changes associated with the timing of accounts payable.
Cash Used-in Investing Activities
Consolidated investing activities used cash of approximately $46.1 million, $76.1 million and $91.2 million in 2009, 2008 and 2007, respectively. The principal uses of cash in investing activities for in 2009 included $38.9 million of capital expenditures and $7.5 million related primarily to our acquisition of LINK. The principal uses of cash in investing activities in 2008 included $45.0 million of capital expenditures and $30.4 million relating to our 2008 business acquisitions and working capital settlements for our acquisitions prior to 2008. The principal uses of cash in investing activities in 2007 included $47.8 million used to fund our acquisitions and $43.4 million of capital expenditures.
36
Cash Provided by Financing Activities
Consolidated financing activities used cash of approximately $28.0 million and $14.0 million and provided cash of approximately $1.9 million in 2009, 2008 and 2007, respectively. The primary uses of cash for financing activities in 2009 included $15.7 million of net payments on our credit facility and $14.5 million in treasury stock purchases. The primary uses of cash for financing activities in 2008 included $1.1 million of net proceeds on our credit facility offset by $18.8 million in treasury stock purchases. The primary sources of cash for financing activities in 2007 included $125.7 million of net proceeds from our credit facility and $8.6 million from the exercise of stock options offset by $136.0 million in treasury stock purchases.
Off-balance Sheet Arrangements
As of December 31, 2009, we did not have any off-balance-sheet arrangements, as defined in Item 303(a)(4)(ii) of SEC Regulation S-K.
Commitments and Contingencies
The following table summarizes our contractual obligations at December 31, 2009 (in thousands):
| Amounts committed |
2010 | 2011 | 2012 | 2013 | 2014 | There- after |
||||||||
|
|
|
|
|
|
|
|
||||||||
|
Contractual obligation:
|
||||||||||||||
| Current borrowings on credit | $ | 254,880 | $ | — | $ | 254,880 |
$
|
—
|
$
|
—
|
$
|
—
|
$
|
—
|
| facility | ||||||||||||||
| Operating leases | 88,024 | 13,093 | 11,835 | 10,042 | 9,148 | $ | 9,040 | 34,866 | ||||||
| Telecommunications service | ||||||||||||||
| agreements | 61,543 | 32,915 | 28,628 | — | — | — | — | |||||||
| Restructuring costs | 14,445 | 7,969 | 1,693 | 1,078 | 1,065 | 1,073 | 1,567 | |||||||
| Capital leases and interest | 13,385 | 4,683 | 3,785 | 3,226 | 1,639 | 52 | — | |||||||
| Credit facility commitment fees | ||||||||||||||
| and interest | 9,192 | 7,676 | 1,516 | — | — | — | — | |||||||
| Uncertain tax positions | 3,924 | 3,924 | — | — | — | — | — | |||||||
| Asset retirement obligation | 854 | 104 | 549 | 15 | — | 67 | 119 | |||||||
| Acquisitions | 543 | 294 | 166 | 83 | — | — | — | |||||||
|
|
|
|
|
|
|
|
|
|
|
|
|
|
|
|
|
$
|
446,790
|
$
|
70,658
|
$
|
303,052
|
$
|
14,444
|
$
|
11,852
|
$
|
10,232
|
$
|
36,552
|
|
|
|
|
|
|
|
|
|
|
|
|
|
|
|
|
|
The table above contains only the portion of the liability accrued for uncertain tax positions that are expected to be settled during 2010. The remaining amount that has been accrued is not included in the contractual obligations table because we are unable to determine when, or if, payment of these amounts will be made.
State Sales Tax and Excise Taxes
Historically, we have collected and remitted state sales tax from our non-PGiMeet solutions customers in applicable states, but we have not collected and remitted state sales tax from our PGiMeet solutions customers in all applicable jurisdictions. In addition, we have learned that certain of our PGiMeet solutions may be subject to telecommunications excise tax statutes in certain states. During the years ended December 31, 2009 and 2008, we paid $0.1 million and $2.8 million, respectively, related to the settlement of certain of these state sales and excise tax contingencies.
We have reserves for certain state sales and excise tax contingencies based on the likelihood of obligation. At December 31, 2009 and 2008, we had reserved $4.4 and $4.6 million, respectively, for certain state sales and excise tax contingencies. These reserved amounts are included in “Accrued taxes, other than income taxes” in our consolidated balance sheets. We believe we have appropriately accrued for these contingencies. In the event that actual results differ from these reserves, we may need to make adjustments, which could materially impact our financial condition and results of operations. In addition, states may disagree with our method of assessing and remitting such taxes or additional states may subject us to inquiries regarding such taxes
37
Capital Resources
We have a $375.0 million committed revolving credit facility, which consists of an original revolving credit facility of $300.0 million with a $100.0 million accordion feature, of which $75.0 million has been exercised to date. This accordion feature allows for additional credit commitments to increase the revolving credit facility up to a maximum of $400.0 million, subject to its terms and conditions. Our credit facility matures in April 2011. Certain of our material domestic subsidiaries have guaranteed our obligations under the credit facility, which is secured by substantially all of our assets and the assets of our material domestic subsidiaries. In addition, we have pledged as collateral all of the issued and outstanding stock of our material domestic subsidiaries and 65% of our material foreign subsidiaries.
At December 31, 2009, we were in compliance with the covenants under our credit facility. Proceeds drawn under our credit facility may be used for refinancing of existing debt, working capital, capital expenditures, acquisitions and other general corporate purposes. The annual interest rate applicable to borrowings under the credit facility, at our option, is the base rate (the greater of either the federal funds rate plus one-half of one percent, the prime rate or the Eurocurrency rate plus one and three-quarters of one percent) or one-month LIBOR plus an applicable margin that varies based upon our leverage ratio at the end of each fiscal quarter. At December 31, 2009, our applicable margin with respect to LIBOR loans was 1.50%. At December 31, 2009, our interest rate on one-month U.S. Dollar LIBOR loans, which comprise materially all of our outstanding borrowings, was 1.73% for our borrowings on which we did not have an interest rate swap agreement in place. At December 31, 2009, we had $254.9 million of borrowings and $5.9 million in letters of credit outstanding under our credit facility.
In August 2007, we entered into two $100.0 million two-year interest rate swaps at a fixed rate of 4.99%. In December 2007, we amended the life of one of the $100.0 million swaps to three years and reduced the fixed rate to 4.75%. One of the swaps matured in August 2009, and one swap remains outstanding at December 31, 2009. We did not initially designate these interest rate swaps as hedges and, as such, we did not account for them under hedge accounting. During the fourth quarter of 2008, we prospectively designated these interest rate swaps as cash flow hedges of our interest rate risk associated with our credit facility using the long-haul method of effectiveness testing. Any changes in fair value prior to designation as a hedge and any ineffectiveness subsequent to such designation are recognized as “Unrealized gain (loss) on change in fair value of interest rate swaps” as a component of “Other (expense) income” in our consolidated statements of operations and amounted to $3.4 million, $(0.1) million, and $(4.5) million during the years ended December 31, 2009, 2008, and 2007, respectively. Any changes in fair value that are determined to be effective are recorded as a component of “Accumulated other comprehensive loss” in our consolidated balance sheets and amounted to a gain of $1.6 million, net of taxes, for the year ended December 31, 2009. We recognize the fair value of derivatives in our consolidated balance sheets as part of “Accrued expenses” under “Current Liabilities” or “Long-Term Liabilities” depending on the maturity date of the contract. The amount recognized in current liabilities was $2.8 million and $2.6 million at December 31, 2009 and 2008, respectively. The amount recognized in “Long-Term Liabilities” was $6.0 million at December 31, 2008. As of December 31, 2009, we have one $100.0 million interest rate swap outstanding, which has a fixed rate of 4.75% and expires in August 2010.
Liquidity
As of December 31, 2009, we had $41.4 million of cash and cash equivalents. We generated positive operating cash flows from each of our geographic business segments for the year ended December 31, 2009. Each geographic business segment had sufficient cash flows from operations to service existing debt obligations, to fund capital expenditure requirements, which have historically been 5% to 8% of annual consolidated net revenues, and to fund research and development costs for new services and enhancements to existing services, which have historically been 2% to 3% of annual consolidated net revenues. Assuming no material change to these costs, which we do not anticipate, we believe that we will generate adequate operating cash flows for capital expenditures and contractual commitments and to satisfy our indebtedness and fund our liquidity needs for at least the next 12 months. At December 31, 2009, we had $114.2 million of available credit on our existing $375.0 million credit facility, without regard to the uncommitted $25.0 million of the accordion feature.
During 2007, net borrowings on our credit facility of $125.7 million resulted primarily from our self-tender offer and stock repurchases in the open market. We have historically used our cash flows from operations for debt repayments, acquisitions, capital expenditures and stock repurchases. At December 31, 2009, borrowings under our credit facility were $254.9 million. In 2010, we anticipate continuing to use our cash flows to pay down our debt, while still continuing to be optimistic in possible acquisitions and share repurchases.
38
We regularly review our capital structure and evaluate potential alternatives in light of current conditions in the capital markets. Depending upon conditions in these markets, cash flows from our operating segments and other factors, we may engage in other capital transactions. These capital transactions include, but are not limited to, debt or equity issuances or credit facilities with banking institutions. We anticipate refinancing our existing credit facility in the first half of 2010, prior to its maturity in April 2011.
Critical Accounting Policies
“Management’s Discussion and Analysis of Financial Condition and Results of Operations” is based upon our consolidated financial statements and the notes thereto, which have been prepared in accordance with GAAP. The preparation of these financial statements requires management to make estimates and judgments that affect the reported amounts of assets and liabilities and the disclosure of contingent assets and liabilities at the date of the financial statements and the reported amounts of net revenues and expenses during the reported periods. On an ongoing basis, management evaluates its estimates and judgments, including those related to revenue recognition, allowance for uncollectible accounts, goodwill and other intangible assets, income taxes, restructuring costs, legal contingencies and derivative instruments.
Management bases its estimates and judgments on historical experience and on various other factors that are believed to be reasonable under the circumstances, the results of which form the basis for making judgments about the carrying values of assets and liabilities that are not readily apparent from other sources. Actual results may differ from those estimates.
We have identified the policies below as critical to our business operations and the understanding of our results of operations. For a detailed discussion on the application of these and other accounting policies, see Note 2 to our consolidated financial statements.
Revenue Recognition
We recognize revenues when persuasive evidence of an arrangement exists, services have been rendered, the price to the buyer is fixed or determinable and collectability is reasonably assured. Revenues consist primarily of usage fees generally based on per minute, per fax page or per transaction methods. To a lesser extent, we charge subscription fees and have fixed-period minimum revenue commitments. Unbilled revenue consists of earned but unbilled revenue that results from non-calendar month billing cycles and the one-month lag time in billing related to certain of our services. Deferred revenue consists of payments made by customers in advance of the time services are rendered. Should changes in conditions cause management to determine these criteria are not met for certain future transactions, revenue recognized for any reporting period could be adversely affected.
Allowance for Uncollectible Accounts Receivable
Prior to the recognition of revenue, we make a decision that collectability is reasonably assured. Over time, management analyzes accounts receivable balances, historical bad debts, customer concentrations, customer creditworthiness, current economic trends, changes in our customer payment terms and other trends when evaluating the adequacy of the allowance for uncollectible accounts receivable. Significant management judgment and estimates must be made and used in connection with establishing the allowance for uncollectible accounts receivable in any accounting period. The accounts receivable balance was $89.9 million and $94.5 million, net of allowance for uncollectible accounts receivable of $1.7 million and $2.1 million, as of December 31, 2009 and 2008, respectively. If the financial condition of our customers were to deteriorate, resulting in impairment to their ability to make payments, additional allowances may be required.
Goodwill and Other Intangible Assets
We evaluate intangible assets and long-lived assets for potential impairment indicators whenever events or changes in circumstances indicate that the carrying value may not be recoverable. Factors that management considers important which could trigger an impairment review include the following:
-
significant decrease in the market value of an asset;
-
significant adverse change in physical condition or manner of use of an asset;
39
-
significant adverse change in legal factors or negative industry or economic trends;
-
a current period operating or cash flow loss combined with a history of operating or cash flow losses or a projection or forecast that demonstrates continuing losses associated with the use of a long-lived asset;
-
significant decline in our stock price for a sustained period; and
-
an expectation that, more likely than not, an asset will be sold or otherwise disposed of before the end of its previously estimated useful life.
Goodwill is not subject to amortization but is subject to an annual impairment review. We completed these reviews as of December 31, 2009, 2008 and 2007 with no impairments identified. We did recognize an impairment of our goodwill during 2009 associated with the sale of our PGiMarket business. See “—Discontinued Operations.”
Other intangible assets with finite lives continue to be amortized. We recognize an impairment loss when the fair value is less than the carrying value of such assets and the carrying value of these assets is not recoverable. The impairment loss, if applicable, is calculated based on the discounted estimated future cash flows using our weighted average cost of capital compared to the carrying value of the long-lived asset. We recorded asset impairments related to other intangible assets during 2009 and 2008. See “—Asset Impairments” and “Discontinued Operations.” Net intangible assets and goodwill amounted to $379.4 million and $376.0 million as of December 31, 2009 and 2008, respectively. Future events could cause us to conclude that the current estimates used should be changed and that goodwill and intangible assets associated with acquired businesses are impaired. Any resulting impairment loss could have a material adverse impact on our financial condition and results of operations.
Income Taxes
As part of the process of preparing our consolidated financial statements, we are required to estimate our taxes in each of the jurisdictions in which we operate. This process involves significant management judgment in estimating our actual current tax exposure together with assessing temporary differences resulting from differing treatment of items for tax and accounting purposes. These differences result in deferred tax assets and liabilities, which are included in our consolidated balance sheets. We must then assess the likelihood that the deferred tax assets will be recovered from future taxable income and, to the extent we believe that recovery is not likely, we must establish a valuation allowance. To the extent we establish a valuation allowance or increase this allowance in a period, an expense is recorded within the tax provision in our consolidated statements of operations.
Our net deferred tax asset as of December 31, 2009 was $1.1 million and our net deferred tax liability as of December 31, 2008 was $3.1 million, net of a valuation allowance of $17.2 million and $12.6 million, respectively. We have recorded our valuation allowance due to uncertainties related to our ability to utilize some of our deferred tax assets, primarily consisting of certain net operating losses carried forward and capital loss carried forward. The valuation allowance is based on our estimates of taxable income by jurisdiction in which we operate and the period over which the deferred tax assets will be recoverable. In the event that actual results differ from these estimates or we adjust these estimates in future periods, we may need to establish an additional valuation allowance or reverse an existing valuation allowance which could materially impact our financial condition and results of operations.
Significant judgment is required in evaluating our uncertain tax positions and determining our provision for income taxes. The total amount of unrecognized tax benefits at December 31, 2009 and 2008 was $5.7 million and $5.4 million, respectively, all of which, if recognized, would affect our annual effective tax rate.
We also have reserves for certain asserted international, federal and state tax contingencies based on the likelihood of obligation. In the normal course of business, we are subject to inquiries from U.S. and non-U.S. tax authorities regarding the amount of income taxes due. These challenges may result in adjustments of the timing or amount of taxable income or deductions or the allocation of income among tax jurisdictions. Further, during the ordinary course of business, other facts and circumstances may impact our ability to utilize tax benefits as well as the estimated income taxes to be paid in future periods. We believe we have appropriately accrued for tax exposures. If we are required to pay an amount less than or exceeding our provisions for uncertain tax matters, the financial impact will be reflected in the period in which the matter is resolved. In the event that actual results differ
40
from these estimates, we may need to adjust tax accounts which could materially impact our financial condition and results of operations.
Restructuring Costs
Restructuring accruals are based on certain estimates and judgments related to severance and exit costs, contractual lease obligations and related costs. Our estimated severance costs could be impacted if actual severance payments are different from initial estimates. Contractual lease obligations could be materially affected by factors such as our ability to secure sublessees, the creditworthiness of sublessees and the success at negotiating early termination agreements with lessors. In the event that actual results differ from these estimates, we may need to establish additional restructuring accruals or reverse accrual amounts accordingly.
Legal Contingencies
We are currently involved in certain litigation matters as disclosed in Item 3. “Legal Proceedings” of this annual report. We accrue an estimate of the probable costs for the resolution of legal claims. These estimates are developed in consultation with outside counsel handling these matters and based upon an analysis of potential results, assuming a combination of litigation and settlement strategies. Our estimates are subject to change, and we adjust the financial impact in the period in which such matters are resolved.
Derivative Instruments
We have entered into interest rate swaps that are classified as derivatives with the intention of hedging the cash flow risk of variable one-month LIBOR interest rate changes on the interest payments associated with our credit facility. We did not initially designate these interest rate swaps as hedges and, as such, we did not account for them under hedge accounting. During the fourth quarter of 2008, we prospectively designated these interest rate swaps as cash flow hedges using the long-haul method of effectiveness testing. Any changes in fair value prior to designation as a hedge and any ineffectiveness subsequent to such designation are recognized as “Unrealized gain (loss) on change in fair value of interest rate swaps” as a component of “Other (expense) income” in our consolidated statements of operations throughout the contract periods. Any changes in fair value that are determined to be effective are recorded as a component of “Other Comprehensive Income” in our consolidated balance sheets. The fair value of derivatives is recognized in our consolidated balance sheets as “Accrued expenses” under “Current Liabilities” or “Long-Term Liabilities.”
New and Recently Adopted Accounting Pronouncements
In June 2009, the FASB issued Accounting Standards Update No. 2009-01, “Generally Accepted Accounting Principles” (Accounting Standards Codification, or ASC, Topic 105) which establishes the ASC as the official single source of authoritative GAAP. All existing accounting standards are superseded. All other accounting guidance not included in the ASC will be considered non-authoritative. The ASC also includes all relevant SEC guidance organized using the same topical structure in separate sections within the ASC. The ASC is effective for financial statements for interim or annual reporting periods ending after September 15, 2009.
In January 2010, the FASB issued Accounting Standards Update No. 2010-06 “Fair Value Measurements and Disclosures,” which requires disclosures about fair value of financial instruments for interim reporting periods of publicly traded companies as well as in annual financial statements. The new disclosures are effective for interim and annual reporting periods beginning after December 15, 2009. Adoption of the provisions of Update No. 2010-06 will be limited to expanded disclosure in our consolidated financial statements.
In October 2009, the FASB issued Accounting Standards Update No. 2009-13, “Revenue Recognition, Multiple-Deliverable Revenue Arrangements,” an amendment to its accounting guidance on revenue arrangements with multiple deliverables. This new accounting guidance addresses the unit of accounting for arrangements involving multiple deliverables and how consideration should be allocated to separate units of accounting, when applicable. In the same month, the FASB also issued Accounting Standards Update No. 2009-14, “Software, Certain Revenue Arrangements That Include Software Elements,” which changes revenue recognition for tangible products containing software and hardware elements. This update excludes from software revenue recognition all tangible products containing both software and non-software components that function together to deliver the product’s essential functionality and includes such products in the multiple-deliverable revenue guidance discussed above. This guidance will be effective for fiscal years beginning on or after June 15, 2010. Early adoption is permitted. All guidance contained within these updates must be adopted in the same period. We do not expect this guidance to have a material impact on our consolidated financial position or results of operations.
41
In June 2009, the FASB updated ASC 855, “Subsequent Events,” which incorporates the subsequent events guidance contained in the auditing standards literature into authoritative accounting literature. The updated accounting guidance requires entities to disclose the date through which they have evaluated subsequent events and whether the date corresponds with the issuance of their financial statements. The updated provisions of ASC 855 are effective for all interim and annual periods ending after June 15, 2009. The adopted provisions of ASC 855 are limited to expanded disclosure in our consolidated financial statements.
In April 2009, the FASB issued ASC 825, “Financial Instruments,” which requires disclosures about fair value of financial instruments for interim reporting periods of publicly traded companies as well as in annual financial statements. This standard also requires those disclosures in summarized financial information at interim reporting periods beginning after March 15, 2009. We adopted the provisions of ASC 825 effective as of April 1, 2009, and it had no material impact on our consolidated financial statements.
In April 2008, the FASB issued new accounting guidance related to the determination of the useful life of intangible assets. This guidance indicates that in developing assumptions about renewal or extension options used to determine the useful life of an intangible asset, an entity needs to consider its own historical experience adjusted for entity-specific factors. In the absence of that experience, an entity shall consider the assumptions that market participants would use about renewal or extension option. The new accounting guidance is to be applied to intangible assets acquired after January 1, 2009. We adopted the provisions of the new accounting guidance, and it had no material impact on our consolidated financial statements.
In March 2008, the FASB issued new accounting guidance related to disclosures about derivative instruments and hedging activities. This guidance amends and expands disclosure requirements to provide a better understanding of how and why an entity uses derivative instruments, how derivative instruments and related hedged items are accounted for and their effect on an entity’s financial position, financial performance and cash flows. This guidance is effective for fiscal years beginning after November 15, 2008. We adopted this guidance as of January 1, 2009, and it had no financial impact other than expanded disclosure in our consolidated financial statements. See Note 10 to our consolidated financial statements.
In December 2007, the FASB issued new accounting guidance related the principles and requirements for how an acquiror recognizes and measures in its financial statements the identifiable assets acquired, the liabilities assumed, any non-controlling interest in the acquiree and the goodwill acquired, as well as adding the requirement that acquisition-related costs be expensed as incurred rather than included in the purchase price. The guidance also establishes disclosure requirements to enable the evaluation of the nature and financial effects of the business combination. This guidance is effective for fiscal years beginning after December 15, 2008. We adopted this guidance on January 1, 2009, and it had no material impact on our consolidated financial statements. The impact of its adoption in future periods will depend on the nature and size of business combinations completed subsequent to the date of adoption.
Item 7A. Quantitative and Qualitative Disclosures About Market Risk
We are exposed to market risk from changes in interest rates and foreign currency exchange rates. We manage our exposure to these market risks through our regular operating and financing activities and the timing of intercompany payable settlements. In addition, from time to time, we enter into interest rate swaps to hedge the cash flow risk of interest rate changes associated with our credit facility. At December 31, 2009, our interest rate swap effectively converted the interest payments of $100.0 million of our LIBOR-based borrowings to a fixed rate.
At December 31, 2009, we had borrowings of approximately $154.9 million outstanding under our credit facility that are subject to interest rate risk. Each 100 basis point increase in interest rates relative to these borrowings would impact our annual pre-tax earnings and cash flows by approximately $1.5 million based on our December 31, 2009 debt level.
We generated 40.7% of our consolidated net revenues and 35.2% of our operating expenses in countries outside of the United States in 2009. Additionally, we have foreign currency denominated debt as part of our credit
42
facility. At December 31, 2009, we had debt outstanding of CA$4.5 million. As a result, fluctuations in exchange rates impact the amount of our reported consolidated net revenues, operating income and debt. A hypothetical positive or negative change of 10% in foreign currency exchange rates would positively or negatively change our consolidated net revenues for 2009 by approximately $24.5 million, operating expenses for 2009 by approximately $19.6 million and outstanding debt by $0.4 million. Our principal exposure has been related to local currency sales and operating costs in Australia, Canada, the Euro Zone, Japan, Norway and the United Kingdom. We have not used derivatives to manage foreign currency exchange risk, and we did not have any foreign currency exchange derivatives outstanding at December 31, 2009.
43
Item 8. Financial Statements and Supplementary Data
Premiere Global Services, Inc. and Subsidiaries Index to Consolidated Financial Statements
44
Report of Independent Registered Public Accounting Firm
The Board of Directors and Shareholders of Premiere Global Services, Inc.
We have audited the accompanying consolidated balance sheet of Premiere Global Services, Inc. and subsidiaries (the Company) as of December 31, 2009, and the related consolidated statements of operations, shareholders' equity, and cash flows for the year then ended. These financial statements are the responsibility of the Company's management. Our responsibility is to express an opinion on these financial statements based on our audit.
We conducted our audit in accordance with the standards of the Public Company Accounting Oversight Board (United States). Those standards require that we plan and perform the audit to obtain reasonable assurance about whether the financial statements are free of material misstatement. An audit includes examining, on a test basis, evidence supporting the amounts and disclosures in the financial statements. An audit also includes assessing the accounting principles used and significant estimates made by management, as well as evaluating the overall financial statement presentation. We believe that our audit provides a reasonable basis for our opinion.
In our opinion, the financial statements referred to above present fairly, in all material respects, the consolidated financial position of Premiere Global Services, Inc. and subsidiaries at December 31, 2009, and the consolidated results of their operations and their cash flows for the year ended December 31, 2009, in conformity with U.S. generally accepted accounting principles.
We also have audited, in accordance with the standards of the Public Company Accounting Oversight Board (United States), Premiere Global Services, Inc. and subsidiaries’ internal control over financial reporting as of December 31, 2009, based on criteria established in Internal Control-Integrated Framework issued by the Committee of Sponsoring Organizations of the Treadway Commission and our report dated February 26, 2010 expressed an unqualified opinion thereon.
/s/ Ernst & Young LLP
Atlanta, Georgia
February 26, 2010
45
REPORT OF INDEPENDENT REGISTERED PUBLIC ACCOUNTING FIRM
To the Board of Directors and Shareholders of Premiere Global Services, Inc.
We have audited the accompanying consolidated balance sheets of Premiere Global Services, Inc. and subsidiaries (the “Company”) as of December 31, 2008, and the related consolidated statements of income, shareholders’ equity, and cash flows for the years ended December 31, 2008 and 2007. These financial statements are the responsibility of the Company’s management. Our responsibility is to express an opinion on these financial statements based on our audits.
We conducted our audits in accordance with the standards of the Public Company Accounting Oversight Board (United States). Those standards require that we plan and perform the audit to obtain reasonable assurance about whether the financial statements are free of material misstatement. An audit includes examining, on a test basis, evidence supporting the amounts and disclosures in the financial statements. An audit also includes assessing the accounting principles used and significant estimates made by management, as well as evaluating the overall financial statement presentation. We believe that our audits provide a reasonable basis for our opinion.
In our opinion, such consolidated financial statements present fairly, in all material respects, the financial position of the Company as of December 31, 2008, and the results of their operations and their cash flows for the years ended December 31, 2008 and 2007, in conformity with accounting principles generally accepted in the United States of America.
As discussed in Note 5 to the consolidated financial statements, the accompanying 2008 and 2007 consolidated financial statements have been retrospectively adjusted for discontinued operations.
/s/ Deloitte & Touche LLP
Atlanta, GA
February 27, 2009
(February 26, 2010 as to Note 5)
46
PREMIERE GLOBAL SERVICES, INC. AND SUBSIDIARIES
CONSOLIDATED BALANCE SHEETS
December 31, 2009 and 2008
(in thousands, except share data)
| ASSETS | 2009 | 2008 | ||||
|
|
|
|||||
| CURRENT ASSETS | ||||||
| Cash and equivalents | $ | 41,402 | $ | 27,535 | ||
| Accounts receivable (less allowances of $1,702 and $2,069, respectively) | 89,906 | 94,469 | ||||
| Prepaid expenses and other current assets | 10,735 | 12,623 | ||||
| Deferred income taxes, net | 7,261 | 11,184 | ||||
|
|
|
|
|
|||
| Total current assets | 149,304 | 145,811 | ||||
|
|
|
|
|
|||
| PROPERTY AND EQUIPMENT, NET | 137,235 | 129,077 | ||||
| OTHER ASSETS | ||||||
| Goodwill | 354,609 | 343,954 | ||||
| Intangibles, net of amortization | 24,840 | 32,080 | ||||
| Deferred income taxes, net | 2,703 | — | ||||
| Restricted cash | 103 | 306 | ||||
| Other assets | 9,432 | 9,779 | ||||
|
|
|
|
|
|||
| Total assets | $ | 678,226 | $ | 661,007 | ||
|
|
|
|
|
|||
| LIABILITIES AND SHAREHOLDERS' EQUITY | ||||||
| CURRENT LIABILITIES | ||||||
| Accounts payable | $ | 51,502 | $ | 52,710 | ||
| Income taxes payable | 4,507 | 3,063 | ||||
| Accrued taxes, other than income taxes | 6,947 | 9,818 | ||||
| Accrued expenses | 28,543 | 33,787 | ||||
| Current maturities of long-term debt and capital lease obligations | 3,596 | 2,455 | ||||
| Accrued restructuring costs | 7,765 | 1,082 | ||||
|
|
|
|
|
|||
| Total current liabilities | 102,860 | 102,915 | ||||
|
|
|
|
|
|||
| LONG-TERM LIABILITIES | ||||||
| Long-term debt and capital lease obligations | 262,927 | 269,034 | ||||
| Accrued restructuring costs | 5,392 | 771 | ||||
| Accrued expenses | 17,133 | 20,150 | ||||
| Deferred income taxes, net | 8,872 | 14,303 | ||||
|
|
|
|
|
|||
| Total long-term liabilities | 294,324 | 304,258 | ||||
|
|
|
|
|
|||
| COMMITMENTS AND CONTINGENCIES (Notes 11 and 15) | ||||||
| SHAREHOLDERS' EQUITY | ||||||
| Common stock, $.01 par value; 150,000,000 shares authorized, 59,392,311 | ||||||
| and 60,792,441 shares issued and outstanding, respectively | 594 | 608 | ||||
| Additional paid-in capital | 544,896 | 545,801 | ||||
| Notes receivable, shareholder | (1,814 | ) | (1,803 | ) | ||
| Accumulated other comprehensive gain (loss) | 6,217 | (8,312 | ) | |||
| Accumulated deficit | (268,851 | ) | (282,460 | ) | ||
|
|
|
|
|
|||
| Total shareholders' equity | 281,042 | 253,834 | ||||
|
|
|
|
|
|||
| Total liabilities and shareholders’ equity | $ | 678,226 | $ | 661,007 | ||
|
|
|
|
|
|||
Accompanying notes are integral to these consolidated financial statements.
47
PREMIERE GLOBAL SERVICES, INC. AND SUBSIDIARIES
CONSOLIDATED STATEMENTS OF OPERATIONS
Years Ended December 31, 2009, 2008 and 2007
(in thousands, except per share data)
| 2009 | 2008 | 2007 | |||||||||
|
|
|
|
|
||||||||
| Net revenues | $ | 601,522 | $ | 620,400 | $ | 554,920 | |||||
| Operating expenses | |||||||||||
| Cost of revenues (exclusive of depreciation and amortization | |||||||||||
| shown separately below) | 257,194 | 253,140 | 224,432 | ||||||||
| Selling and marketing | 142,942 | 151,178 | 137,891 | ||||||||
| General and administrative (exclusive of expenses shown | |||||||||||
| separately below) | 65,478 | 65,526 | 65,340 | ||||||||
| Research and development | 17,028 | 15,697 | 12,513 | ||||||||
| Excise tax expense | — | 2,890 | — | ||||||||
| Depreciation | 37,199 | 31,687 | 29,672 | ||||||||
| Amortization | 10,637 | 15,129 | 15,059 | ||||||||
| Restructuring costs | 21,834 | 3,339 | 3,447 | ||||||||
| Asset impairments | 3,682 | 3,446 | — | ||||||||
| Net legal settlements and related expenses | 593 | 2,230 | 349 | ||||||||
| Acquisition-related costs | 612 | — | — | ||||||||
|
|
|
|
|
|
|
||||||
| Total operating expenses | 557,199 | 544,262 | 488,703 | ||||||||
|
|
|
|
|
|
|
||||||
| Operating income | 44,323 | 76,138 | 66,217 | ||||||||
| Other (expense) income | |||||||||||
| Interest expense | (13,451 | ) | (19,411 | ) | (13,598 | ) | |||||
| Unrealized gain (loss) on change in fair value of interest rate | |||||||||||
| swaps | 3,366 | (106 | ) | (4,482 | ) | ||||||
| Interest income | 419 | 923 | 780 | ||||||||
| Other, net | (278 | ) | 493 | 1,418 | |||||||
|
|
|
|
|
|
|
||||||
| Total other expense | (9,944 | ) | (18,101 | ) | (15,882 | ) | |||||
|
|
|
|
|
|
|
||||||
| Income from continuing operations before income taxes | 34,379 | 58,037 | 50,335 | ||||||||
| Income tax expense | 13,049 | 17,443 | 16,950 | ||||||||
|
|
|
|
|
|
|
||||||
| Net income from continuing operations | 21,330 | 40,594 | 33,385 | ||||||||
|
|
|
|
|
|
|
||||||
| Loss from discontinued operations, net of taxes | (7,721 | ) | (4,491 | ) | (2,943 | ) | |||||
|
|
|
|
|
|
|
||||||
| Net income | $ | 13,609 | $ | 36,103 | $ | 30,442 | |||||
|
|
|
|
|
|
|
||||||
| BASIC WEIGHTED-AVERAGE SHARES OUTSTANDING | 58,823 | 59,356 | 62,654 | ||||||||
|
|
|
|
|
|
|
||||||
| Basic net income (loss) per share | |||||||||||
| Continuing operations | $ | 0.36 | $ | 0.68 | $ | 0.53 | |||||
| Discontinued operations | (0.13 | ) | (0.08 | ) | (0.05 | ) | |||||
|
|
|
|
|
|
|
||||||
| Net income per share | $ | 0.23 | $ | 0.61 | $ | 0.49 | |||||
|
|
|
|
|
|
|
||||||
| DILUTED WEIGHTED-AVERAGE SHARES OUTSTANDING | 59,310 | 60,477 | 63,940 | ||||||||
|
|
|
|
|
|
|
||||||
| Diluted net income (loss) per share | |||||||||||
| Continuing operations | $ | 0.36 | $ | 0.67 | $ | 0.52 | |||||
| Discontinued operations | (0.13 | ) | (0.07 | ) | (0.05 | ) | |||||
|
|
|
|
|
|
|
||||||
| Net income per share | $ | 0.23 | $ | 0.60 | $ | 0.48 | |||||
|
|
|
|
|
|
|
||||||
Accompanying notes are integral to these consolidated financial statements.
48
PREMIERE GLOBAL SERVICES, INC. AND SUBSIDIARIES
CONSOLIDATED STATEMENTS OF SHAREHOLDERS' EQUITY
Years Ended December 31, 2009, 2008 and 2007
(in thousands)
| Common Stock Issued |
Additional
Paid-In Capital |
Notes
Receivable, Shareholder |
Accumulated
Deficit |
Accumulated
Other Comprehensive Income |
Total
Shareholders’ Equity |
||||||||||||||||||
|
|
|
|
|
|
|
||||||||||||||||||
| BALANCE, December 31, 2006 | $ | 702 | $ | 663,232 | $ | (2,004 | ) | $ | (347,727 | ) | $ | 2,088 | $ | 316,291 | |||||||||
|
|
|
|
|
|
|
|
|
|
|
|
|
||||||||||||
| Comprehensive income, net of taxes: | |||||||||||||||||||||||
| Net income | — | — | — | 30,442 | — | 30,442 | |||||||||||||||||
| Translation adjustments, net of taxes | — | — | — | — | 8,435 | 8,435 | |||||||||||||||||
|
|
|
||||||||||||||||||||||
| Comprehensive income, net of taxes | 38,877 | ||||||||||||||||||||||
|
|
|
||||||||||||||||||||||
| Adoption of FIN No. 48 | — | — | — | (1,278 | ) | — | (1,278 | ) | |||||||||||||||
| Issuance of common stock: | |||||||||||||||||||||||
| Exercise of stock options | 13 | 8,540 | — | — | — | 8,553 | |||||||||||||||||
| Equity-based compensation | — | 8,914 | — | — | — | 8,914 | |||||||||||||||||
| Treasury stock purchase and retirement | (104 | ) | (132,882 | ) | — | — | — | (132,986 | ) | ||||||||||||||
| Redemption of restricted shares, net | 7 | (2,710 | ) | — | — | — | (2,703 | ) | |||||||||||||||
| Income tax benefit from equity awards | — | 3,324 | — | — | — | 3,324 | |||||||||||||||||
| Payments and interest related to notes receivable, | |||||||||||||||||||||||
| shareholder | — | — | 302 | — | — | 302 | |||||||||||||||||
|
|
|
|
|
|
|
|
|
|
|
|
|
|
|
||||||||||
| BALANCE, December 31, 2007 | $ | 618 | $ | 548,418 | $ | (1,702 | ) | $ | (318,563 | ) | $ | 10,523 | $ | 239,294 | |||||||||
|
|
|
|
|
|
|
|
|
|
|
|
|
||||||||||||
| Comprehensive income, net of taxes: | |||||||||||||||||||||||
| Net income | — | — | — | 36,103 | — | 36,103 | |||||||||||||||||
| Translation adjustments, net of taxes | — | — | — | — | (16,252 | ) | (16,252 | ) | |||||||||||||||
| Change in unrealized gain (loss), derivatives, net of taxes | — | — | — | — | (2,583 | ) | (2,583 | ) | |||||||||||||||
|
|
|
||||||||||||||||||||||
| Comprehensive income, net of taxes | 17,268 | ||||||||||||||||||||||
|
|
|
||||||||||||||||||||||
| Issuance of common stock: | |||||||||||||||||||||||
| Exercise of stock options | 3 | 2,523 | — | — | — | 2,526 | |||||||||||||||||
| Equity-based compensation | — | 11,663 | — | — | — | 11,663 | |||||||||||||||||
| Treasury stock purchase and retirement | (15 | ) | (14,236 | ) | — | — | — | (14,251 | ) | ||||||||||||||
| Redemption of restricted shares, net | 2 | (3,230 | ) | — | — | — | (3,228 | ) | |||||||||||||||
| Income tax benefit from equity awards | — | 663 | — | — | — | 663 | |||||||||||||||||
| Payments and interest related to notes receivable, | |||||||||||||||||||||||
|
shareholder
|
— | — | (101 | ) | — | — | (101 | ) | |||||||||||||||
|
|
|
|
|
|
|
|
|
|
|
|
|
||||||||||||
| BALANCE, December 31, 2008 | $ | 608 | $ | 545,801 | $ | (1,803 | ) | $ | (282,460 | ) | $ | (8,312 | ) | $ | 253,834 | ||||||||
|
|
|
|
|
|
|
|
|
|
|
|
|
||||||||||||
| Comprehensive income, net of taxes: | |||||||||||||||||||||||
| Net income | — | — | — | 13,609 | — | 13,609 | |||||||||||||||||
| Translation adjustments, net of taxes | — | — | — | — | 12,955 | 12,955 | |||||||||||||||||
| Change in unrealized gain (loss), derivatives, net of taxes | — | — | — | — | 1,574 | 1,574 | |||||||||||||||||
|
|
|
||||||||||||||||||||||
| Comprehensive income, net of taxes | 28,138 | ||||||||||||||||||||||
|
|
|
||||||||||||||||||||||
| Issuance of common stock: | |||||||||||||||||||||||
| Exercise of stock options | 2 | 561 | — | — | — | 563 | |||||||||||||||||
| Equity-based compensation | — | 10,646 | — | — | — | 10,646 | |||||||||||||||||
| Treasury stock purchase and retirement | (16 | ) | (11,585 | ) | — | — | — | (11,601 | ) | ||||||||||||||
| Redemption of restricted shares, net | — | (2,515 | ) | — | — | — | (2,515 | ) | |||||||||||||||
| Warrants issued | — | 344 | — | — | — | 344 | |||||||||||||||||
| Income tax benefit from equity awards | — | 1,644 | — | — | — | 1,644 | |||||||||||||||||
| Payments and interest related to notes receivable, | |||||||||||||||||||||||
|
shareholder
|
— | — | (11 | ) | — | — | (11 | ) | |||||||||||||||
|
|
|
|
|
|
|
|
|
|
|
|
|
||||||||||||
| BALANCE, December 31, 2009 | $ | 594 | $ | 544,896 | $ | (1,814 | ) | $ | (268,851 | ) | $ | 6,217 | $ | 281,042 | |||||||||
|
|
|
|
|
|
|
|
|
|
|
|
|
||||||||||||
Accompanying notes are integral to these consolidated financial statements
49
PREMIERE GLOBAL SERVICES, INC. AND SUBSIDIARIES
CONSOLIDATED STATEMENTS OF CASH FLOWS
Years Ended December 31, 2009, 2008 and 2007
(in thousands)
| 2009
|
2008
|
2007
|
|||||||||
| CASH FLOWS FROM OPERATING ACTIVITIES | |||||||||||
| Net income | $ | 13,609 | $ | 36,103 |
$
|
30,442 | |||||
| Loss from discontinued operations, net of taxes | 7,721 | 4,491 | 2,943 | ||||||||
|
|
|
|
|
|
|
||||||
| Income from continuing operations | 21,330 | 40,594 | 33,385 | ||||||||
| Adjustments to reconcile net income to net cash provided by operating activities: | |||||||||||
| Depreciation | 37,199 | 31,687 | 29,672 | ||||||||
| Amortization | 10,637 | 15,129 | 15,059 | ||||||||
| Amortization of deferred financing costs | 614 | 564 | 513 | ||||||||
| Net legal settlements and related expenses | 593 | 2,230 | 349 | ||||||||
| Payments for legal settlements and related expenses | (329 | ) | (2,254 | ) | — | ||||||
| Deferred income taxes, net of effect of acquisitions | (3,108 | ) | 14,133 | 919 | |||||||
| Restructuring costs | 21,834 | 3,339 | 3,447 | ||||||||
| Payments for restructuring costs | (10,766 | ) | (4,214 | ) | (7,109 | ) | |||||
| Asset impairments | 3,682 | 3,446 | — | ||||||||
| Equity-based compensation | 10,776 | 12,473 | 10,590 | ||||||||
| Excess tax benefits from share-based payment arrangements | (1,716 | ) | (1,149 | ) | (3,323 | ) | |||||
| Unrealized gain (loss) on change in fair value of interest rate swaps | (3,366 | ) | 106 | 4,482 | |||||||
| Provision (recovery) for doubtful accounts | 1,119 | 412 | (770 | ) | |||||||
| Excise tax expense | — | 2,890 | — | ||||||||
| Changes in assets and liabilities, net of effect of acquisitions: | |||||||||||
| Accounts receivable, net | 6,742 | (7,881 | ) | 33 | |||||||
| Prepaid expenses and other assets | 2,899 | (4,290 | ) | (606 | ) | ||||||
| Accounts payable and accrued expenses | (5,780 | ) | 2,897 | 8,681 | |||||||
|
|
|
|
|
|
|
||||||
| Net cash provided by operating activities from continuing operations | 92,360 | 110,112 | 95,322 | ||||||||
|
|
|
|
|
|
|
||||||
| Net cash used in operating activities from discontinued operations | (2,958 | ) | (4,024 | ) | (4,385 | ) | |||||
|
|
|
|
|
|
|
||||||
| Net cash provided by operating activities | 89,402 | 106,088 | 90,937 | ||||||||
|
|
|
|
|
|
|
||||||
| CASH FLOWS FROM INVESTING ACTIVITIES | |||||||||||
| Capital expenditures | (38,881 | ) | (45,020 | ) | (43,424 | ) | |||||
| Other investing activities | 274 | (681 | ) | — | |||||||
| Business acquisitions, net of cash acquired | (7,496 | ) | (30,416 | ) | (47,749 | ) | |||||
|
|
|
|
|
|
|
||||||
| Net cash used in investing activities from continuing operations | (46,103 | ) | (76,117 | ) | (91,173 | ) | |||||
|
|
|
|
|
|
|
||||||
| Net cash used in investing activities from discontinued operations | (2,650 | ) | (4,605 | ) | (2,917 | ) | |||||
|
|
|
|
|
|
|
||||||
| Net cash used in investing activities | (48,753 | ) | (80,722 | ) | (94,090 | ) | |||||
|
|
|
|
|
|
|
||||||
| CASH FLOWS FROM FINANCING ACTIVITIES | |||||||||||
| Principal payments under borrowing arrangements | (201,765 | ) | (529,710 | ) | (344,388 | ) | |||||
| Proceeds from borrowing arrangements | 186,019 | 530,841 | 470,099 | ||||||||
| Payments of debt issuance costs | (147 | ) | (8 | ) | (50 | ) | |||||
| Repayment of notes receivable, shareholder | 93 | — | 413 | ||||||||
| Excess tax benefits from share-based payment arrangements | 1,716 | 1,149 | 3,323 | ||||||||
| Purchase of treasury stock, at cost | (14,491 | ) | (18,824 | ) | (136,049 | ) | |||||
| Exercise of stock options | 563 | 2,527 | 8,553 | ||||||||
|
|
|
|
|
|
|
||||||
| Net cash (used-in) provided by financing activities | (28,012 | ) | (14,025 | ) | 1,901 | ||||||
|
|
|
|
|
|
|
||||||
| Effect of exchange rate changes on cash and equivalents | 1,230 | (2,065 | ) | 534 | |||||||
|
|
|
|
|
|
|
||||||
| NET INCREASE (DECREASE) IN CASH AND EQUIVALENTS | 13,867 | 9,276 | (718 | ) | |||||||
|
|
|
|
|
|
|
||||||
| CASH AND EQUIVALENTS, beginning of period | 27,535 | 18,259 | 18,977 | ||||||||
|
|
|
|
|
|
|
||||||
| CASH AND EQUIVALENTS, end of period | $ | 41,402 | $ | 27,535 | $ | 18,259 | |||||
|
|
|
|
|
|
|
||||||
| Supplemental Disclosure of Cash Flow Information: | |||||||||||
| Cash paid for interest | $ | 12,635 | $ | 16,338 | $ | 13,687 | |||||
|
|
|
|
|
|
|
||||||
| Income tax payments | $ | 19,139 | $ | 15,627 | $ | 7,617 | |||||
|
|
|
|
|
|
|
||||||
| Income tax refunds | $ | 8,871 | $ | 9,812 | $ | 2,052 | |||||
|
|
|
|
|
|
|
||||||
| Capital lease additions | $ | 10,913 | $ | 3,738 | $ | 2,901 | |||||
|
|
|
|
|
|
|
||||||
| Capital expenditures in total current liabilities | $ | 4,628 | $ | 4,960 | $ | 6,059 | |||||
|
|
|
|
|
|
|
||||||
| Capitalized interest | $ | 328 | $ | 1,086 | $ | 1,104 | |||||
|
|
|
|
|
|
|
||||||
Accompanying notes are integral to these consolidated financial statements.
50
PREMIERE GLOBAL SERVICES, INC. AND SUBSIDIARIES
NOTES TO CONSOLIDATED FINANCIAL STATEMENTS
1. THE COMPANY AND ITS BUSINESS
We are a leading global provider of conferencing and collaboration solutions that enable companies and individuals to meet and collaborate in a more productive and efficient manner. We have a global presence in 24 countries in our three segments in North America, Europe and Asia Pacific.
2. SIGNIFICANT ACCOUNTING POLICIES
Accounting Estimates
Preparation of financial statements in conformity with accounting principles generally accepted in the United States requires management to make estimates and assumptions that affect the reported amounts of assets and liabilities and disclosures of contingent assets and liabilities at the date of the financial statements and reported amounts of net revenues and expenses during the reporting period. Financial statement line items that include significant estimates consist of goodwill, net intangibles, accrued restructuring costs, tax accounts, certain accrued liabilities and the allowance for uncollectible accounts receivable. Changes in the facts or circumstances underlying these estimates could result in material changes, and actual results could differ from those estimates. These changes in estimates are recognized in the period they are realized.
Principles of Consolidation and Basis of Presentation
The financial statements include our accounts consolidated with our wholly-owned subsidiaries. All significant intercompany accounts and transactions have been eliminated in consolidation. Unless otherwise stated, current and prior period results in our consolidated statements of operations and cash flows and these notes reflect our results from continuing operations and exclude the effect of current and prior period discontinued operations. See Note 5 to our consolidated financial statements.
Cash and Equivalents and Restricted Cash
Cash and equivalents include cash on hand and highly liquid investments with a maturity at date of purchase of three months or less. Cash balances that are legally restricted as to usage or withdrawal are separately disclosed on the face of our consolidated balance sheets and are classified as either current or long-term depending on the restrictions. At December 31, 2009 and 2008, we had $0.1 million and $0.3 million, respectively, of restricted cash held in long-term other assets that consist of cash held in escrow by third parties associated with several of our facility leases in our Asia Pacific operating segment.
Accounts Receivable and Allowance for Doubtful Accounts
Included in accounts receivable at December 31, 2009 and 2008 was earned but unbilled revenue of approximately $8.5 million and $5.9 million, respectively, which results from non-calendar month billing cycles and the one-month lag in billing of certain of our services. Earned but unbilled revenue is billed within 30 days. Provision (recovery) for doubtful accounts was approximately $1.1 million, $0.4 million and $(0.8) million in 2009, 2008 and 2007, respectively. Write-offs against the allowance for doubtful accounts were $1.5 million, $2.9 million and $2.3 million in 2009, 2008 and 2007, respectively. Our allowance for doubtful accounts represents reserves for receivables that reduce accounts receivable to amounts expected to be collected. Management uses significant judgment in estimating uncollectible amounts. In estimating uncollectible amounts, management considers factors such as historical and anticipated customer payment performance and industry-specific economic conditions. Using these factors, management assigns reserves for uncollectible amounts by accounts receivable aging categories to specific customer accounts.
Property and Equipment
Property and equipment are recorded at cost. Depreciation is recorded under the straight-line method over the estimated useful lives of the assets, commencing when the assets are placed in service. The estimated useful lives are five to seven years for furniture and fixtures, two to five years for software and three to ten years for
51
PREMIERE GLOBAL SERVICES, INC. AND SUBSIDIARIES
NOTES TO CONSOLIDATED FINANCIAL STATEMENTS
computer servers and Internet and telecommunications equipment. The cost of installation of equipment is capitalized, as applicable. Amortization of assets recorded under capital leases is included in depreciation. Assets recorded under capital leases and leasehold improvements are depreciated over the shorter of their useful lives or the term of the related lease.
Research and Development
Research and development costs primarily related to developing new services, features and enhancements to existing services that do not qualify for capitalization are expensed as incurred.
Software Development Costs
We capitalize certain costs incurred to develop software features sold as part of our service offerings, as part of “Property and Equipment, Net” on our consolidated balance sheets. For the years ended December 31, 2009, 2008 and 2007, we capitalized approximately $17.2 million, $22.7 million and $12.2 million, respectively, of these costs. We amortize these capitalized costs on a straight-line basis over the estimated life of the related software, not to exceed five years. Depreciation expense recorded for developed software for the years ended December 31, 2009, 2008, and 2007 was approximately $9.5 million, $5.1 million and $3.4 million, respectively.
Goodwill
Goodwill is subject to a periodic impairment assessment by applying a fair value-based test based upon a two-step method. The first step is to identify potential goodwill impairment by comparing the estimated fair value of the reporting unit to their carrying amounts. The second step measures the amount of the impairment based upon a comparison of “implied fair value” of goodwill with its carrying amount. We have adopted December 31 of a given calendar year as our valuation date and have evaluated goodwill as of December 31, 2009, 2008 and 2007 with no impairments identified.
Valuation of Long-Lived Assets
We evaluate the carrying values of long-lived assets when significant adverse changes in the economic value of these assets require an analysis, including property and equipment and other intangible assets. A long-lived asset is considered impaired when its fair value is less than its carrying value. In that event, a loss is calculated based on the amount the carrying value exceeds the future cash flows, as calculated under the best-estimate approach, of such asset. We believe that long-lived assets in our consolidated balance sheets are appropriately valued. Asset impairments were $3.7 million and $3.4 million during 2009 and 2008, respectively, and are recognized as “Asset impairments” in our consolidated statements of operations.
Revenue Recognition
We recognize revenues when persuasive evidence of an arrangement exists, services have been rendered, the price to the buyer is fixed or determinable and collectability is reasonably assured. Revenues consist primarily of usage fees generally based on per minute, per fax page or per transaction methods. To a lesser extent, we charge subscription fees and fixed-period minimum revenue commitments. Unbilled revenue consists of earned but unbilled revenue which results from non-calendar month billing cycles and the one-month lag time in billing related to certain of our services. Deferred revenue consists of payments made by customers in advance of the time services are rendered.
USF Charges
In accordance with FCC rules, we are required to contribute to the USF for some of our PGiMeet solutions, which we recover from our applicable PGiMeet customers and remit to the USAC. ASC 605-45-50-03 provides the choice of presenting this type of charge on a gross basis (included in revenues and costs) or a net basis (excluded from revenues). The USF charges that we collect and remit are presented on a net basis.
52
PREMIERE GLOBAL SERVICES, INC. AND SUBSIDIARIES
NOTES TO CONSOLIDATED FINANCIAL STATEMENTS
Foreign Currency Translation
The assets and liabilities of subsidiaries with a functional currency other than the U.S. Dollar are translated at rates of exchange existing at our consolidated balance sheet dates. Revenues and expenses are translated at average rates of exchange prevailing during the year. The resulting translation adjustments are recorded in the “Accumulated other comprehensive gain (loss)” component of shareholders’ equity. In addition, intercompany loans with foreign subsidiaries generally are considered to be permanently invested for the foreseeable future. Therefore, all foreign currency exchange gains and losses related to these balances are recorded in the “Accumulated other comprehensive gain (loss)” component of shareholders’ equity in our consolidated balance sheets.
Treasury Stock
All treasury stock transactions are recorded at cost. During each of the years ended December 31, 2009 and December 31, 2008, we repurchased approximately 1.5 million shares of our common stock in the open market for approximately $11.6 million and $14.2 million, respectively. We retire all shares of treasury stock repurchased.
During the years ended December 31, 2009 and 2008, we withheld approximately 316,000 and 327,000 shares, respectively, of our common stock to satisfy certain of our employees’ tax withholdings due upon the vesting of their restricted stock grants and remitted approximately $2.9 million and $4.6 million, respectively, in taxes on our employees’ behalf.
Preferred Stock
We have 5.0 million shares of authorized $0.01 par value preferred stock, none of which are issued or outstanding. Under the terms of our amended and restated articles of incorporation, our board of directors is empowered to issue preferred stock without shareholder action.
Comprehensive Income (Loss)
Comprehensive income (loss) represents the change in equity of a business during a period, except for investments by owners and distributions to owners. Comprehensive income for the years ended December 31, 2009, 2008 and 2007 was $28.1 million, $17.3 million and $38.9 million, respectively. The primary differences between net income, as reported and comprehensive income are foreign currency translation adjustments, net of taxes, and changes in unrealized gain (loss), derivatives, net of taxes.
The components of accumulated other comprehensive income at December 31, 2009, 2008 and 2007 are as follows (in thousands):
| Translation adjustments |
Change in unrealized gain (loss), derivatives |
Total | |||||||||
|
|
|
|
|
|
|||||||
| Balance at December 31, 2006 |
$
|
2,088 | $ | — | $ | 2,088 | |||||
| Current-period change | 8,435 | — | 8,435 | ||||||||
| Tax effect | — | — | — | ||||||||
|
|
|
|
|
|
|
||||||
| Balance at December 31, 2007 | 10,523 | — | 10,523 | ||||||||
| Current-period change | (16,317 | ) | (3,974 | ) | (20,291 | ) | |||||
| Tax effect | 65 | 1,391 | 1,456 | ||||||||
|
|
|
|
|
|
|
||||||
| Balance at December 31, 2008 | (5,729 | ) | (2,583 | ) | (8,312 | ) | |||||
| Current-period change | 12,955 | 2,421 | 15,376 | ||||||||
| Tax effect | — | (847 | ) | (847 | ) | ||||||
|
|
|
|
|
|
|
||||||
| Balance at December 31, 2009 |
$
|
7,226 | $ | (1,009 | ) | $ | 6,217 | ||||
|
|
|
|
|
|
|
||||||
53
PREMIERE GLOBAL SERVICES, INC. AND SUBSIDIARIES
NOTES TO CONSOLIDATED FINANCIAL STATEMENTS
Income Taxes
Significant judgment is required to determine our provision for income taxes, including deferred tax assets, deferred tax liabilities and valuation allowances and in evaluating our uncertain tax positions. Deferred tax assets and liabilities reflect the tax effect of temporary differences between asset and liability amounts recognized for income tax purposes and the amounts recognized for financial reporting purposes. Deferred tax assets and liabilities are measured by applying enacted statutory tax rates applicable to future years in which the deferred tax assets or liabilities are expected to be settled or realized. Valuation allowances are established when necessary to reduce deferred tax assets to the amount expected to be realized on a more likely than not basis. Under current accounting principles, the impact of an uncertain income tax position on the income tax return must be recognized at the largest amount that is more-likely than not to be sustained upon audit by the relevant taxing authority. An uncertain income tax position will not be recognized if it has less than a 50% likelihood of being sustained.
Restructuring Costs
Restructuring reserves are based on certain estimates and judgments related to severance and exit costs, contractual obligations and related costs, and are recorded as “Restructuring costs” in our consolidated statements of operations. See Note 3 to our consolidated financial statements for additional information and related disclosures regarding our restructuring costs.
Legal Contingencies
We are involved from time to time in litigation matters as disclosed in Note 15. We accrue an estimate of the probable costs for the resolution of legal claims. These estimates are developed in consultation with outside counsel handling these matters and based upon an analysis of potential results, assuming a combination of litigation and settlement strategies.
New and Recently Adopted Accounting Pronouncements
In June 2009, the FASB issued Accounting Standards Update No. 2009-01, “Generally Accepted Accounting Principles” (ASC Topic 105) which establishes the ASC as the official single source of authoritative GAAP. All existing accounting standards are superseded. All other accounting guidance not included in the ASC will be considered non-authoritative. The ASC also includes all relevant SEC guidance organized using the same topical structure in separate sections within the ASC. The ASC is effective for financial statements for interim or annual reporting periods ending after September 15, 2009.
In January 2010, the FASB issued Accounting Standards Update No. 2010-06 “Fair Value Measurements and Disclosures,” which requires disclosures about fair value of financial instruments for interim reporting periods of publicly traded companies as well as in annual financial statements. The new disclosures are effective for interim and annual reporting periods beginning after December 15, 2009. Adoption of the provisions of Update No. 2010-06 will be limited to expanded disclosure in our consolidated financial statements.
In October 2009, the FASB issued Accounting Standards Update No. 2009-13, “Revenue Recognition, Multiple-Deliverable Revenue Arrangements,” an amendment to its accounting guidance on revenue arrangements with multiple deliverables. This new accounting guidance addresses the unit of accounting for arrangements involving multiple deliverables and how consideration should be allocated to separate units of accounting, when applicable. In the same month, the FASB also issued Accounting Standards Update No. 2009-14, “Software, Certain Revenue Arrangements That Include Software Elements,” which changes revenue recognition for tangible products containing software and hardware elements. This update excludes from software revenue recognition all tangible products containing both software and non-software components that function together to deliver the product’s essential functionality and includes such products in the multiple-deliverable revenue guidance discussed above. This guidance will be effective for fiscal years beginning on or after June 15, 2010. Early adoption is permitted. All guidance contained within these updates must be adopted in the same period. We do not expect this guidance to have a material impact on our consolidated financial position or results of operations.
54
PREMIERE GLOBAL SERVICES, INC. AND SUBSIDIARIES
NOTES TO CONSOLIDATED FINANCIAL STATEMENTS
In June 2009, the FASB updated ASC 855, “Subsequent Events,” which incorporates the subsequent events guidance contained in the auditing standards literature into authoritative accounting literature. The updated accounting guidance requires entities to disclose the date through which they have evaluated subsequent events and whether the date corresponds with the issuance of their financial statements. We have evaluated the financial statements for subsequent events through February 26, 2010, the date of issuance of our financial statements, and determined that no events or transactions met the definition of a subsequent event for purposes of recognition or disclosure. The updated provisions of ASC 855 are effective for all interim and annual periods ending after June 15, 2009. The adopted provisions of ASC 855 are limited to expanded disclosure in our consolidated financial statements.
In April 2009, the FASB issued ASC 825, “Financial Instruments,” which requires disclosures about fair value of financial instruments for interim reporting periods of publicly traded companies as well as in annual financial statements. This standard also requires those disclosures in summarized financial information at interim reporting periods beginning after March 15, 2009. We adopted the provisions of ASC 825 effective as of April 1, 2009, and it had no material impact on our consolidated financial statements.
In April 2008, the FASB issued new accounting guidance related to the determination of the useful life of intangible assets. This guidance indicates that in developing assumptions about renewal or extension options used to determine the useful life of an intangible asset, an entity needs to consider its own historical experience adjusted for entity-specific factors. In the absence of that experience, an entity shall consider the assumptions that market participants would use about renewal or extension option. The new accounting guidance is to be applied to intangible assets acquired after January 1, 2009. We adopted the provisions of the new accounting guidance, and it had no material impact on our consolidated financial statements.
In March 2008, the FASB issued new accounting guidance related to disclosures about derivative instruments and hedging activities. This guidance amends and expands disclosure requirements to provide a better understanding of how and why an entity uses derivative instruments, how derivative instruments and related hedged items are accounted for and their effect on an entity’s financial position, financial performance and cash flows. This guidance is effective for fiscal years beginning after November 15, 2008. We adopted this guidance as of January 1, 2009, and it had no financial impact other than expanded disclosure in our consolidated financial statements. See Note 12 to our consolidated financial statements.
In December 2007, the FASB issued new accounting guidance related the principles and requirements for how an acquiror recognizes and measures in its financial statements the identifiable assets acquired, the liabilities assumed, any non-controlling interest in the acquiree and the goodwill acquired, as well as adding the requirement that acquisition-related costs be expensed as incurred rather than included in the purchase price. The guidance also establishes disclosure requirements to enable the evaluation of the nature and financial effects of the business combination. This guidance is effective for fiscal years beginning after December 15, 2008. We adopted this guidance on January 1, 2009, and it had no material impact on our consolidated financial statements. The impact of its adoption in future periods will depend on the nature and size of business combinations completed subsequent to the date of adoption.
3. RESTRUCTURING COSTS
Consolidated restructuring costs for the years ended December 31, 2009, 2008 and 2007, including costs related to our discontinued operations in 2009, are as follows (in thousands):
| Balance at December 31, 2006 |
Provisions
|
Cash payments |
Equity released |
Non-cash
|
Balance at December 31, 2007 |
||||||||||||||
| Accrued restructuring costs: | |||||||||||||||||||
| Severance and exit costs | $ | 4,027 | $ | 4,098 |
$
|
(6,448 | ) |
$
|
— |
$
|
(751 | ) | $ | 926 | |||||
| Contractual obligations | 3,112 | 100 | (846 | ) | — | — | 2,366 | ||||||||||||
|
|
|
|
|
|
|
|
|
|
|
|
|
||||||||
| Total restructuring costs | $ | 7,139 | $ | 4,198 |
$
|
(7,294 | ) |
$
|
— |
$
|
(751 | ) | $ | 3,292 | |||||
|
|
|
|
|
|
|
|
|
|
|
|
|
||||||||
55
PREMIERE GLOBAL SERVICES, INC. AND SUBSIDIARIES
NOTES TO CONSOLIDATED FINANCIAL STATEMENTS
| Balance at December 31, 2007 |
Provisions
|
Cash payments |
Equity released |
Non-cash
|
Balance at December 31, 2008 |
|||||||||||||||
| Accrued restructuring costs: | ||||||||||||||||||||
| Severance and exit costs |
$
|
926 | $ | 3,431 | $ | (3,446 | ) | $ | (549 | ) | $ | (92 | ) | $ | 270 | |||||
| Contractual obligations | 2,366 | — | (783 | ) | — | — | 1,583 | |||||||||||||
|
|
|
|
|
|
|
|
|
|
|
|
|
|||||||||
| Total restructuring costs |
$
|
3,292 | $ | 3,431 | $ | (4,229 | ) | $ | (549 | ) | $ | (92 | ) | $ | 1,853 | |||||
|
|
|
|
|
|
|
|
|
|
|
|
|
|||||||||
|
Balance at
December 31, 2008 |
Provisions
|
Cash
payments |
Equity
released |
Non-cash
|
|
Balance at
December 31, 2009 |
||||||||||||||
| Accrued restructuring costs: | ||||||||||||||||||||
| Severance and exit costs |
$
|
270 | $ | 14,776 | $ | (9,519 | ) | $ | (164 | ) | $ | 129 | $ | 5,492 | ||||||
| Contractual obligations | 1,583 | 7,623 | (1,548 | ) | — | 7 | 7,665 | |||||||||||||
|
|
|
|
|
|
|
|
|
|
|
|
|
|
||||||||
| Total restructuring costs |
$
|
1,853 | $ | 22,399 | $ | (11,067 | ) | $ | (164 | ) | $ | 136 | $ | 13,157 | ||||||
|
|
|
|
|
|
|
|
|
|
|
|
|
|||||||||
Realignment of Workforce – 2009
During the year ended December 31, 2009, we executed a restructuring plan to consolidate and streamline various functions of our work force. As part of these consolidations we eliminated approximately 500 positions. During the year ended December 31, 2009, we recorded total severance and exit costs of $14.8 million, which included the acceleration of vesting of restricted stock with a fair market value of $0.2 million. Severance costs for 2009 included $0.4 million associated with the decision to divest our PGiMarket business. Additionally, during the year ended December 31, 2009, we recorded $4.4 million of lease termination costs associated with office locations in North America and Europe. The expenses associated with these activities are reflected in “Restructuring costs” in our consolidated statements of operations. On a segment basis, these restructuring costs total $12.0 million in North America, $6.6 million in Europe, and $0.6 million in Asia Pacific. Our reserve for the 2009 restructuring costs was $9.3 million at December 31, 2009. We anticipate these severance-related costs will be paid over the next year, and these lease termination costs will be paid over the next nine years.
Realignment of Workforce – 2008
During the year ended December 31, 2008, we executed a restructuring plan to consolidate the senior management of our technology development and network operations functions and to consolidate our corporate communications function into our marketing department. As part of these consolidations, we eliminated 11 positions, including entering into a separation agreement with our president, global operations. During the year ended December 31, 2008, we expensed total restructuring costs of $3.4 million associated with this realignment of our workforce, representing severance costs associated with the elimination of these positions. On a segment basis, the total restructuring costs initially incurred were $2.0 million in North America, $1.3 million in Europe and $0.1 million in Asia Pacific, with total adjustments in 2009 in Europe of $(0.1) million and in North America of $0.1. As of December 31, 2009, we have completed this restructuring plan and, accordingly, no reserves for the 2008 restructuring costs remain.
Realignment of Workforce – 2007
During the year ended December 31, 2007, we executed a restructuring plan to consolidate our non-PGiMeet solutions service delivery organizations. As part of this consolidation, we eliminated 84 positions. We initially expensed total restructuring costs of $4.2 million, representing $4.1 million in severance costs associated with the elimination of these positions and $0.1 million of lease termination costs associated with our Paris, France office. During the years ended December 31, 2008 and 2007, we adjusted the initially recorded charge by $(0.1) million and $(0.2) million, respectively, related to actual severance payments being less than originally estimated. The expenses associated with these charges are reflected in “Restructuring costs” in our consolidated statements of operations. On a segment basis, the total restructuring costs initially incurred were $1.1 million in North America, $2.7 million in Europe and $0.4 million in Asia Pacific, with total adjustments in Europe of $(0.1) million and $(0.2)
56
PREMIERE GLOBAL SERVICES, INC. AND SUBSIDIARIES
NOTES TO CONSOLIDATED FINANCIAL STATEMENTS
million in 2008 and 2007, respectively. As of December 31, 2009, we have completed this restructuring plan and, accordingly, no reserves for the 2007 restructuring costs remain.
Realignment of Workforce – Prior to 2007
Amounts paid in cash during the year ended December 31, 2009 for restructuring costs incurred prior to 2007 totaled $0.9 million. During the year ended December 31, 2009, we revised assumptions used in determining the estimated costs associated with lease terminations incurred prior to 2007. As a result, we recorded an additional $3.2 million of lease termination costs. The expenses associated with these activities are reflected in “Restructuring costs” in our consolidated statements of operations. At December 31, 2009, our reserve for restructuring costs incurred prior to 2007 totaled $3.9 million and is associated with lease termination costs. We anticipate these remaining lease termination costs will be paid over the next seven years.
4. ACQUISITIONS
We seek to acquire complementary companies that increase our market share and provide us with additional customers, technologies, applications and sales personnel. All revenues and related costs from these transactions have been included in our consolidated financial statements as of the effective date of each acquisition.
North America
In February 2009, we acquired certain technology assets of a provider of web collaboration services in exchange for warrants to purchase 105,000 shares of our common stock. We allocated the $0.3 million fair value of the warrants to in-process research and development in other intangible assets. The in-process research and development is not currently being amortized but is subject to periodic impairment testing. We incurred transaction fees and closing costs of $0.2 million, which we expensed as incurred.
In February 2009, we acquired certain assets and assumed certain liabilities of LINK, a U.S.-based provider of audio and web conferencing services. We paid $7.1 million in cash at closing and $0.3 million in transaction fees and closing costs, which we expensed as incurred. We funded the purchase through our credit facility and cash and equivalents on hand. We allocated $0.7 million to accounts receivable, $0.1 million to prepaid assets, $0.3 million to acquired fixed assets, $0.3 million to other acquisition liabilities, $2.4 million to identifiable customer lists and $0.1 million to non-compete agreements, with the customer lists amortized over ten years and the non-compete agreements amortized over five years. We allocated the residual $3.8 million of the purchase price to goodwill, which is subject to a periodic impairment assessment.
In July 2008, we acquired certain assets of Soundpath, a U.S.-based provider of audio conferencing services. We paid $20.1 million in cash at closing and $0.3 million in transaction fees and closing costs. We funded the purchase through our credit facility and cash and equivalents on hand. We allocated $6.0 million to identifiable customer lists and $1.0 million to non-compete agreements, with the customer lists amortized over ten years and the non-compete agreements amortized over five years. We allocated the residual $13.4 million of the aggregate purchase price to goodwill, which is subject to a periodic impairment assessment.
In May 2008, we acquired certain assets and assumed certain liabilities of the U.S.-based audio conferencing business of iLinc. We paid $3.9 million in cash at closing and $0.1 million in transaction fees and closing costs. We funded the purchase with cash and equivalents on hand. We allocated $0.6 million to acquired working capital, $0.8 million to other acquisition liabilities and $1.2 million to identifiable intangible assets, which will be amortized over five years. We allocated the residual $3.0 million of the aggregate purchase price to goodwill, which is subject to a periodic impairment assessment.
In July 2007, we acquired the assets and stock of Budget Conferencing. We paid $19.8 million in cash at closing and $0.6 million in transaction fees and closing costs. In June 2008, we paid an additional $0.7 million in cash to finalize the working capital component of the purchase price. We funded the purchase through our credit facility. We allocated approximately $0.2 million to acquired fixed assets, $0.1 million to other acquisition
57
PREMIERE GLOBAL SERVICES, INC. AND SUBSIDIARIES
NOTES TO CONSOLIDATED FINANCIAL STATEMENTS
liabilities, $6.6 million to identifiable customer lists, $1.3 million to trademarks, and $1.4 million to a non-compete agreement, with the identifiable customer lists and non-compete agreements amortized over five years. In addition, we allocated $2.6 million to long-term deferred tax liabilities to record the step-up in basis for the customer lists and developed technology purchased. We allocated the residual $14.3 million of the aggregate purchase price to goodwill, which is subject to a periodic impairment assessment.
Europe
In November 2007, we acquired the stock of Meet24. We paid $26.3 million in cash at closing and $0.2 million in transaction fees and closing costs. We funded the purchase through our credit facility and cash and equivalents on hand. We allocated approximately $0.2 million to acquired fixed assets, $1.4 million to acquired working capital, $0.9 million to acquired deferred tax assets, $3.8 million to other acquisition liabilities, $8.8 million to identifiable customer lists, and $0.7 million to a non-compete agreement, with the identifiable customer lists and non-compete agreements amortized over five years. In addition, we allocated $2.7 million to long-term deferred tax liabilities. We allocated the residual $21.0 million of the aggregate purchase price to goodwill, which is subject to a periodic impairment assessment.
5. DISCONTINUED OPERATIONS
On November 5, 2009, we completed the sale of our PGiMarket business. Prior period results have been reclassified to present this business as discontinued operations. In connection with this divestiture, we recorded a non-cash charge of $7.0 million in discontinued operations to reduce the carrying value of the assets associated with this business to their estimated fair value of $1.4 million, of which $1.0 million was cash received at closing and $0.4 million is an estimate of cash to be received based on the achievement of certain revenue targets of the business in 2010 under an earn-out provision.
As part of the adjustment, we reduced the net book value of property and equipment associated with this business by $6.9 million and adjusted goodwill and other intangibles by $0.9 million and $0.3 million, respectively. In addition, we incurred charges of $0.2 million for costs associated with the sale and recorded a receivable of $0.4 million for the revenue achievement earn-out estimate.
The following amounts associated with our PGiMarket business have been segregated from continuing operations and are reflected as discontinued operations for 2009, 2008 and 2007 (in thousands):
| Years Ended December 31, |
|||||||||
|
|
|
|
|
|
|
|
|||
| 2009 | 2008 | 2007 | |||||||
|
|
|
|
|||||||
| Net revenue from discontinued operations | $ | 2,634 | $ | 3,829 | $ | 4,786 | |||
| Operating loss | (4,509 | ) | (6,639 | ) | (4,671 | ) | |||
| Loss on disposal | (6,972 | ) | — | — | |||||
| Income tax benefit | 3,760 | 2,148 | 1,728 | ||||||
|
|
|
|
|
|
|
||||
| Loss from discontinued operations, net of taxes | $ | (7,721 | ) | $ | (4,491 | ) | $ | (2,943 | ) |
|
|
|
|
|
|
|
||||
58
PREMIERE GLOBAL SERVICES, INC. AND SUBSIDIARIES
NOTES TO CONSOLIDATED FINANCIAL STATEMENTS
6. PROPERTY AND EQUIPMENT, NET
Property and equipment at December 31, 2009 and 2008 is as follows (in thousands):
| 2009 | 2008 | |||||
|
|
| |||||
| Operations equipment | $ | 123,069 | $ | 122,361 | ||
| Furniture and fixtures | 7,415 | 10,658 | ||||
| Office equipment | 5,328 | 8,063 | ||||
| Leasehold improvements | 25,990 | 24,195 | ||||
| Capitalized software | 99,459 | 82,354 | ||||
| Construction in progress | 11,221 | 17,834 | ||||
| Building | 1,597 | 1,442 | ||||
|
|
|
|
|
|||
| 274,079 | 266,907 | |||||
| Less accumulated depreciation | (136,844 | ) | (137,830 | ) | ||
|
|
|
|
|
|||
| Property and equipment, net | $ | 137,235 | $ | 129,077 | ||
|
|
|
|
|
|||
During 2009, asset impairments were $3.7 million, associated primarily with the abandonment of certain software projects previously included in “Property and equipment, net.” During 2008, included in total asset impairments was $2.3 million associated primarily with the abandonment of billing system software projects previously included in “Property and equipment, net.”
Assets under capital leases included in property and equipment at December 31, 2009 and 2008 are as follows (in thousands):
| 2009 | 2008 | |||||
|
|
| |||||
| Operations equipment | $ | 16,853 | $ | 10,695 | ||
| Less accumulated depreciation | (4,616 | ) | (5,152 | ) | ||
|
|
|
|
|
|||
| Assets under capital lease, net | $ | 12,237 | $ | 5,543 | ||
|
|
|
|
|
|||
7. GOODWILL AND INTANGIBLE ASSETS
Goodwill by reportable business segment at December 31, 2009, 2008 and 2007 (in thousands):
| North America |
Europe | Asia Pacific |
Total | ||||||||||||
|
|
|
|
|
||||||||||||
| Goodwill | $ | 377,718 | $ | 46,529 | $ | 4,570 | $ | 428,817 | |||||||
| Accumulated impairment losses | (91,571 | ) | — | — | (91,571 | ) | |||||||||
|
|
|
|
|
|
|
|
|
||||||||
| Carrying value at December 31, 2007 | 286,147 | 46,529 | 4,570 | 337,246 | |||||||||||
| Additions | 16,862 | — | — | 16,862 | |||||||||||
| Adjustments | (3,474 | ) | (5,885 | ) | (795 | ) | (10,154 | ) | |||||||
|
|
|
|
|
|
|
|
|
||||||||
| Goodwill | 391,106 | 40,644 | 3,775 | 435,525 | |||||||||||
| Accumulated impairment losses | (91,571 | ) | — | — | (91,571 | ) | |||||||||
|
|
|
|
|
|
|
|
|
||||||||
| Carrying value at December 31, 2008 | 299,535 | 40,644 | 3,775 | 343,954 | |||||||||||
| Additions | 3,770 | — | — | 3,770 | |||||||||||
| Impairment loss | (852 | ) | — | — | (852 | ) | |||||||||
| Adjustments | 2,887 | 3,941 | 909 | 7,737 | |||||||||||
|
|
|
|
|
|
|
|
|
||||||||
| Goodwill | 397,763 | 44,585 | 4,684 | 447,032 | |||||||||||
| Accumulated impairment losses | (92,423 | ) | — | — | (92,423 | ) | |||||||||
|
|
|
|
|
|
|
|
|
||||||||
| Carrying value at December 31, 2009 | $ | 305,340 | $ | 44,585 | $ | 4,684 | $ | 354,609 | |||||||
|
|
|
|
|
|
|
|
|
||||||||
59
PREMIERE GLOBAL SERVICES, INC. AND SUBSIDIARIES
NOTES TO CONSOLIDATED FINANCIAL STATEMENTS
Goodwill is not subject to amortization but is subject to periodic reviews for impairment. Additions to the goodwill carrying value during 2009 are primarily due to our acquisition of certain assets of LINK. Additions to the goodwill carrying value during 2008 are primarily due to our acquisition of certain assets of Soundpath and iLinc. Adjustments to the goodwill carrying value since December 31, 2007 are primarily due to working capital adjustments related to prior period acquisitions and foreign currency fluctuations against the U.S. Dollar. Impairments to the goodwill carrying value since December 31, 2008 are associated with the decision to divest our PGiMarket business.
Other Intangible Assets
Summarized below are the carrying value and accumulated amortization, if applicable, by intangible asset class at December 31, 2009 and 2008 (in thousands):
| 2009 | 2008 | ||||||||||||||
|
|
|
|
|
|
|
|
|
|
|||||||
| Gross carrying value |
Accumulated amortization |
Net carrying value |
Gross carrying value |
Accumulated amortization |
Net carrying value |
||||||||||
|
|
|
|
|
|
|
||||||||||
|
Other Intangible assets:
|
|||||||||||||||
| Customer lists | $ 132,704 | $ (112,975 | ) | $ 19,729 | $ 128,564 | $ (102,705 | ) | $ 25,859 | |||||||
| Non-compete agreements | 6,087 | (3,974 | ) | 2,113 | 5,799 | (2,821 | ) | 2,978 | |||||||
| Developed technology | 39,626 | (39,421 | ) | 205 | 40,069 | (39,598 | ) | 471 | |||||||
| Other | 2,855 | (62 | ) | 2,793 | 2,842 | (70 | ) | 2,772 | |||||||
|
|
|
|
|
|
|
||||||||||
|
Total other intangible
|
|||||||||||||||
|
assets
|
$ 181,272 | $ (156,432 | ) | $ 24,840 | $ 177,274 | $ (145,194 | ) | $ 32,080 | |||||||
|
|
|
|
|
|
|
||||||||||
Other intangible assets include $22.1 million of net intangible assets at December 31, 2009 that are subject to amortization. Our weighted-average useful lives from the date of acquisition for finite lived intangible assets acquired during 2009 was 9.3 years and 0.2 years for customer lists and non-compete agreements, respectively, and 9.5 years for total finite lived intangibles acquired during the period. Other intangible assets that are subject to amortization are amortized over an estimated useful life between one and ten years. Amortization expense related to our other intangible assets for the full year 2009 was approximately $10.6 million. Estimated amortization expense for the next five years is as follows (in thousands):
| Estimated | ||
| amortization | ||
| Year | expense | |
|
|
|
|
| 2010 |
$7,553
|
|
| 2011 |
5,906
|
|
| 2012 |
3,557
|
|
| 2013 |
1,124
|
|
| 2014 |
847
|
|
60
PREMIERE GLOBAL SERVICES, INC. AND SUBSIDIARIES
NOTES TO CONSOLIDATED FINANCIAL STATEMENTS
8. INDEBTEDNESS
Long-term debt and capital lease obligations at December 31, 2009 and 2008 are as follows (in thousands):
|
December 31,
2009 |
December 31,
2008 |
|||
| Borrowings on credit facility | $ 254,880 | $ 266,199 | ||
| Capital lease obligations | 11,643 | 5,290 | ||
|
|
|
|||
| Subtotal | $ 266,523 | $ 271,489 | ||
| Less current portion | (3,596 | ) | (2,455 | ) |
|
|
|
|||
| Total long-term debt and capital lease obligations | $ 262,927 | $ 269,034 | ||
|
|
|
The fair value of our long-term debt and capital lease obligations was $262.9 million and $253.7 million at December 31, 2009 and 2008, respectively. Fair value is determined using current interest rates offered to us on debt of the same remaining maturity and characteristics, including credit quality.
Future minimum lease payments under capital leases consist of the following at December 31, 2009 (in thousands):
| 2010 | $ | 4,683 | |
| 2011 | 3,785 | ||
| 2012 | 3,226 | ||
| 2013 | 1,639 | ||
| 2014 | 52 | ||
|
|
|
||
| Total minimum lease payments | 13,385 | ||
| Less amounts representing interest | (1,742 | ) | |
|
|
|
||
| Present value of minimum lease payments | 11,643 | ||
| Less current portion | (3,596 | ) | |
|
|
|
||
| $ | 8,047 | ||
|
|
|
We have a $375.0 million committed revolving credit facility, which consists of an original revolving credit facility of $300.0 million with a $100.0 million accordion feature, of which $75.0 million has been exercised to date. This accordion feature allows for additional credit commitments to increase the revolving credit facility up to a maximum of $400.0 million, subject to its terms and conditions. Our credit facility matures in April 2011. Certain of our material domestic subsidiaries have guaranteed our obligations under the credit facility, which is secured by substantially all of our assets and the assets of our material domestic subsidiaries. In addition, we have pledged as collateral all of the issued and outstanding stock of our material domestic subsidiaries and 65% of our material foreign subsidiaries.
At December 31, 2009, we were in compliance with the covenants under our credit facility. Proceeds drawn under our credit facility may be used for refinancing of existing debt, working capital, capital expenditures, acquisitions and other general corporate purposes. The annual interest rate applicable to borrowings under the credit facility, at our option, is the base rate (the greater of either the federal funds rate plus one-half of one percent, the prime rate or the Eurocurrency rate plus one and three-quarters of one percent) or one-month LIBOR plus an applicable margin that varies based upon our leverage ratio at the end of each fiscal quarter. At December 31, 2009, our applicable margin with respect to LIBOR loans was 1.50%. At December 31, 2009, our interest rate on one-month U.S. Dollar LIBOR loans, which comprise materially all of our outstanding borrowings, was 1.73% for our borrowings on which we did not have an interest rate swap agreement in place. At December 31, 2009, we had $254.9 million of borrowings and $5.9 million in letters of credit outstanding under our credit facility.
In August 2007, we entered into two $100.0 million two-year interest rate swaps at a fixed rate of 4.99%. In December 2007, we amended the life of one of the $100.0 million swaps to three years and reduced the fixed rate to 4.75%. We did not initially designate these interest rate swaps as hedges and, as such, we did not account for them under hedge accounting. During the fourth quarter of 2008, we prospectively designated these interest rate
61
PREMIERE GLOBAL SERVICES, INC. AND SUBSIDIARIES
NOTES TO CONSOLIDATED FINANCIAL STATEMENTS
swaps as cash flow hedges of our interest rate risk associated with our credit facility using the long-haul method of effectiveness testing. Any changes in fair value prior to designation as a hedge and any ineffectiveness subsequent to such designation are recognized as “Unrealized gain (loss) on change in fair value of interest rate swaps” as a component of “Other (expense) income” in our consolidated statements of operations and amounted to $3.4 million, $(0.1) million, and $(4.5) million during the years ended December 31, 2009, 2008, and 2007, respectively. Any changes in fair value that are determined to be effective are recorded as a component of “Accumulated other comprehensive loss” in our consolidated balance sheets and amounted to a gain of $1.6 million, net of taxes, for the year ended December 31, 2009. We recognize the fair value of derivatives in our consolidated balance sheets as part of “Accrued expenses” under “Current Liabilities” or “Long-Term Liabilities” depending on the maturity date of the contract. The amount recognized in current liabilities was $2.8 million and $2.6 million at and December 31, 2009 and 2008, respectively. The amount recognized in “Long-Term Liabilities” was $6.0 million at December 31, 2008. As of December 31, 2009, we have one $100.0 million interest rate swap outstanding, which has a fixed rate of 4.75% and expires in August 2010.
9. EQUITY-BASED COMPENSATION
We may issue restricted stock awards, stock options, stock appreciation rights, restricted stock units and other stock-based awards to employees, directors, non-employee consultants and advisors under our amended and restated 2004 long-term incentive plan and our amended and restated 2000 directors stock plan. Options issued under these plans, other than the directors stock plan, may be either incentive stock options, which permit income tax deferral upon exercise of options, or non-qualified options not entitled to such deferral. The compensation committee of our board of directors administers these stock plans.
In April 2008, our board of directors adopted and, in June 2008, our shareholders approved our amended and restated 2004 long-term incentive plan. The amendment and restatement of our 2004 plan increased the total number of shares authorized for issuance by 2.0 million shares to 6.0 million shares. The maximum number of stock-based awards that we may grant under our 2004 plan during any one calendar year to any one grantee is 1.0 million shares. We may not grant more than 3,975,176 of stock-based awards in the form of “full value” awards, such as restricted stock, subject to anti-dilution adjustments under our 2004 plan.
In April 2008, our board of directors adopted and, in June 2008, our shareholders approved our amended and restated 2000 directors stock plan. Only non-employee directors can participate in our directors stock plan. Under our directors stock plan, we have reserved a total of 2.0 million shares of our common stock in connection with stock-based awards. We may not grant more than 325,431 of stock-based awards in the form of restricted stock, subject to anti-dilution adjustments, and may only grant non-qualified stock options under our directors stock plan.
Equity-based compensation expense is measured at the grant date, based on the fair value of the award, and is recognized over the vesting periods. The following table presents total equity-based compensation expense for non-qualified stock options and restricted stock awards included in the line items below in our consolidated statements of operations (in thousands):
| Years Ended December 31, | |||||||||
|
| |||||||||
| 2009 | 2008 | 2007 | |||||||
|
|
|
| |||||||
| Cost of revenues | $ | 408 | $ | 279 | $ | 416 | |||
| Selling and marketing | 2,187 | 2,942 | 2,238 | ||||||
| Research and development | 1,267 | 1,174 | 827 | ||||||
| General and administrative | 6,914 | 8,078 | 7,109 | ||||||
|
|
|
|
|
|
|
||||
| Equity-based compensation expense | 10,776 | 12,473 | 10,590 | ||||||
| Income tax benefits | (3,664 | ) | (4,241 | ) | (3,601 | ) | |||
|
|
|
|
|
|
|
||||
| Total equity-based compensation expense, net of tax | $ | 7,112 | $ | 8,232 | $ | 6,989 | |||
|
|
|
|
|
|
|
||||
62
PREMIERE GLOBAL SERVICES, INC. AND SUBSIDIARIES
NOTES TO CONSOLIDATED FINANCIAL STATEMENTS
Restricted Stock
The fair value of restricted stock awards is the market value of the stock on the date of grant. The effect of vesting conditions that apply only during the requisite service period is reflected by recognizing compensation cost only for the restricted stock awards for which the requisite service is rendered. As a result, we are required to estimate an expected forfeiture rate, as well as the probability that performance conditions that affect the vesting of certain stock-based awards will be achieved, and only recognize expense for those shares expected to vest. We estimate that forfeiture rate based on historical experience of our stock-based awards that are granted, exercised and voluntarily cancelled. If our actual forfeiture rate is materially different from our estimate, the stock-based compensation expense could be significantly different from what we have recorded in the current period. During the year ended December 31, 2007, we elected to adjust our forfeiture rate to 1.5% from 0%. The financial impact of this adjustment was $0.3 million and was recognized as a reduction of equity-based compensation in the year ended December 31, 2007. We continued to use a forfeiture rate of 1.5% for the year ended December 31, 2009.
The following table summarizes the activity of our unvested restricted stock awards under our stock plans for the year ended December 31, 2009:
| Shares | Weighted- average grant date fair value |
|||
|
|
|
|||
| Unvested at December 31, 2008 | 1,926,507 | $ |
11.18
|
|
| Granted | 378,463 |
9.70
|
||
| Vested/released | (991,351 | ) | 10.35 | |
| Forfeited | (118,348 | ) | 12.24 | |
|
|
|
|
||
| Unvested at December 31, 2009 | 1,195,271 | $ |
11.30
|
|
|
|
|
|
||
The weighted-average grant date fair value of restricted stock awards granted during the years ended December 31, 2009, 2008 and 2007, was $9.70, $12.95 and $12.71, respectively. The aggregate fair value of restricted stock vested during the years ended December 31, 2009, 2008 and 2007, was $9.0 million, $13.9 million and $11.9 million, respectively. As of December 31, 2009, we had $9.4 million of unvested restricted stock, which we will record in our statements of operations over a weighted average recognition period of less than two years.
Stock Options
The fair value of stock options is estimated at the date of grant with the Black-Scholes option pricing model using various assumptions such as expected life, volatility, risk-free interest rate, dividend yield and forfeiture rates. The expected life of stock-based awards granted represents the period of time that they are expected to be outstanding and is estimated using historical data. Using the Black-Scholes option valuation model, we estimate the volatility of our common stock at the date of grant based on the historical volatility of our common stock. We base the risk-free interest rate used in the Black-Scholes option valuation model on the implied yield currently available on U.S. Treasury zero-coupon issues with an equivalent remaining term equal to the expected life of the award. We have not paid any cash dividends on our common stock, and we do not anticipate paying any cash dividends in the foreseeable future. Consequently, we used an expected dividend yield of zero in the Black-Scholes option valuation model. Finally, we use historical data to estimate pre-vesting option forfeitures. Stock-based compensation is recorded for only those awards that are expected to vest. No stock options have been issued since the year ended December 31, 2005.
63
PREMIERE GLOBAL SERVICES, INC. AND SUBSIDIARIES
NOTES TO CONSOLIDATED FINANCIAL STATEMENTS
The following table summarizes the activity of stock options under our stock plans for the year ended December 31, 2009:
| Options | Weighted- average exercise price |
Weighted- average remaining contractual life (in years) |
Aggregate intrinsic value |
|||||||
|
|
|
|
|
|||||||
| Options outstanding at December 31, 2008 | 747,175 | $ | 8.22 | |||||||
| Granted | — | — | ||||||||
| Exercised | (181,420 | ) | 3.11 | |||||||
| Expired | (3,417 | ) | 5.08 | |||||||
|
|
|
|
||||||||
| Options outstanding at December 31, 2009 | 562,338 | 9.89 | 2.49 | $ | 12,284 | |||||
|
|
|
|
|
|
|
|||||
| Options exercisable at December 31, 2009 | 562,338 | $ | 9.89 | 2.49 | $ | 12,284 | ||||
|
|
|
|
|
|
|
|||||
The total intrinsic value of options exercised during the years ended December 31, 2009, 2008, and 2007 was $1.0 million, $2.0 million and $8.6 million, respectively. The total fair value of options vested during the years ended December 31, 2008 and 2007, was million, $0.5 million and $1.4 million, respectively. As of December 31, 2009, we had no remaining unvested stock options to be recorded as an expense in our statements of operations for future periods.
10. EARNINGS PER SHARE
Basic and Diluted Net Income Per Share
Basic earnings per share is computed by dividing net income available to common shareholders by the weighted-average number of common shares outstanding during the period. The weighted-average number of common shares outstanding does not include any potentially dilutive securities or any unvested restricted shares of common stock. These unvested restricted shares, although classified as issued and outstanding at December 31, 2009, 2008 and 2007 are considered contingently returnable until the restrictions lapse and will not be included in the basic earnings per share calculation until the shares are vested.
Diluted earnings per share gives the effect to all potentially dilutive securities on earnings per share. Our outstanding stock options and unvested restricted shares are potentially dilutive securities. The difference between basic and diluted weighted-average shares outstanding was the dilutive effect of stock options, unvested restricted shares, and warrants.
The following table represents a reconciliation of the basic and diluted earnings per share from continuing operations, or EPS, computations contained in our consolidated financial statements (in thousands, except per share data):
64
PREMIERE GLOBAL SERVICES, INC. AND SUBSIDIARIES
NOTES TO CONSOLIDATED FINANCIAL STATEMENTS
| Years Ended December 31,
|
||||||||||||||||||||||||
| 2009
|
2008
|
2007
|
||||||||||||||||||||||
| Net income |
Weighted- average shares |
Earnings per share |
Net income |
Weighted- average shares |
Earnings per share |
Net income |
Weighted- average shares |
Earnings per share |
||||||||||||||||
| Basic EPS | $ | 21,330 | 58,823 | $ | 0.36 | $ | 40,594 | 59,356 | $ | 0.68 | $ | 33,385 | 62,654 | $ | 0.53 | |||||||||
| Effect of dilutive | ||||||||||||||||||||||||
| securities: | ||||||||||||||||||||||||
| Stock options | — | 81 | — | — | 334 | — | — | 588 | — | |||||||||||||||
| Unvested restricted | ||||||||||||||||||||||||
|
shares
|
— | 404 | — | — | 787 | — | — | 698 | — | |||||||||||||||
| Warrants | — | 2 | — | — | — | — | — | — | — | |||||||||||||||
|
|
|
|
|
|
|
|
|
|
|
|
|
|
|
|
||||||||||
| Diluted EPS | $ | 21,330 | 59,310 | $ | 0.36 | $ | 40,594 | 60,477 | $ | 0.67 | $ | 33,385 | 63,940 | $ | 0.52 | |||||||||
The weighted-average diluted common shares outstanding for the year ended December 31, 2009, 2008, 2007 excludes the effect of 701,000, 116,000, and 6,000 restricted shares and out-of-the-money options because their effect would be anti-dilutive.
11. ACCRUED EXPENSES
Accrued expenses at December 31, 2009 and 2008 are as follows (in thousands):
| 2009 | 2008 | |||
|
|
| |||
| Accrued wages and wage related taxes | $ | 10,928 | $ | 12,861 |
| Accrued sales commissions | 4,823 | 3,430 | ||
| Employee benefits | 1,375 | 4,139 | ||
| Accrued professional fees | 2,588 | 2,737 | ||
| Fair value of derivative instruments | 2,777 | 2,600 | ||
| Other | 6,052 | 8,020 | ||
|
|
|
|
| |
| $ | 28,543 | $ | 33,787 | |
|
|
|
|
| |
Sales tax and excise tax
Historically, we have collected and remitted state sales tax from our non-PGiMeet solutions customers in applicable states, but we have not collected and remitted state sales tax from our PGiMeet solutions customers in all applicable jurisdictions. In addition, we have learned that certain of our PGiMeet solutions may be subject to telecommunications excise tax statutes in certain states. During the years ended December 31, 2009 and 2008, we paid $0.1 million and $2.8 million related to the settlement of certain of these state sales and excise tax contingencies.
We have reserves for certain state sales and excise tax contingencies based on the likelihood of obligation. At December 31, 2009 and 2008, we had reserved $4.4 and $4.6 million, respectively, for certain state sales and excise tax contingencies. These reserved amounts are included in “Accrued taxes, other than income taxes” in our consolidated balance sheets. We believe we have appropriately accrued for these contingencies. In the event that actual results differ from these reserves, we may need to make adjustments, which could materially impact our financial condition and results of operations. In addition, states may disagree with our method of assessing and remitting such taxes or additional states may subject us to inquiries regarding such taxes.
65
PREMIERE GLOBAL SERVICES, INC. AND SUBSIDIARIES
NOTES TO CONSOLIDATED FINANCIAL STATEMENTS
12. FAIR VALUE MEASUREMENTS AND FINANCIAL INSTRUMENTS
The fair value amounts for cash and equivalents, accounts receivable, net, and accounts payable and accrued expenses approximate carrying amounts due to the short maturities of these instruments. The estimated fair value of our long-term debt and capital lease obligations at December 31, 2009 and 2008 was based on expected future payments discounted using current interest rates offered to us on debt of the same remaining maturity and characteristics, including credit quality. See Note 8 to our consolidated financial statements. The fair value of our derivative instruments is calculated at the end of each period and carried on our consolidated balance sheets in the appropriate category, as further discussed below.
Fair value is defined as an exit price representing the amount that would be received to sell an asset or paid to transfer a liability at the measurement date in an orderly transaction between market participants. As such, fair value is a market-based measurement that should be determined based on assumptions that market participants would use in pricing an asset or liability. ASC 820, “Fair Value Measurements and Disclosures,” establishes a three-tier fair value hierarchy as a basis for such assumptions which prioritizes the inputs used in measuring fair value as follows:
-
Level 1 – Quoted prices in active markets for identical assets or liabilities;
-
Level 2 – Inputs other than quoted prices included within Level 1 that are observable for the asset or liability, either directly or indirectly; and
-
Level 3 – Unobservable inputs for the asset or liability in which there is little or no market data.
We value our interest rate swaps using a market approach based on interest rate yield curves observable in market transactions. The fair value of our interest rate swaps is based on models whose inputs are observable; therefore, the fair value of these financial instruments is based on Level 2 inputs.
We have segregated all financial assets and liabilities that are measured at fair value on a recurring basis into the most appropriate level within the fair value hierarchy based on the inputs used to determine the fair value at the measurement date in the table below (in thousands):
| December 31, 2009 | |||||||||
|
|
|
|
|
||||||
| Fair value
|
Level 1
|
Level 2
|
Level 3
|
||||||
|
Liabilities:
|
|||||||||
|
Interest rate swap
|
$2,777
|
$
|
—
|
$ |
2,777
|
$ |
—
|
||
|
|
|
|
|
|
|
||||
|
Total
|
$2,777 |
$
|
—
|
$ |
2,777
|
$ |
—
|
||
|
|
|
|
|
|
|
||||
|
December 31, 2008
|
|||||||||
|
|
|
|
|
||||||
| Fair value
|
Level 1
|
Level 2
|
Level 3
|
||||||
|
Liabilities:
|
|||||||||
|
Interest rate swaps
|
$8,563
|
$
|
—
|
$ | 8,563 | $ |
—
|
||
|
|
|
|
|
|
|
||||
|
Total
|
$8,563
|
$
|
—
|
$ | 8,563 | $ |
—
|
||
|
|
|
|
|
|
|
||||
We use derivative instruments to manage risks related to interest rates. During the years ended December 31, 2009 and 2008, our derivative instruments are limited to interest rate swaps. We designated our interest rate swaps as cash flow hedges using the long-haul method in October 2008, and subsequently our derivative instruments qualified for hedge accounting treatment. For further disclosure on our policy for accounting for derivatives and hedges, see Notes 8 and 2 to our consolidated financial statements.
In addition to assets and liabilities that are recorded at fair value on a recurring basis, we are required to record certain assets and liabilities at fair value on a nonrecurring basis. Generally, assets and liabilities recorded at fair value on a nonrecurring basis are the result of impairment charges.
66
PREMIERE GLOBAL SERVICES, INC. AND SUBSIDIARIES
NOTES TO CONSOLIDATED FINANCIAL STATEMENTS
We have segregated all assets and liabilities that are measured at fair value on a nonrecurring basis into the most appropriate level within the fair value hierarchy based on the inputs used to determine the fair value at the measurement date in the table below (in thousands):
|
December 31, 2009
|
||||||||||
| Fair value | Level 1 | Level 2 | Level 3 | Total losses |
||||||
|
|
|
|
|
|
||||||
| Assets: | ||||||||||
| Property and equipment | $ — | $ — |
$ —
|
$ — | $ 3,682 | |||||
|
|
|
|
|
|
||||||
| Total | $ — | $ — |
$ —
|
$ — | $ 3,682 | |||||
|
|
|
|
|
|
||||||
During the year ended December 31, 2009, we abandoned development efforts associated primarily with certain software projects and recorded an other-than-temporary impairment charge in North America. As a consequence, we wrote-off accumulated costs associated with these projects of $3.7 million previously included in “Property and equipment, net,” as asset impairments in our consolidated statements of operations. We determined the fair value of the assets based on Level 3 inputs of unobservable market data that indicate these software projects would never reach their intended use.
In connection with the decision to divest our PGiMarket business, we recorded an other-than-temporary impairment charge in North America of $7.0 million in September 2009 recognized in discontinued operations in our consolidated statements of operations to reduce the carrying value of the assets associated with this business to their estimated fair value of $1.0 million, originally classified as assets held for sale in “Prepaid expenses and other current assets” in our consolidated balance sheet as of September 30, 2009. Subsequently, we completed the sale of these assets and, as of December 31, 2009, no associated asset was included in our consolidated balance sheet. We determined the fair value of the assets based on Level 2 inputs of observable market data. See Note 5 to our consolidated financial statements for further information on this impairment.
Fair Value of Derivative Instruments
We are exposed to one-month LIBOR interest rate risk on our $375.0 million credit facility. In August 2007, we entered into two $100.0 million pay fixed, receive floating interest rate swaps to hedge the variability in our cash flows associated with changes in one-month LIBOR interest rates. One of these interest rate swaps expired in August 2009, and the other will expire in August 2010. As of December 31, 2009, our outstanding interest rate swap is designated as a cash flow hedge, and the fair value is recorded in current liabilities as summarized in the table below (in thousands):
| December 31, 2009 | ||||
|
|
||||
| Interest Rate Swaps |
||||
| Total | ||||
|
|
|
|||
|
Liabilities:
|
||||
|
Current liabilities
|
||||
|
Accrued expenses
|
$ 2,777 |
$ 2,777
|
||
|
|
|
|||
|
Total liabilities
|
$ 2,777 |
$ 2,777
|
||
|
|
|
|||
Cash-Flow Hedges
For a derivative instrument designated as a cash-flow hedge, the effective portion of the derivative’s gain (loss) is initially reported as a component of other comprehensive income and is subsequently recognized in earnings in the same period or periods during which the hedged exposure is recognized in earnings. Gains and losses on the derivative representing hedge ineffectiveness are recognized in current earnings. Monthly settlements with the counterparties are recognized in the same line item, “Interest expense,” as the interest costs associated with our credit facility. Accordingly, cash settlements are included in operating cash flows and were $7.5 million for the year ended December 31, 2009. During the year ended December 31, 2009, we recognized the following gains (losses) and interest expense related to interest rate swaps (in thousands):
67
PREMIERE GLOBAL SERVICES, INC. AND SUBSIDIARIES
NOTES TO CONSOLIDATED FINANCIAL STATEMENTS
| Year Ended December 31, 2009 |
||
|
|
||
| Interest Rate Swaps | ||
|
|
||
| Effective portion: | ||
| Gain recognized in other comprehensive income, net | ||
| of tax effect of $0.8 million | $ 1,574 | |
| Ineffective portion: | ||
| Unrealized gain on change in fair value of interest rate swaps | ||
| recognized in other income | $ 3,366 | |
| Interest expense related to monthly cash settlements: | ||
| Interest expense | $ (7,323) | |
13. EMPLOYEE BENEFIT PLANS
We sponsor a defined contribution plan covering substantially all of our U.S. employees. We also sponsor similar voluntary contribution arrangements for certain of our employees outside the United States that meet applicable eligibility requirements. We may make discretionary contributions for the benefit of employees under these plans. In 2009, 2008 and 2007, we paid cash of approximately $0.6 million, $2.0 million and $1.9 million, respectively, to fund our discretionary employer contributions under these plans.
14. RELATED-PARTY TRANSACTIONS
Notes receivable, shareholder
We have made loans in prior years to our chief executive officer and to a limited partnership in which he has an indirect interest, pursuant to extensions of credit agreed to by us prior to July 30, 2002. These loans were made pursuant to his then current employment agreement for the exercise price of certain stock options and the taxes related thereto. Each of these loans is evidenced by a recourse promissory note bearing interest at the applicable federal rate and secured by the common stock purchased. These loans mature in 2010. These loans, including accrued interest, are recorded in the equity section of our consolidated balance sheets under the caption “Notes receivable, shareholder.” The principal amount outstanding under all remaining loans owed to us by our chief executive officer is approximately $1.8 million as of December 31, 2009.
15. COMMITMENTS AND CONTINGENCIES
Operating Lease Commitments
We lease office space, computer and other equipment and automobiles under noncancelable lease agreements. The leases generally provide that we pay the taxes, insurance and maintenance expenses related to the leased assets. Future minimum lease payments for noncancelable operating leases as of December 31, 2009 are as follows (in thousands):
| 2010 | $14,641 | |
| 2011 | 13,266 | |
| 2012 | 11,423 | |
| 2013 | 10,483 | |
| 2014 | 10,383 | |
| Thereafter | 37,063 | |
|
| ||
| Net minimum lease payments | $97,259 | |
|
|
68
PREMIERE GLOBAL SERVICES, INC. AND SUBSIDIARIES
NOTES TO CONSOLIDATED FINANCIAL STATEMENTS
Included in our future minimum lease payments is an aggregate of $9.2 million for leases included in our restructuring efforts. Rent expense under operating leases was $16.1 million, $13.8 million and $9.3 million for the years ended December 31, 2009, 2008 and 2007, respectively. Facilities rent was reduced by sublease income of approximately $0.1 million for the year ended December 31, 2007, with no sublease income in 2009 or 2008. In 2009, 2008 and 2007, facilities rent was reduced by approximately $1.5 million, $0.8 million and $0.8 million, respectively, associated with contractual obligations provided for in the restructuring charge.
Asset Retirement Obligation
Our recorded asset retirement obligation liability represents the estimated costs to bring certain office buildings that we lease back to their original condition after the termination of the lease. In instances where our lease agreements either contain make-whole provision clauses or subject us to remediation costs, we establish an asset retirement obligation liability with a corresponding increase to leasehold improvements. These amounts are included in “Accrued expenses” under “Current Liabilities” and “Long-Term Liabilities” in our consolidated balance sheets. For the year ended December 31, 2009, asset retirement obligation liabilities increased by approximately $0.4 million for remediation costs, offset in part by $0.4 million of asset retirement obligations that were satisfied. The current and long-term portion of the asset retirement obligation liability balance was $0.9 million at each of December 31, 2009 and December 31, 2008.
Supply Agreements
We purchase telecommunications services pursuant to supply agreements with telecommunications service providers. Some of our agreements with telecommunications service providers contain commitments that require us to purchase a minimum amount of services through 2011. These commitments total approximately $32.9 million and $28.6 million in 2010 and 2011, respectively. Our total minimum purchase requirements were approximately $37.8 million, $18.7 million and $16.8 million in 2009, 2008 and 2007, respectively, of which we incurred costs in excess of these minimums.
State Income Tax Matter
In May 2009, one of our former subsidiaries, PTEKVentures.com, Inc., a Nevada corporation formally dissolved in 2002, received a notice of proposed income tax assessment from the Georgia Department of Revenue totaling approximately $22.7 million as of June 15, 2009. Because we are at a preliminary stage of the process for resolving this dispute with the Georgia Department of Revenue, we cannot, at this time, reasonably estimate the amount, if any, of taxes or other interest, penalties or additions to tax that would ultimately be assessed at the conclusion of the process, and therefore have not accrued any amounts related to this assessment. We are also not able to currently estimate when the administrative procedures and review within the Georgia Department of Revenue will be completed. We believe we have meritorious defenses and will continue to vigorously contest this matter. However, if the Georgia Department of Revenue’s initial position is sustained, the amount assessed would result in a material adjustment to our consolidated financial statements and would adversely impact our financial condition and results of operations.
Litigation and Claims
We are involved from time to time in legal proceedings that we do not believe will have a material adverse effect upon our business, financial condition or results of operations, although we can offer no assurance as to the ultimate outcome of any such proceedings.
69
NOTES TO CONSOLIDATED FINANCIAL STATEMENTS
16. INCOME TAXES
Income tax expense (benefit) from continuing operations for 2009, 2008 and 2007 is as follows (in thousands):
| 2009 | 2008 | 2007 | |||||||
|
|
|
|
|||||||
| Current: | |||||||||
| Federal | $ | 589 | $ | (6,168 | ) | $ | 8,320 | ||
| State | 386 | (207 | ) | 1,629 | |||||
| International | 11,612 | 11,378 | 6,860 | ||||||
|
|
|
|
|
|
|
||||
| Total current | $ | 12,587 | $ | 5,003 | $ | 16,809 | |||
| Deferred: | |||||||||
| Federal | $ | 4,083 | $ | 13,861 | $ | (285 | ) | ||
| State | 184 | 1,109 | 932 | ||||||
| International | (3,805 | ) | (2,530 | ) | (506 | ) | |||
|
|
|
|
|
|
|
|
|||
| Total deferred | $ | 462 | $ | 12,440 | $ | 141 | |||
| Income tax expense | $ | 13,049 | $ | 17,443 | $ | 16,950 | |||
|
|
|
|
|
|
|
||||
The difference between the statutory federal income tax rate and our effective income tax rate applied to income before income taxes from continuing operations for 2009, 2008 and 2007 is as follows (in thousands):
| 2009 | 2008 | 2007 | |||||||
|
|
|
|
|||||||
| Federal rate | $ | 12,033 | $ | 20,313 | $ | 17,617 | |||
| State taxes, net of federal benefit | 215 | (1,492 | ) | (341 | ) | ||||
| Foreign taxes | (2,716 | ) | (3,937 | ) | (1,651 | ) | |||
| Change in valuation allowance | 1,650 | 2,643 | 2,303 | ||||||
| Non-deductible employee compensation | 1,410 | 1,407 | 989 | ||||||
| Other, net | 465 | (2,323 | ) | (904 | ) | ||||
| Uncertain tax matters | (8 | ) | 832 | (1,063 | ) | ||||
|
|
|
|
|
|
|
||||
| Income taxes at our effective rate | $ | 13,049 | $ | 17,443 | $ | 16,950 | |||
|
|
|
|
|
|
|
||||
Significant judgment is required in evaluating our uncertain tax positions in federal, state and international tax jurisdictions where we file income tax returns. In major tax jurisdictions, tax years from 2000 to 2009 remain subject to income tax examinations by tax authorities. A reconciliation of unrecognized tax benefits at the beginning and end of the years presented is as follows (in thousands):
| Balance at January 1, 2008 | $ | 4,559 | |
| Increase based on tax positions related to 2008 | 707 | ||
| Re-measurement of prior liability | 189 | ||
| Other | (64 | ) | |
|
|
|
||
| Balance at December 31, 2008 | $ | 5,391 | |
| Increase based on tax positions related to 2009 | 213 | ||
| Re-measurement of prior liability | (73 | ) | |
| Expiration of the statute of limitation for the assessment of taxes | 78 | ||
| Decrease due to settlements of assessed liability | (30 | ) | |
| Other | 128 | ||
|
|
|
||
| Balance at December 31, 2009 | $ | 5,707 | |
|
|
|
Our unrecognized tax benefits of $5.7 million and $5.4 million at December 31, 2009 and 2008, respectively, if recognized, would affect our annual effective tax rate. The unrecognized tax benefits at December 31, 2009 are included in “Other assets,” “Income taxes payable” and “Accrued expenses” under “Long-Term Liabilities” in our consolidated balance sheets. We do not expect our unrecognized tax benefit to change significantly over the next 12 months.
70
PREMIERE GLOBAL SERVICES, INC. AND SUBSIDIARIES
NOTES TO CONSOLIDATED FINANCIAL STATEMENTS
We recognize interest and penalties related to uncertain tax positions in “Interest expense” and “Operating expenses,” respectively, in our consolidated statements of operations. During the years ended December 31, 2009, 2008 and 2007, we recognized interest and penalties (benefit) expense of ($0.1) million, $0.9 million and $0.2 million, respectively. As of December 31, 2009 and 2008, we had accrued interest and penalties of approximately $1.7 million and $1.8 million, respectively, related to uncertain tax positions. Including interest and penalties, our total accrual for uncertain tax positions was $6.4 million and $6.2 million at December 31, 2009 and 2008, respectively.
In the normal course of business, we are subject to inquiries from U.S. and non-U.S. tax authorities regarding the amount of taxes due. These inquiries may result in adjustments of the timing or amount of taxable income or deductions or the allocation of income among tax jurisdictions. Further, during the ordinary course of business, other changing facts and circumstances may impact our ability to utilize income tax benefits as well as the estimated taxes to be paid in future periods. We believe we are appropriately accrued for income taxes. In the event that actual results differ from these estimates, we may need to adjust “Income taxes payable” in our consolidated balance sheets, which could materially impact our financial condition and results of operations.
Differences between the financial accounting and tax basis of assets and liabilities giving rise to deferred tax assets and liabilities are as follows at December 31, 2009 and 2008 (in thousands):
| 2009 | 2008 | |||||
|
|
|
|||||
| Deferred tax assets: | ||||||
| Net operating loss carryforwards | $ | 16,758 | $ | 17,200 | ||
| Intangible assets | 7,031 | 6,492 | ||||
| Restructuring costs | 3,305 | 703 | ||||
| Accrued expenses | 5,199 | 6,332 | ||||
| Other tax credits | 8,894 | 2,558 | ||||
|
|
|
|
|
|||
| Gross deferred tax assets | 41,187 | 33,285 | ||||
| Valuation allowance | (17,157 | ) | (12,631 | ) | ||
|
|
|
|
|
|||
| Total deferred tax assets | $ | 24,030 | $ | 20,654 | ||
| Deferred tax liabilities: | ||||||
| Property and equipment | $ | (21,061 | ) | $ | (15,597 | ) |
| Intangible assets | (1,599 | ) | (7,964 | ) | ||
| Other liabilities | (278 | ) | (212 | ) | ||
|
|
|
|
|
|||
| Total deferred tax liabilities | $ | (22,938 | ) | $ | (23,773 | ) |
| Deferred income taxes, net | $ | 1,092 | $ | (3,119 | ) | |
|
|
|
|
|
|||
We are required to estimate our taxes in each jurisdiction in which we operate. This process involves management estimating its tax exposure together with assessing temporary differences resulting from differing treatment of items for tax and accounting purposes. The ultimate recognition of uncertain tax matters is realized in the period of resolution.
At December 31, 2009, we had federal income tax net operating loss carryforwards of approximately $8.2 million expiring in 2009 through 2019. The utilization of some of our net operating losses is subject to Section 382 limitations due to a prior change in control related to one of our previous acquisitions. Excess tax benefits of approximately $1.6 million, $0.7 million, and $3.3 million in 2009, 2008 and 2007, respectively, are associated with non-qualified stock option exercises and restricted stock award releases, the impact of which was recorded directly to additional paid-in capital.
The undistributed earnings of our foreign subsidiaries that are not considered permanently reinvested and have not been remitted to the United States totaled $103.5 million and $78.2 million as of December 31, 2009 and 2008. These earnings are not subject to U.S. income tax until they are distributed to the United States. Historically, we have provided for deferred U.S. federal income taxes in our consolidated statements of operations only on the
71
PREMIERE GLOBAL SERVICES, INC. AND SUBSIDIARIES
NOTES TO CONSOLIDATED FINANCIAL STATEMENTS
undistributed earnings that were determined not to be indefinitely reinvested. The foreign subsidiaries not considered permanently reinvested are Australia, Japan and New Zealand. We made the determination of permanent reinvestment on the basis of sufficient evidence that demonstrates that we will invest the undistributed earnings overseas indefinitely for use in working capital as well as foreign acquisitions and expansion.
The valuation allowance at December 31, 2009 primarily relates to certain foreign and state loss carryforwards that, in the opinion of management, are more likely than not to expire unutilized. During the year ended December 31, 2009, our valuation allowance increased by approximately $4.5 million, primarily a result of a $5.6 million increase in the valuation reserves placed on the capital loss realized on the sale of our PGiMarket business.
72
PREMIERE GLOBAL SERVICES, INC. AND SUBSIDIARIES
NOTES TO CONSOLIDATED FINANCIAL STATEMENTS
17. SEGMENT REPORTING
We manage our operations on a geographic regional basis, with reportable segments in North America, Europe and Asia Pacific. The accounting policies as described in the summary of significant accounting policies are applied consistently across our segments. Our North America segment is comprised of operations in the United States and Canada. Beginning with our quarterly report on Form 10-Q for the three months ended March 31, 2009, we present “Operating income” for each of our reportable segments as a measure of segment profit, which differs from the presentation in our annual report on Form 10-K for the year ended December 31, 2008, where we reported “Net income” as a measure of segment profit. Beginning in 2009, our chief operating decision makers use operating income internally, as a means of analyzing segment performance, and believe that it more clearly represents our segment profit, without the impact of income taxes and other non-operating items. The sum of these regional results may not agree to the consolidated results due to rounding. Information concerning our operations in our reportable segments is as follows (in thousands):
| Reportable Segments | ||||||||||||
|
|
||||||||||||
| North America |
Europe | Asia Pacific |
Consolidated | |||||||||
|
|
|
|
|
|||||||||
| Year ended December 31, 2009: | ||||||||||||
| Statement of operations: | ||||||||||||
| Net revenues | $ | 373.3 | $ | 116.0 | $ | 112.2 | $ | 601.5 | ||||
| Depreciation | 30.6 | 3.9 | 2.7 | 37.2 | ||||||||
| Amortization | 8.7 | 1.7 | 0.2 | 10.6 | ||||||||
| Asset impairments | 3.7 | — | — | 3.7 | ||||||||
| Interest expense | 13.4 | — | 0.1 | 13.5 | ||||||||
| Interest income | 0.1 | 0.1 | 0.2 | 0.4 | ||||||||
| Income tax expense | 7.3 | 2.1 | 3.6 | 13.0 | ||||||||
| Operating income | 0.6 | 21.7 | 22.0 | 44.3 | ||||||||
| Balance Sheet: | ||||||||||||
| Goodwill | 305.3 | 44.6 | 4.7 | 354.6 | ||||||||
| Intangibles, net of amortization | 19.5 | 4.8 | 0.5 | 24.8 | ||||||||
| Property and equipment, net | 118.2 | 12.1 | 6.9 | 137.2 | ||||||||
| Total assets | 517.9 | 102.9 | 57.5 | 678.2 | ||||||||
| Expenditures for long-lived assets: | ||||||||||||
| Capital expenditures | 34.9 | 1.9 | 2.1 | 38.9 | ||||||||
| Business acquisitions, net of cash acquired | $ | 7.3 | $ | 0.2 | $ | — | $ | 7.5 | ||||
| Year ended December 31, 2008: | ||||||||||||
| Statement of operations: | ||||||||||||
| Net revenues | $ | 382.0 | $ | 122.1 | $ | 116.3 | $ | 620.4 | ||||
| Depreciation | 25.6 | 3.6 | 2.5 | 31.7 | ||||||||
| Amortization | 11.2 | 3.5 | 0.4 | 15.1 | ||||||||
| Asset impairments | 2.5 | 0.8 | 0.1 | 3.4 | ||||||||
| Interest expense | 19.2 | 0.2 | — | 19.4 | ||||||||
| Interest income | 0.5 | 0.3 | 0.1 | 0.9 | ||||||||
| Income tax expense | 11.1 | 1.8 | 4.5 | 17.4 | ||||||||
| Operating income | 28.8 | 22.5 | 24.9 | 76.1 | ||||||||
| Balance Sheet: | ||||||||||||
| Goodwill | 299.6 | 40.6 | 3.8 | 344.0 | ||||||||
| Intangibles, net of amortization | 25.8 | 5.7 | 0.6 | 32.1 | ||||||||
| Property and equipment, net | 112.2 | 10.9 | 6.0 | 129.1 | ||||||||
| Total assets | 516.1 | 94.0 | 50.9 | 661.0 | ||||||||
| Expenditures for long-lived assets: | ||||||||||||
| Capital expenditures | 40.0 | 2.3 | 2.7 | 45.0 | ||||||||
| Business acquisitions, net of cash acquired | $ | 28.0 | $ | 2.4 | $ | — | $ | 30.4 | ||||
73
PREMIERE GLOBAL SERVICES, INC. AND SUBSIDIARIES
NOTES TO CONSOLIDATED FINANCIAL STATEMENTS
| Reportable Segments (continued) | ||||||||||||
|
|
||||||||||||
| North America |
Europe | Asia Pacific |
Consolidated | |||||||||
|
|
|
|
|
|||||||||
| Year ended December 31, 2007: | ||||||||||||
| Statement of operations: | ||||||||||||
| Net revenues | $ | 352.6 | $ | 103.0 | $ | 99.3 | $ | 554.9 | ||||
| Depreciation | 23.5 | 3.4 | 2.8 | 29.7 | ||||||||
| Amortization | 12.9 | 1.7 | 0.4 | 15.1 | ||||||||
| Interest expense | 13.6 | — | — | 13.6 | ||||||||
| Interest income | 0.4 | 0.4 | — | 0.8 | ||||||||
| Income tax expense | 12.1 | 2.5 | 2.4 | 17.0 | ||||||||
| Operating income | 34.3 | 14.4 | 17.5 | 66.2 | ||||||||
| Balance Sheet: | ||||||||||||
| Goodwill | 286.1 | 46.5 | 4.6 | 337.2 | ||||||||
| Intangibles, net of amortization | 30.4 | 11.6 | 1.1 | 43.1 | ||||||||
| Property and equipment, net | 92.0 | 13.3 | 5.5 | 110.8 | ||||||||
| Total assets | 472.1 | 109.9 | 43.7 | 625.7 | ||||||||
| Expenditures for long-lived assets: | ||||||||||||
| Capital expenditures | 36.0 | 4.2 | 3.2 | 43.4 | ||||||||
| Business acquisitions, net of cash acquired | $ | 21.2 | $ | 26.5 | $ | — | $ | 47.7 | ||||
74
SELECTED QUARTERLY FINANCIAL DATA (Unaudited)
The following table presents certain unaudited quarterly consolidated statement of operations data from continuing operations for each of the eight quarters in the periods ended December 31, 2009 and 2008. The information has been derived from our unaudited financial statements, which have been prepared on substantially the same basis as the audited consolidated financial statements contained in this annual report. We have presented quarterly earnings per share numbers as reported in our earnings releases. The sum of these quarterly results may differ from annual results due to rounding and the impact of the difference in the weighted shares outstanding for the stand-alone periods. The results of operations for any quarter are not necessarily indicative of the results to be expected for any future period.
| First Quarter |
Second Quarter |
Third Quarter |
Fourth Quarter |
Total
|
|||||||||||
| (in thousands, except per share data) | |||||||||||||||
| Year Ended December 31, 2009 | |||||||||||||||
| Net revenues | $ | 155,082 | $ | 153,933 | $ | 148,002 | $ | 144,506 | $ | 601,522 | |||||
| Cost of Revenue | 65,370 | 65,628 | 64,471 | 61,726 | 257,194 | ||||||||||
|
|
|
|
|
|
|
|
|
|
|
||||||
| Gross profit | 89,712 | 88,305 | 83,531 | 82,780 | 344,328 | ||||||||||
|
|
|
|
|
|
|
|
|
|
|
||||||
| Operating income | 19,750 | 15,219 | (1,223 | ) | 10,577 | 44,323 | |||||||||
| Income (loss) from continuing operations | 11,315 | 8,456 | (4,556 | ) | 6,113 | 21,330 | |||||||||
| Income (loss) on discontinued operations | (1,091 | ) | (672 | ) | (8,060 | ) | 2,103 | (7,721 | ) | ||||||
|
|
|
|
|
|
|
|
|
|
|
||||||
| Net income | 10,224 | 7,784 | (12,616 | ) | 8,216 | 13,609 | |||||||||
|
|
|
|
|
|
|
|
|
|
|
||||||
| Basic net income (loss) per share: | |||||||||||||||
| Continuing operations | $ | 0.19 | $ | 0.14 | $ | (0.08 | ) | $ | 0.10 | $ | 0.36 | ||||
| Discontinued operations | (0.02 | ) | (0.01 | ) | (0.14 | ) | 0.04 | (0.13 | ) | ||||||
|
|
|
|
|
|
|
|
|
|
|
||||||
| Net income per share | $ | 0.17 | $ | 0.13 | $ | (0.21 | ) | $ | 0.14 | $ | 0.23 | ||||
|
|
|
|
|
|
|
|
|
|
|
||||||
| Diluted net income (loss) per share: | |||||||||||||||
| Continuing operations | $ | 0.19 | $ | 0.14 | $ | (0.08 | ) | $ | 0.10 | $ | 0.36 | ||||
| Discontinued operations | (0.02 | ) | (0.01 | ) | (0.14 | ) | 0.04 | (0.13 | ) | ||||||
|
|
|
|
|
|
|
|
|
|
|
||||||
| Net income per share | $ | 0.17 | $ | 0.13 | $ | (0.21 | ) | $ | 0.14 | $ | 0.23 | ||||
|
|
|
|
|
|
|
|
|
|
|
||||||
| First Quarter |
Second Quarter |
Third Quarter |
Fourth Quarter |
Total
|
|||||||||||
| (in thousands, except per share data) | |||||||||||||||
| Year Ended December 31, 2008 | |||||||||||||||
| Net revenues | $ | 151,889 | $ | 160,465 | $ | 156,532 | $ | 151,513 | $ | 620,400 | |||||
| Cost of Revenue | 60,886 | 65,328 | 64,185 | 62,739 | 253,140 | ||||||||||
|
|
|
|
|
|
|
|
|
|
|
||||||
| Gross profit | 91,003 | 95,137 | 92,347 | 88,774 | 367,260 | ||||||||||
|
|
|
|
|
|
|
|
|
|
|
||||||
| Operating income | 20,741 | 15,368 | 21,719 | 18,311 | 76,138 | ||||||||||
| Income (loss) from continuing operations | 9,780 | 9,463 | 11,859 | 9,492 | 40,594 | ||||||||||
| Income (loss) on discontinued operations | (745 | ) | (925 | ) | (1,101 | ) | (1,720 | ) | (4,491 | ) | |||||
|
|
|
|
|
|
|
|
|
|
|
||||||
| Net income | 9,035 | 8,538 | 10,758 | 7,772 | 36,103 | ||||||||||
|
|
|
|
|
|
|
|
|
|
|
||||||
| Basic net income (loss) per share: | |||||||||||||||
| Continuing operations | $ | 0.16 | $ | 0.16 | $ | 0.20 | $ | 0.16 | $ | 0.68 | |||||
| Discontinued operations | (0.01 | ) | (0.02 | ) | (0.02 | ) | (0.03 | ) | (0.08 | ) | |||||
|
|
|
|
|
|
|
|
|
|
|
||||||
| Net income per share | $ | 0.15 | $ | 0.14 | $ | 0.18 | $ | 0.13 | $ | 0.61 | |||||
|
|
|
|
|
|
|
|
|
|
|
||||||
| Diluted net income (loss) per share: | |||||||||||||||
| Continuing operations | $ | 0.16 | $ | 0.16 | $ | 0.20 | $ | 0.16 | $ | 0.67 | |||||
| Discontinued operations | (0.01 | ) | (0.02 | ) | (0.02 | ) | (0.03 | ) | (0.07 | ) | |||||
|
|
|
|
|
|
|
|
|
|
|
||||||
| Net income per share | $ | 0.15 | $ | 0.14 | $ | 0.18 | $ | 0.13 | $ | 0.60 | |||||
|
|
|
|
|
|
|
|
|
|
|
||||||
75
The results of operations in all the quarters in 2009 and 2008 include charges associated with some or all of the following: equity-based compensation, amortization, unrealized gain (loss) on change in fair values of interest rate swaps, restructuring costs, asset impairments, net legal settlements and related expenses, excise tax expense and interest in 2008, and acquisition-related costs.
Item 9. Changes in and Disagreements with Accountants on Accounting and Financial Disclosure
Not applicable.
Item 9A. Controls and Procedures
Disclosure Controls and Procedures
Our management has evaluated, under the supervision and with the participation of our principal executive officer and principal financial officer, the effectiveness of our disclosure controls and procedures as of December 31, 2009. Based on this evaluation, our principal executive officer and principal financial officer concluded that, as of December 31, 2009, our disclosure controls and procedures (as defined in Rules 13a-15(e) and 15d-15(e) under the Exchange Act), were effective and designed to ensure that (a) information required to be disclosed in our reports filed under the Exchange Act is recorded, processed, summarized, and reported within the time periods specified in the SEC's rules and instructions, and (b) information is accumulated and communicated to our management, including our principal executive officer and principal financial officer, as appropriate to allow timely decisions regarding required disclosures.
Management’s Report on Internal Control Over Financial Reporting
Our management is responsible for establishing and maintaining adequate internal control over financial reporting, as such term is defined in Exchange Act Rules 13a-15(f)/15d-15(f). Under the supervision and with the participation of our management, including our principal executive officer and principal financial officer, we conducted an evaluation of the effectiveness of our internal control over financial reporting based on the framework in Internal Control – Integrated Framework issued by the Committee of Sponsoring Organizations of the Treadway Commission. Based on our evaluation under the framework in Internal Control – Integrated Framework, our management concluded that our internal control over financial reporting was effective as of December 31, 2009. The effectiveness of our internal control over financial reporting as of December 31, 2009 has been audited by Ernst & Young LLP, an independent registered public accounting firm, as stated in their report included on page 77 of this annual report.
Changes in Internal Control Over Financial Reporting
There were no changes in our internal control over financial reporting during the quarter ended December 31, 2009 that have materially affected, or are reasonably likely to materially affect, our internal control over financial reporting.
76
Report of Independent Registered Public Accounting Firm on Internal Control over Financial Reporting
The Board of Directors and Shareholders of Premiere Global Services, Inc.
We have audited Premiere Global Services, Inc. and subsidiaries’ internal control over financial reporting as of December 31, 2009, based on criteria established in Internal Control—Integrated Framework issued by the Committee of Sponsoring Organizations of the Treadway Commission (the COSO criteria). Premiere Global Services, Inc. and subsidiaries’ management is responsible for maintaining effective internal control over financial reporting, and for its assessment of the effectiveness of internal control over financial reporting included in Management’s Report on Internal Control Over Financial Reporting appearing under Item 9A. Our responsibility is to express an opinion on the company’s internal control over financial reporting based on our audit.
We conducted our audit in accordance with the standards of the Public Company Accounting Oversight Board (United States). Those standards require that we plan and perform the audit to obtain reasonable assurance about whether effective internal control over financial reporting was maintained in all material respects. Our audit included obtaining an understanding of internal control over financial reporting, assessing the risk that a material weakness exists, testing and evaluating the design and operating effectiveness of internal control based on the assessed risk, and performing such other procedures as we considered necessary in the circumstances. We believe that our audit provides a reasonable basis for our opinion.
A company’s internal control over financial reporting is a process designed to provide reasonable assurance regarding the reliability of financial reporting and the preparation of financial statements for external purposes in accordance with generally accepted accounting principles. A company’s internal control over financial reporting includes those policies and procedures that (1) pertain to the maintenance of records that, in reasonable detail, accurately and fairly reflect the transactions and dispositions of the assets of the company; (2) provide reasonable assurance that transactions are recorded as necessary to permit preparation of financial statements in accordance with generally accepted accounting principles, and that receipts and expenditures of the company are being made only in accordance with authorizations of management and directors of the company; and (3) provide reasonable assurance regarding prevention or timely detection of unauthorized acquisition, use or disposition of the company’s assets that could have a material effect on the financial statements.
Because of its inherent limitations, internal control over financial reporting may not prevent or detect misstatements. Also, projections of any evaluation of effectiveness to future periods are subject to the risk that controls may become inadequate because of changes in conditions, or that the degree of compliance with the policies or procedures may deteriorate.
In our opinion, Premiere Global Services, Inc. and subsidiaries maintained, in all material respects, effective internal control over financial reporting as of December 31, 2009, based on the COSO criteria.
We also have audited, in accordance with the standards of the Public Company Accounting Oversight Board (United States), the consolidated balance sheet of Premiere Global Services, Inc. and subsidiaries as of December 31, 2009, and the related consolidated statements of operations, shareholders’ equity, and cash flows for the year ended December 31, 2009 and our report dated February 26, 2010 expressed an unqualified opinion thereon.
/s/ Ernst & Young LLP
Atlanta, Georgia
February 26, 2010
77
Item 9.B. Other Information
None.
PART III
Certain information required by Part III is omitted from this report and is incorporated by reference to our definitive proxy statement pursuant to Regulation 14A for our 2010 annual meeting of shareholders, which we will file not later than 120 days after the end of the fiscal year covered by this annual report.
Item 10. Directors, Executive Officers and Corporate Governance
The information required by this item is incorporated herein by reference to our proxy statement under the headings “Proposal 1: Election of Directors – Information Regarding Nominees and Continuing Directors and Executive Officers,” “Corporate Governance Matters – Audit Committee” and “Section 16(a) Beneficial Ownership Reporting Compliance.”
Our board of directors adopted our Code of Conduct and Ethics that applies to all employees, directors and officers, including our principal executive officer, principal financial officer, principal accounting officer or controller, or persons performing similar functions. This code is posted on our website at www.pgi.com (follow the “Investor Relations” tab to “Corporate Governance”). We will satisfy any disclosure requirements under Item 5.05 of Form 8-K regarding an amendment to, or a waiver from, any provision of this code with respect to our principal executive officer, our principal financial officer, principal accounting officer, or controller or persons performing similar functions by disclosing the nature of such amendment or waiver on our website.
Item 11. Executive Compensation
The information required by this item is incorporated herein by reference to our proxy statement under the headings “Corporate Governance Matters – Compensation Committee,” “—Compensation Committee Interlocks and Insider Participation,” “—Director Compensation,” “—Director Compensation for the 2000 Fiscal Year,” “Compensation Committee Report,” which shall not be deemed filed in this annual report, “Compensation Discussion and Analysis” and “Executive Compensation.”
Item 12. Security Ownership of Certain Beneficial Owners and Management and Related Stockholder Matters
The information required by this item is incorporated herein by reference to our proxy statement under the headings “Security Ownership of Certain Beneficial Owners and Management” and “Equity Compensation Plan Information.”
Item 13. Certain Relationships and Related Transactions and Director Independence
The information required by this item is incorporated herein by reference to our proxy statement under the headings “Corporate Governance Matters – Independent Directors,” “—Audit Committee,” “—Compensation Committee,” “—Nominating and Governance Committee” and “Certain Transactions.”
Item 14. Principal Accountant Fees and Services
The information required by this item is incorporated herein by reference to our proxy statement under the heading “Audit Matters.”
78
PART IV
Item 15. Exhibits and Financial Statement Schedules
(a) 1. Financial Statements
The financial statements listed in the index set forth in Item 8. “Financial Statements and Supplementary Data” of this report are filed as part of this annual report.
2. Financial Statement Schedules
Financial statement schedules of valuation and qualifying accounts are not applicable or the required information is included in our consolidated financial statements or notes thereto.
3. Exhibits
The exhibits filed with this report are listed on the “Exhibit Index” following the signature page of this annual report, which are incorporated herein by reference.
79
Pursuant to the requirements of Section 13 or 15(d) of the Securities Exchange Act of 1934, the registrant has duly caused this report to be signed on its behalf by the undersigned, thereunto duly authorized.
Premiere Global Services, Inc.
| By: | /s/ Boland T. Jones | |
|
|
||
| Boland T. Jones, Chairman of the Board | ||
| and Chief Executive Officer | ||
| Date: February 26, 2010 |
POWER OF ATTORNEY
KNOW BY ALL PERSONS BY THESE PRESENTS, that each person whose signature appears below constitutes and appoints jointly and severally, Boland T. Jones and Scott Askins Leonard, and each one of them, his or her attorneys-in-fact, each with the power of substitution, for him or her in any and all capacities, to sign any and all amendments to this Annual Report on Form 10-K and to file the same, with exhibits thereto and other documents in connection therewith, with the Securities and Exchange Commission, hereby ratifying and confirming all that each said attorneys-in-fact, or his substitute or substitutes, may do or cause to be done by virtue hereof.
Pursuant to the requirements of Section 13 or 15(d) of the Securities Exchange Act of 1934, this annual report has been signed below by the following persons on behalf of the registrant in the capacities and on the dates indicated.
| Signature | Title | Date | ||
|
|
|
|
||
| /s/ Boland T. Jones | Chairman of the Board and Chief | February 26, 2010 | ||
|
|
Executive Officer (principal | |||
| Boland T. Jones | executive officer) and Director | |||
| /s/ David E. Trine | Chief Financial Officer | February 26, 2010 | ||
|
|
(principal financial and | |||
| David E. Trine | accounting officer) | |||
| /s/ Jeffrey T. Arnold | Director | February 26, 2010 | ||
|
|
||||
| Jeffrey T. Arnold | ||||
| /s/ Wilkie S. Colyer | Director | February 26, 2010 | ||
|
|
||||
| Wilkie S. Colyer | ||||
| /s/ John R. Harris | Director | February 26, 2010 | ||
|
|
||||
| John R. Harris | ||||
| /s/ W. Steven Jones | Director | February 26, 2010 | ||
|
|
||||
| W. Steven Jones | ||||
| /s/ Raymond H. Pirtle, Jr. | Director | February 26, 2010 | ||
|
|
||||
| Raymond H. Pirtle, Jr. | ||||
| /s/ J. Walker Smith, Jr. | Director | February 26, 2010 | ||
|
|
||||
| J. Walker Smith, Jr. | ||||
80
EXHIBIT INDEX
| Exhibit Number |
Description |
|
2.1 |
Agreement and Plan of Merger, together with exhibits, dated November 13, 1997, by and among the Registrant, Nets Acquisition Corp. and Xpedite Systems, Inc. (incorporated by reference to Exhibit 99.2 to the Registrant's Current Report on Form 8-K dated November 13, 1997 and filed December 5, 1997, as amended by Form 8-K/A and filed on December 23, 1997). |
|
2.2 |
Agreement and Plan of Merger, dated April 22, 1998, by and among the Registrant, American Teleconferencing Services, Ltd. ("ATS"), PTEK Missouri Acquisition Corp. and the shareholders of ATS (incorporated by reference to Exhibit 99.1 of the Company's Current Report on Form 8-K dated April 23, 1998 and filed on April 28, 1998). |
|
3.1 |
Amended and Restated Articles of Incorporation of the Registrant dated March 15, 2006 (incorporated by reference to Exhibit 3.1 to the Registrant’s Annual Report on Form 10-K for the year ended December 31, 2005 and filed on March 16, 2006). |
|
3.2 |
Second Amended and Restated Bylaws of the Registrant (incorporated by reference to Exhibit 3.2 to the Registrant’s Annual Report on Form 10-K for the year ended December 31, 2005 and filed on March 16, 2006). |
|
3.3 |
Amendment No. 1 to Second Amended and Restated Bylaws of the Registrant (incorporated by reference to Exhibit 3.1 to the Registrant’s Current Report on Form 8-K dated April 18, 2007 and filed on April 19, 2007). |
|
3.4 |
Amendment No. 2 to Second Amended and Restated Bylaws of the Registrant (incorporated by reference to Exhibit 3.2 to the Registrant’s Current Report on Form 8-K dated and filed on June 27, 2007). |
|
4.1 |
See Exhibits 3.1-3.4. for provisions of the Articles of Incorporation and Bylaws defining the rights of the holders of common stock of the Registrant. |
|
4.2 |
Specimen Stock Certificate (incorporated by reference to Exhibit 4.2 to the Registrant’s Annual Report on Form 10-K for the year ended December 31, 2005 and filed on March 16, 2006). |
|
10.1 |
Amended and Restated 1998 Stock Plan of the Registrant (incorporated by reference to Exhibit 10.1 to the Registrant's Quarterly Report on Form 10-Q for the quarter ended June 30, 1999 and filed on August 16, 1999). + |
|
10.2 |
Amendment No. 1 to the Amended and Restated 1998 Stock Plan of the Registrant (incorporated by reference to Exhibit 10.45 to the Registrant’s Annual Report on Form 10-K for the year ended December 31, 1999 and filed on March 30, 2000). + |
|
10.3 |
1995 Stock Plan of the Registrant (incorporated by reference to Appendix C to the Registrant’s Definitive Proxy Statement distributed in connection with the Registrant’s June 5, 2002 Annual Meeting of Shareholders, filed on April 30, 2002). + |
|
10.4 |
Intellivoice Communications, Inc. 1995 Incentive Stock Plan (assumed by the Registrant) (incorporated by reference to Exhibit 10.52 to the Registrant’s Annual Report on Form 10-K for the year ended December 31, 1999 and filed on March 30, 2000). |
|
10.5 |
Standard Office Lease, dated May 23, 1996, by and between 2221 Bijou, LLC and American Teleconferencing Services, Ltd., as amended by First Amendment to Standard Office Lease dated May 4, 1999, as amended by Second Amendment to Standard Office Lease dated May 1998, as amended by Third Amendment to Standard Office Lease dated September 1999 (incorporated by reference to Exhibit 10.53 to the Registrant’s Annual Report on Form 10-K for the year ended December 31, 2002 and filed on March 31, 2003). |
| Exhibit Number |
Description |
|
10.6 |
Lease Agreement from Townsend XPD, LLC to Xpedite Systems, Inc., dated June 15, 2000, (incorporated by reference to Exhibit 10.68 to the Registrant’s Annual Report on Form 10-K for the year ended December 31, 2002 and filed on March 31, 2003). |
|
10.7 |
Agreement for Assignment of Stock Options, dated February 5, 1999, by and among Boland T. Jones, Seven Gables Management Company, LLC, Seven Gables Partnership, L.P. and the Registrant (incorporated by reference to Exhibit 10.74 to Amendment No. 1 to the Registrant’s Annual Report on Form 10-K/A for the year ended December 31, 2002 and filed on December 23, 2003). + |
|
10.8 |
Promissory Note, dated October 31, 2000, payable to the Registrant by Boland T. Jones (incorporated by reference to Exhibit 10.75 to Amendment No. 1 to the Registrant’s Annual Report on Form 10-K/A for the year ended December 31, 2002 and filed on December 23, 2003). + |
|
10.9 |
Stock Pledge Agreement, dated October 31, 2000, by and between Seven Gables Partnership, L.P. and the Registrant (incorporated by reference to Exhibit 10.76 to Amendment No. 1 to the Registrant’s Annual Report on Form 10-K/A for the year ended December 31, 2002 and filed on December 23, 2003). + |
|
10.10 |
Promissory Note, dated April 17, 2001, payable to the Registrant by Boland T. Jones (incorporated by reference to Exhibit 10.81 to Amendment No. 1 to the Registrant’s Annual Report on Form 10-K/A for the year ended December 31, 2002 and filed on December 23, 2003). + |
|
10.11 |
Form of Director Indemnification Agreement between the Registrant and Non-employee Directors (incorporated by reference to Exhibit 10.67 to the Registrant’s Annual Report on Form 10-K for the year ended December 31, 2003 and filed on March 14, 2004). + |
|
10.12 |
Form of Officer Indemnification Agreement between the Registrant and each of the executive officers (incorporated by reference to Exhibit 10.68 to the Registrant’s Annual Report on Form 10-K for the year ended December 31, 2003 and filed on March 14, 2004). + |
|
10.13 |
Credit Agreement, dated June 30, 2004, among the Registrant, as Borrower, Certain Subsidiaries and Affiliates of the Borrower, as Guarantors, the Lenders Party thereto, Bank of America, N.A., as Administrative Agent and Collateral Agent, and LaSalle Bank National Association, as Syndication Agent and Co-Lead Arranger (incorporated by reference to Exhibit 10.1 to the Registrant’s Quarterly Report on Form 10-Q for the quarter ended June 30, 2004 and filed on August 9, 2004). |
|
10.14 |
Security Agreement, dated June 30, 2004, among the Registrant, American Teleconferencing Services, Ltd., Premiere Conferencing Network Services, Inc., PTEK Services, Inc., Xpedite Network Services, Inc., Xpedite Systems, Inc., Xpedite Systems Worldwide, Inc. and Bank of America, N.A., as Collateral Agent (incorporated by reference to Exhibit 10.2 to the Registrant’s Quarterly Report on Form 10-Q for the quarter ended June 30, 2004 and filed on August 9, 2004). |
|
10.15 |
Pledge Agreement, dated June 30, 2004, among the Registrant, American Teleconferencing Services, Ltd., Premiere Conferencing Networks, Inc., PTEK Services, Inc., Xpedite Network Services, Inc., Xpedite Systems, Inc., Xpedite Systems Worldwide, Inc. and Bank of America, N.A., as Collateral Agent (incorporated by reference to Exhibit 10.3 to the Registrant’s Quarterly Report on Form 10-Q for the quarter ended June 30, 2004 and filed on August 9, 2004). |
|
10.16 |
Amendment No. 1 to Credit Agreement, dated February 2, 2005, by and among the Registrant, as Borrower, Bank of America, N.A., as Administrative Agent, and the Guarantors and the Lenders that are parties thereto (incorporated by reference Exhibit 10.1 to the Registrant’s Current Report on Form 8-K dated February 2, 2004 and filed on February 3, 2004). |
| Exhibit Number |
Description |
|
10.17 |
Fourth Amendment to Standard Office Lease, effective March 1, 2005, by and between 2221 Bijou, LLC and American Teleconferencing Services, Ltd. to the Standard Office Lease dated May 23, 1996, as amended (incorporated by reference to Exhibit 10.57 of the Registrant’s Annual Report on Form 10-K for the year ended December 31, 2004 and filed on March 15, 2005). |
|
10.18 |
Fourth Amended and Restated Executive Employment Agreement between Boland T. Jones and the Registrant, effective January 1, 2005 (incorporated by reference to Exhibit 10.1 to the Registrant’s Current Report on Form 8-K dated and filed on April 20, 2005). + |
|
10.19 |
Restricted Stock Agreement between Boland T. Jones and the Registrant, effective April 18, 2005, under the Registrant’s 2004 Long-Term Incentive Plan (incorporated by reference to Exhibit 10.4 to the Registrant’s Current Report on Form 8-K dated and filed on April 20, 2005). + |
|
10.20 |
Restricted Stock Agreement between Boland T. Jones and the Registrant, effective April 18, 2005, under the Registrant’s 1995 Stock Plan (incorporated by reference to Exhibit 10.5 to the Registrant’s Current Report on Form 8-K dated and filed on April 20, 2005). + |
|
10.21 |
Form of NonStatutory Stock Option Agreement under the Registrant’s 2004 Long-Term Incentive Plan (incorporated by reference to Exhibit 10.4 to the Registrant’s Quarterly Report on Form 10-Q for the quarter ended March 31, 2005 and filed on May 6, 2005. + |
|
10.22 |
Form of NonStatutory Stock Option Agreement under the Registrant’s 1995 Stock Plan (incorporated by reference to Exhibit 10.6 to the Registrant’s Quarterly Report on Form 10-Q for the quarter ended March 31, 2005 and filed on May 6, 2005). |
|
10.23 |
Form of Restricted Stock Award Agreement under the Registrant’s 1995 Stock Plan (incorporated by reference to Exhibit 10.7 to the Registrant’s Quarterly Report on Form 10-Q for the quarter ended March 31, 2005 and filed on May 6, 2005). |
|
10.24 |
Summary of the Registrant’s Non-Employee Director Compensation (incorporated by reference to Exhibit 10.1 to the Registrant’s Current Report on Form 8-K dated and filed on December 22, 2005). |
|
10.25 |
Lease Agreement, dated October 28, 2005, between Xpedite Systems, LLC and 3280 Peachtree I LLC (incorporated by reference to Exhibit 10.1 to the Registrant’s Current Report on Form 8-K dated and filed on February 1, 2006). |
|
10.26 |
Guaranty to the Lease Agreement between Xpedite Systems, LLC and 3280 Peachtree I LLC, dated October 28, 2005, by the Registrant (incorporated by reference to Exhibit 10.2 to the Registrant’s Current Report on Form 8-K dated and filed on February 1, 2006). |
|
10.27 |
Lease Agreement, dated October 28, 2005, between American Teleconferencing Services, Ltd. and 3280 Peachtree I LLC (incorporated by reference to Exhibit 10.3 to the Registrant’s Current Report on Form 8-K dated and filed on February 1, 2006). |
|
10.28 |
Guaranty to the Lease Agreement between American Teleconferencing Services, Ltd. and 3280 Peachtree I LLC, by the Registrant (incorporated by reference to Exhibit 10.4 to the Registrant’s Current Report on Form 8-K dated and filed on February 1, 2006). |
|
10.29 |
Fifth Amendment to Standard Office Lease, dated February 9, 2006, by and between 2221 Bijou, LLC and American Teleconferencing Services, Ltd., to the Standard Office Lease, dated May 23, 1996, as amended (incorporated by reference to Exhibit 10.62 to the Registrant’s Annual Report on Form 10-K for the year ended December 31, 2005 and filed on March 16, 2006). |
| Exhibit Number |
Description |
|
10.30 |
Amendment No. 2 and Waiver to Credit Agreement, dated August 3, 2005, by and among the Registrant, as Borrower, Bank of America, N.A., as Administrative Agent, and the Guarantors and the Lenders that are parties thereto (incorporated by reference to Exhibit 10.65 of the Registrant’s Annual Report on Form 10-K for the year ended December 31, 2005 and filed on March 16, 2006). |
|
10.31 |
Amendment No. 3 to Credit Agreement, dated April 24, 2006, by and among the Registrant as Borrower, Bank of America, N.A. as Administrative Agent, and the Guarantors and the Lenders that are parties thereto (incorporated by reference to Exhibit 10.1 to the Registrant’s Current Report on Form 8-K dated and filed April 25, 2006). |
|
10.32 |
Amendment to Fifth Amendment to Standard Office Lease, effective March 13, 2006, by and between 2221 Bijou, LLC and American Teleconferencing Services, Ltd. to the Standard Office Lease, dated May 23, 1996, as amended (incorporated by reference to Exhibit 10.1 to the Registrant’s Quarterly Report on Form 10-Q for the quarter ended March 31, 2006 and filed on May 9, 2006). |
|
10.33 |
Restricted Stock Agreement by and between Theodore P. Schrafft and the Registrant, dated May 5, 2006, under the Registrant’s 1995 Stock Plan (incorporated by reference to Exhibit 10.2 to the Registrant’s Current Report on Form 8-K dated May 10, 2006 and filed on May 11, 2006). + |
|
10.34 |
Revised Summary of the Equity Compensation Component to the Registrant’s Non-Employee Director Compensation (incorporated by reference to Exhibit 10.1 to the Registrant’s Current Report on Form 8-K dated and filed on July 26, 2006). |
|
10.35 |
Amended and Restated Employment Agreement between Theodore P. Schrafft and the Registrant, dated September 15, 2006 (incorporated by reference to Exhibit 10.1 to the Registrant’s Current Report on Form 8-K dated and filed September 19, 2006). + |
|
10.36 |
First Amendment to Fourth Amended and Restated Executive Employment Agreement between Boland T. Jones and the Registrant, dated September 15, 2006 (incorporated by reference to Exhibit 10.3 to the Registrant’s Current Report on Form 8-K dated and filed on September 19, 2006). + |
|
10.37 |
Second Amendment to Fifth Amendment to the Standard Office Lease, dated September 11, 2006, by and between 2221 Bijou, LLC and American Teleconferencing Services, Ltd., to the Standard Office Lease, dated May 23, 1996, as amended (incorporated by reference to Exhibit 10.9 of the Registrant’s Quarterly Report on Form 10-Q for the quarter ended September 30, 2006 and filed on November 9, 2006). |
|
10.38 |
Amendment No. 4 and Waiver to Credit Agreement, dated October 3, 2006, by and among the Registrant as Borrower, Bank of America, N.A. as Administrative Agent, and the Guarantors and the Lenders that are parties thereto (incorporated by reference to Exhibit 10.8 to the Registrant’s Quarterly Report on Form 10-Q for the quarter ended September 30, 2006 and filed on November 9, 2006). |
|
10.39 |
Amendment No. 5 and Waiver, dated April 19, 2007, to the Credit Agreement by and among the Registrant as Borrower, Bank of America, N.A., as Administrative Agent, and the Guarantors and the Lenders that are parties thereto (incorporated by reference to Exhibit 10.2 to the Registrant’s Current Report on Form 8-K dated April 18, 2007 and filed on April 19, 2007). |
|
10.40 |
Second Amendment to Fourth Amended and Restated Executive Employment Agreement between Boland T. Jones and the Registrant dated December 21, 2007 (incorporated by reference to Exhibit 10.1 to the Registrant’s Current Report on Form 8-K dated December 20, 2007 and filed on December 21, 2007). + |
|
10.41 |
First Amendment to Amended and Restated Employment Agreement between Theodore P. Schrafft and the Registrant dated December 21, 2007 (incorporated by reference to Exhibit 10.2 to the Registrant’s Current Report on Form 8-K dated December 20, 2007 and filed on December 21, 2007). + |
| Exhibit Number |
Description |
|
10.42 |
Second Amendment to Amended and Restated Employment Agreement between Theodore P. Schrafft and the Registrant dated January 23, 2008 (incorporated by reference to Exhibit 10.1 to the Registrant’s Current Report on Form 8-K dated January 22, 2007 and filed on January 25, 2008). + |
|
10.43 |
Restricted Stock Agreement between Theodore P. Schrafft and the Registrant dated September 30, 2007 under the Registrant’s 1995 Stock Plan (incorporated by reference to Exhibit 10.65 to the Registrant’s Annual Report on Form 10-K/A for the year ended December 31, 2007 and filed on January 30, 2009). + |
|
10.44 |
Amended and Restated 2004 Long-Term Incentive Plan of the Registrant (incorporated by reference to Appendix A of the Company’s Definitive Proxy Statement on Schedule 14A filed on April 18, 2008). + |
|
10.45 |
Amended and Restated 2000 Directors Stock Plan of the Registrant (incorporated herein by reference to Appendix B of the Company’s Definitive Proxy Statement on Schedule 14A filed on April 18, 2008). + |
|
10.46 |
Amended and Restated Employment Agreement between David M. Guthrie and the Registrant dated May 19, 2008 and effective as of June 30, 2008 (incorporated by reference to Exhibit 10.2 to the Registrant’s Current Report on Form 8-K dated May 16, 2008 and filed on May 19, 2008). + |
|
10.47 |
Restricted Stock Agreement between David M. Guthrie and the Registrant, dated June 30, 2005, under the Registrant’s 2004 Long-Term Incentive Plan (incorporated by reference to Exhibit 10.5 to the Registrant’s Form 10-Q/A for the quarter ended June 30, 2008 and filed on October 14, 2008). + |
|
10.48 |
Restricted Stock Agreement between David M. Guthrie and the Registrant, dated May 5, 2006, under the Registrant’s 1995 Stock Plan (incorporated by reference to Exhibit 10.6 to the Registrant’s Form 10-Q/A for the quarter ended June 30, 2008 and filed on October 14, 2008). + |
|
10.49 |
First Amendment to Restricted Stock Agreement dated May 5, 2006 between David M. Guthrie and the Registrant, effective July 13, 2006 (incorporated by reference to Exhibit 10.7 to the Registrant’s Form 10-Q/A for the quarter ended June 30, 2008 and filed on October 14, 2008). + |
|
10.50 |
Restricted Stock Agreement between David M. Guthrie and the Registrant, dated September 30, 2007, under the Registrant’s 1995 Stock Plan (incorporated by reference to Exhibit 10.8 to the Registrant’s Form 10-Q/A for the quarter ended June 30, 2008 and filed on October 14, 2008). + |
|
10.51 |
Form of Restricted Stock Agreement under the Registrant’s Amended and Restated 2004 Long-Term Incentive Plan (incorporated by reference to Exhibit 10.9 to the Registrant’s Form 10-Q/A for the quarter ended June 30, 2008 and filed on October 14, 2008).+ |
|
10.52 |
Form of Restriction Agreement for non-employee directors under the Amended and Restated 2000 Directors Stock Plan (incorporated by reference to Exhibit 10.10 to the Registrant’s Form 10-Q/A for the quarter ended June 30, 2008 and filed on October 14, 2008). + |
|
10.53 |
Form of Restricted Stock Agreement to be issued to Boland T. Jones as Stock Bonuses pursuant to the terms of his Fourth Amended and Restated Executive Employment Agreement with the Registrant (incorporated by reference to Exhibit 10.11 to the Registrant’s Form 10-Q/A for the quarter ended June 30, 2008 and filed on October 14, 2008). + |
|
10.54 |
First Amendment to Lease Agreement, dated July 14, 2006, by and between American Teleconferencing Services, Ltd. and 3280 Peachtree I LLC (incorporated by reference to Exhibit 10.12 to the Registrant’s Form 10-Q/A for the quarter ended June 30, 2008 and filed on October 14, 2008). |
|
10.55 |
Acknowledgment, Consent and Reaffirmation of Guarantor of Lease to the First Amendment to Lease Agreement between American Teleconferencing Services, Ltd. and 3280 Peachtree I LLC, dated July 14, 2006, by the Registrant (incorporated by reference to Exhibit 10.13 to the Registrant’s Form 10-Q/A for the quarter ended June 30, 2008 and filed on October 14, 2008). |
| Exhibit Number |
Description |
|
10.56 |
Second Amendment to Lease Agreement, dated March 15, 2007, by and between American Teleconferencing Services, Ltd. and 3280 Peachtree I LLC (incorporated by reference to Exhibit 10.14 to the Registrant’s Form 10-Q/A for the quarter ended June 30, 2008 and filed on October 14, 2008). |
|
10.57 |
Acknowledgment, Consent and Reaffirmation of Guarantor of Lease to the Second Amendment to Lease Agreement between American Teleconferencing Services, Ltd. and 3280 Peachtree I LLC, dated March 15, 2007, by the Registrant (incorporated by reference to Exhibit 10.15 to the Registrant’s Form 10-Q/A for the quarter ended June 30, 2008 and filed on October 14, 2008). |
|
10.58 |
Third Amendment to Lease Agreement, dated June 3, 2008, by and between American Teleconferencing Services, Ltd. and 3280 Peachtree I LLC (incorporated by reference to Exhibit 10.16 to the Registrant’s Form 10-Q/A for the quarter ended June 30, 2008 and filed on October 14, 2008). |
|
10.59 |
Acknowledgment, Consent and Reaffirmation of Guarantor of Lease to the Third Amendment to Lease Agreement between American Teleconferencing Services, Ltd. and 3280 Peachtree I LLC, dated June 3, 2008, by the Registrant (incorporated by reference to Exhibit 10.17 to the Registrant’s Form 10-Q/A for the quarter ended June 30, 2008 and filed on October 14, 2008). |
|
10.60 |
First Amendment to Lease Agreement, dated July 14, 2006, by and between Xpedite Systems, LLC and 3280 Peachtree I LLC (incorporated by reference to Exhibit 10.18 to the Registrant’s Form 10-Q/A for the quarter ended June 30, 2008 and filed on October 14, 2008). |
|
10.61 |
Acknowledgment, Consent and Reaffirmation of Guarantor of Lease to the First Amendment to Lease Agreement between Xpedite Systems, LLC and 3280 Peachtree I LLC, dated July 14, 2006, by the Registrant (incorporated by reference to Exhibit 10.19 to the Registrant’s Form 10-Q/A for the quarter ended June 30, 2008 and filed on October 14, 2008). |
|
10.62 |
Second Amendment to Lease Agreement, dated March 15, 2007, by and between Xpedite Systems, LLC and 3280 Peachtree I LLC (incorporated by reference to Exhibit 10.10 to the Registrant’s Form 10-Q/A for the quarter ended June 30, 2008 and filed on October 14, 2008). |
|
10.63 |
Acknowledgment, Consent and Reaffirmation of Guarantor of Lease to the Second Amendment to Lease Agreement between Xpedite Systems, LLC and 3280 Peachtree I LLC, dated March 15, 2007, by the Registrant (incorporated by reference to Exhibit 10.21 to the Registrant’s Form 10-Q/A for the quarter ended June 30, 2008 and filed on October 14, 2008). |
|
10.64 |
Third Amendment to Lease Agreement, dated June 3, 2008, by and between Xpedite Systems, LLC and 3280 Peachtree I LLC to the Lease Agreement, dated October 28, 2005 (incorporated by reference to Exhibit 10.22 to the Registrant’s Form 10-Q/A for the quarter ended June 30, 2008 and filed on October 14, 2008). |
|
10.65 |
Acknowledgment, Consent and Reaffirmation of Guarantor of Lease to the Third Amendment to Lease Agreement between Xpedite Systems, LLC and 3280 Peachtree I LLC, dated June 3, 2008, by the Registrant (incorporated by reference to Exhibit 10.23 to the Registrant’s Form 10-Q/A for the quarter ended June 30, 2008 and filed on October 14, 2008). |
|
10.66 |
Fourth Amendment to Lease Agreement, dated August 27, 2008, by and between American Teleconferencing Services, Ltd. and 3280 Peachtree I LLC (incorporated by reference to Exhibit 10.1 to the Registrant’s Quarterly Report on Form 10-Q for the quarter ended September 30, 2008 and filed on November 7, 2008). + |
|
10.67 |
Acknowledgment, Consent and Reaffirmation of Guarantor of Lease to the Fourth Amendment to Lease Agreement between American Teleconferencing Services, Ltd. and 3280 Peachtree I LLC, dated August 27, 2008, by the Registrant (incorporated by reference to Exhibit 10.2 to the Registrant’s Quarterly Report on Form 10-Q for the quarter ended September 30, 2008 and filed on November 7, 2008). + |
| Exhibit Number |
Description |
|
10.68 |
Third Amendment to Fourth Amended and Restated Executive Employment Agreement between Boland T. Jones and the Registrant dated December 23, 2008 (incorporated by reference to Exhibit 10.1 to the Registrant’s Current Report on Form 8-K dated and filed December 23, 2008). + |
|
10.69 |
Third Amendment to Amended and Restated Employment Agreement between Theodore P. Schrafft and the Registrant dated December 23, 2008 (incorporated by reference to Exhibit 10.2 to the Registrant’s Current Report on Form 8-K dated and filed December 23, 2008). + |
|
10.70 |
First Amendment to Amended and Restated Employment Agreement between David M. Guthrie and the Registrant dated December 23, 2008 (incorporated by reference to Exhibit 10.1 to the Registrant’s Current Report on Form 8-K dated and filed December 23, 2008). + |
|
10.71 |
Employment Agreement between David E. Trine and the Registrant dated February 19, 2008 (incorporated by reference to Exhibit 10.1 to the Registrant’s Current Report on Form 8-K dated and filed February 19, 2009). + |
|
10.72 |
Fifth Amendment to Lease Agreement, dated October 15, 2008, by and between American Teleconferencing Services, Ltd. and 3280 Peachtree I LLC. |
|
10.73 |
Acknowledgement, Consent and Ratification of Guarantor of Lease to the Fifth Amendment to Lease Agreement, dated October 15, 2008, by and between American Teleconferencing Services, Ltd. and 3280 Peachtree I LLC. |
|
10.74 |
Office Lease Agreement, dated September 29, 2008, by and between Corporate Ridge, L.L.C. and American Teleconferencing Services, Ltd. |
|
10.75 |
Lease Guaranty to the Office Lease Agreement, dated September 29, 2008, by and between Corporate Ridge, L.L.C. and American Teleconferencing Services, Ltd. |
|
10.76 |
Wells Fargo Defined Contribution Prototype Plan and Trust Agreement, 401(K) Plan and Participation Agreement (1.23(D)) of the Registrant, effective January 1, 2009. |
|
10.77 |
Restricted Stock Agreement between David E. Trine and the Registrant, dated March 31, 2009, under the Registrant’s Amended and Restated 2004 Long-Term Incentive Plan (incorporated by reference to Exhibit 10.1 to the Registrant’s Current Report on Form 8-K dated March 31, 2009 and filed April 1, 2009). + |
|
10.78 |
Amendment No. 6 to Credit Agreement, dated April 9, 2009, by and among the Registrant as Borrower, Bank of America, N.A. as Administrative Agent, and the Guarantors and the Lenders that are parties thereto (incorporated by reference to Exhibit 10.1 to the Registrant’s Quarterly Report on Form 10-Q dated and filed August 7, 2009). |
|
10.79 |
Office Building Lease, dated November 12, 2009, between Verizon Business Network Services and American Teleconferencing Services, Ltd. |
|
21.1 |
Subsidiaries of the Registrant. |
| 23.1 | Consent of Ernst & Young LLP. |
| 23.2 | Consent of Deloitte & Touche LLP. |
| 31.1 | Certification of Chief Executive Officer pursuant to Rule 13a-14(a)/15d-14(a) of the Securities Exchange Act of 1934. |
| Exhibit Number |
Description |
|
31.2 |
Certification of Chief Financial Officer pursuant to Rule 13a-14(a)/15d-14(a) of the Securities Exchange Act of 1934. |
|
32.1 |
Certification of Chief Executive Officer pursuant to Rule 13a-14(b)/15d-14(b) of the Securities Exchange Act of 1934 and 18 U.S.C. Section 1350. |
|
32.2 |
Certification of Chief Financial Officer pursuant to Rule 13a-14(b)/15d-14(b) of the Securities Exchange Act of 1934 and 18 U.S.C. Section 1350. |
+ Management contract or compensatory plan or arrangement required to be filed as an exhibit to this form pursuant to Item 15(b) of this report.