Attached files
| file | filename |
|---|---|
| 8-K - 8-K - PACWEST BANCORP | a10-4862_18k.htm |
Exhibit 99.1
|
|
West Coast Financial Services Conference Sandler O’Neill + Partners March 2, 2010 Marina del Rey, California 1 |
|
|
March 2, 2010 Sandler O’Neill Investor Conference 2 Forward-Looking Statements and Where to Find Additional Information This presentation contains certain forward-looking information about PacWest Bancorp that is intended to be covered by the safe harbor for “forward-looking statements” provided by the Private Securities Litigation Reform Act of 1995. All references herein to PacWest are intended to refer to PacWest and its predecessor First Community Bancorp. All statements other than statements of historical fact are forward-looking statements. Such statements involve inherent risks and uncertainties, many of which are difficult to predict and are generally beyond the control of the Company. We caution readers that a number of important factors could cause actual results to differ materially from those expressed in, implied or projected by, such forward-looking statements. Risks and uncertainties include, but are not limited to: planned acquisitions and related cost savings cannot be realized or realized within the expected time frame; lower than expected revenues; credit quality deterioration which could cause an increase in the allowance for credit losses and a reduction in net earnings; increased competitive pressure among depository institutions; the Company’s ability to complete announced acquisitions, to successfully integrate acquired entities, or to achieve expected synergies and operating efficiencies within expected time-frames or at all; the integration of acquired businesses costs more, takes longer or is less successful than expected; the possibility that personnel changes will not proceed as planned; the cost of additional capital is more than expected; a change in the interest rate environment reduces interest margins; asset/liability repricing risks and liquidity risks; pending legal matters may take longer or cost more to resolve or may be resolved adversely to the Company; general economic conditions, either nationally or in the market areas in which the Company does or anticipates doing business, are less favorable than expected; environmental conditions, including natural disasters, may disrupt our business, impede our operations, negatively impact the values of collateral securing the Company’s loans or impair the ability of our borrowers to support their debt obligations; the economic and regulatory effects of the continuing war on terrorism and other events of war, including the conflicts in the Middle East; legislative or regulatory requirements or changes adversely affecting the Company’s business; changes in the securities markets; regulatory approvals for any acquisitions cannot be obtained on the terms expected or on the anticipated schedule; and, other risks that are described in PacWest’s (including its predecessor’s) public filings with the U.S. Securities and Exchange Commission (the “SEC”). If any of these risks or uncertainties materializes or if any of the assumptions underlying such forward-looking statements proves to be incorrect, PacWest’s results could differ materially from those expressed in, implied or projected by such forward-looking statements. PacWest assumes no obligation to update such forward-looking statements. For a more complete discussion of risks and uncertainties, investors and security holders are urged to read the Company’s annual report on Form 10-K, quarterly reports on Form 10-Q and other reports filed by PacWest with the SEC. The documents filed by PacWest with the SEC may be obtained at PacWest Bancorp’s website at www.pacwestbancorp.com or at the SEC’s website at www.sec.gov. These documents may also be obtained free of charge from PacWest by directing a request to: PacWest Bancorp c/o Pacific Western Bank, 275 North Brea Boulevard, Brea, CA 92821. Attention: Investor Relations. Telephone 714-671-6800. |
|
|
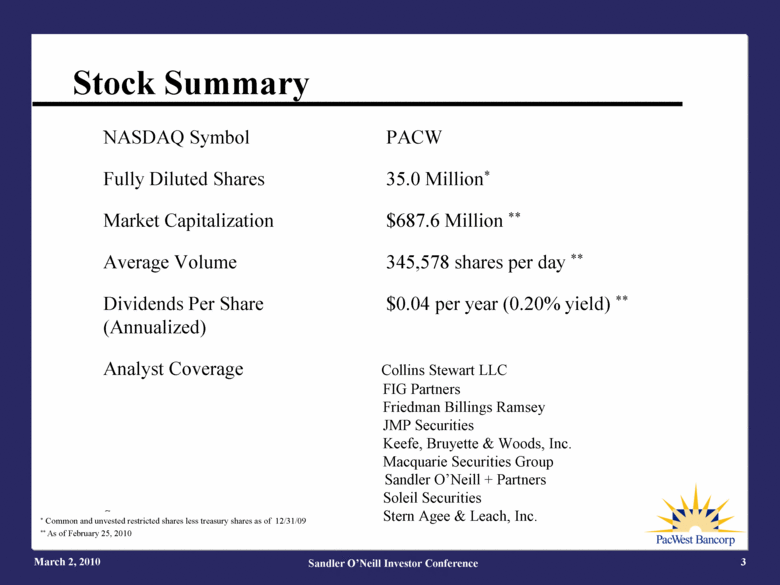
March 2, 2010 Sandler O’Neill Investor Conference 3 NASDAQ Symbol PACW Fully Diluted Shares 35.0 Million* Market Capitalization $687.6 Million ** Average Volume 345,578 shares per day ** Dividends Per Share $0.04 per year (0.20% yield) ** (Annualized) Analyst Coverage Collins Stewart LLC FIG Partners Friedman Billings Ramsey JMP Securities Keefe, Bruyette & Woods, Inc. Macquarie Securities Group Sandler O’Neill + Partners Soleil Securities Stern Stern Agee & Leach, Inc. Stern Agee & Leach, Inc. * Common and unvested restricted shares less treasury shares as of 12/31/09 ** As of February 25, 2010 Stock Summary |
|
|
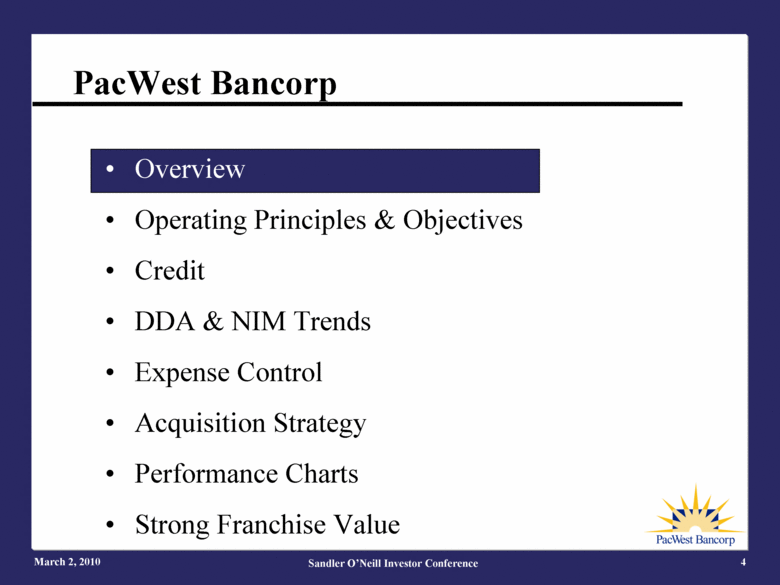
PacWest Bancorp March 2, 2010 Sandler O’Neill Investor Conference 4 Overview Operating Principles & Objectives Credit DDA & NIM Trends Expense Control Acquisition Strategy Performance Charts Strong Franchise Value |
|
|
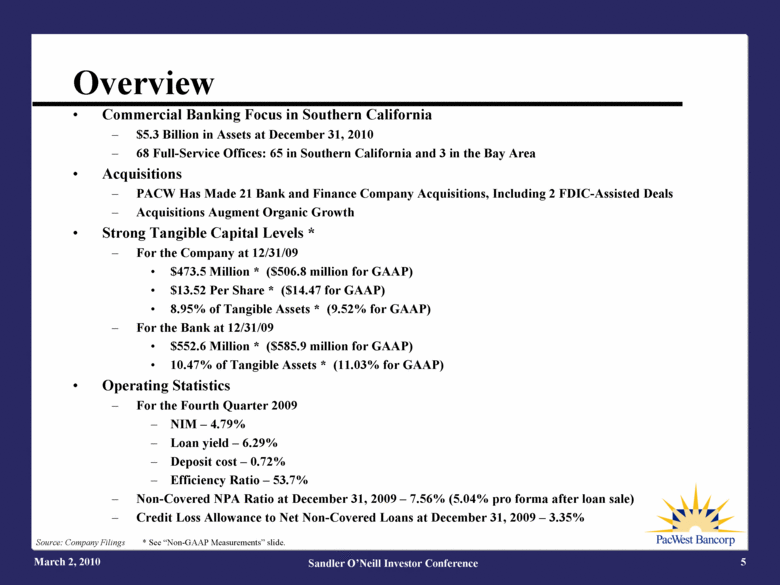
March 2, 2010 Sandler O’Neill Investor Conference 5 Source: Company Filings * See “Non-GAAP Measurements” slide. Commercial Banking Focus in Southern California $5.3 Billion in Assets at December 31, 2010 68 Full-Service Offices: 65 in Southern California and 3 in the Bay Area Acquisitions PACW Has Made 21 Bank and Finance Company Acquisitions, Including 2 FDIC-Assisted Deals Acquisitions Augment Organic Growth Strong Tangible Capital Levels * For the Company at 12/31/09 $473.5 Million * ($506.8 million for GAAP) $13.52 Per Share * ($14.47 for GAAP) 8.95% of Tangible Assets * (9.52% for GAAP) For the Bank at 12/31/09 $552.6 Million * ($585.9 million for GAAP) 10.47% of Tangible Assets * (11.03% for GAAP) Operating Statistics For the Fourth Quarter 2009 NIM – 4.79% Loan yield – 6.29% Deposit cost – 0.72% Efficiency Ratio – 53.7% Non-Covered NPA Ratio at December 31, 2009 – 7.56% (5.04% pro forma after loan sale) Credit Loss Allowance to Net Non-Covered Loans at December 31, 2009 – 3.35% Overview |
|
|
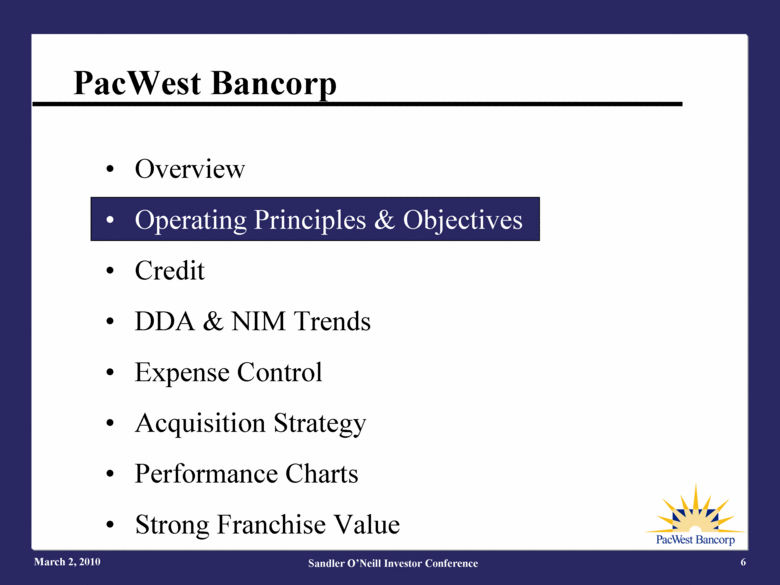
PacWest Bancorp March 2, 2010 Sandler O’Neill Investor Conference 6 Overview Operating Principles & Objectives Credit DDA & NIM Trends Expense Control Acquisition Strategy Performance Charts Strong Franchise Value |
|
|
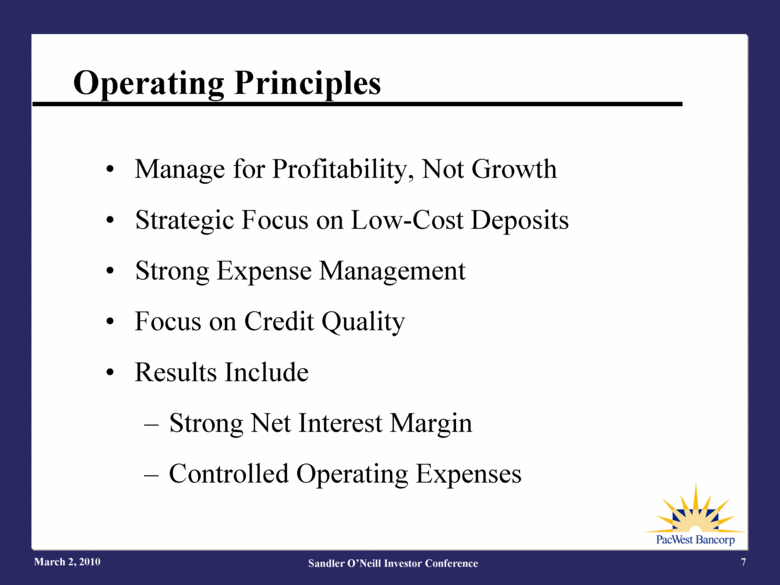
March 2, 2010 Sandler O’Neill Investor Conference 7 Operating Principles Manage for Profitability, Not Growth Strategic Focus on Low-Cost Deposits Strong Expense Management Focus on Credit Quality Results Include Strong Net Interest Margin Controlled Operating Expenses |
|
|
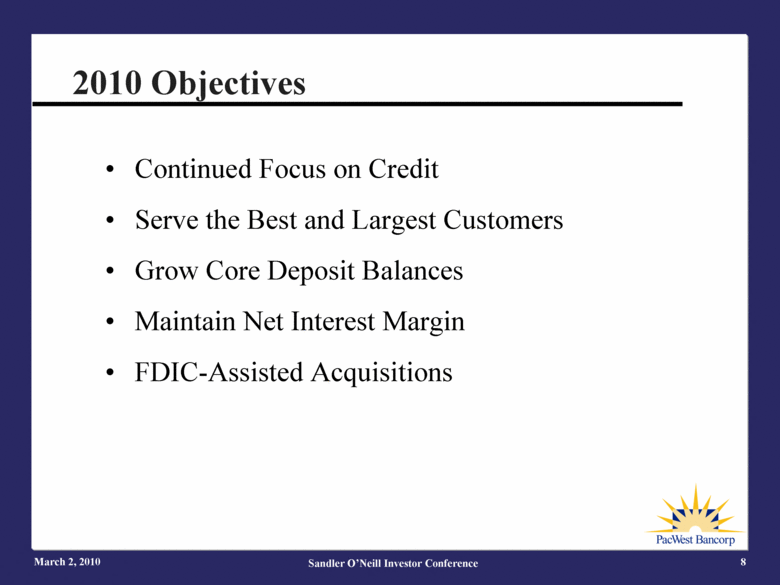
March 2, 2010 Sandler O’Neill Investor Conference 8 2010 Objectives Continued Focus on Credit Serve the Best and Largest Customers Grow Core Deposit Balances Maintain Net Interest Margin FDIC-Assisted Acquisitions |
|
|
PacWest Bancorp March 2, 2010 Sandler O’Neill Investor Conference 9 Overview Operating Principles & Objectives Credit DDA & NIM Trends Expense Control Acquisition Strategy Performance Charts Strong Franchise Value |
|
|
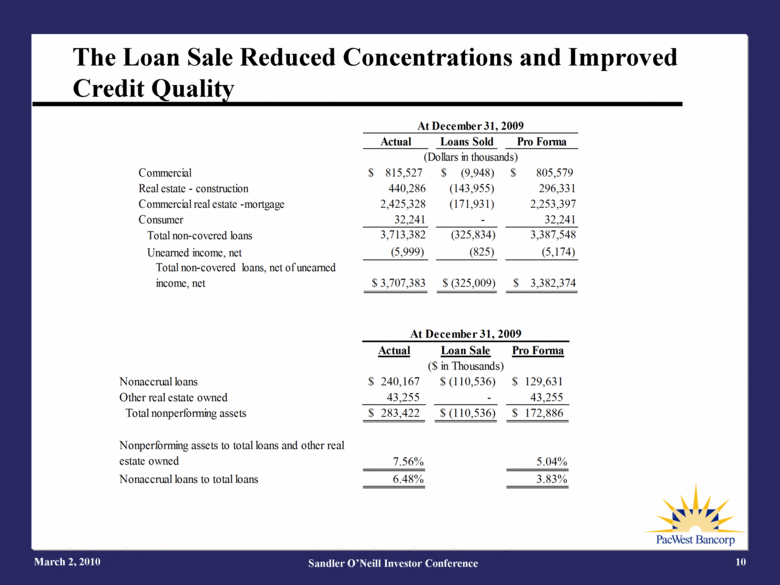
March 2, 2010 Sandler O’Neill Investor Conference 10 The Loan Sale Reduced Concentrations and Improved Credit Quality At December 31, 2009 Actual Loan Sale Pro Forma ($ in Thousands) Nonaccrual loans 240,167 $ (110,536) $ 129,631 $ Other real estate owned 43,255 - 43,255 Total nonperforming assets 283,422 $ (110,536) $ 172,886 $ Nonperforming assets to total loans and other real estate owned 7.56% 5.04% Nonaccrual loans to total loans 6.48% 3.83% Actual Loans Sold Pro Forma Commercial $ 815,527 $ (9,948) $ 805,579 Real estate - construction 440,286 (143,955) 296,331 Commercial real estate -mortgage 2,425,328 (171,931) 2,253,397 Consumer 32,241 - 32,241 Total non-covered loans 3,713,382 (325,834) 3,387,548 Unearned income, net (5,999) (825) (5,174) Total non-covered loans, net of unearned income, net $ 3,707,383 $ (325,009) $ 3,382,374 At December 31, 2009 (Dollars in thousands) |
|
|
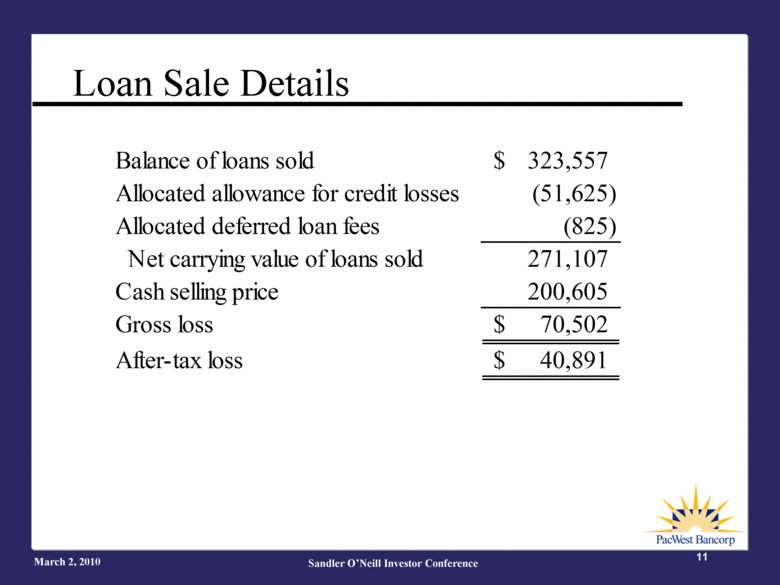
Loan Sale Details March 2, 2010 Sandler O’Neill Investor Conference 11 Balance of loans sold 323,557 $ Allocated allowance for credit losses (51,625) Allocated deferred loan fees (825) Net carrying value of loans sold 271,107 Cash selling price 200,605 Gross loss 70,502 $ After-tax loss 40,891 $ |
|
|
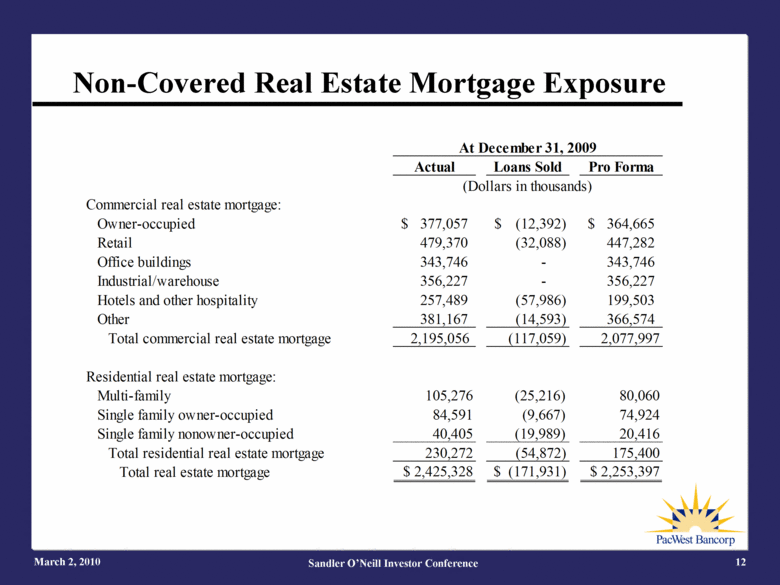
March 2, 2010 Sandler O’Neill Investor Conference 12 Non-Covered Real Estate Mortgage Exposure Actual Loans Sold Pro Forma Commercial real estate mortgage: Owner-occupied 377,057 $ (12,392) $ 364,665 $ Retail 479,370 (32,088) 447,282 Office buildings 343,746 - 343,746 Industrial/warehouse 356,227 - 356,227 Hotels and other hospitality 257,489 (57,986) 199,503 Other 381,167 (14,593) 366,574 Total commercial real estate mortgage 2,195,056 (117,059) 2,077,997 Residential real estate mortgage: Multi-family 105,276 (25,216) 80,060 Single family owner-occupied 84,591 (9,667) 74,924 Single family nonowner-occupied 40,405 (19,989) 20,416 Total residential real estate mortgage 230,272 (54,872) 175,400 Total real estate mortgage $ 2,425,328 $ (171,931) $ 2,253,397 At December 31, 2009 (Dollars in thousands) |
|
|
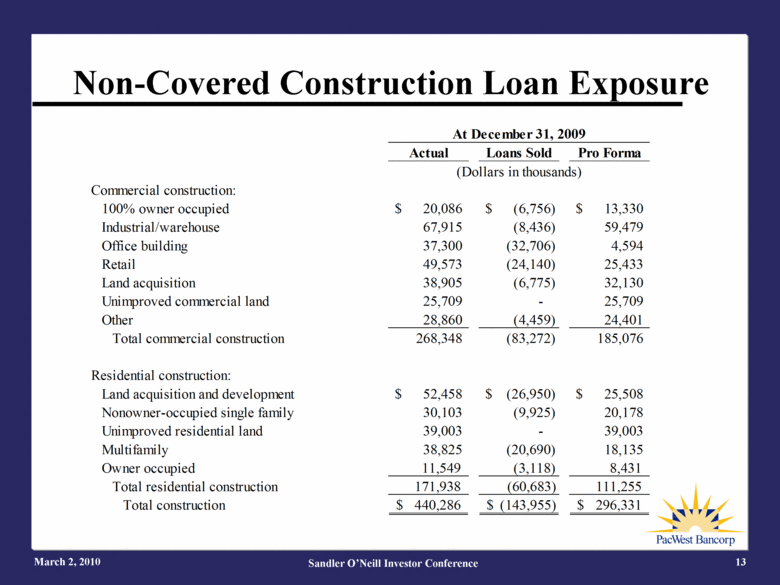
March 2, 2010 Sandler O’Neill Investor Conference 13 Non-Covered Construction Loan Exposure Actual Loans Sold Pro Forma Commercial construction: 100% owner occupied $ 20,086 $ (6,756) $ 13,330 Industrial/warehouse 67,915 (8,436) 59,479 Office building 37,300 (32,706) 4,594 Retail 49,573 (24,140) 25,433 Land acquisition 38,905 (6,775) 32,130 Unimproved commercial land 25,709 - 25,709 Other 28,860 (4,459) 24,401 Total commercial construction 268,348 (83,272) 185,076 Residential construction: Land acquisition and development $ 52,458 $ (26,950) $ 25,508 Nonowner-occupied single family 30,103 (9,925) 20,178 Unimproved residential land 39,003 - 39,003 Multifamily 38,825 (20,690) 18,135 Owner occupied 11,549 (3,118) 8,431 Total residential construction 171,938 (60,683) 111,255 Total construction 440,286 $ (143,955) $ 296,331 $ (Dollars in thousands) At December 31, 2009 |
|
|
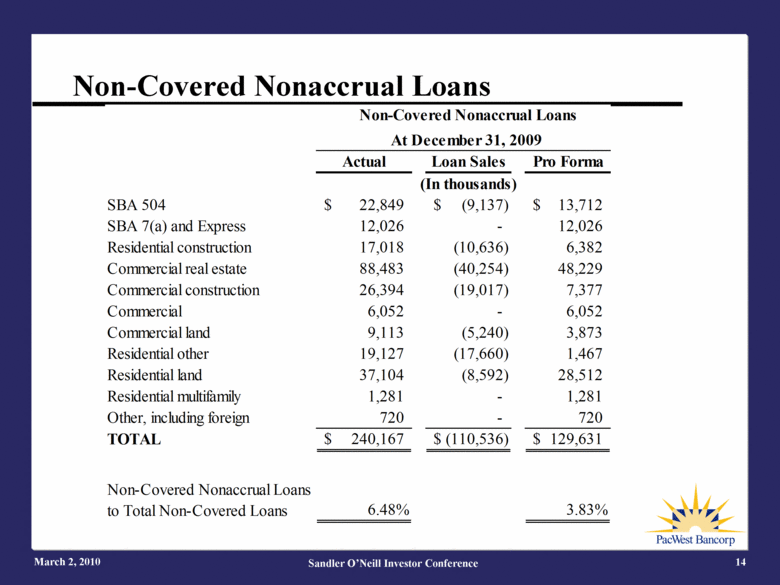
March 2, 2010 Sandler O’Neill Investor Conference 14 Non-Covered Nonaccrual Loans Non-Covered Nonaccrual Loans At December 31, 2009 Actual Loan Sales Pro Forma (In thousands) SBA 504 22,849 $ (9,137) $ 13,712 $ SBA 7(a) and Express 12,026 - 12,026 Residential construction 17,018 (10,636) 6,382 Commercial real estate 88,483 (40,254) 48,229 Commercial construction 26,394 (19,017) 7,377 Commercial 6,052 - 6,052 Commercial land 9,113 (5,240) 3,873 Residential other 19,127 (17,660) 1,467 Residential land 37,104 (8,592) 28,512 Residential multifamily 1,281 - 1,281 Other, including foreign 720 - 720 TOTAL 240,167 $ (110,536) $ 129,631 $ 6.48% 3.83% Non-Covered Nonaccrual Loans to Total Non-Covered Loans |
|
|
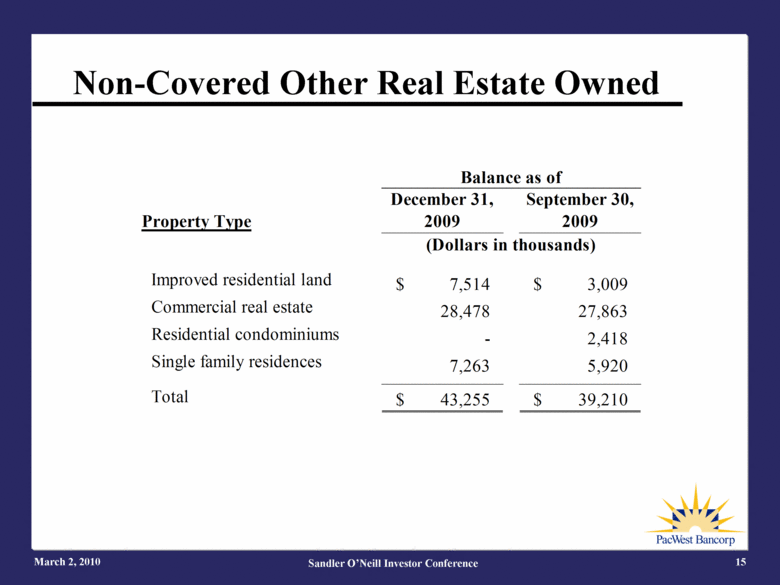
March 2, 2010 Sandler O’Neill Investor Conference 15 Non-Covered Other Real Estate Owned Property Type December 31, 2009 September 30, 2009 Improved residential land $ 7,514 $ 3,009 Commercial real estate 28,478 27,863 Residential condominiums - 2,418 Single family residences 7,263 5,920 Total $ 43,255 $ 39,210 (Dollars in thousands) Balance as of |
|
|
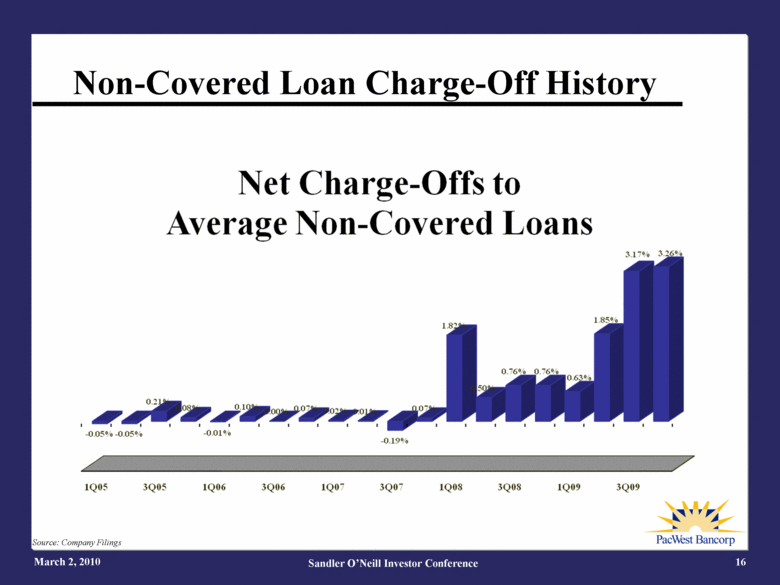
March 2, 2010 Sandler O’Neill Investor Conference 16 Non-Covered Loan Charge-Off History Source: Company Filings |
|
|
PacWest Bancorp March 2, 2010 Sandler O’Neill Investor Conference 17 Overview Operating Principles & Objectives Credit DDA & NIM Trends Expense Control Acquisition Strategy Performance Charts Strong Franchise Value |
|
|
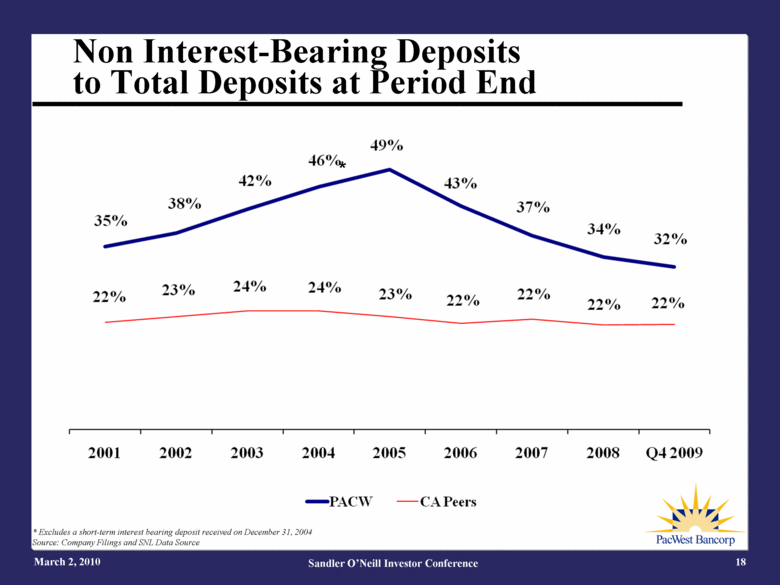
March 2, 2010 Sandler O’Neill Investor Conference 18 Non Interest-Bearing Deposits to Total Deposits at Period End * Excludes a short-term interest bearing deposit received on December 31, 2004 Source: Company Filings and SNL Data Source |
|
|
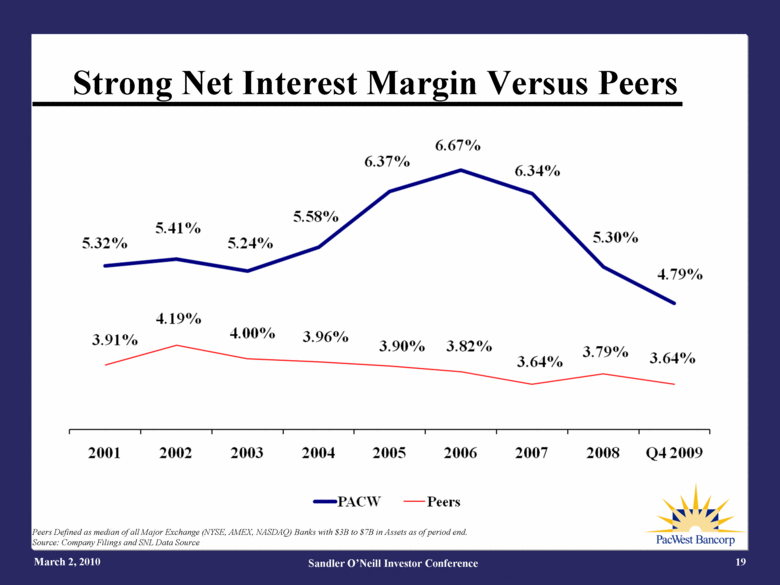
Strong Net Interest Margin Versus Peers March 2, 2010 Sandler O’Neill Investor Conference 19 Peers Defined as median of all Major Exchange (NYSE, AMEX, NASDAQ) Banks with $3B to $7B in Assets as of period end. Source: Company Filings and SNL Data Source |
|
|
PacWest Bancorp March 2, 2010 Sandler O’Neill Investor Conference 20 Overview Operating Principles & Objectives Credit DDA & NIM Trends Expense Control Acquisition Strategy Performance Charts Strong Franchise Value |
|
|
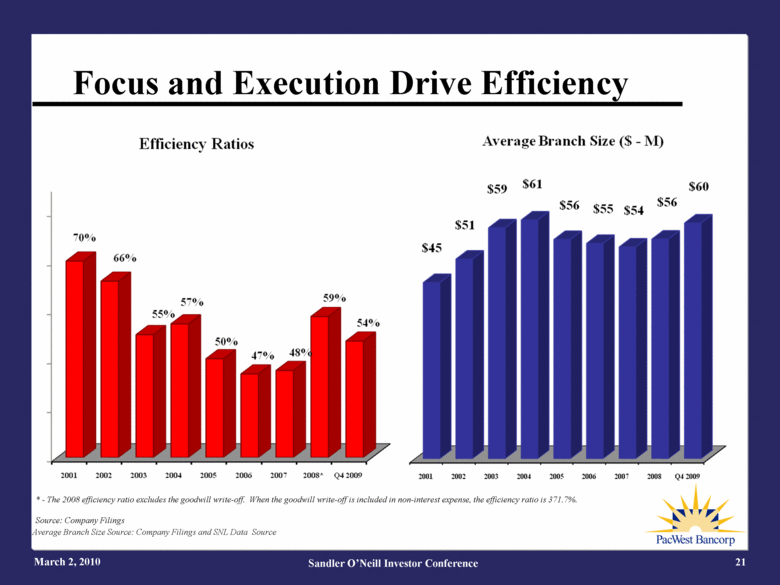
March 2, 2010 Sandler O’Neill Investor Conference 21 * - The 2008 efficiency ratio excludes the goodwill write-off. When the goodwill write-off is included in non-interest expense, the efficiency ratio is 371.7%. Source: Company Filings Average Branch Size Source: Company Filings and SNL Data Source Focus and Execution Drive Efficiency |
|
|
PacWest Bancorp March 2, 2010 Sandler O’Neill Investor Conference 22 Overview Operating Principles & Objectives Credit DDA & NIM Trends Expense Control Acquisition Strategy Performance Charts Strong Franchise Value |
|
|
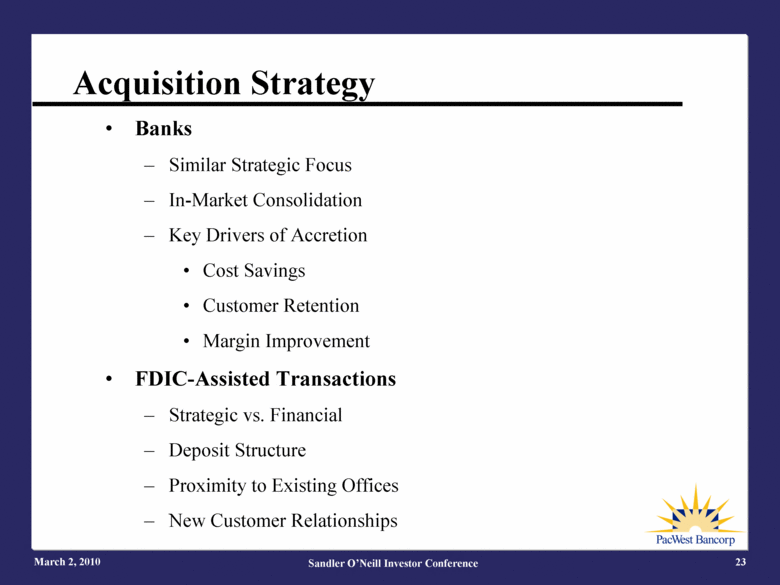
Acquisition Strategy March 2, 2010 Sandler O’Neill Investor Conference 23 Banks Similar Strategic Focus In-Market Consolidation Key Drivers of Accretion Cost Savings Customer Retention Margin Improvement FDIC-Assisted Transactions Strategic vs. Financial Deposit Structure Proximity to Existing Offices New Customer Relationships |
|
|
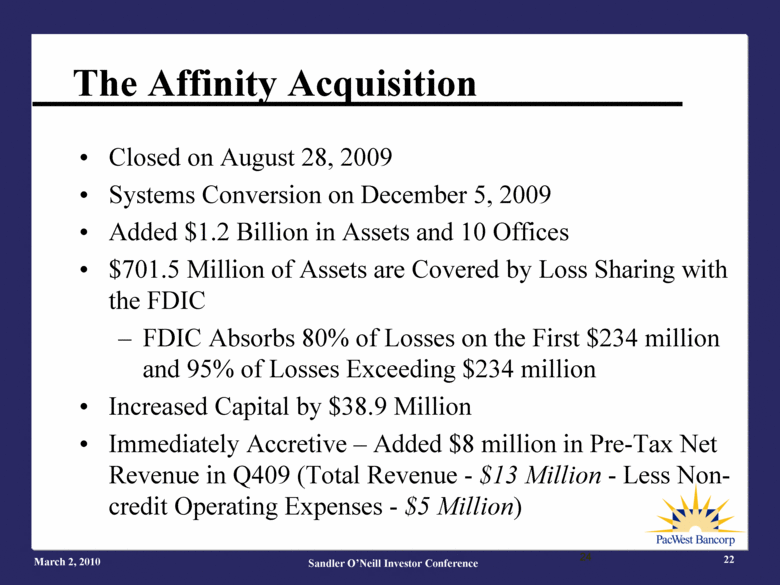
The Affinity Acquisition Closed on August 28, 2009 Systems Conversion on December 5, 2009 Added $1.2 Billion in Assets and 10 Offices $701.5 Million of Assets are Covered by Loss Sharing with the FDIC FDIC Absorbs 80% of Losses on the First $234 million and 95% of Losses Exceeding $234 million Increased Capital by $38.9 Million Immediately Accretive – Added $8 million in Pre-Tax Net Revenue in Q409 (Total Revenue - $13 Million - Less Non-credit Operating Expenses - $5 Million) March 2, 2010 Sandler O’Neill Investor Conference 22 |
|
|
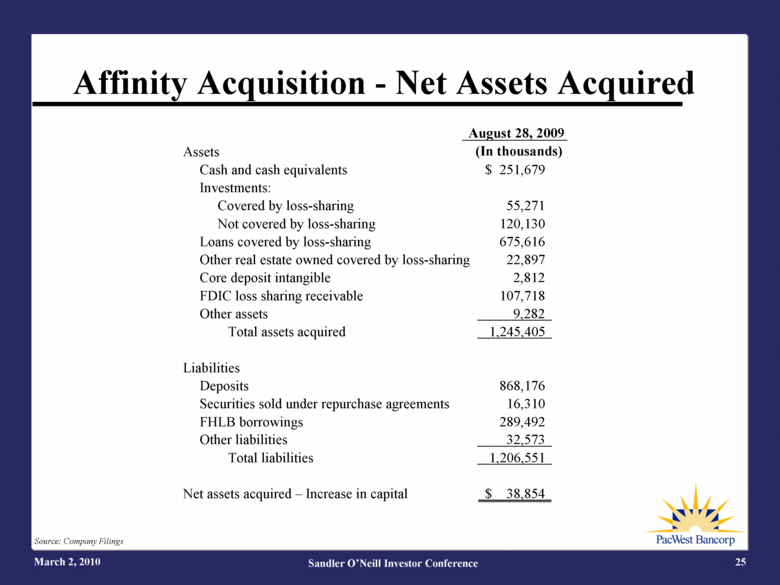
Affinity Acquisition - Net Assets Acquired March 2, 2010 Sandler O’Neill Investor Conference 25 Source: Company Filings Assets Cash and cash equivalents 251,679 $ Investments: Covered by loss-sharing 55,271 Not covered by loss-sharing 120,130 Loans covered by loss-sharing 675,616 Other real estate owned covered by loss-sharing 22,897 Core deposit intangible 2,812 FDIC loss sharing receivable 107,718 Other assets 9,282 Total assets acquired 1,245,405 Liabilities Deposits 868,176 Securities sold under repurchase agreements 16,310 FHLB borrowings 289,492 Other liabilities 32,573 Total liabilities 1,206,551 Net assets acquired – Increase in capital 38,854 $ August 28, 2009 (In thousands) |
|
|
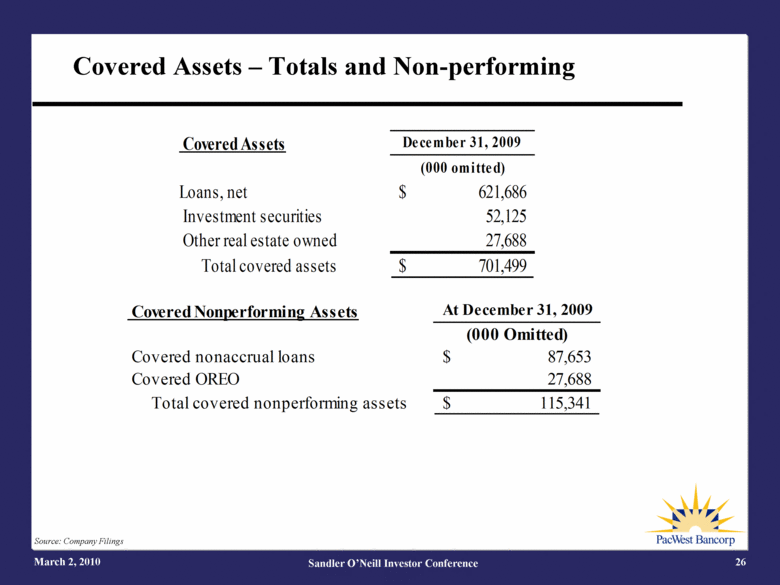
Covered Assets – Totals and Non-performing March 2, 2010 Sandler O’Neill Investor Conference 26 Source: Company Filings Covered Nonperforming Assets At December 31, 2009 Covered nonaccrual loans 87,653 $ Covered OREO 27,688 Total covered nonperforming assets 115,341 $ (000 Omitted) Covered Assets December 31, 2009 (000 omitted) Loans, net 621,686 $ Investment securities 52,125 Other real estate owned 27,688 Total covered assets 701,499 |
|
|
PacWest Bancorp March 2, 2010 Sandler O’Neill Investor Conference 27 Overview Operating Principles & Objectives Credit DDA & NIM Trends Expense Control Acquisition Strategy Performance Charts Strong Franchise Value |
|
|
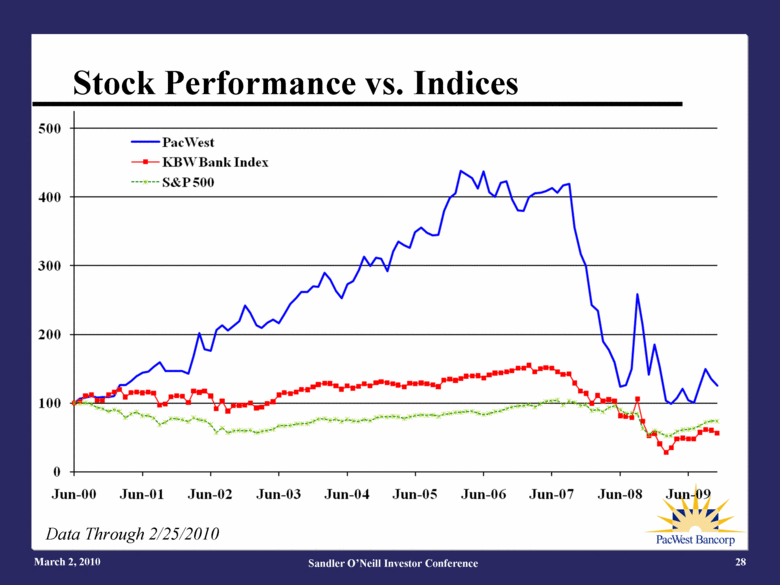
March 2, 2010 Sandler O’Neill Investor Conference 28 Stock Performance vs. Indices Data Through 2/25/2010 |
|
|
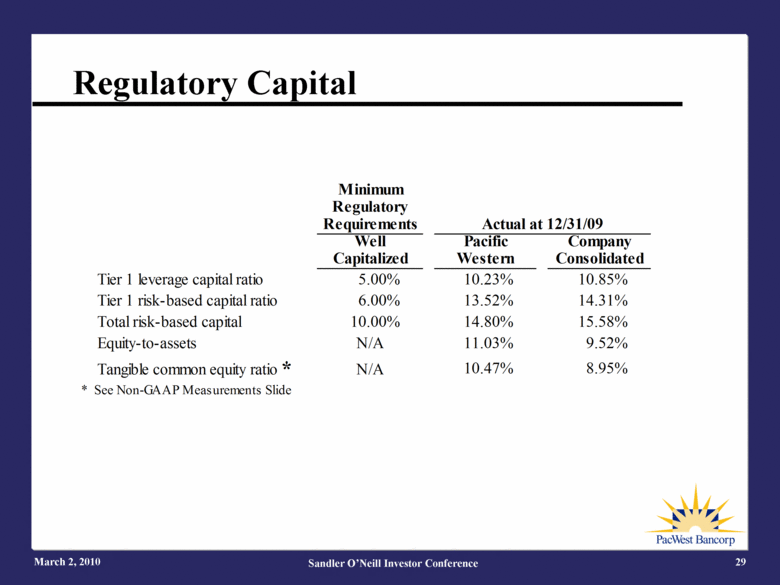
Regulatory Capital March 2, 2010 Sandler O’Neill Investor Conference 29 Pacific |
|
|
PacWest Bancorp March 2, 2010 Sandler O’Neill Investor Conference 30 Overview Operating Principles & Objectives Credit DDA & NIM Trends Expense Control Acquisition Strategy Performance Charts Strong Franchise Value |
|
|
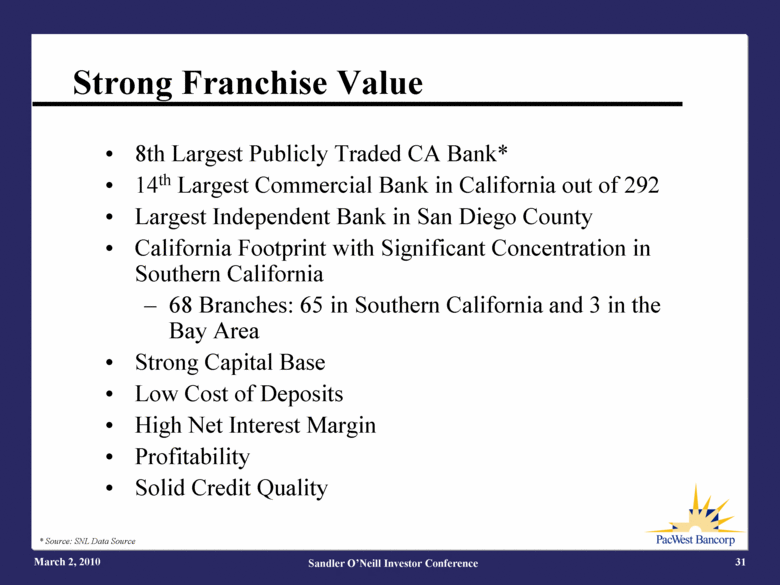
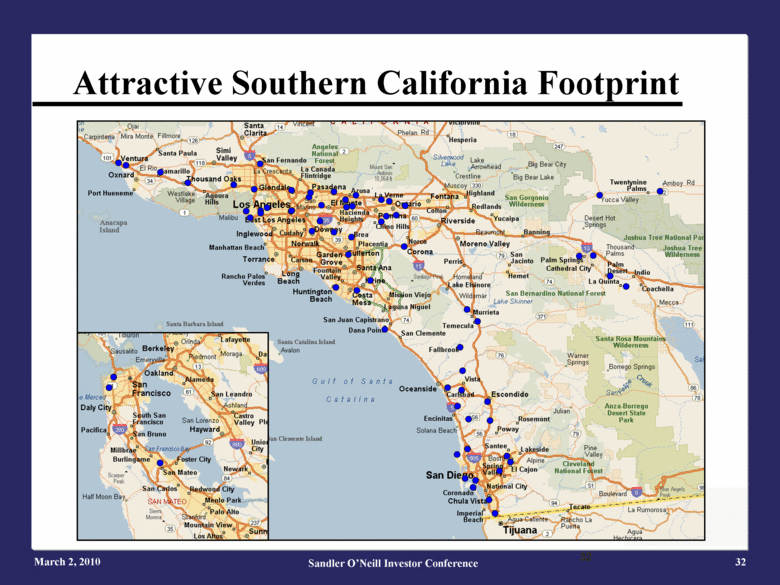
Strong Franchise Value March 2, 2010 Sandler O’Neill Investor Conference 31 * Source: SNL Data Source 8th Largest Publicly Traded CA Bank* 14th Largest Commercial Bank in California out of 292 Largest Independent Bank in San Diego County California Footprint with Significant Concentration in Southern California 68 Branches: 65 in Southern California and 3 in the Bay Area Strong Capital Base Low Cost of Deposits High Net Interest Margin Profitability Solid Credit Quality |
|
|
Attractive Southern California Footprint March 2, 2010 Sandler O’Neill Investor Conference 32 |
|
|
Non-GAAP Information The Company uses certain non-GAAP financial measures to provide meaningful supplemental information regarding the Company’s operational performance and to enhance investors’ overall understanding of such financial performance. These non-GAAP financial measures are presented for supplemental informational purposes only for understanding the Company’s operating results and should not be considered a substitute for financial information presented in accordance with GAAP. These non-GAAP financial measures presented by the Company may be different from non-GAAP financial measures used by other companies. The table on the following slide presents a reconciliation of the non-GAAP financial measurements to the GAAP financial measurements and certain key performance ratios March 2, 2010 Sandler O’Neill Investor Conference 33 |
|
|
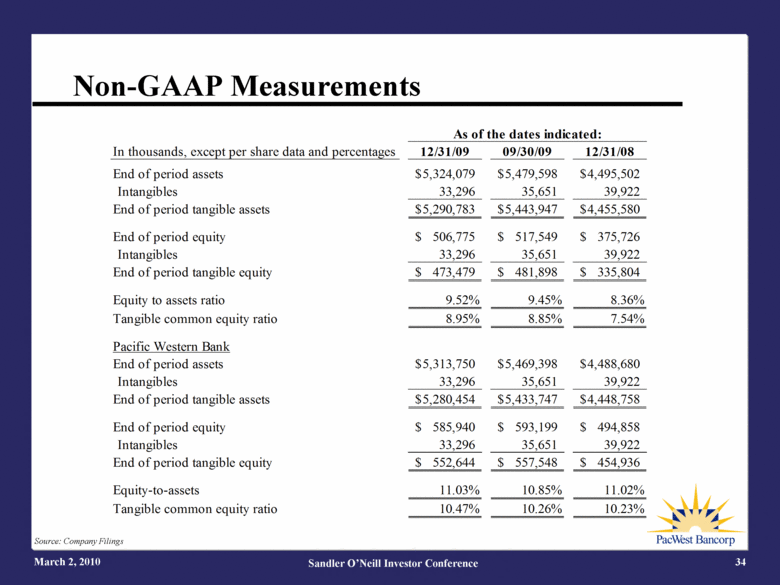
Non-GAAP Measurements March 2, 2010 Sandler O’Neill Investor Conference 34 Source: Company Filings In thousands, except per share data and percentages 12/31/09 09/30/09 12/31/08 End of period assets 5,324,079 $ 5,479,598 $ 4,495,502 $ Intangibles 33,296 35,651 39,922 End of period tangible assets 5,290,783 $ 5,443,947 $ 4,455,580 $ End of period equity 506,775 $ 517,549 $ 375,726 $ Intangibles 33,296 35,651 39,922 End of period tangible equity 473,479 $ 481,898 $ 335,804 $ Equity to assets ratio 9.52% 9.45% 8.36% Tangible common equity ratio 8.95% 8.85% 7.54% Pacific Western Bank End of period assets 5,313,750 $ 5,469,398 $ 4,488,680 $ Intangibles 33,296 35,651 39,922 End of period tangible assets 5,280,454 $ 5,433,747 $ 4,448,758 $ End of period equity 585,940 $ 593,199 $ 494,858 $ Intangibles 33,296 35,651 39,922 End of period tangible equity 552,644 $ 557,548 $ 454,936 $ Equity-to-assets 11.03% 10.85% 11.02% Tangible common equity ratio 10.47% 10.26% 10.23% As of the dates indicated: |
|
|
PacWest Bancorp 10250 Constellation Boulevard Los Angeles, California 90067 Matt Wagner, CEO Vic Santoro, CFO 310.728.1020 310.728.1021 March 2, 2010 Sandler O’Neill Investor Conference 35 |
|
|
March 2, 2010 Sandler O’Neill Investor Conference 36 |