Attached files
| file | filename |
|---|---|
| EX-23.1 - EX-23.1 - MARKWEST ENERGY PARTNERS L P | a2196773zex-23_1.htm |
| EX-31.2 - EX-31.2 - MARKWEST ENERGY PARTNERS L P | a2196773zex-31_2.htm |
| EX-31.1 - EX-31.1 - MARKWEST ENERGY PARTNERS L P | a2196773zex-31_1.htm |
| EX-12.1 - EX-12.1 - MARKWEST ENERGY PARTNERS L P | a2196773zex-12_1.htm |
| EX-21.1 - EX-21.1 - MARKWEST ENERGY PARTNERS L P | a2196773zex-21_1.htm |
| EX-32.1 - EX-32.1 - MARKWEST ENERGY PARTNERS L P | a2196773zex-32_1.htm |
| EX-32.2 - EX-32.2 - MARKWEST ENERGY PARTNERS L P | a2196773zex-32_2.htm |
| EX-10.40 - EX-10.40 - MARKWEST ENERGY PARTNERS L P | a2196773zex-10_40.htm |
| EX-10.41 - EX-10.41 - MARKWEST ENERGY PARTNERS L P | a2196773zex-10_41.htm |
| EX-10.39 - EX-10.39 - MARKWEST ENERGY PARTNERS L P | a2196773zex-10_39.htm |
Use these links to rapidly review the document
Table of Contents
Index to Consolidated Financial Statements
UNITED STATES
SECURITIES AND EXCHANGE COMMISSION
Washington, D.C. 20549
FORM 10-K
ý |
ANNUAL REPORT PURSUANT TO SECTION 13 OR 15(d) OF THE SECURITIES EXCHANGE ACT OF 1934 |
|
For the fiscal year ended December 31, 2009 |
||
or |
||
o |
TRANSITION REPORT PURSUANT TO SECTION 13 OR 15(d) OF THE SECURITIES EXCHANGE ACT OF 1934 |
|
for the transition period from to |
||
Commission File Number 001-31239
MARKWEST ENERGY PARTNERS, L.P.
(Exact name of registrant as specified in its charter)
| Delaware (State or other jurisdiction of incorporation or organization) |
27-0005456 (I.R.S. Employer Identification No.) |
|
1515 Arapahoe Street, Tower 2, Suite 700, Denver, CO 80202-2126 (Address of principal executive offices) |
||
Registrant's telephone number, including area code: 303-925-9200
Securities registered pursuant to Section 12(b) of the Act: Common units representing limited partner interests, New York Stock Exchange
Securities registered pursuant to Section 12(g) of the Act: None
Indicate by check mark whether the registrant is a well-known seasoned issuer, as defined in Rule 405 of the Securities Act. Yes ý No o
Indicate by check mark if the registrant is not required file reports pursuant to Section 13 or Section 15(d) of the Act. Yes o No ý
Indicate by check mark whether the registrant (1) has filed all reports required to be filed by Section 13 or 15(d) of the Securities Exchange Act of 1934 during the preceding 12 months (or for such shorter period that the registrant was required to file such reports), and (2) has been subject to such filing requirements for the past 90 days. Yes ý No o
Indicate by check mark whether the registrant has submitted electronically and posted on its corporate Web site, if any, every Interactive Data File required to be submitted and posted pursuant to Rule 405 of Regulation S-T (§232.405 of this chapter) during the preceding 12 months (or for such shorter period that the registrant was required to submit and post such files). Yes o No o
Indicate by check mark if disclosure of delinquent filers pursuant to Item 405 of Regulation S-K is not contained herein, and will not be contained, to the best of registrant's knowledge, in definitive proxy or information statements incorporated by reference in Part III of this Form 10-K or any amendment to this Form 10-K. ý
Indicate by check mark whether the registrant is a large accelerated filer, an accelerated filer, a non-accelerated filer or a smaller reporting company. See the definitions of "large accelerated filer," "accelerated filer" and "smaller reporting company" in Rule 12b-2 of the Exchange Act.
| Large accelerated filer ý | Accelerated filer o | Non-accelerated filer o (Do not check if a smaller reporting company) |
Smaller reporting company o |
Indicate by check mark whether the registrant is a shell company (as defined in Rule 12b-2 of the Act). Yes o No ý
The aggregate market value of common units held by non-affiliates of the registrant on June 30, 2009 was approximately $944 million. As of February 22, 2010, the number of the registrant's common units were 66,545,872.
DOCUMENTS INCORPORATED BY REFERENCE:
The information required by Part III of this Report, to the extent not set forth herein, is incorporated herein by reference from the registrant's definitive proxy statement relating to the Annual Meeting of Unitholders to be held in 2010, which definitive proxy statement shall be filed with the Securities and Exchange Commission within 120 days after the end of the fiscal year to which this Report relates.
MarkWest Energy Partners, L.P.
Form 10-K
Throughout this document we make statements that are classified as "forward-looking." Please refer to the "Forward-Looking Statements" included later in this section for an explanation of these types of assertions. Also, in this document, unless the context requires otherwise, references to "we," "us," "our," "MarkWest Energy" or the "Partnership" are intended to mean MarkWest Energy Partners, L.P., and its consolidated subsidiaries owned as of December 31, 2009. References to "MarkWest Hydrocarbon" or the "Corporation" are intended to mean MarkWest Hydrocarbon, Inc, a wholly-owned taxable subsidiary of the Partnership.
2
The abbreviations, acronyms and industry technology used in this report are defined as follows.
Bbl |
Barrels of oil | |
Bbl/d |
Barrels of oil per day |
|
Btu |
One British thermal unit, an energy measurement |
|
Dth/d |
Dekatherms per day |
|
EBITDA |
Earnings Before Interest, Taxes, Depreciation and Amortization |
|
FERC |
Federal Energy Regulatory Commission |
|
FASB |
Financial Accounting Standards Board |
|
GAAP |
Accounting principles generally accepted in the United States of America |
|
Gal |
Gallon |
|
Gal/d |
Gallons per day |
|
LIBOR |
London Interbank Offered Rate |
|
Mcf/d |
One thousand cubic feet of natural gas per day |
|
Merger |
On February 21, 2008, the Partnership completed the transactions contemplated by its plan of redemption and merger with MarkWest Hydrocarbon, Inc. and MWEP, L.L.C., a wholly-owned subsidiary of the Partnership. Refer to Note 3 of the accompanying Notes to Consolidated Financial Statements included in Item 8 of this Form 10-K. |
|
MMBtu |
One million British thermal units, an energy measurement |
|
MMBtu/d |
One million British thermal units per day |
|
MMcf/d |
One million cubic feet of natural gas per day |
|
Net operating margin (a non-GAAP financial measure) |
Revenue, excluding any derivative gain (loss), less purchased product costs, excluding any derivative gain (loss) |
|
NGL |
Natural gas liquids, such as ethane, propane, butanes and natural gasoline |
|
N/A |
Not applicable |
|
OTC |
Over-the-Counter |
|
SEC |
Securities and Exchange Commission |
3
Statements included in this Annual Report on Form 10-K that are not historical facts are forward-looking statements. We use words such as "could," "may," "will," "predict," "should," "expect," "hope," "continue," "potential," "plan," "project," "anticipate," "believe," "estimate," "intend" and similar expressions to identify forward-looking statements.
These forward-looking statements are made based upon management's expectations, estimates, assumptions and beliefs concerning future events impacting us and therefore involve a number of risks and uncertainties. We caution that forward-looking statements are not guarantees and that actual results could differ materially from those expressed or implied in the forward-looking statements.
4
General
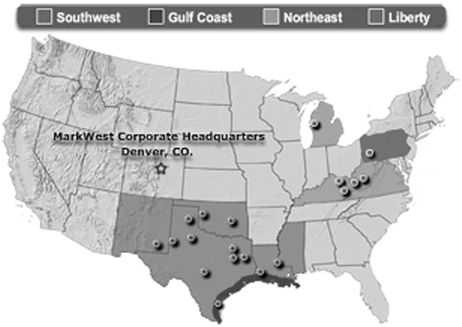
MarkWest Energy Partners, L.P. is a publicly traded Delaware limited partnership formed in January 2002. We are a master limited partnership engaged in the gathering, processing and transportation of natural gas; the transportation, fractionation, storage, and marketing of NGLs; and the gathering and transportation of crude oil. We conduct our operations in four geographical operating segments: Southwest, Northeast, Liberty and Gulf Coast. A map representing the location of the assets that comprise our segments is set forth below. Additional maps detailing the individual assets can be found on our Internet website, www.markwest.com. For more information on these segments, see the Our Operating Segments discussion below.
The following table summarizes the operating performance for each segment for the year ended December 31, 2009 (amounts in thousands). For further discussion of our segments and a reconciliation to our consolidated statement of operations, see Note 26 of the accompanying Notes to Consolidated Financial Statements included in Item 8 of this Form 10-K.
| |
Southwest | Northeast | Liberty | Gulf Coast | Total | ||||||||||||
|---|---|---|---|---|---|---|---|---|---|---|---|---|---|---|---|---|---|
Revenue |
$ | 492,369 | $ | 260,529 | $ | 47,968 | $ | 57,769 | $ | 858,635 | |||||||
Operating expenses: |
|||||||||||||||||
Purchased product costs |
221,021 | 175,326 | 12,479 | — | 408,826 | ||||||||||||
Facility expenses |
73,621 | 20,339 | 16,268 | 16,094 | 126,322 | ||||||||||||
Total operating expenses before items not allocated to segments |
294,642 | 195,665 | 28,747 | 16,094 | 535,148 | ||||||||||||
Portion of operating income attributable to non-controlling interests |
2,613 |
— |
6,637 |
— |
9,250 |
||||||||||||
Operating income before items not allocated to segments |
$ | 195,114 | $ | 64,864 | $ | 12,584 | $ | 41,675 | $ | 314,237 | |||||||
5
Organizational Structure
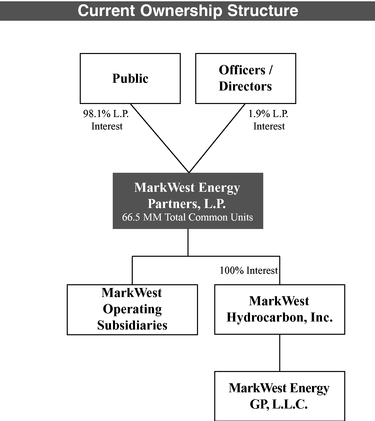
On February 21, 2008, the Partnership and the Corporation completed the Merger by which the Corporation became a wholly owned subsidiary of the Partnership. In connection with the Merger, the 2% economic interest and incentive distribution rights in the Partnership owned by MarkWest Energy GP, L.L.C. (the "General Partner") and the Partnership common units owned by the Corporation were exchanged for Partnership Class A units. In a separate transaction completed simultaneously with the closing of the Merger, the Partnership acquired 100% of the Class B membership interests in the General Partner that had been held by current and former management and certain directors of the Corporation and the General Partner. The organizational structure resulting from this series of transactions is shown in the chart below. Please refer to Note 3 of the accompanying Notes to Consolidated Financial Statements included in Item 8 of this Form 10-K for further details about the Merger.
The Corporation and the General Partner collectively own 22.6 million Class A units of the Partnership that were received in the Merger in exchange for the incentive distribution rights and the 2% economic interest in the Partnership held by the General Partner and common units held by the Corporation prior to the Merger. The following table provides the aggregate number of units and relative ownership interests of the Class A units and common units as of February 22, 2010 as follows (units in millions):
| |
Units | % | |||||
|---|---|---|---|---|---|---|---|
Class A units |
22.6 | 25 | % | ||||
Common units |
66.5 | 75 | % | ||||
Total units |
89.1 | 100 | % | ||||
Class A units represent limited partner interests in the Partnership and have identical rights and obligations of the Partnership common units except that Class A units (i) do not have the right to vote on, approve or disapprove, or otherwise consent to or not consent to any matter (including mergers, share exchanges and similar statutory authorizations) except as otherwise required by any non-waivable provision of law and (ii) do not share in any cash and cash equivalents on hand, income, gains, losses, deductions and credits that are derived from or attributable to the Partnership's ownership of, or sale or disposition of, the shares of MarkWest Hydrocarbon common stock. The transaction structure involving the issuance of the Class A units in exchange for Partnership interests owned by the Corporation and the General Partner was adopted partially for tax purposes. The Class A units held by MarkWest Hydrocarbon and the General Partner are not treated as outstanding common units in the accompanying Consolidated Balance Sheets in accordance with GAAP related to consolidations.
The ownership percentages in the graphic depicted below reflect the Partnership structure from the basis of the consolidated financial statements with the Class A units eliminated.
6
The primary benefit realized from the organizational structure resulting from the Merger is the elimination of the incentive distribution rights which represented the General Partner's right to receive an increasing percentage of quarterly distributions of available cash after a minimum quarterly distribution and certain target distribution levels had been achieved. The elimination of incentive distribution rights substantially lowers our cost of equity capital and increases the cash available to be distributed to our common unitholders. This enhances our ability to compete for new acquisitions and improves the returns to our unitholders on all future expansion projects.
Recent Developments
Liberty Joint Venture
On February 27, 2009, we entered into a joint venture with M&R MWE Liberty LLC ("M&R"), an affiliate of NGP Midstream & Resources, L.P. and its affiliated funds, which is a private equity firm focused on investments in selected areas of the energy infrastructure and natural resources sectors. The joint venture entity MarkWest Liberty Midstream & Resources, L.L.C. ("MarkWest Liberty Midstream") operates in the natural gas midstream business in and around the Marcellus Shale in western Pennsylvania and northern West Virginia. MarkWest Liberty Midstream currently provides gathering and processing services under an agreement with an affiliate of Range Resources Corporation ("Range") and has agreements to begin providing these processing services to several other producers in 2010. MarkWest Liberty Midstream is managed by a Board of Managers, which currently consists of three managers designated by us and three managers designated by M&R. One of our wholly-owned subsidiaries serves as the operator of MarkWest Liberty Midstream and provides field operating and general and administrative services.
Upon closing of the joint venture, we contributed our existing Marcellus Shale natural gas gathering and processing assets to MarkWest Liberty Midstream in exchange for a 60% ownership interest. M&R contributed cash of $50.0 million and agreed to contribute at least an additional $150.0 million during 2009 in exchange for a 40% ownership interest. Effective November 1, 2009, we
7
and M&R executed the second amended and restated joint venture agreement whereby M&R agreed to increase its participation in MarkWest Liberty Midstream by at least an additional $150.0 million. Pursuant to the second amended and restated agreement, we and M&R members will maintain a 60%/40% respective ownership interest in MarkWest Liberty Midstream until January 1, 2011, at which time M&R's ownership interest will increase from 40% to 49%. We and M&R will continue to jointly fund the capital requirements of MarkWest Liberty Midstream at agreed upon levels until our contributed capital is proportionate to our 51% ownership interest (the "Equalization Date"), which is expected to occur on or before December 31, 2012. Following the Equalization Date, M&R will have pre-emptive rights to maintain its ownership interest in MarkWest Liberty Midstream in a range of between 45% and 49%. The joint venture will allow us to achieve our long-term objectives in the Marcellus Shale while significantly reducing capital requirements, which is a critical component of our balance sheet and liquidity objectives. For further discussion, please see Item 7. Management's Discussion and Analysis of Financial Condition and Results of Operations and Note 4 of the accompanying Notes to Consolidated Financial Statements included in Item 8 of this Form 10-K.
Pioneer Joint Venture
MarkWest Pioneer, L.L.C. ("MarkWest Pioneer") is the owner and operator of the Arkoma Connector Pipeline, a 50-mile FERC regulated pipeline that was placed in service in July 2009 and provides approximately 638,000 Dth/d of Woodford Shale takeaway capacity and interconnects with the Midcontinent Express Pipeline and the Gulf Crossing Pipeline.
On May 1, 2009, we entered into a joint venture with Arkoma Pipeline Partners, LLC ("ArcLight"), an affiliate of ArcLight Capital Partners, LLC which is an investment firm focused on opportunities throughout the energy industry. ArcLight acquired a 50% equity interest in MarkWest Pioneer for a total purchase price of $62.5 million. We retained a 50% equity interest and were obligated to fund all capital expenditures necessary to complete construction of the Arkoma Connector Pipeline in excess of $125.0 million (the "Excess Capital Expenditures"). A wholly-owned subsidiary of the Partnership serves as the operator of MarkWest Pioneer and provides field operating and general and administrative services for fixed fees. For further discussion, please see Note 4 of the accompanying Notes to Consolidated Financial Statements included in Item 8 of this Form 10-K.
Sale of Steam Methane Reformer ("SMR Transaction")
On September 1, 2009, we completed the sale of the steam methane reformer ("SMR") currently being constructed at our Javelina gas processing and fractionation facility in Corpus Christi, Texas. Under the terms of the agreement, we received proceeds of $73.1 million and the purchaser will complete the construction of the SMR, which is expected to cost an additional $20 million. We and the purchaser also executed a related hydrogen supply agreement under which we will receive all of the hydrogen produced by the SMR for the next 20 years in exchange for processing fees and the reimbursement of certain other expenses. The processing fee payments will begin when the SMR is capable of commencing operations, which is expected to occur in March 2010. In accordance with generally accepted accounting principles, we are deemed to have continuing involvement with the SMR as a result of certain provisions in the related agreements. Therefore, the SMR Transaction is treated as a financing arrangement, not an asset sale. For further discussion, please see Note 6 of the accompanying Notes to Consolidated Financial Statements included in Item 8 of this Form 10-K.
Sale of Starfish
On December 31, 2009, we sold our 50% equity interest in Starfish Pipeline Company, LLC ("Starfish") to Enbridge Offshore (Gas Transmission), L.L.C. for a base purchase price of approximately $25.0 million, subject to post-closing adjustments for net working capital. For further discussion, please see Note 6 of the accompanying Notes to Consolidated Financial Statements included in Item 8 of this Form 10-K.
8
Business Strategy
Our primary business strategy is to provide top-tier midstream service by developing high-quality, strategically-located assets in the United States. We plan to accomplish this through the following:
- •
- Developing long-term integrated relationships with our producer
customers. As a top-rated midstream service provider, MarkWest has worked to redefine its relationships with its key
producer customers as evidenced by our relationships with the primary producers in the Woodford Shale and the Marcellus Shale. We will continue to develop relationships that are characterized by joint
planning for the development of the emerging resource plays and our commitment to grow to meet the specific needs of our customers.
- •
- Expanding operations through organic growth projects. By
expanding our existing infrastructure and customer relationships, we intend to continue growing in our primary areas of operation to meet the anticipated demand for additional midstream services.
During 2009, we spent approximately $486.6 million of total capital to develop midstream infrastructure in the Marcellus Shale through MarkWest Liberty Midstream and to expand several of our
gathering and processing operations in our Southwest segment including the expansion of our Woodford gathering system in the Arkoma Basin, the construction of the Arkoma Connector Pipeline in
southeastern Oklahoma, and expansions of processing facilities in East Texas and in western Oklahoma, including our operations at Stiles Ranch. Other projects included completion of the expansion of
our processing and fractionation facilities in the Northeast segment.
- •
- Maintaining our financial flexibility. During 2009, we
received net proceeds of $178.6 million from the issuance of equity and $113.8 million from the issuance of long-term debt. We also entered into an amendment to our credit
agreement to expand our borrowing capacity under the revolving facility by $85.6 million from $350.0 million to $435.6 million. Our goal is to maintain a capital structure with
approximately equal amounts of debt and equity on a long-term basis. We also consider the use of alternative financing strategies such as entering into joint venture arrangements and the
sale of selected assets that are not a core component of our long-term objectives. We believe our credit facility, our ability to issue additional partnership units and
long-term debt, our strong relationships with our joint venture partners, and the sale of non-strategic assets will provide us with the financial flexibility to facilitate the
execution of our business strategy.
- •
- Reducing the sensitivity of our cash flows to commodity price
fluctuations. We intend to continue to secure long-term, fee-based contracts in order to further reduce our
exposure to short-term changes in commodity prices. We expect that our fee-based contracts will account for approximately 50% our net operating margin by 2012. We also engage
in risk management activities in order to reduce the effect of commodity price volatility related to future sales of natural gas, NGLs and crude oil. We may utilize a combination of fixed-price
forward contracts, fixed-for-floating price swaps, and options available in the over-the-counter market. We monitor these activities through enforcement
of our commodity risk management policy. Please refer to Note 7 of the accompanying Notes to the Consolidated Financial Statements included in Item 8 of this Form 10-K
for further discussion of our policy.
- •
- Increasing utilization of our facilities. We seek to
increase the utilization of our existing facilities by providing additional services to our existing customers, and by establishing relationships with new customers. We also continue to develop
additional capacity at several of our facilities, which enables us to increase throughput with minimal incremental costs.
- •
- Expanding operations through strategic acquisitions. We intend to continue pursuing strategic acquisitions of assets and businesses in our existing areas of operation that leverage our current asset base, personnel and customer relationships. We may also seek to acquire assets in certain regions outside of our current areas of operation. We believe that our capital structure, which no
9
longer includes incentive distribution rights, positions us to compete more effectively for future transactions.
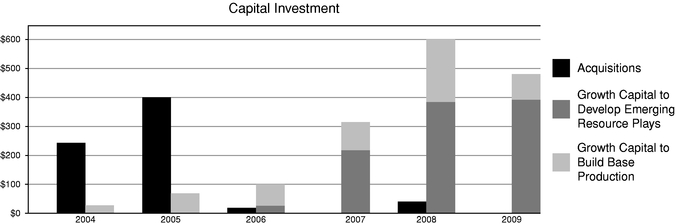
Execution of our business strategy has allowed us to grow substantially since our inception. The majority of our growth since 2007 has focused on the development of natural gas supplies in emerging resource plays. As a result we now have a strong presence in the Woodford Shale, Haynesville Shale, Granite Wash and Marcellus Shale, four emerging resource plays that are expected to be a significant source of domestic natural gas production. The following table summarizes the magnitude of the growth projects and acquisitions that we have completed since 2004 (amounts in millions).
We believe that the following competitive strengths position us to continue to successfully execute our primary business strategy:
- •
- Leading position in the early development of the Marcellus
Shale. As a result of strategic agreements with key producers, we are currently the largest gatherer and processor of natural gas in the
Marcellus Shale. These long-term agreements include significant acreage dedications in the rich-gas areas of the shale. Our gathering systems and processing plants in the
Marcellus are new and highly efficient and we continue to expand these facilities with a strong financial partner under the MarkWest Liberty Midstream joint venture arrangement. Leveraging our current
and planned fractionation capacity, our strategic transportation and storage agreements that provide access to NGL markets, and our extensive marketing experience in the northeast region, we are
positioned to offer fully integrated midstream services for the producers in the Marcellus Shale.
- •
- Strategic and growing position with high-quality assets in the Southwest and the Gulf
Coast. Our acquisitions and internal growth projects have allowed us to establish and expand our presence in several long-lived natural gas supply basins in the
Southwest, particularly in Texas and Oklahoma. In late 2006, we began expanding this strategy through our agreement with Newfield Exploration Mid-Continent Inc. by building the
largest gathering system to date in the Woodford Shale play in Southeast Oklahoma. Our Gulf Coast assets provide high quality service to six strategically located gulf coast refineries that we believe
will continue to play a key role in supporting U.S. demand for refined petroleum products in the long term. All of our major acquisitions in these regions have been characterized by several common
critical success factors that include:
- •
- an existing strong competitive position;
- •
- access to a significant reserve or customer base with a stable or growing production profile;
- •
- ample opportunities for long-term continued organic growth;
- •
- ready access to markets; and
10
- •
- close proximity to other acquisition or expansion opportunities.
- •
- Leading position and continued expansion in the Appalachian
Basin. We are the largest processor of natural gas in Appalachia. We believe our significant presence and asset base provide us with a
competitive advantage in capturing and contracting for new supplies of natural gas. The Appalachian Basin is a large natural gas-producing region characterized by long-lived
reserves with modest decline rates and natural gas with high NGL content. Our concentrated infrastructure, and available land, storage assets and expansion plans in Appalachia should continue to
provide us with a platform for additional cost-effective expansion opportunities. In 2009, we completed the expansion of our Cobb facility and the expansion of our Siloam fractionation
facility.
- •
- Long-term Contracts. We believe our
long-term contracts, which we define as contracts with remaining terms of four years or more, lend greater stability to our cash flow profile. In East Texas, approximately 73% of our
current gathering volumes are under contract for longer than five years as of December 31, 2009. Due to new contracts signed in late 2008 and 2009, approximately 57% of our current daily
throughput in the Western Oklahoma gathering system and Arapaho processing plants are subject to contracts with remaining terms of more than eight years. Approximately 94% of our throughput in the
Woodford gathering system is subject to contracts with remaining terms of more than seven years. Also in the Southwest segment, two of our lateral pipelines operate under fixed-fee
contracts for the transmission of natural gas that expire in approximately 19 and 11 years, respectively. In Appalachia, our natural gas processing and NGL fractionation contracts with
remaining terms of more than five years account for approximately 83% of our volumes. In the Gulf Coast segment, approximately 56% of our volumes are under contract for more than four years. In the
Liberty segment, all of our current gathering and processing agreements with significant dedicated acreage have remaining terms of at least ten years.
- •
- Experienced management with operational, technical and acquisition expertise. Each member of our executive management team has substantial experience in the energy industry. Our facility managers have extensive experience operating our facilities. Our operational and technical expertise has enabled us to upgrade our existing facilities, as well as to design and build new ones. Since our initial public offering in May 2002, our management team has utilized a disciplined approach to analyze and evaluate numerous acquisition opportunities, and has completed eleven acquisitions.
Specifically, our East Texas and Appleby gathering systems are located in the East Texas Basin, producing from both the Cotton Valley and Travis Peak reservoirs as well as the Haynesville Shale. Our Foss Lake gathering system and the associated Arapaho gas processing plants are located in the Anadarko Basin in Oklahoma and are connected to the Granite Wash area in the Texas panhandle. Additionally, as mentioned above, our Woodford gathering system is located in the Woodford Shale reservoir. Our gathering systems are relatively new and provide producers with low-pressure and fuel-efficient service, a significant competitive advantage for us over many competing gathering systems in those areas. We believe this competitive advantage is evidenced by our growing throughput volumes in our East Texas, Appleby, Woodford and Western Oklahoma operations.
11
Industry Overview
We provide services in the midstream sector of the natural gas industry which includes natural gas gathering, transportation, processing and fractionation. The following diagram illustrates the typical natural gas gathering, processing and fractionation process:
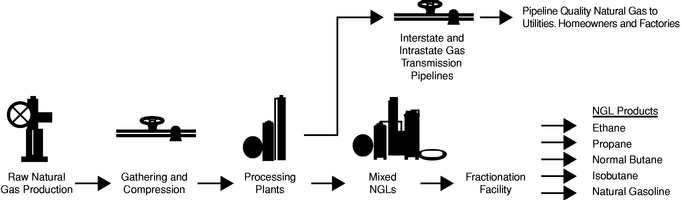
The natural gas gathering process begins with the drilling of wells into gas-bearing rock formations. Once completed, the well is connected to a gathering system. Gathering systems typically consist of a network of small diameter pipelines and, if necessary, compression systems, that collect natural gas from points near producing wells, and transport it to larger pipelines for further transmission.
Historically, the majority of the domestic on-shore natural gas supply has been produced from conventional reservoirs that are characterized by large pockets of natural gas that are accessed successfully using vertical drilling techniques. In the past decade, the supply of natural gas production from the conventional sources has declined as these reservoirs are being depleted. Due to advances in well completion technology and horizontal drilling techniques, unconventional sources such as shale, tight sand and coal bed methane formations, have become the most significant source of current and expected future natural gas production. Due to the ability to economically produce natural gas from these emerging sources, current U.S. natural gas reserves are expected to provide at least 90 years of supply based on projected annual domestic consumption.
Natural gas has a widely varying composition, depending on the field, the formation reservoir or facility from which it is produced. The principal constituents of natural gas are methane and ethane. Most natural gas also contains varying amounts of heavier components, such as propane, butane, natural gasoline and inert substances that may be removed by any number of processing methods.
Most natural gas produced at the wellhead is not suitable for long-haul pipeline transportation or commercial use. It must be gathered, compressed and transported via pipeline to a central facility, and then processed to remove the heavier hydrocarbon components and other constituents or contaminants that may interfere with pipeline transportation or the end-use of the gas. Our business includes providing these services either for a fee or a percentage of the NGLs removed or gas units processed. The industry as a whole is characterized by regional competition, based on the proximity of gathering systems and processing plants to producing natural gas wells, or to facilities that produce natural gas as a byproduct of refining crude oil. Due to the shift in the source of natural gas production, midstream providers with a significant presence in the emerging resource plays will likely have a competitive advantage.
We also provide processing and fractionation services to crude oil refineries in the Corpus Christi, Texas, area through our Javelina Gas Processing and Fractionation facility. While similar to the natural
12
gas industry diagram outlined above, the following diagram illustrates the significant gas processing and fractionation processes at the Javelina facility:
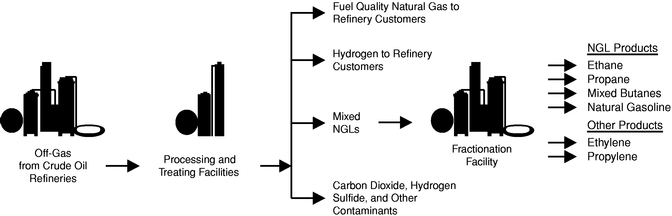
Natural gas processing and treating involves the separation of raw natural gas into pipeline-quality natural gas, principally methane, and NGLs, as well as the removal of contaminants. Raw natural gas from the wellhead is gathered at a processing plant, typically located near the production area, where it is dehydrated and treated, and then processed to recover a mixed NGL stream. In the case of our Javelina facilities, the natural gas delivered to our processing plant is a byproduct of the crude oil refining process.
The removal and separation of individual hydrocarbons and other constituents by processing is possible because of differences in physical properties. Each component has a distinctive weight, boiling point, vapor pressure and other physical characteristics. Natural gas may also be diluted or contaminated by water, sulfur compounds, carbon dioxide, nitrogen, helium or other components. We also produce a high quality hydrogen stream that is delivered back to certain refinery customers.
After being separated from natural gas at the processing plant, the mixed NGL stream is typically transported to a centralized facility for fractionation. Fractionation is the process by which NGLs are further separated into individual, more marketable components, primarily ethane, propane, normal butane, isobutane and natural gasoline. Fractionation systems typically exist either as an integral part of a gas processing plant or as a "central fractionator," often located many miles from the primary production and processing facility. A central fractionator may receive mixed streams of NGLs from many processing plants.
Five basic NGL products and their typical uses are discussed below. The basic products are sold in all of our segments except as noted.
- •
- Ethane is used primarily as feedstock in the production of ethylene, one of the basic building blocks for a wide range of plastics and other chemical products.
- •
- Propane is used for heating, engine and industrial fuels, agricultural
burning and drying, and as a petrochemical feedstock for the production of ethylene and propylene. Propane is principally used as a fuel in our operating areas.
- •
- Normal butane is principally used for gasoline blending, as a fuel gas, either alone or in a mixture with propane, and as a feedstock for the manufacture of ethylene and butadiene, a key ingredient of synthetic rubber.
Ethane is not produced at our Siloam fractionator, as there is little petrochemical demand for ethane in Appalachia. It remains, therefore, in the natural gas stream. Ethane, however, is produced and sold in our East Texas, Gulf Coast and Oklahoma operations.
13
- •
- Isobutane is principally used by refiners to enhance the octane content of
motor gasoline.
- •
- Natural gasoline is principally used as a motor gasoline blend stock or petrochemical feedstock.
Our Operating Segments
We conduct our operations in four geographical operating segments: Southwest, Northeast, Liberty, and Gulf Coast. Our assets and operations in each of these segments are described below.
- •
- East Texas. Our East Texas system consists of natural gas
gathering pipelines, centralized compressor stations, a natural gas processing facility and an NGL pipeline. The East Texas system is located in Panola, Harrison and Rusk Counties and services the
Carthage Field. Producing formations in Panola County consist of the Cotton Valley, Pettit, Travis Peak and Haynesville formations, which collectively form one of the largest natural gas producing
regions in the United States. For natural gas that is processed in this region, we purchase the NGLs from the producers primarily under percent-of-proceeds arrangements, or we
transport volumes for a fee. Approximately 83% of our natural gas volumes in the East Texas System result from contracts with six producers. We sell substantially all of the purchased and retained
NGLs produced at our East Texas processing facility to Targa Resources Partners, L.P. ("Targa") under a long-term contract. Such sales represent approximately 15.7% of our
consolidated revenue in 2009. For the year ended December 31, 2009, the contract contributed 7% to net operating margin (a non-GAAP measure, see Our
Contracts below for discussion and reconciliation of net operating margin). The original term of the Targa agreement expires in December 2015.
- •
- Oklahoma. We own the Foss Lake natural gas gathering system and the Arapaho I and II natural gas processing plants, all located in Roger Mills, Custer and Ellis Counties of western Oklahoma. The gathering portion consists of a pipeline system that is connected to natural gas wells and associated compression facilities. The majority of the gathered gas ultimately is compressed and delivered to the processing plants. We also own and operate a gathering system in the Granite Wash formation in the Texas panhandle that is connected to our Foss Lake processing plants and our Grimes gathering system that is located in Roger Mills and Beckham Counties in western Oklahoma. In addition, we own a natural gas gathering system in the Woodford Shale play in the Arkoma Basin of southeast Oklahoma. Approximately 66% of our Oklahoma volumes result from contracts with three producers. The Oklahoma region has one customer to which we sell NGLs which account for a significant portion of the Southwest segment revenue, but sales to this customer do not account for a significant portion of our consolidated revenue in 2009.
Southwest Segment
- •
- Other Southwest. We own a number of natural gas-gathering systems located in Texas, Louisiana, Mississippi and New Mexico, including the Appleby gathering system in Nacogdoches County, Texas. We gather a significant portion of the gas produced from fields adjacent to our gathering systems, including from wells targeting the Haynesville formation. In many areas, we are the primary gatherer, and in some of the areas served by our smaller systems we are the sole gatherer. In addition, we own four lateral pipelines in Texas and New Mexico. The Other
Through our joint venture MarkWest Pioneer, we operate the Arkoma Connector Pipeline, a 50-mile FERC regulated pipeline that provides approximately 638,000 Dth/d of Woodford Shale takeaway capacity and interconnects with Midcontinent Express Pipeline and Gulf Crossing Pipeline at Bennington, Oklahoma. For a complete discussion of the formation of, and accounting treatment for, MarkWest Pioneer, see Note 4 of the accompanying Notes to Consolidated Financial Statements included in Item 8 of this Form 10-K.
14
- •
- Appalachia. We are the largest processor of natural gas in
the Appalachian Basin, with fully integrated processing, fractionation, storage and marketing operations. The Appalachian Basin is a large natural gas producing region characterized by
long-lived reserves and modest decline rates. Our Appalachian assets include the Kenova, Boldman, Cobb and Kermit natural gas processing plants, an NGL pipeline, the Siloam NGL
fractionation plant and two caverns for storing propane. The Appalachia area has one customer which accounts for a significant portion of the Northeast segment revenue, but this customer does not
account for a significant portion of our consolidated revenue.
- •
- Michigan. We own and operate a FERC regulated crude oil pipeline in Michigan ("Michigan Crude Pipeline") providing transportation service for six shippers. Effective November 1, 2009, the Partnership sold its interest in Basin Pipeline, LLC for nominal consideration.
Southwest area does not have any customers which we consider to be significant to the Southwest segment revenue or our consolidated revenue.
Northeast Segment
- •
- Marcellus Shale. We operate natural gas gathering systems and processing facilities located primarily in western Pennsylvania and northern West Virginia through MarkWest Liberty Midstream. We have a 35 MMcf/d cryogenic plant, and a 120 MMcf/d cryogenic plant at our Houston, Pennsylvania processing complex. We plan to complete the installation of a 120 MMcf/d cryogenic plant at our Majorsville site in the third quarter of 2010. We also plan to complete a 37,000 Bbl/d fractionation facility at our Houston complex in the first half of 2011. We are currently designing additional expansions of our processing capacity and in 2011, we expect to further increase our gas gathering and cryogenic processing capacity in the Marcellus Shale to as much as 475 MMcf/d, all of which we expect to be supported by long-term agreements with our producer customers. We are also constructing a connection to a key interstate NGL pipeline providing a market outlet for the propane produced at our Liberty facilities. For a complete discussion of the formation of, and accounting treatment for, MarkWest Liberty Midstream, see Note 4 of the accompanying Notes to Consolidated Financial Statements included in Item 8 of this Form 10-K.
- •
- Javelina. We own and operate the Javelina Processing Facility, a natural gas processing facility in Corpus Christi, Texas, which treats and processes off-gas from six local refineries operated by three different refinery customers. We have a hydrogen supply agreement creating a long-term contractual obligation for the payment of processing fees in exchange for all of the hydrogen processed by the SMR that is operated by a third party (see Note 6 of the accompanying Notes to Consolidated Financial Statements for further discussion of this agreement and the related SMR Transaction). The hydrogen received under this agreement will be sold to a refinery customer pursuant to a corresponding long-term agreement.
Liberty Segment
Gulf Coast Segment
The following summarizes the percentage of our revenue and net operating margin (a non-GAAP financial measure, see Our Contracts discussion below) generated by our assets, by segment, for the year ended December 31, 2009:
| |
Southwest | Northeast | Liberty | Gulf Coast | Total | |||||||||||
|---|---|---|---|---|---|---|---|---|---|---|---|---|---|---|---|---|
Revenue |
57 | % | 30 | % | 6 | % | 7 | % | 100 | % | ||||||
Net operating margin |
60 | % | 19 | % | 8 | % | 13 | % | 100 | % | ||||||
15
For further financial information regarding our segments, see Item 7. Management's Discussion and Analysis of Financial Condition and Results of Operations and Item 8. Financial Statements and Supplementary Data included in this Form 10-K.
We own a 40% non-operating membership interest in Centrahoma Processing LLC ("Centrahoma"), a joint venture with Antero Midstream Resources Corporation that is accounted for using the equity method. Centrahoma owns certain processing plants in the Arkoma Basin. We have signed agreements to dedicate our processing rights in certain acreage in the Woodford Shale play to Centrahoma through March 1, 2018. The financial results for Centrahoma are included in Earnings from unconsolidated affiliates and are not included in our segment results.
Our Contracts
We generate the majority of our revenues and net operating margin (a non-GAAP measure, see below for discussion and reconciliation of net operating margin) from natural gas gathering, transportation and processing; NGL transportation, fractionation, marketing and storage; and crude oil gathering and transportation. We enter into a variety of contract types. In many cases, we provide services under contracts that contain a combination of more than one of the arrangements described below. We provide services under the following different types of arrangements:
- •
- Fee-based arrangements: Under
fee-based arrangements, we receive a fee or fees for one or more of the following services: gathering, processing and transmission of natural gas; transportation, fractionation and storage
of NGLs; and gathering and transportation of crude oil. The revenue we earn from these arrangements is generally directly related to the volume of natural gas, NGLs or crude oil that flows through our
systems and facilities and is not directly dependent on commodity prices. If a sustained decline in commodity prices were to result in a decline in volumes, however, our revenues from these
arrangements would be reduced. In certain cases, our arrangements provide for minimum annual payments, fixed demand charges, or fixed returns on gathering system expenditures.
- •
- Percent-of-proceeds
arrangements: Under percent-of-proceeds arrangements, we gather and process natural gas on behalf of producers,
sell the resulting residue gas, condensate and NGLs at market prices and remit to producers an agreed-upon percentage of the proceeds. In other cases, instead of remitting cash payments to
the producer, we deliver an agreed-upon percentage of the residue gas and NGLs to the producer and sell the volumes we keep to third parties at market prices. The percentage of volumes
that we retain can be either fixed or variable. Generally, under these types of arrangements our revenues and gross margins increase as natural gas, condensate and NGL prices increase, and our
revenues and net operating margins decrease as natural gas, condensate and NGL prices decrease.
- •
- Percent-of-index
arrangements: Under percent-of-index arrangements, we purchase natural gas at either (1) a percentage
discount to a specified index price, (2) a specified index price less a fixed amount or (3) a percentage discount to a specified index price less an additional fixed amount. We then
gather and deliver the natural gas to pipelines where we resell the natural gas at the index price, or at a different percentage discount to the index price. With respect to (1) and
(3) above, the net operating margins we realize under the arrangements decrease in periods of low natural gas prices because these net operating margins are based on a percentage of the index
price. Conversely, our net operating margins increase during periods of high natural gas prices.
- •
- Keep-whole arrangements: Under keep-whole arrangements, we gather natural gas from the producer, process the natural gas and sell the resulting condensate and NGLs to third parties at market prices. Because the extraction of the condensate and NGLs from the natural gas during processing reduces the Btu content of the natural gas, we must either purchase natural gas at
16
- •
- Settlement margin: Typically, we are allowed to retain a fixed percentage of the volume gathered to cover the compression fuel charges and deemed-line losses. To the extent that we operate our gathering systems more or less efficiently than specified per contract allowance, we will retain the benefit or loss for our own account.
market prices for return to producers or make cash payment to the producers equal to the energy content of this natural gas. Certain keep-whole arrangements also have provisions that require us to share a percentage of the keep-whole profits with the producers based on the oil to gas ratio or the relative price of NGLs to natural gas. Accordingly, under these arrangements our revenues and net operating margins increase as the price of condensate and NGLs increases relative to the price of natural gas, and decrease as the price of natural gas increases relative to the price of condensate and NGLs.
The terms of our contracts vary based on gas quality conditions, the competitive environment when the contracts are signed and customer requirements. Our contract mix and, accordingly, our exposure to natural gas and NGL prices, may change as a result of changes in producer preferences, our expansion in regions where some types of contracts are more common and other market factors, including current market and financial conditions which have increased the risk of volatility in oil, natural gas and NGL prices. Any change in mix will influence our long-term financial results.
As of December 31, 2009, our primary exposure to keep-whole contracts was limited to our Appalachian, Western Oklahoma (Arapaho), East Texas (Carthage), and Woodford processing agreements.
- •
- Approximately 59% of the NGLs sold from Appalachia relate to keep-whole contracts for the year ended
December 31, 2009.
- •
- At the inlets to the Arapaho plants, natural gas meets the downstream pipeline specification; however, we have the option
of extracting NGLs when the processing margin environment is favorable. All of our gas gathering contacts in Western Oklahoma are keep-whole, but some of the contracts include additional
fees to cover plant operating costs, fuel costs and shrinkage costs in a low-processing margin environment. Our keep-whole contract exposure is further mitigated due to our
ability to operate the Arapaho plants in several recovery modes.
- •
- Approximately 6% of the gas processed in East Texas for producers was processed under keep-whole terms for the
year ended December 31, 2009.
- •
- Approximately 40 MMcf/d of the gas in the Woodford system is rich with NGLs and is processed under keep-whole contracts. Our keep-whole contract exposure is partially mitigated by our ability to operate in several recovery modes.
Our keep-whole exposure in all areas was partially offset by the settlement margin related to certain gathering and compression arrangements. The excess natural gas retained under these arrangements reduced the amount of replacement natural gas purchases required to keep our producers whole on an MMBtu basis, thereby creating a partial natural hedge. We also have an active commodity risk management program in place to reduce the impacts of changing NGL and natural gas prices and our keep-whole exposure.
Management evaluates contract performance on the basis of net operating margin (a non-GAAP financial measure), which is defined as revenue, excluding any derivative gain (loss), less purchased product costs, excluding any derivative gain (loss). These charges have been excluded for the purpose of enhancing the understanding by both management and investors of the underlying baseline operating performance of our contractual arrangements, which management uses to evaluate our financial performance for purposes of planning and forecasting. Net operating margin does not have any standardized definition and therefore is unlikely to be comparable to similar measures presented by
17
other reporting companies. Net operating margin results should not be evaluated in isolation of, or as a substitute for, our financial results prepared in accordance with GAAP. Our use of net operating margin and the underlying methodology in excluding certain charges is not necessarily an indication of the results of operations expected in the future, or that we will not, in fact, incur such charges in future periods.
The following is a reconciliation to income from operations, the most comparable GAAP financial measure of this non-GAAP financial measure (in thousands):
| |
Year ended December 31, | ||||||||||
|---|---|---|---|---|---|---|---|---|---|---|---|
| |
2009 | 2008 | 2007 | ||||||||
Revenue |
$ | 858,635 | $ | 1,060,662 | $ | 845,727 | |||||
Purchased product costs |
408,826 | 615,902 | 487,892 | ||||||||
Net operating margin |
449,809 | 444,760 | 357,835 | ||||||||
Facility expenses |
126,977 | 103,682 | 70,863 | ||||||||
Total derivative loss (gain) |
188,862 | (254,813 | ) | 175,148 | |||||||
Selling, general and administrative expenses |
63,728 | 68,975 | 72,484 | ||||||||
Depreciation |
95,537 | 67,480 | 41,281 | ||||||||
Amortization of intangible assets |
40,831 | 38,483 | 16,672 | ||||||||
Loss on disposal of property, plant and equipment |
1,677 | 178 | 7,743 | ||||||||
Accretion of asset retirement obligations |
198 | 129 | 114 | ||||||||
Impairment of goodwill and long-lived assets |
5,855 | 36,351 | 356 | ||||||||
(Loss) income from operations |
$ | (73,856 | ) | $ | 384,295 | $ | (26,826 | ) | |||
The following table is prepared as if we did not have an active commodity risk management program in place. For further discussion of how we have reduced the downside volatility to the portion of our net operating margin that is not fee-based, see Note 7 of the accompanying Notes to the Consolidated Financial Statements included in Item 8 of this Form 10-K. For the year ended December 31, 2009, we calculated the following approximate percentages of our revenue and net operating margin from the following types of contracts:
| |
Fee-Based | Percent-of-Proceeds(1) | Percent-of-Index(2) | Keep-Whole(3) | Total | |||||||||||
|---|---|---|---|---|---|---|---|---|---|---|---|---|---|---|---|---|
Revenue |
20 | % | 38 | % | 6 | % | 36 | % | 100 | % | ||||||
Net operating margin |
39 | % | 26 | % | 4 | % | 31 | % | 100 | % | ||||||
- (1)
- Includes
condensate sales and other types of arrangements tied to NGL prices.
- (2)
- Includes
arrangements tied to natural gas prices.
- (3)
- Includes condensate sales and other types of arrangements tied to both NGL and natural gas prices.
While the percentages in the table above accurately reflect the percentages by contract type, we manage our business by taking into account the partial offset of short natural gas positions by long positions primarily in our Southwest segment, required levels of operational flexibility and the fact that our hedge plan is implemented on this basis. When the partial offset of our natural gas positions is considered, the calculated percentages for the net operating margin in the table above for percent-of-proceeds, percent-of-index and keep-whole contracts change to 43%, 0% and 18%, respectively.
18
Competition
In each of our operating segments, we face competition for natural gas and crude oil transportation and in obtaining natural gas supplies for our processing and related services operations; in obtaining unprocessed NGLs for fractionation; and in marketing our products and services. Competition for natural gas supplies is based primarily on the location of gas-gathering facilities and gas-processing plants, operating efficiency and reliability, and the ability to obtain a satisfactory price for products recovered. Competitive factors affecting our fractionation services include availability of capacity, proximity to supply and industry marketing centers, and cost efficiency and reliability of service. Competition for customers is based primarily on price, delivery capabilities, flexibility and maintenance of high-quality customer relationships.
Our competitors include:
- •
- other large natural gas gatherers that gather, process and market natural gas and NGLs;
- •
- major integrated oil companies;
- •
- medium and large sized independent exploration and production companies;
- •
- major interstate and intrastate pipelines; and
- •
- a large number of smaller gas gatherers of varying financial resources and experience.
Many of our competitors operate as master limited partnerships and enjoy a cost of capital comparable to and, in some cases, lower than ours. Other competitors, such as major oil and gas and pipeline companies, have capital resources and control supplies of natural gas substantially greater than ours. Smaller local distributors may enjoy a marketing advantage in their immediate service areas.
We believe that our customer focus in all segments, demonstrated by our ability to offer an integrated package of services and our flexibility in considering various types of contractual arrangements allows us to compete more effectively. Additionally, we have critical connections to the key market outlets for NGLs and natural gas in each of our segments. In our Gulf Coast segment, the strategic location of our assets and the long-term nature of our contracts provide a significant competitive advantage. In the Southwest segment our major gathering systems are relatively new and provide producers with low-pressure and fuel-efficient service, which differentiates us from many competing gathering systems in those areas. In the Northeast segment, our operational experience of over 20 years and our existing presence in the Appalachian Basin provide a significant competitive advantage. In the Liberty segment, our early entrance in the Marcellus Shale through our strategic gathering and processing agreements with key producers enhances our competitive position to participate in the further development of the Marcellus Shale.
Seasonality
Our business is affected by seasonal fluctuations in commodity prices. Sales volumes also are affected by various other factors such as fluctuating and seasonal demands for products, changes in transportation and travel patterns and variations in weather patterns from year to year. Our Northeast segment is particularly impacted by seasonality. In the Appalachia area, we store a portion of the propane that is produced in the summer to be sold in the winter months. As a result of our seasonality, we generally expect the sales volumes in our Northeast segment to be higher in the first quarter and fourth quarter.
Regulatory Matters
Our operations are subject to extensive regulations. The failure to comply with applicable laws and regulations can result in substantial penalties. The regulatory burden on our operations increases our
19
cost of doing business and, consequently, affects our profitability. However, we do not believe that we are affected in a significantly different manner by these laws and regulations than are our competitors. Due to the myriad of complex federal, state, provincial and local regulations that may affect us, directly or indirectly, reliance on the following discussion of certain laws and regulations should not be considered an exhaustive review of all regulatory considerations affecting our operations.
Pipeline and Gathering Regulation
FERC Regulated Gas Pipelines. Our natural gas pipeline operations are subject to federal, state and local regulatory authorities. Specifically, our Hobbs, New Mexico natural gas pipeline, our Arkoma Connector natural gas pipeline in Oklahoma, and our Michigan Crude Pipeline and related assets are subject to regulation by FERC. Federal regulation extends to such matters as:
- •
- rate structures;
- •
- return on equity;
- •
- recovery of costs;
- •
- the services that our regulated assets are permitted to perform;
- •
- the acquisition, construction and disposition of assets; and
- •
- to an extent, the level of competition in that regulated industry.
Under the Natural Gas Act ("NGA"), FERC has authority to regulate natural gas companies that provide natural gas pipeline transportation services in interstate commerce. Its authority to regulate those services includes the rates charged for the services, terms and conditions of service, certification and construction of new facilities, the extension or abandonment of services and facilities, the maintenance of accounts and records, the acquisition and disposition of facilities, the initiation and discontinuation of services, and various other matters. Natural gas companies may not charge rates that have been determined not to be just and reasonable by FERC. In addition, FERC prohibits natural gas companies from unduly preferring or unreasonably discriminating against any person with respect to pipeline rates or terms and conditions of service. The rates and terms and conditions for our service will be found in FERC-approved tariffs. Pursuant to FERC's jurisdiction over rates, existing rates may be challenged by complaint and proposed rate increases may be challenged by protest. We cannot assure you that FERC will continue to pursue its approach of procompetitive policies as it considers matters such as pipeline rates and rules and policies that may affect rights of access to natural gas transportation capacity, and transportation facilities. Any successful complaint or protest against our rates, or loss of market-based rate authority by FERC could have an adverse impact on our revenues associated with providing interstate gas transportation services.
Energy Policy Act of 2005. On August 8, 2005, President Bush signed into law the Domenici-Barton Energy Policy Act of 2005 ("2005 EP Act"). Under the 2005 EP Act, FERC may impose civil penalties of up to $1,000,000 per day for each current violation of the NGA or the Natural Gas Policy Act of 1978. The 2005 EP Act also amends the NGA to add an anti-market manipulation provision, which makes it unlawful for any entity to engage in prohibited behavior in contravention of rules and regulations to be prescribed by FERC. FERC issued Order No. 670 to implement the anti-market manipulation provision of 2005 EP Act. This order makes it unlawful for gas pipelines and storage companies that provide interstate services to: (1) in connection with the purchase or sale of natural gas subject to the jurisdiction of FERC, or the purchase or sale of transportation services subject to the jurisdiction of FERC, for any entity, directly or indirectly, to use or employ any device, scheme or artifice to defraud; (2) to make any untrue statement of material fact or omit to make any such statement necessary to make the statements made not misleading; or (3) to engage in any act or practice that operates as a fraud or deceit upon any person. The anti-market manipulation rule and
20
enhanced civil penalty authority reflect an expansion of FERC's enforcement authority. Additional proposals and proceedings that might affect the natural gas industry are pending before Congress, FERC and the courts. We cannot assure you that present policies pursued by FERC and Congress will continue.
Standards of Conduct. On October 16, 2008, FERC issued a Final Rule ("Order 717") revising the FERC Standards of Conduct for natural gas and electric transmission providers by eliminating its earlier concept of Energy Affiliates and corporate separation in favor of an employee functional approach. A transmission provider is prohibited from disclosing to a marketing function employee non-public information about the transmission system or a transmission customer. Order 717 also retains the long-standing no-conduit rule, which prohibits a transmission function provider from disclosing non-public information to marketing function employees by using a third party conduit. Additionally, Order 717 requires that a transmission provider provide annual training on the Standards of Conduct to all transmission function employees, marketing function employees, officers, directors, supervisory employees, and any other employees likely to become privy to transmission function information. This rule became effective November 26, 2008.
FERC issued Order 717-A, an order on rehearing and clarification of Order 717, on October 15, 2009. FERC issued a second rehearing order, Order 717-B, on November 15, 2009. Requests for rehearing of Order 717-B have been filed and are currently pending before FERC. We have no way to predict with certainty whether and to what extent FERC will revise the new standards of conduct in response to those requests for rehearing.
Market Transparency Rulemakings. In 2007, FERC issued a final rule on the annual natural gas transaction reporting requirements, as amended by subsequent orders on rehearing ("Order 704"). The order became effective February 4, 2008. Under Order 704, wholesale buyers and sellers of more than 2.2 million MMBtu of physical natural gas in the previous calendar year, including interstate and intrastate natural gas pipelines, natural gas gatherers, natural gas processors and natural gas marketers, are now required to report, on May 1 of each year, beginning in 2009, aggregate volumes of natural gas purchased or sold at wholesale in the prior calendar year to the extent such transactions utilize, contribute to, or may contribute to the formation of price indices. It is the responsibility of the reporting entity to determine which transactions should be reported based on the guidance of Order 704. Order 704 will require most, if not all of our natural gas pipelines to report annual volumes of relevant transactions to FERC. On November 20, 2008, FERC issued a final rule on daily scheduled flows and capacity posting requirements ("Order 720"). Under Order 720, certain non-interstate pipelines delivering, on an annual basis, more than an average of 50 million MMBtu of gas over the previous three (3) calendar years, are required to post daily certain information regarding the pipeline's capacity and scheduled flows for each receipt and delivery point that has a design capacity equal to or greater than 15,000 MMBtu per day. In response to requests for clarification and rehearing, FERC issued Order 720-A on January 21, 2010, which clarified certain of the rules promulgated under Order 720 and established July 1, 2010 as the deadline for applicable non-interstate pipelines to meet the daily posting requirement. A petition for review of Orders 720 and 720-A has been filed and is currently pending before the Court of Appeals for the Fifth Circuit. In addition, requests for clarification and/or rehearing of Order 720-A are currently pending before FERC. We have no way to predict with certainty whether and to what extent Orders 720 and 720-A may be modified as a result of the petition for review or the requests for clarification and/or rehearing.
FERC Equity Return Allowance. On April 17, 2008, FERC adopted a new policy under Docket No. PL07-2-000 that will allow master limited partnerships to be included in proxy groups for the purpose of determining rates of return for both interstate natural gas and oil pipelines. The policy statement will govern all future gas and oil rate proceedings involving the establishment of a return on equity, as well as those cases that are currently pending before either FERC or an administrative law
21
judge. On May 19, 2008, an application for rehearing was filed by The American Public Gas Association. On June 13, 2008, FERC dismissed the request for rehearing.
Gathering and Intrastate Pipeline Regulation. Section 1(b) of the NGA exempts natural gas gathering facilities from the jurisdiction of FERC. We own a number of facilities that we believe meet the traditional tests FERC has used to establish a pipeline's status as a gatherer not subject to FERC jurisdiction. In the states in which we operate, regulation of gathering facilities and intrastate pipeline facilities generally includes various safety, environmental and, in some circumstances, open access, nondiscriminatory take requirement and complaint- based rate regulation. For example, some of our natural gas gathering facilities are subject to state ratable take and common purchaser statutes. Ratable take statutes generally require gatherers to take, without undue discrimination, natural gas production that may be tendered to the gatherer for handling. Similarly, common purchaser statutes generally require gatherers to purchase gas without undue discrimination as to source of supply or producer. These statutes are designed to prohibit discrimination in favor of one producer over another producer or one source of supply over another source of supply. These statutes have the effect of restricting our right as an owner of gathering facilities to decide with whom we contract to purchase or transport natural gas.
Natural gas gathering may receive greater regulatory scrutiny at both the state and federal levels now that FERC has taken a less stringent approach to regulation of the gathering activities of interstate pipeline transmission companies and a number of such companies have transferred gathering facilities to unregulated affiliates. Our gathering operations could be adversely affected should they be subject in the future to the application of state or federal regulation of rates and services. Our gathering operations also may be or become subject to safety and operational regulations relating to the design, installation, testing, construction, operation, replacement and management of gathering facilities. Additional rules and legislation pertaining to these matters are considered or adopted from time to time. We cannot predict what effect, if any, such changes might have on our operations, but the industry could be required to incur additional capital expenditures and increased costs depending on future legislative and regulatory changes.
Our intrastate gas pipeline facilities are subject to various state laws and regulation that affect the rates we charge and terms of service. Although state regulation is typically less onerous than at FERC, state regulation typically requires pipelines to charge just and reasonable rates and to provide service on a non-discriminatory basis. The rates and service of an intrastate pipeline generally are subject to challenge by complaint.
Our Appalachian pipeline carries NGLs across state lines. We are the only shipper on the pipeline. We neither operate our Appalachian pipeline as a common carrier, nor hold it out for service to the public. Generally, there are currently no third-party shippers on this pipeline and the pipeline is, and will continue to be, operated as a proprietary facility. The likelihood of other entities seeking to utilize our Appalachian pipeline is remote, so it should not be subject to regulation by FERC in the future. We cannot provide assurance, however, that FERC will not at some point assert that such transportation is within its jurisdiction, or that such an assertion would not adversely affect our results of operations. In such a case, we would be required to file a tariff with FERC and provide a cost justification for the transportation charge.
The natural gas pipeline connecting the Stiles Ranch gathering assets to our Arapaho processing plants carries natural gas across state lines. This pipeline is a gathering line that is not subject to FERC jurisdiction. We cannot provide assurance, however, that FERC will not at some point assert that such transportation is within its jurisdiction, or that such an assertion would not adversely affect our results of operations. In such a case, we would be required to file a tariff with FERC and provide a cost justification for the transportation charge.
22
Propane Regulation. National Fire Protection Association Pamphlets No. 54 and No. 58, which establish rules and procedures governing the safe handling of propane, or comparable regulations, have been adopted as the industry standard in all of the states in which we operate. In some states these laws are administered by state agencies, and in others they are administered on a municipal level. With respect to the transportation of propane by truck, we are subject to regulations promulgated under the Federal Motor Carrier Safety Act. These regulations cover the transportation of hazardous materials and are administered by the DOT. We conduct ongoing training programs to help ensure that our operations are in compliance with applicable regulations. We maintain various permits that are necessary to operate our facilities, some of which may be material to our propane operations. We believe that the procedures currently in effect at all of our facilities for the handling, storage and distribution of propane are consistent with industry standards and are in compliance in all material respects with applicable laws and regulations.
Crude Common Carrier Pipeline Operations. Our Michigan Crude Pipeline is a crude oil pipeline that is a common carrier and subject to regulation by FERC under the October 1, 1977 version of the Interstate Commerce Act ("ICA") and the Energy Policy Act of 1992 ("EPAct 1992"). The ICA and its implementing regulations give FERC authority to regulate the rates charged for service on the interstate common carrier liquids pipelines and generally require the rates and practices of interstate liquids pipelines to be just and reasonable and nondiscriminatory. The ICA also requires tariffs to be maintained on file with FERC that set forth the rates it charges for providing transportation services on its interstate common carrier liquids pipelines as well as the rules and regulations governing these services. EPAct 1992 and its implementing regulations allow interstate common carrier oil pipelines to annually index their rates up to a prescribed ceiling level. In addition, FERC retains cost-of-service ratemaking, market-based rates and settlement rates as alternatives to the indexing approach.
With respect to our Michigan Crude Pipeline, on February 24, 2009, we filed to increase rates effective April 1, 2009 to incorporate index increases that were not fully taken over the prior three years because of a previously effective settlement that had since expired. FERC rejected the filing. On May 29, 2009 we filed to increase rates pursuant to FERC's 2009-2010 index adjustment, and those rate increases took effect July 1, 2009.
Environmental Matters
General.
Our processing and fractionation plants, pipelines, and associated facilities are subject to multiple obligations and potential liabilities under a variety of stringent and comprehensive federal, state and local laws and regulations governing discharges of materials into the environment or otherwise relating to environmental protection. Such laws and regulations affect many aspects of our present and future operations, such as requiring the acquisition of permits or other approvals to conduct regulated activities that may impose burdensome conditions or potentially cause delays, restricting the manner in which we handle or dispose of our wastes, limiting or prohibiting activities in sensitive areas such as wetlands, ecologically-sensitive areas, or areas inhabited by endangered species, incurring capital costs to construct, maintain and upgrade equipment and facilities, restricting the locations in which we may construct our compressor stations and other facilities or requiring the relocation of existing stations and facilities, and requiring remedial actions to mitigate pollution caused by our operations or attributable to former operations. Failure to comply with these stringent and comprehensive requirements may expose us to the assessment of administrative, civil and criminal penalties, the imposition of remedial requirements and the issuance of orders enjoining or limiting some or all of our operations.
We believe that our operations and facilities are in substantial compliance with applicable environmental laws and regulations, and that the cost of continued compliance with such laws and regulations will not have a material adverse effect on our results of operations or financial condition.
23
We cannot ensure, however, that existing environmental laws and regulations will not be reinterpreted or revised or that new laws and regulations will not be adopted or become applicable to us. The clear trend in environmental law is to place more restrictions and limitations on activities that may be perceived to affect the environment, and thus there can be no assurance as to the amount or timing of future expenditures for environmental-regulation compliance or remediation, and actual future expenditures may be different from the amounts we currently anticipate. Revised or additional environmental requirements that result in increased compliance costs or additional operating restrictions, particularly if those costs are not fully recoverable from our customers, could have a material adverse effect on our business, financial condition, results of operations and cash flow. We may not be able to recover some or any of these costs from insurance.
Hazardous Substance and Waste.
To a large extent, the environmental laws and regulations affecting our operations relate to the release of hazardous substances or solid wastes into soils, groundwater, and surface water, and include measures to control environmental pollution of the environment. For instance, the Comprehensive Environmental Response, Compensation, and Liability Act, as amended, or CERCLA, also known as the "Superfund" law, and comparable state laws, impose liability without regard to fault or the legality of the original conduct, on certain classes of persons that contributed to a release of "hazardous substance" into the environment. These persons include current and prior owners or operators of a site where a release occurred and companies that transported or disposed or arranged for the transportation or disposal of the hazardous substances found at the site. Under CERCLA, these persons may be subject to strict and, under certain circumstances, joint and several liability for the costs of removing or remediating hazardous substances that have been released into the environment, for restoration costs and damages to natural resources, and for the costs of certain health studies. Additionally, it is not uncommon for neighboring landowners and other third parties to file claims for personal injury and property damage allegedly caused by hazardous substances or other pollutants released into the environment. While we generate materials in the course of our operations that are regulated as hazardous substances under CERCLA or similar state statutes, we do not believe that we have any material liability for cleanup costs under such laws. We also may incur liability under the Resource Conservation and Recovery Act, as amended, or RCRA, and comparable state statutes, which impose requirements relating to the handling and disposal of hazardous wastes and nonhazardous solid wastes. We are not currently required to comply with a substantial portion of the RCRA requirements because our operations generate minimal quantities of hazardous wastes. However, it is possible that some wastes generated by us that are currently classified as nonhazardous may in the future be designated as hazardous wastes, resulting in the wastes being subject to more rigorous and costly disposal requirements.
We currently own or lease, and have in the past owned or leased, properties that have been used over the years for natural gas gathering, processing and transportation, for NGL fractionation, or for the storage, gathering and transportation of crude oil. Although solid waste disposal practices within the NGL industry and other oil and natural gas related industries have improved over the years, a possibility exists that petroleum hydrocarbons and other solid wastes or hazardous wastes may have been disposed of on or under various properties owned or leased by us during the operating history of those facilities. In addition, a number of these properties may have been operated by third parties whose treatment and disposal or release of petroleum hydrocarbons or other wastes was not under our control. These properties and wastes disposed thereon may be subject to CERCLA, RCRA, and analogous state laws. Under these laws, we could be required to remove or remediate previously disposed wastes or property contamination, including groundwater contamination or to perform remedial operations to prevent future contamination. We do not believe that there presently exists significant surface and subsurface contamination of our properties by petroleum hydrocarbons or other solid wastes for which we are currently responsible.
24
Ongoing Remediation and Indemnification from a Third Party.
The previous owner or operator of our Cobb, Boldman, Kenova, Kermit and Majorsville facilities has been, or is currently involved in, investigatory or remedial activities with respect to the real property underlying this facility. These investigatory and remedial obligations arise out of a September 1994 "Administrative Order by Consent for Removal Actions" with EPA Regions II, III, IV, and V; and with respect to the Boldman facility, an "Agreed Order" entered into by the previous owner/operator with the Kentucky Natural Resources and Environmental Protection Cabinet in October 1994. The previous owner/operator has accepted sole liability and responsibility for, and indemnifies us against, any environmental liabilities associated with the EPA Administrative Order, the Kentucky Agreed Order or any other environmental condition related to the real property prior to the effective dates of our lease or purchase of the real property. In addition, the previous owner/operator has agreed to perform all the required response actions at its expense in a manner that minimizes interference with our use of the properties. To date, the previous owner/operator has been performing all actions required under these agreements and, accordingly, we do not believe that the remediation obligation of these properties will have a material adverse impact on our financial condition or results of operations.
Water.
The Federal Water Pollution Control Act of 1972, as amended, also known as the "Clean Water Act," and analogous state laws impose restrictions and controls on the discharge of pollutants into federal and state waters. Such discharges are prohibited, except in accord with the terms of a permit issued by the EPA or the analogous state agency. Spill prevention, control and countermeasure requirements under federal law require appropriate containment berms and similar structures to help prevent the contamination of navigable waters in the event of a hydrocarbon tank spill, rupture or leak. Any unpermitted release of pollutants, including oil, natural gas liquids or condensates, could result in penalties, as well as significant remedial obligations. In June 2009, MarkWest Liberty Midstream agreed to pay civil penalties and administrative oversight costs in an aggregate amount of $0.2 million and to perform certain corrective actions, the cost of which is not expected to have a material impact on our financial condition, liquidity, or results of operations. In addition, the The Clean Water Act and analogous state law may also require individual permits or coverage under general permits for discharges of stormwater from certain types of facilities, but these requirements are subject to several exemptions specifically related to oil and gas operations and facilities. We conduct regular review of the applicable laws and regulations, and maintain discussions with the various state agencies with regard to the application of those laws and regulations to our facilities. We have been in negotiations with the Pennsylvania State enumerated agency regarding the permitting process and categories of applicable permits for stream crossings that may be required for the construction or operation of certain of our facilities in the state. We believe that we are in substantial compliance with the Clean Water Act.
Activities of natural gas exploration and production operators with whom we have a business relationship may include the performance of hydraulic fracturing to enhance the production of natural gas from formations with low permeability, such as shales. Due to concerns raised concerning potential impacts of hydraulic fracturing on groundwater quality, legislative and regulatory efforts at the federal level and in some states have been initiated to render permitting and compliance requirements more stringent for hydraulic fracturing. Such efforts could have an adverse effect on natural gas production activities in shale formations, including the Marcellus Shale, which in turn could have an adverse effect on the gathering, transportation, processing and/or fracturing operations that we render for our exploration and production customers
Air and Greenhouse Gases.
The Clean Air Act, as amended, and comparable state laws restrict the emission of air pollutants from many sources in the U.S., including processing plants and compressor stations, and also impose
25
various monitoring and reporting requirements. These laws and any implementing regulations may require us to obtain pre-approval for the construction or modification of certain projects or facilities expected to produce or significantly increase air emissions, obtain and strictly comply with stringent air permit requirements, or utilize specific equipment or technologies to control emissions, or may be subject to reinterpretation and require the co-location of our facilities for permitting purposes. As the result of changes to the Clean Air Act, we may be required to incur certain capital expenditures for air pollution control equipment in connection with maintaining or obtaining operating permits addressing other air emission-related issues, and we may encounter construction delays in connection with the applying for and receiving required permits. We believe that our operations are in substantial compliance with applicable air permitting and control technology requirements.
Some scientific studies have suggested that anthropogenic emissions of certain gases, commonly referred to as "greenhouse gases" and including carbon dioxide and methane, may be contributing to warming of the Earth's atmosphere. In response to such studies, President Obama has expressed support for legislation to restrict or regulate emissions of greenhouse gases.
As a result of the United States Supreme Court's 2007 decision in Massachusetts, et al. v. EPA, the EPA may regulate greenhouse gas emissions from mobile sources such as cars and trucks. The Court's holding in Massachusetts that greenhouse gases including carbon dioxide fall under the federal Clean Air Act's definition of "air pollutant" may also result in future regulation of carbon dioxide and other greenhouse gas emissions from stationary sources, including natural gas liquids fractionators. In July 2008, EPA released an "Advance Notice of Proposed Rulemaking" regarding possible future regulation of greenhouse gas emissions under the Clean Air Act, in response to the Supreme Court's decision in Massachusetts, and on April 17, 2009, the EPA issued a notice of its proposed finding and determination that emissions of carbon dioxide, methane, and other greenhouse gases presented an endangerment to human health and the environment. This finding and determination was finalized by the EPA on December 7, 2009, which could provide the basis to permit the EPA to begin regulating emissions of greenhouse gases under existing provisions of the federal Clean Air Act.
On June 26, 2009, the U.S. House of Representatives passed the "American Clean Energy and Security Act of 2009", also known as the "Waxman-Markey legislation," which would establish an economy-wide cap-and-trade program to reduce emissions of carbon dioxide and other greenhouse gases in the United States and would require an overall reduction in greenhouse gas emissions of 17% (from 2005 levels) by 2020, and by over 80% by 2050. Covered sources of greenhouse gases would be required to obtain emission allowances based upon their annual emissions of greenhouse gases. The number of emission allowances issued each year would decline to satisfy the overall emission reduction goals, which could cause the cost of the allowances to increase significantly over time. The Senate is also considering legislation to reduce greenhouse gas emissions. Depending on the particular requirements of any cap and trade program that might ultimately be enacted, we could be required to purchase allowances or surrender allowances for the greenhouse gas emissions resulting from our operations or from the combustion of fuels that we process. It is also possible that the requirements of any such cap and trade program could extend to the NGLs that we process or hold in inventory, such that we may be required to purchase or surrender allowances for those NGLs even though we are not the ultimate end user. In addition, more than one-third of the states, either individually or through multi-state regional initiatives, already have begun implementing legal measures to inventory and/or reduce emissions of greenhouse gases, primarily through the planned development of emission inventories or regional greenhouse gas cap and trade programs.
It is not possible at this time to predict the scope of legislation or new regulations that may be adopted to address greenhouse gas emissions or the impact of such legislation or regulations on our business. However, any such new federal, regional or state restrictions on emissions of carbon dioxide or other greenhouse gases that may be imposed in areas in which we conduct business could have an adverse affect on our cost of doing business and on the demand for the natural gas and crude oil we
26
gather as well as the natural gas and natural gas liquids we process, which in turn could adversely affect our cash available for distribution to our unitholders.
Anti-Terrorism Measures.
Our operations and the operations of the natural gas and oil industry in general may be subject to laws and regulations regarding the security of industrial facilities, including natural gas and oil facilities. The Department of Homeland Security Appropriations Act of 2007 required the Department of Homeland Security ("DHS"), to issue regulations establishing risk-based performance standards for the security of chemical and industrial facilities, including oil and gas facilities that are deemed to present "high levels of security risk." The DHS issued an interim final rule, known as the Chemical Facility Anti-Terrorism Standards interim rule, in April 2007 regarding risk-based performance standards to be attained pursuant to the act and on November 20, 2007 further issued an Appendix A to the interim rule that established the chemicals of interest and their respective threshold quantities that will trigger compliance with these interim rules. Covered facilities that are determined by DHS to pose a high level of security risk are required to prepare and submit Security Vulnerability Assessments and Site Security Plans as well as comply with other regulatory requirements, including those regarding inspections, audits, recordkeeping, and protection of chemical-terrorism vulnerability information. In January 2008, we prepared and submitted to the DHS initial screening surveys for facilities operated by us that possess regulated chemicals of interest in excess of the Appendix A threshold levels. During 2008, the DHS requested that we perform a Security Vulnerability Assessment for our Javelina plant. The DHS did not require us to perform any assessments with respect to our other facilities. We completed the assessment for our Javelina plant and submitted the assessment to the DHS for review in December 2008. We are also required to develop a written security plan for our Javelina plant and train our employees accordingly. While we do not currently anticipate incurring significant costs in connection with complying with these requirements, we have not yet received a response from the DHS regarding our assessment. It is possible that additional requirements could be imposed by the DHS in connection with this program, and complying with such requirements could result in additional costs that may be substantial.
Pipeline Safety Regulations
Our pipelines are subject to regulation by the U.S. Department of Transportation ("DOT") under the Natural Gas Pipeline Safety Act of 1986, as amended ("NGPSA"), with respect to natural gas and the Hazardous Pipeline Safety Act of 1979, as amended ("HLPSA"), with respect to crude oil, NGLs and condensates. The NGPSA and HLPSA govern the design, installation, testing, construction, operation, replacement and management of natural gas, oil and NGL pipeline facilities. The NGPSA and HLPSA require any entity that owns or operates pipeline facilities to comply with the regulations implemented under these acts, permit access to and allow copying of records, and to make certain reports and provide information as required by the Secretary of Transportation. We believe that our pipeline operations are in substantial compliance with applicable existing NGPSA and HLPSA requirements; however, due to the possibility of new or amended laws and regulations or reinterpretation of existing laws and regulations, future compliance with the NGPSA and HLPSA could result in increased costs.
Our pipelines are also subject to regulation by the DOT under the Pipeline Safety Improvement Act of 2002, which was amended by the Pipeline Inspection, Protection, Enforcement and Safety Act of 2006. The DOT, through the Pipeline and Hazardous Materials Safety Administration ("PHMSA"), has established a series of rules under 49 C.F.R. Part 192 that require pipeline operators to develop and implement integrity management programs for gas transmission pipelines that, in the event of a failure, could affect high consequence areas. "High consequence areas" are currently defined to include high population areas, areas unusually sensitive to environmental damage and commercially navigable
27
waterways. Similar rules are also in place under 49 C.F.R. Part 195 for operators of hazardous liquid pipelines including lines transporting NGLs and condensates. The DOT also adopted rules in June 2008 pursuant to authorization granted by the Pipeline Inspections, Protection, Enforcement, and Safety Act of 2006 that amends the pipeline safety regulations to extend regulatory coverage to certain rural onshore hazardous liquid gathering lines and low stress pipelines located in specified "unusually sensitive areas," including non-populated areas requiring extra protection because of the presence of sole source drinking water resources, endangered species or other ecological sources. While we believe that our pipeline operations are in substantial compliance with applicable requirements, due to the possibility of new or amended laws and regulations, or reinterpretation of existing laws and regulations, there can be no assurance that future compliance with the requirements will not have a material adverse effect on our results of operations or financial position.
Employee Safety
The workplaces associated with the processing and storage facilities and the pipelines we operate are also subject to oversight pursuant to the federal Occupational Safety and Health Act, as amended, ("OSHA"), as well as comparable state statutes that regulate the protection of the health and safety of workers. In addition, the OSHA hazard-communication standard requires that we maintain information about hazardous materials used or produced in operations, and that this information be provided to employees, state and local government authorities, and citizens. We believe that we have conducted our operations in substantial compliance with OSHA requirements, including general industry standards, record-keeping requirements and monitoring of occupational exposure to regulated substances.
In general, we expect industry and regulatory safety standards to become stricter over time, resulting in increased compliance expenditures. While these expenditures cannot be accurately estimated at this time, we do not expect such expenditures will have a material adverse effect on our results of operations.
Employees
Through our subsidiary MarkWest Hydrocarbon, Inc., we employ approximately 520 individuals to operate our facilities and provide general and administrative services. We have no employees represented by unions and consider our labor relations to be satisfactory at this time.
Available Information
Our principal executive office is located at 1515 Arapahoe Street, Tower 2, Suite 700, Denver, Colorado 80202-2126. Our telephone number is 303-925-9200. Our common units trade on the New York Stock Exchange under the symbol "MWE." You can find more information about us at our Internet website, www.markwest.com. Our annual reports on Form 10-K, our quarterly reports on Form 10-Q, our current reports on Form 8-K and any amendments to those reports are available free of charge through our Internet website as soon as reasonably practicable after we electronically file or furnish such material with the Securities and Exchange Commission. The filings are also available through the SEC at the SEC's Public Reference Room at 100 F Street, N.E., Washington, D.C. 20549 or by calling 1-800-SEC-0330. Also, these filings are available on the Internet website www.sec.gov.
28
In addition to the other information set forth elsewhere in this Form 10-K, you should carefully consider the following factors when evaluating us.
Risks Inherent in Our Business
Our substantial debt and other financial obligations could impair our financial condition, results of operations and cash flows, and our ability to fulfill our debt obligations.
We have substantial indebtedness and other financial obligations. Subject to the restrictions governing our indebtedness and other financial obligations, including the indentures governing our outstanding notes, we may incur significant additional indebtedness and other financial obligations.
Our substantial indebtedness and other financial obligations could have important consequences. For example, they could:
- •
- make it more difficult for us to satisfy our obligations with respect to our existing debt;
- •
- impair our ability to obtain additional financings in the future for working capital, capital expenditures, acquisitions,
or general partnership and other purposes;
- •
- have a material adverse effect on us if we fail to comply with financial and restrictive covenants in our debt agreements,
and an event of default occurs as a result of that failure that is not cured or waived;
- •
- require us to dedicate a substantial portion of our cash flow to payments on our indebtedness and other financial
obligations, thereby reducing the availability of our cash flow to fund working capital, capital expenditures, distributions and other general partnership requirements;
- •
- limit our flexibility in planning for, or reacting to, changes in our business and the industry in which we operate; and
- •
- place us at a competitive disadvantage compared to our competitors that have proportionately less debt.
Furthermore, these consequences could limit our ability, and the ability of our subsidiaries, to obtain future financings, make needed capital expenditures, withstand the prevailing economic uncertainty or any future downturn in our business or the economy in general, conduct operations or otherwise take advantage of business opportunities that may arise. Our existing credit facility contains covenants requiring us to maintain specified financial ratios and satisfy other financial conditions, which may limit our ability to grant liens on our assets, make or own certain investments, enter into any swap contracts other than in the ordinary course of business, merge, consolidate, or sell assets, incur indebtedness senior to the credit facility, make distributions on equity investments, and declare or make, directly or indirectly, any distribution on our common units. Our obligations under the credit facility are secured by substantially all of our assets and guaranteed by all of our wholly-owned subsidiaries, including our operating company (please read Item 7. Management's Discussion and Analysis of Financial Condition and Results of Operations—Liquidity and Capital Resources). We may be unable to meet those ratios and conditions. Any future breach of any of these covenants or our failure to meet any of these ratios or conditions could result in a default under the terms of our credit facility, which could result in acceleration of our debt and other financial obligations. If we were unable to repay those amounts, the lenders could initiate a bankruptcy or liquidation proceeding, or proceed against the collateral.
29
Global economic conditions may have adverse impacts on our business and financial condition.
Changes in economic conditions could adversely affect our financial condition and results of operations. A number of economic factors, including, but not limited to, gross domestic product, consumer interest rates, strength of U.S. currency, consumer confidence and debt levels, retail trends, housing starts, sales of existing homes, the level of mortgage refinancing, inflation and foreign currency exchange rates, may generally affect our business. Recessionary economic cycles, higher unemployment rates, higher fuel and other energy costs, and higher tax rates may adversely affect demand for natural gas, NGLs and crude oil. A decline in economic activity and conditions in the United States and any other markets in which we operate could adversely affect our financial condition and results of operations.
The significant disruption in the global markets and financial systems and the decline in the U.S. economy in 2008, which continued through 2009 and into 2010 has only recently begun to improve, increased both the volatility and the amplitude of the risk associated with the other risk factors identified in this report. In particular, these events impacted our yield and unit price, and substantially increased our cost of capital during 2009. If the prevailing economic uncertainty persists or in the event of renewed turmoil in the financial systems, there could be an incremental tightening in the capital markets. Our ability to access the capital markets may be restricted or be available only on unfavorable terms, which could significantly and adversely impact our ability to execute our long term organic growth projects and meet obligations to our producer customers. Limited access to the capital markets could also adversely impact our ability to otherwise take advantage of business opportunities or react to changing economic and business conditions. Our ability to obtain capital from our Amended Partnership Credit Agreement could be adversely impacted by the failure of one or more of the members of the participating bank group. Although the members of the participating bank group are investment grade, an increased risk does exist. Ultimately we may be required to substantially reduce our future capital expenditures. The prevailing economic uncertainty could also have an impact on our producers, other customers, or counterparties to our commodity hedging arrangements causing them to fail to meet their obligations to us. These factors could have a material adverse effect on our revenues, income from operations, cash flows and our quarterly distribution on the common units. The uncertainty and volatility of the global economy may have further impacts on our business and financial condition that we currently cannot predict or anticipate.
Furthermore, the current conditions of the global financial markets have contributed, and recent declines in commodity prices may have contributed, to a decline in our unit price and corresponding market capitalization in 2009, and could recur in 2010. Continued declines in our market capitalization could result in an additional noncash impairment of our recorded goodwill. Continued declines in commodity prices could have an adverse impact on cash flows from operations that could result in noncash impairments of long-lived assets, as well as other-than-temporary noncash impairments of our equity method investments.
We may not have sufficient cash after the establishment of cash reserves and payment of our expenses to enable us to pay distributions at the current level.
The amount of cash we can distribute on our units depends principally on the amount of cash we generate from our operations, which will fluctuate from quarter to quarter based on, among other things:
- •
- the fees we charge and the margins we realize for our services and sales;
- •
- the prices of, level of production of, and demand for natural gas and NGLs;
- •
- the relative prices of NGLs and crude oil, which impact the effectiveness of our hedging program;
30
- •
- the volumes of natural gas we gather, process and transport;
- •
- the level of our operating costs; and
- •
- prevailing economic conditions.
In addition, the actual amount of cash we will have available for distribution will depend on other factors, some of which are beyond our control, including:
- •
- our debt service requirements;
- •
- fluctuations in our working capital needs;
- •
- our ability to borrow funds and access capital markets;
- •
- restrictions contained in our debt agreements;
- •
- the level of capital expenditures we make, including capital expenditures incurred in connection with our enhancement
projects;
- •
- the cost of acquisitions, if any; and
- •
- the amount of cash reserves established by our general partner.
Unitholders should be aware that the amount of cash we have available for distribution depends primarily on our cash flow and not solely on profitability, which is affected by non-cash items. As a result, we may make cash distributions during periods when we record losses for financial accounting purposes and may not make cash distributions during periods when we record net earnings for financial accounting purposes.
Our profitability and cash flows are affected by the volatility of NGL product and natural gas prices.
We are subject to significant risks associated with frequent and often substantial fluctuations in commodity prices. In the past, the prices of natural gas and NGLs have been volatile, and we expect this volatility to continue. The New York Mercantile Exchange ("NYMEX") daily settlement price of natural gas for the prompt month contract in 2008 ranged from a high of $13.58 per MMBtu to a low of $5.29 per MMBtu. In 2009, the same index ranged from a high of $6.07 per MMBtu to a low of $2.51 per MMBtu. A composite of the weighted monthly average NGLs price at our Appalachian facilities based on our average NGLs composition in 2008 ranged from a high of approximately $2.24 per gallon to a low of approximately $0.55 per gallon. In 2009, the same composite ranged from approximately $1.44 per gallon to approximately $0.68 per gallon. The markets and prices for natural gas and NGLs depend upon factors beyond our control. These factors include demand for oil, natural gas and NGLs, which fluctuate with changes in market and economic conditions and other factors, including:
- •
- the level of domestic oil, natural gas and NGL production;
- •
- demand for natural gas and NGL products in localized markets;
- •
- changes in interstate pipeline gas quality specifications;
- •
- imports of crude oil, natural gas and NGLs;
- •
- seasonality;
- •
- the condition of the U.S. economy;
- •
- political conditions in other oil-producing and natural gas-producing countries; and
- •
- government regulation, legislation and policies.
31
Our net operating margins under various types of commodity-based contracts are directly affected by changes in NGL product prices and natural gas prices, and thus are more sensitive to volatility in commodity prices than our fee-based contracts. Additionally, our purchase and resale of gas in the ordinary course of business exposes us to significant risk of volatility in gas prices due to the potential difference in the time of the purchases and sales, and the potential existence of a difference in the gas price associated with each transaction. Significant declines in commodity prices could have an adverse impact on cash flows from operations that could result in noncash impairments of long-lived assets, as well as other-than-temporary noncash impairments of our equity method investments.
Relative changes in NGL product and natural gas prices may adversely impact our results due to frac spread, natural gas and liquids exposure.
Under our keep-whole arrangements, our principal cost is delivering dry gas of an equivalent Btu content to replace Btus extracted from the gas stream in the form of NGLs, or consumed as fuel during processing. The spread between the NGL product sales price and the purchase price of natural gas with an equivalent Btu content is called the "frac spread." Generally, the frac spread and, consequently, the net operating margins are positive under these contracts. In the event natural gas becomes more expensive on a Btu equivalent basis than NGL products, the cost of keeping the producer "whole" results in operating losses.
Due to timing of gas purchases and liquid sales, direct exposure to changes in market prices of either gas or liquids can be created because there is no longer an offsetting purchase or sale that remains exposed to market pricing. Through our marketing and derivatives activity, direct exposure may occur naturally or we may choose direct price exposure to either gas or liquids when we favor that exposure over frac spread risk. Given that we have derivative positions, adverse movement in prices to the positions we have taken will negatively impact results.
Our commodity derivative activities may reduce our earnings, profitability and cash flows.
Our operations expose us to fluctuations in commodity prices. We utilize derivative financial instruments related to the future price of crude oil, natural gas and certain NGLs with the intent of reducing volatility in our cash flows due to fluctuations in commodity prices.
The extent of our commodity price exposure is related largely to the effectiveness and scope of our derivative activities. We have a policy to enter into derivative transactions related to only a portion of the volume of our expected production or fuel requirements and, as a result, we will continue to have direct commodity price exposure to the unhedged portion. Our actual future production or fuel requirements may be significantly higher or lower than we estimate at the time we enter into derivative transactions for such period. If the actual amount is higher than we estimate, we will have greater commodity price exposure than we intended. If the actual amount is lower than the amount that is subject to our derivative financial instruments, we might be forced to settle all or a portion of our derivative transactions without the benefit of the cash flow from our sale or purchase of the underlying physical commodity, which could result in a substantial diminution of our liquidity. Additionally, because we primarily use derivative financial instruments relating to the future price of crude oil to mitigate our exposure to NGL price risk, the volatility or our future cash flows and net income may increase if there is a change in the pricing relationship between crude oil and NGLs. As a result of these factors, our hedging activities may not be as effective as we intend in reducing the downside volatility of our cash flows, and in certain circumstances may actually increase the volatility of our cash flows. In addition, our hedging activities are subject to the risks that a counterparty may not perform its obligation under the applicable derivative instrument, the terms of the derivative instruments are imperfect, and our hedging policies and procedures are not properly followed. It is possible that the steps we take to monitor our derivative financial instruments may not detect and prevent violations of our risk management policies and procedures, particularly if deception or other intentional misconduct
32
is involved. For further information about our risk management policies and procedures, please read Note 7 of the accompanying Notes to the Consolidated Financial Statements included in Item 8 of this Form 10-K for further discussion of our policy.
We conduct risk management activities but we may not accurately predict future commodity price fluctuations and therefore expose us to financial risks and reduce our opportunity to benefit from price increases.
We evaluate our exposure to commodity price risk from an overall portfolio basis. We have discretion in determining whether and how to manage the commodity price risk associated with our physical and derivative positions.
To the extent that we do not manage the commodity price risk relating to a position that is subject to commodity price risk, and commodity prices move adversely, we could suffer losses. Such losses could be substantial, and could adversely affect our operations and cash flows available for distribution to our unitholders. In addition, managing the commodity risk may actually reduce our opportunity to benefit from increases in the market or spot prices.
The adoption of derivatives legislation by Congress could have an adverse impact on our ability to hedge risks associated with our business.
Congress currently is considering broad financial regulatory reform legislation that among other things would impose comprehensive regulation on the OTC derivatives marketplace and could affect the use of derivatives in hedging transactions. The financial regulatory reform bill adopted by the House of Representatives on December 11, 2009, would subject swap dealers and "major swap participants" to substantial supervision and regulation, including capital standards, margin requirements, business conduct standards, and recordkeeping and reporting requirements. It also would require central clearing for transactions entered into between swap dealers or major swap participants. For these purposes, a major swap participant generally would be someone other than a dealer who maintains a "substantial" net position in outstanding swaps, excluding swaps used for commercial hedging or for reducing or mitigating commercial risk, or whose positions create substantial net counterparty exposure that could have serious adverse effects on the financial stability of the U.S. banking system or financial markets. The House-passed bill also would provide the Commodity Futures Trading Commission ("CFTC") with express authority to impose position limits for OTC derivatives related to energy commodities. Separately, in late January, 2010, the CFTC proposed regulations that would impose speculative position limits for certain futures and option contracts in natural gas, crude oil, heating oil, and gasoline. These proposed regulations would make an exemption available for certain bona fide hedging of commercial risks. Although it is not possible at this time to predict whether or when Congress will act on derivatives legislation or the CFTC will finalize its proposed regulations, any laws or regulations that subject us to additional capital or margin requirements relating to, or to additional restrictions on, our trading and commodity positions could have an adverse effect on our ability to hedge risks associated with our business or on the cost of our hedging activity.
A significant decrease in natural gas production in our areas of operation would reduce our ability to make distributions to our unitholders.
Our gathering systems are connected to natural gas reserves and wells, from which the production will naturally decline over time, which means that our cash flows associated with these wells will also decline over time. To maintain or increase throughput levels on our gathering systems and the utilization rate at our processing plants and our treating and fractionation facilities, we must continually obtain new natural gas supplies. Our ability to obtain additional sources of natural gas depends in part on the level of successful drilling activity near our gathering systems.
33
We have no control over the level of drilling activity in the areas of our operations, the amount of reserves associated with the wells or the rate at which production from a well will decline. In addition, we have no control over producers or their production decisions, which are affected by, among other things, prevailing and projected energy prices, demand for hydrocarbons, the level of reserves, geological considerations, governmental regulations and the availability and cost of capital. The cost of capital in the current market environment may make it more difficult for producers to finance drilling programs around our systems which could lead to decreased volumes. In addition, fluctuations in energy prices can greatly affect production rates and investments by third parties in the development of new oil and natural gas reserves. Drilling activity generally decreases as oil and natural gas prices decrease. During 2009, we saw decreases in the prices of natural gas in connection with the prevailing economic uncertainty, and we cannot predict if these prices will recover or continue to decline in the future. Declines in natural gas prices, if sustained, could lead to a material decrease in such production activity and ultimately to a decrease in exploration activity.
Because of these factors, even if new natural gas reserves are discovered in areas served by our assets, producers may choose not to develop those reserves. If we are not able to obtain new supplies of natural gas to replace the natural decline in volumes from existing wells due to reductions in drilling activity or competition, throughput on our pipelines and the utilization rates of our treating and processing facilities would decline, which could have a material adverse effect on our business, results of operations, financial condition and ability to make cash distributions.
Alternative financing strategies may not be successful.
Periodically, we will consider the use of alternative financing strategies such as joint venture arrangements and the sale of non-strategic assets. Joint venture agreements may not share the risks and rewards of ownership in proportion to the voting interests. Joint venture arrangements may require us to pay certain costs or to make certain capital investments and we may have little control over the amount or the timing of these payments and investments. We may not be able to negotiate terms that adequately reimburse us for our costs to fulfill service obligations for those joint ventures where we are the operator. In addition, our joint venture partners may be unable to meet their economic or other obligations and we may be required to fulfill those obligations alone.
We may periodically sell assets or portions of our business. Separating the existing operations from our assets or operations of which we dispose may result in significant expense and accounting charges, disrupt our business or divert management's time and attention. We may not achieve expected cost savings from these dispositions or the proceeds from sales of assets or portions of our business may be lower than the net book value of the assets sold. We may not be relieved of all of our obligations related to the assets or businesses sold. These factors could have a material adverse effect on our revenues, income from operations, cash flows and our quarterly distribution on our common units.
We depend on third parties for the natural gas and refinery off-gas we process, and the NGLs we fractionate at our facilities, and a reduction in these quantities could reduce our revenues and cash flow.
Although we obtain our supply of natural gas, refinery off-gas and NGLs from numerous third-party producers, a significant portion comes from a limited number of key producers/suppliers who are committed to us under processing contracts. According to these contracts or other supply arrangements, however, the producers are usually under no obligation to deliver a specific quantity of natural gas or NGLs to our facilities. If these key suppliers, or a significant number of other producers, were to decrease the supply of natural gas or NGLs to our systems and facilities for any reason, we could experience difficulty in replacing those lost volumes. Because our operating costs are primarily fixed, a reduction in the volumes of natural gas or NGLs delivered to us would result not only in a reduction of revenues, but also a decline in net income and cash flow.
34
Growing our business by constructing new pipelines and processing and treating facilities subjects us to construction risks and risks that natural gas supplies will not be available upon completion of the facilities.
One of the ways we intend to grow our business is through the construction of additions to our existing gathering systems and construction of new gathering, processing and treating facilities. The construction of gathering, processing and treating facilities requires the expenditure of significant amounts of capital, which may exceed our expectations, and involves numerous regulatory, environmental, political, legal and inflationary uncertainties, which may delay our construction activities. If we undertake these projects, we may not be able to complete them on schedule or at all or at the budgeted cost. Moreover, our revenues may not increase immediately upon the expenditure of funds on a particular project. For instance, if we build a new pipeline, the construction will occur over an extended period of time, and we will not receive any material increases in revenues until after completion of the project, if at all.
Furthermore, we may have only limited natural gas supplies committed to these facilities prior to their construction. Moreover, we may construct facilities to capture anticipated future growth in production in a region in which anticipated production growth does not materialize. We may also rely on estimates of proved reserves in our decision to construct new pipelines and facilities, which may prove to be inaccurate because there are numerous uncertainties inherent in estimating quantities of proved reserves. As a result, new facilities may not be able to attract enough natural gas to achieve our expected investment return, which could adversely affect our operations and cash flows available for distribution to our unitholders.
The fees charged to third parties under our gathering, processing, transmission, transportation, fractionation and storage agreements may not escalate sufficiently to cover increases in costs, or the agreements may not be renewed or may be suspended in some circumstances.
Our costs may increase at a rate greater than the fees we charge to third parties. Furthermore, third parties may not renew their contracts with us. Additionally, some third parties' obligations under their agreements with us may be permanently or temporarily reduced due to certain events, some of which are beyond our control, including force majeure events wherein the supply of either natural gas, NGLs or crude oil are curtailed or cut off. Force majeure events include (but are not limited to): revolutions, wars, acts of enemies, embargoes, import or export restrictions, strikes, lockouts, fires, storms, floods, acts of God, explosions and mechanical or physical failures of equipment affecting our facilities or facilities of third parties. If the escalation of fees is insufficient to cover increased costs, if third parties do not renew or extend their contracts with us or if any third party suspends or terminates its contracts with us, our financial results would suffer.
We are exposed to the credit risks of our key customers, and any material nonpayment or nonperformance by our key customers could reduce our ability to make distributions to our unitholders.
We are subject to risks of loss resulting from nonpayment or nonperformance by our customers. Any material nonpayment or nonperformance by our key customers could reduce our ability to make distributions to our unitholders. The prevailing economic uncertainty may increase this risk. Furthermore, some of our customers may be highly leveraged and subject to their own operating and regulatory risks, which increases the risk that they may default on their obligations to us.
We may not be able to retain existing customers, or acquire new customers, which would reduce our revenues and limit our future profitability.
The renewal or replacement of existing contracts with our customers at rates sufficient to maintain current revenues and cash flows depends on a number of factors beyond our control, including competition from other gatherers, processors, pipelines, fractionators, and the price of, and demand for,
35
natural gas, NGLs and crude oil in the markets we serve. Our competitors include large oil, natural gas, refining and petrochemical companies, some of which have greater financial resources, more numerous or greater capacity pipelines, processing and other facilities, and greater access to natural gas and NGL supplies than we do. Additionally, our customers that gather gas through facilities that are not otherwise dedicated to us may develop their own processing and fractionation facilities in lieu of using our services. Certain of our competitors may also have advantages in competing for acquisitions, or other new business opportunities, because of their financial resources and synergies in operations.
As a consequence of the increase in competition in the industry, and the volatility of natural gas prices, end-users and utilities are reluctant to enter into long-term purchase contracts. Many end-users purchase natural gas from more than one natural gas company and have the ability to change providers at any time. Some of these end-users also have the ability to switch between gas and alternative fuels in response to relative price fluctuations in the market. Because there are numerous companies of greatly varying size and financial capacity that compete with us in the marketing of natural gas, we often compete in the end-user and utilities markets primarily on the basis of price. The inability of our management to renew or replace our current contracts as they expire and to respond appropriately to changing market conditions could affect our profitability. For more information regarding our competition, please read Item 1. Business—Competition of Part I of this report.
Transportation on certain of our pipelines may be subject to federal or state rate and service regulation, and the imposition and/or cost of compliance with such regulation could adversely affect our operations and cash flows available for distribution to out unitholders.
Some of our gas, liquids and crude oil transmission operations are subject to rate and service regulations under FERC or various state regulatory bodies, depending upon jurisdiction. FERC generally regulates the transportation of natural gas and oil in interstate commerce, and FERC's regulatory authority includes: facilities construction, acquisition, extension or abandonment of services or facilities; accounts and records; and depreciation and amortization policies. FERC's action in any of these areas or modifications of its current regulations can adversely impact our ability to compete for business, the costs we incur in our operations, the construction of new facilities or our ability to recover the full cost of operating our pipelines. Intrastate natural gas pipeline operations and transportation on proprietary natural gas or petroleum products pipelines are generally not subject to regulation by FERC, and the Natural Gas Act, which is referred to as "NGA," specifically exempts some gathering systems. Yet such operations may still be subject to regulation by various state agencies. The applicable statutes and regulations generally require that our rates and terms and conditions of service provide no more than a fair return on the aggregate value of the facilities used to render services. We cannot assure unitholders that FERC will not at some point determine that such gathering and transportation services are within its jurisdiction, and regulate such services. FERC rate cases can involve complex and expensive proceedings. For more information regarding regulatory matters that could affect our business, please read Item 1. Business—Regulatory Matters as set forth in this report.
Some of our natural gas transportation operations are subject to FERC's rate-making policies that could have an adverse impact on our ability to establish rates that would allow us to recover the full cost of operating our pipelines including a reasonable return.
Action by FERC on currently pending matters as well as matters arising in the future could adversely affect our ability to establish reasonable rates that cover operating costs and allow for a reasonable return. An adverse determination in any future rate proceeding brought by or against us could have a material adverse effect on our business, financial condition and results of operations.
For example, one such matter relates to FERC's policy regarding allowances for income taxes in determining a regulated entity's cost of service. In May 2005, FERC adopted a policy statement ("Policy Statement"), stating that it would permit entities owning public utility assets, including oil
36
pipelines, to include an income tax allowance in such utilities' cost-of-service rates to reflect actual or potential tax liability attributable to their public utility income, regardless of the form of ownership. Pursuant to the Policy Statement, a tax pass-through entity seeking such an income tax allowance would have to establish that its partners or members have an actual or potential income tax obligation on the entity's public utility income. This tax allowance policy was upheld by the D.C. Circuit in May 2007. Whether a pipeline's owners have actual or potential income tax liability will be reviewed by FERC on a case-by-case basis. How the Policy Statement is applied in practice to pipelines owned by publicly traded partnerships could impose limits on our ability to include a full income tax allowance in cost of service.
If we are unable to obtain new rights-of-way or the cost of renewing existing rights-of-way increases, then we may be unable to fully execute our growth strategy, which may adversely affect our operations and cash flows available for distribution to unitholders.
The construction of additions to our existing gathering assets or in the expansion of Liberty may require us to obtain new rights-of-way prior to constructing new pipelines and other transportation facilities. We may be unable to obtain such rights-of-way to connect new natural gas supplies to our existing gathering lines, to connect our existing facilities to new natural gas or natural gas liquids markets, or capitalize on other attractive expansion opportunities. Additionally, it may become more expensive for us to obtain new rights-of-way or to renew existing rights-of-way. If the cost of obtaining new rights-of-way or renewing existing rights-of-way increases, it may adversely affect our operations and cash flows available for distribution to unitholders.
We are indemnified for liabilities arising from an ongoing remediation of property on which certain of our facilities are located and our results of operation and our ability to make distributions to our unitholders could be adversely affected if the indemnifying party fails to perform its indemnification obligation.
Columbia Gas is the previous or current owner of the property on which our Kenova, Boldman, Cobb, Kermit and Majorsville facilities are located and is the previous operator of our Boldman and Cobb facilities. Columbia Gas has been or is currently involved in investigatory or remedial activities with respect to the real property underlying the Boldman, Cobb and Majorsville facilities pursuant to an "Administrative Order by Consent for Removal Actions" entered into by Columbia Gas and the U.S. Environmental Protection Agency and, in the case of the Boldman facility, an "Agreed Order" with the Kentucky Natural Resources and Environmental Protection Cabinet.
Columbia Gas has agreed to retain sole liability and responsibility for, and to indemnify us against, any environmental liabilities associated with these regulatory orders or the real property underlying these facilities to the extent such liabilities arose prior to the effective date of the agreements pursuant to which such properties were acquired or leased from Columbia Gas. Our results of operation and our ability to make cash distributions to our unitholders could be adversely affected if in the future Columbia Gas fails to perform under the indemnification provisions of which we are the beneficiary.
Our business is subject to federal, state and local laws and regulations with respect to environmental, safety and other regulatory matters, and the violation of, or the cost of compliance with, such laws and regulations could adversely affect our operations and cash flows available for distribution to our unitholders.
Numerous governmental agencies enforce comprehensive and stringent federal, state, regional and local laws and regulations on a wide range of environmental, safety and other regulatory matters. We could be adversely affected by increased costs due to stricter pollution-control requirements or liabilities resulting from non-compliance with operating or other regulatory permits. Strict and, under certain circumstances, joint and several liability may be incurred without regard to fault, or the legality of the original conduct, under certain of the environmental laws for remediation of contaminated areas, including the Comprehensive Environmental Response, Compensation and Liability Act, as amended,
37
the Resource Conservation and Recovery Act, as amended, and analogous state laws. Private parties, including the owners of properties located near our storage, fractionation and processing facilities or through which our pipeline systems pass, also may have the right to pursue legal actions to enforce compliance, as well as seek damages for non-compliance with environmental laws and regulations or for personal injury or property damage. New, more stringent environmental laws, regulations and enforcement policies might adversely influence our products and activities, and existing laws, regulations and policies could be reinterpreted or modified to impose additional requirements or constraints on our operations. Federal, state and local agencies also could impose additional safety requirements, any of which could affect our profitability. Local governments may adopt more stringent zoning ordinances requiring the relocation of our facilities or increasing our costs to construct and operate our facilities. In addition, we face the risk of accidental releases or spills associated with our operations. These could result in material costs and liabilities, including those relating to claims for damages to property, natural resources and persons. Our failure to comply with environmental or safety-related laws and regulations could result in administrative, civil and criminal penalties, the imposition of investigatory and remedial obligations and even injunctions that restrict or prohibit our operations. For more information regarding the environmental, safety and other regulatory matters that could affect our business, please read Item 1. Business—Regulatory Matters, Item 1. Business—Environmental Matters, and Item 1. Business—Pipeline Safety Regulations, each as set forth in this report.
The adoption of legislation by Congress or states, or additional regulations by the EPA, to control and reduce the emissions of greenhouse gases could increase our operating costs and adversely affect the cash flows available for distribution to our unitholders.
Congress is currently considering legislation to reduce the emissions of carbon dioxide and other greenhouse gases in the United States. In June 2009, the U.S. House of Representatives passed such legislation, calling for the establishment of an economy-wide cap-and-trade program to reduce these emissions and requiring covered sources of greenhouse gases to obtain emission allowances based upon their annual emissions of greenhouse gases. Over time the number of the allowances would decline while the cost of such allowances is expected to increase significantly. The Senate is also considering greenhouse gas emission legislation. While the scope and requirements of legislation that might ultimately be enacted is unknown, based upon the legislation that is currently being considered, it is possible that we could be required to purchase allowances or surrender allowances for the greenhouse gas emissions resulting from our operations, from the combustion of fuels that we process, or from the NGLs that we process or hold in inventory even though we are not the ultimate end user of those NGLs. States may also pass legislation to reduce the emission of greenhouse gases, and the EPA may adopt regulations controlling the emission of greenhouse gases under the existing provisions of the Clean Air Act. The imposition of a cap and trade program or other regulations on the emission of greenhouse gases could increase our cost of doing business by increasing our compliance costs, and have an adverse impact on our revenues and cash flow by reducing the demand for the natural gas and crude oil that we gather and the natural gas and NGLs that we process, which in turn could adversely affect our cash available for distribution to our unitholders. For more information regarding greenhouse gas emission and regulation, please read Item 1. Business—Environmental Matters—Air and Greenhouse Gases. Finally, it should be noted that some scientists have concluded that increasing concentrations of greenhouse gases in the Earth's atmosphere may produce climate changes that have significant physical effects, such as increased frequency and severity of storms, droughts, and floods and other climatic events; if any such effects were to occur, they could have an adverse effect on our assets and operations.
38
Federal legislation and state legislative and regulatory initiatives relating to hydraulic fracturing could result in reduced volumes available for us to gather, process and fractionate.
Congress is currently considering two companions bills for the "Fracturing Responsibility and Awareness of Chemicals Act," or "FRAC Act." The bills would repeal an exemption in the federal Safe Drinking Water Act ("SWDA") for the underground injection of hydraulic fracturing fluids near drinking water sources. Hydraulic fracturing is an important and commonly used process for the completion of natural gas, and to a lesser extent, oil wells in shale formations, and involves the pressurized injection of water, sand and chemicals into rock formations to stimulate natural gas production. Sponsors of the FRAC Act have asserted that chemicals used in the fracturing process could adversely affect drinking water supplies. If enacted, the FRAC Act could result in additional regulatory burdens such as permitting, construction, financial assurance, monitoring, recordkeeping, and plugging and abandonment requirements. The FRAC Act also proposes requiring the disclosure of chemical constituents used in the fracturing process to state or federal regulatory authorities, who would then make such information publicly available. The availability of this information could make it easier for third parties opposing the hydraulic fracturing process to initiate legal proceedings based on allegations that specific chemicals used in the fracturing process could adversely affect groundwater. In addition, various state and local governments are considering increased regulatory oversight of hydraulic fracturing through additional permit requirements, operational restrictions, and temporary or permanent bans on hydraulic fracturing in certain environmentally sensitive areas such as watersheds. The adoption of the FRAC Act or any other federal or state laws or regulations imposing reporting obligations on, or otherwise limiting, the hydraulic fracturing process could make it more difficult to complete natural gas wells in shale formations and increase our producers' costs of compliance. This could significantly reduce the volumes that we gather, process and fractionate which could adversely impact our earnings, profitability and cash flows.
The amount of gas we process, gather and transmit, or the crude oil we gather and transport, may be reduced if the pipelines to which we deliver the natural gas or crude oil cannot, or will not, accept the gas or crude oil.
All of the natural gas we process, gather and transmit is delivered into pipelines for further delivery to end-users. If these pipelines cannot, or will not, accept delivery of the gas due to downstream constraints on the pipeline or changes in interstate pipeline gas quality specifications, we will be forced to limit or stop the flow of gas through our pipelines and processing systems. In addition, interruption of pipeline service upstream of our processing facilities would limit or stop flow through our processing facilities. Likewise, if the pipelines into which we deliver crude oil are interrupted, we will be limited in, or prevented from conducting, our crude oil transportation operations. Any number of factors beyond our control could cause such interruptions or constraints on pipeline service, including necessary and scheduled maintenance, or unexpected damage to the pipeline. Because our revenues and net operating margins depend upon (1) the volumes of natural gas we process, gather and transmit, (2) the throughput of NGLs through our transportation, fractionation and storage facilities and (3) the volume of crude oil we gather and transport, any reduction of volumes could adversely affect our operations and cash flows available for distribution to our unitholders.
Interruptions in operations at any of our facilities may adversely affect our operations and cash flows available for distribution to our unitholders.
Our operations depend upon the infrastructure that we have developed, including processing and fractionation plants, storage facilities, and various means of transportation. Any significant interruption at these facilities or pipelines, or our inability to transmit natural gas or NGLs, or to transport crude oil to or from these facilities or pipelines for any reason, would adversely affect our operations and cash flows available for distribution to our unitholders.
39
Operations at our facilities could be partially or completely shut down, temporarily or permanently, as the result of circumstances not within our control, such as:
- •
- unscheduled turnarounds or catastrophic events at our physical plants;
- •
- labor difficulties that result in a work stoppage or slowdown; and
- •
- a disruption in the supply of crude oil to our crude oil pipeline, natural gas to our processing plants or gathering pipelines, or a disruption in the supply of NGLs to our transportation pipeline and fractionation facility.
Due to our lack of asset diversification, adverse developments in our gathering, processing, transportation, transmission, fractionation and storage businesses could reduce our operations and cash flows available for distribution to our unitholders.
We rely exclusively on the revenues generated from our gathering, processing, transportation, transmission, fractionation and storage businesses. An adverse development in one of these businesses would have a significantly greater impact on our operations and cash flows available for distribution to our unitholders than if we maintained more diverse assets.
We may not be able to successfully execute our business plan and may not be able to grow our business, which could adversely affect our operations and cash flows available for distribution to our unitholders.
Our ability to successfully operate our business, generate sufficient cash to pay the quarterly cash distributions to our unitholders, and to allow for growth, is subject to a number of risks and uncertainties. Similarly, we may not be able to successfully expand our business through acquiring or growing our assets, because of various factors, including economic and competitive factors beyond our control. If we are unable to grow our business, or execute on our business plan including increasing or maintaining distributions, the market price of the common units is likely to decline.
We are subject to operating and litigation risks that may not be covered by insurance.
Our industry is subject to numerous operating hazards and risks incidental to processing, transporting, fractionating and storing natural gas and NGLs and to transporting and storing crude oil. These include:
- •
- damage to pipelines, plants, related equipment and surrounding properties caused by floods, hurricanes, and other natural
disasters and acts of terrorism;
- •
- inadvertent damage from construction and farm equipment;
- •
- leakage of crude oil, natural gas, NGLs and other hydrocarbons;
- •
- fires and explosions; and
- •
- other hazards, including those associated with high-sulfur content, or sour gas that could also result in personal injury and loss of life, pollution and suspension of operations.
As a result, we may be a defendant in various legal proceedings and litigation arising from our operations. We may not be able to maintain or obtain insurance of the type and amount we desire at reasonable rates. Market conditions could cause certain insurance premiums and deductibles to become unavailable, or available only for reduced amounts of coverage. For example, insurance carriers now require broad exclusions for losses due to war risk and terrorist acts. If we were to incur a significant liability for which we were not fully insured, it could have a material adverse effect on our operations and cash flows available for distribution to our unitholders.
40
Our business may suffer if any of our key senior executives or other key employees discontinues employment with us or if we are unable to recruit and retain highly skilled staff.
Our future success depends to a large extent on the services of our key employees. Our business depends on our continuing ability to recruit, train and retain highly qualified employees, including accounting, business operations, finance and other key back-office and mid-office personnel. The competition for these employees is intense, and the loss of these employees could harm our business. Our equity based long-term incentive plans are a significant component of our strategy to retain key employees. Further, our ability to successfully integrate acquired companies or handle complexities related to managing joint ventures depends in part on our ability to retain key management and existing employees at the time of the acquisition.
A shortage of skilled labor may make it difficult for us to maintain labor productivity, and competitive costs could adversely affect our operations and cash flows available for distribution to our unitholders.
Our operations require skilled and experienced laborers with proficiency in multiple tasks. In recent years, a shortage of workers trained in various skills associated with the midstream energy business has caused us to conduct certain operations without full staff, which decreases our productivity and increases our costs. This shortage of trained workers is the result of the previous generation's experienced workers reaching the age for retirement, combined with the difficulty of attracting new laborers to the midstream energy industry. Thus, this shortage of skilled labor could continue over an extended period. If the shortage of experienced labor continues or worsens, it could have an adverse impact on our labor productivity and costs and our ability to expand production in the event there is an increase in the demand for our products and services, which could adversely affect our operations and cash flows available for distribution to our unitholders.
If we do not make acquisitions on economically acceptable terms, our future growth may be limited.
Our ability to grow depends in part on our ability to make acquisitions that result in an increase in the cash generated from operations per unit. If we are unable to make these accretive acquisitions because we are (1) unable to identify attractive acquisition candidates or negotiate acceptable purchase contracts with them, (2) unable to obtain financing for these acquisitions on economically acceptable terms, or (3) outbid by competitors, then our future growth and ability to increase distributions will be limited.
If we are unable to timely and successfully integrate our future acquisitions, our future financial performance may suffer, and we may fail to realize all of the anticipated benefits of the transaction.
Our future growth will depend in part on our ability to integrate our future acquisitions. We cannot guarantee that we will successfully integrate any acquisitions into our existing operations, or that we will achieve the desired profitability and anticipated results from such acquisitions. Failure to achieve such planned results could adversely affect our operations and cash flows available for distribution to our unitholders.
The integration of acquisitions with our existing business involves numerous risks, including:
- •
- operating a significantly larger combined organization and integrating additional midstream operations into our existing
operations;
- •
- difficulties in the assimilation of the assets and operations of the acquired businesses, especially if the assets
acquired are in a new business segment or geographical area;
- •
- the loss of customers or key employees from the acquired businesses;
- •
- the diversion of management's attention from other existing business concerns;
41
- •
- the failure to realize expected synergies and cost savings;
- •
- coordinating geographically disparate organizations, systems and facilities;
- •
- integrating personnel from diverse business backgrounds and organizational cultures; and
- •
- consolidating corporate and administrative functions.
Further, unexpected costs and challenges may arise whenever businesses with different operations or management are combined, and we may experience unanticipated delays in realizing the benefits of an acquisition. Following an acquisition, we may discover previously unknown liabilities including those under the same stringent environmental laws and regulations relating to releases of pollutants into the environment and environmental protection as are applicable to our existing plants, pipelines and facilities. If so, our operation of these new assets could cause us to incur increased costs to address these liabilities or to attain or maintain compliance with such requirements. If we consummate any future acquisition, our capitalization and results of operation may change significantly, and unitholders will not have the opportunity to evaluate the economic, financial and other relevant information that we will consider in determining the application of these funds and other resources.
Terrorist attacks aimed at our facilities could adversely affect our business.
Since the September 11, 2001 terrorist attacks, the U.S. government has issued warnings that energy assets, specifically the nation's pipeline infrastructure, may be future targets of terrorist organizations. These developments will subject our operations to increased risks. Any future terrorist attack that may target our facilities, those of our customers and, in some cases, those of other pipelines, could have a material adverse effect on our business.
We have partial ownership interests in a number of joint venture legal entities, including Liberty, Pioneer, Wirth, and Centrahoma, which could adversely affect our ability to control certain decisions of these entities. In addition, we may be unable to control the amount of cash we will receive from the operation of these entities and where we do not have control, we could be required to contribute significant cash to fund our share of their operations, which could adversely affect our ability to distribute cash to our unitholders.
Our inability, or limited ability, to control certain aspects of management of joint venture legal entities that we have a partial ownership interest in may mean that we will not receive the amount of cash we expect to be distributed to us. In addition, for entities where we have a non-controlling ownership interest such as in Centrahoma we will be unable to control ongoing operational decisions, including the incurrence of capital expenditures that we may be required to fund. Specifically,
- •
- We may have limited ability to influence certain management decisions with respect to these entities and their
subsidiaries, including decisions with respect to incurrence of expenses and distributions to us;
- •
- These entities may establish reserves for working capital, capital projects, environmental matters and legal proceedings
which would otherwise reduce cash available for distribution to us;
- •
- These entities may incur additional indebtedness, and principal and interest made on such indebtedness may reduce cash
otherwise available for distribution to us; and
- •
- These entities may require us to make additional capital contributions to fund working capital and capital expenditures, our funding of which could reduce the amount of cash otherwise available for distribution.
All of these things could significantly and adversely impact our ability to distribute cash to our unitholders.
42
Certain changes in accounting and/or financial reporting standards issued by the FASB, the SEC or other standard-setting bodies could have a material adverse impact on our financial position or results of operations.
We are subject to the application of GAAP, which periodically is revised and/or expanded. As such, we periodically are required to adopt new or revised accounting and/or financial reporting standards issued by recognized accounting standard setters or regulators, including the FASB and the SEC. It is possible that future requirements, including the recently proposed implementation of International Financial Reporting Standards ("IFRS"), could change our current application of GAAP, resulting in a material adverse impact on our financial position or results of operations.
The potential requirement to convert our financial statements from being prepared in conformity with GAAP to IFRS may strain our resources and increase our annual expenses.
As a public entity, the SEC may require in the future that we report our financial results under IFRS instead of GAAP. IFRS is a set of accounting principles that has been gaining acceptance on a worldwide basis. These standards are published by the London-based International Accounting Standards Board and are more focused on objectives and principles and less reliant on detailed rules than GAAP. Today, there remain significant and material differences in several key areas between GAAP and IFRS which would affect us. Additionally, GAAP provides specific guidance in classes of accounting transactions for which equivalent guidance in IFRS does not exist. The adoption of IFRS is highly complex and would have an impact on many aspects and operations of us, including but not limited to financial accounting and reporting systems, internal controls, taxes, borrowing covenants and cash management. It is expected that a significant amount of time, internal and external resources and expenses over a multi-year period would be required for this conversion.
Risks Related to Our Partnership Structure
We may issue additional common units without unitholder approval, which would dilute your ownership interests.
The General Partner, without your approval, may cause us to issue additional common units or other equity securities of equal rank with or senior to the common units.
The issuance of additional common units or other equity securities of equal or senior rank will have the following effects:
- •
- the unitholders' proportionate ownership interest will decrease;
- •
- the amount of cash available for distribution on each common unit may decrease;
- •
- the relative voting strength of each previously outstanding common unit may be diminished;
- •
- the market price of the common units may decline; and
- •
- the ratio of taxable income to distributions may increase.
Unitholders have less ability to influence management's decisions than holders of common stock in a corporation.
Unlike the holders of common stock in a corporation, unitholders have more limited voting rights on matters affecting our business, and therefore a more limited ability to influence management's decisions regarding our business. The amended and restated partnership agreement provides that the General Partner may not withdraw and may not be removed at any time for any reason whatsoever. Furthermore, if any person or group other than the General Partner and its affiliates acquires beneficial ownership of 20% or more of any class of units (without the prior approval of the General
43
Partner board), that person or group loses voting rights on all of its units. However, if unitholders are dissatisfied with the performance of our General Partner, they have the right to annually elect its board of directors.
Unitholders may not have limited liability if a court finds that unitholder action constitutes control of our business.
Under Delaware law, unitholders could be held liable for our obligations as a general partner if a court determined that the right or the exercise of the right by unitholders as a group to approve certain transactions or amendments to the agreement of limited partnership, or to take other action under the Partnership Agreement was considered participation in the "control" of our business. Unitholders elect the members of the General Partner board, which may be deemed to be participation in the "control" of our business. This could subject unitholders to liability as a general partner.
In addition, Section 17-607 of the Delaware Revised Uniform Limited Partnership Act provides that, under some circumstances, a unitholder may be liable to us for the amount of a distribution for a period of three years from the date of the distribution.
Tax Risks Related to Owning our Common Units
Our tax treatment depends on our status as a partnership for federal income tax purposes. If the Internal Revenue Service ("IRS") were to treat us as a corporation for federal income tax purposes or we were to become subject to a material amount of entity-level taxation then our cash available for distribution to unitholders could be substantially reduced.
The anticipated after-tax benefit of an investment in the common units depends largely on our being treated as a partnership for federal income tax purposes. We have not requested, and do not plan to request, a ruling from the IRS on this or any other matter affecting us.
Despite the fact that we are a limited partnership under Delaware law, it is possible in certain circumstances for a partnership such as ours to be treated as a corporation for federal income tax purposes. Although we do not believe based on our current operations that we are so treated, a change in our business or a change in current law could cause us to be treated as a corporation for federal income tax purposes or otherwise subject us to taxation as an entity.
If we were treated as a corporation for federal income tax purposes, we would pay federal income tax on our income at the corporate tax rate, which is currently a maximum of 35%, and would likely pay state income tax at varying rates. Distributions to our unitholders would generally be taxed again as corporate distributions, and no income, gains, losses, deductions or credits would flow through to our unitholders. Because a tax would be imposed upon us as a corporation, our cash available for distribution to our unitholders would be substantially reduced. Therefore, our treatment as a corporation would result in a material reduction in the anticipated cash flow and after-tax return to our unitholders, likely causing a substantial reduction in the value of the common units.
Current law may change, causing us to be treated as a corporation for federal income tax purposes or otherwise subjecting us to entity-level taxation. The present federal income tax treatment of publicly traded partnerships, including us, or an investment in our common units may be modified by legislative, judicial, or administrative changes and differing interpretations at any time. Any modification to the federal income tax laws and interpretations thereof may or may not be applied retroactively. For example, members of Congress are considering substantive changes to the existing U.S. tax laws that affect certain publicly traded partnerships. Although the proposed legislation would not affect our tax treatment as a partnership as proposed, we are unable to predict whether any of these changes, or other proposals, will be modified or will ultimately be enacted. Any such changes could negatively impact the value of an investment in our common units.
44
The partnership agreement provides that if a law is enacted or existing law is modified or interpreted in a manner that subjects us to taxation as a corporation or otherwise subjects us to entity-level taxation for federal, state or local income tax purposes, then the minimum quarterly distribution amount and the target distribution amounts will be reduced to reflect the impact of that law on us.
If we were subjected to a material amount of additional entity-level taxation by individual states, it would reduce our cash available for distribution to unitholders.
Changes in current state law may subject us to additional entity-level taxation by individual states. Because of widespread state budget deficits and other reasons, several states are evaluating ways to subject partnerships to entity-level taxation through the imposition of state income, franchise and other forms of taxation. Imposition of any such taxes may substantially reduce the cash available for distribution to our unitholders. For example, the state of Texas and the state of Michigan have both instituted income-based taxes that result in an entity level tax for us. We are required to pay a Texas franchise tax at a maximum effective rate of 1.0% of our gross income apportioned to Texas in the prior year. Additionally, the Michigan Business Tax, which contains two prongs, also imposes a tax on us. The two prongs comprise a tax at the rate of 0.8% of a taxpayer's modified gross receipts and a tax at the rate of 4.95% of the taxpayer's business income. Each of the above mentioned rates also includes a surcharge of 21.99% resulting in overall rates of 0.97% and 6.03%. The imposition of entity level taxes on us by Texas and Michigan and, if applicable, by any other state will reduce the cash available for distribution to our unitholders.
If the IRS contests the federal income tax positions we take, the market for our common units may be adversely impacted and the cost of any IRS contest will reduce our cash available for distribution to our unitholders.
We have not requested a ruling from the IRS with respect to our treatment as a partnership for federal income tax purposes or any other matter affecting us. The IRS may adopt positions that differ from the positions we take. It may be necessary to resort to administrative or court proceedings to sustain some or all of the positions we take. A court may not agree with some or all of the positions we take. Any contest with the IRS may materially and adversely impact the market for our common units and the price at which they trade. In addition, our costs of any contest with the IRS will be borne indirectly by our unitholders and the General Partner because the costs will reduce our cash available for distribution.
A unitholder may be required to pay taxes on his share of our income even if the unitholder does not receive any cash distributions from us.
Because our unitholders will be treated as partners to whom we will allocate taxable income which could be different in amount than the cash we distribute, each unitholder will be required to pay any federal income taxes and, in some cases, state and local income taxes on his share of our taxable income even if the unitholder receives no cash distributions from us. A unitholder may not receive cash distributions from us equal to his share of our taxable income or even equal to the actual tax liability that results from that income.
Tax gain or loss on the disposition of our common units could be more or less than expected.
If a unitholder sells his common units, he will recognize a gain or loss equal to the difference between the amount realized and his tax basis in those common units. Because distributions in excess of the unitholder's allocable share of our net taxable income decrease the unitholder's tax basis in his common units, the amount, if any, of such prior excess distributions with respect to the common units the unitholder sells will, in effect, become taxable income to the unitholder if the unitholder sells such common units at a price greater than his tax basis in those common units, even if the price the
45
unitholder receives is less than his original cost. Furthermore, a substantial portion of the amount realized, whether or not representing gain, may be taxed as ordinary income due to potential recapture items, including depreciation recapture. In addition, because the amount realized includes a unitholder's share of our nonrecourse liabilities, if the unitholder sells his units, the unitholder may incur a tax liability in excess of the amount of cash the unitholder receives from the sale.
Tax-exempt entities and non-U.S. persons face unique tax issues from owning our common units that may result in adverse tax consequences to them.
Investment in our common units by tax-exempt entities, such as employee benefit plans and individual retirement accounts (known as IRAs), and non-U.S. persons raises issues unique to them. For example, virtually all of our income allocated to organizations that are exempt from federal income tax, including IRAs and other retirement plans, will be unrelated business taxable income and could be taxable to them. Distributions to non-U.S. persons will be reduced by withholding taxes at the highest applicable effective tax rate, and non-U.S. persons will be required to file federal tax returns and pay tax on their share of our taxable income. If a unitholder is a tax exempt entity or a non-U.S. person, the unitholder should consult a tax advisor before investing in our common units.
We treat each purchaser of our common units as having the same tax benefits without regard to the actual common units purchased. The IRS may challenge this treatment, which could adversely affect the value of our common units.
Due to a number of factors including our inability to match transferors and transferees of our common units and because of other reasons, we will adopt depreciation and amortization positions that may not conform to all aspects of existing Treasury regulations. A successful IRS challenge to those positions could adversely affect the amount of tax benefits available to our unitholders. It also could affect the timing of these tax benefits or the amount of gain from a unitholder's sale of our common units and could have a negative impact on the value of our common units or result in audit adjustments to a unitholder's tax returns.
We prorate our items of income, gain, loss and deduction between transferors and transferees of our common units each month based upon the ownership of the common units on the first day of each month, instead of on the basis of the date a particular common unit is transferred. The IRS may challenge this treatment, which could change the allocation of items of income, gain, loss and deduction among our unitholders.
We prorate our items of income, gain, loss and deduction between transferors and transferees of our units each month based upon the ownership of the units on the first day of each month, instead of on the basis of the date a particular common unit is transferred. The use of this proration method may not be permitted under existing Treasury Regulations. Recently, however, the Department of the Treasury and the IRS issued proposed Treasury Regulations that provide a safe harbor pursuant to which a publicly traded partnership may use a similar monthly simplifying convention to allocate tax items among transferor and transferee unitholders. Although existing publicly traded partnerships are entitled to rely on these proposed Treasury Regulations, they are not binding on the IRS and are subject to change until final Treasury Regulations are issued.
A unitholder whose common units are loaned to a "short seller" to cover a short sale of common units may be considered as having disposed of those common units. If so, he would no longer be treated for tax purposes as a partner with respect to those common units during the period of the loan and may recognize gain or loss from the disposition.
Because a unitholder whose common units are loaned to a "short seller" to cover a short sale of common units may be considered as having disposed of the loaned units, he may no longer be treated for tax purposes as a partner with respect to those common units during the period of the loan to the
46
short seller and the unitholder may recognize gain or loss from such disposition. Moreover, during the period of the loan to the short seller, any of our income, gain, loss or deduction with respect to those common units may not be reportable by the unitholder and any cash distributions received by the unitholder as to those common units could be fully taxable as ordinary income. Unitholders desiring to assure their status as partners and avoid the risk of gain recognition from a loan to a short seller are urged to modify any applicable brokerage account agreements to prohibit their brokers from borrowing their common units.
We have adopted certain valuation methodologies that may result in a shift of income, gain, loss and deduction between the Class A unitholders and our common unitholders. The IRS may challenge this treatment, which could adversely affect the value of our common units.
When we issue additional common units or engage in certain other transactions, we will determine the fair market value of our assets and allocate any unrealized gain or loss attributable to our assets to the capital accounts of our common unitholders and the Class A unitholders. Our methodology may be viewed as understating the value of our assets. In that case, there may be a shift of income, gain, loss and deduction between certain unitholders, which may have an unfavorable effect. Moreover, under our valuation methods, subsequent purchasers of common units may have a greater portion of their Internal Revenue Code Section 743(b) adjustment allocated to our tangible assets and a lesser portion allocated to our intangible assets. The IRS may challenge our valuation methods, or our allocation of the Section 743(b) adjustment attributable to our tangible and intangible assets, and allocations of income, gain, loss and deduction between our unitholders.
A successful IRS challenge to these methods or allocations could adversely affect the amount of taxable income or loss being allocated to our unitholders. It also could affect the amount of gain from the sale of common units by our unitholders and could have a negative impact on the value of our common units or result in audit adjustments to the tax returns of our unitholders without the benefit of additional deductions.
The sale or exchange of 50% or more of our capital and profits interests during any twelve-month period will result in the termination of our partnership for federal income tax purposes.
We will be considered to have terminated for federal income tax purposes if there is a sale or exchange of 50% or more of the total interests in our capital and profits within a twelve-month period. For purposes of determining whether the 50% threshold has been met, multiple sales of the same interest will be counted only once. Our termination would, among other things, result in the closing of our taxable year for all unitholders, which would result in our filing two tax returns for one fiscal year and may result in a significant deferral of depreciation deductions allowable in computing our taxable income. In the case of a unitholder reporting on a taxable year other than a calendar year, the closing of our taxable year may also result in more than twelve months of our taxable income or loss being includable in his taxable income for the year of termination. Our termination currently would not affect our classification as a partnership for federal income tax purposes, but would result in our being treated as a new partnership for tax purposes. If we were treated as a new partnership, we would be required to make new tax elections and could be subject to penalties if we were unable to determine that a termination occurred.
47
Our unitholders will likely be subject to state and local taxes and return filing requirements in states where the unitholders do not live as a result of investing in common units.
In addition to federal income taxes, our unitholders will likely be subject to other taxes, including foreign, state and local taxes, unincorporated business taxes and estate, inheritance or intangible taxes that are imposed by the various jurisdictions in which we conduct business or own property now or in the future, even if our unitholders do not live in any of those jurisdictions. Our unitholders will likely be required to file foreign, state and local income tax returns and pay state and local income taxes in some or all of these various jurisdictions. Further, our unitholders may be subject to penalties for failure to comply with those requirements. We currently do business or own property in nine states, most of which, other than Texas, impose personal income taxes. Most of these states also impose an income tax on corporations and other entities. As we make acquisitions or expand our business, we may own assets or conduct business in additional states that impose a personal income tax. It is our unitholder's responsibility to file all United States federal, foreign, state and local tax returns.
ITEM 1B. Unresolved Staff Comments
None.
48
The following tables set forth certain information relating to our gas processing facilities, fractionation facility, natural gas gathering systems, NGL pipelines, natural gas pipeline and crude oil pipeline as of and for the year ended December 31, 2009.
Gas Processing Facilities:
| |
|
|
|
Year ended December 31, 2009 | |||||||||||||||
|---|---|---|---|---|---|---|---|---|---|---|---|---|---|---|---|---|---|---|---|
Facility
|
Location | Year of Initial Construction |
Design Throughput Capacity |
Natural Gas Throughput |
Utilization of Design Capacity |
NGL Throughput |
|||||||||||||
| |
|
|
(Mcf/d) |
(Mcf/d) |
|
(Gal/d) |
|||||||||||||
Southwest |
|||||||||||||||||||
East Texas: |
|||||||||||||||||||
East Texas processing plant |
Panola County, TX | 2005 | 280,000 | 246,600 | 88 | % | 673,400 | ||||||||||||
Oklahoma: |
|||||||||||||||||||
Arapaho processing plants |
Custer County, OK | 2000 | 160,000 | 153,200 | 96 | % | 347,600 | ||||||||||||
Northeast |
|||||||||||||||||||
Appalachia: |
|||||||||||||||||||
Kenova processing plant(1) |
Wayne County, WV | 1996 | 160,000 | 126,400 | 79 | % | N/A | ||||||||||||
Boldman processing plant(1) |
Pike County, KY | 1991 | 70,000 | 42,500 | 61 | % | N/A | ||||||||||||
Cobb processing plant |
Kanawha County, WV | 2005 | 65,000 | 25,700 | 40 | % | N/A | ||||||||||||
Kermit processing plant(1)(2) |
Mingo County, WV | 2001 | 32,000 | N/A | N/A | N/A | |||||||||||||
Liberty |
|||||||||||||||||||
Marcellus Shale: |
|||||||||||||||||||
Houston processing plants(3) |
Washington County, PA | 2009 | 155,000 | 53,500 | 35 | % | 94,300 | ||||||||||||
Gulf Coast |
|||||||||||||||||||
Javelina processing plant |
Corpus Christi, TX | 1989 | 142,000 | 120,200 | 85 | % | 976,300 | ||||||||||||
- (1)
- A
portion of the gas processed at the Boldman plant, and all of the gas processed at the Kermit plant, is further processed at the Kenova plant to recover
additional NGLs.
- (2)
- The Kermit processing plant is operated by a third party solely to prevent liquids from condensing in the gathering and transmission pipelines upstream of our Kenova plant. We do not receive Kermit gas volume information but do receive all of the liquids produced at the Kermit facility.
49
- (3)
- The Houston processing plants' volume is the average daily production for the full year of 2009. During December 2009 the processing capacity increased by 55,000 Mcf/d. The net change is a result of the 120,000 Mcf/d Houston II plant being placed in service and the 65,000 Mcf/d leased interim plant going out of service. The calculated utilization is not based on the capacity that existed throughout the year. Utilization as of December 31, 2009 was approximately 56%.
Fractionation Facility:
| |
|
|
|
Year ended December 31, 2009 |
||||||||||||
|---|---|---|---|---|---|---|---|---|---|---|---|---|---|---|---|---|
Facility
|
Location | Year of Initial Construction |
Design Throughput Capacity |
NGL Throughput |
Utilization of Design Capacity |
|||||||||||
| |
|
|
(Gal/d) |
(Gal/d) |
|
|||||||||||
Northeast |
||||||||||||||||
Appalachia: |
||||||||||||||||
Siloam fractionation plant |
South Shore, KY | 1957 | 1,008,000 | 714,600 | 71 | % | ||||||||||
Our Siloam facility has both above ground, pressurized storage facilities, with capacity of three million gallons, and underground storage facilities, with capacity of 11 million gallons. Product can be received by truck, pipeline or rail car and can be transported from the facility by truck, rail car or barge. There are ten automated 24-hour-a-day truck loading and unloading slots, a modern rail loading/unloading rack with 14 unloading slots, and a river barge facility capable of loading barges with a capacity of up to 840,000 gallons. We generate revenue from our underground storage facilities by charging an annual fee.
50
Natural Gas Gathering Systems:
| |
|
|
|
Year ended December 31, 2009 |
||||||||||||
|---|---|---|---|---|---|---|---|---|---|---|---|---|---|---|---|---|
Facility
|
Location | Year of Initial Construction |
Design Throughput Capacity |
Natural Gas Throughput |
Utilization of Design Capacity |
|||||||||||
| |
|
|
(Mcf/d) |
(Mcf/d) |
|
|||||||||||
Southwest |
||||||||||||||||
East Texas: |
||||||||||||||||
East Texas gathering system |
Panola County, TX | 1990 | 500,000 | 454,400 | 91 | % | ||||||||||
Oklahoma: |
||||||||||||||||
Foss Lake gathering system |
Roger Mills, Ellis and Custer Counties, OK | 1998 | 130,000 | 86,600 | 67 | % | ||||||||||
Stiles Ranch gathering system |
Wheeler County, TX | 2008 | 250,000 | 89,300 | 36 | % | ||||||||||
Grimes gathering system |
Beckham and Roger Mills Counties, OK | 2005 | 25,000 | 9,700 | 39 | % | ||||||||||
Southeast Oklahoma gathering system |
Hughes, Pittsburg and Coal Counties, OK | 2006 | 500,000 | 416,800 | 83 | % | ||||||||||
Other Southwest: |
||||||||||||||||
Appleby gathering system |
Nacogdoches County, TX | 1990 | 85,000 | 47,300 | 56 | % | ||||||||||
Other gathering systems(4) |
Various | Various | 36,500 | 10,300 | 28 | % | ||||||||||
Liberty |
||||||||||||||||
Marcellus Shale: |
||||||||||||||||
Gas gathering system |
Washington County, PA | 2008 | 175,000 | 53,500 | 31 | % | ||||||||||
- (4)
- Excludes lateral pipelines where revenue is not based on throughput.
51
NGL Pipelines:
| |
|
|
|
Year ended December 31, 2009 |
||||||||||||
|---|---|---|---|---|---|---|---|---|---|---|---|---|---|---|---|---|
Pipeline
|
Location | Year of Initial Construction |
Design Throughput Capacity |
NGL Throughput |
Utilization of Design Capacity |
|||||||||||
| |
|
|
(Gal/d) |
(Gal/d) |
|
|||||||||||
Northeast |
||||||||||||||||
Appalachia: |
||||||||||||||||
Ranger to Kenova(5) |
Lincoln County, WV to Wayne County, WV | 1976 | 831,000 | 243,700 | 29 | % | ||||||||||
Kenova to Siloam |
Wayne County, WV to South Shore, KY | 1957 | 831,000 | 267,600 | 32 | % | ||||||||||
Southwest |
||||||||||||||||
East Texas: |
||||||||||||||||
East Texas liquid line |
Panola County, TX | 2005 | 1,050,000 | 673,400 | 64 | % | ||||||||||
- (5)
- NGLs transported through the Ranger to Kenova pipeline are combined with NGLs recovered at the Kenova facility and the combined NGL stream is transported in the Kenova to Siloam pipeline.
Natural Gas Pipeline:
| |
|
|
|
Year ended December 31, 2009 |
||||||||||||
|---|---|---|---|---|---|---|---|---|---|---|---|---|---|---|---|---|
Pipeline
|
Location | Year of Initial Construction |
Design Throughput Capacity |
Natural Gas Throughput |
Utilization of Design Capacity |
|||||||||||
| |
|
|
(Dth/d) |
(Dth/d) |
|
|||||||||||
Southwest |
||||||||||||||||
Oklahoma |
||||||||||||||||
Arkoma Connector Pipeline(6) |
Coal County, OK to Bryan County, OK | 2009 | 638,000 | 286,300 | 45 | % | ||||||||||
- (6)
- The Arkoma Connector Pipeline is FERC regulated and was placed into service in July 2009. The volume reported is the average daily rate for the days of operation.
Crude Oil Pipeline:
| |
|
|
|
Year ended December 31, 2009 |
||||||||||||
|---|---|---|---|---|---|---|---|---|---|---|---|---|---|---|---|---|
Pipeline
|
Location | Year of Initial Construction |
Design Throughput Capacity |
NGL Throughput |
Utilization of Design Capacity |
|||||||||||
| |
|
|
(Bbl/d) |
(Bbl/d) |
|
|||||||||||
Northeast |
||||||||||||||||
Michigan: |
||||||||||||||||
Michigan crude pipeline |
Manistee County, MI to Crawford County, MI | 1973 | 60,000 | 12,300 | 21 | % | ||||||||||
52
Title to Properties
Substantially all of our pipelines are constructed on rights-of-way granted by the owners of record of the property. Lands over which pipeline rights-of-way have been obtained may be subject to prior liens that have not been subordinated to the right-of-way grants. We have obtained, where determined necessary, permits, leases, license agreements and franchise ordinances from public authorities to cross over or under, or to lay facilities in or along water courses, county roads, municipal streets and state highways, as applicable. We also have obtained easements and license agreements from railroad companies to cross over or under railroad properties or rights-of-way. Many of these authorizations and grants are revocable at the election of the grantor. In some cases, property on which our pipelines were built was purchased in fee or held under long-term leases. Our Siloam fractionation plant, Kenova processing plant and Houston processing facilities are on land that we own in fee.
Some of the leases, easements, rights-of-way, permits, licenses and franchise ordinances that were transferred to us required the consent of the then-current landowner to transfer these rights, which in some instances was a governmental entity. We believe that we have obtained sufficient third-party consents, permits and authorizations for the transfer of the assets necessary for us to operate our business. We also believe we have satisfactory title or other right to all of our material land assets. Title to these properties is subject to encumbrances in some cases; however, we believe that none of these burdens will materially detract from the value of these properties or from our interest in these properties, or will materially interfere with their use in the operation of our business.
We have pledged substantially all of our assets and those of our wholly-owned subsidiaries as collateral for borrowings under our new credit agreement entered into on February 20, 2008 ("Partnership Credit Agreement").
We are subject to a variety of risks and disputes, and are a party to various legal proceedings in the normal course of our business. We maintain insurance policies in amounts and with coverage and deductibles as we believe are reasonable and prudent. However, we cannot assure that the insurance companies will promptly honor their policy obligations or that the coverage or levels of insurance will be adequate to protect us from all material expenses related to future claims for property loss or business interruption to us, or for third-party claims of personal and property damage, or that the coverages or levels of insurance we currently have will be available in the future at economical prices. While it is not possible to predict the outcome of the legal actions with certainty, management is of the opinion that appropriate provisions and accruals for potential losses associated with all legal actions have been made in the consolidated financial statements.
In June 2006, the Office of Pipeline Safety ("OPS") issued a Notice of Probable Violation and Proposed Civil Penalty ("NOPV") (CPF No. 2-2006-5001) to both MarkWest Hydrocarbon and Equitable Production Company ("Equitable"). The NOPV is associated with the pipeline leak and an ensuing explosion and fire that occurred on November 8, 2004 in Ivel, Kentucky on an NGL pipeline owned by Equitable and leased and operated by a subsidiary, MarkWest Energy Appalachia, L.L.C. The NOPV sets forth six counts of violations of applicable regulations, and a proposed civil penalty in the aggregate amount of $1.1 million. An administrative hearing on the matter, previously set for the last week of March 2007, was postponed to allow the administrative record to be produced and to allow OPS an opportunity to respond to our and Equitable's motions to dismiss count one of the NOPV, which involves $0.8 million of the $1.1 million proposed penalty. This count arises out of alleged activity in 1982 and 1987, which predates our leasing and operation of the pipeline. We believe we have viable and mitigating defenses to the remaining counts and will vigorously defend all applicable assertions of violations. The administrative hearing request was withdrawn by us and
53
Equitable in October 2009, and the case will proceed to initial resolution on the briefs, exhibits and other documents filed or submitted by the parties in the matter.
MarkWest Javelina Company, L.L.C. is a party to an action styled Esmerejilda G. Valasquez, et al. v. Occidental Chemical Corp., et al., Case No. A-060352-C, 128th Judicial District, Orange County, Texas, original petition filed July 10, 2006; as refiled from previously dismissed petition captioned Jesus Villarreal v. Koch Refining Co. et al., Cause No. 05-01977-F, 214th Judicial Dist. Ct., County of Nueces, Texas, originally filed April 27, 2005), which sets forth claims for wrongful death, personal injury or property damage, and nuisance type claims, allegedly incurred as a result of operations and emissions from MarkWest Javelina's gas processing plant and from various petroleum, petrochemical and metal processing and refining operations located in the area, which were also named as defendants in the action. The action has been and is being vigorously defended, and it appears at this time that this action should not have a material adverse impact on our financial position or results of operations.
On June 26, 2009, MarkWest Liberty Midstream entered into a Consent Order and Agreement with the Commonwealth of Pennsylvania, Department of Environmental Protection relating to alleged violations of Pennsylvania's stormwater and dam safety regulations in connection with the construction of facilities installed or acquired by MarkWest Liberty Midstream. Under the Consent Order and Agreement, MarkWest Liberty Midstream agreed to pay civil penalties and administrative oversight costs in an aggregate amount of $0.2 million and to perform certain corrective actions, the cost of which is not expected to have a material impact on our financial condition, liquidity, or results of operations.
In the ordinary course of business, we are a party to various other legal and regulatory actions. In the opinion of management, none of these actions, either individually or in the aggregate, will have a material adverse effect on our financial condition, liquidity or results of operations.
ITEM 5. Market for Registrant's Common Units, Related Unitholder Matters and Issuer Purchases of Equity Securities
Our common units have been listed on the New York Stock Exchange ("NYSE"), under the symbol "MWE," since May 2, 2007. Our common units had been traded on the American Stock Exchange, under the symbol "MWE," from May 24, 2002 to May 2, 2007. Prior to May 24, 2002, our equity securities were not listed on any exchange, or traded on any public trading market.
The following table sets forth the high and low sales prices of the common units as reported by NYSE, as well as the amount of cash distributions paid per quarter for 2009 and 2008:
| |
Unit Price | |
|
|
||||||||||||
|---|---|---|---|---|---|---|---|---|---|---|---|---|---|---|---|---|
| |
Distributions Per Common Unit |
|
|
|||||||||||||
Quarter Ended
|
High | Low | Record Date | Payment Date | ||||||||||||
December 31, 2009 |
$ | 29.94 | $ | 22.20 | $ | 0.64 | February 5, 2010 | February 12, 2010 | ||||||||
September 30, 2009 |
24.00 | 17.87 | 0.64 | November 2, 2009 | November 13, 2009 | |||||||||||
June 30, 2009 |
20.00 | 11.20 | 0.64 | August 3, 2009 | August 14, 2009 | |||||||||||
March 31, 2009 |
14.30 | 7.30 | 0.64 | May 4, 2009 | May 15, 2009 | |||||||||||
December 31, 2008 |
25.75 | 6.55 | 0.64 | February 6, 2009 | February 13, 2009 | |||||||||||
September 30, 2008 |
36.00 | 21.22 | 0.64 | November 4, 2008 | November 14, 2008 | |||||||||||
June 30, 2008 |
38.50 | 30.70 | 0.63 | August 4, 2008 | August 15, 2008 | |||||||||||
March 31, 2008 |
37.00 | 29.53 | 0.60 | May 5, 2008 | May 15, 2008 | |||||||||||
As of February 22, 2010 there were approximately 160 holders of record of our common units.
54
Distributions of Available Cash
Within 45 days after the end of each quarter, we will distribute all of our "Available Cash" to unitholders of record on the applicable record date. We will make distributions of "Available Cash" to all unitholders (common and Class A), pro rata and we will make distributions of Hydrocarbon Available Cash (as defined in our amended and restated partnership agreement) pro rata to common unitholders. We define "Available Cash" in our amended and restated partnership agreement, and we generally mean, for each fiscal quarter:
- •
- all cash and cash equivalents on hand at the end of the quarter;
- •
- less the amount of cash that the General Partner determines in its reasonable discretion is necessary or appropriate
to:
- •
- provide for the proper conduct of our business;
- •
- comply with applicable law, any of our debt instruments, or other agreements; or
- •
- provide funds for distributions to unitholders for any one or more of the next four quarters;
- •
- plus all cash and cash equivalents on hand on the date of determination of available cash for the quarter resulting from working capital borrowings made after the end of the quarter. Working capital borrowings are generally borrowings that are made under our revolving credit facility and in all cases are used solely for working capital purposes or to pay distributions to partners.
Generally, Hydrocarbon Available Cash is defined as all cash and cash equivalents on hand derived from or attributable to our ownership of, or sale or other disposition of, the shares of common stock of MarkWest Hydrocarbon, Inc.
Our ability to distribute available cash is contractually restricted by the terms of our credit facilities. Our credit facilities contain covenants requiring us to maintain certain financial ratios and a minimum net worth. We are prohibited from making any distribution to unitholders if such distribution would cause an event of default or otherwise violate a covenant under our credit facilities. In addition, our credit facilities prohibit us from borrowing more than $0.75 per outstanding unit during any consecutive 12-month period for the purpose of making distributions to unitholders. Our credit facilities provide that any amount so borrowed must be repaid once annually.
There is no guarantee that we will pay a quarterly distribution on the common units in any quarter.
Distributions of Cash Upon Liquidation
If we dissolve in accordance with the amended and restated partnership agreement, we will sell or otherwise dispose of our assets in a process called liquidation. We will first apply the proceeds of liquidation to the payment of its creditors. We will distribute any remaining proceeds to the unitholders, in accordance with their capital account balances, as adjusted to reflect any gain or loss upon the sale or other disposition of our assets in liquidation.
55
Securities Authorized for Issuance under Equity Compensation Plans
The following table provides information as of December 31, 2009, regarding our common units that may be issued upon conversion of outstanding phantom units granted under all of our existing equity compensation plans.
| |
Number of securities to be issued upon exercise of outstanding options, warrants and rights |
Weighted average exercise price of outstanding options, warrants and rights(1) |
Number of securities remaining available for future issuance under equity compensation plans |
||||||||
|---|---|---|---|---|---|---|---|---|---|---|---|
Equity compensation plans approved by security holders: |
|||||||||||
2008 Long-Term Incentive Plan(2) |
968,835 | $ | — | 1,325,361 | |||||||
2006 Hydrocarbon Stock Incentive Plan(3)(4) |
8,406 | $ | — | — | |||||||
Equity compensation plans not approved by security holders: |
|||||||||||
Long-Term Incentive Plan(4) |
69,555 | $ | — | — | |||||||
Total |
1,046,796 | 1,325,361 | |||||||||
- (1)
- Phantom
units are granted with no exercise price.
- (2)
- Includes
437,100 performance-based units which vest if we achieve established performance goals determined by the Compensation Committee of the General
Partner's board of directors.
- (3)
- Outstanding
shares of restricted stock under this plan were converted to phantom units pursuant to the terms of the Merger. The converted phantom units will
remain outstanding under the terms of their original plan until their respective settlement dates.
- (4)
- No further awards will be made pursuant to this plan.
Recent Sales of Unregistered Units
None.
Repurchase of Equity by MarkWest Energy Partners, L.P.
None.
56
ITEM 6. Selected Financial Data
The following table sets forth selected consolidated historical financial and operating data for MarkWest Energy Partners. For periods prior to the Merger, the information presented represents the consolidated financial position and results of operations for the Corporation. The selected financial data should be read in conjunction with the consolidated financial statements, including the notes thereto, and Item 7. Management's Discussion and Analysis of Financial Condition and Results of Operation in this Form 10-K.
| |
Year ended December 31, | |||||||||||||||||
|---|---|---|---|---|---|---|---|---|---|---|---|---|---|---|---|---|---|---|
| |
2009 | 2008 | 2007 | 2006 | 2005(1) | |||||||||||||
Statement of Operations: |
||||||||||||||||||
Revenue: |
||||||||||||||||||
Revenue |
$ | 858,635 | $ | 1,060,662 | $ | 845,727 | $ | 829,298 | $ | 759,381 | ||||||||
Derivative (loss) gain(2) |
(120,352 | ) | 277,828 | (159,970 | ) | 10,383 | (3,198 | ) | ||||||||||
Total revenue |
738,283 | 1,338,490 | 685,757 | 839,681 | 756,183 | |||||||||||||
Operating expenses: |
||||||||||||||||||
Purchased product costs |
408,826 | 615,902 | 487,892 | 560,597 | 625,090 | |||||||||||||
Derivative loss related to purchased product costs(2) |
68,883 | 22,371 | 15,192 | 5,689 | — | |||||||||||||
Facility expenses |
126,977 | 103,682 | 70,863 | 57,403 | 45,577 | |||||||||||||
Derivative (gain) loss related to facility expenses(2) |
(373 | ) | 644 | (14 | ) | — | — | |||||||||||
Selling, general and administrative expenses |
63,728 | 68,975 | 72,484 | 63,360 | 33,757 | |||||||||||||
Depreciation |
95,537 | 67,480 | 41,281 | 31,010 | 20,829 | |||||||||||||
Amortization of intangible assets |
40,831 | 38,483 | 16,672 | 16,047 | 9,656 | |||||||||||||
Loss (gain) on disposal of property, plant and equipment |
1,677 | 178 | 7,743 | (322 | ) | (407 | ) | |||||||||||
Accretion of asset retirement obligations |
198 | 129 | 114 | 102 | 160 | |||||||||||||
Impairment of goodwill and long-lived assets |
5,855 | 36,351 | 356 | — | — | |||||||||||||
Total operating expenses |
812,139 | 954,195 | 712,583 | 733,886 | 734,662 | |||||||||||||
(Loss) income from operations |
(73,856 | ) | 384,295 | (26,826 | ) | 105,795 | 21,521 | |||||||||||
Other income (expense): |
||||||||||||||||||
Earnings (loss) from unconsolidated affiliates |
3,505 | 90 | 5,309 | 5,316 | (2,153 | ) | ||||||||||||
Impairment of unconsolidated affiliate |
— | (41,449 | ) | — | — | — | ||||||||||||
Gain on sale of unconsolidated affiliate |
6,801 | — | — | — | — | |||||||||||||
Interest income |
349 | 3,769 | 4,547 | 1,574 | 1,060 | |||||||||||||
Interest expense |
(87,419 | ) | (64,563 | ) | (39,435 | ) | (40,942 | ) | (22,622 | ) | ||||||||
Amortization of deferred financing costs and discount (a component of interest expense) |
(9,718 | ) | (8,299 | ) | (2,983 | ) | (9,229 | ) | (6,979 | ) | ||||||||
Derivative gain related to interest expense(2) |
2,509 | — | — | — | — | |||||||||||||
Miscellaneous income (expense), net(2) |
2,459 | (241 | ) | 233 | 11,984 | 658 | ||||||||||||
(Loss) income before provision for income tax |
(155,370 | ) | 273,602 | (59,155 | ) | 74,498 | (8,515 | ) | ||||||||||
Provision for income tax expense (benefit): |
||||||||||||||||||
Current |
8,072 | 15,032 | 23,869 | (179 | ) | 554 | ||||||||||||
Deferred |
(50,088 | ) | 53,798 | (48,518 | ) | 5,431 | (2,358 | ) | ||||||||||
Total provision for income tax |
(42,016 | ) | 68,830 | (24,649 | ) | 5,252 | (1,804 | ) | ||||||||||
Net (loss) income |
(113,354 | ) | 204,772 | (34,506 | ) | 69,246 | (6,711 | ) | ||||||||||
Net (income) loss attributable to non-controlling interest |
(5,314 |
) |
3,301 |
(4,853 |
) |
(59,709 |
) |
(91 |
) |
|||||||||
Net (loss) income attributable to the Partnership |
$ | (118,668 | ) | $ | 208,073 | $ | (39,359 | ) | $ | 9,537 | $ | (6,802 | ) | |||||
Net (loss) income attributable to the Partnership's common unitholders per common unit(3) (Note 25): |
||||||||||||||||||
Basic |
$ | (1.97 | ) | $ | 4.02 | $ | (1.72 | ) | $ | 0.42 | $ | (0.30 | ) | |||||
Diluted |
$ | (1.97 | ) | $ | 4.02 | $ | (1.72 | ) | $ | 0.42 | $ | (0.30 | ) | |||||
Cash distribution declared per common unit(3) |
$ | 2.560 | $ | 2.059 | $ | 0.703 | $ | 0.416 | $ | 0.191 | ||||||||
57
| |
Year ended December 31, | |||||||||||||||||
|---|---|---|---|---|---|---|---|---|---|---|---|---|---|---|---|---|---|---|
| |
2009 | 2008 | 2007 | 2006 | 2005(1) | |||||||||||||
Balance Sheet Data (at December 31): |
||||||||||||||||||
Working capital |
$ | 13,536 | $ | 51,237 | $ | 21,932 | $ | 66,030 | $ | 61,156 | ||||||||
Property, plant and equipment, net |
1,981,644 | 1,569,525 | 830,809 | 554,335 | 494,698 | |||||||||||||
Total assets |
3,014,737 | 2,673,054 | 1,524,695 | 1,203,241 | 1,132,304 | |||||||||||||
Total long-term debt |
1,170,072 | 1,172,965 | 552,695 | 526,865 | 608,762 | |||||||||||||
Total partners' capital |
1,379,393 | 1,207,759 | 563,974 | 483,061 | 340,997 | |||||||||||||
Cash Flow Data: |
||||||||||||||||||
Net cash flow provided by (used in): |
||||||||||||||||||
Operating activities |
$ | 223,101 | $ | 226,995 | $ | 133,237 | $ | 165,969 | $ | 16,874 | ||||||||
Investing activities |
(461,753 | ) | (909,265 | ) | (314,792 | ) | (122,046 | ) | (445,848 | ) | ||||||||
Financing activities |
333,083 | 647,896 | 170,406 | (16,047 | ) | 437,098 | ||||||||||||
Other Financial Data: |
||||||||||||||||||
Maintenance capital expenditures(4) |
$ | 7,483 | $ | 7,161 | $ | 4,140 | $ | 2,460 | $ | 2,181 | ||||||||
Growth capital expenditures(4) |
479,140 | 568,137 | 312,499 | 77,620 | 69,162 | |||||||||||||
Total capital expenditures |
$ | 486,623 | $ | 575,298 | $ | 316,639 | $ | 80,080 | $ | 71,343 | ||||||||
- (1)
- We
made our initial investment in Starfish on March 31, 2005, and acquired Javelina (Gulf Coast) on November 1, 2005.
- (2)
- As discussed further in Note 2 of the accompanying Notes to Consolidated Financial Statements included in Item 8 of this Form 10-K, volatility in any given period related to unrealized gains and losses on our derivative positions can be significant. We ultimately expect unrealized gains and losses to be offset when they become realized. The following table summarizes the realized and unrealized gains and losses impacting Revenue, Purchased product costs, Facility expenses, Interest expense and Miscellaneous income (expense), net (in thousands):
| |
Year ended December 31, | ||||||||||||||||
|---|---|---|---|---|---|---|---|---|---|---|---|---|---|---|---|---|---|
| |
2009 | 2008 | 2007 | 2006 | 2005 | ||||||||||||
Realized gain (loss)—revenue |
$ | 87,289 | $ | (15,704 | ) | $ | (15,901 | ) | $ | 17 | $ | (2,541 | ) | ||||
Unrealized (loss) gain—revenue |
(207,641 | ) | 293,532 | (144,069 | ) | 10,366 | (657 | ) | |||||||||
Realized (loss) gain—purchased product costs |
(53,052 |
) |
7,368 |
(8,829 |
) |
153 |
— |
||||||||||
Unrealized loss—purchased product costs |
(15,831 | ) | (29,739 | ) | (6,363 | ) | (5,842 | ) | — | ||||||||
Unrealized gain (loss)—facility expenses |
373 |
(644 |
) |
14 |
— |
— |
|||||||||||
Realized gain—interest expense |
2,000 |
— |
— |
— |
— |
||||||||||||
Unrealized gain—interest expense |
509 | — | — | — | — | ||||||||||||
Unrealized gain—miscellaneous income (expense), net |
336 |
— |
— |
— |
— |
||||||||||||
Total derivative (loss) gain |
$ | (186,017 | ) | $ | 254,813 | $ | (175,148 | ) | $ | 4,694 | $ | (3,198 | ) | ||||
- (3)
- All
per unit data where applicable has been adjusted to reflect the Exchange Ratio to give effect to the Merger (see Note 3 of the accompanying Notes
to Consolidated Financial Statements included in Item 8 of this Form 10-K).
- (4)
- Maintenance capital includes capital expenditures made to maintain our operating capacity and asset base. Growth capital includes expenditures made to expand the existing operating capacity, to increase the efficiency of our existing assets, and to facilitate an increase in volumes within our operations. Growth capital also includes costs associated with new well connections. Growth capital excludes expenditures for third-party acquisitions and equity investments.
58
Operating Data
| |
Year ended December 31, | |||||||||||||||||
|---|---|---|---|---|---|---|---|---|---|---|---|---|---|---|---|---|---|---|
| |
2009 | 2008 | 2007 | 2006 | 2005 | |||||||||||||
Southwest |
||||||||||||||||||
East Texas |
||||||||||||||||||
Gathering systems throughput (Mcf/d) |
454,400 | 442,900 | 413,700 | 378,100 | 321,000 | |||||||||||||
NGL product sales (gallons) |
245,787,000 | 193,534,100 | 179,601,000 | 161,437,000 | 126,476,000 | |||||||||||||
Oklahoma |
||||||||||||||||||
Foss Lake gathering system throughput (Mcf/d) |
86,600 | 95,800 | 104,000 | 87,500 | 75,800 | |||||||||||||
Stiles Ranch gathering system throughput (Mcf/d)(1) |
89,300 | 84,800 | N/A | N/A | N/A | |||||||||||||
Grimes gathering system throughput (Mcf/d)(2) |
9,700 | 12,900 | 12,500 | N/A | N/A | |||||||||||||
Arapaho NGL product sales (gallons) |
126,870,500 | 79,416,400 | 87,522,000 | 79,093,000 | 60,903,000 | |||||||||||||
Southeast Oklahoma gathering systems throughput (Mcf/d)(3) |
416,800 | 318,700 | 114,000 | 34,000 | N/A | |||||||||||||
Arkoma Connector Pipeline throughput (Mcf/d)(4) |
277,300 | N/A | N/A | N/A | N/A | |||||||||||||
Other Southwest |
||||||||||||||||||
Appleby gathering system throughput (Mcf/d) |
47,300 | 58,400 | 58,700 | 34,200 | 33,400 | |||||||||||||
Other gathering systems throughput (Mcf/d)(5) |
10,300 | 11,000 | 8,700 | 18,300 | 16,500 | |||||||||||||
Northeast |
||||||||||||||||||
Appalachia(6) |
||||||||||||||||||
Natural gas processed (Mcf/d) |
194,600 | 202,200 | 200,200 | 203,000 | 197,000 | |||||||||||||
Keep-whole sales (gallons) |
145,493,100 |
140,847,500 |
126,192,600 |
118,581,000 |
120,300,000 |
|||||||||||||
Percent-of-proceeds sales (gallons) |
99,910,200 | 53,987,900 | 43,815,100 | 43,271,000 | 41,700,000 | |||||||||||||
Total NGL product sales (gallons)(7) |
245,403,300 | 194,835,400 | 170,007,700 | 161,852,000 | 162,000,000 | |||||||||||||
Michigan |
||||||||||||||||||
Crude oil transported for a fee (Bbl/d) |
12,300 | 13,300 | 14,000 | 14,500 | 14,200 | |||||||||||||
Liberty |
||||||||||||||||||
Marcellus Shale(8) |
||||||||||||||||||
Gathering system throughput (Mcf/d) |
53,500 | 18,700 | N/A | N/A | N/A | |||||||||||||
NGL product sales (gallons) |
34,409,000 | N/A | N/A | N/A | N/A | |||||||||||||
Gulf Coast(9) |
||||||||||||||||||
Refinery off-gas processed (Mcf/d) |
120,200 | 122,900 | 114,500 | 124,300 | 115,000 | |||||||||||||
Liquids fractionated (Bbl/d) |
23,200 | 24,400 | 25,000 | 26,200 | 19,400 | |||||||||||||
- (1)
- The
2008 volume reported for the Stiles Ranch gathering system is the average daily rate for the period of operation, which began November 2008.
- (2)
- We
acquired the Grimes gathering system on December 29, 2006.
- (3)
- We
began gathering gas on that the Woodford gathering system in December 2006. The volume reported for 2006 is the average daily rate for the month of
December.
- (4)
- The
Arkoma Connector Pipeline was placed into service in July 2009. The volume reported is the average daily rate for the days of operation.
- (5)
- Excludes lateral pipelines where revenue is not based on throughput.
59
- (6)
- Includes
throughput from the Kenova, Cobb, and Boldman processing plants.
- (7)
- Represents
sales at the Siloam fractionator. The total sales in 2009 exclude 23.3 million gallons sold by the Northeast on behalf of Liberty; those
volumes are included in the NGL product sales for Liberty.
- (8)
- The
2009 and 2008 volumes reported represent the average daily rate for the period of operation.
- (9)
- We acquired the Javelina system (Gulf Coast) on November 1, 2005. The volume reported is the average daily rate for the days of operation.
ITEM 7. Management's Discussion and Analysis of Financial Condition and Results of Operations
Management's Discussion and Analysis ("MD&A") contains statements that are forward-looking and should be read in conjunction with "Selected Consolidated Financial Data" and our consolidated financial statements and accompanying notes included elsewhere in this report. These statements are based on current expectations and assumptions that are subject to risks and uncertainties. Actual results could differ materially from those expressed or implied in the forward-looking statements as a result of a number of factors.
Overview
We are a master limited partnership engaged in the gathering, transportation and processing of natural gas; the transportation, fractionation, marketing and storage of NGLs; and the gathering and transportation of crude oil. We have extensive natural gas gathering, processing and transmission operations in the southwest, Gulf Coast and northeast regions of the United States, including the Marcellus Shale, and are the largest natural gas processor in the Appalachian region.
Significant Financial and Other Highlights
Significant financial and other highlights for the year ended December 31, 2009 are listed below. Refer to Results of Operations and Liquidity and Capital Resources for further details.
- •
- Total segment operating income before items not allocated to segments decreased approximately $27.9 million, or 8%,
for the year ended December 31, 2009 compared to the same period in 2008. The decrease is due primarily to significantly lower NGL and natural gas prices in 2009. The decrease related to
commodity prices was partially offset by the following:
- •
- Increased gathered and processed volumes in the Southwest segment due to the 2008 acquisition of the Stiles Ranch
gathering system, the continued expansion of the Woodford gathering system including the start of operations for the Arkoma Connector Pipeline, and the expansion of the processing facilities in
western Oklahoma and East Texas.
- •
- Increased contracted volumes from a large producer and expansion of the processing facilities in the Northeast segment.
- •
- Continued expansion of our Marcellus Shale operations in the Liberty segment which commenced in October 2008.
- •
- During the year ended December 31, 2009, the prices of NGLs relative to the price of crude oil were below
historical averages. This reduced the effectiveness of our hedging program and adversely impacted our cash flows and results of operations. The declines in segment operating income before items not
allocated to segments were partially offset by $34.2 million of realized gains on derivative positions.
- •
- In May 2009, we received net proceeds of $113.8 million from a private placement of senior notes. These notes, with an aggregate principal amount of $150.0 million, are due in November 2014.
60
- •
- In June 2009, we received net proceeds of $57.7 million from a public offering of approximately 3.34 million
newly issued common units.
- •
- In August 2009, we received net proceeds of $120.9 million from a public offering of approximately
6.03 million newly issued common units.
- •
- We received $194.5 million of net contributions to MarkWest Liberty Midstream.
- •
- We received $60.7 million of net proceeds from the sale of a 50% equity interest in MarkWest Pioneer.
- •
- In September 2009, we sold the SMR, located in Corpus Christi, TX, for net proceeds of approximately $71.6 million.
- •
- In December 2009, we sold our equity interest in Starfish and received net proceeds of approximately $24.5 million, subject to post-closing adjustments for net working capital.
Impact of Acquisitions on Comparability of Financial Results
In reviewing our historical results of operations, investors should be aware of the impact of our past acquisitions, which fundamentally affect the comparability of our results of operations over the periods discussed.
Two acquisitions occurred in 2008 and are included in the results of operations from the acquisition date.
- •
- On March 1, 2008, we acquired a 20% interest in Centrahoma Processing LLC ("Centrahoma") for
$11.6 million, which is accounted for under the equity method. On May 9, 2008, we acquired an additional 20% interest in Centrahoma for $12.0 million including a capital call,
which brought our total ownership interest to 40%. As a result, our share of Centrahoma's net loss from March 2008 to December 2008 is included in Earnings from unconsolidated
affiliates in the accompanying Consolidated Statements of Operations for the year ended December 31, 2008.
- •
- The PQ Gathering Assets, L.L.C. ("PQ Assets") acquisition closed on July 31, 2008 for consideration of $41.3 million. As a result, five months of activity for PQ Assets is reflected in the accompanying Consolidated Statements of Operations for the year ended December 31, 2008.
Results of Operations
Segment Reporting
We classify our business in four reportable segments: Southwest, Northeast, Liberty and Gulf Coast. We capture information in this MD&A by geographical segment. Items below (Loss) income from operations in the accompanying Consolidated Statements of Operations, certain compensation expense, certain other non-cash items and any unrealized gains (losses) from derivative instruments are not allocated to individual business segments. Management does not consider these items allocable to or controllable by any individual business segment and therefore excludes these items when evaluating segment performance. The 2009 segment results are also adjusted to exclude the portion of operating income attributable to the non-controlling interests; non-controlling interest were immaterial prior to 2009. The segment information appearing in Note 26 of the accompanying Notes to Consolidated Financial Statements included in Item 8 of this Form 10-K is presented on a basis consistent with our internal management reporting and in accordance with GAAP. As a result of the new Liberty segment, segment information for the year ended December 31, 2008 has been recast.
61
Year Ended December 31, 2009, Compared to Year Ended December 31, 2008
The tables below present information about operating income for the reported segments for the years ended December 31, 2009 and 2008.
| |
Year ended December 31, |
|
|
|||||||||||
|---|---|---|---|---|---|---|---|---|---|---|---|---|---|---|
| |
2009 | 2008 | $ Change | % Change | ||||||||||
| |
(in thousands) |
|
||||||||||||
Revenue |
$ | 492,369 | $ | 652,365 | $ | (159,996 | ) | (25 | )% | |||||
Operating expenses: |
||||||||||||||
Purchased product costs |
221,021 | 387,516 | (166,495 | ) | (43 | )% | ||||||||
Facility expenses |
73,621 | 62,369 | 11,252 | 18 | % | |||||||||
Total operating expenses before items not allocated to segments |
294,642 | 449,885 | (155,243 | ) | (35 | )% | ||||||||
Portion of operating income attributable to non-controlling interests |
2,613 |
— |
2,613 |
N/A |
||||||||||
Operating income before items not allocated to segments |
$ | 195,114 | $ | 202,480 | $ | (7,366 | ) | (4 | )% | |||||
Revenue. Revenue decreased primarily due to lower commodity prices. Revenue from NGL, natural gas and condensate sales decreased across the segment by $191.2 million. The change from a gas purchase contract to a gas gathering contract with a significant producer in the Other Southwest area also contributed to the decline in revenue. The revenue decreases were partially offset by increased volumes processed at the Arapaho facilities associated with the Stiles Ranch gathering system that began operations in the fourth quarter of 2008 and by an increase of $33.0 million in gathering, treating, and transportation fee revenue due primarily to the continued expansion of our operations in the Woodford Shale, including the start of the Arkoma Connector Pipeline operations.
Purchased Product Costs. NGL and natural gas purchases decreased due primarily to lower commodity prices as well as the contract change for a significant producer in the Other Southwest area.
Facility Expenses. Facility expenses increased due primarily to the continued expansion of operations for the Woodford gathering system, including the PQ Assets acquisition in July of 2008, the expansion of the Foss Lake gathering and processing operations, and increased repairs and maintenance resulting from the completed non-recurring environmental remediation costs in East Texas.
Portion of Operating Income Attributable to Non-controlling Interests. Portion of operating income attributable to non-controlling interest represents our partners' interest in the net operating income of MarkWest Pioneer and Wirth Gathering Partnership.
62
| |
Year ended December 31, |
|
|
|||||||||||
|---|---|---|---|---|---|---|---|---|---|---|---|---|---|---|
| |
2009 | 2008 | $ Change | % Change | ||||||||||
| |
(in thousands) |
|
||||||||||||
Revenue |
$ | 260,529 | $ | 313,921 | $ | (53,392 | ) | (17 | )% | |||||
Operating expenses: |
||||||||||||||
Purchased product costs |
175,326 | 228,386 | (53,060 | ) | (23 | )% | ||||||||
Facility expenses |
20,339 | 20,869 | (530 | ) | (3 | )% | ||||||||
Total operating expenses before items not allocated to segments |
195,665 | 249,255 | (53,590 | ) | (22 | )% | ||||||||
Operating income before items not allocated to segments |
$ |
64,864 |
$ |
64,666 |
$ |
198 |
0 |
% |
||||||
Revenue. Revenue decreased due mainly to lower commodity prices realized on NGL sales from the Appalachia region. This decrease was partially offset by changes in contract terms and increased volumes from a large producer in the Appalachia region. Revenue also decreased $4.2 million in our Western Michigan area due to the shut-in and subsequent sale or abandonment of the assets in this area.
Purchased Product Costs. Purchased product costs decreased due to lower prices for the natural gas that must be purchased to satisfy the keep-whole arrangements in the Appalachia area. The effect of the lower prices was partially offset by increased volumes and changes in market value. Purchased product costs in 2008 included an expense of $6.7 million to write down inventories to market value at December 31, 2008. Purchased product costs also decreased $2.8 million in our Western Michigan area due to the shut-in and subsequent sale or abandonment of the assets in this area.
| |
Year ended December 31, |
|
|
|||||||||||
|---|---|---|---|---|---|---|---|---|---|---|---|---|---|---|
| |
2009 | 2008 | $ Change | % Change | ||||||||||
| |
(in thousands) |
|
||||||||||||
Revenue |
$ | 47,968 | $ | 2,334 | $ | 45,634 | 1,955 | % | ||||||
Operating expenses: |
||||||||||||||
Purchased product costs |
12,479 | — | 12,479 | N/A | ||||||||||
Facility expenses |
16,268 | 2,006 | 14,262 | 711 | % | |||||||||
Total operating expenses before items not allocated to segments |
28,747 | 2,006 | 26,741 | 1,333 | % | |||||||||
Portion of operating income attributable to non-controlling interests |
6,637 |
— |
6,637 |
N/A |
||||||||||
Operating income before items not allocated to segments |
$ | 12,584 | $ | 328 | $ | 12,256 | 3,737 | % | ||||||
The results of operations for the year ended December 31, 2009 include our operations in the northern West Virginia and western Pennsylvania areas. Revenue for the year ended December 31, 2009 consists of approximately $30.1 million of fee-based revenue. Approximately $17.9 million of the revenue relates to NGL product sales under percent-of-proceeds arrangements. The portion of operating income attributable to non-controlling interest represents M&R's interest in the net operating income of MarkWest Liberty Midstream.
63
We began construction in the second quarter of 2008 and commenced gas gathering and processing operations in the fourth quarter of 2008.
| |
Year ended December 31, |
|
|
|||||||||||
|---|---|---|---|---|---|---|---|---|---|---|---|---|---|---|
| |
2009 | 2008 | $ Change | % Change | ||||||||||
| |
(in thousands) |
|
||||||||||||
Revenue |
$ | 57,769 | $ | 92,042 | $ | (34,273 | ) | (37 | )% | |||||
Operating expenses: |
||||||||||||||
Facility expenses |
16,094 | 17,368 | (1,274 | ) | (7 | )% | ||||||||
Total operating expenses before items not allocated to segments |
16,094 | 17,368 | (1,274 | ) | (7 | )% | ||||||||
Operating income before items not allocated to segments |
$ |
41,675 |
$ |
74,674 |
$ |
(32,999 |
) |
(44 |
)% |
|||||
Revenue. Revenue decreased due to lower commodity prices and decreased inlet volumes. The decrease in revenue was partially offset by a higher percent-of-proceeds received from one of our refinery customers under a variable percent-of-proceeds contract.
Facility Expenses. Facility expenses decreased primarily due to lower electricity rates. The decrease was partially offset by the cost of the plant turnaround completed in March 2009.
64
Reconciliation of Segment Operating Income to Consolidated (Loss)
Income Before Provision for Income Tax
The following table provides a reconciliation of segment revenue to total revenue and operating income before items not allocated to segments to our consolidated (loss) income before provision for income tax for the years ended December 31, 2009 and 2008. The ensuing items listed below the Total segment revenue and Operating income lines are not allocated to business segments as management does not consider these items allocable to any individual segment.
| |
Year ended December 31, | |
|
||||||||||||
|---|---|---|---|---|---|---|---|---|---|---|---|---|---|---|---|
| |
2009 | 2008 | $ Change | % Change | |||||||||||
| |
(in thousands) |
|
|||||||||||||
Total segment revenue |
$ | 858,635 | $ | 1,060,662 | $ | (202,027 | ) | (19 | )% | ||||||
Derivative (loss) gain not allocated to segments |
(120,352 | ) | 277,828 | (398,180 | ) | (143 | )% | ||||||||
Total revenue |
$ | 738,283 | $ | 1,338,490 | $ | (600,207 | ) | (45 | )% | ||||||
Operating income before items not allocated to segments |
$ | 314,237 | $ | 342,148 | $ | (27,911 | ) | (8 | )% | ||||||
Portion of operating income attributable to non-controlling interests |
9,250 | — | 9,250 | N/A | |||||||||||
Derivative (loss) gain not allocated to segments |
(188,862 | ) | 254,813 | (443,675 | ) | (174 | )% | ||||||||
Compensation expense included in facility expenses not allocated to segments |
(1,032 | ) | (1,070 | ) | 38 | (4 | )% | ||||||||
Facility expenses elimination |
377 | — | 377 | N/A | |||||||||||
Selling, general and administrative expenses |
(63,728 | ) | (68,975 | ) | 5,247 | (8 | )% | ||||||||
Depreciation |
(95,537 | ) | (67,480 | ) | (28,057 | ) | 42 | % | |||||||
Amortization of intangible assets |
(40,831 | ) | (38,483 | ) | (2,348 | ) | 6 | % | |||||||
Loss on disposal of property, plant and equipment |
(1,677 | ) | (178 | ) | (1,499 | ) | 842 | % | |||||||
Accretion of asset retirement obligations |
(198 | ) | (129 | ) | (69 | ) | 53 | % | |||||||
Impairment of goodwill and long-lived assets |
(5,855 | ) | (36,351 | ) | 30,496 | (84 | )% | ||||||||
(Loss) income from operations |
(73,856 | ) | 384,295 | (458,151 | ) | (119 | )% | ||||||||
Earnings from unconsolidated affiliates |
3,505 | 90 | 3,415 | 3,794 | % | ||||||||||
Impairment of unconsolidated affiliate |
— | (41,449 | ) | 41,449 | (100 | )% | |||||||||
Gain on sale of unconsolidated affiliate |
6,801 | — | 6,801 | N/A | |||||||||||
Interest income |
349 | 3,769 | (3,420 | ) | (91 | )% | |||||||||
Interest expense |
(87,419 | ) | (64,563 | ) | (22,856 | ) | 35 | % | |||||||
Amortization of deferred financing costs and discount (a component of interest expense) |
(9,718 | ) | (8,299 | ) | (1,419 | ) | 17 | % | |||||||
Derivative gain related to interest expense |
2,509 | — | 2,509 | N/A | |||||||||||
Miscellaneous income (expense), net |
2,459 | (241 | ) | 2,700 | (1,120 | )% | |||||||||
(Loss) income before provision for income tax |
$ | (155,370 | ) | $ | 273,602 | $ | (428,972 | ) | (157 | )% | |||||
Derivative (Gain) Loss Not Allocated to Segments. Unrealized loss from the mark-to-market of our derivative instruments was $223.1 million in 2009 compared to unrealized gain of $263.1 million in 2008. Realized gain from the settlement of our derivative instruments was $34.2 million in 2009 compared to realized loss of $8.3 million in 2008. The total change of $443.7 million is due mainly to volatility in commodity prices when comparing prices in 2009 with 2008. Realized gains in 2009 also include net gains of $15.2 million due to the early settlement of certain positions as discussed in Note 7 of the accompanying Notes to Consolidated Financial Statements included in Item 8 of this Form 10-K.
65
Selling, General and Administrative Expenses. Selling, general and administrative expenses decreased primarily due to lower expense related to share-based incentive compensation plans as the established targets for certain awards are not currently expected to be fully achieved. Additionally, we incurred $2.6 million of expenses related to the Merger during 2008 which did not recur in 2009. These costs are partially offset by increases in headcount and short-term incentive compensation.
Depreciation and Amortization of Intangible Assets. Depreciation and amortization expense increased partially due to a $4.4 million increase caused by the step-up in value of property, plant, and equipment and intangible assets as a result of the Merger. The remaining increase is due to depreciation on additional projects completed during 2008 and 2009.
Impairment of Goodwill and Long-Lived Assets. During the year ended December 31, 2009, we recognized an impairment of $5.9 million related to certain gas-gathering and intangible assets in the Southwest segment.
During the year ended December 31, 2008, we recognized an impairment charge of $7.6 million related to certain gas-gathering assets in the Northeast segment. See Note 15 of the accompanying Notes to the Consolidated Financial Statements included in Item 8 of this Form 10-K for further discussion.
During the year ended December 31, 2008, we recognized an impairment charge of $28.7 million related to goodwill that was recorded a result of the purchase accounting for the Merger. The impairment was due primarily to a reduction in our forecasted cash flows caused by a significant decline in commodity prices in the fourth quarter of 2008. See Note 15 of the accompanying Notes to the Consolidated Financial Statements included in Item 8 of this Form 10-K for further discussion.
Earnings from Unconsolidated Affiliates. Earnings from unconsolidated affiliates is related to our investment in Starfish and Centrahoma. The increase in our earnings from unconsolidated affiliates is due mainly to increased volumes and prices at Starfish. Additionally, operations at Starfish were disrupted in the third and fourth quarter of 2008 due to damage caused by Hurricane Ike. We sold our interest in Starfish effective December 31, 2009. See Note 6 of the accompanying Notes to Consolidated Financial Statements included in Item 8 of this Form 10-K.
Impairment of Unconsolidated Affiliate. During the year ended December 31, 2008, we recognized an impairment charge of $41.4 million related to an other-than-temporary decline in the fair value of our equity investment in Starfish. See Note 16 of the accompanying Notes to Consolidated Financial Statements included in Item 8 of this Form 10-K for further discussion.
Gain on Sale of Unconsolidated Affiliate. During the year ended December 31, 2009, we sold our equity investment in Starfish. See Note 6 of the accompanying Notes to Consolidated Financial Statements included in Item 8 of this Form 10-K for further discussion.
Interest Income. Interest income decreased due to a significant reduction in the excess cash available for short-term investments as a result of our capital spending requirements during 2009. Interest rates were also lower on the amounts that were invested in 2009.
Interest Expense. Interest expense increased primarily due to additional borrowings in 2008 and 2009 to fund the Merger and our capital plan. The increase in interest expense was partially offset by a $2.7 million increase in capitalized interest.
Amortization of Deferred Financing Costs and Discount. Amortization of deferred financing costs and discount increased due mainly to the amortization of deferred financing costs associated with the issuance of senior notes in May 2009.
66
Derivative Gain Related to Interest Expense. Derivative gain related to interest expense relates to changes in the fair value of interest rate swaps which we use to manage the interest rate risk associated with the fair value of our fixed rate borrowings. The interest rate swaps effectively convert a portion of the underlying cash flows related to our long-term fixed rate debt securities into variable rate cash flows in order to achieve a desired mix of fixed and variable rate debt. We settled all of the outstanding interest rate swaps in January 2010. See Note 7 and Note 31 of the accompanying Notes to Consolidated Financial Statements included in Item 8 of this Form 10-K for further details.
Provision for Income Tax. The total provision for income tax benefit was $42.0 million which includes a deferred benefit of $50.1 million related primarily to MarkWest Hydrocarbon's ownership of Class A units and the net unrealized derivative loss during the period. The current provision for income tax expense was $8.1 million. Approximately $7.3 million is attributable to MarkWest Hydrocarbon, Inc. and the remaining $0.8 million is related to taxes payable by the Partnership associated with the Texas Margin Tax and Michigan Business Taxes. See Note 24 of the accompanying Notes to Consolidated Financial Statements included in Item 8 of this Form 10-K for a discussion of the significant changes in the provision.
Year Ended December 31, 2008, Compared to Year Ended December 31, 2007
The tables below present information about operating income for the reported segments for the years ended December 31, 2008 and 2007.
Southwest
| |
Year ended December 31, |
|
|
|||||||||||
|---|---|---|---|---|---|---|---|---|---|---|---|---|---|---|
| |
2008 | 2007 | $ Change | % Change | ||||||||||
| |
(in thousands) |
|
||||||||||||
Revenue |
$ | 652,365 | $ | 503,461 | $ | 148,904 | 30 | % | ||||||
Operating expenses: |
||||||||||||||
Purchased product costs |
387,516 | 310,888 | 76,628 | 25 | % | |||||||||
Facility expenses |
62,369 | 44,045 | 18,324 | 42 | % | |||||||||
Total operating expenses before items not allocated to segments |
449,885 | 354,933 | 94,952 | 27 | % | |||||||||
Operating income before items not allocated to segments |
$ | 202,480 | $ | 148,528 | $ | 53,952 | 36 | % | ||||||
Revenue. Revenue increased due primarily to an increase in volumes and higher average annual pricing in most areas of the segment. Revenue in East Texas increased $75.2 million from the sale of greater NGL and condensate volumes and higher prices for most of the year. Additionally, continued expansion in the Woodford gathering system, including the purchase of PQ Assets from PetroQuest Energy, L.L.C., and the start of gas processing operations in this area increased revenue approximately $63.4 million. Revenue from the Other Southwest area increased approximately $39.3 million due to higher average annual prices and increased volumes of approximately 2,000 Mcf/d in the gathering systems. Revenue generated by the Foss Lake region decreased $28.9 million mainly due to lower volumes.
Purchased Product Costs. Purchased product costs increased due primarily to the increased NGL purchases in East Texas related to percent-of-proceeds arrangements. Additional increases are related to the increased volumes and higher prices in the Other Southwest area. Additional NGL and gas purchases associated with the Woodford expansion also contributed to the increase.
67
Facility Expenses. Facility expenses increased due primarily to the increased operations for the Woodford gathering system. Expanded operations in East Texas and Western Oklahoma also contributed to the increase in facility expenses.
| |
Year ended December 31, |
|
|
|||||||||||
|---|---|---|---|---|---|---|---|---|---|---|---|---|---|---|
| |
2008 | 2007 | $ Change | % Change | ||||||||||
| |
(in thousands) |
|
||||||||||||
Revenue |
$ | 313,921 | $ | 265,152 | $ | 48,769 | 18 | % | ||||||
Operating expenses: |
||||||||||||||
Purchased product costs |
228,386 | 177,004 | 51,382 | 29 | % | |||||||||
Facility expenses |
20,869 | 16,347 | 4,522 | 28 | % | |||||||||
Total operating expenses before items not allocated to segments |
249,255 | 193,351 | 55,904 | 29 | % | |||||||||
Operating income before items not allocated to segments |
$ | 64,666 | $ | 71,801 | $ | (7,135 | ) | (10 | )% | |||||
Revenue. Revenue increased due mainly to higher average annual prices and increased volumes of NGLs sold from the Appalachia region. The increase in volumes resulted from the expanded production of a large producer customer in the area and upgrades to our processing facilities.
Purchased Product Costs. Purchased product costs increased mainly due to higher average annual prices for natural gas that must be purchased to satisfy the keep-whole arrangements in the Appalachia area, and an increase in the volumes of natural gas purchased. Purchased product costs also includes an expense of $6.7 million to write down inventories to market value at December 31, 2008. The increase in purchased product costs was partially offset by a $3.0 million decrease in trucking expenses resulting from a change in contractual terms with a producer.
Facility Expenses. Facility expenses increased due primarily to increases in plant fuel costs, repairs and maintenance expense and labor and benefits expense to support the increased level of operations in the Appalachia region.
| |
Year ended December 31, |
|
|
|||||||||||
|---|---|---|---|---|---|---|---|---|---|---|---|---|---|---|
| |
2008 | 2007 | $ Change | % Change | ||||||||||
| |
(in thousands) |
|
||||||||||||
Revenue |
$ | 2,334 | $ | — | $ | 2,334 | N/A | |||||||
Operating expenses: |
||||||||||||||
Facility expenses |
2,006 | — | 2,006 | N/A | ||||||||||
Total operating expenses before items not allocated to segments |
2,006 | — | 2,006 | N/A | ||||||||||
Operating income before items not allocated to segments |
$ | 328 | $ | — | $ | 328 | N/A | |||||||
The results of operations for the year ended December 31, 2008 include our operations in the northern West Virginia and western Pennsylvania areas. We began construction in the second quarter of 2008 and commenced gas gathering and processing operations in the fourth quarter of 2008.
68
| |
Year ended December 31, |
|
|
|||||||||||
|---|---|---|---|---|---|---|---|---|---|---|---|---|---|---|
| |
2008 | 2007 | $ Change | % Change | ||||||||||
| |
(in thousands) |
|
||||||||||||
Revenue |
$ | 92,042 | $ | 77,114 | $ | 14,928 | 19 | % | ||||||
Operating expenses: |
||||||||||||||
Facility expenses |
17,368 | 10,471 | 6,897 | 66 | % | |||||||||
Total operating expenses before items not allocated to segments |
17,368 | 10,471 | 6,897 | 66 | % | |||||||||
Operating income before items not allocated to segments |
$ | 74,674 | $ | 66,643 | $ | 8,031 | 12 | % | ||||||
Revenue. Revenue increased due mainly to higher pricing and inlet volumes partially offset by a slightly lower percent-of-proceeds ("POP") received. Effective March 1, 2008, a significant contract changed from a fixed POP to variable POP, resulting in a lower POP received. In addition, the sale of pentanes generated $10.2 million of revenue for the year ended December 31, 2008, compared to $4.8 million for the same period in 2007. Historically, pentanes had to be stored and were sold seasonally. However, with the completion of a new pentane hydrotreater in March 2008, the quality of the pentanes has been improved, and they can be sold on a recurring basis as they are produced.
Facility Expenses. Facility expenses increased due partially to a refund of $3.6 million from a utility rate case concluded in the first quarter of 2007. Excluding the refund, facility expenses were $3.2 million higher due mainly to increased energy expenses related to a new contract in March 2008 whereby the Partnership shares the cost of electricity. In 2007 these expenses were fully reimbursed by the customer.
69
Reconciliation of Segment Operating Income to Consolidated Income (Loss)
Before Provision for Income Tax
The following table provides a reconciliation of segment revenue to total revenue and operating income before items not allocated to segments to our consolidated income (loss) before provision for income tax for the years ended December 31, 2008 and 2007. The ensuing items listed below the Total segment revenue and Operating income lines are not allocated to business segments as management does not consider these items allocable to any individual segment.
| |
Year ended December 31, | |
|
||||||||||||
|---|---|---|---|---|---|---|---|---|---|---|---|---|---|---|---|
| |
2008 | 2007 | $ Change | % Change | |||||||||||
| |
(in thousands) |
|
|||||||||||||
Total segment revenue |
$ | 1,060,662 | $ | 845,727 | $ | 214,935 | 25 | % | |||||||
Derivative gain (loss) not allocated to segments |
277,828 | (159,970 | ) | 437,798 | (274 | )% | |||||||||
Total revenue |
$ | 1,338,490 | $ | 685,757 | $ | 652,733 | 95 | % | |||||||
Operating income before items not allocated to segments |
$ | 342,148 | $ | 286,972 | $ | 55,176 | 19 | % | |||||||
Derivative gain (loss) not allocated to segments |
254,813 | (175,148 | ) | 429,961 | (245 | )% | |||||||||
Compensation expense included in facility expenses not allocated to segments |
(1,070 | ) | — | (1,070 | ) | N/A | |||||||||
Selling, general and administrative expenses |
(68,975 | ) | (72,484 | ) | 3,509 | (5 | )% | ||||||||
Depreciation |
(67,480 | ) | (41,281 | ) | (26,199 | ) | 63 | % | |||||||
Amortization of intangible assets |
(38,483 | ) | (16,672 | ) | (21,811 | ) | 131 | % | |||||||
Loss on disposal of property, plant and equipment |
(178 | ) | (7,743 | ) | 7,565 | (98 | )% | ||||||||
Accretion of asset retirement obligations |
(129 | ) | (114 | ) | (15 | ) | 13 | % | |||||||
Impairment of goodwill and long-lived assets |
(36,351 | ) | (356 | ) | (35,995 | ) | 10,111 | % | |||||||
Income (loss) from operations |
384,295 | (26,826 | ) | 411,121 | (1,533 | )% | |||||||||
Earnings from unconsolidated affiliates |
90 | 5,309 | (5,219 | ) | (98 | )% | |||||||||
Impairment of unconsolidated affiliate |
(41,449 | ) | — | (41,449 | ) | N/A | |||||||||
Interest income |
3,769 | 4,547 | (778 | ) | (17 | )% | |||||||||
Interest expense |
(64,563 | ) | (39,435 | ) | (25,128 | ) | 64 | % | |||||||
Amortization of deferred financing costs and discount (a component of interest expense) |
(8,299 | ) | (2,983 | ) | (5,316 | ) | 178 | % | |||||||
Miscellaneous (expense) income, net |
(241 | ) | 233 | (474 | ) | (203 | )% | ||||||||
Income (loss) before provision for income tax |
$ | 273,602 | $ | (59,155 | ) | $ | 332,757 | (563 | )% | ||||||
Derivative Gain (Loss) Not Allocated to Segments. Derivative gains were $254.8 million for the year ended December 31, 2008, compared to derivative losses of $175.1 million for the year ended December 31, 2007. The change of $430.0 million is primarily attributable to the significant decline in commodity prices in the fourth quarter of 2008. Approximately $413.6 million of the change relates to unrealized gains due to mark-to-market adjustments. Settlements of our derivative instruments resulted in a $16.4 million decrease in realized losses, when comparing 2008 to 2007 results. The decrease in realized derivative losses is primarily attributable to management's decision to settle certain 2010 and 2011 frac spread positions in November and December of 2008. We recognized $28.0 million of net gains during the year ended December 31, 2008 resulting from the settlement of these 2010 and 2011 positions. The settlements were completed prior to 2010 and 2011 to improve liquidity and to mitigate credit risk with certain counterparties, and as such does not represent trading activity. These gains on the early settlement of the 2010 and 2011 positions partially offset the $36.3 million of realized losses resulting from the scheduled settlement of the 2008 positions.
70
Selling, General and Administrative Expenses. Selling, general and administrative expenses decreased during the year ended December 31, 2008, relative to 2007, due primarily to a $12.2 million decrease in compensation expense related to the Participation Plan and a decrease in Merger-related expenses of $3.8 million. Refer to Note 22 of the accompanying Notes to Consolidated Financial Statements included in Item 8 of this Form 10-K for further discussion of the Participation Plan. These decreases in costs were partially offset by an $8.7 million increase in compensation expenses related to phantom unit awards. Increases in professional consulting expenses, office rent expense, letter of credit fees, and novation expenses also partially offset the overall decrease in selling, general, and administrative expenses.
Depreciation and Amortization of Intangible Assets. Depreciation and amortization expense increased during the year ended December 31, 2008, relative to 2007, due primarily to a $32.5 million increase caused by the step-up in value of property, plant, and equipment and intangible assets as a result of the Merger. The remainder is due to depreciation on additional projects completed during the fiscal years ended 2008 and 2007.
Impairment of Goodwill and Long-Lived Assets. During the year ended December 31, 2008, we recognized an impairment charge of $28.7 million related to goodwill that was recorded a result of the purchase accounting for the Merger. The impairment is due primarily to a reduction in our forecasted cash flows caused by a significant decline in commodity prices in the fourth quarter of 2008. Refer to Note 15 of the accompanying Notes to the Consolidated Financial Statements included in Item 8 of this Form 10-K for further discussion.
During the year ended December 31, 2008, we recognized an impairment charge of $7.6 million related to certain gas-gathering assets in the Northeast segment. During the year ended December 31, 2007, we recognized an impairment charge of $0.4 million related to assets in the Southwest segment. Refer to Note 15 of the accompanying Notes to the Consolidated Financial Statements included in Item 8 of this Form 10-K for further discussion.
Loss on Disposal of Property, Plant, and Equipment. The loss from disposal of property, plant and equipment decreased during the year ended December 31, 2008, relative to 2007. The $7.7 million loss during the year ended 2007 related primarily to the conveyance of the Maytown facility to Equitable and the write-off of leasehold improvements as a result of the termination of the pipeline lease with Equitable in November 2007. There were no significant disposals during 2008.
Earnings from Unconsolidated Affiliates. Earnings from unconsolidated affiliates are primarily related to our investment in Starfish, a joint venture with Enbridge Offshore Pipelines L.L.C. which is accounted for using the equity method. The decrease in our earnings from unconsolidated affiliates for the year ended December 31, 2008, relative to 2007, is due mainly to the damage and business interruption caused by Hurricane Ike in September 2008.
Impairment of Unconsolidated Affiliate. During the year ended December 31, 2008, we recognized an impairment charge of $41.4 million related to an other-than-temporary decline in the fair value of our equity investment in Starfish. See Note 16 of the accompanying Notes to Consolidated Financial Statements included in Item 8 of this Form 10-K for further details regarding this impairment charge.
Interest Income. Interest income decreased during the year ended December 31, 2008, relative to 2007, mainly due to proceeds received in the first quarter of 2007 from a rate case in our Gulf Coast segment. This decrease was partially offset by interest earnings on additional money market investments resulting from the cash raised in the debt and equity offerings in April 2008.
Interest Expense. Interest expense increased during the year ended December 31, 2008, relative to 2007, primarily due to increased borrowings in 2008 to fund the Merger and to raise funds for acquisitions and organic growth projects.
71
Amortization of Deferred Financing Costs and Discount. Amortization of deferred financing costs and discount increased during the year ended December 31, 2008, relative to 2007, due mainly to the $4.2 million write-off of financing costs related to a term loan that was repaid in April 2008. The remaining increase relates to the amortization of deferred financing costs associated with the revolving credit facility of our Partnership Credit Agreement and the issuance of Senior Notes in April 2008.
Provision for Income Tax. The total provision for income tax for the year ended December 31, 2008 was $68.8 million. Refer to Note 24 of the accompanying Notes to Consolidated Financial Statements included in Item 8 of this Form 10-K for a discussion of the significant changes in the provision.
The current provision for income tax was $15.0 million for the year ended December 31, 2008. Approximately $13.5 million is attributable to MarkWest Hydrocarbon, Inc. Of this amount, $18.8 million is attributable to MarkWest Hydrocarbon's ownership of Class A units, and the remaining benefit of $5.3 million is related to the Corporation's NGL marketing business. The remaining $1.5 million is related to taxes payable by the Partnership associated with the Texas Margin Tax and Michigan Business Taxes.
Liquidity and Capital Resources
Our primary strategy is to expand our asset base through organic growth and expansion projects and selective third-party acquisitions that are accretive to our cash available for distribution per common unit. In 2009, we spent approximately $487.0 million on internal development and expansion opportunities, of which a significant portion was funded by our joint venture partners and by our divestiture of the SMR facility as discussed in the Alternative Financing section below.
Our 2010 capital plan includes approximately $490 million to $540 million of capital expenditures for growth projects and approximately $10 million to $15 million for maintenance capital. Our share of growth capital expenditures is expected to be approximately $300 million to $350 million and the remainder will be funded through contributions from our joint venture partners and existing cash balances in the joint ventures. Growth capital includes expenditures made to expand the existing operating capacity, to increase the efficiency of our existing assets, and to facilitate an increase in volumes within our operations. Growth capital also includes costs associated with new well connections. Growth capital excludes expenditures for third-party acquisitions and equity investments. Maintenance capital includes capital expenditures made to maintain our operating capacity and asset base.
Our primary sources of liquidity to meet operating expenses, pay distributions to our unitholders and fund capital expenditures are cash flows generated by our operations and access to debt and equity markets, both public and private. We will also consider the use of alternative financing strategies such as entering into additional joint venture arrangements and the sale of non-strategic assets.
During 2009, we completed the following transactions that have improved our liquidity position:
- •
- Amended our Partnership Credit Agreement to increase our borrowing capacity under the revolving credit facility from
$350.0 million to $435.6 million.
- •
- Received net proceeds of $113.8 million from a private placement of senior notes.
- •
- Received net proceeds of $178.6 million from two public offerings of common units.
- •
- Entered into a joint venture agreement with M&R to jointly fund our growth plan in the Marcellus Shale region. As of
December 31, 2009, M&R has contributed $200.0 million to the joint venture, which net of transaction costs has provided additional liquidity of $194.5 million.
- •
- Entered into a joint venture agreement with ArcLight and received net proceeds of $60.7 million to finance a significant portion of the cost of the Arkoma Connector Pipeline.
72
- •
- Sold the SMR for net proceeds of approximately $71.6 million.
- •
- Sold our 50% equity interest in Starfish for net proceeds of approximately $24.5 million, subject to post-closing adjustments for net working capital.
As a result of these financing activities, which are discussed in further detail below, management believes that expenditures for our current capital projects will be funded with cash flows from operations, current cash balances, contributions by our joint venture partners for capital projects encompassed by the joint venture and our current borrowing capacity under the expanded revolving credit facility. However, it may be necessary to raise additional funds to finance our future capital requirements. Our access to capital markets can be impacted by factors outside our control, including economic conditions; however, we believe that our strong cash flows and balance sheet, renewal and expansion of our credit facility and our credit rating will provide us with adequate access to funding given our expected cash needs. Any new borrowing cost would be affected by market conditions and long-term debt ratings assigned by independent rating agencies. As of February 22, 2010, our debt ratings were B2 with a Stable outlook by Moody's Investors Service and B+ with a Stable outlook by Standard & Poor's. Changes in our operating results, cash flows or financial position could impact the ratings assigned by the various rating agencies. Should our credit ratings be adjusted downward, we may incur higher costs to borrow, which could have a material impact on our financial condition and results of operations.
Debt Financing Activities
Effective March 2, 2009, the revolving credit facility was amended in order to accommodate the MarkWest Liberty Midstream joint venture with M&R and the available credit facility was expanded to $435.6 million to provide additional liquidity. Under the terms of the amendment, the accordion feature was reset to $200.0 million of uncommitted funds. The term of the original credit agreement has been reduced by one year and is now due on February 20, 2012. Under the provisions of the Partnership Credit Agreement we are subject to a number of restrictions and covenants. These covenants are used to calculate the available borrowing capacity on a quarterly basis. As of February 22, 2010, we had $10.1 million of borrowings outstanding and $37.5 million of letters of credit outstanding under the revolving credit facility, leaving approximately $388.0 million available for borrowing.
On May 26, 2009, we completed a private placement of $150.0 million in aggregate principal amount of 6.875% senior unsecured notes due 2014 to qualified institutional buyers under Rule 144A. We received proceeds of approximately $113.8 million, after deducting initial purchasers' discounts and the expenses of the private placement. The proceeds were primarily used to repay borrowings under our revolving credit facility.
As of December 31, 2009, we had four series of senior notes outstanding: $225.0 million aggregate principal issued in October 2004 and due November 2014 ("2014 Senior Notes"); $150.0 million aggregate principal issued in May 2009 and due November 2014 with terms substantially the same as the 2014 Senior Notes ("2014 Senior Notes—Mirror"); $275.0 million aggregate principal issued in July 2006 and due July 2016 ("2016 Senior Notes"); and $500.0 million aggregate principal issued in April and May 2008 and due April 2018 ("2018 Senior Notes" and all together with the 2014 Senior Notes, 2014 Senior Notes—Mirror, and 2016 Senior Notes, the "Senior Notes"). For further discussion of the Senior Notes see Note 19 of the accompanying Notes to Consolidated Financial Statements included in Item 8 of this Form 10-K.
The indentures governing the Senior Notes limit our activity, including activity of our restricted subsidiaries. The indentures place limits on our ability to incur additional indebtedness; declare or pay dividends or distributions or redeem, repurchase or retire equity interests or subordinated indebtedness; make investments; incur liens; create any consensual limitation on the ability of our restricted
73
subsidiaries to pay dividends or distributions, make loans or transfer property to us; engage in transactions with our affiliates; sell assets, including equity interests of our subsidiaries; make any payment on or with respect to, or purchase, redeem, defease or otherwise acquire or retire for value any subordinated obligation or guarantor subordination obligation (except principal and interest at maturity); and consolidate, merge or transfer assets.
The Partnership Credit Agreement limits our ability to enter into transactions with parties that require margin calls under certain derivative instruments. The Partnership Credit Agreement prevents members of the participating bank group from requiring margin calls. As of February 22, 2010, approximately 95% of our derivative positions, measured volumetrically, are with members of the participating bank group and are not subject to margin deposit requirements. We believe this arrangement gives us additional liquidity as it allows us to enter into derivative instruments without utilizing cash for margin calls or requiring the use of letters of credit; however, there is no certainty that the members of our bank group will continue to participate and in such case, a portion of our available credit could be used for derivative instruments instead of future growth.
Equity Offerings
On June 10, 2009, we completed a public offering of approximately 3.34 million newly issued common units, which included the exercise of the overallotment option by the underwriters, representing limited partner interests at a purchase price of $18.15 per common unit. Net proceeds of approximately $57.7 million were used to partially fund our 2009 capital expenditure requirements and the remainder was used to pay down borrowings under our revolving credit facility of the Partnership Credit Agreement.
On August 18, 2009, we completed a public offering of approximately 6.03 million newly issued common units, which included the exercise of the overallotment option by the underwriters, representing limited partner interests at a purchase price of $20.95 per common unit. Net proceeds of approximately $120.9 million were used to partially fund our 2009 capital expenditure requirements and the remainder was used to pay down borrowings under our revolving credit facility of the Partnership Credit Agreement.
Alternative Financing Arrangements
On February 27, 2009, we entered into a joint venture agreement in which M&R acquired a 40% interest in MarkWest Liberty Midstream (see Note 4 of the accompanying Notes to Consolidated Financial Statements in Item 8 of this Form 10-K for further details of the joint venture agreement). MarkWest Liberty Midstream operates our natural gas midstream business in and around the Marcellus Shale in western Pennsylvania and northern West Virginia. The 2009 capital expenditures related to projects included within MarkWest Liberty Midstream were approximately $181.5 million. In accordance with the joint venture agreement, M&R made contributions of $200.0 million to MarkWest Liberty Midstream in 2009, offsetting our total 2009 cash requirements.
Effective November 1, 2009, we and M&R executed the Amended Liberty Agreement. Under the Amended Liberty Agreement, M&R will increase its participation in MarkWest Liberty Midstream by at least an additional $150.0 million. Additionally, we and M&R will maintain a 60%/40% respective ownership interest in MarkWest Liberty Midstream until January 1, 2011, at which time M&R's ownership interest will increase from 40% to 49%. We and M&R will jointly fund the capital requirements of MarkWest Liberty Midstream at agreed upon levels until our contributed capital is proportionate to our 51% ownership interest (the "Equalization Date"), which is expected to occur on or before December 31, 2012. Following the Equalization Date, M&R will have pre-emptive rights to maintain its ownership interest in MarkWest Liberty Midstream in a range of between 45% and 49%. MarkWest Liberty Midstream's capital plan for 2010 through 2012 has not been finalized, so the exact
74
timing of the contributions by both parties is currently uncertain. If the Equalization Date has not occurred by December 31, 2012, M&R may elect that we contribute the amount of the shortfall, or may elect that we continue to fund 100% of MarkWest Liberty Midstream's capital expenditures until our total contributed capital is proportionate to our 51% ownership interest.
On May 1, 2009, we entered into a joint venture with ArcLight (see Note 4 of the accompanying Notes to Consolidated Financial Statements in Item 8 of this Form 10-K for further details of the joint venture agreement). The joint venture entity, MarkWest Pioneer, operates a 50-mile FERC regulated pipeline that connects our gathering systems in the Woodford Shale to the Midcontinent Express Pipeline and the Gulf Crossing Pipeline. ArcLight acquired a 50% equity interest in MarkWest Pioneer for a total purchase price of $62.5 million. ArcLight contributed cash of $31.25 million at closing and an additional $31.25 million in July 2009, corresponding with the pipeline's commercial operations date. We retain a 50% equity interest and we were obligated to fund all capital expenditures necessary to complete construction of the Arkoma Connector Pipeline in excess of $125.0 million.
On September 1, 2009, we completed the sale of the SMR currently being constructed at our Javelina gas processing and fractionation facility in Corpus Christi, Texas. Under the terms of the agreement, we received proceeds of $73.1 million and the purchaser will complete the construction of the SMR, which is expected to cost an additional $20 million. A related hydrogen supply agreement was executed under which we will receive all of the hydrogen produced by the SMR for the next 20 years in exchange for processing fees and the reimbursement of certain other expenses. We are deemed to have continuing involvement with the SMR as a result of certain provisions in the related agreements. Therefore, the transaction is treated as a financing arrangement under GAAP, not an asset sale. We used the proceeds from the transaction to pay down amounts outstanding under our revolving credit facility and for the continued development of other strategic projects.
On December 31, 2009, we sold our 50% equity interest in Starfish and received proceeds of approximately $25.0 million. The purchase price is subject to post-closing adjustments to net working capital, which takes into account the cost of repairs performed prior to closing from damage caused by Hurricane Ike in 2008.
In the future, we may raise additional capital through the issuance of debt and equity securities under our shelf registration statement or in private transactions.
Liquidity Risks and Uncertainties
Our ability to pay distributions to our unitholders and to fund planned capital expenditures and make acquisitions will depend upon our future operating performance. That, in turn, will be affected by prevailing economic conditions in our industry, as well as financial, business and other factors, some of which are beyond our control. The global economic recession had a significant adverse impact on commodity prices during 2009. Although NGL and natural gas prices have improved somewhat in the latter part of 2009 compared to the end of 2008, our operating performance could continue to be negatively impacted if the improvements in commodity prices are not sustained.
The prevailing uncertainty that exists in the financial markets has created an increased risk of counterparty default that could impact our liquidity in several ways. During 2010, we expect that we will be required to borrow additional amounts under our revolving credit facility. However, our ability to access these funds could be adversely impacted by the failure of one or more of the members of the participating bank group. Although management believes that the participating members are financially sound, an increased risk does exist. Also, because the participating members of our bank group are the counterparties to most of our derivative instruments, the failure of one of more members could significantly reduce the cash flow from operations related to the settlement of these positions. The cash flows generated by our operations could also be significantly reduced if any of our major customers defaulted. The creditworthiness of our trade customers is continuously monitored, and we believe that
75
our current group of customers are sound and represent no abnormal credit risk. Additionally, our supply of gas is dependent on a few large producers in each of our operating segments. If any of these producers were forced to significantly curtail or cease production due to economic adversity, our cash flows from operations could be significantly reduced.
Cash Flow
The following table summarizes cash inflows (outflows) (in thousands).
| |
Year ended December 31, | |
||||||||
|---|---|---|---|---|---|---|---|---|---|---|
| |
2009 | 2008 | Change | |||||||
Net cash provided by operating activities |
$ | 223,101 | $ | 226,995 | $ | (3,894 | ) | |||
Net cash used in investing activities |
(461,753 | ) | (909,265 | ) | 447,512 | |||||
Net cash provided by financing activities |
333,083 | 647,896 | (314,813 | ) | ||||||
Net cash provided by operating activities decreased primarily due to a decrease of $27.9 million in operating income, excluding derivative gains and losses, in our operating segments. Operating income decreased in our Southwest and Gulf Coast segments, and was partially offset by an increase in Liberty, a new segment in 2009. Cash provided by operations for the year ended December 31, 2008 also included $40.3 million of inflows from the return of margin deposits which did not recur in 2009. These decreases were offset by an increase of $44.6 million in net cash received from the settlement of derivative positions and an increase in operating cash flows provided by working capital in 2009.
Net cash used in investing activities decreased primarily due to cash paid as consideration in the Merger of $269.9 million in 2008. In 2008, we acquired PQ Assets for $41.3 million and there were no acquisitions in 2009. Cash contributed to equity investments in 2008 were higher by $28.8 million mainly due to the contribution to acquire Centrahoma. In addition, capital expenditures decreased by $88.7 million mainly in our Southwest segment offset by increases in our Liberty segment. Also, in 2009 we received proceeds of $25.0 million related to the sale of our equity interest in Starfish.
Net cash provided by financing activities decreased primarily due to the $636.3 million decrease of net borrowings on long-term debt. This decrease was offset by $194.5 million in net contributions from M&R to MarkWest Liberty Midstream, $60.7 million in net proceeds from the sale of equity interest in the Arkoma joint venture, and $73.1 million in proceeds from the SMR Transaction. See Debt Financing Activities, Equity Offerings and Alternative Financing Arrangements above for a discussion of our 2009 financing activities.
76
Total Contractual Cash Obligations
A summary of our total contractual cash obligations as of December 31, 2009, is as follows (in thousands):
| |
Payment Due by Period | ||||||||||||||||
|---|---|---|---|---|---|---|---|---|---|---|---|---|---|---|---|---|---|
Type of obligation
|
Total Obligation | Due in 2010 | Due in 2011-2012 | Due in 2013-2014 | Thereafter | ||||||||||||
Long-term debt |
$ | 1,209,300 | $ | — | $ | 59,300 | $ | 375,000 | $ | 775,000 | |||||||
Interest expense on long-term debt(1) |
649,825 | 96,020 | 189,445 | 181,516 | 182,844 | ||||||||||||
Operating leases(2) |
59,367 | 9,170 | 12,980 | 14,293 | 22,924 | ||||||||||||
Purchase obligations(3) |
16,723 | 16,723 | — | — | — | ||||||||||||
Natural gas purchase obligations(4) |
154,545 | 28,892 | 60,150 | 61,889 | 3,614 | ||||||||||||
SMR Liability(5) |
348,240 | 14,510 | 34,824 | 34,824 | 264,082 | ||||||||||||
Other long-term liabilities reflected on the Consolidated Balance Sheets: |
|||||||||||||||||
Asset retirement obligation(6) |
2,877 | — | — | — | 2,877 | ||||||||||||
Other(7) |
7,566 | 1,636 | 2,667 | 1,280 | 1,983 | ||||||||||||
Total contractual cash obligations |
$ | 2,448,443 | $ | 166,951 | $ | 359,366 | $ | 668,802 | $ | 1,253,324 | |||||||
- (1)
- Assumes
that our outstanding borrowings at December 31, 2009 remain outstanding until their respective maturity dates and we incur interest expense
at 5.25% on the Partnership Credit Facility revolver, 6.875% on the 2014 Senior Notes and 2014 Senior Notes—Mirror, 8.5% on the 2016 Senior Notes and 8.75% on the 2018 Senior Notes.
- (2)
- Amounts
relate primarily to compressor rentals and our office leases.
- (3)
- Represents
purchase orders and contracts related to purchase of property, plant and equipment. Purchase obligations exclude current and
long-term unrealized losses on derivative instruments included on the accompanying Consolidated Balance Sheets, which represent the current fair value of various derivative contracts and
do not represent future cash purchase obligations. These contracts are generally settled financially at the difference between the future market price and the contractual price and may result in cash
payments or cash receipts in the future, but generally do not require delivery of physical quantities of the underlying commodity.
- (4)
- Natural
gas purchase obligations consist primarily of a purchase agreement with a producer in the Appalachia region. The contract provides for the purchase
of keep-whole volumes at a specific price and is a component of a broader regional arrangement. The contract price is designed to share a portion of the frac spread with the producer and
as a result, the amounts reflected for the obligation exceed the cost of purchasing the keep-whole volumes at a market price. The contract is considered an embedded derivative; see
Note 7 of the accompanying Notes to Consolidated Financial Statements included in Item 8 for the fair value of the frac spread sharing component.
- (5)
- Represents
amounts due under hydrogen supply agreement (see Note 6 of the accompanying Notes to Consolidated Financial Statements included in
Item 8 of this Form 10-K).
- (6)
- Excludes
accretion expense of $10.7 million. The total amount to be paid is approximately $13.6 million.
- (7)
- Primarily represents long-term portion of deferred revenue.
77
Off-Balance Sheet Arrangements
We do not engage in off-balance sheet financing activities.
Effects of Inflation
Inflation did not have a material impact on our results of operations for the years ended December 31, 2009, 2008 or 2007. Although the impact of inflation has been insignificant in recent years, it is still a factor in the United States economy and may increase the cost to acquire or replace property, plant and equipment. It may also increase the costs of labor and supplies. To the extent permitted by competition, regulation and our existing agreements, we have and will continue to pass along increased costs to our customers in the form of higher fees.
Critical Accounting Policies and Estimates
The preparation of financial statements in conformity with GAAP requires management to make estimates and assumptions that affect the reported amounts of assets and liabilities, disclosure of contingent assets and liabilities at the date of the financial statements, and the reported amounts of revenues and expenses during the reporting period. Actual results could differ from those estimates.
The policies and estimates discussed below are considered by management to be critical to an understanding of our financial statements, because their application requires the most significant judgments from management in estimating matters for financial reporting that are inherently uncertain. See Note 2 of the accompanying Notes to the Consolidated Financial Statements included in Item 8 of this Form 10-K for additional information on these policies and estimates, as well as a discussion of additional accounting policies and estimates.
Description
|
Judgments and Uncertainties | Effect if Actual Results Differ from Estimates and Assumptions |
||
|---|---|---|---|---|
| Inventories | ||||
Inventories, which consist primarily of natural gas, propane, and other NGLs, are recorded at the lower of weighted-average cost or market value. |
Due to the short-term volatility in commodity prices and differences based on geographic location, judgment is required in determining the market value of inventory. We estimate the market value based on the expected sales prices during the periods in which inventory will be sold. |
As a result of the lower of cost or market analysis performed at December 31, 2009, no adjustment was required to record inventories at the lower of cost or market. If the actual sales prices are 10% lower than the expected prices used in our analysis, there would still be no required adjustment and no impact on the reported net income before taxes. |
78
Description
|
Judgments and Uncertainties | Effect if Actual Results Differ from Estimates and Assumptions |
||
|---|---|---|---|---|
| Intangible Assets | ||||
Intangible assets are comprised of customer contracts and relationships acquired in business combinations, recorded under the purchase method of accounting at their estimated fair values at the date of acquisition. Using relevant information and assumptions, management determines the fair value of acquired identifiable intangible assets. |
The fair value of customer contracts is generally calculated using the income approach. The key assumptions include contract renewals, economic incentives to retain customers, historical volumes, current and future capacity of the gathering system, pricing volatility, and the discount rate. |
If the actual results differ significantly from the assumptions used to determine the fair value and economic lives of intangible assets, then a significant impairment charge could be recorded (see Impairment of Long-Lived Assets below) or amortization expense could increase. |
||
Amortization of intangibles with definite lives is calculated using the straight-line method over the estimated useful life of the intangible asset. The estimated economic life is determined by assessing the life of the assets to which the contracts and relationships relate, likelihood of renewals, the projected reserves, competitive factors, regulatory or legal provisions, and maintenance and renewal costs. |
||||
79
Description
|
Judgments and Uncertainties | Effect if Actual Results Differ from Estimates and Assumptions |
||
|---|---|---|---|---|
| Impairment of Long-Lived Assets | ||||
Management evaluates our long-lived assets, including intangibles, for impairment when events or changes in circumstances warrant such a review. A long-lived asset group is considered impaired when the estimated undiscounted cash flows from such asset group are less than the asset group's carrying value. In that event, a loss is recognized to the extent that the carrying value exceeds the fair value of the long-lived asset group. |
Management considers the volume of reserves behind the asset and future NGL product and natural gas prices to estimate cash flows for each asset group. The amount of additional reserves developed by future drilling activity depends, in part, on expected commodity prices. Projections of reserves, drilling activity and future commodity prices are inherently subjective and contingent upon a number of variable factors, many of which are difficult to forecast. |
During 2009 we wrote down the value of long-lived assets for Wirth Gathering Partnership to zero resulting in a $5.9 million impairment expense. As of December 31, 2009, there were no indicators of additional impairment for any of our asset groups. A significant variance in any of these assumptions or factors could materially affect future cash flows, which could result in the impairment of an asset. A 10% decrease in the estimated future cash flows used in our impairment analysis would have indicated a potential impairment for one asset group with a total net book value of $51.8 million. |
||
80
Description
|
Judgments and Uncertainties | Effect if Actual Results Differ from Estimates and Assumptions |
||
|---|---|---|---|---|
| Impairment of Goodwill | ||||
Goodwill is the cost of an acquisition less the fair value of the net assets of the acquired business. We evaluate goodwill for impairment annually as of November 30, and whenever events or changes in circumstances indicate it is more likely than not that the fair value of a reporting unit is less than its carrying amount. |
Management determines the fair value of our reporting units using the income and market approaches. These approaches are also used when allocating the purchase price to acquired assets and liabilities. These types of analyses require us to make assumptions and estimates regarding industry and economic factors such as relevant commodity prices and production volumes. It is our policy to conduct impairment testing based on our current business strategy in light of present industry and economic conditions, as well as future expectations. |
As a result of the goodwill impairment testing completed in 2009, we recorded no impairment expense. The fair value of each reporting unit with goodwill was significantly in excess of its carrying value. |
||
Management was also required to make certain assumptions when identifying the reporting units and determining the amount of goodwill allocated to each reporting unit. The method of allocating goodwill resulting from the Merger involved estimating the fair value of the reporting units and allocating the purchase price of the Merger to each reporting unit. Goodwill was then calculated for each reporting unit as the excess of the allocated purchase price over the estimated fair value of the net assets. |
||||
81
Description
|
Judgments and Uncertainties | Effect if Actual Results Differ from Estimates and Assumptions |
||
|---|---|---|---|---|
| Impairment of Equity Investments | ||||
We evaluate our equity method investments for impairment whenever events or changes in circumstances indicate, in management's judgment, that the carrying value of such investment may have experienced a decline in value. When evidence of an other-than-temporary loss in value has occurred, we compare the estimated fair value of the investment to the carrying value of the investment to determine whether an impairment has occurred. |
Our impairment loss calculations require management to apply judgment in estimating future cash flows and asset fair values, including forecasting useful lives of the assets, assessing the probability of differing estimated outcomes, and selecting the discount rate that reflects the risk inherent in future cash flows. We assess the fair value of our equity method investments using commonly accepted techniques, and may use more than one method, including, but not limited to, recent third party comparable sales and discounted cash flow models. |
Management determined that there were no material events or changes in circumstances that would indicate an other-than-temporary decline in value of our investment in Centrahoma. |
||
Accounting for Share-Based Compensation |
||||
Our long-term incentive plans permit the grant of restricted units, phantom units, unit options and substitute awards. As of December 31, 2009, only phantom units are issued and outstanding under these plans. Compensation expense is recognized over the vesting period or service period of the related awards. Compensation expense is only recognized for those awards for which vesting is probable. The vesting of performance-based awards is contingent upon us meeting specific financial targets in fiscal years 2009, 2010 and 2011. |
We must exercise judgment and make several assumptions regarding the future profits and cash flows of the Partnership in order to estimate the number of performance-based units for which vesting is probable. |
As of December 31, 2009, management expected none of the outstanding performance-based awards related to fiscal years 2009, 2010 and 2011 performance to vest and recorded no compensation expense accordingly. If management had concluded that vesting of all of the performance awards was probable, an additional $5.8 million of compensation expense would have been recognized during the year ended December 31, 2009. |
||
82
Description
|
Judgments and Uncertainties | Effect if Actual Results Differ from Estimates and Assumptions |
||
|---|---|---|---|---|
| Accounting for Risk Management Activities and Derivative Financial Instruments | ||||
Our derivative financial instruments are recorded at fair value in the accompanying Consolidated Balance Sheets. Changes in fair value and settlements are reflected in our earnings in the accompanying Consolidated Statements of Operations as gains and losses related to revenue, purchased product costs, facility expenses, interest income and/or miscellaneous income. |
When available, quoted market prices or prices obtained through external sources are used to determine a financial instrument's fair value. The valuation of Level 2 financial instruments is based on quoted market prices for similar assets and liabilities in active markets and other inputs that are observable. However, for other financial instruments for which quoted market prices are not available, the fair value is based on inputs that are largely unobservable. These instruments are classified as Level 3 under the fair value hierarchy. The fair value of these instruments are determined based on pricing models developed primarily from historical and expected correlations with quoted market prices. All fair value measurements are appropriately adjusted for nonperformance risk. |
If the assumptions used in the pricing models for our Level 2 and 3 financial instruments are inaccurate or if we had used an alternative valuation methodology, the estimated fair value may have been different, and we may be exposed to unrealized losses or gains that could be material. A 10% difference in our estimated fair value of Level 2 and 3 derivatives at December 31, 2009 would have affected net income by approximately $14.8 million for the year ended December 31, 2009. |
83
Description
|
Judgments and Uncertainties | Effect if Actual Results Differ from Estimates and Assumptions |
||
|---|---|---|---|---|
| Variable Interest Entities | ||||
We evaluate all legal entities in which we hold an ownership or other pecuniary interest to determine if the entity is a variable interest entity ("VIE"). Our interests in a VIE are referred to as variable interests. A variable interest can have the obligation to absorb expected losses and/or the right to receive the residual benefits of a VIE. When we conclude that we hold a variable interest in a VIE we must determine if we are the entity's primary beneficiary. A primary beneficiary absorbs a majority of the entity's expected losses or receives a majority of its residual returns, or both. We consolidate any VIE when we determine that we are the primary beneficiary. We must disclose the nature of any variable interests in a VIE that is not consolidated. |
Significant judgment is exercised in determining that a legal entity is a VIE and in evaluating our interest in a VIE. We use qualitative and quantitative analysis to determine if an entity is a VIE. We evaluate the entity's need for continuing financial support; the equity holder's lack of the traditional characteristics of a controlling financial interest; and/or if an equity holders voting interests are disproportionate to its obligation to absorb expected losses or receive residual returns. We evaluate our variable interests in a VIE to determine whether we are the primary beneficiary. We use qualitative and quantitative analysis to determine if we absorb a majority of the VIE's expected losses and/or have the right to a majority of its residual returns. In circumstances where other variable interests are deemed to be our de-facto agents, we qualitatively determine if we are involved in substantially all of the VIE's activities, which would indicate we are the primary beneficiary. When reconsideration events occur, we evaluate changes in the design or activities of an entity and changes in our interests, including our status as the primary beneficiary to determine if the changes require us to revise our previous conclusions. |
MarkWest Liberty Midstream and MarkWest Pioneer are VIEs and we are considered the primary beneficiary; we have a controlling financial interest in the Wirth Gathering Partnership and the Brightstar Partnership, which are less-than wholly-owned. All of these entities are consolidated subsidiaries. Changes in the design or nature of the activities of any of these entities, or our involvement with an entity may require us to reconsider our conclusions on the entity's status as a VIE and/or our status as the primary beneficiary. Such reconsideration could result in the deconsolidation of the affected subsidiary. The deconsolidation of a subsidiary would have a significant impact on our financial statements. We account for our ownership interest in Centrahoma under the equity method and have determined it is not a VIE. However, changes in the design or nature of the activities of the entity may require us to reconsider our conclusions. Such reconsideration would require the identification of the variable interests in the entity and a determination on which party is the entity's primary beneficiary. If Centrahoma were considered a VIE and we were determined to be the primary beneficiary, the change could cause us to consolidate the entity. The consolidation of an entity that is currently accounted for under the equity method could have a significant impact on our financial statements. |
84
Recent Accounting Pronouncements
Refer to Note 2—Recent Accounting Pronouncements of the accompanying Notes to Consolidated Financial Statements included in Item 8 of this Form 10-K for information regarding recent accounting pronouncements.
ITEM 7A. Quantitative and Qualitative Disclosures About Market Risk
Market risk includes the risk of loss arising from adverse changes in market rates and prices. We face market risk from commodity price changes and, to a lesser extent, interest rate changes.
Refer to Note 7 of the accompanying Notes to Consolidated Financial Statements included in Item 8 of this Form 10-K for information and disclosures regarding our commodity price risk.
The following table provides information on the derivative positions that we have entered into subsequent to December 31, 2009.
WTI Crude Collars
|
Volumes (Bbl/d) |
WAVG Floor (Per Bbl) |
WAVG Cap (Per Bbl) |
|||||||
|---|---|---|---|---|---|---|---|---|---|---|
2011 |
1,673 | $ | 75.00 | $ | 90.30 | |||||
Interest Rate
Our primary interest rate risk exposure results from the revolving portion of the Partnership Credit Agreement that has a borrowing capacity of $435.6 million. As of February 22, 2010, we have $10.1 million of borrowings outstanding on the revolving credit facility. The debt related to this agreement bears interest at variable rates that are tied to either the U.S. prime rate or LIBOR at the time of borrowing.
We may make use of interest rate swap agreements in the future, to adjust the ratio of fixed and floating rates in our debt portfolio. In July 2009, we entered into fixed-to-variable interest rate swap agreements having a combined notional principal amount of $275.0 million. The hedges were intended to hedge against changes in fair value due to changes in the benchmark interest rate (one-month LIBOR). We hedged a portion of our senior notes that mature on November 1, 2014. All outstanding interest rate swaps were settled in January 2010.
Long-Term Debt
|
Interest Rate | Lending Limit | Due Date | Outstanding at December 31, 2009 |
|||||||
|---|---|---|---|---|---|---|---|---|---|---|---|
Partnership Credit Agreement |
Variable | $ | 435.6 million | February 2012 | $ | 59.3 million | |||||
2014 Senior Notes |
Fixed | $ | 225.0 million | November 2014 | $ | 225.0 million | |||||
2014 Senior Notes—Mirror |
Fixed | $ | 150.0 million | November 2014 | $ | 150.0 million | |||||
2016 Senior Notes |
Fixed | $ | 275.0 million | July 2016 | $ | 275.0 million | |||||
2018 Senior Notes |
Fixed | $ | 500.0 million | April 2018 | $ | 500.0 million | |||||
Based on our overall interest rate exposure at December 31, 2009, a hypothetical increase or decrease of one percentage point in interest rates applied to borrowings under our credit facility would change earnings by approximately $3.3 million over a 12-month period. Based on our overall interest rate exposure at February 22, 2010, a hypothetical increase or decrease of one percentage point in interest rates applied to borrowings under our credit facility would not have a material impact on our earnings over a 12-month period.
85
ITEM 8. Financial Statements and Supplementary Data
Index to Consolidated Financial Statements
All omitted schedules have been omitted because they are not required or because the required information is contained in the financial statements or notes thereto.
86
REPORT OF INDEPENDENT REGISTERED PUBLIC ACCOUNTING FIRM
To
the Board of Directors of
MarkWest Energy GP, L.L.C.
Denver, Colorado
We have audited the accompanying consolidated balance sheets of MarkWest Energy Partners, L.P. and subsidiaries (the "Partnership") as of December 31, 2009 and 2008, and the related consolidated statements of operations, changes in partners' capital and comprehensive income, and cash flows for each of the three years in the period ended December 31, 2009. These financial statements are the responsibility of the Partnership's management. Our responsibility is to express an opinion on the financial statements based on our audits.
We conducted our audits in accordance with the standards of the Public Company Accounting Oversight Board (United States). Those standards require that we plan and perform the audit to obtain reasonable assurance about whether the financial statements are free of material misstatement. An audit includes examining, on a test basis, evidence supporting the amounts and disclosures in the financial statements. An audit also includes assessing the accounting principles used and significant estimates made by management, as well as evaluating the overall financial statement presentation. We believe that our audits provide a reasonable basis for our opinion.
In our opinion, such consolidated financial statements present fairly, in all material respects, the financial position of MarkWest Energy Partners, L.P. and subsidiaries as of December 31, 2009 and 2008, and the results of their operations and their cash flows for each of the three years in the period ended December 31, 2009, in conformity with accounting principles generally accepted in the United States of America.
We have also audited, in accordance with the standards of the Public Company Accounting Oversight Board (United States), the Partnership's internal control over financial reporting as of December 31, 2009, based on the criteria established in Internal Control—Integrated Framework issued by the Committee of Sponsoring Organizations of the Treadway Commission and our report dated March 1, 2010 expressed an unqualified opinion on the Partnership's internal control over financial reporting.
/s/ DELOITTE & TOUCHE LLP
Denver,
Colorado
March 1, 2010
87
MARKWEST ENERGY PARTNERS, L.P.
CONSOLIDATED BALANCE SHEETS
(in thousands)
| |
December 31, 2009 | December 31, 2008 | |||||||
|---|---|---|---|---|---|---|---|---|---|
ASSETS |
|||||||||
Current assets: |
|||||||||
Cash and cash equivalents |
$ | 97,752 | $ | 3,321 | |||||
Receivables, net of allowances of $162 and $175, respectively |
140,969 | 101,849 | |||||||
Inventories |
29,075 | 31,556 | |||||||
Fair value of derivative instruments |
8,821 | 126,949 | |||||||
Deferred income taxes |
12,228 | — | |||||||
Other current assets |
10,674 | 11,748 | |||||||
Total current assets |
299,519 | 275,423 | |||||||
Property, plant and equipment |
2,154,644 | 1,650,692 | |||||||
Less: accumulated depreciation |
(173,000 | ) | (81,167 | ) | |||||
Total property, plant and equipment, net |
1,981,644 | 1,569,525 | |||||||
Other long-term assets: |
|||||||||
Investment in unconsolidated affiliates |
29,633 | 46,092 | |||||||
Intangibles, net of accumulated amortization of $83,735 and $42,972, respectively |
654,411 | 695,917 | |||||||
Goodwill |
9,421 | 9,421 | |||||||
Deferred financing costs, net of accumulated amortization of $6,990 and $3,248, respectively |
21,027 | 16,682 | |||||||
Deferred contract cost, net of accumulated amortization of $1,638 and $1,326, respectively |
1,612 | 1,924 | |||||||
Fair value of derivative instruments |
15,810 | 55,389 | |||||||
Other long-term assets |
1,660 | 2,681 | |||||||
Total assets |
$ | 3,014,737 | $ | 2,673,054 | |||||
LIABILITIES AND PARTNERS' CAPITAL |
|||||||||
Current liabilities: |
|||||||||
Accounts payable |
$ | 87,832 | $ | 72,837 | |||||
Accrued liabilities |
137,687 | 111,034 | |||||||
Deferred income taxes |
— | 2,682 | |||||||
Fair value of derivative instruments |
60,464 | 37,633 | |||||||
Total current liabilities |
285,983 | 224,186 | |||||||
Deferred income taxes |
11,034 | 47,465 | |||||||
Fair value of derivative instruments |
62,519 | 14,801 | |||||||
Long-term debt, net of discounts of $39,417 and $11,735, respectively |
1,170,072 | 1,172,965 | |||||||
Other long-term liabilities |
105,736 | 5,878 | |||||||
Commitments and contingencies (see Note 21) |
|||||||||
Partners' Capital: |
|||||||||
MarkWest Energy Partners, L.P. partners' capital (66,275 and 56,640 units outstanding, respectively) |
1,096,654 | 1,204,458 | |||||||
Non-controlling interest in consolidated subsidiaries |
282,739 | 3,301 | |||||||
Total partners' capital |
1,379,393 | 1,207,759 | |||||||
Total liabilities and partners' capital |
$ | 3,014,737 | $ | 2,673,054 | |||||
The accompanying notes are an integral part of these consolidated financial statements.
88
MARKWEST ENERGY PARTNERS, L.P.
CONSOLIDATED STATEMENTS OF OPERATIONS
(in thousands, except per unit amounts)
| |
Year ended December 31, | |||||||||||
|---|---|---|---|---|---|---|---|---|---|---|---|---|
| |
2009 | 2008 | 2007 | |||||||||
Revenue: |
||||||||||||
Revenue |
$ | 858,635 | $ | 1,060,662 | $ | 845,727 | ||||||
Derivative (loss) gain |
(120,352 | ) | 277,828 | (159,970 | ) | |||||||
Total revenue |
738,283 | 1,338,490 | 685,757 | |||||||||
Operating expenses: |
||||||||||||
Purchased product costs |
408,826 | 615,902 | 487,892 | |||||||||
Derivative loss related to purchased product costs |
68,883 | 22,371 | 15,192 | |||||||||
Facility expenses |
126,977 | 103,682 | 70,863 | |||||||||
Derivative (gain) loss related to facility expenses |
(373 | ) | 644 | (14 | ) | |||||||
Selling, general and administrative expenses |
63,728 | 68,975 | 72,484 | |||||||||
Depreciation |
95,537 | 67,480 | 41,281 | |||||||||
Amortization of intangible assets |
40,831 | 38,483 | 16,672 | |||||||||
Loss on disposal of property, plant and equipment |
1,677 | 178 | 7,743 | |||||||||
Accretion of asset retirement obligations |
198 | 129 | 114 | |||||||||
Impairment of goodwill and long-lived assets |
5,855 | 36,351 | 356 | |||||||||
Total operating expenses |
812,139 | 954,195 | 712,583 | |||||||||
(Loss) income from operations |
(73,856 | ) | 384,295 | (26,826 | ) | |||||||
Other income (expense): |
||||||||||||
Earnings from unconsolidated affiliates |
3,505 | 90 | 5,309 | |||||||||
Impairment of unconsolidated affiliate |
— | (41,449 | ) | — | ||||||||
Gain on sale of unconsolidated affiliate |
6,801 | — | — | |||||||||
Interest income |
349 | 3,769 | 4,547 | |||||||||
Interest expense |
(87,419 | ) | (64,563 | ) | (39,435 | ) | ||||||
Amortization of deferred financing costs and discount (a component of interest expense) |
(9,718 | ) | (8,299 | ) | (2,983 | ) | ||||||
Derivative gain related to interest expense |
2,509 | — | — | |||||||||
Miscellaneous income (expense), net |
2,459 | (241 | ) | 233 | ||||||||
(Loss) income before provision for income tax |
(155,370 | ) | 273,602 | (59,155 | ) | |||||||
Provision for income tax (benefit) expense: |
||||||||||||
Current |
8,072 | 15,032 | 23,869 | |||||||||
Deferred |
(50,088 | ) | 53,798 | (48,518 | ) | |||||||
Total provision for income tax |
(42,016 | ) | 68,830 | (24,649 | ) | |||||||
Net (loss) income |
(113,354 | ) | 204,772 | (34,506 | ) | |||||||
Net (income) loss attributable to non-controlling interest |
(5,314 | ) | 3,301 | (4,853 | ) | |||||||
Net (loss) income attributable to the Partnership |
$ | (118,668 | ) | $ | 208,073 | $ | (39,359 | ) | ||||
Net (loss) income attributable to the Partnership's common unitholders per common unit(1) (Note 25): |
||||||||||||
Basic |
$ | (1.97 | ) | $ | 4.02 | $ | (1.72 | ) | ||||
Diluted |
$ | (1.97 | ) | $ | 4.02 | $ | (1.72 | ) | ||||
Weighted average number of outstanding common units(1): |
||||||||||||
Basic |
60,957 | 51,013 | 22,854 | |||||||||
Diluted |
60,957 | 51,016 | 22,854 | |||||||||
Cash distribution declared per common unit(1) |
$ | 2.560 | $ | 2.059 | $ | 0.703 | ||||||
- (1)
- All unit and per unit data where applicable has been adjusted to reflect the Exchange Ratio to give effect to the Merger (see Note 3).
The accompanying notes are an integral part of these consolidated financial statements.
89
MARKWEST ENERGY PARTNERS, L.P.
CONSOLIDATED STATEMENTS OF CHANGES IN
PARTNERS' CAPITAL AND COMPREHENSIVE (LOSS) INCOME
(in thousands)
| |
MarkWest Energy Partners, L.P. Unitholders |
|
|
||||||||||||||
|---|---|---|---|---|---|---|---|---|---|---|---|---|---|---|---|---|---|
| |
Common Units(1) |
Partners' Capital |
Accumulated Other Comprehensive Income |
Non-controlling Interest |
Total | ||||||||||||
December 31, 2006 |
22,813 | $ | 40,386 | $ | 1,103 | $ | 441,572 | $ | 483,061 | ||||||||
Stock option exercises |
17 | 119 | — | — | 119 | ||||||||||||
Restricted stock activity, net of registration costs |
31 | 753 | — | — | 753 | ||||||||||||
Gain in connection with issuance of units by MarkWest Energy Partners, L.P. (net of tax of $31.5 million) |
— | 52,367 | — | — | 52,367 | ||||||||||||
APIC pool for excess tax benefits related to share-based compensation |
— | 335 | — | — | 335 | ||||||||||||
Proceeds from Mark West Energy's private placement, net |
— | — | — | 224,951 | 224,951 | ||||||||||||
Gain related to accounting for sales of stock by a subsidiary |
— | — | — | (83,844 | ) | (83,844 | ) | ||||||||||
Other |
— | (71 | ) | — | 967 | 896 | |||||||||||
Dividends paid |
— | (16,067 | ) | — | — | (16,067 | ) | ||||||||||
Distributions to non-controlling interest holders |
— | — | — | (63,916 | ) | (63,916 | ) | ||||||||||
Net (loss) income |
— |
(39,359 |
) |
— |
4,853 |
(34,506 |
) |
||||||||||
Unrealized loss on marketable securities, net of tax of $110 |
— | — | (175 | ) | — | (175 | ) | ||||||||||
Comprehensive loss |
(34,681 | ) | |||||||||||||||
December 31, 2007 |
22,861 | 38,463 | 928 | 524,583 | 563,974 | ||||||||||||
Option exercises |
98 | 375 | — | — | 375 | ||||||||||||
Share-based compensation activity |
14 | 11,560 | — | — | 11,560 | ||||||||||||
Dividends paid |
— | (4,338 | ) | — | — | (4,338 | ) | ||||||||||
Distributions paid |
— | (107,269 | ) | — | (19,651 | ) | (126,920 | ) | |||||||||
APIC pool for excess tax benefits related to share-based compensation |
— | 717 | — | — | 717 | ||||||||||||
Acquisition of partially owned entity included as part of PQ Gathering Assets, L.L.C. |
— | — | — | 2,935 | 2,935 | ||||||||||||
Other |
— | — | — | 1,032 | 1,032 | ||||||||||||
Merger and Redemption: |
|||||||||||||||||
Redemption of MarkWest Hydrocarbon, Inc. common stock |
(7,458 | ) | (240,513 | ) | — | — | (240,513 | ) | |||||||||
Conversion of restricted stock to phantom units in connection with the Merger |
(45 | ) | — | — | — | — | |||||||||||
Acquisition of General Partnership's non-controlling interest associated with the Merger |
946 | 30,078 | — | — | 30,078 | ||||||||||||
Purchase of non-controlling interest of MarkWest Energy Partners, L.P. |
34,474 | 1,095,917 | — | (502,297 | ) | 593,620 | |||||||||||
Issuance of units in public offering, net of offering costs |
5,750 | 171,395 | — | — | 171,395 | ||||||||||||
Net income (loss) |
— |
208,073 |
— |
(3,301 |
) |
204,772 |
|||||||||||
Realized gain on marketable securities, net of tax of $558 |
— | — | (928 | ) | — | (928 | ) | ||||||||||
Comprehensive income |
203,844 | ||||||||||||||||
December 31, 2008 |
56,640 | 1,204,458 | — | 3,301 | 1,207,759 | ||||||||||||
Share-based compensation activity |
275 | 5,204 | — | — | 5,204 | ||||||||||||
Distributions paid |
— | (155,307 | ) | — | (155 | ) | (155,462 | ) | |||||||||
Issuance of units in public offering, net of offering costs |
9,360 | 178,565 | — | — | 178,565 | ||||||||||||
Contributions to MarkWest Liberty Midstream joint venture, net |
— | (5,464 | ) | — | 200,000 | 194,536 | |||||||||||
Proceeds from sale of equity interest in joint venture, net |
— | (1,846 | ) | — | 62,500 | 60,654 | |||||||||||
Transfer to non-controlling interest from sale of equity interest in joint venture, net of tax |
— | (10,288 | ) | — | 11,779 | 1,491 | |||||||||||
Net (loss) income |
— | (118,668 | ) | — | 5,314 | (113,354 | ) | ||||||||||
December 31, 2009 |
66,275 | $ | 1,096,654 | $ | — | $ | 282,739 | $ | 1,379,393 | ||||||||
- (1)
- All unit data where applicable has been adjusted to reflect the Exchange Ratio to give effect to the Merger (see Note 3).
The accompanying notes are an integral part of these consolidated financial statements.
90
MARKWEST ENERGY PARTNERS, L.P.
CONSOLIDATED STATEMENTS OF CASH FLOWS
(in thousands)
| |
Year ended December 31, | ||||||||||||
|---|---|---|---|---|---|---|---|---|---|---|---|---|---|
| |
2009 | 2008 | 2007 | ||||||||||
Cash flows from operating activities: |
|||||||||||||
Net (loss) income |
$ | (113,354 | ) | $ | 204,772 | $ | (34,506 | ) | |||||
Adjustments to reconcile net (loss) income to net cash provided by operating activities (net of acquisitions): |
|||||||||||||
Depreciation |
95,537 | 67,480 | 41,281 | ||||||||||
Amortization of intangible assets |
40,831 | 38,483 | 16,672 | ||||||||||
Impairment of goodwill and long-lived assets |
5,855 | 36,351 | 356 | ||||||||||
Impairment of unconsolidated affiliate |
— | 41,449 | — | ||||||||||
Inventory lower of cost or market adjustment |
— | 6,678 | — | ||||||||||
Amortization of deferred financing costs and discount |
9,718 | 8,299 | 2,983 | ||||||||||
Accretion of asset retirement obligations |
198 | 129 | 114 | ||||||||||
Amortization of deferred contract costs |
312 | 312 | 312 | ||||||||||
Phantom unit compensation expense |
7,448 | 11,348 | 2,080 | ||||||||||
Participation Plan compensation expense |
— | 4,545 | 17,704 | ||||||||||
Stock option compensation expense |
— | — | (27 | ) | |||||||||
Restricted stock compensation expense |
— | 75 | 780 | ||||||||||
Equity in earnings of unconsolidated affiliates |
(3,505 | ) | (90 | ) | (5,309 | ) | |||||||
Gain on sale of unconsolidated affiliate |
(6,801 | ) | — | — | |||||||||
Distributions from unconsolidated affiliates |
— | 445 | 10,840 | ||||||||||
Unrealized loss (gain) on derivative instruments |
227,920 | (276,526 | ) | 150,418 | |||||||||
Loss on disposal of property, plant and equipment |
1,677 | 178 | 7,743 | ||||||||||
Deferred income taxes |
(50,088 | ) | 53,798 | (48,518 | ) | ||||||||
Gain on sale of available for sale securities |
— | (1,238 | ) | (668 | ) | ||||||||
Trading securities transactions, net |
512 | 3,162 | (3,674 | ) | |||||||||
Other |
(2,740 | ) | 181 | (190 | ) | ||||||||
Changes in operating assets and liabilities, net of working capital acquired: |
|||||||||||||
Receivables |
(33,133 | ) | 29,028 | (29,761 | ) | ||||||||
Inventories |
6,245 | (7,906 | ) | 4,451 | |||||||||
Other current assets |
1,074 | 39,430 | (35,057 | ) | |||||||||
Accounts payable and accrued liabilities |
30,717 | (34,072 | ) | 34,051 | |||||||||
Other long-term assets |
(2,808 | ) | (1,126 | ) | — | ||||||||
Other long-term liabilities |
7,486 | 1,810 | 1,162 | ||||||||||
Net cash provided by operating activities |
223,101 | 226,995 | 133,237 | ||||||||||
Cash flows from investing activities: |
|||||||||||||
Capital expenditures |
(486,623 | ) | (575,298 | ) | (316,639 | ) | |||||||
Acquisitions |
— | (41,300 | ) | 29 | |||||||||
Equity investments |
(405 | ) | (29,187 | ) | — | ||||||||
Cash paid to acquire General Partnership's non-controlling interest |
— | (21,484 | ) | — | |||||||||
Cash paid in Merger for MarkWest Hydrocarbon, Inc. stock |
— | (248,395 | ) | — | |||||||||
Proceeds from sale of unconsolidated affiliate |
25,000 | — | — | ||||||||||
Proceeds from sale of available for sale securities |
— | 6,226 | 1,622 | ||||||||||
Proceeds from disposal of property, plant and equipment |
275 | 173 | 196 | ||||||||||
Net cash flows used in investing activities |
(461,753 | ) | (909,265 | ) | (314,792 | ) | |||||||
Cash flows from financing activities: |
|||||||||||||
Proceeds from revolver |
725,200 | 678,001 | 499,100 | ||||||||||
Payments of revolver |
(850,600 | ) | (548,801 | ) | (473,600 | ) | |||||||
Proceeds from long-term debt |
117,000 | 498,732 | — | ||||||||||
Payments for debt issuance costs, deferred financing costs and registration costs |
(8,554 | ) | (21,204 | ) | (516 | ) | |||||||
Contributions to MarkWest Liberty Midstream joint venture, net |
194,536 | — | — | ||||||||||
Proceeds from sale of equity interest in joint venture, net |
60,654 | — | — | ||||||||||
Proceeds from SMR Transaction |
73,129 | — | — | ||||||||||
Proceeds from private placements, net |
— | — | 224,951 | ||||||||||
Proceeds from public offering, net |
178,565 | 171,395 | — | ||||||||||
Exercise of stock options |
— | 375 | 119 | ||||||||||
Cash paid for taxes related to net settlement of share-based payment awards |
(1,385 | ) | (61 | ) | — | ||||||||
APIC pool for excess tax benefits related to share-based compensation |
— | 717 | 335 | ||||||||||
Payment of dividends and distributions |
(155,462 | ) | (111,607 | ) | (16,067 | ) | |||||||
Distributions to MarkWest Energy unitholders prior to the Merger |
— | (19,651 | ) | (63,916 | ) | ||||||||
Net cash flows provided by financing activities |
333,083 | 647,896 | 170,406 | ||||||||||
Net increase (decrease) in cash |
94,431 | (34,374 | ) | (11,149 | ) | ||||||||
Cash and cash equivalents at beginning of year |
3,321 | 37,695 | 48,844 | ||||||||||
Cash and cash equivalents at end of year |
$ | 97,752 | $ | 3,321 | $ | 37,695 | |||||||
The accompanying notes are an integral part of these consolidated financial statements.
91
MARKWEST ENERGY PARTNERS, L.P.
NOTES TO CONSOLIDATED FINANCIAL STATEMENTS
1. Organization
MarkWest Energy Partners, L.P. ("MarkWest Energy Partners") was formed in January 2002, as a Delaware limited partnership. MarkWest Energy Partners and its majority-owned subsidiaries (collectively, the "Partnership") are engaged in the gathering, transportation and processing of natural gas; the transportation, fractionation, marketing and storage of NGLs and the gathering and transportation of crude oil. The Partnership has established a significant presence in the Southwest through strategic acquisitions and strong organic growth opportunities stemming from those acquisitions. The Partnership is also the largest processor of natural gas in the Appalachian Basin, one of the country's oldest natural gas producing regions. The Partnership also has a significant presence in the Marcellus Shale through a joint venture that is the largest gatherer and processor of natural gas in this emerging resource play. Finally, the Partnership owns a crude oil transportation pipeline in Michigan. The Partnership's principal executive office is located in Denver, Colorado.
On February 21, 2008, MarkWest Energy Partners consummated the transactions contemplated by its plan of redemption and merger (the "Merger") with MarkWest Hydrocarbon, Inc. (the "Corporation" or "MarkWest Hydrocarbon") and MWEP, L.L.C., a wholly-owned subsidiary of the Partnership. A discussion of the Merger and its accounting impact on the Partnership is described in Note 3. The Merger was considered a downstream merger, whereby the Corporation was viewed as the surviving consolidated entity for accounting and financial purposes rather than the Partnership, which is the surviving consolidated entity for legal purposes. As such, the Merger was accounted for in the Corporation's consolidated financial statements as an acquisition of non-controlling interest using the purchase method of accounting. As a result, the historical and comparative consolidated financial statements of the surviving legal entity are those of the Corporation, the accounting acquirer, rather than those of the Partnership, the legal acquirer.
2. Summary of Significant Accounting Policies
Basis of Presentation
The Partnership's consolidated financial statements include all majority-owned or majority-controlled subsidiaries. In addition, MarkWest Liberty Midstream & Resources, L.L.C. ("MarkWest Liberty Midstream") and MarkWest Pioneer, L.L.C. ("MarkWest Pioneer"), variable interest entities for which the Partnership has been determined to be the primary beneficiary, are included in the consolidated financial statements (see Note 4 for further discussion of MarkWest Liberty Midstream and MarkWest Pioneer). All significant intercompany investments, accounts and transactions have been eliminated. Investments in which the Partnership exercises significant influence but does not control, and is not the primary beneficiary, are accounted for using the equity method. The accompanying consolidated financial statements include the accounts of the Partnership, and have been prepared in accordance with GAAP.
Non-Controlling Interest in Consolidated Subsidiaries
The Partnership owns a controlling operating interest in Wirth Gathering, a general partnership. The Partnership's equity interest was acquired as part of the acquisition of PQ Gathering Assets, L.L.C. ("PQ Assets", see Note 5). The interests in Wirth Gathering, MarkWest Liberty Midstream and MarkWest Pioneer that are not owned by the Partnership have been recorded as Non-controlling interest in consolidated subsidiaries in the accompanying Consolidated Balance Sheets. The amount recorded in 2009 relates to all three of these entities, the amount recorded in 2008 relates primarily to Wirth
92
MARKWEST ENERGY PARTNERS, L.P.
NOTES TO CONSOLIDATED FINANCIAL STATEMENTS (Continued)
2. Summary of Significant Accounting Policies (Continued)
Gathering and the amount recorded in 2007 relates to the non-controlling interest in the Partnership that no longer exists due to the Merger (see Note 3).
Use of Estimates
The preparation of financial statements in conformity with GAAP requires management to make estimates and assumptions that affect the reported amounts of assets and liabilities, disclosure of contingent assets and liabilities at the date of the financial statements, and the reported amounts of revenues and expenses during the reporting period. Actual results could differ from those estimates. Estimates affect, among other items, valuing identified intangible assets; determining the fair value of derivative instruments; valuing inventory, evaluating impairments of long-lived assets, goodwill and equity investments; establishing estimated useful lives for long-lived assets; recognition of share-based compensation expense; estimating revenues and expense accruals; valuing asset retirement obligations; and in determining liabilities, if any, for legal contingencies.
Cash and Cash Equivalents
The Partnership considers investments in highly liquid financial instruments purchased with an original maturity of 90 days or less to be cash equivalents. Such investments include money market accounts.
Inventories
Inventories are valued at the lower of weighted average cost or market. Inventories consisting primarily of crude oil and unprocessed natural gas are valued based on the cost of the raw material. Processed natural gas inventories include material, labor and overhead. Shipping and handling costs related to purchases of natural gas and NGLs are included in inventory.
Property, Plant and Equipment
Property, plant and equipment are recorded at cost. Expenditures that extend the useful lives of assets are capitalized. Repairs, maintenance and renewals that do not extend the useful lives of the assets are expensed as incurred. Interest costs for the construction or development of long-lived assets are capitalized and amortized over the related asset's estimated useful life. Leasehold improvements are depreciated over the shorter of the useful life or lease term. Depreciation is provided, principally on the straight-line method, over the following estimated useful lives:
Asset Class
|
Range of Estimated Useful Lives |
|||
|---|---|---|---|---|
Buildings |
20 - 25 years | |||
Gas gathering facilities |
20 - 25 years | |||
Gas processing plants |
20 - 25 years | |||
Fractionation and storage facilities |
20 - 25 years | |||
Natural gas pipelines |
20 - 25 years | |||
Crude oil pipelines |
20 - 25 years | |||
NGL transportation facilities |
20 - 25 years | |||
Equipment and other |
3 - 10 years | |||
93
MARKWEST ENERGY PARTNERS, L.P.
NOTES TO CONSOLIDATED FINANCIAL STATEMENTS (Continued)
2. Summary of Significant Accounting Policies (Continued)
Asset Retirement Obligations
An asset retirement obligation ("ARO") is a legal obligation associated with the retirement of tangible long-lived assets that generally result from the acquisition, construction, development or normal operation of the asset. AROs are recorded at fair value in the period in which they are incurred, if a reasonable estimate of fair value can be made, and added to the carrying amount of the associated asset. This additional carrying amount is then depreciated over the life of the asset. The liability is determined using a risk free interest rate, and increases due to the passage of time based on the time value of money until the obligation is settled. The Partnership recognizes a liability of a conditional ARO as soon as the fair value of the liability can be reasonably estimated. A conditional ARO is defined as an unconditional legal obligation to perform an asset retirement activity in which the timing and/or method of settlement are conditional on a future event that may or may not be within the control of the entity.
Regulation
Certain assets and operations of the Partnership are subject to regulation by the FERC. The Partnership's accounting policies related to these assets conform to GAAP, as applied to regulated enterprises, and are in accordance with the accounting requirements and ratemaking practices of the FERC.
Property, Plant and Equipment for FERC Regulated Assets
Depreciation is generally computed over the asset's estimated useful life using the straight-line method. The composite weighted-average depreciation rates were 4% for 2009. When the Partnership retires its regulated property, plant and equipment, it charges the original cost plus the cost of retirement, less salvage value, to accumulated depreciation and amortization.
Allowance for Funds Used During Construction
Allowance for funds used during construction ("AFUDC"), which represents the estimated debt and equity costs of capital funds necessary to finance the construction and expansion of regulated facilities, consists of an equity component and an interest expense component. The equity component is a non-cash item. AFUDC is capitalized as a component of Property, plant and equipment, with offsetting credits to the Consolidated Statements of Operations included in Miscellaneous income (expense), net for the equity component and Interest expense for the interest component. After construction is completed, the Partnership is permitted to recover these costs through inclusion in the rate base and in the depreciation provision. The total amount of AFUDC included in the Consolidated Statements of Operations was $5.0 million for the year ended December 31, 2009 (an equity component of $2.8 million and an interest expense component of $2.2 million). If the Partnership discontinued the application of GAAP related to regulated enterprises due to an increased level of competition and discounting in its market area, the Partnership would be required to write-off a portion of the recorded AFUDC.
Accounting for Sales of Real Estate
The Partnership evaluates transactions involving the sale of assets to determine if they are, in-substance, the sale of real estate. Tangible assets may be considered real estate if the costs to
94
MARKWEST ENERGY PARTNERS, L.P.
NOTES TO CONSOLIDATED FINANCIAL STATEMENTS (Continued)
2. Summary of Significant Accounting Policies (Continued)
relocate them for use in a different location exceeds 10% of the asset's fair value. Financial assets, primarily in the form of ownership interests in an entity, may be in-substance real estate based on the significance of the real estate in the entity. Sales of real estate are not considered consummated if the Partnership maintains an interest in the asset after it is sold, or has certain other forms of continuing involvement. Significant judgment is required to determine if a transaction is a sale of real estate and if a transaction has been consummated. If a sale of real estate is not considered consummated, the Partnership cannot record the transaction as a sale and must account for the transaction under an alternative method of accounting such as a financing or leasing arrangement. During 2009, the Partnership entered into two transactions which were accounted for under the real estate guidance. The sale of the steam methane reformer ("SMR Transaction") was not considered a sale of real estate due to the Partnership's continuing involvement, and was accounted for as a financing arrangement. The Partnership's sale of equity interest in MarkWest Pioneer was considered the sale of in-substance real estate. See Notes 6 and 4, respectively, for a description of each transaction and its impact on the financial statements.
Investment in Unconsolidated Affiliates
Equity investments in which the Partnership exercises significant influence, but does not control and is not the primary beneficiary, are accounted for using the equity method, and are reported in Investment in unconsolidated affiliates in the accompanying Consolidated Balance Sheets. Refer to Note 16 for further discussion of the Partnership's equity investments.
The Partnership believes the equity method is an appropriate means for it to recognize increases or decreases measured by GAAP in the economic resources underlying the investments. Regular evaluation of these investments is appropriate to evaluate any potential need for impairment. It uses the following types of evidence of a loss in value to identify a loss in value of an investment that is other than a temporary decline. Examples of an other-than-temporary loss in value may be identified by:
- •
- The potential inability to recover the carrying amount of the investment;
- •
- The estimated fair value of an investment that is less than its carrying amount. Factors considered include the length of
time in which the market has been less than cost and the intent and ability to retain the investment to sufficiently allow for any recovery; and
- •
- Other operational or external factors including economic trends and projected financial performance that cause management to believe the investment may be worth less than otherwise accounted for by using the equity method.
Intangible Assets
The Partnership's intangible assets are comprised of customer contracts and relationships acquired in business combinations, recorded under the purchase method of accounting at their estimated fair values at the date of acquisition. Using relevant information and assumptions, management determines the fair value of acquired identifiable intangible assets. Fair value is generally calculated as the present value of estimated future cash flows using a risk-adjusted discount rate. The key assumptions include probability of contract renewals, economic incentives to retain customers, historical volumes, current and future capacity of the gathering system, pricing volatility, and the discount rate. Amortization of
95
MARKWEST ENERGY PARTNERS, L.P.
NOTES TO CONSOLIDATED FINANCIAL STATEMENTS (Continued)
2. Summary of Significant Accounting Policies (Continued)
intangibles with definite lives is calculated using the straight-line method over the estimated useful life of the intangible asset. The estimated economic life is determined by assessing the life of the assets to which the contracts and relationships relate, likelihood of renewals, the projected reserves, competitive factors, regulatory or legal provisions, and maintenance and renewal costs.
Goodwill
Goodwill is the cost of an acquisition less the fair value of the net identifiable assets of the acquired business. The Partnership evaluates goodwill for impairment annually as of November 30, and whenever events or changes in circumstances indicate it is more likely than not that the fair value of a reporting unit is less than its carrying amount. Impairment testing of goodwill consists of a two-step process. The first step involves comparing the fair value of the reporting unit, to which goodwill has been allocated, with its carrying amount. If the carrying amount of a reporting unit exceeds its fair value, the second step of the process involves comparing the implied fair value to the carrying value of the goodwill for that reporting unit. If the carrying value of the goodwill of a reporting unit exceeds the implied fair value of that goodwill, the excess of the carrying value over the implied fair value is recognized as an impairment loss.
Impairment of Long-Lived Assets
The Partnership's policy is to evaluate whether there has been a permanent impairment in the value of long-lived assets when certain events indicate that the remaining balance may not be recoverable. The Partnership evaluates the carrying value of its property, plant and equipment on at least a segment level and at lower levels where the cash flows for specific assets can be identified and are largely independent from other asset groups. A long-lived asset group is considered impaired when the estimated undiscounted cash flows from such asset group are less than the asset group's carrying value. In that event, a loss is recognized to the extent that the carrying value exceeds the fair value of the long-lived asset group. Fair value is determined primarily using estimated discounted cash flows. Management considers the volume of reserves behind the asset and future NGL product and natural gas prices to estimate cash flows. The amount of additional reserves developed by future drilling activity depends, in part, on expected natural gas prices. Projections of reserves, drilling activity and future commodity prices are inherently subjective and contingent upon a number of variable factors, many of which are difficult to forecast. Any significant variance in any of these assumptions or factors could materially affect future cash flows, which could result in the impairment of an asset.
For assets identified to be disposed of in the future, the carrying value of these assets is compared to the estimated fair value, less the cost to sell, to determine if impairment is required. Until the assets are disposed of, an estimate of the fair value is re-determined when related events or circumstances change.
Deferred Financing Costs
Deferred financing costs are amortized over the estimated lives of the related obligations or, in certain circumstances, accelerated if the obligation is refinanced, using the effective interest method.
96
MARKWEST ENERGY PARTNERS, L.P.
NOTES TO CONSOLIDATED FINANCIAL STATEMENTS (Continued)
2. Summary of Significant Accounting Policies (Continued)
Deferred Contract Costs
A wholly-owned subsidiary of the Partnership entered into a series of agreements with a gas producer in September 2004, under which the Partnership processes natural gas under modified keep-whole arrangements. In connection with these agreements, the subsidiary paid $3.3 million of consideration to the producer in connection with these non-separable contracts, which are being amortized as additional cost of the gas purchased over the term of the contracts, October 1, 2004 through February 9, 2015. Amortization related to these contracts for the years ended December 31, 2009, 2008 and 2007 was $0.3 million for each year.
Deferred Income
Deferred income represents prepayments received in revenue generating contracts. In certain cases, the Partnership received prepayments under fixed fee contracts to deliver NGLs at a future date. Deferred income is recognized as revenue upon delivery of the product. In other cases, the Partnership received prepayments related to the construction of gathering facilities to transport the producer's gas from certain delivery points. Deferred income is generally recognized into revenue over the term of the gathering contract. Deferred income is reported in Accrued liabilities and Other long-term liabilities in the accompanying Consolidated Balance Sheets.
Derivative Instruments
Derivative instruments (including certain derivative instruments embedded in other contracts) are recorded at fair value and included in the consolidated balance sheet as assets or liabilities. The Partnership discloses the fair value of substantially all of its derivative instruments separate from other assets and liabilities under the caption Fair value of derivative instruments in the Consolidated Balance Sheet, inclusive of option premiums (net of amortization). The fair value of derivatives related to long-term debt is included as a component of Long-term debt in the Consolidated Balance Sheet.
Changes in the fair value of derivative instruments are reported in the Statement of Operations in accounts related to the item economically hedged. During 2009, substantially all derivative instruments were marked to market through Revenue, Purchased product costs, Facility expenses, Interest expense, or Miscellaneous income (expense), net. Revenue gains and losses relate to contracts utilized to hedge the cash flow for the sale of a product and the amortization of associated option premiums. Option premiums are amortized over the effective term of the corresponding option contract. Purchased product costs gains and losses relate to contracts utilized to hedge costs, typically in a keep-whole arrangement. Facility expenses gains and losses relate to a contract utilized to hedge electricity costs. Interest expense gains relate to contracts to manage the interest rate risk associated with the fair value of its fixed rate borrowings. Miscellaneous income (expense), net relate to changes in the fair value of certain embedded put options (see Notes 7 and 19). Changes in risk management activities are reported in cash flow from operating activities on the accompanying Consolidated Statements of Cash Flows.
During 2009 and 2008 the Partnership did not designate any hedges or designate any contracts as normal purchases and normal sales. During 2007, the Partnership did not designate any hedges but did designate certain contracts as normal purchases and normal sales.
97
MARKWEST ENERGY PARTNERS, L.P.
NOTES TO CONSOLIDATED FINANCIAL STATEMENTS (Continued)
2. Summary of Significant Accounting Policies (Continued)
Fair Value of Financial Instruments
Management believes the carrying amount of financial instruments, including cash, accounts receivable, accounts payable, and accrued expenses approximates fair value because of the short-term maturity of these instruments. Management believes the carrying amount of the SMR Liability approximates fair value because there has not been a significant change in interest rates since the liability was established in September 2009 (see Note 6). The recorded value of the amounts outstanding under the Partnership's Credit Agreement approximate fair value due to the variable interest rate that reflects current market conditions. Derivative instruments are recorded at fair value, based on available market information (see Note 7). The following table shows the carrying value and related fair value of financial instruments that are not recorded in the financial statements at fair value as of December 31, 2009 (amounts in millions).
| |
Carrying Value | Fair Value | |||||
|---|---|---|---|---|---|---|---|
Long-term debt |
$ | 1,170 | $ | 1,212 | |||
SMR Liability |
95 | 95 | |||||
Total |
$ | 1,265 | $ | 1,307 | |||
Fair Value Measurement
The Partnership adopted guidance related to fair value measurements, effective January 1, 2008, with portions deferred by the FASB as discussed in Recent Accounting Pronouncements. The guidance defines fair value, establishes a framework for measuring fair value, establishes a three-level valuation hierarchy, and expands the disclosures about fair value measurements.
The valuation hierarchy is based upon the transparency of inputs to the valuation of an asset or liability as of the measurement date. The three levels are defined as follows:
- •
- Level 1—inputs to the valuation methodology are quoted prices (unadjusted) for identical assets or
liabilities in active markets.
- •
- Level 2—inputs to the valuation methodology include quoted prices for similar assets and liabilities in
active markets, and inputs that are observable for the asset or liability, either directly or indirectly, for substantially the full term of the financial instrument.
- •
- Level 3—inputs to the valuation methodology are unobservable and significant to the fair value measurement.
A financial instrument's categorization within the valuation hierarchy is based upon the lowest level of input that is significant to the fair value measurement.
The determination to classify a financial instrument with Level 3 of the valuation hierarchy is based upon the significance of the unobservable inputs to the overall fair value measurement. However, Level 3 financial instruments typically include, in addition to the unobservable or Level 3 inputs, observable inputs (that is, inputs that are actively quoted and can be validated to external sources); accordingly, the gains and losses for Level 3 financial instruments include changes in fair value due in part to observable inputs that are part of the valuation methodology. Level 3 financial instruments include interest rate swaps, crude oil options, all NGL transactions and the embedded put options
98
MARKWEST ENERGY PARTNERS, L.P.
NOTES TO CONSOLIDATED FINANCIAL STATEMENTS (Continued)
2. Summary of Significant Accounting Policies (Continued)
discussed in Notes 7 and 19, as they have significant unobservable inputs. Depending on the Level 3 financial instrument, significant unobservable inputs include volatilities associated with option contracts, commodity prices interpolated and extrapolated due to inactive markets, the embedded put options incorporate assumptions about the probability of specific events occurring in the future.
The methods described above may produce a fair value calculation that may not be indicative of net realizable value or reflective of future fair values. Furthermore, while the Partnership believes its valuation methods are appropriate and consistent with other market participants, the use of different methodologies or assumptions to determine the fair value of certain financial instruments could result in a different estimate of fair value at the reporting date. For further discussion see Note 8.
Revenue Recognition
The Partnership generates the majority of its revenues from natural gas gathering, transportation and processing; NGL transportation, fractionation, marketing and storage; and crude oil gathering and transportation. It enters into a variety of contract types. In many cases, the Partnership provides services under contracts that contain a combination of more than one of the arrangements described below. The Partnership provides services under the following different types of arrangements:
- •
- Fee-based arrangements—Under fee-based
arrangements, the Partnership receives a fee or fees for one or more of the following services: gathering, processing and transmission of natural gas; transportation, fractionation and storage of
NGLs; and gathering and transportation of crude oil. The revenue the Partnership earns from these arrangements is generally directly related to the volume of natural gas, NGLs or crude oil that flows
through the Partnership's systems and facilities and is not directly dependent on commodity prices. In certain cases, the Partnership's arrangements provide for minimum annual payments, fixed demand
charges, or fixed returns on gathering system expenditures.
- •
- Percent-of-proceeds arrangements—Under
percent-of-proceeds arrangements, the Partnership gathers and processes natural gas on behalf of producers, sells the resulting residue gas, condensate and NGLs at market
prices and remits to producers an agreed-upon percentage of the proceeds. In other cases, instead of remitting cash payments to the producer, the Partnership will deliver an
agreed-upon percentage of the residue gas and NGLs to the producer and sell the volumes the Partnership keeps to third parties at market prices.
- •
- Percent-of-index arrangements—Under
percent-of-index arrangements, the Partnership will purchase natural gas at either (1) a percentage discount to a specified index price, (2) a specified index
price less a fixed amount or (3) a percentage discount to a specified index price less an additional fixed amount. The Partnership will then gather and deliver the natural gas to pipelines
where the Partnership will resell the natural gas at the index price, or at a different percentage discount to the index price.
- •
- Keep-whole arrangements—Under keep-whole arrangements, the Partnership gathers natural gas from the producer, processes the natural gas and sells the resulting condensate and NGLs to third parties at market prices. Because the extraction of the condensate and NGLs from the natural gas during processing reduces the Btu content of the natural gas, the Partnership must either purchase natural gas at market prices for return to producers or make cash payment to the producers equal to the energy content of this natural gas. Certain keep-whole arrangements
99
MARKWEST ENERGY PARTNERS, L.P.
NOTES TO CONSOLIDATED FINANCIAL STATEMENTS (Continued)
2. Summary of Significant Accounting Policies (Continued)
- •
- Settlement margin—Typically, the Partnership is allowed to retain a fixed percentage of the volume gathered to cover the compression fuel charges and deemed-line losses. To the extent the Partnership's gathering systems are operated more or less efficiently than specified per contract allowance, the Partnership is entitled to retain the benefit or loss for its own account.
also have provisions that require the Partnership to share a percentage of the keep-whole profits with the producers based on the oil to gas ratio or the NGL to gas ratio.
In many cases, the Partnership provides services under contracts that contain a combination of more than one of the arrangements described above. The terms of the Partnership's contracts vary based on gas quality conditions, the competitive environment when the contracts are signed and customer requirements. Under all of the arrangements, revenue is recognized at the time the product is delivered and title is transferred. It is upon delivery and title transfer that the Partnership meets all four revenue recognition criteria, and it is at such time that the Partnership recognizes revenue.
The Partnership's assessment of each of the four revenue recognition criteria as they relate to its revenue producing activities is as follows:
Persuasive evidence of an arrangement exists. The Partnership's customary practice is to enter into a written contract, executed by both the customer and the Partnership.
Delivery. Delivery is deemed to have occurred at the time the product is delivered and title is transferred, or in the case of fee-based arrangements, when the services are rendered.
The fee is fixed or determinable. The Partnership negotiates the fee for its services at the outset of its fee-based arrangements. In these arrangements, the fees are nonrefundable. The fees are generally due within ten days of delivery or services rendered. For other arrangements, the amount of revenue is determinable when the sale of the applicable product has been completed upon delivery and transfer of title. Proceeds from the sale of products are generally due in ten days.
Collectibility is reasonably assured. Collectibility is evaluated on a customer-by-customer basis. New and existing customers are subject to a credit review process, which evaluates the customers' financial position (e.g. cash position and credit rating) and their ability to pay. If collectibility is not considered reasonably assured at the outset of an arrangement in accordance with the Partnership's credit review process, revenue is recognized when the fee is collected.
The Partnership enters into revenue arrangements where it sells customer's gas and/or NGLs and depending on the nature of the arrangement acts as the principal or agent. Revenue from such sales is recognized gross where the Partnership acts as the Principal, as the Partnership takes title to the gas and/or NGLs, has physical inventory risk and does not earn a fixed amount. Revenue is recognized net when the Partnership earns a fixed amount and does not take ownership of the gas and/or NGLs.
Amounts billed to customers for shipping and handling are included in Revenue. Shipping and handling costs associated with product sales are included in operating expenses. Taxes collected from customers and remitted to the appropriate taxing authority are excluded from revenue.
Gas volumes received may be different from gas volumes delivered, resulting in gas imbalances. The Partnership records a receivable or payable for such imbalances based upon the contractual terms of the purchase agreements. The Partnership had an imbalance payable of $0.7 million and $0.2 million
100
MARKWEST ENERGY PARTNERS, L.P.
NOTES TO CONSOLIDATED FINANCIAL STATEMENTS (Continued)
2. Summary of Significant Accounting Policies (Continued)
at December 31, 2009 and 2008, recorded in Accrued liabilities in the accompanying Consolidated Balance Sheets. The Partnership had an imbalance receivable of $0.3 million and $0.9 million at December 31, 2009 and 2008, respectively, recorded in Receivables, net in the accompanying Consolidated Balance Sheets. Changes in gas imbalances are recognized in Revenue or Purchased product costs in the accompanying Consolidated Statements of Operations.
Revenue and Expense Accruals
The Partnership routinely makes accruals based on estimates for both revenues and expenses due to the timing of compiling billing information, receiving certain third party information and reconciling the Partnership's records with those of third parties. The delayed information from third parties includes, among other things, actual volumes purchased, transported or sold, adjustments to inventory and invoices for purchases, actual natural gas and NGL deliveries and other operating expenses. The Partnership makes accruals to reflect estimates for these items based on its internal records and information from third parties. Estimated accruals are reversed in the following month when actual information is received from third parties and the Partnership's internal records have been reconciled.
Incentive Compensation Plans
The Partnership issues phantom units under certain share-based compensation plans as described further in Note 22. A phantom unit entitles the grantee to receive a common unit upon the vesting of the phantom unit. The phantom units are treated as equity awards. Compensation expense is measured for the phantom unit grants using the market price of MarkWest Energy Partners' common units on the date the units are granted. The fair value of the units awarded is amortized into earnings, reduced for an estimate of expected forfeitures, over the period of service corresponding with the vesting period. For certain plans the awards are accounted for as liability awards and the compensation expense is adjusted monthly for the change in the fair value of the unvested units granted.
To satisfy common unit awards, the Partnership may issue new common units, acquire common units in the open market, or use common units already owned by the general partner.
Participation Plan
The interests in the Partnership's General Partner sold by the Corporation to certain directors and employees were referred to as the Participation Plan. The Participation Plan was considered a compensatory arrangement and the General Partner interests were classified as liability awards. As a result, the Corporation was required to calculate the fair value of the General Partner interests at the end of each period. In conjunction with the Merger, all of the outstanding interests in the General Partner were acquired and the Participation Plan was terminated. Refer to Note 22 for further discussion of the impact of the Participation Plan on the financial statements.
101
MARKWEST ENERGY PARTNERS, L.P.
NOTES TO CONSOLIDATED FINANCIAL STATEMENTS (Continued)
2. Summary of Significant Accounting Policies (Continued)
Income Taxes
The Partnership is not a taxable entity for federal income tax purposes. As such, the Partnership does not directly pay federal income tax. The Partnership's taxable income or loss, which may vary substantially from the net income or loss reported in the Consolidated Statements of Operations, is includable in the federal income tax returns of each partner. The Partnership is, however, a taxable entity under certain state jurisdictions. The Corporation is a tax paying entity for both federal and state purposes.
The Partnership and the Corporation account for income taxes under the asset and liability method. Deferred income taxes are recognized for the future tax consequences attributable to differences between the financial statement carrying amounts of existing assets and liabilities and their respective tax basis, capital loss carryforwards and net operating loss and credit carryforwards. Deferred tax assets and liabilities are measured using enacted tax rates applied to taxable income in the years in which those temporary differences are expected to be recovered or settled. The effect of any tax rate change on deferred taxes is recognized in the period that includes the enactment date of the tax rate change. Realizability of deferred tax assets is assessed and, if not more likely than not, a valuation allowance is recorded to reflect the deferred tax assets at net realizable value as determined by management. Deferred tax balances that are expected to be settled within twelve months are classified as current, and all other deferred tax balance are classified as long term in the accompanying Consolidated Balance Sheets.
The Corporation recognizes a tax expense or a tax benefit on its proportionate share of Partnership income or loss resulting from the Corporation's ownership of Class A units of the Partnership even though for financial reporting purposes said income or loss is eliminated in consolidation. The deferred income tax component relates to the change in the book to tax basis difference in the carrying amount of the investment in the Partnership which results primarily from its timing differences in the Corporation's proportionate share of the book income or loss as compared with the Corporation's proportionate share of the taxable income or loss of the Partnership.
To account for uncertainty in income taxes recognized in financial statements, the Partnership prescribes a "more likely than not" recognition threshold and measurement attribute for the financial statement recognition and measurement of a tax position taken or expected to be taken in a tax return. The Partnership records penalties and interest related to income taxes as a component of income before tax as they become applicable. Penalties are recorded in Miscellaneous income (expense), net and interest is recorded in Interest expense in the accompanying Consolidated Statements of Operations.
Comprehensive Income (Loss)
Comprehensive income (loss) includes net income and other comprehensive income (loss), which includes unrealized gains and losses on marketable securities that are classified as available for sale.
Earnings (Loss) Per Unit
The Partnership's outstanding phantom units are considered to be participating securities, and therefore basic and diluted earnings per common unit are calculated pursuant to the two-class method described in the generally accepted accounting principles for earnings per share. In accordance with the two-class method, basic earnings per common unit is calculated by dividing net income attributable to
102
MARKWEST ENERGY PARTNERS, L.P.
NOTES TO CONSOLIDATED FINANCIAL STATEMENTS (Continued)
2. Summary of Significant Accounting Policies (Continued)
the Partnership, after deducting amounts that are allocable to the outstanding phantom units, by the weighted-average number of common units outstanding during the period. The amount allocable to the phantom units is generally calculated as if all of the net income attributable to the Partnership were distributed, and not on the basis of actual cash distributions for the period. However, during periods in which a net loss attributable to the Partnership is reported or periods in which the total distributions exceed the reported net income attributable to the Partnership, the amount allocable to the phantom units is based on actual distributions to the phantom unit holders. Diluted earnings per unit is calculated by dividing net income attributable to the Partnership, after deducting amounts allocable to the outstanding phantom units, by the weighted-average number of potential common units outstanding during the period. Potential common units are excluded from the calculation of diluted earnings per unit during periods in which the Partnership incurs a net loss as the impact would be anti-dilutive.
Business Combinations
Transactions in which the Partnership acquires control of a business are accounted for under the acquisition method. The identifiable assets, liabilities and any non-controlling interests are recorded at the estimated fair market values as of the acquisition date. The purchase price in excess of the fair value acquired is recorded as goodwill.
Accounting for Changes in Ownership Interests in Subsidiaries
The Partnership's ownership interest in a consolidated subsidiary may change if it sells a portion of its interest, or if the subsidiary issues or re-purchases its own shares. If the transaction does not result in a change in control over the subsidiary and it is not deemed to be a sale of real estate, the transaction is accounted for as an equity transaction. If the transaction results in a change in control it would result in the deconsolidation of a subsidiary with a gain or loss recognized in the statement of operations. During 2009 the Partnership's ownership interest in Liberty Midstream changed in two separate transactions which were accounted for as equity transactions. See Note 4 for a description of the transactions and the impact to the financial statements.
Accounting for Sales of Stock by a Subsidiary
Prior to the Merger, the Partnership issued common units in various transactions, which resulted in a dilution of the Corporation's percentage ownership in the Partnership. The Corporation accounted for the sale of the Partnership common units in accordance with guidance related to equity transactions. The guidance allows for the election of an accounting policy of recording such increase or decreases in a parent's investment either in income or in equity. The Corporation adopted a policy of recording such gains or losses directly to additional paid in capital. Due to the preference nature of the Partnership's common units, the Corporation was precluded from recording gains or losses until the subordinated units converted to common units. On August 15, 2007, the Partnership converted its remaining 1.2 million subordinated units to common units, in accordance with the provisions of the amended and restated partnership agreement. As a result, the Corporation recorded a $52.3 million gain to additional paid in capital, a decrease in non-controlling interest in consolidated subsidiary of $83.8 million and an increase to deferred tax liability of $31.5 million associated with gains from sales of common units by the Partnership in conjunction with, and subsequent to, the Partnership's May 24, 2002 initial public offering.
103
MARKWEST ENERGY PARTNERS, L.P.
NOTES TO CONSOLIDATED FINANCIAL STATEMENTS (Continued)
2. Summary of Significant Accounting Policies (Continued)
Recent Accounting Pronouncements
In September 2006, the FASB issued guidance regarding fair value measurements which was effective for the Partnership's financial statements as of January 1, 2008, except for certain provisions relating to non-financial assets and liabilities, which were effective January 1, 2009. The adoption as of January 1, 2008 had an effect of a $1.1 million decrease to fair value of derivative instruments liability, a decrease to Revenue—derivative loss of $0.4 million and an increase to derivative gain related to purchase product costs of $0.7 million. The provisions adopted as of January 1, 2009 did not have a material impact on the Partnership's financial statements.
In December 2007, the FASB amended the guidance related to business combinations. The amended guidance provides for how the acquirer recognizes and measures the identifiable assets acquired, liabilities assumed any non-controlling interest in the acquiree. It also provides for how the acquirer recognizes and measures the goodwill acquired in the business combination or a gain from a bargain purchase and determines what information to disclose to enable users to evaluate the nature and financial effects of the business combination. The provisions of the amended guidance became effective for the Partnership as of January 1, 2009. The guidance did not affect business combinations completed prior to January 1, 2009.
In December 2007, the FASB amended the guidance related to non-controlling interests in consolidated financial statements. This amended guidance provides that non-controlling interests in subsidiaries held by parties other than the parent be identified, labeled and presented in the statement of financial position within equity, but separate from the parent's equity. It also states that the amount of consolidated net income attributable to the parent and to the non-controlling interest be clearly identified on the consolidated statement of income and provides for consistency regarding changes in parent ownership including when a subsidiary is deconsolidated. Any retained non-controlling equity investment in the former subsidiary will be initially measured at fair value. Certain provisions of the amended guidance became effective for the Partnership as of January 1, 2009. The Partnership's financial statements were retrospectively adjusted for the presentation and disclosure requirements of the amended guidance.
In April 2008, the FASB issued amended guidance related to the determination of the useful life of intangible assets. The guidance amends the factors that an entity should consider in developing renewal or extension assumptions used in determining the useful life of recognized intangible assets. In determining the useful life of an acquired intangible asset, an entity is no longer required to consider whether renewal of the intangible asset requires significant costs or material modifications to the related arrangement. The amended guidance also replaces the previous useful life assessment criteria with a requirement that an entity consider its own experience in renewing similar arrangements. If the entity has no relevant experience, it would consider market participant assumptions regarding renewal. The amended guidance became effective as of January 1, 2009 and applied only to intangible assets acquired after that date. Retroactive application to previously acquired intangible assets is prohibited. There will be no impact on the Partnership's financial statements unless the Partnership acquires intangible assets in the future.
In June 2008, the FASB issued updated earnings per share guidance regarding determining whether instruments granted in share-based payment transactions are participating securities. The amended guidance states that unvested share-based payment awards that contain non-forfeitable rights to dividends or dividend equivalents (whether paid or unpaid) are participating securities and shall be
104
MARKWEST ENERGY PARTNERS, L.P.
NOTES TO CONSOLIDATED FINANCIAL STATEMENTS (Continued)
2. Summary of Significant Accounting Policies (Continued)
included in the computation of earnings per unit pursuant to the two-class method. The amended guidance became effective for the Partnership beginning January 1, 2009. The adoption of the guidance did not have an impact on the net income reported in the Partnership's Consolidated Statements of Operations, however the reported earnings per unit is generally lower than the amount reported prior to adoption. The effect of the guidance is reflected for all years presented in the Partnership's Consolidated Statements of Operations.
In November 2008, the FASB clarified the accounting for certain transactions and impairment considerations involving equity method investments which were affected by the FASB issuances of updated guidance related to business combinations and consolidations. The transition provisions require prospective application and are effective for the Partnership on January 1, 2009. The clarification did not have a material effect on the Partnership's consolidated financial statements.
In May 2009, the FASB established guidance for the accounting and reporting of subsequent events, which are events occurring after the balance sheet date but before the financial statements are issued or available to be issued. The new principles describe the circumstances that would require the Partnership to recognize the impact of subsequent events in its financial statements, provides disclosure requirements for subsequent events, and defines the period through which subsequent events must be evaluated. The guidance became effective for the Partnership as of the period ended June 30, 2009, and did not have a material impact on the Partnership's financial statements upon adoption.
In June 2009, the FASB amended the Variable Interest Entity ("VIE") subsections of the consolidation guidance. The amended guidance changes the criteria for determining if a VIE exists and whether or not a VIE should be consolidated. When this guidance is adopted, the Partnership must reconsider its previous VIE conclusions and what types of financial statement disclosures are appropriate. The amended guidance is effective for the Partnership on January 1, 2010. The amendment will not have a material effect on the Partnership's consolidated financial statements.
In September 2009, the FASB amended the accounting guidance for revenue recognition for multiple-deliverable arrangements. The amended guidance establishes a hierarchy for determining the selling price of each individual deliverable and eliminates the residual value method of allocating the selling price. The amended guidance is effective prospectively for all revenue arrangements entered into or materially modified in fiscal years beginning after June 15, 2010. The amendment is not expected to have a material effect on the Partnership's consolidated financial statements.
In January 2010, the FASB issued a clarification to the accounting for decreases in ownership interests in certain subsidiaries. The FASB clarified that the guidance for consolidations does not apply to transactions involving in-substance real estate or the conveyances of oil and gas mineral rights. The FASB indicated that the established guidance for transactions involving in-substance real estate or oil and gas mineral rights should be followed. The clarification also expands disclosures required upon the deconsolidation of a subsidiary. The guidance within this clarification is effective for the Partnership as of December 31, 2009, with retrospective application required to January 1, 2009. The Partnership has determined that its sale of equity interests in MarkWest Pioneer qualifies as a sale of in-substance real estate; however, the impact on the Partnership's consolidated financial statements was not material.
105
MARKWEST ENERGY PARTNERS, L.P.
NOTES TO CONSOLIDATED FINANCIAL STATEMENTS (Continued)
3. Redemption and Merger
On February 21, 2008, the Partnership completed the transactions contemplated by its plan of redemption and merger with the Corporation and MWEP, L.L.C., a wholly-owned subsidiary of the Partnership. Under the Merger, the shareholders of the Corporation exchanged each share of Corporation common stock for consideration equal to 1.9051 Partnership common units. This Exchange Ratio was computed based on the stated consideration of 1.285 Partnership common units plus $20 in cash, or equivalent value. In accordance with the merger agreement, the equivalent value was based on a Partnership common unit price of $32.25, which equals the average market price of Partnership common units for the ten day period ending three days prior to the closing date. Therefore, the $20.00 in cash was equivalent to 0.6201 Partnership common units which results in a total Exchange Ratio of 1.9051 when combined with the other 1.285 units included in the stated consideration. Subject to proration, the shareholders elected to receive this consideration either entirely in cash in the redemption, entirely in Partnership common units in the Merger, or in any combination of cash and Partnership common units with equivalent value. The Corporation redeemed for $240.5 million in cash those shares of Corporation common stock electing to receive cash. Immediately after the redemption, the Partnership acquired the Corporation through a merger of MWEP, L.L.C. with and into the Corporation, pursuant to which all remaining shares of the Corporation's common stock were converted into approximately 15.5 million Partnership common units. As a result of the Merger, the Corporation is a wholly-owned subsidiary of the Partnership. In connection with the Merger, the incentive distribution rights in the Partnership, the 2% economic interest in the Partnership held by MarkWest Energy GP, L.L.C. (the "General Partner") and the Partnership common units owned by the Corporation were exchanged for Partnership Class A units. Contemporaneously with the closing of the transactions contemplated by the Merger, the Partnership separately acquired 100% of the Class B membership interests in the General Partner that had been held by current and former management and certain directors of the Corporation and the General Partner under the Participation Plan in exchange for approximately $21.5 million in cash and approximately 0.9 million common units valued at $30.1 million. Additionally, as a result of the Merger, the Partnership assumed the 2006 Hydrocarbon Stock Incentive Plan and the 1996 Hydrocarbon Stock Incentive Plan (see Note 22).
Using the Exchange Ratio, the number of Corporation shares outstanding as of December 31, 2007 and activity through February 21, 2008 has been adjusted to the equivalent number of Partnership common units in the accompanying Consolidated Financial Statements. The following table illustrates these conversions (shares and units in thousands):
| |
Common Shares |
Exchange Ratio |
Common Units |
|||||||
|---|---|---|---|---|---|---|---|---|---|---|
Shares of Corporation Common Stock Outstanding at December 31, 2007 |
11,999.8 | 1.9051 | 22,861 | |||||||
Stock Option exercises in first quarter 2008, prior to Merger |
51.5 | 1.9051 | 98 | |||||||
Conversion of Restricted Shares to Partnership Phantom units |
(23.8 | ) | 1.9051 | (45 | ) | |||||
Shares eligible for redemption or conversion to Partnership Units |
12,027.5 | 22,914 | ||||||||
Common shares tendered for redemption in cash |
(3,914.5 | ) | 1.9051 | (7,458 | ) | |||||
Common shares tendered for conversion to Partnership common units |
8,113.0 | 1.9051 | 15,456 | |||||||
Class A units represent limited partner interests in the Partnership and have identical rights and obligations of the Partnership common units except that Class A units (a) do not have the right to vote
106
MARKWEST ENERGY PARTNERS, L.P.
NOTES TO CONSOLIDATED FINANCIAL STATEMENTS (Continued)
3. Redemption and Merger (Continued)
on, approve or disapprove, or otherwise consent to or not consent to any matter (including mergers, share exchanges and similar statutory authorizations) except as otherwise required by any non-waivable provision of law and (b) do not share in any cash and cash equivalents on hand, income, gains, losses, deductions and credits that are derived from or attributable to the Partnership's ownership of, or sale or disposition of, the shares of MarkWest Hydrocarbon common stock. The Class A units held by the Corporation and the General Partner are not treated as outstanding common units in the Consolidated Balance Sheets.
The total fair value of the non-controlling interest acquired was the number of non-controlling interest units outstanding on the date the Merger closed valued at the then current per unit market price of the Partnership common units of $31.79. The following table shows the calculation of the purchase price of the Partnership ($ in thousands):
| |
Units | Dollars | |||||
|---|---|---|---|---|---|---|---|
Fair value of units held prior to Merger |
34,473,647 | $ | 1,095,917 | ||||
Add: Direct costs of the Merger |
7,882 | ||||||
|
$ | 1,103,799 | |||||
Significant fair value estimates were required for the following assets and liabilities:
- •
- Property, plant, and equipment—The fair value estimates for property, plant and equipment were based primarily
on the cost approach, which considers both historical cost and replacement cost. Additionally, management estimated the remaining useful lives of the property, plant and equipment to ensure that the
useful lives used for depreciation subsequent to the Merger are reasonable and consistent with the Partnership's accounting policy.
- •
- Intangible assets—The fair value estimates for customer relationships were based on a version of the income
approach. The income approach involves estimating future cash flows from existing customer relationships and making provisions for a fair return on other recognized contributory assets. Key
assumptions in the valuation include contract renewals, economic incentives to retain customers, historic volumes, current and future capacity in the gathering system, pricing volatility and the
discount rate. The estimated useful life of the intangible assets was determined by assessing the estimated useful life of the other assets to which the contracts and relationships relate, likelihood
of renewals, projected reserves, competitive factors, regulatory or legal provisions, and maintenance and renewal costs.
- •
- Long-term debt—The fair value of the Partnership's Senior Notes was estimated using a high yield
market price at which the debt was trading as of the date the Merger closed.
- •
- Deferred finance costs—The deferred finance costs of the Partnership had no fair market value as of the date
the Merger closed. Therefore 85.7% of these costs, which is the percentage subject to revaluation under the purchase accounting method, were written-off.
- •
- The remaining purchase price in excess of the fair values of the assets and liabilities acquired was recorded as goodwill. The goodwill balance was then allocated to the Partnership's reporting units. The Partnership had eight reporting units: East Texas, Eastern Oklahoma, Western Oklahoma, Other Southwest, Javelina, Appalachia, Western Michigan, and Michigan Crude Pipeline. Goodwill was allocated to those reporting units that are expected to benefit from the
107
MARKWEST ENERGY PARTNERS, L.P.
NOTES TO CONSOLIDATED FINANCIAL STATEMENTS (Continued)
3. Redemption and Merger (Continued)
business combination. One of the primary benefits of the Merger was to allow the Partnership to compete more effectively for future growth opportunities. Because there were no significant growth plans in place for Western Michigan and Michigan Crude Pipeline, no goodwill was allocated to these reporting units. For all other reporting units, goodwill was allocated in a manner consistent with the methodology used to determine total goodwill. Management estimated the fair value of the net assets of reporting unit, allocated a portion of the Merger purchase price to each reporting unit, and assigned goodwill to the extent that the allocated purchase price exceeded the fair value of the reporting unit. The methodology used to determine the fair value of the net assets of each reporting unit and the allocated purchase price to each reporting unit was applied consistently.
The following table shows the final purchase price allocation as of February 21, 2008 (in thousands):
| |
Original Net Book Value |
Fair Value | 85.7% Proportional Step-Up of Fair Value |
Average Depreciable Life |
|||||||||
|---|---|---|---|---|---|---|---|---|---|---|---|---|---|
Property, plant and equipment |
$ | 843,122 | $ | 1,051,407 | $ | 178,501 | 18 | ||||||
Intangible assets |
324,326 | 780,343 | 390,807 | 18 | |||||||||
Long-term debt |
(581,642 | ) | (570,775 | ) | 9,313 | 8 | |||||||
Deferred financing costs |
12,815 | — | (10,982 | ) | 8 | ||||||||
Goodwill |
37,461 | ||||||||||||
Total Adjustments |
605,100 | ||||||||||||
Deferred income taxes |
n/a | n/a | (3,598 | ) | |||||||||
Non-controlling interest |
502,297 | ||||||||||||
Total Purchase Price |
$ | 1,103,799 | |||||||||||
- n/a—
- Amounts represent the recognition of deferred tax liabilities related to temporary tax differences that are expected to reverse in future periods related to the proportional step-up of fair value due to the Merger. No deferred tax liabilities related to goodwill were recognized as goodwill is not deductible for tax purposes.
4. Variable Interest Entities
MarkWest Liberty Midstream
On February 27, 2009, the Partnership entered into a joint venture with M&R MWE Liberty LLC ("M&R"), an affiliate of NGP Midstream & Resources, L.P. and its affiliated funds, which is a private equity firm focused on investments in selected areas of the energy infrastructure and natural resources sectors. The joint venture entity, MarkWest Liberty Midstream, operates in the natural gas midstream business in and around the Marcellus Shale in western Pennsylvania and northern West Virginia. The Partnership contributed its existing Marcellus Shale natural gas gathering and processing assets to MarkWest Liberty Midstream in exchange for a 60% ownership interest. The agreed-to value of the contributed assets was approximately $107.5 million. At closing, M&R contributed cash of $50.0 million in exchange for a 40% ownership interest. A wholly-owned subsidiary of the Partnership serves as the
108
MARKWEST ENERGY PARTNERS, L.P.
NOTES TO CONSOLIDATED FINANCIAL STATEMENTS (Continued)
4. Variable Interest Entities (Continued)
operator of MarkWest Liberty Midstream and provides field operating and general and administrative services. A portion of the fee for providing these services is fixed.
The Partnership has determined that MarkWest Liberty Midstream is a variable interest entity primarily due to the insufficiency of equity, as defined in generally accepted accounting principles for consolidation, at its inception as evidenced by the capital requirements outlined below. The Partnership is considered the primary beneficiary due mainly to its disproportionate share of profits and losses relative to the equal voting rights shared by both members. The Partnership assumes additional variability based on its compensation as the operator of MarkWest Liberty Midstream. The Partnership's maximum exposure to loss as a result of its involvement with MarkWest Liberty Midstream includes its equity investment, the additional capital contribution commitments and any operating expense in excess of its compensation as the operator of MarkWest Liberty Midstream. MarkWest Liberty Midstream will be funded entirely by the Partnership and M&R and has no debt.
M&R contributed an additional $150.0 million during 2009 to fund the capital expenditures of MarkWest Liberty Midstream. MarkWest Liberty Midstream's capital expenditures exceed M&R's quarterly contributions during 2009. As a result, the Partnership contributed approximately $8.0 million to the entity during 2009. As M&R contributed the majority of capital associated with 2009 capital expenditures, the capital contributed to MarkWest Liberty Midstream is disproportionate to each party's respective ownership interest. Under the terms of the joint venture agreement, M&R received a special $3.4 million non-cash allocation of net income from MarkWest Liberty Midstream during 2009 because its capital contributed exceeded its ownership interest. The non-cash allocation is recorded in Net (income) loss attributable to non-controlling interest.
Effective November 1, 2009, the Partnership and M&R executed the Amended Liberty Agreement pursuant to which M&R will increase its participation in MarkWest Liberty Midstream by at least an additional $150.0 million. Additionally, the Partnership and M&R will maintain a 60%/40% respective ownership interest in MarkWest Liberty Midstream until January 1, 2011, at which time M&R's ownership interest will increase from 40% to 49%. The Partnership and M&R will jointly fund the capital requirements of MarkWest Liberty Midstream at agreed upon levels until the Partnership's contributed capital is proportionate to its 51% ownership interest (the "Equalization Date"), which is expected to occur on or before December 31, 2012. MarkWest Liberty Midstream's capital plan for 2011 and 2012 has not been finalized and the exact timing of the member's contributions is currently uncertain. If the Equalization Date has not occurred by the end of 2012, M&R may require the Partnership to contribute the amount of the shortfall at December 31, 2012, or may allow the Partnership to continue to fund 100% of MarkWest Liberty Midstream's capital expenditures until its total contributed capital is proportionate to its ownership interest. Following the Equalization Date, M&R will have pre-emptive rights to maintain its ownership interest in MarkWest Liberty Midstream in a range of between 45% and 49% or have its ownership interest diluted to the extent that it elects not to fund its proportionate share. As a result of the execution of the Amended Liberty Agreement, the Partnership reconsidered the accounting treatment for MarkWest Liberty Midstream as a VIE and determined that the conclusions as discussed above remain unchanged.
MarkWest Pioneer
MarkWest Pioneer is the owner and operator of the Arkoma Connector Pipeline, a 50-mile FERC regulated pipeline that was placed in service in July 2009 and provides approximately 638,000 Dth/d of
109
MARKWEST ENERGY PARTNERS, L.P.
NOTES TO CONSOLIDATED FINANCIAL STATEMENTS (Continued)
4. Variable Interest Entities (Continued)
Woodford Shale takeaway capacity and interconnects with the Midcontinent Express Pipeline and the Gulf Crossing Pipeline.
On May 1, 2009, the Partnership entered into a joint venture with Arkoma Pipeline Partners, LLC ("ArcLight"), an affiliate of ArcLight Capital Partners, LLC which is an investment firm focused on opportunities throughout the energy industry. ArcLight acquired a 50% equity interest in MarkWest Pioneer for a total purchase price of $62.5 million. The Partnership retained a 50% equity interest and was obligated to fund all capital expenditures necessary to complete construction of the Arkoma Connector Pipeline in excess of $125.0 million (the "Excess Capital Expenditures"). As a result of the Excess Capital Expenditures, the Partnership recorded a $10.3 million equity loss, net of a $1.5 million tax benefit, that is reflected as a transfer to non-controlling interest, and the Partnership's recorded ownership interest exceeds its stated ownership interest in MarkWest Pioneer by approximately $2.0 million. The difference between the Partnership's recorded ownership interest and its stated ownership interest is amortized based upon the respective useful lives of the assets to which the difference relates. A wholly-owned subsidiary of the Partnership serves as the operator of MarkWest Pioneer and provides field operating and general and administrative services for fixed fees.
The Partnership has determined that MarkWest Pioneer is a VIE under generally accepted accounting principles for consolidation. This determination is based primarily on disproportionate economic interests as compared to voting interests. The Partnership has economic interests that do not match its 50% voting interest as it was obligated to fund the Excess Capital Expenditures.
Financial Statement Impact of VIEs
As the primary beneficiary of MarkWest Liberty Midstream and MarkWest Pioneer, the Partnership consolidates the entities and recognizes non-controlling interests. The Partnership has not provided any financial support that it was not contractually obligated to provide. The Partnership
110
MARKWEST ENERGY PARTNERS, L.P.
NOTES TO CONSOLIDATED FINANCIAL STATEMENTS (Continued)
4. Variable Interest Entities (Continued)
reflected the following amounts in its Consolidated Balance Sheet for MarkWest Liberty Midstream and MarkWest Pioneer (in thousands):
| |
As of December 31, 2009 | ||||||||
|---|---|---|---|---|---|---|---|---|---|
| |
MarkWest Liberty Midstream |
MarkWest Pioneer | |||||||
ASSETS |
|||||||||
Cash and cash equivalents |
$ | 18,168 | $ | 3,774 | |||||
Accounts receivable |
20,753 | 1,280 | |||||||
Inventories |
3,343 | — | |||||||
Other current assets |
225 | 102 | |||||||
Property, plant and equipment, net of accumulated depreciation of $8,273 and $3,051, respectively |
330,116 | 153,478 | |||||||
Other long-term assets |
314 | — | |||||||
Total assets |
$ | 372,919 | $ | 158,634 | |||||
LIABILITIES |
|||||||||
Accounts payable |
$ | 2,713 | $ | 32 | |||||
Accrued liabilities |
43,136 | 1,479 | |||||||
Other long-term liabilities |
80 | 285 | |||||||
Total liabilities |
$ | 45,929 | $ | 1,796 | |||||
The assets of MarkWest Liberty Midstream and MarkWest Pioneer are the property of the respective ventures and are not available to the Partnership for any other purpose, including collateral for its secured debt (see Note 19 and Note 27). The Partnership is required to reinvest all cash distributions from MarkWest Liberty Midstream until the Equalization Date has occurred. The liabilities of MarkWest Liberty Midstream and MarkWest Pioneer do not represent additional claims against the Partnership's general assets. The Partnership's Liberty segment includes the results of operations of MarkWest Liberty Midstream (see Note 26). The Partnership's Southwest segment includes the results of operations of MarkWest Pioneer (see Note 26). The cash flow information for MarkWest Liberty Midstream and MarkWest Pioneer comprise substantially all of the cash flow information of non-guarantors (see Note 27).
111
MARKWEST ENERGY PARTNERS, L.P.
NOTES TO CONSOLIDATED FINANCIAL STATEMENTS (Continued)
4. Variable Interest Entities (Continued)
The following table shows the net loss attributable to the Partnership and transfers to the non-controlling interests for the year ended December 31, 2009 (in thousands).
| |
Year Ended December 31, 2009 |
|||||
|---|---|---|---|---|---|---|
Net loss attributable to the Partnership |
$ | (118,668 | ) | |||
Transfers to the non-controlling interests: |
||||||
Decrease in Partners' Capital for transaction costs related to sale of equity interest in MarkWest Liberty Midstream and MarkWest Pioneer |
(7,310 | ) | ||||
Decrease to Partners' Capital for transfer to non-controlling interest from sale of equity interest in MarkWest Pioneer(1) |
(10,288 | ) | ||||
Net loss attributable to the Partnership and transfers to the non-controlling interests |
$ | (136,266 | ) | |||
- (1)
- Decrease to Partners' Capital for transfer to non-controlling interest is determined based on the amount of Excess Capital Expenditures as estimated on the closing date. As of December 31, 2009, the decrease is shown net of tax benefit.
5. Business Combination
On July 31, 2008, the Partnership acquired a 100% interest in PQ Assets from PetroQuest Energy, L.L.C. for $41.3 million. PQ Assets consisted of gathering systems located in the Woodford Shale area of Southeast Oklahoma. The acquisition also included a 50% managing partner interest in Wirth Gathering, a general partnership, which also owns a gathering system located in the Woodford Shale area. PQ Assets was renamed MarkWest McAlester, L.L.C. The transaction was accounted for under the purchase method, the results of operations from the business combination are included in the consolidated financial statements from the acquisition date. The following table summarizes the costs and allocation of the PQ Assets acquired (in thousands):
| |
|
||||
|---|---|---|---|---|---|
Allocation of acquisition costs: |
|||||
Property, plant and equipment |
$ | 26,698 | |||
Customer contracts and relationships(1) |
16,872 | ||||
Goodwill(2) |
665 | ||||
Non-controlling interest |
(2,935 | ) | |||
Total |
$ | 41,300 | |||
- (1)
- Customer
contracts and relationships will be amortized over a ten-year life.
- (2)
- Goodwill was recorded in the Southwest segment.
112
MARKWEST ENERGY PARTNERS, L.P.
NOTES TO CONSOLIDATED FINANCIAL STATEMENTS (Continued)
6. Divestitures
SMR Transaction
On September 1, 2009, the Partnership completed the sale of the steam methane reformer ("SMR") currently being constructed at its Javelina gas processing and fractionation facility in Corpus Christi, Texas. Under the terms of the agreement, the Partnership received proceeds of $73.1 million and the purchaser will complete the construction of the SMR. The Partnership and the purchaser also executed a related hydrogen supply agreement under which the Partnership will receive all of the hydrogen produced by the SMR for the next 20 years in exchange for processing fees and the reimbursement of certain other expenses. The processing fee payments will begin when the SMR is capable of commencing operations, which is expected to occur in March 2010. The Partnership is deemed to have continuing involvement with the SMR as a result of certain provisions in the related agreements. Therefore, the transaction is treated as a financing arrangement under GAAP. The Partnership has continued to report an asset, and the related depreciation, for the total capitalized costs of constructing the SMR and has recorded a liability equal to the proceeds from the transaction plus the costs expected to be incurred by the buyer to complete construction ("SMR Liability"). The Partnership will impute interest on the SMR Liability at 9.35% annually, its incremental borrowing rate at the time of the transaction. Until the SMR is capable of commencing operations and the Partnership begins payment of the processing fee under the hydrogen supply agreement, the accrued interest on the SMR Liability will be capitalized. Each processing fee payment will have multiple elements: reduction of principal of the SMR Liability, interest expense associated with the SMR Liability, and facility expense related to the operation of the SMR. As of December 31, 2009, the following amounts related to the SMR are included in the accompanying Consolidated Balance Sheets (in thousands):
ASSETS |
|||||
Property, plant and equipment, net of accumulated depreciation of $0 |
$ | 103,522 | |||
LIABILITIES |
|||||
Accrued liabilities |
$ | 1,434 | |||
Other long-term liabilities |
93,776 | ||||
Other Divestitures
Effective November 1, 2009, the Partnership sold its interest in Basin Pipeline, LLC ("Basin") for nominal consideration. Basin owns a natural gas pipeline in Manistee, Mason and Oceana Counties in Michigan. The Partnership ceased its operations in western Michigan, including Basin, in July 2009. The Partnership's loss on the disposal of Basin was near zero.
Effective December 31, 2009, the Partnership sold its 50% equity interest in Starfish Pipeline Company, LLC ("Starfish") to Enbridge Offshore (Gas Transmission), L.L.C. for a base purchase price of $25.0 million. The purchase price is subject to post-closing adjustments to net working capital, which takes into account the cost of repairs performed prior to closing from damage caused by Hurricane Ike in 2008. The Partnership recorded a $6.8 million gain on the sale of its equity interest in Starfish. The calculated gain on sale was impacted by the impairment of $41.4 million recorded in 2008 (see Note 16).
113
MARKWEST ENERGY PARTNERS, L.P.
NOTES TO CONSOLIDATED FINANCIAL STATEMENTS (Continued)
7. Derivative Financial Instruments
Commodity Instruments
The Partnership's primary risk management objective is to reduce downside volatility in its cash flows arising from changes in commodity prices related to future sales or purchases of natural gas, NGLs and crude oil. Swaps, options and fixed-price forward contracts may allow the Partnership to reduce downside volatility in its realized margins as realized losses or gains on the derivative instruments generally are offset by corresponding gains or losses in the Partnership's sales or purchases of physical product. While management largely expects realized derivative gains and losses to be offset by increases or decreases in the value of physical sales and purchases, the Partnership will experience volatility in reported earnings due to the recording of unrealized gains and losses on derivative positions that will have no offset. The Partnership's commodity derivative instruments are recorded at fair value in the Consolidated Balance Sheets. Accordingly, the volatility in any given period related to unrealized gains or losses reported in the Consolidated Statements of Operations can be significant to the overall financial results of the Partnership; however, management generally expects those gains and losses to be offset when they become realized. The Partnership does not have any trading derivative financial instruments.
To mitigate its cash flow exposure to fluctuations in the price of NGLs, the Partnership has entered into derivative financial instruments relating to the future price of NGLs and crude oil. To mitigate its cash flow exposure to fluctuations in the price of natural gas, the Partnership primarily utilizes derivative financial instruments relating to the future price of natural gas. As a result of these transactions, the Partnership has mitigated a significant portion of its expected commodity price risk with agreements expiring at various times through the fourth quarter of 2012. The Partnership has a committee comprised of the senior management team that oversees all of the risk management activity and continually monitors the risk management program and expects to continue to adjust its derivative positions as conditions warrant.
To manage its commodity price risk, the Partnership utilizes a combination of swaps, options and fixed-price forward contracts available on the OTC market. The Partnership enters into OTC derivatives with financial institutions and other energy company counterparties. Management conducts a standard credit review on counterparties and has agreements containing collateral requirements when deemed necessary. The Partnership uses standardized agreements that allow for offset of positive and negative exposures (master netting arrangements). Due to the timing of purchases and sales, direct exposure to price volatility may result because there is no longer an offsetting purchase or sale that remains exposed to market pricing. Through marketing and derivative activities, direct price exposure may occur naturally or the Partnership may choose direct exposure when it is favorable as compared to the keep-whole risk.
The use of derivative instruments may create exposure to the risk of financial loss in certain circumstances, including instances when (i) NGLs do not trade at historical levels relative to crude oil, (ii) sales volumes are less than expected, requiring market purchases to meet commitments, or (iii) OTC counterparties fail to purchase or deliver the contracted quantities of natural gas, NGLs or crude oil or otherwise fail to perform. To the extent that the Partnership engages in derivative activities, it may be prevented from realizing the benefits of favorable price changes in the physical market; however, it may be similarly insulated against unfavorable changes in such prices.
The Partnership's Credit Agreement limits its ability to enter into transactions with parties that require margin calls under certain derivative instruments and prevents members of the participating
114
MARKWEST ENERGY PARTNERS, L.P.
NOTES TO CONSOLIDATED FINANCIAL STATEMENTS (Continued)
7. Derivative Financial Instruments (Continued)
bank group from requiring margin calls. As of December 31, 2009 approximately 5% of the Partnership's derivative positions, measured volumetrically, are with non-bank group counterparties and are subject to margin deposit requirements under OTC agreements that it meets with letters of credit, if necessary. In the unlikely event that the Partnership were unable to meet these margin calls with letters of credit, it would be forced to terminate the corresponding contracts.
Interest Rate Contracts
The Partnership borrows funds using a combination of fixed and variable rate debt. The Partnership may utilize interest rate swap contracts to manage the interest rate risk associated with the fair value of its fixed rate borrowings and to effectively convert a portion of the underlying cash flows related to its long-term fixed rate debt securities into variable rate cash flows in order to achieve its desired mix of fixed and variable rate debt. As a result, the Partnership's future cash flows from these agreements will vary with the market rate of interest.
Other Contracts—Embedded Derivatives Related to Long-Term Debt
On May 26, 2009, the Partnership completed the private placement of senior notes with two contingent written put options as described in Note 19. The written put options are considered embedded derivatives and are not considered clearly and closely related to the indenture. When a hybrid contract contains more than one embedded derivative requiring separate accounting, the embedded derivatives must be aggregated and accounted for as one compound embedded derivative. The initial fair value of the compound embedded derivative in the indenture (the "Compound Derivative") was recorded as a component of Long-term debt in the Consolidated Balance Sheets with a corresponding increase in the recorded balance of the original issue discount related to the senior notes issued in May 2009.
Financial Statement Impact of Derivative Contracts
See Note 2 for a description of how the Partnership values its derivative financial instruments and how the instruments impact its financial statements. The impact of the Partnership's derivative
115
MARKWEST ENERGY PARTNERS, L.P.
NOTES TO CONSOLIDATED FINANCIAL STATEMENTS (Continued)
7. Derivative Financial Instruments (Continued)
instruments on its Consolidated Balance Sheets and Statements of Operations are summarized below (in thousands):
| |
Asset Derivatives | Liability Derivatives | |||||||||||||
|---|---|---|---|---|---|---|---|---|---|---|---|---|---|---|---|
Derivative contracts not designated as hedging instruments and their balance sheet location |
Fair Value at December 31, 2009 |
Fair Value at December 31, 2008 |
Fair Value at December 31, 2009 |
Fair Value at December 31, 2008 |
|||||||||||
Commodity Contracts |
|||||||||||||||
Fair value of derivative instruments—current |
$ | 8,312 | $ | 126,949 | $ | (60,464 | ) | $ | (37,633 | ) | |||||
Fair value of derivative instruments—long-term |
15,810 | 55,389 | (62,519 | ) | (14,801 | ) | |||||||||
Interest Rate Contracts |
|||||||||||||||
Fair value of derivative instruments—current |
509 | — | — | — | |||||||||||
Other Contracts |
|||||||||||||||
Long-term debt |
— | — | (190 | ) | — | ||||||||||
Total |
$ | 24,631 | $ | 182,338 | $ | (123,173 | ) | $ | (52,434 | ) | |||||
| |
Year ended December 31, | |||||||||||
|---|---|---|---|---|---|---|---|---|---|---|---|---|
Derivative contracts not designated as hedging instruments and the location of gain or (loss) recognized in income |
2009 | 2008 | 2007 | |||||||||
Revenue: Derivative (loss) gain |
||||||||||||
Realized gain (loss) |
$ | 87,289 | $ | (15,704 | ) | $ | (15,901 | ) | ||||
Unrealized (loss) gain |
(207,641 | ) | 293,532 | (144,069 | ) | |||||||
Total revenue: derivative (loss) gain |
(120,352 | ) | 277,828 | (159,970 | ) | |||||||
Derivative (loss) gain related to purchased product costs |
||||||||||||
Realized (loss) gain |
(53,052 | ) | 7,368 | (8,829 | ) | |||||||
Unrealized loss |
(15,831 | ) | (29,739 | ) | (6,363 | ) | ||||||
Total derivative loss related to purchased product costs |
(68,883 | ) | (22,371 | ) | (15,192 | ) | ||||||
Derivative gain (loss) related to facility expenses |
||||||||||||
Unrealized gain (loss) |
373 | (644 | ) | 14 | ||||||||
Derivative gain related to interest expense |
||||||||||||
Realized gain |
2,000 | — | — | |||||||||
Unrealized gain |
509 | — | — | |||||||||
Total derivative gain related to interest expense |
2,509 | — | — | |||||||||
Miscellaneous income (expense), net |
||||||||||||
Unrealized gain |
336 | — | — | |||||||||
Total (loss) gain |
$ | (186,017 | ) | $ | 254,813 | $ | (175,148 | ) | ||||
At December 31, 2009, the fair value of the Partnership's commodity derivative contracts is inclusive of premium payments of $7.7 million, net of amortization. For 2009, 2008 and 2007, the Realized (loss) gain—revenue includes amortization of premium payments of $5.7 million, $2.1 million and $1.0 million, respectively.
116
MARKWEST ENERGY PARTNERS, L.P.
NOTES TO CONSOLIDATED FINANCIAL STATEMENTS (Continued)
7. Derivative Financial Instruments (Continued)
Credit Risk Contingent Feature
The Partnership has a contractual arrangement with one non-bank group counterparty that contains a credit risk contingent feature. The Partnership has OTC swap and put positions with this counterparty. This arrangement contains provisions that if the Partnership's credit rating for its long-term senior unsecured debt, as announced by Moody's Investors Service, Inc. and Standard & Poor's Corporation were to decline below B3 or B-, respectively, the Partnership would be required to post additional collateral in the amount of 15% of all outstanding transactions if the contract value of all outstanding transactions was in a net liability position. The Partnership has a standard master netting arrangement with this counterparty. The aggregate fair value of all derivative contracts with a credit risk related contingent feature that are in a liability position at December 31, 2009 is $(5.2) million; however, for all outstanding transactions with this counterparty, the Partnership has a net asset position of $1.7 million. If the credit risk contingent feature was triggered as of December 31, 2009, the Partnership would not be required to post additional collateral as collateral is not required when the net position is an asset. If the Partnership's net position became a liability and collateral was required to be posted, it would be accomplished through a letter of credit due to a restriction in the credit agreement which does not allow cash collateral.
Outstanding Derivative Contracts
The following tables provide information on the volume of the Partnership's derivative activity for positions related to long liquids and keep-whole price risk and interest rate risk at December 31, 2009, including the weighted average prices ("WAVG"):
WTI Crude Collars
|
Volumes (Bbl/d) |
WAVG Floor (Per Bbl) |
WAVG Cap (Per Bbl) |
Fair Value (in thousands) |
|||||||||
|---|---|---|---|---|---|---|---|---|---|---|---|---|---|
2010 (Apr - Dec) |
1,297 | $ | 66.48 | $ | 74.49 | $ | (3,678 | ) | |||||
2011 |
822 | 60.00 | 80.13 | (3,399 | ) | ||||||||
2012 |
822 | 60.00 | 85.87 | (3,328 | ) | ||||||||
WTI Crude Puts
|
Volumes (Bbl/d) |
WAVG Floor (Per Bbl) |
Fair Value (in thousands) |
|||||||
|---|---|---|---|---|---|---|---|---|---|---|
2010 |
1,191 | $ | 80.00 | $ | 3,117 | |||||
2011 |
1,818 | 80.00 | 6,872 | |||||||
WTI Crude Swaps
|
Volumes (Bbl/d) |
WAVG Price (Per Bbl) |
Fair Value (in thousands) |
|||||||
|---|---|---|---|---|---|---|---|---|---|---|
2010 |
2,783 | $ | 67.88 | $ | (14,340 | ) | ||||
2011 |
535 | 68.20 | (3,305 | ) | ||||||
2012 |
529 | 70.30 | (3,139 | ) | ||||||
Natural Gas Swaps
|
Volumes (MMBtu/d) |
WAVG Price (Per MMBtu) |
Fair Value (in thousands) |
|||||||
|---|---|---|---|---|---|---|---|---|---|---|
2010 |
5,023 | $ | 5.59 | $ | (25 | ) | ||||
117
MARKWEST ENERGY PARTNERS, L.P.
NOTES TO CONSOLIDATED FINANCIAL STATEMENTS (Continued)
7. Derivative Financial Instruments (Continued)
IsoButane Swaps
|
Volumes (Gal/d) |
WAVG Price (Per Gal) |
Fair Value (in thousands) |
|||||||
|---|---|---|---|---|---|---|---|---|---|---|
2010 |
10,949 | $ | 1.40 | $ | (802 | ) | ||||
Natural Gasoline Swaps
|
Volumes (Gal/d) |
WAVG Price (Per Gal) |
Fair Value (in thousands) |
|||||||
|---|---|---|---|---|---|---|---|---|---|---|
2010 |
19,246 | $ | 1.66 | $ | (828 | ) | ||||
Normal Butane Swaps
|
Volumes (Gal/d) |
WAVG Price (Per Gal) |
Fair Value (in thousands) |
|||||||
|---|---|---|---|---|---|---|---|---|---|---|
2010 |
16,532 | $ | 1.36 | $ | (863 | ) | ||||
Propane Swaps
|
Volumes (Gal/d) |
WAVG Price (Per Gal) |
Fair Value (in thousands) |
|||||||
|---|---|---|---|---|---|---|---|---|---|---|
2010 |
56,435 | $ | 1.10 | $ | (3,200 | ) | ||||
Interest Rate Swaps
|
Principal Notional Amount (in thousands) |
WAVG LIBOR Spread |
Fair Value (in thousands) |
|||||||
|---|---|---|---|---|---|---|---|---|---|---|
2014 (Settlement Dates May 1st & Nov 1st) |
$ | 275,000 | 3.83 | % | $ | 509 | ||||
The following tables provide information on the volume of the Partnership's taxable subsidiary's commodity derivative activity for positions related to keep-whole price risk at December 31, 2009, including the WAVG:
WTI Crude Collars
|
Volumes (Bbl/d) |
WAVG Floor (Per Bbl) |
WAVG Cap (Per Bbl) |
Fair Value (in thousands) |
|||||||||
|---|---|---|---|---|---|---|---|---|---|---|---|---|---|
2012 |
648 | $ | 70.00 | $ | 91.85 | $ | (1,401 | ) | |||||
WTI Crude Swaps
|
Volumes (Bbl/d) |
WAVG Price (Per Bbl) |
Fair Value (in thousands) |
|||||||
|---|---|---|---|---|---|---|---|---|---|---|
2010 |
2,098 | $ | 71.05 | $ | (8,959 | ) | ||||
2011 |
3,150 | 87.27 | 1,412 | |||||||
2012 (Jan) |
2,142 | 91.50 | 261 | |||||||
Natural Gas Swaps
|
Volumes (MMBtu/d) |
WAVG Price (Per MMBtu) |
Fair Value (in thousands) |
|||||||
|---|---|---|---|---|---|---|---|---|---|---|
2010 |
12,810 | $ | 8.83 | $ | (12,360 | ) | ||||
2011 |
15,429 | 8.79 | (12,247 | ) | ||||||
2012 |
4,225 | 7.08 | (618 | ) | ||||||
IsoButane Swaps
|
Volumes (Gal/d) |
WAVG Price (Per Gal) |
Fair Value (in thousands) |
|||||||
|---|---|---|---|---|---|---|---|---|---|---|
2010 |
14,224 | $ | 1.44 | $ | (231 | ) | ||||
118
MARKWEST ENERGY PARTNERS, L.P.
NOTES TO CONSOLIDATED FINANCIAL STATEMENTS (Continued)
7. Derivative Financial Instruments (Continued)