Attached files
| file | filename |
|---|---|
| 8-K - FORM 8-K - ENDURANCE SPECIALTY HOLDINGS LTD | c97004e8vk.htm |
Exhibit 99.1
| 2010 AIFA Insurance Conference Strategic and Financial Benefits of ERM March 1, 2010 Michael E. Angelina, ACAS, MAAA Chief Risk Officer Endurance Specialty Holdings Ltd |
| 2 Forward looking statements & regulation G disclaimer Safe Harbor for Forward Looking Statements Some of the statements in this presentation include forward-looking statements which reflect our current views with respect to future events and financial performance. Such statements include forward-looking statements both with respect to us in general and the insurance and reinsurance sectors specifically, both as to underwriting and investment matters. Statements which include the words "expect," "intend," "plan," "believe," "project," "anticipate," "seek," "will," and similar statements of a future or forward-looking nature identify forward-looking statements in this presentation for purposes of the U.S. federal securities laws or otherwise. We intend these forward-looking statements to be covered by the safe harbor provisions for forward-looking statements in the Private Securities Litigation Reform Act of 1995. All forward-looking statements address matters that involve risks and uncertainties. Accordingly, there are or may be important factors that could cause actual results to differ from those indicated in the forward-looking statements. These factors include, but are not limited to, developments in the world's financial and capital markets that could adversely affect the performance of Endurance's investment portfolio or access to capital, changes in the composition of Endurance's investment portfolio, competition, possible terrorism or the outbreak of war, the frequency or severity of unpredictable catastrophic events, changes in demand for insurance or reinsurance, rating agency actions, uncertainties in our reserving process, a change in our tax status, acceptance of our products, the availability of reinsurance or retrocessional coverage, retention of key personnel, political conditions, the impact of current legislation and regulatory initiatives, changes in accounting policies, changes in general economic conditions and other factors described in our most recent Annual Report on Form 10-K. Forward-looking statements speak only as of the date on which they are made, and we undertake no obligation publicly to update or revise any forward-looking statement, whether as a result of new information, future developments or otherwise. Regulation G Disclaimer In presenting the Company's results, management has included and discussed certain non-GAAP measures. Management believes that these non-GAAP measures, which may be defined differently by other companies, better explain the Company's results of operations in a manner that allows for a more complete understanding of the underlying trends in the Company's business. However, these measures should not be viewed as a substitute for those determined in accordance with GAAP. For a complete description of non-GAAP measures and reconciliations, please review the Investor Financial Supplement on our web site at www.endurance.bm. The combined ratio is the sum of the loss, acquisition expense and general and administrative expense ratios. Endurance presents the combined ratio as a measure that is commonly recognized as a standard of performance by investors, analysts, rating agencies and other users of its financial information. The combined ratio, excluding prior year net loss reserve development, enables investors, analysts, rating agencies and other users of its financial information to more easily analyze Endurance's results of underwriting activities in a manner similar to how management analyzes Endurance's underlying business performance. The combined ratio, excluding prior year net loss reserve development, should not be viewed as a substitute for the combined ratio. Net premiums written (prior to deposit accounting adjustments) is a non-GAAP internal performance measure used by Endurance in the management of its operations. Net premiums written (prior to deposit accounting adjustments) represents net premiums written and deposit premiums, which are premiums on contracts that are deemed as either transferring only significant timing risk or transferring only significant underwriting risk and thus are required to be accounted for under GAAP as deposits. Endurance believes these amounts are significant to its business and underwriting process and excluding them distorts the analysis of its premium trends. In addition to presenting gross premiums written determined in accordance with GAAP, Endurance believes that net premiums written (prior to deposit accounting adjustments) enables investors, analysts, rating agencies and other users of its financial information to more easily analyze Endurance's results of underwriting activities in a manner similar to how management analyzes Endurance's underlying business performance. Net premiums written (prior to deposit accounting adjustments) should not be viewed as a substitute for gross premiums written determined in accordance with GAAP. Return on Average Equity (ROAE) is comprised using the average common equity calculated as the arithmetic average of the beginning and ending common equity balances for stated periods. Return on Beginning Equity (ROBE) is comprised using the beginning common equity for stated periods. The Company presents various measures of Return on Equity that are commonly recognized as a standard of performance by investors, analysts, rating agencies and other users of its financial information. |
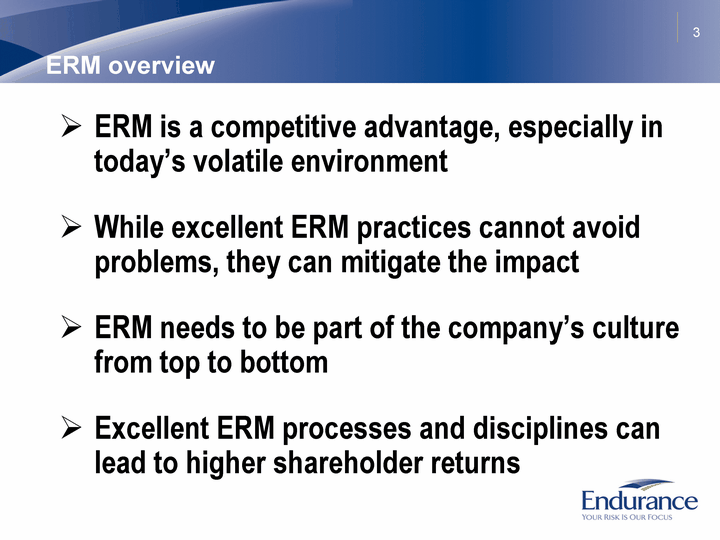
| 3 ERM overview ERM is a competitive advantage, especially in today's volatile environment While excellent ERM practices cannot avoid problems, they can mitigate the impact ERM needs to be part of the company's culture from top to bottom Excellent ERM processes and disciplines can lead to higher shareholder returns |
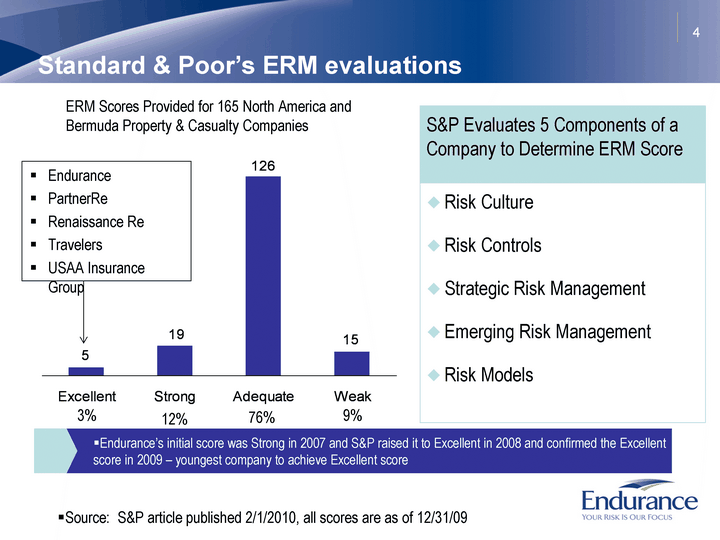
| 4 Standard & Poor's ERM evaluations Excellent Strong Adequate Weak Property 5 19 126 15 Endurance's initial score was Strong in 2007 and S&P raised it to Excellent in 2008 and confirmed the Excellent score in 2009 - youngest company to achieve Excellent score S&P Evaluates 5 Components of a Company to Determine ERM Score Risk Culture Risk Controls Strategic Risk Management Emerging Risk Management Risk Models ERM Scores Provided for 165 North America and Bermuda Property & Casualty Companies Endurance PartnerRe Renaissance Re Travelers USAA Insurance Group 3% 12% 76% 9% Source: S&P article published 2/1/2010, all scores are as of 12/31/09 |
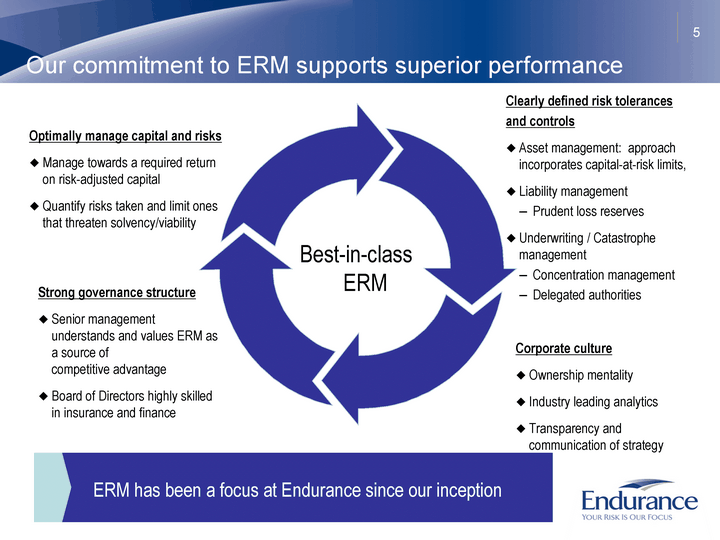
| ERM has been a focus at Endurance since our inception 5 Our commitment to ERM supports superior performance Best-in-class ERM Optimally manage capital and risks Manage towards a required return on risk-adjusted capital Quantify risks taken and limit ones that threaten solvency/viability Clearly defined risk tolerances and controls Asset management: approach incorporates capital-at-risk limits, Liability management Prudent loss reserves Underwriting / Catastrophe management Concentration management Delegated authorities Strong governance structure Senior management understands and values ERM as a source of competitive advantage Board of Directors highly skilled in insurance and finance Corporate culture Ownership mentality Industry leading analytics Transparency and communication of strategy |
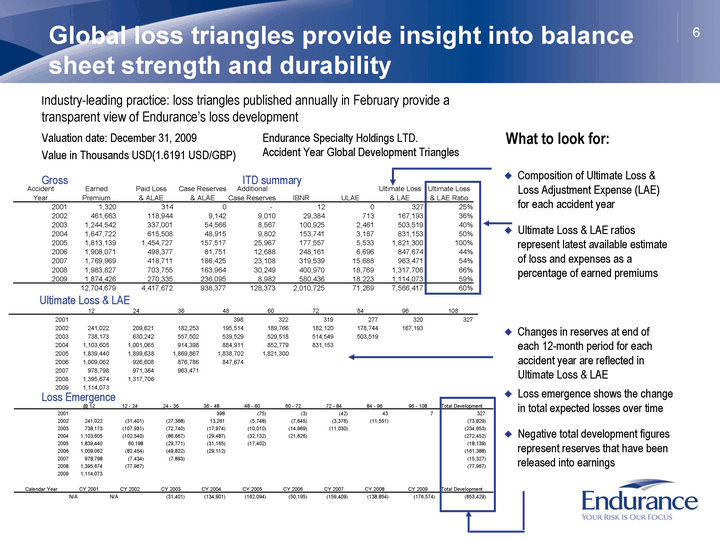
| 12 24 36 48 60 72 84 96 108 2001 398 322 319 277 320 327 2002 241,022 209,621 182,253 195,514 189,766 182,120 178,744 167,193 2003 738,173 630,242 557,502 539,529 529,518 514,549 503,519 2004 1,103,605 1,001,065 914,398 884,911 852,779 831,153 2005 1,839,440 1,899,638 1,869,867 1,838,702 1,821,300 2006 1,009,062 926,608 876,786 847,674 2007 978,798 971,364 963,471 2008 1,395,674 1,317,706 2009 1,114,073 @ 12 12 - 24 24 - 36 36 - 48 48 - 60 60 - 72 72 - 84 84 - 96 96 - 108 Total Development 2001 398 (75) (3) (42) 43 7 327 2002 241,022 (31,401) (27,368) 13,261 (5,748) (7,645) (3,376) (11,551) (73,829) 2003 738,173 (107,931) (72,740) (17,974) (10,010) (14,969) (11,030) (234,653) 2004 1,103,605 (102,540) (86,667) (29,487) (32,132) (21,626) (272,452) 2005 1,839,440 60,198 (29,771) (31,165) (17,402) (18,139) 2006 1,009,062 (82,454) (49,822) (29,112) (161,388) 2007 978,798 (7,434) (7,893) (15,327) 2008 1,395,674 (77,967) (77,967) 2009 1,114,073 Calendar Year CY 2001 CY 2002 CY 2003 CY 2004 CY 2005 CY 2006 CY 2007 CY 2008 CY 2009 Total Development N/A N/A (31,401) (134,901) (162,094) (50,195) (159,409) (138,854) (176,574) (853,429) Accident Earned Paid Loss Case Reserves Additional Ultimate Loss Ultimate Loss Year Premium & ALAE & ALAE Case Reserves IBNR ULAE & LAE & LAE Ratio 2001 1,320 314 0 - 12 0 327 25% 2002 461,663 118,944 9,142 9,010 29,384 713 167,193 36% 2003 1,244,542 337,001 54,566 8,567 100,925 2,461 503,519 40% 2004 1,647,722 615,508 48,915 9,802 153,741 3,187 831,153 50% 2005 1,813,139 1,454,727 157,517 25,967 177,557 5,533 1,821,300 100% 2006 1,908,071 498,377 81,751 12,688 248,161 6,696 847,674 44% 2007 1,769,969 418,711 186,425 23,108 319,539 15,688 963,471 54% 2008 1,983,827 703,755 163,964 30,249 400,970 18,769 1,317,706 66% 2009 1,874,426 270,335 236,095 8,982 580,436 18,223 1,114,073 59% 12,704,679 4,417,672 938,377 128,373 2,010,725 71,269 7,566,417 60% 6 Global loss triangles provide insight into balance sheet strength and durability Industry-leading practice: loss triangles published annually in February provide a transparent view of Endurance's loss development Composition of Ultimate Loss & Loss Adjustment Expense (LAE) for each accident year Ultimate Loss & LAE ratios represent latest available estimate of loss and expenses as a percentage of earned premiums What to look for: Loss emergence shows the change in total expected losses over time Negative total development figures represent reserves that have been released into earnings Changes in reserves at end of each 12-month period for each accident year are reflected in Ultimate Loss & LAE Gross ITD summary Endurance Specialty Holdings LTD. Accident Year Global Development Triangles Valuation date: December 31, 2009 Value in Thousands USD(1.6191 USD/GBP) Ultimate Loss & LAE Loss Emergence |
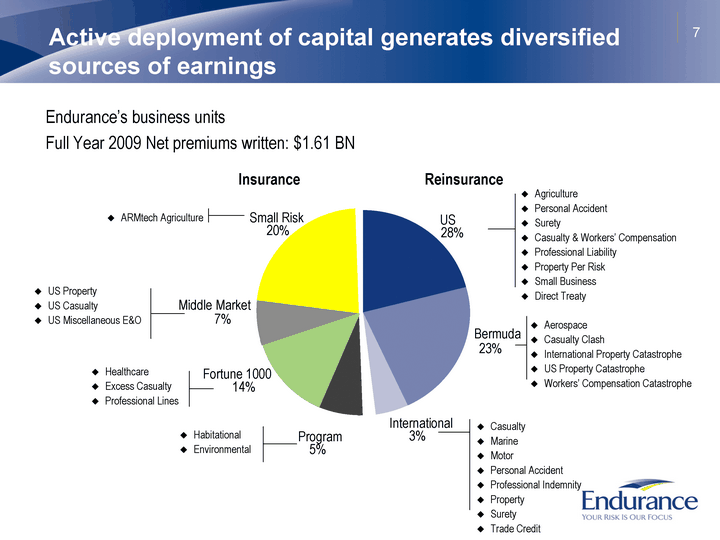
| 7 Active deployment of capital generates diversified sources of earnings Endurance's business units Full Year 2009 Net premiums written: $1.61 BN Reinsurance Insurance Agriculture Personal Accident Surety Casualty & Workers' Compensation Professional Liability Property Per Risk Small Business Direct Treaty Aerospace Casualty Clash International Property Catastrophe US Property Catastrophe Workers' Compensation Catastrophe ARMtech Agriculture US Property US Casualty US Miscellaneous E&O Healthcare Excess Casualty Professional Lines Habitational Environmental International 3% Fortune 1000 14% Middle Market 7% 20% Bermuda 23% US 28% Program 5% Casualty Marine Motor Personal Accident Professional Indemnity Property Surety Trade Credit Small Risk |
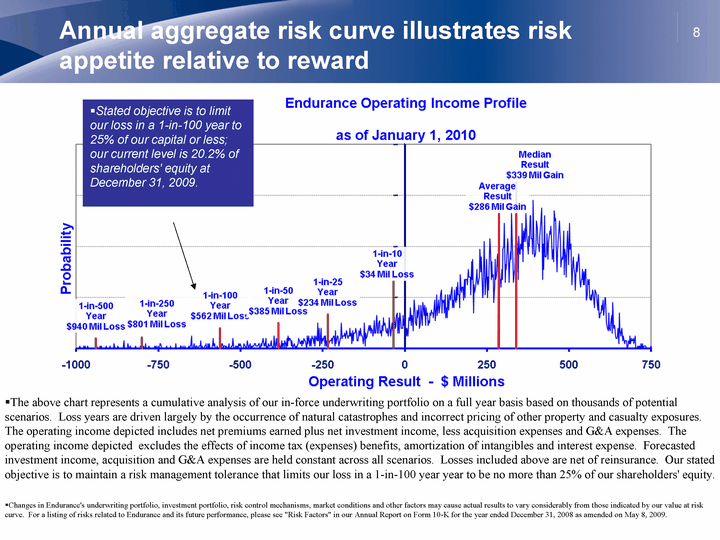
| 8 Annual aggregate risk curve illustrates risk appetite relative to reward Stated objective is to limit our loss in a 1-in-100 year to 25% of our capital or less; our current level is 20.2% of shareholders' equity at December 31, 2009. The above chart represents a cumulative analysis of our in-force underwriting portfolio on a full year basis based on thousands of potential scenarios. Loss years are driven largely by the occurrence of natural catastrophes and incorrect pricing of other property and casualty exposures. The operating income depicted includes net premiums earned plus net investment income, less acquisition expenses and G&A expenses. The operating income depicted excludes the effects of income tax (expenses) benefits, amortization of intangibles and interest expense. Forecasted investment income, acquisition and G&A expenses are held constant across all scenarios. Losses included above are net of reinsurance. Our stated objective is to maintain a risk management tolerance that limits our loss in a 1-in-100 year year to be no more than 25% of our shareholders' equity. Changes in Endurance's underwriting portfolio, investment portfolio, risk control mechanisms, market conditions and other factors may cause actual results to vary considerably from those indicated by our value at risk curve. For a listing of risks related to Endurance and its future performance, please see "Risk Factors" in our Annual Report on Form 10-K for the year ended December 31, 2008 as amended on May 8, 2009. |
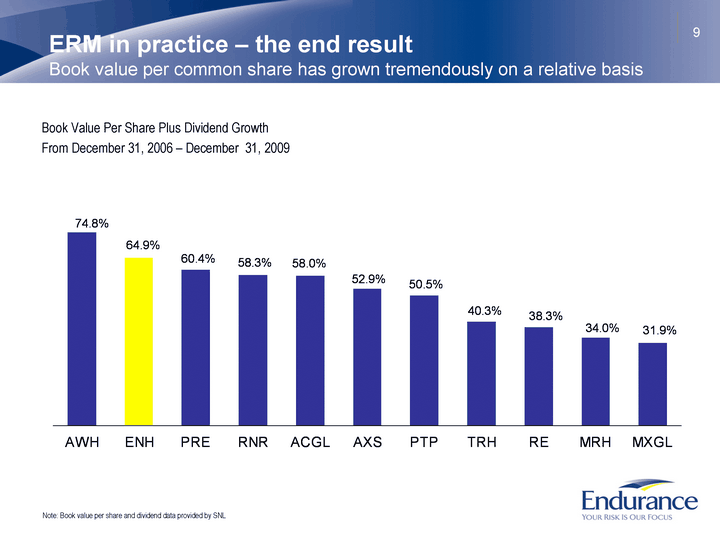
| 9 ERM in practice - the end result Book value per common share has grown tremendously on a relative basis Book Value Per Share Plus Dividend Growth From December 31, 2006 - December 31, 2009 AWH ENH PRE RNR ACGL AXS PTP TRH RE MRH MXGL Book Value 0.748 0.649 0.604 0.583 0.58 0.529 0.505 0.403 0.383 0.34 0.319 Note: Book value per share and dividend data provided by SNL |
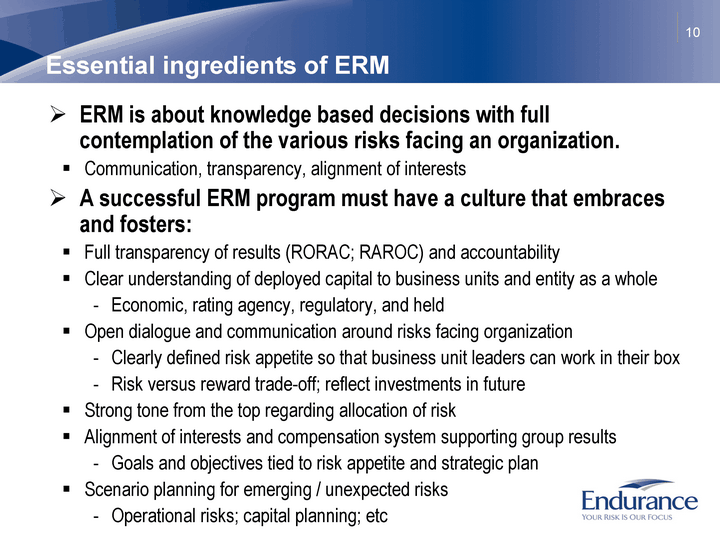
| 10 Essential ingredients of ERM ERM is about knowledge based decisions with full contemplation of the various risks facing an organization. Communication, transparency, alignment of interests A successful ERM program must have a culture that embraces and fosters: Full transparency of results (RORAC; RAROC) and accountability Clear understanding of deployed capital to business units and entity as a whole Economic, rating agency, regulatory, and held Open dialogue and communication around risks facing organization Clearly defined risk appetite so that business unit leaders can work in their box Risk versus reward trade-off; reflect investments in future Strong tone from the top regarding allocation of risk Alignment of interests and compensation system supporting group results Goals and objectives tied to risk appetite and strategic plan Scenario planning for emerging / unexpected risks Operational risks; capital planning; etc |
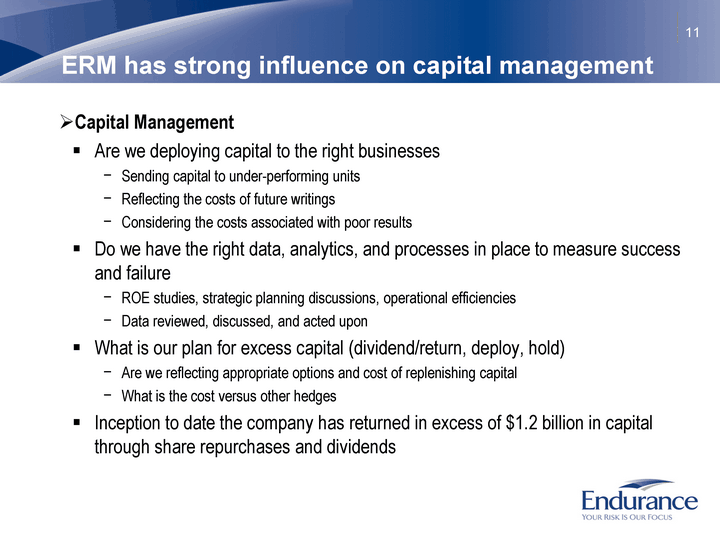
| 11 ERM has strong influence on capital management Capital Management Are we deploying capital to the right businesses Sending capital to under-performing units Reflecting the costs of future writings Considering the costs associated with poor results Do we have the right data, analytics, and processes in place to measure success and failure ROE studies, strategic planning discussions, operational efficiencies Data reviewed, discussed, and acted upon What is our plan for excess capital (dividend/return, deploy, hold) Are we reflecting appropriate options and cost of replenishing capital What is the cost versus other hedges Inception to date the company has returned in excess of $1.2 billion in capital through share repurchases and dividends |
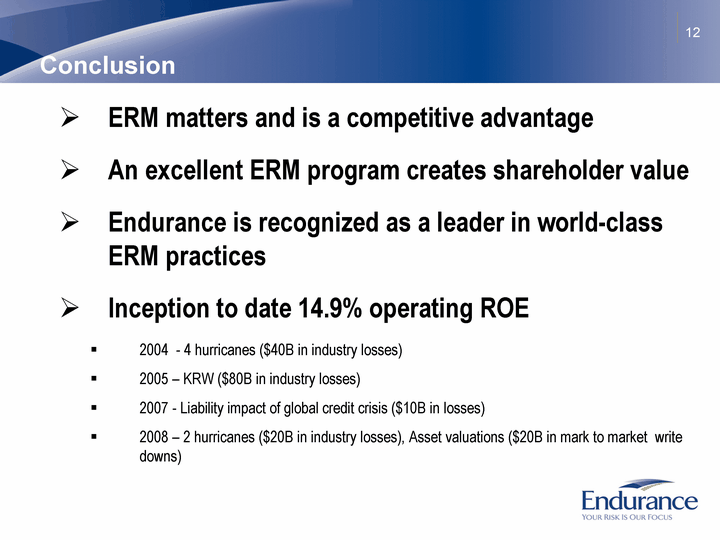
| 12 Conclusion ERM matters and is a competitive advantage An excellent ERM program creates shareholder value Endurance is recognized as a leader in world-class ERM practices Inception to date 14.9% operating ROE 2004 - 4 hurricanes ($40B in industry losses) 2005 - KRW ($80B in industry losses) 2007 - Liability impact of global credit crisis ($10B in losses) 2008 - 2 hurricanes ($20B in industry losses), Asset valuations ($20B in mark to market write downs) |
