Attached files
| file | filename |
|---|---|
| EX-99.1 - EXHIBIT 99.1 - EAST WEST BANCORP INC | a2196846zex-99_1.htm |
| EX-32.2 - EXHIBIT 32.2 - EAST WEST BANCORP INC | a2196846zex-32_2.htm |
| EX-31.2 - EXHIBIT 31.2 - EAST WEST BANCORP INC | a2196846zex-31_2.htm |
| EX-21.1 - EXHIBIT 21.1 - EAST WEST BANCORP INC | a2196846zex-21_1.htm |
| EX-31.1 - EXHIBIT 31.1 - EAST WEST BANCORP INC | a2196846zex-31_1.htm |
| EX-32.1 - EXHIBIT 32.1 - EAST WEST BANCORP INC | a2196846zex-32_1.htm |
| EX-23.1 - EXHIBIT 23.1 - EAST WEST BANCORP INC | a2196846zex-23_1.htm |
| EX-99.2 - EXHIBIT 99.2 - EAST WEST BANCORP INC | a2196846zex-99_2.htm |
| EX-23.2 - EXHIBIT 23.2 - EAST WEST BANCORP INC | a2196846zex-23_2.htm |
| EX-12.1 - EXHIBIT 12.1 - EAST WEST BANCORP INC | a2196846zex-12_1.htm |
| EX-10.12 - EXHIBIT 10.12 - EAST WEST BANCORP INC | a2196846zex-10_12.htm |
UNITED STATES
SECURITIES AND EXCHANGE COMMISSION
Washington, D.C. 20549
FORM 10-K
| Mark One | ||
ý |
ANNUAL REPORT PURSUANT TO SECTION 13 OR 15(d) OF THE SECURITIES EXCHANGE ACT OF 1934 |
|
For the fiscal year ended December 31, 2009 |
||
or |
||
o |
TRANSITION REPORT PURSUANT TO SECTION 13 OR 15(d) OF THE SECURITIES EXCHANGE ACT OF 1934 |
|
For the transition period from to . |
||
Commission file number 000-24939
EAST WEST BANCORP, INC.
(Exact name of registrant as specified in its charter)
| Delaware (State or other jurisdiction of incorporation or organization) |
95-4703316 (I.R.S. Employer Identification No.) |
|
135 North Los Robles Ave., 7th Floor, Pasadena, California (Address of principal executive offices) |
91101 (Zip Code) |
|
Registrant's telephone number, including area code: (626) 768-6000 |
||
Securities registered pursuant to Section 12(b) of the Act: |
||
Title of each class
|
Name of each exchange on which registered
|
|
|---|---|---|
| Common Stock, $0.001 Par Value | NASDAQ "Global Select Market" |
Securities registered pursuant to Section 12(g) of the Act:
NONE
Indicate by check mark if the registrant is a well-known seasoned issuer, as defined in Rule 405 of the Securities Act. Yes ý No o
Indicate by check mark if the registrant is not required to file reports pursuant to Section 13 or Section 15(d) of the Act. Yes o No ý
Indicate by check mark whether the registrant (1) has filed all reports required to be filed by Section 13 or 15(d) of the Securities Exchange Act of 1934 during the preceding 12 months (or for such shorter period that the registrant was required to file such reports), and (2) has been subject to such filing requirements for the past 90 days. Yes ý No o
Indicate by check mark whether the registrant has submitted electronically and posted on its corporate Web site, if any, every Interactive Data File required to be submitted and posted pursuant to Rule 405 of Regulation S-T (§ 232.405 of this chapter) during the preceding 12 months (or for such shorter period that the registrant was required to submit and post such files). Yes o No o
Indicate by check mark if disclosure of delinquent filers pursuant to Item 405 of Regulation S-K (§ 229.405 of this chapter) is not contained herein, and will not be contained, to the best of registrant's knowledge, in definitive proxy or information statements incorporated by reference in Part III of the Form 10-K or any amendment to this Form 10-K. ý
Indicate by check mark whether the registrant is a large accelerated filer, an accelerated filed, a non-accelerated filer, or a smaller reporting company. See definitions of "large accelerated filer, "accelerated filer" and "smaller reporting company" in Rule 12b-2 of the Exchange Act.
| Large accelerated filed o | Accelerated filer ý | Non-accelerated filer o | Smaller reporting company o |
Indicate by check mark whether the registrant is a shell company (as defined in Rule 12b-2 of the Exchange Act). Yes o No ý
The aggregate market value of the registrant's common stock held by non-affiliates is approximately $346,390,718 (based on the June 30, 2009 closing price of Common Stock of $6.49 per share).
As of February 12, 2010, 110,506,071 shares of East West Bancorp, Inc. Common Stock were outstanding.
DOCUMENT INCORPORATED BY REFERENCE
Definitive Proxy Statement for the Annual Meeting of Stockholders – Part III
EAST WEST BANCORP, INC.
2009 ANNUAL REPORT ON FORM 10-K
TABLE OF CONTENTS
2
Certain matters discussed in this Annual Report contains or incorporates statements that we believe are "forward-looking statements" within the meaning of Section 27A of the Securities Act of 1933, as amended, and Rule 175 promulgated thereunder, and Section 21E of the Securities Exchange Act of 1934, as amended, and Rule 3b-6 promulgated thereunder. These statements relate to our financial condition, results of operations, plans, objectives, future performance or business. They usually can be identified by the use of forward-looking language, such as "will likely result," "may," "are expected to," "is anticipated," "estimate," "forecast," "projected," "intends to," or may include other similar words or phrases, such as "believes," "plans," "trend," "objective," "continue," "remain," or similar expressions, or future or conditional verbs, such as "will," "would," "should," "could," "might," "can," or similar verbs. You should not place undue reliance on these statements, as they are subject to risks and uncertainties, including, but not limited to, those described in the documents incorporated by reference. When considering these forward-looking statements, you should keep in mind these risks and uncertainties, as well as any cautionary statements we may make. Moreover, you should treat these statements as speaking only as of the date they are made and based only on information then actually known to us.
There are a number of important factors that could cause future results to differ materially from historical performance and these forward-looking statements. Factors that might cause such a difference include, but are not limited to:
- •
- our ability to integrate the former United Commercial Bank operations and to achieve expected synergies, operating
efficiencies or other benefits within expected time frames, or at all, or within expected cost projections;
- •
- our ability to integrate and retain former depositors and borrowers of United Commercial Bank;
- •
- our ability to manage the loan portfolio acquired from United Commercial Bank within the limits of the loss protection
provided by the FDIC;
- •
- changes in our borrowers' performance on loans;
- •
- changes in the commercial and consumer real estate markets;
- •
- changes in our costs of operation, compliance and expansion;
- •
- changes in the economy, including inflation;
- •
- changes in government interest rate policies;
- •
- changes in laws or the regulatory environment;
- •
- changes in critical accounting policies and judgments;
- •
- changes in accounting policies or procedures as may be required by the Financial Accounting Standards Board or other
regulatory agencies;
- •
- changes in the equity and debt securities markets;
- •
- changes in competitive pressures on financial institutions;
- •
- effect of additional provision for loan losses;
- •
- effect of any goodwill impairment;
- •
- fluctuations of our stock price;
- •
- success and timing of our business strategies;
- •
- impact of reputational risk created by these developments on such matters as business generation and retention, funding
and liquidity;
- •
- changes in our ability to receive dividends from our subsidiaries; and
- •
- political developments, wars or other hostilities may disrupt or increase volatility in securities or otherwise affect economic conditions.
3
For a more detailed discussion of some of the factors that might cause such differences, see "ITEM 1A. RISK FACTORS." The Company does not undertake, and specifically disclaims any obligation to update any forward-looking statements to reflect the occurrence of events or circumstances after the date of such statements, except as required by law.
Organization
East West Bancorp, Inc. East West Bancorp, Inc. (referred to herein on an unconsolidated basis as "East West" and on a consolidated basis as the "Company" or "we") is a bank holding company incorporated in Delaware on August 26, 1998 and registered under the Bank Holding Company Act of 1956, as amended ("BHCA"). The Company commenced business on December 30, 1998 when, pursuant to a reorganization, it acquired all of the voting stock of East West Bank, or the "Bank". The Bank is the Company's principal asset. In addition to the Bank, the Company has ten other subsidiaries, namely East West Insurance Services, Inc., East West Capital Trust I, East West Capital Trust II, East West Capital Statutory Trust III, East West Capital Trust IV, East West Capital Trust V, East West Capital Trust VI, East West Capital Trust VII, East West Capital Trust VIII, and East West Capital Trust IX.
East West Insurance Services, Inc. On August 22, 2000, East West completed the acquisition of East West Insurance Services, Inc. (the "Agency") in a stock exchange transaction. The Agency provides business and consumer insurance services to the Southern California market. The Agency runs its operations autonomously from the operations of the Company. The operations of the Agency are limited and are not deemed material in relation to the overall operations of the Company.
Other Subsidiaries of East West Bancorp, Inc. The Company has established nine other subsidiaries as statutory business trusts, East West Capital Trust I and East West Capital Trust II in 2000, East West Capital Statutory Trust III in 2003, East West Capital Trust IV and East West Capital Trust V in 2004, East West Capital Trust VI in 2005, East West Capital Trust VII in 2006, and East West Capital Trusts VIII and IX in 2007, collectively referred to as the "Trusts". In nine separate private placement transactions, the Trusts have issued either fixed or variable rate capital securities representing undivided preferred beneficial interests in the assets of the Trusts. East West is the owner of all the beneficial interests represented by the common securities of the Trusts. The purpose of issuing the capital securities was to provide the Company with a cost-effective means of obtaining Tier I capital for regulatory purposes. In accordance with Financial Accounting Standards Interpretation No. 46R, Consolidation of Variable Interest Entities ("FIN No. 46R"), the Trusts are not consolidated into the accounts of the Company.
East West's principal business is to serve as a holding company for the Bank and other banking or banking-related subsidiaries which East West may establish or acquire. East West has not engaged in any other activities to date. As a legal entity separate and distinct from its subsidiaries, East West's principal source of funds is, and will continue to be, dividends that may be paid by its subsidiaries. East West's other sources of funds include proceeds from the issuance of its common stock in connection with stock option and warrant exercises and employee stock purchase plans. At December 31, 2009, the Company had $20.56 billion in total consolidated assets, $13.84 billion in net consolidated loans, and $14.99 billion in total consolidated deposits.
The principal office of the Company is located at 135 N. Los Robles Ave., 7th Floor, Pasadena, California 91101, and the telephone number is (626) 768-6000.
4
East West Bank. East West Bank was chartered by the Federal Home Loan Bank Board in June 1972, as the first federally chartered savings institution focused primarily on the Chinese-American community, and opened for business at its first office in the Chinatown district of Los Angeles in January 1973. From 1973 until the early 1990's, the Bank conducted a traditional savings and loan business by making predominantly long-term, single family residential and commercial and multifamily real estate loans. These loans were made principally within the ethnic Chinese market in Southern California and were funded primarily with retail savings deposits and advances from the Federal Home Loan Bank of San Francisco. The Bank has emphasized commercial lending since its conversion to a state-chartered commercial bank on July 31, 1995. The Bank now also provides loans for commercial, construction, and residential real estate projects and for the financing of international trade for companies primarily in California.
At December 31, 2009, the Bank had four wholly owned subsidiaries. The first subsidiary, E-W Services, Inc., is a California corporation organized by the Bank in 1977. E-W Services, Inc. holds property used by the Bank in its operations. The secondary subsidiary, East-West Investments, Inc., primarily acts as a trustee in connection with real estate secured loans. The remaining two other subsidiaries, Cal Canton and United Commercial Bank (China) Limited were the result of the UCB Acquisition.
Acquisitions of existing banks have contributed to the Bank's growth. We continue to look for opportunities to expand the Bank's branch network by acquiring other financial institutions to diversify our customer base in order to compete for new deposits and loans, and to serve our customers effectively by providing them with a wide array of financial solutions, products and services.
On August 17, 2007, the Bank completed the acquisition of Desert Community Bank ("DCB"), a commercial bank headquartered in Victorville, California. The purchase price was $145.0 million with fifty-five percent of the merger consideration paid in East West common stock and the remainder in cash. DCB operated through nine branches located throughout the High Desert area of San Bernardino County. The Bank acquired approximately $406.1 million in net loans receivable and assumed $506.7 million in deposits through this acquisition. These nine branches are operated under the name Desert Community Bank, a division of East West Bank.
On November 6, 2009, the Bank entered into a purchase and assumption agreement ("Purchase and Assumption Agreement") with the Federal Deposit Insurance Corporation ("FDIC"), pursuant to which the Bank acquired certain assets and assumed certain liabilities of the former United Commercial Bank ("United Commercial Bank"), a California state-chartered bank headquartered in San Francisco, California (the "UCB Acquisition"). The UCB Acquisition included all 63 U.S. branches of United Commercial Bank, which opened as branches of the Bank as of Monday, November 9, 2009. It also included the Hong Kong branch of United Commercial Bank and United Commercial Bank (China) Limited, the subsidiary of United Commercial Bank headquartered in Shanghai, China.
Under the terms of the Purchase and Assumption Agreement, the Bank acquired certain assets of United Commercial Bank with a fair value of approximately $9.86 billion, including $5.90 billion of loans, $1.56 billion of investment securities, $93.5 million of Federal Home Loan Bank stock, $599.0 million of cash and cash equivalents, $147.4 million of securities purchased under sale agreements, $38.0 million of other real estate owned ("OREO"), and $207.6 million of other assets. Liabilities with a fair value of approximately $9.57 billion were also assumed, including $6.53 billion of insured and uninsured deposits, but excluding certain brokered deposits, $1.84 billion of Federal Home Loan ("FHLB") advances, $858.2 million of securities sold under agreements to repurchase, $90.6 million in other borrowings and $254.2 million of other liabilities.
5
See the "Business Combination" section of the Notes to the Consolidated Financial Statements in Note 2 on page 111 for more information on the acquisition.
The Bank has also grown through strategic partnerships and additional branch locations. On August 30, 2001, the Bank entered into an exclusive ten-year agreement with 99 Ranch Market to provide retail banking services in their stores throughout California. 99 Ranch Market is the largest Asian-focused chain of supermarkets on the West Coast, with 24 full service stores in California, two in Washington, and affiliated licensee stores in Arizona, Georgia, Hawaii, Nevada, and Indonesia. Tawa Supermarket Companies or "Tawa" is the parent company of 99 Ranch Market. Tawa's property development division owns and operates many of the shopping centers where 99 Ranch Market stores are located. We are currently providing in-store banking services to nine 99 Ranch Market locations in Southern California and one in Northern California.
The Bank continues to expand its market presence in the international arena. The Bank has two full-service branches in Hong Kong, one of which commenced operations during the first quarter of 2007 and the other was the result of the UCB Acquisition. The Hong Kong branches offer a variety of deposit, loan, and international banking products. In addition, the Bank has two full-service branches in China, one in Shanghai, and one in Shantou, also the result of the UCB Acquisition. The Bank also has four overseas representative offices in China and one in Taipei, Taiwan. The first office, located in Beijing, was opened on January 20, 2003. The second overseas representative office was opened on August 10, 2007, and is located in Shanghai. The remainder of the representative offices were acquired in the UCB Acquisition. These representative offices serve to further develop the Bank's existing international banking capabilities. In addition to facilitating traditional letters of credit and trade finance to businesses, these representative offices allow the Bank to assist existing clients, as well as develop new business relationships. Through these offices, the Bank is focused on growing its export-import lending volume by aiding domestic exporters in identifying and developing new sales opportunities to China-based customers as well as capturing additional letters of credit business generated from China-based exports through broader correspondent banking relationships with a variety of Chinese financial institutions.
The Bank continues to explore opportunities to establish other foreign offices, subsidiaries or strategic investments and partnerships to expand its footprint in the international and global marketplace.
Banking Services
The Bank is the third largest independent commercial bank headquartered in California as of December 31, 2009, and the largest bank in the United States that focuses on the Asian-American community. Through its network of 135 branches worldwide, the Bank provides a wide range of personal and commercial banking services to small and medium-sized businesses, business executives, professionals, and other individuals. The Bank offers multilingual services to its customers in English, Cantonese, Mandarin, Vietnamese, and Spanish. The Bank also offers a variety of deposit products which includes the traditional range of personal and business checking and savings accounts, time deposits and individual retirement accounts, travelers' checks, safe deposit boxes, and MasterCard and Visa merchant deposit services.
The Bank's lending activities include residential and commercial real estate, construction, commercial, trade finance, accounts receivable, small business administration ("SBA"), inventory and working capital loans. The Bank's commercial borrowers are engaged in a wide variety of manufacturing, wholesale trade, and service businesses. The Bank provides commercial loans to small and medium-sized businesses with annual revenues that generally range from several million to
6
$200 million. In addition, the Bank provides short-term trade finance facilities for terms of less than one year primarily to U.S. importers and manufacturers doing business in the Asia Pacific region.
Market Area and Competition
The Bank concentrates on marketing its services primarily in the Los Angeles metropolitan area, Orange County, San Bernardino County, and the greater San Francisco Bay area, including San Mateo County, the Silicon Valley area of Santa Clara County, and Alameda County, with a particular focus on regions with a high concentration of ethnic Chinese. The ethnic Chinese markets within the Bank's primary market area have experienced rapid growth in recent years. According to information provided by the U.S. Census Bureau's 2005-2007 American Community Survey, there were an estimated 4.6 million Asians and Pacific Islanders residing in California, or 12.6% of the total population. As California continues to gain momentum as the hub of the Pacific Rim, the Bank provides important competitive advantages to its customers participating in the Asia Pacific marketplace. We believe that our customers benefit from our understanding of Asian markets and cultures, our corporate and organizational ties throughout Asia, as well as our international banking products and services. We believe that this approach, combined with the extensive ties of our management and Board of Directors to the growing Asian and ethnic Chinese communities, provides us with an advantage in competing for customers in our market area. The Bank is also committed to expanding its customer base to other high growth communities in Northern and Southern California, New York, Georgia, Massachusetts, Texas and Washington
The Bank has 111 branches in California located in the following counties: Los Angeles, Orange, San Bernardino, San Francisco, San Mateo, Santa Clara and Alameda. Additionally, the Bank has eight branches in New York, five branches in Georgia, three branches in Massachusetts, two branches in Texas, and two branches in Washington. In Greater China, East West's presence includes four full-service branches, including two in Hong Kong, one in Shanghai, and one in Shantou. The Bank also has representative offices in Beijing, Guangzhou, Shanghai and Shenzhen, China, and Taipei, Taiwan.
The banking and financial services industry in California generally, and in our market areas specifically, is highly competitive. The increasingly competitive environment is a result primarily of changes in laws and regulations, changes in technology and product delivery systems, as well as continuing consolidation and nationwide expansion among financial services providers.
The Bank competes for loans, deposits, and customers with other commercial banks, savings and loan associations, savings banks, securities and brokerage companies, mortgage companies, insurance companies, finance companies, money market funds, credit unions, and other nonbank financial service providers. Some of these competitors are larger in total assets and capitalization, have greater access to capital markets, including foreign ownership, and offer a broader range of financial services than the Bank.
Economic Conditions, Government Policies, Legislation, and Regulation
The Company's profitability, like most financial institutions, is primarily dependent on interest rate differentials. In general, the difference between the interest rates paid by the Bank on interest-bearing liabilities, such as deposits and other borrowings, and the interest rates received by the Bank on interest-earning assets, such as loans extended to customers and securities held in the investment portfolio, will comprise the major portion of the Company's earnings (losses). These rates are highly sensitive to many factors that are beyond the control of the Company, such as inflation, recession and
7
unemployment, and the impact which future changes in domestic and foreign economic conditions might have on the Company cannot be predicted.
The Company's business is also influenced by the monetary and fiscal policies of the federal government and the policies of regulatory agencies, particularly the Board of Governors of the Federal Reserve System (the "FRB"). The FRB implements national monetary policies (with objectives such as curbing inflation and combating recession) through its open-market operations in U.S. Government securities by adjusting the required level of reserves for depository institutions subject to its reserve requirements, and by varying the target federal funds and discount rates applicable to borrowings by depository institutions. The actions of the FRB in these areas influence the growth of bank loans, investments, and deposits and also affect interest earned on interest-earning assets and paid on interest-bearing liabilities. The nature and impact of any future changes in monetary and fiscal policies on the Company cannot be predicted.
From time to time, federal and state legislation is enacted which may have the effect of materially increasing the cost of doing business, limiting or expanding permissible activities, or affecting the competitive balance between banks and other financial services providers. Several proposals for legislation that could substantially intensify the regulation of the financial services industry (including a possible comprehensive overhaul of the financial institutions regulatory system) are expected to be introduced and possibly enacted in the new Congress in response to the current economic downturn and financial industry instability. Other legislative and regulatory initiatives which could affect us and the banking industry in general are pending, and additional initiatives may be proposed or introduced, before the Congress, the California legislature, and other governmental bodies in the future. Such proposals, if enacted, may further alter the structure, regulation, and competitive relationship among financial institutions, and may subject us to increased regulation, disclosure, and reporting requirements. In addition, the various bank regulatory agencies often adopt new rules and regulations and policies to implement and enforce existing legislation. It cannot be predicted whether, or in what form, any such legislation or regulations or changes in policy may be enacted or the extent to which the business of the Bank would be affected thereby. The Company cannot predict whether or when potential legislation will be enacted, and if enacted, the effect that it, or any implemented regulations and supervisory policies, would have on our financial condition or results of operations. In addition, the outcome of examinations, any litigation or any investigations initiated by state or federal authorities may result in necessary changes in our operations and increased compliance costs.
Negative developments beginning in the latter half of 2007 in the sub-prime mortgage market and the securitization markets for such loans, together with volatility in oil prices and other factors, have resulted in uncertainty in the financial markets in general and a related general economic downturn, which have continued through 2009. Dramatic declines in the housing market, with decreasing home prices and increasing delinquencies and foreclosures, have negatively impacted the credit performance of mortgage and construction loans and resulted in significant write-downs of assets by many financial institutions, including the Bank. In addition, the values of real estate collateral supporting many loans have declined and may continue to decline. General downward economic trends, reduced availability of commercial credit and increasing unemployment have negatively impacted the credit performance of commercial and consumer credit, resulting in additional write-downs. Concerns over the stability of the financial markets and the economy have resulted in decreased lending by financial institutions to their customers and to each other. This market turmoil and tightening of credit has led to increased commercial and consumer delinquencies, lack of customer confidence, increased market volatility and widespread reduction in general business activity. Competition among depository institutions for deposits has increased significantly. Bank and bank holding company stock prices have been significantly negatively affected as has the ability of banks and bank holding companies to raise capital or borrow in the debt markets compared to recent years. The bank regulatory agencies have
8
been very aggressive in responding to concerns and trends identified in examinations, and this has resulted in the increased issuance of enforcement orders requiring action to address credit quality, liquidity and risk management, and capital adequacy concerns, as well as other safety and soundness concerns.
On October 3, 2008, the Emergency Economic Stabilization Act of 2008 was enacted ("EESA") to restore confidence and stabilize the volatility in the U.S. banking system and to encourage financial institutions to increase their lending to customers and to each other. Initially introduced as the Troubled Asset Relief Program ("TARP"), the EESA authorized the United States Department of the Treasury ("U.S. Treasury") to purchase from financial institutions and their holding companies up to $700 billion in mortgage loans, mortgage-related securities and certain other financial instruments, including debt and equity securities issued by financial institutions and their holding companies in a troubled asset relief program. Initially, $350 billion or half of the $700 billion was made immediately available to the U.S. Treasury. On January 15, 2009, the remaining $350 billion was released to the U.S. Treasury.
On October 14, 2008, the U.S. Treasury announced its intention to inject capital into nine large U.S. financial institutions under the TARP Capital Purchase Program (the "TARP CPP"), and since has injected capital into many other financial institutions, including the Company. The U.S. Treasury initially allocated $250 billion towards the TARP CPP. On December 5, 2008, the Company entered into a Securities Purchase Agreement – Standard Terms with the U.S. Treasury ("Stock Purchase Agreement"), pursuant to which, among other things, the Company sold to the U.S. Treasury for an aggregate purchase price of $306.5 million, preferred stock and warrants. Under the terms of the TARP CPP, the Company is prohibited from increasing dividends on its common stock, and from making certain repurchases of equity securities, including its common stock, without the U.S. Treasury's consent. Furthermore, as long as the preferred stock issued to the U.S. Treasury is outstanding, dividend payments and repurchases or redemptions relating to certain equity securities, including the Company's common stock, are prohibited until all accrued and unpaid dividends are paid on such preferred stock, subject to certain limited exceptions. See "Management's Discussion and Analysis of Financial Condition and Results of Operations – Liquidity and Capital Resources" in Part II, Item 7 herein.
In order to participate in the TARP CPP, financial institutions were required to adopt certain standards for executive compensation and corporate governance. These standards generally apply to the Chief Executive Officer, Chief Financial Officer and the three next most highly compensated senior executive officers. The standards include (1) ensuring that incentive compensation for senior executives does not encourage unnecessary and excessive risks that threaten the value of the financial institution; (2) required clawback of any bonus or incentive compensation paid to a senior executive based on statements of earnings, gains or other criteria that are later proven to be materially inaccurate; (3) prohibition on making golden parachute payments to senior executives; and (4) agreement not to deduct for tax purposes executive compensation in excess of $500,000 for each senior executive. The Company has complied with these requirements.
The bank regulatory agencies, U.S. Treasury and the Office of Special Inspector General, also created by the EESA, have issued guidance and requests to the financial institutions that participate in the TARP CPP to document their plans and use of TARP CPP funds and their plans for addressing the executive compensation requirements associated with the TARP CPP.
On February 10, 2009, the U.S. Treasury and the federal bank regulatory agencies announced in a Joint Statement a new Financial Stability Plan which would include additional capital support for banks under a Capital Assistance Program, a public-private investment fund to address existing bank
9
loan portfolios and expanded funding for the FRB's pending Term Asset-Backed Securities Loan Facility to restart lending and the securitization markets.
On February 17, 2009, the American Recovery and Reinvestment Act of 2009 ("ARRA") was signed into law by President Obama. The ARRA includes a wide variety of programs intended to stimulate the economy and provide for extensive infrastructure, energy, health, and education needs. In addition, the ARRA imposes certain new executive compensation and corporate expenditure limits on all current and future TARP recipients, including the Company, until the institution has repaid the U.S. Treasury, which is now permitted under the ARRA without penalty and without the need to raise new capital, subject to the U.S. Treasury's consultation with the recipient's appropriate regulatory agency.
The executive compensation standards are more stringent than those currently in effect under the TARP CPP or those previously proposed by the U.S. Treasury. The new standards include (but are not limited to) (i) prohibitions on bonuses, retention awards and other incentive compensation, other than restricted stock grants which do not fully vest during the TARP period up to one-third of an employee's total annual compensation, (ii) prohibitions on golden parachute payments for departure from a company, (iii) an expanded clawback of bonuses, retention awards, and incentive compensation if payment is based on materially inaccurate statements of earnings, revenues, gains or other criteria, (iv) prohibitions on compensation plans that encourage manipulation of reported earnings, (v) retroactive review of bonuses, retention awards and other compensation previously provided by TARP recipients if found by the U.S. Treasury to be inconsistent with the purposes of TARP or otherwise contrary to public interest, (vi) required establishment of a company-wide policy regarding "excessive or luxury expenditures," and (vii) inclusion in a participant's proxy statements for annual shareholder meetings of a nonbinding "Say on Pay" shareholder vote on the compensation of executives.
On February 23, 2009, the U.S. Treasury and the federal bank regulatory agencies issued a Joint Statement providing further guidance with respect to the Capital Assistance Program ("CAP") announced February 10, 2009, including: (i) that the CAP will be initiated on February 25, 2009 and will include "stress test" assessments of major banks and that should the "stress test" indicate that an additional capital buffer is warranted, institutions will have an opportunity to turn first to private sources of capital; otherwise the temporary capital buffer will be made available from the government; (ii) such additional government capital will be in the form of mandatory convertible preferred shares, which would be converted into common equity shares only as needed over time to keep banks in a well-capitalized position and can be retired under improved financial conditions before the conversion becomes mandatory; and (iii) previous capital injections under the TARP CPP will also be eligible to be exchanged for the mandatory convertible preferred shares. The conversion of preferred shares to common equity shares would enable institutions to maintain or enhance the quality of their capital by increasing their tangible common equity capital ratios; however, such conversions would necessarily dilute the interests of existing shareholders.
On February 25, 2009, the first day the CAP program was initiated, the U.S. Treasury released the actual terms of the program, stating that the purpose of the CAP is to restore confidence throughout the financial system that the nation's largest banking institutions have a sufficient capital cushion against larger than expected future losses, should they occur due to more a more severe economic environment, and to support lending to creditworthy borrowers. Under the CAP terms, eligible U.S. banking institutions with assets in excess of $100 billion on a consolidated basis are required to participate in coordinated supervisory assessments, which are forward-looking "stress test" assessments to evaluate the capital needs of the institution under a more challenging economic environment. Should this assessment indicate the need for the bank to establish an additional capital buffer to withstand more stressful conditions, these institutions may access the CAP immediately as a
10
means to establish any necessary additional buffer or they may delay the CAP funding for six months to raise the capital privately. Eligible U.S. banking institutions with assets below $100 billion may also obtain capital from the CAP. The CAP program is an additional program from the TARP CCP and is open to eligible institutions regardless of whether they participated in the TARP CCP. The deadline to apply to the CAP was May 25, 2009. Recipients of capital under the CAP will be subject to the same executive compensation requirements as if they had received TARP CCP.
The EESA also increased Federal Deposit Insurance Corporation ("FDIC") deposit insurance on most accounts from $100,000 to $250,000. This increase was originally scheduled to end in 2009; however, Congress extended the temporary increase until December 31, 2013. The increase is not covered by deposit insurance premiums paid by the banking industry. In addition, the FDIC has implemented two temporary programs under the Temporary Liquidity Guaranty Program ("TLGP") to provide deposit insurance for the full amount of most noninterest bearing transaction accounts through the end of 2009, and later extended through June 30, 2010 and to guarantee certain unsecured debt of financial institutions and their holding companies through June 2012. Financial institutions had until December 5, 2008 to opt out of these two programs. The Company and the Bank have elected to not opt out of these two programs. The FDIC charges "systemic risk special assessments" to depository institutions that participate in the TLGP.
Supervision and Regulation
General. The Company and the Bank are extensively regulated under both federal and state laws. Regulation and supervision by the federal and state banking agencies are intended primarily for the protection of depositors and the Deposit Insurance Fund ("DIF") administered by the FDIC and not for the benefit of stockholders. Set forth below is a brief description of key laws and regulations which relate to our operations. These descriptions are qualified in their entirety by reference to the applicable laws and regulations. The federal and state agencies regulating the financial services industry also frequently adopt changes to their regulations.
The Company. As a bank holding company and financial holding company, the Company is subject to regulation and examination by the FRB under the BHCA. Accordingly, the Company is subject to the FRB's regulation and its authority to:
- •
- require periodic reports and such additional information as the FRB may require.
- •
- require the Company to maintain certain levels of capital. See "Capital Requirements".
- •
- require that bank holding companies serve as a source of financial and managerial strength to subsidiary banks and commit
resources as necessary to support each subsidiary bank. A bank holding company's failure to meet its obligations to serve as a source of strength to its subsidiary banks will generally be considered
by the FRB to be an unsafe and unsound banking practice or a violation of FRB regulations or both.
- •
- terminate an activity or terminate control of or liquidate or divest certain subsidiaries, affiliates or investments if
the FRB believes the activity or the control of the subsidiary or affiliate constitutes a significant risk to the financial safety, soundness or stability of any bank subsidiary.
- •
- regulate provisions of certain bank holding company debt, including the authority to impose interest ceilings and reserve
requirements on such debt and require prior approval to purchase or redeem our securities in certain situations.
- •
- approve acquisitions and mergers with banks and consider certain competitive, management, financial and other factors in granting these approvals. Similar California and other state banking agency approvals may also be required.
11
Nonbanking and Financial Activities
Subject to certain prior notice or FRB approval requirements, bank holding companies may engage in any, or acquire shares of companies engaged in, those nonbanking activities determined by the FRB to be so closely related to banking or managing or controlling banks as to be a proper incident thereto. The Company may engage in these nonbanking activities and broader securities, insurance, merchant banking and other activities that are determined to be "financial in nature" or are incidental or complementary to activities that are financial in nature without prior FRB approval pursuant to its election to become a financial holding company. Pursuant to the Gramm-Leach-Bliley Act of 1999 ("GLBA"), in order to elect and retain financial holding company status, all depository institution subsidiaries of a bank holding company must be well capitalized, well managed, and, except in limited circumstances, be in satisfactory compliance with the Community Reinvestment Act ("CRA"). Failure to sustain compliance with these requirements or correct any non-compliance within a fixed time period could lead to divestiture of subsidiary banks or require all activities to conform to those permissible for a bank holding company.
The Company is also a bank holding company within the meaning of the California Financial Code. As such, the Company and its subsidiaries are subject to examination by, and may be required to file reports with, the Department of Financial Institutions ("DFI").
Securities Registration
The Company's securities are registered with the Securities Exchange Commission ("SEC") under the Exchange Act of 1934, as amended (the "Exchange Act"). As such, the Company is subject to the information, proxy solicitation, insider trading, corporate governance, and other requirements and restrictions of the Exchange Act.
The Sarbanes-Oxley Act
The Company is subject to the accounting oversight and corporate governance requirements of the Sarbanes-Oxley Act of 2002, including:
- •
- required executive certification of financial presentations;
- •
- increased requirements for board audit committees and their members;
- •
- enhanced disclosure of controls and procedures and internal control over financial reporting;
- •
- enhanced controls over, and reporting of, insider trading; and
- •
- increased penalties for financial crimes and forfeiture of executive bonuses in certain circumstances.
The Bank. As a California chartered bank, the Bank is subject to primary supervision, periodic examination, and regulation by the DFI and by the FRB as the Bank's primary federal regulator. As a member bank, the Bank is a stockholder of the Federal Reserve Bank of San Francisco (the "Reserve Bank").
In general, under the California Financial Code, California banks have all the powers of a California corporation, subject to the general limitation of state bank powers under the Federal Deposit Insurance Act ("FDIA") to those permissible for national banks. Specific federal and state laws and regulations which are applicable to banks regulate, among other things, the scope of their business, their investments, their reserves against deposits, the timing of the availability of deposited funds and the nature and amount of and collateral for certain loans. The regulatory structure also gives the bank regulatory agencies extensive discretion in connection with their supervisory and enforcement activities
12
and examination policies, including policies with respect to the classification of assets and the establishment of adequate loan loss reserves for regulatory purposes. If, as a result of an examination, the DFI or the FRB should determine that the financial condition, capital resources, asset quality, earnings prospects, management, liquidity, or other aspects of the Bank's operations are unsatisfactory or that the Bank or its management is violating or has violated any law or regulation, the DFI and the FRB, and separately the FDIC as insurer of the Bank's deposits, have residual authority to:
- •
- require affirmative action to correct any conditions resulting from any violation or practice;
- •
- direct an increase in capital and the maintenance of specific minimum capital ratios;
- •
- restrict the Bank's growth geographically, by products and services or by mergers and acquisitions;
- •
- enter into informal or formal enforcement orders, including memoranda of understanding, written agreements; and consent or
cease and desist orders to take corrective action and enjoin unsafe and unsound practices;
- •
- remove officers and directors and assess civil monetary penalties; and
- •
- take possession and close and liquidate the Bank.
Permissible Activities and Subsidiaries
California law permits state chartered commercial banks to engage in any activity permissible for national banks. Therefore, the Bank may form subsidiaries to engage in the many so-called "closely related to banking" or "nonbanking" activities commonly conducted by national banks in operating subsidiaries, and further, pursuant to GLBA, the Bank may conduct certain "financial" activities in a subsidiary to the same extent as may a national bank, provided the Bank is and remains "well-capitalized," "well-managed" and in satisfactory compliance with the CRA. Presently, none of the Bank's subsidiaries are financial subsidiaries.
Interstate Banking and Branching
Under the Riegle-Neal Interstate Banking and Branching Efficiency Act of 1994, bank holding companies and banks generally have the ability to acquire or merge with banks in other states and, subject to certain state restrictions, banks may also acquire or establish new branches outside their home state. Interstate branches are subject to certain laws of the states in which they are located.
Federal Home Loan Bank System
The Bank is a member of the Federal Home Loan Bank ("FHLB") of San Francisco. Among other benefits, each FHLB serves as a reserve or central bank for its members within its assigned region and makes available loans or advances to its members. Each FHLB is financed primarily from the sale of consolidated obligations of the FHLB system. As an FHLB member, the Bank is required to own a certain amount of capital stock in the FHLB. At December 31, 2009, the Bank was in compliance with the FHLB's stock ownership requirement and our investment in FHLB capital stock totaled $180.2 million. In January 2009, the FHLB announced that it will suspend dividend payments for the fourth quarter of 2008 to preserve capital given the possibility of other-than-temporary charges on certain non-agency mortgage-backed securities in the future. Additionally, the FHLB announced that it will not repurchase excess capital stock on January 31, 2009, which was the next regularly scheduled repurchase date.
13
Federal Reserve System
The Federal Reserve Board requires all depository institutions to maintain interest bearing reserves at specified levels against their transaction accounts. At December 31, 2009, the Bank was in compliance with these requirements. As a member bank, the Bank is also required to own capital stock in the Reserve Bank. At December 31, 2009, the Bank held an investment of $36.8 million in capital stock.
Foreign Operations
As a result of the UCB Acquisition, the Bank currently has four full-service branches, two in Hong Kong, one in Shanghai, and one in Shantou, China. The Bank also has representative offices in Beijing, Guangzhou, Shanghai and Shenzhen, China and Taipei, Taiwan. The Bank's overseas activities are regulated by the FRB and the DFI, and are also regulated by supervisory authorities of the host countries where the Bank has offices.
Dividends and Other Transfers of Funds
Dividends from the Bank constitute the principal source of income to the Company. The Bank is subject to various statutory and regulatory restrictions on its ability to pay dividends. Under such restrictions, the amount available for payment of dividends to the Company by the Bank totaled $85.8 million at December 31, 2009. The Bank is permitted to pay dividend to the Company as long as the banking regulatory authorities of the Bank are notified of the proposed dividend and there is non objection language from the banking regulatory authorities. In addition, the banking agencies have the authority to prohibit or limit the Bank from paying dividends, depending upon the Bank's financial condition, if such payment is deemed to constitute an unsafe or unsound practice. Furthermore, under the federal Prompt Corrective Action regulations, the FRB or FDIC may prohibit a bank holding company from paying any dividends if the holding company's bank subsidiary is classified as "undercapitalized." See "Capital Requirements."
It is FRB policy that bank holding companies should generally pay dividends on common stock only out of income available over the past year, and only if prospective earnings retention is consistent with the organization's expected future needs and financial condition. It is also FRB policy that bank holding companies should not maintain dividend levels that undermine the company's ability to be a source of strength to its banking subsidiaries. Additionally, in consideration of the current financial and economic environment, the FRB has indicated that bank holding companies should carefully review their dividend policy and has discouraged payment ratios that are at maximum allowable levels unless both asset quality and capital are very strong.
Under the terms of the TARP CPP, for so long as any preferred stock issued under the TARP CPP remains outstanding, the Company is prohibited from increasing dividends on its common stock, and from making certain repurchases of equity securities, including its common stock, without the U.S. Treasury's consent until the third anniversary of the U.S. Treasury's investment or until the U.S. Treasury has transferred all of the preferred stock it purchased under the TARP CPP to third parties. As long as the preferred stock issued to the U.S. Treasury is outstanding, as well as the Company's Series A Preferred Stock, dividend payments and repurchases or redemptions relating to certain equity securities, including the Company's common stock, are also prohibited until all accrued and unpaid dividends are paid on such preferred stock, subject to certain limited exceptions (see "Management's Discussion and Analysis of Financial Condition and Results of Operations – Liquidity and Capital Resources" in Part II, Item 7 herein).
14
Capital Requirements
Bank holding companies and banks are subject to various regulatory capital requirements administered by state and federal banking agencies. Capital adequacy guidelines and, additionally for banks, prompt corrective action regulations, involve quantitative measures of assets, liabilities, and certain off-balance-sheet items calculated under regulatory accounting practices. Capital amounts and classifications are also subject to qualitative judgments by regulators about components, risk weighting and other factors. At December 31, 2009, the Company's and the Bank's capital ratios exceed the minimum capital adequacy guideline percentage requirements of the federal banking agencies for "well capitalized" institutions. See "Management's Discussion and Analysis of Financial Condition and Results of Operations – Risk-Based Capital" and Note 25 to the consolidated financial statements for further information regarding the regulatory capital guidelines as well as the Company's and the Bank's actual capitalization as of December 31, 2009.
The federal banking agencies have adopted risk-based minimum capital adequacy guidelines for bank holding companies and banks which are intended to provide a measure of capital that reflects the degree of risk associated with a banking organization's operations for both transactions reported on the balance sheet as assets and transactions which are recorded as off-balance sheet items. The risk-based capital ratio is determined by classifying assets and certain off-balance sheet financial instruments into weighted categories, with higher levels of capital being required for those categories perceived as representing greater risk. Bank holding companies and banks engaged in significant trading activity may also be subject to the market risk capital guidelines and be required to incorporate additional market and interest rate risk components into their risk-based capital standards. Under the capital adequacy guidelines, a banking organization's total capital is divided into tiers. "Tier I capital" includes common equity and trust-preferred securities, subject to certain criteria and quantitative limits. The TARP CPP capital received by the Company from the U.S. Treasury and the capital received from the Series A preferred stock offering also qualifies as Tier I capital. "Tier II capital" includes hybrid capital instruments, other qualifying debt instruments, a limited amount of the allowance for loan and lease losses, and a limited amount of unrealized holding gains on equity securities. "Tier III capital" consists of qualifying unsecured debt. The sum of Tier II and Tier III capital may not exceed the amount of Tier I capital. The risk-based capital guidelines require a minimum ratio of qualifying total capital to risk-weighted assets of 8% and a minimum ratio of Tier I capital to risk-weighted assets of 4%. An institution is defined as well capitalized if its total capital to risk-weighted assets ratio is 10.00% or more; its core capital to risk-weighted assets ratio is 6.00% or more; and its core capital to adjusted average assets ratio is 5.00% or more.
Bank holding companies and banks are also required to comply with minimum leverage ratio requirements. The leverage ratio is the ratio of a banking organization's Tier 1 capital to its total adjusted quarterly average assets (as defined for regulatory purposes). The requirements necessitate a minimum leverage ratio of 3.0% for holding companies and banks that either have the highest supervisory rating or have implemented the appropriate federal regulatory authority's risk-adjusted measure for market risk. All other holding companies and banks are required to maintain a minimum leverage ratio of 4.0%, unless a different minimum is specified by an appropriate regulatory authority. For a depository institution to be considered "well capitalized" under the regulatory framework for prompt corrective action, its leverage ratio must be at least 5.0%.
Basel and Basel II Accords
The current risk-based capital guidelines which apply to the Company and the Bank are based upon the 1988 capital accord of the International Basel Committee on Banking Supervision, a committee of central banks and bank supervisors and regulators from the major industrialized countries
15
that develops broad policy guidelines for use by each country's supervisors in determining the supervisory policies they apply. A new international accord, referred to as Basel II, which emphasizes internal assessment of credit, market and operational risk; supervisory assessment and market discipline in determining minimum capital requirements, became mandatory for large or "core" international banks outside the U.S. in 2008 (total assets of $250 billion or more or consolidated foreign exposures of $10 billion or more); is optional for others, and if adopted, must first be complied with in a "parallel run" for two years along with the existing Basel I standards. In January 2009, the Basel Committee proposed to reconsider regulatory-capital standards, supervisory and risk-management requirements and additional disclosures to further strengthen Basel II framework in response to recent worldwide developments.
In July 2008, the U.S. federal banking agencies issued a proposed rule for banking organizations that do not use the "advanced approaches" under Basel II. While this proposed rule generally parallels the relevant approaches under Basel II, it diverges where U.S. markets have unique characteristics and risk profiles, most notably with respect to risk weighting residential mortgage exposures. A definitive final rule has not yet been issued. The U.S. banking agencies have indicated, however, that they will retain the minimum leverage requirement for all U.S. banks.
Prompt Corrective Action
The FDIA provides a framework for regulation of depository institutions and their affiliates, including parent holding companies, by their federal banking regulators. Among other things, it requires the relevant federal banking regulator to take "prompt corrective action" with respect to a depository institution if that institution does not meet certain capital adequacy standards, including requiring the prompt submission of an acceptable capital restoration plan. Supervisory actions by the appropriate federal banking regulator under the prompt corrective action rules generally depend upon an institution's classification within five capital categories as defined in the regulations. The relevant capital measures are the capital ratio, the Tier 1 capital ratio and the leverage ratio. However, the federal banking agencies have also adopted non-capital safety and soundness standards to assist examiners in identifying and addressing potential safety and soundness concerns before capital becomes impaired. These include operational and managerial standards relating to: (i) internal controls, information systems and internal audit systems, (ii) loan documentation, (iii) credit underwriting, (iv) asset quality and growth, (v) earnings, (vi) risk management, and (vii) compensation and benefits.
A depository institution's capital tier under the prompt corrective action regulations will depend upon how its capital levels compare with various relevant capital measures and the other factors established by the regulation. A bank will be: (i) "well capitalized" if the institution has a total risk-based capital ratio of 10.0% or greater, a Tier 1 risk-based capital ratio of 6.0% or greater, and a leverage ratio of 5.0% or greater, and is not subject to any order or written directive by any such regulatory authority to meet and maintain a specific capital level for any capital measure; (ii) "adequately capitalized" if the institution has a total risk-based capital ratio of 8.0% or greater, a Tier 1 risk-based capital ratio of 4.0% or greater, and a leverage ratio of 4.0% or greater and is not "well capitalized"; (iii) "undercapitalized" if the institution has a total risk-based capital ratio that is less than 8.0%, a Tier 1 risk-based capital ratio of less than 4.0% or a leverage ratio of less than 4.0%; (iv) "significantly undercapitalized" if the institution has a total risk-based capital ratio of less than 6.0%, a Tier 1 risk-based capital ratio of less than 3.0% or a leverage ratio of less than 3.0%; and (v) "critically undercapitalized" if the institution's tangible equity is equal to or less than 2.0% of average quarterly tangible assets. An institution may be downgraded to, or deemed to be in, a capital category that is lower than indicated by its capital ratios if it is determined to be in an unsafe or unsound condition or if it receives an unsatisfactory examination rating with respect to certain matters.
16
The FDIA generally prohibits a depository institution from making any capital distributions (including payment of a dividend) or paying any management fee to its parent holding company if the depository institution would thereafter be "undercapitalized." "Undercapitalized" institutions are subject to growth limitations and are required to submit a capital restoration plan. The agencies may not accept such a plan without determining, among other things, that the plan is based on realistic assumptions and is likely to succeed in restoring the depository institution's capital. In addition, for a capital restoration plan to be acceptable, the depository institution's parent holding company must guarantee that the institution will comply with such capital restoration plan. The bank holding company must also provide appropriate assurances of performance. The aggregate liability of the parent holding company is limited to the lesser of (i) an amount equal to 5.0% of the depository institution's total assets at the time it became undercapitalized and (ii) the amount which is necessary (or would have been necessary) to bring the institution into compliance with all capital standards applicable with respect to such institution as of the time it fails to comply with the plan. If a depository institution fails to submit an acceptable plan, it is treated as if it is "significantly undercapitalized." "Significantly undercapitalized" depository institutions may be subject to a number of requirements and restrictions, including orders to sell sufficient voting stock to become "adequately capitalized," requirements to reduce total assets, and cessation of receipt of deposits from correspondent banks. "Critically undercapitalized" institutions are subject to the appointment of a receiver or conservator.
The appropriate federal banking agency may, under certain circumstances, reclassify a well capitalized insured depository institution as adequately capitalized. The FDIA provides that an institution may be reclassified if the appropriate federal banking agency determines (after notice and opportunity for hearing) that the institution is in an unsafe or unsound condition or deems the institution to be engaging in an unsafe or unsound practice. The appropriate agency is also permitted to require an adequately capitalized or undercapitalized institution to comply with the supervisory provisions as if the institution were in the next lower category (but not treat a significantly undercapitalized institution as critically undercapitalized) based on supervisory information other than the capital levels of the institution.
FDIC Deposit Insurance
The FDIC is an independent federal agency that insures deposits, up to prescribed statutory limits, of federally insured banks and savings institutions and safeguards the safety and soundness of the banking and savings industries. The FDIC insures our customer deposits through the DIF up to prescribed limits for each depositor. Pursuant to the EESA, the maximum deposit insurance amount has been increased from $100,000 to $250,000. The amount of FDIC assessments paid by each DIF member institution is based on its relative risk of default as measured by regulatory capital ratios and other supervisory factors. Pursuant to the Federal Deposit Insurance Reform Act of 2005, the FDIC is authorized to set the reserve ratio for the DIF annually at between 1.15% and 1.50% of estimated insured deposits. The FDIC may increase or decrease the assessment rate schedule on a semi-annual basis. In an effort to restore capitalization levels and to ensure the DIF will adequately cover projected losses from future bank failures, the FDIC, in October 2008, proposed a rule to alter the way in which it differentiates for risk in the risk-based assessment system and to revise deposit insurance assessment rates, including base assessment rates. Effective April 1, 2009, initial base assessment rates were increased to between 12 and 45 cents for every $100 of assessable domestic deposits, with most banks paying between 12 and 14 cents.
On February 27, 2009, the FDIC approved an interim rule to institute a one-time special assessment of 20 cents per $100 in assessable domestic deposits to restore the DIF reserves depleted by recent bank failures. The interim rule additionally reserves the right of the FDIC to charge an additional up-to-10 basis point special premium at a later point if the DIF reserves continue to fall.
17
The FDIC also approved an increase in regular premium rates for the second quarter of 2009. For most banks, this will be between 12 to 16 basis points per $100 in assessable domestic deposits.
On September 29, 2009, the FDIC adopted an Amended Restoration Plan to allow the DIF to return to a reserve ratio of 1.15 percent within eight years, as mandated by statute. While the Amended Restoration Plan and higher assessment rates address the need to return the DIF reserve ratio to 1.15 percent, the FDIC must also consider its need for cash to pay for projected bank failures. On November 17, 2009, the FDIC amended its regulation requiring insured institutions to prepay their estimated quarterly risk-based assessments for the fourth quarter of 2009, and for all of 2010, 2011, and 2012. The Bank prepaid a total of $80.6 million to the FDIC in December 2009.
If the DIF's reserves exceed the designated reserve ratio, the FDIC is required to pay out all or, if the reserve ratio is less than 1.5%, a portion of the excess as a dividend to insured depository institutions based on the percentage of insured deposits held on December 31, 1996 adjusted for subsequently paid premiums.
Additionally, by participating in the TLGP, banks temporarily become subject to "systemic risk special assessments" of 10 basis points for transaction account balances in excess of $250,000 assessments up to 100 basis points of the amount of TLGP debt issued. Further, all FDIC-insured institutions are required to pay assessments to the FDIC to fund interest payments on bonds issued by the Financing Corporation ("FICO"), an agency of the Federal government established to recapitalize the predecessor to the DIF. The FICO assessment rates, which are determined quarterly, averaged 0.0106% of insured deposits in fiscal 2009. These assessments will continue until the FICO bonds mature in 2017.
The FDIC may terminate a depository institution's deposit insurance upon a finding that the institution's financial condition is unsafe or unsound or that the institution has engaged in unsafe or unsound practices that pose a risk to the DIF or that may prejudice the interest of the bank's depositors. The termination of deposit insurance for a bank would also result in the revocation of the bank's charter by the DFI.
Loans-to-One Borrower Limitations
With certain limited exceptions, the maximum amount of obligations, secured or unsecured, that any borrower (including certain related entities) may owe to a California state bank at any one time may not exceed 25% of the sum of the shareholders' equity, allowance for loan losses, capital notes and debentures of the bank. Unsecured obligations may not exceed 15% of the sum of the shareholders' equity, allowance for loan losses, capital notes and debentures of the bank. The Bank has established internal loan limits which are lower than the legal lending limits for a California bank.
Extensions of Credit to Insiders and Transactions with Affiliates
The Federal Reserve Act and FRB Regulation O place limitations and conditions on loans or extensions of credit to:
- •
- a bank or bank holding company's executive officers, directors and principal shareholders (i.e., in most cases,
those persons who own, control or have power to vote more than 10% of any class of voting securities);
- •
- any company controlled by any such executive officer, director or shareholder; or
- •
- any political or campaign committee controlled by such executive officer, director or principal shareholder.
18
Such loans and leases:
- •
- must comply with loan-to-one-borrower limits;
- •
- require prior full board approval when aggregate extensions of credit to the person exceed specified amounts;
- •
- must be made on substantially the same terms (including interest rates and collateral) and follow credit-underwriting
procedures no less stringent than those prevailing at the time for comparable transactions with non-insiders; and
- •
- must not involve more than the normal risk of repayment or present other unfavorable features.
In addition, Regulation O provides that the aggregate limit on extensions of credit to all insiders of a bank as a group cannot exceed the bank's unimpaired capital and unimpaired surplus. California has laws and the DFI has regulations which adopt and also apply Regulation O to the Bank.
The Bank also is subject to certain restrictions imposed by Federal Reserve Act Sections 23A and 23B and FRB Regulation W on any extensions of credit to, or the issuance of a guarantee or letter of credit on behalf of, any affiliates, the purchase of, or investments in, stock or other securities thereof, the taking of such securities as collateral for loans, and the purchase of assets of any affiliates. Affiliates include parent holding companies, sister banks, sponsored and advised companies, financial subsidiaries and investment companies where the Bank's affiliate serves as investment advisor. Sections 23A and 23B and Regulation W generally:
- •
- prevent any affiliates from borrowing from the Bank unless the loans are secured by marketable obligations of designated
amounts;
- •
- limit such loans and investments to or in any affiliate individually to 10.0% of the Bank's capital and surplus;
- •
- limit such loans and investments to all affiliate in the aggregate to 20.0% of the Bank's capital and surplus; and
- •
- require such loans and investments to or in any affiliate to be on terms and under conditions substantially the same or at least as favorable to the Bank as those prevailing for comparable transactions with nonaffiliated parties.
Additional restrictions on transactions with affiliates may be imposed on the Bank under the FDIA prompt corrective action provisions and the supervisory authority of the federal and state banking agencies.
Securities Activities
FRB Regulation R implements exceptions provided in GLBA for securities activities which banks may conduct without registering with the SEC as securities broker or moving such activities to a broker-dealer affiliate. Regulation R provides exceptions for networking arrangements with third-party broker-dealers and authorizes compensation for bank employees who refer and assist retail and high net worth bank customers with their securities, including sweep accounts to money market funds, and with related trust, fiduciary, custodial and safekeeping needs. The current securities activities which the Bank provides customers are conducted in conformance with these rules and regulations.
19
USA PATRIOT Act and Anti-Money Laundering Compliance
The USA PATRIOT Act of 2001 and its implementing regulations significantly expanded the anti-money laundering and financial transparency laws, including the Bank Secrecy Act. The Bank has adopted comprehensive policies and procedures to address the requirements of the USA PATRIOT Act. Material deficiencies in anti-money laundering compliance can result in public enforcement actions by the banking agencies, including the imposition of civil money penalties and supervisory restrictions on growth and expansion. Such enforcement actions could also have serious reputation consequences for the Company and the Bank.
Consumer Laws
The Bank and the Company are subject to many federal and state consumer protection laws and regulations prohibiting unfair or fraudulent business practices, untrue or misleading advertising and unfair competition, including:
- •
- The Home Ownership and Equity Protection Act of 1994, or HOEPA, which requires extra disclosures and consumer protections
to borrowers from certain lending practices, such as practices deemed to be "predatory lending."
- •
- Privacy policies required by federal and state banking laws and regulations which limit the ability of banks and other
financial institutions to disclose nonpublic information about consumers to nonaffiliated third parties.
- •
- The Fair Credit Reporting Act, as amended by the Fair and Accurate Credit Transactions Act, or the FACT Act, which
requires financial firms to help deter identity theft, including developing appropriate fraud response programs, and gives consumers more control of their credit data.
- •
- The Equal Credit Opportunity Act, or ECOA, which generally prohibits discrimination in any credit transaction, whether for
consumer or business purposes, on the basis of race, color, religion, national origin, sex, marital status, age (except in limited circumstances), receipt of income from public assistance programs, or
good faith exercise of any rights under the Consumer Credit Protection Act.
- •
- The Truth in Lending Act, or TILA, which requires that credit terms be disclosed in a meaningful and consistent way so
that consumers may compare credit terms more readily and knowledgeably.
- •
- The Fair Housing Act, which regulates many lending practices, including making it unlawful for any lender to discriminate
in its housing-related lending activities against any person because of race, color, religion, national origin, sex, handicap or familial status.
- •
- The CRA, which requires insured depository institutions, while operating safely and soundly, to help meet the credit needs
of their communities; directs the federal regulatory agencies in examining insured depository institutions to assess a bank's record of helping meet the credit needs of its entire community, including
low- and moderate-income neighborhoods, consistent with safe and sound banking practices; and further requires the agencies to take a financial institution's record of meeting its
community credit needs into account when evaluating applications for, among other things, domestic branches, mergers or acquisitions, or holding company formations. In its last examination for CRA
compliance, as of July 7, 2008, the Bank was rated "satisfactory."
- •
- The Home Mortgage Disclosure Act, or HMDA, which includes a "fair lending" aspect that requires the collection and disclosure of data about applicant and borrower characteristics as a way of identifying possible discriminatory lending patterns and enforcing anti-discrimination statutes.
20
- •
- The Real Estate Settlement Procedures Act, or RESPA, which requires lenders to provide borrowers with disclosures
regarding the nature and cost of real estate settlements and prohibits certain abusive practices, such as kickbacks.
- •
- The National Flood Insurance Act, which requires homes in flood-prone areas with mortgages from a federally regulated lender to have flood insurance.
Regulation of Subsidiaries
Foreign-based subsidiaries, including United Commercial Bank China (Limited), are subject to applicable foreign laws and regulations. Nonbank subsidiaries are subject to additional or separate regulation and supervision by other state, federal and self-regulatory bodies. East West Insurance Services, Inc. is subject to the licensing and supervisory authority of the California Commissioner of Insurance.
Employees
East West does not have any employees other than officers who are also officers of the Bank. Such employees are not separately compensated for their employment with the Company. As of December 31, 2009, the Bank had a total of 2,522 full-time employees and 145 part-time employees and the Agency had a total of 12 full-time employees. None of the employees are represented by a union or collective bargaining group. The managements of the Bank and Agency believe that their employee relations are satisfactory.
Recently Issued Accounting Standards
For a discussion of recent accounting pronouncements and their expected impact on the Company's consolidated financial statements, refer to Note 1 – "Recent Accounting Pronouncements" in the accompanying notes to the consolidated financial statements included elsewhere in this report.
Available Information
We file reports with the SEC, including our proxy statements, annual reports on Form 10-K, quarterly reports on Form 10-Q and current reports on Form 8-K. These reports and other information on file can be inspected and copied at the SEC's Public Reference Room at 100 F Street, N.E., Washington, DC 20549, on official business days during the hours of 10 a.m. to 3 p.m. The public may obtain information on the operation of the Public Reference Room by calling the SEC at 1-800-SEC-0330. The Commission maintains a web site that contains the reports, proxy and information statements and other information we file with them. The address of the site is http://www.sec.gov.
The Company also maintains an internet website at www.eastwestbank.com. The Company makes its website content available for information purposes only. It should not be relied upon for investment purposes.
We make available free of charge through our website our annual reports on Form 10-K, quarterly reports on Form 10-Q, current reports on Form 8-K, and proxy statements for our annual shareholders meetings, as well as any amendments to those reports, as soon as reasonably practicable after the Company files such reports with the SEC. The Company's SEC reports can be accessed through the investor information page of its website. None of the information contained in or hyperlinked from our website is incorporated into this Form 10-K. The SEC also maintains a website at www.sec.gov that contains reports, proxy statements and other information regarding SEC registrants, including the Company.
21
Executive Officers of the Registrant
The following table sets forth the executive officers of the Company, their positions, and their ages. Each officer is appointed by the Board of Directors of the Company or the Bank and serves at their pleasure.
Name
|
Age (1) | Position with Company or Bank | |||
|---|---|---|---|---|---|
| Dominic Ng | 51 | Chairman and Chief Executive Officer of the Company and the Bank | |||
Julia S. Gouw |
50 |
Vice-Chairman, President and Chief Operating Officer of the Company and the Bank |
|||
Ming Lin Chen |
49 |
Executive Vice President and Director of Loan Operations |
|||
Wellington Chen |
50 |
Executive Vice President and Director of Corporate Banking Division of the Bank |
|||
Donald S. Chow |
59 |
Executive Vice President |
|||
William H. Fong |
62 |
Executive Vice President and Head of Northern California Commercial Lending Division of the Bank |
|||
Karen Fukumura |
45 |
Executive Vice President and Head of Retail Banking & Technology Division of the Bank |
|||
Agatha Fung |
50 |
Executive Vice President and Head of the International Banking Division of the Bank |
|||
Douglas P. Krause |
53 |
Executive Vice President, Chief Risk Officer, General Counsel, and Secretary of the Company and the Bank |
|||
William J. Lewis |
66 |
Executive Vice President and Chief Credit Officer of the Bank |
|||
Irene H. Oh |
32 |
Executive Vice President and Chief Financial Officer of the Company and the Bank |
|||
Lawrence B. Schiff |
57 |
Executive Vice President and Director of Credit Risk Management |
|||
Andy Yen |
52 |
Executive Vice President and Director of the Business Banking Division of the Bank |
|||
- (1)
- As of February 26, 2010
Dominic Ng serves as Chairman and Chief Executive Officer of East West Bancorp, Inc. and East West Bank. Prior to taking the helm of East West in 1992, Mr. Ng was President and Chief Executive Officer of Seyen Investment, Inc. and before that spent over a decade as a CPA with Deloitte & Touche LLP. Mr. Ng serves on the Boards of Directors of the Federal Reserve Bank of San Francisco, Los Angeles Branch and Mattel, Inc.
22
Julia S. Gouw serves as Vice-Chairman, President and Chief Operating Officer of the Company and the Bank. Prior to that, Ms. Gouw served as Executive Vice President and Chief Financial Officer of the Company and the Bank from 1994 until April 2008. In April 2008, she became the Vice Chairman of the Board of Directors of the Company and the Bank and the Chief Risk Officer of the Bank. Ms. Gouw retired from her position as Chief Risk Officer of the Bank at the end of 2008 and rejoined the Bank in December 2009. Prior to joining East West in 1989, Ms. Gouw spent over five years as a CPA with KPMG LLP. She was ranked among the top ten bank CFOs in the nation by U.S. Banker in January 2006 and was listed four times among the "25 Most Powerful Women in Banking" by U.S. Banker magazine. She was also selected on the "Best CFOs in America of 2007 and 2006" as determined by Institutional Investor magazine.
Ming Lin Chen serves as Executive Vice President and Director of Loan Operations. Ms. Chen joined East West Bank in 2004 as Senior Vice President and Senior Relationship Manager and was promoted to her current position in 2009. Prior to joining East West Bank, Ms. Chen was Senior Vice President and Corporate Secretary of General Bank and General Bancorp. She was responsible for several management positions including international banking, commercial and SBA lending, marketing and branch operations during her 19 years with General Bank. Ms. Chen is a board member of the Taiwanese American Chamber of Commerce, Greater Los Angeles.
Wellington Chen serves as Executive Vice President and Director of the Corporate Banking Division. Prior to joining East West in 2003, Mr. Chen was Senior Executive Vice President of Far East National Bank (Far East), heading up their Commercial Banking and Consumer Banking groups. He also served on the Board of Directors of Far East. Mr. Chen's career with Far East started in 1986 and included a variety of branch and credit management positions. Prior to that, Mr. Chen spent three years with Security Pacific National Bank where he began his banking career as an asset-based lending auditor. Mr. Chen serves on the Board of Directors of the Pasadena Tournament of Roses Foundation.
Donald S. Chow serves as Executive Vice President. Mr. Chow has over 30 years of experience in commercial lending. Before joining East West in 1993, Mr. Chow was First Vice President and Senior Credit Officer for Mitsui Manufacturers Bank from 1987 to 1993, and prior to that spent over 14 years with Security Pacific National Bank where he held a number of management positions in the commercial lending area.
William H. Fong serves as Executive Vice President and Head of the Bank's Northern California Commercial Lending division. Mr. Fong joined East West in April 2006 from United Commercial Bank where he was the Head of Commercial Banking. Prior to this, Mr. Fong spent 23 years with the BNP Paribas/Bank of the West group. His responsibilities as an Executive Vice President with Bank of the West included the oversight of the Pacific Rim Division's Corporate Banking department as well as the strategic planning and development of the division's branch network in Portland, California, Nevada, and representative offices in Shanghai. Mr. Fong is a member of the California Economic Development Commission Goods Movement International Trade Advisory Committee.
Karen Fukumura serves as Executive Vice President and Head of the Bank's Retail Banking & Technology Division. Prior to joining East West in April 2008, Ms. Fukumura was a Senior Vice President with Bank of America and held several transformational leadership roles within the Consumer Bank and Service & Fulfillment Operations. Additionally, Ms. Fukumura has seven years of management and technology consulting experience in Asia, and previously held sales and manufacturing operations roles within Mobil Oil and Xerox Corporation, respectively.
Agatha Fung serves as Executive Vice President and Head of the International Banking division. In October 2005, Ms. Fung joined East West from CITIC International Financial Holdings in Hong
23
Kong where she held positions as Head of Business Banking of CITIC Ka Wah Bank and Chief Executive Officer and Executive Director of HKCB Finance. Ms. Fung has over 20 years of banking experience and has also held senior management positions at Standard Chartered Bank and Citibank in both Hong Kong and Tokyo. Ms. Fung is a member of the Advisory Board for Asia Society Southern California.
Douglas P. Krause serves as Executive Vice President, Chief Risk Officer, General Counsel and Corporate Secretary of East West Bancorp, Inc. and East West Bank. Prior to joining East West in 1996, Mr. Krause was Corporate Senior Vice President and General Counsel of Metrobank from 1991 to 1996. Mr. Krause started his career with the law firms Dewey & LeBoeuf and Jones, Day, Reavis and Pogue where he specialized in financial services. Mr. Krause also serves on the governing boards of the Port of Los Angeles and of the Alameda Corridor Transportation Authority; he is the chairman of the Audit Committees of both Commissions.
Irene H. Oh serves as Executive Vice President and Chief Financial Officer of East West Bancorp, Inc. and East West Bank. Ms. Oh joined East West in 2004. Prior to being promoted to Chief Financial Officer, Ms. Oh served as Senior Vice President and Director of Corporate Finance. A Certified Public Accountant, she began her financial career in 1999 with Deloitte & Touche in Los Angeles and spent two years with Goldman Sachs.
William J. Lewis serves as Executive Vice President and Chief Credit Officer. Mr. Lewis joined the Bank in 2002 with over 35 years of banking experience, during which time he has held a number of senior management positions. He was Executive Vice President and Chief Credit Officer of PriVest Bank from 1998 to 2002 and held the same positions with Eldorado Bank from 1994 to 1998. Prior to that, Mr. Lewis was with Sanwa Bank for over 12 years where he administered a 35 branch region. Before that, Mr. Lewis spent 13 years with First Interstate Bank where he held a variety of branch and credit management positions.
Lawrence B. Schiff serves as Executive Vice President and Director of Credit Risk Management. Mr. Schiff joined East West Bank in early 2010, after serving for several years as Director of National Credit Risk Management at KPMG and as a Group Vice President in SunTrust Bank's Credit Risk Management Division. Mr. Schiff spent the majority of his career as a commercial bank examiner with the Federal Reserve System, both in Washington, DC and in New York. Earlier in his career, Mr. Schiff was a Senior Vice President and Chief Financial Officer of a community bank in Honolulu. Mr. Schiff has lectured in Finance and International Finance at several universities, and he is presently a board member of the City of Hope Hospital's LA Real Estate Council.
Andy Yen serves as Executive Vice President and Director of Business Banking Division. Mr. Yen joined the Bank in September 2005 through its merger with United National Bank. Before being promoted to President of UNB in 2001, Mr. Yen was the Executive Vice President from 1998 to 2000 and Senior Vice President from 1992 to 1997, overseeing both the operations and lending functions of UNB. Mr. Yen also served as a member of the Board of Directors of UNB from 1992 to 2005. Mr. Yen has over 20 years experience in commercial and real estate lending and also held positions at Tokai Bank of California and Trans National Bank before he joined UNB.
24
Risk Factors That May Affect Future Results
Together with the other information on the risks we face and our management of risk contained in this Annual Report or in our other SEC filings, the following presents significant risks which may affect us. Events or circumstances arising from one or more of these risks could adversely affect our business, financial condition, operating results, cash flows and prospects, and the value and price of our common stock could decline. The risks identified below are not intended to be a comprehensive list of all risks we face and additional risks that we may currently view as not material may also impair our business operations and results.
Difficult economic and market conditions have adversely affected our industry. Dramatic declines in the housing market, with decreasing home prices and increasing delinquencies and foreclosures, have negatively impacted the credit performance of mortgage and construction loans and resulted in significant writedowns of assets by many financial institutions. General downward economic trends, reduced availability of commercial credit and increasing unemployment have negatively impacted the credit performance of commercial and consumer credit, resulting in additional writedowns. Concerns over the stability of the financial markets and the economy have resulted in decreased lending by financial institutions to their customers and to each other. This market turmoil and tightening of credit has led to increased commercial and consumer deficiencies, lack of customer confidence, increased market volatility and widespread reduction in general business activity. Financial institutions have experienced decreased access to deposits and borrowings. The resulting economic pressure on consumers and businesses and the lack of confidence in the financial markets may adversely affect our business, financial condition, results of operations and stock price. A worsening of these conditions would likely exacerbate the adverse effects of these difficult market conditions on us and others in the financial institutions industry. In particular, we may face the following risks in connection with these events:
- •
- We potentially face increased regulation of our industry including heightened legal standards and regulatory requirements
or expectations imposed in connection with the EESA and the ARRA. Compliance with such regulation may increase our costs and limit our ability to pursue business opportunities.
- •
- The process we use to estimate losses inherent in our credit exposure requires difficult, subjective and complex
judgments, including forecasts of economic conditions and how these economic conditions might impair the ability of our borrowers to repay their loans. The level of uncertainty concerning economic
conditions may adversely affect the accuracy of our estimates which may, in turn, impact the reliability of the process.
- •
- We may be required to pay significantly higher FDIC premiums because market developments have significantly depleted the
insurance fund of the FDIC and reduced the ratio of reserves to insured deposits.
- •
- The Company's commercial and residential borrowers may be unable to make timely repayments of their loans, or the decrease
in value of real estate collateral securing the payment of such loans could result in significant credit losses, increased delinquencies, foreclosures and customer bankruptcies, any of which could
have a material adverse effect on the Company's operating results.
- •
- Further disruptions in the capital markets or other events, including actions by rating agencies and deteriorating
investor expectations, may result in an inability to borrow on favorable terms or at all from other financial institutions.
- •
- Increased competition among financial services companies due to the recent consolidation of certain competing financial institutions and the conversion of certain investment banks to bank
25
holding companies may adversely affect the Company's ability to market its products and services.
Recent legislative and regulatory initiatives to address difficult market and economic conditions may not stabilize the U.S. banking system. If current levels of market disruption and volatility continue or worsen, there can be no assurance that we will not experience an adverse effect, which may be material, on our ability to access capital and on our business, financial condition, results of operations, and cash flows. The EESA, which established TARP, was signed into law on October 3, 2008. As part of TARP, the U.S. Treasury established the TARP CPP to provide up to $700 billion of funding to eligible financial institutions through the purchase of capital stock and other financial instruments for the purpose of stabilizing and providing liquidity to the U.S. financial markets. Then, on February 17, 2009, the ARRA was signed into law as a sweeping economic recovery package intended to stimulate the economy and provide for broad infrastructure, energy, health, and education needs. There can be no assurance as to the actual impact that EESA or its programs, including the TARP CPP, and ARRA or its programs, will have on the national economy or financial markets. The failure of these significant legislative measures to help stabilize the financial markets and a continuation or worsening of current financial market conditions could materially and adversely affect the Company's business, financial condition, results of operations, access to credit or the trading price of its common shares.
There have been numerous actions undertaken in connection with or following the EESA and ARRA by the FRB, Congress, U.S. Treasury, the SEC and the federal bank regulatory agencies in efforts to address the current liquidity and credit crisis in the financial industry that followed the sub-prime mortgage market meltdown which began in late 2007. These measures include homeowner relief that encourages loan restructuring and modification; the temporary increase in FDIC deposit insurance from $100,000 to $250,000, the establishment of significant liquidity and credit facilities for financial institutions and investment banks; the lowering of the federal funds rate; emergency action against short selling practices; a temporary guaranty program for money market funds; the establishment of a commercial paper funding facility to provide back-stop liquidity to commercial paper issuers; and coordinated international efforts to address illiquidity and other weaknesses in the banking sector. The purpose of these legislative and regulatory actions is to help stabilize the U.S. banking system. The EESA, ARRA and the other regulatory initiatives described above may not have their desired effects. If the volatility in the markets continues and economic conditions fail to improve or worsen, the Company's business, financial condition and results of operations could be materially and adversely affected.
U.S. and international financial markets and economic conditions, particularly in California, could adversely affect our liquidity, results of operations and financial condition. As described in "Management's Discussion and Analysis of Financial Condition and Results of Operations," the turmoil and downward economic trends the past couple of years have been particularly acute in the financial sector. Although the Company and the Bank remain well capitalized and have not suffered any significant liquidity issues as a result of these events, the cost and availability of funds may be adversely affected by illiquid credit markets and the demand for our products and services may decline as our borrowers and customers realize the impact of an economic slowdown and recession. In view of the concentration of our operations and the collateral securing our loan portfolio primarily in Northern and Southern California, we may be particularly susceptible to the adverse economic conditions in the state of California, where our business is concentrated. In addition, the severity and duration of these adverse conditions is unknown and may exacerbate our exposure to credit risk and adversely affect the ability of borrowers to perform under the terms of their lending arrangements with us. In addition, the severity and duration of these adverse conditions is unknown and may exacerbate the Company's exposure to credit risk and adversely affect the ability of borrowers to perform under the terms of their lending
26
arrangements with us. Accordingly, continued turbulence in the U.S. and international markets and economy may adversely affect our liquidity, financial condition, results of operations and profitability.
We may be required to make additional provisions for loan losses and charge off additional loans in the future, which could adversely affect our results of operations. During the year ended December 31, 2009, we recorded a $528.7 million provision for loan losses and charged off $485.3 million, gross of $9.9 million in recoveries. There has been a significant slowdown in the housing market in portions of Los Angeles, Riverside, San Bernardino and Orange counties where a majority of our loan customers are based. This slowdown reflects declining prices and excess inventories of homes to be sold, which has contributed to financial strain on home builders and suppliers. As of December 31, 2009, we had $4.43 billion and $3.90 billion in non-covered and covered, respectively, commercial real estate and construction loans. Continuing deterioration in the real estate market generally and in the residential building segment in particular could result in additional loan charge offs and provisions for loan losses in the future, which could have a material adverse effect on our financial condition, net income and capital.
Our allowance for loan and lease losses may not be adequate to cover actual losses. A significant source of risk arises from the possibility that we could sustain losses because borrowers, guarantors, and related parties may fail to perform in accordance with the terms of their loans and leases. The underwriting and credit monitoring policies and procedures that we have adopted to address this risk may not prevent unexpected losses that could have a material adverse effect on our business, financial condition, results of operations and cash flows. We maintain an allowance for loan and lease losses to provide for loan and lease defaults and non-performance. The allowance is also appropriately increased for new loan growth. While we believe that our allowance for loan and lease losses is adequate to cover current losses, we cannot assure you that we will not increase the allowance for loan and lease losses further.
Liquidity risk could impair our ability to fund operations and jeopardize our financial condition. Liquidity is essential to our business. An inability to raise funds through deposits, borrowings, the sale of loans and other sources could have a material adverse effect on our liquidity. Our access to funding sources in amounts adequate to finance our activities could be impaired by factors that affect us specifically or the financial services industry in general. Factors that could detrimentally impact our access to liquidity sources include a decrease in the level of our business activity due to a market downturn or adverse regulatory action against us. Our ability to acquire deposits or borrow could also be impaired by factors that are not specific to us, such as a severe disruption of the financial markets or negative views and expectations about the prospects for the financial services industry as a whole as the turmoil faced by banking organizations in the domestic and worldwide credit markets.
The actions and commercial soundness of other financial institutions could affect the Company's ability to engage in routine funding transactions. Financial service institutions are interrelated as a result of trading, clearing, counterparty or other relationships. The Company has exposure to different industries and counterparties, and executes transactions with various counterparties in the financial industry, including brokers and dealers, commercial banks, investment banks, mutual and hedge funds, and other institutional clients. Recent defaults by financial services institutions, and even rumors or questions about one or more financial services institutions or the financial services industry in general, have led to market wide liquidity problems and could lead to losses or defaults by the Company or by other institutions. Many of these transactions expose the Company to credit risk in the event of default of its counterparty or client. In addition, the Company's credit risk may increase when the collateral held by it cannot be realized upon or is liquidated at prices not sufficient to recover the full amount of the loan or derivative exposure due to the Company. Any such losses could materially and adversely affect the Company's results of operations.
27
Our loan portfolio is predominantly secured by real estate and thus we have a higher degree of risk from a downturn in our real estate markets. A downturn in our real estate markets could hurt our business because many of our loans are secured by real estate. Real estate values and real estate markets are generally affected by changes in national, regional or local economic conditions, fluctuations in interest rates and the availability of loans to potential purchasers, changes in tax laws and other governmental statutes, regulations and policies and acts of nature, such as earthquakes and national disasters particular to California. Substantially all of our real estate collateral is located in California. If real estate values continue to further decline, the value of real estate collateral securing our loans could be significantly reduced. Our ability to recover on defaulted loans by foreclosing and selling the real estate collateral would then be diminished and we would be more likely to suffer losses on defaulted loans. Furthermore, a substantial portion of our loan portfolio is comprised of commercial real estate. Commercial real estate and multi-family loans typically involve large balances to single borrowers or groups of related borrowers. Since payments on these loans are often dependent on the successful operation or management of the properties, as well as the business and financial condition of the borrower, repayment of such loans may be subject to adverse conditions in the real estate market, adverse economic conditions or changes in applicable government regulations. Borrowers' inability to repay such loans may have an adverse affect on our business.
We may experience additional goodwill impairment. In light of the overall instability of the economy, the continued volatility in the financial markets, the downward pressure on bank stock prices, and expectations of financial performance for the banking industry, including the Company, our estimates of goodwill fair value may be subject to change or adjustment and we may determine that additional impairment charges are necessary. Estimates of fair value are determined based on a complex model using cash flows and company comparisons. If management's estimates of future cash flows are inaccurate, the fair value determined could be inaccurate and impairment may not be recognized in a timely manner. No assurance can be given that goodwill will not be written down further in future periods.
Our business is subject to interest rate risk and variations in interest rates may negatively affect our financial performance. A substantial portion of our income is derived from the differential or "spread" between the interest earned on loans, investment securities and other interest-earning assets, and the interest paid on deposits, borrowings and other interest-bearing liabilities. Because of the differences in the maturities and repricing characteristics of our interest-earning assets and interest-bearing liabilities, changes in interest rates do not produce equivalent changes in interest income earned on interest-earning assets and interest paid on interest-bearing liabilities. Significant fluctuations in market interest rates could materially and adversely affect not only our net interest spread, but also our asset quality and loan origination volume.
We are subject to extensive government regulation that could limit or restrict our activities, which, in turn, may hamper our ability to increase our assets and earnings. Our operations are subject to extensive regulation by federal, state and local governmental authorities and are subject to various laws and judicial and administrative decisions imposing requirements and restrictions on part or all of our operations. Because our business is highly regulated, the laws, rules, regulations and supervisory guidance and policies applicable to us are subject to regular modification and change. The Company is now also subject to supervision, regulation and investigation by the U.S. Treasury and the Office of the Special Inspector General for the TARP under the EESA by virtue of its participation in the TARP CPP. From time to time, various laws, rules and regulations are proposed, which, if adopted, could impact our operations by making compliance much more difficult or expensive, restricting our ability to originate or sell loans or further restricting the amount of interest or other charges or fees earned on loans or other products.
28
The short term and long term impact of the new Basel II capital standards and the forthcoming new capital rules to be proposed for non-Basel II U.S. banks is uncertain. As a result of the deterioration during the past few years in the global credit markets and the potential impact of increased liquidity risk and interest rate risk, it is unclear what the short term impact of the implementation of Basel II may be or what impact a pending alternative standardized approach to Basel II option for non-Basel II U.S. banks may have on the cost and availability of different types of credit and the potential compliance costs of implementing the new capital standards.
Failure to manage our growth may adversely affect our performance. Our financial performance and profitability depend on our ability to manage our recent and possible future growth. Future acquisitions and our continued growth may present operating, integration and other issues that could have a material adverse effect on our business, financial condition, results of operations and cash flows.
We face strong competition from financial services companies and other companies that offer banking services. We conduct most of our operations in California. The banking and financial services businesses in California are highly competitive and increased competition in our primary market area may adversely impact the level of our loans and deposits. Ultimately, we may not be able to compete successfully against current and future competitors. These competitors include national banks, regional banks and other community banks. We also face competition from many other types of financial institutions, including savings and loan associations, finance companies, brokerage firms, insurance companies, credit unions, mortgage banks and other financial intermediaries. In particular, our competitors include major financial companies whose greater resources may afford them a marketplace advantage by enabling them to maintain numerous locations and mount extensive promotional and advertising campaigns. Areas of competition include interest rates for loans and deposits, efforts to obtain loan and deposit customers and a range in quality of products and services provided, including new technology-driven products and services. If we are unable to attract and retain banking customers, we may be unable to continue our loan growth and level of deposits.
If we cannot attract deposits, our growth may be inhibited. Our ability to increase our deposit base depends in large part on our ability to attract additional deposits at favorable rates. We seek additional deposits by offering deposit products that are competitive with those offered by other financial institutions in our markets.
We rely on communications, information, operating and financial control systems technology from third-party service providers, and we may suffer an interruption in those systems. We rely heavily on third-party service providers for much of our communications, information, operating and financial control systems technology, including our internet banking services and data processing systems. Any failure or interruption of these services or systems or breaches in security of these systems could result in failures or interruptions in our customer relationship management, general ledger, deposit, servicing and/or loan origination systems. The occurrence of any failures or interruptions may require us to identify alternative sources of such services, and we cannot assure you that we could negotiate terms that are as favorable to us, or could obtain services with similar functionality as found in our existing systems without the need to expend substantial resources, if at all.
We are dependent on key personnel and the loss of one or more of those key personnel may materially and adversely affect our prospects. Competition for qualified employees and personnel in the banking industry is intense and there are a limited number of qualified persons with knowledge of, and experience in, the California community banking industry. The process of recruiting personnel with the combination of skills and attributes required to carry out our strategies is often lengthy. Our success depends to a significant degree upon our ability to attract and retain qualified management, loan origination, finance, administrative, marketing and technical personnel and upon the continued
29
contributions of our management and personnel. In particular, our success has been and continues to be highly dependent upon the abilities of key executives, including our President, and certain other employees.
Managing reputational risk is important to attracting and maintaining customers, investors and employees. Threats to the Company's reputation can come from many sources, including unethical practices, employee misconduct, failure to deliver minimum standards of service or quality, compliance deficiencies, and questionable or fraudulent activities of our customers. We have policies and procedures in place to protect our reputation and promote ethical conduct, but these policies and procedures may not be fully effective. Negative publicity regarding our business, employees, or customers, with or without merit, may result in the loss of customers, investors and employees, costly litigation, a decline in revenues and increased governmental regulation.
State laws may restrict our ability to pay dividends. Our ability for the Bank to pay dividends to the Company is limited by California law and the Company's ability to pay dividends on its outstanding stock is limited by Delaware law. See "Management's Discussion and Analysis of Financial Condition and Results of Operations – Liquidity and Capital Resources."
The terms of our outstanding preferred stock limit our ability to pay dividends on and repurchase our common stock, and there can be no assurance of any future dividends on our common stock. The Stock Purchase Agreement between the Company and the U.S. Treasury pursuant to which we sold $306.5 million of our Series B Preferred Stock (the "Series B Preferred Stock") and issued a warrant to purchase up to 3,035,109 shares of our common stock (the "TARP Warrant") provides that prior to the earlier of (i) December 5, 2011 and (ii) the date on which all of the shares of the Series B Preferred Stock have been redeemed by us or transferred by the U.S. Treasury to third parties, we may not, without the consent of the U.S. Treasury, (a) increase the cash dividend on our common stock above $0.10 per share or (b) subject to limited exceptions, redeem, repurchase or otherwise acquire shares of our common stock or preferred stock other than the Series A Preferred Stock and Series B Preferred Stock. The terms of our outstanding Series A Preferred Stock have similar limitations on our ability to redeem or repurchase our common stock. In addition, we are unable to pay any dividends on our common stock unless we are current in our dividend payments on the TARP Preferred Stock and Series A Preferred Stock. These restrictions, together with the potentially dilutive impact of the TARP Warrant and common stock issuable upon conversion of the Series A Preferred Stock, described below, could have a negative effect on the value of our common stock. Moreover, holders of our common stock are entitled to receive dividends only when, as and if declared by our Board of Directors. Although we have historically paid cash dividends on our common stock, we are not required to do so. Commencing with second quarter 2009 dividends, our Board of Directors reduced our common stock dividend to $0.01 per share from the first quarter 2009 dividends of $0.02 per share and relative to our previous quarterly dividend rate of $0.10 per share. See "Management's Discussion and Analysis of Financial Condition and Results of Operations – Liquidity and Capital Resources" herein. The terms of the Stock Purchase Agreement allow the U.S. Treasury to impose additional restrictions, including those on dividends and including unilateral amendments required to comply with changes in applicable federal law. During the fourth quarter of 2009, the Company received a 50% reduction in the TARP Warrant. As of December 31, 2009, the new share count of the TARP Warrant is 1,517,555. This adjustment to the TARP Warrant was due to the fact that within one year of issuance, the Company raised new capital in excess of the Series B preferred stock.
Our outstanding preferred stock impacts net income available to our common stockholders and earnings per common share, and the TARP Warrant as well as other potential issuances of equity securities may be dilutive to holders of our common stock. The dividends declared and the accretion on discount on our outstanding preferred stock will reduce the net income available to common stockholders and
30
our earnings per common share. Our outstanding preferred stock will also receive preferential treatment in the event of liquidation, dissolution or winding up of the Company. Additionally, the ownership interest of the existing holders of our common stock will be diluted to the extent the TARP Warrant is exercised. The shares of common stock underlying the TARP Warrant represent approximately 1% of the shares of our common stock outstanding as of January 31, 2010 (including the shares issuable upon exercise of the TARP Warrant in total shares outstanding). Although the U.S. Treasury has agreed not to vote any of the shares of common stock it receives upon exercise of the TARP Warrant, a transferee of any portion of the TARP Warrant or of any shares of common stock acquired upon exercise of the TARP Warrant is not bound by this restriction. In addition, to the extent our Series A Preferred Stock and Series C Preferred Stock are converted, or options to purchase common stock under our employee and director stock option plans are exercised, holders of our common stock will incur additional dilution. Further, if we sell additional equity or convertible debt securities, such sales could result in increased dilution to our shareholders. If our stockholders do not approve the conversion of the Series C Preferred Stock at the special meeting of stockholders to be held on March 25, 2010, the Series C Preferred Stock will remain outstanding and we will be required to pay a cash dividend of approximately of $17.8 million and dividends in kind of approximately $8.1 million on May 1, 2010 and a cash dividend of approximately $18.9 million on November 1, 2010 and dividends in kind of approximately $8.6 million (if stockholder approval is not subsequently obtained by those dates). Payment of such dividends would reduce the net income available to our common stockholders and would reduce our earning per common share.
Because of our participation in the Troubled Asset Relief Program, we are subject to several restrictions including restrictions on compensation paid to our executives. Pursuant to the terms of the Stock Purchase Agreement, we adopted certain standards for executive compensation and corporate governance for the period during which the U.S. Treasury holds the equity issued pursuant to the Purchase Agreement, including the common stock which may be issued pursuant to the TARP Warrant. These standards generally apply to our Chief Executive Officer, Chief Financial Officer and the three next most highly compensated senior executive officers. The standards include (1) ensuring that incentive compensation for senior executives does not encourage unnecessary and excessive risks that threaten the value of the financial institution; (2) required clawback of any bonus or incentive compensation paid to a senior executive based on statements of earnings, gains or other criteria that are later proven to be materially inaccurate; (3) prohibition on making golden parachute payments to senior executives; and (4) agreement not to deduct for tax purposes executive compensation in excess of $500,000 for each senior executive. In particular, the change to the deductibility limit on executive compensation will likely increase the overall cost of our compensation programs in future periods. Since the TARP Warrant has a ten year term, we could potentially be subject to the executive compensation and corporate governance restrictions for a ten year time period.
The adoption of the ARRA on February 17, 2009 imposed certain new executive compensation and corporate expenditure limits on all current and future TARP recipients, including the Company, until the institution has repaid the U.S. Treasury, which is now permitted under the ARRA without penalty and without the need to raise new capital, subject to the U.S. Treasury's consultation with the recipient's appropriate regulatory agency. The executive compensation standards are more stringent than those currently in effect under the TARP CPP or those previously proposed by the U.S. Treasury. The new standards include (but are not limited to) (i) prohibitions on bonuses, retention awards and other incentive compensation, other than restricted stock grants which do not fully vest during the TARP period up to one-third of an employee's total annual compensation, (ii) prohibitions on golden parachute payments for departure from a company, (iii) an expanded clawback of bonuses, retention awards, and incentive compensation if payment is based on materially inaccurate statements of earnings, revenues, gains or other criteria, (iv) prohibitions on compensation plans that encourage manipulation of reported earnings, (v) retroactive review of bonuses, retention awards and other
31
compensation previously provided by TARP recipients if found by the Treasury to be inconsistent with the purposes of TARP or otherwise contrary to public interest, (vi) required establishment of a company-wide policy regarding "excessive or luxury expenditures," and (vii) inclusion in a participant's proxy statements for annual shareholder meetings of a nonbinding "Say on Pay" shareholder vote on the compensation of executives.
The price of our common stock may be volatile or may decline. The trading price of our common stock may fluctuate widely as a result of a number of factors, many of which are outside our control. In addition, the stock market is subject to fluctuations in the share prices and trading volumes that affect the market prices of the shares of many companies. These broad market fluctuations could adversely affect the market price of our common stock. Among the factors that could affect our stock price are:
- •
- actual or anticipated quarterly fluctuations in our operating results and financial condition;
- •
- changes in revenue or earnings estimates or publication of research reports and recommendations by financial analysts;
- •
- failure to meet analysts' revenue or earnings estimates;
- •
- speculation in the press or investment community;
- •
- strategic actions by us or our competitors, such as acquisitions or restructurings;
- •
- actions by institutional shareholders;
- •
- fluctuations in the stock price and operating results of our competitors;
- •
- general market conditions and, in particular, developments related to market conditions for the financial services
industry;
- •
- proposed or adopted regulatory changes or developments;
- •
- anticipated or pending investigations, proceedings or litigation that involve or affect us; or
- •
- domestic and international economic factors unrelated to our performance.
The stock market and, in particular, the market for financial institution stocks, has experienced significant volatility during the year. As a result, the market price of our common stock may be volatile. In addition, the trading volume in our common stock may fluctuate more than usual and cause significant price variations to occur. The trading price of the shares of our common stock and the value of our other securities will depend on many factors, which may change from time to time, including, without limitation, our financial condition, performance, creditworthiness and prospects, future sales of our equity or equity related securities, and other factors identified above in "Special Cautionary Note Regarding Forward-Looking Statements." Market volatility during the past couple of years is unprecedented. The capital and credit markets have been experiencing volatility and disruption for more than a year. In some cases, the markets have produced downward pressure on stock prices and credit availability for certain issuers without regard to those issuers' underlying financial strength. A significant decline in our stock price could result in substantial losses for individual shareholders and could lead to costly and disruptive securities litigation.
Anti-takeover provisions could negatively impact our stockholders. Provisions of Delaware law and of our certificate of incorporation, as amended, and bylaws could make it more difficult for a third party to acquire control of us or have the effect of discouraging a third party from attempting to acquire control of us. For example, our certificate of incorporation requires the approval of the holders of at least two-thirds of our outstanding shares of voting stock to approve certain business combinations. We are subject to Section 203 of the Delaware General Corporation Law, which would make it more difficult for another party to acquire us without the approval of our board of directors. Additionally, our certificate of incorporation, as amended, authorizes our board of directors to issue preferred stock and preferred stock could be issued as a defensive measure in response to a takeover proposal. These and other provisions could make it more difficult for a third party to acquire us even if an acquisition might be in the best interest of our stockholders.
32
Natural disasters and geopolitical events beyond our control could adversely affect us. Natural disasters such as earthquakes, wildfires, extreme weather conditions, hurricanes, floods, and other acts of nature and geopolitical events involving terrorism or military conflict could adversely affect our business operations and those of our customers and cause substantial damage and loss to real and personal property. These natural disasters and geopolitical events could impair our borrowers' ability to service their loans, decrease the level and duration of deposits by customers, erode the value of loan collateral, and result in an increase in the amount of our nonperforming loans and a higher level of nonperforming assets (including real estate owned), net chargeoffs, and provision for loan losses, which could adversely affect our earnings.
Adverse conditions in Asia could adversely affect our business. A substantial number of our customers have economic and cultural ties to Asia and, as a result, we are likely to feel the effects of adverse economic and political conditions in Asia. Additionally, we also have four representative offices in China and one in Taipei, Taiwan, and two full-service branches in Hong Kong and China. U.S. and global economic policies, military tensions, and unfavorable global economic conditions may adversely impact the Asian economies. Pandemics and other public health crises or concerns over the possibility of such crises could create economic and financial disruptions in the region. If economic conditions in Asia deteriorate, we could, among other things, be exposed to economic and transfer risk, and could experience an outflow of deposits by those of our customers with connections to Asia. Transfer risk may result when an entity is unable to obtain the foreign exchange needed to meet its obligations or to provide liquidity. This may adversely impact the recoverability of investments with or loans made to such entities. Adverse economic conditions in Asia, and in China in particular, may also negatively impact asset values and the profitability and liquidity of our customers who operate in this region.
We have engaged in and may continue to engage in further expansion through acquisitions, which could negatively affect our business and earnings. We have engaged in and may continue to engage in expansion through acquisitions, such as the UCB Acquisition that was completed on November 6, 2009. There are risks associated with such expansion. These risks include, among others, incorrectly assessing the asset quality of a bank acquired in a particular transaction, encountering greater than anticipated costs in integrating acquired businesses, facing resistance from customers or employees, and being unable to profitably deploy assets acquired in the transaction. Additional country- and region-specific risks are associated with transactions outside the United States, including in China. To the extent we issue capital stock in connection with additional transactions, these transactions and related stock issuances may have a dilutive effect on earnings per share and share ownership.
Our earnings, financial condition, and prospects after a merger or acquisition depend in part on our ability to successfully integrate the operations of the acquired company. We may be unable to integrate operations successfully or to achieve expected cost savings. Any cost savings which are realized may be offset by losses in revenues or other charges to earnings.
We may experience difficulties in integrating the operations of United Commercial Bank, which may negatively impact our business and earnings. The acquisition of United Commercial Bank involves the integration of East West Bank and United Commercial Bank, which have previously operated independently. The successful integration of operations of East West Bank and United Commercial Bank depends primarily upon our ability to consolidate operations, systems and procedures and to eliminate redundancies and costs. No assurance can be given that we will be able to integrate the banking operations without encountering difficulties including, without limitation, the loss of key employees and customers, the disruption of on-going business or possible inconsistencies in standards, controls, procedures and policies. Estimated cost savings and revenue enhancements are projected to come from various areas that our management has identified through the integration planning process. The elimination and consolidation of duplicate tasks at these banks are projected to result in annual
33
cost savings. If we experience difficulty with the integration, we may not achieve all the economic benefits we expect to result from the acquisition, and this may hurt our business and earnings. In addition, we may experience greater than expected costs or difficulties relating to the integration of the business of United Commercial Bank and/or may not realize expected cost savings from the acquisition within the anticipated time frames.
We may have difficulty integrating and retaining the deposits of United Commercial Bank. We may experience some attrition of former customers of United Commercial Bank following the FDIC receivership. Following the November 6, 2009 acquisition, total deposits decreased from $6.52 billion (excluding fair value adjustments) as of the date of the November 6, 2009 acquisition to $6.10 billion at December 31, 2009. Withdrawal of a material amount of such deposits could adversely impact the our liquidity, profitability, business prospects, results of operations and cash flows. Any difficulties we may experience in integrating the operations of East West Bank and United Commercial Bank may also affect our retention of deposit accounts and former United Commercial Bank Customers.
We may experience difficulty in managing the acquired United Commercial Bank loan portfolio within the limits of the loss protection provided by the FDIC. In connection with the United Commercial Bank acquisition, East West Bank entered into a shared-loss agreement with the FDIC that covered, at fair value, on the November 6, 2009 acquisition date, approximately $5.66 billion and $38.0 million of United Commercial Bank's loans and other real estate owned, respectively. East West Bank will share in the losses, which begins with the first dollar of loss occurred, of the loan pools (including single family residential mortgage loans, commercial loans, foreclosed loan collateral and other real estate owned) covered ("covered loans") under the shared-loss agreement. Pursuant to the terms of the shared-loss agreement, the FDIC is obligated to reimburse East West Bank 80% of eligible losses of up to $2.05 billion with respect to covered loans. The FDIC will reimburse East West Bank for 95% of eligible losses in excess of $2.05 billion with respect to covered loans. East West Bank has a corresponding obligation to reimburse the FDIC for 80% or 95%, as applicable, of eligible recoveries with respect to covered loans.
The shared-loss agreement for commercial and single family residential mortgage loans is in effect for 5 years and 10 years, respectively, from the November 6, 2009 acquisition date and the loss recovery provisions are in effect for 8 years and 10 years, respectively, from the acquisition date. On January 14, 2020, East West Bank is required to pay to the FDIC 50% of the excess, if any of (i) $410 million over (ii) the sum of (A) 25% of the asset discount plus (B) 25% of the Cumulative Shared-Loss Payments plus (C) the Cumulative Servicing Amount if net losses on covered loans subject to the stated threshold is not reached. Although we have substantial expertise in asset resolution, we cannot guarantee that we will be able to adequately manage the loan portfolio within the limits of the loss protection provided by the FDIC.
ITEM 1B. UNRESOLVED STAFF COMMENTS
None.
The Company currently neither owns nor leases any real or personal property. The Company uses the premises, equipment, and furniture of the Bank. The Agency also currently conducts its operations in one of the administrative offices of the Bank. The Company is currently reimbursing the Bank for the Agency's use of this facility.
34
The Bank owns the buildings and land at 24 of its retail branch offices. Nine of these retail branch locations are either attached or adjacent to offices that are being used by the Bank to house various administrative departments. All other branch and administrative locations are leased by the Bank, with lease expiration dates ranging from 2009 to 2020, exclusive of renewal options.
Subsequent to year end, we assumed approximately forty-eight leases and agreed to purchase approximately $72.6 million in fair value of real property from the FDIC as part of the FDIC-assisted transaction of United Commercial Bank.
The Company believes that its existing facilities are adequate for its present purposes. The Company believes that, if necessary, it could secure alternative facilities on similar terms without adversely affecting its operations.
At December 31, 2009, the Bank's consolidated investment in premises and equipment, net of accumulated depreciation and amortization, totaled $59.1 million. Total occupancy expense, inclusive of rental payments and furniture and equipment expense, for the year ended December 31, 2009 was $30.2 million. Total annual rental expense (exclusive of operating charges and real property taxes) was approximately $15.0 million during 2009.
Neither the Company nor the Bank is involved in any material legal proceedings. The Bank, from time to time, is party to litigation which arises in the ordinary course of business, such as claims to enforce liens, claims involving the origination and servicing of loans, and other issues related to the business of the Bank. After taking into consideration information furnished by counsel to the Company and the Bank, management believes that the resolution of such issues would not have a material adverse impact on the financial position, results of operations, or liquidity of the Company or the Bank.
ITEM 4. SUBMISSION OF MATTERS TO A VOTE OF SECURITY HOLDERS
There were no matters submitted to a vote of security holders during the fourth quarter of the year ended December 31, 2009.
35
ITEM 5. MARKET FOR REGISTRANT'S COMMON EQUITY, RELATED STOCKHOLDER MATTERS AND ISSUER PURCHASES OF EQUITY SECURITIES
Market Information
East West Bancorp, Inc. commenced trading on the NASDAQ Global Select Market on February 8, 1999 under the symbol "EWBC." The following table sets forth the range of sales prices for the Company's common stock for the years ended December 31, 2009 and 2008.
| |
2009 | 2008 | |||||||||||
|---|---|---|---|---|---|---|---|---|---|---|---|---|---|
| |
High | Low | High | Low | |||||||||
First quarter |
$ | 16.14 | $ | 3.24 | $ | 25.75 | $ | 16.96 | |||||
Second quarter |
10.45 | 4.35 | 18.74 | 6.94 | |||||||||
Third quarter |
11.37 | 5.75 | 17.65 | 6.77 | |||||||||
Fourth quarter |
17.39 | 8.05 | 18.40 | 9.85 | |||||||||
The foregoing reflects information available to the Company and does not necessarily include all trades in the Company's stock during the periods indicated. The closing price of our common stock on January 31, 2010 was $16.43 per share, as reported by the NASDAQ Global Select Market.
Issuance of Preferred Stock
In April 2008, the Company issued 200,000 shares of 8% Non-Cumulative Perpetual Convertible Preferred Stock, Series A ("Series A preferred shares"), with a liquidation preference of $1,000 per share. In conjunction with this issuance, the Company received $194.1 million of additional Tier 1 qualifying capital, net of stock issuance costs. The shares are quoted on the Over-the-Counter Bulletin board under the symbol "EWBCP.PK" on an exchange. The holders of the Series A preferred shares will have the right at any time to convert each share of Series A into 64.9942 shares of the Company's common stock, plus cash in lieu of fractional shares. This represented an initial conversion price of approximately $15.39 per share of common stock or a 22.5% conversion premium based on the closing price of the Company's common stock on April 23, 2008 of $12.56 per share. On or after May 1, 2013, the Company has the right to cause the Series A preferred shares to be converted into shares of the Company's common stock, subject to conversion provisions. Dividends on the Series A preferred shares, if declared, will accrue and be payable quarterly in arrears at a rate per annum equal to 8% on the liquidation preference of $1,000 per share, on February 15, May 15, August 15 and November 15 of each year.
During July 2009, the Company exchanged 9,968,760 shares of the Company's common stock for 110,764 shares of the Company's 8.00% Non-Cumulative Perpetual Convertible Preferred Stock, Series A.
On December 5, 2008, the Company issued 306,546 shares of Fixed Rate Cumulative Perpetual Senior Preferred Stock, Series B ("Series B preferred shares"), with a liquidation preference of $1,000 per share in conjunction with its participation in the U.S. Treasury's TARP CPP. The Company received $306.5 million of additional Tier 1 qualifying capital as a result of this issuance. The shares are not listed on an exchange. The Series B preferred shares are senior to common stock and pari passu with existing preferred shares (including shares of our Series A preferred stock discussed above) other than preferred shares which by their terms rank junior to any existing preferred shares. The Series B preferred shares will pay cumulative dividends at a rate of 5% per annum until the fifth anniversary of
36
the investment date and thereafter at a rate of 9% per annum. Dividends will be payable quarterly in arrears on February 15, May 15, August 15 and November 15 of each year. For as long as any Series B preferred shares are outstanding, no dividends may be declared or paid on junior preferred shares, preferred shares ranking pari passu with the Series B preferred shares, or common shares (other than in the case of pari passu preferred shares, in which case, dividends are paid on a pro rata basis with the Series B preferred shares), nor may the Company repurchase or redeem any junior preferred shares, preferred shares ranking pari passu with the Series B preferred shares or common shares, unless all accrued and unpaid dividends for all past dividend periods on the Series B preferred shares are fully paid. Series B preferred shares are transferable by the U.S. Treasury at any time. Subject to approval from the FRB, the Series B preferred shares are redeemable at the option of the Company at 100% of liquidation preference (plus any accrued and unpaid dividends), provided, however, that the Series B preferred shares may be redeemed prior to the first dividend payment date falling after the third anniversary of the Closing Date (February 15, 2012) only if (i) the Company has raised aggregate gross proceeds in one or more Qualified Equity Offerings in excess of $76,636,500, and (ii) the aggregate redemption price does not exceed the aggregate net proceeds from such Qualified Equity Offerings. Except for certain specified transactions, Series B preferred shares shall be non-voting in nature.
In connection with the Series B offering, the Company issued warrants to purchase 3,035,109 shares of common stock with an initial price of $15.15 per share of common stock for which the TARP Warrant may be exercised. The TARP Warrant may be exercised at any time on or before December 5, 2018. During the fourth quarter of 2009, the Company received a 50% reduction in the TARP Warrant we issued to the U.S. treasury in conjunction with the Series B preferred shares issued. As of December 31, 2009, the new share count of the warrant is 1,517,555. This adjustment to the TARP Warrant was due to the fact that within one year of issuance, the Company raised new capital in excess of the TARP capital issued in December 2008.
Private Sales of Common Stock
In July 2009, in private placement transactions, two customers of the Bank purchased 5 million shares of our common stock at a price of $5.50 per share. We received net proceeds of approximately $26.0 million, net of stock issuance costs, in conjunction with this common stock offering. We have registered these shares for resale to the public.
Public Offering of Common Stock
In July 2009, we completed a public offering of 11 million shares of our common stock priced at $6.35. The underwriter also exercised its option to purchase an additional 1.65 million shares of our common stock. We received net proceeds of approximately $76.7 million, net of stock issuance costs, in conjunction with this common stock offering.
Private Placement
On November 6, 2009, the Company raised $500.0 million in a private placement of 18,247,012 shares of common stock, $0.001 par value, and 335,047 shares of newly authorized Mandatory Convertible Cumulative Non-Voting Perpetual Preferred Stock, Series C, ("Series C preferred shares") to certain qualified institutional buyers and accredited investors (collectively, the "Investors") with a liquidation preference of $1,000 per share. The common stock sold represented 19.9% of the Company's common stock outstanding. In connection with the Series C preferred shares offering, the shares are mandatorily convertible upon shareholder approval and subject to any applicable regulatory approvals. For as long as any Series C preferred shares are outstanding, the cumulative dividends are payable semi-annually in arrears on May 1 and November 1 of each year in cash and in kind in
37
additional shares of Series C preferred shares if, when and as declared by the Board of Directors or a committee thereof. The Series C preferred shares will pay an annual rate as high as 13% plus dividends payable at an annual rate equal to 5%. The Series C preferred shares rank in parity with respect to dividend rights and rights on liquidation, winding up and dissolution with the Company's outstanding series of preferred stock and senior to the Company's common stock. The Series C preferred shares have no voting rights, except as required by law and with respect to certain limited matters, non-redeemable by the holders, but redeemable by the Company following the fifth anniversary of issuance, no preemptive rights, a 9.9% ownership limitation and has the customary anti-dilution adjustment provisions.
Because the Company's common stock is listed on the NASDAQ Global Select Market, the Company is subject to the NASDAQ Rules. NASDAQ Rule 5635(d) requires stockholder approval prior to the issuance of securities in connection with a transaction, other than a public offering, involving the sale, issuance or potential issuance by a company of common stock, or securities convertible into or exercisable for common stock, equal to 20% or more of the common stock or 20% or more of the voting power outstanding before the issuance for less than the greater of book value or market value of the stock. The 37,062,721 shares of common stock issuable upon conversion of the Series C preferred shares together with the common stock issued at the closing of the private placement will exceed 19.99% of the number of shares of our common stock and voting power outstanding prior to the private placement. The $9.04 per share conversion price for the Series C preferred shares is less than the book value per share of our common stock. Accordingly, the issuance of the common stock upon conversion of the Series C preferred shares is subject to stockholder approval.
Shares of Series C preferred are subject to rights preferences and privileges set forth in the Company's Certificate of Designations which has been filed with the Secretary of State of the State of Delaware.
Common Stock Holders
As of January 31, 2010, 110,498,101 shares of the Company's common stock were held by 1,861 shareholders of record.
Common Dividends
We declared and paid cash dividends of $0.10 per share during each of the four quarters of 2008 and $0.02 per share for the first quarter of 2009 and $0.01 per share for the second, third and fourth quarters of 2009. Refer to "Item 1. BUSINESS – Supervision and Regulation – Dividends and Other Transfers of Funds" for information regarding dividend payment restrictions.
38
Stock Performance Graph
The following graph shows a comparison of stockholder return on the Company's common stock based on the market price of the common stock assuming the reinvestment of dividends, with the cumulative total returns for the companies in the Standard & Poor's 500 Index and the SNL Western Bank Index for the 5-year period beginning on December 31, 2004 through December 31, 2009. This graph is historical only and may not be indicative of possible future performance of the Company's common stock. The information set forth under the heading "Stock Performance Graph" shall not be deemed "soliciting material" or to be "filed" with the Commission except to the extent we specifically request that such information be treated as soliciting material or specifically incorporate it by reference into a filing under the Securities Exchange Act of 1934, as amended, or the Securities Act of 1933, as amended.
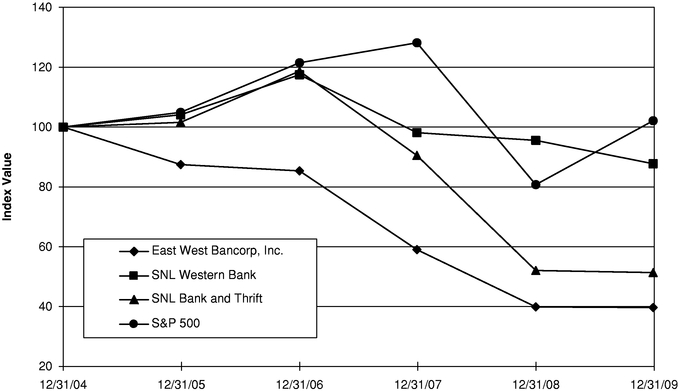
| |
Period Ending | ||||||||||||||||||
|---|---|---|---|---|---|---|---|---|---|---|---|---|---|---|---|---|---|---|---|
| Index | 12/31/04 | 12/31/05 | 12/31/06 | 12/31/07 | 12/31/08 | 12/31/09 | |||||||||||||
East West Bancorp, Inc. |
100.00 | 87.45 | 85.34 | 59.02 | 39.88 | 39.66 | |||||||||||||
SNL Western Bank |
100.00 | 104.11 | 117.48 | 98.12 | 95.54 | 87.73 | |||||||||||||
SNL Bank and Thrift |
100.00 | 101.57 | 118.68 | 90.50 | 52.05 | 51.35 | |||||||||||||
S&P 500 |
100.00 | 104.91 | 121.48 | 128.16 | 80.74 | 102.11 | |||||||||||||
Source: SNL Financial LC, Charlottesville, VA, (434) 977-1600, www.snl.com
39
Purchases of Equity Securities by the Issuer and Affiliated Purchasers
On January 23, 2007, the Company's Board of Directors authorized a new stock repurchase program to buy back up to $30.0 million of the Company's common stock. On March 20, 2007, the Company's Board of Directors authorized an increase in the stock repurchase program to buy back up to an additional $50.0 million of the Company's common stock in 2007. This new authorization is in addition to the $30.0 million stock repurchase authorized on January 23, 2007. The Company completed the repurchase of 1,392,176 shares at a weighted average price of $38.69 during 2007. There were no repurchases of equity securities during the years ended December 31, 2009 and 2008. The Company had $26.2 million in authorized share repurchases remaining as of December 31, 2009. Under the terms of the U.S. Treasury's Capital Purchase Program, the Company is prohibited from making certain repurchases of equity securities – see Note 24 under Series B Preferred Stock Offering.
Repurchases of the Company's securities during the fourth quarter of 2009 are as follows:
| Month Ended | Total Number of Shares Purchased (1) |
Weighted Average Price Paid per Share |
Total Number of Shares Purchased as Part of Publicly Announced Programs |
Approximate Dollar Value in Millions of Shares that May Yet Be Purchased Under the Programs (2) |
||||||||||
|---|---|---|---|---|---|---|---|---|---|---|---|---|---|---|
October 31, 2009 |
- | $ | - | - | $ | 26.2 | ||||||||
November 30, 2009 |
- | - | - | 26.2 | ||||||||||
December 31, 2009 |
- | - | - | 26.2 | ||||||||||
Total |
- | $ | - | - | $ | 26.2 | ||||||||
- (1)
- Excludes 113,982 in repurchased shares totaling $2.3 million due to granting of unrestricted stock awards as well as forfeitures and vesting of restricted stock awards pursuant to the Company's 1998 Stock Incentive Plan.
- (2)
- During the first quarter of 2007, the Company's Board of Directors announced a repurchase program authorizing the repurchase of up to $80.0 million of its common stock. This repurchase program has no expiration date and, to date, 1,392,176 shares have been purchased under this program.
40
ITEM 6. SELECTED FINANCIAL DATA
The following selected financial data should be read in conjunction with the Company's consolidated financial statements and the accompanying notes presented elsewhere herein.
| |
2009 | 2008 | 2007 | 2006 | 2005 | |||||||||||
|---|---|---|---|---|---|---|---|---|---|---|---|---|---|---|---|---|
| |
(In thousands, except per share data) |
|||||||||||||||
Summary of Operations |
||||||||||||||||
Interest and dividend income |
$ | 722,818 | $ | 664,858 | $ | 773,607 | $ | 660,050 | $ | 411,399 | ||||||
Interest expense |
239,499 | 309,694 | 365,613 | 292,568 | 131,284 | |||||||||||
Net interest income |
483,319 | 355,164 | 407,994 | 367,482 | 280,115 | |||||||||||
Provision for loan losses |
528,666 | 226,000 | 12,000 | 6,166 | 15,870 | |||||||||||
Net interest income after provision for loan losses |
(45,347 | ) | 129,164 | 395,994 | 361,316 | 264,245 | ||||||||||
Noninterest income (loss) (1) |
396,553 | (25,062 | ) | 49,520 | 33,920 | 29,649 | ||||||||||
Noninterest expense |
246,484 | 201,270 | 183,255 | 161,455 | 123,533 | |||||||||||
Income (loss) before provision (benefit) for income taxes |
104,722 | (97,168 | ) | 262,259 | 233,781 | 170,361 | ||||||||||
Provision (benefit) for income taxes |
22,714 | (47,485 | ) | 101,092 | 90,412 | 61,981 | ||||||||||
Net income (loss) before extraordinary item |
82,008 | (49,683 | ) | 161,167 | 143,369 | 108,380 | ||||||||||
Extraordinary item, net of tax |
(5,366 | ) | - | - | - | - | ||||||||||
Net income (loss) |
$ | 76,642 | $ | (49,683 | ) | $ | 161,167 | $ | 143,369 | $ | 108,380 | |||||
PREFERRED STOCK DIVIDENDS AND AMORTIZATION OF PREFERRED STOCK DISCOUNT |
49,115 | 9,474 | - | - | - | |||||||||||
NET INCOME (LOSS) AVAILABLE TO COMMON STOCKHOLDERS |
$ | 27,527 | $ | (59,157 | ) | $ | 161,167 | $ | 143,369 | $ | 108,380 | |||||
Per Common Share |
||||||||||||||||
Basic earnings per share |
$ | 0.35 | $ | (0.94 | ) | $ | 2.63 | $ | 2.40 | $ | 2.03 | |||||
Diluted earnings per share |
$ | 0.33 | $ | (0.94 | ) | $ | 2.60 | $ | 2.35 | $ | 1.97 | |||||
Common dividends per share |
$ | 0.05 | $ | 0.40 | $ | 0.40 | $ | 0.20 | $ | 0.20 | ||||||
Average number of shares outstanding, basic |
78,770 | 62,673 | 61,180 | 59,605 | 53,454 | |||||||||||
Average number of shares outstanding, diluted |
84,523 | 62,673 | 62,093 | 60,909 | 55,034 | |||||||||||
At Year End: |
||||||||||||||||
Total assets |
$ | 20,559,212 | $ | 12,422,816 | $ | 11,852,212 | $ | 10,823,711 | $ | 8,278,256 | ||||||
Loans receivable |
8,218,671 | 8,069,377 | 8,750,921 | 8,182,172 | 6,724,320 | |||||||||||
Covered loans |
5,598,155 | - | - | - | - | |||||||||||
Investment securities |
2,564,081 | 2,162,511 | 1,887,136 | 1,647,080 | 869,837 | |||||||||||
Deposits |
14,987,613 | 8,141,959 | 7,278,914 | 7,235,042 | 6,258,587 | |||||||||||
Federal Home Loan Bank advances |
1,805,387 | 1,353,307 | 1,808,419 | 1,136,866 | 617,682 | |||||||||||
Stockholders' equity |
2,284,659 | 1,550,766 | 1,171,823 | 1,019,390 | 734,138 | |||||||||||
Common shares outstanding |
109,963 |
63,746 |
63,137 |
61,431 |
56,519 |
|||||||||||
Book value per common share |
$ | 14.37 | $ | 16.92 | $ | 18.56 | $ | 16.59 | $ | 12.99 | ||||||
Financial Ratios: |
||||||||||||||||
Return on average assets |
0.55 | % | (0.42 | )% | 1.45 | % | 1.46 | % | 1.55 | % | ||||||
Return on average common equity |
2.37 | (5.41 | ) | 14.89 | 15.78 | 18.27 | ||||||||||
Return on average total equity |
4.69 | (3.99 | ) | 14.89 | 15.78 | 18.27 | ||||||||||
Common dividend payout ratio |
13.03 | N/A | 15.27 | 8.35 | 9.88 | |||||||||||
Average stockholders' equity to average assets |
11.81 | 10.55 | 9.77 | 9.26 | 8.48 | |||||||||||
Net interest margin |
3.75 | 3.19 | 3.94 | 3.98 | 4.22 | |||||||||||
Efficiency Ratio (2) |
48.89 | 45.94 | 37.44 | 37.07 | 36.53 | |||||||||||
Asset Quality Ratios: |
||||||||||||||||
Net chargeoffs (recoveries) to average non-covered loans |
5.69 | % | 1.64 | % | 0.08 | % | (0.01 | )% | 0.08 | % | ||||||
Nonperforming assets to total assets |
0.91 | 2.12 | 0.57 | 0.18 | 0.36 | |||||||||||
Allowance for loan losses to total gross non-covered loans |
2.81 | 2.16 | 1.00 | 0.95 | 1.01 | |||||||||||
- (1)
- 2009 and 2008 include other-than-temporary ("OTTI") charges relating to investment securities of $107.7 million and $73.2 million, respectively and pre-tax gain of $471.0 million during 2009.
- (2)
- Represents noninterest expense, excluding the amortization of intangibles, amortization and impairment writedowns of premiums on deposits acquired, impairment writedown on goodwill, and investments in affordable housing partnerships, divided by the aggregate of net interest income before provision for loan losses and noninterest income, excluding impairment writedowns on investment securities and other equity investment.
41
ITEM 7. MANAGEMENT'S DISCUSSION AND ANALYSIS OF FINANCIAL CONDITION AND RESULTS OF OPERATIONS
The following discussion provides information about the results of operations, financial condition, liquidity, and capital resources of East West Bancorp, Inc. and its subsidiaries. This information is intended to facilitate the understanding and assessment of significant changes and trends related to our financial condition and the results of our operations. This discussion and analysis should be read in conjunction with our consolidated financial statements and the accompanying notes presented elsewhere in this report.
On November 6, 2009 the Bank acquired United Commercial Bank from the FDIC in an FDIC-assisted transaction. This acquisition nearly doubled our asset size and contributed $23.3 million to our total pre-tax income for the period from November 6, 2009 to December 31, 2009. A pre-tax gain of $471.0 million was recorded as a result of the acquisition.
Critical Accounting Policies
Our financial statements are prepared in accordance with accounting principles generally accepted in the United States of America and general practices within the banking industry. The financial information contained within these statements is, to a significant extent, financial information that is based on approximate measures of the financial effects of transactions and events that have already occurred. All of our significant accounting policies are described in Note 1 of our consolidated financial statements presented elsewhere in this report and are essential to understanding Management's Discussion and Analysis of Financial Condition and Results of Operations. Various elements of our accounting policies, by their nature, are inherently subject to estimation techniques, valuation assumptions and other subjective assessments. In addition, certain accounting policies require significant judgment in applying complex accounting principles to individual transactions to determine the most appropriate treatment. We have established procedures and processes to facilitate making the judgments necessary to prepare financial statements.
The following is a summary of the more judgmental and complex accounting estimates and principles. In each area, we have identified the variables most important in the estimation process. We have used the best information available to make the estimations necessary to value the related assets and liabilities. Actual performance that differs from our estimates and future changes in the key variables could change future valuations and impact net income.
Fair Valuation of Financial Instruments
The Company adopted Financial Accounting Standards Board Accounting Standards Codification ("ASC") 820 (previously SFAS No. 157, Fair Value Measurements), on January 1, 2008. This standard provides a definition of fair value, establishes a framework for measuring fair value, and requires expanded disclosures about fair value measurements. Fair value is the price that could be received to sell an asset or paid to transfer a liability in an orderly transaction between market participants. Based on the observability of the inputs used in the valuation techniques, we classify our financial assets and liabilities measured and disclosed at fair value in accordance within the three-level hierarchy (e.g., Level 1, Level 2 and Level 3). Fair value determination requires that we make a number of significant judgments. In determining the fair value of financial instruments, we use market prices of the same or similar instruments whenever such prices are available. We do not use prices involving distressed sellers in determining fair value. If observable market prices are unavailable or impracticable to obtain, then fair value is estimated using modeling techniques such as discounted cash flow analyses. These modeling techniques incorporate our assessments regarding assumptions that
42
market participants would use in pricing the asset or the liability, including assumptions about the risks inherent in a particular valuation technique and the risk of nonperformance.
Fair value is used on a recurring basis for certain assets and liabilities in which fair value is the primary basis of accounting. Additionally, fair value is used on a non-recurring basis to evaluate assets or liabilities for impairment or for disclosure purposes in accordance with ASC 825 (previously SFAS No. 107, Disclosures About Fair Value of Financial Instruments).
Investment Securities
The classification and accounting for investment securities are discussed in detail in Note 1 of the consolidated financial statements presented elsewhere in this report. Investment securities generally must be classified as held-to-maturity, available-for-sale, or trading. The appropriate classification is based partially on our ability to hold the securities to maturity and largely on management's intentions with respect to either holding or selling the securities. The classification of investment securities is significant since it directly impacts the accounting for unrealized gains and losses on securities. Unrealized gains and losses on trading securities flow directly through earnings during the periods in which they arise. Investment securities that are classified as held-to-maturity are recorded at amortized cost. Unrealized gains and losses on available-for-sale securities are recorded as a separate component of stockholders' equity (accumulated other comprehensive income or loss) and do not affect earnings until realized or are deemed to be other-than-temporarily impaired. The fair values of investment securities are generally determined by reference to the average of at least two quoted market prices obtained from independent external brokers or independent external pricing service providers who have experience in valuing these securities. In obtaining such valuation information from third parties, the Company has evaluated the methodologies used to develop the resulting fair values. The Company performs a monthly analysis on the broker quotes received from third parties to ensure that the prices represent a reasonable estimate of the fair value. The procedures include, but are not limited to, initial and on-going review of third party pricing methodologies, review of pricing trends, and monitoring of trading volumes. The Company ensures prices received from independent brokers represent a reasonable estimate of fair value through the use of internal and external cash flow models developed based on spreads, and when available, market indices. As a result of this analysis, if the Company determines there is a more appropriate fair value based upon the available market data, the price received from the third party is adjusted accordingly. Prices from third party pricing services are often unavailable for securities that are rarely traded or are traded only in privately negotiated transactions. As a result, certain securities are priced via independent broker quotations which utilize inputs that may be difficult to corroborate with observable market based data. Additionally, the majority of these independent broker quotations are non-binding.
For current broker prices obtained on certain investment securities that we believe are based on forced liquidation or distressed sale values in very inactive markets, we have modified our approach in determining the fair values of these securities. We have determined that each of these securities will be individually examined for the appropriate valuation methodology based on a combination of the market approach reflecting current broker prices and a discounted cash flow approach. In calculating the fair value derived from the income approach, the Company made assumptions related to the implied rate of return, general change in market rates, estimated changes in credit quality and liquidity risk premium, specific non-performance and default experience in the collateral underlying the security, as well as taking into consideration broker discount rates in determining the discount rate. The values resulting from each approach (i.e. market and income approaches) are weighted to derive the final fair value for each security trading in an inactive market.
43
We are obligated to assess, at each reporting date, whether there is an "other-than-temporary" impairment to our investment securities. If we determine that a decline in fair value is other-than-temporary, a credit-related impairment loss is recognized in current earnings. Noncredit-related impairment losses are charged to other comprehensive income. The determination of other-than-temporary impairment is a subjective process, requiring the use of judgments and assumptions. We examine all individual securities that are in an unrealized loss position at each reporting date for other-than-temporary impairment. Specific investment-related factors we examine to assess impairment include the nature of the investment, severity and duration of the loss, the probability that we will be unable to collect all amounts due, an analysis of the issuers of the securities and whether there has been any cause for default on the securities and any change in the rating of the securities by the various rating agencies. Additionally, we evaluate whether the creditworthiness of the issuer calls the realization of contractual cash flows into question. We reexamine the financial resources, intent and the overall ability of the Company to hold the securities until their fair values recover. Management does not believe that there are any investment securities, other than those identified in the current and previous periods, which are deemed to be "other-than-temporarily" impaired as of December 31, 2009. Investment securities are discussed in more detail in Note 6 to the Company's consolidated financial statements presented elsewhere in this report.
The Company considers all available information relevant to the collectibility of the security, including information about past events, current conditions, and reasonable and supportable forecasts, when developing the estimate of future cash flows and making its other-than-temporary impairment assessment for our portfolio of residual securities and trust preferred securities. The Company considers factors such as remaining payment terms of the security, prepayment speeds, the financial condition of the issuer(s), expected defaults, and the value of any underlying collateral.
Acquired Loans
Acquired loans are valued as of acquisition date in accordance with ASC 805 Business Combinations, formerly FAS 141R Business Combinations. Loans purchased with evidence of credit deterioration since origination for which it is probable that all contractually required payments will not be collected are accounted for under ASC 310-30, Loans and Debt Securities Acquired with Deteriorated Credit Quality, formerly SOP 03-3 Accounting for Certain Loans or Debt Securities Acquired in a Transfer. Further, the Company elected to account for all other acquired loans within the scope of ASC 310-30 using the same methodology.
Under ASC 805 and ASC 310-30, loans are recorded at fair value at acquisition date, factoring in credit losses expected to be incurred over the life of the loan. Accordingly, an allowance for loan losses is not carried over or recorded as of the acquisition date. In situations where loans have similar risk characteristics, loans were aggregated into pools to estimate cash flows under ASC 310-30. A pool is accounted for as a single asset with a single interest rate, cumulative loss rate and cash flow expectation. The Company aggregated all of the loans acquired in the FDIC-assisted acquisition of United Commercial Bank in fifty two different pools, based on common risk characteristics.
The cash flows expected over the life of the pools are estimated using an internal cash flow model that projects cash flows and calculates the carrying values of the pools, book yields, effective interest income and impairment, if any, based on pool level events. Assumptions as to cumulative loss rates, loss curves and prepayment speeds are utilized to calculate the expected cash flows.
Under ASC 310-30, the excess of the expected cash flows at acquisition over the fair value is considered to be the accretable yield and is recognized as interest income over the life of the loan or pool. The excess of the contractual cash flows over the expected cash flows is considered to be the
44
nonaccretable difference. Subsequent to the acquisition date, any increases in cash flow over those expected at purchase date in excess of fair value are recorded as an adjustment to accretable difference on a prospective basis. Any subsequent decreases in cash flow over those expected at purchase date are recognized by recording an allowance for loan losses. Any disposals of loans, including sales of loans, payments in full or foreclosures result in the removal of the loan from the ASC 310-30 portfolio at the carrying amount.
Covered Loans
The majority of the loans acquired in the FDIC-assisted acquisition of United Commercial Bank are included in a FDIC shared-loss agreement and are referred to as covered loans. Covered loans are reported exclusive of the expected cash flow reimbursements expected from the FDIC. At the date of acquisition, all covered loans were accounted for under ASC 805 and ASC 310-30. Subsequent to acquisition all covered loans are accounted for under ASC 310-30.
Covered Other Real Estate Owned
All other real estate owned acquired in the FDIC-assisted acquisition of United Commercial Bank are included in a FDIC shared-loss agreement and are referred to as covered other real estate owned. Covered other real estate owned is reported exclusive of expected reimbursement cash flows from the FDIC. Upon transferring covered loan collateral to covered other real estate owned status, acquisition date fair value discounts on the related loan are also transferred to covered other real estate owned. Fair value adjustments on covered other real estate owned result in a reduction of the covered other real estate carrying amount and a corresponding increase in the estimated FDIC reimbursement, with the estimated net loss to the Bank charged against earnings.
FDIC Indemnification Asset
In conjunction with the FDIC-assisted acquisition of United Commercial Bank, the Bank entered into a shared-loss agreement with the FDIC for amounts receivable under the shared-loss agreement. At the date of the acquisition the Company elected to account amounts receivable under the shared-loss agreement as an indemnification asset in accordance with ASC 805. Subsequent to the acquisition the indemnification asset is tied to the loss in the covered loans and is not being accounted for under fair value. The FDIC indemnification asset is accounted for on the same basis as the related covered loans and is the present value of the cash flows the Company expects to collect from the FDIC under the shared-loss agreement. The difference between the present value and the undiscounted cash flow the Company expects to collect from the FDIC is accreted into noninterest income over the life of the FDIC indemnification asset. The FDIC indemnification asset is adjusted for any changes in expected cash flows based on the loan performance. Any increases in cash flow of the loans over those expected will reduce the FDIC indemnification asset and any decreases in cash flow of the loans over those expected will increase the FDIC indemnification asset. Increase and decreases to the FDIC indemnification asset are recorded as adjustments to noninterest income.
Allowance for Loan Losses
Our allowance for loan loss methodology incorporates a variety of risk considerations, both quantitative and qualitative, in establishing an allowance for loan loss that management believes is appropriate at each reporting date. Quantitative factors include our historical loss experience, delinquency and chargeoff trends, collateral values, changes in nonperforming loans, and other factors. Qualitative factors include the general economic environment in our markets and, in particular, the
45
state of certain industries. Size and complexity of individual credits, loan structure, and pace of portfolio growth are other qualitative factors that are considered in our methodologies.
A detailed discussion of our allowance for loan loss methodology can be found in "Management's Discussion and Analysis of Consolidated Financial Condition and Results of Operations – Allowance for Loan Losses." As we add new products, increase the complexity of our loan portfolio, and expand our geographic coverage, we continue to enhance our methodology to keep pace with the size and complexity of the loan portfolio and changing credit environment. Changes in any of the factors cited above could have a significant impact on the loan loss calculation. We believe that our methodologies continue to be appropriate given our size and level of complexity. This discussion should also be read in conjunction with the Company's consolidated financial statements and the accompanying notes presented elsewhere in this report including the section entitled "Loans and Allowance for Loan Losses."
Other Real Estate Owned
Other real estate owned ("OREO") represents properties acquired through foreclosure or through full or partial satisfaction of loans, is considered held for sale, and is recorded at the lower of cost or estimated fair value at the time of foreclosure. Loan balances in excess of fair value of the real estate acquired at the date of foreclosure are charged against the allowance for loan losses. After foreclosure, valuations are periodically performed as deemed necessary by management and the real estate is carried at the lower of carrying value or fair value less costs to sell. Subsequent declines in the fair value of the OREO below the carrying value are recorded through the use of a valuation allowance by charges to noninterest expense. Any subsequent operating expenses or income of such properties are charged to non-interest expense. If the OREO is sold shortly after it is received in a foreclosure (i.e., the holding period was deemed minimal), the Company substitutes the value received in the sale (net of costs to sell) for the fair value (less costs to sell). Any adjustment made to the loss originally recognized at the time of foreclosure is then charged against or credited to the allowance for loan and lease losses, if deemed material. Otherwise, any declines in value after foreclosure are recorded as gains or losses from the sale or disposition of the real estate. Revenue recognition upon disposition of a property is dependent on the sale having met certain criteria relating to the buyer's initial investment in the property sold.
Loan, OREO and Note Sales
The Bank is able and willing to provide financing for entities purchasing loans or OREO assets from the Bank. Our general guideline is to seek a 30% down payment (as a percentage of the purchase price) from the buyer. We will consider lower down payments when this is not possible, however, accounting rules require certain minimum down payments if these new seller-financing loans are to be considered accrual loans on our books. The minimum down payment varies by the type of underlying real estate collateral. For note sales where we provide financing, in addition to the required adequate down payment, the sales agreements generally call for guarantees or other forms of borrower recourse.
Goodwill Impairment
Under ASC 350 (previously SFAS No. 142, Goodwill and Other Intangibles), goodwill must be allocated to reporting units and tested for impairment. The Company tests goodwill for impairment at least annually or more frequently if events or circumstances, such as adverse changes in the business, indicate that there may be justification for conducting an interim test. Impairment testing is performed at the reporting-unit level (which is the same level as the Company's two major operating segments identified in Note 26 to the Company's consolidated financial statements presented elsewhere in this
46
report). The first part of the test is a comparison, at the reporting unit level, of the fair value of each reporting unit to its carrying value, including goodwill. In order to determine the fair value of the reporting units, a combined income approach and market approach was used. Under the income approach, the Company provided a net income projection and a terminal growth rate was used to calculate the discounted cash flows and the present value of the reporting units. Under the market approach, the fair value was calculated using the current fair values of comparable peer banks of similar size, geographic footprint and focus. The market capitalizations and multiples of these peer banks were used to calculate the market price of the Company and each reporting unit. The fair value was also subject to a control premium adjustment, which is the cost savings that a purchase of the reporting unit could achieve by eliminating duplicative costs. Under the combined income and market approach, the value from each approach was appropriately weighted to determine the fair value. If the fair value is less than the carrying value, then the second part of the test is needed to measure the amount of goodwill impairment. The implied fair value of the reporting unit goodwill is calculated and compared to the actual carrying value of goodwill recorded within the reporting unit. If the carrying value of reporting unit goodwill exceeds the implied fair value of that goodwill, then the Company would recognize an impairment loss for the amount of the difference, which would be recorded as a charge against net income. For additional information regarding goodwill, see Note 12 to the Company's consolidated financial statements presented elsewhere in this report.
Share-Based Compensation
We account for share-based awards to employees, officers, and directors in accordance with the provisions of ASC 505 and ASC 718 (previously SFAS No. 123(R), Share-Based Payment). Share-based compensation cost is measured at the grant date, based on the fair value of the award, and is recognized as expense over the employee's requisite service period. We adopted these standards, as required, on January 1, 2006. Prior to 2006, we recognized stock-based compensation expense for employee share-based awards based on their intrinsic value on the date of grant pursuant to Accounting Principles Board Opinion No. 25, Accounting for Stock Issued to Employees, and followed the disclosure requirements of SFAS No. 123, Accounting for Stock-Based Compensation.
We adopted ASC 505 and ASC 718 using the modified prospective approach. Under the modified prospective approach, prior periods are not restated for comparative purposes. The valuation provisions of these standards apply to new awards and to awards that are outstanding on the effective date and subsequently modified, repurchased or cancelled. Compensation expense, net of estimated forfeitures, for awards outstanding at the effective date is recognized over the remaining service period using the compensation cost calculated for pro forma disclosures under the original SFAS No. 123.
We grant nonqualified stock options and restricted stock. Most of our stock option and restricted stock awards include a service condition that relates only to vesting. The stock option awards generally vest in one to four years from the grant date, while the restricted stock awards generally vest in three to five years from the date of grant. Compensation expense is amortized on a straight-line basis over the requisite service period for the entire award, which is generally the maximum vesting period of the award.
We use an option-pricing model to determine the grant-date fair value of our stock options which is affected by assumptions regarding a number of complex and subjective variables. These methods used to determine these variables are generally similar to the methods used prior to 2006 for the purposes of our pro forma disclosures under SFAS No. 123. We make assumptions regarding expected term, expected volatility, expected dividend yield, and risk-free interest rate in determining the fair value of our stock options. The expected term represents the weighted-average period that stock options are expected to remain outstanding. The expected term assumption is estimated based on the
47
stock options' vesting terms and remaining contractual life and employees' historical exercise behavior. The expected volatility is based on the historical volatility of our common stock over a period of time equal to the expected term of the stock options. The dividend yield assumption is based on the Company's current dividend payout rate on its common stock. For the risk-free interest rate assumption is based upon the U.S. Treasury yield curve in effect at the time of grant appropriate for the term of the employee stock options.
For restricted share awards, the grant-date fair value is measured at the fair value of the Company's common stock as if the restricted share was vested and issued on the date of grant.
As share-based compensation expense is based on awards ultimately expected to vest, it is reduced for estimated forfeitures. Forfeitures are estimated at the time of grant and revised, if necessary, in subsequent periods if actual forfeitures differ from those estimates. Share-based compensation is discussed in more detail in Notes 1 and 22 to the Company's consolidated financial statements presented elsewhere in this report.
UCB Acquisition
On November 6, 2009 the Bank acquired certain assets and assumed certain liabilities of United Commercial Bank from the FDIC in an FDIC-assisted transaction. As part of the Purchase and Assumption Agreement, the Bank and the FDIC entered into a shared-loss agreement, whereby the FDIC will cover a substantial portion of any future losses on loans (and related unfunded loan commitments), OREO and accrued interest on loans for up to 90 days. We refer to the acquired loans and OREO subject to the shared-loss agreement collectively as "covered assets." Under the terms of the our shared-loss agreement, the FDIC will absorb 80% of losses and share in 80% of loss recoveries on the first $2.05 billion on covered loans and absorb 95% of losses and share in 95% of loss recoveries exceeding $2.05 billion. The shared-loss agreement for commercial and single family residential mortgage loans is in effect for 5 years and 10 years, respectively, from the November 6, 2009 acquisition date and the loss recovery provisions are in effect for 8 years and 10 years, respectively, from the acquisition date.
The Bank purchased assets with fair value of approximately $5.90 billion in loans, $599.0 million of cash and cash equivalents, $147.4 million in securities purchased under sale agreements, $1.56 billion in investment securities and $207.6 million of other assets of United Commercial Bank from the FDIC. The Bank also assumed liabilities with fair values of $6.53 billion of deposits, $1.84 billion in Federal Home Loan Bank advances, $858.2 million of securities sold under repurchase agreements, other borrowings of $90.6 million and $254.2 million of other liabilities of United Commercial Bank from the FDIC. United Commercial Bank was a full service commercial bank headquartered in San Francisco, California that operated 63 branch locations in the U.S. We made this acquisition to expand our presence domestically, primarily in the State of California.
The assets acquired and liabilities assumed have been accounted for under the acquisition method of accounting (formerly the purchase method). The assets and liabilities, both tangible and intangible, were recorded at their estimated fair values as of the November 6, 2009 acquisition date. The application of the acquisition method of accounting resulted in a net after-tax gain of $291.5 million.
See Note 2, Business Combinations, to the Company's consolidated financial statements presented elsewhere in this report.
48
Overview
The Company returned to profitability in 2009, with net earnings for the full year of $76.6 million. The Company's return to profitability came as a result of a pre-tax gain of $471.0 million recorded in the fourth quarter of 2009 from the acquisition of United Commercial Bank in November 2009 and despite the year-to-date loan loss provision of $528.7 million. Our return to profitability for 2009 follows a single loss year in 2008 – the only loss year for East West in nearly 30 years. Prior to 2008, East West achieved record earnings every year for over a decade, with net income of $161.2 million in 2007 and $143.4 million in 2006.
In 2009, we raised a total $588.6 million, net of costs in capital primarily through the issuance of $335.0 million in Series C Preferred Shares and $272.8 million in common stock. These issuances of preferred and common stock have bolstered our capital ratios well above regulatory minimum as well as "well-capitalized" thresholds for banks. As of December 31, 2009, our total risk-based capital ratio was 19.8% or $1.1 billion more than the 10.0% regulatory requirement for well-capitalized banks. Our Tier 1 risk-based capital ratio of 17.9% and our Tier 1 leverage ratio of 11.7% as of December 31, 2009 also significantly exceeded regulatory guidelines for "well-capitalized" banks. Our tangible equity to tangible assets ratio was 9.2% at December 31, 2009, compared to 9.9% as of December 31, 2008.
Similarly, our liquidity position has also been considerably strengthened. At December 31, 2009, we increased our total borrowing capacity and holdings of cash and short-term investments to $4.24 billion, compared to $3.34 billion at December 31, 2008. As of December 31, 2009, we had $1.34 billion in cash and short-term investments and approximately $2.9 billion in available borrowing capacity from various sources including the FHLB, the FRB, repurchase agreements, and federal funds facilities with several financial institutions. Our combined borrowing capacity and cash holdings represent 20.6% of total assets and 28.3% of total deposits as of December 31, 2009. Due primarily to our acquisition of United Commercial Bank, we also experienced an 84%, or $6.85 billion, increase in deposits during 2009, with total deposits increasing to $14.99 billion as of December 31, 2009, compared with $8.14 billion as of December 31, 2008. Our continued efforts to deleverage our balance sheet resulted in a lower loan to deposit ratio of 93.8% at December 31, 2009, compared to 96.8% at September 30, 2009 and 101% at December 31, 2008. We believe that our liquidity position is sufficient to meet our operating expenses, borrowing needs and other obligations.
Non-covered nonperforming assets totaled $296.1 million representing 1.44% of total assets at December 31, 2009. This is a decrease from $230.2 million or 1.84% of total assets at September 30, 2009 and $263.9 million or 2.12% of total assets at December 31, 2008. Nonperforming assets as of December 31, 2009 are comprised of nonaccrual loans totaling $173.2 million, OREO totaling $13.8 million, and loans modified or restructured amounting to $109.1 million.
Covered nonperforming assets totaled $719.9 million, representing 3.50% of total assets at December 31, 2009. These covered nonperforming assets are subject to the shared-loss agreement with the FDIC.
During 2009, we continued to build on measures and initiatives that we undertook throughout 2008 in order to identify, quantify, and reduce our exposure to problem loans. During 2009, we lowered total commitments on land and construction loans by $1.31 billion, significantly reducing our overall exposure to these sectors of our loan portfolio which have been most impacted by the downturn in the real estate market. As of December 31, 2009, outstanding balances on land and construction loans totaled only 9.5% of total gross loans.
49
At December 31, 2009, our allowance for loan losses amounted to $238.9 million or 2.81% of total gross non-covered loans. In comparison, the allowance for loan losses totaled $178.0 million or 2.16% of total gross loans as of December 31, 2008. Partly as a consequence of the actions that we took to identify and manage our problem loans, we recorded $528.7 million in loan loss provisions during 2009. Total net chargeoffs amounted to $475.3 million during 2009, representing 5.69% of average non-covered loans during 2009. This compares to $141.4 million, representing 1.64% of average loans during 2008. Approximately 65%, or $309.5 million, of the total net chargeoffs recorded during 2009 were related to land and construction loans.
The allowance for loan loss increased during the year due to the significant increase in the loan loss provision during 2009, especially during the first three quarters of 2009 reflecting our elevated charge-off levels as we continue to manage down our exposure to nonaccrual loans, delinquent loans and OREO. We continued to sustain higher charge-off activities and loan loss provision in our land and residential construction loans that were caused by the sustained weakness in the real estate market.
Also, as we continued to reduce our exposure to problem loans, we had to sell problem loans which resulted in charges against the allowance for loan losses and therefore increases in our loan loss provision. However, both the provision and net charge-offs peaked in the third quarter of 2009 resulting in a lower loan loss provision during the fourth quarter of 2009 as compared to the third quarter of 2009. Given the trend we are seeing in the loan portfolio, it is expected that the provision for loan losses and net charge-offs will continue to decrease throughout 2010.
Based on management's evaluation and analysis of portfolio credit quality and prevailing economic conditions, we believe the allowance for loan losses is adequate for losses inherent in the loan portfolio as of December 31, 2009.
Despite a sizeable loss provision recorded during 2009, the Company was profitable during the year. The $76.6 million net income that we recorded during 2009 includes $528.7 million in loan loss provisions, $107.7 million in OTTI charges on investment securities and a pre-tax gain of $471.0 million from the UCB Acquisition.
Net interest income increased 36.1% to $483.3 million during 2009, compared with $355.2 million in 2008. Our net interest margin increased 56 basis points to 3.75% during 2009. This compares with 3.19% during the same period in 2008. Relative to 2008, our net interest margin during 2009 increased primarily as the result of the yield adjustment on covered loans during the fourth quarter of 2009. Excluding the yield adjustment related to the FDIC covered loans, our net interest margin decreased 29 basis points compared to 2008, primarily due to the sharp decline in interest rates prompted by several consecutive Federal Reserve rate cuts, reversal of interest from nonaccrual loans and increases in our core deposit base.
Excluding the non-cash OTTI charges on investment securities, gain from the UCB Acquisition, and decrease in FDIC indemnification asset amounting to $340 million, total noninterest income increased 18% to $56.6 million during 2009, compared with $48.1 million for 2008. This increase is primarily due to net gain on investment securities available-for-sale and loan fees. These increases were complemented by higher net gain on sale of investment securities and branch-related revenues earned during 2009. Core noninterest income, which excludes the impact of non-cash OTTI charges, as well as net gains on sales of investment securities, loans and the gain on the UCB Acquisition, was $44.6 million during 2009, compared to $36.8 million during the same period last year. Core noninterest income is a non-GAAP disclosure. The Company uses certain non-GAAP financial measures to provide supplemental information regarding the Company's performance to provide additional disclosure. The Company believes that presenting core noninterest income provides more
50
clarity to the users of financial statements regarding the Company's core business operations. See table below.
Table 1: Non-GAAP Table – Core Noninterest Income
| Description | December 31, 2009 | December 31, 2008 | ||||||||||||||
|---|---|---|---|---|---|---|---|---|---|---|---|---|---|---|---|---|
| |
(In thousands) |
|||||||||||||||
Noninterest Income |
$ | 396,553 | $ | (25,062 | ) | |||||||||||
Less: Gain on acquisition of United Commercial Bank |
(471,009 | ) | - | |||||||||||||
Impairment loss on other investment securities |
107,671 | 73,165 | ||||||||||||||
Decrease in FDIC indemnification asset and FDIC receivable |
23,338 | |||||||||||||||
Net Adjustments |
(340,000 | ) | 73,165 | |||||||||||||
Normalized noninterest income |
56,553 | 48,103 | ||||||||||||||
Less: Gain on investment securities |
(11,923 | ) | (9,005 | ) | ||||||||||||
Gain on sales of loans |
- | (2,275 | ) | |||||||||||||
Net Adjustments |
(11,923 | ) | (11,280 | ) | ||||||||||||
Core noninterest income (Non-GAAP) |
$ | 44,630 | $ | 36,823 | ||||||||||||
Total noninterest expense increased 22% to $246.5 million during 2009, compared with $201.3 million for the same period in 2008. The increase in total noninterest expense during 2009, relative to 2008, can be attributed predominantly to higher deposit insurance premiums and regulatory assessments, higher OREO expenses, increase in amortization of investments in affordable housing partnerships and higher outside professional service expenses. Our efficiency ratio, which represents noninterest expense (excluding amortization and impairment writedowns on intangible assets and amortization of investments in affordable housing partnerships) divided by the aggregate of net interest income before provision for loan losses and noninterest income, was 48.89% during 2009 compared with 45.94% for 2008.
Total consolidated assets at December 31, 2009 increased 65% to a record $20.56 billion, compared with $12.42 billion at December 31, 2008. The net increase in total assets is comprised predominantly of an increase in covered loans receivable of $5.60 billion and an FDIC indemnification asset and receivable of $1.26 billion resulting from the UCB Acquisition. In addition, there were increases in cash and due from banks of $440.5 million, securities purchased under resale agreements of $177.4 million, and available-for-sale investment securities of $523.9 million. Total liabilities increased 69% to $18.32 billion as of December 31, 2009, compared to $10.87 billion as of December 31, 2008. The net increase in liabilities is primarily due to increases in total deposits of $6.85 billion and FHLB advances of $452.1 million.
Total average assets increased 17% to $13.84 billion in 2009, compared to $11.80 billion in 2008 due primarily to the growth in average short-term investments, average investment securities and average loans. The increase in average short-term investments and investment securities can be attributed to proceeds received in conjunction with our issuance of Series B preferred stock during December 2008. The increase in average loans is due to the covered loans acquired in the United Commercial Bank acquisition. Total average deposits rose 30% during 2009 to $7.98 billion, compared to $6.14 billion for 2008, with the most significant contribution coming from time deposits and money market accounts.
On January 26, 2010, the Board of Directors declared first quarter 2010 dividends on our common stock and Series A preferred stock. The common stock dividend of $0.01 per share is payable
51
on or about February 24, 2010 to stockholders of record on February 10, 2010. The dividend on the Series A Preferred Stock of $20 per share is payable on February 1, 2010 to shareholders of record on January 15, 2010.
Results of Operations
Net income after extraordinary items for 2009 totaled $76.6 million, compared with a net loss of $49.7 million for 2008 and net income of $161.2 million for 2007. Results in 2009 include the acquisition of United Commercial Bank on November 6, 2009. See table below for United Commercial Bank's contribution to the Company's 2009 results of operations. These amounts exclude the pre-tax bargain purchase gain of $471.0 million and the discount accretion related to both the covered loans and FDIC indemnification asset recorded during the fourth quarter. On a per diluted share basis, net income (loss) was $0.33, ($0.94) and $2.60 for 2009, 2008 and 2007, respectively. During 2009, our operating results were significantly impacted by $528.7 million in loan loss provisions, $107.7 million in total non-cash OTTI investment securities charges and a pre-tax gain of $471.0 million from the FDIC assisted acquisition of United Commercial Bank. Our return on average total assets increased to 0.55% in 2009, compared with (0.42%) in 2008 and 1.45% in 2007. Our return on average total stockholders' equity also increased to 4.69% in 2009, compared with (3.99%) in 2008 and 14.89% in 2007.
Table 2: United Commercial Bank Results
| |
UCB | |||||
|---|---|---|---|---|---|---|
| |
November 7, 2009 – December 31, 2009 |
|||||
| |
(In thousands) |
|||||
Interest Income |
$ | 52,442 | ||||
Interest Expense |
13,427 | |||||
Net Interest Margin |
39,015 | |||||
Noninterest Income |
6,390 | |||||
Noninterest Expense: |
||||||
Compensation and employee benefits |
12,232 | |||||
Other noninterest expense |
9,895 | |||||
Total Noninterest expense |
22,127 | |||||
Income before income taxes |
$ | 23,278 | ||||
52
Table 3: Components of Net Income (Loss)
| |
Year Ended December 31, | ||||||||||
|---|---|---|---|---|---|---|---|---|---|---|---|
| |
2009 | 2008 | 2007 | ||||||||
| |
(In millions) |
||||||||||
Net interest income |
$ | 483.3 | $ | 355.2 | $ | 408.0 | |||||
Provision for loan losses |
(528.7 | ) | (226.0 | ) | (12.0 | ) | |||||
Noninterest income (loss) |
396.6 | (25.1 | ) | 49.5 | |||||||
Noninterest expense |
(246.5 | ) | (201.3 | ) | (183.2 | ) | |||||
(Provision) benefit for income taxes |
(22.7 | ) | 47.5 | (101.1 | ) | ||||||
Net income (loss) before extraordinary items |
82.0 | (49.7 | ) | 161.2 | |||||||
Extraordinary item |
5.4 | - | - | ||||||||
Net income (loss) after extraordinary items |
$ | 76.6 | $ | (49.7 | ) | $ | 161.2 | ||||
Return on average total assets |
0.55 | % | -0.42 | % | 1.45 | % | |||||
Return on average common equity |
2.37 | % | -5.41 | % | 14.89 | % | |||||
Return on average total equity |
4.69 | % | -3.99 | % | 14.89 | % | |||||
Net Interest Income
Our primary source of revenue is net interest income, which is the difference between interest earned on loans, investment securities and other earning assets less the interest expense on deposits, borrowings and other interest-bearing liabilities. Net interest income in 2009 totaled $483.3 million, a 36% increase over net interest income of $355.2 million in 2008. Comparing 2008 to 2007, net interest income decreased 13% to $355.2 million, as compared to $408.0 million in 2007.
Net interest margin, defined as net interest income divided by average earning assets, increased 56 basis points to 3.75% during 2009, from 3.19% during 2008. The increase in the net interest margin was primarily the result of the yield adjustment on covered loans during the fourth quarter of 2009. Excluding the one time yield adjustment, our net interest margin decreased 2 basis points compared to 2008, primarily due to the decline in interest rates prompted by several Federal Reserve rate cuts, reversal of interest from nonaccrual loans, and increase in our core deposit base. Comparing 2008 to 2007, our net interest margin decreased by 75 basis points to 3.19% during 2008, compared to 3.94% during 2007.
53
The following table presents the net interest spread, net interest margin, average balances, interest income and expense, and the average yields and rates by asset and liability component for the years ended December 31, 2009, 2008 and 2007:
Table 4: Summary of Selected Financial Data
| |
Year Ended December 31, | |||||||||||||||||||||||||||||
|---|---|---|---|---|---|---|---|---|---|---|---|---|---|---|---|---|---|---|---|---|---|---|---|---|---|---|---|---|---|---|
| |
2009 | 2008 | 2007 | |||||||||||||||||||||||||||
| |
Average Balance |
Interest | Average Yield Rate |
Average Balance |
Interest | Average Yield Rate |
Average Balance |
Interest | Average Yield Rate |
|||||||||||||||||||||
| |
(Dollars in thousands) |
|||||||||||||||||||||||||||||
ASSETS |
||||||||||||||||||||||||||||||
Interest-earning assets: |
||||||||||||||||||||||||||||||
Short-term investments |
$ | 881,282 | $ | 9,047 | 1.03 | % | $ | 286,650 | $ | 7,029 | 2.45 | % | $ | 7,748 | $ | 375 | 4.84 | % | ||||||||||||
Securities purchased under resale agreements |
89,883 | 7,985 | 8.76 | % | 70,246 | 6,811 | 9.67 | % | 192,883 | 15,593 | 8.08 | % | ||||||||||||||||||
Investment securities (3)(4) |
||||||||||||||||||||||||||||||
Taxable |
2,541,832 | 115,446 | 4.54 | % | 2,001,089 | 98,217 | 4.91 | % | 1,693,236 | 100,218 | 5.92 | % | ||||||||||||||||||
Tax-exempt (1) |
27,960 | 1,242 | 4.44 | % | 44,708 | 3,256 | 7.28 | % | 34,725 | 2,923 | 8.42 | % | ||||||||||||||||||
Loans receivable (3)(5) |
8,355,825 | 452,019 | 5.41 | % | 8,601,825 | 545,260 | 6.32 | % | 8,354,989 | 650,717 | 7.79 | % | ||||||||||||||||||
Loans receivable – covered (2) |
877,029 | 135,144 | 15.41 | % | - | - | - | - | - | - | ||||||||||||||||||||
FHLB and FRB stock |
137,001 | 2,337 | 1.71 | % | 115,370 | 5,175 | 4.47 | % | 84,470 | 4,581 | 5.42 | % | ||||||||||||||||||
Total interest-earning assets |
12,910,812 | 723,220 | 5.60 | % | 11,119,888 | 665,748 | 5.97 | % | 10,368,051 | 774,407 | 7.47 | % | ||||||||||||||||||
Noninterest-earning assets: |
||||||||||||||||||||||||||||||
Cash and due from banks |
147,694 | 137,730 | 156,081 | |||||||||||||||||||||||||||
Allowance for loan losses |
(216,775 | ) | (144,154 | ) | (80,161 | ) | ||||||||||||||||||||||||
Other assets |
997,214 | 689,323 | 635,799 | |||||||||||||||||||||||||||
Total assets |
$ | 13,838,945 | $ | 11,802,787 | $ | 11,079,770 | ||||||||||||||||||||||||
LIABILITIES AND STOCKHOLDERS' EQUITY |
||||||||||||||||||||||||||||||
Interest-bearing liabilities: |
||||||||||||||||||||||||||||||
Checking accounts |
$ | 398,619 | $ | 1,507 | 0.38 | % | $ | 404,404 | $ | 3,226 | 0.80 | % | $ | 412,550 | $ | 6,646 | 1.61 | % | ||||||||||||
Money market accounts |
2,035,821 | 25,583 | 1.26 | % | 1,099,576 | 25,805 | 2.34 | % | 1,302,898 | 53,021 | 4.07 | % | ||||||||||||||||||
Savings deposits |
506,706 | 3,322 | 0.66 | % | 452,259 | 4,148 | 0.91 | % | 412,272 | 4,400 | 1.07 | % | ||||||||||||||||||
Time deposits less than $100,000 |
1,499,076 | 32,073 | 2.14 | % | 1,164,622 | 35,061 | 3.00 | % | 956,203 | 37,164 | 3.89 | % | ||||||||||||||||||
Time deposits $100,000 or greater |
3,538,046 | 66,992 | 1.89 | % | 3,018,876 | 109,820 | 3.63 | % | 2,862,017 | 139,804 | 4.88 | % | ||||||||||||||||||
Federal funds purchased |
2,379 | 9 | 0.37 | % | 89,309 | 2,217 | 2.48 | % | 173,103 | 8,779 | 5.07 | % | ||||||||||||||||||
FHLB advances |
1,333,846 | 52,310 | 3.92 | % | 1,592,125 | 70,661 | 4.43 | % | 1,230,940 | 61,710 | 5.01 | % | ||||||||||||||||||
Securities sold under repurchase agreements |
1,027,665 | 49,725 | 4.77 | % | 1,000,332 | 46,062 | 4.59 | % | 978,739 | 38,485 | 3.93 | % | ||||||||||||||||||
Long-term debt |
235,570 | 7,816 | 3.27 | % | 235,570 | 12,694 | 5.37 | % | 211,364 | 15,603 | 7.38 | % | ||||||||||||||||||
Other borrowings |
12,311 | 162 | 1.32 | % | - | - | - | - | - | - | ||||||||||||||||||||
Total interest-bearing liabilities |
10,590,039 | 239,499 | 2.26 | % | 9,057,073 | 309,694 | 3.41 | % | 8,540,086 | 365,612 | 4.28 | % | ||||||||||||||||||
Nonnterest-bearing liabilities: |
||||||||||||||||||||||||||||||
Demand deposits |
1,459,871 | 1,362,617 | 1,312,709 | |||||||||||||||||||||||||||
Other liabilities |
154,138 | 137,320 | 144,414 | |||||||||||||||||||||||||||
Stockholders' equity |
1,634,897 | 1,245,777 | 1,082,561 | |||||||||||||||||||||||||||
Total liabilities and stockholders' equity |
$ | 13,838,945 | $ | 11,802,787 | $ | 11,079,770 | ||||||||||||||||||||||||
Interest rate spread |
3.34 | % | 2.56 | % | 3.19 | % | ||||||||||||||||||||||||
Net interest income and net interest margin |
$ | 483,721 | 3.75 | % | $ | 356,054 | 3.19 | % | $ | 408,795 | 3.94 | % | ||||||||||||||||||
- (1)
- Amounts calculated on a full taxable equivalent basis using the current statutory federal tax rate. Total interest income and average yield rate on an unadjusted basis for tax-exempt investment securities available-for-sale is $842 thousand and 3.0% for the twelve months ended December 31, 2009. Total interest income and average yield rate on an unadjusted basis for tax-exempt investment securities available-for-sale is $2.4 million and 5.3% for the twelve months ended December 31, 2008. Total interest income and average yield rate on an unadjusted basis for tax-exempt investment securities available-for-sale is $2.1 million and 6.1% for the twelve months ended December 31, 2007.
- (2)
- Amounts include yield adjustment of $74,439 from discount accretion on early prepayments.
- (3)
- Includes amortization of premiums and accretion of discounts on investment securities and loans receivable totaling $(5.5) million, $(7.4) million, and $(3.3) million for the years ended December 31, 2009, 2008, and 2007, respectively. Also includes the amortization of deferred loan fees totaling $255 thousand and $5.4 million for the years ended December 31, 2008 and 2007, respectively. There was no amortization of deferred loan fees for 2009.
- (4)
- Average balances exclude unrealized gains or losses on available-for-sale securities.
- (5)
- Average balances include nonperforming loans.
54
Analysis of Changes in Net Interest Income
Changes in our net interest income are a function of changes in rates and volumes of both interest-earning assets and interest-bearing liabilities. The following table sets forth information regarding changes in interest income and interest expense for the years indicated. The total change for each category of interest-earning asset and interest-bearing liability is segmented into the change attributable to variations in volume (changes in volume multiplied by old rate) and the change attributable to variations in interest rates (changes in rates multiplied by old volume). Nonaccrual loans are included in average loans used to compute this table.
Table 5: Analysis of Changes in Net Interest Income
| |
Year Ended December 31, | |||||||||||||||||||
|---|---|---|---|---|---|---|---|---|---|---|---|---|---|---|---|---|---|---|---|---|
| |
2009 vs. 2008 | 2008 vs. 2007 | ||||||||||||||||||
| |
|
Changes Due to | |
Changes Due to | ||||||||||||||||
| |
Total Change |
Total Change |
||||||||||||||||||
| |
Volume (1) | Rate (1) | Volume (1) | Rate (1) | ||||||||||||||||
| |
(In thousands) |
|||||||||||||||||||
INTEREST-EARNING ASSETS: |
||||||||||||||||||||
Short-term investments |
$ | 2,017 | $ | 7,933 | $ | (5,916 | ) | $ | 6,654 | $ | 6,929 | $ | (275 | ) | ||||||
Securities purchased under resale agreements |
1,174 | 1,765 | (591 | ) | (8,782 | ) | (11,419 | ) | 2,637 | |||||||||||
Investment securities |
||||||||||||||||||||
Taxable |
17,229 | 34,465 | (17,236 | ) | (2,001 | ) | 16,794 | (18,795 | ) | |||||||||||
Tax-exempt (2) |
(2,014 | ) | (409 | ) | (1,605 | ) | 333 | 763 | (430 | ) | ||||||||||
Loans receivable |
(93,241 | ) | (15,426 | ) | (77,815 | ) | (105,457 | ) | 18,734 | (124,191 | ) | |||||||||
Loans receivable – covered |
135,144 | 135,144 | - | - | - | - | ||||||||||||||
FHLB and FRB stock |
(2,838 | ) | 825 | (3,663 | ) | 594 | 1,479 | (885 | ) | |||||||||||
Total interest and dividend income |
$ | 57,471 | $ | 164,297 | $ | (106,826 | ) | $ | (108,659 | ) | $ | 33,280 | $ | (141,939 | ) | |||||
INTEREST-BEARING LIABILITIES: |
||||||||||||||||||||
Checking accounts |
$ | (1,719 | ) | $ | (46 | ) | $ | (1,673 | ) | $ | (3,420 | ) | $ | (129 | ) | $ | (3,291 | ) | ||
Money market accounts |
(222 | ) | 15,294 | (15,516 | ) | (27,216 | ) | (7,331 | ) | (19,885 | ) | |||||||||
Savings deposits |
(826 | ) | 453 | (1,279 | ) | (252 | ) | 402 | (654 | ) | ||||||||||
Time deposits less than $100,000 |
(2,988 | ) | 8,551 | (11,539 | ) | (2,103 | ) | 7,203 | (9,306 | ) | ||||||||||
Time deposits $100,000 or greater |
(42,828 | ) | 16,373 | (59,201 | ) | (29,984 | ) | 7,317 | (37,301 | ) | ||||||||||
Federal funds purchased |
(2,208 | ) | (1,181 | ) | (1,027 | ) | (6,562 | ) | (3,194 | ) | (3,368 | ) | ||||||||
FHLB advances |
(18,351 | ) | (10,780 | ) | (7,571 | ) | 8,951 | 16,614 | (7,663 | ) | ||||||||||
Securities sold under repurchase agreements |
3,663 | 1,235 | 2,428 | 7,577 | 866 | 6,711 | ||||||||||||||
Subordinated debt and trust preferred securities |
(4,878 | ) | - | (4,878 | ) | (2,909 | ) | 1,643 | (4,552 | ) | ||||||||||
Other borrowings |
162 | 162 | - | - | - | - | ||||||||||||||
Total interest expense |
$ | (70,195 | ) | $ | 30,061 | $ | (100,256 | ) | $ | (55,918 | ) | $ | 23,391 | $ | (79,309 | ) | ||||
CHANGE IN NET INTEREST INCOME |
$ | 127,666 | $ | 134,236 | $ | (6,570 | ) | $ | (52,741 | ) | $ | 9,889 | $ | (62,630 | ) | |||||
- (1)
- Changes in interest income/expense not arising from volume or rate variances are allocated proportionately to rate and volume.
- (2)
- Amounts calculated on a fully taxable equivalent basis using the current statutory federal tax rate. Total change on an unadjusted basis for tax-exempt investment securities is $(1.5) million, and total changes due to volume and rates on an unadjusted basis for tax-exempt investment securities is $(357) thousand and $(1.2) million for 2009 vs. 2008. For 2008 vs. 2007, total change on an unadjusted basis for tax-exempt investment securities available-for-sale is $242 thousand, and total changes due to volume and rates on an unadjusted basis for tax-exempt investment securities available-for-sale is $554 thousand and $(312) thousand.
Provision for Loan Losses
The provision for loan losses amounted to $528.7 million for 2009, compared to $226.0 million for 2008 and $12.0 million for 2007. The increase in loan loss provisions during 2009 reflects our
55
elevated chargeoff levels as we managed down our problem assets with sizable reductions in nonaccrual loans, delinquent loans, and OREO. We sustained higher chargeoff activity and increased loan loss provisions on our land, residential construction, and commercial construction loans during 2009 due to the continued weakness in the real estate market. Total net chargeoffs amounted to $475.3 million during 2009, representing 5.69% of average non-covered loans during 2009. This compares to $141.4 million, representing 1.64% of average loans during 2008. Approximately 65%, or $309.5 million, of total net chargeoffs recorded during 2009 were related to land and construction loans. During 2009, we took proactive measures to reduce our exposure to land and construction loans. As a result of these efforts, total construction loan commitments and land loans declined by $1.31 billion as of December 31, 2009 relative to year-end 2008. We continue to aggressively monitor delinquencies and proactively review the credit risk exposure of our loan portfolio to minimize and mitigate potential losses. Also during the year we had note sale proceeds of $358.4 million on notes with a carrying value of $473.7 million. The difference between the carrying value and the sale amount was charged against the allowance for loan losses.
Comparing 2008 to 2007, the increase in loan loss provisions during 2008 reflects our increased chargeoff levels, our higher volume of classified and nonperforming loans caused by challenging conditions in the real estate housing market, turmoil in the financial markets, as well as recessionary pressures in the overall economic environment.
Provisions for loan losses are charged to income to bring the allowance for credit losses as well as the allowance for unfunded loan commitments, off-balance sheet credit exposures, and recourse provisions to a level deemed appropriate by the Company based on the factors discussed under the "Allowance for Loan Losses" section of this report.
Noninterest Income (Loss)
Table 6: Components of Noninterest Income (Loss)
| |
2009 | 2008 | 2007 | ||||||||
|---|---|---|---|---|---|---|---|---|---|---|---|
| |
(In millions) |
||||||||||
Gain on acquisition of UCB |
$ | 471.01 | $ | - | $ | - | |||||
Impairment writedown on investment securities |
(107.67 | ) | (73.17 | ) | (0.41 | ) | |||||
Decrease in FDIC indemnification assets |
(23.34 | ) | - | - | |||||||
Branch fees |
22.32 | 16.97 | 15.07 | ||||||||
Net gain on investment securities available-for-sale |
11.92 | 9.01 | 7.83 | ||||||||
Letters of credit fees and commissions |
8.34 | 9.74 | 10.25 | ||||||||
Ancillary loan fees |
6.29 | 4.65 | 5.77 | ||||||||
Income from life insurance policies |
4.37 | 4.15 | 4.16 | ||||||||
Net gain on sale of loans |
- | 2.28 | 1.57 | ||||||||
Other operating income |
3.31 | 1.31 | 5.28 | ||||||||
Total |
$ | 396.55 | $ | (25.06 | ) | $ | 49.52 | ||||
Noninterest income (loss) includes revenues earned from sources other than interest income. These sources include service charges and fees on deposit accounts, fees and commissions generated from trade finance activities and the issuance of letters of credit, ancillary fees on loans, net gains on sales of loans, investment securities available-for-sale, and other assets, impairment writedowns on investment securities and other assets, and other noninterest-related revenues.
56
Our recorded noninterest income of $396.6 million during 2009 was primarily due to a pre-tax gain of $471.0 million from the FDIC-assisted acquisition of United Commercial Bank partially offset by non-cash OTTI charges on our available-for-sale securities portfolio. In comparison, we recorded a noninterest loss of $(25.1) million during 2008. Excluding the pre-tax gain of $471.0 million from the FDIC-assisted acquisition, the $23.3 decrease in the FDIC indemnification asset and the non-cash OTTI charges on investment securities totaling $107.7 million in 2009 and $73.2 million in 2008, total noninterest income increased to $56.5 million during 2009, compared with $48.1 million for the corresponding period in 2008. The $107.7 impairment charge recorded during 2009 was related to credit-related impairment loss on our trust preferred securities recorded pursuant to the provisions of ASC 320-10-65 which the Company implemented during the first quarter of 2009.
Branch fees, which represent revenues derived from branch operations, totaled $22.3 million in 2009, representing a 32% increase from the $17.0 million earned in 2008. The increase in branch-related fee income during 2009 can be attributed primarily to higher revenues from service and transaction charges on deposit accounts.
Letters of credit fees and commissions, which represent revenues from trade finance operations as well as fees related to the issuance and maintenance of standby letters of credit, decreased 14% to $8.3 million in 2009, from $9.7 million in 2008. The decrease in letters of credit fees and commissions for both periods is primarily due to the decline in the volume of standby letters of credit during 2009 relative to the prior year as well as a decrease in commissions generated from trade finance activities due to the downturn in the economy.
Net gain on sales of investment securities available-for-sale increased to $11.9 million during 2009 compared with $9.0 million in 2008. The proceeds from the sale of investment securities during 2009 provided additional liquidity to purchase additional high credit quality investment securities and short-term investments as well as pay down our borrowings.
Ancillary loan fees consist of revenues earned from the servicing of mortgages, fees related to the monitoring and disbursement of construction loan proceeds, and other miscellaneous loan income. Ancillary loan fees increased 35% to $6.3 million in 2009, compared to $4.6 million in 2008. The increase in ancillary loan fees during 2009 is primarily due to the impairment provision on mortgage servicing assets that amounted to $1.1 million in 2009, as compared to $2.4 million impairment writedown in 2008.
Other operating income, which includes insurance commissions and insurance-related service fees, rental income, and other miscellaneous income, increased 152% to $3.3 million in 2009, compared to $1.3 million in 2008.
Comparing 2008 to 2007, our recorded noninterest loss of $(25.1) million during 2008 was primarily due to non-cash OTTI charges on our available-for-sale securities portfolio. In comparison, we recorded noninterest income of $49.5 million during 2007. Excluding the non-cash OTTI charges on investment securities totaling $73.2 million in 2008 and $405 thousand in 2007, total noninterest income slightly decreased to $48.1 million during 2008, compared with $49.9 million for the corresponding period in 2007. A large portion of the OTTI charges recorded during 2008, or approximately $55.3 million, was related to Fannie Mae and Freddie Mac preferred securities, with the remaining $17.9 million related to certain trust preferred debt and equity securities. The $405 thousand impairment charge recorded during 2007 was related to a trust preferred debt security.
57
Noninterest Expense
Table 7: Components of Noninterest Expense
| |
2009 | 2008 | 2007 | ||||||||
|---|---|---|---|---|---|---|---|---|---|---|---|
| |
(In millions) |
||||||||||
Compensation and employee benefits |
$ | 79.47 | $ | 82.24 | $ | 85.93 | |||||
Occupancy and equipment expense |
30.22 | 26.99 | 25.58 | ||||||||
Amortization and impairments of investments in affordable housing partnerships |
13.05 | 7.27 | 4.96 | ||||||||
Amortization and impairment writedowns of premiums on deposits acquired |
5.90 | 7.27 | 6.85 | ||||||||
Deposit insurance premiums and regulatory assessments |
28.07 | 7.22 | 1.40 | ||||||||
Loan related expense |
7.58 | 6.37 | 3.05 | ||||||||
Other real estate owned expense (income) |
19.10 | 6.01 | (1.24 | ) | |||||||
Legal expense |
8.02 | 5.58 | 3.20 | ||||||||
Data processing |
5.64 | 4.49 | 4.82 | ||||||||
Deposit-related expenses |
3.91 | 4.41 | 6.77 | ||||||||
Consulting expense |
8.14 | 4.40 | 3.32 | ||||||||
Other operating expenses |
37.38 | 39.02 | 38.62 | ||||||||
Total noninterest expense |
$ | 246.48 | $ | 201.27 | $ | 183.26 | |||||
Efficiency Ratio (1) |
48.89 | % | 45.94 | % | 37.44 | % | |||||
- (1)
- Represents noninterest expense, excluding the amortization of intangibles, amortization and impairment writedowns of premiums on deposits acquired, impairment writedown on goodwill, and investments in affordable housing partnerships, divided by the aggregate of net interest income before provision for loan losses and noninterest income, excluding impairment writedowns on investment securities.
Noninterest expense, which is comprised primarily of compensation and employee benefits, occupancy and other operating expenses increased 22% to $246.5 million during 2009, compared to $201.3 million during 2008.
Compensation and employee benefits decreased 3% to $79.5 million in 2009, compared to $82.2 million in 2008, primarily due to the impact of initiatives undertaken by the Company throughout the year to reduce overall staffing levels and lower compensation related expenses.
Occupancy and equipment expenses increased 12% to $30.2 million during 2009, compared with $27.0 million during 2008. The increase in occupancy and equipment expenses during 2009 is primarily due to the additional occupancy and equipment expenses from the United Commercial Bank acquisition.
The amortization and impairment writedowns of premiums on deposits acquired decreased 19% to $5.9 million during 2009, compared with $7.3 million in 2008. During 2008, we recognized an $855 thousand impairment loss on deposit premiums initially recorded for the Desert Community Bank acquisition due to higher than anticipated runoffs in certain deposit categories. In comparison, we did not record any impairment losses on deposit premiums during 2009. Additionally, the amortization expense on deposit premiums related to the United National Bank and Standard Bank acquisitions decreased during 2009, relative to the same period in 2008.
58
Deposit-related expenses decreased 11% to $3.9 million during 2009, compared with $4.4 million during 2008. Deposit-related expenses represent various business-related expenses paid by the Bank on behalf of its commercial account customers. The decrease in deposit-related expenses can be correlated to the decline in the volume of title and escrow deposit balances during 2009 relative to the prior year. This segment of our deposit base has been adversely impacted by the overall slowing in the housing market both in production and sale.
The amortization of investments in affordable housing partnerships increased to $13.1 million in 2009, from $7.3 million in 2008. The increase in amortization expense is primarily due to a $5.6 million impairment charge on one investment property. Total investments in affordable housing partnerships increased to $84.8 million at December 31, 2009, compared to $48.1 million at December 31, 2008, of which $31.6 million of the increase was due to the UCB Acquisition.
Deposit insurance premiums and regulatory assessments increased $20.9 million to $28.1 million during 2009, compared with $7.2 million in 2008. This is due to an increase in the FDIC deposit assessment rate during 2009 in addition to the special assessment imposed on each insured depository institution to maintain confidence in the federal deposit insurance system. On May 22, 2009, the FDIC adopted a final rule imposing a 5 basis point special assessment on each insured depository institution's total assets minus Tier 1 capital as of June 30, 2009. This special assessment resulted in a $5.7 million impact to our pretax earnings during 2009. Also, during the fourth quarter of 2009, an additional deposit insurance premium of $2.9 million was recorded relating to the acquired deposits of United Commercial Bank.
We recorded OREO expenses, net of OREO revenues and gains, totaling $19.1 million during 2009, compared with $6.0 million during 2008. As of December 31, 2009, total net non-covered OREO amounted to $13.8 million, compared to $38.3 million as of December 31, 2008. The $19.1 million in total OREO expenses during 2009 is comprised of $6.0 million in various operating and maintenance expenses related to our OREO properties, $7.8 million in valuation losses, and $5.3 million in net OREO losses from the sale of 158 OREO properties consummated in 2009.
Loan related expenses increased to $7.6 million in 2009, compared to $6.4 million 2008. The increase in loan related expenses is primarily due to new appraisals ordered during 2009 to obtain current valuations of collateral securing our land, residential construction, and commercial construction loan portfolios.
Other operating expenses include advertising and public relations, telephone and postage, stationery and supplies, bank and item processing charges, insurance expenses, and other professional fees, and charitable contributions. Other operating expenses slightly decreased 4% to $37.4 million in 2009, compared with $39.0 million in 2008.
Comparing 2008 to 2007, noninterest expense increased $18.0 million, or 10%, to $201.3 million. The increase is comprised primarily of the following: (1) OREO expenses, net of OREO revenues and gains, totaling $6.0 million during 2008, compared with $1.2 million in net OREO income during 2007 representing the net gain on sale of one OREO property sold during the first quarter of 2007. The $6.0 million in total OREO expenses incurred during 2008 is comprised of $2.8 million in various operating and maintenance expenses related to our higher volume of OREO properties, $2.4 million in valuation writedowns, and $852 thousand in net losses from the sale of 29 OREO properties consummated in 2008; (2) an increase in deposit insurance premiums and discounts of $5.8 million, or 414%, primarily due to increases in the FDIC deposit assessment rate during 2008; and (3) an increase in loan related expenses of $3.3 million, or 109%, primarily due to new appraisals ordered during 2008 to obtain current valuations of collateral securing our land, residential construction, and commercial
59
construction loan portfolios; and (4) an increase in amortization of investments in affordable housing partnerships of $2.3 million, or 47%, partly due to additional purchases of investments in affordable housing partnerships during 2008.
The Company's efficiency ratio increased to 48.89% in 2009, compared to 45.94% in 2008 and 37.44% in 2007. The increase in our efficiency ratio during 2009 can be attributed to higher deposit insurance premiums, higher credit cycle expenses associated with OREO/foreclosure transactions as well as higher amortization of investments in affordable housing partnership and legal and consulting expenses. Comparing 2008 to 2007, the increase in our efficiency ratio can be attributed largely to higher deposit insurance premiums, as well as higher credit cycle expenses associated with OREO/foreclosure transactions and legal expenses.
Income Taxes
The income tax provision totaled $22.7 million in 2009, representing an effective tax rate of 21.7%. In comparison, the income tax benefit of $47.5 million represented an effective tax benefit rate of 48.9% for 2008. The income tax provision recognized during 2009 reflects the utilization of $7.1 million in tax credits and no tax on the gain recognized from the acquisition of the foreign operations from the UCB Acquisition. The income tax benefit recognized during 2008 reflects the utilization of $7.4 million in tax credits.
Comparing 2008 to 2007, the income tax benefit totaled $47.5 million in 2008, representing an effective tax benefit rate of 48.9%, compared to a provision for income taxes of $101.1 million in 2007, representing an effective tax rate of 38.6%. The income tax benefit recognized during 2008 reflects the utilization of $7.4 million in tax credits, compared to $5.2 million utilized in 2007.
Pursuant to the adoption of FIN 48 on January 1, 2007, the Company increased its existing unrecognized tax benefits by $7.1 million by recognizing a one-time cumulative effect adjustment to retained earnings on January 1, 2007 related to the Company's dissolved regulated investment company ("RIC"), East West Securities Company, Inc. During the second quarter of 2008, the Company determined that the remaining $4.6 million, net of tax benefit, would not "more likely than not" be sustained upon examination by tax authorities. As a result, this charge was recorded against the provision for income taxes during the second quarter of 2008. See Note 20 to the Company's consolidated financial statements presented elsewhere in this report.
Operating Segment Results
We had previously identified five operating segments for purposes of management reporting: retail banking, commercial lending, treasury, residential lending, and other. Our strategic focus has been shifting and evolving over the last several years which has influenced how our chief operating decision maker views the Company's business operations and assesses its economic performance. For the Bank the chief operating decision maker is the Chief Executive Officer ("CEO"). Specifically, our business focus has culminated in a two-segment core business structure: Retail Banking and Commercial Banking. A third segment, which is comprised of a combination of our previous operating segments – Treasury and Other, provides broad administrative support to these two core segments. As a result of this evolution in our strategic focus, we realigned our segment methodology during the first quarter of 2009, and identified these three business divisions as meeting the criteria of an operating segment. During the fourth quarter of 2009, a fourth operating segment, the United Commercial Bank segment (the "UCB segment") was identified as a result of the UCB Acquisition. The UCB segment is currently identified as a segment due to the significant size of the transaction and meets the other requirements of a segment, that is, the segment engages in business activities from which it earns
60
revenues and incur expenses and whose operating results are regularly reviewed by the Company's chief operating decision maker to make decisions about resources to be allocated to the segment and assess its performance and for which discrete financial information is available. Management will continue to evaluate the UCB segment going forward and make any required realignment as it fully integrates with the Company's other business operations.
The Retail Banking segment focuses primarily on retail operations through the Bank's branch network. The Commercial Banking segment, which includes commercial real estate, primarily generates commercial loans through the efforts of the commercial lending offices located in the Bank's northern and southern California production offices. Furthermore, the Commercial Banking segment also offers a wide variety of international finance and trade services and products. The former residential lending segment has been combined with the Retail Banking segment due to the consumer-centric nature of the products and services offered by these two segments as well as the synergistic relationship between these two units in generating consumer mortgage loans. The UCB segment focuses primarily on the contribution towards the Company's overall business operations resulting from the acquired loan and deposit portfolio of United Commercial Bank. The remaining centralized functions, including the former Treasury segment, and eliminations of intersegment amounts have been aggregated and included in "Other."
Changes in our management structure or reporting methodologies may result in changes in the measurement of operating segment results. Results for prior periods are generally restated for comparability for changes in management structure or reporting methodologies unless it is not deemed practicable to do so.
Given the significant decline in short-term and long-term interest rates since 2007, we reassessed our transfer pricing assumptions during the first quarter of 2009 to be consistent with the Company's strategic goal of growing core deposits and originating profitable, good credit quality loans. Changes to our funds transfer pricing assumptions were made with the intent to promote core deposit growth and, given our recent credit experience, to better reflect the current risk profiles of various loan categories within our credit portfolio. Our transfer pricing assumptions and methodologies are reviewed at least annually to ensure that our process is reflective of current market conditions. Our transfer pricing process is formulated with the goal of incenting loan and deposit growth that is consistent with the Company's overall growth objectives as well as provide a reasonable and consistent basis for measurement of our business segments and product net interest margins. Changes to our transfer pricing assumptions and methodologies are approved by the Asset Liability Committee.
The changes in transfer pricing assumptions that we implemented during the first quarter of 2009 have not been reflected in the segment results for 2008 since these changes were adopted on a prospective basis. We have, however, performed a high level assessment of the impact of these transfer pricing assumption changes to the various operating segments. Based on this assessment, we determined that the full year impact of these changes was not significant overall, and would have been favorable to the segment pre-tax profit (loss) results for the Retail Banking and Commercial Banking segments but unfavorable to the Other segment during 2008. Additionally, the changes in transfer pricing assumptions implemented during the first quarter of 2009 would not have altered the conclusion of our goodwill impairment test performed as of December 31, 2008, had these assumptions been retroactively implemented during 2008.
For more information about our segments, including information about the underlying accounting and reporting process, please see Note 26 to the Company's consolidated financial statements presented elsewhere in this report.
61
Retail Banking
The Retail Banking segment reported a $50.8 million pre-tax loss during 2009, compared to a $17.4 million pre-tax loss for 2008, an increase of $33.4 million. The pre-tax loss for this segment during 2009 is primary derived from a $82.6 million or 89% increase in loan loss provision associated with the $528.7 million provision for loan loss in 2009. The loss is also driven by a $16.0 million or an 8% increase in net interest income, offset against a $11.3 million or 30% decrease in noninterest income and a $23.6 million or 22% increase in noninterest expense.
Net interest income for this segment increased 8% to $215.3 million during 2009, compared to $199.2 million for 2008. The increase in net interest income during the 2009 is attributable to the interest rate floors on newly originated variable-rate loans, which partially offsets the steep decline in interest rates. The sizeable increase in loan loss provisions for this segment during 2009, relative to 2008, was due to increased charge-off activity resulting from the continued downturn in the real estate housing market. Loan loss provisions are also impacted by average loan balances for each reporting segment.
Noninterest income for this segment decreased 30%, to $26.1 million for 2009, from $37.4 million in 2008. The decrease in noninterest income is primarily due to lower loan fee income resulting from a decrease in our loan origination activities and lower net gain on sale of loans, partially offset by an increase in branch-related revenues.
Noninterest expense for this segment increased 22% to $130.7 million during 2009, compared with $107.1 million during 2008. The increase in noninterest expense is primarily due to higher FDIC insurance premiums, amortization of intangibles, and OREO operations. This was partially offset by a decrease in compensation and employee benefits.
Comparing 2008 to 2007, the retail banking segment reported a pre-tax loss of $17.4 million during 2008, representing a 110.3% decrease, as compared to the $168.6 million pre-tax income recorded for the same period in 2007. The decrease in pre-tax income for this segment during 2008 is comprised of a 23%, or $59.9 million, decrease in net interest income to $199.2 million, a $85.0 million increase in loan loss provisions, and increases in noninterest expense and corporate overhead expense allocations. The decrease in net interest income during 2008 is primarily due to the steep 400 basis point decrease in interest rates since December 2007. The increase in loan loss provisions for this segment during 2008, relative to 2007, was due to increased chargeoff activity, as well as higher levels of nonperforming and classified assets resulting from the downturn in the real estate housing market.
Commercial Banking
The Commercial Banking segment reported a pre-tax loss of $254.8 million during 2009, compared with a pre-tax loss of $3.0 million for 2008, a change of $251.8 million. The pre-tax loss for this segment is due to a significant increase in loan loss provisions, $220.1 million, resulting from increased charge-off activity. The loss was also driven by an $8.6 million or a 5% decrease in net interest income, a $6.3 million or 26% decrease in noninterest income, and a $6.7 million or 14% increase in noninterest expense. Year over year, loan loss provisions increased to $352.8 million or 166% during 2009, compared with $132.7 million for 2008.
Net interest income for this segment decreased 5% to $179.5 million during 2009, compared to $188.1 million for 2008. The slight decrease in net interest income is primarily due to a decrease in interest income on loans in response to declining interest rates.
62
Noninterest income for this segment decreased 26% to $18.2 million during 2009, compared with $24.5 million recorded in 2008. The decrease in noninterest income is primarily due to an increase in fee waivers as well as a decrease in letters of credit fees and commissions driven by a decline in the volume of standby letters of credit and commissions generated from trade finance activities due to the overall condition of the economy.
Noninterest expense for this segment increased 14% to $53.2 million during 2009, compared with $46.5 million recorded during 2008. The increase in noninterest expense during 2009 is due to an increase in the FDIC insurance premiums and a real estate investment impairment partially offset by a decrease in compensation and employee benefits for this segment.
Comparing 2008 to 2007, the commercial banking segment reported a pre-tax loss of $3.0 million during 2008, or a 102.9% decrease, compared with pre-tax income of $102.6 million for 2007. The primary driver of the decrease in pre-tax income for this segment for both periods is a significant increase in loan loss provisions resulting from increased chargeoff activity as well as higher levels of nonperforming and classified assets and an increase in corporate overhead allocations, partially offset by the increase in net interest income.
Other
This segment reported a pre-tax profit of $302.4 million during 2009, compared with a pre-tax loss of $76.8 million recorded in 2008, a change of $379.2 million. The profit was driven by a $432.5 million increase in noninterest income primarily from the $471.0 million pre-tax gain recorded on the United Commercial Bank acquisition during the fourth quarter.
Net interest loss for this segment amounted to $37.4 million during 2009, compared to net interest loss of $32.2 million recorded in 2008. Since this segment now includes the treasury function, which is responsible for the liquidity and interest rate risk management of the Bank, it bears the cost of adverse movements in interest rates affecting our net interest margin and supports the Retail Banking and Commercial Banking segments through funds transfer pricing.
Noninterest income for this segment amounted to $345.6 million during 2009, compared with $86.9 million in noninterest loss recorded during 2008. The 2009 noninterest income for this segment is primarily due to $471.0 million associated with the gain on the acquisition of United Commercial Bank. The gain was offset by $107.7 in securities impairments recorded in 2009, as compared to $73.2 million recorded in 2008.
Noninterest expense for this segment decreased 20% to $37.9 million for 2009, compared with $47.6 million recorded during 2009. The decrease in noninterest expense is primarily due to a decrease in core deposit intangibles and employee compensation/benefits, partially offset by higher FDIC insurance premiums.
Comparing 2008 to 2007, the other segment's pre-tax income decreased to a pre-tax loss of $76.8 million in 2008, compared to a pre-tax loss of $9.0 million in 2007. The primary driver of the decrease in pre-tax income for this segment in 2008 are OTTI charges recorded on government-sponsored entities preferred stock and trust preferred debt and equity securities.
UCB Segment
The UCB segment reported a pre-tax profit of $107.9 million primarily due to the yield adjustment of $74.4 million on covered loans partially offset by the decrease in the FDIC
63
indemnification asset of $23.3 million. The pre-tax profit also includes net interest income of $65.2 million which represents net interest income for the period November 7, 2009 to December 31, 2009.
Balance Sheet Analysis
Total assets increased $8.14 billion, or 65%, to $20.56 billion as of December 31, 2009. The increase is comprised predominantly of increases in securities purchased under resale agreements of $177.4 million, available-for-sale investment securities of $523.9 million, net loans of $5.75 billion, FDIC indemnification asset and receivable of $1.26 billion and other assets of $138.0 million. The increases in total assets were funded primarily through increases in deposit growth of $6.85 billion and FHLB advances of $452.1 million. Total asset and liability growth was predominantly the result of the November 6, 2009 acquisition of United Commercial Bank.
Securities Purchased Under Resale Agreements
We purchase securities under resale agreements ("resale agreements") with terms that range from one day to several years. Total resale agreements increased to $227.4 million as of December 31, 2009, compared with $50.0 million at December 31, 2008. The increase as of December 31, 2009 reflects an additional resale agreement for $30.0 million entered into during 2009 and the assumption of $150.0 million in resale agreements, less a discount of $2.6 million, resulting from the UCB Acquisition.
Purchases of securities under resale agreements are overcollateralized to ensure against unfavorable market price movements. We monitor the market value of the underlying securities which collateralize the related receivable on resale agreements, including accrued interest. In the event that the fair market value of the securities decreases below the carrying amount of the related repurchase agreement, our counterparty is required to designate an equivalent value of additional securities. The counterparties to these agreements are nationally recognized investment banking firms that meet credit eligibility criteria and with whom a master repurchase agreement has been duly executed.
Investment Securities
Income from investing activities provides a significant portion of our total income. We aim to maintain an investment portfolio with an adequate mix of fixed-rate and adjustable-rate securities with relatively short maturities to minimize overall interest rate risk. Our investment securities portfolio primarily consists of U.S. Treasury securities, U.S. Government agency securities, U.S. Government sponsored enterprise debt securities, U.S. Government sponsored and other mortgage-backed securities, municipal securities, corporate debt securities, residual securities, and U.S. Government sponsored enterprise equity securities. We classify certain investment securities as held-to-maturity, and accordingly, these securities are recorded based on their amortized cost. We also classify certain investments as available-for-sale, and accordingly, these securities are carried at their estimated fair values with the corresponding changes in fair values recorded in accumulated other comprehensive income, as a component of stockholders' equity.
We had no held-to-maturity investment securities as of December 31, 2009 compared to $122.3 million at December 31, 2008. During 2009 and subsequent to the UCB Acquisition, we transferred $681.4 million held-to-maturity investment securities to available-for-sale.
Total investment securities available-for-sale increased 25% to $2.56 billion as of December 31, 2009, compared with $2.04 billion at December 31, 2008. The increase in investment securities was
64
funded by deposit growth, capital raised during 2009, and the government assisted acquisition of United Commercial Bank. Total repayments/maturities and proceeds from sales of available-for-sale securities amounted to $1.48 billion and $1.65 billion, respectively, during 2009. Proceeds from repayments, maturities, sales, and redemptions were applied towards additional investment securities purchases totaling $4.08 billion. We recorded net gains totaling $11.9 million and $9.0 million on sales of available-for-sale securities during 2009 and 2008, respectively. At December 31, 2009, investment securities available-for-sale with a par value of $1.51 billion were pledged to secure public deposits, FHLB advances, repurchase agreements, FRB discount window, and for other purposes required or permitted by law.
We perform regular impairment analyses on the investment securities. If we determine that a decline in fair value is other-than-temporary, an impairment writedown is recognized in current earnings. Other-than-temporary declines in fair value are assessed based on factors including the duration the security has been in a continuous unrealized loss position, the severity of the decline in value, the rating of the security, the probability that we will be unable to collect all amounts due, and our ability and intent on holding the securities until the fair values recover.
The fair values of the investment securities are generally determined by reference to the average of at least two quoted market prices obtained from independent external brokers or prices obtained from independent external pricing service providers who have experience in valuing these securities. The Company performs a monthly analysis on the broker quotes received from third parties to ensure that the prices represent a reasonable estimate of the fair value. The procedures include, but are not limited to, initial and ongoing review of third party pricing methodologies, review of pricing trends, and monitoring of trading volumes. The Company ensures whether prices received from independent brokers represent a reasonable estimate of fair value through the use of internal and external cash flow models developed based on spreads, and when available, market indices. As a result of this analysis, if the Company determines there is a more appropriate fair value based upon available market data, the price received from the third party is adjusted accordingly.
Prices from third party pricing services are often unavailable for securities that are rarely traded or are traded only in privately negotiated transactions. As a result, certain securities are priced via independent broker quotations which utilize inputs that may be difficult to corroborate with observable market based data. Additionally, the majority of these independent broker quotations are non-binding.
As a result of the global financial crisis and illiquidity in the U.S. markets, we believe the current broker prices that we have obtained on our private label mortgage-backed securities and trust preferred debt and equity securities are based on forced liquidation or distressed sale values in very inactive markets that are not representative of the economic value of these securities. The fair values of private label mortgage-backed securities and trust preferred securities have traditionally been based on the average of at least two quoted market prices obtained from independent external brokers since broker quotes in an active market are given the highest priority under ASC 820. However, in light of these circumstances, we have modified our approach in determining the fair values of these securities. We have determined that each of these securities will be individually examined for the appropriate valuation methodology based on a combination of the market approach reflecting current broker prices and the income approach based on discounted cash flows. In calculating the fair value derived from the income approach, the Company made assumptions related to the implied rate of return, general change in market rates, estimated changes in credit quality and liquidity risk premium, specific non-performance and default experience in the collateral underlying the security, as well as broker discount rates are taken into consideration in determining the discount rate. The values resulting from each approach (i.e. market and income approaches) are weighted to derive the final fair value on each private label mortgage-backed and trust preferred security.
65
The majority of unrealized losses in the available-for-sale portfolio at December 31, 2009 are related to trust preferred debt securities. As of December 31, 2009, the Company had $14.5 million in trust preferred debt securities available-for-sale, representing less than 1% of the total investment securities available-for-sale portfolio. During the year, except for one security that maintained its rating and one security which was downgraded but remained at investment grade status, the ratings for the other fourteen trust preferred securities were downgraded to non-investment grade status due to increased deferral and default activity from the issuers of the underlying debt collateralizing these instruments. As of December 31, 2009, these debt instruments had gross unrealized losses amounting to $17.4 million, or 66% of the total amortized cost basis of these securities, comprised of $3.3 million in gross unrealized losses and $14.1 million, or $8.2 million on a net of tax basis, in noncredit-related impairment losses recorded during the year ended December 31, 2009 pursuant to the provisions of ASC 320-10-65. As a result of the previously discussed diminishing collateral values, deteriorating cash flows, and increasing estimates of future deferrals and defaults, we recorded an impairment loss of $120.8 million on our portfolio of trust preferred securities during the year of which $106.7 million was a pre-tax credit loss recorded through earnings. Included in the $106.7 million in gross unrealized losses, is the reclassification of $14.0 million, or $8.1 million on a net of tax basis, in previously recognized noncredit-related impairment losses from the opening balance of retained earnings to other comprehensive income. This reclassification was recorded as of March 31, 2009 pursuant to the provisions of FSP FAS 115-2 and FAS 124-2.
In addition, $41.6 million of non-investment grade mortgage backed securities, representing 1.6% of the total investment securities have an unrealized loss of $9.6 million or 18.9% of the aggregate amortized cost basis of these securities as of December 31, 2009.
We have seven individual securities that have been in a continuous unrealized loss position for twelve months or longer as of December 31, 2009. These securities are comprised of six trust preferred securities with a total fair value of $9.8 million and one mortgage-backed security with a total fair value of $12.7 million. As of December 31, 2009, there were also seventy one securities that have been in a continuous unrealized loss position for less than twelve months. The unrealized losses on these securities are primarily attributed to changes in interest rates as well as the liquidity crisis that has impacted all financial industries. The issuers of these securities have not, to our knowledge, established any cause for default on these securities. These securities have fluctuated in value since their purchase dates as market interest rates have fluctuated. However, we have the ability and the intention to hold these securities until their fair values recover to cost or maturity. As such, management does not deem these securities to be other-than-temporarily impaired.
In September 2008, the liquidity and credit concerns led the U.S. Federal Government to assume a conservatorship role in Fannie Mae and Freddie Mac. The rating on Fannie Mae and Freddie Mac preferred securities was downgraded from BBB- to C reflecting the cessation of dividend payments on these securities. These securities are non-cumulative perpetual preferred stock in which unpaid dividends do not accumulate. The purchase agreement between the U.S. Treasury and these government-sponsored entities contains a covenant prohibiting the payment of dividends on existing preferred stock. As the assessment on the status of any resumption in dividend payments on these securities was uncertain, in accordance with ASC 320-10, we recorded $55.3 million in OTTI charges on Fannie Mae and Freddie Mac preferred stock securities in 2008. In December 2009, we recorded an additional $1.0 million in OTTI charges. As of December 31, 2009, the fair value of these preferred securities was $1.8 million. Gross unrealized losses on these securities amounted to $216 thousand as of December 31, 2009, or 11% of the aggregate amortized cost basis of these securities. The value of these preferred securities have been very volatile and in the month preceding and subsequent to year-end, these securities have traded above their carrying values. The Company has the ability and the
66
intention to hold these securities until their fair values recover to cost. As such, the Company does not deem these securities to be other-than-temporarily impaired.
The following table sets forth the amortized cost of investment securities held-to-maturity and the fair values of investment securities available-for-sale at December 31, 2009, 2008 and 2007:
Table 8: Investment Securities
| |
At December 31, | ||||||||||
|---|---|---|---|---|---|---|---|---|---|---|---|
| |
2009 | 2008 | 2007 | ||||||||
| |
(In thousands) |
||||||||||
Held-to-maturity (at amortized cost) |
|||||||||||
Municipal securities |
- | 5,772 | - | ||||||||
Corporate debt securities |
- | 116,545 | - | ||||||||
Total investment securities held-to-maturity |
$ | - | $ | 122,317 | $ | - | |||||
Available-for-sale (at fair value) |
|||||||||||
U.S. Treasury securities |
$ | 303,472 | $ | 2,513 | $ | 2,492 | |||||
U.S. Government agency securities and U.S Government sponsored enterprise debt securities |
832,025 | 1,023,934 | 426,490 | ||||||||
U.S. Government sponsored enterprise mortgage-backed securities |
750,703 | 380,051 | 535,276 | ||||||||
Other mortgage-backed securities |
137,126 | 537,326 | 680,598 | ||||||||
Municipal securities |
60,193 | - | - | ||||||||
Residual securities |
- | 50,062 | 40,716 | ||||||||
Corporate debt securities (1) |
469,757 | 42,544 | 119,627 | ||||||||
U.S. Goverment sponsored enterprise equity securities (2) |
1,782 | 1,184 | 75,055 | ||||||||
Other securities (3) |
9,023 | 2,580 | 6,882 | ||||||||
Total investment securities available-for-sale |
$ | 2,564,081 | $ | 2,040,194 | $ | 1,887,136 | |||||
Total investment securities |
$ | 2,564,081 | $ | 2,162,511 | $ | 1,887,136 | |||||
- (1)
- Balances presented net of OTTI charge of $106.7 million, $13.6 million and $405 thousand as of December 31, 2009, 2008 and 2007, respectively.
- (2)
- Balances presented net of OTTI charge of $1.0 million and $55.3 million as of December 31, 2009 and 2008, respectively.
- (3)
- Balances presented net of OTTI charge of $4.3 million as of December 31, 2008.
The following table sets forth certain information regarding the amortized cost of our investment securities held-to-maturity and fair values of our investment securities available-for-sale, as well as the weighted average yields, and contractual maturity distribution, excluding periodic principal payments, of our investment securities held-to-maturity and available-for-sale portfolio at December 31, 2009. Securities with no stated maturity dates, such as equity securities, are included in the "indeterminate maturity" category.
67
Table 9: Yields and Maturities of Investment Securities
| |
Within One Year |
After One But Within Five Years |
After Five But Within Ten Years |
After Ten Years |
Indeterminate Maturity |
Total | ||||||||||||||||||||||||||||||||
|---|---|---|---|---|---|---|---|---|---|---|---|---|---|---|---|---|---|---|---|---|---|---|---|---|---|---|---|---|---|---|---|---|---|---|---|---|---|---|
| |
Amount | Yield | Amount | Yield | Amount | Yield | Amount | Yield | Amount | Yield | Amount | Yield | ||||||||||||||||||||||||||
| |
(Dollars in thousands) |
|||||||||||||||||||||||||||||||||||||
U.S. Treasury securities |
$ | 183,910 | 0.23 | % | $ | 119,562 | 1.02 | % | $ | - | - | $ | - | - | $ | - | - | $ | 303,472 | 0.54 | % | |||||||||||||||||
U.S. Government agency and U.S. Government sponsored enterprise debt securities |
494,838 | 3.31 | % | 209,476 | 2.62 | % | 49,035 | 3.54 | % | 78,676 | 5.36 | % | - | - | 832,025 | 3.34 | % | |||||||||||||||||||||
U.S Government agency and U.S. Government sponsored enterprise mortgage-backed securities: |
||||||||||||||||||||||||||||||||||||||
Commercial mortgage-backed securities |
- | - | 2,702 | 5.69 | % | 8,249 | 4.56 | % | 15,404 | 4.71 | % | - | - | 26,355 | 4.76 | % | ||||||||||||||||||||||
Residential mortgage-backed securities |
- | - | - | - | 59,447 | 4.88 | % | 664,901 | 4.96 | % | - | - | 724,348 | 4.96 | % | |||||||||||||||||||||||
Municipal securities |
8,983 | 2.80 | % | 32,507 | 4.23 | % | 16,839 | 6.57 | % | 1,864 | 7.62 | % | - | - | 60,193 | 4.77 | % | |||||||||||||||||||||
Other residential mortgage-backed securities: |
||||||||||||||||||||||||||||||||||||||
Investment grade |
- | - | - | - | 48,301 | 5.54 | % | 47,216 | 6.41 | % | - | - | 95,517 | 5.31 | % | |||||||||||||||||||||||
Non-investment grade |
- | - | - | - | - | - | 41,610 | 8.64 | % | - | - | 41,610 | 3.32 | % | ||||||||||||||||||||||||
Corporate debt securities: |
||||||||||||||||||||||||||||||||||||||
Investment grade |
108,163 | 5.78 | % | 333,424 | 5.16 | % | 19,308 | 5.22 | % | - | - | - | - | 460,895 | 5.31 | % | ||||||||||||||||||||||
Non-investment grade |
1,347 | 3.80 | % | 608 | 6.05 | % | - | - | 6,906 | 0.86 | % | - | - | 8,861 | 3.32 | % | ||||||||||||||||||||||
U.S. Government sponsored enterprise equity securities |
- | - | - | - | - | - | - | - | 1,782 | 0.36 | % | 1,782 | 0.36 | % | ||||||||||||||||||||||||
Other securities |
7,090 | 0.10 | % | 1,933 | 0.47 | % | - | - | - | - | - | - | 9,023 | 0.18 | % | |||||||||||||||||||||||
Total investment securities available-for-sale |
$ | 804,331 | 2.91 | % | $ | 700,212 | 3.62 | % | $ | 201,179 | 4.86 | % | $ | 856,577 | 5.21 | % | $ | 1,782 | 0.36 | % | $ | 2,564,081 | 4.03 | % | ||||||||||||||
We retain residual securities in securitized mortgage loans in connection with certain of our securitization activities. The fair value of residual securities is subject to credit, prepayment, and interest rate risk on the underlying mortgage loans. Fair value is estimated based on a discounted cash flow analysis. These cash flows are projected over the lives of the receivables using prepayment speed, expected credit losses, and the forward interest rate environment on the residual securities. At December 31, 2009, no residual securities are maintained due to the desecuritizations earlier in the year. As of December 31, 2008, the fair value of residual securities totaling $50.1 million is based on a weighted average remaining life of 6.64 years, a weighted average projected prepayment rate of 21%, a weighted average expected credit loss rate of 0.07% and a weighted average discount rate of 15%.
Covered Assets
Covered assets are loans receivable and real estate owned "REO" that were acquired in the UCB Acquisition in November 6, 2009 for which the Company entered into a shared-loss agreement (the "shared-loss agreement") with the FDIC. The shared-loss agreement covered all the loans originated by United Commercial Bank in the domestic U.S. and Hong Kong. Loans originated by United Commercial Bank in China under its United Commercial Bank China (Limited) subsidiary were not included in the shared-loss agreement. The Company will share in the losses, which begins with the first dollar of loss occurred, ofssss the loan pools (including single family residential mortgage loans, commercial loans "covered loans" and foreclosed loan collateral and other real estate owned), together covered ("covered assets") under the shared-loss agreement.
68
Pursuant to the terms of the shared-loss agreement, the FDIC is obligated to reimburse the Company 80% of eligible losses of up to $2.05 billion with respect to covered assets. The FDIC will reimburse the Company for 95% of eligible losses in excess of $2.05 billion with respect to covered loans. The Company has a corresponding obligation to reimburse the FDIC for 80% or 95%, as applicable, of eligible recoveries with respect to covered loans. The shared-loss agreement for commercial and single family residential mortgage loans is in effect for 5 years and 10 years, respectively, from the November 6, 2009 acquisition date and the loss recovery provisions are in effect for 8 years and 10 years, respectively, from the acquisition date.
On January 14, 2020, the Company is required to pay to the FDIC 50% of the excess, if any of (i) $410 million over (ii) the sum of (A) 25% of the asset discount plus (B) 25% of the Cumulative Shared-Loss Payments plus (C) the Cumulative Servicing Amount if net losses on covered loans subject to the stated threshold is not reached. As of December 31, 2009, the estimate for this liability is zero.
At the November 6, 2009 acquisition date, we accounted for the loan portfolio acquired from United Commercial Bank under the fair value accounting requirements as stated in ASC 805 and estimated that the fair value of the loan portfolio subject to the shared-loss agreement at $5.66 billion. This represents the expected cash flows from the portfolio. In estimating the nonaccretable difference, we (a) calculated the contractual amount and timing of undiscounted principal and interest payments (the "undiscounted contractual cash flows") and (b) estimated the amount and timing of undiscounted expected principal and interest payments (the "undiscounted expected cash flows"). The amount by which the undiscounted expected cash flows exceed the estimated fair value (the "accretable yield") is accreted into interest income over the life of the loans. The difference between the undiscounted contractual cash flows and the undiscounted expected cash flows is the nonaccretable difference. The nonaccretable difference represents our estimate of the credit losses expected and was written off as of the acquisition date. In the determination of contractual cash flows and cash flows expected to be collected, we assumed no prepayment on the SOP 03-3 nonaccrual loan pools as we do not anticipate any significant prepayments on credit impaired loans. For the SOP 03-3 accrual loans for single-family, multi-family and commercial real estate, we used a third party vendor to obtain the prepayment speed. The third party vendor is recognized in the mortgage-industry for the delivery of prepayment and default models for the secondary market to identify loan level prepayment, delinquency, default, and loss propensities. The prepayment rates for the construction, land, commercial and consumer pools have historically been low and so we applied the prepayment assumptions of our current portfolio using our internal modeling. The Company has elected to account for all loans acquired in the FDIC-assisted acquisition of United Commercial Bank under ASC 310-30 as the accounting treatment subsequent to acquisition date fair value.
United Commercial Bank's loan portfolio included unfunded commitments for commercial lines of credit, constructions draws and other lending activity. Any additional advances on these loans subsequent to November 6, 2009 are not accounted for under ASC 310-30. The total commitment outstanding as of the acquisition date is included under the shared-loss agreement. As such, any additional advances, up to the total commitment outstanding at the time of acquisition are covered loans.
The covered loans acquired are and will continue to be subject to the Bank's internal and external credit review and monitoring. If credit deterioration is experienced subsequent to the November 6, 2009 acquisition fair value amount, such deterioration will be measured through our loss reserving methodology and a provision for credit losses will be charged to earnings with a partially offsetting noninterest income item reflecting the increase to the FDIC indemnification asset or receivable.
69
The carrying amounts and the composition of the covered loans as of December 31, 2009 are as follows:
Table 10: Covered Loans
| |
Balance at December 31, 2009 | |||||||||||
|---|---|---|---|---|---|---|---|---|---|---|---|---|
| |
Credit Impaired | Other Loans | Total | |||||||||
| |
(In thousands) |
|||||||||||
Real estate loans |
||||||||||||
Residential single family |
$ | 22,325 | $ | 621,742 | $ | 644,067 | ||||||
Residential multifamily |
158,452 | 1,010,413 | 1,168,865 | |||||||||
Commercial and industrial real estate |
900,165 | 1,515,284 | 2,415,449 | |||||||||
Contruction and land |
1,236,228 | 155,500 | 1,391,728 | |||||||||
Total real estate |
2,317,170 | 3,302,939 | 5,620,109 | |||||||||
Other loans: |
||||||||||||
Commercial business |
603,507 | 580,260 | 1,183,767 | |||||||||
Other consumer |
422 | 100,377 | 100,799 | |||||||||
Total other loans |
603,929 | 680,637 | 1,284,566 | |||||||||
Total principal balance |
2,921,099 | 3,983,576 | 6,904,675 | |||||||||
Covered discount |
(1,033,720 | ) | (474,948 | ) | (1,508,668 | ) | ||||||
Net valuation of loans |
1,887,379 | 3,508,628 | 5,396,007 | |||||||||
Subsequent acquisition loan advances |
- | 202,148 | 202,148 | |||||||||
Total covered loans |
$ | 1,887,379 | $ | 3,710,776 | $ | 5,598,155 | ||||||
At December 31, 2009, $675.6 million of the credit impaired loans were considered to be nonperforming loans.
The following table shows the carrying amounts and estimated fair value for the covered loans as of acquisition date November 6, 2009 and year ended December 31, 2009:
Table 11: Carrying Amounts and Estimated Fair Value for the Covered Loans
| Description | At Acquisition November 6, 2009 |
Year End December 31, 2009 |
|||||
|---|---|---|---|---|---|---|---|
| |
(In thousands) |
||||||
Contractually required payments of interest and principal |
$ | 8,407,745 | $ | 7,976,064 | |||
Nonaccretable difference |
(1,705,626 | ) | (1,596,950 | ) | |||
Cash flows expected to be collected (1) |
6,702,119 | 6,379,114 | |||||
Accretable difference |
(1,041,687 | ) | (983,107 | ) | |||
Carrying value of covered loans |
$ | 5,660,432 | $ | 5,396,007 | |||
- (1)
- Represents undiscounted expected principal and interest cash flows.
70
Changes in the accretable yield for the covered loans for the year ended December 31, 2009 is as follows:
Table 12: Accretable Yield for Covered Loans
| Description | Accretable Yield | |||
|---|---|---|---|---|
| |
(In thousands) |
|||
Balance at beginning of period |
$ | - | ||
Acquisition |
1,041,687 | |||
Accretion |
(9,731 | ) | ||
Disposals |
(48,849 | ) | ||
Balance at end of period |
$ | 983,107 | ||
The excess of cash flows expected to be collected over the initial fair value of acquired loans is referred to as the accretable yield and is accreted into interest income over the estimated life of the acquired loans using the effective yield method. The accretable yield will change due to:
- •
- estimate of the remaining life of acquired loans which may change the amount of future interest income
- •
- estimate of the amount of contractually required principal and interest payments over the estimated life that will not be
collected (the nonaccretable difference); and
- •
- indices for acquired loans with variable rates of interest.
From the acquisition date of November 6, 2009 to December 31, 2009, excluding scheduled principal payments, a total of $333.8 million of loans were removed from the covered loans accounted under ASC 310-30 due to loans paid in full, sold, transferred to covered REO. The payoff activity during this period of time was higher than anticipated and what was modeled, however management does not believe this activity suggests the need for a change in the original prepayment assumptions at this time. The loan discount related to these prepayments of $74.4 million was recorded as a yield adjustment to interest income. No impairment write-downs were recorded in 2009.
FDIC Indemnification Asset
As of November 6, 2009, we recorded an FDIC indemnification asset of $1.1 billion, consisting of the present value of the amounts the Company expects to receive from the FDIC under the shared-loss agreement. The difference between the present value and the undiscounted cash flow the Company expects to collect from the FDIC is accreted into noninterest income over the life of the FDIC indemnification asset. From the period of time from November 7, 2009 through December 31, 2009, the Company recorded $8.3 million of accretion into income. Additionally, because of the high prepayment activity during this timeframe, the Company reduced the FDIC indemnification asset by $31.7 million and recorded the adjustment as noninterest income. As of December 31, 2009, the recorded FDIC indemnification asset was $1.1 billion.
Non-Covered Loans
We offer a broad range of products designed to meet the credit needs of our borrowers. Our lending activities consist of residential single family loans, residential multifamily loans, commercial real estate loans, construction loans, commercial business loans, trade finance loans, and consumer loans. Net non-covered loans receivable increased $149.3 million, or 2%, to $8.22 billion at December 31, 2009.
71
The following table sets forth the composition of the loan portfolio as of the dates indicated:
Table 13: Composition of Loan Portfolio
| |
December 31, | ||||||||||||||||||||||||||||||||
|---|---|---|---|---|---|---|---|---|---|---|---|---|---|---|---|---|---|---|---|---|---|---|---|---|---|---|---|---|---|---|---|---|---|
| |
2009 | 2008 | 2007 | 2006 | 2005 | ||||||||||||||||||||||||||||
| |
Amount | Percent | Amount | Percent | Amount | Percent | Amount | Percent | Amount | Percent | |||||||||||||||||||||||
| |
(Dollars in thousands) |
||||||||||||||||||||||||||||||||
Real estate loans: |
|||||||||||||||||||||||||||||||||
Residential, single family |
$ | 930,392 | 10.9 | % | $ | 491,315 | 6.0 | % | $ | 433,337 | 4.9 | % | $ | 365,407 | 4.4 | % | $ | 509,151 | 7.5 | % | |||||||||||||
Residential, multifamily |
1,022,383 | 12.0 | % | 677,989 | 8.2 | % | 690,941 | 7.8 | % | 1,584,674 | 19.2 | % | 1,239,836 | 18.3 | % | ||||||||||||||||||
Commercial and industrial real estate |
3,964,622 | 46.6 | % | 4,048,564 | 49.1 | % | 4,183,473 | 47.3 | % | 3,766,634 | 45.6 | % | 3,321,520 | 48.9 | % | ||||||||||||||||||
Construction |
455,142 | 5.4 | % | 1,260,724 | 15.3 | % | 1,547,082 | 17.5 | % | 1,154,339 | 14.0 | % | 640,654 | 9.4 | % | ||||||||||||||||||
Total real estate loans |
$ | 6,372,539 | 74.9 | % | $ | 6,478,592 | 78.6 | % | $ | 6,854,833 | 77.5 | % | $ | 6,871,054 | 83.2 | % | $ | 5,711,161 | 84.1 | % | |||||||||||||
Other loans: |
|||||||||||||||||||||||||||||||||
Commercial business |
$ | 1,283,182 | 15.1 | % | $ | 1,210,260 | 14.6 | % | $ | 1,314,068 | 14.8 | % | $ | 960,375 | 11.6 | % | $ | 643,296 | 9.5 | % | |||||||||||||
Trade finance |
220,528 | 2.6 | % | 343,959 | 4.2 | % | 491,690 | 5.6 | % | 271,795 | 3.3 | % | 230,771 | 3.4 | % | ||||||||||||||||||
Automobile |
6,817 | 0.1 | % | 9,870 | 0.1 | % | 23,946 | 0.3 | % | 9,481 | 0.1 | % | 8,543 | 0.1 | % | ||||||||||||||||||
Other consumer |
617,967 | 7.3 | % | 206,772 | 2.5 | % | 160,572 | 1.8 | % | 152,527 | 1.8 | % | 200,254 | 2.9 | % | ||||||||||||||||||
Total other loans |
$ | 2,128,494 | 25.1 | % | $ | 1,770,861 | 21.4 | % | $ | 1,990,276 | 22.5 | % | $ | 1,394,178 | 16.8 | % | $ | 1,082,864 | 15.9 | % | |||||||||||||
Total gross loans |
8,501,033 | 100.0 | % | 8,249,453 | 100.0 | % | 8,845,109 | 100.0 | % | 8,265,232 | 100.0 | % | 6,794,025 | 100.0 | % | ||||||||||||||||||
Unearned fees, premiums, and discounts, net |
(43,529 | ) | (2,049 | ) | (5,781 | ) | (4,859 | ) | (1,070 | ) | |||||||||||||||||||||||
Allowance for loan losses |
(238,833 | ) | (178,027 | ) | (88,407 | ) | (78,201 | ) | (68,635 | ) | |||||||||||||||||||||||
Loans held for sale |
28,014 | - | - | - | - | ||||||||||||||||||||||||||||
Loans receivable, net |
$ | 8,246,685 | $ | 8,069,377 | $ | 8,750,921 | $ | 8,182,172 | $ | 6,724,320 | |||||||||||||||||||||||
Single Family Residential Loans. We offer mortgage loans secured by one-to-four unit residential properties located in our primary lending areas. At December 31, 2009, $930.4 million or 11% of the loan portfolio was secured by one-to-four family residential real estate properties, compared to $491.3 million or 6% at December 31, 2008. Residential single family loan balances increased year over year due to the desecuritization of our private-label mortgage backed securities in the second quarter of 2009 and new originations. The desecuritizations in the second quarter of 2009 resulted in a $330.7 million increase in single family loans receivable with a corresponding decrease to available for sale securities. Residential single family loan origination activity increased in 2009, with $226.6 million in new loan originations during 2009, compared with $131.3 million in 2008. This increase in the loan origination was primarily due to market improvements.
Further, we sold approximately $36.1 million in conforming and non-conforming residential single family loans through our secondary marketing efforts during 2009, compared to $31.2 million sold in 2008.
We offer both fixed and adjustable rate ("ARM") single family residential mortgage loan programs. We primarily offer ARM loan programs that have six-month, three-year, five-year, or seven-year initial fixed periods. We originate single family residential mortgage loans under three different types of programs: full/alternative documentation, reduced documentation and no documentation loans. The underwriting criteria for these loan programs vary in income and asset documentation levels. Our underwriting criteria for all the loans in our single family residential mortgage loan programs include minimum Fair Isaac Corporation ("FICO") credit scores and maximum loan-to-value ("LTV") ratios. Additionally, our full/alternative documentation loan program requires verification of employment and income. Reduced documentation loans are primarily intended for borrowers who are self-employed. Generally, we require reduced documentation borrowers to have more equity in the property and higher amounts of liquid reserves. Finally, our no documentation loan program is designed for borrowers who demonstrate excellent credit quality and have the ability to
72
place a large down payment or have high equity in the property. We still do reduced and no documentation loans, but the risk is minimal due to our stringent underwriting criteria.
Of the $226.6 million in residential single family mortgage loans originated during 2009, 22% or $50.1 million were full/alternative documentation loans, 16% or $35.5 million were reduced documentation loans, 27% or $62.1 million were no documentation loans, and 35% or $78.9 million were limited document loans. In comparison, of the $131.3 million in residential single family mortgage loans originated during 2008, 7% or $8.8 million were full/alternative documentation loans, 35% or $46.0 million were reduced documentation loans and 58% or $76.6 million were no documentation loans. Based on management's evaluation and analysis of the portfolio credit quality and prevailing economic conditions, we believe the loan loss provision is adequate for losses inherent in the portfolio as of December 31, 2009.
Multifamily Real Estate Loans. At December 31, 2009, $1.0 billion or 12% of the loan portfolio was secured by multifamily real estate properties, compared to $678.0 million or 8% at December 31, 2008. Multifamily loan balances increased year over year primarily due to the desecuritization of our private-label mortgage backed securities in the second quarter of 2009. The desecuritizations in the second quarter of 2009 resulted in a $304.9 million increase in multifamily loans receivable with a corresponding decrease to available for sale securities. We originated $27.6 million multifamily loans in 2009, as compared to $27.8 million in 2008. Although real estate lending activities are collateralized by real property, these transactions are subject to similar credit evaluation, underwriting and monitoring standards as those applied to commercial business loans. Multifamily real estate loans accounted for $1.02 billion or 12%, and $678.0 million or 8%, of our loan portfolio at December 31, 2009 and 2008, respectively.
Additionally, we own single family and multifamily residential mortgage loans that have contractual features that may increase our credit exposure. These mortgage loans include adjustable rate mortgage loans that may subject borrowers to significant future payment increases or create the potential for negative amortization of the principal balance.
Interest-only mortgage loans allow interest-only payments for a fixed period of time. At the end of the interest-only period, the loan payment includes principal payments and increases significantly. The borrower's new payment once the loan becomes amortizing (i.e., includes principal payments) will be greater than if the borrower had been making principal payments since the origination of the loan. The longer the interest-only period, the larger the amortizing payment will be when the interest-only period ends. There were $21.3 million and $40.4 million in interest-only loans held in the Bank's portfolio as of December 31, 2009 and 2008, respectively. Historically, losses experienced from interest-only loans have been minimal and we do not believe potential losses from these loans will be significant.
The Bank has purchased adjustable rate mortgage loans which permit different repayment options. The monthly payment for adjustable rate mortgage loans with negative amortization features is set as the initial interest rate for the first year of the loan. After that point, the borrower can make a minimum payment that is limited to a 7.5% increase in payment. If the minimum payment is not adequate to cover the interest amount due on the mortgage loan, the loan would have negative amortization, which will result in an increase in the mortgage loans' principal balance. These loans completely re-amortize every five years and the monthly payment is reset at that point. None of the adjustable rate mortgages held in the Bank's loan portfolio that have the potential to negatively amortize were negatively amortizing as of December 31, 2009 and 2008. We do not believe potential losses from these loans will be significant.
73
Our total exposure related to these products in our loan portfolio for the years ended December 31, 2009 and 2008 is summarized as follows:
Table 14: Nontraditional Mortgage Products
| |
Unpaid Principal Balance as of December 31, | |||||||
|---|---|---|---|---|---|---|---|---|
| |
2009 | 2008 | ||||||
| |
(In thousands) |
|||||||
Interest only mortgage loans |
$ | 16,306 | $ | 40,399 | ||||
Adjustable rate mortgages with negative amortization features: |
||||||||
Residential single family loans |
853 | 1,181 | ||||||
Residential multifamily loans |
17,198 | 9,399 | ||||||
All of the loans we originate are subject to our underwriting guidelines and loan origination standards. Generally, loans obtained from third party originators, including the higher risk loans in the preceding table, are closed and funded in our name and are also subject to our same underwriting guidelines and loan origination standards. We believe our strict underwriting criteria and procedures adequately consider the unique risks which may come from these products. We conduct a variety of quality control procedures and periodic audits to ensure compliance with our origination standards, including our criteria for lending and legal requirements.
Commercial Real Estate Loans. We continue to place emphasis in the origination of commercial real estate loans. Although real estate lending activities are collateralized by real property, these transactions are subject to similar credit evaluation, underwriting and monitoring standards as those applied to commercial business loans. Commercial real estate loans accounted for $3.97 billion or 47%, and $4.05 billion or 49%, of our non-covered loan portfolio at December 31, 2009, and 2008, respectively.
Since substantially all of our real estate loans are secured by properties located in California, declines in the California economy and in real estate values could have a significant effect on the collectibility of our loans and on the level of allowance for loan losses required.
Construction Loans. We offer loans to finance the construction of income-producing or owner-occupied buildings. At December 31, 2009, construction loans accounted for $455.1 million or 5% of our non-covered loan portfolio. This compares with $1.26 billion or 15% of the non-covered loan portfolio at December 31, 2008. Total unfunded commitments related to construction loans decreased to $87.8 million at December 31, 2009, compared to $344.4 million at December 31, 2008. At December 31, 2009, the total commitment for residential construction loans was approximately $343.7 million. The current residential construction loan balance was $288.4 million, representing 63% of total construction loans and 3% of total gross loans. During 2009, we reduced our total commitment on residential construction loans by 66% from $1.01 billion as of December 31, 2008. Additionally, all construction disbursements are being carefully monitored and reviewed to address key risks and factors in this portfolio, such as interest reserves remaining, number of homes sold, geographic area and concentration of loans.
Commercial Business Loans. We finance small and middle-market businesses in a wide spectrum of industries throughout California. Included in commercial business loans are loans for working capital, accounts receivable lines, inventory lines, SBA guaranteed small business loans and lease financing. At December 31, 2009, commercial business loans accounted for a total of $1.28 billion or 15% of our loan portfolio, compared to $1.21 billion or 15% at December 31, 2008. Total unfunded
74
commitments related to commercial business loans decreased 17% to $455.4 million at December 31, 2009, compared to $548.9 million at year-end 2008.
Trade Finance Products. We offer a variety of international finance and trade services and products, including letters of credit, revolving lines of credit, import loans, bankers' acceptances, working capital lines, domestic purchase financing, and pre-export financing. At December 31, 2009, these loans to finance international trade totaled $220.5 million or 3% of our loan portfolio, compared to $344.0 million or 4% at December 31, 2008. Although most of our trade finance activities are related to trade with Asian countries, a significant majority of our loans are made to companies domiciled in the United States. A substantial portion of this business involves California-based customers engaged in import activities. In addition, we also offer Export-Import financing to various domestic and foreign exporters. These loans are guaranteed by the Export-Import Bank of the United States. Our trade finance portfolio as of December 31, 2009 primarily represents loans made to borrowers that import goods into the U.S. These financings are generally made through letters of credit ranging from $100 thousand to $1 million. At December 31, 2009, total unfunded commitments related to trade finance loans decreased 11% to $252.7 million, compared to $283.9 million at December 31, 2008.
Other Consumer Loans. Other consumer loans increased from $206.8 million at December 31, 2008 to $618.0 million at December 31, 2009, an increase of 199%, primarily due to the purchase of fully guaranteed student loans during the year.
Affordable Housing. We are engaged in a variety of lending and credit enhancement programs to finance the development of affordable housing projects, which are generally eligible for federal low income housing tax credits. As of December 31, 2009, we had outstanding $329.5 million of letters of credit, which were issued to enhance the ratings of revenue bonds used to finance affordable housing projects. This compares to $345.0 million as of year-end 2008. Credit facilities for individual projects generally range from $5 million to $15 million.
Foreign Outstandings. Foreign outstandings include loans, acceptances, interest bearing deposits with other banks, other interest bearing investments and related accrued interest receivable. Foreign assets are subject to the general risks of conducting business in each foreign country, including economic uncertainty and government regulations. In addition, foreign assets may be impacted by changes in demand or pricing resulting from movements in exchange rates or other factors. The Company's cross-border exposure primarily relate to our branch operations in Hong Kong, China. As of December 31, 2009, our cross-border exposure exceeded 1.00% of our total assets. The increase in total assets of the Company's operations in Hong Kong as of December 31, 2009 was due to growth in cash and investments. The total assets do not include the Hong Kong branch from the UCB Acquisition as a significant amount of the assets are covered assets under the FDIC-assisted transaction.
Contractual Maturity of Loan Portfolio. The following table presents the maturity schedule of our loan portfolio at December 31, 2009. All loans are shown maturing based upon contractual maturities, and include scheduled repayments but not potential prepayments. Demand loans, loans having no stated schedule of repayments and no stated maturity, and overdrafts are reported as due within one year. Loan balances have not been reduced for undisbursed loan proceeds, unearned discounts, and the allowance for loan losses. Non-covered nonaccrual loans of $173.2 million are included in the following table by their contractual maturity date.
75
Table 15: Maturity of Loan Portfolio
| |
Within One Year |
After One But Within Five Years |
More Than Five Years |
Total | ||||||||||
|---|---|---|---|---|---|---|---|---|---|---|---|---|---|---|
| |
(In thousands) |
|||||||||||||
Residential, single family |
$ | 14,338 | $ | 54,263 | $ | 861,791 | $ | 930,392 | ||||||
Residential, multifamily |
52,043 | 167,316 | 803,024 | 1,022,383 | ||||||||||
Commercial and industrial real estate |
554,937 | 1,481,057 | 1,928,628 | 3,964,622 | ||||||||||
Construction |
393,721 | 61,421 | - | 455,142 | ||||||||||
Commercial business |
773,061 | 376,850 | 133,271 | 1,283,182 | ||||||||||
Trade finance |
214,569 | 5,959 | - | 220,528 | ||||||||||
Automobile and other consumer |
410,406 | 5,913 | 208,465 | 624,784 | ||||||||||
Total |
$ | 2,413,075 | $ | 2,152,779 | $ | 3,935,179 | $ | 8,501,033 | ||||||
As of December 31, 2009, outstanding loans, including projected prepayments, scheduled to be repriced within one year, after one but within five years, and in more than five years, excluding nonaccrual loans, are as follows:
Table 16: Loans Scheduled to be Repriced
| |
Within One Year |
After One But Within Five Years |
More Than Five Years |
Total | ||||||||||
|---|---|---|---|---|---|---|---|---|---|---|---|---|---|---|
| |
(In thousands) |
|||||||||||||
Total fixed rate |
$ | 79,085 | $ | 391,136 | $ | 488,340 | $ | 958,561 | ||||||
Total variable rate |
6,255,053 | 1,006,721 | 107,518 | 7,369,292 | ||||||||||
Total |
$ | 6,334,138 | $ | 1,397,857 | $ | 595,858 | $ | 8,327,853 | ||||||
Mortgage Servicing Assets
As of December 31, 2009, we had $13.4 million in mortgage servicing assets, which is net of $2.6 million in total valuation allowances. Mortgage servicing assets are initially recorded at fair value. The fair value of servicing assets is determined based on the present value of estimated net future cash flows related to contractually specified servicing fees. The primary determinants of the fair value of mortgage servicing assets are prepayment speeds and discount rates. Published industry standards are used to derive market-based assumptions. Changes in the assumptions used may have a significant impact on the valuation of mortgage servicing assets. Evaluation of impairment is performed on a quarterly basis. We record mortgage servicing assets for loans sold or securitized for which servicing has been retained by the Bank.
We recorded an impairment of $1.1 million in mortgage servicing assets during 2009, compared with $2.4 million in impairment writedown in 2008. The decline in interest rates as well as the overall increases in borrower refinancing and prepayment rates related to the underlying sold or securitized loans have caused the value of mortgage servicing assets to decrease. For more information about mortgage servicing assets, see Note 13 to the Company's consolidated financial statements presented elsewhere in this report.
76
Non-Covered Nonperforming Assets
Loans are continually monitored by management and the Board of Directors. Generally, our policy is to place a loan on nonaccrual status if either (i) principal or interest payments are past due in excess of 90 days; or (ii) the full collection of principal or interest becomes uncertain, regardless of the length of past due status. When a loan reaches nonaccrual status, any interest accrued on the loan is reversed and charged against current income. In general, subsequent payments received are applied to the outstanding principal balance of the loan. Nonaccrual loans that demonstrate a satisfactory payment trend for several months are returned to full accrual status subject to management's assessment of the full collectibility of the account.
Non-covered nonperforming assets are comprised of nonaccrual loans, loans past due 90 days or more but not on nonaccrual, restructured loans and other real estate owned, net. Non-covered nonperforming assets as a percentage of total assets were 0.91% and 2.04% at December 31, 2009 and 2008, respectively. Nonaccrual loans totaled $173.2 million and $214.6 million at December 31, 2009 and 2008, respectively. Loans totaling $761.1 million were placed on nonaccrual status during 2009. As part of our comprehensive loan review process, loans totaling $95.2 million which were not 90 days past due as of December 31, 2009 were included in nonaccrual loans as of December 31, 2009. Additions to nonaccrual loans during 2009 were offset by $288.7 million in payoffs and principal paydowns, $133.1 million in loans brought current, $214.9 million in net chargeoffs, and $119.0 million in loans transferred to OREO. Additions to nonaccrual loans during the year ended December 31, 2009 were comprised of $257.5 million in construction loans, $307.9 million in commercial real estate loans, $79.7 million in commercial business loans including SBA loans, $60.7 million in single family loans, $47.9 million in multifamily loans, $1.3 million in automobile and other consumer loans, and $6.1 million in trade finance loans.
All loans that were past due 90 days or more were on nonaccrual status at December 31, 2009 and 2008.
The Company had $109.1 million and $11.0 million in restructured loans as of December 31, 2009 and 2008, respectively. As of December 31, 2009, restructured loans were comprised of $15.6 million in single family loans, $56.8 million in multifamily loans, $16.9 million in commercial real estate loans, $6.9 million in commercial business loans, $60 thousand in SBA loans, and $12.8 million in construction loans.
Non-covered other real estate owned includes properties acquired through foreclosure or through full or partial satisfaction of loans. We had 28 OREO properties at December 31, 2009, with a combined aggregate carrying value of $13.8 million. The majority of these properties were related to our land, residential construction and single family residence portfolios. Approximately 53% of OREO properties as of December 31, 2009 were located in the Greater Los Angeles area and Inland Empire region of Southern California. As of December 31, 2008, we had 41 OREO properties with a carrying value of $38.3 million. During 2009, we foreclosed on 130 properties with an aggregate carrying value of $119.0 million as of the foreclosure date. During 2009, we sold 142 OREO properties with a carrying value before charge-offs of $140.3 million and transferred one OREO to Affordable Housing Investments for $3.2 million resulting in a total net loss of $5.4 million. During 2008, we foreclosed on 70 properties with an aggregate carrying value of $83.6 million as of the foreclosure date. During 2008, we sold 29 OREO properties with a carrying value of $44.5 million resulting in a total net loss on sale of $852 thousand.
77
The following table sets forth information regarding nonaccrual loans, loans past due 90 days or more but not on nonaccrual, restructured loans and other real estate owned as of the dates indicated:
Table 17: Nonperforming Assets
| |
December 31, | ||||||||||||||||
|---|---|---|---|---|---|---|---|---|---|---|---|---|---|---|---|---|---|
| |
2009 | 2008 | 2007 | 2006 | 2005 | ||||||||||||
| |
(Dollars in thousands) |
||||||||||||||||
Nonaccrual loans |
$ | 173,180 | $ | 214,607 | $ | 63,882 | $ | 17,101 | $ | 24,149 | |||||||
Loans past due 90 days or more but not on nonaccrual |
- | - | - | - | 5,670 | ||||||||||||
Total nonperforming loans |
173,180 | 214,607 | 63,882 | 17,101 | 29,819 | ||||||||||||
Other real estate owned, net |
13,832 | 38,302 | 1,500 | 2,786 | 299 | ||||||||||||
Total nonperforming assets |
$ | 187,012 | $ | 252,909 | $ | 65,382 | $ | 19,887 | $ | 30,118 | |||||||
Total nonperforming assets to total assets |
0.91 | % | 2.04 | % | 0.55 | % | 0.18 | % | 0.36 | % | |||||||
Allowance for loan losses to nonperforming loans |
137.91 | % | 82.95 | % | 138.39 | % | 457.29 | % | 230.17 | % | |||||||
Nonperforming loans to total gross covered loans |
2.04 | % | 2.60 | % | 0.72 | % | 0.21 | % | 0.44 | % | |||||||
Performing restructured loans |
114,013 | 10,992 | 2,081 | - | - | ||||||||||||
Covered nonperforming assets totaled $719.9 million, representing 3.50% of total assets at December 31, 2009. These covered nonperforming assets are subject to the shared-loss agreement with the FDIC.
We evaluate loan impairment according to the provisions of ASC 310-10-35 (previously SFAS No. 114). Under ASC 310-10-35, loans are considered impaired when it is probable that we will be unable to collect all amounts due according to the contractual terms of the loan agreement, including scheduled interest payments. Impaired loans are measured based on the present value of expected future cash flows discounted at the loan's effective interest rate or, as an expedient, at the loan's observable market price or the fair value of the collateral if the loan is collateral dependent, less costs to sell. If the measure of the impaired loan is less than the recorded investment in the loan, the deficiency will be charged off against the allowance for loan losses or, alternatively, a specific allocation will be established. Also, in accordance with ASC 310-10-35, loans that are considered impaired are specifically excluded from the quarterly migration analysis when determining the amount of the allowance for loan and lease losses required for the period.
At December 31, 2009, the Company's total recorded investment in impaired loans was $191.5 million, compared with $232.1 million at December 31, 2008. The decrease in impaired loans is largely due to a decrease in nonperforming residential construction loans. All nonaccrual and doubtful loans are included in impaired loans. Impaired loans at December 31, 2009 are comprised of single family loans totaling $3.3 million, multifamily loans totaling $10.6 million, commercial real estate loans totaling $105.6 million, construction loans totaling $34.3 million, commercial business loans totaling $37.4 million, SBA loans totaling $11 thousand, and automobile and other consumer loans totaling $260 thousand. As of December 31, 2009, the allowance for loan losses included $19.6 million for impaired loans with a total recorded balance of $47.6 million. As of December 31, 2008, the allowance for loan losses included $23.4 million for impaired loans with a total recorded balance of $69.2 million.
Our average recorded investment in impaired loans during 2009 and 2008 totaled $227.2 million and $266.5 million, respectively. During 2009 and 2008, gross interest income that would have been recorded on impaired loans, had they performed in accordance with their original terms, totaled
78
$13.7 million and $19.0 million, respectively. Of this amount, actual interest recognized on impaired loans, on a cash basis, was $10.2 million and $11.6 million, respectively.
In light of the credit and mortgage crisis affecting the entire financial industry and its impact on our borrowers, the Company has taken a more proactive approach to assess potential loan impairment in our overall portfolio. We have expanded our scope to perform focused reviews of certain sectors of our loan portfolio to identify and mitigate potential losses. Our recent experience made us aware of the rapid deterioration occurring in the market in a relatively short period of time. Specifically, we have noted that while our borrowers may continue to pay as agreed in accordance with their contractual terms and/or even though loans may not have reached a significant stage of delinquency, the existence of certain warning signs indicating possible collectibility issues warranted a more careful scrutiny of these loans for potential impairment. Specifically, we reviewed loans that exhibited the following characteristics:
- •
- diminishing or adverse changes in cash flows that serve as the principal source of repayment;
- •
- adverse changes in the financial position or net worth of guarantors or investors;
- •
- adverse changes in collateral values for collateral-dependent loans;
- •
- declining or adverse changes in inventory levels securing commercial business and trade finance;
- •
- failure in meeting financial covenants; or
- •
- other changes or conditions that may adversely impact the ultimate collectibility of loans.
Although certain loans are not 90 days or more delinquent and therefore still accruing interest, we have classified them as impaired as of December 31, 2009 because they exhibit one or more of the characteristics described above.
Allowance for Loan Losses
We are committed to maintaining the allowance for loan losses at a level that is commensurate with estimated and known risks in the loan portfolio. In addition to regular, quarterly reviews of the adequacy of the allowance for loan losses, management performs an ongoing assessment of the risks inherent in the loan portfolio. While we believe that the allowance for loan losses is adequate at December 31, 2009, future additions to the allowance will be subject to a continuing evaluation of estimated and known, as well as inherent, risks in the loan portfolio.
The allowance for loan losses is increased by the provision for loan losses which is charged against current period operating results, and is increased or decreased by the amount of net recoveries or chargeoffs, respectively, during the year. At December 31, 2009, the allowance for loan losses amounted to $238.8 million, or 2.81% of total loans, compared with $178.0 million, or 2.16% of total loans, at December 31, 2008. The $60.8 million increase in the allowance for loan losses at December 31, 2009, from year-end 2008, reflects $528.7 million in additional loss provisions, less $475.3 million in net chargeoffs during the year. The allowance for unfunded loan commitments, off-balance-sheet credit exposures, and recourse provisions is included in accrued expenses and other liabilities and amounted to $8.1 million at December 31, 2009, compared to $6.3 million at December 31, 2008. The increase in the off-balance sheet allowance amount was primarily due to the increase in loss percentage allocated for loans sold/securitized with recourse and unfunded commitments at December 31, 2009 relative to year-end 2008.
We recorded $528.7 million in loan loss provisions during 2009, as compared to $226.0 million in loss provisions recorded during 2008. The increase in loss provisions recorded during 2009, compared to 2008, was brought on by the sustained downturn in the real estate market and continued instability
79
in the overall economy. During 2009, we recorded $475.3 million in net chargeoffs representing 5.69% of average non-covered loans outstanding during the year. In comparison, we recorded net chargeoffs totaling $141.4 million, or 1.64% of average loans outstanding, during 2008. Also during the year we had note sale proceeds of $358.4 million on notes with a carrying value of $473.7 million. The difference between the carrying value and the sale amount was charged against the allowance for loan losses. Given the trends we are seeing in the loan portfolio, it is expected that provision for loan losses and net charge-offs will continue to decrease throughout 2010.
The following table summarizes activity in the allowance for loan losses for the periods indicated:
Table 18: Allowance for Loan Losses
| |
At or for the Year Ended December 31, | |||||||||||||||||
|---|---|---|---|---|---|---|---|---|---|---|---|---|---|---|---|---|---|---|
| |
2009 | 2008 | 2007 | 2006 | 2007 | |||||||||||||
| |
(Dollars in thousands) |
|||||||||||||||||
Allowance balance, beginning of year |
$ | 178,027 | $ | 88,407 | $ | 78,201 | $ | 68,635 | $ | 50,884 | ||||||||
Allowance from acquisitions |
- | - | 4,125 | 4,084 | 9,290 | |||||||||||||
Allowance for unfunded loan commitments and letters of credit |
(1,778 |
) |
5,044 |
841 |
(1,168 |
) |
(2,738 |
) |
||||||||||
Provision for loan losses |
528,666 | 226,000 | 12,000 | 6,166 | 15,870 | |||||||||||||
Impact of desecuritization |
9,262 | - | - | - | - | |||||||||||||
Gross chargeoffs: |
||||||||||||||||||
Residential single family |
33,778 | 3,522 | 335 | 3 | 168 | |||||||||||||
Multifamily real estate |
20,153 | 1,966 | - | - | - | |||||||||||||
Commercial and industrial real estate |
159,969 | 53,459 | - | - | 1,899 | |||||||||||||
Construction |
206,732 | 57,629 | 2,810 | - | - | |||||||||||||
Commercial business |
53,152 | 24,639 | 3,740 | 236 | 1,428 | |||||||||||||
Trade finance |
6,868 | 5,707 | 249 | 205 | 2,821 | |||||||||||||
Automobile |
85 | 268 | 30 | 46 | 97 | |||||||||||||
Other consumer |
4,519 | 261 | 42 | 25 | 29 | |||||||||||||
Total gross chargeoffs |
485,256 | 147,451 | 7,206 | 515 | 6,442 | |||||||||||||
Gross recoveries: |
||||||||||||||||||
Residential single family |
771 | 37 | - | 2 | 23 | |||||||||||||
Residential multifamily |
617 | - | - | - | 90 | |||||||||||||
Commercial and industrial real estate |
2,213 | 2,467 | 7 | 749 | 34 | |||||||||||||
Construction |
3,312 | 2,654 | - | - | - | |||||||||||||
Commercial business |
2,684 | 835 | 419 | 238 | 380 | |||||||||||||
Trade finance |
237 | 9 | - | - | 1,124 | |||||||||||||
Automobile |
50 | 25 | 20 | 5 | 119 | |||||||||||||
Other consumer |
28 | - | - | 5 | 1 | |||||||||||||
Total gross recoveries |
9,912 | 6,027 | 446 | 999 | 1,771 | |||||||||||||
Net chargeoffs (recoveries) |
475,344 | 141,424 | 6,760 | (484 | ) | 4,671 | ||||||||||||
Allowance balance, end of year |
$ | 238,833 | $ | 178,027 | $ | 88,407 | $ | 78,201 | $ | 68,635 | ||||||||
Average loans outstanding |
$ | 8,355,825 | $ | 8,601,825 | $ | 8,354,989 | $ | 7,828,579 | $ | 5,886,398 | ||||||||
Total gross loans outstanding, end of year |
$ | 8,501,033 | $ | 8,249,453 | $ | 8,845,109 | $ | 8,265,232 | $ | 6,794,025 | ||||||||
Net chargeoffs (recoveries) to average loans |
5.69 | % | 1.64 | % | 0.08 | % | (0.01 | )% | 0.08 | % | ||||||||
Allowance for loan losses to total gross loans at end of year |
2.81 | % | 2.16 | % | 1.00 | % | 0.95 | % | 1.01 | % | ||||||||
Our methodology to determine the overall appropriateness of the allowance is based on a classification migration model and qualitative considerations. The technique of migration analysis essentially looks at pools of loans having similar characteristics and analyzes their loss rates over a historical period. In determining the loss rates, we review our historical loss rates for the past twelve
80
quarters. This loss horizon was shortened during 2009 to better reflect the current environment and the Bank's current loan portfolio and loss trends. We utilize historical loss factors derived from trends and losses associated with each pool over a specified period of time. Based on this process, we assign loss factors to each loan grade within each category of loans. Loss rates derived by the migration model are based predominantly on historical loss trends that may not be indicative of the actual or inherent loss potential for loan categories. As such, we utilize qualitative and environmental factors as adjusting mechanisms to supplement the historical results of the classification migration model.
Qualitative considerations include, but are not limited to, prevailing economic or market conditions, relative risk profiles of various loan segments, the strength or deficiency of the internal control environment, volume concentrations, growth trends, delinquency and nonaccrual status, problem loan trends, and geographic concentrations. Qualitative and environmental factors are reflected as percent adjustments and are added to the historical loss rates derived from the classified asset migration model to determine the appropriate allowance amount for each loan category.
In consideration of the significant growth and increasing diversity and credit risk profiles of loans in our portfolio over the past several years, our classification migration model utilizes eighteen risk-rated or heterogeneous loan pool categories and three homogeneous loan categories. The loan sectors included in the heterogeneous loan pools are residential single family, residential multifamily, commercial real estate, construction, commercial business, trade finance, and automobile loans. With the exception of automobile loans, all other heterogeneous loan categories have been broken down into additional subcategories. For example, the commercial real estate loan category is further segmented into six subcategories based on industry sector. These subcategories include retail, office, industrial, land, hotel/motel, and other special purpose or miscellaneous. By sectionalizing these broad loan categories into smaller subgroups, we are better able to isolate and identify the risks associated with each subgroup based on historical loss trends.
In addition to the eighteen heterogeneous loan categories, our classification migration model also utilizes three homogeneous loan categories which encompass predominantly consumer-related credits. Specifically, these homogeneous loan categories are home equity lines, overdraft protection lines, and credit card loans.
The following table reflects the Company's allocation of the allowance for loan losses by loan category and the ratio of each loan category to total loans as of the dates indicated.
Table 19: Allowance for Loan Losses by Loan Category
| |
At December 31, | ||||||||||||
|---|---|---|---|---|---|---|---|---|---|---|---|---|---|
| |
2009 | 2008 | |||||||||||
| |
Amount | % | Amount | % | |||||||||
| |
(Dollars in thousands) |
||||||||||||
Residential single family |
$ | 18,693 | 10.9 | % | $ | 6,178 | 5.9 | % | |||||
Residential multifamily |
19,332 | 12.0 | % | 6,811 | 8.2 | % | |||||||
Commercial and industrial real estate |
110,628 | 46.6 | % | 49,567 | 49.1 | % | |||||||
Construction |
36,963 | 5.4 | % | 60,478 | 15.3 | % | |||||||
Commercial business |
43,774 | 15.1 | % | 40,843 | 14.7 | % | |||||||
Trade finance |
6,713 | 2.6 | % | 12,721 | 4.2 | % | |||||||
Automobile |
75 | 0.1 | % | 282 | 0.1 | % | |||||||
Consumer and other |
2,655 | 7.3 | % | 1,147 | 2.5 | % | |||||||
Total |
$ | 238,833 | 100.0 | % | $ | 178,027 | 100.0 | % | |||||
81
The increase of $60.8 million in the allowance for loan at December 31, 2009, relative to year-end 2008, was primarily due to increased loss estimates and historic losses for individual loan categories. Except for trade finance loans, loss reserves on all loan categories increased, reflecting the downturn in the residential real estate market and deteriorating conditions in the overall economy. Loss reserves for construction and land loans (included in commercial and industrial real estate) increased significantly from December 31, 2008, reflecting the sharp decline in values experienced in these portfolios. The decrease in loss reserves on trade finance loans is in line with the contraction of this portfolio since year-end 2008.
Deposits
We offer a wide variety of deposit account products to both consumer and commercial customers. Total deposits increased $6.85 billion to $14.99 billion at December 31, 2009, as compared to $8.14 billion at December 31, 2008. The increase in deposits was primarily due to the acquisition of $6.53 billion in deposits, at fair value, from the UCB Acquisition. The acquired deposits resulted in the recording of $74.4 million in core deposit intangible. Net deposit growth was comprised of increases in money market accounts of $1.8 billion or 137%, time deposits of $3.16 billion or 67%, noninterest-bearing demand accounts of $998.3 million or 77%, interest-bearing checking accounts of $303.9 million or 84%, and savings accounts of $571.4 million or 136%, during the year.
As of December 31, 2009, time deposits within the Certificate of Deposit Account Registry Service ("CDARS") program increased to $995.0 million, compared to $946.8 million at December 31, 2008. The CDARS program allows customers with deposits in excess of FDIC-insured limits to obtain full coverage on time deposits through a network of banks within the CDARS program. Additionally, we partner with another financial institution to offer a retail sweep product for non-time deposit accounts to provide added deposit insurance coverage for deposits in excess of FDIC-insured limits. Deposits gathered through these programs are considered brokered deposits under current regulatory reporting guidelines.
Public deposits increased 96% to $301.6 million at December 31, 2009, from $153.5 million at December 31, 2008. A large portion of these public funds are comprised of deposits from the State of California.
Time deposits greater than $100 thousand totaled $4.66 billion, representing 31% of the deposit portfolio at December 31, 2009. These accounts, consisting primarily of deposits by consumers, had a weighted average interest rate of 1.89% at December 31, 2009. The following table provides the remaining maturities at December 31, 2009 of time deposits greater than $100 thousand:
Table 20: Time Deposits $100,000 or Greater
| |
(In thousands) | ||||
|---|---|---|---|---|---|
3 months or less |
$ | 2,448,983 | |||
Over 3 months through 6 months |
1,106,693 | ||||
Over 6 months through 12 months |
1,026,880 | ||||
Over 12 months |
76,141 | ||||
Total |
$ | 4,658,697 | |||
82
Borrowings
We utilize a combination of short-term and long-term borrowings to manage our liquidity position. Federal funds purchased generally mature within one business day to six months from the transaction date. At December 31, 2009, we had $22 thousand of federal funds purchased compared to a balance of $28.0 million at December 31, 2008. FHLB advances increased 33% to $1.81 billion as of December 31, 2009, compared to $1.35 billion at December 31, 2008. During 2009, the increase in FHLB advances was primarily related to the UCB Acquisition. During 2008, a portion of the proceeds from the maturities and sales of investment securities, as well as proceeds from our Series A and B preferred stock issuance in April 2008 and December 2008, were used to pay down our borrowings. During the first quarter of 2008, we paid off an FHLB advance totaling $50.0 million prior to its contractual maturity date. During the fourth quarter of 2009, we paid off $750 million of FHLB advances prior to its contractual maturity date and recorded a penalty amount of $2.4 million as an adjustment to interest expense. In accordance with Accounting Principles Bulletin No. 18, Early Extinguishment of Debt, we recorded the penalty amount of $149 thousand as an adjustment to interest expense during the first quarter of 2008. As of December 31, 2009 and 2008, we had no overnight FHLB advances. We entered into several new FHLB advances totaling $680.0 million during 2009. The maturity terms of these advances are 1 year or less with fixed interest rates ranging from 0.3% to 0.5%. FHLB advances totaling $810 million matured during 2009.
In addition to federal funds purchased and FHLB advances, we also utilize securities sold under repurchase agreements ("repurchase agreements") to manage our liquidity position. Repurchase agreements totaled $1.03 billion and $998.4 million as of December 31, 2009 and 2008, respectively. Included in these balances are $31.9 million and $3.4 million in short-term repurchase agreements as of December 31, 2009 and 2008, respectively. The interest rates on these short-term repurchase agreements were 0.51% at December 31, 2009 and ranged from 0.50% to 0.75% as of December 31, 2008. All of the other repurchase agreements are long-term with ten year maturity terms. Repurchase agreements are accounted for as collateralized financing transactions and recorded at the amounts at which the securities were sold. The collateral for these agreements consist of U.S. Government agency and U.S. Government sponsored enterprise debt and mortgage-backed securities. All of these repurchase agreements have an original term of ten years. The rates were generally initially floating rate for a period of time ranging from six months to three years, with the floating interest rates ranging from the three-month Libor minus 80 basis points to the three-month Libor minus 340 basis points. With the exception of one repurchase agreement, the rates have been switched to fixed rates for the remainder of the term, with fixed interest rates ranging from 4.29% to 5.13%. The counterparty has the right to either a one-time call or a quarterly call when the rates change from floating to fixed, for each of the repurchase agreements.
Long-Term Debt
Long-term debt remained at $235.6 million at December 31, 2009 and 2008. Long-term debt is comprised of subordinated debt which qualifies as Tier II capital and junior subordinated debt issued in connection with our various trust preferred securities offerings which qualify as Tier I capital for regulatory purposes.
Off-Balance Sheet Arrangements and Aggregate Contractual Obligations
In the course of our business, we may enter into or be a party to transactions that are not recorded on the balance sheet and are considered to be off-balance sheet arrangements. Off-balance sheet arrangements are any contractual arrangements whereby an unconsolidated entity is a party, under which we have: (1) any obligation under a guarantee contract; (2) a retained or contingent
83
interest in assets transferred to an unconsolidated entity or similar arrangement that serves as credit, liquidity or market risk support to that entity for such assets; (3) any obligation under certain derivative instruments; or (4) any obligation under a material variable interest held by us in an unconsolidated entity that provides financing, liquidity, market risk or credit risk support to us, or engages in leasing, hedging or research and development services with us.
Commitments
As a financial service provider, we routinely enter into commitments to extend credit to customers, such as loan commitments, commercial letters of credit for foreign and domestic trade, standby letters of credit, and financial guarantees. Many of these commitments to extend credit may expire without being drawn upon. The same credit policies are used in extending these commitments as in extending loan facilities to customers. Under some of these contractual agreements, the Company may also have liabilities contingent upon the occurrence of certain events. A schedule of significant commitments to extend credit to customers as of December 31, 2009 is as follows:
Table 21: Significant Commitments
| |
December 31, 2009 | |||
|---|---|---|---|---|
| |
(In thousands) |
|||
Undisbursed loan commitments |
$ | 2,462,195 | ||
Standby letters of credit |
653,030 | |||
Commercial letters of credit |
62,201 | |||
A discussion of significant contractual arrangements under which the Company may be held contingently liable is included in Note 21 to the Company's consolidated financial statements presented elsewhere in this report. In addition, the Company has commitments and obligations under post-retirement benefit plans as described in Note 23 to the Company's consolidated financial statements presented elsewhere in this report.
Contractual Obligations
The following table presents, as of December 31, 2009, the Company's significant fixed and determinable contractual obligations, within the categories described below, by payment date. With the exception of operating lease obligations, these contractual obligations are included in the consolidated balance sheets. The payment amounts represent the amounts and interest contractually due to the recipient.
Table 22: Contractual Obligations
| |
Payment Due by Period | ||||||||||||||||||
|---|---|---|---|---|---|---|---|---|---|---|---|---|---|---|---|---|---|---|---|
| Contractual Obligations | Less than 1 year |
1-3 years | 3-5 years | After 5 years |
Indeterminate Maturity |
Total | |||||||||||||
| |
(In thousands) |
||||||||||||||||||
Deposits |
$ | 7,712,577 | $ | 281,083 | $ | 3,894 | $ | 24,876 | $ | 7,238,938 | $ | 15,261,368 | |||||||
Federal funds purchased |
22 | - | - | - | - | 22 | |||||||||||||
FHLB advances |
856,042 | 178,535 | 281,586 | 627,451 | - | 1,943,614 | |||||||||||||
Securities sold under repurchase agreements |
79,282 | 94,823 | 94,823 | 1,067,637 | - | 1,336,565 | |||||||||||||
Notes payable |
- | - | - | - | 7,366 | 7,366 | |||||||||||||
Long-term debt obligations |
6,190 | 12,380 | 12,380 | 331,250 | - | 362,200 | |||||||||||||
Operating lease obligations |
11,591 | 20,649 | 13,316 | 18,959 | 64,515 | ||||||||||||||
Unrecognized tax benefits |
- | - | - | - | 6,804 | 6,804 | |||||||||||||
Postretirement benefit obligations |
252 | 1,728 | 2,409 | 45,812 | - | 50,201 | |||||||||||||
Total contractual obligations |
$ | 8,665,956 | $ | 589,198 | $ | 408,408 | $ | 2,115,985 | $ | 7,253,108 | $ | 19,032,655 | |||||||
84
Capital Resources
For the year, our primary source of capital was the retention of net after tax earnings and public and private stock offerings totaling $588.6 million, net of issuance costs. At December 31, 2009, stockholders' equity totaled $2.28 billion, a 47% increase from the year-end 2008 balance of $1.55 billion. The increase is comprised of the following: (1) net income of $76.6 million; (2) net unrealized gain on investment securities available-for-sale of $72.8 million; (3) net unrealized gain as a result of desecuritization of $30.6 million; (4) stock compensation costs amounting to $5.3 million related to grants of restricted stock and stock options; (5) net issuance of common stock totaling $263.6 million, representing 36,407,654 shares; and (3) net issuance of Series C Preferred Stock totaling $335.0 million. These transactions were offset by (1) tax provision of $1.0 million from the stock plans; (2) purchase of treasury shares related to vested restricted stock amounting to $430 thousand, representing 37,020 shares; (3) noncredit-related impairment loss on investment securities of $8.2 million and (4) payment of quarterly cash dividends on common stock, accrual and payment of preferred stock dividends, as well as the amortization of preferred stock discount totaling $30.5 million during 2009.
Private Sales of Common Stock
In July 2009, in private placement transactions, two customers of the Bank purchased 5 million newly issued shares of our common stock at a price of $5.50 per share. We received net proceeds of approximately $26.0 million, net of stock issuance costs, in conjunction with this common stock offering. We have registered these shares for resale to the public.
Public Offering of Common Stock
In July 2009, we completed a public offering of 11 million shares of our common stock at a price of $6.35 per share. The underwriter also exercised its option to purchase an additional 1.65 million shares of our common stock. We received net proceeds of approximately $76.7 million, net of stock issuance costs, in conjunction with this common stock offering.
Private Placement
On November 6, 2009, we raised $500.0 million in a private placement of 18,247,012 shares of our common stock, $0.001 par value, and 335,047 shares of our newly authorized Mandatory Convertible Cumulative Non-Voting Perpetual Preferred Stock, Series C, to certain qualified institutional buyers and accredited investors (collectively, the "Investors"). The common stock sold represented 19.9% of our common stock outstanding. The proceeds from this offering was used to bolster the Company's capital in contemplation of the acquisition by the Company's wholly owned subsidiary, East West Bank, of approximately $9.86 billion in assets and $9.57 billion in liabilities of United Commercial Bank from the FDIC, as receiver for United Commercial Bank. For further discussion on the Private Placement, see Note 24 of the Company's consolidated financial statements presented elsewhere in the report.
Risk-Based Capital
We are committed to maintaining capital at a level sufficient to assure our shareholders, our customers and our regulators that our company and our bank subsidiary are financially sound. We are subject to risk-based capital regulations adopted by the federal banking regulators in January 1990. These guidelines are used to evaluate capital adequacy and are based on an institution's asset risk profile and off-balance sheet exposures. According to the regulations, institutions whose Tier I and
85
total capital ratios meet or exceed 6.0% and 10.0%, respectively, are deemed to be "well-capitalized." At December 31, 2009, the Bank's Tier I and total capital ratios were 15.7% and 17.7%, respectively, compared to 13.6% and 15.6%, respectively, at December 31, 2008.
The following table compares East West Bancorp, Inc.'s and East West Bank's actual capital ratios at December 31, 2009, to those required by regulatory agencies for capital adequacy and well-capitalized classification purposes:
Table 23: Regulatory Required Ratios
| |
East West Bancorp |
East West Bank |
Minimum Regulatory Requirements |
Well Capitalized Requirements |
|||||||||
|---|---|---|---|---|---|---|---|---|---|---|---|---|---|
Total Capital (to Risk-Weighted Assets) |
19.8 | % | 17.7 | % | 8.0 | % | 10.0 | % | |||||
Tier 1 Capital (to Risk-Weighted Assets) |
17.9 | % | 15.7 | % | 4.0 | % | 6.0 | % | |||||
Tier 1 Capital (to Average Assets) |
11.7 | % | 10.2 | % | 4.0 | % | 5.0 | % | |||||
ASSET LIABILITY AND MARKET RISK MANAGEMENT
Liquidity
Liquidity management involves our ability to meet cash flow requirements arising from fluctuations in deposit levels and demands of daily operations, which include funding of securities purchases, providing for customers' credit needs and ongoing repayment of borrowings. Our liquidity is actively managed on a daily basis and reviewed periodically by the Asset/Liability Committee and the Board of Directors. This process is intended to ensure the maintenance of sufficient funds to meet the needs of the Bank, including adequate cash flow for off-balance sheet instruments.
Our primary sources of liquidity are derived from financing activities which include the acceptance of customer and brokered deposits, federal funds facilities, repurchase agreement facilities, advances from the Federal Home Loan Bank of San Francisco, and issuances of long-term debt. These funding sources are augmented by payments of principal and interest on loans, the routine liquidation of securities from the available-for-sale portfolio and securitizations of loans. In addition, government programs, such as the FDIC's TLGP, may influence deposit behavior. Primary uses of funds include withdrawal of and interest payments on deposits, originations and purchases of loans, purchases of investment securities, and payment of operating expenses.
During the years ended December 31, 2009, 2008, and 2007, we experienced net cash inflows from operating activities of $152.9 million, $182.4 million, and $224.0 million, respectively. Net cash inflows from operating activities were primarily due to net income earned during the year.
Net cash inflows (outflows) from investing activities totaled $1.20 billion, $(132.7) million, and $(519.4) million during 2009, 2008, and 2007, respectively. Net cash inflows from investing activities for 2009 were due primarily to repayment and redemption of investment securities. Net cash outflows from investing activities for 2008 were due primarily to purchases of investment securities. These factors were partially offset by proceeds from the sale of investment securities and loans, as well as repayments, maturities and redemptions of investment securities. For 2007, net cash outflows from investing activities can be attributed primarily to the growth in our loan portfolio and purchases of available-for-sale securities. These activities were partially offset by repayments, maturities, redemptions and net sales proceeds from investment securities.
86
We experienced net cash outflows from financing activities of $1.39 billion during the year ended December 31, 2009, primarily due to repayment of short-term borrowings.
During 2008, we had net cash inflows from financing activities of $668.8 million primarily due to $500.6 million net proceeds received from the issuance of Series A and Series B preferred stock during April 2008 and December 2008, respectively, as well as the net increase in deposits. As a result of the turbulence in the banking sector, we experienced a notable growth in deposit products that afford greater deposit insurance coverage to deposit customers during the second half of 2008. As of December 31, 2008, time deposits within the CDARS program increased to $946.8 million, compared to $11.7 million at December 31, 2007. The CDARS program allows customers with deposits in excess of FDIC-insured limits to obtain full coverage on time deposits through a network of banks within the CDARS program. Additionally, during the third quarter of 2008, we partnered with another financial institution to implement a new retail sweep product for non-time deposit accounts to provide added deposit insurance coverage for deposits in excess of FDIC-insured limits. Cash from financing activities were partially offset by net decreases in federal funds purchased and FHLB advances, as well as $33.4 million of existing cash and cash equivalents to pay cash dividends to our stockholders.
During 2007, proceeds from federal funds purchased, FHLB advances, and long-term debt accounted for net cash inflows from financing activities totaling $263.2 million. These factors were partially offset by a net decrease in deposits, purchases of treasury shares related to our Board-approved share repurchase program, and dividends paid on common stock.
As a means of augmenting our liquidity, we have available a combination of borrowing sources comprised of the Federal Reserve Bank's discount window, FHLB advances, federal funds lines with various correspondent banks, and several master repurchase agreements with major brokerage companies. During 2009, we obtained additional borrowing capacity from the Federal Reserve discount window of almost $451.8 million by pledging construction and commercial business loans. We believe our liquidity sources to be stable and adequate to meet our day-to-day cash flow requirements. At December 31, 2009, we are not aware of any trends, events or uncertainties that had or were reasonably likely to have a material effect on our liquidity position. As of December 31, 2009, we are not aware of any material commitments for capital expenditures in the foreseeable future.
The liquidity of East West Bancorp, Inc. is primarily dependent on the payment of cash dividends by its subsidiary, East West Bank, subject to limitations imposed by the Financial Code of the State of California. The Bank is permitted to pay dividend to the Company as long as the banking regulatory authorities of the Bank are notified of the proposed dividend and there is non objection language from the banking regulatory authorities. For the years ended December 31, 2009 and 2008, total dividends paid by the Bank to East West Bancorp, Inc. amounted to $23.6 million and $34.8 million, respectively. As of December 31, 2009, approximately $85.8 million of undivided profits of the Bank were available for dividends to the Company. On January 26, 2010, the Board of Directors declared first quarter dividends on the Company's common stock and Series A preferred stock. The Board of Directors authorized common stock dividends of $0.01 per share for the first quarter of 2010.
Interest Rate Sensitivity Management
Our success is largely dependent upon our ability to manage interest rate risk, which is the impact of adverse fluctuations in interest rates on our net interest income and net portfolio value. Although in the normal course of business we manage other risks, such as credit and liquidity risk, we consider interest rate risk to be among the more significant market risks and could potentially have material effect on our financial condition and results of operations.
87
The fundamental objective of the asset liability management process is to manage our exposure to interest rate fluctuations while maintaining adequate levels of liquidity and capital. Our strategy is formulated by the Asset/Liability Committee, which coordinates with the Board of Directors to monitor our overall asset and liability composition. The Committee meets regularly to evaluate, among other things, the sensitivity of our assets and liabilities to interest rate changes, the book and market values of assets and liabilities, unrealized gains and losses on the available-for-sale portfolio (including those attributable to hedging transactions, if any), purchase and securitization activity, and maturities of investments and borrowings.
Our overall strategy is to minimize the adverse impact of immediate incremental changes in market interest rates (rate shock) on net interest income and net portfolio value. Net portfolio value is defined as the present value of assets, minus the present value of liabilities and off-balance sheet instruments. The attainment of this goal requires a balance between profitability, liquidity and interest rate risk exposure. To minimize the adverse impact of changes in market interest rates, we simulate the effect of instantaneous interest rate changes on net interest income and net portfolio value on a quarterly basis. The table below shows the estimated impact of changes in interest rates on net interest income and market value of equity as of December 31, 2009 and 2008, assuming a non-parallel shift of 100 and 200 basis points in both directions:
Table 24: Rate Shock Table
| |
Net Interest Income Volatility (1) |
Net Portfolio Value Volatility (2) |
|||||||||||
|---|---|---|---|---|---|---|---|---|---|---|---|---|---|
| Change in Interest Rates (Basis Points) | December 31, 2009 |
December 31, 2008 |
December 31, 2009 |
December 31, 2008 |
|||||||||
+200 |
1.5 | % | 11.6 | % | -4.3 | % | 8.8 | % | |||||
+100 |
0.3 | % | 5.4 | % | -2.2 | % | 4.4 | % | |||||
-100 |
3.9 | % | -1.6 | % | 1.6 | % | -4.5 | % | |||||
-200 |
6.8 | % | -1.4 | % | 1.1 | % | -9.7 | % | |||||
- (1)
- The percentage change represents net interest income for twelve months in a stable interest rate environment versus net interest income in the various rate scenarios.
- (2)
- The percentage change represents net portfolio value of the Bank in a stable rate environment versus net portfolio value in the various rate scenarios.
All interest-earning assets, interest-bearing liabilities and related derivative contracts are included in the interest rate sensitivity analysis at December 31, 2009 and 2008. At December 31, 2009 and 2008, our estimated changes in net interest income and net portfolio value were within the ranges established by the Board of Directors.
Our primary analytical tool to gauge interest rate sensitivity is a simulation model used by many major banks and bank regulators, and is based on the actual maturity and repricing characteristics of interest-rate sensitive assets and liabilities. The model attempts to predict changes in the yields earned on assets and the rates paid on liabilities in relation to changes in market interest rates. As an enhancement to the primary simulation model, prepayment assumptions and market rates of interest provided by independent broker/dealer quotations, an independent pricing model and other available public sources are incorporated into the model. Adjustments are made to reflect the shift in the Treasury and other appropriate yield curves. The model also factors in projections of anticipated activity levels by product line and takes into account our increased ability to control rates offered on deposit products in comparison to our ability to control rates on adjustable-rate loans tied to the published indices.
88
The following table provides the outstanding principal balances and the weighted average interest rates of our financial instruments as of December 31, 2009. The information presented below is based on the repricing date for variable rate instruments and the expected maturity date for fixed rate instruments.
Table 25: Expected Maturity for Financial Instruments
| |
Expected Maturity or Repricing Date by Year | |
|
|||||||||||||||||||||||
|---|---|---|---|---|---|---|---|---|---|---|---|---|---|---|---|---|---|---|---|---|---|---|---|---|---|---|
| |
2010 | 2011 | 2012 | 2013 | 2014 | After 2015 |
Total | Fair Value at December 31, 2009 |
||||||||||||||||||
| |
(Dollars in thousands) |
|||||||||||||||||||||||||
Assets: |
||||||||||||||||||||||||||
CD investments |
$ | 487,150 | $ | 11,165 | $ | 250 | $ | 498,565 | $ | 498,711 | ||||||||||||||||
average yield (fixed rate) |
0.42 | % | 2.16 | % | 4.00 | % | 0.46 | % | ||||||||||||||||||
Short-term investments |
$ | 262,329 | $ | 262,329 | $ | 262,329 | ||||||||||||||||||||
Weighted average rate |
0.60 | % | 0.60 | % | ||||||||||||||||||||||
Securities purchased under resale agreements |
$ | 227,444 | $ | 227,444 | $ | 232,693 | ||||||||||||||||||||
Weighted average rate |
7.30 | % | 7.30 | % | ||||||||||||||||||||||
Investment securities available-for-sale (fixed rate) |
$ | 437,417 | $ | 244,163 | $ | 133,660 | $ | 197,772 | $ | 192,980 | $ | 151,046 | $ | 1,357,038 | $ | 1,377,032 | ||||||||||
Weighted average rate |
3.39 | % | 3.78 | % | 5.47 | % | 5.52 | % | 4.05 | % | 5.22 | % | 4.27 | % | ||||||||||||
Investment securities available-for-sale (variable rate) (1) |
$ | 607,509 | $ | 267,661 | $ | 249,889 | $ | 38,778 | $ | 41,227 | $ | 940 | $ | 1,206,004 | $ | 1,187,049 | ||||||||||
Weighted average rate |
3.06 | % | 3.99 | % | 4.00 | % | 4.34 | % | 4.67 | % | 4.78 | % | 3.56 | % | ||||||||||||
Total gross loans |
$ | 11,245,657 | $ | 1,518,973 | $ | 719,497 | $ | 343,569 | $ | 189,988 | $ | 1,670,117 | $ | 15,687,801 | $ | 13,801,404 | ||||||||||
Weighted average rate |
5.29 | % | 6.58 | % | 6.65 | % | 6.42 | % | 5.90 | % | 1.40 | %(2) | 5.10 | % | ||||||||||||
Liabilities: |
||||||||||||||||||||||||||
Checking accounts |
$ | 667,177 | $ | 667,177 | $ | 541,243 | ||||||||||||||||||||
Weighted average rate |
0.26 | % | 0.26 | % | ||||||||||||||||||||||
Money market accounts |
$ | 3,138,866 | $ | 3,138,866 | $ | 2,957,312 | ||||||||||||||||||||
Weighted average rate |
0.99 | % | 0.99 | % | ||||||||||||||||||||||
Savings deposits |
$ | 991,520 | $ | 991,520 | $ | 800,726 | ||||||||||||||||||||
Weighted average rate |
0.38 | % | 0.38 | % | ||||||||||||||||||||||
Time deposits |
$ | 7,619,283 | $ | 231,919 | $ | 32,988 | $ | 2,318 | $ | 1,075 | $ | 196 | $ | 7,887,779 | $ | 7,912,384 | ||||||||||
Weighted average rate |
1.60 | % | 2.09 | % | 3.93 | % | 3.47 | % | 2.42 | % | 0.74 | % | 1.62 | % | ||||||||||||
Short term borrowings |
$ | 19 | $ | 19 | $ | 19 | ||||||||||||||||||||
Weighted average rate |
0.05 | % | 0.05 | % | ||||||||||||||||||||||
FHLB advances (term) |
$ | 806,142 | $ | 100,000 | $ | 5,000 | $ | 175,000 | $ | 50,000 | $ | 578,000 | $ | 1,714,142 | $ | 1,791,326 | ||||||||||
Weighted average rate |
3.01 | % | 5.01 | % | 4.46 | % | 4.55 | % | 4.43 | % | 4.26 | % | 3.75 | % | ||||||||||||
Short term repurchase agreements |
$ | 31,870 | $ | 31,870 | $ | 31,870 | ||||||||||||||||||||
Weighted average rate |
0.51 | % | 0.51 | % | ||||||||||||||||||||||
Securities sold under repurchase agreements (fixed rate) |
$ | 945,000 | $ | 945,000 | $ | 1,181,616 | ||||||||||||||||||||
Weighted average rate |
4.80 | % | 4.80 | % | ||||||||||||||||||||||
Securities sold under repurchase agreements (variable rate) |
$ | 50,000 | $ | 50,000 | $ | 52,079 | ||||||||||||||||||||
Weighted average rate |
4.15 | % | 4.15 | % | ||||||||||||||||||||||
Subordinated debt |
$ | 75,000 | $ | 75,000 | $ | 47,736 | ||||||||||||||||||||
Weighted average rate |
1.41 | % | 1.41 | % | ||||||||||||||||||||||
Junior subordinated debt (fixed rate) |
$ | 21,392 | $ | 21,392 | $ | 22,214 | ||||||||||||||||||||
Weighted average rate |
10.91 | % | 10.91 | % | ||||||||||||||||||||||
Junior subordinated debt (variable rate) |
$ | 139,178 | $ | 139,178 | $ | 33,852 | ||||||||||||||||||||
Weighted average rate |
2.01 | % | 2.01 | % | ||||||||||||||||||||||
Other borrowing (variable rate) |
$ | 68,218 | $ | 68,218 | $ | 68,040 | ||||||||||||||||||||
Weighted average rate |
2.11 | % | 2.11 | % | ||||||||||||||||||||||
- (1)
- Includes hybrid securities that have fixed interest rates for the first three or five years. Thereafter, interest rates become adjustable based on a predetermined index.
- (2)
- Total
rate sensitive loans = 5.33%;
Total nonrate sensitive loans (non-performing loans) = 0.00%;
Weighted average rate = 1.40%
Expected maturities of assets are contractual maturities adjusted for projected payment based on contractual amortization and unscheduled prepayments of principal as well as repricing frequency. Expected maturities for deposits are based on contractual maturities adjusted for projected rollover rates for deposits with no stated maturity dates. We utilize assumptions supported by documented analyses for the expected maturities of our loans and repricing of our deposits. We also use prepayment projections for amortizing securities. The actual maturities of these instruments could vary significantly if future prepayments and repricing frequencies differ from our expectations based on historical experience.
The fair values of short-term investments approximate their book values due to their short maturities. For securities purchased under resale agreements, fair values are calculated by discounting
89
future cash flows based on expected maturities or repricing dates utilizing estimated market discount rates. The fair values of the investment securities are generally determined by reference to the average of at least two quoted market prices obtained from independent external brokers or prices obtained from independent external pricing service providers who have experience in valuing these securities. In obtaining such valuation information from third parties, the Company has reviewed the methodologies used to develop the resulting fair values. For private label mortgage-backed securities and pooled trust preferred securities, fair values are derived based on a combination of broker prices and discounted cash flow analyses that are weighted as deemed appropriate for each security. The fair value of loans is determined based on the discounted cash flow approach. The discount rate is derived from the associated yield curve plus spreads, and reflects the offering rates in the market for loans with similar financial characteristics.
The fair value of deposits is determined based on the discounted cash flow approach. The discount rate is derived from the associated yield curve, plus spread, if any. For core deposits, the cash outflows are projected by the decay rate based on the Bank's core deposit premium study. Cash flows for all non-time deposits are discounted using the LIBOR yield curve. For time deposits, the cash flows are based on the contractual runoff and are discounted by the Bank's current offering rates, plus spread. For federal funds purchased, fair value approximates book value due to their short maturities. The fair value of FHLB term advances is estimated by discounting the cash flows through maturity or the next repricing date based on current rates offered by the FHLB for borrowings with similar maturities. Customer repurchase agreements, which have maturities ranging from one to three days, are presumed to have equal book and fair values because the interests rates paid on these instruments are based on prevailing market rates. The fair values of securities sold under repurchase agreements are calculated by discounting future cash flows based on expected maturities or repricing dates, utilizing estimated market discount rates and taking into consideration the call features of each instrument. For both subordinated and junior subordinated debt instruments, fair values are estimated by discounting cash flows through maturity based on current market rates the Bank would pay for new issuances.
The Asset/Liability Committee is authorized to utilize a wide variety of off-balance sheet financial techniques to assist in the management of interest rate risk. We may elect to use derivative financial instruments as part of our asset and liability management strategy, with the overall goal of minimizing the impact of interest rate fluctuations on our net interest margin and stockholders' equity. Currently, derivative instruments do not have material effect on our operating results or financial position.
ITEM 7A. QUANTITATIVE AND QUALITATIVE DISCLOSURES ABOUT MARKET RISKS
For quantitative and qualitative disclosures regarding market risks in our portfolio, see "Management's Discussion and Analysis of Consolidated Financial Condition and Results of Operations – Asset Liability and Market Risk Management."
ITEM 8. FINANCIAL STATEMENTS AND SUPPLEMENTARY DATA
The financial statements of the Company, including the "Report of Independent Registered Public Accounting Firm," are included in this report immediately following Part IV.
ITEM 9. CHANGES IN AND DISAGREEMENTS WITH ACCOUNTANTS ON ACCOUNTING AND FINANCIAL DISCLOSURE
During the Company's two most recent fiscal years ended December 31, 2008 and 2007 and from January 1, 2009 through April 2, 2009, there were no disagreements between the Company and
90
Deloitte & Touche LLP, the Company's predecessor auditors, on any matter of accounting principle or practice, financial statement disclosure, or auditing scope or procedure that, if not resolved to Deloitte & Touche LLP's satisfaction, would have caused it to make reference to the matter in conjunction with its report on the Company's consolidated financial statements for the relevant year.
ITEM 9A. CONTROLS AND PROCEDURES
Disclosure Controls and Procedures
As of December 31, 2009, we carried out an evaluation, under the supervision and with the participation of our management, including our Chief Executive Officer and our Chief Financial Officer, of the effectiveness of the design and operation of our disclosure controls and procedures pursuant to Exchange Act Rule 13a-15(e) and 15d-15(e). Based upon that evaluation, our Chief Executive Officer and our Chief Financial Officer concluded that our disclosure controls and procedures are effective as of December 31, 2009.
Our disclosure controls and procedures are designed to ensure that information required to be disclosed by us in the reports that we file or submit under the Exchange Act is recorded, processed, summarized and reported within the time periods specified in the SEC's rules and forms. Our disclosure controls and procedures include, without limitation, controls and procedures designed to ensure that information required to be disclosed by us in the reports that we file under the Exchange Act is accumulated and communicated to our management, including our Chief Executive Officer and Chief Financial Officer, as appropriate, to allow timely decisions regarding required disclosure.
Management's Annual Report on Internal Control over Financial Reporting
Management of the Company is responsible for establishing and maintaining effective internal control over financial reporting as defined in Rules 13a-15(f) under the Securities Exchange Act of 1934. The Company's internal control over financial reporting is designed to provide reasonable assurance to the Company's management and board of directors regarding the preparation and fair presentation of published financial statements.
Because of its inherent limitations, internal control over financial reporting may not prevent or detect misstatements. Therefore, even those systems determined to be effective can provide only reasonable assurance with respect to financial statement preparation and presentation.
Management assessed the effectiveness of the Company's internal control over financial reporting as of December 31, 2009. In making this assessment, management used the criteria set forth in Internal Control – Integrated Framework issued by the Committee of Sponsoring Organizations of the Treadway Commission (COSO). Based on our assessment, we concluded, as of December 31, 2009, the Company's internal control over financial reporting is effective based on those criteria.
Changes in Internal Control over Financial Reporting
There have been no changes in our internal control over financial reporting during the quarter ended December 31, 2009 that have materially affected or is reasonably likely to materially affect our internal control over financial reporting.
Audit Report of the Company's Registered Public Accounting Firm
The independent registered public accounting firm of KPMG LLP, as auditors of East West Bancorp's consolidated financial statements, has issued an audit report on the effectiveness of internal control over financial reporting based on criteria established in Internal Control – Integrated Framework, issued by COSO, which has been presented on the following page.
91
REPORT OF INDEPENDENT REGISTERED PUBLIC ACCOUNTING FIRM
The
Board of Directors and Shareholders
East West Bancorp:
We have audited East West Bancorp's (the Corporation) internal control over financial reporting as of December 31, 2009, based on criteria established in the Internal Control – Integrated Framework issued by the Committee of Sponsoring Organizations of the Treadway Commission (COSO). The Corporation's management is responsible for maintaining effective internal control over financial reporting and for its assessment of the effectiveness of internal control over financial reporting, included in the accompanying Management's Report on Internal Controls Over Financial Reporting. Our responsibility is to express an opinion on the Corporation's internal control over financial reporting based on our audit.
We conducted our audit in accordance with the standards of the Public Company Accounting Oversight Board (United States). Those standards require that we plan and perform the audit to obtain reasonable assurance about whether effective internal control over financial reporting was maintained in all material respects. Our audit included obtaining an understanding of internal control over financial reporting, assessing the risk that a material weakness exists, and testing and evaluating the design and operating effectiveness of internal control based on the assessed risk. Our audit also included performing such other procedures as we considered necessary in the circumstances. We believe that our audit provides a reasonable basis for our opinion.
A company's internal control over financial reporting is a process designed to provide reasonable assurance regarding the reliability of financial reporting and the preparation of financial statements for external purposes in accordance with generally accepted accounting principles. A company's internal control over financial reporting includes those policies and procedures that (1) pertain to the maintenance of records that, in reasonable detail, accurately and fairly reflect the transactions and dispositions of the assets of the company; (2) provide reasonable assurance that transactions are recorded as necessary to permit preparation of financial statements in accordance with generally accepted accounting principles, and that receipts and expenditures of the company are being made only in accordance with authorizations of management and directors of the company; and (3) provide reasonable assurance regarding prevention or timely detection of unauthorized acquisition, use, or disposition of the company's assets that could have a material effect on the financial statements.
Because of its inherent limitations, internal control over financial reporting may not prevent or detect misstatements. Also, projections of any evaluation of effectiveness to future periods are subject to the risk that controls may become inadequate because of changes in conditions, or that the degree of compliance with the policies or procedures may deteriorate.
In our opinion, East West Bancorp maintained, in all material respects, effective internal control over financial reporting as of December 31, 2009, based on criteria established in the Internal Control – Integrated Framework issued by the Committee of Sponsoring Organizations of the Treadway Commission (COSO).
We also have audited, in accordance with the standards of the Public Company Accounting Oversight Board (United States), the consolidated balance sheet of East West Bancorp and subsidiaries as of December 31, 2009, and the related consolidated statements of operations, changes in stockholders' equity and comprehensive income and cash flows for the year ended December 31, 2009, and our report dated February 26, 2010 expressed an unqualified opinion on those consolidated financial statements.
/s/KPMG LLP
Los
Angeles, California
February 26, 2010
92
None.
93
ITEM 10. DIRECTORS, EXECUTIVE OFFICERS AND CORPORATE GOVERNANCE
Information concerning directors and executive officers of the Company, to the extent not included under Item 1 under the heading "Executive Officers of the Registrant" appearing at the end of Part I of this report, will appear in the Company's definitive proxy statement for the 2010 Annual Meeting of Shareholders (the "2010 Proxy Statement"), and such information either shall be (i) deemed to be incorporated herein by reference from the section entitled "ELECTION OF DIRECTORS," if filed with the SEC pursuant to Regulation 14A not later than 120 days after the end of the Company's most recently completed fiscal year, or (ii) included in an amendment to this report filed with the SEC on Form 10-K/A not later than the end of such 120 day period. Additionally, information on compensation arrangements for the Board of Directors of the Company is set forth as Exhibit 10.12 "Director Compensation."
Code of Ethics
The Company has adopted a code of ethics that applies to its principal executive officer, principal financial and accounting officer, controller, and persons performing similar functions. The code of ethics is posted on our internet website at www.eastwestbank.com.
Audit Committee Financial Experts
The Company has determined that all members of the Audit Committee, namely Directors Andrew Kane, John Lee, Herman Li and Keith Renken are "Audit Committee Financial Experts" as defined under Section 407 of the Sarbanes-Oxley Act of 2002 and the rules promulgated by the SEC in furtherance of Section 407. All members of the Audit Committee are independent of management.
ITEM 11. EXECUTIVE COMPENSATION
Information concerning executive compensation of the Company's named executives will appear in the 2010 Proxy Statement, and such information either shall be (i) deemed to be incorporated herein by reference from the sections entitled "DIRECTOR COMPENSATION" "COMPENSATION OF EXECUTIVE OFFICERS," "COMPENSATION DISCUSSION AND ANALYSIS," and "REPORT BY THE COMPENSATION COMMITTEE," if filed with the SEC pursuant to Regulation 14A not later than 120 days after the end of the Company's most recently completed fiscal year, or (ii) included in an amendment to this report filed with the SEC on Form 10-K/A not later than the end of such 120 day period.
ITEM 12. SECURITY OWNERSHIP OF CERTAIN BENEFICIAL OWNERS AND MANAGEMENT AND RELATED STOCKHOLDER MATTERS
Information concerning security ownership of certain beneficial owners and management will appear in the 2010 Proxy Statement, and such information either shall be (i) deemed to be incorporated herein by reference from the sections entitled "BENEFICIAL STOCK OWNERSHIP OF PRINCIPAL STOCKHOLDERS AND MANAGEMENT" if filed with the SEC pursuant to Regulation 14A not later than 120 days after the end of the Company's most recently completed fiscal year, or (ii) included in an amendment to this report filed with the SEC on Form 10-K/A not later than the end of such 120 day period.
94
Securities Authorized for Issuance Under Equity Compensation Plans
The following table provides information as of December 31, 2009 regarding equity compensation plans under which equity securities of the Company were authorized for issuance.
| Plan Category | Number of securities to be issued upon exercise of outstanding options, warrants and rights (a) |
Weighted average exercise price of outstanding options, warrants and rights (b) |
Number of securities remaining available for future issuance under equity compensation plans excluding securities reflected in Column (a) (c) |
|||||||
|---|---|---|---|---|---|---|---|---|---|---|
Equity compensation plans approved by security holders |
1,927,515 | $ | 21.59 | 3,624,702 | ||||||
Equity compensation plans not approved by security holders |
- | - | - | |||||||
Total |
1,927,515 | $ | 21.59 | 3,624,702 | ||||||
ITEM 13. CERTAIN RELATIONSHIPS AND RELATED TRANSACTIONS AND DIRECTOR INDEPENDENCE
Information concerning certain relationships and related transactions will appear in the 2010 Proxy Statement, and such information either shall be (i) deemed to be incorporated herein by reference from the section entitled "CERTAIN RELATIONSHIPS AND RELATED TRANSACTIONS," if filed with the SEC pursuant to Regulation 14A not later than 120 days after the end of the Company's most recently completed fiscal year, or (ii) included in an amendment to this report filed with the SEC on Form 10-K/A not later than the end of such 120 day period.
ITEM 14. PRINCIPAL ACCOUNTANT FEES AND SERVICES
Information concerning principal accountant fees and services will appear in the 2010 Proxy Statement, and such information either shall be (i) deemed to be incorporated herein by reference from the section entitled "INDEPENDENT REGISTERED PUBLIC ACCOUNTING FIRM," if filed with the SEC pursuant to Regulation 14A not later than 120 days after the end of the Company's most recently completed fiscal year, or (ii) included in an amendment to this report filed with the SEC on Form 10-K/A not later than the end of such 120 day period.
95
ITEM 15. EXHIBITS AND FINANCIAL STATEMENT SCHEDULES
(a)(1) Financial Statements
The following financial statements included in the registrant's 2009 Annual Report to Shareholders are included. Page number references are to the 2009 Annual Report to Shareholders.
(a)(2) Financial Statement Schedules
Schedules have been omitted because they are not applicable, not material or because the information is included in the consolidated financial statements or the notes thereto.
(a)(3) Exhibits
Exhibit No.
|
Exhibit Description
|
|
|---|---|---|
| 3.1 | Certificate of Incorporation of the Registrant [Incorporated by reference from Registrant's Registration Statement on Form S-4 filed with the Commission on September 17, 1998 (File No. 333-63605).] | |
| 3.2 | Certificate of Amendment to Certificate of Incorporation of the Registrant [Incorporated by reference from Registrant's Annual Report on Form 10-K for the year ended December 31, 2002 filed with the Commission on March 28, 2003.] | |
| 3.3 | Amendment to the Certification of Incorporation of the Registrant [Incorporated by reference from Registrant's Definitive Proxy Statement on Schedule 14A filed with the Commission on April 15, 2005.] | |
| 3.4 | Certificate of Amendment to Certificate of Incorporation of the Registrant [Incorporated by reference from Registrant's Exhibit A of the Registrant's Definitive Proxy Statement on Schedule 14A filed with the Commission on April 24, 2008.] | |
| 3.5 | Bylaws of the Registrant [Incorporated by reference from Registrant's Registration Statement on Form S-4 filed with the Commission on September 17, 1998 (File No. 333-63605).] | |
| 3.6 | Amended and Restated Bylaws of the Registrant dated May 29, 2008 [Incorporated by reference from Registrant's Current Report on Form 8-K, filed with the Commission on June 3, 2008.] | |
| 3.7 | Certificate of Designations of 8.00% Non-Cumulative Perpetual Convertible Preferred Stock, Series A, including Form of Series A Preferred Stock Certificate [Incorporated by reference from Registrant's Current Report on Form 8-K, filed with the Commission on April 30, 2008.] |
96
| 3.8 | Certificate of Designations of Fixed Rate Cumulative Perpetual Preferred Stock, Series B [Incorporated by reference from Registrant's Current Report on Form 8-K, filed with the Commission on December 9, 2008.] | |
| 3.9 | Certificate of Designations of Mandatory Convertible Cumulative Non-Voting Perpetual Preferred Stock, Series C [Incorporated by reference from Registrant's Current Report on Form 8-K, filed with the Commission on November 12, 2009.] | |
| 4.1 | Specimen Common Stock Certificate of Registrant [Incorporated by reference from Registrant's Registration Statement on Form S-4 filed with the Commission on September 17, 1998 (File No. 333-63605).] | |
| 4.2 | Form of Certificate of the Registrant's 8.00% Non-Cumulative Perpetual Convertible Preferred Stock, Series A [Incorporated by reference from Registrant's Current report on Form 8-K, filed with the Commission on April 30, 2008.] | |
| 4.3 | Form of Preferred Share Certificate for Fixed Rate Cumulative Perpetual Preferred Stock, Series B. [Incorporated by reference from Registrant's Current report on Form 8-K, filed with the Commission on December 9, 2008.] | |
| 4.4 | Warrant to purchase up to 3,035,109 shares of Common Stock [Incorporated by reference from Registrant's Current Report on Form 8-K, filed with the Commission on December 9, 2008.] | |
| 10.1 | Employment Agreement with Dominic Ng+ [Incorporated by reference from Registrant's Registration Statement on Form S-4 filed with the Commission on November 13, 1998 (File No. 333-63605).] | |
| 10.2 | Employment Agreement with Julia Gouw+ [Incorporated by reference from Registrant's Registration Statement on Form S-4 filed with the Commission on November 13, 1998 (File No. 333-63605).] | |
| 10.5 | Employment Agreement with Douglas P. Krause+ [Incorporated by reference from Registrant's Annual Report on Form 10-K for the year ended December 31, 2005 filed with the Commission on March 11, 2005.] | |
| 10.6.1 | East West Bancorp, Inc. 1998 Stock Incentive Plan and Forms of Agreements+ [Incorporated by reference from Registrant's Registration Statement on Form S-4 filed with the Commission on November 13, 1998 (File No. 333-63605).] | |
| 10.6.2 | Amended East West Bancorp, Inc. 1998 Stock Incentive Plan+ [Incorporated by reference from Registrant's Current Report on Form 8-K filed with the Commission on March 9, 2005.] | |
| 10.6.3 | 1998 Non-Qualified Stock Option Program for Employees and Independent Contractors+ [Incorporated by reference from Registrant's Current Report on Form 8-K filed with the Commission on March 9, 2005.] | |
| 10.6.4 | Performance-Based Bonus Plan+ [Incorporated by reference from Registrant's Current Report on Form 8-K filed with the Commission on March 9, 2005.] | |
| 10.6.5 | 1999 Spirit of Ownership Restricted Stock Program+ [Incorporated by reference from Registrant's Current Report on Form 8-K filed with the Commission on March 9, 2005.] | |
| 10.6.6 | 2003 Directors' Restricted Stock Program+ [Incorporated by reference from Registrant's Current Report on Form 8-K filed with the Commission on March 9, 2005.] | |
| 10.7 | East West Bancorp, Inc. 1998 Employee Stock Purchase Plan+ [Incorporated by reference from Registrant's Registration Statement on Form S-4 filed with the Commission on November 13, 1998 (File No. 333-63605).] | |
| 10.8 | Employment Agreement with William J. Lewis+ [Incorporated by reference from Registrant's Annual Report on Form 10-K for the year ended December 31, 2005 filed with the Commission on March 11, 2005.] | |
| 10.9.1 | Employment Agreement with Donald Sang Chow+ [Incorporated by reference from Registrant's Annual Report on Form 10-K for the year ended December 31, 1999 filed with the Commission on March 30, 2000.] |
97
| 10.9.2 | Amendment to Employment Agreement with Donald Sang Chow+ [Incorporated by reference from Registrant's Annual Report on Form 10-K for the year ended December 31, 1999 filed with the Commission on March 30, 2000.] | |
| 10.9.3 | Amendment to Employment Agreement with Donald Sang Chow+ [Incorporated by reference from Registrant's Annual Report on Form 10-K for the year ended December 31, 2005 filed with the Commission on March 11, 2005.] | |
| 10.10 | Supplemental Executive Retirement Plans+ [Incorporated by reference from Registrant's Annual Report on Form 10-K for the year ended December 31, 2005 filed with the Commission on March 11, 2005.] | |
| 10.11 | Employment Agreement with Wellington Chen+ [Incorporated by reference from Registrant's Annual Report on Form 10-K for the year ended December 31, 2005 filed with the Commission on March 11, 2005.] | |
| 10.12 | Director Compensation%+ | |
| 10.14 | Letter Agreement, dated December 5, 2008, including Securities Purchase Agreement – Standard Terms incorporated by reference therein, by and between the Registrant and the United States Department of Treasury [Incorporated by reference from Registrant's Current report on Form 8-K, filed with the Commission on December 9, 2008.] | |
| 10.15 | Form of Investment Agreement by and between the Company and the respective Purchaser thereto [Incorporated by reference from Registrant's Current Report on Form 8-K, filed with the Commission on November 12, 2009.] | |
| 10.16 | Purchase and Assumption Agreement – Whole Bank – All Deposits, among the Federal Deposit Insurance Corporation, Receiver of United Commercial Bank, San Francisco, California, the Federal Deposit Insurance Corporation and East West Bank, dated as of November 6, 2009 [Incorporated by reference from Registrant's Current Report on Form 8-K, filed with the Commission on November 12, 2009.] | |
| 12.1 | Computation of Ratio of Earnings to Fixed Charges% | |
| 21.1 | Subsidiaries of the Registrant% | |
| 23.1 | Consent of Independent Registered Public Accounting Firm KPMG LLP% | |
| 23.2 | Consent of Independent Registered Public Accounting Firm Deloitte and Touche LLP% | |
| 31.1 | Chief Executive Officer Certification Pursuant to Section 302 of the Sarbanes-Oxley Act of 2002% | |
| 31.2 | Chief Financial Officer Certification Pursuant to Section 302 of the Sarbanes-Oxley Act of 2002% | |
| 32.1 | Chief Executive Officer Certification Pursuant to 18 U.S.C. Section 1350, As Adopted Pursuant To Section 906 of the Sarbanes-Oxley Act of 2002% | |
| 32.2 | Chief Financial Officer Certification Pursuant to 18 U.S.C. Section 1350, As Adopted Pursuant To Section 906 of the Sarbanes-Oxley Act of 2002% | |
| 99.1 | Chief Executive Officer Certification Pursuant to Section 111(b)(4) of the Emergency Economic Stabilization Act of 2008, as Amended% | |
| 99.2 | Chief Financial Officer Certification Pursuant to Section 111(b)(4) of the Emergency Economic Stabilization Act of 2008, as Amended% |
Forms 8-K, 10-Q and 10-K identified in the exhibit index have SEC file number 000-24939.
- +
- Denotes management contract or compensatory plan or arrangement.
- %
- A copy of this exhibit is being filed with this Annual Report on Form 10-K.
98
REPORT OF INDEPENDENT REGISTERED PUBLIC ACCOUNTING FIRM
The
Board of Directors and Shareholders
East West Bancorp:
We have audited the accompanying consolidated balance sheet of East West Bancorp and subsidiaries (the Corporation) as of December 31, 2009 and the related consolidated statements of operations, changes in stockholders' equity and comprehensive income, and cash flows for the year ended December 31, 2009. These consolidated financial statements are the responsibility of the Corporation's management. Our responsibility is to express an opinion on these consolidated financial statements based on our audit.
We conducted our audit in accordance with the standards of the Public Company Accounting Oversight Board (United States). Those standards require that we plan and perform the audit to obtain reasonable assurance about whether the financial statements are free of material misstatement. An audit includes examining, on a test basis, evidence supporting the amounts and disclosures in the financial statements. An audit also includes assessing the accounting principles used and significant estimates made by management, as well as evaluating the overall financial statement presentation. We believe that our audit provides a reasonable basis for our opinion.
In our opinion, the consolidated financial statements referred to above present fairly, in all material respects, the financial position of East West Bancorp and subsidiaries as of December 31, 2009 and the results of their operations and their cash flows for the year ended December 31, 2009, in conformity with U.S. generally accepted accounting principles.
We also have audited, in accordance with the standards of the Public Company Accounting Oversight Board (United States), the Corporation's internal control over financial reporting as of December 31, 2009, based on criteria established in the Internal Control-Integrated Framework issued by the Committee of Sponsoring Organizations of the Treadway Commission (COSO), and our report dated February 26, 2010 expressed an unqualified opinion on the effectiveness of the Corporation's internal control over financial reporting,
As discussed in Note 1 to the consolidated financial statements, in 2009 East West Bancorp changed its method of accounting for recognition and presentation of other-than-temporary impairment.
/s/ KPMG LLP
Los
Angeles, California
February 26, 2010
99
REPORT OF INDEPENDENT REGISTERED PUBLIC ACCOUNTING FIRM
To
the Board of Directors and Stockholders of
East West Bancorp, Inc.
Pasadena, California
We have audited the accompanying consolidated balance sheet of East West Bancorp, Inc. and subsidiaries (the "Company") as of December 31, 2008, and the related consolidated statements of operations, changes in stockholders' equity, and cash flows for the years ended December 31, 2008 and 2007. These financial statements are the responsibility of the Company's management. Our responsibility is to express an opinion on these financial statements based on our audits.
We conducted our audits in accordance with the standards of the Public Company Accounting Oversight Board (United States). Those standards require that we plan and perform the audit to obtain reasonable assurance about whether the financial statements are free of material misstatement. An audit includes examining, on a test basis, evidence supporting the amounts and disclosures in the financial statements. An audit also includes assessing the accounting principles used and significant estimates made by management, as well as evaluating the overall financial statement presentation. We believe that our audits provide a reasonable basis for our opinion.
In our opinion, such consolidated financial statements present fairly, in all material respects, the financial position of East West Bancorp, Inc. and subsidiaries as of December 31, 2008, and the results of their operations and their cash flows for the years ended December 31, 2008 and 2007, in conformity with accounting principles generally accepted in the United States of America.
/s/ DELOITTE & TOUCHE LLP
Los
Angeles, California
March 2, 2009 (July 17, 2009 as to the reclassification of segment information for 2008 and 2007 as described in Note 26)
100
EAST WEST BANCORP, INC. AND SUBSIDIARIES
CONSOLIDATED BALANCE SHEETS
(In thousands, except share data)
| |
December 31, | ||||||||
|---|---|---|---|---|---|---|---|---|---|
| |
2009 | 2008 | |||||||
ASSETS |
|||||||||
Cash and cash equivalents |
$ | 835,141 | $ | 878,853 | |||||
Short-term investments |
510,788 | 228,441 | |||||||
Securities purchased under resale agreements |
227,444 | 50,000 | |||||||
Investment securities held-to-maturity, at amortized cost (with fair value of $123,105) |
- | 122,317 | |||||||
Investment securities available for sale, at fair value (with amortized cost of $2,563,043 at December 31, 2009 and $2,189,570 at December 31, 2008) |
2,564,081 | 2,040,194 | |||||||
Loans held for sale, at fair value |
28,014 | - | |||||||
Loans receivable, excluding covered loans (net of allowance for loans of $238,833 in 2009 and $178,027 in 2008) |
8,218,671 | 8,069,377 | |||||||
Covered loans |
5,598,155 | - | |||||||
Total loans receivable, net |
13,816,826 | 8,069,377 | |||||||
FDIC indemnification asset |
1,091,814 | - | |||||||
Other real estate owned, net |
13,832 | 38,302 | |||||||
Other real estate owned covered, net |
44,273 | - | |||||||
Total other real estate owned |
58,105 | 38,302 | |||||||
Accrued interest receivable |
82,370 | 46,230 | |||||||
Due from customer acceptances |
40,550 | 5,538 | |||||||
Investment in affordable housing partnerships |
84,833 | 48,141 | |||||||
Premiums on deposits acquired, net |
89,735 | 21,190 | |||||||
Goodwill |
337,438 | 337,438 | |||||||
Other assets |
792,073 | 536,795 | |||||||
TOTAL |
$ | 20,559,212 | $ | 12,422,816 | |||||
LIABILITIES AND STOCKHOLDERS' EQUITY |
|||||||||
Customer deposit accounts: |
|||||||||
Noninterest-bearing |
$ | 2,291,259 | $ | 1,292,997 | |||||
Interest-bearing |
12,696,354 | 6,848,962 | |||||||
Total deposits |
14,987,613 | 8,141,959 | |||||||
Federal Home Loan Bank advances |
1,805,387 | 1,353,307 | |||||||
Securities sold under repurchase agreements |
1,026,870 | 998,430 | |||||||
Notes payable and other borrowings |
74,406 | 16,506 | |||||||
Bank acceptances outstanding |
40,550 | 5,538 | |||||||
Long term debt |
235,570 | 235,570 | |||||||
Accrued interest payable, accrued expenses and other liabilities |
104,157 | 120,740 | |||||||
Total liabilities |
18,274,553 | 10,872,050 | |||||||
COMMITMENTS AND CONTINGENCIES (Note 20) |
|||||||||
STOCKHOLDERS' EQUITY |
|||||||||
Preferred stock, $0.001 par value, 5,000,000 shares authorized; Series A, non-cumulative convertible, 200,000 shares issued and 85,741 shares outstanding in 2009 and 196,505 shares outstanding in 2008; Series B, cumulative, 306,546 shares issued and outstanding in 2009 and 2008; Series C, cumulative convertible preferred stock 335,047 shares issued and outstanding in 2009. |
693,803 | 472,311 | |||||||
Common stock, $0.001 par value, 200,000,000 shares authorized; 116,754,403 and 70,377,989 shares issued in 2009 and 2008, respectively; 109,962,965 and 63,745,624 shares outstanding in 2009 and 2008, respectively. |
117 | 70 | |||||||
Additional paid in capital |
1,091,047 | 695,521 | |||||||
Retained earnings |
604,223 | 572,172 | |||||||
Treasury stock, at cost – 6,791,438 shares in 2009 and 6,632,365 shares in 2008 |
(105,130 | ) | (102,817 | ) | |||||
Accumulated other comprehensive loss, net of tax |
599 | (86,491 | ) | ||||||
Total stockholders' equity |
2,284,659 | 1,550,766 | |||||||
TOTAL |
$ | 20,559,212 | $ | 12,422,816 | |||||
See accompanying notes to consolidated financial statements.
101
EAST WEST BANCORP, INC. AND SUBSIDIARIES
CONSOLIDATED STATEMENTS OF OPERATIONS
(In thousands, except per share data)
| |
Year Ended December 31, | |||||||||||
|---|---|---|---|---|---|---|---|---|---|---|---|---|
| |
2009 | 2008 | 2007 | |||||||||
INTEREST AND DIVIDEND INCOME |
||||||||||||
Loans receivable, including fees |
$ | 587,163 | $ | 545,260 | $ | 650,717 | ||||||
Investment securities |
116,286 | 100,583 | 102,341 | |||||||||
Securities purchased under resale agreements |
7,985 | 6,372 | 15,064 | |||||||||
Investment in Federal Home Loan Bank stock |
- | 3,639 | 3,464 | |||||||||
Investment in Federal Reserve Bank stock |
2,337 | 1,536 | 1,117 | |||||||||
Short-term investments |
9,047 | 7,468 | 904 | |||||||||
Total interest and dividend income |
722,818 | 664,858 | 773,607 | |||||||||
INTEREST EXPENSE |
||||||||||||
Customer deposit accounts |
129,477 | 178,060 | 241,035 | |||||||||
Federal Home Loan Bank advances |
52,310 | 70,661 | 61,710 | |||||||||
Securities sold under repurchase agreements |
49,725 | 46,062 | 38,366 | |||||||||
Long-term debt |
7,816 | 12,694 | 15,603 | |||||||||
Other borrowings |
171 | 2,217 | 8,899 | |||||||||
Total interest expense |
239,499 | 309,694 | 365,613 | |||||||||
Net interest income before provision for loan losses |
483,319 | 355,164 | 407,994 | |||||||||
Provision for loan losses |
528,666 | 226,000 | 12,000 | |||||||||
Net interest (loss) income after provision for loan losses |
(45,347 | ) | 129,164 | 395,994 | ||||||||
NONINTEREST (LOSS) INCOME |
||||||||||||
Gain on acquisition of United Commercial Bank |
471,009 | - | - | |||||||||
Impairment loss on investment securities |
(121,802 | ) | (73,165 | ) | (405 | ) | ||||||
Less: non-credit related impairment loss recorded in other comprehensive income |
14,131 | - | - | |||||||||
Net impairment loss on investment securities recognozed in earnings |
(107,671 | ) | (73,165 | ) | (405 | ) | ||||||
Decrease in FDIC indemnification asset and receivable |
(23,338 | ) | - | - | ||||||||
Branch fees |
22,326 | 16,972 | 15,071 | |||||||||
Net gain on investment securities available-for-sale |
11,923 | 9,005 | 7,833 | |||||||||
Letters of credit fees and commissions |
8,338 | 9,739 | 10,252 | |||||||||
Ancillary loan fees |
6,286 | 4,646 | 5,773 | |||||||||
Income from life insurance policies |
4,368 | 4,151 | 4,156 | |||||||||
Net gain on sale of loans |
- | 2,275 | 1,571 | |||||||||
Other operating income |
3,312 | 1,315 | 5,269 | |||||||||
Total noninterest income (loss) |
396,553 | (25,062 | ) | 49,520 | ||||||||
NONINTEREST EXPENSE |
||||||||||||
Compensation and employee benefits |
79,475 | 82,236 | 85,926 | |||||||||
Occupancy and equipment expense |
30,218 | 26,991 | 25,582 | |||||||||
Amortization of investments in affordable housing partnerships |
13,050 | 7,272 | 4,958 | |||||||||
Amortization and impairment writedowns of premiums on deposits acquired |
5,895 | 7,270 | 6,846 | |||||||||
Deposit insurance premiums and regulatory assessments |
28,073 | 7,223 | 1,399 | |||||||||
Loan related expenses |
7,580 | 6,373 | 3,049 | |||||||||
Other real estate owned expense (income) |
19,104 | 6,013 | (1,237 | ) | ||||||||
Legal expense |
8,024 | 5,577 | 3,198 | |||||||||
Data processing |
5,641 | 4,494 | 4,818 | |||||||||
Deposit-related expenses |
3,909 | 4,414 | 6,767 | |||||||||
Consulting expense |
8,135 | 4,398 | 3,324 | |||||||||
Other operating expenses |
37,380 | 39,009 | 38,625 | |||||||||
Total noninterest expense |
246,484 | 201,270 | 183,255 | |||||||||
INCOME (LOSS) BEFORE PROVISION (BENEFIT) FOR INCOME TAXES |
104,722 | (97,168 | ) | 262,259 | ||||||||
PROVISION (BENEFIT) FOR INCOME TAXES |
22,714 | (47,485 | ) | 101,092 | ||||||||
NET INCOME (LOSS) BEFORE EXTRAORDINARY ITEMS |
82,008 | (49,683 | ) | 161,167 | ||||||||
Extraordinary item, net of tax |
(5,366 | ) | - | - | ||||||||
NET INCOME (LOSS) AFTER EXTRAORDINARY ITEMS |
76,642 | (49,683 | ) | 161,167 | ||||||||
PREFERRED STOCK DIVIDENDS, INDUCEMENT, AND AMORTIZATION OF PREFERRED STOCK DISCOUNT |
49,115 | 9,474 | - | |||||||||
NET INCOME (LOSS) AVAILABLE TO COMMON STOCKHOLDERS |
$ | 27,527 | $ | (59,157 | ) | $ | 161,167 | |||||
EARNINGS (LOSS) PER SHARE AVAILABLE TO COMMON STOCKHOLDERS |
||||||||||||
BASIC |
$ | 0.35 | $ | (0.94 | ) | $ | 2.63 | |||||
DILUTED |
$ | 0.33 | $ | (0.94 | ) | $ | 2.60 | |||||
DIVIDENDS DECLARED PER COMMON SHARE |
$ | 0.05 | $ | 0.40 | $ | 0.20 | ||||||
WEIGHTED AVERAGE NUMBER OF SHARES OUTSTANDING |
||||||||||||
BASIC |
78,770 | 62,673 | 61,180 | |||||||||
DILUTED |
84,523 | 62,673 | 62,093 | |||||||||
See accompanying notes to consolidated financial statements.
102
EAST WEST BANCORP, INC. AND SUBSIDIARIES
CONSOLIDATED STATEMENTS OF CHANGES IN STOCKHOLDERS' EQUITY AND COMPREHENSIVE INCOME
(In thousands, except share data)
| |
Preferred Stock |
Additional Paid In Capital Preferred Stock |
Common Stock |
Additional Paid In Capital |
Retained Earnings |
Treasury Stock |
Accumulated Other Comprehensive Income (Loss), Net of Tax |
Comprehensive Income (Loss) |
Total Stockholders' Equity |
||||||||||||||||||||
|---|---|---|---|---|---|---|---|---|---|---|---|---|---|---|---|---|---|---|---|---|---|---|---|---|---|---|---|---|---|
BALANCE, JANAURY 1, 2007 |
66 | 544,469 | 525,247 | (40,305 | ) | (10,087 | ) | 1,019,390 | |||||||||||||||||||||
Comprehensive income |
|||||||||||||||||||||||||||||
Net income for the year |
161,167 | $ | 161,167 | 161,167 | |||||||||||||||||||||||||
Net unrealized loss on investment securities available-for-sale |
(28,715 | ) | (28,715 | ) | (28,715 | ) | |||||||||||||||||||||||
Total comprehensive income |
$ | 132,452 | |||||||||||||||||||||||||||
Cumulative effect from the adoption of FIN 48 |
(4,628 | ) | (4,628 | ) | |||||||||||||||||||||||||
Stock compensation costs |
6,767 | 6,767 | |||||||||||||||||||||||||||
Tax benefit from stock plans |
7,457 | 7,457 | |||||||||||||||||||||||||||
Issuance of 1,195,698 shares pursuant to various stock plans and agreements |
2 | 11,791 | 11,793 | ||||||||||||||||||||||||||
Issuance of 5,880 shares in lieu of Board of Director retainer fees |
219 | 219 | |||||||||||||||||||||||||||
Issuance of 2,032,816 shares pursuant to Desert Community Bank acquisition |
2 | 78,484 | 78,486 | ||||||||||||||||||||||||||
Cancellation of 85,603 shares due to forfeitures of issued restricted stock |
3,110 | (3,110 | ) | - | |||||||||||||||||||||||||
Purchase of 39,048 shares of treasury stock due to the vesting of restricted stock |
(1,280 | ) | (1,280 | ) | |||||||||||||||||||||||||
Purchase of 11,624 shares of treasury stock due to granting of unrestricted stock to Desert Community Bank |
(425 | ) | (425 | ) | |||||||||||||||||||||||||
Purchase of 1,392,176 shares of treasury stock pursuant to the Stock Repurchase Program |
(53,805 | ) | (53,805 | ) | |||||||||||||||||||||||||
Dividends paid on common stock |
(24,603 | ) | (24,603 | ) | |||||||||||||||||||||||||
BALANCE, DECEMBER 31, 2007 |
- | 70 | 652,297 | 657,183 | (98,925 | ) | (38,802 | ) | 1,171,823 | ||||||||||||||||||||
Comprehensive loss |
|||||||||||||||||||||||||||||
Net loss for the year |
(49,683 | ) | $ | (49,683 | ) | (49,683 | ) | ||||||||||||||||||||||
Net unrealized loss on investment securities available-for-sale |
(47,689 | ) | (47,689 | ) | (47,689 | ) | |||||||||||||||||||||||
Total comprehensive loss |
$ | (97,372 | ) | ||||||||||||||||||||||||||
Cumulative effect of change in accounting principle pursuant to adoption of EITF 06-4 |
(479 | ) | (479 | ) | |||||||||||||||||||||||||
Stock compensation costs |
6,167 | 6,167 | |||||||||||||||||||||||||||
Tax provision from stock plans |
(414 | ) | (414 | ) | |||||||||||||||||||||||||
Issuance of 200,000 shares Series A convertible |
|||||||||||||||||||||||||||||
preferred stock, net of stock issuance costs |
194,059 | 194,059 | |||||||||||||||||||||||||||
Conversion of 3,495 shares of Series A preferred stock |
(3,391 | ) | (3,391 | ) | |||||||||||||||||||||||||
Issuance of 227,150 shares of common stock from converted 3,495 shares of Series A preferred stock |
3,391 | 3,391 | |||||||||||||||||||||||||||
Issuance of 306,546 shares Series B – fixed rate cumulative perpetual preferred stock, net of stock issuance costs and discount |
281,643 | 281,643 | |||||||||||||||||||||||||||
Issuance of 3,035,109 warrants, pursuant to the Series B preferred stock offering |
25,201 | 25,201 | |||||||||||||||||||||||||||
Issuance of 496,701 shares pursuant to various stock plans and agreements |
2,776 | 2,776 | |||||||||||||||||||||||||||
Issuance of 18,361 shares pursuant to Director retainer fee |
219 | 219 | |||||||||||||||||||||||||||
Cancellation of 113,929 shares due to forfeitures of issued restricted stock |
3,586 | (3,586 | ) | - | |||||||||||||||||||||||||
Purchase accounting adjustment pursuant to DCB Acquisition |
2,298 | 2,298 | |||||||||||||||||||||||||||
Purchase of 20,846 shares of treasury stock due to the vesting of restricted stock |
(306 | ) | (306 | ) | |||||||||||||||||||||||||
Amortization of Series B preferred stock discount |
(312 | ) | (312 | ) | |||||||||||||||||||||||||
Dividends accrued and paid on preferred stock |
(9,162 | ) | (9,162 | ) | |||||||||||||||||||||||||
Dividends paid on common stock |
(25,375 | ) | (25,375 | ) | |||||||||||||||||||||||||
BALANCE, DECEMBER 31, 2008 |
- | 472,311 | 70 | 695,521 | 572,172 | (102,817 | ) | (86,491 | ) | 1,550,766 | |||||||||||||||||||
Cumulative effect adjustment for reclassification of the previously recognized noncredit-related impairment loss on investment securities |
8,110 | (8,110 | ) | - | |||||||||||||||||||||||||
BALANCE, JANUARY 1, 2009 |
- | 472,311 | 70 | 695,521 | 580,282 | (102,817 | ) | (94,601 | ) | 1,550,766 | |||||||||||||||||||
Comprehensive loss |
|||||||||||||||||||||||||||||
Net income for the year |
76,642 | $ | 76,642 | 76,642 | |||||||||||||||||||||||||
Net unrealized gain on investment securities available-for-sale |
72,844 | 72,844 | 72,844 | ||||||||||||||||||||||||||
Net unrealized gain as a result of desuritization |
30,552 | 30,552 | 30,552 | ||||||||||||||||||||||||||
Noncredit related loss on investment securities recorded in the current year |
(8,196 | ) | (8,196 | ) | (8,196 | ) | |||||||||||||||||||||||
Total comprehensive loss |
$ | 171,842 | |||||||||||||||||||||||||||
Stock compensation costs |
5,330 | 5,330 | |||||||||||||||||||||||||||
Tax provision from stock plans |
(1,012 | ) | (1,012 | ) | |||||||||||||||||||||||||
Preferred stock issuance and conversion costs |
(9,928 | ) | (9,928 | ) | |||||||||||||||||||||||||
Common stock issuance costs |
(10,392 | ) | (10,392 | ) | |||||||||||||||||||||||||
Induced conversion of 110,764 shares of preferred stock |
(107,474 | ) | (107,474 | ) | |||||||||||||||||||||||||
Issuance of 9,968,760 shares of Common Stock from converted 110,764 shares of Preferred Stock |
10 | 107,464 | 107,474 | ||||||||||||||||||||||||||
Issuance of 23,247,012 shares of Common Stock from Various Placement |
24 | 192,430 | 192,454 | ||||||||||||||||||||||||||
Issuance of 12,650,000 shares Common Stock from Public Offering |
12 | 80,316 | 80,328 | ||||||||||||||||||||||||||
Issuance of 488,256 shares pursuant to various stock plans and agreements |
1 | 948 | 949 | ||||||||||||||||||||||||||
Issuance of 22,386 shares pursuant to Director retainer fee |
219 | 219 | |||||||||||||||||||||||||||
Issuance of 335,047 shares Series C convertible preferred stock, net of stock issuance costs and discount |
335,047 | 335,047 | |||||||||||||||||||||||||||
Cancellation of 76,962 shares due to forfeitures of issued restricted stock |
1,883 | (1,883 | ) | - | |||||||||||||||||||||||||
Purchase of 37,020 shares of treasury stock due to the vesting of restricted stock |
(430 | ) | (430 | ) | |||||||||||||||||||||||||
Amortization of Series B preferred stock discount |
3,847 | (3,847 | ) | - | |||||||||||||||||||||||||
Preferred stock dividends |
(26,928 | ) | (26,928 | ) | |||||||||||||||||||||||||
Common stock dividends |
(3,586 | ) | (3,586 | ) | |||||||||||||||||||||||||
Inducement of preferred stock conversion |
18,340 | (18,340 | ) | - | |||||||||||||||||||||||||
BALANCE, DECEMBER 31, 2009 |
$ | - | $ | 693,803 | $ | 117 | $ | 1,091,047 | $ | 604,223 | $ | (105,130 | ) | $ | 599 | $ | 2,284,659 | ||||||||||||
| |
Year Ended December 31, | |||||||||
|---|---|---|---|---|---|---|---|---|---|---|
| Disclosure of reclassification amount: |
2009 | 2008 | 2007 | |||||||
| |
(In thousands) |
|||||||||
Unrealized holding gain (loss) on securities arising during the year, net of tax (expense) benefit of $(28,723) in 2009, $61,480 in 2008, and $17,504 in 2007 |
$ | 39,666 | $ | (84,902 | ) | $ | (24,172 | ) | ||
Less: Reclassification adjustment for loss (gain) included in net income, net of tax (benefit) expense of $(46,149) in 2009, $(26,947) in 2008, and $3,290 in 2007 |
63,730 | 37,213 | (4,543 | ) | ||||||
Net unrealized gain (loss) on securities, net of tax (expense) benefit of $(74,872) in 2009, $34,533 in 2008, $20,794 in 2007 |
$ | 103,396 | $ | (47,689 | ) | $ | (28,715 | ) | ||
See accompanying notes to consolidated financial statements.
103
EAST WEST BANCORP, INC. AND SUBSIDIARIES
CONSOLIDATED STATEMENTS OF CASH FLOWS
(In thousands)
| |
Year Ended December 31, | ||||||||||||
|---|---|---|---|---|---|---|---|---|---|---|---|---|---|
| |
2009 | 2008 | 2007 | ||||||||||
CASH FLOWS FROM OPERATING ACTIVITIES |
|||||||||||||
Net (loss) income |
$ | 76,642 | $ | (49,683 | ) | $ | 161,167 | ||||||
Adjustments to reconcile net (loss) income to net cash provided by operating activities: |
|||||||||||||
Depreciation and amortization |
81,901 | 18,096 | 13,869 | ||||||||||
Accretion of discount and premium |
(116,770 | ) | - | - | |||||||||
Gain on acquisition of United Commercial Bank |
(471,009 | ) | - | - | |||||||||
Impairment writedown on goodwill |
- | 858 | - | ||||||||||
Impairment writedown on investment securities available-for-sale |
107,671 | 73,165 | 405 | ||||||||||
Impairment writedown on other investment |
6,181 | 1,319 | - | ||||||||||
Stock compensation costs |
5,549 | 6,167 | 6,767 | ||||||||||
Deferred tax benefit |
127,132 | (83,637 | ) | (17,495 | ) | ||||||||
Provision for loan losses |
528,666 | 226,000 | 12,000 | ||||||||||
Impairment on other real estate owned |
7,759 | 3,609 | - | ||||||||||
Net gain on sales of investment securities, loans and other assets |
(6,340 | ) | (9,851 | ) | (12,460 | ) | |||||||
Federal Home Loan Bank stock dividends |
- | (4,623 | ) | (3,539 | ) | ||||||||
Originations of loans held for sale |
(65,047 | ) | (49,352 | ) | (42,578 | ) | |||||||
Proceeds from sale of loans held for sale |
37,127 | 49,725 | 42,663 | ||||||||||
Tax (benefit) provision from stock plans |
(1,012 | ) | 414 | (7,457 | ) | ||||||||
Net change in accrued interest receivable and other assets |
(126,047 | ) | 22,859 | 64,899 | |||||||||
Net change in accrued expenses and other liabilities |
(39,498 | ) | (22,645 | ) | 5,788 | ||||||||
Total adjustments |
76,263 | 232,104 | 62,862 | ||||||||||
Net cash provided by operating activities |
152,905 | 182,421 | 224,029 | ||||||||||
CASH FLOWS FROM INVESTING ACTIVITIES |
|||||||||||||
Net decrease (increase) in loans |
467,149 | 302,422 | (1,373,150 | ) | |||||||||
Net decrease (increase) in short-term investments |
(282,347 | ) | (228,441 | ) | 1,205 | ||||||||
Purchases of: |
|||||||||||||
Securities purchased under resale agreements |
(30,044 | ) | - | (150,000 | ) | ||||||||
Investment securities held-to-maturity |
(551,608 | ) | (122,185 | ) | - | ||||||||
Investment securities available-for-sale |
(1,976,701 | ) | (2,566,040 | ) | (943,448 | ) | |||||||
Loans receivable |
(530,345 | ) | (103,751 | ) | - | ||||||||
Federal Home Loan Bank stock |
- | (9,400 | ) | (33,829 | ) | ||||||||
Federal Reserve Bank stock |
(9,196 | ) | (5,904 | ) | (3,351 | ) | |||||||
Premises and equipment |
(179 | ) | (3,693 | ) | (11,971 | ) | |||||||
Proceeds from sale of: |
|||||||||||||
Investment securities available-for-sale |
1,650,680 | 699,392 | 541,092 | ||||||||||
Securities purchased under resale agreements |
- | 100,000 | 100,000 | ||||||||||
Covered loans |
129,807 | - | - | ||||||||||
Loans receivable |
169,515 | 183,764 | 23,170 | ||||||||||
Real estate owned |
81,825 | 33,709 | 4,130 | ||||||||||
Premises and equipment |
18 | 85 | 6,745 | ||||||||||
Repayments, maturity and redemption of investment securities available-for-sale |
1,477,470 | 1,576,271 | 1,295,580 | ||||||||||
Redemption of Federal Home Loan Bank stock |
- | 12,270 | 31,767 | ||||||||||
Acquisitions, net of cash (acquired) paid |
599,036 | (1,181 | ) | (7,337 | ) | ||||||||
Net cash provided by (used in) investing activities |
1,195,080 | (132,682 | ) | (519,397 | ) | ||||||||
CASH FLOWS FROM FINANCING ACTIVITIES |
|||||||||||||
Net (payment for) proceeds from: |
|||||||||||||
Deposits |
325,211 | 863,045 | (462,872 | ) | |||||||||
Short-term borrowings |
(2,212,727 | ) | (547,137 | ) | 197,589 | ||||||||
Proceeds from: |
|||||||||||||
Isuance of long-term borrowings |
- | 250,000 | 670,641 | ||||||||||
Issuance of long-term debt |
- | - | 50,000 | ||||||||||
Issuance of common stock pursuant to various stock plans and agreements |
949 | 2,776 | 11,266 | ||||||||||
Issuance of preferred stock, net of stock issuance costs, and common stock warrants |
335,047 | 500,591 | - | ||||||||||
Issuance of common stock from public offering |
80,328 | - | - | ||||||||||
Issuance of common stock from private placement |
192,454 | - | - | ||||||||||
Payment for: |
|||||||||||||
Repayment of long-term borrowings |
- | (355,640 | ) | (123,500 | ) | ||||||||
Repayment of notes payable and other borrowings |
(62,547 | ) | (10,736 | ) | (7,737 | ) | |||||||
Purchase of treasury shares |
(430 | ) | (306 | ) | (55,085 | ) | |||||||
Issuance and conversion costs of preferred stock & common stock |
(20,320 | ) | - | - | |||||||||
Cash dividends on preferred stock |
(26,076 | ) | (8,037 | ) | - | ||||||||
Cash dividends on common stock |
(3,586 | ) | (25,375 | ) | (24,603 | ) | |||||||
Tax (provision) benefit from stock plans |
- | (414 | ) | 7,457 | |||||||||
Net cash (used in) provided by financing activities |
(1,391,697 | ) | 668,767 | 263,156 | |||||||||
NET INCREASE (DECREASE) IN CASH AND CASH EQUIVALENTS |
(43,712 | ) | 718,506 | (32,212 | ) | ||||||||
CASH AND CASH EQUIVALENTS, BEGINNING OF YEAR |
878,853 | 160,347 | 192,559 | ||||||||||
CASH AND CASH EQUIVALENTS, END OF YEAR |
$ | 835,141 | $ | 878,853 | $ | 160,347 | |||||||
SUPPLEMENTAL CASH FLOW INFORMATION: |
|||||||||||||
Cash paid during the year for: |
|||||||||||||
Interest |
$ | 230,667 | $ | 301,744 | $ | 372,230 | |||||||
Income tax payments, net of refunds |
(21,180 | ) | 38,937 | 114,870 | |||||||||
Noncash investing and financing activities: |
|||||||||||||
Transfers from investment securities held-to-maturity to available-for-sale |
681,404 | - | - | ||||||||||
Desecurtization of loans receivable |
635,614 | - | - | ||||||||||
Transfers from real estate owned/ affordable housing partnership |
13,982 | - | - | ||||||||||
Real estate acquired through foreclosure |
135,844 | 83,672 | 1,500 | ||||||||||
Affordable housing investment financed through notes payable |
- | 11,000 | 12,600 | ||||||||||
Loans to facilitate sales of real estate owned |
40,687 | 8,701 | - | ||||||||||
Purchase accounting adjustment in connection with acquisition |
- | 2,298 | - | ||||||||||
Accrued preferred stock dividends |
852 | 1,125 | - | ||||||||||
Amortization of preferred stock discount |
3,847 | 312 | |||||||||||
Issuance of common stock in lieu of Board of Director retainer fees |
219 | 219 | 219 | ||||||||||
Guaranteed mortgage loan securitizations |
- | - | 1,180,160 | ||||||||||
Issuance of equity shares pursuant to acquisition |
- | - | 78,588 | ||||||||||
Equity interests in East West Capital Trusts |
- | - | 1,547 | ||||||||||
See accompanying notes to consolidated financial statements.
104
EAST WEST BANCORP, INC. AND SUBSIDIARIES
NOTES TO CONSOLIDATED FINANCIAL STATEMENTS
1. SUMMARY OF OPERATIONS AND SIGNIFICANT ACCOUNTING POLICIES
OPERATIONS SUMMARY
East West Bancorp, Inc. (referred to herein on an unconsolidated basis as "East West" and on a consolidated basis as the "Company" or "we") is a registered bank holding company that offers a full range of banking services to individuals and small to mid-size businesses through its subsidiary bank, East West Bank and its subsidiaries ("East West Bank" or the "Bank"). The Bank is the Company's principal asset. The Bank operates 111 banking locations throughout California, eight branches in New York, five branches in metropolitan Atlanta, three branches in Massachusetts, two branches in Houston, and two branches in Seattle. In Greater China, the Bank's presence includes four full-service branches, including two in Hong Kong, one in Shanghai, and one in Shantou. The Bank also has representative offices in Beijing, Guangzhou, Shanghai and Shenzhen, China and Taipei, Taiwan.
The Bank specializes in financing international trade and lending for commercial, construction, and residential real estate projects. Included in the Bank's locations are ten in-store branches located in 99 Ranch Market stores in Southern and Northern California. The Bank's revenues are derived from providing financing for residential and commercial real estate and business customers, as well as investing activities. Funding for lending and investing activities is obtained through acceptance of customer deposits, Federal Home Loan Bank advances and other borrowing activities.
As discussed in Note 2, on November 6, 2009 the Bank acquired United Commercial Bank from the FDIC in an FDIC-assisted transaction. This acquisition nearly doubled our asset size and contributed $23.3 million to our total pre-tax income for the period from November 6, 2009 to December 31, 2009. A pre-tax gain of $471.0 million was recorded as a result of the acquisition.
SIGNIFICANT ACCOUNTING POLICIES
Basis of Presentation – The consolidated financial statements are prepared in accordance with accounting principles generally accepted in the United States of America and general practices within the banking industry. The following is a summary of significant principles used in the preparation of the accompanying financial statements. In preparing the financial statements, management of the Company has made a number of estimates and assumptions pertaining to the reporting of assets and liabilities, including the fair value of assets acquired and liabilities assumed (including the FDIC indemnification asset), valuation of OREO, evaluation of goodwill for impairment, the allowance for loan losses, the disclosure of contingent assets and liabilities and the disclosure of income and expenses for the periods presented in conformity with accounting principles generally accepted in the United States of America. Actual results could differ from those estimates.
Principles of Consolidation – The financial statements include the accounts of the Company and its subsidiaries, East West Bank and East West Insurance Services, Inc. All intercompany transactions and accounts have been eliminated in consolidation. The Company also has nine wholly-owned subsidiaries that are statutory business trusts (the "Trusts") that are not consolidated into the accounts of East West Bancorp, Inc.
Fair Value – Fair value is the price that could be received to sell an asset or paid to transfer a liability in an orderly transaction between market participants, and in many cases may require us to make a number of significant judgments. Based on the observability of the inputs used in the valuation
105
techniques, we classify our assets and liabilities measured and disclosed at fair value in accordance with a three-level hierarchy (e.g., Level 1, Level 2 and Level 3) established under ASC 820. In determining the fair value of financial instruments, we use market prices of the same or similar instruments whenever such prices are available. We do not use prices involving distressed sellers in determining fair value. If observable market prices are unavailable or impracticable to obtain, then fair value is estimated using modeling techniques such as discounted cash flow analyses. These modeling techniques incorporate our assessments regarding assumptions that market participants would use in pricing the asset or the liability, including assumptions about the risks inherent in a particular valuation technique and the risk of nonperformance.
Securities Purchased Under Resale Agreements ("Resale Agreements") – The Company purchases securities under resale agreements with terms that range from one day to several years. These agreements are collateralized by mortgage-backed securities and mortgage or commercial loans that are generally held by a third party custodian. The purchases are over-collateralized to ensure against unfavorable market price movements. In the event that the fair value of the securities decreases below the carrying amount of the related repurchase agreement, the counterparty is required to designate an equivalent value of additional securities. The counterparties to these agreements are nationally recognized investment banking firms that meet credit eligibility criteria and with whom a master repurchase agreement has been duly executed. Resale agreements which are short-term in nature, or have terms of up to 90 days, are included in cash and cash equivalents. Resale agreements with terms greater than 90 days are separately categorized. The Company had no short-term resale agreements as of December 31, 2009 and 2008.
Investment Securities – The Company classifies its investment securities according to their purpose and holding period. Trading account securities are typically investment grade securities which are generally held by the Bank for a period of seven days or less. Trading account securities are carried at fair value. Realized and unrealized gains or losses on trading account securities are included in noninterest income. As of December 31, 2009 and 2008, there were no trading account securities in the investment portfolio. Held-to-maturity debt securities are recorded at amortized cost. The Company has the intent and ability to hold such securities to maturity. Investment securities available-for-sale are reported at estimated fair value, with unrealized gains and losses, excluded from operations and reported as a separate component of accumulated other comprehensive income or loss, net of tax, in stockholders' equity.
The fair values of the investment securities are generally determined by reference to the average of at least two quoted market prices obtained from independent external brokers or independent external pricing service providers who have experience in valuing these securities. In obtaining such valuation information from third parties, the Company has evaluated the methodologies used to develop the resulting fair values. The Company performs a monthly analysis on the broker quotes received from third parties to ensure that the prices represent a reasonable estimate of the fair value. The procedures include, but are not limited to, initial and on-going review of third party pricing methodologies, review of pricing trends, and monitoring of trading volumes. The Company ensures whether prices received from independent brokers represent a reasonable estimate of fair value through the use of internal and external cash flow models developed based on spreads, and when available, market indices. As a result of this analysis, if the Company determines there is a more appropriate fair value based upon the available market data, the price received from the third party is adjusted accordingly. Prices from third party pricing services are often unavailable for securities that are rarely traded or are traded only in privately negotiated transactions. As a result, certain securities are priced via independent broker quotations which utilize inputs that may be difficult to corroborate with observable market based data. Additionally, the majority of these independent broker quotations are non-binding.
106
For current broker prices obtained on certain investment securities that the Company believes are based on forced liquidation or distressed sale values in very inactive markets, the Company has modified its approach in determining the fair values of these securities. The Company has determined that each of these securities will be individually examined for the appropriate valuation methodology based on a combination of the market approach reflecting current broker prices and a discounted cash flow approach (income approach). In calculating the fair value derived from the income approach, the Company made assumptions related to the implied rate of return, general change in market rates, estimated changes in credit quality and liquidity risk premium, specific non-performance and default experience in the collateral underlying the security, as well as broker discount rates are taken into consideration in determining the discount rate. The values resulting from each approach (i.e. market and income approaches) are weighted to derive the final fair value for each security trading in an inactive market.
Amortization of premiums and accretion of discounts on securities are recorded as yield adjustments on such securities using the effective interest method. The specific identification method is used for purposes of determining cost in computing realized gains and losses on investment securities sold.
The Company assesses, at each reporting date, whether there is an "other-than-temporary" impairment ("OTTI") in its portfolio of investment securities. If we determine that a decline in fair value is other-than-temporary, an impairment loss is recognized in current earnings. For debt securities for which we have the intent and ability to hold the security for a period necessary to recover the non-credit related impairment losses, only the credit related impairment amount is recognized in earnings. In these instances, the noncredit-related impairment losses are charged to other comprehensive income. The Company examines all individual securities that are in an unrealized loss position at each reporting date for other-than-temporary impairment. Specific investment level factors that are examined to assess impairment include the nature of the investments, severity and duration of the loss, the probability that the Company will be unable to collect all amounts due, an analysis of the issuers of the securities and if there has been any cause for default on the securities and any change in the rating of the securities by the various rating agencies. Additionally, management reexamines the Company's financial resources as well as the Company's overall ability and intent to hold the securities until their fair values recover.
The Company considers all available information relevant to the collectibility of the security, including information about past events, current conditions, and reasonable and supportable forecasts, when developing the estimate of future cash flows and making its other-than-temporary impairment assessment for its portfolio of residual securities and trust preferred securities. The Company considers factors such as remaining payment terms of the security, prepayment speeds, the financial condition of the issuer(s), expected defaults, and the value of any underlying collateral.
Residual Securities – Residual securities represent retained beneficial interests in certain components of cash flows of underlying mortgage loans in connection with the Company's securitization transactions. Residual securities include interest-only mortgage securities and overcollateralization bonds and are reported at their estimated fair values with unrealized gains and losses reported in accumulated other comprehensive income. To the extent that the cost basis of residual securities exceeds the fair value and the unrealized loss is considered to be other-than-temporary, an impairment charge is recognized in earnings.
Interest-only mortgage securities represent the contractual right to receive excess interest cash flows from a pool of securitized mortgage loans. Interest payments received by the independent trust are first applied to the principal and interest bonds (which are generally retained by the Company in its
107
available-for-sale investment portfolio), servicing fees and administrative fees. The excess, if any, is remitted to the Company related to its ownership of the interest-only mortgage security. Overcollateralization bonds represent the contractual right to excess principal payments resulting from over collateralization of the obligations of the trust.
Interest income on residual securities is recognized using a prospective interest method, particularly with reagrd to beneficial interests in securitized financial assets that (a) can contractually be prepaid or otherwise settled in such a way that the Company may not recover substantially all of its recorded investment (such as interest-only strips) or (b) are not of high credit quality at the acquisition date. The excess of all estimated cash flows attributable to these interests over its principal amount is recognized as interest income (throughout the life of the retained interests) using the effective yield method. The Company updates its estimates of expected cash flows periodically and recognizes changes in calculated effective yield on a prospective basis. The estimated cash flows change as management's assumptions for credit losses, borrower prepayments, and interest rates are updated.
Loans Receivable – Loans receivable that the Company has the intent and ability to hold for the foreseeable future, or until maturity, are stated at their outstanding principal, reduced by an allowance for loan losses and net deferred loan fees or costs on originated loans and unamortized premiums or discounts on purchased loans. Nonrefundable fees and direct costs associated with the origination or purchase of loans are deferred and netted against outstanding loan balances. The deferred net loan fees and costs are recognized in interest income as an adjustment to yield over the loan term using the effective interest method. Discounts or premiums on purchased loans are accreted or amortized to interest income using the effective interest method over the remaining period to contractual maturity adjusted for anticipated prepayments. Interest on loans is calculated using the simple-interest method on daily balances of the principal amount outstanding. Accrual of interest is discontinued on a loan when management believes, after considering economic and business conditions and collection efforts, that the borrower's financial condition is such that full collection of principal or interest becomes uncertain, regardless of the length of past due status. Generally, loans are placed on nonaccrual status when they become 90 days past due. When interest accrual is discontinued, all unpaid accrued interest is reversed against interest income. In general, subsequent payments received are applied to the outstanding principal balance of the loan. A loan is returned to accrual status when the borrower has demonstrated a satisfactory payment trend subject to management's assessment of the borrower's ability to repay the loan.
Loans held for sale are carried at the lower of aggregate cost or fair value. Origination fees on loans held for sale, net of certain costs of processing and closing the loans, are deferred until the time of sale and are included in the computation of the gain or loss from the sale of the related loans. A valuation allowance is established if the fair value of such loans is lower than their cost, with a corresponding charge to noninterest income.
Allowance for Loan Losses – The allowance for loan losses is established as management's estimate of probable losses inherent in the loan portfolio. The allowance is increased by the provision for loan losses and decreased by chargeoffs when management believes the uncollectibility of a loan is confirmed. Subsequent recoveries, if any, are credited to the allowance. The allowance for loan losses is evaluated on a regular basis by management and is based upon management's periodic review of the collectibility of the loans in light of historical experience, the nature and volume of the loan portfolio, adverse situations that may affect the borrower's ability to repay, estimated value of any underlying collateral and prevailing economic conditions. This evaluation is inherently subjective as it requires estimates that are susceptible to significant revision as more information becomes available. Additionally, nonclassified loans are also considered in the allowance for loan losses calculation and are factored in based on the historical loss experience adjusted for various qualitative factors.
108
A loan is considered impaired when, based on current information and events, it is probable that the Company will be unable to collect all scheduled payments of principal or interest due according to the contractual terms of the loan agreement. Factors considered by management in determining and measuring loan impairment include payment status, collateral value, and the probability of collecting scheduled principal and interest payments when due. Loans that experience insignificant payment delays and payment shortfalls generally are not classified as impaired. Management determines the significance of payment delays and payment shortfalls on a case-by-case basis, taking into consideration all of the circumstances surrounding the loan and the borrower, including the length of delay, the reasons for the delay, the borrower's prior payment record, and the amount of the shortfall in relation to the principal and interest owed. Impairment is measured on a loan-by-loan basis for real estate, construction, and commercial loans based on the present value of expected future cash flows discounted at the loan's effective interest rate or, as an expedient, at the loan's observable market price or the fair value of the collateral if the loan is collateral dependent, less costs to sell. If the measure of the impaired loan is less than the recorded investment in the loan, the deficiency will be charged off against the allowance for loan losses or, alternatively, a specific allocation will be established. Consumer and other homogeneous smaller balance loans are reviewed on a collective basis for impairment.
Acquired Loans – Acquired loans are valued as of acquisition date in accordance with ASC 805 Business Combinations, formerly FAS 141R Business Combinations. Loans purchased with evidence of credit deterioration since origination for which it is probable that all contractually required payments will not be collected are accounted for under ASC 310-30, Loans and Debt Securities Acquired with Deteriorated Credit Quality, formerly SOP 03-3 Accounting for Certain Loans or Debt Securities Acquired in a Transfer. Further, the Company elected to account for all other acquired loans within the scope of ASC 310-30 using the same methodology.
Under ASC 805 and ASC 310-30, loans are recorded at fair value at acquisition date, factoring in credit losses expected to be incurred over the life of the loan. Accordingly, an allowance for loan losses is not carried over or recorded as of the acquisition date. In situations where loans have similar risk characteristics, loans were aggregated into pools to estimate cash flows under ASC 310-30. A pool is accounted for as a single asset with a single interest rate, cumulative loss rate and cash flow expectation. The Company aggregated all of the loans acquired in the FDIC-assisted acquisition of United Commercial Bank in fifty two different pools, based on common risk characteristics.
The cash flows expected over the life of the loan or pool are estimated using an internal cash flow model that projects cash flows and calculates the carrying values of the pools, book yields, effective interest income and impairment, if any, based on pool level events. Assumptions as to default rates, loss severity, payment curves, loss curves and prepayment speeds are utilized to calculate the expected cash flows.
The excess of the cash flows expected at acquisition to be collected over the fair value is considered to be the accretable yield and is recognized as interest income over the life of the loan or pool. The excess of the contractual cash flows over the cash flows expected to be collected is considered to be the nonaccretable difference. Subsequent to the acquisition date, any increases in expected cash flows over those expected at purchase date in excess of fair value are adjusted through the accretable difference on a prospective basis. Any subsequent decreases in expected cash flows over those expected at purchase date are recognized by recording an allowance for loan losses. Any disposals of loans, including sales of loans, payments in full or foreclosures result in the removal of the loan from the ASC 310-30 portfolio at the carrying amount.
Covered Loans – Loans acquired in a FDIC-assisted acquisition that are subject to a FDIC shared-loss agreement are referred to as covered loans. Covered loans are reported exclusive of the
109
expected cash flow reimbursements expected from the FDIC. All covered loans are accounted for under ASC 805 and ASC 310-30.
FDIC Indemnification Asset – In conjunction with the FDIC-assisted acquisition of United Commercial Bank, the Bank entered into a shared-loss agreement with the FDIC related to covered loans and covered other real estate owned (see below). The FDIC indemnification asset is initially recorded at fair value, based on the discounted value of expected future cash flows under the shared-loss agreement. The Company has elected to account amounts receivable under the shared-loss agreement as an indemnification asset in accordance with ASC 805, Business Combinations. The difference between the present value and the undiscounted cash flows the Company expects to collect from the FDIC is accreted into noninterest income over the life of the FDIC indemnification asset. The FDIC indemnification asset is reviewed quarterly and adjusted for any changes in expected cash flows based on recent performance and expectations for future performance of the covered portfolio. These adjustments are measured on the same basis as the related covered loans and covered other real estate owned. Any increases in cash flow of the covered loans over those expected will reduce the FDIC indemnification asset and any decreases in cash flow of the covered loans over those expected will increase the FDIC indemnification asset. Increases and decreases to the FDIC indemnification asset are recorded as adjustments to noninterest income.
Other Real Estate Owned – Other real estate owned ("OREO") represents properties acquired through foreclosure or through full or partial satisfaction of loans, is considered held for sale, and is recorded at the lower of cost or estimated fair value at the time of foreclosure. Loan balances in excess of fair value of the real estate acquired at the date of foreclosure are charged against the allowance for loan losses. After foreclosure, valuations are periodically performed as deemed necessary by management and the real estate is carried at the lower of carrying value or fair value less costs to sell. Subsequent declines in the fair value of the OREO below the carrying value are recorded through the use of a valuation allowance by charges to noninterest expense. Any subsequent operating expenses or income of such properties are also charged to noninterest expense. If the OREO is sold shortly after it is received in a foreclosure (within three months), the Company substitutes the value received in the sale (net of costs to sell) for the fair value (less costs to sell). Any adjustment made to the loss originally recognized at the time of foreclosure is then charged against or credited to the allowance for loan losses, if deemed material. Otherwise, any declines in value after foreclosure are recorded as gains or losses from the sale or disposition of the real estate. Gain recognition upon disposition of a property is dependent on the sale having met certain criteria relating to the buyer's initial investment in the property sold.
Covered Other Real Estate Owned – All other real estate owned acquired in a FDIC-assisted acquisition that are subject to a FDIC shared-loss agreement are referred to as covered other real estate owned. Covered other real estate owned is reported exclusive of expected reimbursement cash flows from the FDIC. Upon transferring covered loan collateral to covered other real estate owned status, acquisition date fair value discounts on the related loan are also transferred to covered other real estate owned. Fair value adjustments on covered other real estate owned result in a reduction of the covered other real estate carrying amount and a corresponding increase in the FDIC indemnification asset (see above), with the estimated net loss to the Bank recorded as a provision for credit losses.
Investment in Affordable Housing Partnerships – The Company owns limited partnership interests in projects of affordable housing for lower income tenants. The investments in which the Company has significant influence or has a limited partnership interest that exceeds 5% are recorded using the equity method of accounting. The remaining investments are recorded using the cost method and are being amortized using the level-yield method over the life of the related tax credits. The tax credits are being
110
recognized in the consolidated financial statements to the extent they are utilized on the Company's income tax returns.
Goodwill and Other Intangible Assets – The Company has goodwill, which represents the excess of purchase price over the fair value of net assets acquired, as a result of various past acquisitions. If the consideration paid is less than the fair value of the net assets acquired, the Company will record a bargin purchase gain. Goodwill is not amortized and is reviewed for impairment on an annual basis on December 31, or on an interim basis if an event occurs or circumstances change that would reduce the fair value of a reporting unit below its carrying value. Premiums on deposits, which represent the intangible value of depositor relationships resulting from deposit liabilities assumed in acquisitions, are amortized over the projected useful lives of the deposits, which is typically 7 to 15 years. Core deposit intangibles are reviewed for impairment whenever events or changes in circumstances indicate that the carrying value may not be recoverable. Impairment on goodwill and premiums on deposits is recognized by writing down the asset to the extent that the carrying value exceeds the estimated fair value.
Investment in Federal Home Loan Bank of San Francisco Stock – As a member of the Federal Home Loan Bank ("FHLB") of San Francisco, the Bank is required to own common stock in the FHLB of San Francisco based upon our balance of residential mortgage loans and outstanding FHLB advances. FHLB stock is carried at cost and may be sold back to the FHLB at its carrying value. Both cash and stock dividends received are reported as dividend income. Since January 2009, the FHLB has not made dividend payments or repurchased excess capital stock in order to preserve capital.
Investment in Federal Reserve Bank Stock – As a member of the Federal Reserve Bank ("FRB") of San Francisco, the Bank is required to maintain stock in the FRB of San Francisco based on a specified ratio relative to our capital. FRB stock is carried at cost and may be sold back to the FRB at its carrying value. Cash dividends received are reported as dividend income.
Premises and Equipment – The Company's premises and equipment are stated at cost, less accumulated depreciation and amortization. Depreciation and amortization are computed based on the straight-line method over the estimated useful lives of the various classes of assets. The ranges of useful lives for the principal classes of assets are as follows:
| Buildings and building improvements | 25 years | |
| Furniture, fixtures and equipment | 3 to 7 years | |
| Leasehold improvements | Term of lease or useful life, whichever is shorter |
The Company reviews its long-lived assets for impairment annually or when events or circumstances indicate that the carrying amount of these assets may not be recoverable. An asset is considered impaired when the expected undiscounted cash flows over the remaining useful life is less than the net book value. When impairment is indicated for an asset, the amount of impairment loss is the excess of the net book value over its fair value.
Mortgage Servicing Assets – Mortgage servicing assets are initially recorded at fair value. Servicing assets are amortized in proportion to, and over the period of, estimated net servicing income. The fair value of servicing assets is determined based on the present value of estimated net future cash flows related to contractually specified servicing fees. The primary determinants of the fair value of mortgage servicing assets are prepayment speeds and discount rates. Evaluation of impairment is performed on a quarterly basis using discounted static cash flow analysis in combination with mortgage dealer consensus prepayment forecasts. Variations in either or a combination of these factors could materially affect the estimated values of mortgage servicing assets. In conjunction with the valuation process, each class of servicing assets is stratified to evaluate and measure impairment, which is measured as the excess of
111
cost over fair value. Determination of each stratum is based on one or more predominant risk characteristics of the underlying financial assets, including loan type, maturity and interest rates. Impairment, if it occurs, is recognized through a valuation allowance for each class.
Securities Sold Under Repurchase Agreements ("Repurchase Agreements") – The Company sells securities under repurchase agreements. These transactions are accounted for as collateralized financing transactions and recorded at the amounts at which the securities were sold. The Company may have to provide additional collateral to the counterparty, as necessary.
Long-Term Debt – Long-term debt consists of both junior subordinated debt and subordinated debt. The Company has established nine statutory business trusts whereby the Company is the owner of all the beneficial interests represented by the common securities of the Trusts, and third parties hold the fixed and variable rate capital securities of the Trusts. The purpose of issuing the capital securities was to provide the Company with a cost-effective means of obtaining Tier I capital for regulatory reporting purposes.
The Trusts are not consolidated by the Company. Junior subordinated debt represents liabilities of the Company to the Trusts and is included in long-term debt on the accompanying consolidated balance sheets.
Federal Funds Purchased – The Company utilizes federal funds purchased as part of its short-term financing strategy. Federal funds purchased are generally overnight borrowings and mature within one business day to six months from the transaction date.
Income Taxes – Deferred income taxes are recognized for the tax consequences in future years of differences between the tax bases of assets and liabilities and their financial reporting amounts at each year-end, based on enacted tax laws and statutory tax rates applicable to the periods in which the differences are expected to affect taxable income.
The Company examines its financial statements, its income tax provision, and its federal and state income tax returns and analyzes its tax positions, including permanent and temporary differences, as well as the major components of income and expense to determine whether a tax benefit is more likely than not to be sustained upon examination by tax authorities. In the event a tax position is not more likely than not to be sustained by the tax authorities, a reserve is established by management with a corresponding charge to provision for income taxes. The Company recognizes interest and penalties arising from income tax settlements as part of its provision for income taxes. Upon adoption of ASC 740-10 (previously FIN No. 48, Accounting for uncertainty in Income Taxes) on January 1, 2007, the Company recorded a net decrease to retained earnings of $4.6 million related to the measurement of a position that the Company had taken with respect to the tax treatment of regulated investment companies (RICs). See Note 20 to the consolidated financial statements.
Stock-Based Compensation – The Company issues stock-based compensation to certain employees, officers, and directors and accounts for stock options using the fair value method, which generally results in compensation expense recognition. Prior to December 31, 2005, the Company accounted for its fixed stock options using the intrinsic-value method, as prescribed in Accounting Principles Board ("APB") Opinion No. 25. Accordingly, no stock option expense was recorded in periods prior to December 31, 2005.
In adopting the fair value method discussed above, the Company elected to follow the modified prospective method, which required application of the new standard to new awards and to awards modified, repurchased or cancelled after the required effective date. Accordingly, prior period amounts have not been restated. Additionally, compensation cost for the portion of awards for which the
112
requisite service has not been rendered that are outstanding as of January 1, 2006 are being recognized as the requisite services are rendered on or after January 1, 2006. The compensation cost of that portion of awards is based on the grant-date fair value of those awards as calculated for pro forma disclosures under the original SFAS No. 123.
Transfers and Servicing of Financial Assets and Extinguishments of Liabilities – Transfers of financial assets are accounted for as sales, when control over the assets has been surrendered. Control over transferred assets is deemed to be surrendered when (1) the assets have been isolated from the Company; (2) the transferee has the right (free of conditions that constrain it from taking advantage of that right) to pledge or exchange the transferred assets; and (3) the Company does not maintain effective control over the transferred assets through either (a) an agreement that entitles and obligates the Company to repurchase or redeem them before their maturity or (b) the ability to unilaterally cause the holder to return specific assets. The difference between the net proceeds received and the carrying amount of the financial assets being sold is recognized as a gain or loss on sale.
Earnings (Loss) Per Share ("EPS") – Basic EPS excludes dilution and is computed by dividing income or loss available to common stockholders by the weighted-average number of shares outstanding during the period. Diluted EPS is calculated on the basis of the weighted average number of shares outstanding during the period plus restricted stock and shares issuable upon the assumed exercise of outstanding convertible preferred stock, common stock options and warrants, unless they have an antidilutive effect.
Comprehensive Income – The term "comprehensive income" describes the total of all components of comprehensive income, including net income and other comprehensive income. "Other comprehensive income" refers to revenues, expenses, and gains and losses that are included in comprehensive income but are excluded from net income because they have been recorded directly in equity under the provisions of other Financial Accounting Standards Board statements. The Company presents the comprehensive income disclosure as a part of the statements of changes in stockholders' equity by identifying each element of comprehensive income, including net income.
Derivative Financial Instruments – As part of its asset and liability management strategy, the Company may use derivative financial instruments to mitigate exposure to risk. All derivative instruments, including certain derivative instruments embedded in other contracts, are recognized on the consolidated balance sheet at fair value with the change in fair value reported in earnings.
Reclassifications – Certain items in the consolidated statements of operations for the years ended December 31, 2008 and 2007 were reclassified to conform to the 2009 presentation. These reclassifications did not affect previously reported net income.
RECENT ACCOUNTING STANDARDS
In December 2007, the FASB issued ASC 805 (previously SFAS No. 141(R), Business Combinations). ASC 805 establishes principles and requirements for how an acquiring company (1) recognizes and measures in its financial statements the identifiable assets acquired, the liabilities assumed, and any non-controlling interest in the acquiree, (2) recognizes and measures the goodwill acquired in the business combination or a gain from a bargain purchase, and (3) determines what information to disclose to enable users of the financial statements to evaluate the nature and financial effects of the business combination. ASC 805 was effective for the Company on January 1, 2009, and was applied in the Company's acquisition of United Commercial Bank (see Note 2).
In March 2008, the FASB issued ASC 815-10-50 (previously SFAS No. 161, Disclosures about Derivative Instruments and Hedging Activities). ASC 815-10-50 requires specific disclosures regarding the
113
location and amounts of derivative instruments in the financial statements; how derivative instruments and related hedged items are accounted for; and how derivative instruments and related hedged items affect the financial position, financial performance, and cash flows of the Company. It was effective for the Company in 2009. The disclosures required by this standard are located in Note 7.
In December 2008, the FASB issued ASC-10-50 (previously FSP FAS 140-4 and FIN 46(R)-8, "Disclosures by Public Entities (Enterprises) About Transfers of Financial Assets and Interests in Variable Interest Entities"). This disclosure-only ASC improves the transparency of transfers of financial assets and an enterprise's involvement with variable interest entities (VIEs), including qualifying special-purpose entities (QSPEs). The disclosures required by this ASC are intended to provide greater transparency to financial statement users about a transferor's continuing involvement with transferred financial assets and an enterprise's involvement with variable interest entities and qualifying SPEs. This ASC was effective for the Company in 2009.
In January 2009, the FASB issued ASC 325-40 (previously FSP EITF 99-20-1), Amendments to the Impairment Guidance of EITF Issue No. 99-20 , which revises the other-than-temporary-impairment ("OTTI") guidance on beneficial interests in securitized financial assets that are within the scope of EITF 99-20, Recognition of Interest Income and Impairment on Purchased and Retained Beneficial Interests in Securitized Financial Assets). ASC 325-40 amends Issue 99-20, to more closely align its OTTI guidance with ASC 320-10 (previously FASB Statement No. 115, Accounting for Certain Investments in Debt and Equity Securities), by (1) removing the notion of a "market participant" and (2) inserting a "probable" concept related to the estimation of a beneficial interest's cash flows. ASC 325-40 was effective for the Company on a prospective basis for interim and annual periods ending after December 15, 2008, or December 31 for the Company. Retrospective application of this ASC was prohibited. The adoption of this guidance did not have a material effect on the Company's financial condition, results of operations, or cash flows.
In April 2009, the FASB issued ASC 320-10-65 (previously FSP FAS 115-2 and FAS 124, Recognition and Presentation of Other-Than-Temporary Impairments), which makes changes to the timing of loss recognition and earnings for debt and similar investment securities classified as either "available-for-sale" or "held-to-maturity". The ASC provides that if an entity intends to sell an impaired debt security prior to recovery of its amortized cost basis, or if it is more likely than not that it will have to sell the security prior to recovery, then the full amount of the impairment is to be classified as other-than-temporary and recognized in earnings. Otherwise, the portion of the impairment loss deemed to constitute a credit loss is considered an OTTI loss to be reported in earnings, with the non-credit loss portion recognized in other comprehensive income. This ASC also requires entities to initially apply the provisions of the standard to the noncredit portion of previously recorded OTTI impaired securities, existing as of the date of initial adoption, by making a cumulative-effect adjustment from the opening balance of retained earnings to other comprehensive income in the period of adjustment. Upon adoption of ASC 320-10-65, the Company reclassified the noncredit portion of previously recognized OTTI totaling $8.1 million, net of tax, from the opening balance of retained earnings to other comprehensive income. Additionally, upon implementation of this ASC as of March 31, 2009, the Company recorded $200 thousand, on a pre-tax basis, of the credit portion of OTTI through earnings and $7.6 million, net of tax, of the non-credit portion of OTTI in other comprehensive income.
In April 2009, the FASB issued ASC 820-10-65 (previously FSP FAS 157-4, Determining Fair Value When the Volume and Level of Activity for the Asset or Liability Have Significantly Decreased and Identifying Transactions That Are Not Orderly), which provides additional guidance for estimating fair value in accordance with ASC 820 when the volume and level of activity for the asset or liability have significantly decreased. ASC 820-10-65 also requires additional disclosures relating to fair value
114
measurement inputs and valuation techniques, as well as providing disclosures for all debt and equity investment securities by major security types rather than by major security categories that should be based on the nature and risks of the security during both interim and annual periods. The adoption of this ASC resulted in additional disclosures which are presented in Note 3 of the Company's condensed consolidated financial statements.
In April 2009, the FASB issued ASC 820-10-50, (previously FSP FAS 107-1 and APB 28-1, Interim Disclosures about Fair Value of Financial Instruments), which increases the frequency of fair value disclosures from an annual basis only to a quarterly basis. The guidance will require public entities to disclose in their interim financial statements the fair value of all financial instruments within the scope of ASC 825 (previously SFAS No. 107, Disclosures about Fair Value of Financial Instruments), as well as the methods and significant assumptions used to estimate the fair value of those instruments. The ASC was adopted on June 30, 2009 and resulted in additional disclosures which are presented in Note 3 of the Company's condensed consolidated financial statements.
In June 2009, the FASB issued ASC 860 (previously SFAS No. 166, Accounting for Transfers of Financial Assets, which amends Statement 140, Accounting for Transfers and Servicing of Financial Assets and Extinguishments of Liabilities), and will require more information about transfers of financial assets, including securitization transactions, and where companies have continuing exposure to the risks related to transferred financial assets. It eliminates the concept of a "qualifying special-purpose entity," changes the requirements for derecognizing financial assets, and requires additional disclosures. It is effective for financial statements issued for fiscal years beginning after November 15, 2009, and early adoption is prohibited. The adoption of this guidance did not have a material impact to the Company's consolidated financial statements.
In June 2009, the FASB issued ASC 810 (previously SFAS No. 167, Amendments to FASB Interpretation No. 46(R)), which is a revision to FASB Interpretation No. 46(R), Consolidation of Variable Interest Entities, and changes how a company determines when an entity that is insufficiently capitalized or is not controlled through voting (or similar rights) should be consolidated. The determination of whether a company is required to consolidate an entity is based on, among other things, an entity's purpose and design and a company's ability to direct the activities of the entity that most significantly impact the entity's economic performance. It is effective for financial statements issued for fiscal years beginning after November 15, 2009, and early adoption is prohibited. The adoption of this guidance does not have a material effect on its financial condition, results of operations, or cash flows.
In January 2010, the FASB issued ASU 2010-06, Improving Disclosures about Fair Value Measurements. ASU 2010-06 requires separate disclosure of the amounts of significant transfers in and out of Level 1 and Level 2 fair value measurements and reasons for the transfers and separate presentation of information about purchases, sales, issuances, and settlements in the reconciliation for Level 3 fair value measurements. Additionally, ASU 2010-06 clarifies existing disclosures regarding level of disaggregation and inputs and valuation techniques. The new disclosures and clarifications of existing disclosures under ASU 2010-06 are effective for interim and annual reporting periods beginning after December 15, 2009, except for the disclosures about purchases, sales, issuances, and settlements in the roll forward of activity in Level 3 fair value measurements. Those disclosures are effective for fiscal years ending after December 15, 2010 and for interim periods within those fiscal years. The Company does not expect the adoption of this guidance to have a material effect on its financial condition, results of operations, or cash flows.
115
2. BUSINESS COMBINATIONS
On November 6, 2009 the Bank acquired certain assets and assumed certain liabilities of United Commercial Bank from the FDIC in an FDIC-assisted transaction. As part of the Purchase and Assumption Agreement, the Bank and the FDIC entered into a shared-loss agreement, whereby the FDIC will cover a substantial portion of any future losses on loans (and related unfunded loan commitments), OREO and accrued interest on loans for up to 90 days. We refer to the acquired loans and OREO subject to the shared-loss agreement collectively as "covered assets." Under the terms of the our shared-loss agreement, the FDIC will absorb 80% of losses and share in 80% of loss recoveries on the first $2.05 billion on covered loans and absorb 95% of losses and share in 95% of loss recoveries exceeding $2.05 billion. The shared-loss agreement for commercial and single family residential mortgage loans is in effect for 5 years and 10 years, respectively, from the November 6, 2009 acquisition date and the loss recovery provisions are in effect for 8 years and 10 years, respectively, from the acquisition date.
The Bank purchased assets with fair value of approximately $5.90 billion in loans, $599.0 million of cash and cash equivalents, $147.4 million in securities purchased under sale agreements, $1.56 billion in investment securities and $207.6 million of other assets of United Commercial Bank from the FDIC. The Bank also assumed liabilities with fair values of $6.53 billion of deposits, $1.84 billion in Federal Home Loan Bank advances, $858.2 million of securities sold under repurchase agreements, other borrowings of $90.6 million and $254.2 million of other liabilities of United Commercial Bank from the FDIC. United Commercial Bank was a full service commercial bank headquartered in San Francisco, California that operated 63 branch locations in the U.S. We made this acquisition to expand our presence domestically, primarily in the State of California.
The assets acquired and liabilities assumed have been accounted for under the acquisition method of accounting (formerly the purchase method). The assets and liabilities, both tangible and intangible, were recorded at their estimated fair values as of the November 6, 2009 acquisition date.
116
The application of the acquisition method of accounting resulted in a net after-tax gain of $291.5 million. A summary of the net assets received from the FDIC is as follows:
| |
November 6, 2009 | ||||
|---|---|---|---|---|---|
| |
(In thousands) |
||||
Cash and cash equivalents |
$ | 599,036 | |||
Securities purchased under resale agreements |
147,400 | ||||
Investment securities |
1,561,446 | ||||
Investment in Federal Home Loan Bank stock |
93,488 | ||||
Loans covered by loss sharing |
5,660,432 | ||||
Loans not covered by loss sharing |
236,504 | ||||
Other real estate owned |
38,031 | ||||
Investment in affordable housing partnerships |
41,552 | ||||
Premises and equipment |
6,209 | ||||
Due from customers on acceptances |
39,282 | ||||
Mortgage servicing rights |
5,192 | ||||
Core deposit intangible |
74,440 | ||||
FDIC shared-loss receivable |
1,143,989 | ||||
FDIC settlement receivable |
173,995 | ||||
Accrued interest receivable |
36,273 | ||||
Other assets |
4,688 | ||||
Total assets acquired |
9,861,957 | ||||
Deposits |
6,529,864 | ||||
Federal Home Loan Bank advances |
1,837,593 | ||||
Securities sold under repurchase agreements |
858,244 | ||||
Other borrowings |
90,591 | ||||
Bank acceptances outstanding |
39,282 | ||||
Accrued interest payable |
25,028 | ||||
Deferred tax liability |
179,541 | ||||
Other liabilities |
10,346 | ||||
Total liabilities assumed |
9,570,489 | ||||
Net assets acquired |
$ | 291,468 | |||
The net gain represents the excess of the estimated fair value of the assets acquired over the estimated fair value of the liabilities assumed and is influenced significantly by the FDIC-assisted transaction process. Under the FDIC-assisted transaction process, only certain assets and liabilities are transferred to the acquirer and, depending on the nature and amount of the acquirer's bid, the FDIC may be required to make a cash payment to the acquirer. The Bank had a cash payment due from the FDIC for $174.0 million as of November 6, 2009 of which $62.0 million was received in January 2010. In the United Commercial Bank acquisition as shown in the table below, the book value of net assets transferred to the Bank was $990.1 million. The after tax gain of $291.5 million recognized by the Company is considered a bargain purchase transaction under ASC 805 Business Combinations since the total acquisition-date fair value of the identifiable net assets acquired exceeded the fair value of the
117
consideration transferred. The gain was recognized as non-interest income in the Company's 2009 Consolidated Statements of Operations.
| |
November 6, 2009 | |||||
|---|---|---|---|---|---|---|
| |
(In thousands) |
|||||
United Commercial Bank's cost basis net assets on November 6, 2009 |
$ | 990,106 | ||||
Cash payment due from the FDIC |
173,995 | |||||
Fair value adjustments: |
||||||
Loans |
(1,795,112 | ) | ||||
Core deposit intangible |
74,440 | |||||
FDIC loss sharing receivable |
1,143,989 | |||||
Other real estate owned |
(7,057 | ) | ||||
Investment in affordable housing partnerships |
(1,258 | ) | ||||
Premises and equipment |
328 | |||||
Other assets |
(2,410 | ) | ||||
Time deposits |
(11,321 | ) | ||||
Federal Home Loan Bank advances |
(96,052 | ) | ||||
Other borrowings |
1,200 | |||||
Deferred tax liability |
(179,541 | ) | ||||
Other liabilities |
161 | |||||
Net after-tax gain from United Commercial Bank acquisition |
$ | 291,468 | ||||
Before the Company acquired United Commercial Bank on November 6, 2009, United Commercial Bank had not completed their restatement process. The restatement process was expected to have resulted in significant adjustments to prior years' financial information. Also, United Commercial Bank did not file any quarterly filings with the SEC during 2009. The Company determined that it cannot place reliance on the financial information of United Commercial Bank for the two years prior to the acquisition. The Company considered the proforma requirements of ASC 805 and was unable to independently substantiate the assumptions of management prior the acquisition date without significant estimates of circumstances prior to that point. The Company does not believe that it can distinguish objectively information about the estimates due to the lack of reliable financial information over the past two fiscal years. After making every reasonable effort, the Company deemed it impracticable to provide proforma financials as required under ASC 805. See table below for United Commercial Bank's contribution to the Company's 2009 results of operations. These amounts exclude
118
the pre-tax bargain purchase gain of $471.0 million and the discount accretion related to both the covered loans and FDIC indemnification asset recorded during the fourth quarter.
| |
UCB | |||||
|---|---|---|---|---|---|---|
| |
November 7, 2009 – December 31, 2009 |
|||||
| |
(In thousands) |
|||||
Interest Income |
$ | 52,442 | ||||
Interest Expense |
13,427 | |||||
Net Interest Margin |
39,015 | |||||
Noninterest Income |
6,390 | |||||
Noninterest Expense: |
||||||
Compensation and employee benefits |
12,232 | |||||
Other noninterest expense |
9,895 | |||||
Total Noninterest expense |
22,127 | |||||
Income before income taxes |
$ | 23,278 | ||||
3. FAIR VALUE
Fair value is defined as the price that would be received to sell an asset or paid to transfer a liability in an orderly transaction between market participants at the measurement date. In determining fair value, the Company uses various methods including market and income approaches. Based on these approaches, the Company often utilizes certain assumptions that market participants would use in pricing the asset or liability. These inputs can be readily observable, market corroborated, or generally unobservable firm inputs. The Company utilizes valuation techniques that maximize the use of observable inputs and minimize the use of unobservable inputs. Based on the observability of the inputs used in the valuation techniques, the Company is required to provide the following information according to the fair value hierarchy. The hierarchy is based on the quality and reliability of the information used to determine fair values. The hierarchy gives the highest priority to quoted prices available in active markets and the lowest priority to data lacking transparency. Financial assets and liabilities carried at fair value will be classified and disclosed in one of the following three categories:
- •
- Level 1 – Quoted prices for identical instruments that are highly liquid, observable and
actively traded in over-the-counter markets. Level 1 financial instruments typically include U.S. Treasury securities.
- •
- Level 2 – Quoted prices for similar instruments in active markets; quoted prices for identical
or similar instruments in markets that are not active; and model-derived valuations whose inputs are observable and can be corroborated by market data. Level 2 financial instruments typically
include U.S. Government debt and agency mortgage-backed securities, municipal securities, U.S. Government sponsored enterprise preferred stock securities, trust preferred securities, equity swap
agreements, and OREO.
- •
- Level 3 – Unobservable inputs that are supported by little or no market activity and that are significant to the fair value of the assets or liabilities. Level 3 assets and liabilities include financial instruments whose value is determined using pricing models, discounted cash flow methodologies, or similar techniques, as well as instruments for which the determination of fair value requires significant management judgment or estimation. This category typically includes mortgage servicing assets, impaired loans, private label mortgage-backed securities, trust preferred securities, and derivatives payable.
119
In determining the appropriate hierarchy levels, the Company performs a detailed analysis of assets and liabilities that are subject to fair value disclosure. The following table presents both financial and non-financial assets and liabilities that are measured at fair value on a recurring and non-recurring basis. These assets and liabilities are reported on the consolidated balance sheets at their fair values as of December 31, 2009. Financial assets and liabilities are classified in their entirety based on the lowest level of input that is significant to their fair value measurement.
| |
Assets (Liabilities) Measured at Fair Value on a Recurring Basis as of December 31, 2009 |
|||||||||||||
|---|---|---|---|---|---|---|---|---|---|---|---|---|---|---|
| |
Fair Value Measurements December 31, 2009 |
Quoted Prices in Active Markets for Identical Assets (Level 1) |
Significant Other Observable Inputs (level 2) |
Significant Unobservable Inputs (Level 3) |
||||||||||
| |
(In thousands) |
|||||||||||||
Investment securities available-for-sale |
||||||||||||||
U.S. Treasury securities |
$ | 303,472 | $ | 303,472 | $ | - | $ | - | ||||||
U.S. Government agency securities and U.S. Government sponsored enterprise debt securities |
832,025 | - | 832,025 | - | ||||||||||
U.S. Government agency securities and U.S. Government sponsored enterprise residential mortgage-backed securities |
||||||||||||||
Commercial mortgage-backed securities |
26,355 | - | 26,355 | - | ||||||||||
Residential mortgage-backed securities |
724,348 | - | 724,348 | - | ||||||||||
Municipal securities |
60,193 | - | 60,193 | - | ||||||||||
Other residential mortgage-backed securities |
||||||||||||||
Investment grade |
95,517 | - | 95,517 | - | ||||||||||
Non-investment grade |
41,610 | - | 28,872 | 12,738 | ||||||||||
Corporate debt securities |
||||||||||||||
Investment grade |
460,895 | - | 459,917 | 978 | ||||||||||
Non-investment grade |
8,861 | - | 6,906 | 1,955 | ||||||||||
U.S. Government sponsored enterprise equity securities |
1,782 | - | 1,782 | - | ||||||||||
Other securities |
9,023 | 9,023 | - | - | ||||||||||
Total investment securities available-for-sale |
$ | 2,564,081 | $ | 312,495 | $ | 2,235,915 | $ | 15,671 | ||||||
Equity swap agreements |
$ | 14,177 | $ | - | $ | 14,177 | $ | - | ||||||
Derivatives payable |
$ | (14,185 | ) | $ | - | $ | - | $ | (14,185 | ) | ||||
120
| |
Assets (Liabilities) Measured at Fair Value on a Recurring Basis as of December 31, 2008 |
|||||||||||||
|---|---|---|---|---|---|---|---|---|---|---|---|---|---|---|
| |
Fair Value Measurements December 31, 2008 |
Quoted Prices in Active Markets for Identical Assets (Level 1) |
Significant Other Observable Inputs (level 2) |
Significant Unobservable Inputs (Level 3) |
||||||||||
| |
(In thousands) |
|||||||||||||
Investment securities available-for-sale |
||||||||||||||
U.S. Treasury securities |
$ | 2,513 | $ | 2,513 | $ | - | $ | - | ||||||
U.S. Government agency securities and U.S. Government sponsored enterprise debt securities |
1,023,934 | - | 1,023,934 | - | ||||||||||
U.S. Government agency securities and U.S. Government sponsored enterprise residential mortgage-backed securities |
||||||||||||||
Commercial mortgage-backed securities |
- | - | - | - | ||||||||||
Residential mortgage-backed securities |
380,051 | - | 380,051 | - | ||||||||||
Other residential mortgage-backed securities |
||||||||||||||
Investment grade |
527,109 | - | - | 527,109 | ||||||||||
Non-investment grade |
10,216 | - | - | 10,216 | ||||||||||
Corporate debt securities |
||||||||||||||
Investment grade |
38,275 | - | 5,581 | 32,694 | ||||||||||
Non-investment grade |
4,270 | - | - | 4,270 | ||||||||||
U.S. Government sponsored enterprise equity securities |
1,184 | - | 1,184 | - | ||||||||||
Residual securities |
50,062 | - | - | 50,062 | ||||||||||
Other securities |
2,580 | 2,580 | - | - | ||||||||||
Total investment securities available-for-sale |
$ | 2,040,194 | $ | 5,093 | $ | 1,410,750 | $ | 624,351 | ||||||
Equity swap agreements |
$ | 13,853 | $ | - | $ | 13,853 | $ | - | ||||||
Derivatives payable |
$ | (14,142 | ) | $ | - | $ | - | $ | (14,142 | ) | ||||
| |
Assets Measured at Fair Value on a Non-Recurring Basis for the Twelve Months Ended December 31, 2009 |
|||||||||||||||
|---|---|---|---|---|---|---|---|---|---|---|---|---|---|---|---|---|
| |
Fair Value Measurements December 31, 2009 |
Quoted Prices in Active Markets for Identical Assets (Level 1) |
Significant Other Observable Inputs (level 2) |
Significant Unobservable Inputs (Level 3) |
Total Gains (Losses) |
|||||||||||
| |
(In thousands) |
|||||||||||||||
Mortgage Servicing Assets |
$ | 16,284 | $ | - | $ | - | $ | 16,284 | $ | 1,051 | ||||||
Non-Covered Impaired Loans |
191,452 | - | - | 191,452 | (66,936 | ) | ||||||||||
Non-Covered OREO |
13,832 | - | 13,832 | - | (5,388 | ) | ||||||||||
| |
Assets Measured at Fair Value on a Non-Recurring Basis for the Twelve Months Ended December 31, 2008 |
|||||||||||||||
|---|---|---|---|---|---|---|---|---|---|---|---|---|---|---|---|---|
| |
Fair Value Measurements December 31, 2008 |
Quoted Prices in Active Markets for Identical Assets (Level 1) |
Significant Other Observable Inputs (level 2) |
Significant Unobservable Inputs (Level 3) |
Total Gains (Losses) |
|||||||||||
| |
(In thousands) |
|||||||||||||||
Mortgage Servicing Assets |
$ | 16,492 | $ | - | $ | - | $ | 16,492 | $ | (2,387 | ) | |||||
Non-Covered Impaired Loans |
208,716 | - | - | 208,716 | (7,090 | ) | ||||||||||
At each reporting period, all assets and liabilities for which the fair value measurement is based on significant unobservable inputs are classified as Level 3. The following table provides a reconciliation of the beginning and ending balances for available-for-sale investment securities by major
121
security type and for major asset and liability categories measured at fair value using significant unobservable inputs (Level 3) for the year ended December 31, 2009:
| |
Securities Available-for-Sale | |
||||||||||||||||||||||
|---|---|---|---|---|---|---|---|---|---|---|---|---|---|---|---|---|---|---|---|---|---|---|---|---|
| |
|
Other Residential Mortgage- Backed Securities |
Corporate Debt Securities | EWMT Residual | |
|||||||||||||||||||
| |
Total | Investment Grade |
Non-Investment Grade |
Investment Grade |
Non-Investment Grade |
Non-Investment Grade |
Derivatives Payable |
|||||||||||||||||
| |
(In thousands) |
|
||||||||||||||||||||||
Beginning balance, January 1, 2009 |
$ | 624,351 | $ | 527,109 | $ | 10,216 | $ | 32,694 | $ | 4,270 | $ | 50,062 | $ | (14,142 | ) | |||||||||
Total gains or losses (1) |
||||||||||||||||||||||||
Included in earnings (realized) |
(99,729 | ) | 2,629 | 193 | 26 | (106,434 | ) | 3,857 | (43 | ) | ||||||||||||||
Included in other comprehensive loss (unrealized) (2) |
142,801 | 101,456 | (1,433 | ) | (217 | ) | 68,015 | (25,020 | ) | |||||||||||||||
Purchases, issuances, sales, settlements (3) |
(651,752 | ) | (613,582 | ) | (13,850 | ) | (125 | ) | 4,704 | (28,899 | ) | |||||||||||||
Transfers in and/or out of Level 3 (4) |
- | (17,612 | ) | 17,612 | (31,400 | ) | 31,400 | - | ||||||||||||||||
Ending balance December 31, 2009 |
$ | 15,671 | $ | - | $ | 12,738 | $ | 978 | $ | 1,955 | $ | - | $ | (14,185 | ) | |||||||||
Changes in unrealized losses included in earnings relating to assets and liabilities still held at December 31, 2009 |
$ | (106,434 | ) | $ | - | $ | - | $ | - | $ | (106,434 | ) | $ | - | $ | - | ||||||||
- 1)
- Total gains or losses represent the total realized and unrealized gains and losses recorded for Level 3 assets and liabilities. Realized gains or losses are reported in the consolidated statements of operations.
- 2)
- Unrealized gains or losses as well as the noncredit portion of OTTI on investment securities are reported in accumulated other comprehensive loss, net of tax in the consolidated statements of changes in stockholders' equity.
- 3)
- Purchases, issuances, sales and settlements represent Level 3 assets and liabilities that were either purchased, issued, sold, or settled during the period. The amounts are recorded at their end of period fair values. In May 2009, the Company desecuritized its portfolio of private-label mortgage backed securities resulting in a $635.6 million decrease in Level 3 investment grade mortgage-backed securities for the year ended December 31, 2009.
- 4)
- Transfers in and/or out represent existing assets and liabilities that were either previously categorized as a higher level and the inputs to the model became unobservable or assets and liabilities that were previously classified as Level 3 and the lowest significant input became observable during the period. These assets and liabilities are recorded at their end of period fair values.
122
The following table provides a reconciliation of the beginning and ending balances for available-for-sale investment securities by major security type and for major asset and liability categories measured at fair value using significant unobservable inputs (Level 3) for the year ended December 31, 2008:
| |
Securities Available-for-Sale | |
||||||||||||||||||||||
|---|---|---|---|---|---|---|---|---|---|---|---|---|---|---|---|---|---|---|---|---|---|---|---|---|
| |
|
Other Residential Mortgage- Backed Securities |
Corporate Debt Securities | EWMT Residual | |
|||||||||||||||||||
| |
Total | Investment Grade |
Non-Investment Grade |
Investment Grade |
Non-Investment Grade |
Non-Investment Grade |
Derivatives Payable |
|||||||||||||||||
| |
(In thousands) |
|
||||||||||||||||||||||
Beginning balance, January 1, 2008 |
$ | 700,434 | $ | 659,718 | $ | - | $ | - | $ | - | $ | 40,716 | $ | - | ||||||||||
Total gains or losses (1) |
||||||||||||||||||||||||
Included in earnings (realized) |
(3,031 | ) | (2,964 | ) | - | (7,982 | ) | - | 7,915 | 951 | ||||||||||||||
Included in other comprehensive income (unrealized) (2) |
(40,779 | ) | (35,972 | ) | - | (17,442 | ) | - | 12,635 | - | ||||||||||||||
Purchases, Issuances, sales, settlements (3) |
(113,057 | ) | (103,096 | ) | - | 1,243 | - | (11,204 | ) | - | ||||||||||||||
Transfers in and/or out of Level 3 (4) |
80,784 | 9,423 | 10,216 | 56,875 | 4,270 | - | (15,093 | ) | ||||||||||||||||
Ending balance, December 31, 2008 |
$ | 624,351 | $ | 527,109 | $ | 10,216 | $ | 32,694 | $ | 4,270 | $ | 50,062 | $ | (14,142 | ) | |||||||||
Changes in unrealized losses included in earnings relating to assets and liabilities still held at December 31, 2008 |
$ | (17,845 | ) | $ | (17,845 | ) | $ | - | $ | - | $ | - | $ | - | $ | - | ||||||||
- 1)
- Total
gains or losses represent the total realized and unrealized gains and losses recorded for Level 3 assets and liabilities. Realized gains or
losses are reported in the consolidated statements of operations.
- 2)
- Unrealized
gains or losses on investment securities are reported in accumulated other comprehensive loss, net of tax in the consolidated statements of
changes in stockholders' equity.
- 3)
- Purchases,
issuances, sales and settlements represent Level 3 assets and liabilities that were either purchased, issued, sold, or settled during the
period. The amounts are recorded at their end of period fair values.
- 4)
- Transfers in and/or out represent existing assets and liabilities that were either previously categorized as a higher level and the inputs to the model became unobservable or assets and liabilities that were previously classified as Level 3 and the lowest significant input became observable during the period. These assets and liabilities are recorded at their end of period fair values.
Valuation Methodologies
Investment Securities Available-for-Sale – The fair values of available-for-sale investment securities are generally determined by reference to the average of at least two quoted market prices obtained from independent external brokers or prices obtained from independent external pricing service providers who have experience in valuing these securities. In obtaining such valuation information from third parties, the Company has reviewed the methodologies used to develop the resulting fair values.
123
The Company's Level 3 available-for-sale securities include one private-label mortgage-backed security and certain pooled trust preferred securities. The fair values of the private-label mortgage-backed security and pooled trust preferred securities have traditionally been based on the average of at least two quoted market prices obtained from independent external brokers since broker quotes in an active market are given the highest priority. However, as a result of the global financial crisis and illiquidity in the U.S. markets, the market for these securities has been inactive since mid-2007. It is the Company's view that current broker prices (which are typically non-binding) on the private-label mortgage-backed security and certain pooled trust preferred securities are based on forced liquidation or distressed sale values in very inactive markets that are not representative of the fair value of these securities. As such, the Company considered what weight, if any, to place on transactions that are not orderly when estimating fair value.
For the private-label mortgage-backed security, the Company determined fair value by using the appropriate combination of the market approach reflecting current broker prices and a discounted cash flow approach. The values resulting from each approach (i.e. market and income approaches) were weighted to derive the final fair value on the private-label mortgage-backed security. For the pooled trust preferred securities, the fair value was derived based on discounted cash flow analyses (the income method) prepared by management. In order to determine the appropriate discount rate used in calculating fair values derived from the income method for the private-label mortgage-backed security and pooled trust preferred securities, the Company has made assumptions using an exit pricing approach related to the implied rate of return which have been adjusted for general changes in market rates, estimated changes in credit quality and liquidity risk premium, specific non-performance and default experience in the collateral underlying the securities. The losses recorded in the period are recognized in noninterest income. During the second quarter of 2009, the private-label mortgage-backed security was downgraded from investment grade to non-investment grade.
In May 2009, the desecuritization of the Company's Level 3 private-label mortgage backed securities resulted in a $635.6 million increase in single and multifamily loans receivable with a corresponding decrease of Level 3 investment grade mortgage-backed investment securities in the table above.
Equity Swap Agreements – The Company has entered into several equity swap agreements with a major investment brokerage firm to hedge against market fluctuations in a promotional equity index certificate of deposit product offered to bank customers. This deposit product, which has a term of 5 years or 51/2 years, pays interest based on the performance of the Hang Seng China Enterprises Index ("HSCEI"). The fair value of these equity swap agreements is based on the income approach. The fair value is based on the change in the value of the HSCEI and the volatility of the call option over the life of the individual swap agreement. The option value is derived based on the volatility, the interest rate and the time remaining to maturity of the call option. The Company's consideration of its counterparty's credit risk resulted in a $12 thousand adjustment to the valuation of the equity swap agreements for the year ended December 31, 2009. The valuation of equity swap agreements falls within Level 2 of the fair value hierarchy due to the observable nature of the inputs used in deriving the fair value of these derivative contracts.
Derivatives Payable – The Company's derivatives payable are recorded in conjunction with the certificate of deposits ("host instrument") that pays interest based on changes in the HSCEI and are included in interest-bearing deposits on the consolidated balance sheets. The fair value of these embedded derivatives is based on the income approach. The Company's consideration of its own credit risk resulted in a $4 thousand adjustment to the valuation of the derivative liabilities. The valuation of the derivatives payable falls within Level 3 of the fair value hierarchy since the significant inputs used in deriving the fair value of these derivative contracts are not directly observable.
124
Mortgage Servicing Assets ("MSAs") – The Company records MSAs in conjunction with its loan sale and securitization activities since the servicing of the underlying loans is retained by the Bank. MSAs are initially measured at fair value using an income approach. The initial fair value of MSAs is determined based on the present value of estimated net future cash flows related to contractually specified servicing fees. The valuation for MSAs falls within Level 3 of the fair value hierarchy since there are no quoted prices for MSAs and the significant inputs used to determine fair value are not directly observable. The valuation of MSAs is determined using a discounted cash flow approach utilizing the appropriate yield curve and several market-derived assumptions including prepayment speeds, servicing cost, delinquency and foreclosure costs and behavior, and float earnings rate. Net cash flows are present valued using a market-derived discount rate. The resulting fair value is then compared to recently observed bulk market transactions with similar characteristics. The fair value is adjusted accordingly to be better aligned with current observed market trends and activity.
Impaired Loans – The Company's impaired loans are generally measured using the fair value of the underlying collateral, which is determined based on the most recent valuation information received, which may be adjusted based on factors such as the Company's historical knowledge and changes in market conditions from the time of valuation. Impaired loans fall within Level 3 of the fair value hierarchy since they are measured at fair value based on the most recent valuation information received on the underlying collateral.
Other Real Estate Owned ("OREO") – The Company's OREO represents properties acquired through foreclosure or through full or partial satisfaction of loans, are considered held-for-sale, and are recorded at the lower of cost or estimated fair value at the time of foreclosure. The fair values of OREO properties are based on third-party appraisals, broker price opinions or accepted written offers. These valuations are reviewed and approved by the Company's appraisal department, credit review, or OREO department. OREO properties are classified as Level 2 assets in the fair value hierarchy. The non-covered OREO balance of $13.8 million included in the condensed consolidated balance sheets as of December 31, 2009 is recorded net of estimated disposal costs.
125
Fair Value of Financial Instruments
The carrying amounts and fair values of the Company's financial instruments at December 31, 2009 and 2008, were as follows:
| |
December 31, | |||||||||||||
|---|---|---|---|---|---|---|---|---|---|---|---|---|---|---|
| |
2009 | 2008 | ||||||||||||
| |
Carrying Notional or Contract Amount |
Estimated Fair Value |
Carrying Notional or Contract Amount |
Estimated Fair Value |
||||||||||
| |
(In thousands) |
|||||||||||||
Financial Assets: |
||||||||||||||
Cash and cash equivalents |
$ | 835,141 | $ | 835,141 | $ | 878,853 | $ | 878,853 | ||||||
Short-term investments |
510,788 | 510,788 | 228,441 | 228,353 | ||||||||||
Securities purchased under resale agreements |
227,444 | 232,693 | 50,000 | 51,581 | ||||||||||
Investment securities held-to-maturity |
- | - | 122,317 | 123,105 | ||||||||||
Investment securities available-for-sale |
2,564,081 | 2,564,081 | 2,040,194 | 2,040,194 | ||||||||||
Loans receivable, net |
13,844,840 | 13,519,060 | 8,069,377 | 8,036,406 | ||||||||||
Investment in Federal Home Loan Bank stock |
180,217 | 180,217 | 86,729 | 86,729 | ||||||||||
Investment in Federal Reserve Bank stock |
36,785 | 36,785 | 27,589 | 27,589 | ||||||||||
Accrued interest receivable |
82,370 | 82,370 | 46,230 | 46,230 | ||||||||||
Equity swap agreements |
38,828 | 14,177 | 43,453 | 13,853 | ||||||||||
Financial Liabilities: |
||||||||||||||
Customer deposit accounts: |
||||||||||||||
Demand, savings and money market deposits |
7,088,822 | 6,214,848 | 3,399,817 | 3,141,126 | ||||||||||
Time deposits |
7,898,791 | 7,912,384 | 4,742,142 | 4,750,957 | ||||||||||
Federal funds purchased |
22 | 22 | 28,022 | 28,022 | ||||||||||
Federal Home Loan Bank advances |
1,805,387 | 1,791,326 | 1,353,307 | 1,397,081 | ||||||||||
Securities sold under repurchase agreements |
1,026,870 | 1,265,565 | 998,430 | 1,204,329 | ||||||||||
Notes payable |
7,366 | 7,366 | 16,506 | 16,506 | ||||||||||
Accrued interest payable |
19,386 | 19,386 | 18,977 | 18,977 | ||||||||||
Long-term debt |
235,570 | 103,442 | 235,570 | 120,325 | ||||||||||
Derivatives payable |
38,828 | 14,185 | 43,453 | 14,142 | ||||||||||
The methods and assumptions used to estimate the fair value of each class of financial instruments for which it is practicable to estimate that value are explained below:
Cash and Cash Equivalents – The carrying amounts approximate fair values due to the short-term nature of these instruments.
Short-Term Investments – The fair values of short-term investments generally approximate their book values due to their short maturities.
Securities Purchased Under Resale Agreements – For securities purchased under resale agreements with original maturities of 90 days or less, the carrying amounts approximate fair values due to the short-term nature of these instruments. At December 31, 2009 and 2008, the securities purchased under
126
resale agreements are long-term in nature and the fair value is estimated by discounting the cash flows based on expected maturities or repricing dates utilizing estimated market discount rates.
Investment Securities Held-To-Maturity – The fair values of the investment securities held-to-maturity are generally determined by reference to the average of at least two quoted market prices obtained from independent external brokers or independent external pricing service providers who have experience in valuing these securities. In obtaining such valuation information from third parties, the Company has reviewed the methodologies used to develop the resulting fair values.
Investment Securities Available-For-Sale – The fair values of the investment securities available-for-sale are generally determined by reference to the average of at least two quoted market prices obtained from independent external brokers or independent external pricing service providers who have experience in valuing these securities. In obtaining such valuation information from third parties, the Company has reviewed the methodologies used to develop the resulting fair values. For private label mortgage-backed securities and trust preferred securities, fair values are derived based on a combination of broker prices and discounted cash flow analyses that are weighted as deemed appropriate for each security.
Loans Receivable, net – The fair value of loans is determined based on the discounted cash flow approach. The discount rate is derived from the associated yield curve plus spreads, and reflects the offering rates in the market for loans with similar financial characteristics. No adjustments have been made for changes in credit within the loan portfolio. It is management's opinion that the allowance for loan losses pertaining to performing and nonperforming loans results in a fair valuation of such loans.
Federal Home Loan Bank and Federal Reserve Bank Stock – The carrying amount approximates fair value, as the stock may be sold back to the Federal Home Loan Bank and the Federal Reserve Bank at carrying value.
Accrued Interest Receivable – The carrying amount of accrued interest receivable approximates fair value due to its short-term nature.
Equity Swap Agreements – The fair value of the derivative contracts is provided by an independent third party and is determined based on the change in value of the HSCEI and the volatility of the call option over the life of the individual swap agreement. The option value is derived based on the volatility of the option, interest rate and time remaining to the maturity. The Company has also considered the counterparty's credit risk in determining the valuation.
Deposits – The fair value of deposits is determined based on the discounted cash flow approach. The discount rate is derived from the associated yield curve, plus spread, if any. For core deposits, the cash outflows are projected by the decay rate based on the Bank's core deposit premium study. Cash flows for all non-time deposits are discounted using the LIBOR yield curve. For time deposits, the cash flows are based on the contractual runoff and are discounted by the Bank's current offering rates, plus spread.
Federal Funds Purchased – The carrying amounts approximate fair values due to the short-term nature of these instruments.
Federal Home Loan Bank Advances – The fair value of FHLB advances is estimated based on the discounted value of contractual cash flows, using rates currently offered by the FHLB of San Francisco for fixed-rate credit advances with similar remaining maturities at each reporting date.
127
Securities Sold Under Repurchase Agreements – For securities sold under repurchase agreements with original maturities of 90 days or less, the carrying amounts approximate fair values due to the short-term nature of these instruments. At December 31, 2009 and 2008, most of the securities sold under repurchase agreements are long-term in nature and the fair values of securities sold under repurchase agreements are calculated by discounting future cash flows based on expected maturities or repricing dates, utilizing estimated market discount rates and taking into consideration the call features of each instrument.
Notes Payable – The carrying amount of notes payable approximates fair value as these notes are payable on demand.
Accrued Interest Payable – The carrying amount of accrued interest payable approximates fair value due to its short-term nature.
Long-Term Debt – The fair values of long-term debt are estimated by discounting the cash flows through maturity based on current market rates the Bank would pay for new issuances.
Derivatives Payable – The Company's derivatives payable are recorded in conjunction with the certificate of deposits ("host instrument") that pays interest based on changes in the HSCEI. The Company's derivatives payable are estimated using the income approach. The Company has also considered its own credit risk in determining the valuation.
The fair value estimates presented herein are based on pertinent information available to management as of each reporting date. Although the Company is not aware of any factors that would significantly affect the estimated fair value amounts, such amounts have not been comprehensively revalued for purposes of these financial statements since that date, and therefore, current estimates of fair value may differ significantly from the amounts presented herein.
4. CASH AND CASH EQUIVALENTS AND SHORT-TERM INVESTMENTS
Cash and cash equivalents include cash, amounts due from banks, money-market funds, and other short-term investments with original maturities of less than 90 days. Short-term investments, which include federal funds sold, are recorded at cost, which approximates market.
The composition of cash and cash equivalents at December 31, 2009 and 2008 is presented as follows:
| |
December 31, | ||||||||
|---|---|---|---|---|---|---|---|---|---|
| |
2009 | 2008 | |||||||
| |
(Dollars in thousands) |
||||||||
Cash and amounts due from banks |
$ | 585,024 | $ | 144,486 | |||||
Cash equivalents: |
|||||||||
Money market funds |
150,031 | 724,156 | |||||||
Other Short-term investments |
100,086 | 10,211 | |||||||
Total cash and cash equivalents |
$ | 835,141 | $ | 878,853 | |||||
Short-term investments include interest-bearing deposits in other banks and other short-term investments with original maturities of greater than 90 days and less than one year.
128
The following table provides information on short-term investments as of and for the period ended December 31, 2009 and 2008.
| |
December, 31 | ||||||
|---|---|---|---|---|---|---|---|
| |
2009 | 2008 | |||||
| |
(Dollars in thousands) |
||||||
Balance at end of year |
$ | 510,788 | $ | 228,441 | |||
Average balance outstanding during the year |
500,031 | 25,230 | |||||
Maximum balance outstanding at any month-end |
579,183 | 228,441 | |||||
Weighted average interest rate at end of year |
0.38 | % | 2.02 | % | |||
5. SECURITIES PURCHASED UNDER RESALE AGREEMENTS
Securities purchased under resale agreements ("resale agreements") increased to $227.4 million as of December 31, 2009, compared with $50.0 million at December 31, 2008. The increase as of December 31, 2009 reflects an additional resale agreement for $30.0 million entered into during 2009 and the assumption of $150.0 million in resale agreements, less a discount of $2.6 million, resulting from the UCB Acquisition.
The $227.4 million balance of resale agreements at December 31, 2009 is comprised of four resale agreements. One resale agreement for $50 million has a term of fifteen years. The interest rate is initially fixed for the first two years and thereafter becomes floating. There is no interest payment on this agreement if certain swap yield curves are inverted. An additional $30.0 million resale agreement has a resale date of November 16, 2024. The interest rate is 7.5% for each day on which the three month USD London Interbank Offered Rate ("LIBOR") is less than or equal to 7.00%, and 0.00% for each day on which three month USD LIBOR exceeds 7.00%. Interest payments on this resale agreement are made quarterly.
The Company acquired two resale agreements totaling $150.0 million as a result of the UCB Acquisition. The first resale agreement is for $75.0 million and matures on March 14, 2017. Under the terms of the resale agreement, interest payments are due semi-annually. The interest rate for this resale agreement is based on the six month USD LIBOR plus a margin of 1.75% for the first and second year. For year three through year ten, the interest rate is based on a rate of 7.4% plus ten times the difference between 65% of the average one month USD LIBOR and the average USD SIFMA Swap index, subject to a minimum of 0.00% and a maximum of 10.09%. The second resale agreement is also for $75.0 million and matures on March 30, 2017. Under the terms of the resale agreement, interest payments are due quarterly. The interest rate for this resale agreement is based on 7.72% plus ten times the difference between 65% of the average one month USD LIBOR and the average USD SIFMA Swap index, subject to a minimum of 0.00% and a maximum of 10.19%.
The $50.0 million balance of resale agreements at December 31, 2008 is comprised of one resale agreement with a term of ten years. The interest rate is initially fixed for the first two years and thereafter becomes floating. There is no interest payment on this agreement if certain swap yield curves are inverted. The collateral for this resale agreement consists of U.S. Government agency and/or U.S. Government sponsored enterprise debt and mortgage-backed securities held in safekeeping by a third party custodian.
Resale agreements are recorded at the amounts at which the securities were acquired. The Company's policy is to obtain possession of securities purchased under resale agreements that is equal to or greater than the principal amount loaned. The market value of the underlying securities, which
129
collateralize the related receivable on resale agreements, is monitored, including accrued interest. Additional collateral may be requested from the counterparty when determined to be appropriate.
Total interest income on resale agreements amounted to $8.0 million, $6.4 million, and $15.1 million, for the years ended December 31, 2009, 2008, and 2007, respectively.
6. INVESTMENT SECURITIES
An analysis of the held-to-maturity and available-for-sale investment securities portfolio is presented as follows:
| (In thousands) | Amortized Cost |
Gross Unrealized Gains |
Gross Unrealized Losses |
Estimated Fair Value |
|||||||||||
|---|---|---|---|---|---|---|---|---|---|---|---|---|---|---|---|
As of December 31, 2009 |
|||||||||||||||
Available-for-sale |
|||||||||||||||
U.S. Treasury securities |
$ | 304,105 | $ | 8 | $ | (641 | ) | $ | 303,472 | ||||||
U.S. Government agency securities and U.S. Government sponsored enterprise debt securities |
841,953 | 507 | (10,435 | ) | 832,025 | ||||||||||
U.S. Government agency and U.S. Government sponsored enterprise mortgage-backed securities |
|||||||||||||||
Commercial mortgage-backed securities |
25,503 | 852 | - | 26,355 | |||||||||||
Residential mortgage-backed securities |
707,290 | 17,863 | (805 | ) | 724,348 | ||||||||||
Municipal securities |
59,264 | 1,027 | (98 | ) | 60,193 | ||||||||||
Other residential mortgage-backed securities |
|||||||||||||||
Investment grade |
95,181 | 827 | (492 | ) | 95,516 | ||||||||||
Non-investment grade |
50,843 | 368 | (9,601 | ) | 41,610 | ||||||||||
Corporate debt securities |
|||||||||||||||
Investment grade |
441,606 | 20,428 | (1,138 | ) | 460,896 | ||||||||||
Non-investment grade (1) |
26,277 | - | (17,416 | ) | 8,861 | ||||||||||
U.S. Government sponsored enterprise equity securities |
1,998 | - | (216 | ) | 1,782 | ||||||||||
Other securities |
9,023 | - | - | 9,023 | |||||||||||
Total investment securities |
$ | 2,563,043 | $ | 41,880 | $ | (40,842 | ) | $ | 2,564,081 | ||||||
As of December 31, 2008 |
|||||||||||||||
Held-to-maturity |
|||||||||||||||
Municipal securities |
$ | 5,772 | $ | 118 | $ | - | $ | 5,890 | |||||||
Corporate debt securities |
116,545 | 904 | (234 | ) | 117,215 | ||||||||||
Total investment securities held-to-maturity |
122,317 | 1,022 | (234 | ) | 123,105 | ||||||||||
Available-for-sale |
|||||||||||||||
U.S. Treasury securities |
2,505 | 8 | - | 2,513 | |||||||||||
U.S. Government agency securities and U.S. Government sponsored enterprise debt securities |
1,020,355 | 4,762 | (1,183 | ) | 1,023,934 | ||||||||||
U.S. Government agency securities and U.S. Government sponsored enterprise mortgage-backed securities |
373,690 | 6,758 | (397 | ) | 380,051 | ||||||||||
Other mortgage-backed securities |
645,940 | - | (108,614 | ) | 537,326 | ||||||||||
Corporate debt securities (1) |
116,127 | 266 | (73,849 | ) | 42,544 | ||||||||||
U.S. Government sponsored enterprise equity securities (1) |
3,340 | - | (2,156 | ) | 1,184 | ||||||||||
Residual securities |
25,043 | 25,019 | - | 50,062 | |||||||||||
Other securities (1) |
2,570 | 10 | - | 2,580 | |||||||||||
Total investment securities available-for-sale |
2,189,570 | 36,823 | (186,199 | ) | 2,040,194 | ||||||||||
Total investment securities |
$ | 2,311,887 | $ | 37,845 | $ | (186,433 | ) | $ | 2,163,299 | ||||||
- (1)
- As of December 31, 2008, the Company recorded an OTTI charge of $13.6 million for corporate debt securities, $55.3 million for U.S. Government sponsored enterprise equity securities, and $4.3 million for other securities. Upon adoption of ASC 320, the Company reclassified the noncredit portion of previously recognized OTTI for pooled trust preferred securities totaling $8.1 million, on a net of tax basis, from the opening balance of retained earnings to other comprehensive income as of March 31, 2009. Additionally, the Company recorded $107.7 million, on a pre-tax basis, of the credit portion of OTTI through earnings and $8.2 million, net of tax, of the non-credit portion of OTTI for pooled trust preferred securities in other comprehensive income for the year ended December 31, 2009.
130
The following table shows the Company's rollforward of the amount related to credit losses for the year ended December 31, 2009:
(In thousands) |
||||
Beginning balance, January 1, 2009 |
$ | - | ||
Additions of OTTI that was not previously recognized |
107,671 | |||
Ending balance, December 31, 2009 |
$ | 107,671 | ||
The following table shows the Company's investment portfolio's gross unrealized losses and related fair values, aggregated by investment category and length of time that individual securities have been in a continuous unrealized loss position, for the years ended December 31, 2009 and 2008:
| |
Less Than 12 Months |
12 Months or More | Total | |||||||||||||||||||
|---|---|---|---|---|---|---|---|---|---|---|---|---|---|---|---|---|---|---|---|---|---|---|
| (In thousands) | Fair Value |
Unrealized Losses |
Fair Value |
Unrealized Losses |
Fair Value |
Unrealized Losses |
||||||||||||||||
As of December 31, 2009 |
||||||||||||||||||||||
Available-for-sale |
||||||||||||||||||||||
U.S. Treasury securities |
$ | 253,002 | $ | (641 | ) | $ | - | $ | - | $ | 253,002 | $ | (641 | ) | ||||||||
U.S. Government agency and U.S. Government sponsored enterprise debt securities |
673,067 | (10,435 | ) | - | - | 673,067 | (10,435 | ) | ||||||||||||||
U.S. Government agency and U.S. Government sponsored enterprise mortgage-backed securities |
||||||||||||||||||||||
Commercial mortgage-backed securities |
- | - | - | - | - | - | ||||||||||||||||
Residential mortgage-backed securities |
55,947 | (805 | ) | - | - | 55,947 | (805 | ) | ||||||||||||||
Municipal securities |
12,369 | (98 | ) | 12,369 | (98 | ) | ||||||||||||||||
Other residential mortgage-backed securities |
||||||||||||||||||||||
Investment grade |
47,343 | (492 | ) | - | - | 47,343 | (492 | ) | ||||||||||||||
Non-investment grade |
19,970 | (1,011 | ) | 12,739 | (8,590 | ) | 32,709 | (9,601 | ) | |||||||||||||
Corporate debt securities |
||||||||||||||||||||||
Investment grade |
32,342 | (97 | ) | 978 | (1,041 | ) | 33,320 | (1,138 | ) | |||||||||||||
Non-investment grade |
- | - | 8,861 | (17,416 | ) | 8,861 | (17,416 | ) | ||||||||||||||
U.S. Government sponsored enterprise equity securities |
1,782 | (216 | ) | - | - | 1,782 | (216 | ) | ||||||||||||||
Residual securities |
- | - | - | - | - | - | ||||||||||||||||
Other securities |
- | - | - | - | - | - | ||||||||||||||||
Total temporarily impaired securities |
$ | 1,095,822 | $ | (13,795 | ) | $ | 22,578 | $ | (27,047 | ) | $ | 1,118,400 | $ | (40,842 | ) | |||||||
As of December 31, 2008 |
||||||||||||||||||||||
Held-to-maturity |
||||||||||||||||||||||
Corporate debt securities |
$ | 40,057 | $ | (234 | ) | $ | - | $ | - | $ | 40,057 | $ | (234 | ) | ||||||||
Total temporarily impaired securities held-to-maturity |
$ | 40,057 | $ | (234 | ) | $ | - | $ | - | $ | 40,057 | $ | (234 | ) | ||||||||
Available-for-sale |
||||||||||||||||||||||
U.S. Government agency securities and U.S. Government sponsored enterprise debt securities |
$ | 143,727 | $ | (1,183 | ) | $ | - | $ | - | $ | 143,727 | $ | (1,183 | ) | ||||||||
U.S. Government agency securities and U.S. Government sponsored enterprise mortgage-backed securities |
72,245 | (397 | ) | - | - | 72,245 | (397 | ) | ||||||||||||||
Other mortgage-backed securities |
17,984 | (3,339 | ) | 519,090 | (105,275 | ) | 537,074 | (108,614 | ) | |||||||||||||
Corporate debt securities |
4,016 | (2,946 | ) | 34,611 | (70,903 | ) | 38,627 | (73,849 | ) | |||||||||||||
U.S. Government sponsored enterprise equity securities |
1,184 | (2,156 | ) | - | - | 1,184 | (2,156 | ) | ||||||||||||||
Total temporarily impaired securities available-for-sale |
$ | 239,156 | $ | (10,021 | ) | $ | 553,701 | $ | (176,178 | ) | $ | 792,857 | $ | (186,199 | ) | |||||||
Total temporarily impaired securities |
$ | 279,213 | $ | (10,255 | ) | $ | 553,701 | $ | (176,178 | ) | $ | 832,914 | $ | (186,433 | ) | |||||||
131
Unrealized Losses
The Company has seven individual securities that have been in a continuous unrealized loss position for twelve months or longer as of December 31, 2009. These securities are comprised of six corporate debt securities with a total fair value of $9.8 million and one mortgage-backed security with a fair value of $12.7 million. As of December 31, 2009, there were also 72 securities that have been in a continuous unrealized loss position for less than twelve months. The unrealized losses on these securities are primarily attributed to changes in interest rates as well as the liquidity crisis that has impacted all financial industries. The issuers of these securities have not, to the Company's knowledge, established any cause for default on these securities. These securities have fluctuated in value since their purchase dates as market interest rates have fluctuated. The Company does not intend to sell these securities and it is not more likely than not that the Company will be required to sell the investments before recovery of their amortized cost bases. As such, the Company does not deem these securities to be other-than-temporarily impaired as of December 31, 2009.
Corporate Debt Securities (Available-for-Sale)
The majority of unrealized losses in the available-for-sale portfolio at December 31, 2009 are related to trust preferred debt securities. As of December 31, 2009, the Company had $14.5 million in trust preferred debt securities available-for-sale, representing less than 1% of the total investment securities available-for-sale portfolio. During the year, except for one security that maintained its rating and one security which was downgraded but remained at investment grade status, the ratings for the other fourteen trust preferred securities were downgraded to non-investment grade status due to increased deferral and default activity from the issuers of the underlying debt collateralizing these instruments. As of December 31, 2009, these non-investment grade debt instruments had gross unrealized losses amounting to $17.4 million, or 66% of the total amortized cost basis of these securities, comprised of $3.3 million in gross unrealized losses and $14.1 million, or $8.2 million on a net of tax basis, in noncredit-related impairment losses recorded during the year ended December 31, 2009 pursuant to the provisions of ASC 320-10-65. As a result of the previously discussed diminishing collateral values, deteriorating cash flows, and increasing estimates of future deferrals and defaults, we recorded an impairment loss of $121.8 million on our portfolio of pooled trust preferred securities during the year of which $106.6 million was a pre-tax credit loss recorded through earnings. Included in the $106.6 million in gross unrealized losses, is the reclassification of $14.0 million, or $8.1 million on a net of tax basis, in previously recognized noncredit-related impairment losses from the opening balance of retained earnings to other comprehensive income. This reclassification was recorded as of March 31, 2009 pursuant to the provisions of FSP FAS 115-2 and FAS 124-2.
During 2008 and 2007, the Company recorded $13.6 million and $405 thousand, respectively, in non-credit related impairment losses on three trust preferred securities due to rating downgrades caused by increases in market spreads, concerns regarding the housing market, and lack of liquidity in the market. None of these securities have experienced any credit-related losses for which OTTI was previously recorded. Upon the implementation of ASC 320-10-65, the Company reclassified the combined $14.0 million, or $8.1 million on a net of tax basis, in noncredit-related OTTI impairment losses recognized during 2008 and 2007 from the opening balance of retained earnings to other comprehensive income as of March 31, 2009.
Mortgage-backed Securities (Available-for-Sale)
As of December 31, 2009, the Company had one private-label available-for-sale mortgage-backed security with a fair value of $12.7 million, with a gross unrealized loss of $8.6 million, or 40.3% of the amortized cost basis of this security, for more than 12 months. During the second quarter of 2009, this
132
security was downgraded from investment grade to non-investment grade. This security is collateralized by single family loans and secured by the first lien on these residential properties. Additionally, any principal and interest shortfall that may arise from the deterioration of the collateral will be covered by a monoline insurance provider. The Company does not intend to sell this security and it is not more likely than not that the Company will be required to sell this security before recovery of its amortized cost basis. As such, the Company does not deem this security to be other-than-temporarily impaired as of December 31, 2009. This investment is included in the $41.6 million of non-investment grade mortgage backed securities, representing 1.6% of our total investment securities have an unrealized loss of $9.6 million or 18.9% of the aggregate amortized cost basis of these securities as of December 31, 2009.
In May 2009, the Company desecuritized its private-label mortgage backed securities which resulted in a $635.6 million increase in single and multifamily loans receivable with a corresponding decrease in available-for-sale investment securities. These single family and multifamily loans were previously originated by the Company and were securitized in 2006 and 2007 for additional liquidity purposes. All of the resulting securities were retained by the Company in its available-for-sale investment portfolio. The Company's decision to desecuritize these securities was prompted by the fair value adjustments recorded on these securities that were based on price points observed in the general market for mortgage-backed securities that were not reflective of the better credit quality of the underlying loans. These loans had very low overall delinquency rates as of December 31, 2009. The accumulated fair value adjustments on these securities, recorded in other comprehensive income, were negatively impacting the Company's tangible common equity. The desecuritization added $30.6 million to the Company's tangible common equity.
Government-Sponsored Equity Preferred Stock (Available-for Sale)
In September 2008, liquidity and credit concerns led the U.S. Federal Government to assume a conservatorship role in Fannie Mae and Freddie Mac. The rating on Fannie Mae and Freddie Mac preferred stock securities was downgraded from investment grade to non-investment grade status reflecting the cessation of dividend payments on these securities. These securities are non-cumulative perpetual preferred stock in which unpaid dividends do not accumulate. The purchase agreement between the U.S. Treasury and these government-sponsored entities contains a covenant prohibiting the payment of dividends on existing preferred stock. As the assessment on the status of any resumption in dividend payments on these securities was uncertain, the Company recorded $55.3 million in OTTI charges on Fannie Mae and Freddie Mac preferred stock securities in 2008. In December 2009, we recorded an additional $1.0 million in OTTI charges. As of December 31, 2009, the fair value of these preferred stock securities was $1.8 million. The outlook for these preferred securities remains stable. The Company does not intend to sell these securities and it is not more likely than not that the Company will be required to sell these securities before recovery of their amortized cost basis. As such, the Company does not deem these remaining securities to be other-than-temporarily impaired as of December 31, 2009.
As of December 31, 2008, there were fifteen individual securities that have been in a continuous unrealized loss position for twelve months or more. These securities are comprised of eleven trust preferred securities with a total fair value of $34.6 million and four mortgage-backed securities with a total fair value of $519.1 million. As of December 31, 2008, there were also 72 securities that have been in a continuous unrealized loss position for less than twelve months. The unrealized losses on these securities are primarily attributed to changes in interest rates as well as the liquidity crisis that has impacted all financial industries. The issuers of these securities have not, to our knowledge, established any cause for default on these securities. These securities have fluctuated in value since their purchase dates as market interest rates have fluctuated. However, the Company has the ability and the intention
133
to hold these securities until their fair values recover to cost or maturity. As such, the Company does not deem these securities to be other-than-temporarily impaired.
The scheduled maturities of investment securities at December 31, 2009 are presented as follows:
| |
Available-for-sale | |||||||
|---|---|---|---|---|---|---|---|---|
| (In thousands) | Amortized Cost |
Estimated Fair Value |
||||||
Due within one year |
$ | 813,668 | $ | 804,332 | ||||
Due after one year through five years |
694,703 | 700,212 | ||||||
Due after five years through ten years |
197,562 | 201,179 | ||||||
Due after ten years |
855,112 | 856,576 | ||||||
Indeterminate maturity |
1,998 | 1,782 | ||||||
Total |
$ | 2,563,043 | $ | 2,564,081 | ||||
Actual maturities of mortgage-backed securities can differ from contractual maturities because borrowers have the right to prepay obligations. In addition, such factors as prepayments and interest rates may affect the yields on the carrying values of mortgage-backed securities.
Proceeds from sales of available-for-sale securities during 2009, 2008 and 2007 were $1.65 billion, $699.4 million and $541.1 million, respectively. Gross realized gains were $11.9 million, $9.0 million and $8.3 million during 2009, 2008 and 2007, respectively. Other than other-than-temporary impairment, the Company recorded no gross realized losses, $472 thousand and $472 thousand in 2009, 2008 and 2007, respectively. The realized losses recognized in 2007 primarily relate to the sale of U.S. Government sponsored enterprise mortgage-backed securities. The tax expense on the sale of investment securities available-for-sale amounted to $5.0 million, $3.8 million and $3.3 million for the years ended December 31, 2009, 2008 and 2007, respectively.
At December 31, 2009 and 2008, investment securities available-for-sale with a par value of $1.5 billion and $1.83 billion, respectively, were pledged to secure public deposits, FHLB advances, repurchase agreements, Federal Reserve Bank's discount window, or for other purposes required or permitted by law. None of the investment securities held-to-maturity were pledged as of December 31, 2009 and 2008.
During the year ended December 31, 2007, the Company securitized $1.18 billion in residential and multifamily mortgage loans through FNMA and through private label securitization. These transactions were treated as guaranteed mortgage securitizations, and in accordance with the provisions of ASC 860 (previously SFAS No. 140), they were accounted for as neither sales nor financings which had no impact on the Company's results of operations. All of the resulting securities were retained in the Company's available-for-sale securities portfolio and the Company recorded $13.8 million in mortgage servicing assets as a result of the securitizations as the Bank serviced the underlying loans. There were no securitization activities recorded in 2008. As previously discussed, in May 2009 the Company desecuritized its private label mortgage-backed securities. This resulted in the reduction of mortgage servicing assets by $6.6 million.
At December 31, 2009, we had no held-to-maturity investment securities compared to $122.3 million at December 31, 2008. During 2009 and subsequent to the UCB Acquisition, we transferred $681.4 million held-to-maturity investment securities to available-for-sale.
134
7. DERIVATIVE FINANCIAL INSTRUMENTS
Warrants – At December 31, 2009 and 2008, the Company had outstanding warrants to purchase the common stock of various companies. The Company received these warrants in connection with certain lending relationships, primarily with small, privately-held companies. The fair value of these warrants was zero at December 31, 2009 and approximately $549 thousand at December 31, 2008. As of December 31, 2009 the warrants were either exercised or written off.
Equity Linked Certificate of Deposits – During 2004, the Company entered into four equity swap agreements with a major investment brokerage firm to hedge against market fluctuations in a promotional equity index certificate of deposit product that was offered to customers for a limited time during the latter half of 2004. This product, which has a term of 51/2 years, pays interest based on the performance of the Hang Seng China Enterprises Index (the "HSCEI"). Under ASC 815, a certificate of deposit that pays interest based on changes in an equity index is a hybrid instrument with an embedded derivative (i.e. equity call option) that must be accounted for separately from the host contract (i.e. the certificate of deposit). In accordance with ASC 815, both the embedded equity call options on the certificates of deposit and the freestanding equity swap agreements are marked-to-market every month with resulting changes in fair value recorded in the consolidated statements of operations.
In December 2007, the Company entered into two new equity swap agreements in a promotional deposit product offered to bank customers which has a term of 5 years and pays interest based on the performance of the HSCEI. As of December 31, 2009, the combined notional amounts of the equity swap agreements totaled $38.8 million. As of December 31, 2008, the combined notional amounts of the equity swap agreements totaled $24.1 million.
The fair values of the equity swap agreements and embedded derivative liability for these six derivative contracts amounted to $14.2 million and $14.2 million, respectively, as of December 31, 2009, compared to $13.9 million and $14.1 million, respectively, as of December 31, 2008. The embedded derivative liability is included in interest-bearing deposits and the equity swap agreements are included in other assets on the consolidated balance sheets. The fair value of the derivative contracts is determined based on the change in value of the HSCEI and the volatility of the call option over the life of the individual swap agreement. The option value is derived based on the volatility, the interest rate and time remaining to the maturity of the call option. The Company has also considered the counterparty's as well as its own credit risk in determining the valuation of both the equity swap agreements and embedded derivative liability.
8. COVERED ASSETS AND FDIC INDEMNIFICATION ASSET
Covered Assets
Covered assets are loans receivable and real estate owned "REO" that were acquired in the UCB Acquisition in November 6, 2009 for which the Company entered into a shared-loss agreement (the "shared-loss agreement") with the FDIC. The shared-loss agreement covered all the loans originated by United Commercial Bank in the domestic U.S. and Hong Kong. Loans originated by United Commercial Bank in China under its United Commercial Bank China (Limited) subsidiary were not included in the shared-loss agreement. The Company will share in the losses, which begins with the first dollar of loss occurred, of the loan pools (including single family residential mortgage loans, commercial loans "covered loans" and foreclosed loan collateral and other real estate owned), together covered ("covered assets") under the shared-loss agreement.
135
Pursuant to the terms of the shared-loss agreement, the FDIC is obligated to reimburse the Company 80% of eligible losses of up to $2.05 billion with respect to covered assets. The FDIC will reimburse the Company for 95% of eligible losses in excess of $2.05 billion with respect to covered loans. The Company has a corresponding obligation to reimburse the FDIC for 80% or 95%, as applicable, of eligible recoveries with respect to covered loans. The shared-loss agreement for commercial and single family residential mortgage loans is in effect for 5 years and 10 years, respectively, from the November 6, 2009 acquisition date and the loss recovery provisions are in effect for 8 years and 10 years, respectively, from the acquisition date.
On January 14, 2020, the Company is required to pay to the FDIC 50% of the excess, if any of (i) $410 million over (ii) the sum of (A) 25% of the asset discount plus (B) 25% of the Cumulative Shared-Loss Payments plus (C) the Cumulative Servicing Amount if net losses on covered loans subject to the stated threshold is not reached. As of December 31, 2009, the estimate for this liability is zero.
At the November 6, 2009 acquisition date, we accounted for the loan portfolio acquired from United Commercial Bank at fair value and estimated that the fair value of the loan portfolio subject to the shared-loss agreement at $5.66 billion. This represents the expected cash flows from the portfolio. In estimating the nonaccretable difference, we (a) calculated the contractual amount and timing of undiscounted principal and interest payments (the "undiscounted contractual cash flows") and (b) estimated the amount and timing of undiscounted expected principal and interest payments (the "undiscounted expected cash flows"). The amount by which the undiscounted expected cash flows exceed the estimated fair value (the "accretable yield") is accreted into interest income over the life of the loans. The difference between the undiscounted contractual cash flows and the undiscounted expected cash flows is the nonaccretable difference. The nonaccretable difference represents our estimate of the credit losses expected and was considered in determining the fair value of the loans as of the acquisition date. In the determination of contractual cash flows and cash flows expected to be collected, we assumed no prepayment on the SOP 03-3 nonaccrual loan pools as we do not anticipate any significant prepayments on credit impaired loans. For the SOP 03-3 accrual loans for single-family, multi-family and commercial real estate, we used a third party vendor to obtain prepayment speeds, in order to be consistent with the market participation notion of the accounting standards. The third party vendor is recognized in the mortgage-industry for the delivery of prepayment and default models for the secondary market to identify loan level prepayment, delinquency, default, and loss propensities. The prepayment rates for the construction, land, commercial and consumer pools have historically been low and so we applied the prepayment assumptions of our current portfolio using our internal modeling. The Company has elected to account for all loans acquired in the FDIC-assisted acquisition of United Commercial Bank under ASC 310-30.
United Commercial Bank's loan portfolio included unfunded commitments for commercial lines of credit, constructions draws and other lending activity. Any additional advances on these loans subsequent to November 6, 2009 are not accounted for under ASC 310-30. The total commitment outstanding as of the acquisition date is included under the shared-loss agreement. As such, any additional advances, up to the total commitment outstanding at the time of acquisition are covered loans.
The covered loans acquired are and will continue to be subject to the Bank's internal and external credit review and monitoring. If credit deterioration is experienced subsequent to the November 6, 2009 acquisition fair value amount, such deterioration will be measured through our loss reserving methodology and a provision for credit losses will be charged to earnings with a partially offsetting noninterest income item reflecting the increase to the FDIC indemnification asset or receivable.
136
The fair value and the composition of the covered loans as of acquisition date, November 6, 2009 are as follows:
| |
Balance at acquisition date, November 6, 2009 | |||||||||||
|---|---|---|---|---|---|---|---|---|---|---|---|---|
| |
Credit Impaired | Other Loans | Total | |||||||||
| |
(In thousands) |
|||||||||||
Real estate loans |
||||||||||||
Residential single family |
$ | 23,042 | $ | 633,820 | $ | 656,862 | ||||||
Residential multifamily |
164,754 | 1,020,985 | 1,185,739 | |||||||||
Commercial and industrial real estate |
918,348 | 1,562,091 | 2,480,439 | |||||||||
Contruction and land |
1,304,112 | 165,660 | 1,469,772 | |||||||||
Total real estate |
2,410,256 | 3,382,556 | 5,792,812 | |||||||||
Other loans: |
||||||||||||
Commercial business |
702,486 | 698,681 | 1,401,167 | |||||||||
Other consumer |
636 | 104,688 | 105,324 | |||||||||
Total other loans |
703,122 | 803,369 | 1,506,491 | |||||||||
Total principal balance |
3,113,378 | 4,185,925 | 7,299,303 | |||||||||
Covered discount |
(1,108,059 | ) | (530,812 | ) | (1,638,871 | ) | ||||||
Total covered loans |
$ | 2,005,319 | $ | 3,655,113 | $ | 5,660,432 | ||||||
The carrying amounts and the composition of the covered loans as of December 31, 2009 are as follows:
| |
Balance at December 31, 2009 | |||||||||||
|---|---|---|---|---|---|---|---|---|---|---|---|---|
| |
Credit Impaired | Other Loans | Total | |||||||||
| |
(In thousands) |
|||||||||||
Real estate loans |
||||||||||||
Residential single family |
$ | 22,325 | $ | 621,742 | $ | 644,067 | ||||||
Residential multifamily |
158,452 | 1,010,413 | 1,168,865 | |||||||||
Commercial and industrial real estate |
900,165 | 1,515,284 | 2,415,449 | |||||||||
Contruction and land |
1,236,228 | 155,500 | 1,391,728 | |||||||||
Total real estate |
2,317,170 | 3,302,939 | 5,620,109 | |||||||||
Other loans: |
||||||||||||
Commercial business |
603,507 | 580,260 | 1,183,767 | |||||||||
Other consumer |
422 | 100,377 | 100,799 | |||||||||
Total other loans |
603,929 | 680,637 | 1,284,566 | |||||||||
Total principal balance |
2,921,099 | 3,983,576 | 6,904,675 | |||||||||
Covered discount |
(1,033,720 | ) | (474,948 | ) | (1,508,668 | ) | ||||||
Net valuation of loans |
1,887,379 | 3,508,628 | 5,396,007 | |||||||||
Subsequent acquisition loan advances |
— | 202,148 | 202,148 | |||||||||
Total covered loans |
$ | 1,887,379 | $ | 3,710,776 | $ | 5,598,155 | ||||||
At December 31, 2009, $675.6 million of the credit impaired loans were considered to be nonperforming loans.
137
The following table shows the estimated fair value and carrying amounts for the covered loans as of acquisition date November 6, 2009 and year ended December 31, 2009, respectively:
| Description | At Acquisition November 6, 2009 |
Year End December 31, 2009 |
|||||
|---|---|---|---|---|---|---|---|
| |
(In thousands) |
||||||
Contractually required payments of interest and principal |
$ | 8,407,745 | $ | 7,976,064 | |||
Nonaccretable difference |
(1,705,626 | ) | (1,596,950 | ) | |||
Cash flows expected to be collected (1) |
6,702,119 | 6,379,114 | |||||
Accretable difference |
(1,041,687 | ) | (983,107 | ) | |||
Carrying value of covered loans |
$ | 5,660,432 | $ | 5,396,007 | |||
- (1)
- Represents undiscounted expected principal and interest cash flows.
Changes in the accretable yield for the covered loans for the year ended December 31, 2009 is as follows:
| Description | Accretable Yield | |||
|---|---|---|---|---|
| |
(In thousands) |
|||
Balance at beginning of period |
$ | - | ||
Acquisition |
1,041,687 | |||
Accretion |
(9,731 | ) | ||
Disposals |
(48,849 | ) | ||
Balance at end of period |
$ | 983,107 | ||
The excess of cash flows expected to be collected over the initial fair value of acquired loans is referred to as the accretable yield and is accreted into interest income over the estimated life of the acquired loans using the effective yield method. The accretable yield will change due to:
- •
- estimate of the remaining life of acquired loans which may change the amount of future interest income
- •
- estimate of the amount of contractually required principal and interest payments over the estimated life that will not be
collected (the nonaccretable difference); and
- •
- indices for acquired loans with variable rates of interest.
From the acquisition date of November 6, 2009 to December 31, 2009, excluding scheduled principal payments, a total of $333.8 million of loans were removed from the covered loans accounted under ASC 310-30 due to loans being paid in full, sold, or transferred to covered OREO. The payoff activity during this period of time was higher than anticipated and what was modeled, however management does not believe this activity suggests the need for a change in the original prepayment assumptions at this time. The loan discount related to these prepayments of $74.4 million was recorded as an adjustment to interest income in 2009. No impairment write-downs were recorded in 2009.
FDIC Indemnification Asset
As of November 6, 2009, we recorded an FDIC indemnification asset of $1.14 billion, consisting of the present value of the amounts the Company expects to receive from the FDIC under the shared-loss agreement. From the period of time from November 7, 2009 through December 31, 2009, the Company recorded $8.3 million of accretion into income. Additionally, because of the high prepayment activity during this timeframe, the Company wrote down the FDIC indemnification asset by $60.5 million and recorded the adjustment to noninterest (loss) income. As of December 31, 2009, the recorded FDIC indemnification asset was $1.09 billion.
138
The table below shows FDIC indemnification asset activity for 2009:
| |
2009 | |||
|---|---|---|---|---|
| |
(In thousands) |
|||
Balance November 6, 2009 |
$ | 1,143,989 | ||
Accretion |
8,329 | |||
Writeoff |
(60,504 | ) | ||
Balance December 31, 2009 |
$ | 1,091,814 | ||
9. NON-COVERED LOANS AND ALLOWANCE FOR LOAN LOSSES
The following is a summary of loans receivable:
| |
December 31, | |||||||||
|---|---|---|---|---|---|---|---|---|---|---|
| |
2009 | 2008 | ||||||||
| |
(In thousands) |
|||||||||
Real estate loans: |
||||||||||
Residential single family |
$ | 930,392 | $ | 491,315 | ||||||
Residential multifamily |
1,022,383 | 677,989 | ||||||||
Commercial and industrial real estate |
3,964,622 | 4,048,564 | ||||||||
Construction |
455,142 | 1,260,724 | ||||||||
Total real estate loans |
6,372,539 | 6,478,592 | ||||||||
Other loans: |
||||||||||
Commercial business |
1,283,182 | 1,210,260 | ||||||||
Trade finance |
220,528 | 343,959 | ||||||||
Automobile |
6,817 | 9,870 | ||||||||
Other consumer |
617,967 | 206,772 | ||||||||
Total other loans |
2,128,494 | 1,770,861 | ||||||||
Total gross loans |
8,501,033 | 8,249,453 | ||||||||
Unearned fees, premiums and discounts, net |
(43,529 | ) | (2,049 | ) | ||||||
Allowance for loan losses |
(238,833 | ) | (178,027 | ) | ||||||
Loans held for sale |
28,014 | - | ||||||||
Loans receivable, net |
$ | 8,246,685 | $ | 8,069,377 | ||||||
Accrued interest on non-covered loans receivable amounted to $36.3 million and $32.5 million at December 31, 2009 and 2008, respectively.
Loans serviced for others amounted to $1.55 billion and $2.31 billion at December 31, 2009 and 2008, respectively. These represent loans that have either been sold or securitized for which the Bank continues to provide servicing. The bank has limited recourse for which a reserve has been established of $2.9 million at December 31, 2009 and $1.3 million at December 31, 2008. These loans are maintained off balance sheet and are not included in the loans receivable balance. The Bank held $4.7 million in custodial accounts on behalf of investors at December 31, 2009.
At December 31, 2009 and 2008, loans receivable totaling $6.42 billion and $4.03 billion, respectively, were pledged to secure public deposits, FHLB advances, repurchase agreements, and for other purposes required or permitted by law.
139
The Bank offers both fixed and adjustable rate ("ARM") first mortgage loans secured by one-to-four unit residential properties located in its primary lending areas. The Bank originated $226.6 million and $131.3 million in new residential single family loans during 2009 and 2008, respectively. The Bank primarily offers ARM loan programs that have six-month, three-year, five-year, or seven-year initial fixed periods. Residential single family mortgage loans are originated under three different types of programs: full/alternative documentation, reduced documentation and no documentation. The underwriting criteria for these loan programs vary in income and asset documentation levels. The Bank's underwriting criteria for all the loans in its residential single family mortgage loan programs include minimum FICO scores and maximum loan-to-value ratios. Additionally, the full/alternative documentation loan program requires verification of employment and income. Reduced documentation loans are primarily intended for borrowers who are self-employed. Generally, the Bank requires reduced documentation borrowers to have more equity in the property and higher amounts of liquid reserves. Finally, the no documentation loan program is designed for borrowers who demonstrate excellent credit quality and have the ability to place a large down payment or have high equity in the property. Of the $226.6 million in residential single family mortgage loans originated during 2009, 22% or $50.1 million were full/alternative documentation loans, 16% or $35.5 million were reduced documentation loans, 27% or $62.1 million were no documentation loans, and 35% or $78.9 million were limited documentation loans. In comparison, of the $131.3 million in residential single family mortgage loans originated during 2008, 7% or $8.8 million were full/alternative documentation loans, 35% or $46.0 million were reduced documentation loans and 55% or $76.6 million were no documentation loans.
The Bank also offers both fixed and ARM residential multifamily loan programs. For the years ended December 31, 2009 and 2008, the Bank originated $27.6 million and $27.8 million, respectively, in multifamily residential loans. The Bank primarily offers ARM multifamily loan programs that have six-month, three-year, or five-year initial fixed periods. Prior to the latter half of 2007, the Bank originated multifamily mortgage loans under two different types of programs: full documentation and reduced documentation. The underwriting criteria for these loan programs vary in income and asset documentation levels, similar to the programs mentioned in the residential single family loan programs. Underwriting criteria generally include minimum FICO scores, maximum loan-to-value ratios and minimum debt coverage ratios.
Additionally, the Bank has single family and multifamily residential mortgage loans that have contractual features that may increase its credit exposure. These mortgage loans include adjustable rate mortgage loans that may subject borrowers to significant future payment increases or create the potential for negative amortization of the principal balance.
Interest-only mortgage loans allow interest-only payments for a fixed period of time. At the end of the interest-only period, the loan payment includes principal payments and increases significantly. The borrower's new payment once the loan becomes amortizing (i.e. includes principal payments) will be greater than if the borrower had been making principal payments since the origination of the loan. The longer the interest-only period, the larger the amortizing payment will be when the interest-only period ends.
The Bank has purchased adjustable rate mortgage loans which permit different repayment options. The monthly payment is set as the initial interest rate for the first year of the loan. After that point, the borrower can make a minimum payment that is limited to a 7.5% increase in payment. If the minimum payment is not adequate to cover the interest amount due on the mortgage loan, the loan would have negative amortization, which will result in an increase in the mortgage loans' principal balance. These single family residential loans completely re-amortize every five years and the monthly payment is reset at that point. None of the adjustable rate mortgages held in the Bank's loan portfolio
140
that have the potential to negatively amortize were negatively amortizing as of December 31, 2009 and 2008.
The Bank's total exposure related to these products included in loans receivable for the years ended December 31, 2009 and 2008 is summarized as follows:
| |
Unpaid Principal Balance as of December 31, |
|||||||
|---|---|---|---|---|---|---|---|---|
| |
2009 | 2008 | ||||||
| |
(In thousands) |
|||||||
Interest only mortgage loans |
$ | 16,306 | $ | 40,399 | ||||
Adjustable rate mortgages with negative amortization features: |
||||||||
Residential single family loans |
853 | 1,181 | ||||||
Residential multifamily loans |
17,198 | 9,399 | ||||||
All of the loans that the Bank originates are subject to its underwriting guidelines and loan origination standards. Generally, loans obtained from third party originators, including the higher risk loans in the preceding table, are closed and funded in the Bank's name and are also subject to the same underwriting guidelines and loan origination standards. Management believes that the Bank's underwriting criteria and procedures adequately consider the unique risks which may come from these products. The Bank conducts a variety of quality control procedures and periodic audits to ensure compliance with its origination standards, including criteria for lending and legal requirements.
Allowance for Loan Losses
An analysis of the activity in the allowance for loan losses is as follows:
| |
Year Ended December 31, | |||||||||
|---|---|---|---|---|---|---|---|---|---|---|
| |
2009 | 2008 | 2007 | |||||||
| |
(In thousands) |
|||||||||
Balance, beginning of year |
$ | 178,027 | $ | 88,407 | $ | 78,201 | ||||
Allowance from acquisitions |
- | - | 4,125 | |||||||
Allowance for unfunded loan commitments, letters of credit and other recourse provision |
(1,778 | ) | 5,044 | 841 | ||||||
Provision for loan losses |
528,666 | 226,000 | 12,000 | |||||||
Impact of desecuritization |
9,262 | - | - | |||||||
Gross chargeoffs |
(485,256 | ) | (147,451 | ) | (7,206 | ) | ||||
Gross recoveries |
9,912 | 6,027 | 446 | |||||||
Balance, end of year |
$ | 238,833 | $ | 178,027 | $ | 88,407 | ||||
Generally, impaired loans include loans that are designated as nonaccrual or restructured. When the value of an impaired loan is less than the recorded investment in the loan, the deficiency will be charged off against the allowance for loan losses, or alternatively, a specific allocation will be established.
141
There were no commitments to lend additional funds to borrowers whose loans are impaired. The following table provides information on impaired loans for the periods indicated:
| |
As of and for the Year Ended December 31, |
||||||||||
|---|---|---|---|---|---|---|---|---|---|---|---|
| |
2009 | 2008 | 2007 | ||||||||
| |
(In thousands) |
||||||||||
Recorded investment with related allowance |
$ | 47,597 | $ | 69,165 | $ | 67,105 | |||||
Recorded investment with no related allowance |
143,855 | 162,913 | 56,711 | ||||||||
Allowance on impaired loans |
(19,622 | ) | (23,362 | ) | (16,272 | ) | |||||
Net recorded investment in impaired loans |
$ | 171,830 | $ | 208,716 | $ | 107,544 | |||||
Average total recorded investment in impaired loans |
$ | 227,200 | $ | 266,456 | $ | 120,972 | |||||
The following is a summary of interest foregone on impaired loans for the years ended December 31:
| |
For the Year Ended December 31, |
|||||||||
|---|---|---|---|---|---|---|---|---|---|---|
| |
2009 | 2008 | 2007 | |||||||
| |
(In thousands) |
|||||||||
Interest income that would have been recognized had impaired loans performed in accordance with their original terms |
$ | 13,743 | $ | 18,986 | $ | 9,680 | ||||
Less: Interest income recognized on impaired loans on a cash basis |
(10,231 | ) | (11,647 | ) | (6,801 | ) | ||||
Interest foregone on impaired loans |
$ | 3,512 | $ | 7,339 | $ | 2,879 | ||||
The Company recorded $528.7 million in loan loss provisions during 2009, as compared to $226.0 million in loss provisions recorded during 2008. The increase in loss provisions recorded during 2009, compared to 2008, was due to the sustained downturn in the real estate market and the overall economy.
During 2009, the Company recorded $475.3 million in net chargeoffs representing 5.69% of average non-covered loans outstanding during the year. In comparison, the Company recorded net chargeoffs totaling $141.4 million, or 1.64% of average loans outstanding, during 2008. Moreover, the volume of delinquent and nonperforming loans also increased significantly in 2009 relative to 2008 as a result of the deterioration in the real estate and housing markets.
The allowance for loan losses as of December 31, 2009 and 2008 was determined using the Company's systemic methodology, including recent loss history and information obtained from our loan review efforts, and is adequate for inherent losses in the loan portfolio at the balance sheet dates.
Nonaccrual Loans – Non-covered nonaccrual loans totaled $173.2 million and $214.6 million at December 31, 2009 and 2008, respectively. The increase in nonaccrual loans as of December 31, 2009 is due primarily to an increase in nonperforming land and residential construction loans resulting from the downturn in the housing market. Loans totaling $95.2 million which were under 90 days past due as of December 31, 2009 were included in nonaccrual loans as of December 31, 2009.
In light of the credit and mortgage crisis affecting the entire financial industry and its impact on our borrowers, the Company has taken a more proactive approach to assess potential loan impairment in our overall portfolio. The Company has expanded its scope to perform focused reviews of certain sectors of our loan portfolio to identify and mitigate potential losses. As a result of the rapid
142
deterioration in the market, the Company has recently noted that while its borrowers may continue to pay as agreed in accordance with their contractual terms and/or even though loans may not have reached a significant stage of delinquency, the existence of certain warning signs indicating possible collectibility issues warranted a more careful scrutiny of these loans for potential impairment. Specifically, the Company reviewed loans that exhibited the following characteristics:
- •
- diminishing or adverse changes in cash flows that serve as the principal source of repayment;
- •
- adverse changes in the financial position or net worth of guarantors or investors;
- •
- adverse changes in collateral values for collateral-dependent loans;
- •
- declining or adverse changes in inventory levels securing commercial business and trade finance;
- •
- failure in meeting financial covenants; or
- •
- other changes or conditions that may adversely impact the ultimate collectibility of loans.
Although certain loans are not 90 days or more delinquent and therefore still accruing interest, the Company has classified them as impaired as of December 31, 2009 because they exhibit one or more of the characteristics described above.
Loans Past Due 90 Days or More but not on Nonaccrual – At December 31, 2009 and 2008, there were no loans past due 90 days or more but not on nonaccrual status.
Restructured Loans – The Company had $114.0 million and $11.0 million in total performing restructured loans as of December 31, 2009 and 2008, respectively. Non performing restructured loans were $10.1 million at December 31, 2009 and are included in nonaccrual loans. Included in the $114.0 million total restructured loans as of December 31, 2009 were $96.0 million in performing A/B notes. In A/B note restructurings, the original note is bifurcated into two notes where the A note represents the portion of the original loan which allows for acceptable loan-to-value and debt coverage on the collateral and is expected to be collected in full and the B note represents the portion of the original loan where there is a shortfall in value and is fully charged off. The A/B notes balance as of December 31, 2009 is comprised of A note balances only. The A notes are performing loans at market interest rates with adequate collateral and cash flow and are accruing interest. In accordance with generally accepted accounting principles, A notes need not be disclosed as troubled debt restructurings in years after the restructuring if the restructuring agreement specifies an interest rate equal to or greater than the rate that the Bank was willing to accept at the time of the restructuring for a new loan with comparable risk and the loan is not impaired based on the terms specified by the restructuring agreement. At December 31, 2009, the amount of commitments for restructured loans were not significant.
Non-Covered Other Real Estate Owned – As of December 31, 2009, the Company had 28 OREO properties with a combined carrying value of $13.8 million. Approximately 68% of OREO properties as of December 31, 2009 were located in the Greater Los Angeles area and Inland Empire region of Southern California. During 2009, the Company foreclosed on 130 properties with an aggregate carrying value of $119.0 million as of the foreclosure date. During this period, the Company also sold 153 OREO properties with a combined carrying value of $112.2 million resulting in a total net loss on sale of $5.4 million. During the year ended December 31, 2008, the Company sold 29 OREO properties with a combined carrying value of $44.5 million for a net loss of $852 thousand. For the year ended December 31, 2007, the Company sold one OREO property with a carrying value of $2.8 million for a net gain of $1.3 million.
Allowance for Unfunded Loan Commitments, Off-Balance Sheet Credit Exposures, and Recourse Provisions – The allowance for unfunded loan commitments, off-balance sheet credit exposures, and
143
recourse provisions is maintained at a level believed by management to be sufficient to absorb estimated probable losses related to these unfunded credit facilities. The determination of the adequacy of the allowance is based on periodic evaluations of the unfunded credit facilities including an assessment of the probability of commitment usage, credit risk factors for loans outstanding to these same customers, and the terms and expiration dates of the unfunded credit facilities. As of December 31, 2009 and 2008, the allowance for unfunded loan commitments, off-balance sheet credit exposures, and recourse provisions amounted to $8.1 million and $6.3 million, respectively. Net adjustments to the allowance for unfunded loan commitments, off-balance sheet credit exposures, and recourse provisions are included in the provision for loan losses.
Credit Risk and Concentrations – There has been a significant slowdown in the housing market in portions of Los Angeles, Riverside, San Bernardino and Orange counties where a majority of the Company's loan customers are based. As of December 31, 2009, the Company had $4.43 billion in non-covered commercial real estate and construction loans. Substantially all of the Company's real estate loans are secured by real properties located in California. Continuing deterioration in the real estate market generally and in the residential building segment in particular could result in additional loan charge offs and provisions for loan losses in the future, which could have a material adverse effect on the Company's financial condition, net income and capital. In addition, although most of the Company's trade finance activities are related to trade with Asian countries, the majority of our loans are made to companies domiciled in the United States. A substantial portion of this business involves California-based customers engaged in import activities. In addition, we also offer Export-Import financing to various domestic and foreign exporters. These loans are guaranteed by the Export-Import Bank of the United States.
10. INVESTMENTS IN AFFORDABLE HOUSING PARTNERSHIPS
The Company has in the past invested in certain limited partnerships that were formed to develop and operate apartment complexes designed as high-quality affordable housing for lower income tenants throughout the United States. These investments increased with the acquisition of United Commercial Bank in 2009. The Company's ownership in each limited partnership varies from 1% to 20%. Each of the partnerships must meet the regulatory requirements for affordable housing for a minimum 15-year compliance period to fully utilize the tax credits. Depending on the ownership percentage and the influence the Company has on the limited partnership, the company uses either the equity method or cost method of accounting. Each limited partnership is being amortized using a level-yield method over the lives of the related tax credits. If the partnerships cease to qualify during the compliance period, the credits may be denied for any period in which the projects are not in compliance and a portion of the credits previously taken may be subject to recapture with interest.
The Company finances the purchase of certain real estate tax credits generated by partnerships which own multiple properties currently under construction. These transactions were financed with non-recourse notes which are collateralized by the Company's partnership interests in the real estate investment tax credits. The notes are payable upon demand and, if defaulted, interest will be imposed at an annual rate ranging from 10% to 18% or the maximum rate permitted by applicable law. No
144
interest is due if the notes are paid on demand. The Company has no liabilities in addition to these notes payable or any contingent liabilities to the partnerships.
| |
December 31, | |||||||||||||
|---|---|---|---|---|---|---|---|---|---|---|---|---|---|---|
| |
2009 | 2008 | ||||||||||||
| |
Amount | Count | Amount | Count | ||||||||||
| |
(Dollars in thousands) |
|||||||||||||
Tax credit partnerships: |
||||||||||||||
Equity method |
$ | 50,135 | 34 | $ | 17,990 | 7 | ||||||||
Cost method |
34,696 | 11 | 30,151 | 10 | ||||||||||
Grand total |
$ | 84,831 | 45 | $ | 48,141 | 17 | ||||||||
Notes payable |
$ | 7,365 | $ | 16,506 | ||||||||||
Remaining tax credits |
$ | 75,894 | $ | 47,923 | ||||||||||
The Company's usage of federal tax credits approximated $7.1 million, $5.7 million and $5.2 million during 2009, 2008 and 2007, respectively. Investment amortization amounted to $7.0 million, $7.1 million and $5.0 million for the years ended December 31, 2009, 2008 and 2007, respectively. In 2009, one investment incurred an impairment charge of $5.6 million.
11. PREMISES AND EQUIPMENT
Premises and equipment is included in other assets and consists of the following:
| |
December 31, | ||||||||
|---|---|---|---|---|---|---|---|---|---|
| |
2009 | 2008 | |||||||
| |
(In thousands) |
||||||||
Land |
$ | 15,545 | $ | 13,285 | |||||
Office buildings |
27,923 | 25,068 | |||||||
Leasehold improvements |
24,663 | 23,648 | |||||||
Furniture, fixtures and equipment |
39,253 | 37,917 | |||||||
Total cost |
107,384 | 99,918 | |||||||
Accumulated depreciation and amortization |
(48,285 | ) | (39,734 | ) | |||||
Net book value |
$ | 59,099 | $ | 60,184 | |||||
Depreciation expense on premises and equipment was $7.5 million, $8.3 million and $7.6 million for the years ended December 31, 2009, 2008 and 2007, respectively.
Capitalized assets are depreciated or amortized on a straightline basis in accordance with the estimated useful life for each fixed asset class. The estimated useful life for furniture and fixtures is seven years, office equipment is for five years and twenty-five years for buildings and improvements. Leasehold improvements are amortized over the term of the lease or useful life, whichever is shorter.
12. GOODWILL AND OTHER INTANGIBLE ASSETS
The carrying amount of goodwill amounted to $337.4 million at December 31, 2009 and 2008. Goodwill is tested for impairment on an annual basis as of December 31, or more frequently as events occur, or as current circumstances and conditions warrant. The Company records impairment writedowns as charges to noninterest expense and adjustments to the carrying value of goodwill. Subsequent reversals of goodwill impairment are prohibited.
145
During 2009, both the U.S. and global financial markets continued to experience volatility and the effect of such volatility continued to unfavorably impact the market prices of banking stocks, including the Company's. As of December 31, 2009, the Company's market capitalization based on total outstanding common and preferred shares was $2.63 billion and its total stockholders' equity was $2.28 billion. The Company performed its annual impairment test as of December 31, 2009 to determine whether and to what extent, if any, recorded goodwill was impaired. The analysis compared the fair value of each of the reporting units, including goodwill, to the respective carrying amounts. If the carrying amount of the reporting unit, including goodwill exceeds the fair value of that reporting unit, then further testing for goodwill impairment is performed.
During the first quarter of 2009, the Company re-aligned its management reporting structure and identified three business divisions that meet the criteria of an operating segment in accordance with generally accepted accounting principles. The Company's three operating segments are Retail Banking, Commercial Banking, and Other. The Company determined that there were no additional reporting units below each operating segment and therefore the reporting units are equivalent to the operating segments. See Note 26 to the Company's condensed consolidated financial statements presented elsewhere in this report for a further discussion of the revised business segments.
In order to determine the fair value of the reporting units, a combined income and market approach was used. Under the income approach, the Company provided a net income projection for the next 5 years plus a terminal growth rate was used to calculate the discounted cash flows and the present value of the reporting units. Under the market approach, the fair value was calculated using the current fair values of comparable peer banks of similar size, geographic footprint and focus. The market capitalizations and multiples of these peer banks were used to calculate the market price of the Company and each reporting unit. The fair value was also subject to a control premium adjustment, which is the cost savings that a purchaser of the reporting units could achieve by eliminating duplicative costs. Under the combined income and market approaches, the value from each approach was appropriately weighted to determine the fair value. As a result of this analysis, the Company determined that there was no goodwill impairment at December 31, 2009 as the fair values of all reporting units exceeded the current carrying amounts of the goodwill. No assurance can be given that goodwill will not be written down in future periods. The Company recorded goodwill impairment of $858 thousand as a charge to earnings during 2008.
The changes in the carrying amount of goodwill for the years ended December 31, 2009 and 2008 are summarized in the following table:
| |
As of December 31, | ||||||
|---|---|---|---|---|---|---|---|
| |
2009 | 2008 | |||||
Balance, beginning of year |
$ | 337,438 | $ | 335,366 | |||
Additions to goodwill |
- | - | |||||
Impairment write-down |
- | (858 | ) | ||||
Purchase accounting adjustments |
- | 2,930 | |||||
Balance, end of year |
$ | 337,438 | $ | 337,438 | |||
The Company also has premiums on acquired deposits which represent the intangible value of depositor relationships resulting from deposit liabilities assumed in various acquisitions. Other intangibles are tested for impairment on an annual basis, or more frequently as events occur, or as current circumstances and conditions warrant. The gross carrying amount of deposit premiums totaled $117.5 million and $43.0 million, respectively, and the related accumulated amortization totaled $26.9 million and $21.0 million, respectively, at December 31, 2009 and 2008. During 2009, the
146
Company added $74.4 million in deposit premiums as a result of the UCB Acquisition. During 2008, the Company recorded an $855 thousand impairment writedown on deposit premiums initially recorded for the DCB acquisition due to higher than anticipated runoffs in certain deposit categories. The Company did not record any impairment writedowns on deposit premiums during 2009. Total amortization expense on deposit premiums was $5.9 million, $7.3 million and $6.8 million during the years ended December 31, 2009, 2008 and 2007, respectively.
The following table provides the estimated future amortization expense of premiums on acquired deposits for the succeeding five years is as follows:
| Estimate For The Year Ending December 31, | Amount | |||
|---|---|---|---|---|
| |
(In thousands) |
|||
2010 |
$ | 13,059 | ||
2011 |
11,959 | |||
2012 |
10,563 | |||
2013 |
9,047 | |||
2014 |
8,162 | |||
13. MORTGAGE SERVICING ASSETS
Mortgage servicing assets are recorded when loans are sold to third parties and the servicing of those loans is retained by the Bank. The Company's two primary classes of mortgage servicing assets, which result from sales and securitizations, are single family loans and multifamily loans. Mortgage servicing assets are subject to interest rate risk and may become impaired when interest rates fall and borrowers refinance or prepay their mortgage loans. Mortgage servicing assets are included in other assets.
Income from servicing loans is reported as ancillary loan fee income, a component of noninterest income in the Company's consolidated statements of operations, and the amortization of mortgage servicing assets is reported as a reduction to ancillary loan fee income. Late fees and charges collected on delinquent loans are recorded as a component of loans receivable interest income in the consolidated statements of operations.
147
Information regarding the Company's mortgage servicing assets ("MSAs") for the years ended December 31, 2009 and 2008 is as follows:
| |
Year ended December 31, | |||||||
|---|---|---|---|---|---|---|---|---|
| |
2009 | 2008 | ||||||
| |
(In thousands) |
|||||||
MSAs balance, beginning of year |
$ | 20,118 | $ | 22,797 | ||||
Additions |
221 | 295 | ||||||
Addition due to UCB Acquisition |
5,192 | - | ||||||
Amortization |
(9,530 | ) | (2,974 | ) | ||||
MSAs before valuation allowance, end of year |
16,001 | 20,118 | ||||||
Valuation allowance |
(2,575 | ) | (3,626 | ) | ||||
MSAs, end of year |
$ | 13,426 | $ | 16,492 | ||||
Fair value, beginning of year |
$ |
20,174 |
$ |
23,078 |
||||
Fair value, end of year |
$ | 16,284 | $ | 20,174 | ||||
Valuation allowance, beginning of year |
$ |
(3,626 |
) |
$ |
(1,239 |
) |
||
Impairment reversal (provision) |
1,051 | (2,387 | ) | |||||
Valuation allowance, end of year |
$ | (2,575 | ) | $ | (3,626 | ) | ||
Key Assumptions: |
||||||||
Weighted average discount |
13.73 | % | 12.33 | % | ||||
Weighted average prepayment speed assumption |
10.32 | % | 9.38 | % | ||||
Estimated future amortization of mortgage servicing assets for the succeeding five years and thereafter is as follows:
| |
Total | ||||
|---|---|---|---|---|---|
| |
(In thousands) |
||||
Estimate for the year ending December 31, |
|||||
2010 |
$ | 2,208 | |||
2011 |
1,616 | ||||
2012 |
1,230 | ||||
2013 |
960 | ||||
2014 |
760 | ||||
Thereafter |
6,652 | ||||
Total |
$ | 13,426 | |||
The following table shows the hypothetical effect on the fair value of our mortgage servicing assets using various unfavorable variations of the expected levels of certain key assumptions used in the valuations as of December 31, 2009 and 2008. These sensitivities are hypothetical and are presented for illustration purposes only. As the amounts indicate, changes in fair value based on variations in assumptions generally cannot be extrapolated because the relationship of the change in assumption to the change in fair value may not be linear. Also, in this table, the effect of a variation in a particular assumption on the fair value of the interest that continues to be held by the transferor is calculated
148
without changing any of the other assumptions. In reality, changes in one factor may result in changes in another factor, which might magnify or counteract the sensitivities.
| |
December 31, | ||||||
|---|---|---|---|---|---|---|---|
| |
2009 | 2008 | |||||
| |
(Dollars in thousands) |
||||||
Balance sheet net carrying value |
$ | 13,426 | $ | 16,492 | |||
CPR assumption |
10.32 |
% |
9.38 |
% |
|||
Impact on fair value of 10% adverse change of prepayment speed |
$ | (107 | ) | $ | (269 | ) | |
Impact on fair value of 20% adverse change of prepayment speed |
$ | (209 | ) | $ | (526 | ) | |
Discount rate assumption |
13.73 |
% |
12.33 |
% |
|||
Impact on fair value of 10% adverse change of discount rate |
$ | (225 | ) | $ | (623 | ) | |
14. OTHER ASSETS
The components of the Company's other assets were as follows:
| |
December 31, | |||||||
|---|---|---|---|---|---|---|---|---|
| |
2009 | 2008 | ||||||
| |
(In thousands) |
|||||||
Federal Home Loan Bank Stock |
$ | 180,217 | $ | 86,729 | ||||
Federal Reserve Stock |
36,785 | 27,589 | ||||||
Premises and equipment, net |
59,099 | 60,184 | ||||||
Cash surrender value of life insurance policies |
98,552 | 94,745 | ||||||
Prepaid FDIC insurance premiums |
72,461 | - | ||||||
Deferred tax assets |
- | 184,588 | ||||||
Accrued taxes receivable |
108,781 | 18,917 | ||||||
FDIC receivable (1) |
166,861 | - | ||||||
Other |
69,317 | 64,043 | ||||||
Total other assets |
$ | 792,073 | $ | 536,795 | ||||
- (1)
- $62.0 million of this amount was received in January 2010.
15. CUSTOMER DEPOSIT ACCOUNTS
Customer deposit account balances are summarized as follows:
| |
December 31, | ||||||||
|---|---|---|---|---|---|---|---|---|---|
| |
2009 | 2008 | |||||||
| |
(In thousands) |
||||||||
Noninterest-bearing demand |
$ | 2,291,259 | $ | 1,292,997 | |||||
Interest-bearing checking |
667,177 | 363,285 | |||||||
Money market accounts |
3,138,866 | 1,323,402 | |||||||
Savings deposits |
991,520 | 420,133 | |||||||
Total core deposits |
7,088,822 | 3,399,817 | |||||||
Time deposits: |
|||||||||
Less than $100,000 |
3,240,094 | 1,521,988 | |||||||
$100,000 or greater |
4,658,697 | 3,220,154 | |||||||
Total time deposits |
7,898,791 | 4,742,142 | |||||||
Total deposits |
$ | 14,987,613 | $ | 8,141,959 | |||||
149
At December 31, 2009, the scheduled maturities of time deposits are as follows:
| |
$100,000 or Greater |
Less Than $100,000 |
Total | ||||||||
|---|---|---|---|---|---|---|---|---|---|---|---|
| |
(In thousands) |
||||||||||
2010 |
$ | 4,582,556 | $ | 3,114,037 | $ | 7,696,593 | |||||
2011 |
56,006 | 93,640 | 149,646 | ||||||||
2012 |
19,305 | 31,283 | 50,588 | ||||||||
2013 |
463 | 795 | 1,258 | ||||||||
2014 |
266 | 277 | 543 | ||||||||
Thereafter |
101 | 62 | 163 | ||||||||
Total |
$ | 4,658,697 | $ | 3,240,094 | $ | 7,898,791 | |||||
Accrued interest payable totaled $3.8 million and $10.2 million at December 31, 2009 and 2008, respectively. Interest expense on customer deposits by account type is summarized as follows:
| |
December 31, | |||||||||||
|---|---|---|---|---|---|---|---|---|---|---|---|---|
| |
2009 | 2008 | 2007 | |||||||||
| |
(In thousands) |
|||||||||||
Interest-bearing checking |
$ | 1,507 | $ | 3,226 | $ | 6,646 | ||||||
Money market accounts |
25,583 | 25,805 | 53,021 | |||||||||
Savings deposits |
3,322 | 4,148 | 4,400 | |||||||||
Time deposits: |
||||||||||||
Less than $100,000 |
32,073 | 35,061 | 37,164 | |||||||||
$100,000 or greater |
66,992 | 109,820 | 139,804 | |||||||||
Total |
$ | 129,477 | $ | 178,060 | $ | 241,035 | ||||||
As of December 31, 2009, time deposits within the Certificate of Deposit Account Registry Service ("CDARS") program increased to $995.0 million, compared to $946.8 million at December 31, 2008. The CDARS program allows customers with deposits in excess of FDIC-insured limits to obtain full coverage on time deposits through a network of banks within the CDARS program. Additionally, during the third quarter of 2008, the Company partnered with another financial institution to implement a new retail sweep product for non-time deposit accounts to provide added deposit insurance coverage for deposits in excess of FDIC-insured limits. Deposits gathered through these programs are considered brokered deposits under current regulatory reporting guidelines.
16. FEDERAL FUNDS PURCHASED
Federal funds purchased generally mature within one business day to six months from the transaction date. Federal funds purchased are included in notes payable and other borrowings.
150
The following table provides information on Federal funds purchased for the periods indicated:
| |
As of and for the Year Ended December 31, | |||||||||
|---|---|---|---|---|---|---|---|---|---|---|
| |
2009 | 2008 | 2007 | |||||||
| |
(Dollars in thousands) |
|||||||||
Balance at end of year |
$ | 22 | $ | 28,022 | $ | 222,275 | ||||
Average balance outstanding during the year |
$ | 2,379 | $ | 89,309 | $ | 173,103 | ||||
Maximum balance outstanding at any month-end |
$ | 3,022 | $ | 193,259 | $ | 222,275 | ||||
Weighted average interest rate during the year |
0.37 | % | 2.05 | % | 5.07 | % | ||||
Weighted average interest rate at end of year |
0.06 | % | 0.25 | % | 3.18 | % | ||||
As a means of augmenting its liquidity, the Company has established Federal funds lines with nine correspondent banks. The Company's available borrowing capacity from Federal funds line facilities amounted to $243.0 million and $289.0 million as of December 31, 2009 and 2008, respectively.
17. FEDERAL HOME LOAN BANK ADVANCES
FHLB advances and their related weighted average interest rates are summarized as follows:
| |
December 31, 2009 | December 31, 2008 | ||||||||||||
|---|---|---|---|---|---|---|---|---|---|---|---|---|---|---|
| Year of Maturity | Amount | Rate | Amount | Rate | ||||||||||
| |
(Dollars in thousands) |
|||||||||||||
2009 |
$ | - | - | % | $ | 630,114 | 4.79 | % | ||||||
2010 |
805,861 | 3.00 | % | 660,074 | 3.95 | % | ||||||||
2011 |
102,737 | 5.01 | % | 55,054 | 5.20 | % | ||||||||
2012 |
5,061 | 4.41 | % | 5,026 | 4.46 | % | ||||||||
2013 |
190,916 | 4.55 | % | - | - | % | ||||||||
After 2013 |
700,812 | 4.28 | % | 3,039 | 4.44 | % | ||||||||
Total |
$ | 1,805,387 | 3.78 | % | $ | 1,353,307 | 4.39 | % | ||||||
There were no overnight borrowings at December 31, 2009 and 2008. All term advances as of December 31, 2009 are at fixed interest rates and are secured by real estate loans.
The Company's available borrowing capacity from unused FHLB advances totaled $1.07 billion and $556.1 million at December 31, 2009 and 2008, respectively. The Company's available borrowing capacity from FHLB advances is derived from its outstanding FHLB advances and from its portfolio of real estate loans and home equity lines of credit ("HELOC") that are pledged to the FHLB. The increase in available borrowing capacity from FHLB advances at December 31, 2009 is primarily due to the decrease in outstanding FHLB advances, partially offset by the reduction in loans pledged to the FHLB at December 31, 2009, relative to December 31, 2008. Additionally, during 2009, the Company obtained additional borrowing capacity from the Federal Reserve discount window of almost $451.8 million by pledging construction and commercial business loans.
18. SECURITIES SOLD UNDER REPURCHASE AGREEMENTS
Securities sold under repurchase agreements totaled $1.03 billion and $998.4 million as of December 31, 2009 and 2008, respectively. The interest rates on these customer repurchase agreements ranged from 0.51% to 5.13% as of December 31, 2009. All of the other repurchase agreements are long-term with ten year maturity terms. The rates are all initially floating rate for a period of time
151
ranging from 6 months to 10 years. Thereafter, the rates are fixed for the remainder of the term, with interest rates ranging from 4.29% to 5.13%. The counterparty has the right to either a one-time call or a quarterly call when the rates change from floating to fixed, for each of the repurchase agreements.
These transactions are accounted for as collateralized financing transactions and recorded at the amounts at which the securities were sold. The collateral for these agreements consist of U.S. Government agency and U.S. Government sponsored enterprise debt and mortgage-backed securities. The Company may have to provide additional collateral for the repurchase agreements, as necessary.
The following table provides information on securities sold under repurchase agreements as of December 31, 2009 and 2008:
| |
December 31, 2009 | December 31, 2008 | |||||||||||
|---|---|---|---|---|---|---|---|---|---|---|---|---|---|
| Year of Maturity | Amount | Rate | Amount | Rate | |||||||||
| |
(Dollars in thousands) |
||||||||||||
2009 |
$ | - | % | $ | 3,430 | 0.70 | % | ||||||
2010 |
31,870 | 0.51 | % | - | 0.00 | % | |||||||
2015 |
245,000 | 4.49 | % | 245,000 | 4.50 | % | |||||||
2016 |
700,000 | 4.91 | % | 700,000 | 4.92 | % | |||||||
2017 |
50,000 | 4.15 | % | 50,000 | 4.15 | % | |||||||
|
$ | 1,026,870 | 4.63 | % | $ | 998,430 | 4.77 | % | |||||
Total interest expense recorded on repurchase agreements amounted to $49.7 million, $46.1 million and $38.5 million for the years ended December 31, 2009, 2008 and 2007, respectively.
The Company also has master repurchase agreements with other major brokerage companies. The Company's available borrowing capacity from repurchase agreements totaled $1.13 billion and $721.9 million at December 31, 2009 and 2008, respectively. The increase in the available borrowing capacity from repurchase agreements is due to the increase in investment securities available to be pledged at year-end 2008.
19. CAPITAL RESOURCES
Junior Subordinated Debt – The Company has formed nine statutory business trusts for the purpose of issuing junior subordinated debt to third party investors. Junior subordinated debt is recorded as a component of long-term debt and includes the value of the common stock issued by the Trusts to the Company in conjunction with these transactions. The common stock is recorded in other assets for the amount issued in connection with these junior subordinated debt issuances. As of December 31, 2009 and 2008, total junior subordinated debt of $155.8 million and total common stock of $4.8 million and $4.9 million, respectively, were issued by the Trusts to the Company.
The proceeds from these issuances represent liabilities of the Company to the Trusts and are reported in the consolidated balance sheets as a component of long-term debt. Interest payments on these securities are made either quarterly or semi-annually and are deductible for tax purposes. These securities are not registered with the Securities and Exchange Commission. For regulatory reporting purposes, these securities qualify for Tier I capital treatment.
152
The table below summarizes pertinent information related to outstanding junior subordinated debt issued by each Trust as of December 31, 2009 and 2008:
| |
|
|
|
Balance at December 31, |
|||||||||
|---|---|---|---|---|---|---|---|---|---|---|---|---|---|
| |
|
Stated Interest Rate |
Rate at December 31, 2009 |
||||||||||
| Trust Name | Maturity Date (1) | 2009 | 2008 | ||||||||||
| |
|
|
|
(Dollars in thousands) |
|||||||||
East West Capital Trust I |
March 2030 | 10.88%, fixed | 10.88% | $ | 10,750 | $ | 10,750 | ||||||
East West Capital Trust II |
July 2030 | 10.95%, fixed | 10.95% | 10,000 | 10,000 | ||||||||
East West Capital Statutory Trust III |
December 2033 | 3-month Libor + 2.85% | 3.10% | 10,000 | 10,000 | ||||||||
East West Capital Trust IV |
July 2034 | 3-month Libor + 2.55% | 2.83% | 10,000 | 10,000 | ||||||||
East West Capital Trust V |
November 2034 | 3-month Libor + 1.80% | 2.07% | 15,000 | 15,000 | ||||||||
East West Capital Trust VI |
September 2035 | 3-month Libor + 1.50% | 1.75% | 20,000 | 20,000 | ||||||||
East West Capital Trust VII |
June 2036 | 3-month Libor + 1.35% | 1.60% | 30,000 | 30,000 | ||||||||
East West Capital Trust VIII |
June 2037 | 3-month Libor + 1.40% | 1.66% | 20,000 | 20,000 | ||||||||
East West Capital Trust IX |
September 2037 | 3-month Libor + 1.90% | 2.15% | 30,000 | 30,000 | ||||||||
|
$ | 155,750 | $ | 155,750 | |||||||||
- (1)
- All of the above debt instruments are subject to various call options.
Subordinated Debt – In 2005, the Company issued $75.0 million in subordinated debt in a private placement transaction. For the subordinated debt, the maturity is September 15, 2015 and the interest rate is based on the three-month LIBOR plus 110 basis points, payable on a quarterly basis. At December 31, 2009, the interest rate on this debt instrument was 1.41%. The subordinated debt was issued through the Bank and qualifies as Tier II capital for regulatory reporting purposes and is included as a component of long-term debt in the accompanying consolidated balance sheets.
20. INCOME TAXES
The benefit or provision for income taxes consists of the following components:
| |
Year Ended December 31, | |||||||||||
|---|---|---|---|---|---|---|---|---|---|---|---|---|
| |
2009 | 2008 | 2007 | |||||||||
| |
(In thousands) |
|||||||||||
Current income tax (benefit) expense: |
||||||||||||
Federal |
$ | (109,092 | ) | $ | 20,575 | $ | 90,193 | |||||
State |
2,916 | 15,577 | 28,394 | |||||||||
Foreign |
1,758 | - | - | |||||||||
Total current income tax (benefit) expense |
(104,418 | ) | 36,152 | 118,587 | ||||||||
Deferred income tax (benefit) expense: |
||||||||||||
Federal |
127,668 | (61,068 | ) | (14,483 | ) | |||||||
State |
11,571 | (22,569 | ) | (3,012 | ) | |||||||
Foreign |
(12,107 | ) | ||||||||||
Total deferred income tax (benefit) expense |
127,132 | (83,637 | ) | (17,495 | ) | |||||||
Provision (benefit) for income taxes |
$ | 22,714 | $ | (47,485 | ) | $ | 101,092 | |||||
153
The difference between the effective tax rate implicit in the consolidated financial statements and the statutory federal income tax rate can be attributed to the following:
| |
Year Ended December 31, | |||||||||
|---|---|---|---|---|---|---|---|---|---|---|
| |
2009 | 2008 | 2007 | |||||||
Federal income tax provision at statutory rate |
35.0 | % | 35.0 | % | 35.0 | % | ||||
State franchise taxes, net of federal tax effect |
8.1 | 4.7 | 6.3 | |||||||
Tax credits |
(6.9 | ) | 7.7 | (2.2 | ) | |||||
Foreign subsidiaries acquisition |
(14.4 | ) | - | - | ||||||
Other, net |
(0.1 | ) | 1.5 | (0.5 | ) | |||||
Effective income tax rate |
21.7 | % | 48.9 | % | 38.6 | % | ||||
The tax effects of temporary differences that give rise to significant portions of the deferred tax (assets) liabilities are presented below:
| |
December 31, | |||||||||||||||||||||
|---|---|---|---|---|---|---|---|---|---|---|---|---|---|---|---|---|---|---|---|---|---|---|
| |
2009 | 2008 | ||||||||||||||||||||
| |
Federal | State | Total | Federal | State | Total | ||||||||||||||||
| |
(In thousands) |
|||||||||||||||||||||
Deferred tax liabilities: |
||||||||||||||||||||||
Premiums on deposits acquired |
$ | 31,407 | $ | 1,825 | $ | 33,232 | $ | 7,414 | $ | 2,296 | $ | 9,710 | ||||||||||
Depreciation |
- | 384 | 384 | 571 | 411 | 982 | ||||||||||||||||
FHLB stock dividends |
39,886 | 12,353 | 52,239 | 7,244 | 2,244 | 9,488 | ||||||||||||||||
Deferred loan fees |
4,943 | 1,474 | 6,417 | 5,324 | 1,592 | 6,916 | ||||||||||||||||
Purchased loan discounts |
233 | 72 | 305 | 256 | 79 | 335 | ||||||||||||||||
State taxes |
6,343 | - | 6,343 | 8,012 | - | 8,012 | ||||||||||||||||
Mortgage servicing assets |
10,408 | 549 | 10,957 | 1,471 | 564 | 2,035 | ||||||||||||||||
Acquisition of United Commercial Bank |
120,063 | 49,437 | 169,500 | |||||||||||||||||||
Other, net |
2,199 | 721 | 2,920 | 1,170 | 363 | 1,533 | ||||||||||||||||
Total gross deferred tax liabilities |
215,482 | 66,815 | 282,297 | 31,462 | 7,549 | 39,011 | ||||||||||||||||
Deferred tax assets: |
||||||||||||||||||||||
Bad debt deduction |
(86,369 | ) | (26,660 | ) | (113,029 | ) | (75,693 | ) | (23,354 | ) | (99,047 | ) | ||||||||||
Affordable housing partnership book loss |
(535 | ) | (285 | ) | (820 | ) | (930 | ) | (406 | ) | (1,336 | ) | ||||||||||
Deferred compensation accrual |
(13,701 | ) | (4,237 | ) | (17,938 | ) | (15,753 | ) | (4,879 | ) | (20,632 | ) | ||||||||||
State taxes |
(190 | ) | - | (190 | ) | - | - | - | ||||||||||||||
Purchased loan premium |
(1,112 | ) | (344 | ) | (1,456 | ) | (1,299 | ) | (402 | ) | (1,701 | ) | ||||||||||
Unrealized loss on securities |
(58,113 | ) | (15,138 | ) | (73,251 | ) | (71,220 | ) | (25,122 | ) | (96,342 | ) | ||||||||||
Net operating and capital loss carryforwards |
(23,192 | ) | (34,385 | ) | (57,577 | ) | - | (326 | ) | (326 | ) | |||||||||||
Other, net |
(4,787 | ) | (4,586 | ) | (9,373 | ) | (3,196 | ) | (1,019 | ) | (4,215 | ) | ||||||||||
Total gross deferred tax assets |
(187,999 | ) | (85,635 | ) | (273,634 | ) | (168,091 | ) | (55,508 | ) | (223,599 | ) | ||||||||||
Net deferred tax liabilities (assets) |
$ | 27,483 | $ | (18,820 | ) | $ | 8,663 | $ | (136,629 | ) | $ | (47,959 | ) | $ | (184,588 | ) | ||||||
154
At December 31, 2009, the bank had federal net operating loss carryforwards of approximately $40.9 million which will expire in 2029. At December 31, 2008, the Bank did not have any federal net operating loss carryforwards. At December 31, 2007, the Bank had a federal net operating loss carryforward of approximately $336 thousand which was fully utilized in 2008. This net operating loss carryforward was acquired in connection with the Bank's acquisition of American International Bank ("AIB"). At December 31, 2009, the Bank also had state net operating loss carryforwards of approximately $317.2 million of which $3.0 million resulting from the acquisition of DCB will expire in 2019 and the remainder in 2029. Federal and state tax laws related to a change in ownership, such as the acquisition of AIB and DCB, place limitations on the annual amount of operating loss carryovers that can be utilized to offset post-acquisition operating income. Under Internal Revenue Code Section 382, which has been adopted under California law, if during any three-year period there is more than a 50% change in ownership of the Bank, then the future use of any pre-change net operating losses or built-in losses of the Bank would be subject to an annual percentage limitation based on the value of the Bank at an ownership change date.
The passage of the Emergency Economic Stabilization Act of 2008 ("EESA") in October 2008 provided banks with tax relief by treating OTTI losses on Fannie Mae and Freddie Mac preferred stock as ordinary losses, instead of capital losses. As a result of this law change, an additional $5.7 million in tax benefit related to these OTTI charges were recognized during 2008.
The Company adopted the provisions of FIN 48 on January 1, 2007. As a result of implementing FIN 48, the Company increased its existing unrecognized tax benefits by $7.1 million, which included accrued interest, relating to a reduction in the state income tax receivable in connection with its dissolved regulated investment company, East West Securities Company, Inc. This receivable was related to the Franchise Tax Board's position on certain state tax deductions taken by East West Securities Company, Inc. for the 2000, 2001, and 2002 tax years. The $7.1 million increase in unrecognized tax benefits was recorded as a cumulative effect accounting adjustment to retained earnings of $4.6 million, net of the federal deferred tax impact of $2.5 million. During the second quarter of 2008, the Company determined that the remaining $4.6 million, net of tax benefit, would not "more likely than not" be sustained upon examination by tax authorities. As a result, this charge was recorded against the provision for income taxes during the second quarter of 2008.
The following table summarizes the activity related to our unrecognized tax benefits:
| |
Year Ended December 31, | ||||||||||
|---|---|---|---|---|---|---|---|---|---|---|---|
| |
2009 | 2008 | 2007 | ||||||||
| |
(Dollars in thousands) |
||||||||||
Balance, beginning of year |
$ | 1,103 | $ | 7,051 | $ | 6,754 | |||||
Reductions based on tax positions related to prior years |
- | (6,283 | ) | - | |||||||
Additions based on tax positions related to current year and prior years |
5,701 | 335 | 297 | ||||||||
Balance, end of year |
$ | 6,804 | $ | 1,103 | $ | 7,051 | |||||
During 2009, the addition of the $5.7 million of unrecognized tax benefit was from the tax credit related to the enterprise zone net interest deduction.
The Company is not currently under examination by the Internal Revenue Service or any other income or franchise tax authorities other than the FTB. However, the Company has received communication from the Internal Revenue Service that it plans to perform an audit of the Company's
155
tax returns for the 2007 and 2008 calendar year beginning the first quarter of 2010. For federal tax purposes tax years from 2006 and beyond remain open to examination and for California franchise tax purposes tax years from 2003 and beyond remain open to examination. The Company does not believe that there are any other tax jurisdictions in which the outcome of unresolved issues or claims is likely to be material to the Company's financial position, cash flows or results of operations. The Company further believes that adequate provisions have been made for all income tax uncertainties. The Company does not anticipate that the total amount of unrecognized tax benefits will significantly change for the year ending December 31, 2010.
The Company recognizes interest and penalties, if applicable, related to the underpayment of income taxes as a component of income tax expense in the consolidated statement of operations. The Company has accrued $1.15 million and $141 thousand of interest expense for its unrecognized tax position as December 31, 2009 and December 31, 2008, respectively.
21. COMMITMENTS AND CONTINGENCIES
Credit Extensions – In the normal course of business, there are various outstanding commitments to extend credit which are not reflected in the accompanying consolidated financial statements. While the Company does not anticipate losses as a result of these transactions, commitments to extend credit are included in determining the appropriate level of the allowance for unfunded commitments and credit exposures.
Loan commitments are agreements to lend to a customer provided there is no violation of any condition established in the agreement. Commitments generally have fixed expiration dates or other termination clauses. Because many of the commitments are expected to expire without being drawn upon, the total commitment amounts do not necessarily represent future funding requirements. As of December 31, 2009 and 2008, undisbursed non-covered loan commitments amounted to $1.01 billion and $1.47 billion, respectively. As of December 31, 2009 covered loan commitments amounted to $1.46 billion. In addition, the Bank has committed to fund mortgage and commercial loan applications in process amounting to $75.1 million and $65.9 million as of December 31, 2009 and 2008, respectively. Substantially all commitments are for loans to be held for investment.
Commercial letters of credit are issued to facilitate domestic and foreign trade transactions while standby letters of credit are issued to make payments on behalf of customers when certain specified future events occur. As of December 31, 2009 and 2008, non-covered commercial and standby letters of credit totaled $642.1 million and $696.4 million, respectively. The Bank issues standby letters of credit, or "SBLCs" and financial guarantees to support the obligations of its customers to beneficiaries. Based on historical trends, the probability that it will have to make payments under standby letters of credit is low. Additionally, in many cases, the Bank holds collateral in various forms against these standby letters of credit. As part of its risk management activities, the Bank continuously monitors the creditworthiness of the customer as well as its SBLC exposure; however, if the customer fails to perform the specified obligation to the beneficiary, the beneficiary may draw upon the standby letters of credit by presenting documents that are in compliance with the letter of credit terms. In that event, the Bank either repays the money borrowed or advanced, makes payment on account of the indebtedness of the customer or makes payment on account of the default by the customer in the performance of an obligation, to the beneficiary up to the full notional amount of the standby letters of credit. The customer is obligated to reimburse the Bank for any such payment. If the customer fails to pay, the Bank would, as applicable, liquidate collateral and/or set off accounts.
156
Credit card lines are unsecured commitments that are not legally binding. Management reviews credit card lines at least annually, and upon evaluation of the customers' creditworthiness, the Bank has the right to terminate or change certain terms of the credit card lines.
The Bank uses the same credit policies in making commitments and conditional obligations as in extending loan facilities to customers. It evaluates each customer's creditworthiness on a case-by-case basis. The amount of collateral obtained, if deemed necessary by the Bank upon extension of credit, is based on management's credit evaluation of the counterparty. Collateral held varies but may include accounts receivable, inventory, property, plant and equipment, and income-producing commercial properties.
As of December 31, 2009 and 2008, the allowance for unfunded loan commitments, off-balance sheet credit exposures, and recourse provision amounted to $8.1 million and $6.3 million, respectively. These amounts are included in accrued expenses and other liabilities in the accompanying consolidated balance sheets. The increase in the off-balance sheet allowance amount was due, in part, by a 67.6% increase in unfunded loan commitments at December 31, 2009 relative to December 31, 2008.
Guarantees – From time to time, the Company sells loans with recourse in the ordinary course of business. For loans that have been sold with recourse, the recourse component is considered a guarantee. When the Company sells or securitizes a loan with recourse, it commits to stand ready to perform if the loan defaults, and to make payments to remedy the default. As of December 31, 2009, total loans sold with recourse amounted to $472.5 million and were comprised of $52.9 million in single family loans with full recourse and $419.6 million in multifamily loans with limited recourse. In comparison, total loans sold with recourse amounted to $544.5 million at December 31, 2008, comprised of $62.4 million in single family loans with full recourse and $482.1 million in multifamily loans with limited recourse. The recourse provision on multifamily loans is limited to 2.5% of the top loss on the underlying loans. All of these transactions represent securitizations with Fannie Mae. The Company's recourse reserve related to loan securitizations totaled $2.6 million and $1.2 million as of December 31, 2009 and 2008, respectively, and is included in accrued expenses and other liabilities in the accompanying consolidated balance sheets. Despite the challenging conditions in the real estate market, the Company continues to experience minimal losses from single family and multifamily loan portfolios.
The Company also sells or securitizes loans without recourse that may have to be subsequently repurchased if a defect that occurred during the loan origination process results in a violation of a representation or warranty made in connection with the securitization or sale of the loan. When a loan sold or securitized to an investor without recourse fails to perform according to its contractual terms, the investor will typically review the loan file to determine whether defects in the origination process occurred and if such defects give rise to a violation of a representation or warranty made to the investor in connection with the sale or securitization. If such a defect is identified, the Company may be required to either repurchase the loan or indemnify the investor for losses sustained. If there are no such defects, the Company has no commitment to repurchase the loan. As of December 31, 2009 and 2008, the amount of loans sold without recourse totaled $697.7 million and $693.5 million, respectively. Total loans securitized without recourse amounted to $358.1 million and $1.04 billion, respectively, at December 31, 2009 and 2008. The loans sold or securitized without recourse represent the unpaid principal balance of the Company's loans serviced for others portfolio.
Lease Commitments – The Company conducts a portion of its operations utilizing leased premises and equipment under operating leases. Rental expense amounted to $15.0 million, $10.7 million and $10.8 million for the years ended December 31, 2009, 2008 and 2007, respectively.
157
Future minimum rental payments under noncancelable operating leases are estimated as follows:
| Estimate For The Year Ending December 31, | Amount | ||||
|---|---|---|---|---|---|
| |
(In thousands) |
||||
2010 |
$ | 11,591 | |||
2011 |
11,111 | ||||
2012 |
9,538 | ||||
2013 |
7,680 | ||||
2014 |
5,636 | ||||
Thereafter |
18,959 | ||||
Total |
$ | 64,515 | |||
Litigation – Neither the Company nor the Bank is involved in any material legal proceedings at December 31, 2009. The Bank, from time to time, is a party to litigation which arises in the ordinary course of business, such as claims to enforce liens, claims involving the origination and servicing of loans, and other issues related to the business of the Bank. After taking into consideration information furnished by counsel to the Company and the Bank, management believes that the resolution of such issues will not have a material adverse impact on the financial position, results of operations, or liquidity of the Company or the Bank.
22. STOCK COMPENSATION PLANS
The Company issues stock options and restricted stock to employees under share-based compensation plans. The adoption of ASC 505 and ASC 718 (previously SFAS No. 123(R)) on January 1, 2006 has resulted in incremental stock-based compensation expense. Since the Company has previously recognized compensation expense on restricted stock awards, the incremental stock-based compensation expense recognized pursuant to ASC 505 and ASC 718 relates only to issued and unvested stock option grants. For the years ended December 31, 2009, 2008, and 2007, incremental stock-based compensation expense reduced income before income taxes by $1.4 million, $2.1 million, and $1.5 million, and reduced net income by $841 thousand, $1.2 million, and $891 thousand, respectively. This additional expense reduced both basic and diluted earnings per share by $0.01, $0.02, and $0.01 for the years ended December 31, 2009, 2008, and 2007, respectively.
During the years ended December 31, 2009, 2008 and 2007, total compensation cost recognized in the consolidated statements of operations related to stock options and restricted stock awards amounted to $5.3 million, $6.2 million, and $6.8 million, respectively, with related tax provisions of $1.0 million for 2009 and related tax benefit of $2.6 million and $2.8 million for 2008 and 2007 respectively.
Stock Options – The Company issues fixed stock options to certain employees, officers, and directors. Stock options are issued at the current market price on the date of grant with a three-year or four-year vesting period and contractual terms of 7 or 10 years. The Company issues new shares upon the exercise of stock options.
158
A summary of activity for the Company's stock options as of and for the year ended December 31, 2009 is presented below:
| |
Shares | Weighted Average Exercise Price |
Weighted Average Remaining Contractual Term |
Aggregate Intrinsic Value (In thousands) |
||||||||
|---|---|---|---|---|---|---|---|---|---|---|---|---|
Outstanding at beginning of year |
2,588,968 | $ | 20.67 | |||||||||
Granted |
43,942 | 6.83 | ||||||||||
Exercised |
(23,330 | ) | 10.75 | |||||||||
Forfeited |
(682,065 | ) | 17.53 | |||||||||
Outstanding at end of year |
1,927,515 | $ | 21.59 | 3.39 years | $ | 2,899 | ||||||
Vested or expected to vest at year-end |
1,864,785 | $ | 21.58 | 3.34 years | $ | 2,815 | ||||||
Exercisable at year-end |
1,026,148 | $ | 21.46 | 1.99 years | $ | 2,059 | ||||||
The fair value of each option grant is estimated on the date of grant using the Black-Scholes option-pricing model with the following assumptions:
| |
Year Ended December 31, | |||||||||
|---|---|---|---|---|---|---|---|---|---|---|
| |
2009 | 2008 | 2007 | |||||||
Expected term (1) |
4 years | 4 years | 4 years | |||||||
Expected volatility (2) |
60.5 | % | 28.1 | % | 24.1 | % | ||||
Expected dividend yield (3) |
0.6 | % | 1.2 | % | 1.1 | % | ||||
Risk-free interest rate (4) |
1.8 | % | 2.6 | % | 4.5 | % | ||||
- (1)
- The expected term (estimated period of time outstanding) of stock options granted was estimated using the historical exercise behavior of employees.
- (2)
- The expected volatility was based on historical volatility for a period equal to the stock option's expected term.
- (3)
- The expected dividend yield is based on the Company's prevailing dividend rate at the time of grant.
- (4)
- The risk-free rate is based on the U.S. Treasury strips in effect at the time of grant equal to the stock option's expected term.
159
The following table summarizes information about stock options outstanding as of December 31, 2009:
| |
Options Outstanding | Options Exercisable | ||||||||||||||
|---|---|---|---|---|---|---|---|---|---|---|---|---|---|---|---|---|
| Range of Exercise Prices | Number of Outstanding Options |
Weighted Average Exercise Price |
Weighted Average Remaining Contractual Life |
Number of Exercisable Options |
Weighted Average Exercise Price |
|||||||||||
$0.00 to $4.99 |
23,529 | $ | 4.25 | 6.25 years | - | $ | - | |||||||||
$5.00 to $9.99 |
78,426 | 7.06 | 1.41 years | 65,362 | 7.25 | |||||||||||
$10.00 to $14.99 |
683,323 | 12.96 | 2.89 years | 475,598 | 12.65 | |||||||||||
$15.00 to $19.99 |
166,988 | 17.48 | 3.18 years | 83,977 | 16.90 | |||||||||||
$20.00 to $24.99 |
399,716 | 21.09 | 5.14 years | - | - | |||||||||||
$25.00 to $29.99 |
77,616 | 26.48 | 1.28 years | 75,636 | 26.39 | |||||||||||
$30.00 to $34.99 |
43,048 | 34.17 | 2.64 years | 43,048 | 34.17 | |||||||||||
$35.00 to $39.99 |
445,120 | 37.81 | 3.32 years | 275,666 | 37.60 | |||||||||||
$40.00 to $44.99 |
9,749 | 40.63 | 3.46 years | 6,861 | 40.74 | |||||||||||
$0.00 to $44.99 |
1,927,515 | 21.59 | 3.39 years | 1,026,148 | 21.46 | |||||||||||
During the years ended December 31, 2009, 2008 and 2007, information related to stock options are presented as follows:
| |
Year Ended December 31, | |||||||||
|---|---|---|---|---|---|---|---|---|---|---|
| |
2009 | 2008 | 2007 | |||||||
Weighted average grant date fair value of stock options granted during the year |
$ | 3.00 | $ | 4.28 | $ | 9.17 | ||||
Total intrinsic value of options exercised (in thousands) |
$ | 53 | $ | 517 | $ | 17,966 | ||||
Total fair value of options vested (in thousands) |
$ | 1,638 | $ | 1,486 | $ | 833 | ||||
As of December 31, 2009, total unrecognized compensation cost related to stock options amounted to $2.2 million. This cost is expected to be recognized over a weighted average period of 2.8 years.
The Company received $251 thousand and $1.1 million as of December 31, 2009 and 2008, respectively, in cash proceeds from stock option exercises.
Restricted Stock – In addition to stock options, the Company also grants restricted stock awards to directors, certain officers and employees. The restricted shares awarded become fully vested after three to five years of continued employment from the date of grant. The Company becomes entitled to an income tax deduction in an amount equal to the taxable income reported by the holders of the restricted shares when the restrictions are released and the shares are issued. Restricted shares are forfeited if officers and employees terminate prior to the lapsing of restrictions. The Company records forfeitures of restricted stock as treasury share repurchases.
160
A summary of the activity for the Company's restricted stock as of December 31, 2009, including changes during the year then ended, is presented below:
| |
2009 | ||||||
|---|---|---|---|---|---|---|---|
| |
Shares | Weighted Average Price |
|||||
Outstanding at beginning of year |
753,165 | $ | 29.35 | ||||
Granted |
331,196 | 7.41 | |||||
Vested |
(97,591 | ) | 36.16 | ||||
Forfeited |
(122,053 | ) | 29.78 | ||||
Outstanding at end of year |
864,717 | 20.12 | |||||
Of the total shares of restricted stock granted in 2009, 32,752 shares were granted to outside directors.
The weighted average fair values of restricted stock awards granted during the years ended December 31, 2009, 2008, and 2007 were $7.41, $19.58, and $32.98, respectively.
As of December 31, 2009, total unrecognized compensation cost related to restricted stock awards amounted to $8.2 million. This cost is expected to be recognized over a weighted average period of 2.4 years.
Stock Purchase Plan – The Company adopted the 1998 Employee Stock Purchase Plan (the "Purchase Plan") providing eligible employees of the Company and its subsidiaries participation in the ownership of the Company through the right to purchase shares of its common stock at a discount. Under the terms of the Purchase Plan, prior to April 2005, employees could purchase shares of the Company's common stock at the lesser of 85% of the per-share market price at the date of grant or exercise, subject to an annual limitation of common stock valued at $25,000. In April 2005, the terms of the Purchase Plan were amended to allow the employees to purchase shares at 90% of the per-share market price at the date of exercise, maintaining the annual common stock value limitation of $25,000. As of December 31, 2009, the Purchase Plan qualifies as a non-compensatory plan under Section 423 of the Internal Revenue Code and, accordingly, no compensation expense is recognized under the plan.
The Purchase Plan covers a total of 2,000,000 shares of the Company's common stock. During, 2009 and 2008, 133,730 shares totaling $697 thousand and 119,979 shares totaling $1.7 million, respectively, were sold to employees under the Purchase Plan.
23. EMPLOYEE BENEFIT PLANS
The Company sponsors a defined contribution plan for the benefit of its employees. The Company's contributions to the plan are determined annually by the Board of Directors in accordance with plan requirements. For tax purposes, eligible participants may contribute up to a maximum of 15% of their compensation, not to exceed the dollar limit imposed by the Internal Revenue Service. There were no Company contributions to the plan for the plan year ended December 31, 2009. For the plan years ended December 31, 2008 and 2007, the Company contributed $3.0 million and $2.9 million, respectively.
161
During 2002, the Company adopted a Supplemental Executive Retirement Plan ("SERP"). The SERP meets the definition of a pension plan per ASC 715-30 (previously SFAS No. 87, Employers' Accounting for Pensions), pursuant to which the Company will pay supplemental pension benefits to certain executive officers designated by the Board of Directors upon retirement based upon the officers' years of service and compensation. For the years ended December 31, 2009, 2008, and 2007, $2.3 million, $2.5 million and $2.3 million, respectively, of benefits were accrued and expensed. The SERP is funded through life insurance contracts on the participating officers, though the plan does not require formal funding. At December 31, 2009, the life insurance contracts related to the SERP had an aggregate cash surrender value of $98.6 million. As of December 31, 2009 and 2008, the vested benefit obligation under the SERP was $11.3 million and $11.7 million, respectively.
24. STOCKHOLDERS' EQUITY AND EARNINGS PER SHARE
Authorized Shares – On May 25, 2005, the Company's shareholders approved an amendment to the Company's Certificate of Incorporation to increase the number of authorized shares of common stock from 100,000,000 to 200,000,000. The additional authorized shares provide the Company greater flexibility for stock splits and stock dividends, issuances under employee benefit plans, financings, corporate mergers and acquisitions, and other general corporate purposes. As of December 31, 2009, the Company also had 5,000,000 authorized shares of preferred stock.
Series A Preferred Stock Offering – In April 2008, the Company issued 200,000 shares of 8% Non-Cumulative Perpetual Convertible Preferred Stock, Series A ("Series A preferred shares"), with a liquidation preference of $1,000 per share. The Company received $194.1 million of additional Tier 1 qualifying capital, after deducting underwriting discounts, commissions and offering expenses. The holders of the Series A preferred shares will have the right at any time to convert each share of Series A preferred shares into 64.9942 shares of the Company's common stock, plus cash in lieu of fractional shares. This represents an initial conversion price of approximately $15.39 per share of common stock or a 22.5% conversion premium based on the closing price of the Company's common stock on April 23, 2008 of $12.56 per share. On or after May 1, 2013, the Company will have the right, under certain circumstances, to cause the Series A preferred shares to be converted into shares of the Company's common stock. Dividends on the Series A preferred shares, if declared, will accrue and be payable quarterly in arrears at a rate per annum equal to 8% on the liquidation preference of $1,000 per share, on February 15, May 15, August 15 and November 15 of each year. The proceeds from this offering were used to augment the Company's liquidity and capital positions and reduce its borrowings. During July, 2009, the Company exchanged 9,968,760 shares of the Company's common stock for 110,764 shares of the Company's 8.00% Non-Cumulative Perpetual Convertible Preferred Stock, Series A.
Series B Preferred Stock Offering – On December 5, 2008, the Company issued 306,546 shares of Fixed Rate Cumulative Perpetual Preferred Stock, Series B ("Series B preferred shares"), with a liquidation preference of $1,000 per share. The Company received $306.5 million of additional Tier 1 qualifying capital from the U.S. Treasury by participating in the U.S. Treasury's Capital Purchase Program ("TCPP"). The Series B preferred shares will pay cumulative dividends at a rate of 5% per annum until the fifth anniversary of the investment date and thereafter at a rate of 9% per annum. The Series B preferred shares is transferable by the U.S. Treasury at any time. Subject to the approval of the FRB, the Series B preferred shares are redeemable at the option of the Company at 100% of liquidation preference (plus any accrued and unpaid dividends), provided, however, that the Series B preferred shares may be redeemed prior to the first dividend payment date falling after the third anniversary of the Closing Date (February 15, 2012) only if (i) the Company has raised aggregate gross proceeds in one or more Qualified Equity Offerings (as defined in the Stock Purchase Agreement) in excess of $76,636,500, and (ii) the aggregate redemption price does not exceed the aggregate net
162
proceeds from such Qualified Equity Offerings. In connection with the Series B preferred shares offering, the Company issued warrants with an initial price of $15.15 per share of common stock for which the warrant may be exercised. The warrant may be exercised at any time on or before December 5, 2018. The U.S. Treasury may not transfer a portion of the warrant with respect to more than one-half of the original number of shares of common stock until the earlier of the successful completion of an offering of replacement Tier 1 capital of at least $306.5 million and December 31, 2009. The warrants, and all rights under the warrants, are otherwise transferable.
Under the terms of the TCPP, as long as any preferred stock issued under the TCPP remains outstanding, the Company is prohibited from increasing dividends on common stock, and from making certain repurchases of equity securities, including common stock, without the U.S. Treasury's consent until the third anniversary of the U.S. Treasury's investment or until the U.S. Treasury has transferred all of the preferred stock it purchased under the TCPP to third parties. Furthermore, as long as the preferred stock issued to the U.S. Treasury is outstanding or the Series A preferred shares is outstanding, dividend payments and repurchases or redemptions relating to certain equity securities, including common stock, are prohibited until all accrued and unpaid dividends are paid on such preferred stock, subject to certain limited exceptions.
Pursuant to the terms of the Stock Purchase Agreement with the U.S. Treasury ("Stock Purchase Agreement"), the Company adopted certain standards for executive compensation and corporate governance for the period during which the U.S. Treasury holds the equity issued pursuant to the Stock Purchase Agreement, including the common stock which may be issued pursuant to the TARP Warrant. These standards generally apply to our Chief Executive Officer, Chief Financial Officer and the three next most highly compensated senior executive officers. The standards include (1) ensuring that incentive compensation for senior executives does not encourage unnecessary and excessive risks that threaten the value of the financial institution; (2) required clawback of any bonus or incentive compensation paid to a senior executive based on statements of operations, gains or other criteria that are later proven to be materially inaccurate; (3) prohibition on making golden parachute payments to senior executives; and (4) agreement not to deduct for tax purposes executive compensation in excess of $500,000 for each senior executive. In particular, the change to the deductibility limit on executive compensation will likely increase the overall cost of our compensation programs in future periods. Since the TARP Warrant has a ten year term, the Company could potentially be subject to the executive compensation and corporate governance restrictions for a ten year time period.
On February 17, 2009, the American Recovery and Reinvestment Act of 2009 ("ARRA") was signed into law by President Obama. The ARRA includes a wide variety of programs intended to stimulate the economy and provide for extensive infrastructure, energy, health, and education needs. In addition, the ARRA imposes certain new executive compensation and corporate expenditure limits on all current and future TARP recipients, including the Company, until the institution has repaid the U.S. Treasury, which is now permitted under the ARRA without penalty and without the need to raise new capital, subject to the U.S. Treasury's consultation with the recipient's appropriate regulatory agency.
The executive compensation standards are more stringent than those currently in effect under the TARP CPP or those previously proposed by the U.S. Treasury. The new standards include (but are not limited to) (i) prohibitions on bonuses, retention awards and other incentive compensation, other than restricted stock grants which do not fully vest during the TARP period up to one-third of an employee's total annual compensation, (ii) prohibitions on golden parachute payments for departure from a company, (iii) an expanded clawback of bonuses, retention awards, and incentive compensation if payment is based on materially inaccurate statements of earnings, revenues, gains or other criteria, (iv) prohibitions on compensation plans that encourage manipulation of reported earnings,
163
(v) retroactive review of bonuses, retention awards and other compensation previously provided by TARP recipients if found by the U.S. Treasury to be inconsistent with the purposes of TARP or otherwise contrary to public interest, (vi) required establishment of a company-wide policy regarding "excessive or luxury expenditures," and (vii) inclusion in a participant's proxy statements for annual shareholder meetings of a nonbinding "Say on Pay" shareholder vote on the compensation of executives.
Warrants – During 2008, in conjunction with the Series B preferred stock offering, the Company issued warrants with an initial price of $15.15 per share of common stock for which the warrant may be exercised, with an allocated fair value of $25.2 million. The warrant may be exercised at any time on or before December 5, 2018. The U.S. Treasury may not transfer a portion of the warrants with respect to more than one-half of the original number of shares of common stock until the earlier of the successful completion of an offering of replacement Tier 1 capital of at least $306.5 million and December 31, 2009. The warrants, and all rights under the warrants, are otherwise transferable. During the fourth quarter of 2009, the Company received a 50% reduction in the warrant we issued to the U.S. treasury in conjunction with the TARP capital we received in December, 2008. As of December 31, 2009, the new share count of the warrant is 1,517,555. This adjustment to the warrant was due to the fact that within one year of issuance, the Company raised new capital in excess of the TARP capital issued in December, 2008.
Private Sales of Common Stock – On July 14, 2009, in private placement transactions, two customers of the Bank purchased 5,000,000 newly issued shares of the Company's common stock at a price of $5.50 per share. The Company received net proceeds of approximately $26.0 million, net of stock issuance costs, in conjunction with this common stock offering. The Company has registered these shares for resale to the public.
Public Offering of Common Stock – On July 24, 2009, the Company completed a public offering of 11 million shares of its common stock priced at $6.35. The underwriter also exercised its option to purchase an additional 1.65 million shares of the Company's common stock. The Company received net proceeds of approximately $76.7 million, net of stock issuance costs, in conjunction with this common stock offering.
Private Placement – On November 6, 2009, the Company raised $500.0 million in a private placement of 18,247,012 shares of common stock, $0.001 par value, and 335,047 shares of newly authorized Mandatory Convertible Cumulative Non-Voting Perpetual Preferred Stock, Series C, ("Series C preferred shares") to certain qualified institutional buyers and accredited investors (collectively, the "Investors") with a liquidation preference of $1,000 per share. The common stock sold represented 19.9% of the Company's common stock outstanding. In connection with the Series C preferred shares offering, the shares are mandatorily convertible upon shareholder approval and subject to any applicable regulatory approvals. For as long as any Series C preferred shares are outstanding, the cumulative dividends are payable semi-annually in arrears on May 1 and November 1 of each year in cash and in kind in additional shares of Series C preferred shares if, when and as declared by the Board of Directors or a committee thereof. The Series C preferred shares will pay an annual rate as high as 13% plus dividends payable at an annual rate equal to 5%. The Series C preferred shares rank in parity with respect to dividend rights and rights on liquidation, winding up an dissolution with the Company's outstanding series of preferred stock and senior to the Company's common stock. The Series C preferred shares have no voting rights, except as required by law and with respect to certain limited matters, non-redeemable by the holders, but redeemable by the Company following the fifth anniversary of issuance, no preemptive rights, a 9.9% ownership limitation and has the customary anti-dilution adjustment provisions. No Series C preferred shares dividend has been declared by the Board of Directors. Under the terms of the Series C preferred shares, the May 1 dividend payment or
164
any portion thereof will not be earned or paid should an affirmative shareholder vote to convert be obtained on the March 18, 2010 meeting date. Since management fully expects that the Series C preferred dividend will not be earned or paid, income available to common shareholders has not been adjusted for purposes of computing basic and diluted per share amounts.
Because the Company's common stock is listed on the NASDAQ Global Select Market, the Company is subject to the NASDAQ Rules. NASDAQ Rule 5635(d) requires stockholder approval prior to the issuance of securities in connection with a transaction, other than a public offering, involving the sale, issuance or potential issuance by a company of common stock, or securities convertible into or exercisable for common stock, equal to 20% or more of the common stock or 20% or more of the voting power outstanding before the issuance for less than the greater of book value or market value of the stock. The 37,062,721 shares of common stock issuable upon conversion of the Series C preferred shares together with the common stock issued at the closing of the private placement will exceed 19.99% of the number of shares of our common stock and voting power outstanding prior to the private placement. The $9.04 per share conversion price for the Series C preferred shares is less than the book value per share of our common stock. Accordingly, the issuance of the common stock upon conversion of the Series C preferred shares is subject to stockholder approval.
Stock Repurchase Program – During 2007, the Company's Board of Directors authorized a new stock repurchase program to buy back up to $80.0 million of the Company's common stock. During 2007, the Company repurchased a total of 1,392,176 shares of common stock at a weighted average cost of $38.69 per share in connection with this repurchase program. The Company did not repurchase any shares during the years ended December 31, 2009 and 2008.
Quarterly Dividends – The Company's Board of Directors declared and paid quarterly preferred stock cash dividends of $20.00 per share on its Series A preferred stock payable on or about November 1, 2009 to shareholders of record on October 15, 2009. The Board has also authorized the payment of fourth quarter dividends of $12.50 per share on the Company's Series B Preferred Stock to be paid on November 15, 2009. Cash dividends totaling $26.9 million were paid to the Company's Series A and Series B preferred stock shareholders during year ended December 31, 2009.
The Company also paid quarterly dividends on its common stock of $0.02 per share for the first quarter of 2009 and $0.01 per share for the remainder of 2009. The Company paid quarterly dividends on its common stock of $0.10 per share during 2008. Total quarterly dividends amounting to $3.6 million and $25.4 million were paid to the Company's common shareholders during the years ended December 31, 2009 and 2008, respectively.
165
Earnings (Loss) Per Share ("EPS") – The calculation of basic and diluted (loss) earnings per share for the years ended December 31, 2009, 2008 and 2007 is presented below:
| |
Net (Loss) Income Available to Common Stockholders |
Number of Shares |
Per Share Amounts |
||||||||
|---|---|---|---|---|---|---|---|---|---|---|---|
| |
(In thousands, except per share data) |
||||||||||
2009 |
|||||||||||
Net income before extraordinary item, as reported |
$ | 82,008 | 78,770 | ||||||||
Less: |
|||||||||||
Preferred stock dividends and amortization of preferred stock discount |
(49,115 | ) | - | ||||||||
Basic earnings per share before extraordinary item |
32,893 | 78,770 | $ | 0.42 | |||||||
Extraordinary item |
(5,366 | ) | 78,770 | (0.07 | ) | ||||||
Basic earnings per share after extraordinary item |
27,527 | 78,770 | $ | 0.35 | |||||||
Effect of dilutive securities: |
|||||||||||
Stock options |
15 | ||||||||||
Restricted stock |
51 | ||||||||||
Noncumulative preferred stock |
5,687 | ||||||||||
Stock warrants |
- | ||||||||||
Diluted earnings per share before extraordinary item |
$ | 32,893 | 84,523 | $ | 0.39 | ||||||
Income impact of assumed conversions |
2 | ||||||||||
Extraordinary item |
(5,366 | ) | |||||||||
Diluted earnings per share after extraordinary item |
$ | 27,529 | 84,523 | $ | 0.33 | ||||||
2008 |
|||||||||||
Net loss as reported |
$ | (49,683 | ) | 62,673 | |||||||
Less: |
|||||||||||
Preferred stock dividends and amortization of preferred stock discount |
(9,474 | ) | - | ||||||||
Basic loss per share |
$ | (59,157 | ) | 62,673 | $ | (0.94 | ) | ||||
Effect of dilutive securities: |
|||||||||||
Stock options |
- | - | |||||||||
Restricted stock |
- | - | |||||||||
Noncumulative preferred stock |
- | - | |||||||||
Stock warrants |
- | - | |||||||||
Diluted earnings per share |
$ | (59,157 | ) | 62,673 | $ | (0.94 | ) | ||||
2007 |
|||||||||||
Basic earnings per share |
$ | 161,167 | 61,180 | $ | 2.63 | ||||||
Effect of dilutive securities: |
|||||||||||
Stock options |
- | 669 | |||||||||
Restricted stock |
- | 215 | |||||||||
Stock warrants |
- | 29 | |||||||||
Diluted earnings per share |
$ | 161,167 | 62,093 | $ | 2.60 | ||||||
166