Attached files
| file | filename |
|---|---|
| 8-K - CURRENT REPORT OF MATERIAL EVENTS OR CORPORATE CHANGES - CORNELL COMPANIES INC | a10-4356_38k.htm |
Exhibit 99.1
|
|
Cornell Companies, Inc. Investor Discussion 4th Quarter – 2009 |

|
|
Forward-looking Statements and Non-GAAP Measures Statements made during this presentation regarding the company, its expected future earnings, operations, strategic direction, and any other statements that are not historical facts are forward-looking statements within the meaning of applicable securities laws. These statements involve certain risks, uncertainties and assumptions including changes in demand for our services, actions by governmental agencies and other third parties and other factors detailed in our most recent Form 10-K and other filings with the Securities and Exchange Commission, which are available free of charge on the SEC's website at http://www.sec.gov. Should one or more of these risks or uncertainties materialize, or should underlying assumptions prove incorrect, actual results may vary materially from those indicated. Each forward looking-statement speaks only as of the date of the particular statement, and we undertake no obligation to update or revise any forward looking-statement, whether as a result of new information, future events or otherwise. A reconciliation of all non-GAAP financial measures used in this presentation, including EBITDA, is attached to this presentation. |
|
|
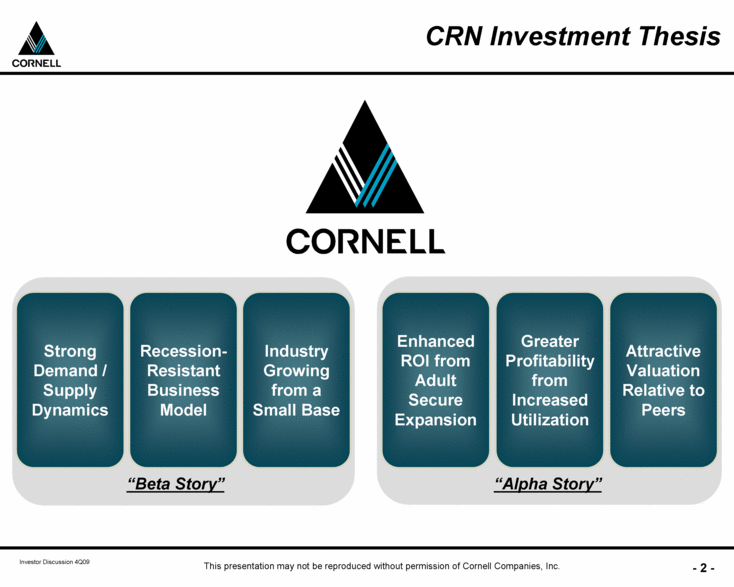
CRN Investment Thesis Strong Demand / Supply Dynamics Recession-Resistant Business Model “Beta Story” “Alpha Story” Industry Growing from a Small Base Enhanced ROI from Adult Secure Expansion Greater Profitability from Increased Utilization Attractive Valuation Relative to Peers |
|
|
Cornell Overview Industry Highlights Cornell Growth Strategy Financial Review Appendix |
|
|
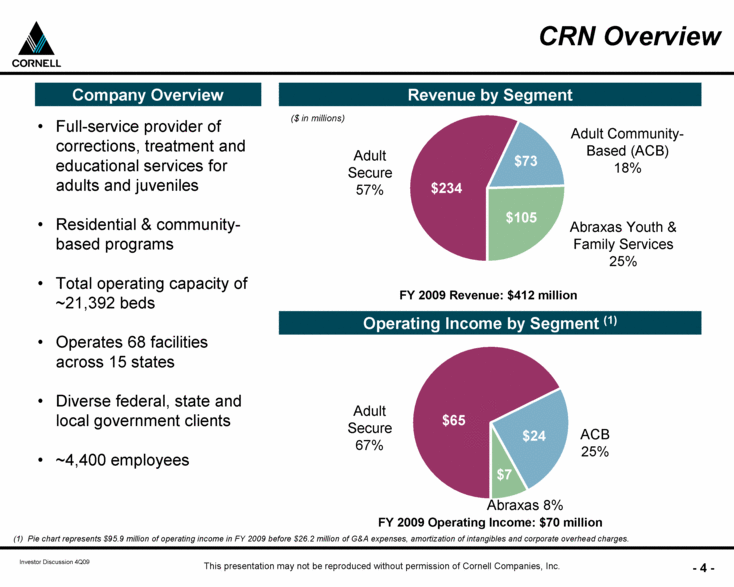
CRN Overview Full-service provider of corrections, treatment and educational services for adults and juveniles Residential & community- based programs Total operating capacity of ~21,392 beds Operates 68 facilities across 15 states Diverse federal, state and local government clients ~4,400 employees Revenue by Segment Company Overview ($ in millions) $234 $73 FY 2009 Operating Income: $70 million Operating Income by Segment (1) $24 $7 Adult Secure 57% (1) Pie chart represents $95.9 million of operating income in FY 2009 before $26.2 million of G&A expenses, amortization of intangibles and corporate overhead charges. Abraxas Youth & Family Services 25% Adult Community-Based (ACB) 18% FY 2009 Revenue: $412 million ACB 25% $105 Adult Secure 67% $65 Abraxas 8% |
|
|
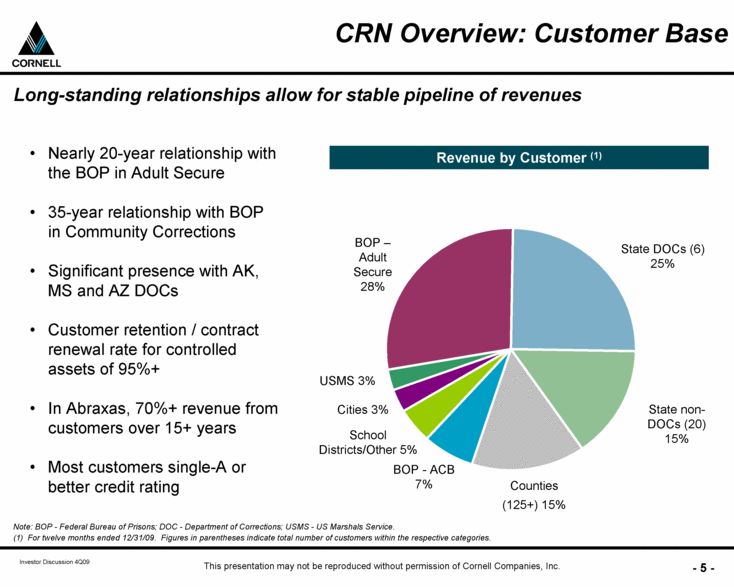
CRN Overview: Customer Base Nearly 20-year relationship with the BOP in Adult Secure 35-year relationship with BOP in Community Corrections Significant presence with AK, MS and AZ DOCs Customer retention / contract renewal rate for controlled assets of 95%+ In Abraxas, 70%+ revenue from customers over 15+ years Most customers single-A or better credit rating Revenue by Customer (1) Long-standing relationships allow for stable pipeline of revenues Note: BOP - Federal Bureau of Prisons; DOC - Department of Corrections; USMS - US Marshals Service. (1) For twelve months ended 12/31/09. Figures in parentheses indicate total number of customers within the respective categories. State non-DOCs (20) 15% BOP – Adult Secure 28% State DOCs (6) 25% Cities 3% Counties (125+) 15% School Districts/Other 5% BOP - ACB 7% USMS 3% |
|
|
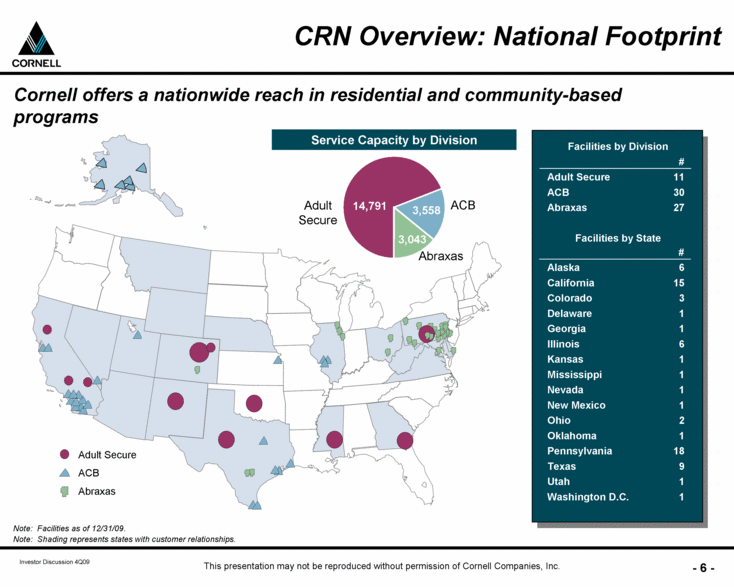
CRN Overview: National Footprint Cornell offers a nationwide reach in residential and community-based programs Note: Facilities as of 12/31/09. Note: Shading represents states with customer relationships. Service Capacity by Division Adult Secure Abraxas ACB 3,558 14,791 3,043 Adult Secure Abraxas ACB Facilities by Division # Adult Secure 11 ACB 30 Abraxas 27 Facilities by State # Alaska 6 California 15 Colorado 3 Delaware 1 Georgia 1 Illinois 6 Kansas 1 Mississippi 1 Nevada 1 New Mexico 1 Ohio 2 Oklahoma 1 Pennsylvania 18 Texas 9 Utah 1 Washington D.C. 1 |
|
|
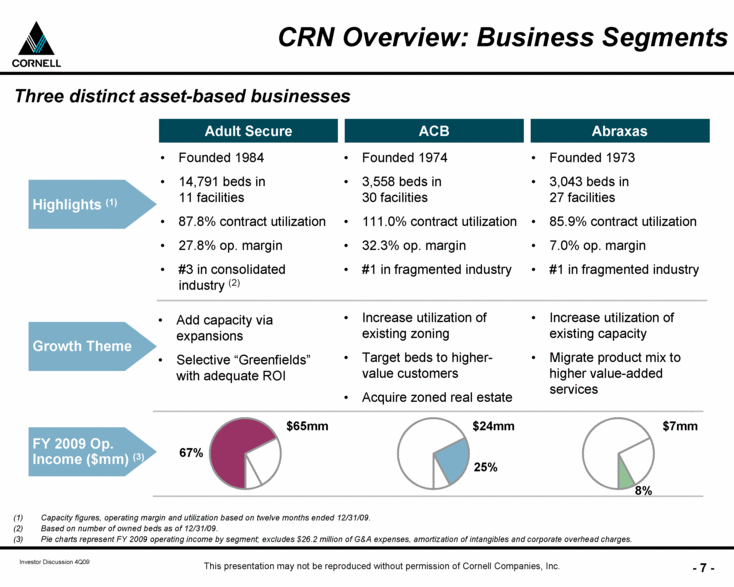
Adult Secure ACB Abraxas Highlights (1) Growth Theme Founded 1984 14,791 beds in 11 facilities 87.8% contract utilization 27.8% op. margin #3 in consolidated industry (2) Founded 1973 3,043 beds in 27 facilities 85.9% contract utilization 7.0% op. margin #1 in fragmented industry Add capacity via expansions Selective “Greenfields” with adequate ROI Increase utilization of existing capacity Migrate product mix to higher value-added services Increase utilization of existing zoning Target beds to higher-value customers Acquire zoned real estate CRN Overview: Business Segments Three distinct asset-based businesses FY 2009 Op. Income ($mm) (3) Founded 1974 3,558 beds in 30 facilities 111.0% contract utilization 32.3% op. margin #1 in fragmented industry 67% 25% $65mm $24mm 8% $7mm Capacity figures, operating margin and utilization based on twelve months ended 12/31/09. Based on number of owned beds as of 12/31/09. Pie charts represent FY 2009 operating income by segment; excludes $26.2 million of G&A expenses, amortization of intangibles and corporate overhead charges. |
|
|
Cornell Overview Industry Highlights Cornell Growth Strategy Financial Review Appendix |
|
|
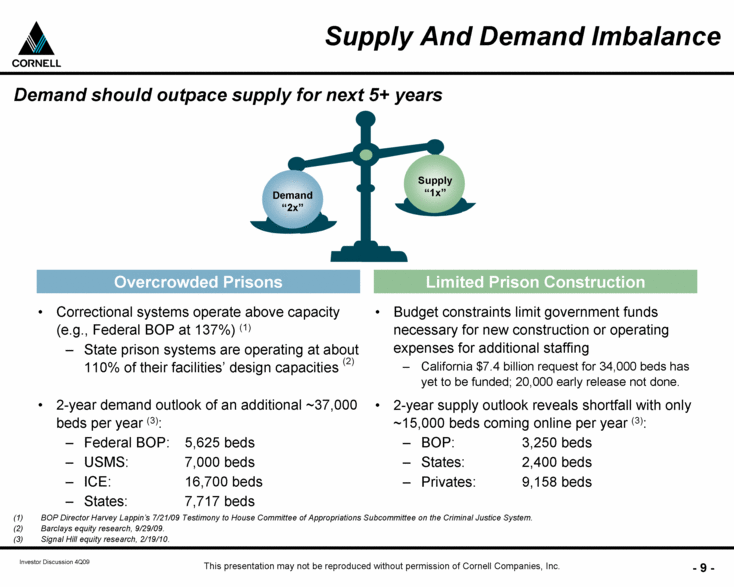
Supply And Demand Imbalance Demand “2x” Supply “1x” Overcrowded Prisons Correctional systems operate above capacity (e.g., Federal BOP at 137%) (1) State prison systems are operating at about 110% of their facilities’ design capacities (2) 2-year demand outlook of an additional ~37,000 beds per year (3): Federal BOP: 5,625 beds USMS: 7,000 beds ICE: 16,700 beds States: 7,717 beds Limited Prison Construction Budget constraints limit government funds necessary for new construction or operating expenses for additional staffing California $7.4 billion request for 34,000 beds has yet to be funded; 20,000 early release not done. 2-year supply outlook reveals shortfall with only ~15,000 beds coming online per year (3): BOP: 3,250 beds States: 2,400 beds Privates: 9,158 beds Demand should outpace supply for next 5+ years BOP Director Harvey Lappin’s 7/21/09 Testimony to House Committee of Appropriations Subcommittee on the Criminal Justice System. Barclays equity research, 9/29/09. Signal Hill equity research, 2/19/10. |
|
|
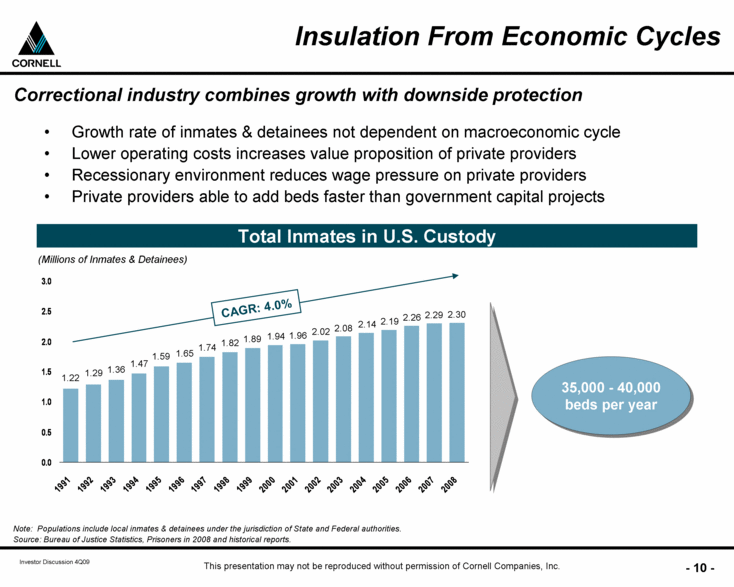
Insulation From Economic Cycles Growth rate of inmates & detainees not dependent on macroeconomic cycle Lower operating costs increases value proposition of private providers Recessionary environment reduces wage pressure on private providers Private providers able to add beds faster than government capital projects Total Inmates in U.S. Custody (Millions of Inmates & Detainees) CAGR: 4.0% Correctional industry combines growth with downside protection 35,000 - 40,000 beds per year Note: Populations include local inmates & detainees under the jurisdiction of State and Federal authorities. Source: Bureau of Justice Statistics, Prisoners in 2008 and historical reports. 1.22 1.29 1.36 1.47 1.59 1.65 1.74 1.82 1.89 1.94 1.96 2.02 2.08 2.14 2.19 2.26 2.29 2.30 0.0 0.5 1.0 1.5 2.0 2.5 3.0 1991 1992 1993 1994 1995 1996 1997 1998 1999 2000 2001 2002 2003 2004 2005 2006 2007 2008 |
|
|
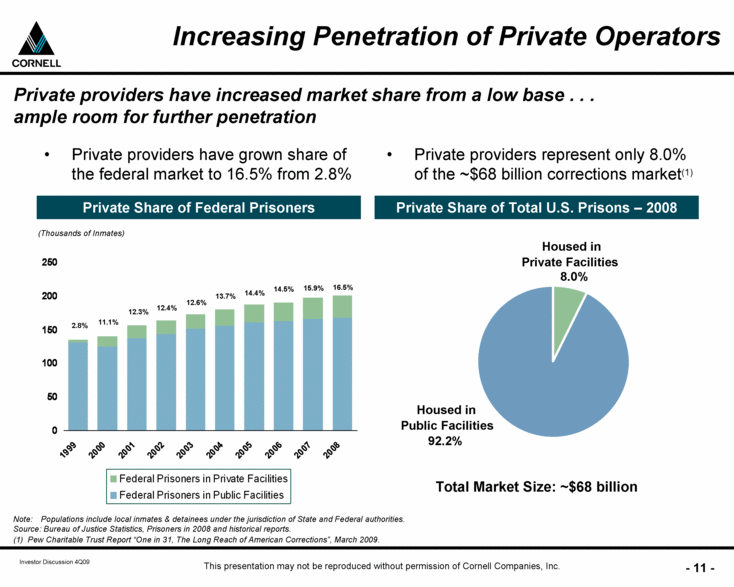
Increasing Penetration of Private Operators Private providers have grown share of the federal market to 16.5% from 2.8% Private Share of Federal Prisoners (Thousands of Inmates) Private Share of Total U.S. Prisons – 2008 Total Market Size: ~$68 billion 12.4% 12.6% 13.7% 14.4% 15.9% 12.3% 11.1% 2.8% Private providers have increased market share from a low base . . . ample room for further penetration Housed in Private Facilities 8.0% Housed in Public Facilities 92.2% Private providers represent only 8.0% of the ~$68 billion corrections market(1) Note: Populations include local inmates & detainees under the jurisdiction of State and Federal authorities. Source: Bureau of Justice Statistics, Prisoners in 2008 and historical reports. (1) Pew Charitable Trust Report “One in 31, The Long Reach of American Corrections”, March 2009. 14.5% 16.5% 0 50 100 150 200 250 1999 2000 2001 2002 2003 2004 2005 2006 2007 2008 Federal Prisoners in Private Facilities Federal Prisoners in Public Facilities |
|
|
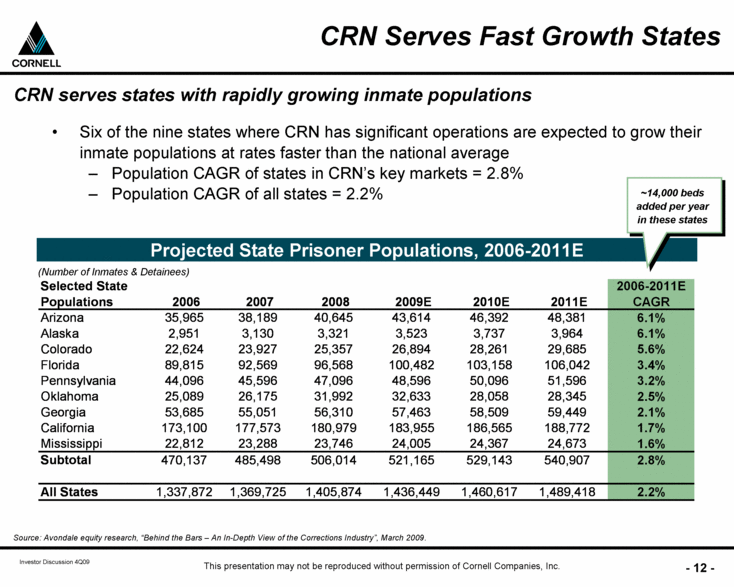
CRN Serves Fast Growth States Source: Avondale equity research, “Behind the Bars – An In-Depth View of the Corrections Industry”, March 2009. Projected State Prisoner Populations, 2006-2011E (Number of Inmates & Detainees) Six of the nine states where CRN has significant operations are expected to grow their inmate populations at rates faster than the national average Population CAGR of states in CRN’s key markets = 2.8% Population CAGR of all states = 2.2% CRN serves states with rapidly growing inmate populations ~14,000 beds added per year in these states Arizona 35,965 38,189 40,645 43,614 46,392 48,381 6.1% Alaska 2,951 3,130 3,321 3,523 3,737 3,964 6.1% Colorado 22,624 23,927 25,357 26,894 28,261 29,685 5.6% Florida 89,815 92,569 96,568 100,482 103,158 106,042 3.4% Pennsylvania 44,096 45,596 47,096 48,596 50,096 51,596 3.2% Oklahoma 25,089 26,175 31,992 32,633 28,058 28,345 2.5% Georgia 53,685 55,051 56,310 57,463 58,509 59,449 2.1% California 173,100 177,573 180,979 183,955 186,565 188,772 1.7% Mississippi 22,812 23,288 23,746 24,005 24,367 24,673 1.6% Subtotal 470,137 485,498 506,014 521,165 529,143 540,907 2.8% All States 1,337,872 1,369,725 1,405,874 1,436,449 1,460,617 1,489,418 2.2% 2008 2007 2006 Selected State Populations 2006-2011E CAGR 2011E 2010E 2009E |
|
|
Cornell Overview Industry Highlights Cornell Growth Strategy Financial Review Appendix |
|
|
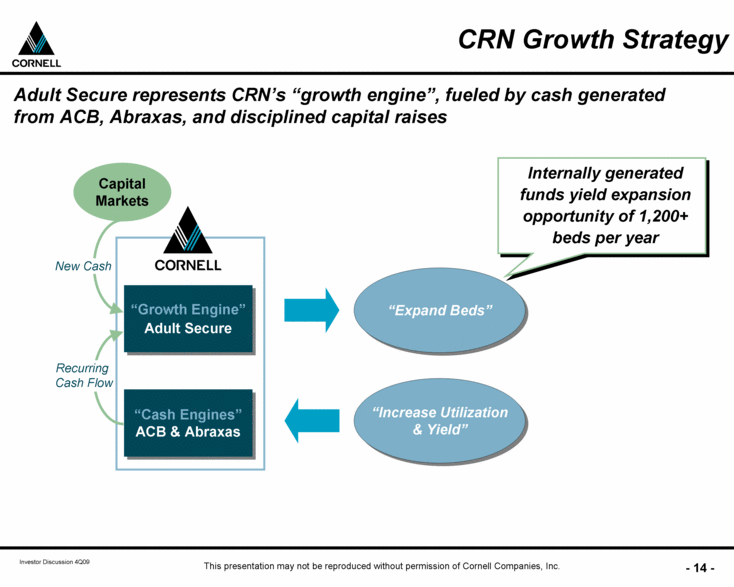
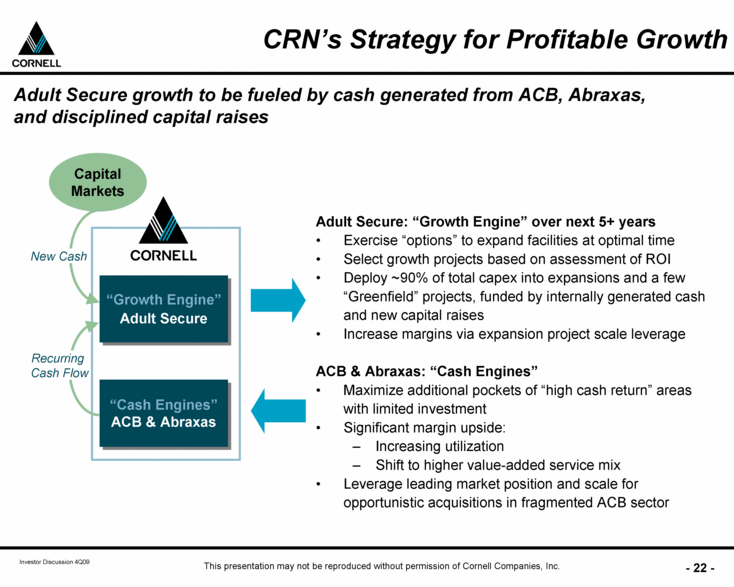
“Growth Engine” Adult Secure “Cash Engines” ACB & Abraxas New Cash Capital Markets CRN Growth Strategy Adult Secure represents CRN’s “growth engine”, fueled by cash generated from ACB, Abraxas, and disciplined capital raises Recurring Cash Flow “Increase Utilization & Yield” “Expand Beds” Internally generated funds yield expansion opportunity of 1,200+ beds per year |
|
|
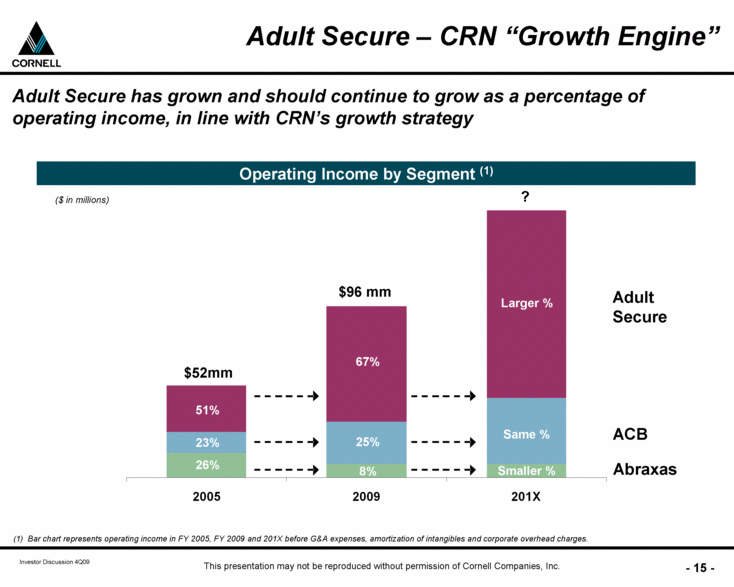
Adult Secure – CRN “Growth Engine” Adult Secure has grown and should continue to grow as a percentage of operating income, in line with CRN’s growth strategy (1) Bar chart represents operating income in FY 2005, FY 2009 and 201X before G&A expenses, amortization of intangibles and corporate overhead charges. Operating Income by Segment (1) ($ in millions) ? $52mm $96 mm 26% 23% 51% 8% 25% 67% Smaller % Same % Larger % Adult Secure ACB Abraxas 2005 2009 201X |
|
|
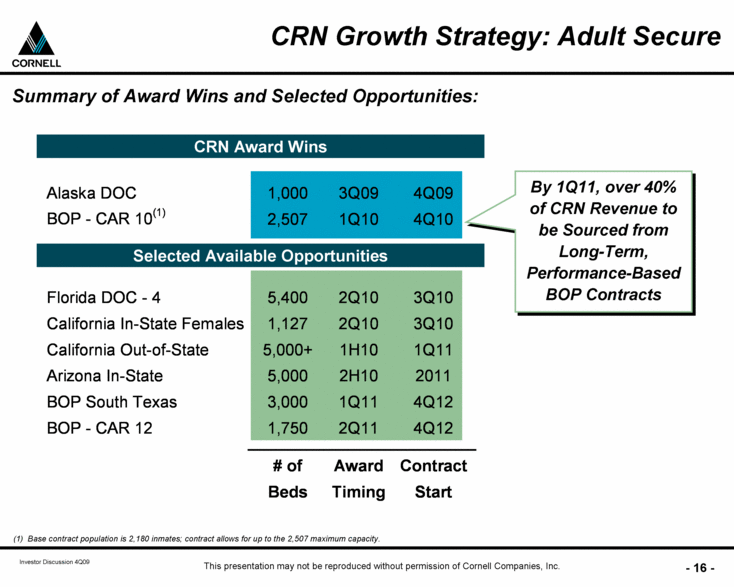
CRN Growth Strategy: Adult Secure Summary of Award Wins and Selected Opportunities: By 1Q11, over 40% of CRN Revenue to be Sourced from Long-Term, Performance-Based BOP Contracts (1) Base contract population is 2,180 inmates; contract allows for up to the 2,507 maximum capacity. CRN Award Wins Selected Available Opportunities Alaska DOC 1,000 3Q09 4Q09 BOP - CAR 10 (1) 2,507 1Q10 4Q10 Florida DOC - 4 5,400 2Q10 3Q10 California In-State Females 1,127 2Q10 3Q10 California Out-of-State 5,000+ 1H10 1Q11 Arizona In-State 5,000 2H10 2011 BOP South Texas 3,000 1Q11 4Q12 BOP - CAR 12 1,750 2Q11 4Q12 # of Award Contract Beds Timing Start |
|
|
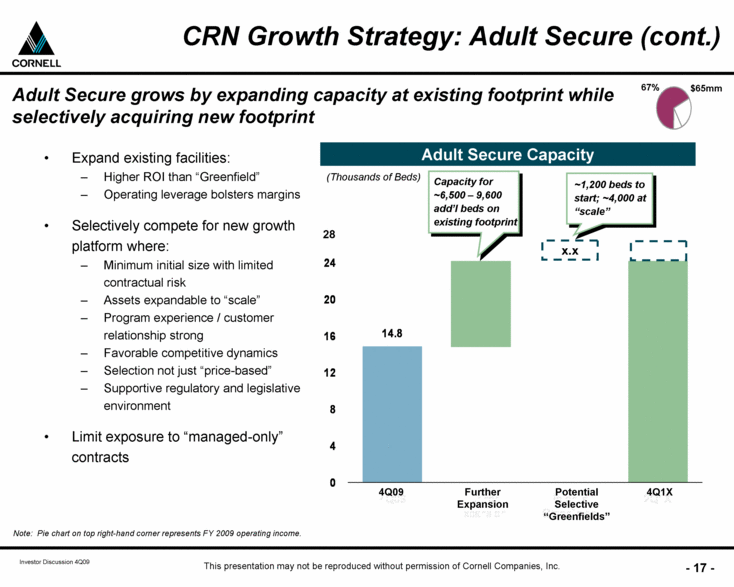
Adult Secure grows by expanding capacity at existing footprint while selectively acquiring new footprint Adult Secure Capacity Expand existing facilities: Higher ROI than “Greenfield” Operating leverage bolsters margins Selectively compete for new growth platform where: Minimum initial size with limited contractual risk Assets expandable to “scale” Program experience / customer relationship strong Favorable competitive dynamics Selection not just “price-based” Supportive regulatory and legislative environment Limit exposure to “managed-only” contracts CRN Growth Strategy: Adult Secure (cont.) (Thousands of Beds) 4Q09 4Q1X Further Expansion Potential Selective “Greenfields” Note: Pie chart on top right-hand corner represents FY 2009 operating income. x.x 67% $65mm 28 Capacity for ~6,500 – 9,600 add’l beds on existing footprint ~1,200 beds to start; ~4,000 at “scale” 14.8 0 4 8 12 16 20 24 |
|
|
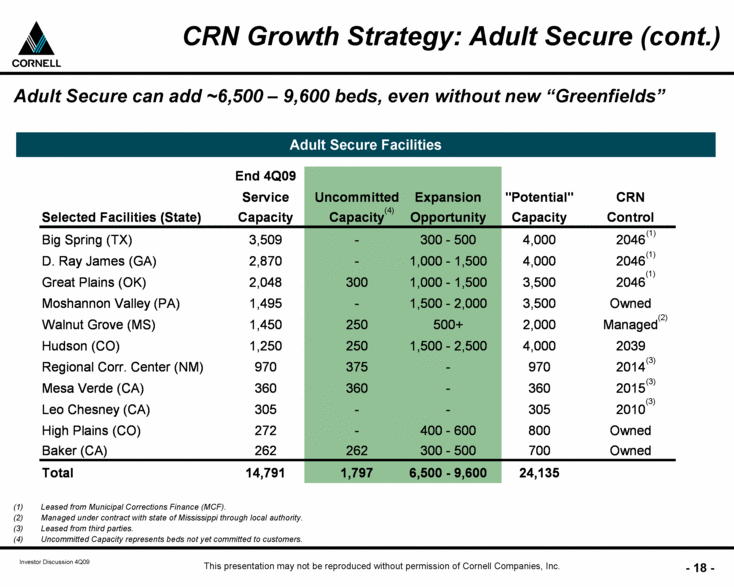
Adult Secure Facilities CRN Growth Strategy: Adult Secure (cont.) Adult Secure can add ~6,500 – 9,600 beds, even without new “Greenfields” Leased from Municipal Corrections Finance (MCF). Managed under contract with state of Mississippi through local authority. Leased from third parties. Uncommitted Capacity represents beds not yet committed to customers. (1) (1) (1) (2) (3) (3) (3) (4) End 4Q09 Service Uncommitted Expansion "Potential" CRN Selected Facilities (State) Capacity Capacity Opportunity Capacity Control Big Spring (TX) 3,509 - 300 - 500 4,000 2046 D. Ray James (GA) 2,870 - 1,000 - 1,500 4,000 2046 Great Plains (OK) 2,048 300 1,000 - 1,500 3,500 2046 Moshannon Valley (PA) 1,495 - 1,500 - 2,000 3,500 Owned Walnut Grove (MS) 1,450 250 500+ 2,000 Managed Hudson (CO) 1,250 250 1,500 - 2,500 4,000 2039 Regional Corr. Center (NM) 970 375 - 970 2014 Mesa Verde (CA) 360 360 - 360 2015 Leo Chesney (CA) 305 - - 305 2010 High Plains (CO) 272 - 400 - 600 800 Owned Baker (CA) 262 262 300 - 500 700 Owned Total 14,791 1,797 6,500 - 9,600 24,135 |
|
|
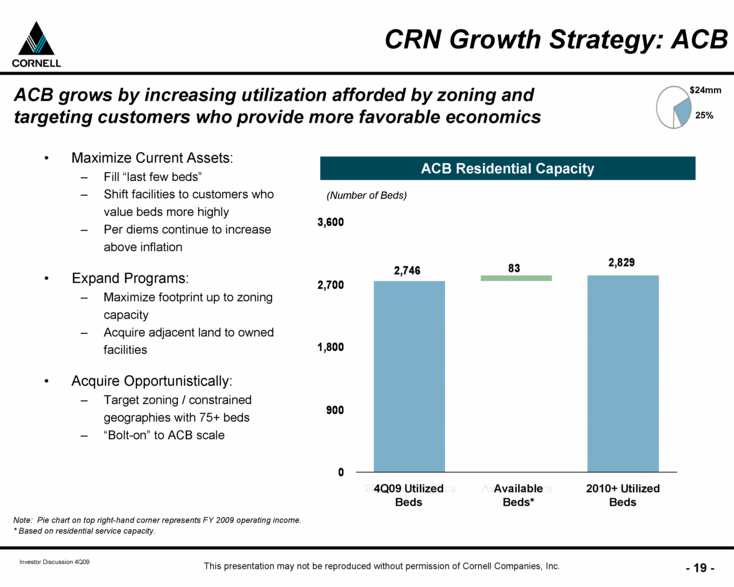
CRN Growth Strategy: ACB ACB Residential Capacity ACB grows by increasing utilization afforded by zoning and targeting customers who provide more favorable economics (Number of Beds) 4Q09 Utilized Beds Note: Pie chart on top right-hand corner represents FY 2009 operating income. * Based on residential service capacity. 2010+ Utilized Beds Available Beds* 25% $24mm Maximize Current Assets: Fill “last few beds” Shift facilities to customers who value beds more highly Per diems continue to increase above inflation Expand Programs: Maximize footprint up to zoning capacity Acquire adjacent land to owned facilities Acquire Opportunistically: Target zoning / constrained geographies with 75+ beds “Bolt-on” to ACB scale 2,746 83 2,829 0 900 1,800 2,700 3,600 |
|
|
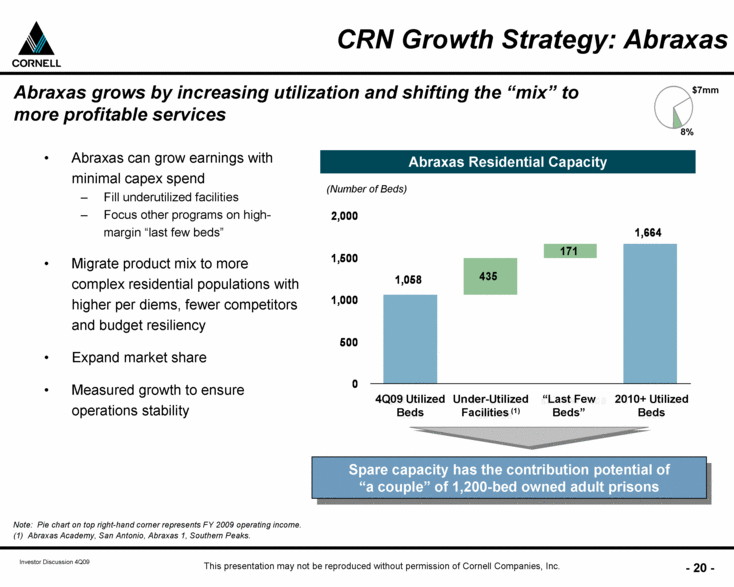
Under-Utilized Facilities (1) CRN Growth Strategy: Abraxas Abraxas Residential Capacity Abraxas grows by increasing utilization and shifting the “mix” to more profitable services Spare capacity has the contribution potential of “a couple” of 1,200-bed owned adult prisons (Number of Beds) 4Q09 Utilized Beds “Last Few Beds” 2010+ Utilized Beds Note: Pie chart on top right-hand corner represents FY 2009 operating income. (1) Abraxas Academy, San Antonio, Abraxas 1, Southern Peaks. 8% $7mm Abraxas can grow earnings with minimal capex spend Fill underutilized facilities Focus other programs on high-margin “last few beds” Migrate product mix to more complex residential populations with higher per diems, fewer competitors and budget resiliency Expand market share Measured growth to ensure operations stability 1,664 171 435 1,058 0 500 1,000 1,500 2,000 |
|
|
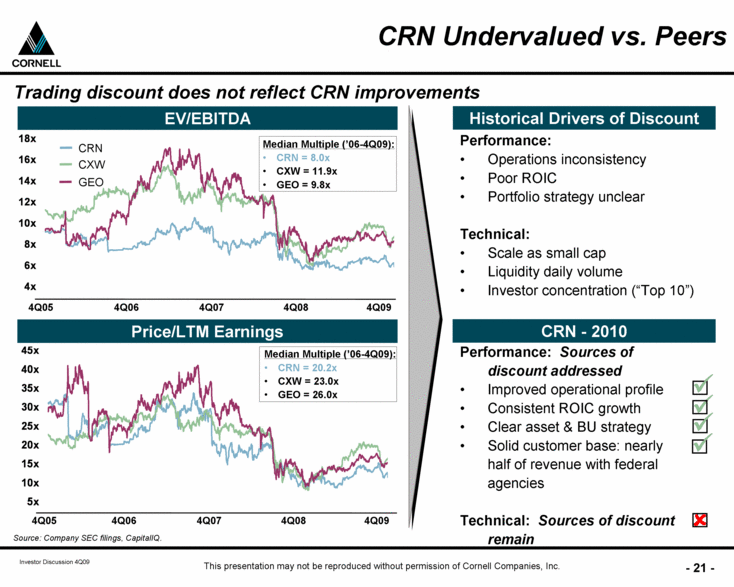
CRN Undervalued vs. Peers EV/EBITDA Price/LTM Earnings CRN CXW GEO Performance: Operations inconsistency Poor ROIC Portfolio strategy unclear Technical: Scale as small cap Liquidity daily volume Investor concentration (“Top 10”) Historical Drivers of Discount CRN - 2010 Performance: Sources of discount addressed Improved operational profile Consistent ROIC growth Clear asset & BU strategy Solid customer base: nearly half of revenue with federal agencies Technical: Sources of discount remain Trading discount does not reflect CRN improvements Median Multiple (’06-4Q09): CRN = 20.2x CXW = 23.0x GEO = 26.0x Source: Company SEC filings, CapitalIQ. 4Q06 4Q07 4Q08 4Q09 4Q05 Median Multiple (’06-4Q09): CRN = 8.0x CXW = 11.9x GEO = 9.8x 4Q06 4Q07 4Q08 4Q09 4Q05 4x 6x 8x 10x 12x 14x 16x 18x |
|
|
“Growth Engine” Adult Secure “Cash Engines” ACB & Abraxas New Cash Capital Markets CRN’s Strategy for Profitable Growth Adult Secure growth to be fueled by cash generated from ACB, Abraxas, and disciplined capital raises Recurring Cash Flow Adult Secure: “Growth Engine” over next 5+ years Exercise “options” to expand facilities at optimal time Select growth projects based on assessment of ROI Deploy ~90% of total capex into expansions and a few “Greenfield” projects, funded by internally generated cash and new capital raises Increase margins via expansion project scale leverage ACB & Abraxas: “Cash Engines” Maximize additional pockets of “high cash return” areas with limited investment Significant margin upside: Increasing utilization Shift to higher value-added service mix Leverage leading market position and scale for opportunistic acquisitions in fragmented ACB sector |
|
|
Cornell Overview Industry Highlights Cornell Growth Strategy Financial Review Appendix |
|
|
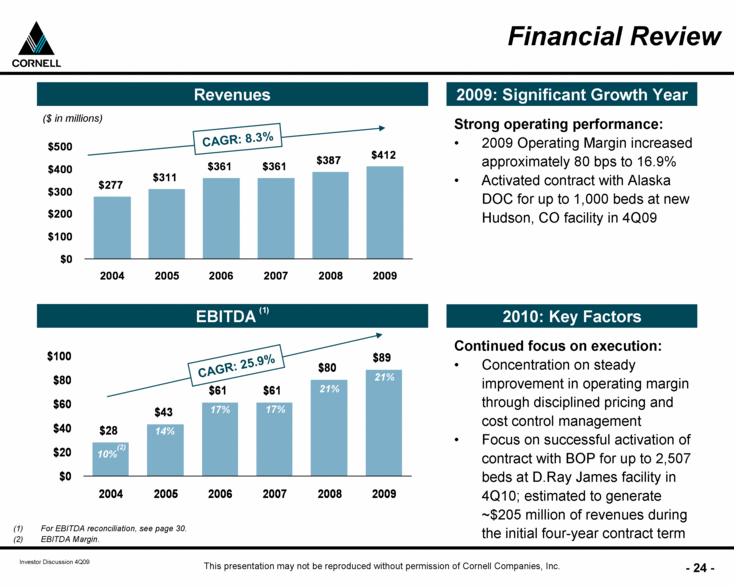
($ in millions) Revenues 2009: Significant Growth Year Financial Review EBITDA (1) CAGR: 8.3% 10%(2) 17% 17% CAGR: 25.9% 14% 21% 21% For EBITDA reconciliation, see page 30. EBITDA Margin. Strong operating performance: 2009 Operating Margin increased approximately 80 bps to 16.9% Activated contract with Alaska DOC for up to 1,000 beds at new Hudson, CO facility in 4Q09 2010: Key Factors Continued focus on execution: Concentration on steady improvement in operating margin through disciplined pricing and cost control management Focus on successful activation of contract with BOP for up to 2,507 beds at D.Ray James facility in 4Q10; estimated to generate ~$205 million of revenues during the initial four-year contract term $28 $43 $61 $61 $80 $89 $0 $20 $40 $60 $80 $100 2004 2005 2006 2007 2008 2009 $277 $311 $361 $361 $387 $412 $0 $100 $200 $300 $400 $500 2004 2005 2006 2007 2008 2009 |
|
|
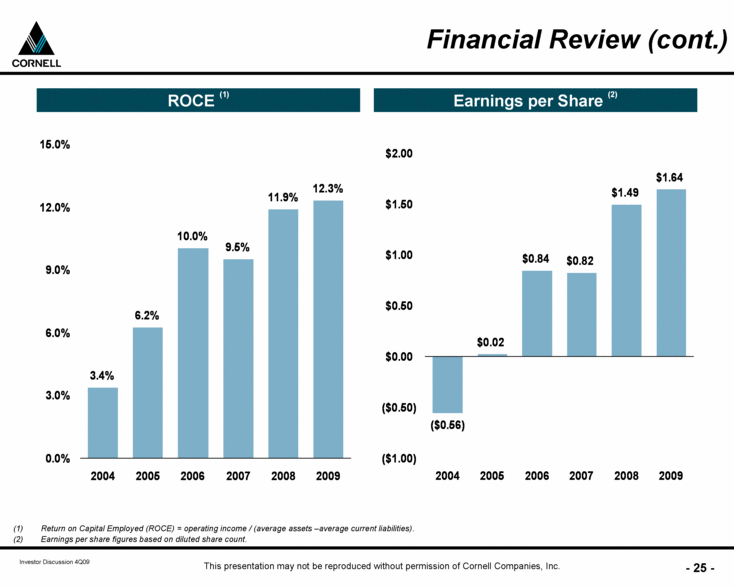
ROCE (1) Earnings per Share (2) Financial Review (cont.) Return on Capital Employed (ROCE) = operating income / (average assets –average current liabilities). Earnings per share figures based on diluted share count. 3.4% 6.2% 10.0% 9.5% 11.9% 12.3% 0.0% 3.0% 6.0% 9.0% 12.0% 15.0% 2004 2005 2006 2007 2008 2009 ($0.56) $0.02 $0.84 $0.82 $1.49 $1.64 ($1.00) ($0.50) $0.00 $0.50 $1.00 $1.50 $2.00 2004 2005 2006 2007 2008 2009 |
|
|
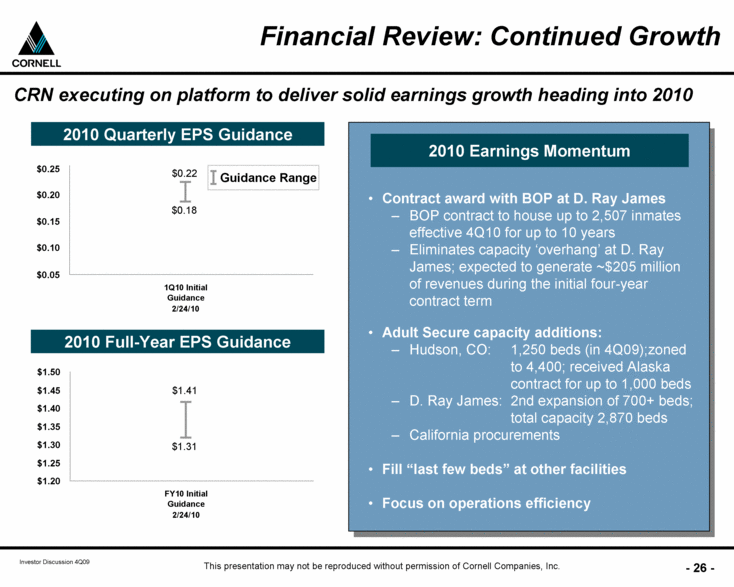
CRN executing on platform to deliver solid earnings growth heading into 2010 Financial Review: Continued Growth Contract award with BOP at D. Ray James BOP contract to house up to 2,507 inmates effective 4Q10 for up to 10 years Eliminates capacity ‘overhang’ at D. Ray James; expected to generate ~$205 million of revenues during the initial four-year contract term Adult Secure capacity additions: Hudson, CO: 1,250 beds (in 4Q09);zoned to 4,400; received Alaska contract for up to 1,000 beds D. Ray James: 2nd expansion of 700+ beds; total capacity 2,870 beds California procurements Fill “last few beds” at other facilities Focus on operations efficiency 2010 Earnings Momentum 2010 Quarterly EPS Guidance Guidance Range 2010 Full-Year EPS Guidance $1.20 $1.25 $1.30 $1.35 $1.40 $1.45 $1.50 FY10 Initial Guidance 2/24/10 $1.41 $1.31 $0.05 $0.10 $0.15 $0.20 $0.25 1Q10 Initial Guidance 2/24/10 $0.22 $0.18 |
|
|
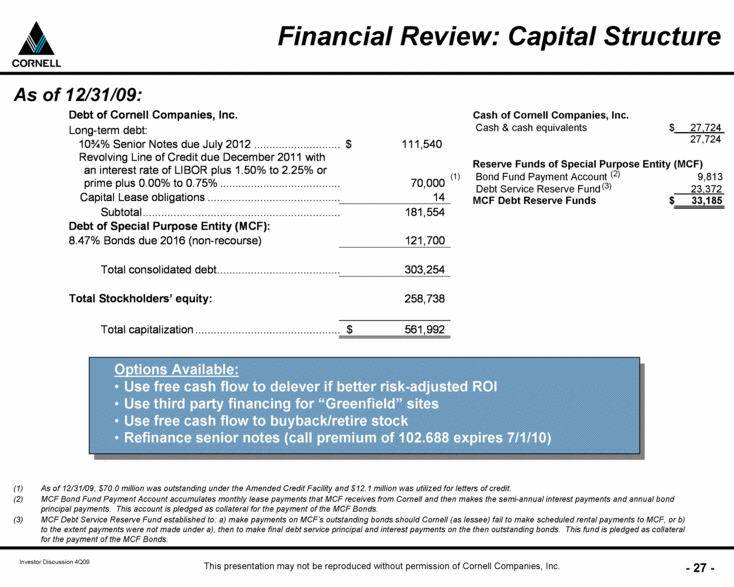
Financial Review: Capital Structure Options Available: Use free cash flow to delever if better risk-adjusted ROI Use third party financing for “Greenfield” sites Use free cash flow to buyback/retire stock Refinance senior notes (call premium of 102.688 expires 7/1/10) As of 12/31/09: Cash of Cornell Companies, Inc. Cash & cash equivalents $ 27,724 Reserve Funds of Special Purpose Entity (MCF) Bond Fund Payment Account 9,813 Debt Service Reserve Fund 23,372 MCF Debt Reserve Funds $ 33,185 (1) (2) (3) As of 12/31/09, $70.0 million was outstanding under the Amended Credit Facility and $12.1 million was utilized for letters of credit. MCF Bond Fund Payment Account accumulates monthly lease payments that MCF receives from Cornell and then makes the semi-annual interest payments and annual bond principal payments. This account is pledged as collateral for the payment of the MCF Bonds. MCF Debt Service Reserve Fund established to: a) make payments on MCF’s outstanding bonds should Cornell (as lessee) fail to make scheduled rental payments to MCF, or b) to the extent payments were not made under a), then to make final debt service principal and interest payments on the then outstanding bonds. This fund is pledged as collateral for the payment of the MCF Bonds. 27,724 Debt of Cornell Companies, Inc. Long-term debt: 10¾% Senior Notes due July 2012 $ 111,540 Revolving Line of Credit due December 2011 with an interest rate of LIBOR plus 1.50% to 2.25% or prime plus 0.00% to 0.75% 70,000 Capital Lease obligations 14 Subtotal 181,554 Debt of Special Purpose Entity (MCF): 8.47% Bonds due 2016 (non-recourse) 121,700 Total consolidated debt 303,254 Total Stockholders’ equity: 258,738 Total capitalization $ 561,992 |
|
|
Cornell Overview Industry Highlights Cornell Growth Strategy Financial Review Appendix |
|
|
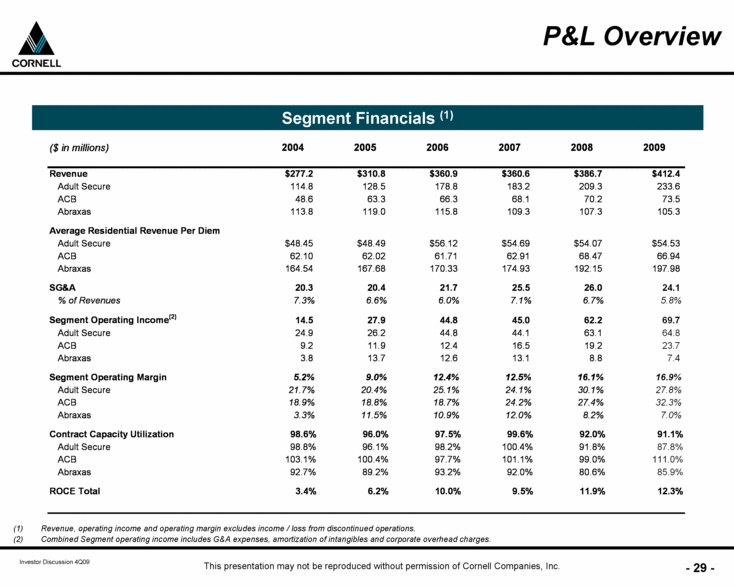
P&L Overview Segment Financials (1) Revenue, operating income and operating margin excludes income / loss from discontinued operations. Combined Segment operating income includes G&A expenses, amortization of intangibles and corporate overhead charges. ($ in millions) 2004 2005 2006 2007 2008 2009 Revenue $277.2 $310.8 $360.9 $360.6 $386.7 $412.4 Adult Secure 114.8 128.5 178.8 183.2 209.3 233.6 ACB 48.6 63.3 66.3 68.1 70.2 73.5 Abraxas 113.8 119.0 115.8 109.3 107.3 105.3 Average Residential Revenue Per Diem Adult Secure $48.45 $48.49 $56.12 $54.69 $54.07 $54.53 ACB 62.10 62.02 61.71 62.91 68.47 66.94 Abraxas 164.54 167.68 170.33 174.93 192.15 197.98 SG&A 20.3 20.4 21.7 25.5 26.0 24.1 % of Revenues 7.3% 6.6% 6.0% 7.1% 6.7% 5.8% Segment Operating Income (2) 14.5 27.9 44.8 45.0 62.2 69.7 Adult Secure 24.9 26.2 44.8 44.1 63.1 64.8 ACB 9.2 11.9 12.4 16.5 19.2 23.7 Abraxas 3.8 13.7 12.6 13.1 8.8 7.4 Segment Operating Margin 5.2% 9.0% 12.4% 12.5% 16.1% 16.9% Adult Secure 21.7% 20.4% 25.1% 24.1% 30.1% 27.8% ACB 18.9% 18.8% 18.7% 24.2% 27.4% 32.3% Abraxas 3.3% 11.5% 10.9% 12.0% 8.2% 7.0% Contract Capacity Utilization 98.6% 96.0% 97.5% 99.6% 92.0% 91.1% Adult Secure 98.8% 96.1% 98.2% 100.4% 91.8% 87.8% ACB 103.1% 100.4% 97.7% 101.1% 99.0% 111.0% Abraxas 92.7% 89.2% 93.2% 92.0% 80.6% 85.9% ROCE Total 3.4% 6.2% 10.0% 9.5% 11.9% 12.3% |
|
|
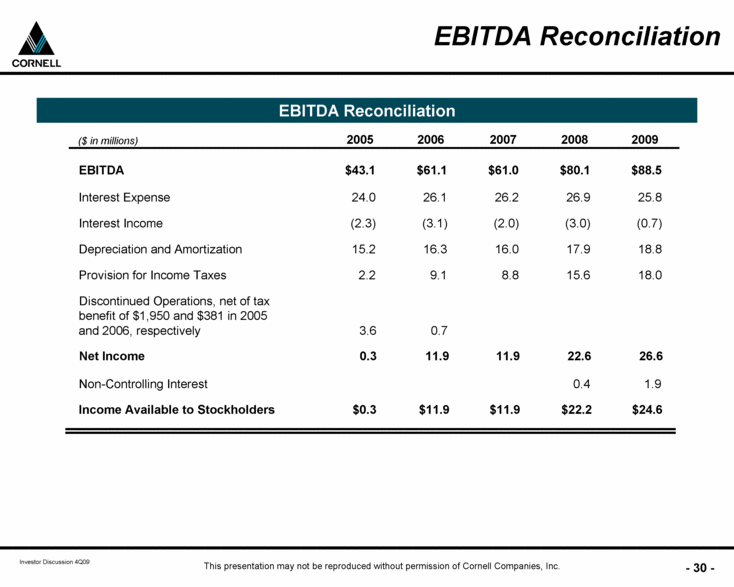
EBITDA Reconciliation EBITDA Reconciliation ($ in millions) 2005 2006 2007 2008 2009 EBITDA $43.1 $61.1 $61.0 $80.1 $88.5 Interest Expense 24.0 26.1 26.2 26.9 25.8 Interest Income (2.3) (3.1) (2.0) (3.0) (0.7) Depreciation and Amortization 15.2 16.3 16.0 17.9 18.8 Provision for Income Taxes 2.2 9.1 8.8 15.6 18.0 Discontinued Operations, net of tax benefit of $1,950 and $381 in 2005 and 2006, respectively 3.6 0.7 Net Income 0.3 11.9 11.9 22.6 26.6 Non-Controlling Interest 0.4 1.9 Income Available to Stockholders $0.3 $11.9 $11.9 $22.2 $24.6 |
|
|
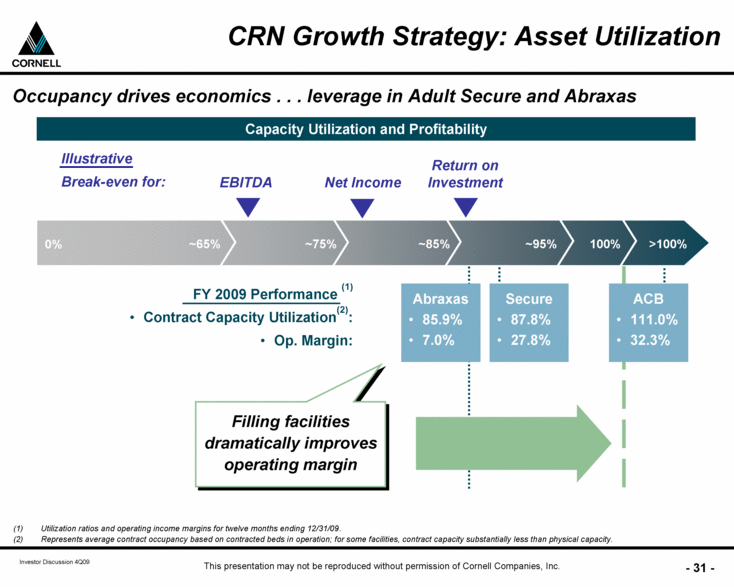
CRN Growth Strategy: Asset Utilization Capacity Utilization and Profitability Occupancy drives economics . . . leverage in Adult Secure and Abraxas ~65% ~75% ~85% >100% EBITDA Net Income Return on Investment 0% Illustrative Break-even for: ~95% FY 2009 Performance (1) Contract Capacity Utilization(2): Op. Margin: Filling facilities dramatically improves operating margin 100% Abraxas 85.9% 7.0% Secure 87.8% 27.8% ACB 111.0% 32.3% Utilization ratios and operating income margins for twelve months ending 12/31/09. Represents average contract occupancy based on contracted beds in operation; for some facilities, contract capacity substantially less than physical capacity. |
|
|
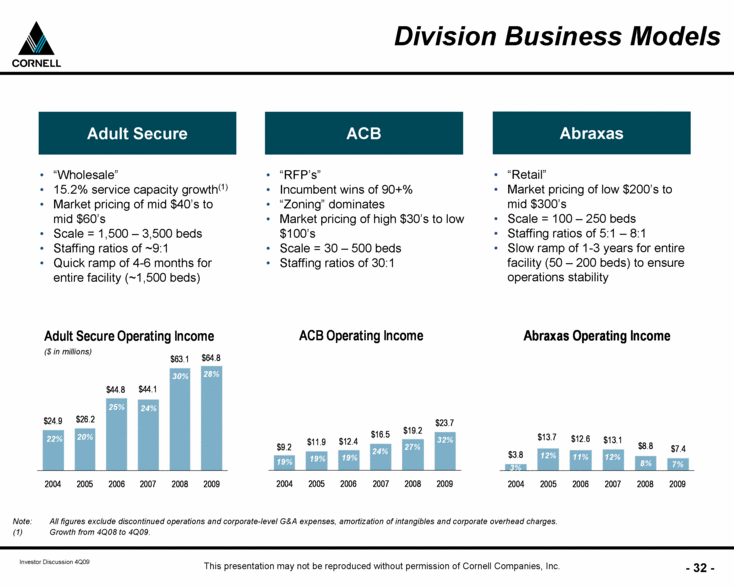
Adult Secure “RFP’s” Incumbent wins of 90+% “Zoning” dominates Market pricing of high $30’s to low $100’s Scale = 30 – 500 beds Staffing ratios of 30:1 Division Business Models ACB “Wholesale” 15.2% service capacity growth(1) Market pricing of mid $40’s to mid $60’s Scale = 1,500 – 3,500 beds Staffing ratios of ~9:1 Quick ramp of 4-6 months for entire facility (~1,500 beds) Note: All figures exclude discontinued operations and corporate-level G&A expenses, amortization of intangibles and corporate overhead charges. (1) Growth from 4Q08 to 4Q09. “Retail” Market pricing of low $200’s to mid $300’s Scale = 100 – 250 beds Staffing ratios of 5:1 – 8:1 Slow ramp of 1-3 years for entire facility (50 – 200 beds) to ensure operations stability Abraxas 25% 24% 30% 30% 20% 22% 19% 19% 19% 24% 27% 32% 3% 12% 11% 12% 8% ($ in millions) 28% 7% Adult Secure Operating Income $24.9 $26.2 $44.1 $44.8 $63.1 $64.8 2004 2005 2006 2007 2008 2009 Abraxas Operating Income $7.4 $8.8 $13.1 $12.6 $13.7 $3.8 2004 2005 2006 2007 2008 2009 ACB Operating Income $23.7 $9.2 $11.9 $16.5 $12.4 $19.2 2004 2005 2006 2007 2008 2009 |
|
|
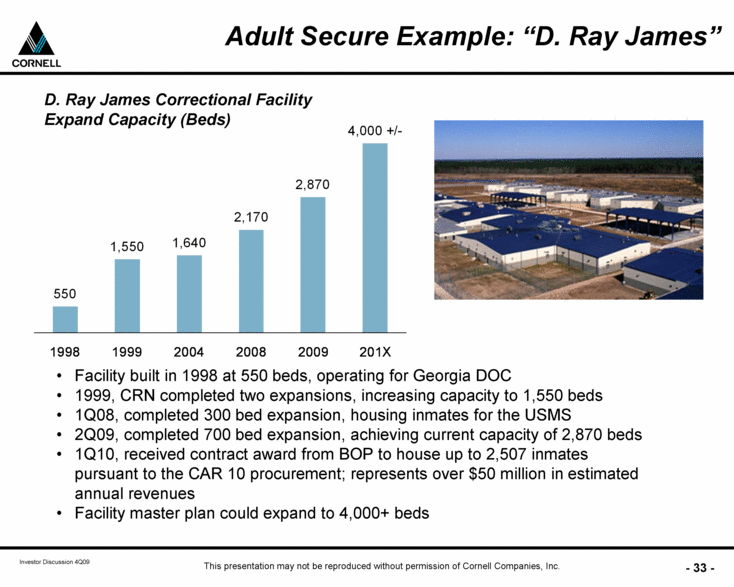
Adult Secure Example: “D. Ray James” Facility built in 1998 at 550 beds, operating for Georgia DOC 1999, CRN completed two expansions, increasing capacity to 1,550 beds 1Q08, completed 300 bed expansion, housing inmates for the USMS 2Q09, completed 700 bed expansion, achieving current capacity of 2,870 beds 1Q10, received contract award from BOP to house up to 2,507 inmates pursuant to the CAR 10 procurement; represents over $50 million in estimated annual revenues Facility master plan could expand to 4,000+ beds D. Ray James Correctional Facility Expand Capacity (Beds) 550 1,550 1,640 4,000 +/- 2,170 2,870 1998 1999 2004 2008 2009 201X |
|
|
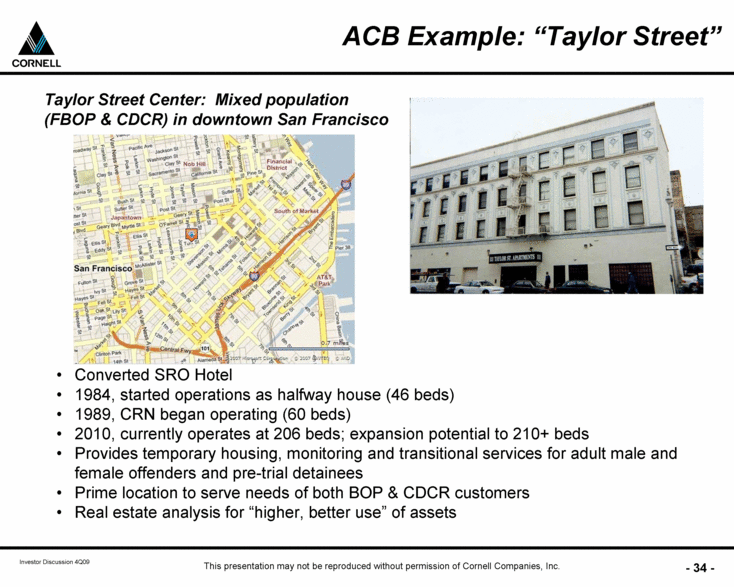
ACB Example: “Taylor Street” Taylor Street Center: Mixed population (FBOP & CDCR) in downtown San Francisco Converted SRO Hotel 1984, started operations as halfway house (46 beds) 1989, CRN began operating (60 beds) 2010, currently operates at 206 beds; expansion potential to 210+ beds Provides temporary housing, monitoring and transitional services for adult male and female offenders and pre-trial detainees Prime location to serve needs of both BOP & CDCR customers Real estate analysis for “higher, better use” of assets |
|
|
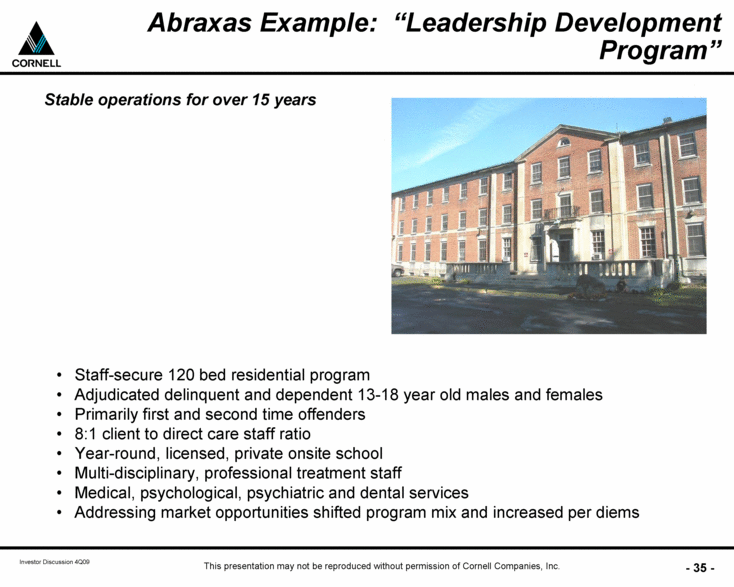
Abraxas Example: “Leadership Development Program” Stable operations for over 15 years Staff-secure 120 bed residential program Adjudicated delinquent and dependent 13-18 year old males and females Primarily first and second time offenders 8:1 client to direct care staff ratio Year-round, licensed, private onsite school Multi-disciplinary, professional treatment staff Medical, psychological, psychiatric and dental services Addressing market opportunities shifted program mix and increased per diems |
|
|
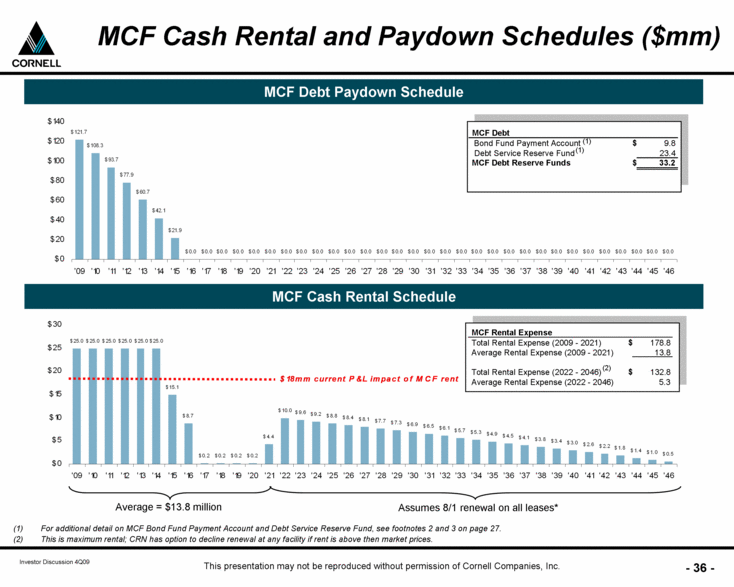
MCF Cash Rental and Paydown Schedules ($mm) MCF Debt Paydown Schedule Assumes 8/1 renewal on all leases* Average = $13.8 million MCF Cash Rental Schedule MCF Debt Bond Fund Payment Account $ 9.8 Debt Service Reserve Fund 23.4 MCF Debt Reserve Funds $ 33.2 MCF Rental Expense Total Rental Expense (2009 - 2021) $ 178.8 Average Rental Expense (2009 - 2021) 13.8 Total Rental Expense (2022 - 2046) $ 132.8 Average Rental Expense (2022 - 2046) 5.3 For additional detail on MCF Bond Fund Payment Account and Debt Service Reserve Fund, see footnotes 2 and 3 on page 27. This is maximum rental; CRN has option to decline renewal at any facility if rent is above then market prices. (1) (1) (2) $121.7 $108.3 $93.7 $77.9 $60.7 $42.1 $21.9 $0.0 $0.0 $0.0 $0.0 $0.0 $0.0 $0.0 $0.0 $0.0 $0.0 $0.0 $0.0 $0.0 $0.0 $0.0 $0.0 $0.0 $0.0 $0.0 $0.0 $0.0 $0.0 $0.0 $0.0 $0.0 $0.0 $0.0 $0.0 $0.0 $0.0 $0.0 $0 $20 $40 $60 $80 $100 $120 $140 '09 '10 '11 '12 '13 '14 '15 '16 '17 '18 '19 '20 '21 '22 '23 '24 '25 '26 '27 '28 '29 '30 '31 '32 '33 '34 '35 '36 '37 '38 '39 '40 '41 '42 '43 '44 '45 '46 $25.0 $25.0 $25.0 $25.0 $25.0 $25.0 $15.1 $8.7 $0.2 $0.2 $0.2 $0.2 $4.4 $10.0 $9.6 $9.2 $8.8 $8.4 $8.1 $7.7 $7.3 $6.9 $6.5 $6.1 $5.7 $5.3 $4.9 $4.5 $4.1 $3.8 $3.4 $3.0 $2.6 $2.2 $1.8 $1.4 $1.0 $0.5 $0 $5 $10 $15 $20 $25 $30 '09 '10 '11 '12 '13 '14 '15 '16 '17 '18 '19 '20 '21 '22 '23 '24 '25 '26 '27 '28 '29 '30 '31 '32 '33 '34 '35 '36 '37 '38 '39 '40 '41 '42 '43 '44 '45 '46 $18mm current P&L impact of MCF rent |
|
|
[LOGO] |