Attached files
| file | filename |
|---|---|
| 8-K - ANR 8K 03-01-2010 - Alpha Natural Resources, Inc. | anr8k03012010.htm |
EXHIBIT
99.1

1
Investor
Presentation
February/March,
2010

2
Forward
Looking Statements
Statements in this
presentation which are not statements of historical fact are
“forward-looking
statements” within the Safe Harbor provision of the Private Securities Litigation Reform Act of 1995.
Such statements are not guarantees of future performance. Many factors could cause our actual
results, performance or achievements, or industry results, to be materially different from any future
results, performance or achievements expressed or implied by such forward looking-statements.
These factors are discussed in detail in our Annual Report on Form 10-K, Quarterly Reports on
Form 10-Q and in our other filings with the SEC. We make forward-looking statements based on
currently available information, and we assume no obligation to update the statements made today
or contained in our Annual Report or other filings due to changes in underlying factors, new
information, future developments, or otherwise, except as required by law.

3
Coal
Industry Themes - 2010
v Strong met coal
pricing driven by growing
Asian demand
Asian demand
v Met coal tightness
increasing in the Atlantic
basin as economic recovery continues
basin as economic recovery continues
v Significant recent
utility inventory draw - U.S.
thermal market positioned to strengthen
thermal market positioned to strengthen
v Future worldwide
demand for thermal coal
anticipated to strain seaborne supply
anticipated to strain seaborne supply

4
4
Strong
Market Outlook
5
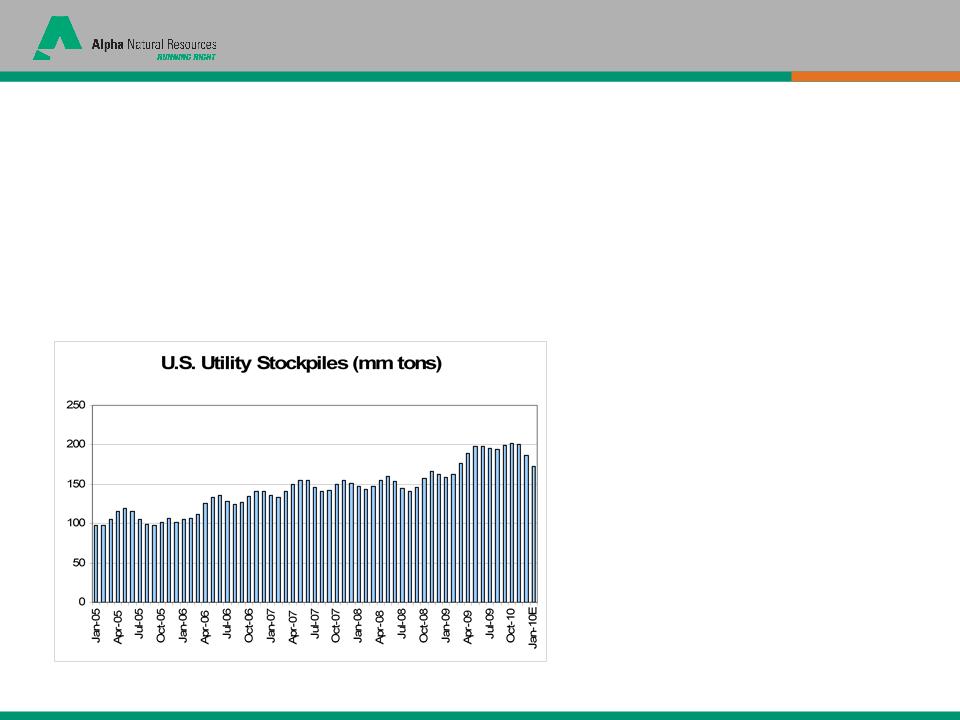
U.S.
Thermal Coal Market Recovering
— Severe
winter weather caused utility inventories to fall by an estimated 30+MTs
since
Nov.
Nov.
— U.S.
thermal coal production unlikely to expand in 2010 and may decline
further
— Economic
recovery likely to drive increased industrial electricity demand
— Forward
natural gas prices indicate that some fuel switching should reverse in
2010
— Global
recovery and weak dollar should drive increasing net exports from the
U.S.
— Crossover
met coal may further reduce available supply in the U.S.
— New
coal-fired generation will increase demand
SOURCE:
DOE NETL, Internal Analysis, Genscape
Given
the rapid drawdown in utility
inventories in the opening weeks of
2010, forecasts of normal inventories
by late 2010 may prove conservative
inventories in the opening weeks of
2010, forecasts of normal inventories
by late 2010 may prove conservative
6
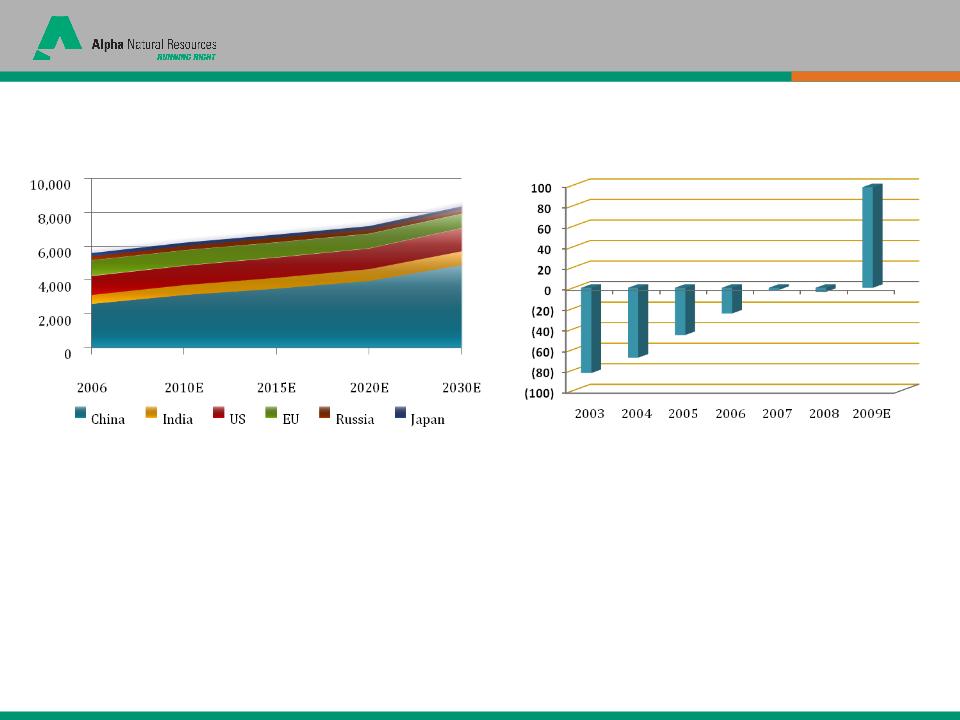
Robust Global Coal Market: Asia Is Key
Global
demand growth, driven primarily by China, is staggering
Global
Coal Consumption (mm tons)
Chinese
Net Imports (mm tonnes)
SOURCE:
Energy Information Administration, International Energy Outlook; International
Energy Agency, World Energy Outlook; Internal Analysis
— Among the countries
representing most of the world’s coal use, coal consumption is forecast to
increase
35% in 20 years (2010 - 2030)
35% in 20 years (2010 - 2030)
— China is forecast to
account for over 80% of this growth of more than 2BTs in annual demand,
increasing
its annual coal consumption by nearly 60% between 2010 and 2030
its annual coal consumption by nearly 60% between 2010 and 2030
— China’s rapid move
to net importer is a well-documented game changer
— India’s coal
consumption is forecast to rise nearly 40% between 2010 and 2030
— Considering that the
U.S. produces ~1BTs per
year…where will the coal come from to satisfy this
incremental increase in demand?
incremental increase in demand?

7
China & India Rely on Coal-fired Electricity
2010E:
80% coal-fired
2030E:
77% coal-fired
2010E:
66% coal-fired
2030E:
69% coal-fired
(Indian
thermal coal imports have grown at 13% CAGR from 1990 - 2008)
Source: IEA;
Booz & Company analysis
8
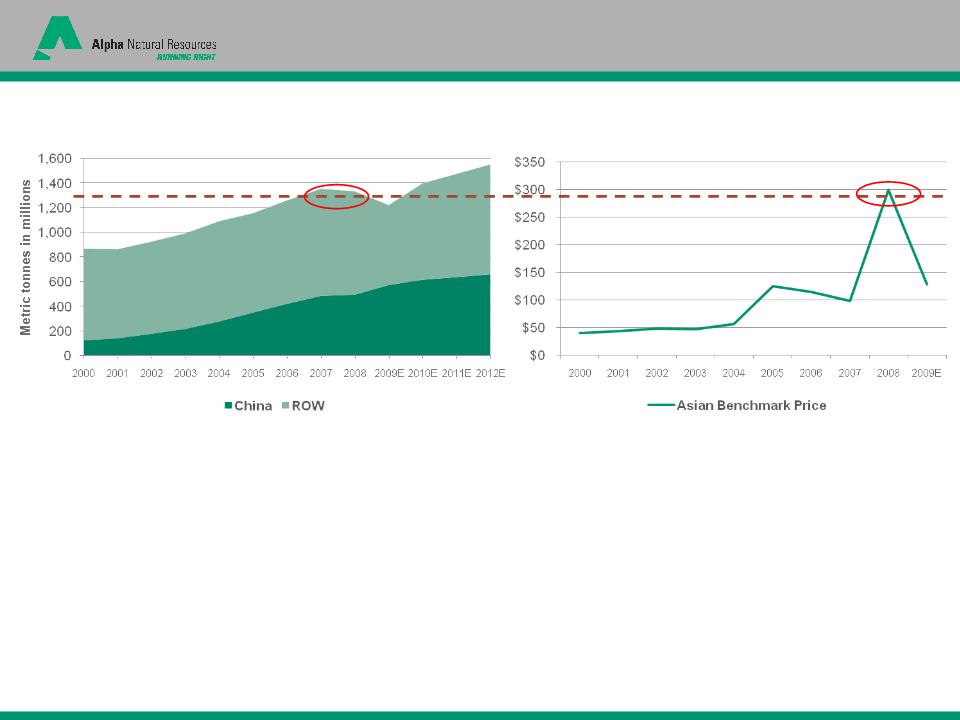
Source: Wood
Mackenzie; Booz & Company analysis
China
= 14.8% CAGR
ROW
= 1.5% CAGR
Scarcity of
Metallurgical Coal
Global
Steel Production
Metallurgical Coal
Pricing (US$)
— As global steel
production has grown, metallurgical coal has come to be viewed as a
scarce
and differentiated product
and differentiated product
— When worldwide
production of steel exceeds 1.3 billion tons, the supply of met coal
becomes
strained and incremental pricing can rise sharply as was seen in 2008
strained and incremental pricing can rise sharply as was seen in 2008
— While new projects
are planned in places like Mozambique, Mongolia and Siberia, and
additional projects are planned in Australia, all must overcome various infrastructure
limitations or political challenges
additional projects are planned in Australia, all must overcome various infrastructure
limitations or political challenges
— Supply constraints
are likely to persist for several years

9
China
Driving Worldwide Met Demand
Chinese
Growth is Permanently Changing Global Seaborne Met Coal Trading
Dynamics
— Chinese crude steel
production increased an estimated 14% in 2009, and China now produces nearly
half
of the world’s steel
of the world’s steel
— China imported 34M
tonnes of Met coal in 2009, or ~15% of the World’s seaborne supply
— Chinese demand will
be satisfied primarily by Australia, which is near its current export
capacity
— Availability of
seaborne coking coal, which totaled an estimated 240M tonnes in 2008, will be
constrained
by the growth of Chinese imports
by the growth of Chinese imports
— Worldwide steel
production is estimated to be on an annual pace of greater than1.3B tonnes, with
over
600M tonnes expected from China alone in 2010
600M tonnes expected from China alone in 2010
SOURCE:
China’s National Bureau of Statistics, Chinese Customs, Macquarie, Internal
Analysis

10
Met Demand Accelerating in Atlantic Basin
Met
Coal Demand in the Atlantic Basin Should Increase As Developed
Economies Recover and Steel Production Ramps Up
Economies Recover and Steel Production Ramps Up
*
ANR is the leading U.S. supplier & exporter of metallurgical coal with
13-14MTPA export capacity*
— Domestic producers’
rapid response to the recession in 2009 drove U.S. service center inventories to
26-
yr. lows, despite anemic demand for steel—restocking is now occurring
yr. lows, despite anemic demand for steel—restocking is now occurring
— U.S. steel
production capacity utilization has increased to the mid-60% range, up from ‘09
lows in the 30s
— The combination of
strong Chinese demand and increasing steel capacity utilization in the U.S. and
the
rest of the world should drive accelerating Atlantic basin met coal demand in 2010 and beyond
rest of the world should drive accelerating Atlantic basin met coal demand in 2010 and beyond
SOURCE:
Metals Service Center Institute, American Iron and Steel Institute, Macquarie,
Internal Analysis

11
Trends
in Seaborne Trading Patterns
Decreasing
trend
Increasing
trend
Spare
capacity provides opportunity to ramp exports to meet global demand
As
Asian Demand Absorbs Seaborne Supply, The Atlantic Basin Will Increasingly Rely
on U.S. Coals

12
12
Investment
Highlights

13
2009
Year-end Reserves = 2.3 BTs
2009
Revenue Mix by Coal Type
Following
our merger on July 31, 2009, Alpha has delivered consistent
execution
demonstrating the benefit of the company’s enhanced scale and diversification.
demonstrating the benefit of the company’s enhanced scale and diversification.
*ANR
is arguably the most regionally diversified producer in the U.S.
today*
(1) Third
quarter 2009 amounts previously reported have been adjusted by $3.2 million,
$0.03 per share, due to reduced expense.

14
High
Margin Longwall Mining in NAPP
— Alpha operates two
low-cost, high-margin longwall mines in the Pittsburgh #8 seam:
Cumberland and Emerald
Cumberland and Emerald
— In 4Q09, the
longwalls accounted for 3M tons, or 45% of Eastern steam coal shipments, and
on
a pro forma basis these mines shipped 12.1M tons in 2009
a pro forma basis these mines shipped 12.1M tons in 2009
— Cost of coal sales
were the low to mid-$30s per ton for 4Q09 and pro forma full year 2009,
while
average realizations were in the mid-$50s
average realizations were in the mid-$50s
— Even in the
relatively weak thermal coal market of 2009, these mines contributed
approximately
$20/ton of gross coal margins, contributing pro forma total margin of $230 to $240 million
$20/ton of gross coal margins, contributing pro forma total margin of $230 to $240 million
— Due to higher
average realizations in the committed and priced book of business, per ton
coal
margins in 2010 are expected to increase despite higher anticipated per ton costs
margins in 2010 are expected to increase despite higher anticipated per ton costs
*
Longwall mines are highly profitable compared to other Eastern steam
operations*
15
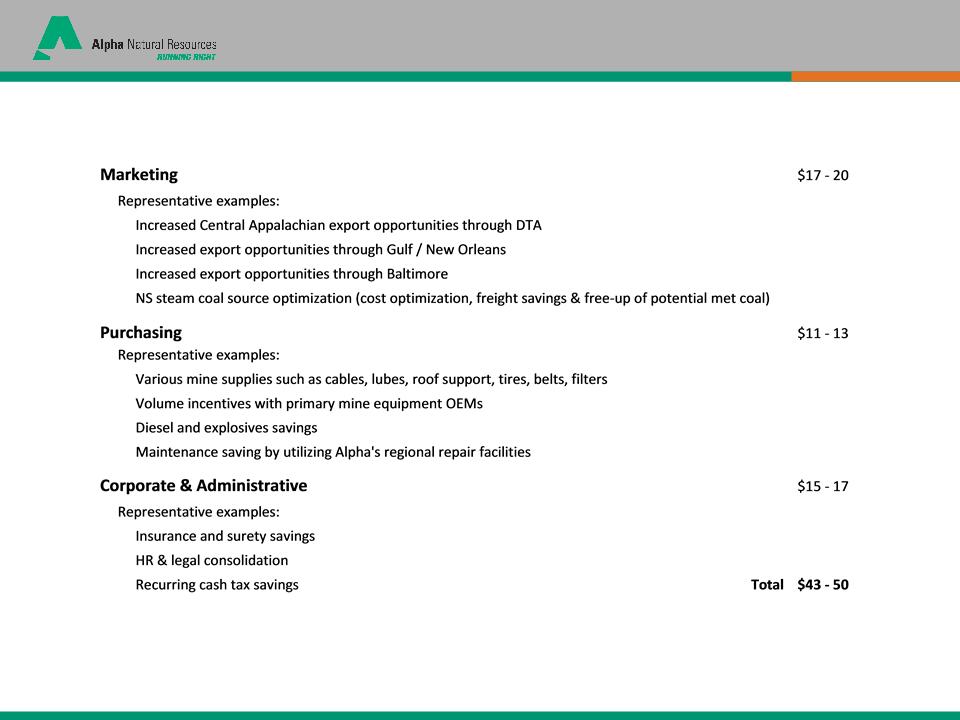
Pacing to Meet or Exceed Synergy Target
Additional
upside possible, primarily driven by additional blending and
optimization opportunities depending on future market conditions
optimization opportunities depending on future market conditions
Annual
net synergies conservatively estimated at $45 million at full
run-rate anticipated to be achieved by mid-year 2010
run-rate anticipated to be achieved by mid-year 2010

16
Consistent History of Positive Cash Flow
Note: Pro
forma capex for 2008 and 2009 includes Lease-By-Application (LBA) bonus bid
payments of $36.1 million each year.
FCF =
Operating cash flow less capex

17
Excellent Liquidity
and Low Leverage
Note: LTM data
as of 12/31/09
(1) LTM combined pro forma Adjusted EBITDA for the fiscal year ended December 31, 2009
(1) LTM combined pro forma Adjusted EBITDA for the fiscal year ended December 31, 2009
Leverage
of approximately 1.2x debt/Adjusted EBITDA and liquidity of approximately $1.1
billion
|
($
millions)
|
Maturity
|
|
As
of
12/31/09 |
|
|
|
|
|
|
|
|
$650mm
Revolving Credit Facility
|
July,
2011
|
|
$0
|
|
|
Term Loan
A
|
July,
2011
|
|
285
|
|
|
2.375%
Convertible Notes
|
April,
2015
|
|
288
|
|
|
7.25% Senior
Unsecured Bonds
|
August,
2014
|
|
298
|
|
|
|
Total
Debt
|
|
|
$871
|
|
|
|
|
|
|
|
|
|
|
|
|
|
Liquidity
and Credit Statistics
|
|
|
|
|
|
Cash &
Equivalents and marketable
securities |
|
|
$584
|
|
|
Revolver
|
|
|
650
|
|
|
Accounts
Receivable Securitization Facility
|
|
|
150
|
|
|
Less: Letters
of Credit Outstanding
|
|
|
(258)
|
|
|
|
Total
Potential Liquidity
|
|
|
$1,126
|
|
|
|
|
|
|
|
Total Debt /
LTM EBITDA
|
|
|
1.2x
|
|
|
|
|
|
|
|
|
LTM Adjusted
EBITDA1
|
|
|
$709
|
|

18
A Leader in the Domestic Coal Industry
Eastern
Coal Operations
Illinois
Basin
Western
Coal Operations
|
Production capacity
|
55.0
|
|
2009
Shipments
|
50.1
|
|
Reserves
|
709
|
|
Reserves
|
26
|
|
Production
Capacity
|
42.0
|
|
2009
Shipments
|
36.0
|
|
Reserves
|
1579
|
Note: Figures
pro forma as of 12/31/09
Strength,
Scale, Diversification

19
(2)CLD revenue, tons
sold and EBITDA as reported for the 12 months ended 12/31/08
(3)JRCC revenue, tons
sold and EBITDA as reported for the twelve
months ended 09/30/09
Market
Capitalization1
($
in billions)
LTM
12/31/09 Tons Sold 2
3 (in
millions)
Peer
Group Comparisons

20
|
Powder
River Basin
|
||
|
Wyoming
Operations
|
Expansion
(MM tons/yr)
|
Capacity
|
|
Truck/shovel
expansion
|
10
|
65
MTPY
|
|
Belle
Ayr LBA
|
200
Million Tons
|
2011
|
|
Central
Appalachia
|
||
|
Mine
|
Resource
Description
|
Production
|
|
Deep
Mine #41
|
~
70 MM Ton Reserve
|
1.0
- 1.2 MTPY (metallurgical)
|
|
Harts
Creek/Atenville
|
~
120 MM Ton Reserve
|
2
- 3 MTPY (metallurgical potential)
|
|
Northern
Appalachia
|
||
|
Mine
|
Resource
Description
|
Production
|
|
Foundation
- longwall
|
~
420 MM Ton Reserve
|
7
- 14 MTPY Pitt #8 (+ Sewickley)
|
|
Freeport
- CM
|
~
68 MM Ton Reserve
|
2
- 3 MTPY (metallurgical)
|
|
Coal
Gas Recovery
|
||
|
Location
|
Resource
Description
|
Production
|
|
CBM
|
~
100-200 Bcf Resource
|
~
5,000 Salable Mcf/Day (current)
|
|
Marcellus
acreage
|
~
18,000 Acres
|
Entered
into JV with Rice Energy 2010
|
Organic
Growth Opportunities

21
• 50/50 Joint Venture
with Rice Energy, LP
• Alpha controls
~18,000 acres of Marcellus in
Greene and Washington Counties of Pennsylvania
Greene and Washington Counties of Pennsylvania
• Initial phase
underway, currently drilling the first of
four wells planned for 2010
four wells planned for 2010
• Each partner
committing acreage and cash
• Total phase 1
capital anticipated to be less than
$20 million
$20 million
• JV potential to
develop ~100 wells in the Marcellus
• Separately, Alpha’s
CBM gas processing plant
expanding from capacity of 5,000 MCF/day to
10,000 MCF/day
expanding from capacity of 5,000 MCF/day to
10,000 MCF/day
Unconventional Gas
Development

22
Summary
of Recent Guidance
NOTES:
1. Based on
committed and priced coal shipments as of February 8, 2010.
2. Eastern
shipments in 2010 and 2011 include an estimated 2.0 to 3.0 million tons of
brokered coal per year.
3. As of
February 8, 2010, compared to the midpoint of shipment guidance
range.
4. In 2010,
committed and un-priced Eastern tons include approximately 1.8 million tons of
met coal subject to market pricing, approximately 0.2 million tons of steam coal
subject to market
pricing, and 0.5 million tons of steam coal subject to collared pricing with an average pricing range of $65.00 to $76.00 per ton. In 2011, committed and unpriced Eastern tons include
approximately 5.9 million tons of met coal subject to market pricing, approximately 3.3 million of steam coal subject to market pricing, approximately 2.9 million tons of steam coal subject to
collared pricing with an average pricing range of $50.00 to $62.00 per ton, and legacy contracts covering approximately 0.4 million tons of steam coal subject to average indexed pricing
estimated at $69.21 per ton.
Guidance
(in millions, except
per-ton and percentage amounts)
|
|
2010
|
2011
|
|
Average
per Ton Sales Realization on
Committed and Priced Coal Shipments1 |
|
|
|
West
|
$10.93
|
$11.93
|
|
Eastern
Steam
|
$65.54
|
$67.03
|
|
Eastern
Met
|
$104.63
|
$123.97
|
|
Coal
Shipments2
|
81.0 -
89.0
|
82.0 -
94.0
|
|
West
|
47.0 -
50.0
|
48.0 -
52.0
|
|
Eastern
Steam
|
23.0 -
26.0
|
23.0 -
28.0
|
|
Eastern
Met
|
11.0 -
13.0
|
11.0 -
14.0
|
|
Committed
and Priced (%)3
|
92%
|
59%
|
|
West
|
100%
|
77%
|
|
Eastern
Steam
|
93%
|
44%
|
|
Eastern
Met
|
62%
|
15%
|
|
Committed
and Un-priced (%)4
|
3%
|
14%
|
|
West
|
0%
|
0%
|
|
Eastern
Steam
|
3%
|
26%
|
|
Eastern
Met
|
15%
|
47%
|
|
West
- Cost of Coal Sales per Ton
|
$8.30 -
$8.90
|
|
|
East
- Cost of Coal Sales per Ton
|
$54.00
-
$57.00 |
|
|
Selling,
General & Administrative
Expense |
$150 -
$165
|
|
|
Depletion,
Depreciation &
Amortization |
$370 -
$390
|
|
|
Interest
Expense
|
$70 -
$80
|
|
|
Capital
Expenditures
|
$340 -
$390
|
|
23
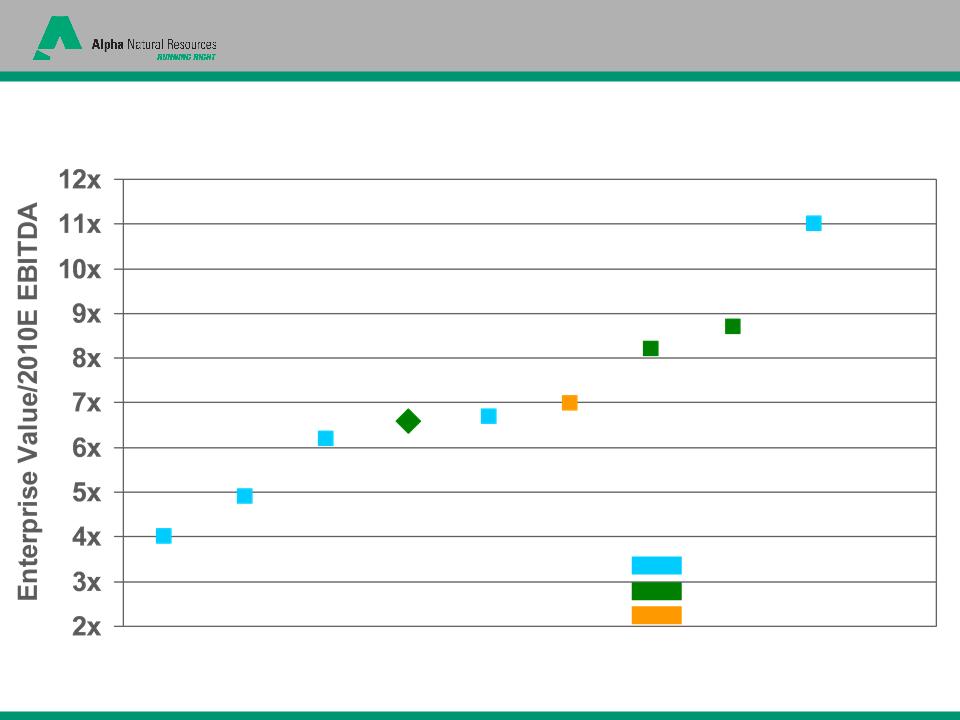
Recent
Valuation Comparison 2/19/10
Notes:
Market data and First Call consensus 2010 EBITDA estimates as of
2/19/10
< 50
MM TPY, regional
> 50
MM TPY, diversified
> 50
MM TPY, regional
Compelling Relative
Valuation
ANR

24
Coal
Industry Themes
v Strong met coal
pricing driven by growing
Asian demand
Asian demand
v Met coal tightness
increasing in the Atlantic
basin as economic recovery continues
basin as economic recovery continues
v Significant utility
inventory draw - U.S.
thermal market positioned to strengthen
thermal market positioned to strengthen
v Future worldwide
demand for thermal coal
anticipated to strain seaborne supply
anticipated to strain seaborne supply
ü ANR
is the largest supplier of met coal in the
U.S. and anticipates sales into Asia in 2010
U.S. and anticipates sales into Asia in 2010
ü ANR
is the largest exporter of met coal with 13
-14 MTs of export terminal capacity
-14 MTs of export terminal capacity
ü ANR’s
operations in NAPP, CAPP and PRB
can respond quickly to increased demand
can respond quickly to increased demand
ü Low-cost
production and export capacity
enable ANR to participate in global thermal
demand
enable ANR to participate in global thermal
demand

25
25
Appendices
26
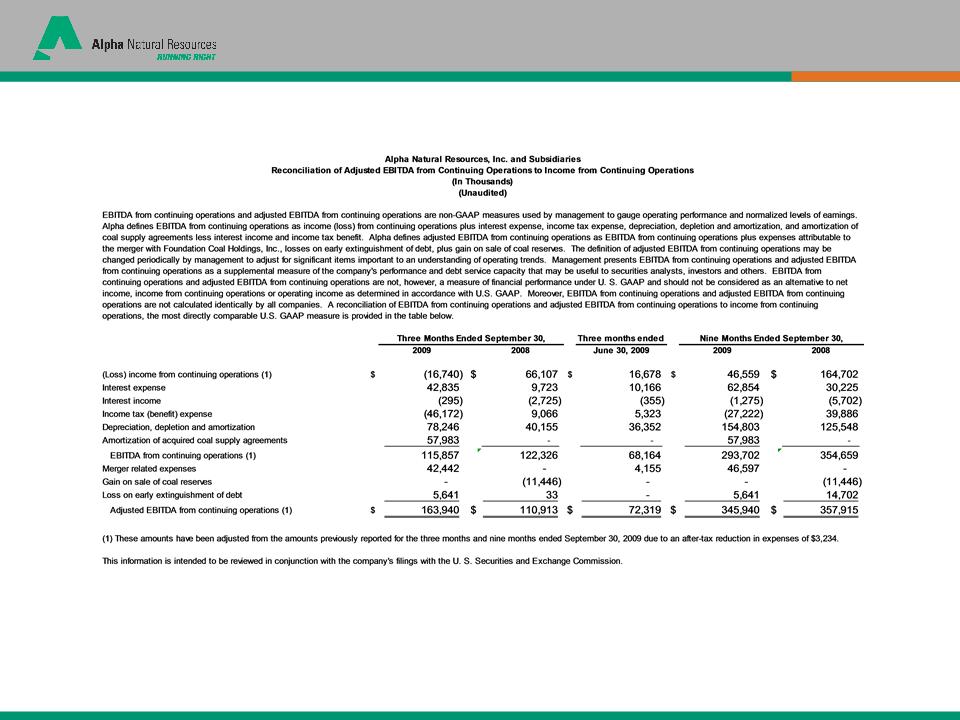
3Q09 Reconciliation of Adjusted EBIDTA

27
3Q09 Reconciliation of Adjusted Income
28
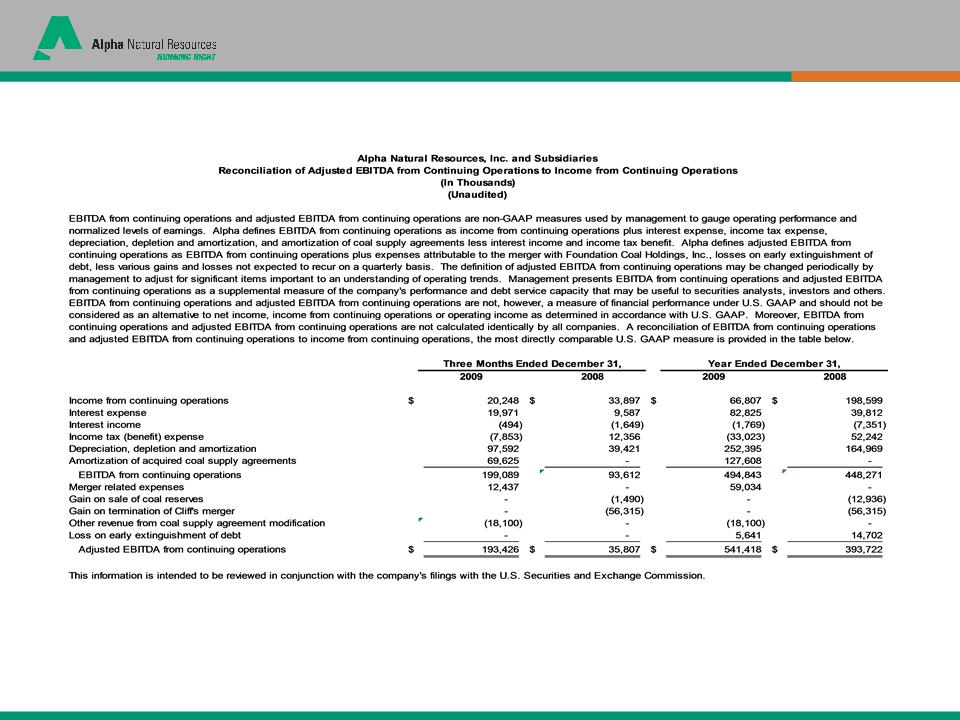
4Q09 Reconciliation of Adjusted EBIDTA

29
4Q09 Reconciliation of Adjusted Income

30
www.alphanr.com