Attached files
UNITED
STATES
SECURITIES
AND EXCHANGE COMMISSION
WASHINGTON,
D.C. 20549
FORM
10-K
|
(Mark
One)
|
|
|
x
|
ANNUAL
REPORT PURSUANT TO SECTION 13 OR 15(d) OF THE SECURITIES EXCHANGE ACT
OF 1934
|
|
FOR
THE FISCAL YEAR ENDED DECEMBER 31, 2009
OR
|
|
|
o
|
TRANSITION
REPORT PURSUANT TO SECTION 13 OR 15(d) OF THE SECURITIES EXCHANGE ACT
OF 1934
|
|
FOR
THE TRANSITION PERIOD
FROM TO
COMMISSION
FILE NUMBER 0-28218
|
|
AFFYMETRIX, INC.
(Exact
name of registrant as specified in its charter)
|
DELAWARE
(State
or other jurisdiction of
incorporation
or organization)
|
77-0319159
(IRS
Employer Identification Number)
|
|
3420
CENTRAL EXPRESSWAY
SANTA
CLARA, CALIFORNIA
(Address
of principal executive offices)
|
95051
(Zip
Code)
|
|
(408) 731-5000
(Registrant’s
telephone number, including area code)
|
|
|
Securities
registered pursuant to Section 12(b) of the
Act:
|
|
|
Title
of Each Class
Common
Stock, $0.01 par value
Preferred
Stock Purchase Rights
|
Name
of Each Exchange on Which Registered
The
Nasdaq Global Select Market
The
Nasdaq Global Select Market
|
Securities
registered pursuant to Section 12(g) of the Act:
None
Indicate
by check mark if the registrant is a well-known seasoned issuer, as defined in
Rule 405 of the Securities Act. Yes o No x
Indicate
by check mark if the registrant is not required to file reports pursuant to
Section 13 or Section 15(d) of the Act. Yes o No x
Indicate
by check mark whether the registrant (1) has filed all reports required to
be filed by Section 13 or 15(d) of the Securities Exchange Act of 1934
during the preceding 12 months (or for such shorter period that the
registrant was required to file such reports), and (2) has been subject to
such filing requirements for the past 90 days. Yes x No o
Indicate
by check mark whether the registrant has submitted electronically and posted on
its corporate Web site, if any, every Interactive Data File required to be
submitted and posted pursuant to Rule 405 of Regulation S-T (§ 232.405 of this
chapter) during the preceding 12 months (or for such shorter period that the
registrant was required to submit and post such files). Yes o No o
Indicate
by check mark if disclosure of delinquent filers pursuant to Item 405 of
Regulation S-K is not contained
herein, and will not be contained, to the best of registrant’s knowledge, in
definitive proxy or information statements incorporated by reference in
Part III of this Form 10-K or any amendment to this
Form 10-K. x
Indicate
by check mark whether the registrant is a large accelerated filer, an
accelerated filer, a non-accelerated filer, or a smaller reporting company. See
the definitions of “large accelerated filer,” “accelerated filer” and “smaller
reporting company” in Rule 12b-2 of the Exchange Act. (Check
one):
|
Large
accelerated filer o
|
Accelerated
filer x
|
|
Non-accelerated
filer o
(Do not check if a smaller reporting company)
|
Smaller
reporting company o
|
Indicate
by check mark whether the registrant is a shell company (as defined in
Rule 12b-2 of the Exchange Act). Yes o No x
The
aggregate market value of the registrant’s common stock held by non-affiliates
of the registrant at June 30, 2009, based on the closing price of such
stock on the Nasdaq Global Select Market on such date, was approximately $413
million. The number of shares of the registrant’s Common Stock outstanding on
February 22, 2010 was 70,901,491.
DOCUMENTS
INCORPORATED BY REFERENCE
Certain
sections of the Proxy Statement to be filed in connection with the 2010 Annual
Meeting of Stockholders are incorporated by reference into Part III of this
Form 10-K where indicated.
FORM
10-K
DECEMBER
31, 2009
TABLE
OF CONTENTS
|
Item
No.
|
Page
|
||||||
| 3 | |||||||
| 1. | 3 | ||||||
| 1A. | 15 | ||||||
| 1B. | 25 | ||||||
| 2. | 26 | ||||||
| 3. | 26 | ||||||
| 4. | 26 | ||||||
| 26 | |||||||
| 5. | 26 | ||||||
| 6. | 28 | ||||||
| 7. | 29 | ||||||
| 7A. | 43 | ||||||
| 8. | 44 | ||||||
| 9. | 80 | ||||||
| 9A. | 80 | ||||||
| 9B. | 82 | ||||||
| 82 | |||||||
| 10. | 82 | ||||||
| 11. | 82 | ||||||
| 12. | 82 | ||||||
| 13. | 82 | ||||||
| 14. | 83 | ||||||
| 83 | |||||||
| 15. | 83 | ||||||
| 87 | |||||||
Forward-Looking
Statements
All
statements in this Annual Report on Form 10-K that are not historical are
"forward-looking statements" within the meaning of the federal securities laws.
These include statements regarding our "expectations," "beliefs," "hopes,"
"intentions," "strategies" or the like. Such statements are based on our current
expectations and are subject to a number of factors and uncertainties that could
cause actual results to differ materially from those described in the
forward-looking statements. We cannot assure you that actual results or business
conditions will not differ materially from those projected or suggested in such
forward-looking statements as a result of various factors, including, but not
limited to, those discussed in "Risk Factors" contained in Item 1A of this
Annual Report on Form 10-K. Unless required by law, we do not undertake to
release publicly any updates or revisions to any forward-looking statements
contained herein to reflect any change in our expectations with regard thereto
or any change in events, conditions, or circumstances on which any such
statements are based.
Overview
We
develop, manufacture and sell products and services for genetic analysis to the
life science research and clinical healthcare markets. Researchers around the
world use our technology to better understand the role that genes play in
disease, the effectiveness and safety of therapies and many other biological
factors that affect human well-being. We sell our products to some of the
world’s largest pharmaceutical, diagnostic and biotechnology companies, as well
as leading academic, government and not-for profit research institutions. More
than 21,000 peer-reviewed papers have been published based on work using our
products. We have approximately 1,000 employees worldwide and maintain sales and
distribution operations across the United States, Europe and Asia.
We were
incorporated in California in 1992 and reincorporated
in
Delaware in 1998. Our principal executive offices are located at 3420 Central
Expressway, Santa Clara, CA 95051. Our telephone number is (408)
731-5000.
Our
Strategy
Our
objective is to be the leading provider of genotyping and gene expression
products for the analysis of genetic variation. The key elements of our strategy
are:
|
·
|
Expanding into new
markets. Our goal is to generate top-line revenue growth by
successfully commercializing our technologies and expanding our customer
base, including by leveraging our established and newly acquired
technologies to enter new markets. We believe that we can expand our
position in the genotyping market with our new AxiomTM
Genotyping Solution. We believe that this market will continue to be one
of the most attractive growth opportunities in life sciences and new
content packaged in versatile formats will drive growth. Other
opportunities include emerging cytogenetic and copy number diagnostics and
our Drug Metabolizing Enzymes and Transporters product, which we believe
addresses a significant unmet need of our pharmaceutical partners. We see
opportunities in applications that are downstream from genome-wide
analysis, particularly in validation and routine testing where our
QuantiGene line of products is used for biomarker
validation.
|
|
·
|
Re-engineering our technology
platform. We intend to combine automated instrumentation, powerful
new biological assays, and new array designs and content to significantly
expand our product line. The new GeneTitan® System, our next generation
mid-to-high end instrumentation platform enables significantly increased
efficiency and throughput for researchers conducting array-based
experiments. This fully automated solution enables higher data quality by
removing or minimizing many of the sources of variation in the laboratory.
We expect to commercially release GeneAtlasTM
in 2010, targeted at new and novice users of microarray technology. With
these instruments we also introduced an alternative format, the peg array
plate, to our cartridge based consumables. We intend to provide an
expanded menu of gene expression and genotyping applications for our peg
array plates.
|
|
·
|
Improving operating
leverage. We expect to see positive operating income in fiscal 2010
as we continue to control costs and work to generate increased revenues.
In 2009, we completed a restructuring plan designed to optimize our
production capacity and cost structure to enable us to decrease our cost
of manufacturing and operating expenses by moving our probe array
manufacturing to our Singapore facility, consolidating our reagent
manufacturing to our Cleveland facility and outsourcing our instrument
manufacturing operations. Additionally, our new peg array plate formats
have lower manufacturing costs than the cartridge-based formats. We also
expect to incur lower operating expenses as we fully integrate our
acquisitions of USB and Panomics and complete the re-engineering of our
technology platform.
|
Our
Markets
The market for genetic analysis tools
are divided into two primary segments: (1) the discovery and exploration markets
and (2) the validation and routine testing markets.
In the discovery and exploration
markets:
|
·
|
the
customer typically is a research
scientist;
|
|
·
|
funding
comes from a variety of public and private
sources;
|
|
·
|
research
is project-driven and the project is typically short, but can range from a
few months to about two years; and
|
|
·
|
the
required technology generally must enable large-scale, high-complexity
analysis of genetic variation and biological
function.
|
Our
products for large scale genotyping and gene expression applications serve
customers in the exploration markets which include academic research centers,
government agencies, private research foundations, clinical and industrial
reference laboratories and the research departments of pharmaceutical
companies.
In the
validation and routine-testing markets:
|
·
|
the
customers include product development scientists and clinicians at
pharmaceutical, diagnostic companies or
hospitals;
|
|
·
|
funding
largely comes from operations or
financing;
|
|
·
|
products
are used in the validation of workflows, once validated, products will be
used in repetitive testing and therefore generate recurring revenue;
and
|
|
·
|
the
required technology generally must enable cost-effective, flexible
analysis of significantly fewer genetic and biological
markers.
|
Our
products for genotyping and gene expression applications serve the validation
and routine testing markets. In particular, our genotyping products
with molecular diagnostics applications, our targeted genotyping products and
our low- to mid-plex gene expression products target the validation and routine
markets. Our customers in the validation and routine testing markets include
pharmaceutical, biotechnology, agrichemical, diagnostics, industrial and
consumer products companies.
We
believe the validation and testing markets are more likely to generate recurring
revenue and are growing at a higher compound annual growth rate than the
discovery market. We expect that the following factors, among others, will
influence the size and development of the markets served by our
technologies:
|
·
|
the
availability of genomic sequence and sequence variation data for the human
population and for other organisms;
|
|
·
|
technological
innovation that increases throughput and lowers the cost of genomic and
genetic analysis;
|
|
·
|
the
development of new computational techniques to handle and analyze large
amounts of genomic data;
|
|
·
|
the
availability of government funding for basic and disease-related research;
|
|
·
|
the
amount of capital and ongoing expenditures allocated to research and
development and outsourced spending by biotechnology, pharmaceutical and
diagnostic companies for products and
services;
|
|
·
|
the
application of genomics to new areas including molecular diagnostics,
agriculture, human identity and consumer goods;
and
|
|
·
|
the
availability of genetic markers and signatures of diagnostic
value.
|
Scientific
Background
Introduction
to the Genome and its Opportunity
In the
years following the completion of the Human Genome Project in 2003, an explosion
of research in genome structure, function and variation has led to an
understanding that human genetic variation is common and takes on many
structural forms. Among individual humans, genetic variation ranges from single
nucleotide changes to gross alterations of entire chromosomes. Subsequent
efforts to identify and catalog human genetic variation, including the HapMap
Project and the 1000 Genomes Project, continue to generate tremendous amounts of
information that is made freely and quickly available to the public. Genetic
variation accounts for many of the differences between individuals, such as eye
color and blood group, and also affects a person’s susceptibility to certain
diseases including cancer, diabetes, stroke and Alzheimer’s disease. Genetic
variation can also determine a person’s response to drug therapies.
Understanding the genome helps us understand the inheritance of biological
characteristics.
We believe that
this will lead to a new healthcare paradigm where disease is understood at the
molecular level, allowing patients to be diagnosed according to genetic
information and then treated with drugs designed to work on specific molecular
targets.
All known
genomes are composed of either deoxyribonucleic acid (“DNA”) or ribonucleic acid
(“RNA”). The human genome is composed of DNA and RNA. The instructions required
for every living cell to develop its characteristic form and function are
believed to be represented within discrete regions of the genome known as genes.
DNA molecules consist of two long complementary strands held together by base
pairs. Four nucleotide bases—adenine-A, cytosine-C, guanine-G and thymine-T form
the chemical building blocks of DNA. The two DNA strands are held together by
hydrogen bonds between nucleotide bases on one strand to complementary
nucleotide bases on the other strand. Only certain pairs of the bases can form
these complementary bonds: C pairs with G, and A pairs with T. Therefore, a
single DNA strand containing bases in the sequence CGTACGGAT can form a
bond with a DNA strand containing bases in the sequence GCATGCCTA. Such paired
DNA strands are said to be "complementary" and can form a double helix
structure in a process called "hybridization." Our technology uses the principle
of hybridization to recognize the presence of specific gene sequences and to
analyze genetic information.
Through
the process of transcription RNA, copies of the DNA are made from the regions
containing genes. Many copies of RNA can be made from each DNA region. The
amount of RNA made from any given gene is a measure of the expression level of
that gene. Many copies of RNA can be made from the same region of DNA. In the
cell, RNA is typically single-stranded, while DNA is double-stranded. One type
of RNA, the messenger RNA ("mRNA") is central to protein synthesis. There are
RNAs with other roles, such as regulating which genes are expressed and carrying
genetic information of viruses.
Genotyping
Genotyping
is the process of determining the genetic constitution of a cell, organism or
individual in order to determine how it is specialized or differs from a group.
Typically, each cell in an individual contains a complete copy of its genome. In
a population, individuals vary from one another because of differences in gene
sequences which are inherited from each parent and sometimes through the
introduction of sequence changes due to environmental damage or biological
errors in processes like gene replication. Common forms of genetic variation
include single-nucleotide polymorphisms, or SNPs, and copy number variations, or
CNVs. A SNP is a variation in a single position in a DNA sequence and a CNV is a
variation in the number of copies of a segment of the DNA.
Genotyping
is a valuable tool for studying genetic contributions to diseases and the
efficacy of drug therapies in specified patient populations. While, in some
cases, genetic variations, or polymorphisms, have little detectable effect on
the biology of the organism, in other cases they may result in a predisposition
to disease or an altered biological response to the environment. By screening
for these polymorphisms, researchers seek to identify those that might be
implicated in specific diseases. Sometimes it is not a single SNP or CNV, but
the combination of certain variations, that leads to a diseased state. For this
reason, researchers look at the patterns of these polymorphisms in a large
number of healthy and diseased individuals in order to correlate specific
variants with specific diseases or phenotypes. Large scale genotyping can be
used, for example, in studies designed to elucidate the genetic contributions to
disease and in clinical trials to categorize drug responses.
Gene
Expression Monitoring
Gene
expression monitoring is the process of determining which genes are active in a
specific cell or group of cells. Timing and level of gene expression is an
important mechanism by which the fate and function of cells are regulated.
Although most cells contain an organism's full set of genes, each cell expresses
only a subset of genes at any given time and the level of expression also varies
with the state of that cell. The expression pattern or profile of genes can be
correlated with many human diseases such as cancer, as well as with the
effectiveness of treatment in specific patient populations. By identifying genes
that are differentially expressed in particular diseases or patient populations,
novel molecular targets and treatments may be identified and validated. In
addition, gene expression signatures may be identified that provide early
identification of a predisposition to disease or allow the selection of
treatments optimized for an individual.
Gene
expression monitoring is a valuable tool for identifying correlations between
genes, determining their biological functions and identifying patterns that
might be useful in classifying diseases. To monitor gene expression, we design
and manufacture arrays with single-stranded DNA molecules that are complementary
to sequences within genes or exons of interest. By synthesizing specific probes
for multiple genes or exons on a single probe array, we enable researchers to
quickly, quantitatively and simultaneously monitor the expression of a large
number of genes or exons of interest. By monitoring the expression of such genes
under different conditions and at different times, researchers can use the
arrays to understand the dynamic relationship between gene expression and
biological activity. We believe such information will be an important tool in
understanding gene function and for the development of new drugs and diagnostic
tools. Increasingly, clinical research is showing that gene expression patterns
in tissue samples, particularly those from cancerous tissues, can be used to
characterize disease sub-types and hopefully to predict therapeutic responses
and likely outcomes.
In order
to understand the impact of genomics on health, disease and other aspects of the
human condition, scientists must compare both the sequence variation and the
gene expression patterns of healthy and diseased individuals, tissues and cells.
The use of arrays to identify correlations of gene expression patterns and
sequence variation with specific diseases is expected to become increasingly
important for gene marker validation, exploration and routine testing for
diagnosis of disease.
Our
Technologies
Array
Technology
Our array
technology leverages semiconductor-based photolithographic fabrication
techniques, which enables us to synthesize a large variety of predetermined DNA
sequences simultaneously in predetermined locations on a small glass chip called
an "array."
Photolithography
is a technique which uses light to create exposure patterns on the glass chip
and to direct chemical reactions. The process begins by coating the chip with
light-sensitive chemical compounds that prevent chemical coupling. These
light-sensitive compounds are called "protecting groups." Lithographic masks,
which consist of predetermined transparent patterns etched into a glass plate
that block or transmit light, are used to selectively illuminate the glass
surface of the chip. Only those areas exposed to light are deprotected, and thus
activated for chemical coupling through removal of the light-sensitive
protecting groups. The entire surface is then flooded with a solution containing
the first in a series of DNA building blocks (A, C, G or T). Coupling only
occurs in those regions that have been deprotected through illumination. The new
DNA building block also bears a light-sensitive protecting group so that the
cycle can be repeated.
This
process of exposure to light and subsequent chemical coupling can be repeated
many times on the same chip in order to generate a complex array of DNA
sequences of defined length. The intricate illumination patterns allow us to
build high-density arrays of many diverse DNA sequences in a small area. Unlike
conventional synthesis techniques, which generally use a linear process to
create compounds, our synthesis technique is combinatorial, in that the number
of different compounds synthesized grows exponentially with the number of cycles
in the synthesis. Currently, our commercial arrays contain over six million
unique sequences. Each unique sequence is 25 to 50 nucleotides in length and is
represented millions of times within a specified area of the array. Just as in
the semiconductor industry, we manufacture arrays in a wafer format. Each wafer
is approximately five inches square and can contain over 300 million unique
probe sequences based on current technology. For our commercial array products,
we can manufacture a large number of identical or different DNA probe arrays on
a glass wafer, which is then diced into individual chips. The number of chips
manufactured per wafer can be varied depending on the desired amount of
information on each chip. The chips can be packaged individually, in our
cartridge format, in our strip format or in our peg format. A strip format can
have four arrays packaged together on a strip and a peg format can have up to 96
arrays packaged together for automated and parallel processing. Given the large
amount of unique sequences represented in our arrays, our technology enables the
efficient analysis of a multitude of DNA probes to analyze DNA or RNA sequences
in a test sample.
The
function of each single-stranded sequence on our array is to bind to its
complementary single strand of DNA or RNA from a biological sample. Each unique
feature on the array contains multiple copies of the same single strand of DNA.
The nucleic acid (DNA or RNA) to be tested is isolated from a sample, such as
blood, saliva or biopsy tissue, amplified and prepared for hybridization to the
array. The test sample is then washed over the array, where the individual
nucleic acid sequences that represent the genetic content or expressed genes of
the sample hybridize to their complementary sequences bound on the array. The
molecules in the test sample may be labeled with fluorescent dye either before
or after hybridization. When scanned by a laser in the scanner instrument, the
test sample generates a fluorescent signal. The locations where a fluorescent
signal is detected by an optical detection system on the scanner instrument
correspond to sequences complementary to the test sample. Sequence variation, or
the quantification of specific sequences of nucleic acids in the sample, can be
determined by detecting the relative strength of these signals since the
sequence and position of each complementary DNA probe on the probe array is
known. The combination of a particular array, together with an optimized set of
reagents and a user protocol describing how to carry out the procedure, is
referred to as an "assay."
bDNA
Technology
We offer
customers a suite of assay products for a wide variety of low- to mid-plex
genetic, protein and cellular analysis applications using branched DNA, or bDNA,
technology. These assays measure RNA levels directly from samples using a novel
signal amplification method without the need for RNA purification, providing
customers with improved accuracy, scale and workflow relative to traditional
methods based on polymerase chain reaction, or PCR.
Our
Products
Overview
We offer
a comprehensive line of products for two principal applications: genotyping and
gene expression. The majority of our product sales consist of sales of
instruments and related consumables. Our GeneChip® and GeneTitan® families of
products are whole systems that include instruments, consumables and software.
We recently re-engineered our platform and launched our GeneTitan® family of
products. Our GeneChip® instruments run arrays packaged in cartridges and our
GeneTitan® instrument runs arrays packaged in a peg format for automated high
throughput processing.
Through
our acquisition of USB, we now offer a range of reagent kits that are compatible
with our platforms as well as the products of other vendors. Through our
acquisition of Panomics, we offer a variety of low-to mid-plex assays for gene
expression.
GeneChip®
Family of Products
Our
GeneChip® system provides an integrated solution for gene expression and
genotyping analysis. It consists of instruments and consumables that provide for
the robust preparation and analysis of samples using our GeneChip® cartridge
arrays. The components of the GeneChip® system include (1) disposable probe
arrays containing genetic information on a chip, (2) reagents for extracting,
amplifying and labeling target nucleic acids, (3) a fluidics station for
introducing the test sample to the probe arrays, (3) a hybridization oven for
optimizing the binding of samples to the probe arrays, (4) a scanner to read the
fluorescent image from the probe arrays, and (5) software to analyze and manage
the resulting genetic information.
Our major
GeneChip® instrument products include:
|
Product
|
Product
Description
|
|
GeneChip®
Scanner 3000
|
Instrument
for scanning higher-density arrays, including SNP arrays with up to
900,000 SNPs, tiling arrays
for
transcription and all-exon arrays for whole-genome
analysis.
|
|
GeneChip®
Scanner 3000Dx
|
This
instrument is a version of the GeneChip® Scanner 3000 that is cleared by
the United States Food and Drug
Administration as an in
vitro diagnostic device (“IVD”) for use and can be used in
conjunction with the Roche Diagnostics AmpliChip CYP450
Test.
|
|
GeneChip®
Fluidics Station
|
Instrument
for the wash and stain of GeneChip® arrays.
|
|
GeneChip®
Hybridization Oven
|
This
instrument provides temperature and rotation control to ensure the
successful hybridization of cartridge arrays before
scanning.
|
Our major
GeneChip® array and reagent products include:
| Product | Product Description |
|
Genotyping
Catalog Cartridge Arrays
|
· SNP 6.0 Array – This
single chip array is a robust tool for studying variation. It enables
genotyping of approximately 906,600 SNPs
and
assaying of
approximately
945,800 non-polymorphic
probes
for detection of copy number.
|
|
· 500K Set – The 500K Set
genotypes over 500,000 SNPs on a two array set.
|
|
|
· DMET™ Plus – This array
features drug markers in FDA-validated genes and enables discovery and
measurement of genetic
variation
associated with
drug response.
|
|
| · Universal Taq Arrays – These arrays enable targeted genotyping for the analysis of between 1,500 to 20,000 SNPs per sample. | |
|
Gene
Expression Catalog Cartridge Arrays
|
· U133 – This array
analyzes the expression level of over 47,000 transcripts and variants of
the human genome.
|
|
· Other Arrays – We also
offer a range of catalog expression arrays for the study of rat, mouse and
other mammalian and model
organisms.
|
|
|
Custom
Arrays
|
· MyGeneChip™
and CustomSeq™ products are custom expression and sequence arrays designed
by our customers to study
organisms
of interests to
them.
|
GeneTitan® Family of
Products
Our
GeneTitan® family of products consists of the GeneTitan® instrument system that
runs genotyping and gene expression array plates. The GeneTitan® family of
products provides a hands-free, automated solution for monitoring gene
expression and genome-wide SNP genotyping.
Our
GeneTitan® products include:
|
Product
|
Product
Description
|
|
GeneTitan®
|
The
GeneTitan® instrument automates array processing from target hybridization
to data generation by combining a hybridization oven, fluidics processing
and imaging device into a single bench-top instrument. It runs array
plates and supports both gene expression and genotyping
studies.
|
|
Axiom™
Genotyping Solution
|
The
Axiom™ Genotyping Solution includes array plates with validated genomic
content, complete reagent kits, data analysis tools and a fully automated
workflow utilizing the GeneTitan®.
· Axiom™ Human Array Plates –
these arrays are designed to maximize genomic coverage of common
and novel SNPs and insertions
and
deletions in Caucasian, Asian and African populations. We are currently
offering the Caucasian array plate and expect to offer the
others
later in 2010.
· Axiom™ Custom Arrays –
Customers can make custom arrays utilizing a proprietary database
of validated genomic markers.
|
|
Gene
Expression Array Plates
|
We
offer a catalog of gene expression array plates similar to our catalog
gene expression cartridge arrays. These arrays are available for the study
of human, rat, mouse and a broad range of other mammalian and model
organisms.
|
Low-
to Mid-plex Products
We also
offer an extensive line of multiplex assays to serve the both the discovery and
the validation markets. Multiplex assays measure many different targets from the
same sample. These products enable drug target identification through analysis
of gene silencing, cell signaling and biomarker validation. Our QuantiGene line
of products is based on bDNA technology and delivers quantitative gene
expression analysis. These products are compatible with a wide variety of
samples and tissues.
Reagents
We offer
researchers with an extensive line of reagent kits, enzymes and biochemicals.
Our reagents are complementary to our array portfolio, thus enabling us to
provide our customers with whole product solutions. In addition, they can be
applied to a broad variety of emerging technologies. Our reagents
include:
|
·
|
ExoSAP-IT® For PCR Product
Clean-Up, a reagent for the rapid clean-up of PCR products used in
downstream applications, such as DNA sequencing or SNP
analysis.
|
|
·
|
HotStart-IT® line of PCR
reagents, reagents that utilize a novel primer binding protein to
inhibit primer dimer formation, and results in sensitive and consistent
amplification for real-time PCR.
|
Our
Services
Our
Affymetrix Research Service Laboratory offers high-throughput genotyping
services for customers using our genotyping products. Our projects range in size
from a few hundred samples to over 10,000 samples. We serve customers requiring
quick turnaround times and suitably priced solutions to their large-scale
academic and consortia genotyping studies.
Our
Collaborative Partners
We
collaborate with our partners to expand the applications of our technology and
to acquire access to complementary technologies and resources. We collaborate
with a number of instrumentation and reagent companies to develop and supply
certain components of the user work flow. These companies include Beckman
Coulter, Inc., CapitalBio Corporation, Life Technologies, Inc., Genisphere LLC
and Qiagen GmbH.
Through
our Powered by Affymetrix™, or PbA Program, we permit commercial entities to
license our technologies to develop custom product solutions based upon our
arrays, instrumentation and software. Our PbA partners include F. Hoffman-La
Roche Ltd., bioMerieux, Inc. and Veridex, LLC, a Johnson &
Johnson company. We provide our PbA partners custom arrays. Our partners
subsequently package these arrays into kits, seek regulatory approval for their
diagnostic use, and sell them into the diagnostic markets using their sales
channels. An example is the PathChip, a gene expression
array used by our PbA partner Pathwork Diagnostics, Inc., in its Pathwork Tissue
of Origin test. In July 2008, the U.S. Food and Drug Administration (“FDA”)
cleared the Pathwork Tissue of Origin test for marketing. PathChip is the first
custom Affymetrix gene expression array to be cleared for diagnostic
use.
We also
collaborate with certain academic, government, and commercial research groups to
develop and validate new applications of our technologies. These include the
Broad Institute of Harvard, the Massachusetts Institute of Technology and the
National Genome Research Institute.
Sales
and Distribution
We market
and distribute our products directly to customers in North America, Japan and
major European markets. In these markets, we have our own sales, service and
application support personnel responsible for expanding and managing their
respective customer bases. In other markets, such as Mexico, India, the Middle
East and Asia Pacific, including the People’s Republic of China, we sell our
products principally through third party distributors that specialize in life
science supply. For molecular diagnostic and industrial applications market
opportunities, we supply our partners with arrays and instruments, which they
incorporate into diagnostic products and assume the primary commercialization
responsibilities.
Manufacturing
and Raw Materials
We
manufacture our consumables, including our arrays and reagents, and contract
with third parties to manufacture our instruments. In 2009, we closed our West
Sacramento facility and consolidated all of our array manufacturing to our
Singapore facility. We manufacture our reagents in our Cleveland, Ohio and
Fremont, California facilities, but will be closing our Fremont facility in 2010
and incorporating those functions into our Santa Clara facilities. We maintain a
pilot manufacturing and process engineering/development facility in Santa Clara,
California.
Our array
manufacturing process involves wafer preparation, probe synthesis, dicing of
synthesized wafers into chips, assembly of chips and quality control. We have
developed software programs that extensively automate the design of
photolithographic masks used in array manufacturing and that control the array
manufacturing lines. Glass wafers are prepared for synthesis through the
application of chemical coatings. Arrays are synthesized on the wafers using our
proprietary, combinatorial photolithographic process. The completed wafers can
then be diced into chips. The chips can be packaged individually, in our
cartridge format, in our strip format or in our peg format.
We offer
a variety of reagents to our customers, including those that are manufactured
in-house, those that are supplied by qualified third-party suppliers and a
combination of the two.
Our
Singapore facility is fully operational and has been certified to ISO 13485
standards. The Singapore facility operates under the strict standards of our
corporate quality plan. In 2009, we certified a portion of our Cleveland, Ohio
operations to these standards. We intend to certify the remaining portions of
the Cleveland, Ohio operations to these standards in 2010. Third parties who
manufacture our instruments will have to meet our quality standards as part of
the qualification process.
Key parts
of our product lines, such as our GeneTitan® instrument and hybridization ovens,
are available from single sources. Likewise, certain raw materials or components
used in the synthesis of arrays or the assembly of instrumentation are currently
available only from a single source or limited sources. Alternative sources of
supply may be time consuming and expensive to qualify. In addition, we are
dependent on our vendors to provide components of appropriate quality and
reliability, and to meet applicable regulatory requirements. We take what we
believe are appropriate measures to prevent the delay or interruption of
supplies from these vendors and to ensure the appropriate quality for our
customers, since any delay or interruption could delay our ability to deliver
our products to our customers.
Research
and Development
We
believe that a substantial investment in research and development is essential
to a long-term sustainable competitive advantage and critical to expansion into
the validation and routine testing markets. Our research and development effort
is divided into the major areas of basic research, product research and
development, and manufacturing technology development. Research efforts are
carried out through our Affymetrix Research Laboratories to further advance our
platform and develop new concepts and applications that can be commercialized to
grow our business. Our product development efforts are focused primarily on the
development of new array, assay and reagent products, improving the overall
performance of our assays, increasing the information capacity per probe array
and simplifying highly complex assays. We are also actively engaged in research
aimed at enhancing the manufacturing process currently employed in the
production of our arrays.
Our
research and development expenses for the years ended December 31, 2009,
2008 and 2007 were $77.4 million, $84.5 million and $72.7 million,
respectively.
Intellectual
Property
We rely
on a combination of patent, copyright, and trade secret laws, know-how and
licensing opportunities to establish and protect our proprietary technologies
and products. Our success depends
in part on our
ability to obtain patent protection for our products and processes, to preserve
our copyrights and trade secrets, to operate without infringing the proprietary
rights of third parties and to acquire licenses related to enabling technology
or products used with our technology.
We are
pursuing a patent strategy designed to facilitate our research and development
program and the commercialization of our current and future products. While no
one patent is considered essential to our success, we aggressively seek to
protect our patent rights as our patent portfolio as a whole is material to the
success of the business.
There are
a significant number of United States and foreign patents and patent
applications in our areas of interest, and we believe that there will continue
to be significant litigation in the industry regarding patent and other
intellectual property rights. Others have filed, and in the future are likely to
file, patent applications that are similar or identical to ours or those of our
licensors. It may be necessary for us to enter into litigation to defend against
or assert claims of infringement, to enforce patents issued to us, to protect
trade secrets or know-how owned by us or to determine the scope and validity of
the proprietary rights of others. To determine the priority of inventions, it
may be necessary for us to participate in interference proceedings declared by
the United States Patent and Trademark Office. Litigation or interference
proceedings could result in substantial costs to and distraction from our core
business and our efforts in respect to such proceedings may not be successful.
For further information regarding intellectual property litigation involving us,
see “Item 8. Financial Statements and Supplementary Data—Note 13.
Commitments and Contingencies” in this Annual Report on Form 10-K.
We also
rely upon copyright and trade secrets to protect our confidential and
proprietary information. We seek to protect our proprietary technology and
processes by confidentiality agreements with our employees and certain
consultants and contractors. These agreements may be breached, we may not have
adequate remedies for any breach and our trade secrets may otherwise become
known or be independently discovered by competitors. To the extent that our
employees or our consultants or contractors use intellectual property owned by
others in their work for us, disputes may also arise as to the rights in related
or resulting know-how and inventions.
We are
party to various option, supply and license agreements with third parties which
grant us rights to use certain aspects of our technologies. We take such
measures as we believe are appropriate to maintain rights to such technology
under these agreements. In addition, our academic collaborators have certain
rights to publish data and information in which we have rights. There is
considerable pressure on academic institutions to publish discoveries in the
genetics and genomics fields. We take such steps as we believe are appropriate
to ensure that such publication will not adversely affect our ability to obtain
patent protection for information in which we may have a commercial
interest.
Competition
The
markets for our products are characterized by rapidly changing technology,
evolving industry standards, changes in customer needs, emerging competition,
new product introductions and strong price competition. We face significant
competition as existing companies develop new or improved products and as new
companies enter the market with new technologies.
In the
highly multiplexed genotyping and gene expression markets, existing competitive
technologies include gel-based sequencing using instruments provided by
companies such as Beckman Coulter, Inc. and Life Technologies. Other
companies developing or marketing competitive DNA array technology include
Illumina, Agilent Technologies, BD Biosciences, CombiMatrix, MDS Analytic
Technologies and Sequenom, some of which offer products directly competitive
with our microarrays
. In the low to midplex genotyping and
gene expression markets, much of the existing low-plex competition comes from
the supplier of realtime PCR products, including Life Technologies, who has a
dominant position, Roche, Agilent Technologies and BioRad. In addition, there
are new midplex technologies being offered by Fluidigm, Sequenom, HTG, Beckman
Coulter, NanoString and Life Technologies (BioTrove). In order to compete
against existing and emerging technologies, we will need to demonstrate that our
products have superior throughput, cost and accuracy advantages over competing
products.
In the
molecular diagnostic field, competition may likely come from established
diagnostic companies, companies developing and marketing DNA probe tests for
genetic and other diseases, and other companies conducting research on new
technologies to ascertain and analyze genetic information. The market for
molecular diagnostic products derived from gene discovery is highly competitive
and has high barriers of entry, with several large corporations already having
significant market share. Established diagnostic companies such as Beckman
Coulter, Becton Dickinson, bioMérieux, Johnson & Johnson and Roche have
the strategic commitment to diagnostics, the financial and other resources to
invest in new technologies, substantial intellectual property portfolios,
substantial experience in new product development, regulatory expertise,
manufacturing capabilities and the distribution channels to deliver products to
customers. Established diagnostic companies also have an installed base of
instruments in several markets, including clinical and reference laboratories,
which are not compatible with our system and could slow acceptance of our
products. In addition, these companies have formed alliances with genomics
companies which provide them access to genetic information that may be
incorporated into their diagnostic tests.
Future
competition in existing and potential markets will likely come from existing
competitors as well as other companies seeking to develop new technologies for
sequencing and analyzing genetic information. We expect new competitors and
technologies to emerge. In addition, pharmaceutical and biotechnology companies
have significant needs for genomic information and may choose to develop or
acquire competing technologies to meet these needs themselves. We have
significantly expanded our network of approved service providers in America,
Japan, Europe, and China. While these companies expand the reach of Affymetrix
technology and make its analytical power available to a wider base of users they
may act as a substitute for outright purchase of instruments and arrays by those
end users. In addition, we have several other third-party licensees that could
offer products that compete with our product offerings.
Government
Regulation
Many of
our products are labeled for research use only. Even where a product
is exempted from clearance or approval by the FDA, the FDA may impose
restrictions as to the manner in which we can market and sell our products
and/or the types of customers to which we can market and sell our
products.
Our
GeneChip® Scanner 3000Dx is approved by the FDA to be used in conjunction with
approved medical devices such as the Roche Diagnostics AmpliChip CYP450 Test. We
will continue to develop diagnostic products ourselves or with our collaborative
partners that may require regulatory approval by governmental agencies.
Commercially available diagnostic tests are regulated as medical devices and are
generally subject to rigorous testing and other approval procedures by the FDA
in the U.S. and by other regulatory agencies in other countries. The FDA's
Quality System Regulations also apply in connection with our manufacture of
arrays and systems as components for use in diagnostic products distributed
outside of the research environment. Obtaining these clearances or approvals and
the compliance with these regulations require the expenditure of substantial
resources over a significant period of time, and we cannot assure you that any
clearances or approvals will be granted on a timely basis, if at all. Once
granted, a clearance or approval may place substantial restrictions on how the
device is marketed or labeled or to whom it may be sold. In addition, various
federal and state statutes and regulations govern or influence the
manufacturing, safety, and storage of our products and components of our
products as well as our record keeping.
The FDA,
the U.S. Department of Health and Human Services, the States of California and
New York, and foreign government regulators are increasingly focused on genetic
analysis tools, including the use of microarrays that are labeled for research
use only by clinical labs, including labs certified under the Clinical
Laboratory Improvement Amendments, or CLIA, or California or New York State
laboratory regulations. We cannot predict the nature of future regulatory
or policy initiatives with respect to the sale and use of arrays for the
development of assays by CLIA laboratories, or the extent to which such
initiatives will impact our business. If new regulations restrict our customers’
development of laboratory-developed tests using our products labeled for
research use only, or if we otherwise are required to obtain FDA premarket
clearance or approval prior to commercializing these products, our ability to
generate revenue from the sale of our products may be delayed or otherwise
adversely affected. Moreover, our failure to comply with governmental rules and
regulations related to our products could cause us to incur significant adverse
publicity, or subject us to investigations and notices of non-compliance or lead
to fines or restrictions upon our ability to sell our products.
Medical
device laws and regulations are also in effect in many countries, including
countries in the European Union, ranging from comprehensive device approval
requirements to requests for product data or certifications. The number and
scope of these requirements are increasing. We may not be able to obtain
regulatory approvals in such countries or may incur significant costs in
obtaining or maintaining our foreign regulatory approvals. In addition, the
export by us of certain of our products which have not yet been cleared for
domestic commercial distribution may be subject to FDA or other export
restrictions.
We have
agreements relating to the sale of our products to government entities and, as a
result, we are subject to various statutes and regulations that apply to
companies doing business with the government. A failure to comply with these
regulations might result in suspension of these contracts or administrative
penalties, and could have a material adverse effect on our ability to compete
for future government grants, contracts and programs.
Reimbursement
The
design of our products and the potential market for their use may be directly or
indirectly affected by U.S. and other government regulations governing
reimbursement for clinical testing services. The availability of third-party
reimbursement for our products and services may be limited or uncertain,
particularly with respect to genetic tests and other clinical applications
products.
Third-party
payers may deny reimbursement if they determine that a prescribed health care
product or service has not received appropriate FDA or other governmental
regulatory clearances, is not used in accordance with cost-effective treatment
methods as determined by the payer, or is deemed by the third-party payer to be
experimental, unnecessary or inappropriate. Furthermore, third-party payers are
increasingly challenging the prices charged for health care products and
services.
We are
currently developing diagnostic and therapeutic products, including those with
our collaborative partners which may be subject to reimbursement issues. The
commercialization of such products may depend, in part, on the extent to which
reimbursement for the cost of these products will be available under U.S. and
foreign regulations governing reimbursement for clinical testing services by
government authorities, private health insurers and other
organizations.
In the
United States, third-party payer price resistance, the trend towards managed
health care and legislative proposals to reform health care or reduce government
insurance programs could reduce prices for health care products and services,
adversely affect the profits of our customers and collaborative partners and
thus reduce our future royalties and product sales.
Environmental
Matters
We are
dedicated to compliance and protection of the environment and individuals. Our
operations require the use of hazardous materials (including biological
materials) which subject us to a variety of federal, state and local
environmental and safety laws and regulations. Some of the regulations under the
current regulatory structure allow for "strict liability," holding a party
potentially liable without regard to fault or negligence. We could be held
liable for damages and fines as a result of our, or others', business operations
should contamination of the environment or individual exposure to hazardous
substances occur. We cannot predict how changes in these laws or development of
new regulations will affect our business operations or the cost of
compliance.
Employees
As of
February 22, 2010, we had 989 full-time employees. The employee group includes
chemists, engineers, computer scientists, mathematicians and molecular
biologists with experience in the diagnostic products, medical products,
semiconductor, computer software and electronics industries. None of our
employees are represented by a collective bargaining agreement, nor have we
experienced work stoppages. Our success depends in large part on our ability to
attract and retain skilled and experienced employees.
Seasonality
Customer
demand for probe arrays and instrumentation systems is typically highest in the
fourth quarter of the calendar year as customers spend unused budget allocations
before the end of the year.
Backlog
Because
most customer orders are shipped in the quarter in which they are received, we
believe that backlog at quarter end is typically not a material indicator of
future sales. In addition, backlog may not result in sales because of
cancellation of orders or other factors. On a few occasions we have experienced,
and made public announcements about, short-term increases in backlog as a result
of factors such as new product introductions or supply constraints.
Financial
Information About Industry Segments
We
operate in one business segment, for the development, manufacture, and
commercialization of systems for genetic analysis in the life sciences and
diagnostic industry. Our operations are treated as one segment as we only report
operating information on a total enterprise level to our chief operating
decision-maker. Further, resource allocations are also made at the enterprise
level by our chief operating decision-maker.
Financial
Information About Geographic Areas
Our total
revenue from customers outside of the United States for fiscal years 2009, 2008
and 2007 was $136.8 million, $141.1 million and $173.6 million, or
approximately 42%, 34% and 47%, respectively, of our total revenue. A summary of
revenues from external customers attributed to each of our geographic areas for
the fiscal years ended December 31, 2009, 2008 and 2007, is included in
“Item 8. Financial Statements and Supplementary Data—Note 17. Segment and
Geographic Information”.
Available
Information
Our
internet address is www.affymetrix.com. Information included on our
website is not part of this Form 10-K. We make available free of charge on
our website our annual reports on Form 10-K, quarterly reports on
Form 10-Q, current reports on Form 8-K, and all amendments to those
reports as soon as reasonably practicable after such material is electronically
filed with or furnished to the SEC. In addition, copies of our annual reports
are available free of charge upon written request. The SEC also maintains an
Internet site that contains reports, proxy and information statements, and other
information regarding issuers that file electronically with the SEC. The address
of that site is www.sec.gov.
In
evaluating our business, you should carefully consider the following risks, as
well as the other information contained in this annual report on Form 10-K.
If any of the following risks actually occurs, our business could be
harmed.
Risks
Related to the Growth of Our Business
If
we do not continually develop and commercialize new or enhanced products and
services, our business may not grow.
Our
success depends in large part on our continual, timely development and
commercialization of new or enhanced products and services that address evolving
market requirements and are attractive to customers. The genetic analysis tools
market, including the RNA/DNA probe array field, is characterized by rapid and
significant technological changes, frequent new product introductions and
enhancements, evolving industry standards and changing customer needs.
Standardization of tools and systems for genetic research is still ongoing and
we cannot assure you that our products will emerge as the standard for genetic
research. Other companies may introduce new technologies, techniques, products
or services that render our products or services obsolete or uneconomical. If we
do not appropriately innovate and invest in new technologies, then our
technologies will become dated and our customers could move to new technologies
offered by our competitors.
As a
result, we are continually looking to develop, license or acquire new or
enhanced technologies, products and services to further broaden and deepen our
offerings. Some of the factors affecting market acceptance of our products and
services include:
|
·
|
availability,
quality and price as compared to competitive products and
services;
|
|
·
|
the
functionality of new and existing products and
services;
|
|
·
|
the
timing of introduction of our products and services as compared to
competitive products and services;
|
|
·
|
the
existence of product defects;
|
|
·
|
scientists’
and customers’ opinions of the utility of our products and services and
our ability to incorporate their feedback into future products and
services;
|
|
·
|
citation
of our products in published research;
and
|
|
·
|
general
trends in life science research and life science informatics software
development.
|
Our new
or enhanced technologies, products or services may not be accepted by customers
in our target markets. For example, once we have developed or
obtained a new technology, we may fail to successfully commercialize new
products and services based on that technology, particularly to the extent that
our new products and services compete with established technologies or the
products and services of more established competitors. Risks relating to product
adoptions include the inability to accurately forecast demand and difficulties
in managing different sales and support requirements due to the type or
complexity of the new products.
Our
growth depends in part on our ability to acquire new technologies, products and
services through additional acquisitions, which may absorb significant resources
and may not be successful.
As part
of our strategy to develop and identify new technologies, products and services,
we have made and may continue to make acquisitions. Our integration of the
operations of acquired businesses requires significant efforts, including the
coordination of information technologies, research and development, sales and
marketing, operations, manufacturing and finance. These efforts result in
additional expenses and divert significant amounts of management’s time from
other projects. Our failure to manage successfully and coordinate the growth of
the combined company could also have an adverse impact on our business. In
addition, there is no guarantee that some of the businesses we acquire will
become profitable or remain so. If our acquisitions do not meet our initial
expectations, we may record impairment charges, such as those recorded in
2008.
Factors
that will affect the success of our acquisitions include:
|
·
|
our
ability to retain key employees of the acquired
company;
|
|
|
·
|
the
performance of the acquired business, technology, product or
service;
|
|
|
·
|
our
ability to integrate operations, financial and other
systems;
|
|
|
·
|
the
ability of the combined company to achieve synergies among its constituent
companies, such as increasing sales of the combined company’s products and
services, achieving expected cost savings and effectively combining
technologies to develop new products and
services;
|
|
·
|
any
disruption in order fulfillment due to integration processes and therefore
loss of sales;
|
|
·
|
the
presence or absence of adequate internal controls and/or significant fraud
in the financial systems of acquired
companies;
|
|
·
|
any
decrease in customer and distributor loyalty and product orders caused by
dissatisfaction with the combined companies’ product lines and sales and
marketing practices, including price increases; and
|
|
|
·
|
our
assumption of known contingent liabilities that are realized, known
liabilities that prove greater than anticipated, or unknown liabilities
that come to light, to the extent that the realization of any of these
liabilities increases our expenses or adversely affects our business or
financial position.
|
Emerging
market opportunities in molecular diagnostics may not develop as quickly as we
expect and we depend on the efforts of our partners to be
successful.
The
clinical applications of our technologies for diagnosing and enabling
informed disease management options in the treatment of disease is an emerging
market opportunity in molecular diagnostics. At this time, we cannot be certain
that molecular diagnostic markets will develop as quickly as we expect. Although
we believe that there will be clinical applications of our technologies that
will be utilized for diagnosing and enabling informed disease management options
in the treatment of disease, there can be no certainty of the technical or
commercial success our technologies will achieve in such markets.
Our
success in the molecular diagnostics market depends to a large extent on our
collaborative relationships and the ability of our collaborative partners
to achieve regulatory approval for such products in the United States and
in overseas markets, and successfully market and sell products using our
technologies.
Risks
Related to Our Sales
We
face significant competition, and our failure to compete effectively could
adversely affect our sales and results of operations.
We
compete with companies that develop, manufacture and market genetic analysis
tools for the life science and clinical healthcare markets. We face significant
competition as our competitors develop new, improved or more economical products
and services and as new companies enter the market with new and innovative
technologies.
The
market for molecular diagnostics products and services is highly competitive,
has high barriers of entry, and has several other large companies with
significant market share. For example, companies such as Illumina, Agilent
Technologies and Life Technologies have products for genetic analysis that are
directly competitive with certain of our products. We also face competition from
established diagnostic companies such as Beckman Coulter, Becton Dickinson,
bioMérieux, Celera Diagnostics, Johnson & Johnson and Roche
Diagnostics, which have made strategic commitments to diagnostics, have
financial and other resources to invest in new technologies, and have
substantial intellectual property portfolios, substantial experience in new
product development, regulatory expertise,
Many of
our current and potential competitors have significantly greater financial,
technical, marketing and other resources than we do. In addition, many current
and potential competitors have greater name recognition, more extensive customer
bases and access to proprietary genetic content.
Consolidation trends in both our
market and that of our customers have increased
competition.
There has
been a trend toward industry consolidation in our markets for the past several
years. We expect this trend toward industry consolidation to continue as
companies attempt to strengthen or hold their market positions in an evolving
industry and as companies are acquired or are unable to continue operations. We
believe that industry consolidation may result in stronger competitors that are
better able to compete as sole-source vendors for customers. This could lead to
more variability in operating results and could harm our
business.
Additionally,
there has been a trend toward consolidation in many of the customer markets we
sell to, in particular the pharmaceutical industry. Consolidation in our
customer markets results in increased competition for important market segments
and fewer available accounts, and larger consolidated customers may be able to
exert increased pricing pressure on companies in our market.
Reduction
or delay in research and development budgets and government funding may
adversely impact our sales.
We expect
that our revenues in the foreseeable future will be derived primarily from
products and services provided to a relatively small number of academic,
governmental and other research institutions, as well as pharmaceutical and
biotechnology companies. Our operating results may fluctuate substantially due
to reductions and delays in research and development expenditures by these
customers.
Factors
that could affect the spending levels of our customers include:
|
·
|
weakness
in the global economy and changing market conditions that affect our
customers;
|
|
·
|
changes
in the extent to which the pharmaceutical industry may use genetic
information and genetic testing as a methodology for drug discovery and
development;
|
|
·
|
changes
in government programs that provide funding to companies and research
institutions;
|
|
·
|
changes
in the regulatory environment affecting life science companies and life
science research;
|
|
·
|
impact
of consolidation within the pharmaceutical industry;
and
|
|
·
|
cost
reduction initiatives of customers.
|
Government
funding of research and development is subject to the political process, which
is inherently unpredictable. In 2009, U.S. government funding for life science
research increased, due in part to the enactment of the American Recovery and
Reinvestment Act of 2009, which provided over $10 billion in research funding to
the National Institutes of Health (“NIH”) through September 2010. In October
2009, we announced that we entered into an agreement with the Kaiser Permanente
Research Program on Genes, Environment and Health and the University of
California at San Francisco to support genome-wide analyses of DNA samples from
over 100,000 Kaiser Permanente members, a program funded by a grant from the
NIH. Any shift away from the funding of life science research and development or
delays surrounding the approval of government budget proposals may cause our
customers to delay or forgo purchases of our products and services. Moreover, in
the short term, our customers may delay or reduce their purchases of our
products as they wait to learn whether, and to what extent, they will receive
stimulus funding. Additionally, if our customers are unable to obtain stimulus
funding they may reduce their research and development budgets, resulting in a
decrease in demand for our products. A reduction or delay in demand will reduce
our revenues and adversely affect our profitability.
If
we are unable to maintain our relationships with collaborative partners, we may
have difficulty developing and selling our products and services.
We
believe that our success in penetrating our target markets depends in part on
our ability to develop and maintain collaborative relationships with key
companies as well as with key academic researchers. Relying on our collaborative
relationships is risky to our future success because:
|
·
|
our
partners may develop technologies or components competitive with our
products and services;
|
|
·
|
our
existing collaborations may preclude us from entering into additional
future arrangements;
|
|
·
|
our
partners may not obtain regulatory approvals necessary to continue the
collaborations in a timely manner;
|
|
·
|
some
of our agreements may terminate prematurely due to disagreements between
us and our partners;
|
|
·
|
our
partners may not devote sufficient resources to the development and sale
of our products and services;
|
|
·
|
our
partners may be unable to provide the resources required for us to
progress in the collaboration on a timely
basis;
|
|
·
|
our
collaborations may be unsuccessful;
or
|
|
·
|
some
of our agreements have expired and we may not be able to negotiate future
collaborative arrangements on acceptable
terms.
|
The
size and structure of our current sales, marketing and technical support
organizations may limit our ability to sell our products and
services.
Although
we have invested significant resources to expand our direct sales force and our
technical and support staff, we may not be able to establish a global sales,
marketing or technical support organization that is sufficient to sell, market
or support our products globally. To assist our sales and support activities, we
have entered into distribution agreements through certain distributors,
principally in markets outside of North America and Europe. These and other
third parties on whom we rely for sales, marketing and technical support may
decide to develop and sell competitive products or otherwise become our
competitors, which could harm our business.
Risks
Related to the Manufacturing of Our Products
We
depend on a limited number of suppliers and we will be unable to manufacture our
products if shipments from these suppliers are delayed or
interrupted.
We depend
on our suppliers to provide components of our products in required volumes, at
appropriate quality and reliability levels, and in compliance with regulatory
requirements. Key parts of our product lines, including components of our
manufacturing equipment and certain raw materials used in the manufacture of our
products are currently available only from a single source or limited sources.
If supplies from these vendors were delayed or interrupted for any reason, we
would not be able to get manufacturing equipment, produce probe arrays, or sell
scanners or other components for our products in a timely fashion or in
sufficient quantities.
Furthermore,
our business is dependent on our ability to forecast the needs for components
and products in the product lines and our suppliers’ ability to deliver such
components and products in time to meet critical manufacturing and product
release schedules. Our business could be adversely affected, for example, if
suppliers fail to meet product release schedules, if we experience supply
constraints, if we fail to negotiate favorable pricing or if we experience any
other interruption or delay in the supply chain which interferes with our
ability to manufacture our products or manage our inventory levels.
We
may need to adjust our manufacturing capacity based on business requirements or
improvements made to our technological capabilities and there are risks
associated with such adjustment.
If demand
for our products is reduced or if we implement technologies that increase the
density or yields of our wafers, our manufacturing capacity could be
under-utilized and some of our long-lived assets, including facilities and
equipment, may be impaired, which would increase our expenses. In addition,
factory planning decisions may shorten the useful lives of long-lived assets
including facilities and equipment, and cause us to accelerate depreciation.
These changes in demand for our products, and changes in our customers’ product
needs, could have a variety of negative effects on our competitive position and
our financial results, and, in certain cases, may reduce our revenue, increase
our costs, lower our gross margin percentage or require us to recognize
impairments of our assets. In addition, if demand for our products is reduced or
we fail to accurately forecast demand, we could be required to write down
inventory since certain of our products have a limited shelf life, which would
have a negative impact on our gross margin.
We have
in the past, and may in the future, adjust our manufacturing capacity based on
business requirements, which may include the rationalization of our facilities,
including the abandonment of long-lived manufacturing assets and additional
charges related to a reduction in capacity. In 2008, we implemented a
restructuring plan that included the closure of our West Sacramento, California
facility and the consolidation of our manufacturing in three locations. This
restructuring was completed in the second quarter of 2009. Manufacturing and
product quality issues may arise as we launch new products in our Singapore and
Ohio facilities. We may lose customers if we are unable to manufacture products
or if we experience delays in the manufacture of our products as a result of
this transition.
We
may lose customers or sales if we are unable to meet customer demand for our
products on a timely and cost-effective basis, or if we are unable to ensure the
proper performance and quality of our products.
We
produce our products in an innovative and complicated manufacturing process
which has the potential for significant variability in manufacturing yields. We
have encountered and may in the future encounter difficulties in manufacturing
our products and, due to the complexity of our products and our manufacturing
process, we may experience delays in the manufacture of our products or fail to
ensure their proper performance or quality. As we develop new and enhanced
products, we must be able to resolve in a timely, cost-effective manner
manufacturing issues that may arise from time to time.
We base
our manufacturing capabilities on our forecasted product mix for the quarter. If
the actual product mix varies significantly from our forecast, we may not be
able to fill some orders during that quarter, which could adversely impact our
financial results. Difficulties in meeting customer, collaborator and internal
demand could also cause us to lose customers or require us to delay new product
introductions, which could in turn result in reduced demand for our
products.
We rely
on internal quality control procedures to verify our manufacturing processes.
Due to the complexity of our products and manufacturing process, however, it is
possible that products that do not meet all of our performance specifications
may not be identified before they are shipped. If our products do not
consistently meet our customers’ performance expectations, demand for our
products will decline. In addition, we do not maintain any backup manufacturing
capabilities for the production of our products. Any interruption in our ability
to continue operations at our existing manufacturing facilities could delay our
ability to develop or sell our products, which could result in lost revenue and
seriously harm our business, financial condition and results of
operations.
We
may not be able to deliver acceptable products to our customers due to the
rapidly evolving nature of genetic sequence information upon which our products
are based.
The
genetic sequence information upon which we rely to develop and manufacture our
products is contained in a variety of public databases throughout the world.
These databases are rapidly expanding and evolving. In addition, the accuracy of
these databases and resulting genetic research is dependent on various
scientific interpretations and it is not expected that global genetic research
efforts will result in standardized genetic sequence databases for particular
genomes in the near future.
Although
we have implemented ongoing internal quality control efforts to help ensure the
quality and accuracy of our products, the fundamental nature of our products
requires us to rely on genetic sequence databases and scientific interpretations
which are continuously evolving. As a result, these variables may cause us to
develop and manufacture products that incorporate sequence errors or
ambiguities. The magnitude and importance of these errors will depend upon
multiple and complex factors that would be considered in determining the
appropriate actions required to remedy any inaccuracies. Our inability to timely
deliver acceptable products as a result of these factors would likely adversely
affect our relationship with customers, and could have a material adverse effect
on our business, financial condition and results of operations.
Risks
Related to Our Operations
We
may not achieve sustained profitability.
Prior to
2002, we incurred losses each year since our inception, and we reported losses
in 2006, 2008 and 2009. As a result, we had an accumulated deficit of
approximately $440.3 million as of December 31, 2009. Our ability to
achieve profitability will depend, in part, on the rate of growth, if any, of
our revenue and on the level of our expenses. We expect to continue incurring
significant expenses related to research and development, sales and marketing
efforts to commercialize our products, litigation and non-cash stock based
compensation, and we expect to continue to experience fluctuations in our
operating results. If our revenues grow more slowly than we anticipate, or if
our operating expenses increase more than we expect or cannot be reduced in the
event of lower revenues, we may not become profitable on a sustained basis, or
at all.
If
we do not attract and retain key employees, our business could be
impaired.
To be
successful, we must attract and retain qualified scientific, engineering,
manufacturing, sales, marketing and management personnel. To expand our
research, product development and sales efforts we need additional people
skilled in areas such as bioinformatics, organic chemistry, information
services, regulatory affairs, manufacturing, sales, marketing and technical
support. Competition for these people is intense, and our compensation
arrangements, such as our equity award programs, may not always be successful in
attracting new employees and retaining and motivating our existing
employees. For example, our stock price has been volatile in the past
three years, resulting in a significant number of stock options granted to our
employees having a strike price that is higher than the current trading price of
our common stock. If we are unable to hire, train and retain a sufficient number
of qualified employees, we will not be able to expand our business or our
business could be adversely affected.
We also
rely on our scientific advisors and consultants to assist us in formulating our
research, development and commercialization strategy. All of these individuals
are engaged by other employers and have commitments to other entities that may
limit their availability to us.
We
may not realize the expected benefits of our initiatives to reduce costs across
our operations.
We are
pursuing and may continue to pursue a number of initiatives to reduce costs
across our operations. These initiatives have included workforce reductions in
certain areas, as well as the rationalization of our facilities.
We may
not realize the expected benefits of our current and future initiatives to
reduce costs. As a result of these initiatives, we expect to incur restructuring
or other charges and we may experience disruptions in our operations, a loss of
key personnel and difficulties in delivering products in a timely
manner.
Recent
economic conditions and the financial crisis could negatively affect our
business, results of operations, and financial condition.
Recent
economic conditions and the crisis affecting the banking system and financial
markets resulted in a tightening in the credit markets, a low level of liquidity
in many financial markets, and heightened volatility in fixed income, credit and
equity markets. Continued market turbulence may adversely affect our liquidity
and financial condition and that of our customers. If these market conditions
persist, they may limit our ability, and the ability of our customers, to obtain
short-term financing or to access the capital markets to meet liquidity needs
and invest in new technologies. In addition, there could be a number of
follow-on effects from the credit crisis on our business,
including:
|
·
|
insolvency
of key suppliers resulting in product
delays;
|
|
·
|
reduction
in research and development spending of
customers;
|
|
·
|
inability
of customers to finance purchases of our products and/or customer
insolvencies (for example, some of our customers are academic institutions
who have experienced significant decreases in income derived from
endowment funds);
|
|
·
|
counterparty
failures negatively impacting our treasury operations;
and
|
|
·
|
increased
impairments on our investments in companies that cannot obtain
financing.
|
Due
to the international nature of our business, political or economic changes or
other factors could harm our business.
A
significant amount of our revenue is currently generated from sales outside the
United States. Although such transactions are primarily denominated in both U.S.
dollars and foreign currencies, our future revenue, gross margin, expenses and
financial condition are still affected by such factors as changes in foreign
currency exchange rates; unexpected changes in, or impositions of, legislative
or regulatory requirements, including export and trade barriers and taxes;
longer payment cycles and greater difficulty in accounts receivable
collection.
We also
are subject to general geopolitical risks in connection with international
operations, such as political, social and economic instability, potential
hostilities, epidemics and changes in diplomatic and trade relationships. We
cannot assure investors that one or more of the foregoing factors will not have
a material adverse effect on our business, financial condition and operating
results or require us to modify our current business practices.
Our
effective tax rate may vary significantly.
Our
operations are subject to income and transaction taxes in the United States and
in multiple foreign jurisdictions. Estimates and judgments are required in
determining our worldwide provision for income taxes. Some of these estimates
are based on interpretations of existing tax laws or regulations. The ultimate
amount of tax liability may be uncertain as a result.
Changes
in overall levels and the geographic mix of pretax earnings may adversely impact
our effective tax rate. Certain jurisdictions have lower tax rates, and the
amount of earnings in these jurisdictions may fluctuate. If we do not have
profitable operations in these jurisdictions, our effective tax rate could be
adversely impacted. Changes in tax laws and regulatory requirements in the
countries in which we operate could have a material impact on our tax provision.
To the extent that we are unable to continue to reinvest a substantial portion
of our profits in our foreign operations, we may be subject to effective income
tax rate increases in the future. Tax authorities may challenge the allocation
of profits between our subsidiaries and we may not prevail in any such
challenge. If we were not to prevail, we could be subject to higher tax rates or
double tax.
Estimates
are required in determining any valuation allowance to be recorded against our
net deferred tax assets. Changes in the amount of valuation allowance required
may significantly impact our financial results of
operations.
Risks
Related to Our Investments
Our
strategic equity investments may result in losses.
We
periodically make strategic equity investments in various public and private
companies with businesses or technologies that may complement our business. The
market values of these strategic equity investments may fluctuate due to market
conditions and other conditions over which we have no control.
Other-than-temporary declines in the market price and valuations of the
securities that we hold in other companies would require us to record losses
relative to our ownership interest. This could result in future charges to our
earnings. It is uncertain whether or not we will realize any long-term benefits
associated with these strategic investments.
Global
credit and financial market conditions could negatively impact the value of our
current portfolio of cash equivalents or short-term investments and our ability
to meet our financing objectives.
Our cash
and cash equivalents are maintained in highly liquid investments with remaining
maturities of 90 days or less at the time of purchase. Our short-term
investments consist primarily of readily marketable debt securities with
remaining maturities of more than 90 days at the time of purchase. While as
of the date of this filing, we are not aware of any downgrades, material losses,
or other significant deterioration in the fair value of our cash equivalents or
short-term investments since December 31, 2009, we cannot assure you that
further deterioration in conditions of the global credit and financial markets
would not negatively impact our current portfolio of cash equivalents or
short-term investments or our ability to meet our financing objectives.
Other-than-temporary declines in the market price and valuation of any of our
short-term investments would require us to adjust the carrying value of the
investment through an impairment charge.
Risks
Related to Government Regulation and Litigation
We
and our customers are subject to various government regulations, and we may
incur significant expenses to comply with, and experience delays in our product
commercialization as a result of, these regulations.
The FDA
must approve certain in-vitro diagnostic products before they can be marketed in
the United States. Certain in-vitro diagnostic products must also be approved by
the regulatory agencies of foreign governments or jurisdictions before the
product can be sold outside the United States. Commercialization of our and our
collaborative partners’ in-vitro diagnostic products outside of the research
environment may depend upon successful completion of clinical trials. Clinical
development is a long, expensive and uncertain process and we do not know
whether we, or any of our collaborative partners, will be permitted to undertake
clinical trials of any potential in-vitro diagnostic products. It may take us or
our collaborative partners many years to complete any such testing, and failure
can occur at any stage. Delays or rejections of potential products may be
encountered based on changes in regulatory policy for product approval during
the period of product development and regulatory agency review. Moreover, if and
when our projects reach clinical trials, we, or our collaborative partners, may
decide to discontinue development of any or all of these projects at any time
for commercial, scientific or other reasons. Any of the foregoing matters could
have a material adverse effect on our business, financial condition and results
of operations.
Many of
our products are labeled for research only. Even when a product is exempted
from FDA clearance or approval, the FDA may impose restrictions as to the types
of customers to which we can market and sell our products. Such restrictions may
materially and adversely affect our business, financial condition and results of
operations.
The FDA,
the U.S. Department of Health and Human Services and foreign government
regulators are increasingly focused on genetic analysis tools, including the use
of arrays that are labeled for research use only by cytogenetics labs, including
labs certified under the Clinical Laboratory Improvement Amendments
(“CLIA”). We cannot predict the extent of the FDA’s future efforts in
regulation and policies with respect to the sale and use of arrays for the
development of assays by CLIA laboratories, which are referred to as laboratory
developed tests (“LDTs”). If new regulations restrict our customers’
development of LDTs using our products labeled for research use only, or if we
otherwise are required to obtain FDA premarket clearance or approval prior to
commercializing these products, our ability to generate revenue from the sale of
our products may be delayed or otherwise adversely affected. Moreover, our
failure to comply with governmental rules and regulations related to our
products could cause us to incur significant adverse publicity, subject us to
investigations and notices of non-compliance or lead to fines or restrictions
upon our ability to sell our products.
Medical
device laws and regulations are also in effect in many countries, ranging from
comprehensive device approval requirements to requests for product data or
certifications. The number and scope of these requirements are increasing. We
may not be able to obtain regulatory approvals in such countries or may incur
significant costs in obtaining or maintaining our foreign regulatory approvals.
In addition, the export by us of certain of our products which have not yet been
cleared for domestic commercial distribution may be subject to FDA or other
export restrictions.
We have
agreements relating to the sale of our products to government entities and, as a
result, we are subject to various statutes and regulations that apply to
companies doing business with the government. A failure to comply with
these regulations might result in suspension of these contracts or
administrative penalties, and could have a material adverse effect on our
ability to compete for future government grants, contracts and
programs.
Healthcare
reform and restrictions on reimbursements may limit our returns on molecular
diagnostic products that we may develop with our collaborators.
We are
currently collaborating with our partners to develop diagnostic and therapeutic
products. The ability of our collaborators to commercialize such products may
depend, in part, on the extent to which reimbursement for the cost of these
products will be available under U.S. and foreign regulations that govern
reimbursement for clinical testing services by government authorities, private
health insurers and other organizations. In the United States, third-party payer
price resistance, the trend towards managed health care and legislative
proposals to reform health care or government insurance programs could reduce
prices for health care products and services, adversely affect the profits of
our customers and collaborative partners and reduce our future
royalties.
Risks
related to handling of hazardous materials and other regulations governing
environmental safety.
Our
operations are subject to complex and stringent environmental, health, safety
and other governmental laws and regulations that both public officials and
private individuals may seek to enforce. Our activities that are subject to
these regulations include, among other things, our use of hazardous and
radioactive materials and the generation, transportation and storage of waste.
We could discover that we or an acquired business is not in material compliance.
Existing laws and regulations may also be revised or reinterpreted, or new laws
and regulations may become applicable to us, whether retroactively or
prospectively, that may have a negative effect on our business and results of
operations. It is also impossible to eliminate completely the risk of accidental
environmental contamination or injury to individuals. In such an event, we could
be liable for any damages that result, which could adversely affect our
business.
We
may be exposed to liability due to product defects.
The risk
of product liability claims is inherent in the testing, manufacturing, marketing
and sale of human diagnostic and therapeutic products and we may be subjected to
such claims. We may seek to acquire additional insurance for clinical or product
liability risks. We may not be able to obtain such insurance or general product
liability insurance on acceptable terms or in sufficient amounts. A product
liability claim or recall could have a serious adverse effect on our business,
financial condition and results of operations.
Ethical,
legal and social concerns surrounding the use of genetic information could
reduce demand for our products.
Genetic
testing has raised ethical issues regarding privacy and the appropriate uses of
the resulting information. For these reasons, governmental authorities may call
for limits on or regulation of the use of genetic testing or prohibit testing
for genetic predisposition to certain conditions, particularly for those that
have no known cure. Similarly, such concerns may lead individuals to refuse to
use genetics tests even if permissible. Any of these scenarios could reduce the
potential markets for our molecular diagnostic products, which could have a
material adverse effect on our business, financial condition and results of
operations.
Risks
Related to Our Intellectual Property
We
may be unable to effectively protect or enforce our intellectual property, which
could harm our competitive position.
Maintaining
a strong patent position is critical to our business. Patent law relating to the
scope of claims in the technology fields in which we operate is uncertain, so we
cannot be assured the patent rights we have or may obtain will be valuable.
Others have filed, and in the future are likely to file, patent applications
that are similar or identical to ours or those of our licensors. To determine
the priority of inventions, we may have to participate in interference
proceedings declared by the United States Patent and Trademark Office that could
result in substantial costs in legal fees and could substantially affect the
scope of our patent protection. We cannot be assured our patent applications
will have priority over those filed by others. Also, our intellectual property
may be subject to significant administrative and litigation proceedings such as
opposition proceedings against our patents in Europe, Japan and other
jurisdictions.
Legal
actions to enforce our patent rights can be expensive and may involve the
diversion of significant management time. In addition, these legal actions could
be unsuccessful and could also result in the invalidation of our patents or a
finding that they are unenforceable. We may or may not choose to pursue
litigation or interferences against those that have infringed on our patents, or
used them without authorization, due to the associated expense and time
commitment of monitoring these activities. If we fail to protect or
to enforce our intellectual property rights successfully, our competitive
position could suffer, which could harm our results of operations.
In
addition to patent protection, we also rely upon copyright and trade secret
protection, as well as non-disclosure agreements with our employees, consultants
and third-parties, to protect our confidential and proprietary information. Such
measures may not provide adequate protection for our proprietary
information.
Litigation
or other proceedings or third party claims of intellectual property infringement
could require us to spend significant time and money and could prevent us from
selling our products or services or impact our stock price.
Third
parties have asserted and may in the future assert that we are employing their
proprietary technology without authorization. We are currently engaged in
litigation with third parties who allege that we have infringed their
intellectual property rights. See “Item 8. Financial Statements and
Supplementary Data—Note 13. Commitments and Contingencies” for further
information. In addition, we are aware of third-party patents that
may relate to our technology. We routinely receive notices claiming infringement
from third parties as well as invitations to take licenses under third party
patents.
As we
enter new markets, we expect that competitors will claim that our products
infringe their intellectual property rights as part of business strategies
designed to impede our successful entry into those markets. In addition, third
parties may have obtained, and may in the future obtain, patents allowing them
to claim that the use of our technologies infringes these patents. We could
incur substantial costs and divert the attention of our management and technical
personnel in defending ourselves against any of these claims. Any adverse ruling
or perception of an adverse ruling in defending ourselves against these claims
could have a material adverse impact on our stock price, which may be
disproportionate to the actual import of the ruling itself. Furthermore, parties
making claims against us may be able to obtain injunctive or other relief, which
could block our ability to develop, commercialize and sell products, and could
result in the award of substantial damages against us. In the event of a
successful claim of infringement against us, we may be required to pay damages
and obtain one or more licenses from third parties, or be prohibited from
selling certain products. In addition, we may be unable to obtain these licenses
at a reasonable cost, if at all. We could therefore incur substantial costs
related to royalty payments for licenses obtained from third parties, which
could negatively affect our gross margins. In addition, we could encounter
delays in product introductions while we attempt to develop alternative methods
or products. Defense of any lawsuit or failure to obtain any of these licenses
on favorable terms could prevent us from commercializing products, and the
prohibition of sale of any of our products could materially affect our ability
to grow and maintain profitability.
Risks
Related to Our Common Stock
The
market price of our common stock has been volatile.
The
market price of our common stock is volatile. During the twelve-month period
ending December 31, 2009, the daily volume of our common stock fluctuated from
278,900 to 7,846,800 shares. Moreover, during that period, our common stock
traded as low as $1.78 per share and as high as $10.06 per share. Our stock
price may be affected by a number of factors, including those listed in these
“Risk Factors” and other, unknown factors. Our stock price also may be affected
by: comments by securities analysts regarding our business or prospects; our
inability to meet analysts’ expectations; general fluctuations in the stock
market, or in the stock prices of our industry peers or our customers; and,
general conditions and publicity regarding the genomics, biotechnology,
pharmaceutical or life science industries.
Volatility
in the stock price of other companies often has led to securities class action
litigation against those companies. Any future securities litigation against us
could result in substantial costs and divert management’s attention and
resources, which could seriously harm our business, financial condition and
results of operations.
Our
quarterly results have historically fluctuated significantly and may continue to
do so. Failure to meet financial expectations may disappoint securities analysts
or investors and result in a decline in our stock price.
Our
revenues and operating results may fluctuate significantly due in part to
factors that are beyond our control and which we cannot predict. The timing of
our customers’ orders may fluctuate from quarter to quarter. Historically, we
have experienced customer ordering patterns for instrumentation and consumables
where the majority of the shipments occur in the last month of the quarter.
These ordering patterns may limit management’s ability to accurately forecast
our future revenues or product mix. Additionally, license revenue may also be
unpredictable and may fluctuate due to the timing of payments of non-recurring
licensing fees. Because our expenses are largely fixed in the short to medium
term, any material shortfall in revenues may cause us to experience material
losses.
Because
of this difficulty in predicting future performance, our operating results may
fall below our own expectations and the expectations of securities analysts or
investors in some future quarter or quarters. Our failure in the past to meet
these expectations has adversely affected the market price of our common stock
and may continue to do so.
In
addition to factors that affect the spending levels of our customers described
above, additional factors could cause our operating results to fluctuate,
including:
|
·
|
competition;
|
|
·
|
our
inability to produce products in sufficient quantities and with
appropriate quality;
|
|
·
|
the
frequency of experiments conducted by our
customers;
|
|
·
|
our
customers’ inventory of products;
|
|
·
|
the
receipt of relatively large orders with short lead times;
and
|
|
·
|
our
customers’ expectations as to how long it takes us to fill future
orders.
|
None.
Our
corporate headquarters is located in Santa Clara, California, where we lease
approximately 200,000 square feet. Our manufacturing facilities are located in
Singapore and Cleveland, Ohio, where we lease approximately 150,000 square feet
and 53,000 square feet, respectively. We also lease approximately 275,000 square
feet of administrative and research and development space in California
(Emeryville, Fremont and Sunnyvale), Ohio (Cleveland), Massachusetts (Bedford),
China (Shanghai), Germany (Staufen), Japan (Osaka and Tokyo) and the United
Kingdom (Wooburn Green). Additionally, as discussed in detail in “Item 8.
Financial Statements and Supplementary Data—Note 3. Restructuring”, we own a
170,000 square foot facility in the West Sacramento but have vacated the space
and moved all of our manufacturing activities to Singapore and Ohio. The West
Sacramento facility is currently vacant. We believe that our existing properties
are in good condition and are suitable for the conduct of our
business.
Information
pertaining to legal proceedings can be found in “Item 8. Financial
Statements and Supplementary Data—Note 13. Commitments and Contingencies”
of this Annual Report on Form 10-K, and is incorporated by reference
herein.
No
matters were submitted during the fourth quarter of the year ended
December 31, 2009.
Our
common stock is traded on the Nasdaq Global Select Market under the symbol of
AFFX. The following table sets forth on a per share basis, for the periods
indicated, the low and high closing prices of our common stock as reported by
the Nasdaq Global Select Market.
|
Low
|
High
|
|||||||
|
2009
|
||||||||
|
First
Quarter
|
$ | 1.78 | $ | 4.06 | ||||
|
Second
Quarter
|
$ | 3.23 | $ | 6.82 | ||||
|
Third
Quarter
|
$ | 5.04 | $ | 9.50 | ||||
|
Fourth
Quarter
|
$ | 4.69 | $ | 9.83 | ||||
|
2008
|
||||||||
|
First
Quarter
|
$ | 15.75 | $ | 23.76 | ||||
|
Second
Quarter
|
$ | 10.06 | $ | 17.89 | ||||
|
Third
Quarter
|
$ | 7.38 | $ | 10.72 | ||||
|
Fourth
Quarter
|
$ | 2.16 | $ | 7.81 | ||||
As of February 22, 2010, there
were approximately 356 holders of record of our common stock, one of which
is Cede & Co., a nominee for Depository Trust Company (“DTC”). All
of the shares of common stock held by brokerage firms, banks and other financial
institutions as nominees for beneficial owners are deposited into participant
accounts at DTC and therefore are considered to be held of record by
Cede & Co. as one shareholder.
No cash
dividends have been paid on our common stock. We currently intend to retain all
future earnings, if any, for use in our business and do not anticipate paying
any cash dividends on our common stock in the foreseeable future.
No equity securities were sold during 2009 that were not
registered under the Securities Act of 1933, as amended (the “Securities Act”).
We did not repurchase any shares of our common stock during the fourth quarter
of 2009.
For information regarding compensation plans under which
equity securities were authorized for issuance, see the section of the Proxy
Statement to be filed in connection with our 2010 Annual Meeting of Shareholders
entitled “Stock Ownership of Principal Stockholders and Management,”
incorporated by reference into Item 11 of this Annual Report on Form
10-K.
Performance
Graph
The graph
below compares the cumulative total return* on our common stock for the period
commencing on December 31, 2004 and ending December 31, 2009 compared
to the CRSP Total Return Index for the Nasdaq National Market (U.S. companies)
and the CRSP Total Return Index for the Nasdaq Pharmaceutical Stocks (SIC 283).
The stock price performance shown on the graph below is not necessarily
indicative of future price performance.
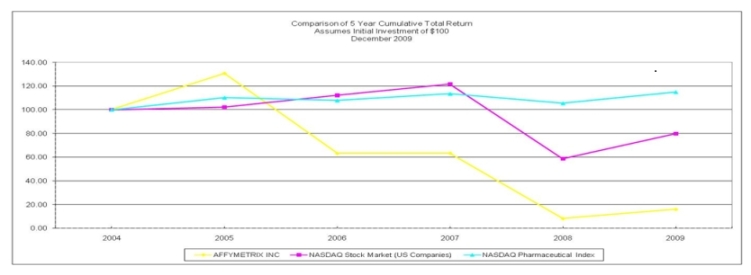
|
|
*
|
Assumes
$100 invested on December 31, 2004 in our common stock and in each
index listed above. The total return for our common stock and the indices
used assumes the reinvestment of dividends, even though dividends have
never been declared on our common
stock.
|
The
information under the caption “Performance Graph” is not deemed filed with the
Securities and Exchange Commission and is not to be incorporated by reference in
any filing of Affymetrix under the Securities Act of 1933, as amended, or the
Securities Exchange Act of 1934, as amended (the “Exchange Act”), whether made
before or after the date of this Annual Report on Form 10-K and irrespective of
any general incorporation language in such filings.
The
following selected historical consolidated financial information has been
derived from our audited consolidated financial statements. The information
below is not necessarily indicative of our future results of operations and
should be read in conjunction with Item 1A, “Risk Factors,” Item 7,
“Management’s Discussion and Analysis of Financial Condition and Results of
Operations,” and Item 8, “Financial Statements and Supplementary Data” in
this Annual Report on Form 10-K in order to fully understand the factors
that may affect the comparability of the information presented
below:
|
Year
Ended December 31,
|
||||||||||||||||||||
|
2009
|
2008
|
2007
|
2006
|
2005
|
||||||||||||||||
|
Consolidated
Statement of Operations Data:
|
(in
thousands, except per share amounts)
|
|||||||||||||||||||
|
Total
revenue
|
$ | 327,094 | $ | 410,249 | $ | 371,320 | $ | 355,317 | $ | 367,602 | ||||||||||
|
(Loss)
income from operations
|
(33,158 | ) | (242,539 | ) | 6,080 | (18,545 | ) | 57,413 | ||||||||||||
|
Net
(loss) income (1)
|
$ | (23,909 | ) | $ | (307,919 | ) | $ | 12,593 | $ | (13,704 | ) | $ | 65,787 | |||||||
|
Basic
net (loss) income per common share
|
$ | (0.35 | ) | $ | (4.49 | ) | $ | 0.18 | $ | (0.20 | ) | $ | 1.03 | |||||||
|
Diluted
net (loss) income per common share
|
$ | (0.35 | ) | $ | (4.49 | ) | $ | 0.17 | $ | (0.20 | ) | $ | 0.96 | |||||||
|
Consolidated
Balance Sheet Data:
|
||||||||||||||||||||
|
Cash,
cash equivalents, and available-for-sale securities
|
$ | 346,574 | $ | 397,739 | $ | 584,274 | $ | 247,752 | $ | 284,932 | ||||||||||
|
Working
capital
|
345,486 | 420,768 | 583,067 | 290,302 | 349,679 | |||||||||||||||
|
Total
assets (2)
|
630,950 | 713,310 | 1,133,591 | 781,215 | 775,094 | |||||||||||||||
|
Long-term
obligations (3), (4)
|
261,394 | 330,896 | 451,143 | 134,662 | 139,790 | |||||||||||||||
|
(1)
|
In
the second quarter of 2009, we recognized a gain of $17.4 million as a
result of the $69.1 million repurchase of our 3.50% senior convertible
notes which is presented in a single line item labeled “Gain from
repurchase of convertible notes” in our Consolidated Statements of
Operations. See (4) for further details.
|
|
|
In
the fourth quarter of 2008, we recognized a goodwill impairment charge of
$239.1 million that was presented in a single line item labeled
“Goodwill impairment charges” in our Consolidated Statements of Operations
as well as an income tax provision of $65.9 million primarily resulting
from a full valuation allowance recorded against all U.S. deferred tax
assets.
|
|
|
Additionally,
we recognized approximately $2.2 million, $43.7 million and
$15.3 million in 2009, 2008 and 2007, respectively, of expense
related to our restructuring plans that was presented in a single line
item labeled “Restructuring charges” in our Consolidated Statements of
Operations.
|
|
(2)
|
On
October 21, 2005, we completed the $122.4 million acquisition of
ParAllele BioScience, Inc. (“ParAllele”), a provider of comprehensive
genetic discovery solutions to the life science research, pharmaceutical
and diagnostic sectors.
In
2008, we completed the acquisitions of USB Corporation (“USB”), True
Materials, Inc. (“TMI”), and Panomics, Inc. for an aggregate of
approximately $163.0 million.
|
|
(3)
|
In
November 2007, we issued $316.3 million principal amount of 3.50%
senior convertible notes.
|
|
(4)
|
In
June 2009, we repurchased approximately $69.1 million aggregate principal
amount of our 3.50% convertible notes for cash consideration of $50.6
million, including accrued interest and transactions costs.
|
|
|
In
December 2008, a total of $119.9 million aggregate principal amount
of our 0.75% senior convertible notes was redeemed for cash as investors
exercised their put right. We repurchased an additional $0.1 million in
2009.
|
The
following discussion should be read in conjunction with the consolidated
financial statements and the related notes that appear elsewhere in this
document.
The
purpose of the following discussion and analysis is to provide an overview of
the business to help facilitate an understanding of significant factors
influencing our historical operating results, financial condition and cash flows
and also to convey our expectations of the potential impact of known trends,
events, or uncertainties that may impact our future results. The discussion and
analysis in this Annual Report on Form 10-K contains forward-looking
statements that involve risks and uncertainties, such as statements of our
plans, strategies, objectives, expectations, intentions and adequacy of
resources. Forward-looking statements are subject to known and unknown risks and
uncertainties and are based on potentially inaccurate assumptions that could
cause actual results to differ materially from those expected or implied by the
forward looking statements. Words such as “anticipate,” “believe,” “continue,”
“estimate,” “expect,” “intend,” “may,” “plan,” “potential,” “predict,” “project”
or similar words or phrases, or the negatives of these words, may identify
forward-looking statements, but the absence of these words does not necessarily
mean that a statement is not forward looking. Examples of forward-looking
statements include, among others, statements regarding the integration of our
acquired technologies with our existing technology, the commercial launch of new
products and the duration which our existing cash and other resources is
expected to fund our operating activities. This discussion should be read in
conjunction with the other sections of this Annual Report on Form 10-K,
including “Item 1: Business”; “Item 1A: Risk Factors”; “Item 6:
Selected Financial Data”; and “Item 8: Financial Statements and
Supplementary Data.”
Overview
We
develop, manufacture and sell products and services for genetic analysis to the
life science research and clinical healthcare markets. Researchers around the
world use our technology to better understand the role that genes play in
disease, the effectiveness and safety of therapies and many other biological
factors that affect human well-being. We sell our products to some of the
world’s largest pharmaceutical, diagnostic and biotechnology companies, as well
as leading academic, government and not-for profit research institutions. More
than 21,000 peer-reviewed papers have been published based on work using our
products. We have approximately 1,000 employees worldwide and maintain sales and
distribution operations across the United States, Europe and Asia.
We offer
a comprehensive line of products for two principal applications: genotyping and
gene expression. The majority of our product sales consist of sales of
instruments and related consumables. Our GeneChip® and GeneTitan® families of
products are whole systems that include instruments, consumables and software.
We recently re-engineered our platform and launched our GeneTitan® family of
products. Our GeneChip® instruments run arrays packaged in cartridges and our
GeneTitan® instrument runs arrays packaged in a peg format for automated high
throughput processing.
Through
our acquisition of USB, we now offer a range of reagent kits that are compatible
with our platforms as well as the products of other vendors. Through our
acquisition of Panomics, we offer a variety of low-to mid-plex assays for gene
expression.
Our
objective is to be the leading provider of genotyping and gene expression
products for the analysis of genetic variation. The key elements of our strategy
are:
Expanding into new markets.
Our goal is to generate top-line revenue growth by successfully commercializing
our technologies and expanding our customer base, including by leveraging our
established and newly acquired technologies to enter new markets. We believe
that we can expand our position in the genotyping market with our new AxiomTM
Genotyping Solution. We believe that this market will continue to be one of the
most attractive growth opportunities in life sciences and new content packaged
in versatile formats will drive growth. Other opportunities include emerging
cytogenetic and copy number diagnostics and our Drug Metabolizing Enzymes and
Transporters product, which we believe addresses a significant unmet need of our
pharmaceutical partners. We see opportunities in applications that are
downstream from genome-wide analysis, particularly in validation and routine
testing where our QuantiGene line of products is used for biomarker
validation.
Re-engineering our technology
platform. We intend to combine automated instrumentation, powerful new
biological assays, and new array designs and content to significantly expand our
product line. The new GeneTitan® System, our next generation mid-to-high end
instrumentation platform enables significantly increased efficiency and
throughput for researchers conducting array-based experiments. This fully
automated solution enables higher data quality by removing or minimizing many of
the sources of variation in the laboratory. We expect to commercially release
GeneAtlasTM in
2010, targeted at new and novice users of microarray technology. With these
instruments we also introduced an alternative format, the peg array plate, to
our cartridge-based consumables. We intend to provide an expanded menu of gene
expression and genotyping applications for our peg array plates.
Improve operating leverage.
We expect to see positive operating income in fiscal 2010 as we continue to
control costs and work to generate increased revenues. In 2009, we completed a
restructuring plan designed to optimize our production capacity and cost
structure to enable us to decrease our cost of manufacturing and operating
expenses by moving our probe array manufacturing to our Singapore facility,
consolidating our reagent manufacturing to our Cleveland facility and
outsourcing our instrument manufacturing operations. Additionally, our new peg
array plate formats have lower manufacturing costs than the cartridge-based
formats. We also expect to incur lower operating expenses as we fully integrate
our acquisitions of USB and Panomics and complete the re-engineering of our
technology platform.
CRITICAL
ACCOUNTING POLICIES & ESTIMATES
General
The
following section of Management’s Discussion and Analysis of Financial Condition
and Results of Operations is based upon our consolidated financial statements,
which have been prepared in accordance with U.S. Generally Accepted Accounting
Principles (“US GAAP”). The preparation of these financial statements requires
management to make estimates and assumptions that affect the reported amounts of
assets, liabilities, revenue and expenses, and related disclosure of contingent
assets and liabilities. Management bases its estimates on historical experience
and on various other assumptions that are believed to be reasonable under the
circumstances, the results of which form the basis for making judgments about
the carrying values of assets and liabilities that are not readily apparent from
other sources. Actual results may differ from these estimates under different
assumptions or conditions.
Our
significant accounting policies are fully described in “Item 8. Financial
Statements and Supplementary Data—Note 2. Summary of Significant Accounting
Policies”. However, certain accounting policies are particularly important to
the reporting of our financial position and results of operations and require
the application of significant judgment by our management. An accounting policy
is deemed to be critical if it requires an accounting estimate to be made based
on assumptions about matters that are highly uncertain at the time the estimate
is made, and if different estimates that reasonably could have been used, or
changes in the accounting estimates that are reasonably likely to occur
periodically, could materially impact the financial statements. Management
believes the following critical accounting policies reflect its more significant
estimates and assumptions used in the preparation of the consolidated financial
statements.
REVENUE
RECOGNITION
We enter
into contracts to sell our products and, while the majority of our sales
agreements contain standard terms and conditions, there are agreements that
contain multiple elements or non-standard terms and conditions. As a result,
significant contract interpretation is sometimes required to determine the
appropriate accounting, including whether the deliverables specified in a
multiple element arrangement should be treated as separate units of accounting
for revenue recognition purposes, and if so, how the value of the arrangement
should be allocated among the deliverable elements, when and how to recognize
revenue for each element, and the period over which revenue should be
recognized. We recognize revenue for delivered elements only when the fair
values of undelivered elements are known and customer acceptance, if required,
has occurred. Changes in the allocation of the sales price between delivered to
undelivered elements might impact the timing of revenue recognition, but would
not change the total revenue recognized on any arrangement.
ACCOUNTS
RECEIVABLE
We
evaluate the collectability of our trade receivables based on a combination of
factors. We regularly analyze our significant customer accounts, and, when we
become aware of a specific customer’s inability to meet its financial
obligations to us, such as in the case of bankruptcy filings or deterioration in
the customer’s operating results or financial position, we record specific bad
debt allowances to reduce the related receivable to the amount we reasonably
believe is collectible. We also record allowances for bad debt on a small
portion of all other customer balances based on a variety of factors, including
the length of time the receivables are past due, the financial health of the
customer, both current and forward-looking, macroeconomic considerations and
historical experience. If circumstances related to specific customers change,
our estimates of the recoverability of receivables could be further
adjusted.
INVENTORIES
We enter
into inventory purchases and commitments so that we can meet future shipment
schedules based on forecasted demand for our products. The business environment
in which we operate is subject to rapid changes in technology and customer
demand. We perform a detailed assessment of inventory each period, which
includes a review of, among other factors, demand requirements, product life
cycle and development plans, component cost trends, product pricing, product
expiration and quality issues. Based on this analysis, we record adjustments to
inventory for potentially excess, obsolete or impaired goods, when appropriate,
in order to report inventory at net realizable value. Revisions to our inventory
adjustments may be required if actual demand, component costs, supplier
arrangements, or product life cycles differ from our estimates. Any such adjustments or revised adjustments could result
in a change to our results of operations.
NON-MARKETABLE
EQUITY SECURITIES
As part
of our strategic efforts to gain access to potential new products and
technologies, we invest in equity securities of certain private biotechnology
companies. These investments are included in other assets in our Consolidated
Balance Sheets and are carried at cost. We also invest in a limited partnership
investment fund that is accounted for under the equity method. We periodically
review our investments for impairment; however, the impairment analysis requires
significant judgment in identifying events or circumstances that would likely
have significant adverse effect on the fair value of the investment. The
analysis may include assessment of the investee’s (i) revenue and earnings
trend, (ii) business outlook for its products and technologies,
(iii) liquidity position and the rate at which it is using its cash, and
(iv) likelihood of obtaining subsequent rounds of financing. If an investee
obtains additional funding at a valuation lower than our carrying value, we
presume that the investment is other than temporarily impaired. We have
experienced impairments in our portfolio due to the decline in the value of
certain of our non-marketable investments over the past few years.
GOODWILL
AND ACQUIRED TECHNOLOGY RIGHTS
Goodwill
represents the difference between the purchase price and the estimated fair
value of the identifiable net assets acquired arising from business
combinations. Goodwill is assessed for impairment at least annually or whenever
changes in circumstances indicate that the carrying amount may not be
recoverable from estimated future cash flows. Factors that may be considered a
change in circumstance indicating the carrying value of our intangible assets,
including goodwill, may not be recoverable include, but are not limited to,
significant underperformance relative to historical or projected future
operating results, a significant decline in our stock price and market
capitalization, and negative industry or economic trends. Any excess of the
carrying value of the goodwill over the implied fair value of the goodwill will
be recorded as an impairment loss.
In 2008,
as a result of our annual impairment test, we determined that all remaining
goodwill derived from our acquisitions was impaired. We recorded a goodwill
impairment charge of $239.1 million in the line labeled “Goodwill
impairment charges” in the Consolidated Statements of Operations during the year
ended December 31, 2008. Refer to “Item 8. Financial Statements and
Supplementary Data—Note 10. Goodwill and Acquired Technology Rights” for further
information.
Acquired
technology rights are carried at cost less accumulated amortization and are
comprised of licenses to technology covered by patents held by third parties or
acquired by the Company. Amortization is computed over the estimated useful life
of the underlying patents, which historically has ranged from one to thirteen
years. Purchased intangible assets other than goodwill are amortized over their
useful lives. We performed an impairment analysis on our identified intangible
assets and determined that there were no indicators of impairment as of December
31, 2009. In 2008, we recognized an impairment loss on acquisition-related
intangible assets of $5.5 million of which $1.9 million was included
as a component of “Cost of product sales”, $3.2 million was included as a
component of “Research and development”, and $0.4 million was included as a
component of “Selling, general and administration” expenses in the Consolidated
Statements of Operations for the year ended December 31, 2008. Refer to
“Item 8. Financial Statements and Supplementary Data—Note 10. Goodwill and
Acquired Technology Rights” for further information.
The
determination as to whether a write-down of goodwill and other intangible
assets, including acquired technology rights, is necessary, involves significant
judgment based on short-term and long-term projections of our operations. The
assumptions supporting the estimated future cash flows of the reporting unit,
including profit margins, long-term forecasts of the amounts and timing of
overall market growth and our percentage of that market, discount rates and
terminal growth rates, reflect our best estimates.
IMPAIRMENT
OF LONG-LIVED ASSETS
Long-lived
assets and certain identifiable intangible assets are reviewed for impairment
when events or changes in circumstances indicate that the carrying amount of
such assets may not be recoverable. Determination of recoverability is based on
an estimate of undiscounted future cash flows resulting from the use of the
asset and its eventual disposition. In the event that such cash flows are not
expected to be sufficient to recover the carrying amount of the assets, the
assets are written down to their estimated fair values. For the years ended
December 31, 2009 and 2008, the Company determined that the carrying value of
its capitalized software exceeded its net realizable value by $1.0 million and
$2.3 million, respectively, and recorded the impairment charges as a component
of “Cost of product sales” in the Consolidated Statements of Operations. Refer
to “Item 8. Financial Statements and Supplementary Data—Note 2, Summary of
Significant Accounting Policies – Software Development Costs” for further
information. In connection with the Company’s restructuring activities in 2008,
the Company wrote-down the value of certain of its property and equipment by
approximately $36.9 million which was included as a component of
“Restructuring charges” in the Consolidated Statement of Operations for the year
ended December 31, 2008. Refer to “Item 8. Financial Statements and
Supplementary Data—Note 3. Restructuring” for further information.
INCOME
TAXES
Income
tax expense is based on pretax financial accounting income. Under the asset and
liability method, deferred tax assets and liabilities are determined based on
the difference between the financial statement and tax basis of assets and
liabilities using enacted tax rates in effect for the year in which the
differences are expected to reverse. We must assess the likelihood that the
resulting deferred tax assets will be realized. To the extent we believe that
realization is not more likely than not, we establish a valuation allowance.
Significant estimates are required in determining our provision for income
taxes, our deferred tax assets and liabilities, and any valuation allowance to
be recorded against our deferred tax assets. Some of these estimates are based
on interpretations of existing tax laws or regulations. We believe that our
estimates are reasonable and that our reserves for income tax related
uncertainties are adequate. Various internal and external factors may have
favorable or unfavorable effects on our future effective tax rate. These factors
include, but are not limited to, changes in overall levels, character, or
geographical mix of pretax earnings, changes in tax laws, regulations and/or
rates, changing interpretations of existing tax laws or regulations, changes in
the valuation of our deferred tax assets or liabilities, future levels of
research and development spending, nondeductible expenses, and ultimate outcomes
of income tax audits.
The total
amount of unrecognized tax benefits as of December 31, 2009 was
approximately $19.9 million. If recognized, the amount of unrecognized tax
benefits that would impact income tax expense is $2.1 million. As of
December 31, 2009, we do not anticipate any material changes to the amount
of unrecognized tax benefit during the
next twelve months.
We
classify interest and penalties related to tax positions as components of income
tax expense. For the year ended December 31, 2009, the amount of accrued
interest and penalties related to tax uncertainties was approximately
$0.1 million for a total cumulative amount of $0.4 million of
non-current income taxes payable as of December 31, 2009.
We
file U.S. federal, state, and foreign income tax returns in jurisdictions
with varying statutes of limitations. The 1992 through 2009 tax years generally
remain subject to examination by federal and state tax authorities. In
significant foreign jurisdictions, the 2006 through 2009 tax years generally
remain subject to examination by their respective tax authorities.
CONTINGENCIES
We are
subject to legal proceedings principally related to intellectual property
matters. Based on the information available at the balance sheet dates, we
assess the likelihood of any adverse judgments or outcomes to these matters, as
well as potential ranges of probable losses. If losses are probable and
reasonably estimable, we will record a reserve which may change in the future
due to new developments in each matter.
ACCOUNTING
FOR STOCK-BASED COMPENSATION
We
account for employee stock-based compensation by estimating the fair value of
our employee stock awards at the date of grant using the Black-Scholes
option-pricing model, which requires the use of certain subjective assumptions.
The most significant of these assumptions are our estimates of the expected
term, volatility and forfeiture rates of the awards. The expected stock price
volatility assumption was determined using a combination of historical and
implied volatility of our common stock. We determined that blended volatility is
more reflective of market conditions and a better indicator of expected
volatility than historical volatility. The estimate of these key assumptions is
based on historical information and judgment regarding market factors and
trends. As required under the accounting rules, we review our valuation
assumptions at each grant date and, as a result, we are likely to change our
valuation assumptions used to value employee stock-based awards granted in
future periods.
US GAAP
requires that employee stock-based compensation costs be recognized over the
requisite service period, or the vesting period, in a manner similar to all
other forms of compensation paid to employees. Accordingly, in 2009, we
recognized employee stock-based compensation of $11.1 million, which consisted
of $1.7 million in cost of product sales, $2.2 million in research and
development expense and $7.2 million in selling, general and administrative
expenses. As of December 31, 2009, $23.0 million of total unrecognized
compensation cost related to non-vested employee stock awards not yet recognized
is expected to be allocated to cost of products sales and operating expenses
over a weighted-average period of 2.8 years.
RESTRUCTURING
In recent
years we engaged in restructuring actions, which require management to utilize
significant estimates related to expenses for severance and other employee
separation costs, lease cancellation, realizable values of assets that may
become duplicative or obsolete, and other exit costs. If the actual amounts
differ from our estimates, the amount of the restructuring charges could be
materially impacted. Refer to “Item 8. Financial Statements and Supplementary
Data—Note 3. Restructuring” for further information.
RECENT
ACCOUNTING PRONOUNCEMENTS
In
June 2009, the Financial Accounting Standards Board (“FASB”) established
the FASB Accounting Standards Codification ("FASB ASC") as the source of
authoritative accounting principles recognized by the FASB. The FASB
will issue new standards in the form of Accounting Standards Updates ("FASB
ASUs"). FASB ASC is effective for financial statements issued for interim and
annual periods ending after September 15, 2009 and therefore is effective
for us in the third quarter of fiscal 2009. The issuance of FASB ASC does not
change US GAAP and therefore the adoption of FASB ASC only affects the specific
references to US GAAP literature in the notes to our consolidated financial
statements.
In February 2010, the FASB issued FASB
ASU 2010-09, Subsequent
Events, Amendments to Certain Recognition and Disclosure Requirements,
which clarifies certain existing evaluation and disclosure requirements in ASC
855 related to subsequent events. FASB ASU 2010-09 requires SEC filers to
evaluate subsequent events through the date in which the financial statements
are issued and is effectively immediately. The new guidance does not have an
effect on our consolidated results of operations and financial
condition.
In January 2010, the FASB issued FASB
ASU 2010-06, Improving
Disclosures about Fair Value Measurements which clarifies certain
existing disclosure requirements in ASC 820 as well as requires disclosures
related to significant transfers between each level and additional information
about Level 3 activity. FASB ASU 2010-06 begins phasing in the first fiscal
period after December 15, 2009. The Company is currently assessing the impact on
our consolidated results of operations and financial
condition.
In
October 2009, the FASB issued FASB ASU No. 2009-13, Revenue Recognition (Topic
605): Multiple Deliverable
Revenue Arrangements – A Consensus of the FASB Emerging Issues Task
Force.” This standard provides application guidance on whether multiple
deliverables exist, how the deliverables should be separated and how the
consideration should be allocated to one or more units of accounting. This
update establishes a selling price hierarchy for determining the selling price
of a deliverable. The selling price used for each deliverable will be based on
vendor-specific objective evidence, if available, third-party evidence if
vendor-specific objective evidence is not available, or estimated selling price
if neither vendor-specific or third-party evidence is available. The Company
will adopt this guidance from January 1, 2010. The Company has assessed the
impact of adoption and it is not expected to have a material effect on our
consolidated results of operations and financial condition.
In August 2009, the FASB issued FASB ASU No. 2009-05, Fair Value
Measurements and Disclosures (Topic 820): Measuring Liabilities at Fair
Value. This standard provides authoritative guidance related to measuring
liabilities at fair value when quoted prices in an active market for identical
liabilities are not available. FASB ASU 2009-05 clarifies the concept that a
fair value measurement should be based on hypothetical transfer at the
measurement date, even for liabilities that are generally never transferred, but
are settled directly with the creditor. Quoted prices of similar liability or of
the liability when it is traded as an asset should also be considered when
determining the liability’s fair value. The provisions of FASB ASU 2009-05 were
effective for the year ended December 31, 2009 and did not have an effect on our
consolidated results of operations and financial condition.
In June
2009, the FASB issued guidance which amends certain FASB ASC concepts related to
consolidation of variable interest entities (“VIE”). Among other accounting and
disclosure requirements, this guidance replaces the quantitative-based risks and
rewards calculation for determining which enterprise has a controlling financial
interest in a variable interest entity with an approach focused on identifying
which enterprise has the power to direct the activities of a variable interest
entity and the obligation to absorb losses of the entity or the right to receive
benefits from the entity. The primary beneficiary assessment must be performed
on a continuous basis. It also requires additional disclosures about
an entity’s involvement with a VIE, restrictions on the VIE’s assets and
liabilities that are included in the reporting entity’s consolidated balance
sheet, significant risk exposures due to the entity’s involvement with the VIE,
and how its involvement with a VIE impacts the reporting entity’s consolidated
financial statements. The Company will adopt this guidance from January 1, 2010
and does not expect it to have a significant effect on our consolidated results
of operations and financial condition.
RESULTS
OF OPERATIONS
The
following discussion compares the historical results of operations for the years
ended December 31, 2009, 2008 and 2007.
PRODUCT
SALES (in thousands, except percentage amounts)
The
components of product sales are as follows (in thousands, except percentage
amounts):
|
Dollar
|
Percentage
|
|||||||||||||||||||||||||||
|
Year
ended December 31,
|
change
from
|
change
from
|
||||||||||||||||||||||||||
|
2009
|
2008
|
2007
|
2008
|
2007
|
2008
|
2007
|
||||||||||||||||||||||
|
Consumables
|
$ | 255,660 | $ | 248,903 | $ | 253,150 | $ | 6,757 | $ | (4,247 | ) | 3 | % | (2 | )% | |||||||||||||
|
Instruments
|
23,526 | 21,489 | 38,678 | 2,037 | (17,189 | ) | 9 | (44 | ) | |||||||||||||||||||
|
Total
product sales
|
$ | 279,186 | $ | 270,392 | $ | 291,828 | $ | 8,794 | $ | (21,436 | ) | 3 | (7 | ) | ||||||||||||||
Total product sales increased $8.8
million or 3% in 2009 as compared to 2008. Consumables sales increased as a
result of a higher volume of sales of our RNA analysis chips and additional
revenues from our acquisition of Panomics in December 2008. This was partially
offset by a decline in volume of our DNA analysis chips and lower overall
average selling prices, partially due to a shift in product mix to lower-priced
products. Additionally, instruments revenue increased due to the introduction of
the GeneTitan® family of products in 2009. In constant currency terms, 2009 was
positively impacted by $2.1 million as compared to 2008.
Total
product sales decreased $21.4 million or 7% in 2008 as compared to 2007.
Consumables sales decreased primarily due to a decline in volumes across most of
the consumables product line, partially offset by higher consumables average
selling prices due to mix shift to higher average selling priced products as
well as higher reagents volumes associated with the acquisition of USB. In
addition, instrument sales declined primarily due to a decrease in unit sales of
our Probe Array systems and GeneChip®
Scanners.
Consumables
sales for the years ended December 31, 2008 and 2007 include
$0.8 million and $12.0 million, respectively, of revenue from Perlegen
Sciences, Inc. (“Perlegen”), a related party. There was no revenue from
Perlegen in 2009.
|
Dollar
|
Percentage
|
|||||||||||||||||||||||||||
|
Year
ended December 31,
|
change
from
|
change
from
|
||||||||||||||||||||||||||
|
2009
|
2008
|
2007
|
2008
|
2007
|
2008
|
2007
|
||||||||||||||||||||||
|
Services
|
$ | 39,563 | $ | 32,096 | $ | 38,074 | $ | 7,467 | $ | (5,978 | ) | 23 | % | (16 | )% | |||||||||||||
Total services revenue increased in
2009 as compared to 2008 primarily due to the growth in our scientific services
business associated with several genotyping projects, including Wellcome Trust
Case Consortium and the National Institutes of Health. These projects began in
the fourth quarter of 2008 and were substantially completed in the fourth
quarter of 2009. We currently have not entered into any other significant
contracts for other projects. In constant currency terms, 2009 was positively
impacted by $2.3 million as compared to 2008.
Total services revenue decreased in
2008 as compared to 2007 primarily due to a decrease of $7.9 million in our
genotyping services business because of the variable timing of projects,
partially offset by an increase of $1.9 million in instrument service
revenue.
ROYALTY
AND OTHER REVENUE (in thousands, except percentage amounts)
|
Dollar
|
Percentage
|
|||||||||||||||||||||||||||
|
Year
ended December 31,
|
change
from
|
change
from
|
||||||||||||||||||||||||||
|
2009
|
2008
|
2007
|
2008
|
2007
|
2008
|
2007
|
||||||||||||||||||||||
|
Royalties
and other revenue
|
$ | 8,345 | $ | 107,761 | $ | 41,418 | $ | (99,416 | ) | $ | 66,343 | (92 | )% | 160 | % | |||||||||||||
Royalties and other revenue decreased
in 2009 as compared to 2008 primarily due to a non-recurring $90 million
intellectual property payment received in January 2008. Additionally, research
revenue decreased by $4.1 million in 2009 as compared to 2008 as National
Institutes of Health grants expired in 2009. In constant currency terms, 2009
was positively impacted by less than $0.1 million as compared to
2008.
Royalties and other revenue increased
in 2008 as compared to 2007 primarily due to a non-recurring $90 million
intellectual property payment received in January 2008, partially offset by
higher license and grant revenue recognized in 2007. In January 2003, under the
terms of an expanded collaboration agreement, Roche paid us an access fee of
$70 million, which we recognized as a component of product related revenue
in license fees on a straight-line basis over the research and development
period of approximately five years. The amortization of this access fee was
completed in 2007.
PRODUCT
AND SERVICES GROSS MARGINS (in thousands, except percentage
amounts)
|
Dollar/Point
|
||||||||||||||||||||
|
Year
ended December 31,
|
change
from
|
|||||||||||||||||||
|
2009
|
2008
|
2007
|
2008
|
2007
|
||||||||||||||||
|
Total
gross margin on product sales
|
$ | 152,809 | $ | 143,483 | $ | 182,944 | $ | 9,326 | $ | (39,461 | ) | |||||||||
|
Total
gross margin on services
|
15,683 | 6,975 | 8,472 | 8,708 | (1,497 | ) | ||||||||||||||
|
Product
gross margin as a percentage of products sales
|
55 | % | 53 | % | 63 | % | 2 | (10 | ) | |||||||||||
|
Service
gross margin as a percentage of services
|
40 | % | 22 | % | 22 | % | 18 | - | ||||||||||||
The
increase in product gross margin in 2009 as compared to 2008 is primarily due to
favorable factory utilization from higher production volumes in arrays as a
result of the plant consolidation to Singapore in 2009. These increases were
partially offset by an unfavorable shift from higher margin array products to
lower margin reagent products.
The decrease in product gross margin in
2008 as compared to 2007 is primarily due to asset impairments and restructuring
related to the closing of our West Sacramento manufacturing facility,
unfavorable factory utilization due to lower production volumes and a mix shift
to lower margin instruments products. These decreases were partially offset by
favorable consumable average selling prices due to a mix shift to higher margin
products.
Gross
margin on product sales for the years ended December 31, 2008 and 2007
includes $0.4 million and $7.3 million, respectively, of gross margin from
Perlegen. There was no gross margin impact from Perlegen in 2009.
Service
gross margin increased in 2009 as compared to 2008 by 18 percentage points
primarily due to the higher revenues in scientific services from the Wellcome
Trust Case Consortium project.
RESEARCH
AND DEVELOPMENT EXPENSES (in thousands, except percentage amounts)
|
Dollar
|
Percentage
|
|||||||||||||||||||||||||||
|
Year
ended December 31,
|
change
from
|
change
from
|
||||||||||||||||||||||||||
|
2009
|
2008
|
2007
|
2008
|
2007
|
2008
|
2007
|
||||||||||||||||||||||
|
Research
and development
|
$ | 77,358 | $ | 84,482 | $ | 72,740 | $ | (7,124 | ) | $ | 11,742 | (8 | )% | 16 | % | |||||||||||||
The decrease in research and
development expenses in 2009 of $7.1 million as compared to 2008 was primarily
due to decreased spending for consulting and purchased services as grant
research projects were completed during the year. Masks, chips and supplies also
decreased as certain products were commercialized in 2009. Additionally, we
recognized an intangible asset impairment charge of $3.2 million in 2008. The
decrease during 2009 was partially offset by an increase in headcount-related
expenses and variable compensation.
The
increase in research and development expenses in 2008 as compared to 2007 was
primarily due to higher headcount related expenses and increased spending for
supplies and outside services. Also included in 2008 is an asset impairment
charge of $3.2 million.
SELLING,
GENERAL AND ADMINISTRATIVE EXPENSES (in thousands, except percentage
amounts)
|
Dollar
|
Percentage
|
|||||||||||||||||||||||||||
|
Year
ended December 31,
|
change
from
|
change
from
|
||||||||||||||||||||||||||
|
2009
|
2008
|
2007
|
2008
|
2007
|
2008
|
2007
|
||||||||||||||||||||||
|
Selling,
general and administrative
|
$ | 130,838 | $ | 127,161 | $ | 138,488 | $ | 3,677 | $ | (11,327 | ) | 3 | % | (8 | )% | |||||||||||||
The increase in selling, general and
administrative expenses in 2009 of $3.7 million as compared to 2008 was
primarily due to increases of $1.6 million in compensation and benefits expense,
including commissions and variable compensation expenses, $3.4 million in legal
expenses primarily resulting from increased litigation during the year, and $1.5
million in depreciation and amortization expense from intangible assets related
to the Panomics acquisition. These increases were partially offset by decreases
of $1.3 million from consulting and purchased services, due to lower advertising
and travel expenses, and $1.4 million from headcount-related expenses in 2009
compared to 2008.
The decrease in selling, general and
administrative expenses in 2008 as compared to 2007 was primarily due to a
decrease in bonus and sales incentive based payments plus lower stock- based
compensation expense.
ACQUIRED
IN-PROCESS TECHNOLOGY (in thousands, except percentage amounts)
|
Dollar
|
Percentage
|
|||||||||||||||||||||||||||
|
Year
ended December 31,
|
change
from
|
change
from
|
||||||||||||||||||||||||||
|
2009
|
2008
|
2007
|
2008
|
2007
|
2008
|
2007
|
||||||||||||||||||||||
|
Acquired
in-process technology
|
$ | - | $ | 6,200 | $ | - | $ | (6,200 | ) | $ | 6,200 | (100 | )% | 100 | % | |||||||||||||
In 2008, for each of the three
acquisitions we made, USB, TMI and Panomics, we recognized the estimated fair
value of certain research and development programs in-process that had not yet
reached technological feasibility and had no alternative future use, totaling
$0.8 million, $5.1 million and $0.3 million, respectively. The fair values of
these projects were determined using the income approach whereby we estimated
each project’s related future net cash flows. We used a discount rate based on
our estimated weighted average cost of capital, adjusted upward for the risks
associated with the projects acquired. The projected cash flows from the
acquired projects were based on estimates of revenues and operating profits
related to the projects of each acquired company considering the stage of
development of each potential product acquired, the time and resources needed to
complete the development and approval of each product, the life of each
potential commercialized product and the inherent difficulties and uncertainties
in developing products and services based on complex genetic technologies and
biochemical processes.
The
largest research and development program in-process at the acquisition date
primarily was the microRNA profiling project undertaken by TMI. The fair value
of this project was determined using the income approach whereby we estimated
the project’s related future net cash flows between 2009 and 2015 and discounted
them to their present value using a risk adjusted discount rate of approximately
30%. We used a discount rate based on our estimated weighted average cost of
capital, adjusted upward for the risks associated with the project acquired. We
completed this project in fiscal 2009.
RESTRUCTURING
(in thousands, except percentage amounts)
|
Dollar
|
Percentage
|
|||||||||||||||||||||||||||
|
Year
ended December 31,
|
change
from
|
change
from
|
||||||||||||||||||||||||||
|
2009
|
2008
|
2007
|
2008
|
2007
|
2008
|
2007
|
||||||||||||||||||||||
|
Restructuring
|
$ | 2,180 | $ | 43,707 | $ | 15,296 | $ | (41,527 | ) | $ | 28,411 | (95 | )% | 186 | % | |||||||||||||
In 2006, 2007 and 2008, we initiated restructuring plans
designed to improve our operating leverage and completed them in 2009. The
effects of these restructuring plans on our results of operations are discussed
below.
Fiscal
2008 Restructuring Plan
In
February 2008, we committed to a restructuring plan (the “2008 Plan”) to close
our West Sacramento manufacturing facility after which all of our products will
be manufactured at our Singapore and Ohio facilities, as well as by third
parties. We completed the closure of the West Sacramento facility during the
second quarter of 2009.
The cash
outlays incurred in connection with the 2008 Plan were approximately
$8.2 million which consisted primarily of employee severance. During the
years ended December 31, 2009 and 2008, we recognized approximately
$2.4 million and $5.8 million, respectively, of expense for employee
termination benefits associated with the 2008 Plan and $(0.2) million and
$37.1 million, respectively, of non-cash credits and charges related to the
abandonment and impairment of certain manufacturing assets such as a building,
leasehold improvements and mask aligners and synthesizer equipment utilized in
the manufacturing of probe arrays. These expenses are presented as a component
of “Restructuring charges” in our Consolidated Statements of
Operations.
In
addition to the $45.1 million of restructuring costs noted above, we expect
to incur a total of approximately $18.1 million of restructuring related costs
that are included as a component of “Cost of product sales” in our Consolidated
Statements of Operations. Of this total, $13.9 million related to
accelerated depreciation charges associated with the continued use of certain
long-lived manufacturing assets and $4.2 million related to manufacturing
transition and other costs. As of December 31, 2009, we have incurred $17.4
million of these costs which was recorded to “Cost of product
sales.”
Fiscal
2007 Restructuring Plan
In July
2007, we announced that we were consolidating an administrative facility located
in Sunnyvale, California into our main campus in Santa Clara, California (the
“2007 Plan”). Additionally, in August and December 2007, we terminated certain
employees in the research and development and selling, general and
administrative functions. The Sunnyvale, California facility was vacated during
the fourth quarter of 2007. The cash outlays incurred in connection with these
restructuring activities were approximately $4.6 million. During the years
ended December 31, 2009 and 2008, the expenses recognized that were
associated with the 2007 Plan were not material. During the year ended
December 31, 2007, we recognized approximately $4.2 million of expense
primarily related to employee termination benefits and contract termination
costs associated with the 2007 Plan. These expenses are presented as a component
of “Restructuring charges” in our Consolidated Statements of Operations. As of
December 31, 2009, we have incurred the majority of the costs related to the
2007 Plan except for the remaining contract termination costs of less than $0.1
million.
Fiscal
2006 Restructuring Plan
In 2006,
we initiated a restructuring plan (the “2006 Plan”) to better align certain of
our expenses with our current business outlook. Our primary focus of the 2006
Plan was in the general and administrative functions and included rationalizing
our facilities. Cash outlays incurred in connection with these restructuring
activities were approximately $16.8 million. During the years ended
December 31, 2009 and 2008, the amount of expense recognized associated
with the 2006 Plan was not material. During the year ended December 31,
2007, we recognized approximately $11.1 million of expense primarily
related to employee termination benefits and contract termination costs
associated with the 2006 Plan. These expenses are presented as a component of
“Restructuring charges” in our Consolidated Statements of Operations. As of
December 31, 2009, we have incurred the majority of the costs related to the
2006 Plan except for the remaining contract termination costs of approximately
$0.3 million.
GOODWILL
IMPAIRMENT CHARGES (in thousands, except percentage amounts)
|
Dollar
|
Percentage
|
|||||||||||||||||||||||||||
|
Year
ended December 31,
|
change
from
|
change
from
|
||||||||||||||||||||||||||
|
2009
|
2008
|
2007
|
2008
|
2007
|
2008
|
2007
|
||||||||||||||||||||||
|
Goodwill
impairment charges
|
$ | (450 | ) | $ | 239,098 | $ | - | $ | (239,548 | ) | $ | 239,098 | (100 | )% | 100 | % | ||||||||||||
In the fourth quarter of 2008, we
determined that goodwill was permanently impaired and its carrying amount was
not recoverable from estimated future cash flows based on the continued decline
in our stock price throughout 2008 and other conditions in our business,
including decreases in our actual revenues as compared to our forecasted
revenues and additional restructuring activities. We recognized an impairment
charge of $239.1 million to write off our entire goodwill balance as of December
31, 2008. In 2009, we received payment on a claim to recover approximately $0.5
million from the USB acquisition indemnity escrow for certain tax liabilities
that were not recognized, and recorded it as a partial recovery of the goodwill
impairment charges.
INTEREST
INCOME AND OTHER, NET (in thousands, except percentage amounts)
The
components of interest income and other, net, are as follows:
|
Dollar
|
Percentage
|
|||||||||||||||||||||||||||
|
Year
ended December 31,
|
change
from
|
change
from
|
||||||||||||||||||||||||||
|
2009
|
2008
|
2007
|
2008
|
2007
|
2008
|
2007
|
||||||||||||||||||||||
|
Interest
income
|
$ | 4,455 | $ | 14,579 | $ | 13,812 | $ | (10,124 | ) | $ | 767 | (69 | )% | 6 | % | |||||||||||||
|
Realized
(loss) gain on equity investments, net
|
(916 | ) | 1,201 | 1,273 | (2,117 | ) | (72 | ) | (176 | ) | (6 | ) | ||||||||||||||||
|
Currency
(loss) gain, net
|
(2,800 | ) | (2,188 | ) | 276 | (612 | ) | (2,464 | ) | 28 | (893 | ) | ||||||||||||||||
|
Other
|
1,850 | 1,037 | 59 | 813 | 978 | 78 | 1,658 | |||||||||||||||||||||
|
Total
interest income and other, net
|
$ | 2,589 | $ | 14,629 | $ | 15,420 | $ | (12,040 | ) | $ | (791 | ) | (82 | ) | (5 | ) | ||||||||||||
Interest income and other, net
decreased in 2009 as compared to 2008 primarily due to the $10.1 million
decrease in interest income resulting from lower average cash and investment
balances combined with lower effective interest rates in 2009 compared to 2008.
Realized (losses) gain on equity investments decreased by $2.1 million, net,
primarily due to a $1.1 million other-than-temporary impairment we recognized in
our nonmarketable securities portfolio in 2009 compared to none recognized in
2008. Additionally, we realized gains of $0.4 million on our equity investments
in fiscal year 2009 compared to $1.4 million in fiscal year 2008.
Interest income and other, net
decreased in 2008 as compared to 2007 primarily due to the recognition of
$2.2 million in foreign currency losses and the recognition of a
$6.0 million net gain on an equity investment in 2007. This decrease was
partially offset by an increase in other income and interest earned on our
higher average total cash balances.
INTEREST
EXPENSE (in thousands, except percentage amounts)
|
Dollar
|
Percentage
|
|||||||||||||||||||||||||||
|
Year
ended December 31,
|
change
from
|
change
from
|
||||||||||||||||||||||||||
|
2009
|
2008
|
2007
|
2008
|
2007
|
2008
|
2007
|
||||||||||||||||||||||
|
Interest
expense
|
$ | 10,945 | $ | 14,091 | $ | 3,218 | $ | (3,146 | ) | $ | 10,873 | (22 | )% | 338 | % | |||||||||||||
Interest expense decreased in 2009 as
compared to 2008 primarily due to lower aggregate principal balance of the
senior convertible notes resulting from our repurchases of $69.1 million in
aggregate principal amount of our 3.50% senior convertible notes in the second
quarter of 2009 and $119.9 million in aggregate principal amount of our 0.75%
senior convertible notes in the fourth quarter of 2008.
Interest expense increased in 2008 as
compared to 2007 as we began recognizing interest expense on our 3.50% senior
convertible notes issued in November 2007.
INCOME
TAX (BENEFIT) PROVISION (in thousands, except percentage amounts)
|
Dollar
|
Percentage
|
|||||||||||||||||||||||||||
|
Year
ended December 31,
|
change
from
|
change
from
|
||||||||||||||||||||||||||
|
2009
|
2008
|
2007
|
2008
|
2007
|
2008
|
2007
|
||||||||||||||||||||||
|
Income
tax (benefit) provision
|
$ | (158 | ) | $ | 65,918 | $ | 5,689 | $ | (66,076 | ) | $ | 60,229 | (100 | )% | 1,059 | % | ||||||||||||
The income tax benefit in 2009 was
approximately $0.2 million, which consisted of foreign taxes and state taxes
offset by a federal refundable alternative minimum tax credit and research tax
credit. The provision for income taxes in 2008 was approximately $65.9 million,
which consisted of foreign taxes, state taxes and the establishment of a full
valuation allowance against our U.S. deferred tax assets, net of reserves for
uncertain tax positions. The provision for income taxes in 2007 was
approximately $5.7 million, which consisted of federal, state and foreign taxes
offset by federal and state research tax credits.
Deferred
tax assets are recognized if realization of such assets is more likely than not.
As of December 31, 2009, we provided for a valuation allowance of
$139.3 million against our net deferred tax assets. As a result of negative
evidence based on our cumulative net loss position, we have placed a full
valuation allowance on U.S. deferred tax assets, net of reserves for uncertain
tax positions. We intend to maintain the valuation allowance until sufficient
positive evidence exists to assure realization of these tax benefits through
future taxable income.
As of
December 31, 2009, the Company had total net operating loss carryforwards
of $242.2 million, comprised of $134.9 million for U.S. federal
purposes, which expire in the years 2020 through 2029 if not utilized, and
$107.3 million for state purposes, the majority of which expire in the
years 2011 through 2029 if not utilized. Utilization of net operating loss
carryforwards may be subject to substantial annual limitations due to the
ownership change limitations provided by the Internal Revenue Code and similar
state provisions. Such an annual limitation may result in the expiration of the
net operating loss before utilization.
LIQUIDITY
AND CAPITAL RESOURCES
Cashflow
(in thousands)
|
Year
ended December 31,
|
||||||||||||
|
2009
|
2008
|
2007
|
||||||||||
|
Net
cash provided by operating activities
|
$ | 9,327 | $ | 83,511 | $ | 32,336 | ||||||
|
Net
cash used in investing activities
|
(7,190 | ) | (151,062 | ) | (194,096 | ) | ||||||
|
Net
cash (used in) provided by financing activities
|
(50,073 | ) | (108,185 | ) | 330,930 | |||||||
|
Effect
of foreign currency translation on cash and cash
equivalents
|
286 | 384 | 411 | |||||||||
|
Net
(decrease) increase in cash and cash equivalents
|
$ | (47,650 | ) | $ | (175,352 | ) | $ | 169,581 | ||||
Net
Cash Provided by Operating Activities
Cash
provided by operating activities is net (loss) income adjusted for certain
non-cash items and changes in operating assets and liabilities. For the year
ended December 31, 2009, cash provided by operating activities was
comprised of a net loss of $23.9 million and non-cash charges that included
depreciation and amortization of $45.1 million, stock-based compensation
expense of $11.1 million and a gain on sale from the repurchase of
convertible notes of $17.4 million. Changes in operating assets and liabilities
resulting in a decrease of cash of approximately $8.7 million for the year
ended December 31, 2009 is primarily driven by:
|
·
|
a
net decrease in prepaid expenses and other assets and restricted cash
balances of $4.1 million primarily related to the receipt of a non-trade
receivable and the release of restricted cash balances due to the
settlement of obligations;
|
|
·
|
a
net increase in accounts payable due to the timing of payments for
operating costs;
|
|
·
|
a
net increase in compensation and benefits of $5.0 million as a result of
the release of accrued severance related to the 2008 restructuring
activities and timing of payments;
|
|
·
|
a
net decrease in semi-annual interest balances on our convertible debt of
$1.1 million;
|
|
·
|
a
payment related to the shareholders’ lawsuit settlement in 2009 of $3.5
million; and
|
|
·
|
an
increase in annual variable compensation of $5.5
million.
|
Net
Cash Used in Investing Activities
Our
investing activities, other than purchases, sales and maturities of
available-for-sale securities, primarily consist of capital expenditures,
strategic investments and purchased technology rights.
Cash used
for capital expenditures was $10.2 million, $13.8 million and
$27.4 million for the years ended December 31, 2009, 2008 and 2007,
respectively. Our capital expenditures in 2009 were primarily due to the
transition of manufacturing operations to Singapore and Ohio, as well as
investments in the re-engineering of our technology platform. Our capital
expenditures in 2008 primarily related to our manufacturing facility in
Singapore and network upgrades, including the capitalization of cost related to
our new enterprise resource planning system. Our capital expenditures in 2007
primarily related to the completion of our manufacturing expansion and the
capitalization of our new enterprise resource planning system.
In 2008,
we paid approximately $156.2 million, net of cash acquired, for
acquisitions of businesses.
Net
Cash (Used in) Provided by Financing Activities
Our
financing activities for fiscal 2009 primarily consist of the repurchase of
approximately $69.1 million of aggregate principal amount of our 3.50%
convertible notes for total considerations of $50.7 million, including accrued
interest and transaction fees. Our financing activities for fiscal 2008
primarily consist of the repurchase of $119.9 million of aggregate
principal amount of our 0.75% senior convertible notes at par, offset by excess
tax benefits for stock-based compensation. Our financing activities for fiscal
2007 primarily consist of the issuance of $316.3 million principal amount
of 3.50% senior convertible note due 2038.
Cash
provided by (used in) the issuance of stock, net of treasury shares withheld for
taxes, under our employee stock plan was $(0.8) million, less than $(0.1)
million and $13.7 million in 2009, 2008 and 2007,
respectively.
Liquidity
Historically,
we have financed our operations primarily through product sales; sales of equity
and debt securities such as our 0.75% and 3.50% convertible notes in 2003 and
2007, respectively, and the exercise of stock options and participation in our
stock plans; collaborative agreements; interest income; and licensing of our
technology.
Our cash
outflows have generally been as follows cash used in operating activities such
as research and development programs, sales and marketing activity, procurement
and growth of inventory, compensation and benefits of our employees and other
working capital needs; cash paid for acquisitions; cash paid for litigation
activity and settlements; cash used for our stock repurchases; and interest
payments on our convertible notes obligations.
As of December 31, 2009, we had
cash, cash equivalents, and available-for-sale securities of approximately
$346.6 million. We anticipate that our existing capital resources along
with the cash to be generated from operations will enable us to maintain
currently planned operations, acquisitions and capital expenditures, for the
foreseeable future. Capital expenditures are estimated to be approximately $11.0
million for the year ending December 31, 2010.
However,
this expectation is based on our current operating and financing plans, which
are subject to change, and therefore we could require additional funding.
Factors that may cause us to require additional funding may include, but are not
limited to, future acquisitions; our ability to maintain existing collaborative
and customer arrangements and establish and maintain new collaboration and
customer arrangements; the progress of our research and development programs;
initiation or expansion of research programs and collaborations; the costs
involved in preparing, filing, prosecuting, defending and enforcing intellectual
property rights; the effectiveness of product commercialization activities and
arrangements; the purchase of patent licenses; and other factors.
As of
December 31, 2009, we have no credit facility or other committed sources of
capital. To the extent capital resources are insufficient to meet future capital
requirements; we will have to raise additional funds to continue the development
of our technologies. There can be no assurance that such funds will be available
on favorable terms, or at all. To the extent that additional capital is raised
through the sale of equity or convertible debt securities, the issuance of such
securities could result in dilution to our stockholders. If adequate funds are
not available, we may be required to curtail operations significantly or to
obtain funds by entering into collaboration agreements on unattractive terms.
Our inability to raise capital would have a material adverse effect on our
business, financial condition and results of operations.
From time
to time, we may seek to retire, repurchase, or exchange our convertible
securities or common stock in open market purchases, privately negotiated
transactions dependent on market conditions, liquidity, and contractual
obligations and other factors.
Off-Balance
Sheet Arrangements and Aggregate Contractual Obligations
As of
December 31, 2009, we have no off-balance sheet arrangements. The impact
that our contractual obligations as of December 31, 2009 are expected to
have on our liquidity and cash flow in future periods is as follows (in
thousands):
|
Total
|
2010
|
2011-2012 | 2013-2014 |
After
2014
|
||||||||||||||||
|
Senior
convertible notes (1)
|
$ | 247,201 | $ | - | $ | - | $ | 247,201 | $ | - | ||||||||||
|
Interest
on senior convertible notes (1)(2)
|
43,260 | 8,652 | 17,304 | 17,304 | - | |||||||||||||||
|
Operating
leases
|
28,678 | 8,907 | 13,922 | 5,322 | 527 | |||||||||||||||
|
Purchase
commitments (3)
|
4,324 | 4,324 | - | - | - | |||||||||||||||
|
Total
contractual obligations
|
$ | 323,463 | $ | 21,883 | $ | 31,226 | $ | 269,827 | $ | 527 | ||||||||||
|
(1)
|
Our
3.50% senior convertible notes are due in 2038. However, holders may
require us to repurchase all or a portion of their notes on
January 15, 2013, 2018 and 2028. In June 2009, we repurchased
approximately $69.1 million of aggregate principal amount of our 3.50%
senior convertible notes for $50.1 million in total cash
consideration.
|
|
(2)
|
Our
0.75% senior convertible notes are due in 2033. However, holders may
require us to repurchase all or a portion of their notes on
December 31, 2013, 2018, 2023, and 2028. In December 2008, a total of
$119.9 million of aggregate principal amount of our 0.75% senior
convertible notes was redeemed for cash at par as investors exercised
their put right. An additional $0.1 million was repurchased in
2009.
|
|
(3)
|
Purchase
commitments include agreements to purchase goods or services that are
enforceable and legally binding on Affymetrix and that specify all
significant terms, including: fixed or minimum quantities to be purchased;
fixed, minimum or variable price provisions; and the approximate timing of
the transaction. Purchase obligations exclude agreements that are
cancelable without penalty.
|
The above
table does not reflect unrecognized tax benefits of approximately $19.9 million,
the timing of which is uncertain. Refer to “Item 8. Financial Statements and
Supplementary Data—Note 16. Income Taxes” for additional discussion on
unrecognized tax benefits.
Interest
Rate Risk
Our
exposure to interest rate risk relates primarily to our investment portfolio.
Fixed rate securities may have their fair market value adversely impacted due to
fluctuations in interest rates, while floating rate securities may produce less
income than expected if interest rates fall. Due in part to these factors, our
future investment income may fall short of expectations due to changes in
interest rates or we may suffer losses in principal if forced to sell securities
which have declined in market value due to changes in interest
rates.
The
primary objective of our investment activities is to preserve principal while at
the same time maximize yields without significantly increasing risk. To achieve
this objective, we invest our excess cash in debt instruments of the U.S.
Government and its agencies and high-quality corporate issuers, and, by policy,
restrict our exposure to any single corporate issuer by imposing concentration
limits. To minimize the exposure due to adverse shifts in interest rates, we
maintain investments at an average maturity of less than three
years.
|
Value
at
|
||||||||||||||||||||||||
|
Periods
of Maturity
|
December
31,
|
|||||||||||||||||||||||
|
2010
|
2011
|
2012
|
Thereafter (1)
|
Total
|
2009
|
|||||||||||||||||||
|
ASSETS:
|
||||||||||||||||||||||||
|
Available-for-sale
securities
|
$ | 237,060 | $ | 59,639 | $ | 4,643 | $ | 1,220 | $ | 302,562 | $ | 303,917 | ||||||||||||
|
Average
interest rate
|
1.5 | % | 0.6 | % | 0.1 | % | 1 | % | ||||||||||||||||
|
LIABILITIES:
|
||||||||||||||||||||||||
|
0.75%
senior convertible notes due 2014
|
$ | - | $ | - | $ | - | $ | 0 | $ | 0 | $ | - | ||||||||||||
|
Average
interest rate
|
0.75 | % | ||||||||||||||||||||||
|
3.50%
senior convertible notes due 2038
|
$ | - | $ | - | $ | - | $ | 247,198 | $ | 247,198 | $ | 217,537 | ||||||||||||
|
Average
interest rate
|
3.5 | % | ||||||||||||||||||||||
(1) Remaining
balance at December 31, 2009 on 0.75% senior convertible notes is less than
$0.01 million.
|
Value
at
|
||||||||||||||||||||||||
|
Periods
of Maturity
|
December
31,
|
|||||||||||||||||||||||
|
2009
|
2010
|
2011
|
Thereafter
|
Total
|
2008
|
|||||||||||||||||||
|
ASSETS:
|
||||||||||||||||||||||||
|
Available-for-sale
securities
|
$ | 267,927 | $ | 26,892 | $ | - | $ | - | $ | 294,819 | $ | 297,404 | ||||||||||||
|
Average
interest rate
|
1.7 | % | 3.6 | % | - | - | ||||||||||||||||||
|
LIABILITIES:
|
||||||||||||||||||||||||
|
0.75%
senior convertible notes due 2014
|
$ | - | $ | - | $ | - | $ | 91 | $ | 91 | $ | 90 | ||||||||||||
|
Average
interest rate
|
0.75 | % | ||||||||||||||||||||||
|
3.50%
senior convertible notes due 2038
|
$ | - | $ | - | $ | - | $ | 316,250 | $ | 316,250 | $ | 101,200 | ||||||||||||
|
Average
interest rate
|
3.5 | % | ||||||||||||||||||||||
Foreign
Currency Exchange Rate Risk
We derive
a portion of our revenues in foreign currencies, predominantly in Europe and
Japan. In addition, a portion of our assets are held in nonfunctional currencies
of our subsidiaries. We may conduct hedging activities by using foreign currency
forward and option contracts with financial institutions to manage a portion of
the currency exposures created by our foreign activities. Our net currency loss recognized on business transactions was $2.8
million for the year ended December 31, 2009 and is included in interest income
and other, net. Management will continue to reevaluate foreign currency
exchange rate risk on an ongoing basis. As of December 31, 2009, we had no
open hedging contracts.
INDEX
TO CONSOLIDATED FINANCIAL STATEMENTS
AFFYMETRIX, INC.
To the
Board of Directors and Stockholders of Affymetrix, Inc.
We have
audited the accompanying consolidated balance sheets of Affymetrix, Inc. as
of December 31, 2009 and 2008, and the related consolidated statements of
operations, comprehensive income (loss), stockholders’ equity, and cash flows
for each of the three years in the period ended December 31, 2009. Our
audits also included the financial statement schedule listed in the Index at
Item 15(a). These financial statements and schedule are the responsibility
of the Company’s management. Our responsibility is to express an opinion on
these financial statements and schedule based on our audits.
We
conducted our audits in accordance with the standards of the Public Company
Accounting Oversight Board (United States). Those standards require that we plan
and perform the audit to obtain reasonable assurance about whether the financial
statements are free of material misstatement. An audit includes examining, on a
test basis, evidence supporting the amounts and disclosures in the financial
statements. An audit also includes assessing the accounting principles used and
significant estimates made by management, as well as evaluating the overall
financial statement presentation. We believe that our audits provide a
reasonable basis for our opinion.
In our
opinion, the financial statements referred to above present fairly, in all
material respects, the consolidated financial position of Affymetrix, Inc.
at December 31, 2009 and 2008, and the consolidated results of its
operations and its cash flows for each of the three years in the period ended
December 31, 2009, in conformity with U.S. generally accepted accounting
principles. Also, in our opinion, the related financial statement schedule, when
considered in relation to the basic financial statements taken as a whole,
presents fairly in all material respects the information set forth
therein.
We also
have audited, in accordance with the standards of the Public Company Accounting
Oversight Board (United States), Affymetrix, Inc.’s internal control over
financial reporting as of December 31, 2009, based on criteria established
in Internal Control-Integrated Framework issued by the Committee of Sponsoring
Organizations of the Treadway Commission and our report dated March 1, 2010
expressed an unqualified opinion thereon.
|
/s/
Ernst &
Young LLP
|
|
|
San
Jose, California
March
1, 2010
|
CONSOLIDATED
BALANCE SHEETS
(In
thousands, except per share amounts)
|
December
31,
|
December
31,
|
|||||||
|
2009
|
2008
|
|||||||
|
ASSETS:
|
||||||||
|
Current
assets:
|
||||||||
|
Cash
and cash equivalents
|
$ | 65,642 | $ | 113,292 | ||||
|
Restricted
cash—short-term portion
|
1,686 | 4,402 | ||||||
|
Available-for-sale
securities—short-term portion
|
213,377 | 250,970 | ||||||
|
Accounts
receivable, net
|
64,933 | 62,726 | ||||||
|
Inventories
|
54,490 | 51,333 | ||||||
|
Deferred
tax assets—current portion
|
1,172 | 1,077 | ||||||
|
Prepaid
expenses and other current assets
|
15,903 | 15,725 | ||||||
|
Total
current assets
|
417,203 | 499,525 | ||||||
|
Available-for-sale
securities—long-term portion
|
64,760 | 26,900 | ||||||
|
Property
and equipment, net
|
68,182 | 89,345 | ||||||
|
Acquired
technology rights, net
|
49,855 | 62,569 | ||||||
|
Deferred
tax assets—long-term portion
|
4,720 | 4,764 | ||||||
|
Restricted
cash—long-term portion
|
1,109 | 2,175 | ||||||
|
Other
assets
|
25,121 | 28,032 | ||||||
|
Total
assets
|
$ | 630,950 | $ | 713,310 | ||||
|
LIABILITIES
AND STOCKHOLDERS’ EQUITY:
|
||||||||
|
Current
liabilities:
|
||||||||
|
Accounts
payable and accrued liabilities
|
$ | 57,183 | $ | 62,559 | ||||
|
Deferred
revenue—current portion
|
14,534 | 16,198 | ||||||
|
Total
current liabilities
|
71,717 | 78,757 | ||||||
|
Deferred
revenue—long-term portion
|
3,898 | 3,583 | ||||||
|
Other
long-term liabilities
|
10,295 | 10,972 | ||||||
|
Convertible
notes
|
247,201 | 316,341 | ||||||
|
Stockholders’
equity:
|
||||||||
|
Convertible
redeemable preferred stock, $0.01 par value; 5,000 shares authorized; no
shares issued and outstanding at December 31, 2009 and
2008
|
- | - | ||||||
|
Common
stock, $0.01 par value; 200,000 shares authorized; 71,000 and 70,267
shares issued and outstanding at December 31, 2009 and 2008,
respectively
|
710 | 703 | ||||||
|
Additional
paid-in capital
|
733,378 | 721,641 | ||||||
|
Accumulated
other comprehensive income (loss)
|
4,051 | (2,296 | ) | |||||
|
Accumulated
deficit
|
(440,300 | ) | (416,391 | ) | ||||
|
Total
stockholders’ equity
|
297,839 | 303,657 | ||||||
|
Total
liabilities and stockholders’ equity
|
$ | 630,950 | $ | 713,310 | ||||
See
Accompanying Notes
CONSOLIDATED
STATEMENTS OF OPERATIONS
(In
thousands, except per share amounts)
|
Year
Ended December 31,
|
||||||||||||
|
2009
|
2008
|
2007
|
||||||||||
|
REVENUE:
|
||||||||||||
|
Product
sales ($0 in 2009, $843 in 2008 and $12,046 in 2007 from Perlegen
Sciences)
|
$ | 279,186 | $ | 270,392 | $ | 291,828 | ||||||
|
Services
|
39,563 | 32,096 | 38,074 | |||||||||
|
Royalties
and other revenue
|
8,345 | 107,761 | 41,418 | |||||||||
|
Total
revenue
|
327,094 | 410,249 | 371,320 | |||||||||
|
COSTS
AND EXPENSES:
|
||||||||||||
|
Cost
of product sales ($0 in 2009, $446 in 2008 and $4,768 in 2007 from
Perlegen Sciences)
|
126,377 | 126,909 | 108,884 | |||||||||
|
Cost
of services and other
|
23,949 | 25,231 | 29,832 | |||||||||
|
Research
and development
|
77,358 | 84,482 | 72,740 | |||||||||
|
Selling,
general and administrative
|
130,838 | 127,161 | 138,488 | |||||||||
|
Acquired
in-process technology
|
- | 6,200 | - | |||||||||
|
Restructuring
charges
|
2,180 | 43,707 | 15,296 | |||||||||
|
Goodwill
impairment (credit) charges
|
(450 | ) | 239,098 | - | ||||||||
|
Total
costs and expenses
|
360,252 | 652,788 | 365,240 | |||||||||
|
(Loss)
income from operations
|
(33,158 | ) | (242,539 | ) | 6,080 | |||||||
|
Interest
income and other, net
|
2,589 | 14,629 | 15,420 | |||||||||
|
Interest
expense
|
10,945 | 14,091 | 3,218 | |||||||||
|
Gain
from repurchase of convertible notes
|
17,447 | - | - | |||||||||
|
(Loss)
income before income taxes
|
(24,067 | ) | (242,001 | ) | 18,282 | |||||||
|
Income
tax (benefit) provision
|
(158 | ) | 65,918 | 5,689 | ||||||||
|
Net
(loss) income
|
$ | (23,909 | ) | $ | (307,919 | ) | $ | 12,593 | ||||
|
Basic
net (loss) income per common share
|
$ | (0.35 | ) | $ | (4.49 | ) | $ | 0.18 | ||||
|
Diluted
net (loss) income per common share
|
$ | (0.35 | ) | $ | (4.49 | ) | $ | 0.17 | ||||
|
Shares
used in computing basic net (loss) income per common share
|
68,722 | 68,556 | 68,242 | |||||||||
|
Shares
used in computing diluted net (loss) income per common
share
|
68,722 | 68,556 | 83,064 | |||||||||
See
Accompanying Notes
CONSOLIDATED
STATEMENTS OF COMPREHENSIVE INCOME (LOSS)
(In
thousands)
|
Year
Ended December 31,
|
||||||||||||
|
2009
|
2008
|
2007
|
||||||||||
|
Net
(loss) income
|
$ | (23,909 | ) | $ | (307,919 | ) | $ | 12,593 | ||||
|
Other
comprehensive income (loss):
|
||||||||||||
|
Foreign
currency translation adjustment, net of tax
|
284 | 384 | 410 | |||||||||
|
Unrealized
gains (losses) on available-for-sale and non-marketable
|
||||||||||||
|
securities,
net of tax
|
6,979 | (3,492 | ) | 4,578 | ||||||||
|
Reclassification
adjustment for losses in net (loss) income
|
(916 | ) | (1,201 | ) | (1,273 | ) | ||||||
|
Unrealized
gains (losses) on cash flow hedges, net of tax
|
- | 15 | (18 | ) | ||||||||
|
Reclassification
adjustment for gains (losses) in net (loss) income
|
- | - | 18 | |||||||||
|
Net
change in other comprehensive income (loss)
|
6,347 | (4,294 | ) | 3,715 | ||||||||
|
Comprehensive
(loss) income
|
$ | (17,562 | ) | $ | (312,213 | ) | $ | 16,308 | ||||
See
Accompanying Notes
CONSOLIDATED
STATEMENTS OF STOCKHOLDERS’ EQUITY
(In
thousands)
|
Year
Ended December 31,
|
||||||||||||
|
2009
|
2008
|
2007
|
||||||||||
|
Convertible
redeemable preferred stock:
|
||||||||||||
|
Balance,
beginning of year
|
$ | - | $ | - | $ | - | ||||||
|
Balance,
end of year
|
- | - | - | |||||||||
|
Common
stock:
|
||||||||||||
|
Balance,
beginning of year
|
703 | 692 | 679 | |||||||||
|
Common
stock issued
|
7 | 11 | 13 | |||||||||
|
Balance,
end of year
|
710 | 703 | 692 | |||||||||
|
Additional
paid-in capital:
|
||||||||||||
|
Balance,
beginning of year
|
721,641 | 704,189 | 674,428 | |||||||||
|
Issuance
of common stock upon exercise of stock options and
warrants
|
||||||||||||
|
and
issuances of restricted stock, net
|
(820 | ) | (80 | ) | 13,714 | |||||||
|
Stock-based
compensation expense from stock options and restricted
stock
|
11,148 | 7,611 | 10,727 | |||||||||
|
Income
tax benefit from stock-based compensation
|
1,409 | 9,921 | 5,320 | |||||||||
|
Balance,
end of year
|
733,378 | 721,641 | 704,189 | |||||||||
|
Accumulated
other comprehensive gain (loss):
|
||||||||||||
|
Balance,
beginning of year
|
(2,296 | ) | 1,998 | (1,717 | ) | |||||||
|
Unrealized
gain (loss) on investments, net of tax
|
6,063 | (4,693 | ) | 3,305 | ||||||||
|
Unrealized
gain on hedging contracts, net of tax
|
- | 15 | - | |||||||||
|
Foreign
currency translation adjustment, net of tax
|
284 | 384 | 410 | |||||||||
|
Balance,
end of year
|
4,051 | (2,296 | ) | 1,998 | ||||||||
|
Accumulated
deficit:
|
||||||||||||
|
Balance,
beginning of year
|
(416,391 | ) | (108,472 | ) | (120,427 | ) | ||||||
|
Net
(loss) income
|
(23,909 | ) | (307,919 | ) | 12,593 | |||||||
|
Net
effect of tax adjustment for uncertain tax positions
|
- | - | (638 | ) | ||||||||
|
Balance,
end of year
|
(440,300 | ) | (416,391 | ) | (108,472 | ) | ||||||
|
Total
stockholders' equity
|
$ | 297,839 | $ | 303,657 | $ | 598,407 | ||||||
|
Number
of shares of common stock
|
||||||||||||
|
Balance,
beginning of year
|
70,267 | 69,217 | 67,922 | |||||||||
|
Issuance
of common stock for cash or services
|
733 | 1,050 | 1,295 | |||||||||
|
Balance,
end of year
|
71,000 | 70,267 | 69,217 | |||||||||
See
Accompanying Notes
CONSOLIDATED
STATEMENTS OF CASH FLOWS
(In
thousands)
|
Year
Ended December 31,
|
||||||||||||
|
2009
|
2008
|
2007
|
||||||||||
|
CASH
FLOWS FROM OPERATING ACTIVITIES:
|
||||||||||||
|
Net
(loss) income
|
$ | (23,909 | ) | $ | (307,919 | ) | $ | 12,593 | ||||
|
Adjustments
to reconcile net (loss) income to net cash provided by
operating activities:
|
||||||||||||
|
Depreciation
and amortization
|
29,888 | 37,058 | 23,779 | |||||||||
|
Goodwill
impairment
|
- | 239,098 | - | |||||||||
|
Amortization
of intangible assets
|
15,237 | 13,453 | 8,328 | |||||||||
|
Charge
for acquired in-process technology
|
- | 6,200 | - | |||||||||
|
Amortization
of investment premiums, net
|
1,219 | 389 | (648 | ) | ||||||||
|
Excess
tax benefits for stock-based compensation
|
(1,409 | ) | (11,794 | ) | (952 | ) | ||||||
|
Stock-based
compensation
|
11,148 | 7,611 | 10,726 | |||||||||
|
Write-down
of equity investments
|
- | - | 3,861 | |||||||||
|
Realized
loss (gain) on equity investments
|
1,111 | (12 | ) | - | ||||||||
|
Realized
(gain) loss on the sales of investments
|
(194 | ) | 433 | (599 | ) | |||||||
|
Deferred
tax assets
|
1,358 | 60,140 | 3,515 | |||||||||
|
Amortization
of debt offering costs
|
1,207 | 2,080 | 931 | |||||||||
|
Gain
from repurchase of convertible notes
|
(17,447 | ) | - | - | ||||||||
|
Impairment
and (gain) loss on disposal of property and equipment
|
(231 | ) | 36,989 | 1,257 | ||||||||
|
Changes
in operating assets and liabilities:
|
||||||||||||
|
Accounts
receivable, net
|
(2,207 | ) | 23,803 | (4,098 | ) | |||||||
|
Inventories
|
(3,157 | ) | 495 | 3,594 | ||||||||
|
Prepaid
expenses and other assets
|
4,115 | 2,009 | (15,889 | ) | ||||||||
|
Accounts
payable and accrued liabilities
|
(5,376 | ) | (18,042 | ) | (1,412 | ) | ||||||
|
Deferred
revenue
|
(1,349 | ) | (6,639 | ) | (13,839 | ) | ||||||
|
Other
long-term liabilities
|
(677 | ) | (1,841 | ) | 1,189 | |||||||
|
Net
cash provided by operating activities
|
9,327 | 83,511 | 32,336 | |||||||||
|
CASH
FLOWS FROM INVESTING ACTIVITIES:
|
||||||||||||
|
Capital
expenditures
|
(10,249 | ) | (13,846 | ) | (27,419 | ) | ||||||
|
Purchases
of available-for-sale securities
|
(381,560 | ) | (449,398 | ) | (280,133 | ) | ||||||
|
Proceeds
from sales and maturities of available-for-sale securities
|
385,119 | 468,671 | 112,588 | |||||||||
|
Acquisition
of businesses, net of cash acquired
|
- | (156,178 | ) | - | ||||||||
|
Purchase
of non-marketable equity investments
|
- | (311 | ) | (800 | ) | |||||||
|
Capital
distribution of non-marketable equity investments
|
- | - | 1,668 | |||||||||
|
Purchase
of technology rights
|
(500 | ) | - | - | ||||||||
|
Net
cash used in investing activities
|
(7,190 | ) | (151,062 | ) | (194,096 | ) | ||||||
|
CASH
FLOWS FROM FINANCING ACTIVITIES:
|
||||||||||||
|
Issuance
of common stock, net
|
(813 | ) | (70 | ) | 13,728 | |||||||
|
Issuance
of convertible notes
|
- | - | 316,250 | |||||||||
|
Redemption
of convertible debt
|
(50,669 | ) | (119,909 | ) | - | |||||||
|
Excess
tax benefits for stock-based compensation
|
1,409 | 11,794 | 952 | |||||||||
|
Net
cash (used in) provided by financing activities
|
(50,073 | ) | (108,185 | ) | 330,930 | |||||||
|
Effect
of exchange rate changes on cash and cash equivalents
|
286 | 384 | 411 | |||||||||
|
Net
(decrease) increase in cash and cash equivalents
|
(47,650 | ) | (175,352 | ) | 169,581 | |||||||
|
Cash
and cash equivalents at beginning of year
|
113,292 | 288,644 | 119,063 | |||||||||
|
Cash
and cash equivalents at end of year
|
$ | 65,642 | $ | 113,292 | $ | 288,644 | ||||||
|
SUPPLEMENTAL
DISCLOSURE OF NONCASH ACTIVITIES:
|
||||||||||||
|
Recognition
of deferred tax assets relating to tax benefits from employee stock
plans
|
$ | - | $ | - | $ | 5,320 | ||||||
|
SUPPLEMENTAL
DISCLOSURE OF CASH FLOW INFORMATION:
|
||||||||||||
|
Cash
paid for interest
|
$ | 9,963 | $ | 8,358 | $ | 904 | ||||||
|
Cash
paid for income taxes
|
$ | 144 | $ | 6,804 | $ | 2,369 | ||||||
See
Accompanying Notes
NOTES
TO CONSOLIDATED FINANCIAL STATEMENTS
DECEMBER
31, 2009
NOTE
1—NATURE OF OPERATIONS
Affymetrix, Inc.
(“Affymetrix” or the “Company”) is engaged in the development, manufacture, sale
and service of consumables and systems for genetic analysis in the life sciences
and clinical healthcare markets. Affymetrix has developed its GeneChip®
system and related microarray technology as the platform of choice for
acquiring, analyzing and managing complex genetic information. The Company’s
integrated GeneChip®microarray
platform includes: disposable DNA probe arrays (chips) consisting of nucleic
acid sequences set out in an ordered, high density pattern, certain reagents for
use with the probe arrays, a scanner and other instruments used to process the
probe arrays, and software to analyze and manage genomic or genetic information
obtained from the probe arrays. Related microarray technology also offered by
Affymetrix includes licenses for fabricating, scanning, collecting and analyzing
results from complementary technologies. The Company currently sells its
products directly to pharmaceutical, biotechnology, agrichemical, diagnostics
and consumer products companies as well as academic research centers, government
research laboratories, private foundation laboratories and clinical reference
laboratories in North America and Europe. The Company also sells some of its
products through life science supply specialists acting as authorized
distributors in Latin America, India, the Middle East and Asia Pacific regions,
including China. The Company has evaluated subsequent events through March 1,
2010, the date on which the financial statements being presented were filed with
the Securities and Exchange Commission.
NOTE
2—SUMMARY OF SIGNIFICANT ACCOUNTING POLICIES
BASIS
OF PRESENTATION
The
consolidated financial statements include the accounts of Affymetrix and its
wholly-owned subsidiaries. All significant intercompany accounts and
transactions have been eliminated.
Certain
prior year revenue and cost of sales amounts in the Company’s consolidated
statements of operations have been reclassified to conform to the current period
presentation. Product sales include consumables and instruments while services
includes scientific services and associated consumables, field service, and
professional service. Royalties and other includes software, subscription fees,
licensing and royalties and research revenue.
USE
OF ESTIMATES
The
preparation of the consolidated financial statements is in conformity with U.S.
generally accepted accounting principles (“US GAAP”) which require management to
make estimates and assumptions that affect amounts reported in the financial
statements and accompanying notes. Actual results could differ materially from
those estimates.
FOREIGN
CURRENCY
Assets
and liabilities of non-U.S. subsidiaries that use the local currency as their
functional currency are translated to U.S. dollars at exchange rates in effect
at the balance sheet date, with the resulting translation adjustments directly
recorded to a separate component of accumulated other comprehensive income
(loss) within stockholders’ equity. Income and expense accounts are translated
at average exchange rates during the year. Foreign currency transaction gains
and losses are recognized, net of hedging activity, in interest income and
other, net and were comprised of net losses of $2.8 million and
$2.2 million for the years ended December 31, 2009 and 2008,
respectively, and a net gain of $0.3 million for the year ended
December 31, 2007.
CASH
EQUIVALENTS, AVAILABLE-FOR-SALE SECURITIES AND INVESTMENTS
|
|
Marketable
Securities
|
The
Company’s investments consist of U.S. government notes and bonds; corporate
notes, bonds and asset-backed securities; mortgaged-backed securities, municipal
notes and bonds; and publicly traded equity securities. The Company reports all
debt securities with maturities at the date of purchase of three months or less
that are readily convertible into cash and have insignificant interest rate risk
as cash equivalents. Cash equivalents and available-for-sale securities consist
of marketable equity and debt securities. Management determines the appropriate
classification of debt securities at the time of purchase. As of
December 31, 2009 and 2008, the Company’s investments in debt securities
are classified as available-for-sale and are carried at fair value with
unrealized gains and losses reported in accumulated other comprehensive income
(loss) in stockholders’ equity. The cost of debt securities is adjusted for
amortization of premiums and discounts to maturity. This amortization is
included in interest income and other, net. Realized gains and losses, as well
as interest income, on available-for-sale securities are also included in
interest income and other, net. The cost of securities sold is based on the
specific identification method. The fair values of securities are based on
quoted market prices. The Company includes its available-for-sale securities
that have an effective maturity of less than twelve months as of the balance
sheet date in current assets and those with an effective maturity greater than
twelve months as of the balance sheet date in non-current assets.
The
Company conducts a review of investment securities on a quarterly basis for the
presence of impairment that is deemed to be other-than-temporary (“OTTI”). As
part of its review, the Company is required to take into consideration current
market conditions, fair value in relationship to cost, extent and nature of
change in fair value, issuer rating changes and trends, volatility of earnings,
current analysts’ evaluations, all available information relevant to the
collectability of debt securities, its ability to hold until, and whether it
will more likely than not be required to sell prior to, a recovery of fair
value, which may be maturity, and other factors when evaluating for the
existence of OTTI in its securities portfolio. Under these circumstances, OTTI
is considered to have occurred if (1) the Company intends to sell the security;
(2) it is “more likely than not” that the Company will be required to sell the
security before recovery of its amortized cost basis or (3) the present value of
expected cash flows is not expected to recover the entire amortized cost basis.
Any credit-related OTTI is to be recognized in earnings while noncredit-related
OTTI on securities not expected to be sold is to be recognized in other
comprehensive income (“OCI”). Noncredit-related OTTI is based on other factors,
including illiquidity. Presentation of OTTI is made in the statement of income
on a gross basis with an offset for the amount of OTTI recognized in
OCI.
Non-marketable
Securities
As part
of the Company’s strategic efforts to gain access to potential new products and
technologies, it invests in equity securities of certain private biotechnology
companies. These investments are included in other assets in the Consolidated
Balance Sheets and are carried at cost. The Company also invests in a limited
partnership investment fund that is accounted for under the equity method. The
Company periodically monitors the liquidity and financing activities of the
respective investments to determine if any impairment exists and accordingly
writes down to the extent necessary, the carrying value of the non-marketable
equity securities to their estimated fair values. In order to determine whether
a decline in value is other-than-temporary, the Company evaluates, among other
factors: the duration and extent to which the fair value has been less than the
carrying value; the financial condition of and business outlook of the issuer
for the company, including key operational and cash flow metrics, current market
conditions; and the Company’s intent and ability to retain the investment for a
period of time sufficient to allow for any anticipated recovery in estimated
fair value.
ACCOUNTS
RECEIVABLE
Trade
accounts receivable are recorded at net invoice value. The Company considers
amounts past due based on the related terms of the invoice. The Company reviews
its exposure to amounts receivable and provides an allowance for specific
amounts if collectability is no longer reasonably assured. The Company also
provides an allowance for a percentage of the gross trade receivable balance
(excluding any specifically reserved amounts) based on its collection
history.
DERIVATIVE
INSTRUMENTS
The
Company has international operations and during the normal course of business is
exposed to foreign currency exchange risks as a result of transactions that are
denominated in currencies other than the United States dollar. The Company
enters into foreign currency forward contracts to manage a portion of the
volatility related to transactions that are denominated in foreign currencies.
The Company’s foreign currency forward contracts are entered into for periods
consistent with the related underlying exposures and do not constitute positions
that are independent of those exposures. In addition, the Company does not enter
into foreign currency forward contracts for trading or speculative purposes, is
not party to any leveraged derivative instrument, and may only enter into
derivative agreements with highly rated counterparties.
The
foreign currency forward contracts used by the Company are generally short-term
in nature, maturing within one quarter. The Company has elected not to designate
its derivatives for balance sheet purposes as fair value hedges and have
appropriately recorded any changes in fair value to interest income and other,
net.
INVENTORIES
Inventory
cost is computed on an adjusted standard basis (which approximates actual cost
on a first-in, first-out basis). Provisions for slow moving, potentially excess
and obsolete inventories are provided based on estimated demand requirements,
product life cycle and development plans, component cost trends, product
pricing, product expiration and quality issues.
PROPERTY
AND EQUIPMENT
Property
and equipment are recorded at cost and are depreciated using the straight-line
method over the estimated useful lives of the assets or the lease term,
whichever is shorter. Equipment and furniture is depreciated over useful lives
generally ranging from 3 to 7 years and leasehold improvements are
depreciated over the shorter of the expected life of the asset or lease terms
generally ranging from 3 to 15 years. Maintenance and repair costs are
expensed as incurred. The Company reassesses the useful life on its property and
equipment on a periodic basis and may adjust the lives accordingly. For example,
the Company extended the useful life of its enterprise resource system as a
result of the extended support period committed to by the service
provider.
GOODWILL
AND ACQUIRED TECHNOLOGY RIGHTS
Goodwill
represents the difference between the purchase price and the estimated fair
value of the net assets acquired arising from business
combinations.
Goodwill
is assessed for impairment at least annually or whenever changes in
circumstances indicate that the carrying amount may not be recoverable from
estimated future cash flows. Factors that may be considered a change in
circumstance indicating the carrying value of our intangible assets, including
goodwill, may not be recoverable include, but are not limited to, significant
underperformance relative to historical or projected future operating results, a
significant decline in our stock price and market capitalization, and negative
industry or economic trends. Any excess of the carrying value of the goodwill
over the implied fair value of the goodwill will be recorded as an impairment
loss. In 2008, due to the continued decline of the Company’s stock price in the
fourth quarter of 2008 along with other conditions in its business such as
decreases in our actual revenues as compared to our forecasted revenues and
additional restructuring activities, the Company recorded an impairment charge
of $239.1 million which was presented as “Goodwill impairment charges” in
the Company’s Consolidated Statements of Operations. In 2009, the Company
recorded $0.5 as a credit to goodwill impairment charges related to a recovery
of unrecorded tax liabilities that were not recognized during the purchase
method of accounting for the USB acquisition. Refer to Note 10, “Goodwill
and Acquired Technology Rights”, for further information.
Acquired
technology rights are carried at cost less accumulated amortization and are
comprised of licenses to technology covered by patents held by third parties or
acquired by the Company. Purchased intangible assets other than goodwill are
required to be amortized over their useful lives unless these lives are
determined to be indefinite. Amortization is computed over the estimated useful
life of the underlying patents, which has historically ranged from one to
thirteen years. In 2009, we did not identify any indicators during our annual
impairment test on the acquired technology rights and did not recognize any
impairment losses. In 2008, the Company performed an impairment analysis over
identified intangible assets and, as a result of that analysis, recognized an
impairment loss on acquisition-related intangible assets of $5.5 million of
which $1.9 million was included as a component of “Cost of product sales”,
$3.2 million was included as a component of “Research and development”, and
$0.4 million was included as a component of “Selling, general and
administration” expenses in the Consolidated Statement of Operations for the
year ended December 31, 2008. Refer to Note 10, “Goodwill and Acquired
Technology Rights”, for further information.
The
determination as to whether a write-down of goodwill is necessary involves
significant judgment based on short-term and long-term projections of the
Company’s operations. The assumptions supporting the estimated future cash flows
of the reporting unit, including profit margins, long-term forecasts of the
amounts and timing of overall market growth and the Company’s percentage of that
market, discount rates and terminal growth rates, reflect the Company’s best
estimates.
IMPAIRMENT
OF LONG-LIVED ASSETS
Long-lived
assets and certain identifiable intangible assets are reviewed for impairment
when events or changes in circumstances indicate that the carrying amount of
such assets may not be recoverable. Determination of recoverability is based on
an estimate of undiscounted future cash flows resulting from the use of the
asset and its eventual disposition. In the event that such cash flows are not
expected to be sufficient to recover the carrying amount of the assets, the
assets are written down to their estimated fair values. For the years ended
December 31, 2009 and 2008, the Company determined that the carrying value of
its capitalized software exceeded its net realizable value by $1.0 million and
$2.3 million, respectively, and recorded the impairment charges as a component
of “Cost of product sales” in the Consolidated Statements of Operations. Refer
to Note 2, “Summary of Significant Accounting Policies – Software Development
Costs” for further information. In connection with the Company’s restructuring
activities in 2008, the Company wrote-down the value of certain of its property
and equipment by approximately $36.9 million which was included as a
component of “Restructuring charges” in the Consolidated Statement of Operations
for the year ended December 31, 2008. Refer to Note 3,
“Restructuring”, for further information.
INCOME
TAXES
Income
tax expense is based on pre-tax financial accounting income. Under the liability
method, deferred tax assets and liabilities are determined based on the
difference between the financial statement and tax basis of assets and
liabilities using enacted tax rates in effect for the year in which the
differences are expected to reverse. The Company must then assess the likelihood
that the resulting deferred tax assets will be realized. To the extent the
Company believes that realization is not more likely than not, the Company
establishes a valuation allowance. Significant estimates are required in
determining the Company’s provision for income taxes, our deferred tax assets
and liabilities, and any valuation allowance to be recorded against our net
deferred tax asset. Some of these estimates are based on interpretations of
existing tax laws or regulations. The Company believes that its estimates are
reasonable and that its reserves for income tax related uncertainties are
adequate. Various internal and external factors may have favorable or
unfavorable effects on the Company’s future effective tax rate. These factors
include, but are not limited to, changes in overall levels of characterization
and geographical mix of pretax earnings (losses), changes in tax laws,
regulations and/or rates, changing interpretations of existing tax laws or
regulations, changes in the valuation of our deferred tax assets or liabilities,
future levels of research and development spending, nondeductible expenses, and
ultimate outcomes of income tax audits. Relative to uncertain tax positions, the
Company only recognizes the tax benefit if it is more likely than not that the
tax position will be sustained on examination by the taxing authorities, based
on the technical merits of the position. The tax benefits recognized in the
financial statements from such positions are then measured based on the largest
benefit that has a greater than 50% likelihood of being realized upon ultimate
settlement.
CONTINGENCIES
The
Company is subject to various legal proceedings principally related to
intellectual property matters. Based on the information available at the most
recent balance sheet date, the Company assesses the likelihood of any material
adverse judgments or outcomes that may result from these matters, as well as the
range of possible or probable loss, if any. If losses are probable and
reasonably estimable, the Company will record a reserve. Any reserves recorded
may change in the future due to new developments in each matter.
REVENUE
RECOGNITION
|
|
Overview
|
The
Company recognizes revenue when persuasive evidence of an arrangement exists,
delivery has occurred, the fee is fixed or determinable, and collectability is
reasonably assured. In instances where final acceptance of the product or system
is required, revenue is deferred until all the acceptance criteria have been
met.
The
Company derives the majority of its revenue from product sales of GeneChip® probe
arrays, reagents, and related instrumentation that may be sold individually or
combined with any of the products, services or other sources of revenue listed
below. When a sale combines multiple elements upon delivery or performance of
multiple products, services and/or rights to use assets, the Company allocates
revenue for transactions or collaborations that include multiple elements to
each unit of accounting based on its relative fair value, and recognizes revenue
for each unit of accounting when the revenue recognition criteria have been met.
The price charged when the element is sold separately generally determines fair
value. In the absence of fair value of a delivered element, the Company
allocates revenue first to the fair value of the undelivered elements and the
residual revenue to the delivered elements. The Company recognizes revenue for
delivered elements when the delivered elements have standalone value and the
Company has objective and reliable evidence of fair value for each undelivered
element. If the fair value of any undelivered element included in a multiple
element arrangement cannot be objectively determined, revenue is deferred until
all elements are delivered and services have been performed, or until fair value
can objectively be determined for any remaining undelivered
elements.
|
|
Product
Sales
|
Product
sales include sales of GeneChip® probe
arrays, reagents and related instrumentation. Probe array, reagent and
instrumentation revenues are recognized when earned, which is generally upon
shipment and transfer of title to the customer and fulfillment of any
significant post-delivery obligations. Accruals are provided for anticipated
warranty expenses at the time the associated revenue is recognized.
|
|
Services
|
Services
revenue includes equipment service revenue; scientific services revenue, which
includes associated consumables; and revenue from custom probe array design
fees.
Revenue
related to extended warranty arrangements is deferred and recognized ratably
over the applicable periods. Revenue from custom probe array design fees
associated with the Company’s GeneChip®
CustomExpress™ and CustomSeq™ products are recognized when the associated
products are shipped.
Revenue
from scientific and DNA analysis services are recognized upon shipment of the
required data to the customer.
|
|
Royalties
and Other Revenue
|
Royalties
and other revenue include license revenue; royalties earned from third party
license agreements; milestones and royalties earned from collaborative product
development and supply agreements; subscription fees earned under GeneChip® array
access programs; and research revenue which mainly consists of amounts earned
under government grants; and non-recurring intellectual property
payments.
License
revenues are generally recognized upon execution of the agreement unless the
Company has continuing performance obligations, in which case the license
revenue is recognized ratably over the period of expected performance. Included
in the Consolidated Statement of Operations for the year ended December 31, 2008
is a one-time nonrefundable perpetual license to specified patents for $90
million. The one-time perpetual license to specified patents was due to the
settlement of an intellectual property dispute and includes no continuing or
future obligations by the Company.
Royalty
revenues are earned from the sale of products by third parties who have been
licensed under the Company’s intellectual property portfolio. Revenue from
minimum royalties is amortized over the term of the creditable royalty period.
Any royalties received in excess of minimum royalty payments are recognized
under the terms of the related agreement, generally upon notification of
manufacture or shipment of a product by a licensee.
The
Company enters into collaborative arrangements which generally include a
research and product development phase and a manufacturing and product supply
phase. These arrangements may include up-front nonrefundable license fees,
milestones, the rights to royalties based on the sale of final product by the
partner, product supply agreements and distribution arrangements.
Any
up-front, nonrefundable payments from collaborative product development
agreements are recognized ratably over the research and product development
period, and at-risk substantive based milestones are recognized when earned. Any
payments received which are not yet earned are included in deferred
revenue.
Revenue
from subscription fees earned under GeneChip® array
access programs is recorded ratably over the related supply term.
Research
revenues result primarily from research grants received from U.S. Government
entities or from subcontracts with other life science research-based companies
which receive their research grant funding from the U.S. Government. Revenues
from research contracts are generated from the efforts of the Company’s
technical staff and include the costs for material and subcontract efforts. The
Company’s research grant contracts generally provide for the payment of
negotiated fixed hourly rates for labor hours incurred plus reimbursement of
other allowable costs. Research revenue is recorded in the period in which the
associated costs are incurred, up to the limit of the prior approval funding
amounts contained in each agreement. The costs associated with these grants are
reported as research and development expense.
|
|
Transactions
with Distributors
|
The
Company recognizes revenue when persuasive evidence of an arrangement exists,
delivery has occurred or services have been rendered, the seller’s price is
fixed or determinable, and collectability is reasonably assured. The Company’s
agreements with distributors do not include rights of return.
RESEARCH
AND DEVELOPMENT EXPENSES
Research
and development expenses consist of costs incurred for internal, collaborative
and grant-sponsored research and development. Research and development expenses
include salaries, contractor fees, building costs, utilities and allocations of
shared corporate services. In addition, the Company funds research and
development at other companies and research institutions under agreements which
are generally cancelable. All such costs are charged to research and development
expense as incurred.
SOFTWARE
DEVELOPMENT COSTS
Costs
of Software to Be Sold, Leased or Marketed
Certain
software development costs subsequent to the establishment of technological
feasibility are capitalized. The Company’s software is deemed to have achieved
technological feasibility at the point a working model of the software product
is developed. Nothing was capitalized in 2009 while approximately
$0.3 million was capitalized on costs incurred subsequent to the
establishment of technological feasibility for the year ended December 31,
2008, respectively. These costs began to be amortized to cost of product sales
in the fourth quarter of 2007. Amortization costs for the years ended
December 31, 2009 and 2008 were $1.1 million and $1.4 million,
respectively. The costs of developing routine software enhancements are expensed
as research and development as incurred because of the short time between the
determination of technological feasibility and the date of general release of
the related products.
Long-lived
assets and certain identifiable intangible assets are reviewed for impairment
when events or changes in circumstances indicate that the carrying amount of
such assets may not be recoverable. During the years ended December 31,
2009 and 2008, the Company performed an analysis of the expected future cash
flows as it related to the Company’s capitalized software and determined that
the carrying value exceeded the net realizable value by $1.0 million and
$2.3 million, respectively, which were included as a component of “Cost of
product sales” in the Consolidated Statements of Operations.
Internal-Use
Software
In 2008,
the Company capitalized costs related to the implementation of an enterprise
resources planning system, totaling approximately $1.9 million, while
nothing was capitalized in 2009. Additionally, the Company capitalized
approximately $0.7 million related to other costs associated with internal-use
software in 2009. All costs associated with software developed for internal use
will be amortized at the time in which the software is ready for its intended
use.
ADVERTISING
COSTS
The
Company expenses advertising costs as incurred. Advertising costs were for the
years ended December 31, 2009, 2008 and 2007 were $0.9 million,
$1.6 million and $0.5 million, respectively.
STOCK-BASED
COMPENSATION
The
Company recognizes the fair value of its stock option awards as compensation
expense on a straight-line basis over the requisite service period of each
award, generally four years. The fair value of options are estimated at the date
of grant using a Black-Scholes option pricing model. The Company evaluates the
assumptions used to value stock options awards on a quarterly
basis.
COMPREHENSIVE
INCOME (LOSS)
Comprehensive
income (loss) is comprised of net (loss) income and other comprehensive income
(loss). Other comprehensive income (loss) includes unrealized gains and losses
on the Company’s available-for-sale securities that are excluded from net (loss)
income, changes in fair value of derivatives designated as, and effective as,
cash flow hedges and foreign currency translation adjustments. Total
comprehensive income (loss) has been disclosed in the consolidated statement of
comprehensive income (loss).
The
components of accumulated other comprehensive income (loss) is as follows (in
thousands):
|
Year
Ended December 31,
|
||||||||
|
2009
|
2008
|
|||||||
|
Foreign
currency translation adjustment, net of tax
|
$ | 327 | $ | 42 | ||||
|
Unrealized
gains (losses) on available-for-sale and non-marketable
|
||||||||
|
securities,
net of tax
|
3,724 | (2,338 | ) | |||||
|
Accumulated
other comprehensive income (loss)
|
$ | 4,051 | $ | (2,296 | ) | |||
NET
(LOSS) INCOME PER COMMON SHARE
Basic net
(loss) income per common share is calculated using the weighted-average number
of common shares outstanding during the period less the weighted-average shares
subject to repurchase. Diluted (loss) income per common share gives effect to
dilutive common stock subject to repurchase, stock options and warrants
(calculated based on the treasury stock method), and convertible debt
(calculated using an as-if-converted method).
The
following table sets forth a reconciliation of basic and diluted net (loss)
income per common share (in thousands, except per share amounts):
|
Year
Ended December 31,
|
||||||||||||
|
2009
|
2008
|
2007
|
||||||||||
|
Numerator:
|
||||||||||||
|
Net
(loss) income - basic
|
$ | (23,909 | ) | $ | (307,919 | ) | $ | 12,593 | ||||
|
Add
effect of dilutive securities:
|
||||||||||||
|
Interest
on convertible notes (inclusive of amortization of debt
|
||||||||||||
|
issuance
costs)
|
- | - | 1,937 | |||||||||
|
Net
(loss) income - diluted
|
$ | (23,909 | ) | $ | (307,919 | ) | $ | 14,530 | ||||
|
Denominator:
|
||||||||||||
|
Weighted-average
shares outstanding
|
70,758 | 69,818 | 68,727 | |||||||||
|
Less:
weighted-average shares of common stock subject to
repurchase
|
(2,036 | ) | (1,262 | ) | (485 | ) | ||||||
|
Shares
used in computing basic net (loss) income per common share
|
68,722 | 68,556 | 68,242 | |||||||||
|
Add
effect of dilutive securities:
|
||||||||||||
|
Employee
stock options
|
- | - | 388 | |||||||||
|
Common
stock subject to repurchase
|
- | - | 65 | |||||||||
|
Convertible
notes
|
- | - | 14,369 | |||||||||
|
Shares
used in computing diluted net (loss) income per common
share
|
68,722 | 68,556 | 83,064 | |||||||||
|
Basic
and diluted net (loss) income per common share
|
$ | (0.35 | ) | $ | (4.49 | ) | $ | 0.18 | ||||
|
Diluted
net (loss) income per common share
|
$ | (0.35 | ) | $ | (4.49 | ) | $ | 0.17 | ||||
Diluted
earnings per share include certain common share equivalents from outstanding
stock options (on the treasury stock method), common stock subject to
repurchase, outstanding warrants to purchase common stock and convertible notes
(on the as-if-converted basis).
The
securities excluded from diluted earnings per common share, on an actual
outstanding basis, were as follows (in thousands):
|
Year
Ended December 31,
|
||||||||||||
|
2009
|
2008
|
2007
|
||||||||||
|
Employee
stock options
|
6,216 | 6,071 | 3,368 | |||||||||
|
Restricted
stock subject to repurchase
|
2,154 | 1,671 | - | |||||||||
|
Convertible
notes
|
8,207 | 10,502 | - | |||||||||
|
Total
|
16,577 | 18,244 | 3,368 | |||||||||
RESTRUCTURING
The
Company has in recent years engaged in restructuring actions, which require
management to utilize significant estimates related to expenses for severance
and other employee separation costs, lease cancellation, realizable values of
assets that may become duplicative or obsolete, and other exit costs. If the
actual amounts differ from the Company’s estimates, the amount of the
restructuring charges could be materially impacted. Refer to Note 3,
“Restructuring”, for further information.
RECENT
ACCOUNTING PRONOUNCEMENTS
In
June 2009, the Financial Accounting Standards Board (“FASB”) established
the FASB Accounting Standards Codification ("FASB ASC") as the source of
authoritative accounting principles recognized by the FASB. The
FASB will issue new standards in the form of Accounting Standards Updates ("FASB
ASUs"). FASB ASC is effective for financial statements issued for interim and
annual periods ending after September 15, 2009 and therefore is effective
for the Company in the third quarter of fiscal 2009. The issuance of
FASB ASC does not change US GAAP and therefore the adoption of FASB ASC only
affects the specific references to US GAAP literature in the notes to its
consolidated financial statements.
In February 2010, the FASB issued FASB
ASU 2010-09, Subsequent
Events, Amendments to Certain Recognition and Disclosure Requirements,
which clarifies certain existing evaluation and disclosure requirements in ASC
855 related to subsequent events. FASB ASU 2010-09 requires SEC filers to
evaluate subsequent events through the date in which the financial statements
are issued and is effectively immediately. The new guidance does not have an
effect on its consolidated results of operations and financial
condition.
In January 2010, the FASB issued FASB
ASU 2010-06, Improving
Disclosures about Fair Value Measurements which clarifies certain
existing disclosure requirements in ASC 820 as well as requires disclosures
related to significant transfers between each level and additional information
about Level 3 activity. FASB ASU 2010-06 begins phasing in the first fiscal
period after December 15, 2009. The Company is currently assessing the impact
on its consolidated results of operations and financial
condition.
In
October 2009, the FASB issued FASB ASU No. 2009-13, Revenue Recognition (Topic
605): Multiple Deliverable
Revenue Arrangements – A Consensus of the FASB Emerging Issues Task
Force.” This standard provides application guidance on whether multiple
deliverables exist, how the deliverables should be separated and how the
consideration should be allocated to one or more units of accounting. This
update establishes a selling price hierarchy for determining the selling price
of a deliverable. The selling price used for each deliverable will be based on
vendor-specific objective evidence, if available, third-party evidence if
vendor-specific objective evidence is not available, or estimated selling price
if neither vendor-specific or third-party evidence is available. The Company
will adopt this guidance from January 1, 2010. The Company has assessed the
impact of adoption and it is not expected to have a material effect on its
consolidated results of operations and financial condition.
In August
2009, the FASB issued FASB ASU No. 2009-05, Fair Value Measurements and
Disclosures (Topic 820): Measuring Liabilities at Fair
Value. This standard provides authoritative guidance related to measuring
liabilities at fair value when quoted prices in an active market for identical
liabilities are not available. FASB ASU 2009-05 clarifies the concept that a
fair value measurement should be based on hypothetical transfer at the
measurement date, even for liabilities that are generally never transferred, but
are settled directly with the creditor. Quoted prices of similar liability or of
the liability when it is traded as an asset should also be considered when
determining the liability’s fair value. The provisions of FASB ASU 2009-05 were
effective for the first reporting period beginning after the issuance of the
FASB ASU and are not expected to have an effect on the consolidated results of
operations and financial condition.
In June
2009, the FASB issued guidance which amends certain FASB ASC concepts related to
consolidation of variable interest entities (“VIE”). Among other accounting and
disclosure requirements, this guidance replaces the quantitative-based risks and
rewards calculation for determining which enterprise has a controlling financial
interest in a variable interest entity with an approach focused on identifying
which enterprise has the power to direct the activities of a variable interest
entity and the obligation to absorb losses of the entity or the right to receive
benefits from the entity. The primary beneficiary assessment must be performed
on a continuous basis. It also requires additional disclosures about
an entity’s involvement with a VIE, restrictions on the VIE’s assets and
liabilities that are included in the reporting entity’s consolidated balance
sheet, significant risk exposures due to the entity’s involvement with the VIE,
and how its involvement with a VIE impacts the reporting entity’s consolidated
financial statements. The Company will adopt this guidance from January 1, 2010
and does not expect it to have an effect on its consolidated results of
operations and financial condition.
NOTE
3—RESTRUCTURING
Fiscal
2008 Restructuring Plan
In
February 2008, the Company committed to a restructuring plan (the “2008 Plan”)
to close its West Sacramento manufacturing facility after which all of the
Company’s products will be manufactured at its Singapore and Ohio facilities, as
well as by third parties. The Company completed the closure of the West
Sacramento facility during the second quarter of 2009.
The cash
outlays incurred in connection with the 2008 Plan were approximately
$8.2 million which consisted of employee severance. During the years ended
December 31, 2009 and 2008, the Company recognized approximately
$2.4 million and $5.8 million, respectively, of expense for employee
termination benefits associated with the 2008 Plan and $(0.2) million and
$37.1 million, respectively, of non-cash credits and charges related to the
abandonment and impairment of certain manufacturing assets such as a building,
leasehold improvements and mask aligners and synthesizer equipment utilized in
the manufacturing of probe arrays. These expenses are presented as a component
of “Restructuring charges” in the Company’s Consolidated Statements of
Operations.
In
addition to the $45.1 million of restructuring costs noted above, the
Company expects to incur a total of approximately $18.1 million of restructuring
related costs that are included as a component of “Cost of product sales” in the
Company’s Consolidated Statements of Operations. Of this total,
$13.9 million related to accelerated depreciation charges associated with
the continued use of certain long-lived manufacturing assets and $4.2 million
related to manufacturing transition and other costs. As of December 31, 2009,
the Company has incurred $17.4 million of costs that was recorded to “Cost of
product sales.”
Fiscal
2007 Restructuring Plan
In July
2007, the Company announced that it was consolidating an administrative facility
located in Sunnyvale, California into its main campus in Santa Clara, California
(the “2007 Plan”). Additionally, in August and December 2007, the Company
terminated certain employees in the research and development and selling,
general and administrative functions. The Sunnyvale, California facility was
vacated during the fourth quarter of 2007. The cash outlays incurred in
connection with these restructuring activities were approximately
$4.6 million. During the years ended December 31, 2009, 2008 and 2007,
the Company recognized approximately $0.1 million, $0.5 million and $4.2
million, respectively, related to contract termination costs and employee
termination benefits associated with the 2007 Plan.
Fiscal
2006 Restructuring Plan
In 2006,
the Company initiated a restructuring plan (the “2006 Plan”) to better align
certain of its expenses with the Company’s current business outlook. The
Company’s primary focus of the 2006 Plan was in the general and administrative
functions and included rationalizing its facilities. Cash outlays incurred in
connection with these restructuring activities were estimated to be
approximately $16.8 million. During the years ended December 31, 2009
and 2008, the amount of expense recognized associated with the 2006 Plan was not
material. During the year ended December 31, 2007, the Company recognized
approximately $11.1 million of expense primarily related to employee
termination benefits and contract termination costs associated with the 2006
Plan.
The
activity for the restructuring plans above for the year ended December 31,
2009 and estimated costs for the amounts expected to be recognized as
“Restructuring charges” in the Company’s Consolidated Statements of Operations
is as follows (in thousands):
|
As
of
|
||||||||||||||||||||||||||||
|
December
31, 2009
|
||||||||||||||||||||||||||||
|
Balance
as of
|
2009
|
Balance
as of
|
Total
|
Total
|
||||||||||||||||||||||||
|
December
31,
|
Charges
|
Cash
|
Non-Cash
|
December
31,
|
costs
|
expected
|
||||||||||||||||||||||
|
2008
|
(Credits)
|
Payments
|
Settlements
|
2009
|
to
date
|
costs
|
||||||||||||||||||||||
|
Fiscal
2008 Restructuring Plan:
|
||||||||||||||||||||||||||||
|
Employee
severance and relocation benefits
|
$ | 3,178 | $ | 2,367 | $ | (5,069 | ) | $ | (457 | ) | $ | 19 | $ | 8,160 | $ | 8,160 | ||||||||||||
|
Abandonment
and impairment of certain long-lived manufacturing assets
|
- | (147 | ) | 565 | (418 | ) | - | 36,942 | 36,942 | |||||||||||||||||||
|
Fiscal
2007 Restructuring Plan:
|
||||||||||||||||||||||||||||
|
Employee
severance and relocation benefits
|
- | - | - | - | - | 2,888 | 2,888 | |||||||||||||||||||||
|
Contract
termination costs
|
487 | 115 | (478 | ) | 42 | 166 | 1,619 | 1,659 | ||||||||||||||||||||
|
Other
restructuring costs
|
- | - | - | - | - | 113 | 113 | |||||||||||||||||||||
|
Fiscal
2006 Restructuring Plan:
|
||||||||||||||||||||||||||||
|
Employee
severance and relocation benefits
|
- | - | - | - | - | 20,197 | 20,197 | |||||||||||||||||||||
|
Contract
termination costs
|
1,239 | (155 | ) | (354 | ) | 283 | 1,013 | 2,612 | 2,890 | |||||||||||||||||||
|
Other
restructuring costs
|
- | - | - | - | - | 2,194 | 2,194 | |||||||||||||||||||||
|
Total
|
$ | 4,904 | $ | 2,180 | $ | (5,336 | ) | $ | (550 | ) | $ | 1,198 | $ | 74,725 | $ | 75,043 | ||||||||||||
NOTE
4—COLLABORATIVE AGREEMENTS
The
Company has agreements with several entities to develop and test probe arrays
for the detection of certain gene sequences, mutations or organisms. Under such
agreements, the Company may receive development fees and may receive payments
upon achievement of certain technical goals. The Company also has research
agreements with many universities and research organizations. The Company’s
material agreement is described below.
F.
Hoffmann-La Roche Ltd. (“Roche”)
In
February 1998, the Company entered into a non-exclusive collaborative
development agreement with F. Hoffmann-La Roche Ltd. (“Roche”) to initially
develop human probe array-based diagnostic products. Under the terms of the
agreement the parties are collaborating to develop mutually agreed upon arrays,
as well as associated instrumentation, software, and reagents. In January 2003,
the Company expanded its collaboration with Roche by granting Roche access to
our GeneChip®
technologies to develop and commercialize GeneChip®
diagnostic laboratory tests for DNA analysis, genotyping and resequencing
applications, as well as for RNA expression analysis, in a broad range of human
disease areas. Under the terms of the collaborative agreement, Roche paid the
Company an access fee of $70 million and the agreement also includes a
broad range of other compensation payable by Roche to Affymetrix throughout the
life of the agreement based on royalties on sales of diagnostic kits and
milestone payments for technical and commercial achievements. As part of the
agreement, Affymetrix will manufacture and supply Roche with microarrays and
related instrumentation based on Affymetrix’ GeneChip®
platform.
The
parties amended the collaborative development agreement in December 2006. Under
the terms of the amendment, Roche is relieved of certain future license
installment payments that would have been payable by Roche to Affymetrix under
the agreement beginning in 2008, Affymetrix is relieved of certain “most
favorable terms and conditions” obligations to Roche, and Roche has agreed to
pay to Affymetrix additional milestone payments related to future commercial
achievements. The license agreement is subject to Roche’s option to terminate on
December 31, 2010 or any time on or after December 31, 2015, with one
year’s prior notice.
The Company assessed the revenue recognition of the December 2006
collaborative agreement amendment to account for the multiple deliverables in
the arrangement and to evaluate the revenue allocated to each of the units of
accounting (the research and development period and the manufacturing and supply
period). In addition, the Company re-assessed the estimated remaining research
and development period and determined that Roche’s one-time, upfront payment of
$70 million under the license agreement should continue to be recognized as
a component of royalties and other revenue over the remaining estimated research
and development through fiscal 2007. Research revenue under this contract was
approximately $14.2 million for the year ended December 31, 2007. The
associated research costs were not significant.
NOTE
5—CONCENTRATIONS OF RISK
Cash
equivalents and investments are financial instruments that potentially subject
Affymetrix to concentrations of risk to the extent of amounts recorded in the
consolidated balance sheets. Company policy restricts the amount of credit
exposure to any one issuer and to any one type of investment, other than
securities issued by the United States Government.
The
Company has not experienced significant credit losses from its accounts
receivable. Affymetrix performs a regular review of its customer activity and
associated credit risks and does not require collateral from its customers. The
Company maintains an allowance for doubtful accounts receivable based upon the
expected collectability of accounts receivable.
Certain
raw materials or components used in the synthesis of probe arrays or the
assembly of instrumentation are currently available only from a single source or
limited sources. No assurance can be given that these raw materials or other
components of the GeneChip®
system will be available in commercial quantities at acceptable costs from other
vendors should the need arise. If the Company is required to seek alternative
sources of supply, it could be time consuming and expensive.
In
addition, the Company is dependent on its vendors to provide components of
appropriate quality and reliability and to meet applicable regulatory
requirements. Consequently, in the event that supplies from these vendors are
delayed or interrupted for any reason, the Company’s ability to develop and
supply its products could be impaired, which could have a material adverse
effect on the Company’s business, financial condition and results of
operations.
For the
fiscal years 2009, 2008 and 2007, approximately 42%, 34% and 47%, respectively,
of the Company’s total revenue was generated from sales outside the United
States. The Company’s results of operations are affected by such factors as
changes in foreign currency exchange rates, trade protection measures, longer
accounts receivable collection patterns and changes in regional or worldwide
economic or political conditions. The risks of the Company’s international
operations are mitigated in part by the extent to which its sales are
geographically distributed.
NOTE
6—FAIR VALUE OF FINANCIAL INSTRUMENTS
Fair
value is defined as the price that would be received from selling an asset or
paid to transfer a liability in an orderly transaction between market
participants at the measurement date. When determining the fair value
measurements for assets and liabilities required to be recorded at fair value,
the Company considers the principal or most advantageous market in which it
would transact and consider assumptions that market participants would use when
pricing the asset or liability, such as inherent risk, transfer restrictions and
risk of nonperformance.
A fair
value hierarchy was established which requires an entity to maximize the use of
observable inputs and minimize the use of unobservable inputs when measuring
fair value. A financial instrument’s categorization within the fair value
hierarchy is based upon the lowest level of input that is significant to the
fair value measurement. The three levels of inputs that may be used to measure
fair value are as follows:
|
·
|
Level 1:
quoted prices in active markets for identical assets or
liabilities;
|
|
·
|
Level 2:
inputs other than Level 1 that are observable, either directly or
indirectly, such as quoted prices in active markets for similar assets or
liabilities, quoted prices for identical or similar assets or liabilities
in markets that are not active, or other inputs that are observable or can
be corroborated by observable market data for substantially the full term
of the assets or
liabilities; or
|
|
·
|
Level 3:
unobservable inputs that are supported by little or no market activity and
that are significant to the fair value of the assets or
liabilities.
|
Financial
Assets and Liabilities Measured at Fair Value on a Recurring Basis
The
following table represents the Company’s fair value hierarchy for its financial
assets and liabilities measured at fair value on a recurring basis as of
December 31, 2009 and 2008 (in thousands):
|
Significant
|
||||||||||||
|
Quoted
Prices
|
Other
|
|||||||||||
|
In
Active
|
Observable
|
|||||||||||
|
Markets
|
Inputs
|
|||||||||||
|
(Level
1)
|
(Level
2)
|
Total
|
||||||||||
|
December
31, 2009:
|
||||||||||||
|
Assets:
|
||||||||||||
|
U.S.
government obligations and agencies
|
$ | - | $ | 164,370 | $ | 164,370 | ||||||
|
U.S.
corporate debt
|
- | 102,761 | 102,761 | |||||||||
|
Non-U.S.
debt and equity securities
|
1,512 | 35,274 | 36,786 | |||||||||
|
Total
financial assets
|
$ | 1,512 | $ | 302,405 | $ | 303,917 | ||||||
|
Liabilities:
|
||||||||||||
|
Convertible
notes
|
$ | 217,537 | $ | - | $ | 217,537 | ||||||
|
December
31, 2008:
|
||||||||||||
|
Assets:
|
||||||||||||
|
U.S.
government obligations and agencies
|
$ | - | $ | 203,488 | $ | 203,488 | ||||||
|
U.S.
corporate debt
|
- | 93,916 | 93,916 | |||||||||
|
Non-U.S.
debt and equity securities
|
842 | - | 842 | |||||||||
|
Total
financial assets
|
$ | 842 | $ | 297,404 | $ | 298,246 | ||||||
|
Liabilities:
|
||||||||||||
|
Convertible
notes
|
$ | 101,290 | $ | - | $ | 101,290 | ||||||
As of December 31, 2009 and 2008,
the Company had no financial assets or liabilities requiring Level 3
classification, including those that have unobservable inputs that are supported
by little or no market activity and are significant to the fair value of the
assets and liabilities.
Investments
in Debt and Equity Securities
The fair
values of all available-for-sale securities are based on quoted market prices
and are included in cash and cash equivalents, available-for-sale
securities—short-term and available-for-sale securities—long-term on the
Company’s Consolidated Balance Sheets based on the securities maturity. The
following is a summary of available-for-sale securities as of December 31,
2009 (in thousands):
|
Gross
|
Gross
|
|||||||||||||||
|
Adjusted
|
Unrealized
|
Unrealized
|
||||||||||||||
|
Cost
|
Gains
|
Losses
|
Fair
Value
|
|||||||||||||
|
U.S.
Government obligations and agency
|
||||||||||||||||
|
securities
|
$ | 163,821 | $ | 577 | $ | (28 | ) | $ | 164,370 | |||||||
|
U.S.
corporate debt securities
|
102,692 | 459 | (390 | ) | 102,761 | |||||||||||
|
Non-U.S.
debt and equity securities
|
36,049 | 766 | (29 | ) | 36,786 | |||||||||||
|
Total
securities
|
$ | 302,562 | $ | 1,802 | $ | (447 | ) | $ | 303,917 | |||||||
|
Amounts
included in:
|
||||||||||||||||
|
Cash
equivalents
|
$ | 25,791 | $ | 6 | $ | (17 | ) | $ | 25,780 | |||||||
|
Available-for-sale
securites
|
276,771 | 1,796 | (430 | ) | 278,137 | |||||||||||
|
Total
securities
|
$ | 302,562 | $ | 1,802 | $ | (447 | ) | $ | 303,917 | |||||||
|
Amounts
mature in:
|
||||||||||||||||
|
Less
than one year
|
$ | 237,061 | $ | 1,315 | $ | (438 | ) | $ | 237,938 | |||||||
|
One
to two years
|
59,638 | 442 | (9 | ) | 60,071 | |||||||||||
|
More
than two years
|
5,863 | 45 | - | 5,908 | ||||||||||||
|
Total
securities
|
$ | 302,562 | $ | 1,802 | $ | (447 | ) | $ | 303,917 | |||||||
The following is a summary of
available-for-sale securities as of December 31, 2008 (in
thousands):
|
Gross
|
Gross
|
|||||||||||||||
|
Adjusted
|
Unrealized
|
Unrealized
|
||||||||||||||
|
Cost
|
Gains
|
Losses
|
Fair
Value
|
|||||||||||||
|
U.S.
Government obligations and agency
|
||||||||||||||||
|
securities
|
$ | 205,076 | $ | 372 | $ | (134 | ) | $ | 205,314 | |||||||
|
U.S.
corporate debt securities
|
95,755 | 32 | (3,697 | ) | 92,090 | |||||||||||
|
Non-U.S.
equity securities
|
890 | - | (48 | ) | 842 | |||||||||||
|
Total
securities
|
$ | 301,721 | $ | 404 | $ | (3,879 | ) | $ | 298,246 | |||||||
|
Amounts
included in:
|
||||||||||||||||
|
Cash
equivalents
|
$ | 21,979 | $ | 20 | $ | - | $ | 21,999 | ||||||||
|
Available-for-sale
securites
|
279,742 | 384 | (3,879 | ) | 276,247 | |||||||||||
|
Total
securities
|
$ | 301,721 | $ | 404 | $ | (3,879 | ) | $ | 298,246 | |||||||
|
Amounts
mature in:
|
||||||||||||||||
|
Less
than one year
|
$ | 271,402 | $ | 11 | $ | (68 | ) | $ | 271,345 | |||||||
|
One
to two years
|
30,319 | 393 | (3,811 | ) | 26,901 | |||||||||||
|
Total
securities
|
$ | 301,721 | $ | 404 | $ | (3,879 | ) | $ | 298,246 | |||||||
Realized gains and (losses) for the
year ended December 31, 2009 were $0.3 million and $(0.1) million,
respectively. For December 31, 2008, realized gains and (losses) were
$2.1 million and $(2.5) million, respectively. Realized gains and (losses)
are included in interest income and other, net in the accompanying Consolidated
Statements of Operations. The gross unrealized losses as of December 31, 2009
were primarily related to the mortgage-backed securities that were impacted by
the weakening of the global economy caused by a lack of liquidity in the credit
markets. The gross unrealized losses as of December 31, 2008 were primarily
caused by the degradation in the value of the assets held by financial
institutions in which we owned certain U.S. corporate debt
securities.
No
significant facts or circumstances have arisen to indicate that there has been
any deterioration in the creditworthiness of the issuers of the Company’s
securities. Based on its review of these securities, including the assessment of
the severity of the related unrealized losses, the Company has not recorded any
other-than-temporary impairments on these securities for the year ended December
31, 2009. For the years ended December 31, 2008 and 2007, the Company recognized
OTTI losses of less than $0.1 million and $0.9 million,
respectively.
Additionally,
the Company did not have any noncredit-related OTTI that was recognized in OCI
during the year ended December 31, 2009 on securities not expected to be sold
and is not more likely than not required to sell before recovery of their
amortized cost basis. The Company did not record any cumulative effect
adjustments for noncredit-related portion of OTTI losses previously recognized
in earnings.
Derivative
Financial Instruments
The
Company derives a portion of its revenues in foreign currencies, predominantly
in Europe and Japan. In addition, a portion of its assets are held in
nonfunctional currencies of its subsidiaries. As of December 31, 2009 and
2008, the Company had no open hedging contracts.
Non-Marketable
Securities
As of
December 31, 2009 and 2008, the carrying amounts of the Company’s non-marketable
securities, totaling $13.1 million and $13.0 million, respectively, equaled the
estimated fair values. The estimated fair values were based on current market
rates, liquidation and net realizable values. During the year ended December 31,
2009, the Company determined that the declines in estimated fair values of
certain investments in the non-marketable equity securities portfolio were
other-than-temporary. Accordingly, the Company recorded net impairment losses on
the investments of approximately $1.1 million. No impairment was recognized for
the year ended December 31, 2008. Net investment losses are included in interest
income and other, net in the Consolidated Statements of Operations. Depending on
market conditions, the Company may incur additional charges on this investment
portfolio in the future.
NOTE
7—INVENTORIES
Inventories
consist of the following at December 31, 2009 and 2008 (in
thousands):
|
2009
|
2008
|
|||||||
|
Raw
materials
|
$ | 20,012 | $ | 22,799 | ||||
|
Work-in-process
|
9,456 | 12,192 | ||||||
|
Finished
goods
|
25,022 | 16,342 | ||||||
|
Total
|
$ | 54,490 | $ | 51,333 | ||||
NOTE
8—PROPERTY AND EQUIPMENT
Property and equipment consists of the
following as of December 31, 2009 and 2008 (in thousands):
|
2009
|
2008
|
|||||||
|
Property
and equipment:
|
||||||||
|
Construction-in-progress
|
$ | 3,561 | $ | 5,183 | ||||
|
Equipment
and furniture
|
146,449 | 161,340 | ||||||
|
Building
and leasehold improvements
|
95,535 | 84,865 | ||||||
|
Land
|
1,310 | 1,310 | ||||||
| 246,855 | 252,698 | |||||||
|
Less:
accumulated depreciation and amortization
|
(178,673 | ) | (163,353 | ) | ||||
|
Net
property and equipment
|
$ | 68,182 | $ | 89,345 | ||||
For the years ended December 31,
2009, 2008 and 2007, the Company recorded depreciation expense of $29.6 million,
$33.1 million and $23.6 million, respectively. Additionally, the
Company wrote down property and equipment in the amount of approximately
$37.0 million in connection with its 2008 Plan. Refer to Note 3,
“Restructuring”, for further information.
NOTE
9—ACQUISITIONS
Business
acquisitions are accounted for by the Company under the purchase method of
accounting whereby the Company records the assets acquired and liabilities
assumed at their estimated fair value, with the excess purchase price reflected
as goodwill. Additionally, certain costs directly related to the acquisitions
are reflected as additional purchase price in excess of net assets
acquired.
In 2008,
the Company completed three acquisitions. A summary of the purchase acquisitions
are as follows (in thousands):
|
Total
|
Assets/
|
In-Process
|
Purchased
|
|||||||||||||||||||||||||
|
Cash
|
Transaction
|
Purchase
|
(Liabilities)
|
R&D
|
Intangible
|
|||||||||||||||||||||||
|
Consideration
|
Costs
|
Consideration
|
Assumed,
Net
|
Expense
|
Assets
|
Goodwill
|
||||||||||||||||||||||
|
USB
Corporation
|
$ | 68,511 | $ | 2,052 | $ | 70,563 | $ | 38 | $ | 800 | $ | 16,300 | $ | 53,425 | ||||||||||||||
|
True
Materials, Inc.
|
19,330 | 323 | 19,653 | (713 | ) | 5,100 | - | 15,266 | ||||||||||||||||||||
|
Panomics,
Inc.
|
71,758 | 924 | 72,682 | 3,492 | 300 | 16,400 | 52,490 | |||||||||||||||||||||
|
Total
|
$ | 159,599 | $ | 3,299 | $ | 162,898 | $ | 2,817 | $ | 6,200 | $ | 32,700 | $ | 121,181 | ||||||||||||||
On
January 30, 2008, the Company acquired 100% of the outstanding shares of
USB Corporation (“USB”), a privately-held Cleveland, Ohio-based company that
develops, manufactures and markets an extensive line of molecular biology and
biochemical reagent products. The acquisition will enable the Company to
accelerate the development and commercialization of new genetic analysis
solutions and increase the value of its current product portfolio. The results
of operations of USB have been included in Affymetrix’ consolidated financial
statements since January 30, 2008.
On
July 17, 2008, the Company acquired 100% of the outstanding shares of True
Materials, Inc. (“TMI”), a privately-held San Francisco, California-based
company that develops digitally encoded microparticle technology. This
technology is applicable to the research, applied and diagnostic markets and
will enable the Company to enter low to mid-multiplex markets. The results of
operations of TMI have been included in Affymetrix’ consolidated financial
statements since July 17, 2008.
On
December 5, 2008, the Company acquired 100% of the outstanding shares of
Panomics, Inc. (“Panomics”), a privately-held Fremont, California-based
company that offers a suite of assay products for a wide variety of low to
mid-plex genetic, protein and cellular analysis applications. The acquisition of
Panomics opens up large and growing market opportunities that are downstream of
whole genome analysis. The results of operations of Panomics have been included
in Affymetrix’ consolidated financial statements since December 5,
2008.
No
acquisitions were made in 2007 and 2009.
Intangible
Assets and Goodwill—USB
A
valuation of the purchased USB intangible assets was undertaken by Affymetrix’
management in its determination of the estimated fair value of such assets. The
following is a summary of the intangible assets recognized:
|
·
|
The
$6.1 million value assigned to developed technology and patents and
core technology is included in acquired technology rights on the Company’s
Consolidated Balance Sheets and will be amortized to cost of product sales
over the estimated useful lives of these assets, generally four to five
years. Affymetrix recorded amortization expense of approximately $1.3
million and $1.2 million for the years ended December 31, 2009
and 2008, respectively, related to these acquired patents and
technology.
|
|
·
|
The
$10.2 million value assigned to customer contracts and trade names
and trademarks is included in acquired technology rights on the Company’s
Consolidated Balance Sheets and will be amortized to selling, general and
administrative expenses over the estimated useful lives of these assets,
generally four to eight years. Affymetrix recorded amortization expense of
approximately $1.8 million and $1.6 million for the years ended
December 31, 2009 and 2008, respectively, related to customer
contracts and trade names and
trademarks.
|
|
·
|
Goodwill
of $53.4 million was recorded as the excess of the purchase price
over the fair value of net assets acquired and subsequently written off in
the fourth quarter of 2008. Refer to “Note 10. Goodwill and Acquired
Technology Rights”, for further
information.
|
Intangible
Assets and Goodwill—Panomics
A
valuation of the purchased Panomics intangible assets was undertaken by
Affymetrix’ management in its determination of the estimated fair value of such
assets. The following is a summary of the intangible assets
recognized:
|
·
|
The
$6.1 million value assigned to existing technology is included in
acquired technology rights on the Company’s Consolidated Balance Sheets
and will be amortized to cost of product sales over the estimated useful
lives of these assets, generally four to seven years. Affymetrix recorded
amortization expense of approximately $1.3 million and $0.1 million
for the years ended December 31, 2009 and 2008, respectively, related
to the acquired technology.
|
|
·
|
The
$7.9 million value assigned to customer contracts and related
relationships, services and related relationships and order backlog is
included in acquired technology rights on the Company’s Consolidated
Balance Sheets and will be amortized to selling, general and
administrative expenses over the estimated useful lives of these assets,
generally five to seven years. Affymetrix recorded amortization expense of
approximately $1.5 million and $0.2 million for the years ended
December 31, 2009 and 2008, respectively, related to these intangible
assets.
|
|
·
|
The
$2.4 million value assigned to patents and core technology is
included in acquired technology rights on the Company’s Consolidated
Balance Sheets and will be amortized to research and development expense
over their estimated useful lives of four to six years. Affymetrix
recorded amortization expense of $0.5 million and less than
$0.1 million for the years ended December 31, 2009 and 2008,
respectively, related to these patents and core technology
assets.
|
|
·
|
Goodwill
of $52.5 million was recorded as the excess of the purchase price
over the net assets acquired and subsequently written off in the fourth
quarter of 2008. Refer to “Note 10. Goodwill and Acquired Technology
Rights”, for further information.
|
In-process
Technology
For each
business acquisition, management determined the estimated fair value of certain
research and development programs in-process at the acquisition date that had
not yet reached technological feasibility and had no alternative future use and
recorded approximately $0.8 million, $5.1 million and
$0.3 million related to the acquisition of USB, TMI and Panomics,
respectively, in the line item “Acquired in-process technology” in the Company’s
Consolidated Statements of Operations. The fair values of these projects were
determined using the Income Approach whereby management estimated each project’s
related future net cash flows. This discount rate is based on the Company’s
estimated weighted average cost of capital adjusted upward for the risks
associated with the projects acquired. The projected cash flows from the
acquired projects were based on estimates of revenues and operating profits
related to the projects of each acquired company considering the stage of
development of each potential product acquired, the time and resources needed to
complete the development and approval of each product, the life of each
potential commercialized product and the inherent difficulties and uncertainties
in developing products and services based on complex genetic technologies and
biochemical processes.
The
largest research and development program in-process at the acquisition date
primarily was the microRNA profiling project undertaken by TMI. The fair value
of this project was determined using the Income Approach whereby the Company
estimated the project’s related future net cash flows between 2009 and 2015 and
discounted them to their present value using a risk adjusted discount rate of
approximately 30%. This discount rate is based on the Company’s estimated
weighted average cost of capital adjusted upward for the risks associated with
the project acquired. The Company completed this project in 2009.
The
estimates used by the Company in valuing the licensed technologies and acquired
in process technologies were based upon assumptions the Company believes to be
reasonable but which are inherently uncertain and unpredictable. The Company’s
assumptions may be incomplete or inaccurate, and no assurance can be given that
unanticipated events and circumstances will not occur. Accordingly, actual
results may vary from the projected results.
Escrow
Agreements
As part
of the terms of the USB merger agreement, the Company had withheld from the
merger consideration $4.0 million, which was held in an escrow account and
released to USB shareholders as certain revenue targets were achieved in fiscal
2008. As of December 31, 2008, a total of $3.5 million was earned by the
USB shareholders and the remaining $0.5 million was returned to the
Company.
Pursuant
to the terms of the TMI merger agreement, the Company withheld from the merger
consideration $5.1 million and delivered those funds to an escrow account,
which shall be released to the founder and certain key employees of TMI upon
achievement of certain employment milestones. As the continuous employment
milestones are achieved, a portion of the escrow funds shall be disbursed to the
founder and certain key employees consistent with the terms of the merger
agreement. The Company records these disbursements as compensation in research
and development expense as earned. As of December 31, 2009,
$3.0 million in total had been disbursed from the escrow
account.
NOTE
10—GOODWILL AND ACQUIRED TECHNOLOGY RIGHTS
Goodwill
In 2008,
the Company recorded goodwill impairment charges of $239.1 million which
represented the entire goodwill amount the Company had previously recognized in
connection with its acquisitions of ParAllele in 2005 and USB, TMI and Panomics
in 2008. The write-off was presented as “Goodwill impairment charges” in the
Company’s Consolidated Statements of Operations. In 2009, the Company received
payment on a claim to recover $0.5 million from the USB acquisition indemnity
escrow for certain tax liabilities that were not recognized during the purchase
method of accounting for the USB acquisition. The reimbursement was recorded as
a credit to goodwill impairment charges in 2009.
Acquired
Technology Rights
Acquired
technology rights are comprised of licenses to technology covered by patents
owned by third parties or patents acquired by the Company and are amortized over
the expected useful lives of these assets, which range from one to fifteen
years. Accumulated amortization of these rights amounted to $59.2 million and
$52.4 million December 31, 2009 and 2008, respectively.
In 2008,
based on a combination of factors, including a sustained decline in the
Company’s stock price, the Company concluded that there were sufficient
indicators to require it to perform an impairment analysis of its acquired
technology rights. The impairment analysis for acquired technology rights
indicated that some of the acquired technology rights were not recoverable as
the sum of its estimated future undiscounted cash flows were below the asset’s
carrying value and accordingly, the Company estimated the fair value of these
identified intangible assets using a discounted cash flow analysis to measure
the impairment loss. As a result of this analysis, the Company wrote-off the
difference between the acquired technology rights’ estimated fair value and the
carrying values which resulted in a non-cash impairment charge totaling
$5.5 million, of which $1.9 million was included as a component of
“Cost of product sales”, $3.2 million was included as a component of
“Research and development”, and $0.4 million was included as a component of
“Selling, general and administration” expenses in the Consolidated Statement of
Operations for the year ended December 31, 2008. No further impairment charges
were recorded in the year ended December 31, 2009 and the $49.9 million balance
at December 31, 2009 is expected to be recoverable.
The
expected future annual amortization expense of the Company’s acquired technology
rights is as follows (in thousands):
|
Amortization
|
||||
|
For the Year Ending December
31,
|
Expense
|
|||
|
2010
|
$ | 12,302 | ||
|
2011
|
12,122 | |||
|
2012
|
10,348 | |||
|
2013
|
7,840 | |||
|
2014
|
6,124 | |||
|
Thereafter
|
1,119 | |||
|
Total
|
$ | 49,855 | ||
NOTE
11—ACCOUNTS PAYABLE AND ACCRUED LIABILITIES
Accounts
payable and accrued liabilities as of December 31, 2009 and 2008 consist of
the following (in thousands):
|
December
31,
|
December
31,
|
|||||||
|
2009
|
2008
|
|||||||
|
Accounts
payable
|
$ | 15,243 | $ | 19,005 | ||||
|
Accrued
compensation and related liabilities
|
22,266 | 20,953 | ||||||
|
Accrued
interest
|
3,965 | 5,073 | ||||||
|
Accrued
taxes
|
7,814 | 5,399 | ||||||
|
Accrued
legal
|
1,022 | 4,500 | ||||||
|
Accrued
warranties
|
1,685 | 1,603 | ||||||
|
Other
|
5,188 | 6,026 | ||||||
|
Total
|
$ | 57,183 | $ | 62,559 | ||||
NOTE
12—RELATED PARTY TRANSACTIONS
Related
Party Transactions
Prior to
December 31, 2009, the Company, and certain of its affiliates, including certain
members of the Board of Directors, held approximately 22% ownership interest in
Perlegen Sciences, Inc. (“Perlegen”), a privately-held biotechnology
company. Two members of Perlegen’s Board of Directors also served as members of
the Company’s Board of Directors.
The
Company determined that Perlegen was a variable interest entity in which the
Company held a variable interest, but was not considered the primary
beneficiary. The Company accounted for its ownership interest in Perlegen using
the equity method as the Company and its affiliates did not control the
strategic, operating, investing and financing activities of Perlegen; however,
the Company had significant influence over Perlegen’s operating activities.
Further, the Company had no obligations to provide funding to Perlegen nor did
it guarantee or otherwise have any obligations related to the liabilities or
results of operations of Perlegen or its investors. As of June 30, 2005,
the Company had reduced the carrying value of its investment to zero through the
recording of its proportionate share of Perlegen’s operating
losses.
In the
fourth quarter of 2009, Perlegen ceased operations permanently, effective
immediately, and the Company has no continuing or future obligation to or
financial interest in Perlegen.
NOTE
13—COMMITMENTS AND CONTINGENCIES
Operating
Leases
Affymetrix
leases laboratory, office and manufacturing facilities under non-cancelable
operating leases that expire at various times through 2016. Some of these leases
contain renewal options ranging from two to five years and escalation clauses.
Rent expense related to operating leases for the years ended December 31,
2009, 2008 and 2007 was approximately $10.2 million, $11.0 million and
$14.6 million, respectively. In connection with some of these facility
leases, the Company has made security deposits totaling $3.0 million, which are
included in long-term other assets in the Consolidated Balance
Sheets.
Future
minimum lease obligations, net of sublease income, at December 31, 2009
under all non-cancelable operating leases are as follows (in
thousands):
|
For the Year Ending December
31,
|
Amount
|
|||
|
2010
|
$ | 8,907 | ||
|
2011
|
7,224 | |||
|
2012
|
6,698 | |||
|
2013
|
4,861 | |||
|
2014
|
461 | |||
|
Thereafter
|
527 | |||
|
Total
|
$ | 28,678 | ||
Sublease
income is expected to be approximately $0.8 million for fiscal years 2010
and 2011, $0.9 million for fiscal year 2012, $0.5 million for fiscal 2013
and $0 thereafter.
Product
Warranty Commitment
The Company provides for anticipated
warranty costs at the time the associated revenue is recognized. Product
warranty costs are estimated based upon the Company’s historical experience and
the warranty period. The Company periodically reviews the adequacy of its
warranty reserve and adjusts, if necessary, the warranty percentage and accrual
based on actual experience and estimated costs to be incurred. In 2009, we
experienced more warranty claims for instruments than expected. Information
regarding the changes in the Company’s product warranty liability for the years
ended December 31, 2007 and 2008 is as follows (in thousands):
|
Amount
|
||||
|
Balance
at December 31, 2007
|
$ | 3,007 | ||
|
New
warranties issued
|
2,542 | |||
|
Repairs
and replacements
|
(3,278 | ) | ||
|
Adjustments
|
(667 | ) | ||
|
Balance
at December 31, 2008
|
$ | 1,604 | ||
|
New
warranties issued
|
3,016 | |||
|
Repairs
and replacements
|
(3,526 | ) | ||
|
Adjustments
|
591 | |||
|
Balance
at December 31, 2009
|
$ | 1,685 | ||
Non-Cancelable
Supply Agreements
As of
December 31, 2009, the Company had approximately $1.0 million of
non-cancelable inventory supply agreements that are in effect through
2010.
Indemnifications
From time
to time the Company has entered into indemnification provisions under certain of
its agreements with other companies in the ordinary course of business,
typically with business partners, customers, and suppliers. Pursuant to these
agreements, the Company generally indemnifies, holds harmless, and agrees to
reimburse the indemnified parties on a case by case basis for losses suffered or
incurred by the indemnified parties in connection with any U.S. patent or other
intellectual property infringement claim by any third party with respect to its
products. The term of these indemnification provisions is generally perpetual
from the time of the execution of the agreement. The maximum potential amount of
future payments the Company could be required to make under these
indemnification provisions is unlimited. In addition, the Company has entered
into indemnification agreements with its officers and directors. The Company has
not incurred material costs to defend lawsuits or settle claims related to these
indemnification provisions. As of December 31, 2009, the Company had not
accrued a liability for this guarantee, because the likelihood of incurring a
payment obligation in connection with this guarantee is remote.
Legal
Proceedings
The
Company has been in the past, and continues to be, a party to litigation which
has consumed, and may continue to consume, substantial financial and managerial
resources. The following are material legal
proceedings to which the Company or one or more of its subsidiaries is a
party:
|
Illumina
Lawsuit
|
On
May 4, 2009 and November 3, 2009, the Company was named as a defendant in
two separate complaints filed by plaintiff, Illumina, Inc., in the U.S.
District Court for the Western District of Wisconsin. In the complaints,
plaintiff alleges that the Company is infringing Patent No. 7,510,841 and
Patent No. 7,612,020 by making and selling certain of the GeneChip® products.
Plaintiff seeks a permanent injunction enjoining the Company from further
infringement and unspecified monetary damages. The two separate complaints
have been consolidated into a single case. The case has been set for
trial in Wisconsin on March 14, 2011. The Company will vigorously defend against
all of plaintiff’s claims.
|
E8
Pharmaceuticals LLC
|
On
July 1, 2008, the Company was named as a defendant in a complaint filed by
plaintiffs E8 Pharmaceuticals LLC and Massachusetts Institute of Technology
("MIT") in the United States District Court of Massachusetts. In the complaint,
the plaintiffs allege that the Company is infringing one patent owned by MIT and
licensed to E8 Pharmaceuticals by making and selling the Company’s GeneChip®
products to customers and teaching its customers how to use the products. The
plaintiffs seek a permanent injunction enjoining the Company from further
infringement, unspecified monetary damages, enhanced damages pursuant to 35
U.S.C. § 284, costs, attorneys’ fees and other relief as the court deems
just and proper. The Company will vigorously defend against all of the
plaintiffs’ claims.
|
Enzo
Litigation
|
On
October 28, 2003, Enzo Life Sciences, Inc., a wholly-owned subsidiary
of Enzo Biochem, Inc. (collectively “Enzo”), filed a complaint against the
Company that is now pending in the United States District Court for the Southern
District of New York for breach of contract, injunctive relief and declaratory
judgment. The Enzo complaint relates to a 1998 distributorship agreement with
Enzo under which the Company served as a non-exclusive distributor of certain
reagent labeling kits supplied by Enzo. In its complaint, Enzo seeks monetary
damages and an injunction against the Company from using, manufacturing or
selling Enzo products and from inducing collaborators and customers to use Enzo
products in violation of the 1998 agreement. Enzo also seeks the transfer of
certain Affymetrix patents to Enzo. In connection with its complaint, Enzo
provided the Company with a notice of termination of the 1998 agreement
effective on November 12, 2003.
On
November 10, 2003, the Company filed a complaint against Enzo in the United
States District Court for the Southern District of New York for declaratory
judgment, breach of contract and injunctive relief relating to the 1998
agreement. In its complaint, the Company alleges that Enzo has engaged in a
pattern of wrongful conduct against it and other Enzo labeling reagent customers
by, among other things, asserting improperly broad rights in its patent
portfolio, improperly using the 1998 agreement and distributorship agreements
with others in order to corner the market for non-radioactive labeling reagents,
and improperly using the 1998 agreement to claim ownership rights to the
Company’s proprietary technology. The Company seeks declarations that it has not
breached the 1998 agreement and that nine Enzo patents that are identified in
the 1998 agreement are invalid and/or not infringed by it. The Company also
seeks damages and injunctive relief to redress Enzo’s alleged breaches of the
1998 agreement, its alleged tortuous interference with the Company’s business
relationships and prospective economic advantage, and Enzo’s alleged unfair
competition. The Company filed a notice of related case stating that its
complaint against Enzo is related to the complaints already pending in the
Southern District of New York against eight other former Enzo distributors. The
U.S. District Court for the Southern District of New York has related the
Company’s case. There is no trial date in the actions between Enzo and the
Company.
|
Administrative
Proceedings
|
The Company’s intellectual property is
subject to a number of significant administrative actions. These proceedings
could result in the Company’s patent protection being significantly modified or
reduced, and the incurrence of significant costs and the consumption of
substantial managerial resources.
NOTE
14—SENIOR CONVERTIBLE NOTES
3.50%
Senior Convertible Notes
On
November 13, 2007, the Company issued $316.3 million principal amount
of 3.50% Senior Convertible Notes (the “3.50% Notes”) due January 15, 2038.
The net proceeds after issuance costs from the 3.50% Notes offering were
approximately $309.4 million. The 3.50% Notes bear interest of 3.50% per
year on the principal amount payable semi-annually in arrears on January 15
and July 15 of each year. The Company incurred underwriter discount and
issuance costs of approximately $6.9 million, which are being amortized
over the effective life of the 3.50% Notes which is five years, the period up to
the first date that the holders of the 3.50% Notes (the “Holders”) can require
the Company to repurchase the notes.
The 3.50%
Notes are convertible into 33.1991 shares of Affymetrix common stock per $1,000
principal amount of notes which equates to 10,499,215 shares of common stock, or
a conversion price equivalent of $30.12 per share of common stock. The
conversion rate is subject to adjustment upon the occurrence of the following
specified events:
|
|
•
|
issuing
shares of the Company’s common stock as a dividend or distribution of the
Company’s common stock;
|
|
|
•
|
effecting
a stock split or stock combination;
|
|
|
•
|
issuing
to all or substantially all Holders of the Company’s common stock any
rights or warrants under certain circumstances and with certain
entitlements;
|
|
|
•
|
distributing
shares of the Company’s common stock, evidences of indebtedness or other
assets or property, to all or substantially all Holders of the Company’s
common stock, with certain
exceptions;
|
|
|
•
|
making
cash distributions to all or substantially all Holders of the Company’s
common stock; or
|
|
|
•
|
should
the Company or any of its subsidiaries purchase shares of its common stock
pursuant to a tender offer at a premium to
market.
|
Holders
may convert their 3.50% Notes into shares of Affymetrix stock at any time at
their option at the initial conversion rate, subject to adjustment, prior to the
close of business on the business day prior to the maturity date.
On
January 15, 2013, 2018 and 2028, the security holders have the option to
require the Company to repurchase the 3.50% Notes at a price equal to 100% of
the principal amount of the 3.50% Notes plus accrued interest. Additionally, on
or after January 15, 2013, Affymetrix has the option of redeeming for cash
at 100% of the principal amount all or part of the then outstanding 3.50% Notes
plus accrued interest.
The 3.50%
Notes are unsecured and rank equally with the Company’s other existing and
future senior indebtedness. The 3.50% Notes are structurally subordinated to any
current or future indebtedness and other liabilities of the Company’s
subsidiaries.
In the
second quarter of 2009, the Company repurchased approximately $69.1 million of
aggregate principal amount of the 3.50% Notes. The Company paid out total cash
considerations of $50.6 million, including accrued interest of $0.9 million, and
recognized a gain of $17.4 million, net of transaction costs of $0.9 million and
accelerated amortization of deferred financing costs of $1.0 million. As of
December 31, 2009, the balance remaining on the 3.50% Notes was $247.2
million.
0.75%
Senior Convertible Notes
On
December 10, 2003, the Company issued $120.0 million of 0.75% Senior
Convertible Notes (the “0.75% Notes”) due December 15, 2033. The net
proceeds after issuance costs from the 0.75% Notes offering were approximately
$116.0 million, net of broker discounts and issuance costs of $3.8 million
and bore interest of 0.75% per year on the principal amount payable
semi-annually in arrears on June 15 and December 15 of each year,
beginning June 15, 2004. The 0.75% Notes had an effective life of five
years, the period up to the first date that the holders of the 0.75% Notes could
require the Company to repurchase the notes.
The 0.75%
Notes were convertible into 32.2431 shares of Affymetrix common stock per $1,000
principal amount of notes which equated to 3,869,172 shares of common stock, or
a conversion price equivalent of $31.01 per share of common stock. The
conversion rate was subject to adjustment upon the occurrence of certain
specified events.
On
December 15, 2008, the Company repurchased $119.9 million of the
$120.0 million of 0.75% Notes as the holders of the 0.75% notes exercised
their option to require the Company to repurchase the 0.75% Notes at a price
equal to 100% of the principal amount of the 0.75% Notes plus accrued and unpaid
interest. The balance of the 0.75% Notes at December 31, 2009 was less than
$0.1 million.
NOTE
15—STOCKHOLDERS’ EQUITY
Stockholder
Rights Plan
In
February 2010, the Company’s existing stockholder rights plan expired and no
further plan has been adopted.
Stock-Based
Compensation Plans
The
Company has a stock-based compensation program that provides the Board of
Directors broad discretion in creating equity incentives for employees,
officers, directors and consultants. This program includes incentive and
non-qualified stock options and non-vested stock awards (also known as
restricted stock) granted under various stock plans. Stock options are generally
time-based, vesting 25% on each annual anniversary of the grant date over four
years and expire 7 to 10 years from the grant date. Non-vested restricted
stock awards are generally time-based, vesting 25% per year beginning on the
date of hire and on each of the second, third and fourth anniversaries of the
grant date. As of December 31, 2009, the Company had approximately
2.0 million shares of common stock reserved for future issuance under its
stock-based compensation plans. New shares are issued as a result of stock
option exercises and non-vested restricted stock awards. A more detailed
description of the Company’s current stock option plans follows
below.
In 1998,
the Board of Directors adopted the Affymetrix 1998 Stock Incentive Plan (the
“1998 Stock Plan”) under which nonqualified stock options and restricted stock
may be granted to employees and outside consultants, except that members of the
Board of Directors and individuals who are considered officers of the Company
under the rules of the National Association of Securities Dealers shall not be
eligible. Options granted under the 1998 Stock Plan expire no later than ten
years from the date of grant. The option price shall be at least 100% of the
fair value of the Company’s common stock on the date of grant (110% in certain
circumstances), as determined by the Board of Directors. Options may be granted
with different vesting terms from time to time as determined by the Board of
Directors. A total of 3,600,000 shares of common stock are authorized for
issuance under the 1998 Stock Plan.
In 2000,
the Board of Directors adopted the 2000 Equity Incentive Plan (the “2000 Stock
Plan”), which was amended and restated in 2001, under which restricted shares,
stock units, stock options and stock appreciation rights may be granted to
employees, outside directors and consultants. Options granted under the 2000
Stock Plan expire no later than ten years from the date of grant. The option
price shall be at least 100% of the fair value of the Company’s common stock on
the date of grant (110% in certain circumstances), as determined by the Board of
Directors. Options may be granted with different vesting terms from time to time
as determined by the Board of Directors. In 2008, the 2000 Stock Plan was
amended and restated to increase share availability by 4,200,000 shares bringing
the total shares of common stock authorized for issuance under the 2000 Stock
Plan to 11,700,000. No additional shares were authorized in 2009.
The
following table sets forth the total stock-based compensation expense resulting
from stock options and non-vested stock awards included in the Company’s
Condensed Consolidated Statements of (Loss) Income (in thousands):
|
Years
Ended December 31,
|
||||||||||||
|
2009
|
2008
|
2007
|
||||||||||
|
Costs
of product sales
|
$ | 1,677 | $ | 1,305 | $ | 1,107 | ||||||
|
Research
and development
|
2,207 | 1,665 | 2,064 | |||||||||
|
Selling,
general and administrative
|
7,264 | 4,641 | 7,215 | |||||||||
|
Restructuring
|
- | - | 340 | |||||||||
|
Total
stock-based compensation expense
|
$ | 11,148 | $ | 7,611 | $ | 10,726 | ||||||
As of
December 31, 2009, $23.0 million of total unrecognized stock-based
compensation expense related to non-vested awards is expected to be recognized
over the respective vesting terms of each award through 2013. The
weighted-average term of the unrecognized stock-based compensation expense is
2.8 years.
Stock
Options
The fair
value of options was estimated at the date of grant using a Black-Scholes option
pricing model with the following weighted-average assumptions:
|
Years
Ended December 31,
|
||||||||||||
|
2009
|
2008
|
2007
|
||||||||||
|
Risk
free interest rate
|
1.7 | % | 3.0 | % | 4.4 | % | ||||||
|
Expected
dividend yield
|
0.0 | % | 0.0 | % | 0.0 | % | ||||||
|
Expected
volatility
|
70 | % | 44 | % | 42 | % | ||||||
|
Expected
option term (in years)
|
4.1 | 4.5 | 4.5 | |||||||||
The risk
free interest rate for periods within the contractual life of the Company’s
stock options is based on the U.S. Treasury yield curve in effect at the time of
grant. The expected term is derived from an analysis of the Company’s historical
exercise trends over ten years. The expected volatility for the years ended
December 31, 2009 and 2008 is based on a blend of historical and
market-based implied volatility. Using the assumptions above, the
weighted-average grant date fair value of options granted during the years ended
December 31, 2009, 2008 and 2007 was $3.03, $4.32 and $10.18,
respectively.
Activity
under the Company’s stock plans for the year ended December 31, 2009 is as
follows (in thousands, except per share amounts):
|
Weighted-Average
|
Weighted-Average
|
Aggregate
|
||||||||||||||
|
Exercise
Price
|
Remaining
|
Intrinsic
|
||||||||||||||
|
Shares
|
Per
Share
|
Contractual
Terms
|
Value
|
|||||||||||||
|
(in
years)
|
||||||||||||||||
|
Outstanding
at December 31, 2008
|
6,257 | $ | 23.09 | |||||||||||||
|
Grants
|
2,217 | 5.60 | ||||||||||||||
|
Exercises
|
(4 | ) | 3.55 | |||||||||||||
|
Forfeitures
or expirations
|
(2,254 | ) | 26.27 | |||||||||||||
|
Outstanding
at December 31, 2009
|
6,216 | $ | 15.72 | 4.92 | $ | 3,022 | ||||||||||
|
Exercisable
at December 31, 2009
|
2,344 | $ | 26.44 | 3.32 | $ | 95 | ||||||||||
|
Vested
and expected to vest at December 31, 2009
|
5,574 | $ | 16.56 | 4.78 | $ | 2,523 | ||||||||||
The
following table summarizes information concerning currently outstanding and
exercisable options at December 31, 2009:
|
Options
Outstanding
|
Options
Exercisable
|
|||||||||||||||||||||
|
Weighted-Average
|
Weighted-Average
|
Weighted-Average
|
||||||||||||||||||||
|
Remaining
|
Exercise
Price
|
Exercise
Price
|
||||||||||||||||||||
|
Range
of Exercise Prices
|
Number
|
Contractual
Life
|
Per
Share
|
Number
|
Per
Share
|
|||||||||||||||||
|
(in
thousands)
|
(in
years)
|
(in
thousands)
|
||||||||||||||||||||
| $ | 1.06 - $2.97 | 754 | 6.03 | $ | 2.93 | 25 | $ | 2.67 | ||||||||||||||
| $ | 3.07 - $5.74 | 613 | 6.31 | $ | 4.49 | 12 | $ | 4.61 | ||||||||||||||
| $ | 5.78 - $8.29 | 913 | 6.57 | $ | 8.26 | 11 | $ | 7.38 | ||||||||||||||
| $ | 8.71 - $10.29 | 1,418 | 5.47 | $ | 10.17 | 358 | $ | 10.18 | ||||||||||||||
| $ | 10.52 - $20.48 | 530 | 4.72 | $ | 16.90 | 258 | $ | 16.18 | ||||||||||||||
| $ | 20.50 - $25.71 | 679 | 3.74 | $ | 23.38 | 477 | $ | 23.25 | ||||||||||||||
| $ | 25.75 - $35.50 | 857 | 2.62 | $ | 29.72 | 764 | $ | 29.95 | ||||||||||||||
| $ | 35.68 - $90.91 | 452 | 2.34 | $ | 45.35 | 439 | $ | 45.50 | ||||||||||||||
|
Total
|
6,216 | 4.92 | $ | 15.72 | 2,344 | $ | 26.44 | |||||||||||||||
The
aggregate intrinsic value in the table above represents the total pretax
intrinsic value (i.e., the difference between the Company’s closing stock
price on the last trading day of its fourth quarter of 2009 and the exercise
price, multiplied by the number of in-the-money options) that would have been
received by the option holders had all option holders exercised their options on
December 31, 2009. The amount changes based on the fair market value of the
Company’s common stock. Total intrinsic value of options exercised is less than
$0.1 million, $0.3 million and $6.2 million for the years ended
December 31, 2009, 2008 and 2007, respectively.
Reserved
Shares
At
December 31, 2009, the Company has shares reserved for future issuance as
follows (in thousands):
|
Options
outstanding
|
6,216 | |||
|
Options
available for future grants
|
2,033 | |||
|
Convertible
subordinated notes
|
8,207 | |||
| 16,456 |
Restricted
Stock
The
following table summarizes the Company’s non-vested restricted stock activity
for the year ended December 31, 2009 (in thousands, except per share
amounts):
|
Number
|
Weighted-Average
|
|||||||
|
of
Shares
|
Grant
Date Fair Value
|
|||||||
|
Non-vested
stock outstanding at December 31, 2008
|
1,638 | $ | 13.86 | |||||
|
Granted
|
1,208 | $ | 5.46 | |||||
|
Vested
|
(412 | ) | $ | 15.07 | ||||
|
Forfeited
|
(333 | ) | $ | 11.31 | ||||
|
Non-vested
stock outstanding at December 31, 2009
|
2,101 | $ | 9.19 | |||||
Total
fair value of shares vested is $19.3 million and $22.7 million for the
years ended December 31, 2009 and 2008, respectively.
NOTE
16—INCOME TAXES
The
following table presents the U.S. and foreign components of consolidated (loss)
income before income taxes and the (benefit) provision for income taxes (in
thousands):
|
Year
Ended December 31,
|
||||||||||||
|
2009
|
2008
|
2007
|
||||||||||
|
(LOSS)
INCOME BEFORE INCOME TAXES:
|
||||||||||||
|
U.S.
|
$ | (25,150 | ) | $ | (244,479 | ) | $ | 11,372 | ||||
|
Foreign
|
1,083 | 2,478 | 6,910 | |||||||||
|
(Loss)
income before income taxes
|
$ | (24,067 | ) | $ | (242,001 | ) | $ | 18,282 | ||||
|
(BENEFIT)
PROVISION FOR INCOME TAXES:
|
||||||||||||
|
Current:
|
||||||||||||
|
Federal
|
$ | (2,248 | ) | $ | 12,042 | $ | 153 | |||||
|
State
|
25 | 2,780 | 14 | |||||||||
|
Foreign
|
2,123 | 2,598 | 2,002 | |||||||||
|
Subtotal
|
(100 | ) | 17,420 | 2,169 | ||||||||
|
Deferred:
|
||||||||||||
|
Federal
|
- | 43,012 | 5,251 | |||||||||
|
State
|
- | 5,317 | (1,207 | ) | ||||||||
|
Foreign
|
(58 | ) | 169 | (524 | ) | |||||||
|
Subtotal
|
(58 | ) | 48,498 | 3,520 | ||||||||
|
(Benefit)
provision for income taxes
|
$ | (158 | ) | $ | 65,918 | $ | 5,689 | |||||
The
difference between the (benefit) provision for income taxes and the amount
computed by applying the federal statutory income tax rate (35%) to (loss)
income before taxes is explained as follows (in thousands):
|
Year
Ended December 31,
|
||||||||||||
|
2009
|
2008
|
2007
|
||||||||||
|
Tax
at federal statutory rate
|
$ | (8,423 | ) | $ | (84,700 | ) | $ | 6,398 | ||||
|
State
taxes, net
|
(2,315 | ) | (3,344 | ) | (1,213 | ) | ||||||
|
Non-deductible
stock compensation
|
659 | 294 | 559 | |||||||||
|
Foreign
rate differential
|
1,686 | 1,543 | 164 | |||||||||
|
Research
credits
|
(1,772 | ) | (1,142 | ) | (849 | ) | ||||||
|
Goodwill
impairment
|
- | 64,986 | - | |||||||||
|
Change
in valuation allowance
|
8,968 | 85,603 | - | |||||||||
|
Other
|
1,039 | 2,678 | 630 | |||||||||
|
|
$ | (158 | ) | $ | 65,918 | $ | 5,689 | |||||
Deferred
income taxes reflect the net tax effects of temporary differences between the
carrying amounts of assets and liabilities for financial reporting purposes and
the amounts used for income tax purposes. Significant components of the
Company’s assets are as follows (in thousands):
|
December
31,
|
||||||||
|
2009
|
2008
|
|||||||
|
Deferred
tax assets:
|
||||||||
|
Net
operating loss carryforwards
|
$ | 48,209 | $ | 38,501 | ||||
|
Tax
credit carryforwards
|
38,710 | 39,426 | ||||||
|
Deferred
revenue
|
1,802 | 1,768 | ||||||
|
Capitalized
research and development costs
|
799 | 1,012 | ||||||
|
Intangibles
|
22,536 | 23,776 | ||||||
|
Stock-based
compensation
|
5,629 | 9,085 | ||||||
|
Accrued
compensation
|
2,432 | 2,701 | ||||||
|
Accrued
warranty
|
676 | 639 | ||||||
|
Inventory
reserve
|
3,101 | 4,976 | ||||||
|
Reserves
and other
|
12,323 | 11,657 | ||||||
|
Depreciation
and amortization
|
21,184 | 18,176 | ||||||
|
Other,
net
|
2,626 | 3,404 | ||||||
|
Total
deferred tax assets
|
160,027 | 155,121 | ||||||
|
Valuation
allowance for deferred tax assets
|
(139,343 | ) | (139,712 | ) | ||||
|
Net
deferred tax assets
|
20,684 | 15,409 | ||||||
|
Net
deferred tax liabilities:
|
||||||||
|
Acquired
intangibles
|
(4,900 | ) | (6,728 | ) | ||||
|
Cancellation
of debt
|
(6,767 | ) | - | |||||
|
Other,
net
|
(3,125 | ) | (2,840 | ) | ||||
|
Total
deferred tax liabilities
|
(14,792 | ) | (9,568 | ) | ||||
|
Net
deferred tax assets
|
$ | 5,892 | $ | 5,841 | ||||
As of
December 31, 2009, the Company had total net operating loss carryforwards
of $242.2 million, comprised of $134.9 million for U.S. federal
purposes, which expire in the years 2020 through 2029 if not utilized, and
$107.3 million for state purposes, the majority of which expire in the
years 2011 through 2029 if not utilized. Additionally, the Company has federal
research and development tax credit carryforwards of approximately
$21.5 million, which expire in the years 2012 through 2029 if not utilized.
The Company also has state research and development tax credit carryforwards and
other various tax credit carryforwards of approximately $35.7 million.
Substantially all of the state tax credits can be carried forward indefinitely.
Utilization of net operating loss and tax credit carryforwards may be subject to
substantial annual limitations due to the ownership change limitations provided
by the Internal Revenue Code and similar state provisions. Such an annual
limitation may result in the expiration of the net operating loss before
utilization.
As of
December 31, 2009, the Company has recorded a full valuation allowance
against the US deferred tax assets, net of reserves for uncertain tax positions.
The valuation allowance decreased by $0.4 million and increased by
$75.1 million for the years ended December 31, 2009 and 2008,
respectively. The decrease during fiscal year 2009 is attributable to the
utilization of tax credits. Approximately $34.9 million of the
valuation allowance as of December 31, 2009 is attributable to the income
tax benefits of stock-based compensation, the benefit of which will be credited
to stockholders’ equity when, and if, realized.
Not
included in the deferred tax assets as of December 31, 2009 is
approximately $4.2 million of tax benefits related to stock-based
compensation. When realized, the tax benefit of these assets will be accounted
for as a credit to stockholders’ equity, rather than a reduction of the income
tax provision.
As of
December 31, 2009, cumulative un-remitted foreign earnings that are
considered to be permanently invested outside the United States and on which no
U.S. taxes have been provided were approximately $24.0 million. The residual
U.S. tax liability, if such amounts were remitted, would be
nominal.
Of the
total tax benefits realized from the stock-based compensation the amounts
recorded to stockholders’ equity were approximately $1.4 million and
$11.7 million for the years ended December 31, 2009 and 2008
respectively.
A portion
of the Company’s operations in Singapore operate under various tax holidays and
tax incentive programs, which expire in whole or in part at various dates
through 2017. There was a minimal net impact of these tax holidays and tax
incentive programs for the year ended December 31, 2009.
The
following table presents the total amount of gross unrecognized tax benefits (in
thousands):
|
2009
|
2008
|
|||||||
|
Unrecognized
tax benefits, beginning of year
|
$ | 18,545 | $ | 17,350 | ||||
|
Gross
increases - tax positions in prior period
|
1,004 | 328 | ||||||
|
Gross
decreases - tax positions in prior period
|
(731 | ) | (263 | ) | ||||
|
Gross
increases - current period tax positions
|
1,048 | 1,130 | ||||||
|
Settlements
|
- | - | ||||||
|
Unrecognized
tax benefits, end of year
|
$ | 19,866 | $ | 18,545 | ||||
If
recognized, the amount of unrecognized tax benefits that would impact income tax
expense is $2.1 million. As of December 31, 2009, the Company does not
anticipate any material changes to the amount of unrecognized tax benefits
during the next 12 months. The Company classifies interest and penalties
related to tax positions as components of income tax expense. For the year ended
December 31, 2009, the amount of accrued interest and penalties related to
tax uncertainties was approximately $0.1 million for a total cumulative
amount included in non-current income taxes payable of $0.4 million as of
December 31, 2009.
The
Company files U.S. federal, state, and foreign income tax returns in
jurisdictions with varying statutes of limitations. Our major tax jurisdictions
are the U.S., California, Singapore, and the U.K. The federal and California
statute of limitations on assessment remain open for the tax years 1992 through
2009. The major foreign jurisdictions remain open for examination in general for
tax years 2006 through 2009.
NOTE
17—SEGMENT AND GEOGRAPHIC INFORMATION
The
Company has determined that it operates in one segment as it only reports
operating results on an aggregate basis to the chief operating decision maker of
the Company.
The
Company reported total revenue by region as follows (in thousands):
|
Year
Ended December 31,
|
||||||||||||
|
2009
|
2008
|
2007
|
||||||||||
|
Customer
location:
|
||||||||||||
|
United
States
|
$ | 190,257 | $ | 269,159 | $ | 197,677 | ||||||
|
Europe
|
87,061 | 92,487 | 114,188 | |||||||||
|
Japan
|
22,588 | 23,861 | 31,572 | |||||||||
|
Other
|
27,188 | 24,742 | 27,883 | |||||||||
|
Total
|
$ | 327,094 | $ | 410,249 | $ | 371,320 | ||||||
Excluding
a $90 million one-time, non-refundable intellectual property payment
received in January 2008, there were no customers representing 10% or more of
total revenue in 2009, 2008 and 2007.
The
Company’s long-lived assets other than purchased intangible assets, which the
Company does not allocate to specific geographic locations as it is
impracticable to do so, are composed principally of net property, plant and
equipment.
Net
property, plant and equipment, classified by major geographic areas in which the
Company operates was as follows (in thousands):
|
Year
Ended December 31,
|
||||||||||||
|
2009
|
2008
|
2007
|
||||||||||
|
Net
property, plant and equipment:
|
||||||||||||
|
United
States
|
$ | 51,262 | $ | 67,680 | $ | 107,028 | ||||||
|
Singapore
|
15,510 | 20,164 | 35,275 | |||||||||
|
Other
countries
|
1,410 | 1,501 | 1,581 | |||||||||
|
Total
|
$ | 68,182 | $ | 89,345 | $ | 143,884 | ||||||
NOTE
18—DEFINED-CONTRIBUTION SAVINGS PLANS
401(k)
Plan
The
Company maintains a defined-contribution savings plan which is qualified under
Section 401(k) of the Internal Revenue Code. The plan covers substantially
all full-time U.S. employees. Participating employees may defer a portion of
their pretax earnings, up to the Internal Revenue Service annual contribution
limit. The Company’s expense associated with matching employee contributions for
the years ended December 31, 2009, 2008 and 2007 totaled $3.2 million,
$3.3 million and $3.7 million, respectively. Company contributions to
employees vest ratably over four years.
Director
and Executive Deferred Compensation Plan
In
December 2004, the Board of Directors approved the creation of the
Affymetrix, Inc. Deferred Compensation Plan (the “Plan”). The Plan provides
directors, executive officers and other eligible employees with the opportunity
to enter into agreements to defer specified percentages of their cash
compensation derived from base salary, bonus awards and other specified
compensation (including director fees). Distributions occur upon termination of
service (or the 6-month anniversary after termination), death, or upon such
other dates that may be elected by the participant in accordance with the terms
of the Plan. Generally, participants may elect for distributions of deferred
amounts upon termination or death to be paid in the form of either a lump sum or
in annual installments. Distributions would be made in the event of a change of
control of Affymetrix. Deferrals are adjusted for gain or loss based on the
performance of one or more investment options selected by the participant from
among investment funds chosen by the Compensation Committee of the Board. The
Company in its sole discretion may suspend or terminate the Plan or revise or
amend it in any respect, except that no such action may reduce vested amounts
credited to deferral accounts, and such accounts will continue to be owed to the
participants or beneficiaries and will continue to be a liability of the Company
until paid. For the years ended December 31, 2009 and 2008, the Company
incurred no significant expenses in connection with the Plan.
NOTE
19—UNAUDITED QUARTERLY FINANCIAL INFORMATION
|
2009
|
2008
|
|||||||||||||||||||||||||||||||
|
Fourth
|
Third
|
Second
|
First
|
Fourth
|
Third
|
Second
|
First
|
|||||||||||||||||||||||||
|
Quarter
|
Quarter
|
Quarter
|
Quarter
|
Quarter
|
Quarter
|
Quarter
|
Quarter
|
|||||||||||||||||||||||||
|
(in
thousands, except per share amounts)
|
||||||||||||||||||||||||||||||||
|
Total
revenue
|
$ | 88,788 | $ | 78,191 | $ | 81,554 | $ | 78,561 | $ | 78,574 | $ | 75,189 | $ | 86,911 | $ | 169,575 | ||||||||||||||||
|
Total
cost of goods sold
|
$ | 34,980 | $ | 35,870 | $ | 37,452 | $ | 42,024 | $ | 43,318 | $ | 38,167 | $ | 39,000 | $ | 31,655 | ||||||||||||||||
|
Net
income (loss)
|
$ | 2,795 | $ | (8,819 | ) | $ | 7,320 | $ | (25,205 | ) | $ | (318,716 | ) | $ | (31,820 | ) | $ | (3,635 | ) | $ | 46,252 | |||||||||||
|
Basic
net income (loss) per common share
|
$ | 0.04 | $ | (0.13 | ) | $ | 0.11 | $ | (0.37 | ) | $ | (4.65 | ) | $ | (0.46 | ) | $ | (0.05 | ) | $ | 0.68 | |||||||||||
|
Diluted
net income (loss) per common share
|
$ | 0.04 | $ | (0.13 | ) | $ | 0.11 | $ | (0.37 | ) | $ | (4.65 | ) | $ | (0.46 | ) | $ | 0.05 | $ | 0.58 | ||||||||||||
In the second quarter of 2009, the
Company recognized a gain of $17.4 million as part of the repurchase of its
3.50% Notes. In 2008, the Company recognized a one-time, nonrefundable
$90 million intellectual property payment in total revenue and a goodwill
impairment charge of $239.1 million.
Not
applicable.
Disclosure
Controls and Procedures
As
required by paragraph (b) of Exchange Act Rules 13a-15 or 15d-15,
Affymetrix’ management, including our Chief Executive Officer and Chief
Financial Officer, conducted an evaluation as of the end of the period covered
by this report, of the effectiveness of Affymetrix’ disclosure controls and
procedures as defined in Exchange Act Rule 13a-15(e) and 15d-15(e). Based
on that evaluation, our Chief Executive Officer and Chief Financial Officer
concluded that Affymetrix’ disclosure controls and procedures were effective as
of the end of the period covered by this report.
Management’s
Report on Internal Control Over Financial Reporting
Our
management is responsible for establishing and maintaining adequate internal
control over financial reporting, as such term is defined in Exchange Act
Rules 13a-15(f) and 15d-15(f). Under the supervision of our Chief Executive
Officer and Chief Financial Officer and with the participation of our
management, we conducted an evaluation of the effectiveness of our internal
control over financial reporting as of December 31, 2009 based on the
framework in Internal Control—Integrated Framework issued by the Committee of
Sponsoring Organizations of the Treadway Commission (“COSO”).
The
effectiveness of our internal control over financial reporting as of
December 31, 2009, has been audited by Ernst &Young LLP, our
independent registered public accounting firm, as stated in their report which
is included as follows.
REPORT
OF INDEPENDENT REGISTERED PUBLIC ACCOUNTING FIRM
To the
Board of Directors and Stockholders of Affymetrix, Inc.
We have
audited Affymetrix, Inc.’s internal control over financial reporting as of
December 31, 2009, based on criteria established in Internal
Control—Integrated Framework issued by the Committee of Sponsoring Organizations
of the Treadway Commission (the “COSO criteria”). Affymetrix, Inc.’s
management is responsible for maintaining effective internal control over
financial reporting, and for its assessment of the effectiveness of internal
control over financial reporting included in the accompanying Management’s
Report on Internal Control Over Financial Reporting. Our responsibility is to
express an opinion on the company’s internal control over financial reporting
based on our audit.
We
conducted our audit in accordance with the standards of the Public Company
Accounting Oversight Board (United States). Those standards require that we plan
and perform the audit to obtain reasonable assurance about whether effective
internal control over financial reporting was maintained in all material
respects. Our audit included obtaining an understanding of internal control over
financial reporting, assessing the risk that a material weakness exists, testing
and evaluating the design and operating effectiveness of internal control based
on the assessed risk, and performing such other procedures as we considered
necessary in the circumstances. We believe that our audit provides a reasonable
basis for our opinion.
A
company’s internal control over financial reporting is a process designed to
provide reasonable assurance regarding the reliability of financial reporting
and the preparation of financial statements for external purposes in accordance
with generally accepted accounting principles. A company’s internal control over
financial reporting includes those policies and procedures that (1) pertain
to the maintenance of records that, in reasonable detail, accurately and fairly
reflect the transactions and dispositions of the assets of the company;
(2) provide reasonable assurance that transactions are recorded as
necessary to permit preparation of financial statements in accordance with
generally accepted accounting principles, and that receipts and expenditures of
the company are being made only in accordance with authorizations of management
and directors of the company; and (3) provide reasonable assurance
regarding prevention or timely detection of unauthorized acquisition, use, or
disposition of the company’s assets that could have a material effect on the
financial statements.
Because
of its inherent limitations, internal control over financial reporting may not
prevent or detect misstatements. Also, projections of any evaluation of
effectiveness to future periods are subject to the risk that controls may become
inadequate because of changes in conditions, or that the degree of compliance
with the policies or procedures may deteriorate.
In our
opinion, Affymetrix, Inc. maintained, in all material respects, effective
internal control over financial reporting as of December 31, 2009, based on
the COSO criteria.
We also
have audited, in accordance with the standards of the Public Company Accounting
Oversight Board (United States), the consolidated balance sheets of
Affymetrix, Inc. as of December 31, 2009 and 2008, and the related
consolidated statements of operations, comprehensive income (loss),
stockholders’ equity, and cash flows for each of the three fiscal years in the
period ended December 31, 2009 of Affymetrix, Inc. and our report
dated March 1, 2010 expressed an unqualified opinion thereon.
|
/s/
Ernst &
Young LLP
|
|
|
San
Jose, California
March
1, 2010
|
Changes
in Internal Control Over Financial Reporting
There
were no changes in our internal control over financial reporting identified in
connection with the evaluation required by paragraph (d) of Exchange Act
Rules 13a-15 or 15d-15 that occurred during our last fiscal quarter that
have materially affected or are reasonably likely to materially affect, our
internal control over financial reporting.
The 2010
Annual Meeting of Stockholders of Affymetrix will take place on Friday, May 14,
2010. The Board
of Directors set March 22, 2010 as the record date for the meeting.
As previously disclosed in our proxy
statement dated May 11, 2009, proposals of stockholders intended to be included
in our proxy statement for our 2010 annual meeting must have been received by us
no later than January 15, 2010 in order to be included in our proxy statement
and form of proxy relating to the meeting. Stockholders intending to
present a proposal at the 2010 annual meeting, but not to include the proposal
in our proxy statement, must submit a written notice of intent to present such a
proposal to the Secretary at our principal executive offices no later than March
11, 2010.
Information
regarding our directors and executive officers is incorporated by reference to
the sections of the Company’s proxy statement for the 2010 Annual Meeting of
Stockholders (the “Proxy Statement”) entitled “Election of Directors” and
“Management.”
The
information concerning our corporate governance, including our audit committee,
required by this Item is incorporated by reference to the sections of the Proxy
Statement entitled “Governance of the Company” and “Report of the Audit
Committee.”
The
information concerning compliance with Section 16(a) of the Exchange Act
required by this Item is incorporated by reference to the section of the Proxy
Statement entitled “Section 16(a) Beneficial Ownership Reporting
Compliance” under the heading “Stock Ownership of Principal Stockholders and
Management.”
CODE
OF ETHICS
Affymetrix
has adopted a code of business conduct and ethics for directors, officers
(including Affymetrix’ Chief Executive Officer, Chief Financial Officer and
Corporate Controller) and employees, known as the Code of Business Conduct and
Ethics. The Code of Business Conduct and Ethics is available on Affymetrix’
website at www.affymetrix.com
in the Corporate Governance section under the “Investors” link. Stockholders may
request a free copy of the Code of Business Conduct and Ethics by sending an
email request to investor@affymetrix.com.
Incorporated
by reference to the sections of the Proxy Statement entitled “Executive
Compensation,” “Compensation Discussion and Analysis,” “Compensation Committee
Report,” “Certain Transactions” and “Compensation of Directors.”
Incorporated
by reference to the section of the Proxy Statement entitled “Stock Ownership of
Principal Stockholders and Management.”
Incorporated
by reference to the sections of the Proxy Statement entitled “Certain
Transactions” and “Governance of the Company.”
Information
about principal accountant fees and services as well as related pre-approval
policies appears under “Fees Paid to Ernst & Young LLP” and “Audit
Committee Pre-Approval of Audit and Permissible Non-Audit Services of
Independent Registered Public Accounting Firm” in the Proxy Statement. Those
portions of the Proxy Statement are incorporated by reference into this
report.
(a)(1) Financial
Statements. The financial statements as set forth under Item 8 of this
Annual Report on Form 10-K are incorporated herein by
reference.
(a)(2) Financial
Statement Schedule—Schedule II—Valuation and Qualifying Accounts. All other
schedules have been omitted as they are not required, not applicable or the
information is otherwise included.
(a)(3) Exhibits:
|
EXHIBIT
NUMBER
|
DESCRIPTION
OF DOCUMENT
|
|
2.1(1)
|
Agreement
and Plan of Merger by and among Panomics, Inc., the Company, Panda
Acquisition Corporation and the Equityholders’ Representative dated as of
November 11, 2008.
|
|
3.1(2)
|
Restated
Certificate of Incorporation.
|
|
3.2(3)
|
Amended
and Restated Bylaws.
|
|
4.1(4)
|
Indenture
dated as of December 15, 2003, between the Company and The Bank of
New York, as Trustee.
|
|
4.2(5)
|
Indenture
dated as of November 16, 2007, between the Company and the Bank of
New York Trust Company, N.A. as Trustee.
|
|
10.1(6)‡
|
1993
Stock Plan, as amended.
|
|
10.2(6)‡
|
1996
Nonemployee Directors Stock Option Plan.
|
|
10.3(7)
|
Lease
between Sobrato Interests and the Company dated June 12, 1996 (3380
Central Expressway, Santa Clara, CA).
|
|
10.4(7)
|
Lease
between Sobrato Interests and the Company dated May 31, 1996 (3450
Central Expressway, Santa Clara, CA).
|
|
10.5(8)‡
|
1998
Stock Incentive Plan.
|
|
10.6(8)‡
|
Form
of Officer and Director Indemnification Agreement.
|
|
10.7(9)‡
|
Amendment
No. 1 to the 1996 Nonemployee Directors Stock Option Plan of the
Company
|
|
10.8(10)‡
|
Amended
and Restated 1996 Non-Employee Directors Stock Plan.
|
|
10.9(11)*
|
Common
Terms Agreement between F. Hoffmann-La Roche Ltd. and the Company
dated January 29, 2003.
|
|
10.10(11)*
|
License
Agreement between F. Hoffmann-La Roche Ltd. and the Company dated
January 29, 2003.
|
|
10.11(11)*
|
Affymetrix
Instrument and Chip Supply Agreement between F. Hoffmann-La
Roche Ltd. and the Company dated January 29,
2003.
|
|
10.12(11)*
|
Research &
Development Collaboration Agreement between F. Hoffmann-La Roche Ltd.
and the Company dated January 29, 2003.
|
|
10.13(11)*
|
Diagnostic
Product and Instrument Agency Agreement between F. Hoffmann-La
Roche Ltd. and the Company dated January 29,
2003.
|
|
10.14(11)*
|
Affymetrix
Instrument Agency Agreement between F. Hoffmann-La Roche Ltd. and the
Company dated January 29, 2003.
|
|
10.15(12)
|
Lease
between Sobrato Interests and the Company dated July 3, 2002 (3420
Central Expressway, Santa Clara, CA).
|
|
10.16(12)
|
First
Amendment to Lease between Sobrato Interests and the Company dated
September 30, 2003 (3420 Central Expressway, Santa Clara,
CA).
|
|
10.17(13)‡
|
Affymetrix, Inc.
Amended and Restated 2000 Equity Incentive Plan, as adopted effective
March 9, 2000 and amended through June 23,
2008.
|
|
10.18(14)‡
|
Form
of Non-Qualified Stock Option Agreement under the Affymetrix, Inc.
Amended and Restated 1996 Non-Employee Directors Stock
Plan.
|
|
10.19(1)‡
|
Form
of Stock Option Agreement under the Affymetrix, Inc. Amended and
Restated 2000 Equity Incentive Plan.
|
|
10.20(A)(15)‡
|
Nonqualified
Supplemental Deferred Compensation Plan of the Company
|
|
10.20(B)(15)‡
|
Nonqualified
Supplemental Deferred Compensation Plan Adoption
Agreement.
|
|
10.21(16)
|
Fifth
Amendment to Lease between Sobrato Interests and the Company dated
July 3, 2002 (3380 Central Expressway, Santa Clara,
CA).
|
|
10.22(16)
|
First
Amendment to Lease between Sobrato Interests and the Company dated
July 3, 2002 (3450 Central Expressway, Santa Clara,
CA).
|
|
10.23(17)
|
Lease
between Keppel Logistics Pte Ltd. and Affymetrix Pte Ltd. dated
as of January 1, 2006 (7 Gul Circle, Singapore
629363).
|
|
10.24(1)‡
|
Form
of Restricted Stock Agreement under the Affymetrix, Inc. Amended and
Restated 2000 Equity Incentive Plan.
|
|
10.25(18)‡
|
Offer
Letter from the Company to Kevin M. King dated December 18,
2006.
|
|
10.26(19)**
|
Amendment
Agreement dated December 22, 2006 by and among F. Hoffmann-La
Roche Ltd., Roche Molecular Systems, Inc. and the
Company
|
|
10.27(20)‡
|
Offer
Letter from the Company to John C. Batty dated May 16,
2007.
|
|
10.28(1)
|
Settlement
and Release Agreement dated January 9, 2008 between the Company and
Illumina, Inc.
|
|
10.29(22)
|
Affymetrix, Inc.
Change of Control Plan, as amended through November 5,
2008.
|
|
10.30(2)‡
|
Offer
Letter from the Company to John F. (Rick) Runkel dated October 6,
2008.
|
|
10.31(1)
|
Offer
Letter from the Company to Frank Witney dated November 7,
2008.
|
|
10.32(23)
|
First
Amendment to Affymetrix, Inc. 1998 Stock Incentive
Plan.
|
|
10.33(24)
|
Stipulation
of Settlement regarding the Affymetrix Derivative Litigation in the United
States District Court, Northern District of California.
|
|
10.34
|
Offer
Letter from the Company to Andrew J. Last, Ph.D. dated November 2,
2009.
|
|
10.35
|
Lease
Agreement between SBP Limited Partnership and the Company dated August 10,
2008 (26309 Miles Road, Warrensville Heights, OH).
|
|
10.36
|
First
Amendment and Lease Expansion Agreement between SBP Limited Partnership
and the Company dated May 20, 2009 (26309 Miles Road, Warrensville
Heights, OH).
|
|
10.37
|
Lease
Agreement between OTR, acting as the duly authorized nominee of The State
Teacher Retirement System of Ohio and Anatrace, Inc. dated February 14,
2001 (434 Dussel Drive, Maumee, OH).
|
|
10.38
|
Assignment
and Assumption of Lease between Anatrace, Inc. and USB Acquisition dated
April 30, 2005 (434 Dussel Drive, Maumee, OH).
|
|
21
|
List
of Subsidiaries.
|
|
23
|
Consent
of Independent Registered Public Accounting Firm.
|
|
31.1
|
Certification
of Chief Executive Officer Pursuant to Section 302 of Sarbanes-Oxley
Act of 2002.
|
|
31.2
|
Certification
of Chief Financial Officer Pursuant to Section 302 of Sarbanes-Oxley
Act of 2002.
|
|
32
|
Certification
of Chief Executive Officer and Chief Financial Officer Pursuant to 18
U.S.C. Section 1350, as adopted Pursuant to Section 906 of
Sarbanes-Oxley Act of
2002.
|
|
(1)
|
Incorporated
by reference to Registrant’s Form 10-K as filed on March 2, 2009 (File No.
000-28218).
|
|
(2)
|
Incorporated
by reference to Registrant’s Form 8-K as filed on June 13, 2000
(File No. 000-28218).
|
|
(3)
|
Incorporated
by reference to Registrant’s Form 10-Q as filed on August 7, 2009
(File No. 000-28218).
|
|
(4)
|
Incorporated
by reference to Registrant’s Form S-3 as filed on January 29,
2004 (File No. 333-112311).
|
|
(5)
|
Incorporated
by reference to Registrant’s Form 8-K as filed on November 19,
2007 (File No. 000-28218).
|
|
(6)
|
Incorporated
by reference to Registrant’s Registration Statement on Form S-1 (File
No. 333-3648), as amended.
|
|
(7)
|
Incorporated
by reference to Registrant’s Quarterly Report on Form 10-Q as filed
on August 14, 1996 (File
No. 000-28218).
|
|
(8)
|
Incorporated
by reference to Registrant’s Report on Form 10-K as filed on
March 31, 1999 (File
No. 000-28218).
|
|
(9)
|
Incorporated
by reference to Registrant’s Registration Statement on Form S-3 as
filed on July 12, 1999 (File No. 333-82685), as
amended.
|
|
(10)
|
Incorporated
by reference to Registrant’s Form 10-Q as filed on May 15, 2001
(File No. 000-28218).
|
|
(11)
|
Incorporated
by reference to Registrant’s Form 10-Q as filed on May 15, 2003
(File No. 000-28218).
|
|
(12)
|
Incorporated
by reference to Registrant’s Form 10-K as filed on March 15,
2004 (File No. 000-28218).
|
|
(13)
|
Incorporated
by reference to Registrant’s Form 10-Q as filed on August 8,
2008 (File No. 000-28218).
|
|
(14)
|
Incorporated
by reference to Registrant’s Form 10-Q as filed on November 9,
2004 (File No. 000-28218).
|
|
(15)
|
Incorporated
by reference to Registrant’s Form 8-K as filed on November 7,
2008 (File No. 000-28218).
|
|
(16)
|
Incorporated
by reference to Registrant’s Form 10-K as filed on March 16,
2005 (File No. 000-28218).
|
|
(17)
|
Incorporated
by reference to Registrant’s Form 10-K as filed on March 9, 2006
(File No. 000-28218).
|
|
(18)
|
Incorporated
by reference to Registrant’s Form 8-K as filed on December 19,
2006 (File No. 000-28218).
|
|
(19)
|
Incorporated
by reference to Registrant’s Form 8-K as filed on December 22,
2006 (File No. 000-28218).
|
|
(20)
|
Incorporated
by reference to Registrant’s Form 8-K as filed on June 6, 2007
(File No. 000-28218).
|
|
(21)
|
Incorporated
by reference to Registrant’s Form 10-K as filed on February 29,
2008 (File No. 000-28218).
|
|
(22)
|
Incorporated
by reference to Registrant’s Form 10-Q as filed on November 7,
2008 (File No. 000-28218).
|
|
(23)
|
Incorporated
by reference to Registrant’s Form S-8 as filed on April 18, 2001 (File No.
333-59158).
|
| (24) | Incorporated by reference to Registrant’s Form 8-K as filed on May 20, 2009 (File No. 000-28218). |
|
‡
|
Management
contract, compensatory plan, contract or
arrangement
|
|
*
|
Confidential
treatment granted
|
| ** | Confidential treatment requested |
AFFYMETRIX, INC.
Schedule II—Valuation
and Qualifying Accounts
(in
thousands)
|
Additions
|
||||||||||||||||
|
Balance
at
|
Charged
to
|
|||||||||||||||
|
Beginning
of
|
Operations
or
|
Write-offs,
net
|
Balance
at
|
|||||||||||||
|
Period
|
Other
Accounts (1)
|
of
recoveries
|
End
of Period
|
|||||||||||||
|
Allowance
for Doubtful Accounts:
|
||||||||||||||||
|
Year
Ended December 31, 2009
|
$ | 2,213 | $ | (87 | ) | $ | (273 | ) | $ | 1,853 | ||||||
|
Year
Ended December 31, 2008
|
$ | 2,372 | $ | 683 | $ | (842 | ) | $ | 2,213 | |||||||
|
Year
Ended December 31, 2007
|
$ | 1,534 | $ | 934 | $ | (96 | ) | $ | 2,372 | |||||||
|
(1)
|
2008
includes $0.1 million for USB Opening Balance
Sheet
|
Pursuant
to the requirements of Section 13 of 15(d) of the Securities Exchange Act
of 1934, the registrant has caused this report to be signed on its behalf by the
undersigned, thereunto duly authorized.
|
Affymetrix, Inc.
(Registrant)
|
||
|
March
1, 2010
|
By:
|
/s/
Kevin M.
King
|
|
Kevin
M. King.
DIRECTOR,
PRESIDENT AND
CHIEF
EXECUTIVE OFFICER
|
||
Pursuant
to the requirements of the Securities Exchange Act of 1934, this report has been
signed below by the following persons on behalf of the registrant and in the
capacities and on the dates indicated.
Each
individual whose signature appears below constitutes and appoints John F.
Runkel, Jr. and John C. Batty, and each of them singly, his or her true and
lawful attorneys-in-fact, each with the power of substitution, for him or her in
any and all capacities, to sign any amendments to this Annual Report on
Form 10-K, and to file the same, with exhibits thereto and other documents
in connection therewith, with the U.S. Securities and Exchange Commission,
hereby ratifies and confirms all that said attorneys-in-fact, or his or her
substitute or substitutes, may do or cause to be done by virtue
thereof.
|
Name
|
Title
|
Date
|
|||||||
|
By:
|
/s/
Kevin M.
King
|
Director,
President and Chief Executive Officer
|
March
1, 2010
|
||||||
|
Kevin
M. King
|
(Principal
Executive Officer)
|
||||||||
|
By:
|
/s/
John C.
Batty
|
Executive
Vice President and Chief Financial Officer
|
March
1, 2010
|
||||||
|
John
C. Batty
|
(Principal
Financial and Accounting Officer)
|
||||||||
|
By:
|
/s/
Stephen P.A.
Fodor, Ph.D.
|
Founder
and Executive
Chairman
of the Board
|
March
1, 2010
|
||||||
|
Stephen
P.A. Fodor, Ph.D.
|
|||||||||
|
By:
|
/s/
Paul Berg,
Ph.D.
|
Director
|
March
1, 2010
|
||||||
|
Paul
Berg, Ph.D.
|
|||||||||
|
By:
|
/s/
John D. Diekman,
Ph.D.
|
Director
|
March
1, 2010
|
||||||
|
John
D. Diekman, Ph.D.
|
|||||||||
|
By:
|
/s/
Gary S. Guthart,
Ph.D.
|
Director
|
March
1, 2010
|
||||||
|
Gary
S. Guthart, Ph.D.
|
|||||||||
|
By:
|
/s/
Robert H. Trice,
Ph.D.
|
Director
|
March
1, 2010
|
||||||
|
Robert
H. Trice, Ph.D.
|
|||||||||
|
By:
|
/s/
Robert P.
Wayman
|
Director
|
March
1, 2010
|
||||||
|
Robert
P. Wayman
|
|||||||||
|
By:
|
/s/
John A.
Young
|
Director
|
March
1, 2010
|
||||||
|
John
A. Young
|
|||||||||
INDEX
TO EXHIBITS
|
EXHIBIT
NUMBER
|
DESCRIPTION
OF DOCUMENT
|
|
2.1(1)
|
Agreement
and Plan of Merger by and among Panomics, Inc., the Company, Panda
Acquisition Corporation and the Equityholders’ Representative dated as of
November 11, 2008.
|
|
3.1(2)
|
Restated
Certificate of Incorporation.
|
|
3.2(3)
|
Amended
and Restated Bylaws.
|
|
4.1(4)
|
Indenture
dated as of December 15, 2003, between the Company and The Bank of
New York, as Trustee.
|
|
4.2(5)
|
Indenture
dated as of November 16, 2007, between the Company and the Bank of
New York Trust Company, N.A. as Trustee.
|
|
10.1(6)‡
|
1993
Stock Plan, as amended.
|
|
10.2(6)‡
|
1996
Nonemployee Directors Stock Option Plan.
|
|
10.3(7)
|
Lease
between Sobrato Interests and the Company dated June 12, 1996 (3380
Central Expressway, Santa Clara, CA).
|
|
10.4(7)
|
Lease
between Sobrato Interests and the Company dated May 31, 1996 (3450
Central Expressway, Santa Clara, CA).
|
|
10.5(8)‡
|
1998
Stock Incentive Plan.
|
|
10.6(8)‡
|
Form
of Officer and Director Indemnification Agreement.
|
|
10.7(9)‡
|
Amendment
No. 1 to the 1996 Nonemployee Directors Stock Option Plan of the
Company
|
|
10.8(10)‡
|
Amended
and Restated 1996 Non-Employee Directors Stock Plan.
|
|
10.9(11)*
|
Common
Terms Agreement between F. Hoffmann-La Roche Ltd. and the Company
dated January 29, 2003.
|
|
10.10(11)*
|
License
Agreement between F. Hoffmann-La Roche Ltd. and the Company dated
January 29, 2003.
|
|
10.11(11)*
|
Affymetrix
Instrument and Chip Supply Agreement between F. Hoffmann-La
Roche Ltd. and the Company dated January 29,
2003.
|
|
10.12(11)*
|
Research &
Development Collaboration Agreement between F. Hoffmann-La Roche Ltd.
and the Company dated January 29, 2003.
|
|
10.13(11)*
|
Diagnostic
Product and Instrument Agency Agreement between F. Hoffmann-La
Roche Ltd. and the Company dated January 29,
2003.
|
|
10.14(11)*
|
Affymetrix
Instrument Agency Agreement between F. Hoffmann-La Roche Ltd. and the
Company dated January 29, 2003.
|
|
10.15(12)
|
Lease
between Sobrato Interests and the Company dated July 3, 2002 (3420
Central Expressway, Santa Clara, CA).
|
|
10.16(12)
|
First
Amendment to Lease between Sobrato Interests and the Company dated
September 30, 2003 (3420 Central Expressway, Santa Clara,
CA).
|
|
10.17(13)‡
|
Affymetrix, Inc.
Amended and Restated 2000 Equity Incentive Plan, as adopted effective
March 9, 2000 and amended through June 23,
2008.
|
|
10.18(14)‡
|
Form
of Non-Qualified Stock Option Agreement under the Affymetrix, Inc.
Amended and Restated 1996 Non-Employee Directors Stock
Plan.
|
|
10.19(1)‡
|
Form
of Stock Option Agreement under the Affymetrix, Inc. Amended and
Restated 2000 Equity Incentive Plan.
|
|
10.20(A)(15)‡
|
Nonqualified
Supplemental Deferred Compensation Plan of the Company
|
|
10.20(B)(15)‡
|
Nonqualified
Supplemental Deferred Compensation Plan Adoption
Agreement.
|
|
10.21(16)
|
Fifth
Amendment to Lease between Sobrato Interests and the Company dated
July 3, 2002 (3380 Central Expressway, Santa Clara,
CA).
|
|
10.22(16)
|
First
Amendment to Lease between Sobrato Interests and the Company dated
July 3, 2002 (3450 Central Expressway, Santa Clara,
CA).
|
|
10.23(17)
|
Lease
between Keppel Logistics Pte Ltd. and Affymetrix Pte Ltd. dated
as of January 1, 2006 (7 Gul Circle, Singapore
629363).
|
|
10.24(1)‡
|
Form
of Restricted Stock Agreement under the Affymetrix, Inc. Amended and
Restated 2000 Equity Incentive Plan.
|
|
10.25(18)‡
|
Offer
Letter from the Company to Kevin M. King dated December 18,
2006.
|
|
10.26(19)**
|
Amendment
Agreement dated December 22, 2006 by and among F. Hoffmann-La
Roche Ltd., Roche Molecular Systems, Inc. and the
Company
|
|
10.27(20)‡
|
Offer
Letter from the Company to John C. Batty dated May 16,
2007.
|
|
10.28(21)
|
Settlement
and Release Agreement dated January 9, 2008 between the Company and
Illumina, Inc.
|
|
10.29(22)
|
Affymetrix, Inc.
Change of Control Plan, as amended through November 5,
2008.
|
|
10.30(22)‡
|
Offer
Letter from the Company to John F. (Rick) Runkel dated October 6,
2008.
|
|
10.31(1)
|
Offer
Letter from the Company to Frank Witney dated November 7,
2008.
|
|
10.32(23)
|
First
Amendment to Affymetrix, Inc. 1998 Stock Incentive
Plan.
|
|
10.33(24)
|
Stipulation
of Settlement regarding the Affymetrix Derivative Litigation in the United
States District Court, Northern District of California.
|
|
10.34
|
Offer
Letter from the Company to Andrew J. Last, Ph.D. dated November 2,
2009.
|
|
10.35
|
Lease
Agreement between SBP Limited Partnership and the Company dated August 10,
2008 (26309 Miles Road, Warrensville Heights, OH).
|
|
10.36
|
First
Amendment and Lease Expansion Agreement between SBP Limited Partnership
and the Company dated May 20, 2009 (26309 Miles Road, Warrensville
Heights, OH).
|
|
10.37
|
Lease
Agreement between OTR, acting as the duly authorized nominee of The State
Teacher Retirement System of Ohio and Anatrace, Inc. dated February 14,
2001 (434 Dussel Drive, Maumee, OH).
|
|
10.38
|
Assignment
and Assumption of Lease between Anatrace, Inc. and USB Acquisition dated
April 30, 2005 (434 Dussel Drive, Maumee, OH).
|
|
21
|
List
of Subsidiaries.
|
|
23
|
Consent
of Independent Registered Public Accounting Firm.
|
|
31.1
|
Certification
of Chief Executive Officer Pursuant to Section 302 of Sarbanes-Oxley
Act of 2002.
|
|
31.2
|
Certification
of Chief Financial Officer Pursuant to Section 302 of Sarbanes-Oxley
Act of 2002.
|
|
32
|
Certification
of Chief Executive Officer and Chief Financial Officer Pursuant to 18
U.S.C. Section 1350, as adopted Pursuant to Section 906 of
Sarbanes-Oxley Act of 2002.
|
|
(1)
|
Incorporated
by reference to Registrant’s Form 10-K as filed on March 2, 2009 (File No.
000-28218).
|
|
(2)
|
Incorporated
by reference to Registrant’s Form 8-K as filed on June 13, 2000
(File No. 000-28218).
|
|
(3)
|
Incorporated
by reference to Registrant’s Form 10-Q as filed on August 7, 2009
(File No. 000-28218).
|
|
(4)
|
Incorporated
by reference to Registrant’s Form S-3 as filed on January 29,
2004 (File No. 333-112311).
|
|
(5)
|
Incorporated
by reference to Registrant’s Form 8-K as filed on November 19,
2007 (File No. 000-28218).
|
|
(6)
|
Incorporated
by reference to Registrant’s Registration Statement on Form S-1 (File
No. 333-3648), as amended.
|
|
(7)
|
Incorporated
by reference to Registrant’s Quarterly Report on Form 10-Q as filed
on August 14, 1996 (File
No. 000-28218).
|
|
(8)
|
Incorporated
by reference to Registrant’s Report on Form 10-K as filed on
March 31, 1999 (File
No. 000-28218).
|
|
(9)
|
Incorporated
by reference to Registrant’s Registration Statement on Form S-3 as
filed on July 12, 1999 (File No. 333-82685), as
amended.
|
|
(10)
|
Incorporated
by reference to Registrant’s Form 10-Q as filed on May 15, 2001
(File No. 000-28218).
|
|
(11)
|
Incorporated
by reference to Registrant’s Form 10-Q as filed on May 15, 2003
(File No. 000-28218).
|
|
(12)
|
Incorporated
by reference to Registrant’s Form 10-K as filed on March 15,
2004 (File No. 000-28218).
|
|
(13)
|
Incorporated
by reference to Registrant’s Form 10-Q as filed on August 8,
2008 (File No. 000-28218).
|
|
(14)
|
Incorporated
by reference to Registrant’s Form 10-Q as filed on November 9,
2004 (File No. 000-28218).
|
|
(15)
|
Incorporated
by reference to Registrant’s Form 8-K as filed on November 7,
2008 (File No. 000-28218).
|
|
(16)
|
Incorporated
by reference to Registrant’s Form 10-K as filed on March 16,
2005 (File No. 000-28218).
|
|
(17)
|
Incorporated
by reference to Registrant’s Form 10-K as filed on March 9, 2006
(File No. 000-28218).
|
|
(18)
|
Incorporated
by reference to Registrant’s Form 8-K as filed on December 19,
2006 (File No. 000-28218).
|
|
(19)
|
Incorporated
by reference to Registrant’s Form 8-K as filed on December 22,
2006 (File No. 000-28218).
|
|
(20)
|
Incorporated
by reference to Registrant’s Form 8-K as filed on June 6, 2007
(File No. 000-28218).
|
|
(21)
|
Incorporated
by reference to Registrant’s Form 10-K as filed on February 29,
2008 (File No. 000-28218).
|
|
(22)
|
Incorporated
by reference to Registrant’s Form 10-Q as filed on November 7,
2008 (File No. 000-28218).
|
|
(23)
|
Incorporated
by reference to Registrant’s Form S-8 as filed on April 18, 2001 (File No.
333-59158).
|
| (24) | Incorporated by reference to Registrant’s Form 8-K as filed on May 20, 2009 (File No. 000-28218). |
|
‡
|
Management
contract, compensatory plan, contract or
arrangement
|
|
*
|
Confidential
treatment granted
|
| ** | Confidential treatment requested |
90