Attached files
| file | filename |
|---|---|
| 8-K - 8-K - TERREMARK WORLDWIDE INC. | g22295e8vk.htm |
Exhibit 99.1


| The following statement is made pursuant to the Safe Harbor for forward-looking statements described in the Private Securities Litigation Reform Act of 1995. In these communications, we may make certain statements that are forward-looking, such as statements regarding Terremark's future results and plans, and anticipated trends in the industry and economies in which Terremark operates. These forward-looking statements are the Company's expectations on the day of the initial broadcast of the 3rd quarter conference Fiscal 2010 call, and the Company will make no efforts to update these expectations based on subsequent events or knowledge. These forward-looking statements are based on Terremark's current expectations and are subject to a number of risks, uncertainties, and assumptions, including that our revenue may differ from that projected; that we may be further impacted by slowdowns, postponements, or cancellations in our clients' businesses, or deterioration in our clients financial condition; that our targeted service markets may not expand as we expect; that we may experience delays in the awarding of customer contracts; that our reserves and allowances may be inadequate, or the carrying value of our assets may be impaired; that we may experience increased costs associated with realigning our business, or may be unsuccessful in those efforts and any of the other risks in our Annual Report on Form 10K. Should one or more of these risks or uncertainties materialize, or should the underlying assumptions prove incorrect, actual results may differ significantly from the results expressed or implied in any forward-looking statements made by the Company in these communications. These and other risks, uncertainties, and assumptions are detailed in documents filed by the Company with the Securities and Exchange Commission. Terremark does not undertake any obligation to revise these forward-looking statements to reflect future events or circumstances. Safe Harbor Clause |

| Welcome MANUEL D. MEDINA - CHAIRMAN AND CHIEF EXECUTIVE OFFICER |

| Today's Speakers Manuel Medina Chairman & CEO Jose Segrera Chief Financial Officer Christopher Day SVP Secure Information Services Randy Rowland SVP Product Development Barry Field SVP US Commercial Sales Bruce Hart COO Terremark Federal Melissa Hathaway Member Board of Directors Chad Swartz Preferred Hotels Sr. Manager, IT Operations |

| Additional Leadership Here Today Marvin Wheeler Chief Strategy Officer Tom Mays SVP Advanced Data Services Simon West Chief Marketing Officer Norm Laudermilch SVP Infrastructure Management Gil Griffin SVP Federal Service Delivery Chris Drumgoole SVP Client Services Nelson Fonseca Chief Operating Officer Adam Smith Chief Legal Officer |

| Members Of The Board Here Today Melissa Hathaway Member Board of Directors Joseph R. Wright Vice-Chairman Board of Directors Guillermo Amore Member Board of Directors Miguel J. Rosenfeld Member Board of Directors Antonio S. Fernandez Member Board of Directors |
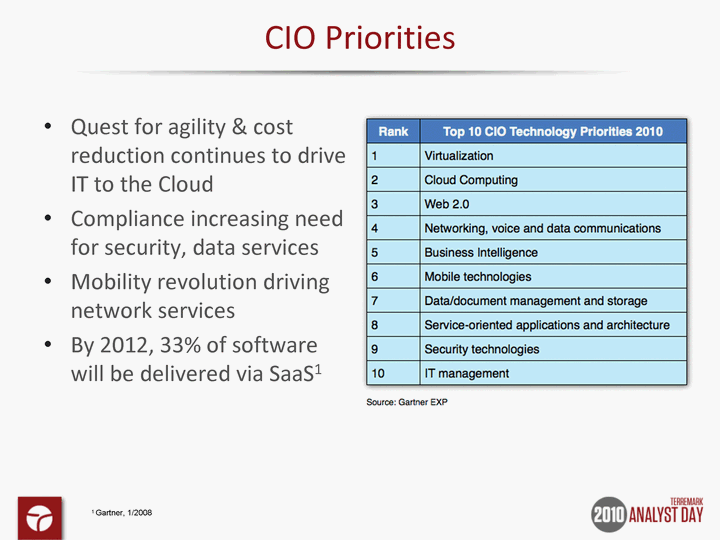
| CIO Priorities Quest for agility & cost reduction continues to drive IT to the Cloud Compliance increasing need for security, data services Mobility revolution driving network services By 2012, 33% of software will be delivered via SaaS1 1 Gartner, 1/2008 |

| Unique Business Model |

| Strategic Expansion Cloud Expansion Colombia Brazil Europe Facility Expansion Dallas Santa Clara Culpeper Brazil Colombia Turkey |
| The Enterprise Cloud RANDY ROWLAND - SVP PRODUCT DEVELOPMENT |

| Definitions Public Cloud Cloud infrastructure made available to the general public Dedicated Private Cloud Cloud infrastructure operated solely for an organization Hybrid Cloud Two or more clouds that interoperate through technology Virtual Private Cloud Simulates private cloud experience in public infrastructure |

| Built For The Enterprise Commodity Public Cloud Single shared network Public network only Single security context Shared computing pool Random location Non auditable Limited/non-existent SLA Terremark Enterprise Cloud vLAN segmentation Private network integration Configurable, H/W firewalls Private computing pool Choice of facility Compliance ready Meaningful SLA Virtual Private or Hybrid Cloud capable |

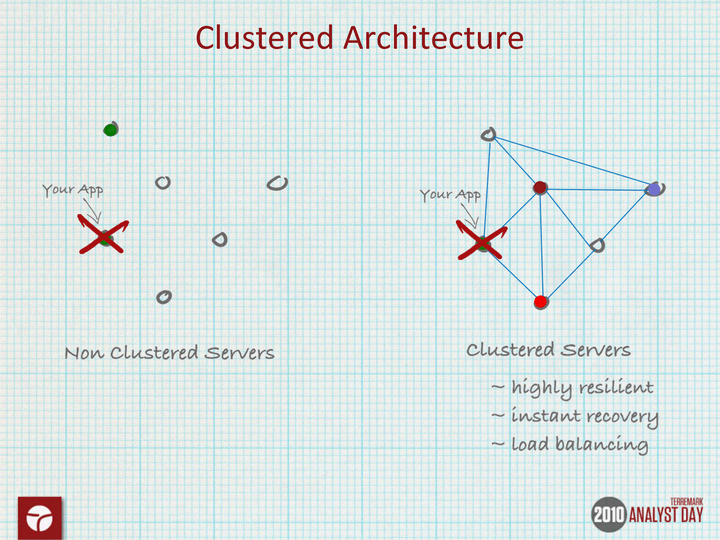
| Enterprise-Class Infrastructure Top-tier datacenters Connectivity to 160 networks Enterprise-class servers High-performance storage Fully clustered architecture Compliance ready |
| Clustered Architecture |

| Built For Interoperability VMware Virtualized vCloud API Broad OS & application support Portable virtual servers Private network integration Physical device integration Hybrid solutions |

| Integrated Security Features Hardware firewalls vLAN segmentation VPN management access Multi-factor authentication Full suite of security services Compliance services |

| Cloud + Services Datacenter migration services Colocation for legacy device connectivity Dedicated circuits connecting to the Cloud Managed Hosting services Data Backup services Disaster recovery services |
| Secure Information Systems CHRIS DAY - CHIEF SECURITY ARCHITECT |


| Effective Information Security Services address key disciplines Administration & Compliance Threat Awareness, Assessment & Mitigation Intrusion Suppression Philosophy Assumes attack Minimize impact Eliminate attack vector More realist Investment in intellectual property |

| Service Portfolio Managed Services Managed firewalls Intrusion Detection/Prevention Log Correlation Network Monitoring/Analysis Network Forensics Data Leak Detection/Prevention "SOC-In-A-Box" Engagement Services Incident Response Digital Forensics Vulnerability Assessments Penetration Testing Compliance Support Threat Intelligence Malware Analysis Threat Actor Monitoring Multi-Carrier Threat Tending Honeynets |

| Securing the Cloud Cloudbursting allows guest virtual machine to execute attacks on underlying shared virtualization infrastructure Only observable in memory |

| Memory Analytics and System Integrity Validation Provides monitoring of runtime state & system integrity Visibility into raw system memory from which an accurate system run- time state can be constructed Allows detection of stealthy malware on running machine Combined with digital forensics analysis and incident response as well as a recurring service Unprecedented ability to detect and defend against sophisticated emerging attacks |

| Enterprise Cloud Demo |

| Q&A Session |

| Cybersecurity, A National Imperative MELISSA HATHAWAY - MEMBER, BOARD OF DIRECTORS |

| Federal Overview BRUCE HART - COO, TERREMARK FEDERAL |

| Origins: Classified & Defense Initial contracts with SouthCom 9/11 impacts federal IT strategy Established relationships with DoD Formed Federal Group subsidiary Focus on colo, network services Cleared facilities Cleared staff SCIF-colocation on GSA Schedule |

| Expansion into Civil Sector Leverage expanded Terremark portfolio Information Security Managed Hosting Early to market with Enterprise Cloud Open Government Initiative Breakthrough Cloud deal with GSA USA.gov - First .gov Cloud application |

| The Power Of Integration NCR opening provides world-class foundation Fortress + Cloud + Security = unique offering Government Cyber Security Initiative Penetrating national security agencies Integrated Cloud & Security offerings On-premise cloud storage Security services to DHS |

| Non-classified 45% '09 Q3 (YTD) Classified 55% Terremark Federal Today '07 Q3 (YTD) 27% 73% * CSC NCR Anchor Tenant Booking Recurring Bookings Revenue By Sector $ IN MILLIONS |

| The Road Ahead Key Initiatives Cyber Security Open Government Key Strategies Direct Sales White Label & Resellers SaaS/PaaS Partners Vertically Integrated Solutions Strategic Partners |

| Sales Strategy BARRY FIELD - SVP COMMERCIAL SALES |

| Target: Fortune 1,000 Looking for hybrid solutions - service portfolio ideally suited Proven record of successful engagement Tested targeted messaging/relevance with Cloud Strike Force "By 2011, 80 percent of Fortune 1000 companies will pay for some cloud computing services." - Gartner |

| Targeted Expansion |

| Channel & Strategic Alliances Launch of formal tiered program Branding package Assigned resources Discount tiers Co-marketing activity Partner Portal Messaging, collateral & sales tools Lead management On-Boarding Process Certification & testing Technology embedded in our solutions Strategic alignment with product teams & CSO office Our services integrated into their solutions Go-to-market framework established Cloud white label National & regional resellers |

| Strategic Account Management Up-sell & cross-sell programs Customer Advisory Board Account mapping Executive sponsorship Quarterly reviews Pro-active renewal process Cross-functional alignment Subject matter expert mapping Customer events |

| Case Study Long-time managed hosting customer Terremark provides services in US, Europe Leveraging the stack Managed services Top-tier facilities Massive connectivity Perfect example of strategic alignment Selected as LEGO Universe hosting provider |
| Q&A Session |

| Financial Overview JOSE SEGRERA - CHIEF FINANCIAL OFFICER |
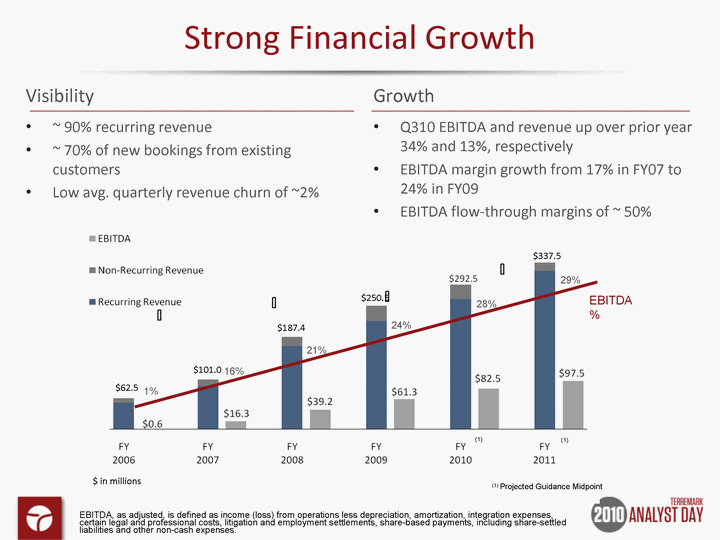
| Strong Financial Growth Visibility ~ 90% recurring revenue ~ 70% of new bookings from existing customers Low avg. quarterly revenue churn of ~2% Growth Q310 EBITDA and revenue up over prior year 34% and 13%, respectively EBITDA margin growth from 17% in FY07 to 24% in FY09 EBITDA flow-through margins of ~ 50% (1) Projected Guidance Midpoint $ in millions EBITDA, as adjusted, is defined as income (loss) from operations less depreciation, amortization, integration expenses, certain legal and professional costs, litigation and employment settlements, share-based payments, including share-settled liabilities and other non-cash expenses. (1) (1) 1% 16% 21% 24% 28% 29% EBITDA % $62.5 $101.0 $187.4 $250.5 $337.5 |

| Average Quarterly Bookings FY10 FY11 TOTAL GROWTH RECURRING GROWTH REVENUE $292.5 $337.5 15% ~22% EBITDA $82.5 $97.5 18% ~40% Strong FY'11 Visibility Strong Backlog NAP West and NCR presales Continued bookings momentum Consistent EBITDA Flow-Through ($ in millions) |

| 43 EBITDA Visibility ($ in millions) Strong EBITDA Base Contract Backlog Strong Visibility + = Note: $22.6 million of backlog is based on currently signed contracts yet to be deployed and their expected annual EBITDA contribution |
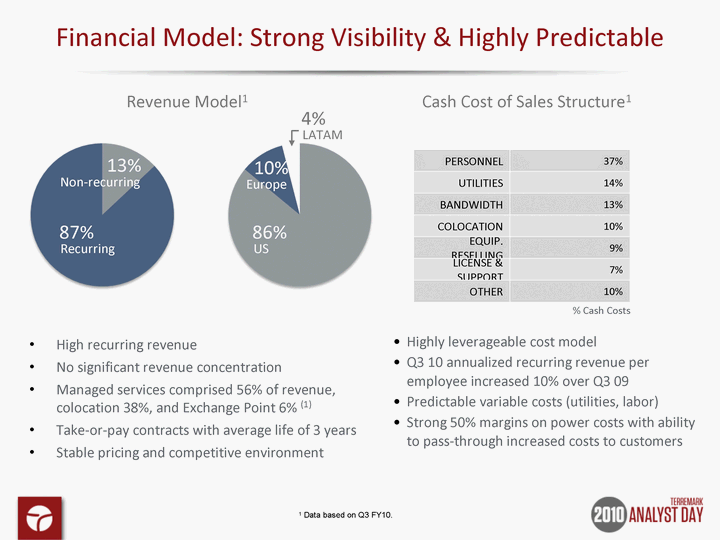
| 44 44 44 Financial Model: Strong Visibility & Highly Predictable Revenue Model1 Cash Cost of Sales Structure1 Highly leverageable cost model Q3 10 annualized recurring revenue per employee increased 10% over Q3 09 Predictable variable costs (utilities, labor) Strong 50% margins on power costs with ability to pass-through increased costs to customers 1 Data based on Q3 FY10. High recurring revenue No significant revenue concentration Managed services comprised 56% of revenue, colocation 38%, and Exchange Point 6% (1) Take-or-pay contracts with average life of 3 years Stable pricing and competitive environment PERSONNEL 37% UTILITIES 14% BANDWIDTH 13% COLOCATION 10% EQUIP. RESELLING 9% LICENSE & SUPPORT 7% OTHER 10% % Cash Costs 13% 87% Recurring Non-recurring 86% US 10% Europe 4% LATAM |

| 45 45 Capital Expenditure Dynamics "Smart builds" - build for demand, not for supply Customer demand driving expansion Strict payback hurdles Minimum ongoing capex $ in millions 2010 Capital Expenditures by Type ~ 95% Growth ~ 5% Maintenance Total CapEx 208,000 ~260,000 ~270,000 EOY Built-Out sq. ft. $90.0 $67.5 |
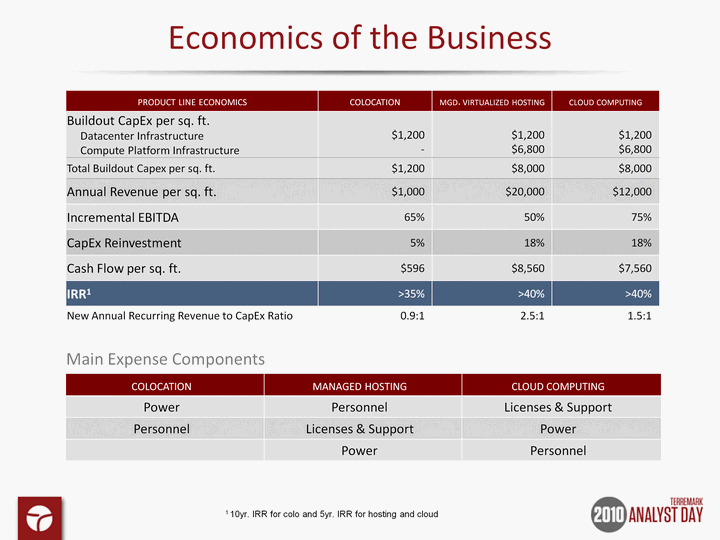
| Economics of the Business 1 10yr. IRR for colo and 5yr. IRR for hosting and cloud PRODUCT LINE ECONOMICS COLOCATION MGD. VIRTUALIZED HOSTING CLOUD COMPUTING Buildout CapEx per sq. ft. Datacenter Infrastructure Compute Platform Infrastructure $1,200 - $1,200 $6,800 $1,200 $6,800 Total Buildout Capex $1,200 $8,000 $8,000 Annual Revenue per sq. ft. $1,000 $20,000 $12,000 Incremental EBITDA 65% 50% 75% CapEx Reinvestment 5% 18% 18% Cash Flow per sq. ft. $596 $7,560 $8,160 IRR1 >35% >40% >40% New Annual Recurring Revenue to CapEx Ratio 0.9:1 2.5:1 1.5:1 Main Expense Components COLOCATION MANAGED HOSTING CLOUD COMPUTING Power Personnel Licenses & Support Personnel Licenses & Support Power Power Personnel |

| Growth Potential - Business Plan as Funded Today Annualized Q3 10 5 Year Potential > > REVENUE EBITDA REVENUE EBITDA 134,000 UTILIZED SQ. FT 300,000 REVENUE CAGR ~20% EBITDA CAGR ~35% EBITDA FLOW-THROUGH ~50% AVG. ANNUAL CAPEX (1.1:1 RATIO) $70M-$80M RETURN ON ASSETS (EBITDA/PPE) >30% 44% REVENUE MIX: COLO + EXCHANGE POINT 40%-45% 56% REVENUE MIX: MANAGED SERVICES 55%-60% (recurring) (recurring) |

| Capital Strategy Fully-funded expansion plan EBITDA growth quickly delevers balance sheet Targeted long-term net leverage of 3x - 4x Additional future growth can be self-funded Baskets under bonds provide future flexibility 1 3 1 Placement of $250 million of bank notes 2 Placement of $420 of senior notes used 3 Leverage ratios based on LQA EBITDA divided by total debt, less $50M minimum cash Business Quickly Delevers Capitalization (12/31/09) CASH & CASH EQUIVALENTS $59.6 INDEBTEDNESS: 12% SENIOR SECURED NOTES DUE 20171 $420.0 6.625% SENIOR CONVERTIBLE NOTES DUE 20131 $57.2 OTHER3 $4.2 TOTAL $481.4 TOTAL STOCKHOLDER EQUITY $79.7 TOTAL CAPITALIZATION $561.1 2 3 |

| Q&A Session |

| Concluding Remarks |
