Attached files
| file | filename |
|---|---|
| EX-21 - EXHIBIT 21 - SYMYX TECHNOLOGIES INC | ex21.htm |
| EX-2.3 - EXHIBIT 2.3 - SYMYX TECHNOLOGIES INC | ex2_3.htm |
| EX-32.1 - EXHIBIT 32.1 - SYMYX TECHNOLOGIES INC | ex32_1.htm |
| EX-23.1 - EXHIBIT 23.1 - SYMYX TECHNOLOGIES INC | ex23_1.htm |
| EX-31.1 - EXHIBIT 31.1 - SYMYX TECHNOLOGIES INC | ex31_1.htm |
| EX-31.2 - EXHIBIT 31.2 - SYMYX TECHNOLOGIES INC | ex31_2.htm |
| EX-10.12 - EXHIBIT 10.12 - SYMYX TECHNOLOGIES INC | ex10_12.htm |
| EX-10.41 - EXHIBIT 10.41 - SYMYX TECHNOLOGIES INC | ex10_41.htm |
UNITED
STATES
SECURITIES
AND EXCHANGE COMMISSION
WASHINGTON,
D.C. 20549
FORM
10-K
|
T
|
ANNUAL
REPORT PURSUANT TO SECTION 13 OR 15(d) OF THE SECURITIES EXCHANGE ACT OF
1934
|
For
the fiscal year ended December 31, 2009
or
|
£
|
TRANSITION
REPORT PURSUANT TO SECTION 13 OR 15(d) OF THE SECURITIES EXCHANGE ACT OF
1934
|
For
the transition period from ___________ to ___________
Commission
file number 000-27765
SYMYX
TECHNOLOGIES, INC.
(Exact
name of registrant as specified in its charter)
|
Delaware
|
77-0397908
|
|||
|
(State
or other jurisdiction of
|
(IRS
Employer
|
|||
|
incorporation
or organization)
|
Identification
No.)
|
|||
|
1263
East Arques Avenue
|
||||
|
Sunnyvale,
California
|
94085
|
|||
|
(Address
of principal executive offices)
|
(Zip
Code)
|
Registrant's
telephone number, including area code: (408)
764-2000
SECURITIES
REGISTERED PURSUANT TO SECTION 12(b) OF THE ACT:
|
Title
of each class:
|
Name
of each exchange on which registered:
|
|
|
Common
Stock, $0.001 Par Value
|
NASDAQ
Global Select Market
|
SECURITIES
REGISTERED PURSUANT TO SECTION 12(g) OF THE ACT:
Common
Stock, $0.001 Par Value
Indicate
by check mark if the registrant is a well-known seasoned issuer, as defined in
Rule 405 of the Securities Act. oYes xNo
Indicate
by check mark if the registrant is not required to file reports pursuant to
Section 13 or Section 15(d) of the Act. oYes xNo
Indicate
by check mark whether the registrant (1) has filed all reports required to be
filed by Section 13 or 15(d) of the Securities Exchange Act of 1934 during the
preceding 12 months (or for such shorter period that the registrant was required
to file such reports), and (2) has been subject to such filing requirements for
the past 90 days. xYes oNo
Indicate
by check mark whether the registrant has submitted electronically and posted on
its corporate Web site, if any, every Interactive Data File required to be
submitted and posted pursuant to Rule 405 of Regulation S-T during the preceding
12 months (or for such shorter period that the registrant was required to submit
and post such files). Yes ¨ No ¨
Indicate
by check mark if disclosure of delinquent filers pursuant to Item 405 of
Regulation S-K is not contained herein, and will not be contained, to the best
of registrant's knowledge, in definitive proxy or information statements
incorporated by reference in Part III of this Form 10-K or any amendment to this
Form 10-K. x
Indicate
by check mark whether the registrant is a large accelerated filer, an
accelerated filer, a non-accelerated filer, or a smaller reporting company. See
the definition of “large accelerated filer,” “accelerated filer” and “smaller
reporting company” in Rule 12b-2 of the Exchange Act. (Check one).
|
Large
accelerated filer o
|
Accelerated
filer x
|
|
|
Non-accelerated
filer o
|
Smaller
Reporting Companyo
|
|
|
(Do not check if a smaller reporting
company)
|
||
Indicate
by check mark whether the registrant is a shell company (as defined in Rule
12b-2 of the Exchange Act). oYes ý No
The
aggregate market value of the registrant’s common stock held by non-affiliates
as of June 30, 2009 (the last business day of the registrant's most recently
completed second fiscal quarter) was $102.5 million, based on the closing price
for the common stock on the NASDAQ Global Select Market on such date. The
determination of affiliate status for the purposes of this calculation is not
necessarily a conclusive determination for other purposes. The calculation
excludes approximately 16,578,000 shares held by directors, officers and
stockholders whose ownership exceeded 5 percent of the registrant’s outstanding
common stock as of June 30, 2009. Exclusion of these shares should not be
construed to indicate that such person controls, is controlled by or is under
common control with the registrant.
As of
February 23, 2010, 34,692,061shares of the registrant’s common stock were
outstanding.
DOCUMENTS
INCORPORATED BY REFERENCE
Certain
sections of the definitive proxy statement to be filed with the Securities and
Exchange Commission not later than 120 days after the end of the fiscal year
covered by this Annual Report on Form 10-K in connection with the registrant’s
2010 Annual Meeting of Stockholders are incorporated by reference into Items 10,
11, 12, 13 and 14 of Part III of this Annual Report on Form 10-K where
indicated. Except with respect to the information specifically incorporated by
reference in this Form 10-K, the registrant’s proxy statement is not deemed to
be filed as part hereof.
TABLE OF CONTENTS
PART
I
ITEM 1. BUSINESS
This
discussion and other parts of this Annual Report on Form 10-K (Report),
including the "Management’s Discussion and Analysis of Financial Condition and
Results of Operations," contain forward-looking statements that involve risks
and uncertainties within the meaning of Section 27A of the Securities Act of
1933, as amended, and Section 21E of the Securities Exchange Act of 1934, as
amended. These statements typically may be identified by the use of
forward-looking words or phrases such as "may," "will," "believe," "expect,"
"plan," "intend," "goal," "anticipate," "should," "planned," "estimated,"
"potential," and "continue," or the negatives thereof or other comparable
terminology regarding beliefs, plans, expectations or intentions regarding the
future. The cautionary statements made in this Report should be read as being
applicable to all related forward-looking statements whenever they appear in
this Report. Forward-looking statements include, without limitation, statements
regarding: our intentions, beliefs and expectations regarding our future
financial performance and operating results; anticipated trends in our business;
the status of our collaborations with industry leaders; the impact of general
economic trends on our business; our belief that our cash and cash equivalents
will be sufficient to satisfy our anticipated cash requirements for at least the
next twelve months; our expectations regarding our customers; our market
penetration and expansion efforts; the potential impact and benefits of our
technology on our customers and their research and development; our expectations
regarding the development, effectiveness and acceptance of our technology; the
expansion of our capabilities and our portfolio of intellectual property; the
effect of our past acquisitions; our belief regarding the adequacy of our supply
arrangements; our belief regarding employee relations; and our expectations
regarding the likelihood of, and the effects of, the divestiture of our High
Productivity Research business as described in this Report.
Among
the factors that could cause actual results to differ materially are the factors
detailed in Item 1A, "Risk Factors." Given these uncertainties, readers are
cautioned not to place undue reliance on the forward-looking
statements.
Any
forward-looking statement speaks only as of the date on which it is made, and
except as required by law, we undertake no obligation to update forward-looking
statements to reflect events or circumstances occurring after the date of this
Report. You should also consult the risk factors listed from time to time in
Symyx’s quarterly reports on Form 10-Q and other Securities and Exchange
Commission (SEC) filings.
General
Symyx
Technologies, Inc. was incorporated in California on September 20, 1994 and
reincorporated in Delaware in February 1999. Symyx’s headquarters are located at
1263 East Arques Avenue, Sunnyvale, California, 94085, and the telephone number
at that location is (408) 764-2000. Our mailing address is 415 Oakmead Parkway,
Sunnyvale, CA 94085. Our common stock trades on the NASDAQ Global Select Market
under the symbol “SMMX.”
During
fiscal 2009, Symyx enabled global leaders in life sciences, chemical, energy,
and consumer and industrial products industries to optimize and accelerate their
scientific research and development (R&D) through our expertise in two
complementary business segments: Symyx Software and Symyx High
Productivity Research (HPR).
Symyx
Software provides a suite of scientific software, content and technology, as
well as associated professional services, to support R&D information
lifecycle management across the enterprise, improving scientists’ ability to
search, develop, manage, manipulate and store research data and to manage
intellectual property. Symyx Software was the larger of our two business units
in 2009, accounting for 59% of our 2009 revenue.
Symyx HPR
provides various ways for customers to access our proprietary high-throughput
technologies for parallel (versus serial) experimentation, enabling greater
speed and breadth of research. Symyx HPR develops and applies high-throughput
technologies that empower customers to engage in faster, broader experimentation
by working with small amounts of materials in an automated fashion and utilizing
parallel, or array-based, testing. Our customers can bring some of the
capabilities of our laboratories into their own organizations by purchasing our
tools and workflows to integrate and automate laboratory experimentation to
increase research productivity. Customers can also leverage our expertise and
infrastructure through the purchase of contract research services, with programs
that range from directed research to strategic collaborative relationships.
Symyx HPR accounted for 41% of our 2009 revenue.
In
October 2009, we commenced a restructuring focused on Symyx HPR (the October
2009 Restructuring) to address underperformance in our contract development and
manufacturing operations (CDMO) acquired as part of the Integrity Biosolution
(IntegrityBio) acquisition in August 2008, and to address an anticipated decline
in demand for research services following the end of 2009. In the
fourth quarter of 2009, we exited our CDMO business and began a process to
reduce HPR staffing by approximately 75 employees, representing a 15% reduction
in total Symyx headcount. We completed the majority of these restructuring
actions by December 31, 2009, and will substantially complete the remaining
balance of these actions in the first quarter of 2010.
On
February 11, 2010, and following an extensive sales process led by our financial
advisors, we announced the execution of a
definitive agreement (Divestiture Agreement) pursuant to which Symyx will divest
the assets of HPR’s tools operations and of certain of our recently restructured
contract research services operations (the Divestiture) to a newly formed
company, HPR Global, Inc. (HPR Global). HPR’s president, John S.
Senaldi, resigned from Symyx prior to the signing of the Divestiture Agreement
to lead the acquisition of HPR assets as founder and chief executive officer of
HPR Global. Pursuant to the Divestiture Agreement, we will transfer
to HPR Global substantially all existing HPR physical assets and certain
intellectual property assets, including a portion of our patent portfolio and
certain components of our Lab Execution and Analysis (LEA) software
suite. Symyx also expects to provide approximately $8.6 million of
positive net working capital (mostly in cash) at closing. In return,
Symyx will receive a $10.0 million note and common stock representing an
approximately 19.5% equity interest in HPR Global. Symyx will retain all
existing rights to royalties and licensing fees previously included in HPR, as
well as relevant patents underlying these entitlements. Finally, we
anticipate substantially all current HPR employees will be offered employment
with HPR Global following the closing of the Divestiture. Symyx
expects to close the Divestiture by the end of March 2010, and to conclude
certain remaining legacy chemical research services contracts by the end of the
second quarter of 2010. As a result of these actions, Symyx expects
to conclude all of its HPR activities other than its ongoing license and royalty
entitlements.
Symyx
Software and Symyx HPR were both fully integrated into Symyx’s business in
fiscal 2009. The Divestiture has not closed as of the date of this
Report, and will not close unless all of the conditions to closing are met or
waived. Accordingly, in most respects this Report presents Symyx’s
2009 fiscal year and related matters (including without limitation, the Risk
Factors and Management Discussion and Analysis sections of this Report) without
taking the Divestiture into account. However, where appropriate, we have
provided commentary and forward-looking statements regarding the likely impact
of the Divestiture on our business.
Industry
Background
Materials
and their diverse properties contribute in vital ways to many of the products in
everyday use. These materials are discovered and evolve through advanced
chemical R&D. Most of the world’s largest companies in our target
industries -- life sciences, chemical, energy and consumer and industrial
products -- depend heavily upon these advancements. New drugs, cleaner and more
efficient fuels, cheaper and stronger plastics, new and improved personal care
products, as examples, share a common feature: they depend upon success in the
chemical laboratories within an R&D organization.
Traditional
materials research relies on an expensive, labor intensive and time-consuming
process of trial and error. However, by applying informatics (through
the licensing of Symyx Software) and miniaturization, parallelization and
automation (through the sale of Symyx HPR tools and research services) to
research and development, we have helped transform our customers’ R&D
operations, enabling them to advance their research and development faster and
more cost effectively.
We
primarily have served customers in two broad categories:
|
1)
|
Life
Sciences
|
The life
sciences industry is highly competitive and undergoing a major transformation,
as pharmaceutical and biotechnology R&D organizations tackle issues such as
the growing costs of drug development and marketing, more competition from
generic drugs, scrutiny over healthcare and drug costs, patent expiration on
leading products and product families, increased partnering and outsourcing and
the need for more targeted therapeutics.
|
2)
|
Chemical,
Energy and Consumer and Industrial
Products
|
To
compete effectively and efficiently on a global scale, chemical, energy and
consumer and industrial products companies must execute and innovate faster than
ever before. Meeting this imperative requires broader and more cost-effective
experimentation, implementing quicker, more efficient product application
testing, reducing raw materials costs, enhancing production yields, creating new
product variants and improving manufacturing quality.
The
market dynamics in these categories are changing product economics, especially
with respect to time-to-market and prices, and in turn, mandating better
information correlation across people, instruments and geographies, faster
experimentation and lower costs. Our offerings help customers meet
these demands.
Symyx
Solutions
Symyx
Software
We have
developed our software offerings through acquisitions and
internally. Most recently, in October 2007 we
acquired MDL Information Systems, Inc. (MDL), a leading provider of scientific
informatics software, databases and services. We acquired
IntelliChem, Inc. (IntelliChem) in November 2004, and Synthematix, Inc.
(Synthematix) in April 2005; these two companies provided us our initial entry
into the market for electronic lab notebook (ELN) applications. Internally, we
have developed a number of solutions, including our Symyx Notebook enterprise
ELN platform, leveraging much of the knowledge gained from our IntelliChem and
Synthematix acquisitions, and our LEA software suite, which enables scientists
to design experiments, execute those experiments on our automated workflows, and
capture and analyze large quantities of multi-media data.
Today,
Symyx Software encompasses:
Symyx Notebook
Platform. Symyx Notebook replaces paper notebooks
traditionally used by scientists, providing a digital environment in which
scientists can plan, execute, record, store, back up and share their daily
research activities. Our enterprise ELN solutions have a consistent “back end,”
our Vault platform described below, and we continue to develop domain-specific
capabilities for scientists engaged in discovery, process, analytical,
formulations and biology functions that are designed with their specific
workflows in mind. We believe having the front-ends customized based on specific
functions best meets the needs of scientists, while having those front-ends
built on a common platform facilitates enterprise-wide adoption and use of Symyx
Software, enabling optimal use of research data, improving data and
documentation quality, and insuring adherence to standard operating
procedures.
Symyx Isentris®. Symyx Isentris
is a comprehensive solution consisting of a number of industry-leading products,
including:
|
(i)
|
Symyx
Isentris Client for searching, browsing, collating and sharing scientific
data in an efficient, time-saving manner that is integrated with
workflows;
|
|
(ii)
|
Symyx
Isentris for Excel® for accessing, browsing, collating, reporting,
managing and sharing scientific data from a diverse range of public and
proprietary data sources in the Microsoft Excel spreadsheet
environment;
|
|
(iii)
|
Symyx
Draw for quickly drawing precise chemical structures and reactions, and
creating publication-quality
graphics;
|
|
(iv)
|
Symyx
Isentris Controls for accessing and
leveraging the underlying functionality of Isentris with a set of .NET
controls that can be used in Microsoft Visual Studio to build custom
scientific applications rapidly, extend applications and integrate
existing applications;
|
|
(v)
|
SymyxCheshire® for defining cheminformatic
business rules for different applications to perform particular
operations, such as chemical convention checks, chemical structure
validation, and physico-chemical property
calculations;
|
|
(vi)
|
Symyx Core Interface for accessing
essential services for managing and supporting critical application
workflows, building consistent, high-quality applications quickly,
creating useful data views and finding information easier;
and
|
|
(vii)
|
SymyxDirect for searching and registering
molecules and reactions in Oracle® databases using a single, powerful
chemistry data cartridge.
|
Vault Platform. Our ELN and
LEA offerings all leverage our proprietary database solution, Vault Platform,
which supports workflow, information access, security, signatures, document
storage and access, and collaboration within regulated and non-regulated
environments.
Content Databases. To support
their research activities, scientists can access our comprehensive, integrated
and cross-referenced collection of factual databases and reference works
covering bioactivity, chemical sourcing, molecular properties, synthetic
methodology, metabolism and toxicology information. These vital
research resources can be accessed easily through our Symyx Notebook and
Isentris applications, or via the Internet through our Discovery Gate
portal.
Lab Execution and Analysis.
Our LEA applications enable scientists to control, monitor and manage the
acquisition of large amounts of data from automated laboratory instruments,
semi-automated instruments and manual instrumentation. We developed
LEA on a vendor-neutral architecture, so it can collect data from our
instruments as well as from a broad range of third-party laboratory equipment
resources, delivering highly flexible method development into the hands of
scientists.
Our LEA
software applications deliver real-time data warehousing, querying,
visualization and reporting with unified and linked views across documents,
chemical structures, multi-step synthesis and sample
lifecycles. Members of a team or an entire organization can utilize
multiple query and browsing tools to simplify reporting or to search by document
or chemical structure. With enterprise-level, worldwide scalability, our LEA
software is designed to meet the needs of companies as they grow.
The
principal components of our LEA suite are:
|
(i)
|
Library Studio: an
intuitive, graphical environment that enables scientists to design complex
libraries for a variety of applications, including polymer formulation,
catalyst synthesis, pharmaceutical API salt selection and crystallization,
and material synthesis;
|
|
(ii)
|
Automation Studio: a
flexible environment that accelerates experimental workflows and improves
R&D productivity by automating and controlling multiple laboratory
instruments, and handling collection/storage, real-time data processing,
data analysis, searching and
reporting;
|
|
(iii)
|
Spectra Studio:
consists of a suite of visualization and manipulation tools that allows
users classify large sets of spectra automatically, to review the
clustering results, manually manipulate group assignments and save the
results for later retrieval and comparison with other experimental
data;
|
|
(iv)
|
PolyView: a flexible
and comprehensive search engine to retrieve data stored across synthesis
and screening activities, enabling the user to view combinations of data
from multi-step synthetic and analytical processes collected through the
lifetime of the test sample;
and
|
|
(v)
|
Data
Loaders: over 50 data loaders are available for
processing output files from analytical instruments including NMS, FT-IRs
and HPLCs, enabling the manual or automated import of data into the Symyx
Vault data warehouse.
|
Upon the
closing of the Divestiture Agreement referenced above, Symyx will transfer
Library Studio and Automation Studio, which are central to HPR’s tools
operations, to HPR Global. In connection with that transfer, Symyx
and HPR Global will enter into a commercial agreement pursuant to which the
parties will cooperate on sales and support of LEA generally, grant certain
cross-licenses, and provide for compensatory payments to the owner of individual
LEA components where those components are included within LEA licenses by the
other party to a customer.
Experimental Logistics. We
offer the chemical presentation capabilities that customers have utilized for
the past 27 years as well as systems that support laboratory operations and
enhance laboratory productivity. These applications provide a framework for
information exchange and laboratory workflow facilitation, and solutions for
information management, work request handling, ordering, purchasing and sample
management.
Software
Services. Symyx Software also offers customers a range of
software integration and development services.
Customers
of our software include life science, chemical and energy companies, as well as
consumer and industrial products companies seeking to improve and integrate
their research data management. Pharmaceutical and biotechnology companies use
Symyx Software to support their pre-clinical research activities as well as some
pharmaceutical discovery research and chemical research. Chemical, energy and
other industrial companies use our software broadly across their research
groups.
As
discussed in the section entitled “General” above, we have entered into the
Divestiture Agreement, which we expect to close in the first quarter of
2010. We believe that the Divestiture will enhance Symyx’s ability to
operate as a highly-focused, positive cash flow, software-only business, and to
capitalize on our strategic growth opportunities.
Symyx
HPR
The
following summary relates to HPR’s business as conducted through the fourth
quarter of 2009.
Introduction
-- High-Throughput Technologies
Since its
founding in 1994, Symyx has pioneered high-throughput R&D technologies with
the goal of modernizing, automating and digitizing chemical/materials R&D.
These advancements are the foundation of all Symyx HPR offerings, and certain of
our Symyx Software offerings.
Our
high-throughput research begins with the rapid creation of large, directed
libraries of materials. These materials are then synthesized and
tested using high-throughput primary and secondary screens. During primary
screening, we conduct experiments across broad material and processing
parameters -- varying chemicals, mixtures, temperatures, pressures, etc. --
enabling researchers to quickly identify the smaller, more promising areas on
which to focus. During secondary screening, we carry out further experiments to
make a more detailed evaluation of the focused areas.
In
conventional terms, creating and testing a single material is considered one
experiment. Using our miniaturized, automated technology to execute hundreds to
thousands of experiments at a time and our software applications to design,
schedule, run, manage and share the data from those experiments, scientists can
dramatically increase the probability of success and reduce the time and costs
per experiment to discover new materials. For example, using traditional
methods, a team consisting of a chemist plus a technician could perform 500 to
1,000 experiments per year. In our laboratories, that same team could perform 10
to 25 times of these same experiments at a vastly reduced cost per experiment.
As a result, Symyx-enabled scientists can improve their productivity, generate
significantly more data, increase the possibility of successful discoveries
within a given timeframe and reduce associated program costs
dramatically.
To
achieve these efficiencies, we have developed extensive capabilities in
materials synthesis, screening and data analysis. A particular challenge is the
ability to screen materials for a wide range of properties. For example, to
discover a new catalyst, we need to screen how well it performs a specific
chemical reaction. To discover a new polymer, we need to screen for physical and
mechanical properties such as molecular weight and toughness.
Our
multi-disciplined team of people with expertise in the fields of inorganic,
physical, polymer and organic chemistries, physics, engineering and software
programming has successfully designed, built and validated a powerful array of
highly specialized proprietary instruments and software. Our scientists can
synthesize a wide range of materials and screen for properties including
catalytic, chemical, physical, mechanical, electronic and optical properties. In
addition, we continue to expand our capabilities through the development of new
instruments and software and enhanced versions of existing systems.
Automated
Tools
Symyx HPR
designs, develops, manufactures and sells tools to life science companies to
speed and improve preclinical testing of drug candidates; and to chemical,
energy, and consumer and industrial products companies for materials discovery
research, development and testing. Symyx HPR tools include high-throughput
reactors, screening systems, robotics, powder-dispensing and analytical
equipment. Our systems range from modular, configurable, increasingly
standardized units that can be integrated as needed, up to very complex,
multi-million- dollar custom systems designed specifically to meet a customer’s
requirements. By offering this range of systems, we give our
customers the flexibility of purchasing complete systems, or purchasing
individualized system components to build full high-throughput experimentation
capability gradually with the assurance that they will be able to integrate the
systems and data management of different research processes at any
time.
Using
Symyx HPR tools, our customers can implement our proven high-throughput
technologies reliably, predictably and at significant time and cost savings
compared to developing and building systems internally. Customers typically
purchase Symyx HPR tools in either Benchtop System or Integrated Workflow
configurations. The Benchtop System is a self-contained unit that automates
multiple steps of experimental procedures and is scalable to enable data and
instrument integration with other equipment in the laboratory. Integrated
Workflows are validated, integrated systems that perform fully automated
experimentation for complete laboratory processes and include integration with
other laboratory equipment and software and the ability to support document
browsing and searching, enterprise-level security and auditing, and configurable
document workflow. Symyx HPR tools are used to help accelerate research, product
optimization and process development, enabling scientists to significantly
increase their research productivity.
The
workflows we sell to life science companies include those for solubility,
polymorph and salt selection, liquid formulations, forced degradation, excipient
compatibility, organic synthesis, bio catalysis and process optimization. The
workflows we sell to chemical companies include those for formulations,
heterogeneous catalysis, homogeneous catalysis and polymerization catalysis.
Consumer and industrial products companies utilize our HPR tools to design,
formulate, and test the performance characteristics of materials. The workflows
we sell to consumer products companies include those for additives,
adhesives/coatings/sealants, consumer and personal care and
plastics.
We
assemble and ship HPR tools primarily from our facilities in California. As we
assemble our systems, we generally manufacture only critical and proprietary
components ourselves. We contract with others for the manufacture and supply of
the majority of components. We believe our supply arrangements to be adequate.
From time to time, we rely on a single supplier for all of our requirements of a
particular component or raw material.
Research
Services
Symyx
HPR’s scientific teams perform research on behalf of customers, with a goal of
producing breakthrough discoveries and at times developing new high-throughput
technologies, which we then commercialize principally through Symyx HPR tools
and services. These services have historically been provided in the context of
an alliance or collaboration agreement under which we provide the platform
technologies and effort, and our partners acquire rights to develop and
commercialize resulting materials within their defined fields of
license. Under these broader arrangements, of which our agreements
with ExxonMobil Corporation (ExxonMobil) and The Dow Chemical Company (Dow) are
the most extensive examples, we receive research funding, and in some cases,
rights to future royalties or other payments on materials we may discover once
our partner commercializes those materials. Our research programs also
contribute greatly toward the development of our intellectual property,
instrumentation and software, as we typically own or control all inventions
pertaining to high-throughput methodology conceived and reduced to practice in
connection with activities under the agreements and all know-how and
intellectual property rights related thereto.
We
provide a variety of research services with flexible scope, including contract
research services, collaborations and partnerships. We provide packaged service
offerings where clients direct the experiment goals, providing the experiment
design and data analysis. We provide the R&D execution, completing the
experimentation by leveraging our proprietary infrastructure. In this scenario,
pricing is typically based on the number of experiments and the customer owns
rights to the intellectual property. Under collaborative research agreements,
customers are also able to access the expertise of our scientists and technology
development. Partnerships within Symyx HPR involve a shared risk model that
leverages the resources of Symyx and the partner company in exchange for a
higher share of the potential reward/outcome.
We
typically bill our customers for services over the term of the research
contract, which can vary from several months to several years. Due to the nature
of our research and our dependence on our collaborative partners to
commercialize the results of the research, we cannot predict with any certainty
whether any particular collaboration or research effort will ultimately result
in a commercial product or whether we will achieve future milestone or royalty
payments under our various collaborations.
As part
of the October 2009 Restructuring, we substantially reduced our research
services offerings.
IP
Licensing
We
discover and patent a range of materials in our collaborations and internal
research programs. These discovered materials provide us licensing
opportunities, offer a path to commercialization of new materials, and
demonstrate the capabilities of our high-throughput research technologies. In
addition, we periodically enter into patent and other intellectual property
licenses designed to provide selective access to our methodology patents,
offering a constructive way to sustain the value of our intellectual property
portfolio while expanding the ways in which we can work with potential
customers.
As noted
above, following the closing of the Divestiture, Symyx will retain all existing
rights to royalties and licensing fees previously included in HPR, as well as
relevant patents underlying these entitlements, but expect no further materials
development after the closing.
Research
and Development
Our
overall R&D expenditures for 2009, 2008 and 2007, respectively, were $52.4
million, $75.4 million and $66.2 million. We do not track our fully burdened
R&D costs by project. However, based on hours spent on each project, we
estimate our R&D efforts were allocated as follows:
|
2009
|
2008
|
2007
|
||||||||||
|
Customer-sponsored
projects
|
28 | % | 37 | % | 55 | % | ||||||
|
Internally-funded
projects
|
72 | % | 63 | % | 45 | % | ||||||
|
Total
|
100 | % | 100 | % | 100 | % | ||||||
Our
overall R&D expenditures in dollar terms will be substantially reduced upon
the closing of the Divestiture Agreement, but substantially all of the remaining
expenditures will be internally-funded projects in support of our Symyx Software
products.
Customers
We have a
record of building enduring relationships with customers as they apply our
various offerings in flexible ways to meet their needs. For some customers, we
have performed research and share their successes through royalties on
commercial discoveries. For others, we have provided Symyx Software
applications, HPR tools or HPR research services either alone or in
combination. Our goal in all accounts has been to provide a
comprehensive set of solutions from each of our business areas.
The
following table lists all of our major customers that contributed more than 10%
of the total revenue in any of the fiscal years ended December 31, 2009, 2008 or
2007 (in thousands):
|
Years
Ended December 31,
|
||||||||||||
|
2009
|
2008
|
2007
|
||||||||||
|
ExxonMobil
|
$ | 13,747 | $ | 24,514 | $ | 36,489 | ||||||
|
Dow
|
$ | 25,522 | 28,681 | 35,301 | ||||||||
|
Total
|
$ | 39,269 | $ | 53,195 | $ | 71,790 | ||||||
The
following table illustrates the revenue contributed by the above customers as a
percentage of total revenue in the fiscal years ended December 31, 2009, 2008
and 2007:
|
2009
|
2008
|
2007
|
||||
|
ExxonMobil
|
9%
|
15%
|
29%
|
|||
|
Dow
|
17%
|
18%
|
28%
|
|||
|
Total
|
26%
|
33%
|
57%
|
Under our
April 1, 2003 alliance agreement with ExxonMobil, we provided research services
in certain exclusive areas, developed and sold Symyx HPR tools and licensed
Symyx Software and intellectual property. The original five-year
commitment under that agreement was approximately $200 million and expired on
May 31, 2008. We continue to be entitled to receive royalties from
the commercialization of materials, processes and products based on discoveries
made in other fields covered by the original alliance agreement (and would
retain these rights following the Divestiture).
Under our
January 1, 2005 alliance agreement with Dow, we contracted to perform research
in a number of exclusive areas, develop and provide HPR tools, and license Symyx
software and intellectual property. This alliance agreement expired on December
31, 2009 but continues to entitle us to receive royalties from the
commercialization of materials, processes and products based on discoveries made
in the fields covered by that agreement. Effective November 29, 2007, we
executed a supplemental agreement with Dow which includes additional commitments
to us of approximately $49.0 million for purchases of Symyx HPR tools and
research services, establishes minimum royalties over the period 2008-2015, and
reduces applicable royalty rates to encourage Dow’s full use and broad
commercialization of technology developed under the original
agreement. Following the Divestiture, Symyx will retain these royalty
rights; HPR Global would assume the tools and related development services
aspects of our remaining agreements with Dow.
For the
fiscal years ended December 31, 2009, 2008 and 2007, approximately 38%, 36%, and
12%, respectively, of our total revenue was generated from sales to customers
located in foreign countries. See Note 6 of the Notes to Consolidated
Financial Statements for further detail. We are exposed to risks associated with
international operations. See “We are exposed to risks associated with export
sales and international operations that may limit our ability to generate
revenue from our products and intellectual property” under Item 1A, “Risk
Factors.”
We
provide in our financial statements the amount of total revenue contributed by
the following classes of products and services accounting for more than 10% of
consolidated revenue in the periods presented: (i) Service, (ii) Product Sales
and (iii) License Fees, Content and Royalties.
Sales and Sales Support
Substantially
all of our sales are direct, though we have non-exclusive distribution
relationships in Europe, Australia, Japan, Korea and India. As of
December 31, 2009, our sales organization consisted of more than 50 employees in
the United States, Europe and Japan, with Symyx Software and Symyx HPR each
maintaining separate salesforces. We expect approximately 10 sales employees to
join HPR Global upon closing of the Divestiture.
We
believe service is an important component of the value we offer our customers.
Although sales representatives have direct responsibility for account
relationships, our sales support group works closely with our customers to
maximize the value of our offerings. Our sales organization includes field
application scientists who participate in the pre-sales effort to the customers’
R&D managers, technology support representatives and product managers to
gather a better understanding of customers’ needs. Our sales organization also
includes field service engineers dedicated to post-sales support, who train
users at our facilities in California and at customer sites, assist with
reassembly of certain instruments, install software for customers, and provide
customizations requested by customers.
Intellectual
Property and Other Proprietary Rights
Our
success, particularly in our HPR business unit, has depended in large part upon
our proprietary technology. The risks associated with patents and other
intellectual property are more fully discussed in the “Risk Factors” section
contained in Item 1A of this Annual Report on Form 10-K.
Our
patent portfolio as of December 31, 2009 consisted of more than 350 issued
patents, including approximately 300 in the United States and the balance in
Europe and in Asia, with approximately 200 additional applications pending
worldwide. These patents and applications cover composition of matter,
instruments and methodology, and include issued patents with broad claims in
high-throughput combinatorial methodologies, and software patents. We co-own
with Lawrence Berkeley National Laboratory (LBNL), on behalf of The Regents of
the University of California, 26 of the issued patents in the United States and
other countries. We have an exclusive license to these patents and patent
applications from Lawrence Berkeley National Laboratory, which was agreed to
upon our formation. In addition to patents, we rely on copyright, trademark and
trade secret rights, confidentiality procedures and licensing arrangements to
establish and protect our proprietary rights. The earliest filed patents will
begin to expire in 2014.
In
connection with the divestiture, Symyx will retain ownership of its software
patents and applications, of the patents co-owned with LBNL, and of other
patents supporting Symyx’s existing licensing and royalty entitlements, but will
transfer to HPR Global those remaining patents and applications it deems
applicable to research and tools.
Markets
Our
primary markets are life sciences, chemical, energy, and consumer and industrial
products. We provide software, and in 2009 also provided hardware and
related services, that enable the R&D operations of companies in these
industries to achieve breakthroughs in scientific R&D productivity and
return on investment. Global companies in life sciences, chemical,
energy, and consumer and industrial products spent more than $100 billion on
R&D in 2007. While the economic downturn that commenced in the
second half of 2008 materially and negatively affected R&D spending, and is
likely to continue to do so in 2010, we believe companies will continue to
invest in technology products and services to increase
productivity.
Competition
Symyx
Software competes in the research software market. In our assessment, the
research software market is highly fragmented. In the area of electronic lab
notebooks, or ELNs, Symyx Software competes primarily with CambridgeSoft,
ChemAxon, IDBS and others. We believe Symyx Software’s enterprise
platform strategy and its long-standing relationships with key customers through
its Isis/Isentris products meet the corporate interests of a single consistent
platform, fewer, stronger vendors and a reputation for good customer support,
while still offering domain specific workflows to meet the needs of individual
scientists and chemists. While we believe we are competitive on price
and other business terms, because ELN adoption is in its early stages, to date
we do not believe price is a primary driver.
Our
Isis/Isentris platform competes with a number of smaller spot solution
providers. We believe the breadth of our Isis/Isentris platform, its
extensive integration with other applications at most of our customers, and our
continuing releases of additional functionality within our maintenance and
support fee structure are competitive advantages.
Finally,
our scientific content subscription products compete primarily with Elsevier,
CAS and Thomson Reuters. We believe our chemical sourcing content
competes favorably due to the comprehensiveness of our databases in this area
and the fact that our product sourcing reference numbering system has been
widely adopted by our customers and vendors in the
industry. Regarding our other content subject areas, the market is
highly competitive, with depth of information by area and price being key
competitive factors. Our competitive position varies by subject area
and the specific needs of the account.
With
respect to Symyx HPR, our tools compete with certain instrument manufacturers,
including Chemspeed Technologies, Zinsser Analytic, Tecan Group Ltd. and others.
We believe the modular design of our tools offerings, which allows customers to
purchase an initial tool and then expand by adding additional Symyx and/or
third-party instruments and relevant portions of LEA to create a complete,
integrated workflow, enables us to compete favorably. Because our HPR
tools are semi-customized to customized to meet the needs of our customers, we
compete on value rather than price.
In
research services, we compete primarily with our customers’ in-house R&D
efforts.
Financial
Information about Geographic Areas
Revenue
is attributed to the following geographic locations based on the physical
location of our customers (as a percentage of total revenue in the respective
periods):
|
2009
|
2008
|
2007
|
||||||||||
|
United
States
|
62 | % | 64 | % | 88 | % | ||||||
|
Europe
|
27 | % | 26 | % | 9 | % | ||||||
|
Asia
|
10 | % | 9 | % | 3 | % | ||||||
|
Rest
of the World
|
1 | % | 1 | % | * | |||||||
|
Total
|
100 | % | 100 | % | 100 | % | ||||||
| * Less than 1% | ||||||||||||
The
tables below show long-lived assets by location (in thousands):
|
Years
Ended December 31,
|
||||||||||||
|
2009
|
2008
|
2007
|
||||||||||
|
Long-lived
assets in U.S.
|
$ | 101,238 | $ | 114,373 | $ | 195,246 | ||||||
|
Long-lived
assets in foreign countries
|
13,156 | 14,076 | 33,207 | |||||||||
|
Total
long-lived assets
|
$ | 114,394 | $ | 128,449 | $ | 228,453 | ||||||
Backlog
of Committed Revenue
As of
December 31, 2009, our backlog was approximately $88.2 million, including
approximately $24.9 million of customer commitments we intend to assign to HPR
Global in connection with the Divestiture. Our backlog at December
31, 2008 was approximately $100 million. Our backlog consists of contractual
commitments from our customers for the next 12 months for products to be
shipped, research, consulting and maintenance services to be provided, and
license and content revenue to be recognized. The decrease in backlog from 2008
to 2009 is mainly due to lower research service commitments from our customers.
Because of the occasional customer-driven changes in delivery schedules or
cancellation of orders without significant penalty, we do not believe our
backlog, as of any particular date, is necessarily indicative of actual revenue
for any future period.
Seasonality
Our
business is seasonal in a number of respects. In Symyx Software, our
renewals of maintenance and of our content subscriptions are heavily weighted
towards the first half of the calendar year, with many domestic and European
contracts having a start date at the beginning of the year, and many contracts
in Asia beginning early in the second quarter. Because revenue
associated with these contracts is recognized ratably over their respective
terms, the seasonal effect on our revenues is lessened, but significant
cancellations would have the effect of creating a material revenue decline
following these renewals seasons. Further, due to the timing of these
renewals, in Symyx Software we typically generate positive cash flow in the
first two quarters of each calendar year and are neutral to negative in the
second half of each year.
In Symyx
HPR, our fourth quarter has historically been strongest for our tools operations
in terms of both bookings and revenues due to our customers’ budgetary cycles,
as our customers are either spending remaining capital budgets in the fourth
quarter or planning significant capital expenditures for the following
year.
Employees
As of
December 31, 2009, we had approximately 460 employees, including approximately
300 scientific and technical employees and 160 employees in business
development, sales, and general and administrative functions. Our total
headcount decreased in 2009, primarily due to the reductions in force discussed
in Note 13 of the Notes to Consolidated Financial Statements. We anticipate our
headcount will continue to decrease in fiscal 2010 as we carry out the
Divestiture. None of our employees is represented by a labor union, and we
consider our employee relations to be good.
Executive
Officers of the Registrant
Set forth
below is information regarding our executive officers as of February 23,
2010:
|
Name of
Executive Officer
|
Age
|
Position
with the Company
|
||
|
Isy
Goldwasser (1)
|
40
|
Chief
Executive Officer
|
||
|
Rex
S. Jackson (2)
|
49
|
Executive
Vice President and Chief Financial Officer
|
||
|
Trevor
Heritage (3)
|
43
|
President,
Symyx Software
|
||
|
Charles
Haley (4)
|
40
|
Senior
Vice President and General Counsel
|
||
|
Richard
J. Rosenthal (5)
|
54
|
Senior
Vice President of Finance and Principal Accounting
Officer
|
(1) Mr.
Goldwasser has been with Symyx since its founding in 1994, was appointed
President and Chief Operating Officer in 1998, and was appointed Chief Executive
Officer in June 2007. Mr. Goldwasser received a B.S. degree in chemical
engineering from the Massachusetts Institute of Technology and an M.S. degree in
chemical engineering from Stanford University.
(2) Mr.
Jackson joined Symyx in February 2007 as Executive Vice President, General
Counsel and Secretary. In June 2007, Mr. Jackson assumed the role of
interim Chief Financial Officer and in October 2007 was appointed Chief
Financial Officer. Prior to joining Symyx, he served as Senior Vice President
and General Counsel at Avago Technologies Ltd. from 2006 to 2007 and held
multiple positions at Synopsys, Inc. from 2003 to 2006, most recently as Senior
Vice President, General Counsel and acting Chief Financial Officer. Mr. Jackson
was primarily responsible for the entire legal function at each of Avago
Technologies and Synopsys. Mr. Jackson obtained a B.A. degree in political
science from Duke University and a J.D. degree from Stanford
University.
(3) Dr.
Heritage was Senior Vice President and Chief Science Officer of MDL Information
Systems, Inc. for three years prior to Symyx’s acquisition of MDL in October
2007 and was appointed President of Symyx Software effective June 1, 2008. Prior
to joining MDL, Dr. Heritage was with Tripos, Inc., a discovery informatics
company focused on the life sciences industry, from 1994 to 2005, most recently
serving as senior vice president and general manager, Discovery Informatics,
responsible for leading the product development. Dr. Heritage has a B.S. degree
in chemistry and computer and a Ph.D. degree in organic chemistry from
University of Reading, United Kingdom.
(4) Mr.
Haley joined Symyx as Senior Vice President and General Counsel in September
2008. Prior to Symyx, from October 2006 to September 2008, Mr. Haley
served as Deputy General Counsel of BigBand Networks, Inc. (BigBand), a
technology company serving the telecommunications and cable industries based in
Redwood City, CA. Prior to BigBand, Mr. Haley was an associate and
then partner in the law firm of Tomlinson Zisko LLP, from June 2002 to September
2006. Mr. Haley’s past experience was primarily in the area of legal
functions. Mr. Haley holds a J.D. from the University of Virginia, School of
Law, and a B.A., summa cum laude, from Princeton University in Near Eastern
Studies.
(5) Mr.
Rosenthal joined Symyx as Senior Vice President of Finance and Principal
Accounting Officer in December 2007. Prior to Symyx, he was employed by LSI
Corporation, a manufacturer of communications, consumer and storage
semiconductors, from 1997 until December 2007, most recently serving as Vice
President and Corporate Controller, responsible for accounting and business
operations. Mr. Rosenthal obtained a B.S. degree in accounting from
San Jose State University and an M.B.A. from Santa Clara
University.
There is
no family relationship between any of the foregoing executive officers or
between any of such executive officers and any of the members of our Board of
Directors. Our executive officers serve at the Board’s discretion.
Environmental
Matters
Symyx
HPR involves the use of a broad range of hazardous chemicals and materials.
Environmental laws impose stringent civil and criminal penalties for improper
handling, disposal and storage of these materials. We have a number of programs
underway to minimize our impact on the environment, such as ongoing safety
trainings and lab owner program. These programs typically do not require
material capital expenditures. We believe we are in substantial
compliance with applicable environmental laws and regulations. With the HPR
Divestiture, we will focus on our software business and expects to substantially
discontinue further use of hazardous chemicals and materials, reducing our
exposure in environmental matters.
Company
Website and Available Information
We are
subject to the informational requirements of the Securities and Exchange Act of
1934, as amended. Therefore, we file periodic reports, proxy statements and
other information with the SEC. Our website can be found at www.symyx.com and it
contains information about Symyx, our products and services and our operations.
Copies of our filings with the SEC on Forms 10-K, 10-Q and 8-K and all
amendments to those reports can be viewed and downloaded free of charge at our
website as soon as reasonably practicable after they are filed with the
SEC. Any materials we file with the SEC may be read at the SEC’s
Public Reference Room at 100 F Street, NE, Washington, DC 20549. Anyone may
obtain information on the operation of the Public Reference Room by calling the
SEC at 1-800-SEC-0330. The SEC also maintains an Internet site that contains
reports, proxy and information statements, and other information regarding
issuers that file electronically with the SEC at
http://www.sec.gov.
Our
website also contains our Corporate Governance Guidelines, charter and
membership of the Board’s Audit, Compensation and Nominating and Governance
Committees, as well as our Code of Conduct and Ethics.
ITEM 1A. RISK FACTORS
In
evaluating Symyx’s business, you should carefully consider the risks described
below, as well as other information contained in this Report. It
should be noted Symyx Software and Symyx HPR were both fully integrated into
Symyx’s business in fiscal 2009, and the Divestiture has not closed as of the
date of this Report (and Symyx cannot guarantee it will
close). Accordingly, in most respects these Risk Factors are
provided without taking the Divestiture into account. In certain Risk
Factors, Symyx describes likely changes in subsequent disclosures and effects on
Symyx’s business, in the event that the Divestiture does close. If
any of those risks actually occurs, our business, financial condition and
operating results could be harmed. The risks and uncertainties listed
are not the only risks and uncertainties facing Symyx. Additional
risks and uncertainties Symyx has not anticipated or are currently seen as
immaterial also may materially and adversely impair our business
operations.
We
expect to be a smaller company in 2010, but may not be able to proportionately
decrease our operating expenses, particularly as a public company, which may
materially and adversely affect our cash flows and profitability.
As a
result of our exiting the CDMO and research services business, and should we
close the expected Divestiture, we will be a substantially smaller company in
2010. However, we may not be able to decrease our expenses
proportionately, as many expenses of operating, in particular as a public
company, are independent of the size of the company, such as the costs of
compliance with the Sarbanes-Oxley Act of 2002. Consequently, we
expect our public company operating expenses will comprise a greater percentage
of our costs than previously, which will make it more challenging for us to be
profitable.
The Divestiture poses significant
operational and financial risks to Symyx that, if realized, could have a
material adverse effect on our financial interests in the transaction and our
customer relationships, which could in turn adversely affect our business,
financial condition and results of operations.
We have
undertaken a material level of business effort and cost to enter into the
Definitive Agreement, and expect the Divestiture will close. If the
Divestiture fails to occur for any reason, Symyx Software and HPR customers
could suffer material disruption. If the Divestiture closes, Symyx
will need to provide certain transition services on a cost plus basis, which
could distract company personnel from other duties in support of Symyx
Software. Further, Symyx has no operational or other control over HPR
Global and cannot guarantee that HPR Global management will successfully manage
HPR Global going forward as necessary to insure Symyx will collect on the
$10,000,000 note issuable in the Divestiture, will see appreciation in Symyx’s
equity interest in HPR Global, and/or will suffer no adverse impact on customer
relationships for Symyx Software. Finally, we cannot predict the
impact of the Divestiture on our stock price in the public markets.
We
depend upon the research and development activities of companies in the life
science, chemical, energy and consumer and industrial products industries, among
others, and declines or reductions in the research and development activities of
these industries could harm our business.
The
market for our software, tools and research services within the life science,
chemical, energy and consumer and industrial products industries depends on our
customers’ ability and willingness to invest in research and development. If we
cannot renew existing contracts or enter into new arrangements at the pace we
expect, our business and operating results will be harmed.
In
particular, many companies in the life science and chemical industries have, in
the past several years, experienced declining profitability, and in many cases,
losses, and this negative trend does not appear to have abated as of the date of
this Report. There also has been considerable consolidation and restructuring
among many companies in the life sciences industry. In addition, many chemical
products have become commodity products that compete primarily on the basis of
price. As a result, some life science and chemical companies have reduced their
research and development activities and/or delayed investments in new
technologies. If commoditization of chemical products and other pressures
affecting the profitability of the industry, including governmental regulations
and governmental spending, continue in the future, more companies could adopt
strategies that involve significant reductions in their research and development
programs. Although we believe our technologies can help life science, chemical,
energy, and consumer and industrial products companies increase the efficiency
of their research and development activities, our efforts to convince them of
this value may be unsuccessful. To the extent these companies reduce their
research and development activities or external investments, they may be less
likely to do business with us. As a result of current industry consolidation, a
number of our pharmaceutical companies have recently reduced or postponed
decisions relative to research and development spending. Decisions by these
companies to reduce or postpone their research and development activities could
result in fewer or smaller scale collaborations with us, fewer or smaller scale
intellectual property and software licenses, fewer sales of our tools, or
choosing not to work with us, any of which could reduce our revenue and harm our
business and operating results.
We
depend on a number of key customers for a large portion of our
revenues. If we are unable to replace the expected decline in certain
key customer contracts with new revenue, or if any of our other key customers
eliminates or significantly reduces its business with us, our business,
financial condition and results of operations would be adversely
affected.
We have
depended on a relatively small number of key customers for a large portion of
our revenues, in particular with respect to our HPR business unit. The loss of
any of our key customers or a material reduction in business from one or more of
these customers would materially harm our business, financial condition and
operating results. For example, our revenue from ExxonMobil and Dow declined
from $71.8 million in 2007 to $53.2 million in 2008 and to $39.3 million in
2009, primarily due to the expiration of our alliance agreement with ExxonMobil
in May 2008. Our primary alliance agreement with Dow and certain
research services extensions from ExxonMobil expired in December
2009. These expirations were the primary drivers of our decision to
execute the October 2009 Restructuring. If the Divestiture does not
close, in 2010 we will continue to depend upon Dow for a significant portion of
HPR revenue. In Symyx Software, our top 25 customers account for more
than 60% of our annual revenue for that business. If we are not able
to effect the Divestiture and thereafter fail to maintain our business with Dow,
or if one or more agreements with our top 25 customers are not fully renewed
annually, our business, operating results and financial condition will be
materially and adversely affected.
We
are exposed to general global economic and market conditions, which declined
significantly in 2008 and did not significantly recover in 2009.
Our
business is subject to the effects of general economic conditions in the United
States, Europe, Asia and globally, and, in particular, market conditions in the
life science and chemical industries. For example, our tools revenue has been
affected by customer delays and cancellations, and our software content and
consulting service revenues have declined as customers cut costs, delay new
projects and reduce staff. Continued or worsening economic slowdowns
globally in the life science and/or chemical industries will materially and
adversely impact our business, operating results and financial
condition.
Recent
worldwide market turmoil adversely affects our customers, which in turn impacts
our business and results of operations.
Our
operations and performance depend on our customers having adequate resources to
purchase our products and services. The unprecedented turmoil in the global
markets and the global economic downturn generally continues to adversely impact
our customers and potential customers. These market and economic conditions have
continued to deteriorate globally, and may remain volatile and uncertain for the
foreseeable future. Customers have altered and may continue to alter their
purchasing and payment activities in response to deterioration in their
businesses, lack of credit, economic uncertainty and concern about the stability
of markets in general. Further, a number of our current and prospective
customers have merged with others or been forced to raise significant amounts of
capital. These market factors have, in turn, reduced customer demand for our
software consulting services, reduced seat counts for our software and content
at certain customers, and extended decision-making for major capital or software
purchases. If we are unable to adequately respond to changes in demand resulting
from these difficult market and economic conditions, our financial condition and
operating results will be materially and adversely affected.
Difficulties
we may encounter developing a new line of business, integrating acquisitions or
growing through other means may divert resources, disrupt our business, and
limit our ability to successfully expand our operations.
If we
develop a new line of business or pursue a partnership or venture, our
management’s attention may be diverted from normal daily operations of the
business. Furthermore, acquisitions or other growth initiatives, such as our
introduction of contract services in the life science market, places strain on
our research, administrative and operational infrastructure and may, in the
short-term, significantly impact our margins and profitability. As our
operations expand domestically and internationally, and as we continue to
acquire new businesses, we will need to continue to manage multiple locations
and additional relationships with various collaborative partners, suppliers and
other third parties. Our ability to manage our operations and further growth
effectively requires us to continue improving our reporting systems and
procedures and our operational, financial and management controls. In addition,
SEC rules and regulations have increased the internal control and regulatory
requirements under which we operate. We may not be able to successfully improve
our management information and control systems to a level necessary to manage
our acquisition activity or growth and we may discover deficiencies in existing
systems and controls that we may not be able to remediate in an efficient or
timely manner.
We have
acquired a number of businesses in the past. In the future, we may engage in
additional acquisitions and expand our business focus in order to exploit
technology or market opportunities. In the event of any future
acquisitions or business expansions, we may issue stock that would dilute our
current stockholders’ percentage ownership, pay cash, incur debts or assume
liabilities. Our success depends upon our ability to successfully integrate the
products, people, and systems we acquire in these transactions. We may not be
able to successfully integrate acquired businesses into our existing business in
a timely and non-disruptive manner or at all. In addition, acquisitions could
result in, among other things, large one-time charges associated with acquired
in-process research and development, amortization of acquisition-related
intangible assets, future write-offs of goodwill and other acquisition-related
intangible assets that are deemed to be impaired, restructuring charges related
to consolidation of operations, charges associated with unknown or unforeseen
liabilities of acquired businesses, increased general and administrative
expenses, and the loss of key employees. As an example, in December 2008, with
the recent decrease in our market capitalization, we recorded a $76.5 million
impairment charge to our goodwill associated with our acquisitions.
In
addition, there is no guarantee that we will successfully integrate a given
acquisition target into our product portfolio after closing of such an
acquisition. For example, in October 2009 we recorded a loss of $2.0
million in connection with exiting the CDMO business, which we acquired in
August 2008.
We
expect our quarterly results of operations will fluctuate, and this fluctuation
could cause our stock price to decline, causing investor losses.
Our
quarterly operating results have fluctuated in the past and are likely to do so
in the future. In particular, third and fourth quarter revenue is
often heavily dependent on closing sales for a few high-value tools to specific
customers. The timing or occurrence of these sales is difficult to predict.
Quarterly fluctuations also result from our customers’ budgetary cycles, as our
customers typically expend their remaining capital budgets for the year in the
fourth quarter. As a
result, the fourth quarter historically has been our strongest quarter. These
fluctuations could cause our stock price to fluctuate significantly or decline,
as was the case when we reported revised projections for the balance of fiscal
2008 in October 2008. Revenue in future fiscal periods may be greater or less
than revenue in the immediately preceding period or in the comparable period of
the prior year. Some of the factors that could cause our operating results to
fluctuate include:
|
•
|
general
and industry-specific economic and financial uncertainties, which may
affect our customers' capital investment levels and research and
development investment
decisions;
|
|
•
|
expiration
of or reduction in revenue derived from research contracts with major
collaborative partners, which may not be renewed or replaced with
contracts with other companies, including the additional impact of the
October 2009 Restructuring and the Divestiture on customers’
decision-making processes;
|
|
•
|
the
amount and timing of royalties we receive from third parties, including
those who license Symyx tools and Symyx Software for
resale;
|
|
•
|
customers’
willingness to renew annual right to use software or content licenses or
maintenance and support
agreements;
|
|
•
|
the
size and timing of both software and intellectual property licensing
agreements we may enter into;
|
|
•
|
the
size and timing of customer orders for, shipments of and payments related
to Symyx tools;
|
|
•
|
the
concentration of Symyx tools sales in the second half of the year, with
the majority of those sales occurring in the fourth
quarter;
|
|
•
|
the
sale of integrated workflows including software and tools that may cause
our tools revenue to be recognized ratably over future periods under our
revenue recognition policy;
|
|
•
|
the
technical risks associated with the delivery of Symyx tools and the timing
of customer acceptance of Symyx
tools;
|
|
•
|
the
timing and willingness of partners to commercialize our discoveries that
would result in royalties;
|
|
•
|
the
success rate of our discovery efforts associated with milestones and
royalties;
|
|
•
|
special
charges related to completed or potential
acquisitions;
|
|
•
|
the
size and timing of research and development programs we undertake on an
internally funded basis;
|
|
•
|
developments
or disputes concerning patent or other proprietary
rights;
|
|
•
|
the
structure, timing and integration of acquisitions of businesses, products
and technologies and related disruption of our current
business;
|
|
•
|
fluctuations
in the market values of our cash equivalents and short and long-term
investments and in interest rates, including any gains or losses arising
on the sale of these
investments;
|
|
•
|
changes
in accounting rules and regulations, including those related to revenue
recognition, stock-based compensation and accounting for uncertainty in
income taxes; and
|
|
•
|
general
and industry-specific economic and financial uncertainties, which may
affect our customers' capital investment levels and research and
development investment
decisions.
|
A large
portion of our expenses, including expenses for facilities, equipment and
personnel, are relatively fixed in nature, which could contribute to adverse
fluctuations in quarterly operating results. Accordingly, if our revenue
declines or does not grow as anticipated due to the expiration of research
contracts, failure to obtain new contracts, or other factors, we may not be able
to correspondingly reduce our operating expenses. Failure to achieve anticipated
levels of revenue would significantly harm our operating results.
The
sales cycle for our tools, and for a number of our software products is long and
complex, and requires us to invest substantial resources in a potential sale
before we know whether the sale will occur.
We have a
limited number of contracts for our tools, and for our software product
offerings (other than content database subscriptions). Our sales
efforts require us to educate our potential customers about the full benefits of
our solutions, which often require significant time and expense. Our sales cycle
is typically from 12 to 18 months, and we incur significant expenses, and in
many cases begin to build customer-specific tools prior to obtaining contractual
commitments, as part of this process, without any assurance of resulting
revenue. As another example, in many cases an enterprise ELN
deployment will require a long sales cycle (and also may result in delayed
revenue, as there will be services deliverables with respect to which we have
not established Vendor Specific Objective Evidence for
pricing). Investment of time and expense in the sales cycle that does
not ultimately result in sales hurts our business. Factors impacting sales and
the length of our sales cycle include, but are not limited to, the
following:
|
•
|
complexity
of convincing customers of the efficacy of an enterprise-wide ELN
solution;
|
|
•
|
customers'
budgetary constraints and internal acceptance review
procedures;
|
|
•
|
limited
number of customers that are willing to purchase our larger tools systems
or enter into licensing agreements with
us;
|
|
•
|
complexity
and cost of our tools systems and difficulties we may encounter in meeting
individual customer specifications and commitments;
and
|
|
•
|
our
ability to build new tools systems and design workflows to meet our
customers’ demands.
|
Failure
to successfully commercialize our discoveries, either independently or in
collaboration with our customers and licensees, would reduce our long-term
revenue and profitability.
In order
for us to commercialize materials we discover and patent in our collaborations
and internal research programs, we need to develop, or obtain through
outsourcing arrangements, the capability to manufacture, market and sell
products. Currently, we do not have these capabilities and we may not be able to
develop or otherwise obtain them. Most of our commercialization
efforts are currently being done through collaborations with our customers and
licensees. We typically receive royalties on sales of products by our
partners only if their products containing materials developed by us or if the
products are produced using our methods. Commercialization of discovered
materials is a long, uncertain and expensive process and we cannot control our
partners’ activities in this regard. The failure of our partners to
commercialize development candidates resulting from our research efforts could
reduce our future revenue and would harm our business and operating results. In
addition, our partners may delay or cancel commercialization of development
candidates which may harm our business and operating results. If we
are unable to successfully commercialize products resulting from our proprietary
research efforts, our future revenue and operating results would
decline.
Strategic
investment projects such as royalty-bearing programs, spin-offs and joint
ventures may affect our operating results and financial condition and distract
our management team.
We are
constantly assessing strategic investment projects with potential to deliver
significant value creation opportunity for our shareholders. These projects
include, but are not limited to, royalty-bearing programs, spin-offs such as our
Divestiture and joint ventures. The process of investigating and implementing
these projects is risky, may create unforeseen operating difficulties and
expenditures, may involve significant additional operating expenses or
investments, and may distract our management team. Failure of any such
investment project, if pursued, would have a material adverse effect on our
operating results and financial condition.
Our
stock price has been and may continue to be volatile.
The
market price of our common stock has been highly volatile since our initial
public offering. Volatility in the market price for our common stock can be
affected by a number of factors, including, but not limited to, the
following:
|
|
•
|
Market
reaction to the Divestiture;
|
|
|
•
|
failure
to achieve operating results within the guidance our senior management
provides, as occurred in the quarter ended September 30, 2008, or downward
revisions in guidance relative to previous forecasts as occurred in
October 2008;
|
|
|
•
|
changes
in our growth rates;
|
|
|
•
|
quarterly
variations in our or our competitors' results of
operations;
|
|
|
•
|
failure
to achieve operating results projected by securities
analysts;
|
|
|
•
|
changes
in earnings estimates or recommendations by securities
analysts;
|
|
|
•
|
changes
in investors’ beliefs as to the appropriate valuation ratios for us and
our competitors;
|
|
|
•
|
changes
in investors’ acceptable levels of
risk;
|
|
|
•
|
decisions
by significant stockholders to acquire or divest their stock holdings,
given the relatively low average daily trading volumes we have
historically experienced;
|
|
|
•
|
changes
in management;
|
|
|
•
|
the
announcement of new products or services by us or our competitors, and
investors’ reaction to the new product portfolio resulting from the
October 2009 Restructuring;
|
|
|
•
|
speculation
in the press or analyst community;
|
|
|
•
|
developments
in our industry; and
|
|
|
•
|
general
market conditions, political influences, and other factors, including
factors unrelated to our operating performance or the operating
performance of our competitors, such as global economic slowdown resulting
from the current disruptions in the credit and financial markets.
Particularly given the current economic downturn, we are concerned that
market conditions may temper customer activity on major capital purchases
such as Symyx tools, and significant enterprise investment in
software.
|
These
factors and fluctuations may materially and adversely affect the market price of
our common stock. Securities class action litigation is often brought
against a company following periods of volatility in the market price of its
securities. We may in the future be the target of similar litigation. Securities
litigation, with or without merit, could result in substantial costs and divert
management’s attention and resources, which could harm our business and
financial condition, as well as the market price of our common stock.
Additionally, volatility or a lack of positive performance in our stock price
may adversely affect our ability to retain key employees, most of whom have been
granted stock options or restricted stock units, or to use our stock to acquire
other companies or technologies at a time when cash or financing for such
acquisitions may not be available.
If
we revise the projections we give to our stockholders regarding our anticipated
financial results, and the revised projections are not well received by our
stockholders, market analysts or investors, our stock price may be adversely
affected.
Due to
the possibility of fluctuations in our revenue and expenses, it is difficult for
our management to predict or estimate our quarterly or annual operating results
and to give accurate projections. Our operating results in some quarters may not
meet the expectations of stock market analysts and investors. In
addition, as in the case of the revised projections for the balance of fiscal
2008 communicated in October 2008, we may update the financial projections we
communicate to our stockholders from time to time to address recent
developments, though we undertake no obligation to do so. In cases in which we
lower our projections, our stock price will likely decline, and investors will
experience a decrease in the value of their investment.
We
may not be able to grow our business and achieve profitability.
Our
ability to grow our business and achieve profitability is dependent on our
ability to:
|
•
|
extend
current research and development relationships and add new
ones;
|
|
•
|
secure
customers for the company’s new life sciences
offerings;
|
|
•
|
secure
new Symyx tools customers;
|
|
•
|
enter
new partnerships or ventures with third parties that would use our
technology and expertise to further develop and commercialize
products;
|
|
•
|
add
additional licensees of our software, discovered materials, and
intellectual property;
|
|
•
|
maintain
renewal rates for our database content business, in the face of
competition and the increasing availability of free
content;
|
|
•
|
convince
existing customers to upgrade to products with greater functionality and
increase the number of users within our existing customer base;
and
|
|
•
|
make
discoveries that our customers choose to commercialize that generate a
substantial stream of royalties and other
revenue.
|
Our
ability to achieve our objectives and maintain or increase the profitability of
our business will depend, in large part, on potential customers accepting our
high-throughput screening technologies and methodologies as effective tools in
the discovery of new materials. Historically, life science and chemical
companies have conducted materials research and discovery activities internally
using traditional manual discovery methods. In order for us to achieve our
business objectives, we must convince these companies that our technology and
capabilities justify outsourcing part of their basic research and discovery
programs. We cannot assure you we will achieve the levels of customer acceptance
necessary for us to maintain and grow a profitable business. Failure to achieve
the necessary customer acceptance, extend current research relationships and add
new ones, secure new tools customers, and add additional licensees of our
software, discovered materials, and intellectual property would adversely affect
our revenue and profitability and may cause our stock price to
decrease.
Our
inability to keep pace with technological advances and evolving industry
standards would harm our business.
The
market for our products is characterized by continuing technological
development, evolving industry standards and changing customer requirements. Due
to increasing competition in our field, it is likely that the pace of innovation
and technological change will increase. Our success depends upon our ability to
enhance existing products and services and to respond to changing customer
requirements. Failure to develop and introduce new products and services, or
enhancements to existing products, in a timely manner in response to changing
market conditions, industry standards or other customer requirements would harm
our future revenue and our business and operating results.
We
depend on skilled and experienced personnel to operate our business effectively.
If we are unable to recruit, hire and retain these employees, our ability to
manage and expand our business will be harmed, which would impair our future
revenue and operating performance.
Our
success will depend on our ability to retain our current management and to
attract and retain qualified personnel, including key scientific and highly
skilled personnel. The hiring of qualified scientific and technical personnel is
generally difficult because the number of people with experience in
high-throughput materials science is limited. We encounter competition for
qualified professionals, especially in the San Francisco Bay Area where we are
headquartered. Further, as noted above, particularly with respect to our HPR
business, in light of the October 2009 Restructuring, we will need personnel
with specific skill sets that may be difficult to locate, attract and retain
(this would be of particular risk to Symyx if the Divestiture fails to close for
any reason). Although we have entered into employment contracts with most of our
senior management, any of them may terminate their employment at any
time. In addition, we do not maintain “key person” life insurance
policies covering any of our employees. Competition for senior
management personnel, as well as key scientific and other highly skilled
personnel, is intense and we may not be able to retain our
personnel. The loss of the services of members of our senior
management, as well as key scientific and other highly skilled personnel, could
prevent the implementation and completion of our
objectives. Upon joining or promotion, new senior personnel
must spend a significant amount of time learning our business model and
management systems or their new roles, in addition to performing their regular
duties. Accordingly, until new senior personnel become familiar with our
business model and systems or with their new roles, we may experience some
disruption to our ongoing operations. Moreover, the loss of a member
of our senior management or our professional staff would require the remaining
executive officers to divert immediate and substantial attention to seeking a
replacement.
Our
ability to retain our skilled labor force and our success in attracting and
hiring new skilled employees will be a critical factor in determining whether we
will be successful in the future. The recent decline in our market
value of our common stock, as well as the October 2009 Restructuring, may
complicate this effort by reducing the perceived value of equity compensation
awards to our employees and candidates for employment. We may not be able to
meet our future hiring needs or retain existing personnel. We will
face particularly significant challenges and risks in hiring, training, managing
and retaining engineering and sales and marketing employees, as well as
independent distributors, most of whom are geographically dispersed and must be
trained in the use and benefits of our products. Failure to attract and retain
personnel, particularly scientific and technical personnel, would impair our
ability to grow our business.
Competition
could increase, and competitive developments could render our technologies
obsolete or noncompetitive, which would reduce our revenue and harm our
business.
The field
of high-throughput materials science is increasingly competitive. We are aware
of companies that may apply their expertise in high-throughput chemistry to
their internal materials research and development programs. There are also
companies focusing on aspects of high-throughput chemistry for the discovery of
materials on behalf of third parties. In addition, academic and research
institutions may seek to develop technologies that would be competitive with our
technologies for materials discovery. Because high-throughput materials science
is an emerging field, competition from additional entrants and pricing pressure
may increase. Both business units are facing increasing competition from a
number of instrument manufacturing and software companies. To the extent these
companies develop competing technologies, our own technologies, methodologies,
systems and workflows, and software could be rendered obsolete or
noncompetitive. We would then experience a decline in our revenue and operating
results.
We
conduct research programs for our own account and for a number of collaborative
partners, and any conflicts between these programs would harm our
business.
Our
strategy includes conducting research programs for our own account as well as
for collaborative partners. We believe our collaborative agreements are
structured in a manner to enable us to minimize conflicts with our collaborators
relating to rights to potentially overlapping leads developed through programs
for our own account and through programs funded by a collaborator, or through
programs funded by different collaborators. However, conflicts between a
collaborator and us, or between or among collaborators, could potentially arise.
In this event, we may become involved in a dispute with our collaborators
regarding the material, including possible litigation. Disputes of this nature
could harm the relationship between us and our collaborators, and concerns
regarding our proprietary research programs could also affect our ability to
enter into new collaborative relationships and cause our revenue and operating
results to decline.
Our
inability to adequately protect our proprietary technologies could harm our
competitive position and have a material adverse effect on our
business.
The
success of our business depends, in part, on our ability to obtain patents and
maintain adequate protection of our intellectual property for our technologies
and products in the United States and other countries. The laws of some foreign
countries do not protect proprietary rights to the same extent as the laws of
the United States, and many companies have encountered significant problems in
protecting their proprietary rights in these foreign countries. These problems
can be caused by, for example, a lack of rules and processes allowing for
meaningfully defending intellectual property rights. If we do not adequately
protect our intellectual property, competitors may be able to practice our
technologies and erode our competitive advantage, and our business and operating
results could be harmed.
The
patent positions of technology companies, including our patent positions, are
often uncertain and involve complex legal and factual questions. We will be able
to protect our proprietary rights from unauthorized use by third parties only to
the extent that our proprietary technologies are covered by valid and
enforceable patents or are effectively maintained as trade secrets. We apply for
patents covering our technologies and products as we deem appropriate. However,
we may not obtain patents on all inventions for which we seek patents, and any
patents we obtain may be challenged and may be narrowed in scope or extinguished
as a result of such challenges. We also have defended certain U.S. patents in
multiple reexaminations, and may be forced to do so again. In addition, we are
involved in several administrative proceedings (such as opposition proceedings
in the European Patent Office) that challenge the validity of the patents we
have obtained there. Our existing patents and any future patents we obtain may
not be sufficiently broad to prevent others from practicing our technologies or
from developing competing products. In that case, our revenue and operating
results could decline.
We rely
upon trade secret protection for certain of our confidential information. We
have taken measures to protect our confidential information. These measures may
not provide adequate protection for our trade secrets or other confidential
information. For example, we seek to protect our confidential information by
entering into confidentiality agreements with employees, collaborators, and
consultants. Nevertheless, employees, collaborators or consultants may still
disclose or misuse our confidential information, and we may not be able to
meaningfully protect our trade secrets. In addition, others may independently
develop substantially equivalent information or techniques or otherwise gain
access to our trade secrets. Disclosure or misuse of our confidential
information would harm our competitive position and could cause our revenue and
operating results to decline.
Failure
to adequately enforce our intellectual property rights could harm our
competitive position and have a material adverse effect on our
business.
Our
success depends on our ability to enforce our intellectual property rights
through either litigation or licensing. To be successful in enforcing our
intellectual property through litigation or licensing there are several aspects
to consider, including maintaining the validity of our intellectual property,
proving that others are infringing, and obtaining a commercially significant
outcome as a result of such infringement. Intellectual property litigation can
succeed if our intellectual property withstands close scrutiny. If it does not
withstand this scrutiny, we can lose part or all of our intellectual property
position. In addition, we are involved in several administrative proceedings
(such as opposition proceedings in the European Patent Office) that challenge
the validity of the patents we have obtained there. We also have begun the
process of defending certain U.S. patents in a reexamination. If we lose part or
all of our intellectual property position, whether through litigation or
opposition proceedings, our business and operating results may be
harmed.
With
regard to proving infringement of our intellectual property, our success depends
in part on obtaining useable knowledge of what technologies others are
practicing. If others do not publish or disclose the technologies that they are
using, our ability to discover infringing uses and enforce our intellectual
property rights will diminish. If we are unable to enforce our intellectual
property rights or if the ability to enforce such rights diminishes, our revenue
from intellectual property licensing and our operating results may
decline.
Our
intellectual property must protect our overall business structure by allowing us
to obtain commercially significant results from litigation, including
compensation and/or relevant injunctions, without resulting in undue cost and
expense. Enforcement of our intellectual property through litigation can result
in significant expenses, distractions, and risks that might cause us to lose
focus or may otherwise harm our profitability and weaken our intellectual
property position. Enforcement proceedings can adversely affect our intellectual
property while causing us to spend resources on the enforcement proceedings. As
our licensing activities have matured, we have become involved in arbitration,
litigation and similar administrative proceedings to assert and defend our
intellectual property. These matters may become material and more such matters
may arise. Successful conclusion of these matters will assist our business,
while unsuccessful conclusion of these matters will cost us time and money and
possibly loss of rights. Our ability to manage the costs of these proceedings to
obtain a successful result cannot be predicted.
Our business may be harmed if we are
found to infringe proprietary rights of others.
Our
commercial success also depends in part on ensuring we do not infringe patents
or other proprietary rights of third parties. Others have filed, and in the
future are likely to file, patent applications covering technologies that we may
wish to utilize with our proprietary technologies, or products that are similar
to products developed with the use of our technologies. If these patent
applications result in issued patents and we wish to use the claimed technology,
we would need to obtain a license from the third party and this would increase
our costs of operations and harm our operating results.
Third
parties may assert that we are employing their proprietary technology without
authorization. In addition, third parties may obtain patents in the future and
claim that use of our technologies infringes these patents. We could incur
substantial costs and diversion of the time and attention of management and
technical personnel in defending ourselves against any such claims. Furthermore,
parties making claims against us may be able to obtain injunctive or other
equitable relief that could effectively block our ability to further develop,
commercialize and sell products, and such claims could result in the award of
substantial damages against us. In the event of a successful claim of
infringement against us, we may be required to pay damages and obtain one or
more licenses from third parties. We may not be able to obtain these licenses at
a reasonable cost, if at all. In that event, we could encounter delays in
product introductions while we attempt to develop alternative methods or
products, or be required to cease commercializing affected products, which would
harm our operating results.
Fluctuation
in foreign currency exchange rates may materially affect our financial condition
and results of operations.
A
significant portion of our business is now denominated in currencies other than
our functional currencies or our reporting currency for consolidated financial
statements. We are in the process of reducing monetary assets denominated in
foreign currencies but expect to continue to have a significant balance to
support our foreign operations. Material changes in foreign currency exchange
rates may materially and adversely affect our financial condition and results of
operations.
We
depend on a limited number of suppliers and will be delayed in our manufacture
or unable to manufacture tools if shipments from these suppliers are delayed or
interrupted.
Key parts
of our tools are currently available only from a single source or a limited
number of sources. In addition, components of our capital equipment are
available from one or only a few suppliers. While we are not bound by long-term
arrangements with such suppliers, and have been able to find replacement vendors
in prior instances, if supplies from these vendors are delayed or interrupted
for any reason, we may not be able to get equipment or components for our tools
or our own research efforts in a timely fashion or in sufficient quantities or
under acceptable terms.
Even if
alternative sources of supply are available, it could be time-consuming and
expensive for us to qualify new vendors and integrate their components into our
tools. In addition, we depend upon our vendors to provide components of
appropriate quality and reliability. Consequently, if supplies from these
vendors were delayed or interrupted for any reason, we could be delayed in our
ability to develop and deliver products; these delays would materially and
adversely affect our business in the event that a key transaction were to be
impacted.
Failure
to maintain effective internal controls in accordance with Section 404 of the
Sarbanes-Oxley Act could have a material adverse effect on our business and
stock price.
Each year
we are required to document and test our internal control procedures in order to
satisfy the requirements of Section 404 of the Sarbanes-Oxley Act, which
requires annual management assessments of the effectiveness of our internal
controls over financial reporting and a report by our Independent Registered
Public Accounting Firm addressing these assessments and the effectiveness of
internal control over financial reporting. During the course of our
testing we may identify deficiencies that we are required to remediate in order
to comply with the requirements of Section 404. In addition, if we fail to
maintain the adequacy of our internal controls, as such standards are modified,
supplemented or amended from time to time; we may not be able to ensure that we
can conclude on an ongoing basis that we have effective internal controls over
financial reporting in accordance with Section 404 of the Sarbanes-Oxley Act.
Furthermore, there are certain areas of accounting such as income tax that
involve extremely complex rules that vary by country, where an inadvertent
error, not misconduct, if undetected through effective internal control, could
be deemed a material weakness in our internal controls. Failure to maintain an
effective internal control environment could have a material adverse effect on
our stock price.
If
our products contain defects, it could expose us to litigation and harm our
revenue.
The
products we offer are complex and, despite extensive testing and quality
control, may contain errors or defects, especially when we first introduce them.
We may need to issue corrective releases of our software products to fix any
defects or errors, and to perform warranty repairs for our tools. Any defects or
errors could also cause injury to personnel and/or damage to our reputation and
result in increased costs, loss of revenue, product returns or order
cancellations, or lack of market acceptance of our products. Accordingly, any
defects or errors could have a material and adverse effect on our business,
results of operations and financial condition.
Our
license agreements with our customers typically contain provisions designed to
limit our exposure to potential product liability claims. It is possible,
however, that the limitation of liability provisions contained in our license
agreements may not be effective as a result of existing or future federal,
state, or local laws or ordinances or unfavorable judicial decisions. Although
we have not experienced any product liability claims to date, sale and support
of our products entails the risk of such claims, which could be substantial in
light of our customers’ use of such products in mission-critical applications.
If a claimant brings a product liability claim against us, it could have a
material adverse effect on our business, results of operations, and financial
condition. Our products interoperate with many parts of complicated computer
systems, such as mainframes, servers, personal computers, application software,
databases, operating systems, and data transformation software. Failure of any
one of these parts could cause all or large parts of computer systems to fail.
In such circumstances, it may be difficult to determine which part failed, and
it is likely that customers will bring a lawsuit against several suppliers. Even
if our product is not at fault, we could suffer material expense and material
diversion of management time in defending any such lawsuits.
We
are exposed to risks associated with export sales and international operations
that may limit our ability to generate revenue from our products and
intellectual property.
We have
established operations in certain parts of Europe and Asia and may continue to
expand our international presence in order to increase our export sales. Export
sales to international customers and maintaining operations in foreign countries
entail a number of risks, including, but not limited to:
|
•
|
obtaining
and enforcing intellectual property rights under a variety of foreign
laws;
|
|
•
|
unexpected
changes in, or impositions of, legislative or regulatory
requirements;
|
|
•
|
delays
resulting from difficulty in obtaining export licenses for certain
technology, and tariffs, quotas, and other trade barriers and
restrictions;
|
|
•
|
longer
payment cycles and greater difficulty in accounts receivable
collection;
|
|
•
|
potentially
adverse taxes;
|
|
•
|
currency
exchange fluctuations;
|
|
•
|
greater
difficulties in maintaining and enforcing United States accounting and
public reporting standards;
|
|
•
|
greater
difficulties in staffing and managing foreign operations;
and
|
|
•
|
the
burdens of complying with a variety of foreign
laws.
|
We are
also subject to general geopolitical risks in connection with international
operations, such as political, social and economic instability, terrorism,
potential hostilities, changes in diplomatic and trade relationships, and
disease outbreaks. Although to date we have not experienced any material adverse
effect on our operations as a result of such regulatory, geopolitical, and other
factors, we cannot assure investors that such factors will not have a material
adverse effect on our business, financial condition, and operating results or
require us to modify our current business practices.
We
use hazardous materials in our business, and any claims relating to improper
handling, storage, or disposal of these materials could subject us to
significant liabilities.
Our HPR
business involves the use of a broad range of hazardous chemicals and materials.
Environmental laws impose stringent civil and criminal penalties for improper
handling, disposal and storage of these materials. We cannot completely
eliminate the risk of accidental contamination or injury from the handling,
disposal or storage of these materials. In the event of an improper or
unauthorized release of, or exposure of individuals to, hazardous materials, we
could be subject to civil damages due to personal injury or property damage
caused by the release or exposure and the resulting liability could exceed our
resources. A failure to comply with environmental laws could result in fines and
the revocation of environmental permits, which could prevent us from conducting
our business. Accordingly, any violation of environmental laws or failure to
properly handle, store, or dispose of hazardous materials could result in
restrictions on our ability to operate our business and could require us to
incur potentially significant costs for personal injuries, property damage and
environmental clean-up and remediation.
Compliance
with current and future environmental regulations may be costly, which could
impact our future earnings.
We are
subject to environmental and other regulations due to our production and
marketing of products in certain states and countries. We also face increasing
complexity in our product design and procurement operations as we adjust to new
and upcoming requirements relating to the materials composition of our products,
including the restrictions on lead and certain other substances in electronics
that apply to specified electronics products put on the market in the European
Union as of July 1, 2006 (Restriction of Hazardous Substances in Electrical and
Electronic Equipment Directive (EU RoHS)). The European Union has also finalized
the Waste Electrical and Electronic Equipment Directive (WEEE), which makes
producers of electrical goods financially responsible for specified collection,
recycling, treatment and disposal of past and future covered products. Other
countries, such as the United States, China and Japan, have enacted or may enact
laws or regulations similar to the EU RoHS or WEEE Legislation. These and other
environmental regulations may require us to reengineer certain of our existing
policies and procedures to comply with environmental regulations.
Our
primary facilities are located near known earthquake fault zones, and the
occurrence of an earthquake or other disaster could cause damage to our
facilities and equipment, could cause us to cease or curtail our
operations.
Our main
U.S. facilities are located in the Silicon Valley near known earthquake fault
zones and are vulnerable to damage from earthquakes. In October 1989, a major
earthquake struck this area, causing significant property damage and a number of
fatalities. We are also vulnerable to damage from other types of disasters,
including fire, floods, power outages or losses, communications failures, and
similar events. If any disaster were to occur, our ability to operate our
business at our facilities would be seriously, or potentially completely,
impaired. In addition, the unique nature of our research activities and of much
of our equipment could make it difficult for us to recover from a disaster. We
do not carry earthquake insurance on the property that we own and the insurance
we do maintain may not be adequate to cover our losses resulting from disasters
or other business interruptions. Accordingly, an earthquake or other disaster
could materially and adversely harm our business and operating
results.
Provisions
of our charter documents may have anti-takeover effects that could prevent a
change in our control, even if this would be beneficial to
stockholders.
Provisions
of our amended and restated certificate of incorporation, bylaws, and Delaware
law could make it more difficult for a third party to acquire us, even if doing
so would be beneficial to our stockholders. These provisions
include:
|
•
|
a
classified Board of Directors, in which our board is divided into three
classes with three-year terms with only one class elected at each annual
meeting of stockholders, which means that holders of a majority of our
common stock would need two annual meetings of stockholders to gain
control of the Board;
|
|
•
|
a
provision that prohibits our stockholders from acting by written consent
without a meeting;
|
|
•
|
a
provision authorizing the issuance of “blank check” preferred stock that
could be issued by our Board of Directors to increase the number of
outstanding shares and thwart a takeover
attempt;
|
|
•
|
a
provision that permits only the Board of Directors, the President or the
Chairman to call special meetings of stockholders;
and
|
|
•
|
a
provision that requires advance notice of items of business to be brought
before stockholders meetings.
|
These
provisions can be amended only with the vote of the holders of 66 2/3% of our
outstanding capital stock.
ITEM 1B. UNRESOLVED STAFF COMMENTS
None.
ITEM 2. PROPERTIES
Our
facilities currently consist of approximately 264,000 square feet of office,
research and manufacturing space in California, New Jersey and Oregon, as well
as Japan, Switzerland, France, Germany and Sweden. We own an approximately
39,000 square-foot building at 3100 Central Expressway, Santa Clara, California
which consists of office and laboratory space. The remaining properties consist
of office, manufacturing and laboratory spaces leased to us under lease
agreements that expire from 2010 to 2016. While our facilities are shared
between our business units, much of our Software business unit is housed in our
San Ramon, California and Bend, Oregon facilities, with much of our corporate
staff located in Sunnyvale, California. A closing condition of the Divestiture
Agreement is that HPR Global will sublease from us all of the
Sunnyvale, California facility currently devoted to the tools portion of HPR,
and our office in Geneva, Switzerland. We believe our existing
properties, including both owned and leased sites, are in good condition and are
adequate to meet our current and reasonably foreseeable future
requirements.
ITEM 3. LEGAL PROCEEDINGS
Not
applicable.
ITEM 4. SUBMISSION OF MATTERS TO A VOTE OF SECURITY
HOLDERS
Not
applicable.
PART
II
ITEM 5. MARKET FOR REGISTRANT’S COMMON EQUITY, RELATED
STOCKHOLDER MATTERS AND ISSUER PURCHASES OF EQUITY SECURITIES
Our
common stock is traded on the NASDAQ Global Select Market under the symbol
“SMMX.” The following table sets forth, for the period indicated, the low and
high closing prices per share for our common stock as reported by the NASDAQ
Global Select Market.
|
HIGH
|
LOW
|
|||||||
|
2008
|
||||||||
|
First
Quarter
|
$ | 8.18 | $ | 6.19 | ||||
|
Second
Quarter
|
$ | 8.40 | $ | 6.93 | ||||
|
Third
Quarter
|
$ | 12.24 | $ | 6.59 | ||||
|
Fourth
Quarter
|
$ | 9.51 | $ | 3.03 | ||||
|
2009
|
||||||||
|
First
Quarter
|
$ | 5.92 | $ | 2.45 | ||||
|
Second
Quarter
|
$ | 6.57 | $ | 3.73 | ||||
|
Third
Quarter
|
$ | 6.99 | $ | 5.88 | ||||
|
Fourth
Quarter
|
$ | 6.92 | $ | 4.07 | ||||
As of
February 23, 2010, there were approximately 89 holders of record of our common
stock.
Dividend
Policy
We have
not declared or paid any dividends on our common stock since our inception and
we currently intend to retain all future earnings, if any, to use in our
business. Further, under the terms of our credit agreement with Bank of America,
N.A., we are restricted from making any cash dividend payments. Accordingly, we
do not anticipate paying any cash dividends in the foreseeable
future.
Stock
Performance Graph
The
following graph compares the cumulative total stockholder return on our common
stock with the cumulative total return for each of the NASDAQ composite and the
S&P Biotechnology index for the 5-year period ended December 31, 2009. The
stock price performance shown on the graph below is not necessarily indicative
of future price performance.
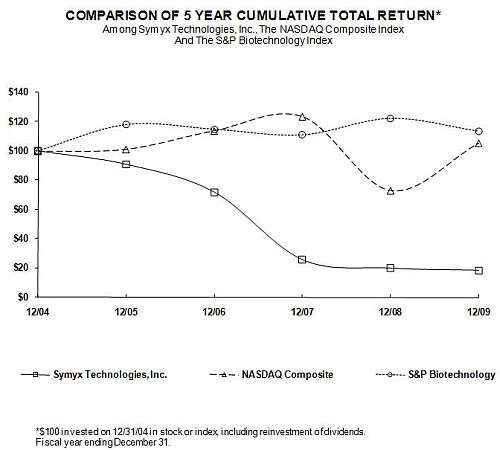
| 12/04 | 12/05 | 12/06 | 12/07 | 12/08 | 12/09 | |||||||||||||||||||
|
Symyx
Technologies, Inc.
|
100.00 | 90.82 | 71.85 | 25.56 | 19.77 | 18.30 | ||||||||||||||||||
|
NASDAQ
Composite
|
100.00 | 101.33 | 114.01 | 123.71 | 73.11 | 105.61 | ||||||||||||||||||
|
S&P
Biotechnology
|
100.00 | 118.28 | 115.04 | 111.10 | 122.56 | 113.66 |
ITEM 6. SELECTED FINANCIAL DATA
The
financial information as of December 31, 2009 and 2008 and for each of the three
years in the period ended December 31, 2009 is derived from audited financial
statements included elsewhere in this Annual Report on Form 10-K. The table
should be read in conjunction with Item 7, "Management's Discussion and Analysis
of Financial Condition and Results of Operations," and Item 8, "Financial
Statements and Supplementary Data."
|
(In
thousands, except per share data)
|
For
the Years Ended December 31,
|
|||||||||||||||||||
|
Consolidated
Statements of Operations Data:
|
2009
|
2008
|
2007
|
2006
|
2005
|
|||||||||||||||
|
Revenue:
|
||||||||||||||||||||
|
Service
|
$ | 70,542 | $ | 74,892 | $ | 59,034 | $ | 57,933 | $ | 56,980 | ||||||||||
|
Product
|
23,888 | 25,033 | 34,898 | 33,526 | 26,663 | |||||||||||||||
|
License
fees, content and royalties
|
56,016 | 59,120 | 31,140 | 33,441 | 24,494 | |||||||||||||||
|
Total
revenue
|
150,446 | 159,045 | 125,072 | 124,900 | 108,137 | |||||||||||||||
|
Costs
of revenue:
|
||||||||||||||||||||
|
Cost
of service
|
26,012 | 21,094 | 8,995 | 6,519 | 3,826 | |||||||||||||||
|
Cost
of products
|
10,806 | 10,444 | 14,281 | 11,811 | 11,090 | |||||||||||||||
|
Cost
of license fees, content and royalties
|
5,649 | 5,876 | 1,773 | - | - | |||||||||||||||
|
Amortization
of intangible assets
|
5,909 | 7,355 | 3,873 | 2,571 | 2,252 | |||||||||||||||
|
Total
costs of revenue
|
48,376 | 44,769 | 28,922 | 20,901 | 17,168 | |||||||||||||||
|
Gross
profit
|
102,070 | 114,276 | 96,150 | 103,999 | 90,969 | |||||||||||||||
|
Operating
expenses:
|
||||||||||||||||||||
|
Research
and development
|
52,350 | 75,365 | 66,186 | 59,268 | 47,151 | |||||||||||||||
|
Sales,
general and administrative
|
45,071 | 54,589 | 41,935 | 34,497 | 25,249 | |||||||||||||||
|
Restructuring
charges
|
2,578 | 4,952 | - | - | - | |||||||||||||||
|
Impairment
to goodwill, intangibles and other long-lived assets
|
327 | 90,330 | - | - | - | |||||||||||||||
|
Acquired
in-process research and development
|
- | - | 2,500 | 1,392 | 1,590 | |||||||||||||||
|
Amortization
of intangible assets
|
5,791 | 5,903 | 2,253 | 1,699 | 1,263 | |||||||||||||||
|
Total
operating expenses
|
106,117 | 231,139 | 112,874 | 96,856 | 75,253 | |||||||||||||||
|
Income
(loss) from operations
|
(4,047 | ) | (116,863 | ) | (16,724 | ) | 7,143 | 15,716 | ||||||||||||
|
Gain
from sale of equity interest in Ilypsa, Inc.
|
- | 4,939 | 40,826 | - | - | |||||||||||||||
|
Loss
from sale of IntegrityBio business
|
(2,009 | ) | - | - | - | - | ||||||||||||||
|
Interest
and other income (expense), net
|
(229 | ) | 135 | 5,694 | 7,709 | 4,427 | ||||||||||||||
|
Income
(loss) before income tax benefit (expense) and equity loss
|
(6,285 | ) | (111,789 | ) | 29,796 | 14,852 | 20,143 | |||||||||||||
|
Income
tax benefit (expense)
|
5,147 | 5,173 | (10,698 | ) | (6,382 | ) | (8,141 | ) | ||||||||||||
|
Equity
in loss from investment in Visyx Technologies Inc.
|
- | - | (314 | ) | (186 | ) | - | |||||||||||||
|
Net
income (loss)
|
$ | (1,138 | ) | $ | (106,616 | ) | $ | 18,784 | $ | 8,284 | $ | 12,002 | ||||||||
|
Basic
net income (loss) per share
|
$ | (0.03 | ) | $ | (3.16 | ) | $ | 0.57 | $ | 0.25 | $ | 0.37 | ||||||||
|
Diluted
net income (loss) per share
|
$ | (0.03 | ) | $ | (3.16 | ) | $ | 0.56 | $ | 0.24 | $ | 0.35 | ||||||||
|
Shares
used in computing basic net income (loss) per share
|
34,321 | 33,747 | 33,199 | 33,199 | 32,819 | |||||||||||||||
|
Shares
used in computing diluted net income (loss) per share
|
34,321 | 33,747 | 33,557 | 34,214 | 34,564 | |||||||||||||||
|
December
31,
|
||||||||||||||||||||
|
(In
thousands)
|
2009
|
2008
|
2007
|
2006
|
2005
|
|||||||||||||||
|
Consolidated
Balance Sheet Data:
|
||||||||||||||||||||
|
Cash,
cash equivalents and marketable securities
|
$ | 81,777 | $ | 66,415 | $ | 45,472 | $ | 149,995 | $ | 168,625 | ||||||||||
|
Working
capital
|
$ | 57,391 | $ | 41,393 | $ | 40,750 | $ | 146,180 | $ | 162,237 | ||||||||||
|
Long-term
investments
|
$ | 15,147 | $ | 15,147 | $ | 13,500 | $ | 13,714 | $ | - | ||||||||||
|
Goodwill
and intangible assets
|
$ | 80,290 | $ | 93,247 | $ | 180,515 | $ | 31,657 | $ | 32,065 | ||||||||||
|
Total
assets
|
$ | 226,808 | $ | 227,585 | $ | 316,898 | $ | 260,006 | $ | 241,412 | ||||||||||
|
Total
stockholders' equity
|
$ | 156,734 | $ | 152,083 | $ | 252,241 | $ | 228,376 | $ | 218,529 | ||||||||||
ITEM 7. MANAGEMENT’S DISCUSSION AND ANALYSIS OF
FINANCIAL CONDITION AND RESULTS OF OPERATIONS
All
percentage amounts and ratios were calculated using the underlying data in
thousands. Operating results for the year ended December 31, 2009 are not
necessarily indicative of the results that may be expected for future fiscal
years. In particular, we have described our expectations with respect to the
Divestiture which, if closed, will materially impact our future
results. For purposes of this discussion and analysis in this Report,
however, we have presented our analysis (with some clarifying changes set out
below) to reflect the fact that the Divestiture has not occurred (and may not
occur). The following discussion and analysis should be read in
conjunction with our historical financial statements and the notes to those
financial statements that are included in Item 8 of Part II of this Annual
Report on Form 10-K.
Overview
Since our
inception, we have invested heavily in developing technology, laboratory systems
and software to automate, accelerate and digitize traditional R&D and pursue
high-throughput materials research. Our scientific team has deep
technical expertise. Through Symyx Software, we offer customers integrated
R&D collaboration, execution and analysis applications, and access to
scientific content and industry-leading chemical informatics, logistics and
decision-support applications. Through Symyx HPR, we historically have provided
research services to our customers and sometimes enter into longer-term, broad
technical alliances for discovery and development of new
materials. We also apply our expertise in high-throughput research
technologies to offer automated tools to enable improved R&D execution in
our customers’ laboratories.
We have
generated revenue and cash flows from operations from licensing Symyx Software,
subscriptions to certain scientific content and accompanying services and
support; from selling and supporting Symyx HPR tools; from providing research
services; and from licenses and royalties from our discovered materials and
intellectual property.
Recent
Events
Our major
recent events and their impact on our business are highlighted
below:
|
·
|
Profitability – Fourth
quarter of 2009 net profit was $1.7 million, or $0.05 per diluted share,
following the third quarter’s net profit of $1.5 million, or $0.04 per
diluted share, and reflecting the Company’s $32.5 million, or 25%,
year-over-year reduction in R&D, sales and general and administrative
expenses in 2009 relative to 2008.
|
|
·
|
Symyx Notebook 6.4 – In January 2010,
we announced the release of Symyx Notebook 6.4, offering scientists
improved support for method development, validation and execution in
regulated and non-regulated analytical labs. This latest release of
Symyx's ELN offers new cross-experiment referencing and reporting
capabilities that improve collaborative workflows for multidisciplinary
teams working in the life sciences, chemicals, energy and consumer
products industries.
|
|
·
|
Workflow Agreement with China
Petroleum & Chemical Corporation – In November 2009, we
announced a deal with China Petroleum & Chemical Corporation (Sinopec
Corp.) to supply a Zeolite Synthesis Workflow for research in energy and
chemical development. This will be Symyx’s first large-scale
implementation of a high-throughput system with a Chinese company. We
expect to assign the agreement underlying this tools sale to HPR Global in
the Divestiture.
|
|
·
|
Hosted Informatics – In
October 2009, we announced the launch of hosted informatics software to
researchers working in the pharmaceutical, biotechnology and chemical
industries and academia. The new hosted offerings, to be accessed via a
software-as-a-service business model, will combine Symyx software with
data archiving capabilities in a secure, state-of-the-art data hosting and
communications facility. The hosted informatics environment will enable
more R&D organizations to benefit from scientific software by reducing
the requirements for information technology (IT) infrastructure and
resources, lowering total cost of ownership and accelerating ELN
deployment.
|
|
·
|
October 2009 Restructuring --
In October 2009, we commenced the October 2009 Restructuring to
address underperformance in our CDMO acquired as part of the IntegrityBio
acquisition in fiscal 2008, and to address an anticipated decline in
demand for research services following the 2009 year end. In
the fourth quarter of 2009, we exited our CDMO business and began a
process to reduce HPR staffing by approximately 75 employees, representing
a 15% reduction in total Symyx headcount. We completed the majority of
these restructuring actions by December 31, 2009, and will substantially
complete the remaining balance of these actions in the first quarter of
2010.
|
|
·
|
HPR Divestiture -- On
February 11, 2010, and following an extensive sales process led by our
financial advisors, we announced the execution of a Divestiture Agreement
and the HPR Divestiture pursuant to which Symyx will divest HPR’s tools
operations and certain of our recently restructured contract research
services operations to a newly formed company, HPR Global. HPR’s
president, John S. Senaldi, resigned his employment from Symyx prior to
the signing of the Divestiture Agreement to lead the acquisition of HPR
assets as founder and chief executive officer of HPR
Global. Pursuant to the Divestiture Agreement, we will transfer
to HPR Global substantially all existing HPR physical assets and certain
intellectual property assets, including a portion of our patent portfolio
and certain components of our LEA software suite. Symyx also expects to
provide approximately $8.6 million of positive net working capital (mostly
in cash) at closing. In return, Symyx expects to receive a
$10.0 million note and common stock representing an approximately 19.5%
equity interest in HPR Global. Symyx will retain all existing rights to
royalties and licensing fees previously included in HPR, as well as
relevant patents underlying these entitlements. Finally, we anticipate HPR
Global will offer employment to substantially all current HPR employees
following the closing of the Divestiture. Symyx expects to close the
Divestiture by the end of March 2010, and to conclude certain remaining
legacy chemical research services contracts by the end of the second
quarter of 2010. As a result of these actions, Symyx expects to
conclude all HPR activities other than its ongoing license and royalty
entitlements. We believe the Divestiture will allow Symyx to operate as a
highly-focused, positive cash flow, software-only business, and to
capitalize on its strategic growth
opportunities.
|
Impairment
to Goodwill, Intangibles and Other Long-lived Assets
In the
fourth quarter of 2008, pursuant to our accounting policy, we performed an
annual impairment test of goodwill. As a result of this analysis, we concluded
that the carrying amounts of goodwill included in our Symyx Software and Symyx
HPR segments exceeded their implied fair values and recorded an impairment
charge of approximately $76.5 million, which is included in the caption
“Impairment to Goodwill, Intangibles and Other Long-Lived
Assets.” The impairment charge was determined by comparing the
carrying value of goodwill assigned to the reporting units within these segments
as of December 1, 2008, with the implied fair value of the goodwill. We
considered both the income and market approaches in determining the implied fair
value of the goodwill based upon a blended approach. The income approach uses
estimates of future operating results and cash flows of each of the reporting
units discounted at estimated discount rates ranging from 19% to 21%. The
estimates of future operating results and cash flows were principally derived
from an updated long-term financial forecast developed as part of our strategic
planning cycle conducted annually during the fourth quarter of 2008. The decline
in the implied fair value of the goodwill and resulting impairment charge was
primarily driven by the updated long-term financial forecasts, which showed
lower estimated near-term and longer-term profitability compared to estimates
developed at the time of the completion of the MDL and IntegrityBio
acquisitions. Refer to Note 1 of the Notes to Consolidated Financial
Statements for further details.
In the
fourth quarter of 2008, due to the significant decline of our market
capitalization, we also performed an impairment test of long-lived assets. As a
result of this analysis, we concluded that the carrying amounts of intangibles
and other long-lived assets in Symyx HPR segments exceeded their implied fair
values and recorded an impairment charge of approximately $13.8 million, which
is also included in the caption “Impairment to Goodwill, Intangibles and Other
Long-Lived Assets.”
No
material impairment charges were recorded in 2009.
Integrity
Biosolution, LLC
On August
13, 2008, we acquired IntegrityBio, a privately-held research service company
based in Camarillo, California for approximately $10.2 million, with additional
contingent consideration as described below.
In
accordance with the authoritative guidance issued by the Financial Accounting
Standards Board (FASB) on business combinations, we allocated the purchase price
to the tangible assets, liabilities and intangible assets acquired, based on
their estimated fair values. The excess purchase price over the fair values was
recorded as goodwill. The fair value assigned to intangible assets acquired was
based on estimates and assumptions determined by management. The acquired
goodwill was assigned entirely to our research business. Purchased intangibles
with finite lives are amortized on a straight-line basis over their respective
useful lives.
The total
cash purchase price for this acquisition was $10.2 million, including working
capital adjustments of $0.6 million paid in January 2009, and $0.2 million in
transaction costs, consisting of legal and other professional service
fees.
The
purchase price allocation is as follows (in thousands):
|
Amount
|
||||
|
Fair
value of net assets acquired
|
$ | 1,948 | ||
|
Intangible
assets
|
2,860 | |||
|
Goodwill
|
5,440 | |||
|
Total
|
$ | 10,248 | ||
The fair
values of IntegrityBio’s net assets as of the acquisition date were (in
thousands):
|
Amount
|
||||
|
Cash
|
$ | 32 | ||
|
Accounts
receivable
|
789 | |||
|
Plant,
property and equipment
|
1,379 | |||
|
Accounts
payable and other accrued liabilities
|
(127 | ) | ||
|
Accrued
compensation
|
(47 | ) | ||
|
Deferred
revenue
|
(78 | ) | ||
|
Fair
value of IntegrityBio's net assets
|
$ | 1,948 | ||
In
October 2009, to address underperformance in our CDMO operations acquired as
part of the IntegrityBio acquisition, and to address the anticipated decline in
the demand for research services after 2009, we exited our CDMO operations and
commenced a plan to reduce our HPR staffing by approximately 75 employees,
representing a 15% reduction in our total current headcount. We completed the
majority of these restructuring actions by December 31, 2009, and will
substantially complete the remaining balance of these actions in the first
quarter of 2010. In the fourth quarter of 2009, we sold all the tangible and
intangible assets acquired during the IntegrityBio acquisition and recorded a
total loss of $2.0 million.
Acquisition
of MDL Group Companies
On
October 1, 2007, we acquired MDL for $123 million in cash. Of the $123 million
cash paid, the parties placed $10 million in escrow pending the final
determination of any detriments suffered or benefits enjoyed by MDL as a result
of pre-closing intercompany transactions between certain MDL group companies and
the seller. The escrow account (including interest earned) was subsequently
settled in 2009, resulting in a distribution of $6.6 million to Symyx (including
$5.0 million in working capital adjustments, a $1.3 million tax reimbursement
and a $325,000 reimbursement for professional fees) and the remaining balance to
the seller of MDL.
The
purchase price for this acquisition was $121.5 million, consisting of
approximately $118.0 million in cash and $3.5 million in transaction costs,
consisting of banking, legal and other professional service. The purchase price
allocation is as follows (in thousands):
|
Amount
|
||||
|
Fair
value of net liabilities assumed
|
$ | (5,605 | ) | |
|
Accrued
restructuring costs
|
(6,823 | ) | ||
|
In-process
research and development
|
2,500 | |||
|
Intangible
assets
|
59,000 | |||
|
Deferred
tax liabilities
|
(22,428 | ) | ||
|
Goodwill
|
95,150 | |||
|
Total
|
$ | 121,794 | ||
The fair
values of MDL’s net liabilities as of the acquisition date were (in
thousands):
|
Amount
|
||||
|
Accounts
receivable, net
|
$ | 4,417 | ||
|
Prepaids
and other assets
|
3,549 | |||
|
Plant,
property and equipment
|
4,851 | |||
|
Accounts
payable and other accrued liabilities
|
(2,046 | ) | ||
|
Accrued
compensation
|
(4,961 | ) | ||
|
Deferred
revenue
|
(10,404 | ) | ||
|
Fair
value of MDL’s net liabilities
|
$ | (4,594 | ) | |
Goodwill
from the MDL acquisition is not deductible for federal income tax purposes and
partially deductible for state income tax purposes.
Critical
Accounting Policies
We
prepare our financial statements and accompanying notes in accordance with
generally accepted accounting principles in the United States (GAAP). Note 1 of
the Notes to Consolidated Financial Statements included under Item 7 in
this Annual Report on Form 10-K describes the significant accounting policies
and methods used in the preparation of the consolidated financial statements.
Preparing financial statements and related disclosures requires management to
exercise judgment in making estimates and assumptions that affect the reported
amounts of assets, liabilities, revenue and expenses. These estimates and
assumptions are affected by management’s application of accounting policies.
Estimates include assumptions such as the elements comprising a revenue
arrangement, including the distinction between software upgrades/enhancements
and new products, when our products achieve technological feasibility, the
assumptions used in determining the implied fair value of goodwill, intangibles
and other long-lived assets, assumptions used to determine the stock-based
compensation of our equity awards, including the volatility rate and the
forfeiture rates for stock-based awards, reserve for excess or obsolete
inventory, future warranty expenditures, significant management judgment
required in determining the provision for income taxes, deferred tax assets and
liabilities and any valuation allowance recorded against net deferred tax
assets, the potential outcome of future tax consequences of events recognized in
the our financial statements or tax returns, the foreign currency rate used in
determining the effect of foreign currency exchange rate fluctuation on our
financial statements and the accounting policies adopted to defer costs
associated with various contracts. We evaluate our estimates,
including those mentioned above, on an ongoing basis. We base our estimates on
historical experience and on various other assumptions that we believe to be
reasonable under the circumstances, the results of which form our basis for
making judgments about the carrying value of assets and liabilities that are not
readily apparent from other sources. Actual results may differ from
those estimates under different assumptions or conditions.
Source
of Revenue and Revenue Recognition Policy
We
generate revenue from services provided under research collaborations, the sale
of products, license of software, content subscriptions, provision of support
and maintenance services, and the license of intellectual property. It is
possible for our customers to work with us in multiple areas of our business and
contracts may include multiple elements of service revenue, product revenue, and
license and royalty revenue. In determining the basis for non-software product
revenue recognition, we first determine the fair value of any extended warranty
services and defer this revenue to be recognized over the service period. For
those contracts that involve multiple element deliverables, we identify all
deliverables and allocate revenue among the units of accounting. In an
arrangement that includes software that is more than incidental to the products
or services as a whole, we recognize revenue from the software and
software-related elements, as well as any non-software deliverable(s) for which
a software deliverable is essential to its functionality, in accordance with the
authoritative guidance on software revenue recognition.
Service
Revenue
We
recognize revenue from research agreements, software consulting agreements, and
support and maintenance agreements as earned upon performance of the services
specified in the agreements. Payments received that are related to future
performance are deferred and recognized as revenue as the performance
requirements are fulfilled.
Non-refundable
up-front payments received in connection with research and development
collaboration agreements, including technology access fees, are deferred and
recognized as earned upon performance of the services over the relevant periods
specified in the agreement, generally the research term. Research revenue is
either recognized as research service time is delivered to the customer or as
the results of research experiments are delivered to the customer over the term
of the agreement. Revenue from milestone payments, which are substantially at
risk until the milestones are completed, is recognized upon completion of these
milestone events. Milestone payments to date have been immaterial.
Revenue
allocable to support and maintenance is recognized on a straight-line basis over
the period the support and maintenance is provided. Our software licenses may
provide for technical support, bug fixes and rights to unspecified upgrades on a
when-and-if-available basis for periods defined within the contract. Revenue
related to this customer support and maintenance is deferred and recognized over
the term of the contracted support.
For many
customers, we have developed custom registration and other tools that are
typically delivered on a time and materials basis. These custom development
projects are generally not sold in connection with a new software license deal,
but rather to customers that have been using our software products for an
extended period of time. Revenue from these arrangements is usually recognized
on a monthly basis as the services are delivered and invoiced.
Product
Sales
We
recognize revenue from the sale of Symyx HPR tools and the license of associated
software, and all related costs of products sold are expensed, once delivery has
occurred and customer acceptance has been achieved. A determination is made for
each system delivered as to whether software is incidental to the system as a
whole. Revenue from the sale of HPR tools is earned and recognized when
persuasive evidence of an arrangement exists, delivery of the product has
occurred, no significant obligations with regard to implementation remain, the
fee is fixed or determinable, and collectibility is reasonably assured. If there
are extended payment terms, we recognize product revenue as these payments
become due. We consider all arrangements with payment terms extending beyond 12
months not to be fixed or determinable. If the fee is not fixed or determinable,
revenue is recognized as payments become due from the customer. In multiple
element arrangements, we use the residual method to allocate revenue to
delivered elements once we have established fair value for all undelivered
elements. A warranty expense accrual is established at the time of delivery for
all tool sales.
Software
License and Database Content Fees
For
database content and software licensed on an annual right to use basis, revenue
is recognized on a straight-line basis over the term of the license. For revenue
allocable to the software portion of a multiple element arrangement or licensed
on a perpetual basis, we recognize revenue upon delivery of the software product
to the end-user and commencement of the license, unless we have ongoing
obligations for which fair value cannot be established or the fee is not fixed
or determinable or collectibility is not probable, in which case we recognize
revenue only when each of these criteria have been met. By way of example, for
our ELN software products and the software products we acquired from MDL, we
have not yet established the fair value of certain ongoing obligations and
accordingly, any perpetual license fees are recognized ratably over the period
of the ongoing obligations (typically a bundled support and maintenance
commitment of one year). The only software product for which we have established
Vendor Specific Objective Evidence of fair value is our LEA software product
maintenance and annual licenses. We consider all arrangements with payment terms
longer than 12 months not to be fixed or determinable. If the fee is not fixed
or determinable, revenue is recognized as payments become due from the customer.
If evidence of the fair value of one or more undelivered elements does not
exist, the total revenue is deferred and recognized when delivery of those
elements occurs, or when fair value for any remaining undelivered elements can
be established, or when
the only remaining undelivered elements are post-contract customer support,
which we will recognize ratably over the term of support.
Intellectual
Property License Fees and Royalties
We
recognize license fee revenue for licenses to our intellectual property when
earned under the terms of the agreements. Generally, revenue is recognized upon
transfer of the license unless we have continuing obligations for which fair
value cannot be established, in which case the revenue is recognized over the
period of the obligation. If there are extended payment terms, we recognize
license fee revenue as these payments become due. We consider all arrangements
with payment terms extending beyond 12 months not to be fixed or determinable.
In certain licensing arrangements there is provision for a variable fee as well
as a non-refundable minimum amount. In such arrangements, the amount of the
non-refundable minimum guarantee is recognized upon transfer of the license
unless we have continuing obligations for which fair value cannot be
established, and the amount of the variable fee in excess of the guaranteed
minimum is recognized as revenue when it is fixed or determinable.
We
recognize royalty revenue based on reported sales by third party licensees of
products containing our materials and intellectual property. If there are
extended payment terms, royalty revenue is recognized as these payments become
due. Non-refundable royalties, for which there are no further performance
obligations, are recognized when due under the terms of the
agreements.
See Note
1 of the Notes to Consolidated Financial Statements for a further discussion of
our revenue recognition policies.
Goodwill,
Intangible Assets and Other Long-Lived Assets
We test
goodwill of our reporting units for impairment annually during our fourth
quarter or whenever events occur or circumstances change, such as an adverse
change in business climate or a decline in the overall industry, that would more
likely than not reduce the fair value of a reporting unit below its carrying
amount. Based on the evaluation of the operating segments in 2008, we allocated
goodwill into three reporting units: Symyx Software and Symyx Research and Symyx
Tools. Symyx Research and Symyx Tools comprised the Symyx HPR operating
segment.
In 2009,
due to the change in Symyx’s business and therefore combination of Symyx
Research and Symyx Tools within the HPR operating segment, we allocated goodwill
into two reporting units: Symyx Software and Symyx HPR, consistent with our
segment disclosure described in Note 6 of the Notes to Consolidated Financial
Statements.
We test
other long-lived assets, including property, equipment and leasehold
improvements and other intangible assets subject to amortization, for
recoverability whenever events or changes in circumstances indicate that the
carrying value of those assets may not be recoverable.
In
estimating the fair value of the reporting units with recognized goodwill for
the purposes of our annual or periodic analyses, we make estimates and judgments
about the future cash flows of these reporting units. Our cash flow forecasts
are based on assumptions that are consistent with the plans and estimates we are
using to manage the underlying reporting units. In addition, we make certain
judgments about allocating shared assets such as accounts receivable and
property, plant and equipment to the estimated balance sheet for those reporting
units. We also consider our market capitalization (adjusted for unallocated
monetary assets such as cash, marketable debt securities and debt) on the date
we perform the analysis.
In 2008,
we recorded an impairment charge of $90.3 million to goodwill, intangible assets
and other long-lived assets. See further discussion in Note 1 of the Notes to
Consolidated Financial Statements.
In 2009,
we recorded an additional impairment charge of $327,000 to goodwill in
connection with the IntegrityBio additional consideration as discussed in Note 1
of the Notes to Consolidated Financial Statements.
Stock-Based
Compensation
Our
stock-based compensation expense is estimated at the grant date based on the
award’s fair value as calculated by the Black-Scholes-Merton (BSM)
option-pricing model and is recognized as expense over the requisite service
period. The BSM model requires various highly judgmental assumptions including
expected volatility and option life. We estimated volatility using historical
stock price information. We estimated option life using simplified method. If
any of the assumptions used in the BSM model change significantly, stock-based
compensation expense may differ materially in the future from that recorded in
the current period. In addition, we are required to estimate the expected
forfeiture rate and only recognize expense for those shares expected to vest. We
estimate the forfeiture rate based on historical experience. To the extent our
actual forfeiture rate is different from our estimate, stock-based compensation
expense is adjusted accordingly. Included in cost and operating expenses is
stock-based compensation expense recognized in our results of operations for the
years ended December 31, 2009, 2008, and 2007 as follows (in
thousands):
|
2009
|
2008
|
2007
|
||||||||||
|
Costs
of revenue
|
$ | 361 | $ | 227 | $ | 294 | ||||||
|
Research
and development
|
1,183 | 1,396 | 2,627 | |||||||||
|
Sales,
general and administrative
|
2,856 | 2,745 | 2,796 | |||||||||
|
Total
|
$ | 4,400 | $ | 4,368 | $ | 5,717 | ||||||
Write-downs
for Excess and Obsolete Inventory
We carry
our inventory at the lower of cost or market, cost generally being determined on
a specific identification basis. We apply judgment in determining the provisions
for slow-moving, excess and obsolete inventories based on historical experience
and anticipated product demand. In 2009, 2008 and 2007, we wrote-down $562,000,
$1.2 million and $396,000 of excess and obsolete inventory,
respectively.
Reserves
for Warranties
A
warranty expense accrual is established at the time of customer acceptance of a
Symyx tools system and is included as a cost of product sold. Management is
required to exercise judgment in establishing the appropriate level of warranty
expense accrual for each Symyx tools system delivered. Factors that affect our
warranty liability include the number of installed units, historical and
anticipated rates of warranty claims, and cost per claim. The actual results
with regard to warranty expenditures could have a material impact on our
financial statements. When actual warranty costs are anticipated to be higher
than our original estimates, an additional expense is charged to cost of
products sold in the period in which such a determination is made. When actual
warranty costs are lower than our original estimates, the difference will have a
favorable impact to cost of products sold at the time the warranty expires for
the systems. In 2009, 2008, and 2007, we recorded favorable adjustments to
warranty expense of approximately $596,000, $699,000 and $128,000, respectively.
At
the end of 2009, we performed a detailed analysis of our reserves for warranties
and believed it was a reasonable estimate of future warranty costs for existing
tools. With the closing of the Divestiture, HPR Global is expected to assume
these warranty liabilities.
Accounting
for Income Taxes
Income
taxes have been provided using the liability method. A deferred tax asset or
liability is determined based on the difference between the financial statement
and tax basis of assets and liabilities as measured by the enacted tax rates
that will be in effect when these differences reverse. We use various
assumptions in calculating the estimated deductions and benefit and research
expense credits, etc. We also recognize the impact of an uncertain income tax
position on the income tax return at the largest amount that is
more-likely-than-not to be sustained upon audit by the relevant taxing authority
accordingly to the authoritative guidance on accounting for uncertainty in
income taxes. An uncertain income tax position will not be recognized
if it has less than a 50% likelihood of being sustained. We consider the
realizability of deferred tax assets and record valuation allowances when
uncertainties related to the realization of such net deferred tax assets exist.
In 2008, we recorded a valuation allowance of $12.5 million against deferred tax
assets that are less than 50% likely to be recognized. In 2009, due to the
changes of circumstances as discussed under the heading “Provision for Income
Taxes” in this section, we released federal valuation allowance of $3.0
million.
Foreign
Currency Translation
We
translate the assets and liabilities of our international non-U.S. dollar
functional currency subsidiaries into U.S. dollars at the rates of exchange in
effect on the balance sheet date. Revenue and expenses are translated using
rates that approximate those in effect during the period. Translation
adjustments are included in stockholders’ equity in the Consolidated Balance
Sheet caption “Accumulated other comprehensive income.” Currency transaction
losses derived from monetary assets and liabilities stated in a currency other
than the functional currency and recognized in results of operations were
$410,000, $2.0 million, and $162,000 for the years ended December 31, 2009, 2008
and 2007, respectively. The effect of foreign currency rate changes on cash and
cash equivalents was an increase of $86,000 in 2009 and decreases of $172,000,
and $498,000 in the years ended December 31, 2008 and 2007,
respectively.
Deferred
Costs
Occasionally
we enter into software consulting service and tools product arrangements under
which all the revenue is deferred until certain elements of the arrangements are
delivered in the future. Management considers the guidance under which the
revenue recognition falls to determine the cost recognition, as well as the
realizability, of the deferred cost. Management believes recognizing deferred
costs in the same period that revenue is recognized will provide investors a
clearer view of the profitability of the contracts. As a result, we defer the
direct variable expense, not exceeding the revenue deferred, in other current
assets on the balance sheet until the period when revenue is recognized. Direct
and incremental variable expenses include direct labor costs and direct services
contracts with third parties working on the software service arrangements. As of
December 31, 2009 and 2008, we deferred approximately $880,000 and $2.2 million,
respectively, of direct and incremental variable expenses related to software
consulting service and tools product arrangements where the revenue is deferred
until future periods.
Results
of Operations
Revenue
|
2009
|
2008
|
2007
|
||||||||||||||||||
|
(in
thousands, except for percentages)
|
Amount
|
Change
over Previous Year
|
Amount
|
Change
over Previous Year
|
Amount
|
|||||||||||||||
|
Service
|
$ | 70,542 | (6 | %) | $ | 74,892 | 27 | % | $ | 59,034 | ||||||||||
|
Product
|
23,888 | (5 | %) | 25,033 | (28 | %) | 34,898 | |||||||||||||
|
License
fees, content and royalties
|
56,016 | (5 | %) | 59,120 | 90 | % | 31,140 | |||||||||||||
|
Total
revenue
|
$ | 150,446 | (5 | %) | $ | 159,045 | 27 | % | $ | 125,072 | ||||||||||
Total
revenue declined from 2008 to 2009 primarily due to lower consulting service
revenue in Symyx Software as customers reduced their consulting projects, lower
service revenue in HPR due to the expiration of our primary agreement with
ExxonMobil in May 2008, and lower content revenue.
Total
revenue increased 27% from 2007 to 2008 due to the increase in Symyx Software
revenue from the MDL acquisition in October 2007, partially offset by a decrease
in research revenue from ExxonMobil and, to a lesser extent, Dow, pursuant to
their respective alliance agreements with Symyx, and lower HPR tools revenue as
tools came under pressure in the second half due to customer delays and
cancellations in a worsening economy.
Revenue
is attributed to the following geographic locations based on the physical
location of our customers (as a percentage of total revenue in the respective
periods):
|
2009
|
2008
|
2007
|
||||||||||
|
United
States
|
62 | % | 64 | % | 88 | % | ||||||
|
Europe
|
27 | % | 26 | % | 9 | % | ||||||
|
Asia
|
10 | % | 9 | % | 3 | % | ||||||
|
Rest
of the World
|
1 | % | 1 | % | * | |||||||
|
Total
|
100 | % | 100 | % | 100 | % | ||||||
|
*
Less than 1%
|
||||||||||||
International
revenue increased significantly in 2008 and 2009 when compared to 2007 due to
the MDL acquisition, which significantly expanded our life sciences customer
base and increased our presence in Europe and in Japan.
The following table lists our major
customers for the years ended December 31, 2009, 2008 and 2007 and revenue
generated from these customers as a percentage of our total revenue in the
respective periods. We expect that a significant portion of our revenue will
continue to be generated from a few key customers, though with the MDL
acquisition we substantially reduced the concentration of our customer
base.
|
2009
|
2008
|
2007
|
||||||||||
|
ExxonMobil
|
9 | % | 15 | % | 29 | % | ||||||
|
Dow
|
17 | % | 18 | % | 28 | % | ||||||
|
Total
|
26 | % | 33 | % | 57 | % | ||||||
For 2010,
with the divestiture of our HPR business unit, we expect both Dow and ExxonMobil
will account for less than 10% of total revenue (mostly software revenue)
because the majority of ExxonMobil and Dow revenue was included in the HPR
business unit.
The
following depicts revenue by business segments:
|
2009
|
2008
|
2007
|
||||||||||||||||||
|
(in
thousands, except for percentages)
|
Amount
|
Change
over Previous Year
|
Amount
|
Change
over Previous Year
|
Amount
|
|||||||||||||||
|
Symyx
Software
|
$ | 88,607 | (6 | %) | $ | 94,200 | 195 | % | $ | 31,893 | ||||||||||
|
Symyx
HPR
|
61,839 | (5 | %) | 64,845 | (30 | %) | 93,179 | |||||||||||||
|
Total
|
$ | 150,446 | (5 | %) | $ | 159,045 | 27 | % | $ | 125,072 | ||||||||||
Symyx
Software generates revenue primarily from the licensing of software, including
our ELN and LEA products and the Isentris platform, content subscriptions, and
providing associated support, maintenance and consulting services.Symyx Software revenue decreased from 2008 to
2009 due primarily to lower software consulting service revenue as our customers
reduced their software consulting projects, partially offset by increase in
software maintenance revenue as we continue to expand our customer base. Symyx
Software revenue increased from 2007 to 2008, driven by products acquired
through the MDL acquisition and related services.
Symyx HPR
generates revenue primarily from providing directed and collaborative research
services and selling tools and associated services, and to a lesser extent,
licensing materials and intellectual property. The decrease in Symyx HPR revenue
in 2009 from 2008 resulted from the decrease in service revenue, product sales
and maintenance revenue, slightly offset by increased royalties and license
fees. The decrease in Symyx HPR revenue in 2008 from 2007 resulted from the
decrease in service revenue, product sales and license fees. The decrease of
Symyx HPR service revenue was driven primarily by the expiration of the
collaborative research component of our alliance with ExxonMobil on May 31,
2008. In addition, the decrease in product sales revenue in 2008 compared to
2007 was primarily due to customer delays and cancellations in the second half
of the year and, to a lesser degree, lower tools revenues for the year from
ExxonMobil and Dow versus the prior year. During the years ended December 31,
2009, 2008 and 2007, we shipped 19, 18 and 41 tools, respectively, to chemical,
life science, academic and other customers.
As a
result of the Divestiture, we expect our revenue in 2010 to be materially below
our revenue for 2009.
Costs
of Revenue
|
2009
|
2008
|
2007
|
||||||||||||||||||
|
(in
thousands, except for percentages)
|
Amount
|
Change
over Previous Year
|
Amount
|
Change
over Previous Year
|
Amount
|
|||||||||||||||
|
Costs
of revenue:
|
||||||||||||||||||||
|
Cost
of service
|
$ | 26,012 | 23 | % | $ | 21,094 | 135 | % | $ | 8,995 | ||||||||||
|
Cost
of products
|
10,806 | 3 | % | 10,444 | -27 | % | 14,281 | |||||||||||||
|
Cost
of license fees, content and royalties
|
5,649 | -4 | % | 5,876 | 231 | % | 1,773 | |||||||||||||
|
Amortization
of intangible assets
|
5,909 | -20 | % | 7,355 | 90 | % | 3,873 | |||||||||||||
|
Total
costs of revenue
|
$ | 48,376 | 8 | % | $ | 44,769 | 55 | % | $ | 28,922 | ||||||||||
Total
costs of revenue represented 32%, 28% and 23%, respectively, of total revenue
for 2009, 2008 and 2007. The increase in costs of revenue as a percentage of
total revenue in 2009 from 2008 was due primarily to incremental expenses from
the HPR formulations business resulting from our IntegrityBio acquisition, which
as a service business not at scale, had substantially lower margins than our
other business lines. To address underperformance in CDMO, and to
address the anticipated decline in research services following the December 2009
expiration of research commitments from Dow and ExxonMobil, we announced the
October 2009 Restructuring plan as detailed in Note 13 of the Notes to
Consolidated Financial Statements. The increase in costs of revenue as a
percentage of total revenue in 2008 from 2007 was due primarily to the
substantial increase in software consulting services in 2008 following the
October 2007 acquisition of MDL.
The table
below depicts the gross profit margin by each revenue category:
|
2009
|
2008
|
2007
|
||||||||||
|
Cost
of service as a percentage of service revenue
|
37 | % | 28 | % | 15 | % | ||||||
|
Cost
of products as a percentage of product sales
|
45 | % | 42 | % | 41 | % | ||||||
|
Cost
of license fees, content and royalties as a percentage of license fees,
content and royalties revenue
|
10 | % | 10 | % | 6 | % | ||||||
Cost of
service includes certain operating expenses related to software consulting and
software and hardware maintenance and costs associated with research services
for life science and chemical and energy industries. Cost of service increased
from 2008 to 2009 due to the incremental costs from the acquisition of
IntegrityBio in August 2008, increase in research service costs for new research
contracts (in contrast, under our alliance arrangements, a substantial component
of the costs to perform research was recorded as R&D expense). Cost of
service increased significantly from 2007 to 2008 primarily due to the
substantial increase in software consulting services in 2008 following the
October 2007 acquisition of MDL.
Cost of
products sold in 2009 was $10.8 million or 45% of product sales revenue,
compared to $10.4 million or 42% of product sales revenue in 2008 and $14.3
million or 41% of product sales revenue in 2007. The fluctuation in the total
cost of products sold in the past three years was primarily due to the change in
the numbers of tools sold and changes in product mix, as well as write-downs for
excess and obsolete inventory of $562,000 and $1.2 million, respectively, in
2009 and 2008 primarily due to customer delays and cancellations. As a
result of the Divestiture, we expect our cost of products to be substantially
reduced in 2010 in both dollars and percentage terms, as Symyx Software
generally carries higher gross margins than Symyx HPR.
The
majority of our tools are built to order or to particular specifications. We
generally charge the development costs incurred prior to the commercial
production of these systems to research and development expenses, resulting in a
lower cost of products sold and a higher margin for these systems. Therefore,
the cost of products sold as a percentage of product sales may fluctuate
significantly from period to period due to variability of product
mix.
The cost
of products sold may also be affected by adjustments to the reserves for
warranties. When actual warranty costs are lower than our estimates, the
difference will have a favorable impact to cost of products sold at the time the
warranty expires for the systems. When actual warranty costs are anticipated to
be higher than our original estimates, an additional expense is charged to cost
of products sold in the period when such a determination is made. In 2009, 2008
and 2007, we made favorable adjustments to reserves for warranties of $596,000,
$699,000, and $128,000, respectively.
Cost of
license fees, content and royalties consists primarily of royalties we pay for
third-party content we include in our content subscription offerings and of
personnel-related costs from our internal content support group.
Amortization
of intangible assets consisted of amortization of developed technology, license
agreement and proprietary content from various acquisitions in previous years.
The gross and net carrying cost of these intangible assets can be found in Note
11 of the Notes to Consolidated Financial Statements.
Operating
Expenses
|
2009
|
2008
|
2007
|
||||||||||||||||||||||||||||||||||
|
(in
thousands, except for percentages)
|
Amount
|
As
a Percentage of Total Revenue
|
Change
over Previous Year
|
Amount
|
As
a Percentage of Total Revenue
|
Change
over Previous Year
|
Amount
|
As
a Percentage of Total Revenue
|
Change
over Previous Year
|
|||||||||||||||||||||||||||
|
Research
and development
|
$ | 52,350 | 35 | % | (31 | %) | $ | 75,365 | 47 | % | 14 | % | $ | 66,186 | 53 | % | 12 | % | ||||||||||||||||||
|
Sales,
general and administrative
|
45,071 | 30 | % | (17 | %) | 54,589 | 34 | % | 30 | % | 41,935 | 33 | % | 22 | % | |||||||||||||||||||||
|
Restructuring
charges
|
2,578 | 2 | % | (48 | %) | 4,952 | 3 | % |
na
|
- | 0 | % |
na
|
|||||||||||||||||||||||
|
Impairment
to goodwill, intangibles and other long-lived assets
|
327 | 0 | % | (100 | %) | 90,330 | 57 | % |
na
|
- | 0 | % |
na
|
|||||||||||||||||||||||
|
Acquired
in-process research and development
|
- | 0 | % |
na
|
- | 0 | % | (100 | %) | 2,500 | 2 | % | 80 | % | ||||||||||||||||||||||
|
Amortization
of intangible assets
|
5,791 | 4 | % | (2 | %) | 5,903 | 4 | % | 162 | % | 2,253 | 2 | % | 33 | % | |||||||||||||||||||||
|
Total
operating expenses
|
$ | 106,117 | 71 | % | (54 | %) | $ | 231,139 | 145 | % | 105 | % | $ | 112,874 | 90 | % | 17 | % | ||||||||||||||||||
Research
and Development (R&D) Expenses
Our
R&D expenses consist primarily of salaries and other personnel-related
expenses, facility costs, supplies and depreciation of facilities and laboratory
equipment.
Research
and development includes those activities performed on behalf of some of our
alliance partners including Dow and ExxonMobil. These activities contribute to
multiple revenue streams, such as research service revenue, product sales
revenue and royalty revenue. Because we do not track fully burdened R&D
costs or capital expenditures by project and to allocate these costs into
various revenue streams, these R&D amounts are not included in costs of
service. However, based on hours spent on each project, we estimate the R&D
efforts undertaken for various projects were as follows:
|
2009
|
2008
|
2007
|
||||||||||
|
Customer-sponsored
projects
|
28 | % | 37 | % | 55 | % | ||||||
|
Internally-funded
projects
|
72 | % | 63 | % | 45 | % | ||||||
|
Total
|
100 | % | 100 | % | 100 | % | ||||||
Our customer-sponsored
R&D efforts as a percentage of total R&D efforts decreased significantly
from 2007 to 2008 and to 2009 due to the expiration of our principal agreement
with ExxonMobil in May 2008, and the significant expansion of our
internally-funded software development workforce from the October 2007 MDL
acquisition.
The
significant decrease in R&D expenses in 2009 from 2008 was driven primarily
by lower salary-related expenses resulted from the reduction in the force we
implemented at the end of 2008, and to our continuing focus on reducing
operating expenses in 2009. The increase of R&D expenses in 2008 over 2007
resulted primarily from additional salary-related expenses and consulting fees
related to our expanded software development activities following the MDL
acquisition.
R&D
expenses as a percentage of total revenue decreased in 2009 compared to 2008
despite a 5% decrease in revenue in 2009 due to our fourth quarter 2008
restructuring and continuing cost control efforts in 2009, and to a lesser
degree, the fact that research services costs for new research contracts in 2009
were reported in cost of sales. R&D expenses as a percentage of total
revenue decreased in 2008 compared to 2007 due to the significant increase in
revenue driven by the MDL acquisition and the fact that R&D as a percentage
of revenue is lower in our software business than in our other business lines.
With the Divestiture of our HPR business unit, we expect customer-sponsored
R&D projects will be nominal, and that our R&D expenses will decline
significantly in 2010. We will continue to focus on innovation and
development of our software product lines, and expect our R&D as a
percentage of revenue to be at or below 2009.
Sales,
General and Administrative (SG&A) Expenses
Our
SG&A expenses consist primarily of personnel costs for sales, business
development, legal, general management, finance and human resources, as well as
payments of commissions to our sales personnel and professional expenses, such
as legal and accounting. The decrease in SG&A expenses from 2008 to 2009
reflected the impact of our restructuring plan implemented at the end of 2008
and our continuing cost control efforts in 2009. The increase in SG&A
expenses in 2008 was primarily due to the inclusion of personnel costs for
employees from the MDL acquisition for the full fiscal year.
SG&A
expenses represented 30%, 34%, and 33% of total revenue for years ended December
31, 2009, 2008 and 2007, respectively. The decrease in SG&A expenses as a
percentage of total revenue from 2008 to 2009 reflected the impact of our
restructuring plan implemented at the end of 2008 and our continuing cost
control efforts in 2009. The increase in SG&A expenses as a percentage of
total revenue from 2007 to 2008 was primarily due to an annual salary increase
and higher marketing expenditures.
With the
Divestiture, we expect our 2010 SG&A expenses to be substantially lower in
dollar terms, but materially higher as a percentage of revenue due to lower
revenues in 2010 and to the fact that certain expenses, such as those associated
with being a public company, cannot readily be proportionately reduced following
the Divestiture.
Restructuring
Charges
Restructuring
charges recorded in 2009 consisted of (i) $1.6 million associated with the
October 2009 Restructuring commenced in the fourth quarter, (ii) $710,000 of
severance costs as part of a plan to consolidate our offshore software
development activities and facilities exit costs relating to the closure of our
UK office, and (iii) various adjustments totaling $250,000 related to
previous-year restructuring plans.
On
December 3, 2008, in order to realign our operations to drive performance and
improve operating efficiency, we implemented a reorganization plan to combine
Symyx Tools and Symyx Research to create Symyx HPR. The 2008 Plan
included a worldwide reduction in force of approximately 90 employees and the
consolidation of certain facilities. We recorded total restructuring charges of
$5.0 million in the fourth quarter of 2008, consisting of $3.7 million of
severance and one-time benefits and $1.3 million of exit costs of facilities,
write-off of related fixed assets and associated legal costs.
Impairment
to Goodwill, Intangibles and Other Long-lived Assets
As
discussed in Note 1 of the Notes to Consolidated Financial Statements, and in
connection with our 2008 annual impairment analysis of goodwill and assessment
of indicators of impairment related to intangible and other long-lived assets,
we determined that the value of our goodwill, intangible assets and other
long-lived assets has been impaired primarily due to the significant decline of
our market capitalization. Accordingly, in the fourth quarter of 2008, we
recorded impairment charges of $90.3 million, which included $76.5 million to
goodwill, $2.6 million to intangible assets and $11.3 million to fixed
assets.
In 2009,
we recorded a payable of $327,000 in connection with the 2008 IntegrityBio
acquisition, representing a portion of the earn-out provided in the acquisition
agreement that was based on the September and October 2009 revenue recognized
from the IntegrityBio operations. This liability, if determinable at the time of
acquisition, would have been recorded to goodwill as part of the purchase price.
We assessed the recoverability of these amounts under the current circumstances
and concluded that the goodwill resulting from the additional purchase
consideration earned should be impaired in 2009.
Acquired
In-Process Research and Development
In
October 2007, we acquired MDL in a transaction accounted for as a business
combination using the purchase method. The preliminary purchase price was
allocated to the assets acquired, including intangible assets, based on their
estimated fair values. The intangible assets include approximately $2.5 million
for acquired in-process technology for projects that did not have future
alternative uses. We determined the value of the purchased in-process technology
using the income approach. At the date of the MDL acquisition, the development
of these projects had not yet reached technological feasibility, and the
technology in process had no alternative future uses. Accordingly, these costs
were expensed at the acquisition date in 2007.
Amortization
of Intangible Assets
In
connection with various acquisitions, we have recorded an aggregate of $81.2
million of intangible assets (See Note 11 of the Notes to Consolidated Financial
Statements). These intangible assets are being amortized on a straight-line
basis over the estimated useful lives of the assets. The amortization
of intangible assets associated with trade name, customer relationship, bargain
lease and non-compete agreement is recorded as operating expenses.
Gain
(loss) from Sales of Businesses
In
connection with exiting the CDMO business, we recorded a loss of $2.0 million in
2009. In 2008, we recorded an additional gain of $4.9 million upon the release
of a holdback related to the sale of an approximately 10% equity interest in
Ilypsa, Inc., for which we had previously recorded a $40.8 million gain in
2007.
Interest
and Other Income, Net
Interest
and other income, net, for the years ended December 31, 2009, 2008 and 2007
consisted of interest income of approximately $61,000, $871,000 and $5.9
million, respectively. Interest income represents interest income earned on our
cash, cash equivalents and marketable securities. Interest income decreased in
2009 compared to 2008 due to the significant decrease in average interest rates
as we elected to hold our cash in highly liquid, highly secure investments.
Interest income decreased in 2008 from 2007 due to the significant decrease in
our average investment balance after the MDL acquisition and the impact of
decreasing average interest rates. Other expense for 2009 consisted of a
$410,000 foreign currency loss. Other expense for 2008 consisted of $2.0 million
in foreign currency losses, partially offset by a $1.6 million gain from the
sale of our Occupational Health Service (OHS) business in May 2008. We recorded
a significant amount of foreign currency losses in 2008 due to increased foreign
operations after the MDL acquisition and the material fluctuation of foreign
currency exchange rates during 2008. Foreign currency loss was lower in 2009
compared to 2008 due to lower cash and other monetary assets and liabilities
stated in a currency other than the functional currency.
Provision
for Income Taxes
We
recorded income tax benefits of $5.1 million in 2009 and $5.2 million in 2008,
and income tax expenses of $10.7 million in 2007. Our effective income tax rate
was 82% for 2009, 5% for 2008 and 36% for 2007. The effective income tax benefit
rate was significantly higher than our statutory combined federal and state rate
of 40% in 2009 due to the release of $3.0 million of federal valuation allowance
principally related to certain deferred tax assets that were realized in
connection with the sale of the CDMO business and the acceleration of certain
fixed asset depreciable lives in connection with our cost segregation study
discussed below. Additionally, we recorded a tax benefit of $813,000 from the
release of liabilities accrued for uncertain tax positions due to the expiration
of the related statute of limitation periods. The effective income tax benefit
rate was lower than our statutory combined federal and state rate of 40% in 2008
due to the non-deductibility of the majority of goodwill impairments and a $12.5
million valuation allowance for deferred tax assets. The effective income tax
rate was lower than our statutory combined federal and state rate of 40% in 2007
due to income tax benefits from research and development credits and tax-exempt
interest income.
We record
income tax expense using the asset and liability method. We recognize deferred
tax assets and liabilities for the expected future tax consequences attributable
to temporary differences between amounts reported for income tax purposes and
financial statement purposes, using current tax rates. We recognize a valuation
allowance if we anticipate that some or all of a deferred tax asset will not be
realized. We must assess the likelihood that our deferred tax assets will be
recovered from future taxable income and, to the extent that we believe that
recovery is not likely, we must establish a valuation allowance. Significant
management judgment is required in determining the provision for income taxes,
deferred tax assets and liabilities and any valuation allowance recorded against
net deferred tax assets. At December 31, 2008, we recorded a valuation allowance
of $12.5 million as a result of uncertainties related to the realization of our
net deferred tax assets. We established the valuation allowance as a result of
weighing all positive and negative evidence, including our history of cumulative
losses over the past three years and the difficulty of forecasting sufficient
future taxable income. The valuation allowance reflects the conclusion of
management that it is more likely than not that the benefit from certain
deferred tax assets will not be realized. If the actual results differ from
these estimates or these estimates are adjusted in future periods, the valuation
allowance may require adjustment which could materially impact our financial
position and results of operations.
In 2009,
we conducted a study of the tax depreciable lives for certain of our fixed
assets placed in service after January 1, 2002. Using the result of the study,
we reassessed the valuation allowance associated with certain federal deferred
tax assets and released $2.0 million of such allowance in the third quarter of
2009. Additionally we exited our CDMO business in the fourth quarter of 2009. In
connection with this transaction, we released an additional $1.0 million of the
federal valuation allowance. With respect to state taxes, we recorded a net
increase of valuation allowance of $707,000 against increased state deferred tax
assets. At the end of 2009, the balance of our valuation allowance was $10.2
million.
On
January 1, 2007, we adopted the authoritative guidance on accounting for
uncertainty in income taxes. As of December 31, 2009, our total
unrecognized tax benefits were $3.2 million, of which $379,000 of tax benefits,
if recognized, would affect the effective income tax rate. We do not anticipate
the total amounts of unrecognized income tax benefits will significantly
increase or decrease in the next 12 months.
Recent
Accounting Pronouncements
FASB
Accounting Standard Update (ASU) No. 2010-06, Improving Disclosures about Fair
Value Measurements, requires disclosures about inputs and valuation
techniques used to measure fair value as well as disclosures about significant
transfers, beginning in the first quarter of 2010. Additionally, these amended
standards require presentation of disaggregated activity within the
reconciliation for fair value measurements using significant unobservable inputs
(Level 3), beginning in the first quarter of 2011. We do not expect these new
standards to significantly impact our consolidated financial
statements.
FASB ASC No.
810, Amendments to FASB
Interpretation No. 46(R) (ASC 810, and formerly referred to as SFAS No.
167), makes significant changes to the model for determining who should
consolidate a variable interest entity, and also addresses how often this
assessment should be performed. ASC 810 will be effective for us beginning in
the first quarter of 2010. We are assessing the impact of the adoption of this
standard on our financial statements particularly in connection with the
divestiture of the HPR business.
FASB ASU
No. 2009-13, Revenue
Recognition: Multiple-Deliverable Revenue Arrangements—a consensus of the FASB
Emerging Issues Task Force, which eliminates the use of the residual
method for allocating consideration, as well as the criteria that require
objective and reliable evidence of fair value of undelivered elements in order
to separate the elements in a multiple-element arrangement. By removing the
criteria requiring the use of objective and reliable evidence of fair value in
separately accounting for deliverables, the recognition of revenue will more
closely align with certain revenue arrangements. The standard also will replace
the term "fair value" in the revenue allocation guidance with "selling price" to
clarify that the allocation of revenue is based on entity-specific assumptions
rather than assumptions of a marketplace participant. ASU No. 2009-13 is
effective for revenue arrangements entered or materially modified in fiscal
years beginning on or after June 15, 2010. We are electing early
adoption as of January 1, 2010 and are assessing the potential impact of this
standard.
FASB ASU No.
2009-14, Software: Certain
Revenue Arrangements that Include Software Elements—a consensus of the FASB
Emerging Issues Task Force, which will significantly improve the
reporting of certain transactions to more closely reflect the underlying
economics of the transactions. By excluding from its scope certain
software-enabled devices, multiple-element arrangements that include such
software-enabled devices will now be evaluated for separation and allocation
using the guidance in ASU No. 2009-13 (described above). ASU No. 2009-14 is
effective for revenue arrangements entered or materially modified in fiscal
years beginning on or after June 15, 2010. Early adoption as of January 1, 2010
is permitted but is not being elected by us. We are currently assessing the
potential impact of this standard.
Liquidity
and Capital Resources
This
section discusses the effects of the changes in our balance sheets, cash flows
and commitments on our liquidity and capital resources.
Balance
Sheet and Cash Flows
We had
positive cash flow from operating activities for the year ended December 31,
2009. We ended fiscal year 2009 with cash and cash equivalents of approximately
$81.8 million as compared to cash and cash equivalents of approximately $66.4
million at December 31, 2008.
Our
operating activities provided $18.4 million and $28.4 million of cash in 2009
and 2008, respectively, and used $14.7 million of cash in 2007. The sources of
cash for the three years were primarily the receipt of funding from research
partners, payments from product sales and licensing and service fees. Our days
of sales outstanding in 2009, 2008 and 2007 were 30, 40 and 58 days,
respectively. Our cash flow from operating activities in 2009 was lower than in
2008 due to the relatively higher collection of payments in early 2008 for tools
shipped in the fourth quarter of 2007. In 2007, we paid approximately
$20.9 million in income taxes, of which the majority was related to the gain
from the Ilypsa transaction (described below). Because this tax payment was
recorded against operating cash flow while the original sales proceeds were
recorded as investing cash flow, our cash flow from operating activities was
negative for 2007.
We currently expect net positive
operating cash flow for 2010, but that operating cash flow will be seasonally
positive in the first half of the year when the majority of our software license
and maintenance agreements and content subscriptions renew, and negative in the
second half of the year.
$571,000,
$42,000 and $163,000 of excess tax benefits for the years ended December 31,
2009, 2008 and 2007, respectively, have been classified as an operating cash
outflow and a financing cash inflow.
Net cash
used in investing activities was $5.0 million and $111,000 in 2009 and 2008,
respectively. Net cash from investing activities was $15.4 million in 2007. Cash
used in investing activities in 2009 was principally comprised of the purchase
of property, plant and equipment. Included in the cash used in investing
activities for 2008 were net cash payments for the IntegrityBio acquisition of
$10.2 million and an additional investment in Intermolecular of $1.6 million,
partially offset by a $5.0 working capital adjustment in connection with the MDL
acquisition and additional proceeds of $4.8 million received in 2008 from the
sale of our Ilypsa equity interests in 2007. Included in the cash from investing
activities for 2007 were net proceeds of $109.0 million from marketable
securities, proceeds from the sale of Ilypsa equity interest of $41.2 million,
partially offset by a net cash payment for MDL acquisition of $125.9 million.
Cash used in purchases of property, plant and equipment was $5.0 million, $7.1
million and $7.7 million, respectively, in 2009, 2008 and 2007.
Financing
activities provided $2.0 million, $1.2 million and $745,000 of cash in 2009,
2008 and 2007, respectively. The cash inflows were primarily the proceeds from
the exercise of stock options and sale of stock under the Employee Stock
Purchase Plan in each of 2009, 2008 and 2007, and excess tax benefits from
stock-based compensation. Cash outflows from financing activities in 2009, 2008
and 2007 included approximately $535,000, $499,000 and $2.0 million,
respectively, payments of employee withholding tax in lieu of issuing common
stock upon the vesting of restricted stock units.
On
September 28, 2007, we entered into a Credit Agreement (the Credit Agreement)
with Bank of America, N.A., as Administrative Agent and L/C Issuer (the Agent),
and each lender from time to time a party thereto. Under the Credit Agreement,
the Agent agreed to provide a $25 million aggregate commitment for a two-year
revolving credit facility and issuances of letters of credit for Symyx (the
Facility), secured by substantially all of our assets excluding intellectual
property. In March 2009, we entered into an amendment to the Facility with the
Agent which lowered the Consolidated Net Worth covenant amount for future
measurement dates. In August 2009, we entered into the second amendment to the
Credit Agreement in which the Agent consented to the legal consolidation of our
U.S. operations. In September 2009, we entered into the third amendment to
extend the term of the Credit Agreement until March 1, 2010. As of December
31, 2009, we were in compliance with the amended covenants in the Credit
Agreement and had no borrowings under the Facility other than a standby letter
of credit of $780,000 to secure a customer deposit.
We believe our current cash, cash
equivalents and marketable securities, our bank credit facility, and the cash
flows generated by operations will be sufficient to satisfy our anticipated cash
needs for working capital, capital expenditures, investment requirements, and
other liquidity requirements associated with our existing operations for at
least the next twelve months. Nonetheless, we may be required to raise
additional funds through public or private financing, collaborative
relationships or other arrangements. We cannot provide assurance that additional
funding, if sought, will be available or be on terms favorable to us. Further,
any additional equity financing may be dilutive to stockholders, and debt
financing, if available, may involve restrictive covenants which may restrict
our business. Collaborative arrangements and licensing may require us to
relinquish our rights to some of our technologies or products. Our failure to
raise capital when needed, or on terms favorable to us, may harm our business
and operating results.
Contractual
Commitments
Our
contractual commitments consist of our obligations under operating leases
(Facility Commitments), our commitments to purchase inventory and fixed assets
and services (Purchase Commitments), and our commitments for royalty payments
(Royalty Commitments, due when we receive customer payments). As of December 31,
2009 and 2008, our contractual commitments were $31.7 million and $34.4 million,
respectively. The decrease in our contractual commitments in 2009 was due to
facility lease payments made in 2009, partially offset by commitments from our
various new leases. We expect to satisfy these obligations as they become due
over the next seven years.
Future
principal commitments as of December 31, 2009 were as follows (in
thousands):
|
Total
|
Less
than 1 Year
|
1-3
Years
|
3-5
Years
|
More
Than 5 Years
|
||||||||||||||||
|
Facility
Commitments
|
$ | 25,607 | $ | 4,793 | $ | 8,854 | $ | 8,144 | $ | 3,816 | ||||||||||
|
Purchase
Commitments
|
4,992 | 4,992 | - | - | - | |||||||||||||||
|
Royalty
Commitments
|
1,104 | 1,069 | 35 | - | - | |||||||||||||||
|
Total
|
$ | 31,703 | $ | 10,854 | $ | 8,889 | $ | 8,144 | $ | 3,816 | ||||||||||
Due to
the expected Divestiture, we are in the process of canceling/transferring
certain purchase commitments totaling approximately $1.8 million.
Estimated
future rents receivable from sublease agreements through 2012, not included
above, amount to approximately $457,000. If the Divestiture closes, we expect
additional rent receivable from the sublease to HPR Global to be approximately
$3.5 million through October 31, 2015.
Other
Commitments
As of
December 31, 2009, we carried a $2.3 million accrued liability associated with
uncertainties in income taxes. We are unable to make reasonably reliable
estimates of the periods of any cash settlement with the respective tax
authorities and have recorded the liability as a long-term payable on our
Consolidated Balance Sheets.
Customer
Indemnification
From time
to time, we agree to indemnify our customers against certain third party
liabilities, including liability if our products infringe a third party’s
intellectual property rights. We account for such indemnification provisions in
accordance with the authoritative guidance on guarantor’s accounting and
disclosure requirements for guarantees, including indirect guarantees of
indebtedness of others.
Other than for limited exceptions (e.g., intellectual property indemnity or
bodily harm), our indemnification obligation in these arrangements is typically
limited to no more than the amount paid by the customer. As of December 31,
2009, we were not subject to any pending intellectual property-related
litigation. We have not received any requests for and have not been required to
make any payments under these indemnification provisions during any periods
covered in these consolidated financial statements.
Insurance
We carry
insurance with coverage and coverage limits that we believe to be adequate.
Although there can be no assurance that such insurance is sufficient to protect
us against all contingencies, our management believes that our insurance
protection is reasonable in view of the nature and scope of our
operations.
Off-Balance
Sheet Arrangements
We have
not entered into any off-balance sheet financing arrangements and have not
established any special purpose entities as of December 31, 2009. We have not
guaranteed any debt or commitments of other entities or entered into any options
on non-financial assets.
ITEM 7A. QUANTITATIVE AND QUALITATIVE DISCLOSURES
ABOUT MARKET RISK
Foreign
Currency Risk
We do not
use derivative instruments to manage risks associated with foreign currency
transactions in order to minimize the impact of changes in foreign currency
exchange rates on earnings. We provide our products and services to customers in
the United States, Europe and elsewhere throughout the world. Sales are
primarily made in U.S. dollars, and to a lesser but increasing extent, Swiss
francs, Euros, Japanese yen, and British pounds. A strengthening of the U.S.
dollar could make our products less competitive in foreign markets.
Our exposure to foreign
exchange rate fluctuations also arises in part from inter-company accounts with
our foreign subsidiaries. These inter-company accounts are typically denominated
in the functional currency of the foreign subsidiary, and, when re-measured and
translated in U.S. dollars, have an impact on our operating results depending
upon the movement in foreign currency rates. During fiscal 2009, our total
realized and unrealized gains due to movements in foreign currencies, primarily
Swiss francs, Euros, Japanese yen and British pounds was $410,000. As exchange
rates vary, these foreign exchange results may vary and adversely or favorably
impact operating results. An unfavorable change of 10% in foreign currency rates
would have a material impact on our financial statements.
Interest
Rate Risk
In both
2009 and 2008 we maintained our cash in treasury-bill money market funds,
classified as cash and cash equivalents, and at December 31, 2009 did not have
any short term investments. As a result, we have minimal exposure to
interest rate changes.
ITEM 8. FINANCIAL STATEMENTS AND SUPPLEMENTARY
DATA
|
Index
to Consolidated Financial Statements
|
Page
|
|
Report
of Independent Registered Public Accounting Firm
|
48
|
|
Consolidated
Balance Sheets at December 31, 2009 and 2008
|
49
|
|
Consolidated
Statements of Operations for the Years Ended December 31, 2009, 2008 and
2007
|
50
|
|
Consolidated
Statements of Stockholders' Equity for the Years Ended December 31, 2009,
2008 and 2007
|
51
|
|
Consolidated
Statements of Cash Flows for the Years Ended December 31, 2009, 2008 and
2007
|
52
|
|
Notes
to Consolidated Financial Statements
|
54
|
Report
of Independent Registered Public Accounting Firm
The
Board of Directors and Shareholders of Symyx Technologies, Inc.
We have
audited the accompanying consolidated balance sheets of Symyx Technologies, Inc.
as of December 31, 2009 and 2008, and the related consolidated statements of
operations, stockholders' equity, and cash flows for each of the three years in
the period ended December 31, 2009. These financial statements are the
responsibility of the Company's management. Our responsibility is to express an
opinion on these financial statements based on our audits.
We
conducted our audits in accordance with the standards of the Public Company
Accounting Oversight Board (United States). Those standards require that we plan
and perform the audit to obtain reasonable assurance about whether the financial
statements are free of material misstatement. An audit includes examining, on a
test basis, evidence supporting the amounts and disclosures in the financial
statements. An audit also includes assessing the accounting principles used and
significant estimates made by management, as well as evaluating the overall
financial statement presentation. We believe that our audits provide a
reasonable basis for our opinion.
In our
opinion, the financial statements referred to above present fairly, in all
material respects, the consolidated financial position of Symyx Technologies,
Inc. at December 31, 2009 and 2008, and the consolidated results of its
operations and its cash flows for each of the three years in the period ended
December 31, 2009, in conformity with U.S. generally accepted accounting
principles.
As
discussed in Note 1 and Note 10 to the consolidated financial statements, Symyx
Technologies, Inc. changed its method of accounting for uncertain income tax
positions with the adoption of guidance originally issued in Financial
Interpretation No. 48, Accounting for Uncertainty in Income
Taxes – an interpretation of FASB Statement No. 109 (codified in FASB ASC
Topic 740, Income
Taxes) as of January 1, 2007.
We also
have audited, in accordance with the standards of the Public Company Accounting
Oversight Board (United States), Symyx Technologies, Inc.'s internal control
over financial reporting as of December 31, 2009, based on criteria established
in Internal Control-Integrated Framework issued by the Committee of Sponsoring
Organizations of the Treadway Commission and our report dated February 26, 2010
expressed an unqualified opinion thereon.
|
/s/
Ernst & Young LLP
|
San Jose,
California
February
26, 2010
SYMYX
TECHNOLOGIES, INC.
CONSOLIDATED
BALANCE SHEETS
(In
thousands, except share and per share information)
|
December 31,
|
||||||||
|
2009
|
2008
|
|||||||
|
ASSETS
|
||||||||
|
Current
assets:
|
||||||||
|
Cash
and cash equivalents
|
$ | 81,777 | $ | 66,415 | ||||
|
Accounts
receivable, net of allowance for doubtful accounts of $156 and $356,
respectively
|
12,793 | 11,993 | ||||||
|
Inventories
|
1,956 | 3,308 | ||||||
|
Deferred
tax assets, current
|
3,850 | 2,227 | ||||||
|
Income
tax receivable
|
4,848 | 6,549 | ||||||
|
Other
current assets
|
5,586 | 6,351 | ||||||
|
Total
current assets
|
110,810 | 96,843 | ||||||
|
Property,
plant and equipment, net
|
17,032 | 18,447 | ||||||
|
Goodwill
|
39,640 | 39,979 | ||||||
|
Intangible
assets, net
|
40,650 | 53,268 | ||||||
|
Long-term
investments
|
15,147 | 15,147 | ||||||
|
Deferred
tax and other assets
|
3,529 | 3,901 | ||||||
|
Total
assets
|
$ | 226,808 | $ | 227,585 | ||||
|
LIABILITIES
AND STOCKHOLDERS’ EQUITY
|
||||||||
|
Current
liabilities:
|
||||||||
|
Accounts
payable
|
$ | 2,479 | $ | 3,056 | ||||
|
Other
accrued liabilities
|
7,408 | 9,947 | ||||||
|
Accrued
compensation and employee benefits
|
9,379 | 9,377 | ||||||
|
Accrued
royalty
|
3,944 | 3,628 | ||||||
|
Income
taxes payable
|
- | 567 | ||||||
|
Current
deferred tax liabilities
|
107 | 778 | ||||||
|
Accrued
restructuring costs
|
2,114 | 4,578 | ||||||
|
Deferred
revenue, current
|
27,988 | 23,519 | ||||||
|
Total
current liabilities
|
53,419 | 55,450 | ||||||
|
Long-term
payable
|
2,322 | 4,457 | ||||||
|
Long-term
deferred revenue
|
5,556 | 7,421 | ||||||
|
Noncurrent
deferred tax liabilities
|
8,777 | 8,174 | ||||||
|
Total
noncurrent liabilities
|
16,655 | 20,052 | ||||||
|
Commitments
(Note 3)
|
||||||||
|
Stockholders'
equity:
|
||||||||
|
Preferred
stock, $0.001 par value, 10,000,000 shares authorized, issuable in
series; no shares issued and outstanding
|
- | - | ||||||
|
Common
stock, $0.001 par value, 60,000,000 shares authorized and 34,692,061 and
34,014,660 shares issued and outstanding at December 31, 2009
and 2008, respectively
|
35 | 34 | ||||||
|
Additional
paid-in capital
|
213,493 | 207,690 | ||||||
|
Accumulated
other comprehensive gain
|
2,591 | 2,606 | ||||||
|
Accumulated
deficits
|
(59,385 | ) | (58,247 | ) | ||||
|
Total
stockholders' equity
|
156,734 | 152,083 | ||||||
|
Total
liabilities and stockholders’ equity
|
$ | 226,808 | $ | 227,585 | ||||
The
accompanying notes are an integral part of these consolidated financial
statements.
SYMYX
TECHNOLOGIES, INC.
CONSOLIDATED
STATEMENTS OF OPERATIONS
(In
thousands, except per share amounts)
|
2009
|
2008
|
2007
|
||||||||||
|
Revenue:
|
||||||||||||
|
Service
|
$ | 70,542 | $ | 74,892 | $ | 59,034 | ||||||
|
Product
|
23,888 | 25,033 | 34,898 | |||||||||
|
License
fees, content and royalties
|
56,016 | 59,120 | 31,140 | |||||||||
|
Total
revenue
|
150,446 | 159,045 | 125,072 | |||||||||
|
Costs
of revenue:
|
||||||||||||
|
Cost
of service
|
26,012 | 21,094 | 8,995 | |||||||||
|
Cost
of products
|
10,806 | 10,444 | 14,281 | |||||||||
|
Cost
of license fees, content and royalties
|
5,649 | 5,876 | 1,773 | |||||||||
|
Amortization
of intangible assets
|
5,909 | 7,355 | 3,873 | |||||||||
|
Total
costs of revenue
|
48,376 | 44,769 | 28,922 | |||||||||
|
Gross
profit
|
102,070 | 114,276 | 96,150 | |||||||||
|
Operating
expenses:
|
||||||||||||
|
Research
and development
|
52,350 | 75,365 | 66,186 | |||||||||
|
Sales,
general and administrative
|
45,071 | 54,589 | 41,935 | |||||||||
|
Restructuring
charges
|
2,578 | 4,952 | - | |||||||||
|
Impairment
to goodwill, intangibles and other long- lived assets
|
327 | 90,330 | - | |||||||||
|
Acquired
in-process research and development
|
- | - | 2,500 | |||||||||
|
Amortization
of intangible assets
|
5,791 | 5,903 | 2,253 | |||||||||
|
Total
operating expenses
|
106,117 | 231,139 | 112,874 | |||||||||
|
Loss
from operations
|
(4,047 | ) | (116,863 | ) | (16,724 | ) | ||||||
|
Gain
from sale of equity interest in Ilypsa, Inc.
|
- | 4,939 | 40,826 | |||||||||
|
Loss
from sale of IntegrityBio business
|
(2,009 | ) | - | - | ||||||||
|
Interest
and other income (expense), net
|
(229 | ) | 135 | 5,694 | ||||||||
|
Income
before income tax benefit (expense) and equity loss
|
(6,285 | ) | (111,789 | ) | 29,796 | |||||||
|
Income
tax benefit (expense)
|
5,147 | 5,173 | (10,698 | ) | ||||||||
|
Equity
in loss from investment in Visyx Technologies Inc.
|
- | - | (314 | ) | ||||||||
|
Net
income (loss)
|
$ | (1,138 | ) | $ | (106,616 | ) | $ | 18,784 | ||||
|
Basic
net income (loss) per share
|
$ | (0.03 | ) | $ | (3.16 | ) | $ | 0.57 | ||||
|
Diluted
net income (loss) per share
|
$ | (0.03 | ) | $ | (3.16 | ) | $ | 0.56 | ||||
|
Shares
used in computing basic net income (loss) per share
|
34,321 | 33,747 | 33,199 | |||||||||
|
Shares
used in computing diluted net income (loss) per share
|
34,321 | 33,747 | 33,557 | |||||||||
The accompanying notes are an integral
part of these consolidated financial statements.
SYMYX
TECHNOLOGIES, INC.
CONSOLIDATED
STATEMENTS OF STOCKHOLDERS' EQUITY
(In
thousands)
|
Preferred
Stock
|
Common
Stock
|
|||||||||||||||||||||||||||||||
|
Shares
|
Amount
|
Shares
|
Amount
|
Additional
Paid-In Capital
|
Accumulated
Other Comprehensive Gain (Loss)
|
Retained
Earnings (Accumulated Deficits)
|
Total
Stockholders’ Equity
|
|||||||||||||||||||||||||
|
Balance
at January 1, 2007
|
- | $ | - | 32,975 | $ | 33 | 197,823 | $ | (4 | ) | $ | 30,524 | $ | 228,376 | ||||||||||||||||||
|
Issuance
of common stock on exercise of options
|
- | - | 96 | - | 629 | - | - | 629 | ||||||||||||||||||||||||
|
Issuance
of common stock under employee share purchase plan
|
- | - | 219 | 1 | 1,908 | - | - | 1,909 | ||||||||||||||||||||||||
|
Issuance
of common stock for vested restricted stock units, net
|
- | - | 208 | - | (1,956 | ) | - | - | (1,956 | ) | ||||||||||||||||||||||
|
Issuance
of restricted common stock
|
- | - | 91 | - | - | - | - | - | ||||||||||||||||||||||||
|
Stock-based
compensation
|
- | - | - | - | 5,702 | - | - | 5,702 | ||||||||||||||||||||||||
|
Tax
deficiency from employee stock option plans
|
- | - | - | - | (812 | ) | - | - | (812 | ) | ||||||||||||||||||||||
|
Cumulative
effect of adopting FIN 48
|
- | - | - | - | (57 | ) | - | (939 | ) | (996 | ) | |||||||||||||||||||||
|
Comprehensive
income:
|
||||||||||||||||||||||||||||||||
|
Net
income
|
- | - | - | - | - | - | 18,784 | 18,784 | ||||||||||||||||||||||||
|
Unrealized
gain on foreign currency translation
|
- | - | - | - | - | 628 | - | 628 | ||||||||||||||||||||||||
|
Unrealized
loss on marketable securities
|
- | - | - | - | - | (23 | ) | - | (23 | ) | ||||||||||||||||||||||
|
Comprehensive
income
|
19,389 | |||||||||||||||||||||||||||||||
|
Balance
at December 31, 2007
|
- | - | 33,589 | 34 | 203,237 | 601 | 48,369 | 252,241 | ||||||||||||||||||||||||
|
Issuance
of common stock on exercise of options
|
- | - | 30 | - | 83 | - | - | 83 | ||||||||||||||||||||||||
|
Issuance
of common stock under employee share purchase plan
|
- | - | 335 | - | 1,592 | - | - | 1,592 | ||||||||||||||||||||||||
|
Issuance
of common stock for vested restricted stock units, net
|
- | - | 151 | - | (499 | ) | - | - | (499 | ) | ||||||||||||||||||||||
|
Cancellation
of restricted common stock
|
- | - | (91 | ) | - | - | - | - | - | |||||||||||||||||||||||
|
Stock-based
compensation
|
- | - | - | - | 4,368 | - | - | 4,368 | ||||||||||||||||||||||||
|
Tax
deficiency from employee stock option plans
|
- | - | - | - | (1,091 | ) | - | - | (1,091 | ) | ||||||||||||||||||||||
|
Comprehensive
loss:
|
||||||||||||||||||||||||||||||||
|
Net
loss
|
- | - | - | - | - | - | (106,616 | ) | (106,616 | ) | ||||||||||||||||||||||
|
Unrealized
gain on foreign currency translation
|
- | - | - | - | - | 2,006 | - | 2,006 | ||||||||||||||||||||||||
|
Unrealized
loss on marketable securities
|
- | - | - | - | - | (1 | ) | - | (1 | ) | ||||||||||||||||||||||
|
Comprehensive
loss
|
(104,611 | ) | ||||||||||||||||||||||||||||||
|
Balance
at December 31, 2008
|
- | - | 34,014 | 34 | 207,690 | 2,606 | (58,247 | ) | 152,083 | |||||||||||||||||||||||
|
Issuance
of common stock on exercise of options
|
- | - | 113 | - | 432 | - | - | 432 | ||||||||||||||||||||||||
|
Issuance
of common stock under employee share purchase plan
|
- | - | 362 | 1 | 1,487 | - | - | 1,488 | ||||||||||||||||||||||||
|
Issuance
of common stock for vested restricted stock units, net
|
- | - | 202 | - | (535 | ) | - | - | (535 | ) | ||||||||||||||||||||||
|
Stock-based
compensation
|
- | - | - | - | 4,400 | - | - | 4,400 | ||||||||||||||||||||||||
|
Tax
benefit from employee stock option plans
|
- | - | - | - | 19 | - | - | 19 | ||||||||||||||||||||||||
|
Comprehensive
loss:
|
||||||||||||||||||||||||||||||||
|
Net
loss
|
- | - | - | - | - | - | (1,138 | ) | (1,138 | ) | ||||||||||||||||||||||
|
Unrealized
loss on foreign currency translation
|
- | - | - | - | - | (15 | ) | - | (15 | ) | ||||||||||||||||||||||
|
Comprehensive
loss
|
(1,153 | ) | ||||||||||||||||||||||||||||||
|
Balance
at December 31, 2009
|
- | $ | - | 34,691 | $ | 35 | $ | 213,493 | $ | 2,591 | $ | (59,385 | ) | $ | 156,734 | |||||||||||||||||
The
accompanying notes are an integral part of these consolidated financial
statements.
SYMYX
TECHNOLOGIES, INC.
CONSOLIDATED
STATEMENTS OF CASH FLOWS
(In
thousands)
|
2009
|
2008
|
2007
|
||||||||||
|
Operating
activities
|
||||||||||||
|
Net
income (loss)
|
$ | (1,138 | ) | $ | (106,616 | ) | $ | 18,784 | ||||
|
Adjustments
to reconcile net income (loss) to net cash provided by (used in) operating
activities:
|
||||||||||||
|
Impairment
of goodwill, intangibles and long-lived assets
|
327 | 90,330 | - | |||||||||
|
Depreciation
and amortization
|
5,262 | 11,355 | 7,603 | |||||||||
|
Amortization
of intangible assets arising from business combinations
|
11,699 | 13,235 | 6,126 | |||||||||
|
Acquired
in-process research and development
|
- | - | 2,500 | |||||||||
|
Stock-based
compensation
|
4,400 | 4,368 | 5,702 | |||||||||
|
Equity
in loss from investment in Visyx Technologies Inc.
|
- | - | 314 | |||||||||
|
Gain
from sale of equity interest in Ilypsa, Inc.
|
- | (4,939 | ) | (40,826 | ) | |||||||
|
Loss
from sale of IntegrityBio business
|
2,009 | - | - | |||||||||
|
Gain
on sale of property, plant and equipment
|
- | (1,606 | ) | - | ||||||||
|
Deferred
income taxes
|
(967 | ) | (306 | ) | (3,534 | ) | ||||||
|
Excess
tax benefits from stock-based compensation
|
(571 | ) | (42 | ) | (163 | ) | ||||||
|
Tax
benefit (deficiency) from employee stock transactions
|
19 | (1,091 | ) | (812 | ) | |||||||
|
Changes
in operating assets and liabilities, excluding effects of business
acquisitions:
|
||||||||||||
|
Accounts
receivable, net
|
(806 | ) | 11,978 | (2,028 | ) | |||||||
|
Inventories
|
1,340 | 830 | (1,397 | ) | ||||||||
|
Other
current assets
|
804 | (1,590 | ) | (2,043 | ) | |||||||
|
Other
long-term assets
|
(307 | ) | (106 | ) | 607 | |||||||
|
Accounts
payable
|
(578 | ) | 852 | (1,791 | ) | |||||||
|
Other
accrued liabilities
|
(3,299 | ) | (15 | ) | 1,991 | |||||||
|
Accrued
compensation and employee benefits
|
(102 | ) | (2,034 | ) | 97 | |||||||
|
Accrued
royalties
|
648 | (64 | ) | 3,692 | ||||||||
|
Income
taxes receivable and payable
|
1,107 | (3,896 | ) | (5,658 | ) | |||||||
|
Accrued
restructuring charges
|
(2,010 | ) | 2,913 | (4,548 | ) | |||||||
|
Deferred
revenue
|
2,661 | 15,062 | 648 | |||||||||
|
Long-term
payable
|
(2,135 | ) | (215 | ) | - | |||||||
|
Net
cash provided by (used in) operating activities
|
18,363 | 28,403 | (14,736 | ) | ||||||||
|
Investing
activities
|
||||||||||||
|
Purchase
of property, plant and equipment, net
|
(5,043 | ) | (7,074 | ) | (7,712 | ) | ||||||
|
Proceeds
from divesting assets
|
- | 694 | - | |||||||||
|
Purchase
of marketable securities
|
- | - | (101,932 | ) | ||||||||
|
Proceeds
from maturities of marketable securities
|
- | 8,400 | 202,900 | |||||||||
|
Proceeds
from sales of marketable securities
|
- | - | 7,986 | |||||||||
|
Proceeds
from sales of businesses
|
- | 4,778 | 41,238 | |||||||||
|
Long-term
investments
|
- | (1,647 | ) | (100 | ) | |||||||
|
Acquisition
of businesses, net of cash acquired
|
- | (5,262 | ) | (125,910 | ) | |||||||
|
Release
of payment to shareholders of an acquired business
|
- | - | (1,024 | ) | ||||||||
|
Net
cash provided by (used in) investing activities
|
(5,043 | ) | (111 | ) | 15,446 | |||||||
|
Financing
activities
|
||||||||||||
|
Proceeds
from issuance of common stock
|
1,920 | 1,675 | 2,538 | |||||||||
|
Payment
of employee withholding tax in lieu of issuing common stock upon vesting
of restricted stock units
|
(535 | ) | (499 | ) | (1,956 | ) | ||||||
|
Excess
tax benefits from stock-based compensation
|
571 | 42 | 163 | |||||||||
|
Net
cash provided by financing activities
|
1,956 | 1,218 | 745 | |||||||||
|
Effect
of foreign exchange rate changes on cash and cash
equivalents
|
86 | (172 | ) | (498 | ) | |||||||
|
Net
increase in cash and cash equivalents
|
15,362 | 29,338 | 957 | |||||||||
|
Cash
and cash equivalents at beginning of year
|
66,415 | 37,077 | 36,120 | |||||||||
|
Cash
and cash equivalents at end of year
|
$ | 81,777 | $ | 66,415 | $ | 37,077 | ||||||
|
2009
|
2008
|
2007
|
||||||||||
|
Supplemental
disclosure of cash flow information
|
||||||||||||
|
Income
taxes paid (refunded), net
|
$ | (3,962 | ) | $ | 4,331 | $ | 20,940 | |||||
|
Supplemental
disclosure of non-cash investing and financing activities
|
||||||||||||
|
Net
working capital adjustments receivable from the seller of an acquired
business
|
$ | - | $ | - | $ | (4,954 | ) | |||||
|
Payable
related to transaction costs for a business acquisition
|
$ | - | $ | - | $ | 562 | ||||||
The
accompanying notes are an integral part of these consolidated financial
statements.
SYMYX
TECHNOLOGIES, INC.
NOTES
TO CONSOLIDATED FINANCIAL STATEMENTS
1. Summary
of Significant Accounting Policies
Business
and Basis of Presentation
Symyx
Technologies, Inc. (together with its wholly-owned subsidiaries, the Company or
Symyx) enables global leaders in life sciences, chemical, energy, and consumer
and industrial products to optimize and accelerate their scientific research and
development (R&D). Through its abilities in scientific informatics
management, workflow optimization, and micro-scale, parallel experimentation,
Symyx helps companies transform their R&D operations to minimize the time
their scientists spend on routine, repetitive tasks and to maximize their return
on R&D investments.
Principles
of consolidation
These
consolidated financial statements include the accounts of the Company and its
wholly-owned subsidiaries. Symyx accounts for equity investments in companies
over which the Company has the ability to exercise significant influence, but
does not hold a controlling interest, under the equity method, and the Company
records its proportionate share of income or losses as other income (loss) in
the consolidated statements of operations. The Company has eliminated all
significant intercompany accounts and transactions.
The
Company has evaluated subsequent events for recognition or disclosure through
the time of filing these consolidated financial statements on Form 10-K with the
U.S. Securities and Exchange Commission on February 26, 2010.
Use
of Estimates
Preparing
financial statements in accordance with US generally accepted accounting
principles (GAAP) requires management to make estimates and assumptions that
affect the reported amounts in Symyx’s consolidated financial statements and
accompanying notes. Estimates include the assumptions used in determining the
implied fair value of goodwill, intangibles and other long-lived assets,
assumptions used to determine the stock-based compensation of our equity awards,
including the volatility rate and the forfeiture rates for stock-based awards,
reserve for excess or obsolete inventory, future warranty expenditures,
significant management judgment required in determining the provision for income
taxes, deferred tax assets and liabilities and any valuation allowance recorded
against net deferred tax assets, the potential outcome of future tax
consequences of events recognized in the our financial statements or tax
returns, the foreign currency rate used in determining the effect of foreign
currency exchange rate fluctuation on our financial statements and the
accounting policies adopted to defer costs associated with various
contracts. The Company evaluates its estimates, including those
mentioned above, on an ongoing basis. The Company bases its estimates on
historical experience and on various other assumptions that it believes to be
reasonable under the circumstances, the results of which form its basis for
making judgments about the carrying value of assets and liabilities that are not
readily apparent from other sources. Actual results may differ from
those estimates under different assumptions or conditions.
Reclassification
Certain
reclassifications have been made to prior period amounts to conform to the
current period presentation, as follows: (i) current deferred tax liabilities
previously netted against current deferred tax assets have been reclassified as
current liabilities; (ii) non-current deferred tax assets previously netted
against non-current deferred tax liabilities have been reclassified
as noncurrent assets.
Cash
and Cash Equivalents
The
Company considers all highly liquid investments with maturities of three months
or less on the date of purchase to be cash equivalents. Cash equivalents are
carried at fair value. The Company’s total cash and cash equivalents were
$81,777,000 and cost approximated fair value of any cash
equivalents.
SYMYX
TECHNOLOGIES, INC.
NOTES
TO CONSOLIDATED FINANCIAL STATEMENTS (CONTINUED)
Investments
In 2008
and 2009, the Company maintained its cash in treasury-bill money market funds,
classified as cash and cash equivalents. The Company did not have any marketable
securities as of December 31, 2009.
The
Company had no realized or unrealized gains or losses on its investments for the
years ended December 31, 2009 and 2008.
The
Company determines the accounting method used to account for investments in
equity securities in which it does not have a controlling interest primarily
based on the Company’s ownership of the investee and whether the Company has the
ability to exercise significant influence over the strategic, operating,
investing, and financing activities of the investee. Accordingly, the Company
accounts for its investments in Intermolecular, Inc. using the cost method of
accounting while it accounts for its November 2006 investment in Visyx
Technologies Inc. (Visyx) using the equity method of accounting. At December 31,
2009, the carrying value of Intermolecular was $15,147,000. The Company
determines that it is not practical to estimate the fair value of the
investments in Intermolecular and believes that there are no identified events
or changes in circumstances that may have a significant adverse effect on the
fair value of the investments.
The
Company owns approximately 38% of outstanding stock of Visyx as of December 31,
2009. At December 31, 2009, the carrying value of its investment in Visyx was
$0. It did not receive any dividends from Visyx in the years ended December 31,
2009, 2008 and 2007.
Goodwill,
Intangible Assets and Other Long-Lived Assets
Goodwill
According
to the authoritative guidance on goodwill, the Company evaluated its operating
components to determine whether the components constituted a business for which
discrete financial information is available and which management regularly
reviewed the operating results of that component at either the operating segment
level or one level below the operating segment.
Based on
the evaluation of the operating segments in 2008, the Company’s two operating
segments were Symyx Software and Symyx HPR. For purposes of goodwill
evaluation, the Company allocated goodwill into three reporting units: Symyx
Software and Symyx Research and Symyx Tools. Symyx Research and Symyx Tools
comprised the Symyx HPR operating segment.
In 2009,
due to the change in Symyx’s business and therefore combination of Symyx
Research and Symyx Tools within the HPR operating segment, the Company allocated
goodwill into two reporting units: Symyx Software and Symyx HPR, consistent with
our segment disclosure described in Note 6 of the Notes to Consolidated
Financial Statements.
Testing
goodwill for impairment requires a two-step approach under the authoritative
guidance on goodwill and other intangible assets. In determining the fair value
of its reporting units in step one of its goodwill and other intangible assets
impairment analysis, the Company uses a combination of the income approach,
which is based on the present value of discounted cash flows and terminal value
projected for the reporting unit, and the market approach, which estimates fair
value based on an appropriate valuation multiple of revenue or earnings derived
from comparable companies, adjusted by an estimated control premium. These
calculations are dependent on several subjective factors including the timing of
future cash flows, future growth rates, the discount rate, and a selection of
peer market transactions. The discount rate that the Company uses in the income
approach of valuation represents the weighted average cost of capital that the
Company believes is reflective of the relevant risk associated with the
projected cash flows.
If the
estimated fair value of a reporting unit’s goodwill exceeds its net book value,
the Company concludes that its goodwill is not impaired. Otherwise, the Company
performs step two of the above test to compare the estimated implied fair value
of goodwill to its carrying value. The excess carrying value of goodwill as
compared to the implied is recorded as a goodwill impairment.
SYMYX
TECHNOLOGIES, INC.
NOTES
TO CONSOLIDATED FINANCIAL STATEMENTS (CONTINUED)
In the
fourth quarter of 2009, the Company conducted an impairment analysis of goodwill
and concluded that there was no more impairment to goodwill. In the fourth
quarter of 2008, the Company concluded that the carrying amounts of goodwill
exceeded the implied fair value of goodwill in the Symyx Software and Symyx
Research reporting units and recorded an impairment charge.
Long
Lived Assets
In
accordance with the authoritative guidance on accounting for the impairment or
disposal of long-lived assets, the Company tests other long-lived assets,
including property, equipment and leasehold improvements and other intangible
assets subject to amortization, for recoverability whenever events or changes in
circumstances indicate that the carrying value of those assets may not be
recoverable.
For
purposes of grouping long lived assets for impairment evaluation, the Company
grouped the assets at the lowest level for which identifiable cash flows are
largely independent of the cash flows of other assets and
liabilities.
In 2008,
the Company was able to identify cash flows for the Symyx Software, Symyx
Research and Symyx Tools groups. In 2009, due to the change in
business and combination of the Symyx Research and Symyx Tools activities, the
Company grouped the long lived assets into the lowest level of identifiable cash
flows of Symyx Software and Symyx HPR.
The
Company assesses the recoverability of an asset group by determining if the
carrying value of the asset group exceeds the sum of the projected undiscounted
cash flows expected to result from the use and eventual disposition of the
assets over the remaining economic life of the primary asset in the asset group.
If the recoverability test indicates that the carrying value of the asset group
is not recoverable, the Company will estimate the fair value of the asset group
using the same approaches indicated above for step two of the authoritative
guidance on accounting for the impairment or disposal of long-lived assets and
compare it to its carrying value. The excess of the carrying value over the fair
value is allocated pro rata to derive the adjusted carrying value. The adjusted
carrying value of each asset in the asset group is not reduced below its fair
value.
In the
fourth quarter of 2009, the Company conducted an impairment analysis of other
long-lived assets and concluded no impairment should be recorded, except
for the $327,000 related to the Integrity Bio additional purchase consideration
as discussed in Note 7. In the fourth quarter of 2008, due to the
significant decline of its market capitalization, the Company also performed an
impairment test of long-lived assets. As a result of this analysis, the Company
concluded that the carrying amounts of intangibles and other long-lived assets
in Symyx Research and Symyx Tools reporting units exceeded their implied fair
values and recorded an impairment charge.
Based on
the impairment analysis conducted in the fourth quarter of 2008, the Company
recorded the following impairment charges by reporting unit (in
thousands):
|
Goodwill
|
Intangible
Assets
|
Plant,
Property and Equipment
|
Total
|
|||||||||||||
|
Symyx
Software
|
$ | 71,085 | $ | - | $ | - | $ | 71,085 | ||||||||
|
Symyx
HPR:
|
- | |||||||||||||||
|
Symyx
Research
|
5,404 | 1,760 | 7,676 | 14,840 | ||||||||||||
|
Symyx
Tools
|
814 | 3,591 | 4,405 | |||||||||||||
|
Total
impairment charges
|
$ | 76,489 | $ | 2,574 | $ | 11,267 | $ | 90,330 | ||||||||
The
following table illustrates the change in the Company’s goodwill in 2009 and
2008 by business segment (in thousands):
SYMYX
TECHNOLOGIES, INC.
NOTES
TO CONSOLIDATED FINANCIAL STATEMENTS (CONTINUED)
|
Symyx
Software
|
Symyx
HPR
|
Total
|
||||||||||
|
Balance
as of January 1, 2008
|
$ | 113,699 | $ | 411 | $ | 114,110 | ||||||
|
Goodwill
acquired during the period
|
- | 5,440 | 5,440 | |||||||||
|
Goodwill
impairment
|
(71,085 | ) | (5,404 | ) | (71,085 | ) | ||||||
|
Adjustments
to goodwill
|
(3,075 | ) | (7 | ) | (8,486 | ) | ||||||
|
Balance
as of December 31, 2008
|
$ | 39,539 | $ | 440 | $ | 39,979 | ||||||
|
Goodwill
acquired during the period
|
- | - | - | |||||||||
|
Goodwill
impairment
|
(327 | ) | - | (327 | ) | |||||||
|
Adjustments
to goodwill
|
(21 | ) | 9 | (12 | ) | |||||||
|
Balance
as of December 31, 2009
|
$ | 39,191 | $ | 449 | $ | 39,640 | ||||||
Intangible
assets, with the exception of goodwill which is not subject to amortization, are
amortized using the straight-line method over their estimated period of benefit,
ranging from one to eight years. See Note 11 of the Notes to Consolidated
Financial Statements for detail.
Property,
plant and equipment are stated at cost. Depreciation of equipment is computed
using the straight-line method over lives of three to five years for financial
reporting purposes and by accelerated methods for income tax purposes.
Depreciation of buildings is computed using the straight-line method over lives
of 30 years for financial reporting purposes. Leasehold improvements are
amortized over the shorter of the lease term or the estimated useful life of the
assets for financial reporting purposes and over a maximum 40-year period for
income tax reporting purposes. Property, plant and equipment consist of the
following (in thousands):
|
December 31,
|
||||||||
|
2009
|
2008
|
|||||||
|
Machinery
and equipment
|
$ | 31,033 | $ | 34,958 | ||||
|
Computers
and software
|
12,134 | 10,314 | ||||||
|
Land
and building
|
3,551 | 3,551 | ||||||
|
Leasehold
improvements
|
32,458 | 27,035 | ||||||
|
Construction
in progress
|
2,356 | 1,913 | ||||||
|
Furniture
and fixtures
|
2,812 | 2,801 | ||||||
|
Property,
plant and equipment, gross
|
84,344 | 80,572 | ||||||
|
Less
accumulated depreciation and amortization
|
(67,312 | ) | (62,125 | ) | ||||
|
Property,
plant and equipment, net
|
$ | 17,032 | $ | 18,447 | ||||
At
December 31, 2009, all property, plant and equipment were pledged as collateral
under the Company’s bank credit facility as detailed in Note 5 of the Notes to
Consolidated Financial Statements. Amortization of leasehold improvements is
included in depreciation expense. Depreciation expense was $5,163,000,
$11,078,000 and $10,818,000 in 2009, 2008 and 2007, respectively.
Revenue
Recognition
The
Company recognizes non-software and single deliverable arrangements in
accordance with the authoritative guidance on revenue recognition, and other
authoritative accounting literature. We recognize all software arrangements in
accordance with the authoritative guidance on software revenue recognition and
all multiple element arrangements in accordance with the authoritative guidance
on multiple-deliverable revenue recognition. The Company generates revenue from
services provided under research collaborations, the sale of products, the
license of software, the provision of support and maintenance and other
services, and the license of intellectual property. It is possible for the
Company’s customers to work with it in multiple areas of its business and
contracts may include multiple elements such as service revenue, product
revenue, license revenue, and royalty revenue. In determining the basis for
non-software product revenue recognition, the Company first determines the fair
value of any extended warranty services and defers this revenue to be recognized
ratably over the warranty service period. For those non-software product sales
contracts that involve multiple element deliverables, the Company identifies all
deliverables, determines the units of accounting and allocates revenue among the
units of accounting in accordance with the authoritative guidance on
multi-deliverable revenue recognition. In a multiple-element arrangement that
includes software that is more than incidental to the products or services as a
whole, the Company recognizes revenue from the software and software-related
elements, as well as any non-software deliverable(s) for which a software
deliverable is essential to its functionality, in accordance with the
authoritative guidance on software revenue recognition.
SYMYX
TECHNOLOGIES, INC.
NOTES
TO CONSOLIDATED FINANCIAL STATEMENTS (CONTINUED)
Service
Revenue
The
Company recognizes service revenue from research service agreements, software
consulting, and support and maintenance agreements based upon the performance
requirements of the agreements. Payments received prior to performance are
deferred and recognized as revenue when earned over future performance periods.
Research agreements specify minimum levels of research effort required to be
performed by the Company. Payments received under research agreements are not
refundable if the research effort is not successful. Direct costs associated
with research services are included in research and development expense.
Software consulting agreements specify the number of days of consulting services
to be provided by the Company. Support and maintenance agreements specify the
term of the product maintenance and the nature of the services to be provided by
the Company during the term.
Non-refundable
up-front payments received in connection with research and development
collaboration agreements, including technology access fees, are deferred and
recognized on a straight-line basis over the relevant periods specified in the
agreement, generally the research term. Research revenue is either recognized as
research service time is delivered to the customer or as the results of research
experiments are delivered to the customer over the term of the agreement.
Revenue from milestone payments, which are substantially at risk until the
milestones are completed, is recognized upon completion of these milestone
events. Milestone payments to date have been immaterial.
Revenue
allocable to support and maintenance is recognized on a straight-line basis over
the period the support and maintenance is provided. The Company’s software
maintenance may provide for technical support, bug fixes, and rights to
unspecified upgrades on a when-and-if-available basis for periods defined within
the services contract. Revenue related to this post-contract customer support is
deferred and recognized ratably over the term of the contracted
support.
For many
customers, the Company has developed custom software applications and other
protocals that are typically invoiced on a time and materials basis. These
custom development projects are generally not sold in connection with a new
software license deal, but rather to customers that have been using the
Company’s software products for an extended period of time. Revenue from these
arrangements is non-refundable and is usually recognized on a monthly basis as
the services are delivered and invoiced.
Extended
product maintenance contracts, which typically provide both extended warranty
coverage and product maintenance services, are separately priced from the
product, and are recognized as revenue ratably over the term of the coverage.
The Company’s software licenses may provide for technical support, bug fixes,
and rights to unspecified upgrades on a when-and-if-available basis for periods
defined within the product maintenance contract. Revenue related to this
post-contract customer support is deferred and recognized over the term of the
contracted support.
Product
Sales
Product
sales revenue includes sales of tools and the license of associated software.
The Company’s tools are typically delivered under multiple-element arrangements,
which include hardware, software and intellectual property licenses, and
maintenance. A determination is made for each system delivered as to whether
software is incidental to the system as a whole. If software is not incidental
to the system as a whole, revenue from these arrangements is recognized in
accordance with the authoritative guidance on software revenue recognition. If
software is incidental to the system, revenue from the sale of the system is
earned and recognized when persuasive evidence of an arrangement exists,
delivery of the product has occurred, no significant obligations with regard to
implementation remain, the fee is fixed or determinable, and collectability is
reasonably assured. This is generally upon shipment, transfer of title to and
acceptance by the customer of the hardware and associated licenses to software
and intellectual property, unless there are extended payment terms. The Company
considers all arrangements with payment terms extending beyond twelve months not
to be fixed or determinable. If the fee is not fixed or determinable, revenue is
recognized as payments become due from the customer. In multiple element
arrangements, the Company uses the residual method to allocate revenue to
delivered elements once it has established fair value for all undelivered
elements. Payments received in advance under these arrangements are recorded as
deferred revenue until earned.
SYMYX
TECHNOLOGIES, INC.
NOTES
TO CONSOLIDATED FINANCIAL STATEMENTS (CONTINUED)
An
accrual is established for warranty expenses at the time the associated revenue
is recognized. Shipping and insurance costs associated with the sale of tools
are not material and are included in sales, general and administrative
expenses.
Software
License and Database Content Fees
Revenue
is recognized when persuasive evidence of an arrangement exists, delivery has
occurred, the fee is fixed or determinable, and collectability is probable. The
Company enters into certain arrangements where it is obligated to deliver
multiple products and/or services (multiple elements). In these transactions,
the Company allocates the total revenue among the elements based on the sales
price of each element when sold separately (Vendor-Specific Objective Evidence,
or VSOE of fair value).
If the
fair value of all elements has not been determined, the amount of revenue
allocated to undelivered elements is based on the VSOE of fair value for those
elements using the residual method. Under the residual method, the total fair
value of the undelivered elements, as indicated by VSOE, is recorded as deferred
revenue, and the difference between the total arrangement fee and the amount for
the undelivered elements is recognized as revenue related to delivered elements.
If evidence of the fair value of one or more undelivered elements does not
exist, the total revenue is deferred and recognized when delivery of those
elements occurs, when fair value for any remaining undelivered elements can be
established or when
the only remaining undelivered elements are post-contract customer support,
which the Company will recognize ratably over the term of
support.
For
software and database content licensed on an annual right to use basis, revenue
is recognized ratably over the term of the license. Revenue from multi-year
licensing arrangements are deferred at the time of billing and recognized as
revenue ratably over the maintenance and support coverage period. Certain
multi-year software licensing arrangements include rights to receive future
versions of software products on a when-and-if-available basis. For software
licensed on a perpetual basis, where the Company has not established vendor
specific objective evidence of the fair value of the software licenses and
maintenance and support (primarily the support for the Electronic Lab Notebook
software products and certain support for the products that we acquired from
MDL), the perpetual license fee is recognized ratably over the contractual
period of the bundled support and maintenance arrangements.
The
Company considers all arrangements with payment terms longer than 12 months not
to be fixed or determinable. If the fee is not fixed or determinable, revenue is
recognized as payments become due from the customer, provided all the other
revenue recognition criteria have been met.
Intellectual
Property License Fees and Royalties
Amounts
received from third parties for licenses to the Company's intellectual property
are recognized when earned under the terms of the agreements. Revenue is
recognized upon transfer of the license unless the Company has continuing
obligations for which fair value cannot be established, in which case the
revenue is recognized ratably over the period of the obligation. If there are
extended payment terms, license fee revenue is recognized as these payments
become due. The Company considers all arrangements with payment terms extending
beyond 12 months not to be fixed or determinable. If there is a provision in the
licensing agreement for a variable fee in addition to a non-refundable minimum
amount, the amount of the non-refundable minimum guarantee is recognized upon
transfer of the license unless the Company has continuing obligations for which
fair value cannot be established and the amount of the variable fee in excess of
the guaranteed minimum is recognized as revenue when it is fixed and
determinable.
SYMYX
TECHNOLOGIES, INC.
NOTES
TO CONSOLIDATED FINANCIAL STATEMENTS (CONTINUED)
Royalty
revenue is recorded based on reported sales by third-party licensees of products
containing the Company’s software and intellectual property. If there are
extended payment terms, royalty revenues are recognized as these payments become
due. Non-refundable royalties, for which there are no further performance
obligations, are recognized when due under the terms of the
agreements.
Amounts
received from third parties for options to license certain technology or enter
collaborative arrangements upon specified terms are deferred until either the
option is exercised or expires.
Concentration
of Revenue
During
the years ended December 31, 2009, 2008 or 2007, the following customers
contributed more than 10% of the Company’s total revenue for the year (in
thousands):
|
Years
Ended December 31,
|
||||||||||||
|
2009
|
2008
|
2007
|
||||||||||
|
ExxonMobil
|
$ | 13,747 | $ | 24,514 | $ | 36,489 | ||||||
|
Dow
|
25,522 | 28,681 | 35,301 | |||||||||
|
Total
|
$ | 39,269 | $ | 53,195 | $ | 71,790 | ||||||
The
revenue from the above customers has been included in the following reportable
segments for the years ended December 31, 2009, 2008 and 2007 (in
thousands):
|
Years
Ended December 31,
|
||||||||||||
|
2009
|
2008
|
2007
|
||||||||||
|
Symyx
Software
|
$ | 7,617 | $ | 9,744 | $ | 9,343 | ||||||
|
Symyx
HPR
|
31,652 | 43,451 | 62,447 | |||||||||
|
Total
|
$ | 39,269 | $ | 53,195 | $ | 71,790 | ||||||
The
revenue from the above customers has been included in the consolidated
statements of operations as follows (in thousands):
|
Years
Ended December 31,
|
||||||||||||
|
2009
|
2008
|
2007
|
||||||||||
|
Service
revenue
|
$ | 17,711 | $ | 24,323 | $ | 35,939 | ||||||
|
Product
sales
|
7,487 | 14,055 | 16,472 | |||||||||
|
License
fees, content revenue and royalties
|
14,071 | 14,817 | 19,379 | |||||||||
|
Total
|
$ | 39,269 | $ | 53,195 | $ | 71,790 | ||||||
Inventory
Raw
materials inventory consists of purchased parts. Work-in-process inventory
consists of purchased parts and fabricated sub-assemblies for Symyx tools in the
process of being built. The Company does not have finished goods inventory that
have been finished but are pending shipment to customers. Inventories are
carried at the lower of cost or market, with cost determined on a specific
identification basis. The Company’s inventory balances at December 31, 2009 and
December 31, 2008 were as follows (in thousands):
SYMYX
TECHNOLOGIES, INC.
NOTES
TO CONSOLIDATED FINANCIAL STATEMENTS (CONTINUED)
|
December 31,
|
||||||||
|
2009
|
2008
|
|||||||
|
Raw
Materials
|
$ | - | $ | 20 | ||||
|
Work-in-process
|
1,956 | 3,288 | ||||||
|
Total
|
$ | 1,956 | $ | 3,308 | ||||
Accounts
Receivable and Allowance for Doubtful Accounts
Trade
accounts receivable are recorded at the invoiced amount and do not bear
interest.
The
Company assesses its allowance for doubtful accounts based on a combination of
factors. In cases where the Company is aware of circumstances that may impair a
specific customer’s ability to meet its financial obligations to us, the Company
records a specific allowance against amounts due and thereby reduces the net
recognized receivable to the amount it reasonably believes will be collected.
For all other customers, the Company records allowances for doubtful accounts
based on the length of time the receivables are past due, the current business
environment and its historical experience.
For the
years ended December 31, 2009 and 2008, the Company’s allowance for doubtful
accounts changed as follows (in thousands):
|
2009
|
2008
|
|||||||
|
Balance
as of January 1
|
$ | 356 | $ | 53 | ||||
|
New
allowance recorded
|
- | 336 | ||||||
|
Accounts
written-off
|
(200 | ) | (33 | ) | ||||
|
Balance
as of December 31
|
$ | 156 | $ | 356 | ||||
Accrued
Warranty
The
Company provides a warranty on each Symyx tool shipped. The specific terms and
conditions of these warranties vary depending upon the products sold and country
in which the Company delivers the products. These warranties typically include
coverage for parts and labor and software bug fixes, for a specified period
(typically one year). The Company estimates the costs that may be incurred under
its basic limited warranty and records a liability in the amount of such costs
at the time product revenue is recognized. Factors that affect the Company’s
warranty liability include the number of installed units, historical and
anticipated rates of warranty claims, and cost per claim. The Company
periodically assesses the adequacy of its recorded warranty liabilities and
adjusts the amounts as necessary.
Changes
in the Company’s accrued warranty during the years ended December 31, 2009 and
2008 are as follows (in thousands):
SYMYX
TECHNOLOGIES, INC.
NOTES
TO CONSOLIDATED FINANCIAL STATEMENTS (CONTINUED)
|
2009
|
2008
|
|||||||
|
Balance
as of January 1
|
$ | 1,409 | $ | 1,728 | ||||
|
New
warranties issued during the period
|
834 | 983 | ||||||
|
Costs
incurred during the period on specific systems
|
(798 | ) | (603 | ) | ||||
|
Changes
in liability for pre-existing warranties during the period, including
expirations
|
(596 | ) | (699 | ) | ||||
|
Balance
as of December 31
|
$ | 849 | $ | 1,409 | ||||
Research
and Development
The
Company’s policy is to expense as incurred all costs of research and
development, including direct and allocated expenses, related both to costs
incurred on its own behalf and on behalf of its customers. The types of costs
classified as research and development expense include salaries of technical
staff, consultant costs, chemical and scientific supplies costs, facilities
rental, and utilities costs related to laboratories and offices occupied by
technical staff, depreciation on equipment and facilities used by technical
staff and outside services, such as machining and third-party research and
development costs.
The
Company has entered into a number of multi-year research and development
collaborations to perform research for partners in exclusive fields over
multiple years. The major collaborative arrangements have similar contractual
terms and are non-cancelable other than for material breach or certain other
conditions. Under the collaborative arrangements, the Company is responsible for
performing research as defined in the agreements, including synthesis,
screening, and informatics. The partner, in turn, is entitled to develop and
commercialize materials discovered in or under collaboration within the defined
field. The Company typically receives research and development funding at
specified amounts per full time equivalent employee working on the project and
is entitled to receive royalties on the sale of any products commercialized
under the agreement or payments on the achievement of specified research
milestones. The agreements also contain procedures by which the Company and the
partner will determine royalty rates for the sale or license of products under
the agreements.
The table
below indicates the significant collaborative partners for whom the Company
conducted research and development in 2009, 2008 or 2007, together with the
primary focus of the collaborations. In addition to these partners the Company
has a number of other undisclosed partners, none of which individually
constituted more than 5% of total revenue in these years:
|
Partner
|
Current Research Contract
Ends
|
Primary focus of current collaborative
efforts
|
||
|
Dow
|
12/31/2009
|
Basic
and Specialty chemicals and materials research
|
||
|
ExxonMobil
|
5/31/2008
|
Catalyst
and process development for basic chemicals and refining
applications
|
The
Company does not track or allocate actual costs by collaboration or project, as
the requirement from its collaborative partners is to staff the various projects
on a full-time-equivalent (“FTE”) employee basis. Accordingly, the Company
tracks the hours incurred by assigned research scientists and engineers to each
project. Based on hours spent on each project, the Company estimates the
research and development efforts undertaken for various projects were as
follows:
|
2009
|
2008
|
2007
|
||||||||||
|
Customer-sponsored
projects
|
28 | % | 37 | % | 55 | % | ||||||
|
Internally-funded
projects
|
72 | % | 63 | % | 45 | % | ||||||
|
Total
|
100 | % | 100 | % | 100 | % | ||||||
SYMYX
TECHNOLOGIES, INC.
NOTES
TO CONSOLIDATED FINANCIAL STATEMENTS (CONTINUED)
Income
Taxes
Income
taxes have been provided using the liability method. Deferred tax assets and
liabilities are determined based on the difference between the financial
statement and tax bases of assets and liabilities as measured by the enacted tax
rates which will be in effect when these differences reverse. The Company
provides a valuation allowance against net deferred tax assets if, based upon
the available evidence, it is not more likely than not that the deferred tax
assets will be realized.
Software
Development Costs
The
authoritative guidance on accounting for the costs of computer software to be
sold, leased or otherwise marketed, requires the capitalization of certain
software development costs subsequent to the establishment of technological
feasibility. The Company determined that the technological feasibility of its
software products is established only upon the completion of a product design, a
working model and the confirmation of the completeness of the working model
against the product design. Costs incurred by the Company between the completion
of the working model and the point at which the product is ready for the general
release have been insignificant. Accordingly, the Company has charged all such
costs to research and development expense in the period incurred.
Employee
Savings Plan
The
Company has a savings plan in the United States that qualifies under Section
401(k) of the Internal Revenue Code. Participating U.S. employees may contribute
up to 60% of their pretax salary, but not more than statutory limits. For each
dollar a participant contributes under this plan, the Company makes employer
contribution to the plan of 50 cents, with a maximum matching contribution of 2%
of a participant’s earnings. Matching contributions for the plan were $924,000,
$1,010,000 and $795,000 in 2009, 2008 and 2007, respectively. Symyx common stock
is not an investment option under the plan.
The
Company participates in defined contribution plans in non-U.S. locations.
Contributions to defined contribution plans are expensed when employees have
rendered services in exchange for such contributions, generally in the year of
contribution. Employer contributions for the plans were approximately $372,000,
$300,000 and $205,000 in 2009, 2008 and 2007, respectively.
Foreign
Currency Translation
The
Company accounts for foreign currency translation in accordance with the
authoritative guidance on foreign currency translation. The Company translates
the assets and liabilities of its international non-U.S. dollar functional
currency subsidiaries into U.S. dollars at the rates of exchange in effect on
the balance sheet date. Revenue and expenses are translated using rates that
approximate those in effect during the period. Translation adjustments are
included in stockholders’ equity in the Consolidated Balance Sheet caption
“Accumulated other comprehensive income.” Currency transaction losses derived
from monetary assets and liabilities such as accounts receivable stated in a
currency other than the functional currency and recognized in results of
operations were $410,000, $1,963,000 and $162,000 for the years ended December
31, 2009, 2008 and 2007, respectively. The effect of foreign currency rate
changes on cash and cash equivalents was an increase of $86,000 in 2009 and
decreases of $172,000 and $498,000 for the years ended December 31, 2008 and
2007, respectively.
Deferred
Costs
Occasionally,
the Company enters into certain software consulting service and tool product
arrangements under which all revenue is deferred until elements of the
arrangements are delivered in the future. In these cases, the direct variable
expenses, not exceeding the revenue deferred, are deferred and included in other
current assets on the balance sheet until the revenue is recognized. Direct
variable expenses include direct labor costs and direct services contracts with
third parties working on the software service arrangements. As of December 31,
2009 and 2008, the Company deferred approximately $880,000 and $2,162,000,
respectively, of direct variable expenses related to software consulting service
and tools product arrangements in which the revenue is deferred until future
periods. The deferred amounts meet the definition of assets. They are related to
future elements of enforceable contracts and will result in positive margins
when the Company recognizes them.
SYMYX
TECHNOLOGIES, INC.
NOTES
TO CONSOLIDATED FINANCIAL STATEMENTS (CONTINUED)
To
account for deferred costs for contracts for which revenue recognition falls
within the scope of FASB ASC No. 605-10-S25, Revenue Recognition
(previously referenced as Staff Accounting Bulletin 104), the Company has
applied FASB ASC No. 310, Accounting for Nonrefundable Fees
and Costs Associated with Originating or Acquiring Loans and Initial Direct
Costs of Leases (as amended), previously
referred to as SFAS No. 91.
For
contracts for which revenue recognition falls within FASB ASC No. 605-35, Accounting for Performance of
Construction-Type and Certain Production-Type Contracts, previously
referred to as AICPA Accounting Statements of Positions No. 81-1, the Company
has applied the guidance contained therein to account for the related deferred
costs.
Fair
Value Measurements
In
September 2006, the FASB issued ASC No. 820, Fair Value Measurements (ASC
820), and previously referred to as Statement No. 157). The accounting
pronouncement establishes a three-level hierarchy which prioritizes the inputs
used in measuring fair value. In general, fair value determined by Level 1
inputs utilize quoted prices in active markets for identical assets or
liabilities. Fair values determined by Level 2 inputs utilize data points that
are observable such as quoted prices, interest rates and yield curves. Fair
values determined by Level 3 inputs are unobservable data points for the asset
or liability, and includes situations in which there is little, if any, market
activity for the asset or liability. Included in the cash and cash equivalent
balances were the fair value of the Company’s cash equivalents of $67,401,000
and $51,999,000 at December 31, 2009 and 2008, respectively, based on Level 1
inputs. Effective January 1, 2009, the Company adopted the provisions
under ASC 820 for valuation of nonfinancial assets and nonfinancial liabilities.
The adoption of such provisions did not impact the Company’s financial position,
results of operations or cash flows.
Comprehensive
Income
The
components of other comprehensive income consist of unrealized gains and losses
on marketable securities and foreign currency translation adjustments, both net
of tax. Comprehensive income has been disclosed in the statement of
stockholders' equity for all periods presented.
The
components of accumulated other comprehensive income at December 31, 2009, 2008
and 2007 are as follows (in thousands):
|
Foreign
Currency Translation Adjustments
|
Unrealized
Gain (Loss) On Available-For-Sale Securities
|
Total
|
||||||||||
|
Balance
at January 1, 2007
|
$ | (28 | ) | $ | 24 | $ | (4 | ) | ||||
|
Foreign
currency translation adjustment
|
628 | - | 628 | |||||||||
|
Unrealized
gain on available-for-sale securities
|
- | (23 | ) | (23 | ) | |||||||
|
Balance
at December 31, 2007
|
600 | 1 | 601 | |||||||||
|
Foreign
currency translation adjustment
|
2,006 | - | 2,006 | |||||||||
|
Unrealized
gain on available-for-sale securities
|
- | (1 | ) | (1 | ) | |||||||
|
Balance
at December 31, 2008
|
2,606 | - | 2,606 | |||||||||
|
Foreign
currency translation adjustment
|
(15 | ) | - | (15 | ) | |||||||
|
Balance
at December 31, 2009
|
$ | 2,591 | $ | - | $ | 2,591 | ||||||
Effect
of New Accounting Pronouncements
FASB
Accounting Standard Update (ASU) No. 2010-06, Improving Disclosures about Fair
Value Measurements, requires disclosures about inputs and valuation
techniques used to measure fair value as well as disclosures about significant
transfers, beginning in the first quarter of 2010. Additionally, these amended
standards require presentation of disaggregated activity within the
reconciliation for fair value measurements using significant unobservable inputs
(Level 3), beginning in the first quarter of 2011. The Company does not expect
these new standards to significantly impact its consolidated financial
statements.
FASB ASC
No. 810, Amendments to FASB
Interpretation No. 46(R) (ASC 810, and formerly referred to as SFAS No.
167), makes significant changes to the model for determining who should
consolidate a variable interest entity, and also addresses how often this
assessment should be performed. ASC 810 will be effective for the Company
beginning in the first quarter of 2010. The Comany is assessing the impact of
the adoption of this standard on its financial statements particularly in
connection with the divestiture of the HPR business.
SYMYX
TECHNOLOGIES, INC.
NOTES
TO CONSOLIDATED FINANCIAL STATEMENTS (CONTINUED)
FASB ASU
No. 2009-13, Revenue
Recognition: Multiple-Deliverable Revenue Arrangements—a consensus of the FASB
Emerging Issues Task Force, which eliminates the use of the residual
method for allocating consideration, as well as the criteria that require
objective and reliable evidence of fair value of undelivered elements in order
to separate the elements in a multiple-element arrangement. By removing the
criteria requiring the use of objective and reliable evidence of fair value in
separately accounting for deliverables, the recognition of revenue will more
closely align with certain revenue arrangements. The standard also will replace
the term "fair value" in the revenue allocation guidance with "selling price" to
clarify that the allocation of revenue is based on entity-specific assumptions
rather than assumptions of a marketplace participant. ASU No. 2009-13 is
effective for revenue arrangements entered or materially modified in fiscal
years beginning on or after June 15, 2010. The Company elected early adoption as
of January 1, 2010 and is currently assessing the potential impact of this
standard.
FASB ASU No.
2009-14, Software: Certain
Revenue Arrangements that Include Software Elements—a consensus of the FASB
Emerging Issues Task Force, which will significantly improve the
reporting of certain transactions to more closely reflect the underlying
economics of the transactions. By excluding from its scope certain
software-enabled devices, multiple-element arrangements that include such
software-enabled devices will now be evaluated for separation and allocation
using the guidance in ASU No. 2009-13 (described above). ASU No. 2009-14 is
effective for revenue arrangements entered or materially modified in fiscal
years beginning on or after June 15, 2010. Early adoption as of January 1, 2010
is permitted but not elected by the Company. The Company is currently assessing
the potential impact of this standard, but does not expect the adoption of the
standard will have a material impact on the financial condition or results of
operations of the Company.
2. Net
Income (Loss) per Share
Basic net
income (loss) per share has been computed using the weighted-average number of
shares of common stock outstanding during the period. Diluted net income (loss)
per share has been calculated based on the shares used in the calculation of
basic net income (loss) per share and the dilutive effect of stock options,
restricted stock and restricted stock units.
The
following table presents the calculation of basic and diluted net income (loss)
per share (in thousands, except per share data):
|
Years
Ended December 31,
|
||||||||||||
|
2009
|
2008
|
2007
|
||||||||||
|
Net
income (loss)
|
$ | (1,138 | ) | $ | (106,616 | ) | $ | 18,784 | ||||
|
Weighted-average
shares of common stock outstanding
|
34,321 | 33,765 | 33,301 | |||||||||
|
Less:
weighted-average restricted stock
|
- | (18 | ) | (102 | ) | |||||||
|
Weighted-average
shares used in computing basic net income (loss) per share
|
34,321 | 33,747 | 33,199 | |||||||||
|
Dilutive
effect of employee stock options and restricted stock units, using the
treasury stock method
|
- | - | 358 | |||||||||
|
Weighted-average
shares used in computing diluted net income (loss) per
share
|
34,321 | 33,747 | 33,557 | |||||||||
|
Basic
net income (loss) per share
|
$ | (0.03 | ) | $ | (3.16 | ) | $ | 0.57 | ||||
|
Diluted
net income (loss) per share
|
$ | (0.03 | ) | $ | (3.16 | ) | $ | 0.56 | ||||
SYMYX
TECHNOLOGIES, INC.
NOTES
TO CONSOLIDATED FINANCIAL STATEMENTS (CONTINUED)
The
following shares were excluded from the calculation of diluted net income (loss)
per share for 2009, 2008 and 2007, respectively, because all were anti-dilutive
for the respective periods (in thousands):
|
2009
|
2008
|
2007
|
||||||||||
|
Options
|
4,463 | 5,276 | 5,072 | |||||||||
|
Restricted
stock units
|
469 | 740 | - | |||||||||
|
Restricted
stock
|
- | - | 91 | |||||||||
|
Total
anti-dilutive shares
|
4,932 | 6,016 | 5,163 | |||||||||
3.
Commitments
Leases
The
Company has entered into various operating lease agreements for facilities with
lease terms ranging from one to 25 years. Rent expense, which is being
recognized on a straight-line basis over the lease terms, was approximately
$4,905,000, $5,610,000 and $3,902,000 for the years ended December 31, 2009,
2008 and 2007, respectively. Future commitments and obligations under the
operating leases for the Company’s facilities, to be satisfied as they become
due, are as follows (in thousands):
|
Years
ending December 31,
|
Amount
|
|||
|
2010
|
$ | 4,793 | ||
|
2011
|
4,620 | |||
|
2012
|
4,234 | |||
|
2013
|
4,098 | |||
|
2014
|
4,046 | |||
|
Thereafter
|
3,816 | |||
|
Total
|
$ | 25,607 | ||
Estimated
future rents receivable from sublease agreements through 2012, not included
above, amount to approximately $457,000. If the Divestiture closes, estimated
additional rent receivable from the sublease to HPR Global would be
approximately $3.5 million through October 31, 2015.
Other
Commitments
As of
December 31, 2009, the Company had firm purchase commitments for inventory,
fixed assets and services of approximately $4,992,000, of which it expects to
cancel or transfer approximately $1.8 million due to the Divestiture. The
Company also had committed to pay royalties to third parties on future database
content revenue of approximately $1,104,000 upon cash receipts from
customers.
As of
December 31, 2009, the Company recorded $2,322,000 liabilities associated with
uncertainties in income taxes under the authoritative guidance on accounting for
uncertainty in income taxes. The Company could not make reasonably reliable
estimates of the periods of cash settlement with the respective tax authorities
and as such has recorded the liabilities as noncurrent on its Consolidated
Balance Sheet.
As of
December 31, 2009, the Company had no amounts due under loan agreements and had
an unused line of credit with Bank of America as detailed in Note 5 of the Notes
to Consolidated Financial Statements.
Customer
Indemnification
From time
to time, the Company agrees to indemnify its customers against certain
third-party liabilities, including liability if its products infringe a third
party’s intellectual property rights. The Company accounts for such
indemnification provisions in accordance with the authoritative guidance for
guarantor’s accounting and disclosure requirements for guarantees, including
indirect guarantees of indebtedness of others. Other than for limited
exceptions (e.g., intellectual property indemnity or bodily harm), the Company’s
indemnification obligation in these arrangements is typically limited to no more
than the amount paid by the customer. As of December 31, 2009, the Company was
not subject to any material pending intellectual property-related litigation.
The Company has not received any requests for and has not been required to make
any payments under these indemnification provisions during any periods covered
in these consolidated financial statements.
SYMYX
TECHNOLOGIES, INC.
NOTES
TO CONSOLIDATED FINANCIAL STATEMENTS (CONTINUED)
4. Stockholders’
Equity
Stock
Purchase Plan
The
Company has an Employee Stock Purchase Plan (ESPP) that permits eligible
employees to purchase common stock at a discount, but only through payroll
deductions, during concurrent 12-month offering periods. Each offering period
will be divided into two consecutive six-month purchase periods. The price at
which stock is purchased under the ESPP is equal to 85% of the fair market value
of the common stock on the first or last day of the offering period, whichever
is lower. On May 4, 2009, Symyx’s Board of Directors amended and restated the
Plan to eliminate the evergreen provision, effective after the January 1, 2009
increase in such reserved share pool, and to provide that the ESPP plan shall
have an indefinite term. This amendment and restatement of the ESPP plan was not
subject to shareholder approval. The Company registered an additional 1,005,793
shares authorized under the evergreen provision of its ESPP program for years
2007 through 2009 in June 2009. As of December 31, 2009, the number of shares of
common stock available for future issue under the Purchase Plan was
1,879,110.
Stock
Option Plans
The
Company's 1996 Stock Option Plan was adopted in March 1996 and provided for the
issuance of options for up to 1,153,444 shares of common stock to employees,
directors and consultants.
During
1997, the Company's Board of Directors approved the adoption of the 1997 Stock
Option Plan with terms and conditions the same as those of the 1996 Stock Option
Plan (collectively, the Qualified Plans). The 1997 Stock Option Plan provided
for the issuance of options for up to 14,090,572 shares of common stock to
employees and consultants. In February 2007, the Qualified Plans expired and all
unissued shares under the Qualified Plans were forfeited.
In
October 2001, the Company's Board of Directors approved the adoption of the 2001
Nonstatutory Stock Option Plan (the NSO Plan). The NSO Plan provides for the
issuance of options for up to 1,000,000 shares of common stock to non-executive
employees and consultants. As of December 31, 2009, all authorized shares of
options under the NSO Plan had been granted.
At the
2007 Annual Stockholders Meeting held on June 12, 2007, the Company’s
stockholders approved the adoption of the 2007 Symyx Technologies, Inc. Stock
Incentive Plan (the 2007 Stock Plan). The 2007 Stock Plan provides for the grant
of stock options, restricted stock, restricted stock units and stock
appreciation rights (collectively, awards). Stock options granted under the 2007
Plan may be either incentive stock options under the provisions of Section 422
of the Internal Revenue Code of 1986, as amended (the Code), or nonqualified
stock options. The Compensation Committee of the Company’s Board of Directors
administers the 2007 Stock Plan. The aggregate number of shares of common stock
that may be issued pursuant to awards granted under the 2007 Stock Plan is
750,000 shares, plus any shares that would otherwise return to each of the
Company’s Qualified Plans and the Company’s NSO as a result of forfeiture,
termination or expiration of awards previously granted under each of the 1997
Plan and the 2001 Nonstatutory Plan. The maximum number of shares
with respect to which options and stock appreciation rights may be granted to a
participant during a calendar year is 750,000 shares. For awards of restricted
stock and restricted stock units that are intended to be performance-based
compensation under Section 162(m) of the Code, the maximum number of shares
subject to such awards that may be granted to a participant during a calendar
year is 750,000 shares.
SYMYX
TECHNOLOGIES, INC.
NOTES
TO CONSOLIDATED FINANCIAL STATEMENTS (CONTINUED)
At the
Company’s annual stockholder meeting on June 16, 2008, the Company’s
stockholders approved a proposal to amend the Company’s 2007 Stock Plan to
increase the total authorized shares available for grant under such plan by
4,700,000 shares and reduce the number of shares available for issuance under
the 2007 Stock Plan (i) by one share for each share of common stock subject to a
stock option or stock appreciation right; and (ii) by one and sixty-five
hundredths (1.65) shares for each share of common stock subject to any other
type of award issued under the 2007 Stock Plan. As of December 31, 2009,
5,109,887 shares were available for issuance under the 2007 Stock
Plan.
The
Company’s stockholders also approved a voluntary stock option exchange program
to allow eligible employees holding stock options with exercise prices equal to
or greater than $12.00 per share the opportunity to exchange eligible stock
options for new stock options with a lower exercise price but covering fewer
shares. The Company’s directors, executive officers, consultants and
employees with a tax residence outside of the United States were not allowed to
participate in this program. The Company completed the stock option exchange in
the third quarter of 2008. Eligible participants tendered options to purchase
2,042,812 shares of common stock in exchange for replacement options to purchase
394,509 shares of common stock under the Company’s 2007 Stock Plan, resulting in
$111,000 of incremental stock-based compensation to be amortized on a
straight-line basis over the vesting period of the replacement options (a
maximum of 2 years). The shares subject to options canceled in this program were
not returned to the 2007 Stock Plan for future issuance.
In
connection with the acquisition of IntelliChem, the Company assumed all the
unvested outstanding stock options issued pursuant to IntelliChem’s 2003 Stock
Option Plan (IntelliChem Plan) and converted them into options to purchase
44,126 shares of the Company’s common stock. In connection with the acquisition
of Synthematix, the Company assumed all the unvested outstanding stock options
issued pursuant to Synthematix’s 2000 Equity Compensation Plan (Synthematix
Plan), as amended, and converted them into options to purchase 23,876 shares of
the Company’s common stock. These options generally retained all of the rights,
terms, and conditions of the plan under which they were originally granted. As
of December 31, 2009, options to purchase 13,717 and 2,971 shares of common
stock were available for future grant under the IntelliChem Plan and Synthematix
Plan, respectively.
Stock
options granted under the Qualified Plans and 2007 Stock Plan may be either
incentive stock options or nonstatutory stock options, whereas stock options
granted under the NSO Plan are nonstatutory stock options. Options are generally
granted with exercise prices equal to the fair value of the common stock on the
grant date, as determined by the Board of Directors. The options issued under
the Qualified Plans and the NSO plan expire no more than 10 years after the date
of grant or earlier if employment or relationship as a director or consultant is
terminated. The options issued under the 2007 Stock plan expire no more than 7
years after the date of grant or earlier if employment or relationship as a
director or consultant is terminated. The Board of Directors shall determine the
times during the term when the options may be exercised and the number of shares
for which an option may be granted. Options may be granted with different
vesting terms from time to time but will provide for annual vesting of at least
20% of the total number of shares subject to the option.
SYMYX
TECHNOLOGIES, INC.
NOTES
TO CONSOLIDATED FINANCIAL STATEMENTS (CONTINUED)
A summary
of activity under all the above stock option plans is as follows:
|
Outstanding
Stock Options
|
||||||||||||
|
Weighted-
|
||||||||||||
|
Number
of
|
Exercise
|
Average
|
||||||||||
|
Shares
|
Price
|
Exercise
Price
|
||||||||||
|
Balance
at January 1, 2007
|
6,762,592 | $ | 0.19 - $58.25 | $ | 27.35 | |||||||
|
Options
granted
|
1,423,500 | $ | 4.29 - $ 8.58 | $ | 6.68 | |||||||
|
Options
exercised
|
(96,122 | ) | $ | 0.39 - $18.95 | $ | 6.55 | ||||||
|
Options
cancelled
|
(1,222,527 | ) | $ | 0.19 - $57.00 | $ | 28.31 | ||||||
|
Balance
at December 31, 2007
|
6,867,443 | $ | 0.39 - $58.25 | $ | 23.18 | |||||||
|
Options
granted
|
2,038,009 | $ | 3.03 - $26.19 | $ | 6.20 | |||||||
|
Options
exercised
|
(30,451 | ) | $ | 0.39 - $10.47 | $ | 2.72 | ||||||
|
Options
cancelled
|
(3,599,230 | ) | $ | 0.96 - $58.25 | $ | 27.24 | ||||||
|
Balance
at December 31, 2008
|
5,275,771 | $ | 0.51 - $57.00 | $ | 13.97 | |||||||
|
Options
granted
|
130,000 | $ | 4.56 - $5.83 | $ | 4.85 | |||||||
|
Options
exercised
|
(113,185 | ) | $ | 0.96 - $6.43 | $ | 3.82 | ||||||
|
Options
cancelled
|
(829,348 | ) | $ | 0.96 - $31.53 | $ | 11.03 | ||||||
|
Balance
at December 31, 2009
|
4,463,238 | $ | 0.51 - $57.00 | $ | 14.51 | |||||||
At
December 31, 2009, 2008 and 2007, vested and outstanding options for the
purchase of 2,563,991, 2,354,850, and 5,411,627 shares of common stock were
exercisable at weighted-average exercise prices of $20.96, $23.76 and $27.53,
respectively.
An
analysis of options outstanding at December 31, 2009 is as follows:
|
Options
Exercisable
|
|||||||||||||||||||||||||
|
Exercise
Price
|
Options
Outstanding at December 31, 2009
|
Weighted-Average
Remaining Contractual Life (in years)
|
Weighted-Average
Exercise Price
|
Oustanding
at December 31, 2009
|
Weighted-Average
Remaining Contractual Life (in years)
|
Weighted-Average
Exercise Price
|
|||||||||||||||||||
| $0.51 - $2.63 | 14,515 | 5.0 | $ | 2.30 | 14,515 | 5.0 | $ | 2.30 | |||||||||||||||||
| $3.03 - $4.56 | 1,582,832 | 5.1 | $ | 3.86 | 400,681 | 5.9 | $ | 3.68 | |||||||||||||||||
| $5.83 - $9.49 | 680,501 | 3.8 | $ | 8.10 | 180,001 | 3.7 | $ | 8.12 | |||||||||||||||||
| $9.51 - $14.75 | 890,751 | 3.8 | $ | 12.35 | 674,155 | 3.4 | $ | 12.85 | |||||||||||||||||
| $15.30 - $23.22 | 247,334 | 3.0 | $ | 17.43 | 247,334 | 3.0 | $ | 17.43 | |||||||||||||||||
| $23.78 - $57.00 | 1,047,305 | 2.3 | $ | 36.09 | 1,047,305 | 2.3 | $ | 36.09 | |||||||||||||||||
| 4,463,238 | 3.9 | $ | 14.51 | 2,563,991 | 3.3 | $ | 20.96 | ||||||||||||||||||
The
aggregate intrinsic values for the above outstanding and exercisable stock
options were $2,650,000 and $775,000, respectively. The aggregate intrinsic
value is calculated as the difference between the exercise price of the
underlying awards and the close price of the Company’s common stock for
in-the-money options at December 31, 2009. During the years ended December 31,
2009, 2008 and 2007, the aggregate intrinsic value of options exercised under
the Company’s stock option plans was $213,000, $123,000 and $859,000,
respectively. The aggregated fair value of stock options vested during 2009,
2008 and 2007 was $1,912,000, $99,000 and $1,330,000, respectively. As of
December 31, 2009, $3,379,000 of total unrecognized compensation cost related to
unvested stock options granted and outstanding is expected to be amortized over
a weighted-average period of one year.
The
Company granted stock options to purchase 130,000, 2,038,009 and 1,423,500
shares of common stock in 2009, 2008 and 2007, respectively. Included in option
granted in 2008 were options to purchase 394,509 shares of common stock from the
Company’s option exchange program. Included in options granted in 2007 were
options to purchase 620,000 shares of common stock granted to non-executive
employees at an exercise price equal to 50% of the grant date fair market value.
The weighted-average grant date fair value of options granted (excluding the
shares from stock option exchange program where only incremental charges were
recorded) during the years ended December 31, 2009, 2008 and 2007 were $2.64,
$2.15 and $4.08, respectively. The Company valued options granted in 2009, 2008
and 2007 using the Black-Scholes method with the following weighted-average
valuation assumptions:
SYMYX
TECHNOLOGIES, INC.
NOTES
TO CONSOLIDATED FINANCIAL STATEMENTS (CONTINUED)
|
2009
|
2008
|
2007
|
||||||||||
|
Expected
dividend
|
0 | % | 0 | % | 0 | % | ||||||
|
Risk-free
interest rate
|
2.2 | % | 2.0 | % | 4.3 | % | ||||||
|
Expected
volatility
|
69 | % | 57 | % | 44 | % | ||||||
|
Expected
life (in years)
|
4.3 | 4.3 | 3.5 | |||||||||
The
computation of expected volatility is based on historical volatility. Expected
life is calculated using
simplified method, due to significant differences in the vesting terms and
contractual life of current option grants compared to the Company’s historical
grants. The interest rate for periods within the contractual life of the
award is based on the U.S. Treasury yield curve in effect at the time of
grant.
The
Company also granted restricted stock units to its employees and members of the
Board of Directors under its stock option plans. The fair value of the Company’s
restricted stock units was calculated based upon the fair market value of the
Company’s stock at the date of grant. As of December 31, 2009, $1,544,000 of
total unrecognized compensation cost related to unvested restricted stock units
granted is expected to be amortized over a weighted-average period of one year.
The Company plans to issue new common stock to settle the restricted stock
units. During the years ended December 31, 2009, 2008 and 2007, the
Company paid $535,000, $499,000 and $1,956,000, respectively, in cash for
employee withholding taxes in lieu of issuing common stock upon vesting of
restricted stock units.
The
following table illustrates the changes in status of the Company’s restricted
stock units and restricted stock during the years ended December 31, 2009, 2008
and 2007:
|
Restricted
Stock Units
|
Restricted
Stock
|
|||||||||||||||
|
Shares
|
Weighted-Average
Grant-Date Fair Value
|
Shares
|
Weighted-Average
Grant-Date Fair Value
|
|||||||||||||
|
Unvested
at January 1, 2007
|
328,050 | $ | 29.05 | - |
na
|
|||||||||||
|
Granted
|
595,011 | $ | 17.26 | 176,400 | $ | 18.06 | ||||||||||
|
Vested
|
(325,406 | ) | $ | 29.05 | - |
na
|
||||||||||
|
Cancelled
|
(152,169 | ) | $ | 17.79 | (85,300 | ) | $ | 17.96 | ||||||||
|
Unvested
at December 31, 2007
|
445,486 | $ | 17.16 | 91,100 | $ | 18.15 | ||||||||||
|
Granted
|
635,953 | $ | 3.93 | - |
na
|
|||||||||||
|
Vested
|
(226,590 | ) | $ | 16.76 | - |
na
|
||||||||||
|
Cancelled
|
(114,829 | ) | $ | 17.35 | (91,100 | ) | $ | 18.15 | ||||||||
|
Unvested
at December 31, 2008
|
740,020 | $ | 5.88 | - |
na
|
|||||||||||
|
Granted
|
68,646 | $ | 5.73 | - |
na
|
|||||||||||
|
Vested
|
(305,335 | ) | $ | 7.41 | - |
na
|
||||||||||
|
Cancelled
|
(34,374 | ) | $ | 4.81 | - |
na
|
||||||||||
|
Unvested
at December 31, 2009
|
468,957 | $ | 4.94 | - |
na
|
|||||||||||
During
the years ended December 31, 2009, 2008 and 2007, the Company valued awards
under the ESPP using the Black-Scholes method with the following
weighted-average valuation assumptions:
SYMYX
TECHNOLOGIES, INC.
NOTES
TO CONSOLIDATED FINANCIAL STATEMENTS (CONTINUED)
|
2009
|
2008
|
2007
|
||||||||||
|
Expected
dividend
|
0 | % | 0 | % | 0 | % | ||||||
|
Risk-free
interest rate
|
0.8 | % | 2.4 | % | 4.7 | % | ||||||
|
Expected
volatility
|
95 | % | 69 | % | 55 | % | ||||||
|
Expected
life (in years)
|
0.8 | 0.8 | 0.8 | |||||||||
As of
December 31, 2009, $303,000 of total unrecognized compensation cost related to
the ESPP is expected to be amortized over a weighted-average period of 4
months.
As of
December 31, 2009, the Company has reserved the following shares of common stock
for issuance:
|
Stock
options outstanding
|
4,463,238 | |||
|
Restricted
Stock Units
|
468,957 | |||
|
Stock
options available for future grant
|
5,126,575 | |||
|
Employees
stock purchase plan
|
1,879,110 | |||
| 11,937,880 |
The
Company recognized stock-based compensation expenses of in the Company’s results
of operations for the year ended December 31, 2009, 2008 and 2007 was as follows
(in thousands):
|
2009
|
2008
|
2007
|
||||||||||
|
Costs
of revenue
|
$ | 361 | $ | 227 | $ | 294 | ||||||
|
Research
and development
|
1,183 | 1,396 | 2,627 | |||||||||
|
Sales,
general and administrative
|
2,856 | 2,745 | 2,796 | |||||||||
|
Total
|
$ | 4,400 | $ | 4,368 | $ | 5,717 | ||||||
The
income tax benefit recognized in the consolidated statements of operations
related to stock-based compensation expense was $1,226,000, $1,410,000 and
$1,873,000 in 2009, 2008 and 2007, respectively.
5. Bank
Credit Facility
On
September 28, 2007, the Company entered into a Credit Agreement (the Credit
Agreement) with Bank of America, N.A., as Administrative Agent and L/C Issuer
(the Agent), and each lender from time to time a party thereto. Under the Credit
Agreement, the Agent agreed to provide a $25 million aggregate commitment for a
two-year revolving credit facility and issuances of letters of credit for the
Company’s account (the Facility), secured by substantially all of the Company’s
assets excluding intellectual property.
Loans
under the Credit Agreement bear interest at either (i) for Eurodollar rate
loans, the rate per annum equal to the British Bankers Association LIBOR plus a
margin ranging from 0.25 percent to 0.50 percent or (ii) a formula based on the
Agent’s prime rate and the federal funds effective rate. Subject to
certain conditions stated in the Credit Agreement, the Company may borrow,
pre-pay and re-borrow amounts under the Facility at any time during the term of
the Credit Agreement. The Company may also, upon the agreement
of either the Agent or additional banks not currently a party to the Credit
Agreement, increase the commitments under the Facility up to an additional $50
million. The Credit Agreement contains customary representations, warranties,
affirmative and negative covenants, including financial covenants and events of
default. The negative covenants set forth in the Credit Agreement
include restrictions on additional indebtedness and liens, fundamental changes
and entering into burdensome agreements. The financial covenants require the
Company to meet quarterly financial tests with respect to consolidated net worth
and consolidated interest coverage ratio, and financial tests with respect to a
consolidated leverage ratio. As amended and extended, the Credit Agreement will
terminate and all amounts owing thereunder will be due and payable on March 1,
2010, unless the commitments are earlier terminated, either at the Company’s
request or, if an event of default occurs, by the lenders.
SYMYX
TECHNOLOGIES, INC.
NOTES
TO CONSOLIDATED FINANCIAL STATEMENTS (CONTINUED)
As of
December 31, 2009, the Company had no borrowings under the Facility other than a
$780,000 standby letter of credit outstanding and was in compliance with all
financial covenants related to the Facility.
6.
Segment Disclosure
The
authoritative guidance on disclosures about segments of an enterprise and
related information, requires disclosures of certain information regarding
operating segments, products and services, geographic areas of operation and
major customers. The method for determining what information to report under the
authoritative guidance on disclosures about segments of an enterprise and
related information is based upon the "management approach," or the way that
management organizes the operating segments within a company for which separate
financial information is available and evaluated regularly by the Chief
Operating Decision Maker (CODM) when deciding how to allocate resources and in
assessing performance. The Company’s CODM is its Chief Executive Officer, who
allocates resources to and assesses the performance of each business unit using
information about the business unit’s revenue and operating income (loss). The
Company’s CODM generally does not review the Company’s assets by business
segment.
Revenue
is defined as revenue from external customers and is disaggregated
into:
|
·
|
Symyx
Software – (i) license of electronic laboratory notebook, lab execution
and experiment analysis, logistics and decision support software, and
subscriptions to scientific content, and (ii) provision of associated
support, maintenance and consulting
services.
|
|
·
|
Symyx
HPR – (i) research services, (ii) license fees and royalties associated
with the Company’s patents, trade secrets and other intellectual property,
including materials discovered in the Company’s research collaborations,
(iii) sale of laboratory automation systems, and (iv) system support
services.
|
The
disaggregated financial information reviewed by the CODM in 2009, 2008 and 2007
is listed in the table below. The Company has research and development,
manufacturing, sales and marketing, and general and administrative groups.
Expenses for these groups are generally allocated to the business units. Certain
corporate-level operating expenses and charges were not allocated to each
business unit and were included in the “other” category. These expenses and
charges include, but not limited to:
|
·
|
Acquisition-related
costs, including in-progress research and development, amortization and
any impairment of acquisition-related intangibles and
goodwill;
|
|
·
|
Amounts
included within restructuring and asset impairment charges;
and
|
|
·
|
Results
of operations of venture businesses supporting the Company’s
initiatives.
|
SYMYX
TECHNOLOGIES, INC.
NOTES
TO CONSOLIDATED FINANCIAL STATEMENTS (CONTINUED)
|
Year
Ended December 31,
|
||||||||||||
|
(in
thousands)
|
2009
|
2008
|
2007
|
|||||||||
|
Revenue:
|
||||||||||||
|
Symyx
Software
|
||||||||||||
|
Service
|
$ | 43,372 | $ | 45,016 | $ | 16,622 | ||||||
|
License
fees, content and royalties
|
45,235 | 49,184 | 15,271 | |||||||||
|
Total
Symyx Software revenue
|
$ | 88,607 | $ | 94,200 | $ | 31,893 | ||||||
|
Symyx
HPR
|
||||||||||||
|
Service
|
$ | 27,170 | $ | 29,876 | $ | 42,412 | ||||||
|
Product
|
23,888 | 25,033 | 34,898 | |||||||||
|
License
fees, content and royalties
|
10,781 | 9,936 | 15,869 | |||||||||
|
Total
Symyx HPR revenue
|
$ | 61,839 | $ | 64,845 | $ | 93,179 | ||||||
|
Total
revenue
|
$ | 150,446 | $ | 159,045 | $ | 125,072 | ||||||
|
Operating
income (loss):
|
||||||||||||
|
Symyx
Software
|
$ | 8,512 | * | * | ||||||||
|
Symyx
HPR
|
2,047 | * | * | |||||||||
|
Other
|
(14,606 | ) | * | * | ||||||||
|
Total
operating loss
|
$ | (4,047 | ) | $ | (116,863 | ) | $ | (16,724 | ) | |||
*
The Company did not implement a reporting system prior to 2009 to segregate
operating expenses by business segment. It is impracticable to restate prior
periods to be consistent with the current period presentation.
Geographic
Area Data
The table
below shows revenue by physical location of the Company’s customers (in
thousands).
|
Years
Ended December 31,
|
||||||||||||
|
2009
|
2008
|
2007
|
||||||||||
|
United
States
|
$ | 94,168 | $ | 102,042 | $ | 109,741 | ||||||
|
Asia
|
15,057 | 14,300 | 3,712 | |||||||||
|
Europe
|
40,204 | 40,885 | 11,065 | |||||||||
|
Rest
of the World
|
1,017 | 1,818 | 554 | |||||||||
|
Total
|
$ | 150,446 | $ | 159,045 | $ | 125,072 | ||||||
The
tables below show revenue and long-lived assets by location (in
thousands):
|
Years
Ended December 31,
|
||||||||||||
|
2009
|
2008
|
2007
|
||||||||||
|
Revenue
generated by U.S. operations
|
$ | 137,705 | $ | 132,629 | $ | 114,242 | ||||||
|
Revenue
generated by foreign operations
|
12,741 | 26,416 | 10,830 | |||||||||
|
Total
revenue from unaffiliated customers
|
$ | 150,446 | $ | 159,045 | $ | 125,072 | ||||||
|
Long-lived
assets in U.S.
|
$ | 101,238 | $ | 114,373 | $ | 195,246 | ||||||
|
Long-lived
assets in foreign countries
|
13,156 | 14,076 | 33,207 | |||||||||
|
Total
long-lived assets
|
$ | 114,394 | $ | 128,449 | $ | 228,453 | ||||||
7.
Integrity Biosolution, LLC
On August
13, 2008, the Company acquired 100% of the ownership of Integrity Biosolution,
LLC (IntegrityBio), a privately held research service company based in
Camarillo, California. By acquiring IntegrityBio, the Company expanded its
research service offerings in the life sciences industry into biologic
formulations, complementing its existing chemical formulations services.
IntegrityBio has since been merged with and into Symyx Software, Inc. effective
December 31, 2008. Its results of operations have been included in the Company’s
consolidated financial statements since the acquisition date.
SYMYX
TECHNOLOGIES, INC.
NOTES
TO CONSOLIDATED FINANCIAL STATEMENTS (CONTINUED)
The
purchase price for IntegrityBio was $10,248,000, including $9,446,000 paid in
cash to the seller, $570,000 of working capital adjustments paid to the seller
and $232,000 in transaction costs, consisting of legal and other professional
service fees.
In
accordance with the authoritative guidance on business combinations, the Company
allocated the purchase price to the tangible assets, liabilities, and intangible
assets acquired based on their estimated fair value. The excess purchase price
over the fair value was recorded as goodwill.
The
allocation of the purchase price of IntegrityBio was as follows (in
thousands):
|
Amount
|
||||
|
Fair
value of net assets acquired
|
$ | 1,948 | ||
|
Intangible
assets
|
2,860 | |||
|
Goodwill
|
5,440 | |||
|
Total
|
$ | 10,248 | ||
The
fair value of IntegrityBio’s net assets as of the acquisition date was (in
thousands):
|
Amount
|
||||
|
Cash
|
$ | 32 | ||
|
Accounts
receivable
|
789 | |||
|
Plant,
property and equipment
|
1,379 | |||
|
Accounts
payable and other accrued liabilities
|
(127 | ) | ||
|
Accrued
compensation
|
(47 | ) | ||
|
Deferred
revenue
|
(78 | ) | ||
|
Fair
value of IntegrityBio's net assets
|
$ | 1,948 | ||
Identifiable
intangible assets purchased in the IntegrityBio acquisition consisted of the
following (in thousands, except for useful life) with a weighted average useful
life of 4.9 years and no significant residual value estimated:
|
Amount
|
Useful
Life (in years)
|
|||||||
|
Customer
Relationships
|
$ | 2,120 | 5 | |||||
|
Customer
Backlog
|
130 | 2 | ||||||
|
Non-competing
Agreement
|
610 | 5 | ||||||
|
Total
|
$ | 2,860 | ||||||
Goodwill
from IntegrityBio was recorded in the Symyx Research reporting unit of Symyx HPR
and is expected to be deductible for income tax purposes. Subsequently in the
fourth quarter of 2008, as part of the annual impairment analysis, goodwill from
IntegrityBio acquisition was written-off. Additionally, the Company reduced the
carrying value of identifiable intangible assets by $1,604,000 in connection
with its review of the recoverability long-lived assets. See detail in Note 1 of
the Notes to Consolidated Financial Statements.
Pro forma
financial information is not provided because the results of operations of the
acquired entity were not material to the historical results of operations of the
Company.
SYMYX
TECHNOLOGIES, INC.
NOTES
TO CONSOLIDATED FINANCIAL STATEMENTS (CONTINUED)
Pursuant
to the terms of the purchase agreement, the founder of IntegrityBio could have
earned an additional $1.75 million in cash, so long as the founder serves as the
Company’s employee continuously for 24 months from the acquisition date. Due to
service requirements of this payment, the Company recorded the associated
liabilities as compensation expenses rather than as part of the purchase price.
Additionally, the Company recorded $327,000 additional purchase consideration
calculated as 46% of total revenue generated by IntegrityBio during the period
from September 1, 2009 to October 31, 2009. This
liability, if determinable at the time of acquisition, would have been recorded
to goodwill as part of the purchase price. The Company assessed the
recoverablility of these amounts under the current circumstances and concluded
that the goodwill resulting from the additional purchase consideration should be
impaired in 2009. On November 1, 2009, in connection with the Company’s
exiting of its CDMO business, the Company sold all the tangible and intangible
assets from the IntegrityBio acquisition, and settled all the compensation
liabilities and revenue share liabilities discussed above either earned through
the selling date or potentially to be earned in the future under the purchase
agreement, resulting in a loss of $2,009,000.
8.
Acquisition of MDL Group Companies
On
October 1, 2007, the Company acquired MDL Information Systems, Inc. (MDL) for
$123,000,000 in cash. Of the cash paid, the Company and the seller placed
$10,000,000 in escrow pending their determination of any detriments suffered or
benefits enjoyed by MDL as a result of certain pre-closing intercompany
transactions. The escrow account (including interest earned) was subsequently
settled after a March 2008 net working capital adjustment payment of $4,954,000
to the Company, June 2008 distributions of $1,626,000 to the Company for
withholding tax and professional fee reimbursement and $1,735,000 to the seller
and final distribution of the remaining amount in the escrow account to the
seller in July 2009.
The
adjusted total purchase price for this acquisition was $121,474,000, consisting
of approximately $118,046,000 in cash and $3,428,000 in transaction costs,
consisting of banking, legal and other professional service fees.
The
adjusted purchase price allocation is as follows (in thousands):
|
Amount
|
||||
|
Fair
value of net liabilities assumed
|
$ | (5,605 | ) | |
|
Accrued
restructuring costs
|
(6,823 | ) | ||
|
In-process
research and development
|
2,500 | |||
|
Intangible
assets
|
59,000 | |||
|
Deferred
tax liabilities
|
(22,428 | ) | ||
|
Goodwill
|
95,150 | |||
|
Total
|
$ | 121,794 | ||
The
adjusted fair values of MDL’s net liabilities as of the acquisition date were
(in thousands):
|
Amount
|
||||
|
Accounts
receivable, net
|
$ | 4,417 | ||
|
Prepaids
and other assets
|
3,549 | |||
|
Plant,
property and equipment
|
4,851 | |||
|
Accounts
payable and other accrued liabilities
|
(2,046 | ) | ||
|
Accrued
compensation
|
(4,961 | ) | ||
|
Deferred
revenue
|
(10,404 | ) | ||
|
Fair
value of MDL’s net liabilities
|
$ | (4,594 | ) | |
9.
Related Party Transactions
The
Company entered into a Collaborative Development and License Agreement in March
2005 and an Alliance Agreement in December 2005 with Intermolecular, Inc.
(Intermolecular). Under these agreements, the two companies worked together to
conduct research and development and other activities with respect to materials
and high-throughput technology for use in semiconductor applications. Each party
bore its own expenses. In November 2007, following the conclusion of the joint
research and development activities, these agreements were amended. Under the
amended agreements, the Company has an ongoing obligation to provide two
employees to modify and integrate certain Symyx software with and into
Intermolecular products and to provide Intermolecular access to certain Symyx
equipment for development purposes. In August 2006, the Company invested
$13,500,000 in exchange for approximately 13% of Intermolecular’s outstanding
shares, and in December 2008 invested an additional $1,647,000. As of December
31, 2009, the Company owned approximately 12% of Intermolecular’s outstanding
shares. The Company accounts for its ownership interest in Intermolecular using
the cost method, because the Company does not have the ability to exercise
significant influence over Intermolecular’s strategic, operating, investing and
financing activities. Isy Goldwasser, the Company’s chief executive officer, is
a director of Intermolecular. For the years ended December 31, 2009, 2008 and
2007, the Company recognized revenue from Intermolecular of $1,008,000,
$1,418,000 and $912,000, respectively. As of December 31, 2009, the Company
recorded $5,000 of deferred revenue and a $77,000 customer deposit from
Intermolecular. As of December 31, 2008, the Company recorded $32,000 of
deferred revenue and a $77,000 customer deposit from
Intermolecular.
SYMYX
TECHNOLOGIES, INC.
NOTES
TO CONSOLIDATED FINANCIAL STATEMENTS (CONTINUED)
10.
Income Taxes
The
Company’s income (loss) before taxes consisted of the following (in
thousands):
|
Years
Ended December 31,
|
||||||||||||
|
2009
|
2008
|
2007
|
||||||||||
|
U.
S.
|
$ | (3,605 | ) | $ | (84,293 | ) | $ | 31,510 | ||||
|
Foreign
|
(2,680 | ) | (27,496 | ) | (2,028 | ) | ||||||
|
Total
|
$ | (6,285 | ) | $ | (111,789 | ) | $ | 29,482 | ||||
The
provision (benefit) for income taxes consisted of the following (in
thousands):
|
Years
Ended December 31,
|
||||||||||||
|
2009
|
2008
|
2007
|
||||||||||
|
Current:
|
||||||||||||
|
Federal
|
$ | (2,991 | ) | $ | (4,503 | ) | $ | 12,759 | ||||
|
State
|
674 | 121 | 645 | |||||||||
|
Foreign
|
(464 | ) | 302 | 542 | ||||||||
|
Total
|
(2,781 | ) | (4,080 | ) | 13,946 | |||||||
|
Deferred:
|
||||||||||||
|
Federal
|
(2,090 | ) | 908 | (2,276 | ) | |||||||
|
State
|
10 | 800 | 472 | |||||||||
|
Foreign
|
(286 | ) | (2,801 | ) | (1,444 | ) | ||||||
|
Total
|
(2,366 | ) | (1,093 | ) | (3,248 | ) | ||||||
|
Provision
(benefit) for income taxes
|
$ | (5,147 | ) | $ | (5,173 | ) | $ | 10,698 | ||||
Tax
benefits or (deficiencies) resulting from the vesting of restricted stock units,
the exercise of nonqualified stock options and the disqualifying dispositions of
shares issued under the Company's stock-based compensation plans were
approximately $19,000 in 2009, ($1,091,000) in 2008, and ($868,000) in 2007.
Such benefits or deficiencies were recorded in additional paid-in
capital.
The
reconciliation of federal statutory income tax (on pre-tax income after
consideration of equity losses) to the Company’s provision (benefit) for income
taxes is as follows (in thousands):
SYMYX
TECHNOLOGIES, INC.
NOTES
TO CONSOLIDATED FINANCIAL STATEMENTS (CONTINUED)
|
Years
Ended December 31,
|
||||||||||||
|
2009
|
2008
|
2007
|
||||||||||
|
Expected
provision (benefit) at federal statutory rate
|
$ | (2,200 | ) | $ | (39,126 | ) | $ | 10,318 | ||||
|
State
taxes, net of federal impact
|
684 | 921 | 571 | |||||||||
|
Research
and development credits
|
(266 | ) | (493 | ) | (321 | ) | ||||||
|
Permanent
difference related to goodwill impairment
|
- | 24,761 | - | |||||||||
|
Permanent
difference related to stock-based compensation
|
237 | 230 | 366 | |||||||||
|
Permanent
difference related to acquisitions
|
- | - | 875 | |||||||||
|
Permanent
difference related to tax-exempt interest
|
- | (50 | ) | (631 | ) | |||||||
|
Change
in liabilities for uncertain tax positions
|
(699 | ) | - | - | ||||||||
|
Valuation
allowance for deferred tax assets
|
(3,040 | ) | 7,995 | - | ||||||||
|
Other
individually immaterial items
|
137 | 589 | (480 | ) | ||||||||
|
Provision
(benefit) for income taxes
|
$ | (5,147 | ) | $ | (5,173 | ) | $ | 10,698 | ||||
Deferred
income taxes reflect the net tax effects of temporary differences between the
carrying amounts of assets and liabilities for financial reporting purposes and
the amounts used for income tax purposes. Significant components of the
Company’s deferred tax assets and liabilities are as follows (in
thousands):
|
December
31,
|
||||||||
|
2009
|
2008
|
|||||||
|
Deferred
tax assets:
|
||||||||
|
Net
operating loss carry-forwards
|
$ | 2,916 | $ | 2,534 | ||||
|
Goodwill
|
1,416 | 3,482 | ||||||
|
Deferred
revenue
|
2,829 | 1,488 | ||||||
|
Capitalized
research and development
|
167 | 349 | ||||||
|
Depreciation
|
6,887 | 11,069 | ||||||
|
Stock-based
compensation
|
2,279 | 2,031 | ||||||
|
Warranty
expense accrual
|
340 | 545 | ||||||
|
Research
and development and other credits
|
2,683 | 2,102 | ||||||
|
Other
accruals and reserves
|
3,159 | 2,927 | ||||||
|
Total
deferred tax assets before valuation allowance
|
22,676 | 26,527 | ||||||
|
Less
valuation allowance for deferred tax assets
|
(10,152 | ) | (12,485 | ) | ||||
|
Total
deferred tax assets
|
12,524 | 14,042 | ||||||
|
Deferred
tax liabilities:
|
||||||||
|
Prepaid
insurance and property tax
|
(367 | ) | (452 | ) | ||||
|
Intangible
assets
|
(15,588 | ) | (18,023 | ) | ||||
|
Total
deferred tax liabilities
|
(15,955 | ) | (18,475 | ) | ||||
|
Net
deferred tax liabilities
|
$ | (3,431 | ) | $ | (4,433 | ) | ||
U.S.
income taxes were not provided on undistributed earnings from investments in
certain non-U.S. subsidiaries. Determination of the amount of unrecognized
deferred tax liability for temporary differences related to investments in these
non-U.S. subsidiaries that are essentially permanent in duration is not
practicable. The Company currently intends to reinvest these earnings in
operations outside the U.S.
As of
December 31, 2009, the Company had federal net operating loss carryforwards of
approximately $127,000. The net operating losses from the acquisition of
Synthematix is subject to an annual limitation due to the ownership change
limitations provided by the Internal Revenue Code of 1986, as amended, and
similar state provisions. The annual limitation may result in the expiration of
net operating losses and credits before utilization. The net operating loss
carryforwards will start to expire in 2010, if not utilized. As of December 31,
2009, the Company had California net operating loss carryforwards of
approximately $33,312,000, which will start to expire in 2019, if not utilized.
As of December 31, 2009, the Company also had Swiss net operating loss
carryforwards of approximately $4,879,000, which will start to expire in 2014,
if not utilized.
SYMYX
TECHNOLOGIES, INC.
NOTES
TO CONSOLIDATED FINANCIAL STATEMENTS (CONTINUED)
As of
December 31, 2009, the Company had federal and California research and
development tax credit carryforwards of approximately $472,000 and $4,415,000,
respectively. The state research and development credits have no expiration
date. The research and development tax credits from the acquisitions of
IntelliChem and Synthematix is subject to an annual limitation of Section 383
due to ownership change limitations provided by the Internal Revenue Code of
1986, as amended, and similar state provisions.
Valuation
Allowance
Income
tax expense is recorded using the asset and liability method. Deferred tax
assets and liabilities are recognized for the expected future tax consequences
attributable to temporary differences between amounts reported for income tax
purposes and financial statement purposes, using current tax rates. In 2008, the
Company recorded a $12,485,000 valuation allowance (including $7,995,000 for
federal deferred tax assets and $4,490,000 for state deferred tax assets) as a
result of uncertainties related to the realization of its net deferred tax
assets at December 31, 2008. In 2009, the Company conducted a study of the tax
depreciable lives for certain of its fixed assets placed in service after
January 1, 2002. Using the result of the study, the Company reassessed the
valuation allowance associated with certain federal deferred tax assets and
released $1,976,000 of such allowance. Additionally in the fourth quarter of
2009, the Company sold its CDMO business, resulting in the release of additional
$1,064,000 of such allowance upon the realization of certain federal deferred
tax assets established for goodwill and intangible assets that were deductible
for tax purposes. In 2009, the Company recorded additional $707,000 valuation
allowance against the state deferred tax assets. The net change of valuation
allowance from 2008 to 2009 was $2,333,000.
The
valuation allowance was established as a result of weighing all the positive and
negative evidence, including the Company’s history of cumulative losses over the
past three years and the difficulty of forecasting sufficient future taxable
income. The valuation allowance reflects the conclusion of the management that
it is more likely than not that the benefits from certain deferred tax assets
will not be realized. If actual results differ from these estimates or these
estimates are adjusted in future periods, the valuation allowance may require
adjustment which could materially impact the Company’s financial position and
results of operations.
Accounting
for Uncertainty in Income Taxes
In June
2006, the FASB issued the authoritative guidance on accounting for uncertainty
in income taxes, which
clarifies the accounting for income taxes by prescribing the minimum recognition
threshold a tax position must meet before being recognized in the financial
statements. Under the authoritative guidance on accounting for uncertainty in
income taxes, the impact of an uncertain income tax position on the income tax
return must be recognized at the largest amount that is more-likely-than-not to
be sustained upon audit by the relevant taxing authority. An uncertain income
tax position will not be recognized if it has less than a 50% likelihood of
being sustained. Additionally, the authoritative guidance on accounting for
uncertainty in income taxes provides guidance on derecognition, measurement,
classification, interest and penalties, accounting in interim periods,
disclosure and transition.
The
following is a tabular reconciliation of the total amounts of unrecognized tax
benefits for the years ended December 31, 2009 and 2008 (in
thousands):
SYMYX
TECHNOLOGIES, INC.
NOTES
TO CONSOLIDATED FINANCIAL STATEMENTS (CONTINUED)
|
2009
|
2008
|
2007
|
||||||||||
|
Unrecognized
tax benefit at January 1
|
$ | 4,693 | $ | 4,965 | $ | 4,273 | ||||||
|
Increase
(decrease) in tax positions for prior period
|
(124 | ) | (590 | ) | 287 | |||||||
|
Increase
(decrease) in tax positions for current period
|
220 | 318 | 526 | |||||||||
|
Lapse
of statute of limitations
|
(1,569 | ) | - | (121 | ) | |||||||
|
Total
unrecognized tax benefit at December 31
|
$ | 3,220 | $ | 4,693 | $ | 4,965 | ||||||
Included
in the balance of unrecognized tax benefits at December 31, 2009, was $379,000
of tax benefits that, if recognized, would affect the effective tax
rate.
The
Company recognizes interest accrued related to unrecognized income tax benefits
in interest expense and penalties as a component of the income tax provision, in
the accompanying Consolidated Statement of Operations. Related to the uncertain
tax benefits noted above, the Company has recognized a liability for interest
and penalties of $232,000 and $455,000 as of December 31, 2009 and 2008,
respectively.
The
Company is subject to taxation in the U.S. and various state and foreign
jurisdictions. The Company is not currently under audit by any tax authorities
and is generally not subject to tax examinations for years prior to
2005.
The
Company does not anticipate the total amounts of unrecognized income tax
benefits will significantly increase or decrease within the next 12 months of
the reporting date.
The
Company assessed the impact of uncertainties in tax positions taken by the MDL
Group Companies in periods prior to the acquisition. Based upon this assessment,
no liabilities under the authoritative guidance on accounting for uncertainty in
income taxes were recorded on the opening balance sheet. By operation of tax
law, the seller of the MDL Group of Companies retains the primary obligation for
most pre-acquisition U.S. tax liabilities. In addition, by the terms
of the acquisition agreement, the seller of the MDL Group of Companies
has agreed to indemnify the Company for any income tax liabilities related
to pre-acquisition periods.
11.
Intangible Assets
The
Company acquired certain patent rights and know-how from third parties. It also
obtained certain intangible assets in various business combinations. These
intangible assets are being amortized on a straight-line basis over the
estimated useful lives of the assets. Because some of the intangible assets
related to the Autodose acquisition were recorded in foreign currencies, the
balance of these intangible assets may be affected by foreign currency exchange
rate fluctuations when converted to U.S. dollars at each reporting period. As
discussed in Note 1 of the Notes to Consolidated Financial Statements, the
Company evaluated the recoverability of intangible assets and recorded an
impairment charge of $2,574,000 in 2008. The current estimated weighted-average
useful lives and carrying amounts of these intangible assets are as follows (in
thousands, except for useful lives):
SYMYX
TECHNOLOGIES, INC.
NOTES
TO CONSOLIDATED FINANCIAL STATEMENTS (CONTINUED)
|
December 31,
2009
|
||||||||||||||||
|
Weighted-Average
Useful Lives (Years)
|
Gross
Carrying Amount
|
Accumulated
Amortization
|
Net
Carrying Amount
|
|||||||||||||
|
Acquired
technology
|
5.0 | $ | 2,974 | $ | (2,974 | ) | $ | - | ||||||||
|
Acquired
technology
|
5.0 | $ | 2,974 | $ | (2,974 | ) | $ | - | ||||||||
|
Trade
name
|
3.4 | 1,752 | (1,325 | ) | $ | 427 | ||||||||||
|
Core/Developed
technology
|
5.7 | 23,164 | (15,574 | ) | $ | 7,590 | ||||||||||
|
Customer
relationships
|
7.8 | 39,825 | (14,101 | ) | $ | 25,724 | ||||||||||
|
Proprietary
content
|
6.0 | 7,800 | (2,925 | ) | $ | 4,875 | ||||||||||
|
License
agreements
|
3.0 | 4,400 | (3,300 | ) | $ | 1,100 | ||||||||||
|
Bargain
lease
|
8.0 | 1,300 | (366 | ) | $ | 934 | ||||||||||
|
Total
intangibles
|
6.6 | $ | 81,215 | $ | (40,565 | ) | $ | 40,650 | ||||||||
|
December
31, 2009
|
||||||||||||||||
|
Weighted-Average
Useful Lives (Years)
|
Gross
Carrying Amount
|
Accumulated
Amortization
|
Net
Carrying Amount
|
|||||||||||||
|
Acquired
technology
|
5.0 | 2,973 | (2,874 | ) | 99 | |||||||||||
|
Acquired
technology
|
5.0 | 2,973 | (2,874 | ) | 99 | |||||||||||
|
Trade
name
|
3.3 | 1,697 | (781 | ) | 916 | |||||||||||
|
Core/Developed
technology
|
5.7 | 23,168 | (12,611 | ) | 10,557 | |||||||||||
|
Customer
relationships
|
7.7 | 40,736 | (9,139 | ) | 31,597 | |||||||||||
|
Proprietary
content
|
6.0 | 7,800 | (1,625 | ) | 6,175 | |||||||||||
|
License
agreements
|
3.0 | 4,400 | (1,833 | ) | 2,567 | |||||||||||
|
Bargain
lease
|
8.0 | 1,300 | (203 | ) | 1,097 | |||||||||||
|
Customer
backlog
|
2.0 | 66 | (25 | ) | 41 | |||||||||||
|
Non-compete
agreement
|
5.0 | 266 | (47 | ) | 219 | |||||||||||
|
Total
intangibles
|
6.5 | $ | 82,406 | $ | (29,138 | ) | $ | 53,268 | ||||||||
In the
years ended December 31, 2009, 2008 and 2007, the Company recorded amortization
expense for intangible assets of $11,798,000, $13,542,000, and $6,418,000,
respectively. Assuming no subsequent impairment of the underlying assets, the
annual amortization expense of total intangible assets is expected to be
approximately $9,880,000 in 2010, $7,859,000 in 2011, $7,307,000 in 2012,
$6,845,000 in 2013, $5,487,000 in 2014 and $3,272,000 thereafter.
12.
Financial Instruments
The
Company has not entered into any derivative contracts at December 31, 2009. It
maintains cash and cash equivalents in treasury-bill money market funds. The
following methods and assumptions were used by the Company in estimating its
fair value disclosures for financial instruments:
Cash and cash equivalents:
The carrying amounts reported in the balance sheets for cash and cash
equivalents are their fair values. The fair value for cash equivalents are based
on quoted market prices.
Accounts receivable and accounts
payable: The carrying amounts reported in the balance sheets for accounts
receivable and accounts payable approximate their fair values. The Company
generally does not require any collateral from the customers to support accounts
receivables.
SYMYX
TECHNOLOGIES, INC.
NOTES
TO CONSOLIDATED FINANCIAL STATEMENTS (CONTINUED)
13.
Restructuring Charges
In the
third quarter of 2009, the Company recorded a $710,000 restructuring charge,
which included $801,000 of severance and facility exit costs in the United
Kingdom as part of the Company’s effort to consolidate its offshore software
development activities. In the fourth quarter of 2009, the Board of Directors
committed the Company to a plan to restructure its HPR business unit. The
restructuring plan is being implemented to address underperformance in the
Company’s CDMO operation acquired as part of the IntegrityBio acquisition, and
to address the anticipated decline in research services following 2009 as
commitments from Dow and ExxonMobil expire. As part of the
restructuring plan, the Company has exited its CDMO operations and reduced its
overall HPR staffing by approximately 75 employees, representing a 15% reduction
in the Company’s total current headcount. As a result, the Company recorded
$1,660,000 restructuring charges in the fourth quarter of 2009. In the table
below, all restructuring activities in 2009 were referred to as the “2009
Plan.” These charges have been aggregated and appear as
“Restructuring Charges” in the Company’s Consolidated Statements of
Operations.
In order
to realign its operations to drive performance and improve operating efficiency,
on December 3, 2008, the Company initiated a reorganization plan (2008 Plan) to
combine Symyx Tools and Symyx Research to create Symyx HPR. The 2008
Plan included a worldwide reduction in force of approximately 90 employees and
the consolidation of certain facilities.
The
Company recorded total restructuring charges of $4,952,000 in the fourth quarter
of 2008, consisting of $3,701,000 of severance and one-time benefits, $1,251,000
of exit costs of facilities, write-off of related fixed assets and associated
legal costs. These charges have been aggregated and appear as “Restructuring
Charges” in the Company’s Consolidated Statements of Operations.
The
Company estimated the cost of exiting and terminating facility leases or
acquired leases by referring to the contractual terms of the agreements and by
evaluating the current real estate market conditions. In addition, the Company
has estimated sublease income by evaluating the current real estate market
conditions or, where applicable, by referring to amounts being negotiated. The
ability to generate this amount of sublease income, as well as the ability to
terminate lease obligations at estimated amounts, is highly dependent upon the
commercial real estate market conditions in certain geographies at the time the
evaluations and negotiations are performed.
The
amounts we have accrued represent the Company’s best estimate of the obligations
expect to be incurred and could be subject to adjustment as market conditions
change.
On
October 2, 2007, in connection with the MDL Acquisition, the Company announced a
restructuring plan (2007 Plan) to terminate approximately 120 employees of the
Company, comprised of approximately 100 positions in the United States and
approximately 20 positions internationally. Total estimated restructuring
termination benefits were $7,040,000, consisting primarily of involuntary
employee termination benefits. Of the total restructuring charges, $6,823,000
was associated with the former MDL employees and therefore was accrued as part
of the liabilities assumed at the time of the MDL acquisition according to the
authoritative guidance on accounting for business combinations, as well as the
authoritative guidance on recognition of liabilities in connection with a
purchase business combination. The remaining balance associated with the
termination of employees of the acquiring company was recorded as part of the
operating expenses according to the authoritative guidance on accounting for
costs associated with exit or disposal activities. As of December 31, 2009, the
Company completed the majority of the 2007 plan but estimates that up to $39,000
may yet be incurred in legal fees pertaining to the termination of certain
former employees of MDL.
SYMYX
TECHNOLOGIES, INC.
NOTES
TO CONSOLIDATED FINANCIAL STATEMENTS (CONTINUED)
The
following table illustrates the change in accrued restructuring costs during the
year ended December 31, 2009 (in thousands):
|
2007
Plan
|
2008
Plan
|
2009
Plan
|
Total
|
|||||||||||||
|
Balance
as of January 1, 2008
|
$ | 2,275 | $ | - | $ | - | $ | 2,275 | ||||||||
|
New
charges accrued during the period
|
723 | 4,952 | - | 5,675 | ||||||||||||
|
Payments
made during the period
|
(1,663 | ) | (442 | ) | - | (2,105 | ) | |||||||||
|
Non-cash
liabilities settled during the period
|
- | (583 | ) | - | (583 | ) | ||||||||||
|
Adjustments
to liabilities during the period, including foreign currency exchange rate
effect
|
(684 | ) | - | - | (684 | ) | ||||||||||
|
Balance
as of December 31, 2008
|
651 | 3,927 | - | 4,578 | ||||||||||||
|
New
charges accrued during the period
|
- | 407 | 2,369 | 2,776 | ||||||||||||
|
Payments
made during the period
|
(153 | ) | (3,777 | ) | (785 | ) | (4,715 | ) | ||||||||
|
Non-cash
liabilities settled during the period
|
- | - | (102 | ) | (102 | ) | ||||||||||
|
Adjustments
to liabilities during the period, including foreign currency exchange rate
effect
|
(459 | ) | (60 | ) | 96 | (423 | ) | |||||||||
|
Balance
as of December 31, 2009
|
$ | 39 | $ | 497 | $ | 1,578 | $ | 2,114 | ||||||||
The
following table illustrates the change in accrued restructuring costs by
business segment during the year ended December 31, 2009 for 2009 Plan only (in
thousands). The Company did not implement a reporting system prior to 2009 to
segregate restructuring charges by business segment. It is impracticable to
restate prior periods to be consistent with the current period
presentation.
|
Symyx Software
|
Symyx HPR
|
Total
|
||||||||||
|
Balance
as of December 31, 2008
|
$ | - | $ | - | $ | - | ||||||
|
New
charges accrued during the period
|
809 | 1,560 | 2,369 | |||||||||
|
Payments
made during the period
|
(544 | ) | (241 | ) | (785 | ) | ||||||
|
Non-cash
liabilities settled during the period
|
(102 | ) | (102 | ) | ||||||||
|
Adjustments
to liabilities during the period, including foreign currency exchange rate
effect
|
96 | 96 | ||||||||||
|
Balance
as of December 31, 2009
|
$ | 259 | $ | 1,319 | $ | 1,578 | ||||||
14.
Subsequent Events
On
February 11, 2010, and following an extensive sales process led by our financial
advisors, the Company announced the execution of a
definitive agreement (Divestiture Agreement) to divest its HPR business unit
(the Divestiture) pursuant to which the Company will divest HPR’s tools
operations and certain of its recently restructured contract research services
operations to a newly formed company, HPR Global, Inc. (HPR
Global). HPR’s president, John S. Senaldi, resigned his employment
from Symyx prior to the signing of the Divestiture Agreement to lead the
acquisition of HPR assets as founder and chief executive officer of HPR
Global. Pursuant to the Divestiture Agreement, the Company will
transfer to HPR Global substantially all existing HPR physical assets and
certain intellectual property assets, including a portion of its patent
portfolio and certain components of its Lab Execution and Analysis software
suite. The total carrying amounts of major classes of assets to be
disposed of are listed below:
|
Property,
plant and equipment
|
$ | 1,661 | ||
|
Goodwill
|
449 | |||
|
Intangible
assets
|
931 | |||
|
Total
|
$ | 3,041 |
Symyx
also expects to provide approximately $8.6 million of positive net working
capital (mostly in cash) at closing. In return, Symyx expects to
receive a $10.0 million note and common stock representing an approximately
19.5% equity interest in HPR Global. Symyx will retain all existing rights to
royalties and licensing fees previously included in HPR, as well as relevant
patents underlying these entitlements. Finally, the Company
anticipates HPR Global will offer employment to substantially all current HPR
employees following the closing of the Divestiture. Symyx expects to
close the Divestiture by the end of March 2010, and to conclude certain
remaining legacy chemical research services contracts by the end of the second
quarter of 2010. As a result of these actions, Symyx will conclude
all HPR activities other than its ongoing license and royalty
entitlements.
SYMYX
TECHNOLOGIES, INC.
NOTES
TO CONSOLIDATED FINANCIAL STATEMENTS (CONTINUED)
15.
Quarterly Results of Operations (Unaudited)
The
following is a summary of the quarterly results of operations for the years
ended December 31, 2009 and 2008 (in thousands, except per share
amounts).
|
Three
Months Ended
|
||||||||||||||||
|
2009
|
March 31,
|
June 30,
|
September 30,
|
December 31,
|
||||||||||||
|
Total
revenue
|
$ | 33,394 | $ | 36,627 | $ | 34,967 | $ | 45,458 | ||||||||
|
Total
costs
|
10,744 | 12,492 | 11,027 | 14,113 | ||||||||||||
|
Gross
Profit
|
22,650 | 24,135 | 23,940 | 31,345 | ||||||||||||
|
Operating
expenses:
|
||||||||||||||||
|
Research
and development
|
13,566 | 13,343 | 12,764 | 12,677 | ||||||||||||
|
Sales,
general and administrative
|
11,097 | 11,373 | 10,397 | 12,204 | ||||||||||||
|
Restructuring
charges (a)
|
208 | - | 710 | 1,660 | ||||||||||||
|
Impairment
to goodwill, intangibles, and other long-lived assets (b)
|
- | - | 284 | 43 | ||||||||||||
|
Amortization
of intangible assets
|
1,445 | 1,447 | 1,448 | 1,451 | ||||||||||||
|
Total
operating expenses
|
26,316 | 26,163 | 25,603 | 28,035 | ||||||||||||
|
Income
(loss) from operations
|
(3,666 | ) | (2,028 | ) | (1,663 | ) | 3,310 | |||||||||
|
Loss
from sale of IntegrityBio business
|
- | - | - | (2,009 | ) | |||||||||||
|
Interest
and other income (expense), net
|
(1,047 | ) | 445 | 521 | (148 | ) | ||||||||||
|
Income
(loss) before income tax provision and equity loss
|
(4,713 | ) | (1,583 | ) | (1,142 | ) | 1,153 | |||||||||
|
Income
tax benefit
|
1,606 | 345 | 2,632 | 564 | ||||||||||||
|
Net
income (loss)
|
$ | (3,107 | ) | $ | (1,238 | ) | $ | 1,490 | $ | 1,717 | ||||||
|
Basic
net income (loss) per share
|
$ | (0.09 | ) | $ | (0.04 | ) | $ | 0.04 | $ | 0.05 | ||||||
|
Diluted
net income (loss) per share
|
$ | (0.09 | ) | $ | (0.04 | ) | $ | 0.04 | $ | 0.05 | ||||||
|
Three
Months Ended
|
||||||||||||||||
|
2008
|
March 31,
|
June 30,
|
September 30,
|
December 31,
|
||||||||||||
|
Total
revenue
|
$ | 36,907 | $ | 40,651 | $ | 38,909 | $ | 42,578 | ||||||||
|
Total
Costs
|
10,237 | 10,387 | 10,397 | 13,748 | ||||||||||||
|
Gross
Profit
|
26,670 | 30,264 | 28,512 | 28,830 | ||||||||||||
|
Operating
expenses:
|
||||||||||||||||
|
Research
and development
|
20,687 | 19,729 | 18,814 | 16,135 | ||||||||||||
|
Sales,
general and administrative
|
15,233 | 14,288 | 12,375 | 12,693 | ||||||||||||
|
Restructuring
charges (a)
|
- | - | - | 4,952 | ||||||||||||
|
Impairment
to goodwill, intangibles, and other long-lived assets (b)
|
- | - | - | 90,330 | ||||||||||||
|
Amortization
of intangible assets
|
1,477 | 1,479 | 1,476 | 1,471 | ||||||||||||
|
Total
operating expenses
|
37,397 | 35,496 | 32,665 | 125,581 | ||||||||||||
|
Loss
from operations
|
(10,727 | ) | (5,232 | ) | (4,153 | ) | (96,751 | ) | ||||||||
|
Gain
from sale of equity interest in Ilypsa, Inc.
|
- | - | 4,939 | - | ||||||||||||
|
Interest
and other income (expense), net
|
(396 | ) | 2,792 | (1,692 | ) | (569 | ) | |||||||||
|
Loss
before income tax provision and equity loss
|
(11,123 | ) | (2,440 | ) | (906 | ) | (97,320 | ) | ||||||||
|
Income
tax benefit (expense)
|
4,331 | 915 | 161 | (234 | ) | |||||||||||
|
Net
loss
|
$ | (6,792 | ) | $ | (1,525 | ) | $ | (745 | ) | $ | (97,554 | ) | ||||
|
Basic
net loss per share
|
$ | (0.20 | ) | $ | (0.05 | ) | $ | (0.02 | ) | $ | (2.87 | ) | ||||
|
Diluted
net loss per share
|
$ | (0.20 | ) | $ | (0.05 | ) | $ | (0.02 | ) | $ | (2.87 | ) | ||||
(a) See Note 13 of the Notes to
Consolidated Financial Statements for detail discussion.
(b) See
Note 1 of the Notes to Consolidated Financial Statements for detail
discussion.
ITEM 9. CHANGES IN AND DISAGREEMENTS WITH ACCOUNTANTS
ON ACCOUNTING AND FINANCIAL DISCLOSURE
None
ITEM 9A. CONTROLS AND PROCEDURES
EVALUATION
OF DISCLOSURE CONTROLS AND PROCEDURES
Our
management, with the participation of our chief executive officer and chief
financial officer, evaluated the effectiveness of our disclosure controls and
procedures (as defined in Rule 13a-15 under the Securities Exchange Act of 1934
(the “Exchange Act”)) as of the end of the period covered by this Annual Report
on Form 10-K. In designing and evaluating the disclosure controls and
procedures, management recognizes that any controls and procedures, no matter
how well designed and operated, can provide only reasonable assurance of
achieving the desired control objectives. In addition, the design of disclosure
controls and procedures must reflect the fact that there are resource
constraints and that management is required to apply its judgment in evaluating
the benefits of possible controls and procedures relative to their
costs.
Based on
our evaluation, our chief executive officer and chief financial officer
concluded that, as of the end of the period covered by this report, our
disclosure controls and procedures are designed at a reasonable assurance level
and are effective to provide reasonable assurance that information we are
required to disclose in reports that we file or submit under the Exchange Act is
recorded, processed, summarized, and reported within the time periods specified
in Securities and Exchange Commission rules and forms, and that such information
is accumulated and communicated to our management, including our chief executive
officer and chief financial officer, as appropriate, to allow timely decisions
regarding required disclosure.
LIMITATIONS
ON THE EFFECTIVENESS OF CONTROLS
Our
disclosure controls and procedures are designed to provide reasonable, not
absolute, assurance that the objectives of our disclosure control system are
met. Because of inherent limitations in all control systems, no evaluation of
controls can provide absolute assurance that all control issues, if any, within
a company have been detected. Our chief executive officer and chief financial
officer have concluded, based on their evaluation as of the end of the period
covered by this report, that our disclosure controls and procedures were
sufficiently effective to provide reasonable assurance that the objectives of
our disclosure control system were met.
CHANGES
IN INTERNAL CONTROL OVER FINANCIAL REPORTING
There
were no changes in our internal control over financial reporting that occurred
during the fourth fiscal quarter ended December 31, 2009 that have materially
affected, or are reasonably likely to materially affect, our internal control
over financial reporting.
MANAGEMENT
REPORT ON INTERNAL CONTROL OVER FINANCIAL REPORTING
As
required by the SEC rules and regulations for the implementation of Section 404
of Sarbanes-Oxley Act, our management is responsible for establishing and
maintaining adequate internal control over financial reporting. Our internal
control over financial reporting is designed to provide reasonable assurance
regarding the reliability of financial reporting and the preparation of
financial statements for external purposes in accordance with generally accepted
accounting principles and includes those policies and procedures that: (i)
pertain to the maintenance of records that, in reasonable detail, accurately and
fairly reflect the transactions and dispositions of Symyx’s
assets; (ii) provide reasonable assurance that transactions are
recorded as necessary to permit preparation of financial statements in
accordance with generally accepted accounting principles, and that
Symyx’s receipts and expenditures are being made only in accordance with
authorizations of Symyx’s management and Board Directors; and (iii) provide
reasonable assurance regarding prevention or timely detection of unauthorized
acquisition, use or disposition of Symyx’s assets that could have a material
effect on the financial statements.
Because
of its inherent limitations, internal control over financial reporting may not
prevent or detect misstatements. Projections of any evaluation of effectiveness
to future periods are subject to the risks that controls may become inadequate
because of changes in conditions or that the degree of compliance with the
policies or procedures may deteriorate.
Symyx’s
management assessed the effectiveness of Symyx’s internal control over financial
reporting as of December 31, 2009. In making this assessment, Symyx’s management
used criteria set forth by the Committee of Sponsoring Organizations of the
Treadway Commission (COSO) in Internal Control-Integrated
Framework.
Based on
its assessment, Symyx’s management believes that, as of December 31, 2009,
Symyx’s internal control over financial reporting was effective based on the
criteria set forth by COSO.
Symyx’s
independent registered public accounting firm, Ernst & Young LLP, has issued
an attestation report on management’s assessment of Symyx’s internal control
over financial reporting. This report is included below.
Report
of Independent Registered Public Accounting Firm
The
Board of Directors and Stockholders of Symyx Technologies, Inc.
We have
audited Symyx Technologies, Inc.’s internal control over financial reporting as
of December 31, 2009, based on criteria established in Internal
Control—Integrated Framework issued by the Committee of Sponsoring Organizations
of the Treadway Commission (the COSO criteria). Symyx Technologies, Inc.’s
management is responsible for maintaining effective internal control over
financial reporting, and for its assessment of the effectiveness of internal
control over financial reporting included in the accompanying Management Report
on Internal Control over Financial Reporting. Our responsibility is to express
an opinion on the company’s internal control over financial reporting based on
our audit.
We
conducted our audit in accordance with the standards of the Public Company
Accounting Oversight Board (United States). Those standards require that we plan
and perform the audit to obtain reasonable assurance about whether effective
internal control over financial reporting was maintained in all material
respects. Our audit included obtaining an understanding of internal control over
financial reporting, assessing the risk that a material weakness exists, testing
and evaluating the design and operating effectiveness of internal control based
on the assessed risk, and performing such other procedures as we considered
necessary in the circumstances. We believe that our audit provides a reasonable
basis for our opinion.
A
company’s internal control over financial reporting is a process designed to
provide reasonable assurance regarding the reliability of financial reporting
and the preparation of financial statements for external purposes in accordance
with generally accepted accounting principles. A company’s internal control over
financial reporting includes those policies and procedures that (1) pertain to
the maintenance of records that, in reasonable detail, accurately and fairly
reflect the transactions and dispositions of the assets of the company; (2)
provide reasonable assurance that transactions are recorded as necessary to
permit preparation of financial statements in accordance with generally accepted
accounting principles, and that receipts and expenditures of the company are
being made only in accordance with authorizations of management and directors of
the company; and (3) provide reasonable assurance regarding prevention or timely
detection of unauthorized acquisition, use, or disposition of the company’s
assets that could have a material effect on the financial
statements.
Because
of its inherent limitations, internal control over financial reporting may not
prevent or detect misstatements. Also, projections of any evaluation of
effectiveness to future periods are subject to the risk that controls may become
inadequate because of changes in conditions, or that the degree of compliance
with the policies or procedures may deteriorate.
In our opinion, Symyx Technologies, Inc.
maintained, in all material respects, effective internal control over financial
reporting as of December 31, 2009, based on the COSO criteria.
We also
have audited, in accordance with the standards of the Public Company Accounting
Oversight Board (United States), the 2009 consolidated financial statements of
Symyx Technologies, Inc. and our report dated February 26, 2010 expressed an
unqualified opinion thereon.
|
/s/
Ernst & Young LLP
|
San Jose,
California
February
26, 2010
ITEM 9A(T). CONTROLS AND PROCEDURES
Not
applicable.
ITEM 9B. OTHER INFORMATION
On
February 26, 2010, the Compensation Committee and the Board of Directors
approved the following increases in the 2009 bonuses payable to two executive
officers of the Company: $10,000 to Charles D. Haley, Senior Vice
President and General Counsel; and $10,000 to Richard Rosenthal, Senior Vice
President, Finance, bringing their total 2009 cash bonuses to $70,000 and
$72,500, respectively.
PART
III
Certain
information required by Part III is omitted from this Annual Report on Form 10-K
because the registrant will file with the U.S. Securities and Exchange
Commission a definitive proxy statement pursuant to Regulation 14A in connection
with the solicitation of proxies for Symyx’s Annual Meeting of Stockholders
expected to be held in June 2010 (the Proxy Statement) not later than 120 days
after the end of the fiscal year covered by this Annual Report on Form 10-K, and
certain information included therein is incorporated herein by
reference.
ITEM 10. DIRECTORS, EXECUTIVE OFFICERS AND CORPORATE
GOVERNANCE
The
information required by this item with respect to directors and executive
officers may be found under the caption “Executive Officers of the Registrant”
in Part I, Item 1 of this Annual Report on Form 10-K, and in the section
entitled “Proposal 1 - Election of Directors” appearing in the Proxy Statement.
Such information is incorporated herein by reference.
The
information required by this Item with respect to our audit committee and audit
committee financial expert may be found in the section entitled “Proposal 1 -
Election of Directors - Audit Committee” appearing in the Proxy Statement. Such
information is incorporated herein by reference.
The
information required by this Item with respect to compliance with Section 16(a)
of the Securities Exchange Act of 1934 may be found in the section entitled
“Section 16(a) Beneficial Ownership Reporting Compliance” appearing in the Proxy
Statement. Such information is incorporated herein by reference.
Symyx has
adopted a Code of Conduct and Ethics that applies to its employees, including
principal executive officer, principal financial officer and controller, within
the meaning of Section 404 of the Sarbanes-Oxley Act of 2002 and the rules
promulgated thereunder. A copy of the Code of Conduct and Ethics is available at
Symyx’s website: www.symyx.com and
without charge upon written request to: Corporate Secretary, 415 Oakmead
Parkway, Sunnyvale, CA 94085. To the extent required by the law, amendments to,
and waivers from, any provision of Symyx’s Code of Conduct and Ethics will
promptly be disclosed to the public. To the extent permitted by such legal
requirements, Symyx intends to make such public disclosure by posting such
information on Symyx’s website in accordance with SEC rules.
ITEM 11. EXECUTIVE COMPENSATION
The
information required by this Item with respect to director and executive officer
compensation is incorporated herein by reference from the information under the
caption “Executive Officer and Director Compensation.”
The
information required by this Item with respect to Compensation Committee
interlocks and insider participation is incorporated herein by reference to the
information from the Proxy Statement under the section entitled “Compensation
Committee Interlocks and Insider Participations.”
The
information required by this Item with respect to our Compensation Committee’s
review and discussion of the Compensation Discussion and Analysis included in
the Proxy Statement is incorporated herein by reference to the information from
the Proxy Statement under the section entitled “Compensation Committee
Report.”
ITEM 12. SECURITY OWNERSHIP OF CERTAIN BENEFICIAL
OWNERS AND MANAGEMENT AND RELATED STOCKHOLDER
MATTERS
The
information required by this Item with respect to security ownership of certain
beneficial owners and management is incorporated herein by reference to the
information appearing in the Proxy Statement under the heading “Security
Ownership of Certain Beneficial Owners and Management.”
Equity
Compensation Plan Information
The
following table provides information as of December 31, 2009 with respect to
shares of our common stock issuable under our existing equity compensation
plans.
| A | B | C | D | E | |||||||||||||||||
|
Plan
Category
|
Number
of Securities to Be Issued Upon Exercise of Outstanding
Options
|
Weighted
Average Exercise Price of Outstanding Options
|
Number
of Securities to Be Issued Upon Vesting of Outstanding Restricted Stock
Units
|
Weighted
Average Grant Price of Outstanding Restricted Stock Units
|
Number
of Securities Remaining Available for Future Issuance Under Equity
Compensation Plans (Excluding Securities Reflected in Columns A and
C)
|
||||||||||||||||
|
Equity
Compensation Plans Approved by Stockholders (1)
|
4,095,820 |
(3)
|
$ | 15.19 | 468,957 | $ | 4.94 | 6,988,997 |
(4)
|
||||||||||||
|
Equity
Compensation Plans Not Approved by Stockholders (2)
|
367,418 | $ | 6.93 | - | 16,688 | ||||||||||||||||
|
Total
|
4,463,238 | $ | 14.51 | 468,957 | $ | 4.94 | 7,005,685 | ||||||||||||||
|
(1)
|
Consists
of the 2007 Stock Incentive Plan (2007 Stock Plan) and the 1999 Employee
Stock Purchase Plan (ESPP).
|
|
(2)
|
Consists
of 2001 Nonstatutory Plan, IntelliChem, Inc. 2003 Stock Option Plan
assumed in connection with the IntelliChem acquisition and the
Synthematix, Inc. 2000 Equity Compensation Plan, as amended, assumed in
connection with the Synthematix acquisition. A description of these plans
is available in Note 4 of the Notes to Consolidated Financial
Statements.
|
|
(3)
|
Excludes
purchase rights accruing under our ESPP which has a stockholder approved
reserve of 1,879,110 shares as of December 31, 2009. Under the ESPP, each
eligible employee may purchase up to a maximum of 10,000 shares per annum
of common stock at semi-annual intervals on the last United States
business day of April and October each year at a purchase price per share
equal to 85% of the lower of (i) the closing selling price per share of
common stock on the employee’s entry date into the 12-month offering
period in which that semi-annual purchase date occurs or (ii) the closing
selling price per share on the semi-annual purchase
date. Eligible employees may defer up to 10% of their salary,
but not to exceed $25,000, in any calendar year, to purchase shares under
this Plan.
|
|
(4)
|
Consists
of shares available for future issuance under our 2007 Stock Plan and
ESPP. As of December 31, 2009, an aggregate of 1,879,110 shares of common
stock were available for issuance under ESPP and 5,109,887 shares of
common stock were available for issuance under the 2007 Stock
Plan.
|
|
(5)
|
Under
our 2007 Stock Plan, the grant of each one (1) share of common stock
subject to any type of award, other than a stock option or stock
appreciation right, shall reduce the number of shares available under the
2007 Stock Plan by one and sixty-five hundredths (1.65)
shares.
|
ITEM 13. CERTAIN RELATIONSHIPS AND RELATED
TRANSACTIONS AND DIRECTOR INDEPENDENCE
The
information required by this item with respect to related party transaction is
incorporated herein by reference to the information under the caption “Certain
Relationships and Related Transactions” in the Proxy Statement.
The
information required by this Item with respect to director independence is
incorporated herein by reference to the information in the Proxy Statement in
the section entitled “Proposal 1 - Election of Directors - Independence of the
Board of Directors.”
ITEM 14. PRINCIPAL ACCOUNTING FEES AND
SERVICES
The
information required by this item is incorporated by reference to the
information under the proposal with the caption “Ratification of Selection of
Independent Registered Public Accounting Firm” under the caption “Principal
Accounting Fees and Services” in the Proxy Statement.
PART
IV
ITEM 15. EXHIBITS AND FINANCIAL STATEMENT SCHEDULES
(a)(
1). FINANCIAL STATEMENTS
The
following Financial Statements of Symyx Technologies, Inc. and the Report of
Ernst & Young LLP, Independent Registered Public Accounting Firm, have been
filed as part of this Annual Report on Form 10-K. See index to Consolidated
Financial Statements under Item 8 above:
|
Report
|
of
Independent Registered Public Accounting
Firm
|
|
Consolidated
|
Balance
Sheets at December 31, 2009 and
2008
|
|
Consolidated
|
Statements
of Operations for the Years Ended December 31, 2009, 2008 and
2007
|
|
Consolidated
|
Statements
of Stockholders’ Equity for the Years Ended December 31, 2009, 2008 and
2007
|
|
Consolidated
|
Statements
of Cash Flows for the Years Ended December 31, 2009, 2008 and
2007
|
|
Notes
|
to
Consolidated Financial
Statements
|
(a)
(2). FINANCIAL STATEMENT SCHEDULES
All
schedules are omitted as the required information is inapplicable or the
information is presented in the Consolidated Financial Statements and notes
thereto in Item 8 above.
(a)
(3). EXHIBITS
Refer to
(b) below.
(b)
EXHIBITS
See the
Exhibit Index which follows the signature page of this Annual Report on Form
10-K, which is incorporated here by reference.
SIGNATURES
Pursuant
to the requirements of the Securities Exchange Act of 1934, the Registrant has
duly caused this report to be signed on its behalf by the undersigned, thereunto
duly authorized.
|
SYMYX
TECHNOLOGIES, INC.
|
||
|
(Registrant)
|
||
|
Date: February
26, 2010
|
/s/ Isy Goldwasser
|
|
|
Isy
Goldwasser
|
||
|
Chief
Executive Officer
|
||
|
(Principal
Executive Officer)
|
||
|
Date: February
26, 2010
|
/s/ Rex S. Jackson
|
|
|
Rex
S. Jackson
|
||
|
Executive
Vice President,
|
||
|
Chief
Financial Officer
|
||
|
(Principal
Financial Officer)
|
||
POWER
OF ATTORNEY
KNOW ALL
PERSONS BY THESE PRESENTS, that each person whose signature appears below
constitutes and appoints Isy Goldwasser, Rex S. Jackson and Richard J.
Rosenthal, or any of them, each with the power of substitution, his
attorney-in-fact, to sign any amendments to this Annual Report on Form 10-K, and
to file the same, with exhibits thereto and other documents in connection
therewith, with the Securities and Exchange Commission, hereby ratifying and
confirming all that each of said attorneys-in-fact, or his substitute or
substitutes, may do or cause to be done by virtue hereof.
Pursuant
to the requirements of the Securities Exchange Act of 1934, this report has been
signed below by the following persons on behalf of the registrant and in the
capacities and on the dates indicated.
|
Signature
|
Title
|
Date
|
|||
|
By
|
/s/ ISY GOLDWASSER
|
Chief
Executive Officer and Director
|
February
26, 2010
|
||
|
Isy
Goldwasser
|
(Principal
Executive Officer)
|
||||
|
By
|
/s/ REX S. JACKSON
|
Executive
Vice President
|
February
26, 2010
|
||
|
Rex
S. Jackson
|
and Chief Financial Officer | ||||
|
(Principal
Financial Officer)
|
|||||
|
By
|
/s/ RICHARD J. ROSENTHAL
|
Senior
Vice President of Finance
|
February
26, 2010
|
||
|
Richard
J. Rosenthal
|
(Principal
Accounting Officer)
|
||||
|
By
|
/s/ STEVEN D. GOLDBY
|
Chairman
of the Board
|
February
26, 2010
|
||
|
Steven
D. Goldby
|
|||||
|
By
|
/s/
G. STEPHEN
DECHERNEY
|
Director
|
February
26, 2010
|
||
|
G.
Stephen DeCherney
|
|||||
|
By
|
/s/
TIMOTHY
HARKNESS
|
Director
|
February
26, 2010
|
||
|
Timothy
Harkness
|
|||||
|
By
|
/s/
DAVID C.
HILL
|
Director
|
February
26, 2010
|
||
|
David
C. Hill
|
|||||
|
By
|
/s/ BRUCE A. PASTERNACK
|
Director
|
February
26, 2010
|
||
|
Bruce
A. Pasternack
|
|||||
|
By
|
/s/
CHRIS
VAN INGEN
|
Director
|
February
26, 2010
|
||
|
Chris
van Ingen
|
EXHIBIT
INDEX
|
Exhibit
Number
|
Description
of Document
|
||
|
*2.1
|
(7)
|
Agreement
and Plan of Merger, dated as of November 12, 2004, by and among Symyx
Technologies, Inc., and IntelliChem, Inc.
|
|
|
#2.2
|
(20)
|
Sale
Agreement by and among Elsevier Inc., Elsevier Swiss Holdings S.A.,
Elsevier Japan KK, Elsevier Limited and MDL Information Systems (UK)
Limited as sellers and Symyx Technologies, Inc. as
buyer
|
|
|
(33)
|
Asset
Purchase Agreement, dated as of February 11, 2010, by and among HPR
Global, Inc., Symyx Technologies, Inc., and Symyx Solutions,
Inc.
|
||
|
3.1
|
(1)
|
Amended
and Restated Certificate of Incorporation
|
|
|
3.2
|
(18)
|
Amended
and Restated Bylaws of Symyx Technologies, Inc.
|
|
|
3.3
|
(8)
|
Certificate
of Amendment to the Amended and Restated Bylaws of Symyx Technologies,
Inc.
|
|
|
4.1
|
(2)
|
Specimen
Common Stock Certificate
|
|
|
**10.1
|
(9)
|
Synthematix,
Inc. Amended and Restated 2000 Equity Compensation Plan and forms of
agreements thereunder
|
|
|
**10.2
|
(2)
|
1996
Stock Plan and forms of agreements thereunder
|
|
|
**10.3
|
(11)
|
Amended
and Restated 1997 Stock Plan and forms of agreements
thereunder
|
|
|
**10.4
|
(31)
|
1999
Employee Stock Purchase Plan, as amended
|
|
|
**10.8
|
(16)
|
Form
of Restricted Stock Agreement under the Symyx Technologies, Inc. 1997
Stock Plan
|
|
|
10.10
|
(2)
|
Collaborative
Research and License Agreement dated January 1, 1999 between Symyx and The
Dow Chemical Company
|
|
|
10.11
|
(2)
|
License
Agreement dated June 22, 1995 between Symyx and Lawrence Berkeley
Laboratory, on behalf of The Regents of the University of
California
|
|
| **10.12 | (33) |
List
of Executive Officers Who Participate in Symyx Technologies,
Inc. Executive Change in Control and Severance Benefit
Plan
|
|
|
10.13
|
(3)
|
Lease
by and between East Arques Sunnyvale, LLC and Symyx Technologies, Inc. for
the premises at 1263 E. Arques, Sunnyvale, California, and addenda and
inserts thereto
|
|
|
**10.14
|
(4)
|
2001
Nonstatutory Stock Option Plan
|
|
|
*10.16
|
(5)
|
Alliance,
Technology Transfer, and License Agreement effective April 1, 2003 between
Symyx Technologies, Inc., Symyx Discovery Tools, Inc. and ExxonMobil
Research and Engineering Company
|
|
|
*10.17
|
(8)
|
Alliance
Agreement dated December 16, 2004 between Symyx Technologies, Inc., Symyx
Discovery Tools, Inc. and The Dow Chemical Company
|
|
|
**10.18
|
(8)
|
2003
IntelliChem, Inc. Stock Option Plan and forms of agreements
thereunder
|
|
|
10.19
|
(10)
|
Lease
by and between Oakmead Ventures LLC and Symyx Technologies, Inc. for the
premises at 415 Oakmead Parkway, Sunnyvale, California, and addenda and
inserts thereto
|
|
|
**10.20
|
(16)
|
Form
of Restricted Stock Unit Agreement under the Symyx Technologies, Inc. 1997
Stock Plan.
|
|
|
10.21
|
(13)
|
First
Amendment to Lease dated January 19, 2007 by and between Symyx
Technologies, Inc. and East Arques Sunnyvale, LLC for the
premises at 1263 East Arques Avenue, Sunnyvale, California and addenda and
inserts thereto
|
|
|
**10.23
|
(17)
|
Symyx
Technologies, Inc. Executive Change in Control and Severance Benefit
Plan
|
|
|
**10.26
|
(21)
|
Form
of Restricted Stock Unit Award under the Symyx Technologies, Inc. 2007
Stock Incentive Plan
|
|
|
**10.27
|
(21)
|
Form
of Director and Executive Officer Indemnification
Agreement
|
|
|
10.28
|
(22)
|
Credit
Agreement, dated as of September 28, 2007, by and among Symyx
Technologies, Inc. as borrower, Bank of America, N.A. as administrative
agent and L/C issuer, and the other lenders from time to time party
thereto
|
|
|
**10.29
|
(23)
|
Form
of Stock Option Agreement under the Symyx Technologies, Inc. 2007 Stock
Incentive Plan
|
|
|
**10.30
|
(24)
|
Form
of Stock Option Agreement under the Symyx Technologies, Inc. 2001
Nonstatutory Stock Option Plan
|
|
|
**10.31
|
(25)
|
2007
Stock Incentive Plan, as amended
|
|
|
*10.32
|
(26)
|
Supplemental
Agreement, by and between Symyx Technologies, Inc. and The Dow Chemical
Company
|
|
|
**10.34
|
(27)
|
Fiscal
Year 2008/2009 Base Salaries and Target Bonus Payouts for Executive
Officers
|
|
**10.35
|
(12)
|
Symyx
Technologies, Inc.’s Offer Letter to Rex S. Jackson Dated January 30,
2007
|
|
|
**10.36
|
(12)
|
Symyx
Technologies, Inc.’s Offer Letter to Timothy E. Campbell Dated February 6,
2007
|
|
|
**10.37
|
(12)
|
Symyx
Technologies, Inc.’s Offer Letter to Richard Boehner Dated March 13,
2007
|
|
|
**10.38
|
(14)
|
Consulting
and Independent Contractor Services Agreement between Symyx Technologies,
Inc. and David Hill
|
|
|
**10.39
|
(14)
|
Symyx
Technologies, Inc. Executive Change in Control and Severance Benefit Plan
Confirmation by Dr. W. Henry Weinberg
|
|
|
**10.40
|
(19)
|
First
Amendment to the Consulting and Independent Contractor and Service
Agreement and Work Orders between Symyx Technologies, Inc. and David C.
Hill
|
|
|
(33)
|
Symyx
Technologies, Inc.’s Offer Letter to John Senaldi Dated November 9,
2009
|
||
|
10.42
|
(28)
|
Amendment
to Credit Agreement, dated as of March 12, 2009, among Symyx Technologies,
Inc., each lender from time to time party thereto, and Bank of America,
N.A. as administrative agent and L/C issuer
|
|
|
10.43
|
(30)
|
Third
amendment to Credit Agreement, dated as of September 25, 2009, between
Symyx Technologies, Inc. and Bank of America, N.A. as administrative agent
and L/C issuer
|
|
|
**10.44
|
(29)
|
Symyx
Technologies, Inc.’s Offer Letter to Richard Rosenthal Dated December 4,
2007
|
|
|
**10.45
|
(29)
|
Symyx
Technologies, Inc.’s Offer Letter to Trevor Heritage Dated October 1,
2007
|
|
|
**10.46
|
(29)
|
Symyx
Technologies, Inc.’s Offer Letter to Charley Haley Dated August 12,
2008
|
|
| **10.47 | (15) |
2007
Executive Annual Cash Incentive Plan
|
|
| *10.48 | (32) |
2009
Executive Cash Bonus Awards
|
|
|
(33)
|
List
of Subsidiaries
|
||
|
(33)
|
Consent
of Independent Registered Public Accounting Firm
|
||
|
24.1
|
Power
of Attorney (reference is made to the signature page of this
report)
|
||
|
(33)
|
Certification
of Chief Executive Officer pursuant to Section 302(a) of the
Sarbanes-Oxley Act of 2002.
|
||
|
(33)
|
Certification
of Chief Financial Officer pursuant to Section 302(a) of the
Sarbanes-Oxley Act of 2002.
|
||
|
(33)
|
Certification
pursuant to Section 906 of the Sarbanes-Oxley Act of
2002.
|
* Confidential
treatment has been requested for portions of these exhibits.
** Management
contracts or compensatory plans or arrangements.
# All
schedules and similar attachments to the sales agreement have been omitted.
Copies of such schedules and similar attachments will be furnished
supplementally to the SEC upon request.
(1)
Incorporated by reference to the same number exhibit filed with Registrant’s
Quarterly Report on Form 10-Q for the period ended June 30, 2003 (SEC File No.
0-27765).
(2)
Incorporated by reference to the same number exhibit filed with Registrant’s
Registration Statement on Form S-1 (File No. 333-87453), as
amended.
(3)
Incorporated by reference to the same number exhibit filed with Registrant’s
Annual Report on Form 10-K for the year ended December 31, 2000 (SEC File No.
0-27765).
(4)
Incorporated by reference to exhibit 4.1 filed with Registrant’s Registration
Statement on Form S-8 (File No. 333-82166).
(5)
Incorporated by reference to the same number exhibit filed with Registrant’s
Quarterly Report on Form 10-Q for the period ended September 30, 2003 (SEC File
No. 0-27765).
(6)
Incorporated by reference to the same number exhibit filed with Registrant’s
Annual Report on Form 10-K for the year ended December 31, 2003 (SEC File No.
0-27765).
(7)
Incorporated by reference to the same number exhibit filed with Registrant’s
Current Report on Form 8-K on December 2, 2004 (SEC File No.
0-27765).
(8)
Incorporated by reference to the same number exhibit filed with Registrant’s
Annual Report on Form 10-K for the year ended December 31, 2004 (SEC File No.
0-27765).
(9)
Incorporated by reference to the same number exhibit filed with Registrant’s
Quarterly Report on Form 10-Q for the period ended March 31, 2005 (SEC File No.
0-27765).
(10)
Incorporated by reference to the same number exhibit filed with Registrant’s
Current Report on Form 8-K on November 15, 2005 (SEC File No.
0-27765).
(11)
Incorporated by reference to the same number exhibit filed with Registrant’s
Annual Report on Form 10-K for the year ended December 31, 2005 (SEC File No.
0-27765).
(12)
Incorporated by reference to the same number exhibit filed with Registrant’s
Quarterly Report on Form 10-Q for the period ended March 31, 2008 (SEC File No.
0-27765).
(13)
Incorporated by reference to the same number exhibit filed with Registrant’s
Current Report on Form 8-K on January 19, 2007 (SEC File No.
0-27765).
(14)
Incorporated by reference to the same number exhibit filed with Registrant’s
Quarterly Report on Form 10-Q for the period ended June 30, 2008 (SEC File No.
0-27765).
(15)
Incorporated by reference to the same number exhibit filed with Registrant’s
Current Report on Form 8-K on February 14, 2007 (SEC File No.
0-27765).
(16)
Incorporated by reference to the same number exhibit filed with the Registrant’s
Annual Report on Form 10-K for the year ended December 31, 2006 (SEC File No.
0-27765).
(17)
Incorporated by reference to the same number exhibit filed with Registrant’s
Quarterly Report on Form 10-Q for the period ended March 31, 2007 (SEC File No.
0-27765).
(18)
Incorporated by reference to the same number exhibit filed with Registrant’s
Current Report on Form 8-K filed on December 1, 2008 (SEC File No.
000-27765).
(19)
Incorporated by reference to the same number exhibit filed with Registrant’s
Current Report on Form 8-K on November 7, 2008 (SEC File No.
0-27765).
(20)
Incorporated by reference to Exhibit 10.25 filed with Registrant’s Current
Report on Form 8-K on August 15, 2007 (SEC File No. 0-27765).
(21)
Incorporated by reference to the same number exhibit filed with Registrant’s
Current Report on Form 8-K on September 4, 2007 (SEC File No.
0-27765).
(22)
Incorporated by reference to the same number exhibit filed with Registrant’s
Current Report on Form 8-K on October 4, 2007 (SEC File No.
0-27765).
(23)
Incorporated by reference to the same number exhibit filed with Registrant’s
Current Report on Form 8-K on November 8, 2007 (SEC File No.
0-27765).
(24)
Incorporated by reference to Exhibit 10.7 filed with Registrant’s Quarterly
Report on Form 10-Q for the period ended September 30, 2007 (SEC File No.
0-27765).
(25)
Incorporated by reference to Exhibit 99.1 filed with Registrant’s Registration
Statement on Form S-8 filed on August 8, 2008 (SEC File No.
333-152893).
(26)
Incorporated by reference to the same number exhibit filed with Registrant’s
Annual Report on Form 10-K for the period ended December 31, 2007 (SEC File No.
0-27765).
(27)
Incorporated by reference to Item 5.02 of the Registrant’s Current Report on
Form 8-K filed on February 24, 2009 (SEC File No. 0-27765).
(28)
Incorporated by reference to the same number exhibit filed with Registrant’s
Annual Report on Form 10-K for the period ended December 31, 2008 (SEC File No.
0-27765).
(29)
Incorporated by reference to the same number exhibit filed with Registrant’s
Quarterly Report on Form 10-Q for the period ended March 31, 2009 (SEC File No.
0-27765).
(30)
Incorporated by reference to the same number exhibit filed with Registrant’s
Quarterly Report on Form 10-Q for the period ended September 30, 2009 (SEC File
No. 0-27765).
(31)
Incorporated by reference to the like-described exhibit filed with the
Registrant’s Registration Statement on Form S-8 (SEC File No.
333-159019).
(32)
Incorporated
by reference to the information set forth under Item 5.02 of the Registrant’s
Current Report on Form 8-K filed on February 22, 2010 (SEC File No. 0-27765),
and Item 9B of this Annual Report on Form 10-K.
(33)
Filed here within.
94