Attached files
Table of Contents
United States
Securities and Exchange Commission
Washington, D.C. 20549
FORM 10-K
| x | ANNUAL REPORT PURSUANT TO SECTION 13 OR 15(d) OF THE SECURITIES EXCHANGE ACT OF 1934 |
For the fiscal year ended December 31, 2009
or
| ¨ | TRANSITION REPORT PURSUANT TO SECTION 13 OR 15(d) OF THE SECURITIES EXCHANGE ACT OF 1934 |
For the transition period from to
Commission File Number 0-21229
Stericycle, Inc.
(Exact name of registrant as specified in its charter)
| Delaware |
36-3640402 | |
| (State or other jurisdiction of incorporation or organization) |
(IRS Employer Identification Number) |
28161 North Keith Drive
Lake Forest, Illinois 60045
(Address of principal executive offices including zip code)
(847) 367-5910
(Registrant’s telephone number, including area code)
Securities registered pursuant to Section 12(b) of the Act:
| Common stock, par value $.01 per share |
NASDAQ Stock Market | |
| (Title of each class) | (Name of each exchange on which registered) |
Securities registered pursuant to Section 12(g) of the Act: None
Indicate by check mark if the registrant is a well-known seasoned issuer, as defined in Rule 405 of the Securities Act. YES x NO ¨
Indicate by check mark if the registrant is not required to file reports pursuant to Section 13 or 15(d) of the Securities Act of 1934. YES ¨ NO x
Indicate by check mark whether the registrant (1) has filed all reports required to be filed by Section 13 or 15 (d) of the Securities Exchange Act of 1934 during the preceding 12 months (or for such shorter period that the registrant was required to file reports), and (2) has been subject to such filing requirements for the past 90 days. YES x NO ¨
Indicate by check mark whether the registrant has submitted electronically and posted on its corporate Web site, if any, every Interactive Data File required to be submitted and posted pursuant to Rule 405 of Regulation S-T during the preceding 12 months (or for such shorter period that the registrant was required to submit and post such files). YES ¨ NO ¨
Indicate by check mark if disclosure of delinquent filers pursuant to Item 405 of Regulation S-K is not contained herein, and will not be contained, to the best of registrant’s knowledge, in definitive proxy or information statements incorporated by reference in Part III of this Form 10-K, or any amendment to this Form 10-K. x
Indicate by check mark whether the registrant is a large accelerated filer, an accelerated filer, a non-accelerated filer, or a smaller reporting company. See the definition of “accelerated filer”, “large accelerated filer” and “smaller reporting company” in Rule 12b-2 of the Exchange Act. (Check one)
Large accelerated filer x Accelerated filer ¨ Non-accelerated filer ¨ Smaller reporting company ¨
Indicate by check mark whether the registrant is a shell company (as defined in Exchange Act Rule 12b-2 of the Exchange Act). YES ¨ NO x
State the aggregate market value of voting and non-voting common equity held by non-affiliates computed by reference to the price at which common equity was last sold as of the last business day of the registrant’s most recently completed second fiscal quarter (June 30, 2009): $4,381,798,671.
On February 19, 2010, there were 84,781,016 shares of the Registrant’s common stock outstanding.
DOCUMENTS INCORPORATED BY REFERENCE
Information required by Items 10, 11, 12 and 13 of Part III of this Report is incorporated by reference from the Registrant’s definitive Proxy Statement for the 2010 Annual Meeting of Stockholders to be held on May 25, 2010.
Table of Contents

Stericycle, Inc.
2009 ANNUAL REPORT ON FORM 10-K
| Page No. | ||||
| PART I. | ||||
| Item 1. |
1 | |||
| Item 1A. |
9 | |||
| Item 1B. |
12 | |||
| Item 2. |
12 | |||
| Item 3. |
13 | |||
| Item 4. |
13 | |||
| 13 | ||||
| PART II. | ||||
| Item 5. |
Market Price of and Dividends on the Registrant’s Common Equity and Related Stockholder Matters |
15 | ||
| Item 6. |
18 | |||
| Item 7. |
Management’s Discussion and Analysis of Financial Condition and Results of Operations |
19 | ||
| Item 7A. |
28 | |||
| Item 8. |
30 | |||
| Item 9. |
Changes in and Disagreements with Accountants on Accounting and Financial Disclosure |
63 | ||
| Item 9A. |
63 | |||
| Item 9B. |
63 | |||
| PART III. | ||||
| Item 10. |
64 | |||
| Item 11. |
64 | |||
| Item 12. |
Security Ownership of Certain Beneficial Owners and Management and Related Stockholder Matters |
64 | ||
| Item 13. |
Certain Relationships and Related Transactions, and Director Independence |
64 | ||
| Item 14. |
65 | |||
| PART IV. | ||||
| Item 15. |
66 | |||
| Signatures | 70 | |||
Table of Contents
PART I.
Unless the context requires otherwise, “we,” “us” or “our” refers to Stericycle, Inc. and its subsidiaries on a consolidated basis.
Overview
We are in the business of managing regulated waste and providing an array of related services. We operate in the United States, Canada, Argentina, Chile, Mexico, Ireland, Portugal, Romania, and the United Kingdom.
For large-quantity generators of regulated waste such as hospitals and for pharmaceutical companies and distributors, we offer:
| • | our regulated waste management services; |
| • | our Bio Systems® sharps management services to reduce the risk of needle sticks; |
| • | a variety of products and services for infection control; and |
| • | our regulated returns management services for expired or recalled products. |
For small-quantity generators of regulated waste such as doctors’ offices and for retail pharmacies, we offer:
| • | our regulated waste management services; |
| • | our Steri-Safe® Occupational Safety and Health Act (“OSHA”) and Health Insurance Portability and Accountability Act (“HIPAA”) compliance programs; |
| • | a variety of products and services for infection control; and |
| • | our regulated returns management services for expired or recalled products. |
We operate integrated national regulated waste management networks in the United States, Canada, Argentina, Chile, Mexico, Ireland, Portugal, Romania, and the United Kingdom. Our national networks include a total of 113 processing or combined processing and collection sites and 135 additional transfer, collection or combined transfer and collection sites.
Our regulated waste processing technologies include autoclaving, our proprietary electro-thermal-deactivation system (“ETD”), chemical treatment and incineration.
We serve approximately 459,200 customers worldwide, of which approximately 11,300 are large-quantity generators, such as hospitals, blood banks and pharmaceutical manufacturers, and approximately 447,900 are small-quantity generators, such as outpatient clinics, medical and dental offices, long-term and sub-acute care facilities, veterinary offices, municipalities and retail pharmacies.
We benefit from significant customer diversification. No one customer accounts for more than 2% of our total revenues, and our top 10 customers account for approximately 7% of total revenues.
Industry Overview
Governmental legislation and regulation increasingly requires the proper handling and disposal of regulated waste which includes such items as medical waste and pharmaceutical waste. Regulated medical waste is generally any medical waste that can cause an infectious disease and includes: single-use disposable items, such as needles, syringes, gloves and other medical supplies; cultures and stocks of infectious agents; and blood and blood products. Regulated pharmaceutical waste consists of expired or recalled pharmaceuticals.
1
Table of Contents
We believe that in 2009 the size of the global regulated waste market for the services we provide was approximately $10.5 billion. We estimate that our global market share increased to 11.2% in 2009 from 10.3% in 2008. Industry growth is driven by a number of factors. These factors include:
| • | Aging of Population: The average age of the population in the countries we operate in is rising. As people age, they typically require more medical attention and a wider variety of tests, procedures and medications, leading to an increase in the quantity of regulated waste generated. |
| • | Pressure to Reduce Healthcare Costs: The healthcare industry is under pressure to reduce costs. We believe that our services can help healthcare providers to reduce their handling and compliance costs and to reduce their potential liability for employee exposure to blood-borne pathogens and other infectious agents. |
| • | Environmental and Safety Regulation: We believe that many businesses that are not currently using third party regulated waste services are unaware either of the need for proper training of employees or of the requirements of OSHA regarding the handling of regulated waste. These businesses include manufacturing facilities, schools, restaurants, hotels and other businesses where employees may come into contact with blood-borne pathogens or handle hazardous materials. Similarly, the proper handling of expired or recalled products requires an expertise that many businesses lack or find inefficient to provide. |
| • | Shift to Off-Site Treatment: We believe that patient care is continuing to shift from institutional higher-cost acute-care settings to less expensive, smaller, off-site treatment alternatives, with a resulting increase in the number of regulated waste generators that cannot treat their own regulated waste. |
| • | Control of Drug Diversion: The U.S. Drug Enforcement Administration (“DEA”) has recently emphasized improved control of the handling and shipment of controlled substances to prevent diversion and counterfeiting, thus increasing the utility to pharmaceutical manufacturers and distributors of a returns service for expired or recalled pharmaceuticals. |
Competitive Strengths
We believe that we benefit from the following competitive strengths, among others:
| • | Broad Range of Services: We offer our customers a broad range of services to help them develop systems and processes to manage their regulated waste safely and efficiently. For example, we have developed programs to help our customers ensure and maintain compliance with EPA, OSHA and HIPAA regulations. |
| • | Established Network of Processing and Transportation Locations in Each Country: We believe that networks like ours would be very expensive and time-consuming for a competitor to develop. |
| • | Diverse Customer Base and Revenue Stability: We have a very diverse customer base and contractual relationships in all the markets in which we operate. We are also generally protected from the cost of regulatory changes and increases in fuel, insurance and other operating costs because our regulated waste contracts typically allow us to adjust our prices to reflect these cost increases. |
| • | Strong Sales Network and Proprietary Database: We use both telemarketing and direct sales efforts to obtain new regulated waste customers. In addition, we have a large database of potential new small-quantity customers, which we believe gives us a competitive advantage in identifying and reaching this higher-margin sector. |
| • | Experienced Senior Management Team: We have experienced leadership. Our five most senior executives collectively have over 120 years of management experience in the health care, consumer and waste management industries. |
2
Table of Contents
| • | Ability to Integrate Acquisitions: Since 1993 we have completed 180 acquisitions in the United States and foreign countries and have demonstrated a consistent ability to integrate our acquisitions into our operations successfully. |
Our goals are to strengthen our position as a leading provider of regulated waste and compliance services and to continue to improve our profitability. Components of our strategy to achieve these goals include:
| • | Expand Range of Services and Products: We believe that we continue to have opportunities to expand our business by increasing the range of products and services that we offer our existing regulated waste customers. For example, through our Steri-Safe® program, we now offer OSHA compliance services to small-quantity customers, and an acquisition in 2003 enabled us to market our Bio Systems® sharps management program to large-quantity customers in new geographic areas. We have expanded our regulated waste services to pharmaceutical companies and other large-quantity generators through a series of acquisitions beginning in 2005 of nine businesses engaged in regulated returns and recall management or related services. |
| • | Improve Margins: We intend to continue working to improve our margins by increasing our base of small-quantity customers and focusing on service strategies that more efficiently meet the needs of our large-quantity customers. We have succeeded in raising the percentage of our domestic regulated waste revenues from small-quantity customers from 33% for the fourth quarter of 1996 to 63% for 2009. |
| • | Seek Complementary Acquisitions: We intend to continue to seek opportunities to acquire businesses that expand our networks in the United States and internationally and increase our customer base. We believe that selective acquisitions can enable us to improve our operating efficiencies through increased utilization of our service infrastructure. |
Acquisitions
We have substantial experience in evaluating potential acquisitions and determining whether a particular waste business can be integrated into our operations with minimal disruption. Once a business is acquired, we implement programs and procedures to improve customer service, sales, marketing, routing, equipment utilization, employee productivity, operating efficiency and overall profitability.
We completed 180 acquisitions from 1993 through 2009, with 130 in the United States and 50 internationally.
During 2009, we completed 23 acquisitions, of which 16 were regulated waste businesses in the United States and seven were regulated waste businesses in Canada, Latin America, and Europe.
Services and Operations
Collection and Transportation: In many respects, our regulated waste business is one of logistics. Efficiency of collection and transportation of regulated waste is a critical element of our operations because it represents the largest component of our operating costs.
For regulated waste, we supply specially designed reusable leak- and puncture-resistant plastic containers to most of our large-quantity customers and many of our larger small-quantity customers. To assure regulatory compliance, we will not accept regulated waste from customers unless it is properly packaged in containers that we have either supplied or approved.
We collect containers or corrugated boxes of regulated waste from our customers at intervals depending upon customer requirements, contract terms and volume of waste generated. The waste is then transported directly to one of our processing or facilities or to one of our transfer stations where it is combined with other regulated waste and transported to a processing facility.
3
Table of Contents
Transfer stations allow us to temporarily hold small loads of waste until they can be consolidated into full truckloads and transported to a processing or facility. Our use of transfer stations in a “hub and spoke” configuration improves the efficiency of our collection and transportation operations by expanding the geographic area that a particular processing facility can serve and thereby increasing utilization of the facility by increasing the volume of waste that it processes.
We collect some expired or recalled products, but more typically, customers ship them directly to our processing facilities.
Processing and Disposal: Upon arrival at a processing or facility, containers or boxes of regulated waste are typically scanned to verify that they do not contain any unacceptable substances like radioactive material. Any container or box that is discovered to contain unacceptable waste is returned to the customer and the appropriate regulatory authorities are informed.
The regulated waste is then processed using one of our various treatment or processing technologies. Upon completion of the particular process, the resulting waste or incinerator ash is transported for resource recovery, recycling or disposal in a landfill owned by an unaffiliated third party. After plastic containers such as our Steri-Tub® or Bio Systems® containers have been emptied, they are washed, sanitized and returned to customers for re-use.
Upon receipt at a processing facility, expired or recalled products are counted and logged, and controlled substances are stored securely. In accordance with the manufacturer’s instructions, expired or recalled products are then returned to the manufacturer or destroyed in compliance with applicable regulations.
Documentation: We provide complete documentation to our customers for all regulated waste that we collect in accordance with applicable regulations and customer requirements.
Marketing and Sales
Marketing Strategy: We use both telemarketing and direct sales efforts to obtain new customers. In addition, our drivers may also participate in our regulated waste marketing efforts by actively soliciting small-quantity customers they service.
Small-Quantity Customers: We target small-quantity customers as a growth area of our regulated waste business. We believe that small-quantity regulated waste customers view the potential risks of failing to comply with applicable state and federal regulated waste regulations as disproportionate to the cost of the services that we provide. We believe that this factor has been the basis for the significantly higher gross margins that we have achieved with our small-quantity customers relative to our large-quantity customers. We believe that the same potential exists in processing returns of expired products for smaller customers.
Steri-Safe®: Our domestic Steri-Safe® OSHA compliance program provides an integrated regulated waste management and compliance-assistance service for small-quantity customers who typically lack the internal personnel and systems to comply with OSHA regulations. Customers for our Steri-Safe® service pay a predetermined subscription fee in advance for regulated waste collection and processing services and can also choose from available packages of training and education services and products designed to help them to comply with OSHA regulations. Approximately 141,000 small-quantity customers are enrolled in this program. We believe that the implementation of our Steri-Safe® service provides us with an enhanced opportunity to leverage our existing customer base through the program’s prepayment structure and diversified product and service offerings.
Mail-Back Program: We also operate a domestic “mail-back” program by which we can reach small-quantity regulated waste customers located in outlying areas that would be inefficient to serve using our regular route structure. Our mail-back program has allowed us to service customers as far away as Hawaii, Alaska, Guam, and the Virgin Islands. Mail-back programs are also used in home care patient settings.
4
Table of Contents
Large-Quantity Customers: Our marketing efforts to large-quantity customers are conducted by account executives, service specialists and healthcare compliance specialists focused on serving as a trusted advisor for our customers. In this role, our field resources provide advice, training and consultative services to assist our large-quantity customers reach their objectives of: 1) staying in compliance with local, state, and federal regulations, 2) reducing their impact on the environment, and 3) maintaining a safe work environment for their staff and patients.
We offer singular waste stream services, including regulated waste services and Sharps Management Service featuring our Bio Systems® reusable containers. Additionally, we have the ability to manage all of the waste streams generated by the facility with our Integrated Waste Stream Solutions service. Many of Stericycle’s LQ services deliver fully integrated/ turnkey solutions which include program design, clinical staff education, implementation support, onsite service personnel and the necessary service equipment to support each program.
National Accounts: As a result of our extensive geographic coverage, we are capable of servicing national account customers (i.e., customers requiring regulated waste services at various geographically dispersed locations).
Contracts: We have multi-year contracts with the majority of our customers. We negotiate individual contracts with each customer. Although we have a standard form of contract, terms may vary depending upon the customer’s service requirements and the volume of regulated waste generated and, in some jurisdictions, statutory and regulatory requirements. Substantially all of our contracts with small-quantity customers contain automatic renewal provisions.
International
We conduct regulated waste operations in Canada, Argentina, Chile, Mexico, Ireland, Portugal, Romania, and the United Kingdom. We began our operations in Canada and Mexico in 1998, Argentina in 1999, the United Kingdom in 2004, Ireland in 2006, Chile in 2008, and Romania and Portugal in 2009.
Processing Technologies
We currently use both non-incineration technologies (autoclaving, chemical treatment and our proprietary ETD technology) and incineration technologies for treating regulated waste.
Stericycle was founded on the belief that there was a need for safe, secure and environmentally responsible management of regulated medical waste. From our beginning we have championed the use of non-incineration treatment technologies such as our ETD process. While we recognize that some state regulations currently in force mandate that some types of regulated waste must be incinerated, we also know from years of experience working with our customers that there are ways to reduce the amount of regulated waste that is ultimately incinerated. The most effective strategy that we have seen involves comprehensive education of our customers in waste minimization and segregation.
Autoclaving: Autoclaving treats regulated waste with steam at high temperature and pressure to kill pathogens. Autoclaving alone does not change the appearance of waste, and some landfill operators may not accept recognizable regulated waste, but autoclaving may be combined with a shredding or grinding process to render the regulated waste unrecognizable.
ETD: Our ETD treatment process includes a system for grinding regulated waste. After grinding, ETD uses an oscillating field of low-frequency radio waves to heat regulated waste to temperatures that destroy pathogens such as viruses, bacteria, fungi and yeast without melting the plastic content of the waste. ETD does not produce regulated air or water emissions.
5
Table of Contents
Incineration: Incineration burns regulated waste at elevated temperatures and reduces it to ash. Incineration reduces the volume of waste, and it is the recommended treatment and disposal option for some types of regulated waste such as anatomical waste or residues from chemotherapy procedures. Air emissions from incinerators can contain certain byproducts that are subject to federal, state and, in some cases, local regulation. In some circumstances, the ash byproduct of incineration may be regulated.
Chem-Clave: Chemclaving treats regulated waste using high heat, pressure, and a steam auger to kill pathogens. The waste is treated in a sealed container while the auger shreds the waste, making it unrecognizable while exposing more surface area of the waste to the steam. After shredding and treatment, the waste residue is sterile and safe for landfill.
Competition
The regulated waste industry is highly competitive, and barriers to entry into the regulated waste collection and disposal business and the pharmaceutical returns business are very low. Our competitors consist of many different types of service providers, including a large number of regional and local companies. In the regulated waste industry, another major source of competition is the on-site treatment of regulated waste by some large-quantity generators, particularly hospitals.
In addition, in the regulated waste industry we face potential competition from businesses that are attempting to commercialize alternate treatment technologies or products designed to reduce or eliminate the generation of regulated waste, such as reusable or degradable medical products.
Governmental Regulation
The regulated waste industry is subject to extensive and frequently changing federal, state and local laws and regulations. This statutory and regulatory framework imposes a variety of compliance requirements, including requirements to obtain and maintain government permits. These permits grant us the authority, among other things:
| • | to construct and operate collection, transfer and processing facilities; |
| • | to transport regulated waste within and between relevant jurisdictions; and |
| • | to handle particular regulated substances. |
Our permits must be periodically renewed and are subject to modification or revocation by the issuing authority.
We are also subject to regulations that govern the definition, generation, segregation, handling, packaging, transportation, treatment, storage and disposal of regulated waste. In addition, we are subject to extensive regulations designed to minimize employee exposure to regulated waste.
Domestic Federal Regulation: Five U.S. federal agencies have authority over regulated waste. These agencies are the U.S. Environmental Protection Agency (“EPA”), OSHA, U.S. Department of Transportation (“DOT”), the U.S. Postal Service (“USPS”) and DEA. These agencies supervise regulated waste under a variety of statutes and regulations. The principal statutes and regulations are:
| • | Medical Tracking Act of 1988. In the late 1980s, the EPA outlined a two-year demonstration program pursuant to the Medical Waste Tracking Act (“MWTA”), which was added to the Resource Conservation and Recovery Act of 1976. In regulations implementing the MWTA, the EPA defined medical waste and established guidelines for its segregation, handling, containment, labeling and transport. The MWTA demonstration program expired in 1991, but the MWTA established a model followed by many states in developing their specific medical waste regulatory framework. |
6
Table of Contents
| • | Occupational Safety and Health Act of 1970. The Occupational Safety and Health Act of 1970 authorizes OSHA to issue occupational safety and health standards. Various standards apply to certain aspects of our operations and govern such matters as exposure to blood borne pathogens and other potentially infectious materials. |
| • | Resource Conservation and Recovery Act of 1976. The Resource Conservation and Recovery Act of 1976 (“RCRA”) created standards for the generation, transportation, treatment, storage and disposal of solid and hazardous wastes. Medical wastes are currently considered non-hazardous solid wastes under RCRA. However, some substances collected by us from some of our customers, including photographic fixer developer solutions, lead foils and dental amalgam, are considered hazardous wastes. |
| • | Clean Air Act Regulations. In August 1997, the EPA adopted regulations under the Clean Air Act Amendments of 1990 that limit the discharge into the atmosphere of pollutants released by regulated waste incineration. These regulations required every state to submit to the EPA for approval a plan to meet minimum emission standards for these pollutants. We currently operate seven incinerators in the United States. We believe these incinerators are in compliance with applicable state requirements. |
| • | DOT Regulations. DOT has adopted regulations under the Hazardous Materials Transportation Authorization Act of 1994 that require us to package and label regulated waste in compliance with designated standards, and which incorporate blood borne pathogens standards issued by OSHA. Under these standards, we must, among other things, identify our packaging with a “biohazard” marking on the outer packaging, and our regulated waste container must be sufficiently rigid and strong to prevent tearing or bursting. It must also be puncture-resistant, leak-resistant, properly sealed and impervious to moisture. |
Expired or recalled pharmaceuticals are subject to substantially the same DOT regulations as medical waste. We identify these products by their National Drug Code number and classify them by their handling, transportation and disposal requirements.
| • | Comprehensive Environmental Response, Compensation and Liability Act of 1980. The Comprehensive Environmental Response, Compensation and Liability Act of 1980 (“CERCLA”) established a regulatory and remedial program to provide for the investigation and cleanup of facilities that have released or threaten to release hazardous substances into the environment. CERCLA and state laws similar to it may impose strict, joint and several liability on the current and former owners and operators of facilities from which releases of hazardous substances have occurred and on the generators and transporters of the hazardous substances that come to be located at these facilities. |
| • | USPS Regulations. We have obtained permits from the USPS to conduct our “mail-back” program, pursuant to which customers mail approved containers of “sharps” (needles, knives, broken glass and the like) directly to our treatment facilities. |
| • | Controlled Substances Act. Our returns service for expired and recalled pharmaceuticals is required to comply with DEA regulations relating to the approval and permitting of processing facilities, management of employees engaged in the collection, processing and disposal of controlled substances, proper documentation and reporting to the DEA. |
Domestic State and Local Regulation: We conduct business in all 50 states and Puerto Rico. Each state has its own regulations related to the handling, treatment and storage of regulated waste. Although there are many differences among the various state laws and regulations, for regulated waste many states have followed the model under the state RCRA equivalent. In each state where we operate a processing facility or a transfer station, we are required to comply with numerous state and local laws and regulations as well as our operating plan for applicable facilities. In addition, many local governments have ordinances and regulations, such as zoning and health regulations that affect our operations.
7
Table of Contents
We maintain numerous governmental permits, registrations, and licenses to conduct our business. Our permits vary from state to state based upon our activities within that state and on the applicable state and local laws and regulations.
Foreign Regulation: We are subject to substantial regulation by the governments of the foreign jurisdictions in which we conduct regulated waste operations. The statutory and regulatory requirements vary from jurisdiction to jurisdiction.
Patents and Proprietary Rights
We consider the protection of our ETD technology to be relevant to our business. Our policy is to protect our technology by a variety of means, including applying for patents in the United States and in other foreign countries.
We hold seven current United States patents relating to the ETD treatment process and other aspects of processing regulated waste. We have filed or have been assigned patent applications in several foreign countries and we have received patents in Australia, Canada, Denmark, France, Ireland, Italy, Japan, Mexico, South Africa, South Korea, Spain, Sweden, and the United Kingdom.
The term of the first-to-end of our existing United States patents relating to our ETD treatment process ended in May 2009 and the term of the last-to-end will currently end in January 2019.
We own federal registrations of the trademarks “Steri-Fuel®”, “Steri-Plastic®”, “Steri-Tub®”, “Direct Return®”, “Steri-Safe®”, the service mark Stericycle® and a service mark consisting of a nine-circle design.
Potential Liability and Insurance
The regulated waste industry involves potentially significant risks of statutory, contractual, tort and common law liability claims. Potential liability claims could involve, for example:
| • | cleanup costs; |
| • | personal injury; |
| • | damage to the environment; |
| • | employee matters; |
| • | property damage; or |
| • | alleged negligence or professional errors or omissions in the planning or performance of work. |
We could also be subject to fines or penalties in connection with violations of regulatory requirements.
We carry $35 million of liability insurance (including umbrella coverage), and under a separate policy, $10 million of aggregate pollution and legal liability insurance ($5 million per incident), which we consider sufficient to meet regulatory and customer requirements and to protect our employees, assets and operations.
Employees
As of December 31, 2009, we had 7,784 full-time and 415 part-time employees, of which 5,524 were employed in the United States and 2,675 internationally. Approximately 300 of our U.S. drivers, transportation helpers and plant workers are covered by a total of five collective bargaining agreements with local unions of the International Brotherhood of Teamsters. These agreements expire at various dates through November 2011. We also have approximately 658 employees in Latin America under various collective bargaining agreements. We consider our employee relations to be satisfactory.
8
Table of Contents
Website Access
We maintain an Internet website, www.stericycle.com, providing a variety of information about us. Our annual reports on Form 10-K, quarterly reports on Form 10-Q and current reports on Form 8-K that we file with the Securities and Exchange Commission are available, as soon as practicable after filing, at the investors’ page on our website, or by a direct link to our filings on the SEC’s free website, www.sec.gov.
We are subject to extensive governmental regulation, which is frequently difficult, expensive and time-consuming to comply with.
The regulated waste management industry is subject to extensive federal, state and local laws and regulations relating to the collection, transportation, packaging, labeling, handling, documentation, reporting, treatment and disposal of regulated waste. Our business requires us to obtain many permits, authorizations, approvals, certificates and other types of governmental permission from every jurisdiction where we operate. We believe that we currently comply in all material respects with all applicable permitting requirements. State and local regulations change often, however, and new regulations are frequently adopted. Changes in the regulations could require us to obtain new permits or to change the way in which we operate under existing permits. We might be unable to obtain the new permits that we require, and the cost of compliance with new or changed regulations could be significant.
Many of the permits that we require, especially those to build and operate processing plants and transfer facilities, are difficult and time-consuming to obtain. They may also contain conditions or restrictions that limit our ability to operate efficiently, and they may not be issued as quickly as we need them (or at all). If we cannot obtain the permits that we need when we need them, or if they contain unfavorable conditions, it could substantially impair our operations and reduce our revenues.
The handling and treatment of regulated waste carries with it the risk of personal injury to employees and others.
Our business requires us to handle materials that may be infectious or hazardous to life and property in other ways. While we try to handle such materials with care and in accordance with accepted and safe methods, the possibility of accidents, leaks, spills, and acts of God always exists. Examples of possible exposure to such materials include:
| • | truck accidents; |
| • | damaged or leaking containers; |
| • | improper storage of regulated waste by customers; |
| • | improper placement by customers of materials into the waste stream that we are not authorized or able to process, such as certain body parts and tissues; or |
| • | malfunctioning treatment plant equipment. |
Human beings, animals or property could be injured, sickened or damaged by exposure to regulated waste. This in turn could result in lawsuits in which we are found liable for such injuries, and substantial damages could be awarded against us.
While we carry liability insurance intended to cover these contingencies, particular instances may occur that are not insured against or that are inadequately insured against. An uninsured or underinsured loss could be substantial and could impair our profitability and reduce our liquidity.
9
Table of Contents
The handling of regulated waste exposes us to the risk of environmental liabilities, which may not be covered by insurance.
As a company engaged in regulated waste management, we face risks of liability for environmental contamination. The federal Comprehensive Environmental Response, Compensation and Liability Act of 1980, or CERCLA, and similar state laws impose strict liability on current or former owners and operators of facilities that release hazardous substances into the environment as well as on the businesses that generate those substances and the businesses that transport them to the facilities. Responsible parties may be liable for substantial investigation and clean-up costs even if they operated their businesses properly and complied with applicable federal and state laws and regulations. Liability under CERCLA may be joint and several, which means that if we were found to be a business with responsibility for a particular CERCLA site, we could be required to pay the entire cost of the investigation and clean-up even though we were not the party responsible for the release of the hazardous substance and even though other companies might also be liable.
Our pollution liability insurance excludes liabilities under CERCLA. Thus, if we were to incur liability under CERCLA and if we could not identify other parties responsible under the law whom we are able to compel to contribute to our expenses, the cost to us could be substantial and could impair our profitability and reduce our liquidity. Our customer service agreements make clear that the customer is responsible for making sure that only appropriate materials are disposed of. If there were a claim against us that a customer might be legally liable for, we might not be successful in recovering our damages from the customer.
The level of governmental enforcement of environmental regulations has an uncertain effect on our business and could reduce the demand for our services.
We believe that the government’s strict enforcement of laws and regulations relating to regulated waste collection and treatment has been good for our business. These laws and regulations increase the demand for our services. A relaxation of standards or other changes in governmental regulation of regulated waste could increase the number of competitors or reduce the need for our services.
If we are unable to acquire other regulated waste businesses, our revenue and profit growth may be slowed.
Historically our growth strategy has been based in substantial part on our ability to acquire other regulated waste businesses. We do not know whether in the future we will be able to:
| • | identify suitable businesses to buy; |
| • | complete the purchase of those businesses on terms acceptable to us; |
| • | improve the operations of the businesses that we do buy and successfully integrate their operations into our own; or |
| • | avoid or overcome any concerns expressed by regulators. |
We compete with other potential buyers for the acquisition of other regulated waste companies. This competition may result in fewer opportunities to purchase companies that are for sale. It may also result in higher purchase prices for the businesses that we want to purchase.
We also do not know whether our growth strategy will continue to be effective. Our business is significantly larger than before, and new acquisitions may not have the desired benefits that we have obtained in the past.
The implementation of our acquisition strategy could be affected in certain instances by the concerns of state regulators, which could result in our not being able to realize the full synergies or profitability of particular acquisitions.
We may become subject to inquiries and investigations by state antitrust regulators from time to time in the course of completing acquisitions of other regulated waste businesses. In order to obtain regulatory clearance for
10
Table of Contents
a particular acquisition, we could be required to modify certain operating practices of the acquired business or to divest ourselves of one or more assets of the acquired business. Changes in the terms of our acquisitions required by regulators or agreed to by us in order to settle regulatory investigations could impede our acquisition strategy or reduce the anticipated synergies or profitability of our acquisitions. The likelihood and outcome of inquiries and investigations from state regulators in the course of completing acquisitions cannot be predicted.
Aggressive pricing by existing competitors and the entrance of new competitors could drive down our profits and slow our growth.
The regulated waste industry is very competitive because of low barriers to entry, among other reasons. This competition has required us in the past to reduce our prices, especially to large account customers, and may require us to reduce our prices in the future. Substantial price reductions could significantly reduce our earnings.
We face direct competition from a large number of small, local competitors. Because it requires very little money or technical know-how to compete with us in the collection and transportation of regulated waste, there are many regional and local companies in the industry. We face competition from these businesses, and competition from them is likely to exist in the new locations to which we may expand in the future. In addition, large national companies with substantial resources may decide to enter the regulated waste industry. For example, in the U.S., Waste Management, Inc., a major solid waste company, has begun offering regulated waste management services to hospitals and possibly other large quantity generators of regulated waste.
Our competitors could take actions that would hurt our growth strategy, including the support of regulations that could delay or prevent us from obtaining or keeping permits. They might also give financial support to citizens’ groups that oppose our plans to locate a treatment or transfer facility at a particular location.
Restrictions in our senior unsecured credit facility may limit our ability to pay dividends, incur additional debt, make acquisitions and make other investments.
Our senior unsecured credit facility contains covenants that restrict our ability to make distributions to stockholders or other payments unless we satisfy certain financial tests and comply with various financial ratios.
It also contains covenants that limit our ability to incur additional indebtedness, acquire other businesses and make capital expenditures, and imposes various other restrictions. These covenants could affect our ability to operate our business and may limit our ability to take advantage of potential business opportunities as they arise.
The loss of our senior executives could affect our ability to manage our business profitably.
We depend on a small number of senior executives. Our future success will depend upon, among other things, our ability to keep these executives and to hire other highly qualified employees at all levels. We compete with other potential employers for employees, and we may not be successful in hiring and keeping the executives and other employees that we need. We do not have written employment agreements with any of our executive officers, and officers and other key employees could leave us with little or no prior notice, either individually or as part of a group. Our loss of or inability to hire key employees could impair our ability to manage our business and direct its growth.
11
Table of Contents
Our expansion into foreign countries exposes us to unfamiliar regulations and may expose us to new obstacles to growth.
We plan to grow both in the United States and in foreign countries. We have established operations in the United States, Canada, Mexico, Argentina, Chile, the United Kingdom, Ireland, Portugal, and Romania. Foreign operations carry special risks. Although our business in foreign countries has not yet been affected, our business in the countries in which we currently operate and those in which we may operate in the future could be limited or disrupted by:
| • | exchange rate fluctuations; |
| • | government controls; |
| • | import and export license requirements; |
| • | political or economic instability; |
| • | trade restrictions; |
| • | changes in tariffs and taxes; |
| • | our unfamiliarity with local laws, regulations, practices and customs; |
| • | restrictions on repatriating foreign profits back to the United States or movement of funds to other countries; |
| • | difficulties in staffing and managing international operations. |
Foreign governments and agencies often establish permit and regulatory standards different from those in the United States. If we cannot obtain foreign regulatory approvals, or if we cannot obtain them when we expect, our growth and profitability from international operations could be limited. Fluctuations in currency exchange could have similar effects.
Our earnings could decline if we write-off intangible assets, such as goodwill.
As a result of acquisition accounting for our various acquisitions, our balance sheet at December 31, 2009 contains goodwill of $1.394 billion and other intangible assets, net of accumulated amortization, of $269.5 million (including indefinite lived intangibles of $71.1 million). In accordance with Accounting Standards Codification (“ASC”) Topic 350 “Intangibles—Goodwill and Other,” we evaluate on an ongoing basis whether facts and circumstances indicate any impairment of the value of indefinite-lived intangible assets such as goodwill. As circumstances after an acquisition can change, we may not realize the value of these intangible assets. If we were to determine that a significant impairment has occurred, we would be required to incur non-cash write-offs of the impaired portion of goodwill and other unamortized intangible assets, which could have a material adverse effect on our results of operations in the period in which the write-off occurs.
Item 1B. Unresolved Staff Comments
None.
We lease office space for our corporate offices in Lake Forest, Illinois. Domestically, we own or lease two ETD processing facilities, 54 facilities that provide autoclave or incineration processing, and four facilities that use other processing technologies. All of our processing facilities also serve as collection sites. We own or lease 108 additional transfer and collection sites and nine additional sales/administrative sites. Internationally, we own or lease two ETD processing facilities, 44 facilities that provide autoclave or incineration processing, and seven facilities that use other processing technologies. We also lease or own 27 transfer and collection sites, 15 additional sales/administrative sites, and lease two landfills. We believe that these processing and other facilities are adequate for our present and anticipated future needs.
12
Table of Contents
We operate in a highly regulated industry and must deal with regulatory inquiries or investigations from time to time that may be instituted for a variety of reasons. We are also involved in a variety of civil litigation from time to time.
On November 30, 2009, we entered into an agreement with the United States Department of Justice (“DOJ”) and the States of Missouri and Nebraska providing clearance under the Hart-Scott-Rodino Antitrust Improvements Act of 1976 that allowed us to complete our pending acquisition of MedServe, Inc., which we closed on December 4, 2009.
Our agreement with the DOJ and the States of Missouri and Nebraska agreement requires us to divest certain assets that we acquired from MedServe consisting of an autoclave treatment facility in Newton, Kansas, four transfer stations in Kansas, Oklahoma, Nebraska and Missouri and certain large customer accounts and associated assets related to these facilities. We are in the process of complying with the required divestiture. In addition, our agreement requires us for a period of ten years to notify the DOJ and the States of Missouri and Nebraska before acquiring any business that is engaged in both the collection and treatment of infectious waste in Kansas, Missouri, Nebraska or Oklahoma.
Item 4. Submission of Matters to a Vote of Security Holders
No matter was submitted to a vote of our stockholders during the fourth quarter of 2009.
Executive Officers of the Registrant
The following table contains certain information regarding our five current executive officers:
| Name |
Position |
Age | ||
| Mark C. Miller |
Chairman, President and Chief Executive Officer | 54 | ||
| Richard T. Kogler |
Executive Vice President and Chief Operating Officer | 50 | ||
| Frank J.M. ten Brink |
Executive Vice President and Chief Financial Officer | 53 | ||
| Richard L. Foss |
Executive Vice President, President International | 55 | ||
| Michael J. Collins |
President, Return Management Services | 53 |
Mark C. Miller has served as our Chairman, President and Chief Executive Officer since joining us in May 1992. From May 1989 until he joined us, Mr. Miller served as vice president for the Pacific, Asia and Africa in the International Division of Abbott Laboratories, which he joined in 1976 and where he held a number of management and marketing positions. Mr. Miller received a B.S. degree in computer science from Purdue University, where he graduated Phi Beta Kappa.
Richard T. Kogler joined us as Chief Operating Officer in December 1998. From May 1995 through October 1998, Mr. Kogler was vice president and chief operating officer of American Disposal Services, Inc., a solid waste management company. From October 1984 through May 1995, Mr. Kogler served in a variety of management positions with Waste Management, Inc. Mr. Kogler received a B.A. degree in chemistry from St. Louis University.
Frank J.M. ten Brink has served as our Executive Vice President, Finance and Chief Financial Officer since June 1997. From 1991 until 1996 he served as chief financial officer of Hexacomb Corporation, and from 1996 until joining us, he served as chief financial officer of Telular Corporation. Prior to 1991, he held various financial management positions with Interlake Corporation and Continental Bank of Illinois. Mr. ten Brink received a B.B.A. degree in international business and a M.B.A. degree in finance from the University of Oregon.
13
Table of Contents
Richard L. Foss has served as Executive Vice President of Corporate Development since March 2003 and became Executive Vice President, President International in July 2008. From 1999 to 2002, Mr. Foss was a corporate vice president and director of worldwide product marketing in the personal communication sector at Motorola Inc., and from 1977 until 1999, he held a number of management and marketing positions at The Procter & Gamble Company, including vice president and general manager of U.S. oral care products and general manager of U.S. respiratory and gastrointestinal products. Mr. Foss received a B.S. degree in chemistry and an M.B.A degree from Rensselaer Polytechnic Institute.
Michael J. Collins has served as President of our Return Management Services Division since June 2006. Prior to joining us, he served at Abbott Laboratories, a diversified health care company, which he joined in 1982 and where he held a number of management and marketing positions, most recently as vice president, medical products group health systems. Mr. Collins received a B.A. degree in business and education from the University of New Haven and a M.B.A. degree in business administration from National University.
14
Table of Contents
PART II.
Item 5. Market Price of and Dividends on the Registrant’s Common Equity and Related Stockholder Matters
As of February 19, 2010, we had 164 stockholders of record. The Company’s stock trades on the NASDAQ National Market under the ticker symbol SRCL.
The following table provides the high and low sales prices of our Common Stock for each calendar quarter during our two most recent fiscal years:
| Quarter |
High | Low | ||||
| First quarter 2008 |
$ | 62.13 | $ | 50.38 | ||
| Second quarter 2008 |
58.91 | 50.82 | ||||
| Third quarter 2008 |
64.77 | 49.72 | ||||
| Fourth quarter 2008 |
$ | 61.13 | $ | 48.83 | ||
| First quarter 2009 |
$ | 52.66 | $ | 45.82 | ||
| Second quarter 2009 |
52.54 | 46.11 | ||||
| Third quarter 2009 |
53.18 | 47.46 | ||||
| Fourth quarter 2009 |
$ | 58.10 | $ | 47.58 | ||
We did not pay any cash dividends during 2009 and have never paid any dividends on our common stock. We currently expect that we will retain future earnings for use in the operation and expansion of our business and do not anticipate paying any cash dividends in the foreseeable future. See Item 7, “Management’s Discussion and Analysis of Financial Condition and Results of Operations.”
Under resolutions that our Board of Directors adopted in May 2002, February 2005, February 2007, May 2007 and May 2008, we have been authorized to purchase a cumulative total of 16,224,578 shares of our common stock on the open market. As of December 31, 2009, we had purchased a cumulative total of 13,186,117 shares.
15
Table of Contents
The following table provides information about our purchases of shares of our common stock during the year ended December 31, 2009:
Issuer Purchases of Equity Securities
| Period |
Total Number of Shares (or Units) Purchased |
Average Price Paid per Share (or Unit) |
Number of Shares (or Units) Purchased as Part of Publicly Announced Plans or Programs |
Maximum Number (or Approximate Dollar Value) of Shares (or Units) that May Yet Be Purchased Under the Plans or Programs | |||||
| January 1 - January 31, 2009 |
340,965 | $ | 48.11 | 340,965 | 4,215,843 | ||||
| February 1 - February 28, 2009 |
143,998 | 46.59 | 143,998 | 4,071,845 | |||||
| March 1 - March 31, 2009 |
51,383 | 46.90 | 51,383 | 4,020,462 | |||||
| April 1 - April 30, 2009 |
39,862 | 48.52 | 39,862 | 3,980,600 | |||||
| May 1 - May 31, 2009 |
300 | 46.53 | 300 | 3,980,300 | |||||
| June 1 - June 30, 2009 |
— | — | — | 3,980,300 | |||||
| July 1 - July 31, 2009 |
— | — | — | 3,980,300 | |||||
| August 1 - August 31, 2009 |
126,578 | 49.41 | 126,578 | 3,853,722 | |||||
| September 1 - September 30, 2009 |
721,591 | 48.47 | 721,591 | 3,132,131 | |||||
| October 1 - October 31, 2009 |
93,665 | 47.83 | 93,665 | 3,038,466 | |||||
| November 1 - November 30, 2009 |
5 | 54.04 | 5 | 3,038,461 | |||||
| December 1 - December 31, 2009 |
— | — | — | 3,038,461 | |||||
| Total |
1,518,347 | $ | 48.20 | 1,518,347 | 3,038,461 | ||||
Equity Compensation Plans
The following table summarizes information as of December 31, 2009 relating to our equity compensation plans pursuant to which stock option grants, restricted stock awards or other rights to acquire shares of our common stock may be made or issued:
Equity Compensation Plan Information
| Plan Category |
Number of Securities to be Issued Upon Exercise of Outstanding Options, Warrants and Rights (a) |
Weighted-Average Exercise Price of Outstanding Options, Warrants and Rights (b) |
Number of Securities Remaining Available for Future Issuance Under Equity Compensation Plans (Excluding Securities Reflected in Column (a)) (c) | ||||
| Equity compensation plans approved by our security holders(1) |
5,705,060 | $ | 39.04 | 3,768,689 | |||
| Equity compensation plans not approved by our security holders(2) |
1,682,693 | $ | 23.18 | 414,317 | |||
| (1) | These plans consist of our 2008 Incentive Stock Plan, 2005 Incentive Stock Plan, 1997 Stock Option Plan, Directors Stock Option Plan, 1995 Incentive Compensation Plan and the Employee Stock Purchase Plan. |
| (2) | The only plan in this category is our 2000 Nonstatutory Stock Option Plan. |
In 2000, our Board of Directors approved the 2000 Nonstatutory Stock Option Plan (the “2000 Plan”), which authorized the granting of nonstatutory stock options for 7,000,000 shares of our common stock to employees (but not to officers or directors). See Note 13 to the Consolidated Financial Statements for a description of this plan.
16
Table of Contents
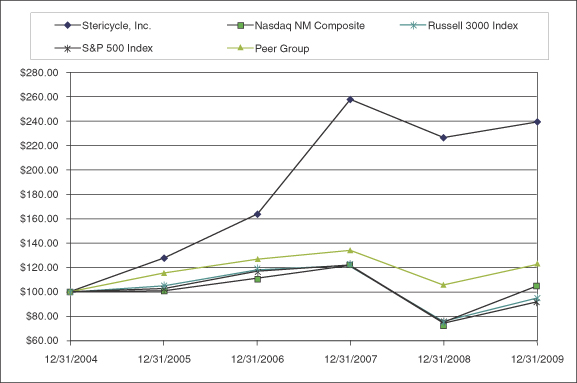
Performance Graph
The following graph compares the cumulative total return (i.e., stock price appreciation plus dividends) on our common stock over the five-year period ending December 31, 2009 with the cumulative total return for the same period on the NASDAQ National Market Composite Index, the S&P 500 Index and an index of a peer group of companies that we selected consisting of Republic Services, Inc., SRI/Surgical Express, Inc. (formerly Sterile Recoveries, Inc.), Steris Corporation, and Waste Management, Inc. The graph assumes that $100 was invested on December 31, 2004 in our common stock and in the stock represented by each of the three indexes, and that all dividends were reinvested.
The stock price performance of our common stock reflected in the following graph is not necessarily indicative of future performance.
17
Table of Contents
Item 6. Selected Consolidated Financial Data
In thousands, except per share data
| Years Ended December 31, | ||||||||||||||||||||
| 2009 | 2008 | 2007 | 2006(3) | 2005 | ||||||||||||||||
| Statement of Income Data(1) |
||||||||||||||||||||
| Revenues |
$ | 1,177,736 | $ | 1,083,679 | $ | 932,767 | $ | 789,637 | $ | 609,457 | ||||||||||
| Income from operations |
315,189 | 274,239 | 224,544 | 201,762 | 166,532 | |||||||||||||||
| Net income attributable to Stericycle, Inc. |
175,691 | 148,708 | 118,378 | 105,270 | 67,154 | |||||||||||||||
| Earnings per share – Diluted(2) |
2.03 | 1.68 | 1.32 | 1.16 | 0.74 | |||||||||||||||
| Depreciation and amortization |
39,990 | 34,148 | 31,137 | 27,036 | 21,431 | |||||||||||||||
| Statements of Cash Flow Data |
||||||||||||||||||||
| Net cash flow provided by/(used for): |
||||||||||||||||||||
| Operating activities |
$ | 277,246 | $ | 210,555 | $ | 174,042 | $ | 160,162 | $ | 94,327 | ||||||||||
| Investing activities |
(350,189 | ) | (132,930 | ) | (135,261 | ) | (201,425 | ) | (156,001 | ) | ||||||||||
| Financing activities |
81,772 | (77,882 | ) | (32,635 | ) | 52,547 | 59,500 | |||||||||||||
| Balance Sheet Data(1) |
||||||||||||||||||||
| Cash, cash equivalents and short-term investments |
$ | 16,898 | $ | 10,503 | $ | 18,364 | $ | 16,040 | $ | 8,545 | ||||||||||
| Total assets |
2,182,803 | 1,759,298 | 1,608,159 | 1,327,906 | 1,047,660 | |||||||||||||||
| Long-term debt, net of current portion |
922,919 | 753,846 | 613,781 | 443,115 | 348,841 | |||||||||||||||
| Stericycle, Inc. shareholders’ equity |
$ | 845,695 | $ | 670,480 | $ | 714,075 | $ | 625,081 | $ | 521,634 | ||||||||||
| (1) | See Note 4 to the Consolidated Financial Statements for information concerning our acquisitions during the three years ended December 31, 2009. |
| (2) | See Note 12 to the Consolidated Financial Statements for information concerning the computation of net income per common share. |
| • | In 2009, net income includes the effects of $6.8 million of after-tax transactional expenses related to acquisitions that in prior years was allowed to be capitalized, and $1.0 million of after-tax restructuring costs for our regulated returns management services business. These costs were partially offset by $1.8 million benefit due to a net release of the prior years’ tax reserves. The net effect of these transactions negatively impacted diluted earnings per share (“EPS”) by $0.06. |
| • | In 2008, net income includes nonrecurring costs (net of tax) of $3.5 million related to a business dispute settlement and related costs, and a fixed asset write-down of equipment of $0.3 million. These costs negatively impacted diluted EPS by $0.05. |
| • | In 2007, net income includes nonrecurring costs (net of tax) of $9.3 million, of which $7.7 million were net non-cash items. These costs negatively impacted EPS by $0.10, related to the following: |
| i. | We recognized legal settlement expense related to the arbitration award in Australia, including expected arbitration cost reimbursements to be paid in 2008; |
| ii. | We wrote down our investment in Medam, B.A., an Argentine joint venture. The write down of our investment in Argentina was a result of the legal restructuring of the business operations; |
| iii. | We wrote down the White Rose Environmental tradename as a result of the name change of our subsidiary in the United Kingdom; |
| iv. | We wrote down the permit intangible for a treatment facility in the United Kingdom that was no longer being used; |
| v. | We wrote down equipment that had been permanently idled; |
| vi. | We recorded a gain on the divestiture of selected assets of Sterile Technologies, Ltd., one of our subsidiaries in the United Kingdom; |
| vii. | We received proceeds from two of our insurance carriers for coverage related to the 3CI Complete Compliance Corporation (“3CI”) class action litigation settlement; |
| viii. | We divested the over the counter products portion of our Scherer Labs assets which resulted in a gain. |
18
Table of Contents
| • | In 2006, net income includes costs (net of tax) related to a fixed asset write-down of equipment of $0.2 million, write-down of an investment in securities of $0.6 million, partially offset by income recorded from insurance proceeds related to the 3CI settlement of $0.6 million. The net amount of $0.2 million did not affect EPS. |
| • | In 2005, net income includes costs (net of tax) related to the 3CI preliminary settlement of class action litigation of $23.4 million, South Africa note receivable write-down of $1.5 million, fixed asset impairments of $0.5 million, settlement of licensing litigation of $1.1 million, and items related to debt restructuring of $0.3 million which negatively impacted EPS by $0.30 per share. Of the total of $26.8 million of such items, $3.4 million were non-cash items. |
| (3) | On January 1, 2006, we adopted new accounting standards for share-based payments using the modified prospective method to account for stock compensation costs. The standard requires the measurement and recognition of compensation expense for all stock-based payment awards made to our employees and directors. During the years ended December 31, 2009, 2008, 2007 and 2006, we recognized stock compensation expense (net of tax) of $9.3, $7.3 million, $6.6 million and $6.5 million, respectively. See Note 13 to the Consolidated Financial Statements for additional information related to stock compensation expense. |
Item 7. Management’s Discussion and Analysis of Financial Condition and Results of Operations
The following discussion of our financial condition and results of operations should be read in conjunction with our Consolidated Financial Statements and related notes in Item 8 of this Report.
Introduction
We are in the business of managing regulated waste and providing an array of related services. We operate in the United States, Canada, Argentina, Chile, Mexico, Ireland, Portugal, Romania, and the United Kingdom.
For large-quantity generators of regulated waste such as hospitals and for pharmaceutical companies and distributors, we offer our institutional regulated waste management services; our Bio Systems® sharps management services to reduce the risk of needle sticks; a variety of products and services for infection control; and our regulated returns and waste management services for expired or recalled products.
For small-quantity generators of regulated waste such as doctors’ offices and for retail pharmacies, we offer: our medical and regulated waste management services; our Steri-Safe® OSHA and HIPAA compliance programs; a variety of products and services for infection control; and our regulated returns services for expired or recalled products.
We operate integrated national regulated waste management networks in the United States, Canada, Argentina, Chile, Mexico, Ireland, Portugal, Romania, and the United Kingdom. Our national networks include a total of 113 processing or combined processing and collection sites and 135 additional transfer, collection or combined transfer and collection sites.
Our regulated waste processing technologies include autoclaving, our proprietary ETD, chemical treatment, and incineration.
As of December 31, 2009, we served approximately 459,200 customers worldwide, of which approximately 447,900 were small quantity customers and 11,300 were large quantity customers.
Critical Accounting Policies and Estimates
Our discussion and analysis of our financial condition and results of operations are based upon our consolidated financial statements, which have been prepared in accordance with accounting principles generally accepted in the United States. The preparation of these financial statements requires that we make estimates and
19
Table of Contents
judgments that affect the reported amounts of assets, liabilities, revenues and expenses, and the related disclosure of contingent assets and liabilities. We believe that of our significant accounting policies (see Note 2 to the Consolidated Financial Statements), the following ones may involve a higher degree of judgment on our part and greater complexity of reporting.
Revenue Recognition: We recognize revenues for our regulated waste services at the time of waste collection. Payments received in advance are deferred and recognized as services are provided. Revenues from regulated returns management services are recorded at the time services are performed. Revenues from product sales are recognized at the time the goods are shipped to the customer. Software licensing revenues are recognized on a prorated basis over the term of the license agreement. We do not have any contracts in a loss position. Losses would be recorded when known and estimable for any contracts that should go into a loss position.
Goodwill and Other Identifiable Intangible Assets: Goodwill associated with the excess purchase price over the fair value of assets acquired is not amortized. We have determined that our permits have indefinite lives and, accordingly, are not amortized (see Note 10 to the Consolidated Financial Statements for additional information).
Our balance sheet at December 31, 2009 contains goodwill of $1.394 billion. In accordance with accounting standards, we evaluate on at least an annual basis, using the fair value of reporting units, whether goodwill is impaired. If we were to determine that a significant impairment has occurred, we would be required to incur non-cash write-offs of the impaired portion of goodwill that could have a material adverse effect on our results of operations in the period in which the write-off occurs. We use the market value of our stock compared to book as the current measurement of total fair value of our company. The performance of each of our reporting units is compared to that fair value ratio, and any unforeseen material drop in our stock price may be an indicator of a potential impairment of goodwill. The results of the 2009 impairment test conducted in June 2009 did not show any impairment of goodwill, and no events have occurred since that time that indicates that an impairment situation exists.
Our permits are tested for impairment annually at December 31 or more frequently if circumstances indicate that they may be impaired. We use a discounted income approach model as the current measurement of the fair value of the permits. The estimate of income is based upon, among other things, certain assumptions about expected future operating performance and an appropriate discount rate determined by management. Our estimates of discounted income may differ from actual income due to, among other things, inaccuracies in economic estimates. The results of the 2009 impairment test did not show any impairment of our permits and no events have occurred since that time that would indicate an impairment situation exists.
Other identifiable intangible assets, such as customer relationships, tradenames, and covenants not-to-compete, are currently amortized using the straight-line method over their estimated useful lives. We have determined that our regulated waste customer relationships have between 15-year and 40-year lives based on the specific type of relationship. This determination was based on an independent study performed on our customer relationships. Although the regulated waste management business is highly competitive, we have been able to maintain high customer retention through contracts with automatic renewal provisions and excellent customer service.
The valuation of our contractual customer relationships was derived using a discounted income approach valuation model similar to the method used for permit impairment testing mentioned earlier. These assets are reviewed for impairment whenever events or changes in circumstances indicate that the carrying amount of an asset may be less than its undiscounted estimated future cash flows. There have been no indicators of impairment of these intangibles (see Note 10 to the Consolidated Financial Statements).
20
Table of Contents
Income Taxes: We are subject to income taxes in both the U.S. and numerous foreign jurisdictions. We compute our provision for income taxes using the asset and liability method, under which deferred tax assets and liabilities are recognized for the expected future tax consequences of temporary differences between the financial reporting and tax bases of assets and liabilities and for operating loss and tax credit carry-forwards. Deferred tax assets and liabilities are measured using the currently enacted tax rates that are expected to apply to taxable income for the years in which those tax assets and liabilities are expected to be realized or settled. Significant judgments are required in order to determine the realizability of these deferred tax assets. In assessing the need for a valuation allowance, we evaluate all significant available positive and negative evidence, including historical operating results, estimates of future taxable income and the existence of prudent and feasible tax planning strategies. Changes in the expectations regarding the realization of deferred tax assets could materially impact income tax expense in future periods. To provide for certain potential tax exposures, we maintain a reserve for specific tax contingencies, the balance of which management believes is adequate.
Accounts Receivable: Accounts receivable consist primarily of amounts due to us from our normal business activities. Accounts receivable balances are determined to be delinquent when the amount is past due based on the contractual terms with the customer. We maintain an allowance for doubtful accounts to reflect the expected uncollectibility of accounts receivable based on past collection history and specific risks identified among uncollected accounts. Accounts receivable are charged to the allowance for doubtful accounts when we have determined that the receivable will not be collected and/or when the account has been referred to a third party collection agency. No single customer accounts for more than 2% of our revenues.
Insurance: Our insurance for workers’ compensation, vehicle liability and physical damage, and employee-related health care benefits is obtained using high deductible insurance policies. A third-party administrator is used to process all such claims. We require all workers’ compensation, vehicle liability and physical damage claims to be reported within 24 hours. As a result, we accrue our workers’ compensation, vehicle and physical damage liability based upon the claim reserves established by the third-party administrator at the end of each reporting period. Our employee health insurance benefit liability is based on our historical claims experience rate. Our earnings would be impacted to the extent that actual claims vary from historical experience. We review our accruals associated with the exposure to these liabilities for adequacy at the end of each reporting period.
Litigation: We operate in a highly regulated industry and deal with regulatory inquiries or investigations from time to time that may be instituted for a variety of reasons. We are also involved in a variety of civil litigation from time to time. Settlements from litigation would be recorded when known, probable and estimable.
Stock Option Plans: We have issued stock options to employees and directors as an integral part of our compensation programs. Stock-based compensation cost is measured at the grant date based on the value of the award and is recognized as expense over the vesting period. Determining the fair value of stock-based awards at the grant date requires considerable judgment, including estimating expected volatility, expected term and risk-free rate. Our expected volatility is based upon historical experience. The expected term of the stock options is based upon a measure of historical volatility of our stock price. The risk-free interest rate assumption is based upon the U.S. Treasury yield rates of a comparable period. If factors change and we employ different assumptions, stock-based compensation expense may differ significantly from what we have recorded in the past.
New Accounting Pronouncements: For information about recently issued accounting pronouncements (see Note 2 to the Consolidated Financial Statements).
Fair Value Considerations: Financial assets and liabilities are classified in their entirety based on the lowest level of input that is significant to the fair value measurement. Our assessment of the significance of a particular input to the fair value measurement requires judgment, and may affect the valuation of assets and liabilities and their placement within the fair value hierarchy levels. The impact of our creditworthiness has been considered in the fair value measurements noted below. In addition, the fair value measurement of a liability must reflect the nonperformance risk of an entity.
21
Table of Contents
At December 31, 2009, we have $15.8 million in cash and cash equivalents and $1.1 million of short-term investments that we carry on our books at fair value using Level 1 inputs.
At December 31, 2009, we have two interest rate swap contracts, covering $100 million of our borrowings outstanding under our term loan facility. The objective of the swap is to reduce the risk of volatile interest expense by fixing the rate. The fair value of the hedge is calculated using Level 2 inputs and is recorded as a current liability of $1.2 million. The fair value was determined using market data inputs to calculate expected future interest rates. The cash streams attributable to the difference between expected future rates and the fixed rate payable is discounted to arrive at the fair value of the two hedges.
As part of our acquisition accounting, we assign fair values to identifiable intangible assets; primarily customer relationships and operating permits. We use a discounted income approach whereby the expected after tax cash flows of the acquired entity are present valued. We use the financial information provided by the acquired company, and management assumptions related to future growth to determine expected future cash flows. We use data provided by unaffiliated external parties as well as internal financial information to calculate a weighted average cost of capital (“WACC”) for the acquired company. The expected cash flows and the calculated WACC are significant inputs in determining the fair value of our intangibles. During 2009, we assigned $70.0 million to customer relationships and $21.0 million to facility environmental permits using Level 3 inputs.
Restructuring Costs: In December of 2009, we announced the consolidation of operations within our Returns Management Services business. This consolidation will result in the closure of our facilities in Boynton Beach, Florida and Conyers, Georgia. The operations of those facilities will be moved to our Indianapolis, Indiana location. We have recognized $1.6 million in expense during the fourth quarter of 2009 related to this restructuring, of which $0.9 million was fixed asset write-offs and $0.7 was primarily severance, which will be paid during 2010. We estimate an additional $1.6 million in expense during 2010 of which approximately $0.8 million will be related to severance and other employee expenses, and $0.8 million will be related to lease and related occupancy charges. We expect that our restructuring will be completed by the end of 2010. We believe this restructuring will allow us to maximize the efficiency of our Returns Management Services business at a single location and management infrastructure.
22
Table of Contents
Year Ended December 31, 2009 Compared to Year Ended December 31, 2008
The following summarizes the Company’s operations:
In thousands, except per share data
| Years Ended December 31, | ||||||||||
| 2009 | 2008 | |||||||||
| $ | % | $ | % | |||||||
| Revenues |
$ | 1,177,736 | 100.0 | $ | 1,083,679 | 100.0 | ||||
| Cost of revenues |
595,608 | 50.6 | 573,554 | 52.9 | ||||||
| Restructuring costs |
704 | 0.1 | — | — | ||||||
| Depreciation |
29,028 | 2.5 | 25,096 | 2.3 | ||||||
| Total cost of revenues |
625,340 | 53.1 | 598,650 | 55.2 | ||||||
| Gross profit |
552,396 | 46.9 | 485,029 | 44.8 | ||||||
| Selling, general and administrative expenses |
216,911 | 18.4 | 194,158 | 17.9 | ||||||
| Depreciation |
5,572 | 0.5 | 5,013 | 0.5 | ||||||
| Amortization |
5,390 | 0.5 | 4,039 | 0.4 | ||||||
| Total selling, general and administrative expenses |
227,873 | 19.3 | 203,210 | 18.8 | ||||||
| Restructuring costs and impairment of fixed assets |
905 | 0.1 | 472 | 0.0 | ||||||
| Transactional expenses related to acquisitions |
7,333 | 0.6 | — | — | ||||||
| Arbitration award and related costs |
— | — | 5,595 | 0.5 | ||||||
| Acquisition integration expenses |
1,096 | 0.1 | 1,513 | 0.1 | ||||||
| Income from operations |
315,189 | 26.8 | 274,239 | 25.3 | ||||||
| Net interest expense |
34,132 | 2.9 | 32,174 | 3.0 | ||||||
| Income tax expense |
101,299 | 8.6 | 90,296 | 8.3 | ||||||
| Net income |
176,389 | 15.0 | 148,771 | 13.7 | ||||||
| Net income attributable to noncontrolling interests |
698 | 0.1 | 63 | 0.0 | ||||||
| Net income attributable to Stericycle, Inc. |
$ | 175,691 | 14.9 | $ | 148,708 | 13.7 | ||||
| Earnings per share – Diluted |
$ | 2.03 | $ | 1.68 | ||||||
Revenues: Our revenues increased $94.1 million, or 8.7%, to $1.18 billion in 2009 from $1.08 billion in 2008. Domestic revenues increased $81.8 million, or 9.8%, to $912.6 million from $830.8 million in 2008 as internal growth for domestic small account customers increased by approximately $39.6 million, over 8%, driven by an increase of Steri-Safe revenues. Revenues from domestic large account customers increased approximately $12.1 million, or over 4%, as we increased the total number of accounts and expanded our Sharps Management program. Returns Management Services revenues decreased by $22.3 million compared to 2008 due to lower than expected recall volumes. Domestic acquisitions less than one year old added an additional $52.4 million to the growth in revenues compared to 2008.
International revenues in 2009 were $265.1 million, compared to $252.9 million in 2008, an increase of $12.3 million, or 4.9%. Internal growth, currency rate fluctuations and acquisitions impact the comparison of 2009 to 2008. Internal growth was $18.3 million. The effect of exchange rates negatively impacted international 2009 revenues by $38.1 million as foreign currencies depreciated against the U.S. dollar. Acquisitions less than one year old favorably impacted revenue growth by $32.1 million.
Cost of Revenues: Our 2009 cost of revenues increased $26.7 million, or $4.5%, to $625.3 million compared to $598.6 million in 2008. Domestic cost of revenues increased $23.3 million, or 5.4%, to $458.3 million in 2009 compared to $435.0 million for 2008. International cost of revenues increased $3.4 million, or 2.1%, to $167.0 million in 2009 compared to $163.6 million in 2008.
Our gross margin percentage increased to 46.9% during 2009 from 44.8% during 2008. Domestic gross margin percentage increased 2.2% to 49.8% during 2009 from 47.6% in 2008. Our domestic gross profit for 2009
23
Table of Contents
was unfavorably impacted by $0.7 million of restructuring costs for our Regulated Returns Management Services business. Lower gross margin in 2008 was primarily the result of energy and transportation costs increases in 2008, which were partially offset by higher revenues related to energy surcharges.
International gross margin improved 1.7 percentage points in 2009 compared to 2008, primarily due to integration of acquisitions and related efficiencies. In general, international gross margins are lower than domestic gross margins because the international operations have less penetration into the small quantity generator market, which has a better gross margin. Historically, the international operations have had most of their revenues from large national healthcare hospitals. As the international revenues increase, consolidated gross margins receive downward pressure due to this “business mix” shift, which can be offset by additional international small quantity market penetration, integration savings and domestic business expansion.
Selling, General and Administrative Expenses: In 2009, our selling, general and administrative (“SG&A”) expenses, excluding acquisition related costs, increased $24.7 million, or 12.1%, to $227.9 million from $203.2 million in 2008. Amortization and depreciation expense as a percentage of revenue slightly increased to 0.9% in 2009 from 0.8% in 2008. Domestically, 2009 SG&A increased $21.4 million, or 13.2%, to $182.6 million from $161.2 million in 2008. The increase was primarily due to spending related to acquisitions, market penetration for our Bio Systems® sharps management and pharma waste programs and investments in the Steri-Safe services.
Internationally, our SG&A increased $3.3 million, or 7.9%, in 2009 to $45.3 million from $42.0 million in 2008, mostly due to acquisitions.
Income from Operations: Income from operations increased by $41.0 million, or 14.9%, to $315.2 million in 2009 from $274.2 million in 2008. Comparisons of income from operations between 2009 and 2008 are affected by various charges not considered part of our day-to-day operations. During the year ended December 31, 2009, we recognized $7.3 million in transactional expenses as result of adopting changes issued by the Financial Accounting Standards Board (“FASB”) to accounting rules related to business combinations and $0.9 million of restructuring costs for our regulated returns management services business. During the year ended December 31, 2008, we recorded expenses of $5.6 million related a business dispute settlement and related costs and $0.5 million related to fixed asset write-offs.
Domestically, our income from operations increased $31.5 million, or 13.5%, to $264.9 million in 2009 from $233.4 million in 2008. Internationally, our income from operations increased $9.5 million, or 23.4%, to $50.3 million in 2009 from $40.8 million in 2008.
Interest Expense and Interest Income: Interest expense increased to $34.4 million during 2009 from $33.1 million during 2008 due to higher borrowings in 2009. Interest income was $0.3 million during 2009 and $0.9 million during 2008.
Income Tax Expense: Income tax expense for the years 2009 and 2008 reflects an effective tax rate of approximately 36.5% and 37.8%, respectively, for federal and state income taxes. In 2009 we recognized a net $1.8 million benefit related to prior years unrecognized tax benefits.
24
Table of Contents
Year Ended December 31, 2008 Compared to Year Ended December 31, 2007
The following summarizes the Company’s operations:
In thousands, except per share data
| Years Ended December 31, | ||||||||||||
| 2008 | 2007 | |||||||||||
| $ | % | $ | % | |||||||||
| Revenues |
$ | 1,083,679 | 100.0 | $ | 932,767 | 100.0 | ||||||
| Cost of revenues |
573,554 | 52.9 | 491,789 | 52.7 | ||||||||
| Depreciation |
25,096 | 2.3 | 23,057 | 2.5 | ||||||||
| Total cost of revenues |
598,650 | 55.2 | 514,846 | 55.2 | ||||||||
| Gross profit |
485,029 | 44.8 | 417,921 | 44.8 | ||||||||
| Selling, general and administrative expenses |
194,158 | 17.9 | 168,657 | 18.1 | ||||||||
| Depreciation |
5,013 | 0.5 | 4,423 | 0.5 | ||||||||
| Amortization |
4,039 | 0.4 | 3,657 | 0.4 | ||||||||
| Total selling, general and administrative expenses |
203,210 | 18.8 | 176,737 | 18.9 | ||||||||
| Gain on sale of assets |
— | — | (2,099 | ) | (0.2 | ) | ||||||
| Impairment of intangible assets |
— | — | 2,269 | 0.2 | ||||||||
| Impairment of fixed assets |
472 | 0.0 | 1,261 | 0.1 | ||||||||
| Arbitration award and related costs |
5,595 | 0.5 | 13,904 | 1.5 | ||||||||
| Acquisition integration expenses |
1,513 | 0.1 | 1,305 | 0.1 | ||||||||
| Income from operations |
274,239 | 25.3 | 224,544 | 24.1 | ||||||||
| Write-down of investment |
— | — | 2,930 | 0.3 | ||||||||
| Insurance proceeds |
— | — | (3,300 | ) | (0.4 | ) | ||||||
| Net interest expense |
32,174 | 3.0 | 32,375 | 3.5 | ||||||||
| Income tax expense |
90,296 | 8.3 | 72,862 | 7.8 | ||||||||
| Net income |
148,711 | 13.7 | 118,653 | 12.7 | ||||||||
| Net income attributable to noncontrolling interests |
63 | 0.0 | 275 | 0.0 | ||||||||
| Net income attributable to Stericycle, Inc. |
$ | 148,708 | 13.7 | $ | 118,378 | 12.7 | ||||||
| Earnings per share – Diluted |
$ | 1.68 | $ | 1.32 | ||||||||
Revenues: Our revenues increased $150.9 million, or 16.2%, to $1.08 billion in 2008 from $932.8 million in 2007. Domestic revenues increased $109.4 million, or 15.2%, to $830.8 million from $721.4 million in 2007 as internal growth for domestic small account customers increased by approximately $52.5 million, over 13%, driven by an increase of Steri-Safe customers. Revenues from domestic large account customers increased approximately $21.9 million, or over 9% as we increased the total number of accounts. Returns Management Services revenues decreased by over $10.8 million compared to 2007 due to lower than expected recall volumes. Domestic acquisitions less than one year old added an additional $45.8 million in revenues compared to 2007.
International revenues in 2008 were $252.9 million, compared to $211.4 million in 2007, an increase of $41.5 million, or 19.6%. Internal growth, currency rate fluctuations, acquisitions, and the divestiture of some plants in the United Kingdom, impact the comparison of 2008 to 2007. Internal growth was $30.8 million. The effect of exchange rates negatively impacted international 2008 revenues by $11.3 million as foreign currencies depreciated against the U.S. dollar. Acquisitions less than one year old favorably impacted revenues by $23.9 million. The divestiture of selected Sterile Technologies Group, Ltd., (“STG”) plants in the first quarter of 2007 negatively impacted the comparison to 2008 by $1.9 million.
Cost of Revenues: Our 2008 cost of revenues increased $83.8 million, or $16.3%, to $598.6 million compared to $514.8 million in 2007. Domestic cost of revenues increased $65.1 million, or 17.6%, to $435.0 million in 2008 compared to $369.9 million for 2007. International cost of revenues increased $18.7 million, or 12.9%, to $163.6 million in 2008 compared to $144.9 million in 2007.
25
Table of Contents
Our gross margin percentage remained at 44.8% during 2008 and 2007. Domestic gross margin percentage decreased 1.1% to 47.6% during 2008 from 48.7% in 2007. Our domestic gross margin decrease was primarily the result of energy and transportation costs increases in 2008, which were partially offset by higher revenues related to energy surcharges.
International gross margin increased 3.9% in 2008 compared to 2007, primarily due to integration of acquisitions and related efficiencies. In general, international gross margins are lower than domestic gross margins because the international operations have less penetration into the small quantity generator market, which has a better gross margin. Historically, the international operations have had most of their revenues from large national healthcare hospitals. As the international segment increases, consolidated gross margins receive downward pressure due to this “business mix” shift, which can be offset by additional international small quantity market penetration, integration savings and domestic business expansion.
Selling, General and Administrative Expenses: In 2008, SG&A expenses increased $26.5 million, or 15.0%, to $203.2 million from $176.7 million in 2007. Amortization and depreciation expense, as a percentage of revenue, did not change from 2007 to 2008. Domestically, 2008 SG&A increased $18.1 million, or 12.6%, to $161.2 million from $143.1 million in 2007. The increase was primarily due to spending related to acquisitions, market penetration for our Bio Systems® sharps management program and investments in the Steri-Safe and returns management services.
Internationally, our SG&A increased $8.4 million, or 25.0%, in 2008 to $42.0 million from $33.6 million in 2007, mostly due to acquisitions.
Income from Operations: Income from operations increased by $49.7 million, or 22.1%, to $274.2 million in 2008 from $224.5 million in 2007. Comparisons of income from operations between 2008 and 2007 are affected by various charges not considered part of our day-to-day operations. During the year ended December 31, 2008, we recorded expenses of $5.6 million related a business dispute settlement and related costs and $0.5 million related to fixed asset write-offs. During the year ended December 31, 2007 we had charges totaling $17.4 million related to permit write-offs, fixed asset write-offs and settlement of arbitration proceedings in Australia. Those charges were partially offset by gains of $2.1 million from the sale of assets of STG and of Scherer Labs.
Domestically, our income from operations increased $40.6 million, or 21.1%, to $233.4 million from $192.8 million in 2007. Internationally, our income from operations increased $9.1 million, or 28.7%, to $40.8 million from $31.7 million in 2006.
Interest Expense and Interest Income: Interest expense slightly decreased to $33.1 million during 2008 from $34.0 million during 2007. The decrease is related to lower interest rates. Interest income was $0.9 million during 2008 and $1.6 million during 2007.
Write-down of Investment: During 2007 we had a $2.9 million non-cash write-down of our investment in Medam B.A., an Argentine medical waste processing company. The write-down was due to a legal restructuring of the Medam B.A. operations. Stericycle now is the sole owner of Medam B.A.
Proceeds from Insurance: During 2007 we received $3.3 million of insurance proceeds related to the 3CI litigation settled in 2005.
Income Tax Expense: Income tax expense for the years 2008 and 2007 reflects an effective tax rate of approximately 37.8% and 38.1%, respectively, for federal and state income taxes.
26
Table of Contents
Liquidity and Capital Resources
Our $850 million senior credit facility maturing in August 2012, our $215 million term loan maturing in June 2012, and our $100 million private placement notes maturing April 2015, all require us to comply with various financial, reporting and other covenants and restrictions, including a restriction on dividend payments. The financial debt covenants are the same for the senior credit facility, the term loan credit agreement and the private placement notes. At December 31, 2009, we were in compliance with all of our financial debt covenants.
As of December 31, 2009, we had $381.6 million of borrowings outstanding under our $850 million senior unsecured credit facility, which includes foreign currency borrowings of $31.1 million. We also had $223.7 million committed to outstanding letters of credit under this facility. The unused portion of the revolving credit facility as of December 31, 2009 was $244.7 million. At December 31, 2009, our interest rates on borrowings under our revolving credit facility were
| • | For short-term borrowing (less than one month): Federal funds rate plus 0.5% or prime rate, whichever is higher; and |
| • | For borrowing greater than one month: LIBOR plus 0.75%. |
The weighted average rate of interest on the unsecured revolving credit facility was 1.0% per annum.
As of December 31, 2009, we had $215 million term loan debt outstanding which was entered into during 2009 with several lenders maturing in June 2012. Term loans under the term loan credit agreement bear interest at fluctuating interest rates determined, for any one-month or other applicable interest period, by reference to the LIBOR plus the applicable margin provided in the term loan agreement. The applicable margin is based on our consolidated leverage ratio and ranges from 2.75% to 3.50%. As of December 31, 2009, the applicable margin was 3.0%. The weighted average rate of interest on the term loan was 5.8% per annum which includes the amounts under our interest rate hedge. After the first year, we are required to make quarterly principal payments of 2.5% of the principal amount of the outstanding term loans, and the remainder at maturity.
As of December 31, 2009, we had $100 million outstanding 5.64% private placement notes which we entered into on April 15, 2008 with nine institutional purchasers. The notes bear interest at the fixed rate of 5.64% per annum. Interest is payable in arrears semi-annually on April 15 and October 15 beginning on October 15, 2009, and principal is payable at the maturity of the notes on April 15, 2015.
At December 31, 2009, we had $292.2 million in other debt outstanding, which includes promissory notes issued in connection with acquisitions during 2004 through 2009, other foreign subsidiary bank debt, and capital leases.
Working Capital: At December 31, 2009, our working capital decreased by $19.0 million to $25.8 million compared to $44.8 million at December 31, 2008. Of the decrease in working capital, $27.1 million increase in current debt relates to financing of foreign and domestic acquisitions in 2009, partially offset by a reduction of accrued liabilities related to a $12.0 million payment of an acquisition purchase accrual.
Net Cash Provided or Used: Net cash provided by operating activities increased $66.7 million, or 31.7%, to $277.2 million during 2009 compared to $210.6 million for 2008. The increase in operating cash was primarily due to an increase in net income of 18.1%, improved collections, and increase in accounts payable.
Net cash used in investing activities during 2009 was $350.2 million compared to $132.9 million used in 2008. The difference is due to $226.9 million more paid for acquisitions in 2009, partially offset by $7.6 million less spent for capital expenditures.
Net cash provided by financing activities was $81.8 million during 2009 compared to $77.9 million net cash used in 2008. As described above, in 2009, we entered into $215 million term loan credit agreement. In 2008, we completed the private placement of $100 million in unsecured seven-year notes, primarily used to pay down our revolver debt. There was $91.7 million less of the purchase of treasury stock in 2009.
27
Table of Contents
Contractual Obligations
The following table summarizes our significant contractual obligations and cash commitments as of December 31, 2009:
Payments due by period (dollars in thousands)
| Total | 2010 | 2011-2012 | 2013-2014 | 2015 and After | |||||||||||
| Long-term debt(1) |
$ | 1,084,770 | $ | 92,393 | $ | 743,652 | $ | 100,286 | $ | 148,439 | |||||
| Capital lease obligations(1) |
6,400 | 3,032 | 2,380 | 311 | 677 | ||||||||||
| Operating leases |
196,931 | 41,483 | 59,308 | 30,375 | 65,765 | ||||||||||
| Purchase obligations |
505 | 409 | 96 | — | — | ||||||||||
| Other long-term liabilities(1)(2) |
7,698 | 1,002 | 1,545 | 998 | 4,153 | ||||||||||
| Total contractual cash obligations |
$ | 1,296,304 | $ | 138,319 | $ | 806,981 | $ | 131,970 | $ | 219,034 | |||||
| (1) | The long-term debt, capital leases, and other long-term liabilities items include both the future principal payment amount as well as an amount calculated for expected future interest payments. For long-term debt with floating rate of interest, management used judgment to estimate the future rate of interest. |
| (2) | Other long-term liabilities include amounts related to non-compete agreements and exclude payments for unrecognized tax benefits. Based on the contingent and uncertain nature of our liability for unrecognized tax benefits, we are unable to make an estimate of the period of potential settlement, if any, with respective taxing authorities. |
At December 31, 2009, we had $223.7 million in stand-by letters of credit issued.
We anticipate that our operating cash flow, together with borrowings under our senior secured credit facility, will be sufficient to meet our anticipated future operating expenses, capital expenditures and debt service obligations as they become due during the next 12 months and the foreseeable future.
Guarantees: We have guaranteed a loan to JPMorganChase Bank N.A. on behalf of Shiraishi-Sogyo Co. Ltd (“Shiraishi”). Shiraishi is a customer in Japan that is expanding their medical waste management business and has a one year loan with a current balance of $5.2 million with JPMorganChase Bank N.A. that expires in May 2010. We also have notes receivable to Shiraihsi for approximately $14.9 million in support of their medical waste business. These amounts are collateralized with the assets of Shiraishi and related companies.
Item 7A. Quantitative and Qualitative Disclosures about Market Risk
We are subject to market risks arising from changes in interest rates. Our potential additional interest expense over one year that would result from a hypothetical, instantaneous and unfavorable change of 100 basis points in the interest rate on all of our variable rate obligations would be approximately $5.5 million on a pre-tax basis.
28
Table of Contents
In October 2008, Stericycle entered into three interest rate swap contracts covering $225 million of our borrowings outstanding under our senior credit facility. The objective of the swap is to reduce the risk of volatile interest expense by fixing the rate. In October 2009 we settled one interest rate swap with the notional value of $125 million. The remaining two contracts are as follows:
In thousands
| Notional |
Fixed Interest Rate |
Variable Interest Rate |
Expiration Date | ||||
| $75,000 |
2.79 | % | 1 Month Libor | April 2010 | |||
| $25,000 |
2.94 | % | 1 Month Libor | October 2010 |
The interest rate swaps are designated as cash flow hedges; the notional amounts and all other significant terms of the swap agreement are matched to the provisions and terms of the variable rate debt hedged. We apply hedge accounting to account for these instruments.
We have exposure to commodity pricing for gas and diesel fuel for our trucks and for the purchase of containers and boxes. We do not hedge these items to manage the exposure.
29
Table of Contents
Item 8. Consolidated Financial Statements and Supplementary Data
Management’s Report on Internal Control Over Financial Reporting
The management of the Company is responsible for establishing and maintaining adequate internal control over financial reporting. Internal control over financial reporting is defined in Rules 13a-15(f) under the Securities Exchange Act of 1934 as a process designed by, or under the supervision of, a company’s principal executive and principal financial officers and effected by the company’s board of directors, management and other personnel, to provide reasonable assurance regarding the reliability of financial reporting and the preparation of financial statements for external purposes in accordance with U.S. generally accepted accounting principles. The Company’s internal control over financial reporting includes those policies and procedures that:
(i) pertain to the maintenance of records that, in reasonable detail, accurately and fairly reflect the transactions and dispositions of the assets of the Company;
(ii) provide reasonable assurance that transactions are recorded as necessary to permit preparation of financial statements in accordance with U.S. generally accepted accounting principles, and that receipts and expenditures of the Company are being made only in accordance with authorizations of management and directors of the Company; and
(iii) provide reasonable assurance regarding prevention or timely detection of unauthorized acquisition, use or disposition of the Company’s assets that could have a material effect on the financial statements.
Because of its inherent limitations, internal control over financial reporting may not prevent or detect misstatements. Projections of any evaluation of effectiveness to future periods are subject to the risk that controls may become inadequate because of changes in conditions, or that the degree of compliance with the policies or procedures may deteriorate.
The Company’s management assessed the effectiveness of the Company’s internal control over financial reporting as of December 31, 2009. In making this assessment, management used the criteria set forth by the Committee of Sponsoring Organizations of the Treadway Commission (COSO) in Internal Control—Integrated Framework.
Based on this assessment and those criteria, management concludes that the Company maintained effective internal control over financial reporting as of December 31, 2009.
The Company’s independent auditors have issued an attestation report on the Company’s internal control over financial reporting. That report appears on page 31.
Stericycle, Inc.
Lake Forest, IL
February 26, 2010
30
Table of Contents
Report of Independent Registered Public Accounting Firm
The Board of Directors and Shareholders of Stericycle, Inc. and Subsidiaries
We have audited Stericycle, Inc.’s internal control over financial reporting as of December 31, 2009, based on criteria established in Internal Control—Integrated Framework issued by the Committee of Sponsoring Organizations of the Treadway Commission (the COSO criteria). Stericycle, Inc.’s management is responsible for maintaining effective internal control over financial reporting, and for its assessment of the effectiveness of internal control over financial reporting included in the accompanying Management’s Report on Internal Control over Financial Reporting. Our responsibility is to express an opinion on the company’s internal control over financial reporting based on our audit.
We conducted our audit in accordance with the standards of the Public Company Accounting Oversight Board (United States). Those standards require that we plan and perform the audit to obtain reasonable assurance about whether effective internal control over financial reporting was maintained in all material respects. Our audit included obtaining an understanding of internal control over financial reporting, assessing the risk that a material weakness exists, testing and evaluating the design and operating effectiveness of internal control based on the assessed risk, and performing such other procedures as we considered necessary in the circumstances. We believe that our audit provides a reasonable basis for our opinion.
A company’s internal control over financial reporting is a process designed to provide reasonable assurance regarding the reliability of financial reporting and the preparation of financial statements for external purposes in accordance with generally accepted accounting principles. A company’s internal control over financial reporting includes those policies and procedures that (1) pertain to the maintenance of records that, in reasonable detail, accurately and fairly reflect the transactions and dispositions of the assets of the company; (2) provide reasonable assurance that transactions are recorded as necessary to permit preparation of financial statements in accordance with generally accepted accounting principles, and that receipts and expenditures of the company are being made only in accordance with authorizations of management and directors of the company; and (3) provide reasonable assurance regarding prevention or timely detection of unauthorized acquisition, use, or disposition of the company’s assets that could have a material effect on the financial statements.
Because of its inherent limitations, internal control over financial reporting may not prevent or detect misstatements. Also, projections of any evaluation of effectiveness to future periods are subject to the risk that controls may become inadequate because of changes in conditions, or that the degree of compliance with the policies or procedures may deteriorate.
In our opinion, Stericycle, Inc. maintained, in all material respects, effective internal control over financial reporting as of December 31, 2009, based on the COSO criteria.
We also have audited, in accordance with the standards of the Public Company Accounting Oversight Board (United States), the consolidated balance sheets of Stericycle, Inc. and Subsidiaries as of December 31, 2009 and 2008, and the related consolidated statements of income, changes in equity, and cash flows for each of the three years in the period ended December 31, 2009 and our report dated February 26, 2010 expressed an unqualified opinion thereon.
Ernst & Young LLP
Chicago, Illinois
February 26, 2010
31
Table of Contents
Report of Independent Registered Public Accounting Firm
The Board of Directors and Shareholders of Stericycle, Inc. and Subsidiaries
We have audited the accompanying consolidated balance sheets of Stericycle, Inc. and Subsidiaries as of December 31, 2009 and 2008, and the related consolidated statements of income, changes in equity, and cash flows for each of the three years in the period ended December 31, 2009. Our audits also included the financial statement schedule listed in the Index at Item 15(a). These financial statements and schedule are the responsibility of the Company’s management. Our responsibility is to express an opinion on these financial statements and schedule based on our audits.
We conducted our audits in accordance with the standards of the Public Company Accounting Oversight Board (United States). Those standards require that we plan and perform the audit to obtain reasonable assurance about whether the financial statements are free of material misstatement. An audit includes examining, on a test basis, evidence supporting the amounts and disclosures in the financial statements. An audit also includes assessing the accounting principles used and significant estimates made by management, as well as evaluating the overall financial statement presentation. We believe that our audits provide a reasonable basis for our opinion.
In our opinion, the financial statements referred to above present fairly, in all material respects, the consolidated financial position of Stericycle, Inc. and Subsidiaries at December 31, 2009 and 2008, and the consolidated results of their operations and their cash flows for each of the three years in the period ended December 31, 2009, in conformity with U.S. generally accepted accounting principles. Also, in our opinion, the related financial statement schedule, when considered in relation to the basic financial statements taken as a whole, presents fairly in all material respects the information set forth therein.
As discussed in Note 2 to the consolidated financial statements, the Company changed its method of accounting for business combinations with the adoption of the guidance originally issued in FASB Statement No. 141(R), Business Combinations (codified in FASB ASC Topic 805, Business Combinations) and FASB Statement No. 160, Noncontrolling Interests in Consolidated Financial Statements-an Amendment of ARB No.51 (codified in FASB ASC Topic 810, Consolidation) both of which were effective January 1, 2009.
We also have audited, in accordance with the standards of the Public Company Accounting Oversight Board (United States), Stericycle Inc.’s internal control over financial reporting as of December 31, 2009, based on criteria established in Internal Control-Integrated Framework issued by the Committee of Sponsoring Organizations of the Treadway Commission and our report dated February 26, 2010 expressed an unqualified opinion thereon.
Ernst & Young LLP
Chicago, Illinois
February 26, 2010
32
Table of Contents
STERICYCLE, INC. AND SUBSIDIARIES
CONSOLIDATED BALANCE SHEETS
In thousands, except share and per share data
| December 31, | ||||||||
| 2009 | 2008 | |||||||
| ASSETS |
||||||||
| Current Assets: |
||||||||
| Cash and cash equivalents |
$ | 15,767 | $ | 9,095 | ||||
| Short-term investments |
1,131 | 1,408 | ||||||
| Accounts receivable, less allowance for doubtful accounts of $8,709 in 2009 and $6,616 in 2008 |
179,770 | 168,598 | ||||||
| Deferred income taxes |
14,087 | 16,821 | ||||||
| Prepaid expenses |
12,421 | 11,273 | ||||||
| Other current assets |
23,364 | 17,235 | ||||||
| Total Current Assets |
246,540 | 224,430 | ||||||
| Property, Plant and Equipment, net |
246,154 | 207,144 | ||||||
| Other Assets: |
||||||||
| Goodwill |
1,394,091 | 1,135,778 | ||||||
| Intangible assets, less accumulated amortization of $18,546 in 2009 and $14,116 in 2008 |
269,454 | 170,624 | ||||||
| Other |
26,564 | 21,322 | ||||||
| Total Other Assets |
1,690,109 | 1,327,724 | ||||||
| Total Assets |
$ | 2,182,803 | $ | 1,759,298 | ||||
| LIABILITIES AND SHAREHOLDERS’ EQUITY |
||||||||
| Current Liabilities: |
||||||||
| Current portion of long-term debt |
$ | 65,932 | $ | 38,880 | ||||
| Accounts payable |
47,608 | 33,612 | ||||||
| Accrued liabilities |
92,226 | 93,487 | ||||||
| Deferred revenues |
14,954 | 13,663 | ||||||
| Total Current Liabilities |
220,720 | 179,642 | ||||||
| Long-term debt, net of current portion |
922,919 | 753,846 | ||||||
| Deferred income taxes |
171,744 | 147,287 | ||||||
| Other liabilities |
10,247 | 7,885 | ||||||
| Common Shareholders’ Equity: |
||||||||
| Common stock (par value $.01 per share, 120,000,000 shares authorized, 84,715,005 issued and outstanding in 2009, 85,252,879 issued and outstanding in 2008) |
847 | 852 | ||||||
| Additional paid-in capital |
47,522 | 67,776 | ||||||
| Accumulated other comprehensive loss |
(12,292 | ) | (32,075 | ) | ||||
| Retained earnings |
809,618 | 633,927 | ||||||
| Stericycle, Inc. Shareholders’ Equity |
845,695 | 670,480 | ||||||
| Noncontrolling interest |
11,478 | 158 | ||||||
| Total Shareholders’ Equity |
857,173 | 670,638 | ||||||
| Total Liabilities and Shareholders’ Equity |
$ | 2,182,803 | $ | 1,759,298 | ||||
The accompanying notes are an integral part of these financial statements.
33
Table of Contents
STERICYCLE, INC. AND SUBSIDIARIES
CONSOLIDATED STATEMENTS OF INCOME
In thousands, except share and per share data
| Years Ended December 31, | ||||||||||||
| 2009 | 2008 | 2007 | ||||||||||
| Revenues |
$ | 1,177,736 | $ | 1,083,679 | $ | 932,767 | ||||||
| Costs and Expenses: |
||||||||||||
| Cost of revenues |
624,636 | 598,650 | 514,846 | |||||||||
| Restructuring costs – cost of revenues |
704 | — | — | |||||||||
| Selling, general and administrative expenses |
227,873 | 203,210 | 176,737 | |||||||||
| Gain on sale of assets |
— | — | (2,099 | ) | ||||||||
| Restructuring costs and impairment of fixed assets |
905 | 472 | 1,261 | |||||||||
| Impairment of intangible assets |
— | — | 2,269 | |||||||||
| Transactional expenses related to acquisitions |
7,333 | — | — | |||||||||
| Arbitration award and related costs |
— | 5,595 | 13,904 | |||||||||
| Acquisition integration expenses |
1,096 | 1,513 | 1,305 | |||||||||
| Total Costs and Expenses |
862,547 | 809,440 | 708,223 | |||||||||
| Income from Operations |
315,189 | 274,239 | 224,544 | |||||||||
| Other Income (Expense): |
||||||||||||
| Interest income |
201 | 930 | 1,590 | |||||||||
| Interest expense |
(34,333 | ) | (33,104 | ) | (33,965 | ) | ||||||
| Write-down of investment |
— | — | (2,930 | ) | ||||||||
| Proceeds from insurance |
— | — | 3,300 | |||||||||
| Other expense, net |
(3,369 | ) | (2,998 | ) | (1,024 | ) | ||||||
| Total Other Expense |
(37,501 | ) | (35,172 | ) | (33,029 | ) | ||||||
| Income Before Income Taxes |
277,688 | 239,067 | 191,515 | |||||||||
| Income Tax Expense |
101,299 | 90,296 | 72,862 | |||||||||
| Net Income |
$ | 176,389 | $ | 148,771 | $ | 118,653 | ||||||
| Less: Net Income Attributable to Noncontrolling Interests |
698 | 63 | 275 | |||||||||
| Net Income Attributable to Stericycle, Inc. |
175,691 | 148,708 | 118,378 | |||||||||
| Earnings Per Common Share: |
||||||||||||
| Basic |
$ | 2.07 | $ | 1.73 | $ | 1.35 | ||||||
| Diluted |
$ | 2.03 | $ | 1.68 | $ | 1.32 | ||||||
| Weighted Average Number of Common Shares Outstanding: |
||||||||||||
| Basic |
84,769,912 | 85,950,192 | 87,578,650 | |||||||||
| Diluted |
86,744,003 | 88,335,832 | 89,933,242 | |||||||||
The accompanying notes are an integral part of these financial statements.
34
Table of Contents
STERICYCLE, INC. AND SUBSIDIARIES
CONSOLIDATED STATEMENTS OF CASH FLOWS
In thousands
| Years Ended December 31, | ||||||||||||
| 2009 | 2008 | 2007 | ||||||||||
| OPERATING ACTIVITIES: |
||||||||||||
| Net income |
$ | 176,389 | $ | 148,771 | $ | 118,653 | ||||||
| Adjustments to reconcile net income to net cash provided by operating activities: |
||||||||||||
| Gain on sale of assets |
— | — | (2,099 | ) | ||||||||
| Restructuring costs and impairment of fixed assets |
1,609 | 472 | 1,261 | |||||||||
| Impairment of intangibles |
— | — | 2,269 | |||||||||
| Write-down of investment |
— | — | 2,930 | |||||||||
| Write-off of note receivable related to joint venture |
— | 798 | — | |||||||||
| Stock compensation expense |
14,638 | 11,755 | 10,714 | |||||||||
| Excess tax benefit of stock options exercised |
(10,905 | ) | (9,319 | ) | (8,054 | ) | ||||||
| Depreciation |
34,600 | 30,109 | 27,480 | |||||||||
| Amortization |
5,390 | 4,039 | 3,657 | |||||||||
| Deferred income taxes |
22,253 | 26,522 | 17,265 | |||||||||
| Changes in operating assets and liabilities, net of effect of acquisitions and divestitures: |
||||||||||||
| Accounts receivable |
12,567 | (12,998 | ) | (11,400 | ) | |||||||
| Accounts payable |
2,420 | (7,041 | ) | 6,987 | ||||||||
| Accrued liabilities |
21,464 | 19,517 | 1,566 | |||||||||
| Deferred revenues |
89 | 1,597 | 537 | |||||||||
| Other assets and liabilities |
(3,268 | ) | (3,667 | ) | 2,276 | |||||||
| Net cash provided by operating activities |
277,246 | 210,555 | 174,042 | |||||||||
| INVESTING ACTIVITIES: |
||||||||||||
| Payments for acquisitions and international investments, net of cash acquired |
(311,891 | ) | (84,947 | ) | (114,781 | ) | ||||||
| Proceeds from maturity/(purchase) of short-term investments |
385 | (463 | ) | 1,301 | ||||||||
| Proceeds from sale of assets |
— | — | 26,616 | |||||||||
| Proceeds from sale of property and equipment |
1,227 | — | — | |||||||||
| Capital expenditures |
(39,910 | ) | (47,520 | ) | (48,397 | ) | ||||||
| Net cash used in investing activities |
(350,189 | ) | (132,930 | ) | (135,261 | ) | ||||||
| FINANCING ACTIVITIES: |
||||||||||||
| Repayment of long-term debt |
(19,023 | ) | (13,866 | ) | (30,447 | ) | ||||||
| Borrowings on senior credit facility |
963,061 | 977,352 | 506,472 | |||||||||
| Repayments of senior credit facility |
(1,022,666 | ) | (1,000,425 | ) | (428,786 | ) | ||||||
| Proceeds from private placement of long-term note |
— | 100,000 | — | |||||||||
| Proceeds from term loan |
215,000 | — | — | |||||||||
| Principal payments on capital lease obligations |
(1,106 | ) | (527 | ) | (212 | ) | ||||||
| Payments of deferred financing costs |
(3,635 | ) | (236 | ) | (606 | ) | ||||||
| Purchase/ cancellation of treasury stock |
(75,686 | ) | (167,338 | ) | (103,679 | ) | ||||||
| Proceeds from other issuance of common stock |
14,922 | 17,839 | 16,569 | |||||||||
| Excess tax benefit of stock options exercised |
10,905 | 9,319 | 8,054 | |||||||||
| Net cash provided by/(used in) financing activities |
81,772 | (77,882 | ) | (32,635 | ) | |||||||
| Effect of exchange rate changes on cash |
(2,157 | ) | (7,756 | ) | (2,530 | ) | ||||||
| Net increase/(decrease) in cash and cash equivalents |
6,672 | (8,013 | ) | 3,616 | ||||||||
| Cash and cash equivalents at beginning of year |
9,095 | 17,108 | 13,492 | |||||||||
| Cash and cash equivalents at end of year |
$ | 15,767 | $ | 9,095 | $ | 17,108 | ||||||
| NON-CASH ACTIVITIES: |
||||||||||||
| Net issuance of notes payable for certain acquisitions |
$ | 38,090 | $ | 106,074 | $ | 112,509 | ||||||
| Net issuance of common stock for certain acquisitions |
— | — | 13,667 | |||||||||
The accompanying notes are an integral part of these financial statements.
35
Table of Contents
STERICYCLE, INC. AND SUBSIDIARIES
CONSOLIDATED STATEMENTS OF CHANGES IN EQUITY
Years Ended December 31, 2009, 2008 and 2007
In thousands
| Stericycle, Inc. Equity | Noncontrolling Interest |
Total Equity |
||||||||||||||||||||||||
| Issued and Outstanding Shares |
Common Stock |
Additional Paid-In Capital |
Retained Earnings |
Accumulated Other Comprehensive Income (Loss) |
||||||||||||||||||||||
| Balance at January 1, 2007 |
88,504 | $ | 886 | $ | 252,125 | $ | 366,841 | $ | 5,229 | $ | 5,270 | $ | 630,351 | |||||||||||||
| Issuance of common stock for exercise of options and warrants and employee stock purchases |
1,067 | 10 | 16,559 | — | — | — | 16,569 | |||||||||||||||||||
| Issuance of common stock for acquisitions |
228 | 2 | 13,665 | — | — | — | 13,667 | |||||||||||||||||||
| Purchase/ Cancellation of treasury stock |
(2,338 | ) | (24 | ) | (103,655 | ) | — | — | — | (103,679 | ) | |||||||||||||||
| Stock compensation expense |
— | — | 10,714 | — | — | — | 10,714 | |||||||||||||||||||
| Excess tax benefit of disqualifying dispositions of stock options and exercise of non-qualified stock options |
— | — | 8,054 | — | — | — | 8,054 | |||||||||||||||||||
| Change in noncontrolling interest |
— | — | — | — | — | (5,585 | ) | (5,585 | ) | |||||||||||||||||
| Currency translation adjustment |
— | — | — | — | 25,125 | 3 | 25,128 | |||||||||||||||||||
| Change in fair value of cash flow hedge |
— | — | — | — | 166 | — | 166 | |||||||||||||||||||
| Net income |
— | — | — | 118,378 | — | 275 | 118,653 | |||||||||||||||||||
| Comprehensive income |
143,947 | |||||||||||||||||||||||||
| Balance at December 31, 2007 |
87,411 | $ | 874 | $ | 197,462 | $ | 485,219 | $ | 30,520 | $ | (37 | ) | $ | 714,038 | ||||||||||||
| Issuance of common stock for exercise of options and warrants and employee stock purchases |
1,064 | 10 | 19,049 | — | — | — | 19,059 | |||||||||||||||||||
| Purchase/ Cancellation of treasury stock |
(3,222 | ) | (32 | ) | (169,809 | ) | — | — | — | (169,841 | ) | |||||||||||||||
| Stock compensation expense |
— | — | 11,755 | — | — | — | 11,755 | |||||||||||||||||||
| Excess tax benefit of disqualifying dispositions of stock options and exercise of non-qualified stock options |
— | — | 9,319 | — | — | — | 9,319 | |||||||||||||||||||
| Change in noncontrolling interest |
— | — | — | — | — | 184 | 184 | |||||||||||||||||||
| Currency translation adjustment |
— | — | — | — | (59,301 | ) | (52 | ) | (59,353 | ) | ||||||||||||||||
| Change in fair value of cash flow hedge, net of tax of $1,900 |
— | — | — | — | (3,294 | ) | — | (3,294 | ) | |||||||||||||||||
| Net income |
— | — | — | 148,708 | — | 63 | 148,771 | |||||||||||||||||||
| Comprehensive income |
86,124 | |||||||||||||||||||||||||
| Balance at December 31, 2008 |
85,253 | $ | 852 | $ | 67,776 | $ | 633,927 | $ | (32,075 | ) | $ | 158 | $ | 670,638 | ||||||||||||
| Issuance of common stock for exercise of options and employee stock purchases |
1,132 | 12 | 15,889 | — | — | — | 15,901 | |||||||||||||||||||
| Purchase/ Cancellation of treasury stock |
(1,670 | ) | (17 | ) | (73,164 | ) | — | — | — | (73,181 | ) | |||||||||||||||
| Stock compensation expense |
— | — | 14,638 | — | — | — | 14,638 | |||||||||||||||||||
| Excess tax benefit of disqualifying dispositions of stock options and exercise of non-qualified stock options |
— | — | 22,383 | — | — | — | 22,383 | |||||||||||||||||||
| Change in noncontrolling interest |
— | — | — | — | — | 9,787 | 9,787 | |||||||||||||||||||
| Currency translation adjustment |
— | — | — | — | 17,595 | 835 | 18,430 | |||||||||||||||||||
| Change in fair value of cash flow hedge, net of tax of $454 |
— | — | — | — | 2,188 | — | 2,188 | |||||||||||||||||||
| Net income |
— | — | — | 175,691 | — | 698 | 176,389 | |||||||||||||||||||
| Comprehensive income |
197,007 | |||||||||||||||||||||||||
| Balance at December 31, 2009 |
84,715 | $ | 847 | $ | 47,522 | $ | 809,618 | $ | (12,292 | ) | $ | 11,478 | $ | 857,173 | ||||||||||||
The accompanying notes are an integral part of these financial statements.
36
Table of Contents
STERICYCLE, INC. AND SUBSIDIARIES
NOTES TO CONSOLIDATED FINANCIAL STATEMENTS
December 31, 2009
Unless the context requires otherwise, “we”, “us” or “our” refers to Stericycle, Inc. and its subsidiaries on a consolidated basis.
NOTE 1—DESCRIPTION OF BUSINESS
We were incorporated in 1989 and presently serve a very diverse customer base of over 459,000 customers throughout the United States, Canada, Argentina, Chile, Mexico, Ireland, Portugal, Romania, and the United Kingdom. Domestically, we own or lease two ETD processing facilities, 54 facilities that provide autoclave or incineration processing, and four facilities that use other processing technologies. All of our processing facilities also serve as collection sites. We own or lease 108 additional transfer and collection sites and nine additional sales/administrative sites. We use our fully integrated, national network to provide a broad range of services to our customers including regulated waste management services and regulated return and recall management services. Regulated waste management services include regulated waste removal services, sharps management services, products and services for infection control, and safety and compliance programs. Regulated return and recall management services are physical services provided to companies and individual businesses that assist with the handling of products that are being removed from the supply chain due to recalls and expiration. These services also include advanced notification technology that is used to communicate specific instructions to the users of the product. Our waste treatment technologies include autoclaving, incineration, chemical treatment and our proprietary electro-thermal-deactivation system. Internationally, we own or lease two ETD processing facilities, and 44 facilities that provide autoclave or incineration processing, and seven facilities that use other processing technologies. We also lease or own 27 transfer and collection sites, 15 additional sales/administrative sites, and lease two landfills.
The accompanying consolidated financial statements have been prepared pursuant to the rules and regulations of the Securities and Exchange Commission (“SEC”). The preparation of financial statements in conformity with these accounting principles requires us to make estimates and assumptions that affect the reported amounts of assets and liabilities and disclosure of contingent assets and liabilities at the date of the financial statements and the reported amounts of revenue and expenses during the reporting period.
In our opinion, the consolidated financial statements included herein contain all adjustments necessary to present fairly our financial position as of December 31, 2009 and 2008, the results of our operations for the three years ended December 31, 2009, 2008 and 2007, our cash flows for the three years ended December 31, 2009, 2008 and 2007 and our statement of changes in equity for the three years ended December 31, 2009, 2008 and 2007. Such adjustments are of a normal recurring nature. We have evaluated subsequent events through February 26, 2010, the date of issuance of the consolidated financial statements.
The preparation of the consolidated financial statements in conformity with accounting principles generally accepted in the United States requires management to make certain estimates and assumptions that affect the amount of reported assets and liabilities and disclosure of contingent assets and liabilities at the date of the consolidated financial statements and revenues and expenses during the periods reported. Actual results may differ from those estimates.
These consolidated financial statements should be read in conjunction with the Consolidated Financial Statements and notes thereto for the year ended December 31, 2009, as filed with our Annual Report on Form 10-K for the year ended December 31, 2009. Current amounts in previously issued financial statements were reclassified to conform to the current period presentation.
37
Table of Contents
NOTE 2—SUMMARY OF SIGNIFICANT ACCOUNTING POLICIES
Principles of Consolidation:
The consolidated financial statements include the accounts of Stericycle, Inc. and its wholly owned subsidiaries.
Revenue Recognition:
We recognize revenues for our regulated waste services at the time of waste collection. Payments received in advance are deferred and recognized as services are provided. Revenues from Regulated Returns Management Services are recorded at the time services are performed. Revenues from product sales are recognized at the time the goods are shipped to the ordering customer. Software licensing revenues, which are not material, are recognized on a prorated basis over the term of the license agreement. We do not have any contracts in a loss position. Losses would be recorded when known and estimable for any contracts that should go into a loss position.
Cash Equivalents and Short-Term Investments:
We consider all highly liquid investments with a maturity of less than three months when purchased to be cash equivalents. Short-term investments consist of certificates of deposit, which mature in less than one year.
Property, Plant and Equipment:
Property, plant and equipment are stated at cost. Depreciation and amortization, which include the depreciation of assets recorded under capital leases, are computed using the straight-line method over the estimated useful lives of the assets as follows:
| Building and improvements |
5 to 30 years | |
| Machinery and equipment |
5 to 20 years | |
| Containers |
2 to 20 years | |
| Transportation equipment |
3 to 7 years | |
| Office equipment and furniture |
3 to 10 years | |
| Software |
1 to 7 years |
Our containers have a weighted average remaining useful life of 11.9 years.
During the years ended December 31, 2009, 2008 and 2007 we wrote down $0.9 million, $0.5 million and $1.3 million, respectively, related to equipment that had been permanently idled.
Goodwill and Identifiable Intangibles:
Goodwill and identifiable indefinite lived intangibles are not amortized, but are subject to an annual impairment test. Other intangible assets will continue to be amortized over their useful lives. We have determined that our customer relationships have useful lives from 15 to 40 years based upon the type of customer, with a weighted average remaining useful life of 37.5 years. We have non-compete intangibles with useful lives from two to ten years, with a weighted average remaining useful life of 5.7 years. We have tradename intangibles with useful lives from 20 to 40 years, with a weighted average remaining useful life of 38.6 years. We have determined that our permits have indefinite lives and therefore are not amortized.
Valuation of our intangible customer relationships and permits is derived using a discounted income approach. Financial information such as revenues, costs, assets and liabilities related to the intangible asset are
38
Table of Contents
input into a standard valuation model to determine a stream of income attributable to that intangible. The income stream is then discounted to the present to arrive at a valuation. We perform annual impairment tests on our indefinite lived intangible assets.
Valuation of Intangibles:
Our permits are currently tested for impairment annually at December 31 or more frequently if circumstances indicate that they may be impaired. We use a discounted income approach model as the current measurement of the fair value of the permits. The estimate of income is based upon, among other things, certain assumptions about expected future operating performance and an appropriate discount rate determined by management. Our estimates of discounted income may differ from actual income due to, among other things, inaccuracies in economic estimates.
Amortizable identifiable intangible assets, such as customer relationships, tradenames and covenants not-to-compete, are currently amortized using the straight-line method over their estimated useful lives. We have determined that our regulated waste customer relationships have between 15 and 40 year lives based on the specific type of relationship. The valuation of our contractual customer relationships was derived using a discounted income approach valuation model similar to the method used for permit impairment testing mentioned earlier. These assets are reviewed for impairment whenever events or changes in circumstances indicate that the carrying amount of an asset may be less than its undiscounted estimated future cash flows (see Note 10 to the Consolidated Financial Statements).
Income Taxes:
Deferred income tax liabilities and assets are determined based on the differences between the financial statement and income tax basis of assets and liabilities using enacted tax rates in effect for the year in which the differences are expected to reverse.
Accounts Receivable:
Accounts receivable consist primarily of amounts due to us from our normal business activities. We do not require collateral as part of our standard trade credit policy. Accounts receivable balances are determined to be past due when the amount is overdue based on the contractual terms with the customer. We maintain an allowance for doubtful accounts to reflect the expected uncollectibility of accounts receivable based on past collection history and specific risks identified among uncollected accounts. Accounts receivable are written off against the allowance for doubtful accounts when we have determined that the receivable will not be collected and/or when the account has been referred to a third party collection agency. Bad debt expense was $6.9 million, $5.0 million and $4.4 million for the years ended December 31, 2009, 2008 and 2007, respectively.
Financial Instruments:
Our financial instruments consist of cash and cash equivalents, short-term investments, derivatives, accounts receivable and payable and long-term debt. At December 31, 2009, the fair value of the Company’s debt obligations was estimated at $985.0 million, compared to a carrying amount of $988.9 million. This fair value was estimated using market interest rates for comparable instruments. The Company has no current plans to retire a significant amount of its debt prior to maturity. Financial instruments, which potentially subject us to concentrations of credit risk, consist principally of accounts receivable. Credit risk on trade receivables is minimized as a result of the large size of our customer base. No single customer represents greater than 2% of total accounts receivable. We perform ongoing credit evaluation of our customers and maintain allowances for potential credit losses. For any contracts in loss positions, losses are recorded when known and estimable. These losses, when incurred, have been within the range of our expectations.
39
Table of Contents
Use of Estimates:
The preparation of financial statements in conformity with generally accepted accounting principles requires us to make estimates and assumptions that affect the amounts reported in the financial statements and accompanying notes. Some areas where we make estimates include allowance for doubtful accounts, credit memo reserve, accrued employee health and welfare benefits, income tax liabilities and accrued auto and workers’ compensation insurance claims and intangible asset valuations. Such estimates are based on historical trends and on various other assumptions that are believed to be reasonable under the circumstances. Actual results could differ from our estimates.
Future estimated expenses may fluctuate depending on changes in foreign currency rates. The estimates for payments due on long-term debt, lease payments under capital leases, amortization expense and rental payments are based upon foreign exchange rates as of December 31, 2009 (see Notes 7, 10 and 11 to the Consolidated Financial Statements).
Derivative Instruments:
We have two interest rate swap contracts, covering $100 million of our borrowings outstanding under our term loan facility. The objective of the swap is to reduce the risk of volatile interest expense by fixing the rate. The fair market of the two hedges is recorded as a current liability of $1.2 million (see Note 9 to the Consolidated Financial Statements for more information). The fair market value was determined using market data inputs to calculate expected future interest rates. The cash streams attributable to the difference between expected future rates and the fixed rate payable is discounted to arrive at the fair value of the two hedges.
Stock-Based Compensation:
We recognize compensation expense for all stock-based payment awards made to our employees and directors. The fair value of stock-based compensation cost is measured at the grant date based on the value of the award and is recognized as expense over the vesting period. Determining the fair value of stock-based awards at the grant date requires considerable judgment, including estimating expected volatility, expected term and risk-free rate. Our expected volatility is based upon historical experience. The expected term of the stock options is based upon the historical volatility of our stock price. The risk-free interest rate assumption is based upon the U.S. Treasury yield rates for a comparable period. If factors change and we employ different assumptions, stock-based compensation expense may differ significantly from what we have recorded in the past.
Foreign Currency Translation:
Assets and liabilities of foreign affiliates that use the local currency as their functional currency are translated at the exchange rate on the last day of the accounting period, and income statement accounts are translated at the average rates during the period. Related translation adjustments are reported as a component of comprehensive income in shareholders’ equity.
Environmental Matters:
We record a liability for environmental remediation or damages when a cleanup program becomes probable and the costs or damages can be reasonably estimated. We do not have any environmental liabilities recorded at December 31, 2009 nor are we aware of any issues at our facilities that could initiate the need for environmental remediation.
40
Table of Contents
New Accounting Standards:
Accounting Standards Recently Adopted
Codification
On September 30, 2009, Stericycle adopted changes issued by the Financial Accounting Standards Board (“FASB”) to the authoritative hierarchy of GAAP. These changes establish the FASB Accounting Standards Codification (“Codification”) as the source of authoritative accounting principles recognized by the FASB to be applied by nongovernmental entities in the preparation of financial statements in conformity with GAAP. Rules and interpretive releases of the SEC under authority of federal securities laws are also sources of authoritative GAAP for SEC registrants. The FASB will no longer issue new standards in the form of Statements, FASB Staff Positions, or Emerging Issues Task Force Abstracts; instead the FASB will issue Accounting Standards Updates. Accounting Standards Updates will not be authoritative in their own right as they will only serve to update the Codification. These changes and the Codification itself do not change GAAP. Other than the manner in which new accounting guidance is referenced, the adoption of these changes had no impact on the financial statements.
Business Combinations
On January 1, 2009, we adopted an update to existing accounting standards for business combinations. The update, which retains the underlying concepts of the original standard in that all business combinations are still required to be accounted for at fair value under the acquisition method of accounting, changes the method of applying the acquisition method in a number of ways. Acquisition costs are no longer considered part of the fair value of an acquisition and will generally be expensed as incurred, contingent consideration is fair-valued at acquisition date and changes to that fair value are recognized to the income statement, noncontrolling interests are recognized at fair value at the acquisition date, in-process research and development is recorded at fair value as an indefinite lived intangible asset at the acquisition date, restructuring costs associated with a business combination are generally expensed subsequent to the acquisition date, and changes in deferred tax asset valuation allowances and income tax uncertainties after the acquisition date generally will affect income tax expense. Net income for the year of 2009 included the effect of $6.8 million of after-tax charges related to this change in accounting standards. Because of the inherent uncertainty of the number, structure and complexity of the acquisitions that we may complete in the future, and the magnitude of the transaction expenses that we may incur in completing these acquisitions, the future impact of this accounting change is not reasonably estimable.
Effective January 1, 2009, Stericycle adopted changes issued by the FASB on accounting for contingencies acquired through business combinations. These changes apply to all assets acquired and liabilities assumed in a business combination that arise from certain contingencies and requires an acquirer to recognize at fair value, at the acquisition date, an asset acquired or liability assumed in a business combination that arises from a contingency if the acquisition-date fair value of that asset or liability can be determined during the measurement period. Otherwise the asset or liability should be recognized at the acquisition date if certain defined criteria are met. The changes also require (i) contingent consideration arrangements of an acquire assumed by the acquirer in a business combination be recognized initially at fair value; (ii) subsequent measurements of assets and liabilities arising from contingencies be based on a systematic and rational method depending on their nature and contingent consideration arrangements be measured subsequently; and (iii) disclosures of the amounts and measurement basis of such assets and liabilities and the nature of the contingencies.
Consolidation
On January 1, 2009, Stericycle adopted changes issued by the FASB to consolidation accounting and reporting. These changes establish accounting and reporting for the noncontrolling interest in a subsidiary and for the deconsolidation of a subsidiary. This guidance defines a noncontrolling interest, previously called a minority interest, as the portion of equity in a subsidiary not attributable, directly or indirectly, to a parent. These changes require, among other items, that a noncontrolling interest be included in the consolidated statement of financial position within equity separate from the parent’s equity; consolidated net income to be reported at amounts
41
Table of Contents
inclusive of both the parent’s and noncontrolling interest’s shares and, separately, the amounts of consolidated net income attributable to the parent and noncontrolling interest all on the consolidated statement of operations; and if a subsidiary is deconsolidated, any retained noncontrolling equity investment in the former subsidiary be measured at fair value and a gain or loss be recognized in net income based on such fair value. Other than the change in presentation of noncontrolling interests, the adoption of these changes had no impact on the financial statements. The presentation and disclosure requirements of these changes were applied retrospectively and reflect noncontrolling interests in certain Latin American acquisitions.
Derivatives
On January 1, 2009, Stericycle adopted changes issued by the FASB to disclosures about derivative instruments and hedging activities. These changes require enhanced disclosures about an entity’s derivative and hedging activities, including (i) how and why an entity uses derivative instruments, (ii) how derivative instruments and related hedged items are accounted for, and (iii) how derivative instruments and related hedged items affect an entity’s financial position, financial performance, and cash flows. The adoption of these changes did not have a material impact on our financial statements.
Fair Value
On June 30, 2009, Stericycle adopted changes issued by the FASB to fair value disclosures of financial instruments. These changes require a publicly traded company to include disclosures about the fair value of its financial instruments whenever it issues summarized financial information for interim reporting periods. Such disclosures include the fair value of all financial instruments for which it is practicable to estimate that value, whether recognized or not recognized in the statement of financial position; the related carrying amount of these financial instruments; and the method(s) and significant assumptions used to estimate the fair value. Other than the required disclosures the adoption of these changes had no impact on the financial statements.
In August 2009, the FASB issued changes to fair value accounting for liabilities. These changes clarify existing guidance that in circumstances in which a quoted price in an active market for the identical liability is not available, an entity is required to measure fair value using either a valuation technique that uses a quoted price of either a similar liability or a quoted price of an identical or similar liability when traded as an asset, or another valuation technique that is consistent with the principles of fair value measurements, such as an income approach (e.g., present value technique). This guidance also states that both a quoted price in an active market for the identical liability and a quoted price for the identical liability when traded as an asset in an active market when no adjustments to the quoted price of the asset are required are Level 1 fair value measurements. The adoption of this accounting standard did not have a material impact on our financial statements
Subsequent Events
On June 30, 2009, Stericycle adopted changes issued by the FASB relating to the accounting for and disclosure of events that occur after the balance sheet date but before financial statements are issued or are available to be issued, otherwise known as “subsequent events”. Specifically, these changes set forth the period after the balance sheet date during which management of a reporting entity should evaluate events or transactions that may occur for potential recognition or disclosure in the financial statements, the circumstances under which an entity should recognize events or transactions occurring after the balance sheet date in its financial statements, and the disclosures that an entity should make about events or transactions that occurred after the balance sheet date. The adoption of these changes had no impact on the Financial Statements as management already followed a similar approach prior to the adoption of this new guidance.
42
Table of Contents
Accounting Standards not yet adopted
Revenue Recognition
In October 2009, the FASB issued an update to existing guidance on revenue recognition for arrangements with multiple deliverables. This update will allow companies to allocate consideration received for qualified separate deliverables using estimated selling price for both delivered and undelivered items when vendor-specific objective evidence or third-party evidence is unavailable. Additional disclosures discussing the nature of multiple element arrangements, the types of deliverables under the arrangements, the general timing of their delivery, and significant factors and estimates used to determine estimated selling prices are required. We will adopt this update for new revenue arrangements entered into or materially modified beginning January 1, 2011. We do not generally have arrangements with multiple deliverables and therefore do not expect any material impact to our financial statements upon adoption.
Consolidation
In June 2009, the FASB issued a new accounting standard which provides amendments to previous guidance on the consolidation of variable interest entities (“VIE”). This standard clarifies the characteristics that identify VIE and changes how a reporting entity identifies a primary beneficiary that would consolidate the VIE from a quantitative risk and rewards calculation to a qualitative approach based on which variable interest holder has controlling financial interest and the ability to direct the most significant activities that impact the VIE’s economic performance. This statement requires the primary beneficiary assessment to be performed on a continuous basis. It also requires additional disclosures about an entity’s involvement with a VIE, restrictions on the VIE’s assets and liabilities that are included in the reporting entity’s consolidated balance sheet, significant risk exposures due to the entity’s involvement with the VIE, and how its involvement with a VIE impacts the reporting entity’s consolidated financial statements. The standard is effective for fiscal years beginning after November 15, 2009. We adopted the standard on January 1, 2010 and do not expect the standard to have an impact on our financial statements.
NOTE 3—FAIR VALUE MEASUREMENTS
Fair value is defined as the price that would be received to sell an asset or paid to transfer a liability in an orderly transaction between market participants at the measurement date. The fair value hierarchy distinguishes between (1) market participant assumptions developed based on market data obtained from independent sources (observable inputs) and (2) an entity’s own assumptions about market participant assumptions developed based on the best information available in the circumstances (unobservable inputs). The fair value hierarchy consists of three broad levels, which gives the highest priority to unadjusted quoted prices in active markets for identical assets or liabilities (Level 1) and the lowest priority to unobservable inputs (Level 3). The three levels of the fair value hierarchy are described below:
| • | Level 1—Valuations based on quoted prices in active markets for identical assets or liabilities that the entity has the ability to access. |
| • | Level 2—Valuations based on quoted prices for similar assets or liabilities, quoted prices in markets that are not active, or other inputs that are observable or can be corroborated by observable data for substantially the full term of the assets or liabilities. |
| • | Level 3—Valuations based on inputs that are supported by little or no market activity and that are significant to the fair value of the assets or liabilities. |
Financial assets and liabilities are classified in their entirety based on the lowest level of input that is significant to the fair value measurement. Our assessment of the significance of a particular input to the fair value measurement requires judgment, and may affect the valuation of assets and liabilities and their placement within the fair value hierarchy levels. The impact of our creditworthiness has been considered in the fair value measurements noted below. In addition, the fair value measurement of a liability must reflect the nonperformance risk of an entity.
43
Table of Contents
Level 1: At December 31, 2009, we have $15.8 million in cash and cash equivalents, and $1.1 million of short-term investments that we carry on our books at fair value using Level 1 inputs. At December 31, 2008, we had $9.1 million in cash and cash equivalents and $1.4 million of short-term investments on our books at fair value using market price inputs.
Level 2: In October 2008, we entered into three interest rate swap contracts, covering $225 million of our borrowings outstanding under our senior credit facility. The objective of the swaps is to reduce the risk of volatile interest expense by fixing the rate. The interest rate swaps are designated as cash flow hedges; the notional amounts and all other significant terms of the swap agreement are matched to the provisions and terms of the variable rate debt hedged. We apply hedge accounting to these instruments with changes in the fair value of the swap agreements recorded as a component of other comprehensive income. In October 2009 we settled one interest rate swap with the notional value of $125 million. The fair value of the remaining hedges is recorded as a current liability of $1.2 million at December 31, 2009. At December 31, 2008 the fair value of the hedges was recorded as a liability of $4.8 million, of which $2.1 million was current. The fair value was determined using market data inputs to calculate expected future interest rates. The cash streams attributable to the difference between expected future rates and the fixed rate payable is discounted to arrive at the fair value of the two hedges.
Level 3: As part of our acquisition accounting, we assign fair values to identifiable intangible assets; primarily customer relationships and operating permits. We use a discounted income approach whereby the expected after tax cash flows of the acquired entity are present valued. We use the financial information provided by the acquired company, and management assumptions related to future growth to determine expected future cash flows. We use data provided by unaffiliated external parties as well as internal financial information to calculate a weighted average cost of capital (“WACC”) for the acquired company. The expected cash flows and the calculated WACC are significant inputs in determining the fair value of our intangibles. During 2009, we assigned $70.0 million to customer relationships and $21.0 million to facility environmental permits.
At December 31, 2009, the fair value of the Company’s debt obligations was estimated at $985.0 million, compared to a carrying amount of $988.9 million. At December 31, 2008, the fair value of the Company’s debt obligations was estimated at $771.5 million, compared to a carrying amount of $792.7 million. This fair value was estimated using market interest rates for comparable instruments. The Company has no current plans to retire a significant amount of its debt prior to maturity.
There were no movements of items between fair value hierarchies.
NOTE 4—ACQUISITIONS AND DIVESTITURES
During 2009, we completed 23 acquisitions, of which 16 were domestic regulated waste businesses and seven were international regulated waste businesses in Canada, Latin America and Europe.
The aggregate purchase price of our acquisitions during the year ended December 31, 2009 was approximately $350.0 million, of which approximately $19.8 million in cash payments related to transactions that closed in 2008 and were distributed in 2009. The purchase price of our 2009 acquisitions was approximately $330.2, of which $292.1 million was paid in cash and $38.1 million was paid by the issuance of promissory notes.
On November 30, 2009 we entered into an agreement with the United States Department of Justice and the States of Missouri and Nebraska providing clearance under the Hart-Scott-Rodino Antitrust Improvements Act of 1976 that allowed us to complete our acquisition of MedServe, Inc. for $182.5 million. The agreement requires us to divest certain assets that were acquired from MedServe consisting of an autoclave treatment facility in Newton, Kansas, four transfer stations in Kansas, Oklahoma, Nebraska and Missouri and certain large customer accounts and associated assets related to these facilities. In addition, the agreement requires Stericycle for a
44
Table of Contents
period of 10 years to notify the United States Department of Justice and the States of Missouri and Nebraska before acquiring any business that is engaged in both the collection and treatment of infectious waste in Kansas, Missouri, Nebraska and Oklahoma. This divestiture has not been completed. Acquisition accounting for MedServe is not yet complete pending certain intangible valuations and fixed asset appraisals, however estimates for these have been made and are included in our balance sheet.
During 2008, we completed 22 acquisitions, of which 12 were domestic regulated waste businesses, two domestic return management businesses and eight were international regulated waste businesses in Canada, Latin America and Europe. The aggregate net purchase price of all our acquisitions, including adjustments for purchase accounting was approximately $191.0 million, of which $84.9 million was paid in cash and $106.1 million was paid by the issuance of promissory notes. The purchase prices of these acquisitions have been primarily allocated to identifiable intangible assets and goodwill, reflecting the complementary strategic fit that the acquired businesses brought to us.
During 2007, we completed 19 acquisitions, of which ten were domestic regulated waste businesses, one was a domestic assembler and distributor of containers that we use in our mail-back program and eight were international regulated waste businesses in Canada, Latin America and Europe. The two largest acquisitions were in the United States. In addition, we acquired the remaining minority interest of our Medam S.A. de C.V. subsidiary in Mexico and became the sole owner of our Medam B.A. subsidiary in Argentina, previously accounted for as a minority interest using the equity method of accounting. The aggregate net purchase price of all our 2007 acquisitions, including adjustments for purchase accounting, was approximately $241.0 million, of which $114.8 million was paid in cash, $112.5 million was paid by the issuance of promissory notes and $13.7 million was paid by the issuance of shares of our common stock.
In February 2007, we sold three incinerators and associated customer contracts in the United Kingdom to comply with a remedy accepted by United Kingdom Competition Commission, as we reported in our Form 10-K for 2006. The sales price was $26.5 million and resulted in a gain of approximately $1.9 million.
For financial reporting purposes, our 2009 acquisitions were accounted for using the acquisition method of accounting. Our 2008 and 2007 acquisitions were accounted for using the purchase method of accounting. The purchase prices of these acquisitions, in excess of acquired tangible assets, have been primarily allocated to goodwill and are preliminary pending completion of certain intangible asset valuations. The results of operations of these acquired businesses have been included in the consolidated statements of income from the dates of acquisition. These acquisitions resulted in recognition of goodwill in our financial statements reflecting the complementary strategic fit that the acquired businesses brought to us.
The total purchase price for 2009, 2008 and 2007 of $350.0, $191.0 million and $241.0 million, respectively, net of cash acquired, was allocated to the assets acquired and liabilities assumed based on the estimated fair market value at the date of acquisition. The excess of the purchase price over the fair market value of the net assets acquired is reflected in the accompanying consolidated balance sheets as goodwill. Some allocations are pending completion of certain intangible asset valuations. Goodwill was recorded in the amounts of $240.4, $148.9 million and $203.8 million during the years 2009, 2008 and 2007, respectively (see Note 10 to the Consolidated Financial Statements). Tax deductible goodwill, pending final purchase accounting, was approximately $73.3 million, $109.9 million and $98.9 million for the years 2009, 2008 and 2007, respectively. The results of operations of these acquired businesses have been included in the consolidated statements of income from the date of the acquisition.
45
Table of Contents
NOTE 5—PROPERTY, PLANT AND EQUIPMENT
Property, plant and equipment at December 31 consist of the following items:
In thousands
| 2009 | 2008 | |||||||
| Land |
$ | 14,250 | $ | 14,322 | ||||
| Building and improvements |
78,549 | 66,810 | ||||||
| Machinery and equipment |
257,736 | 211,153 | ||||||
| Office equipment and furniture |
44,151 | 41,811 | ||||||
| Internally developed software |
7,142 | 6,015 | ||||||
| Construction in progress |
21,447 | 13,610 | ||||||
| Total property, plant & equipment |
423,275 | 353,721 | ||||||
| Less: accumulated depreciation and amortization |
(177,121 | ) | (146,577 | ) | ||||
| Property, plant and equipment, net |
$ | 246,154 | $ | 207,144 | ||||
NOTE 6—INCOME TAXES
The U.S. and foreign components of income before income taxes consist of the following for the years ended December 31, 2009, 2008 and 2007:
In thousands
| 2009 | 2008 | 2007 | |||||||
| U.S. |
$ | 229,343 | $ | 205,183 | $ | 167,603 | |||
| Foreign countries |
48,345 | 33,884 | 23,912 | ||||||
| Total income before income taxes |
277,688 | 239,067 | 191,515 | ||||||
Significant components of our income tax expense for the years ended December 31, 2009, 2008 and 2007 are as follows:
In thousands
| 2009 | 2008 | 2007 | |||||||
| Current |
|||||||||
| U.S. federal |
$ | 60,493 | $ | 49,635 | $ | 39,440 | |||
| U.S. state |
8,938 | 8,053 | 8,042 | ||||||
| Foreign countries |
9,895 | 7,120 | 3,298 | ||||||
| 79,326 | 64,808 | 50,780 | |||||||
| Deferred |
|||||||||
| U.S. federal |
16,046 | 19,279 | 14,275 | ||||||
| U.S. state |
2,636 | 4,722 | 2,805 | ||||||
| Foreign countries |
3,291 | 1,487 | 5,002 | ||||||
| 21,973 | 25,488 | 22,082 | |||||||
| Total provision |
$ | 101,299 | $ | 90,296 | $ | 72,862 | |||
46
Table of Contents
A reconciliation of the income tax provision computed at the federal statutory rate to the effective tax rate for the years ended December 31, 2009, 2008 and 2007 are as follows:
| 2009 | 2008 | 2007 | |||||||
| Federal statutory income tax rate |
35.0 | % | 35.0 | % | 35.0 | % | |||
| Effect of: |
|||||||||
| State taxes, net of federal tax effect |
2.7 | % | 3.5 | % | 3.7 | % | |||
| Other |
(1.2 | )% | (0.7 | )% | (0.6 | )% | |||
| Effective tax rate |
36.5 | % | 37.8 | % | 38.1 | % | |||
Cash payments for income taxes were $66.5 million, $52.4 million and $45.9 million for the years ended December 31, 2009, 2008 and 2007, respectively.
Our deferred tax liabilities and assets as of December 31, 2009 and 2008 are as follows:
In thousands
| 2009 | 2008 | |||||||
| Deferred tax liabilities: |
||||||||
| Property, plant and equipment |
$ | (62,500 | ) | $ | (36,610 | ) | ||
| Goodwill and intangibles |
(135,321 | ) | (116,817 | ) | ||||
| Other |
(9,814 | ) | — | |||||
| Total deferred tax liabilities |
(207,635 | ) | (153,427 | ) | ||||
| Deferred tax assets: |
||||||||
| Accrued liabilities |
$ | 14,310 | $ | 9,158 | ||||
| Other |
14,499 | 5,053 | ||||||
| Net operating tax loss carry forward |
21,169 | 8,750 | ||||||
| Total deferred tax assets |
49,978 | 22,961 | ||||||
| Net deferred tax liabilities |
$ | (157,657 | ) | $ | (130,466 | ) | ||
At December 31, 2009, net operating loss carry forwards for U.S. federal and state income tax purposes have been fully utilized, excluding net operating loss carry forwards related to our acquisitions. The remaining net operating loss carry forwards from acquisitions are approximately $58 million that begin to expire in 2016. We expect to fully utilize the net operating losses that would otherwise expire in 2016.
Undistributed earnings of foreign subsidiaries are considered permanently invested, and therefore no U.S. deferred taxes are recorded thereon. The cumulative amounts of such earnings are $117 million at December 31, 2009, and it was not practicable to estimate the U.S. withholding tax thereon assuming repatriation.
We and our subsidiaries file U.S. federal income tax returns and income tax returns in various states and foreign jurisdictions. With a few exceptions, we are no longer subject to U.S. federal, state, local, or non-U.S. income tax examinations by tax authorities for years before 2002. The Internal Revenue Service (“IRS”) concluded an examination of the Company’s U.S. income tax return for 2004; subsequent tax years remain open and subject to examination by the IRS. Our subsidiaries in foreign countries have tax years open ranging from 2002 through 2009.
The Company has recorded accruals to cover certain unresolved tax issues. Such contingent liabilities relate to additional taxes, interest and penalties the Company may be required to pay in various tax jurisdictions. During the course of examinations by various taxing authorities, proposed adjustments may be asserted. The Company evaluates such items on a case-by-case basis and adjusts the accrual for contingent liabilities as deemed necessary.
47
Table of Contents
The total amount of unrecognized tax positions as of December 31, 2009 is $7.6 million, which includes immaterial amounts of interest and penalties and is reflected as a liability on the balance sheet. The amount of unrecognized tax positions that, if recognized, would affect the effective tax rate is approximately $7.6 million. We recognize interest and penalties accrued related to income tax reserves in income tax expense. This method of accounting is consistent with prior years.
The following table summarizes the changes in unrecognized tax positions during the years ended December 31, 2008 and 2009:
In thousands
| Unrecognized tax positions, January 1, 2008 |
$ | 3,675 | ||
| Gross increases- tax positions in prior period |
786 | |||
| Gross decreases- tax positions in prior period |
(99 | ) | ||
| Gross increase- current period tax positions |
2,461 | |||
| Settlement |
(1,414 | ) | ||
| Lapse of statute of limitations |
(91 | ) | ||
| Unrecognized tax positions, December 31, 2008 |
$ | 5,318 | ||
| Gross increases- tax positions in prior period |
2,133 | |||
| Gross decreases- tax positions in prior period |
— | |||
| Gross increase- current period tax positions |
3,460 | |||
| Settlement |
(51 | ) | ||
| Lapse of statute of limitations |
(3,238 | ) | ||
| Unrecognized tax positions, December 31, 2009 |
$ | 7,622 | ||
NOTE 7—LONG-TERM DEBT
Long-term debt consists of the following at December 31:
In thousands
| 2009 | 2008 | |||||
| Obligations under capital leases |
$ | 5,845 | $ | 1,182 | ||
| Senior credit facility |
381,602 | 439,794 | ||||
| Notes payable and other foreign debt |
286,404 | 251,750 | ||||
| Term loan |
215,000 | — | ||||
| Private placement |
100,000 | 100,000 | ||||
| 988,851 | 792,726 | |||||
| Less: Current portion |
65,932 | 38,880 | ||||
| Total |
$ | 922,919 | $ | 753,846 | ||
Payments due on long-term debt, excluding capital lease obligations, during each of the five years subsequent to December 31, 2009 are as follows:
In thousands
| 2010 |
$ | 63,196 | |
| 2011 |
44,091 | ||
| 2012 |
652,128 | ||
| 2013 |
24,579 | ||
| 2014 |
56,242 | ||
| Thereafter |
142,770 | ||
| $ | 983,006 | ||
48
Table of Contents
We paid interest of $24.8 million, $29.1 million and $31.8 million for the years ended December 31, 2009, 2008 and 2007, respectively.
Property under capital leases included with property, plant and equipment in the accompanying consolidated balance sheets is as follows at December 31:
In thousands
| 2009 | 2008 | |||||||
| Buildings |
$ | 561 | $ | 114 | ||||
| Machinery and equipment |
4,067 | 176 | ||||||
| Office equipment |
— | 111 | ||||||
| Vehicles |
4,181 | 2,760 | ||||||
| Less: Accumulated depreciation and amortization |
(2,354 | ) | (1,472 | ) | ||||
| $ | 6,455 | $ | 1,689 | |||||
Amortization related to these capital leases is included with depreciation expense.
Minimum future lease payments under capital leases are as follows:
In thousands
| 2010 |
$ | 3,032 | ||
| 2011 |
1,697 | |||
| 2012 |
683 | |||
| 2013 |
226 | |||
| 2014 |
85 | |||
| Thereafter |
677 | |||
| Total minimum lease payments |
6,400 | |||
| Less: Amounts representing interest |
(555 | ) | ||
| Present value of net minimum lease payments |
5,845 | |||
| Less: Current portion |
(2,736 | ) | ||
| Long-term obligations under capital leases |
$ | 3,109 | ||
Senior Credit Facility
Our $850 million senior credit facility maturing in August 2012, our $215 million term loan maturing in June 2012, and our $100 million private placement notes maturing April 2015, all require us to comply with various financial, reporting and other covenants and restrictions, including a restriction on dividend payments. The financial debt covenants are the same for the senior credit facility, the term loan credit agreement and the private placement notes. At December 31, 2009, we were in compliance with all of our financial debt covenants.
As of December 31, 2009, we had $381.6 million of borrowings outstanding under our $850 million senior unsecured credit facility, which includes foreign currency borrowings of $31.1 million. We also had $223.7 million committed to outstanding letters of credit under this facility. The unused portion of the revolving credit facility as of December 31, 2009 was $244.7 million. At December 31, 2009, our interest rates on borrowings under our revolving credit facility were
| • | For short-term borrowing (less than one month): Federal funds rate plus 0.5% or prime rate, whichever is higher; and |
| • | For borrowing greater than one month: LIBOR plus 0.75%. |
The weighted average rate of interest on the unsecured revolving credit facility was 1.0% per annum.
49
Table of Contents
As of December 31, 2009, we had $215 million term loan debt outstanding which was entered into during 2009 with several lenders maturing in June 2012. Term loans under the term loan credit agreement bear interest at fluctuating interest rates determined, for any one-month or other applicable interest period, by reference to the LIBOR plus the applicable margin provided in the term loan agreement. The applicable margin is based on our consolidated leverage ratio and ranges from 2.75% to 3.50%. As of December 31, 2009, the applicable margin was 3.0%. The weighted average rate of interest on the term loan was 5.8% per annum which includes the amounts under our interest rate hedge. After the first year, we are required to make quarterly principal payments of 2.5% of the principal amount of the outstanding term loans, and the remainder at maturity.
As of December 31, 2009, we had $100 million outstanding 5.64% private placement notes which we entered into on April 15, 2008 with nine institutional purchasers. The notes bear interest at the fixed rate of 5.64% per annum. Interest is payable in arrears semi-annually on April 15 and October 15 beginning on October 15, 2009, and principal is payable at the maturity of the notes on April 15, 2015.
At December 31, 2009, we had $292.2 million in other debt outstanding, which includes promissory notes issued in connection with acquisitions during 2004 through 2009, other foreign subsidiary bank debt, and capital leases.
Notes Payable and Foreign Subsidiary Debt
At December 31, 2009, we had private placement notes, promissory notes and foreign subsidiary bank debt, primarily issued as a result of acquisitions, totaling $386.4 million. Of the $386.4 million, $223.7 million of promissory notes was secured with letters of credit. Of the $386.4 million, $334.6 million had a fixed interest rate and $51.8 million had a floating interest rate. The weighted average interest rate was 4.46% and the weighted average maturity was approximately 4.9 years.
At December 31, 2008 we had private placement notes, promissory notes and foreign subsidiary bank debt, primarily issued as a result of acquisitions, totaling $351.8 million. Of the $351.8 million, $212.3 million of promissory notes was secured with letters of credit. Of the $351.8 million, $317.4 million had a fixed interest rate and $34.4 million had a floating interest rate. The weighted average interest rate was 5.05% and the weighted average maturity was approximately 6.1 years.
Guarantees
We have guaranteed a loan to JPMorganChase Bank N.A. on behalf of Shiraishi-Sogyo Co. Ltd (“Shiraishi”). Shiraishi is a customer in Japan that is expanding their medical waste management business and has a one year loan with a current balance of $5.2 million with JPMorganChase Bank N.A. that expires in May 2010. We also have notes receivable to Shiraishi for approximately $14.9 million in support of their medical waste business. These amounts are collateralized with the assets of Shiraishi and related companies.
50
Table of Contents
NOTE 8—ACCRUED LIABILITIES
Accrued liabilities at December 31 consist of the following items:
In thousands
| 2009 | 2008 | |||||
| Accrued compensation |
$ | 21,732 | $ | 19,676 | ||
| Accrued insurance |
22,690 | 19,524 | ||||
| Accrued income tax |
7,567 | 7,397 | ||||
| Accrued interest |
5,726 | 4,505 | ||||
| Accrued professional liabilities |
1,468 | 1,364 | ||||
| Accrued acquisition payment |
241 | 12,000 | ||||
| Accrued liabilities- other |
32,802 | 29,021 | ||||
| Total accrued liabilities |
$ | 92,226 | $ | 93,487 | ||
NOTE 9—DERIVATIVE INSTRUMENTS
In July 2009 we settled our remaining GBP Sterling forward hedge related to an intercompany loan. The notional value of the contract was £8.0 million Sterling and settled at $13.9 million USD. Settlement of the contract resulted in an immaterial charge to earnings.
In October 2008, Stericycle entered into three interest rate swap contracts covering $225 million of our borrowings outstanding under our senior credit facility. The objective of the swap is to reduce the risk of volatile interest expense by fixing the rate. In October 2009 we settled one interest rate swap with the notional value of $125 million. The remaining two contracts are as follows:
In thousands
| Notional Amount |
Fixed Interest Rate |
Variable Interest Rate |
Expiration Date | ||||
| $75,000 | 2.79 | % | 1 Month Libor | April 2010 | |||
| $25,000 | 2.94 | % | 1 Month Libor | October 2010 |
We entered into the interest rate swaps in order to manage the risk of interest rate changes to our interest expense. The interest rate swaps are designated as cash flow hedges; the notional amounts and all other significant terms of the swap agreement are matched to the provisions and terms of the variable rate debt hedged. The fair market of the remaining two hedges is recorded as a current liability of $1.2 million at December 31, 2009. At December 31, 2009, the hedges were determined to be 100% effective. Gains or losses on hedges are reclassified into interest expense when the effect of the hedged item is recognized in earnings. The fair market value was determined using market data inputs to calculate expected future interest rates. The cash streams attributable to the difference between expected future rates and the fixed rate payable is discounted to arrive at the fair value of the two hedges.
51
Table of Contents
NOTE 10—GOODWILL AND OTHER INTANGIBLE ASSETS
In accordance with FASB Accounting Standards, goodwill and other indefinite lived intangibles are not amortized, but are subject to an annual impairment test, or to more frequent testing if circumstances indicate that they may be impaired.
We have two geographical reporting segments, “United States” and “Foreign Countries”, both of which have goodwill. The changes in the carrying amount of goodwill for the years ended December 31, 2009 and 2008 was as follows:
In thousands
| United States |
Foreign Countries |
Total | |||||||||
| Balance as of December 31, 2007 |
$ | 827,962 | $ | 205,371 | $ | 1,033,333 | |||||
| Goodwill acquired during year |
129,497 | 19,405 | 148,902 | ||||||||
| Changes due to currency fluctuation |
— | (46,457 | ) | (46,457 | ) | ||||||
| Balance as of December 31, 2008 |
957,459 | 178,319 | 1,135,778 | ||||||||
| Goodwill acquired during year |
195,690 | 44,700 | 240,390 | ||||||||
| Changes due to currency fluctuation |
— | 17,923 | 17,923 | ||||||||
| Balance as of December 31, 2009 |
$ | 1,153,149 | $ | 240,942 | $ | 1,394,091 | |||||
During the quarter ended June 30, 2009, we performed our annual goodwill impairment evaluation for our three reporting units, Domestic Regulated Waste, Domestic Regulated Returns Management and Foreign Countries, and determined that none of our recorded goodwill was impaired.
At December 31, 2009 and 2008, we had $71.1 million and $48.1 million, respectively, of indefinite lived intangibles that consist of environmental permits. In 2009 and 2008, we performed our annual permit impairment evaluation and determined that, other than noted above, there was no impairment.
Our intangible assets, other than indefinite lived goodwill and permits, will continue to be amortized over their useful lives. In 2009, we assigned $70.0 million to customer relationships with amortization periods of 15 to 40 years, $21.0 million to facility environmental permits with indefinite lives and $7.7 million to non-compete agreements with amortization periods of two to ten years.
In 2008, we assigned $35.6 million to customer relationships with amortization periods of 20 to 40 years, $3.4 million to facility environmental permits with indefinite lives and $0.3 million to non-compete agreements with amortization periods of one to ten years.
As of December 31, the value of the amortizable intangible assets were as follows:
In thousands
| Gross Carrying Amount |
Accumulated Amortization |
Net Carrying Amounts | ||||||||||||||||
| 2009 | 2008 | 2009 | 2008 | 2009 | 2008 | |||||||||||||
| Non-compete |
$ | 10,800 | $ | 3,292 | $ | 1,584 | $ | 1,082 | $ | 9,216 | $ | 2,210 | ||||||
| Customer relationships |
202,760 | 129,069 | 14,701 | 9,849 | 188,059 | 119,220 | ||||||||||||
| Tradenames |
1,200 | 1,200 | 221 | 188 | 979 | 1,012 | ||||||||||||
| License agreements |
1,876 | 2,655 | 1,876 | 2,655 | — | — | ||||||||||||
| Other |
241 | 441 | 164 | 342 | 77 | 99 | ||||||||||||
| Total |
$ | 216,877 | $ | 136,657 | $ | 18,546 | $ | 14,116 | $ | 198,331 | $ | 122,541 | ||||||
During the years ended December 31, 2009, 2008 and 2007, the aggregate amortization expense was $5.4 million, $4.0 million and $3.7 million, respectively.
52
Table of Contents
The estimated amortization expense for each of the next five years, assuming no additional amortizable intangible assets, is as follows for the years ended December 31:
In thousands
| 2010 |
$ | 7,775 | |
| 2011 |
7,660 | ||
| 2012 |
7,619 | ||
| 2013 |
7,553 | ||
| 2014 |
7,307 |
NOTE 11—LEASE COMMITMENTS
We lease various plant equipment, office furniture and equipment, motor vehicles, office and warehouse space, and landfills under operating lease agreements, which expire at various dates over the next 15 years. The leases for most of the properties contain renewal provisions.
Rent expense for 2009, 2008 and 2007 was $45.8 million, $41.2 million and $32.4 million, respectively.
Minimum future rental payments under non-cancelable operating leases that have initial or remaining terms in excess of one year as of December 31, 2009 for each of the next five years and in the aggregate are as follows:
In thousands
| 2010 |
$ | 41,483 | |
| 2011 |
33,315 | ||
| 2012 |
25,993 | ||
| 2013 |
17,537 | ||
| 2014 |
12,838 | ||
| Thereafter |
65,765 | ||
| $ | 196,931 | ||
NOTE 12—NET INCOME PER COMMON SHARE
The following table sets forth the computation of basic and diluted net income per share:
In thousands, except share and per share data
| Years Ended December 31, | |||||||||
| 2009 | 2008 | 2007 | |||||||
| Numerator: |
|||||||||
| Numerator for basic earnings per share net income |
$ | 175,691 | $ | 148,708 | $ | 118,378 | |||
| Denominator: |
|||||||||
| Denominator for basic earnings per share-weighted average shares |
84,769,912 | 85,950,192 | 87,578,650 | ||||||
| Effect of diluted securities: |
|||||||||
| Employee stock options |
1,974,091 | 2,385,640 | 2,348,589 | ||||||
| Warrants |
— | — | 6,003 | ||||||
| Dilutive potential shares |
1,974,091 | 2,385,640 | 2,354,592 | ||||||
| Denominator for diluted earnings per share-adjusted weighted average shares and after assumed exercises |
86,744,003 | 88,335,832 | 89,933,242 | ||||||
| Earnings per share – Basic |
$ | 2.07 | $ | 1.73 | $ | 1.35 | |||
| Earnings per share – Diluted |
$ | 2.03 | $ | 1.68 | $ | 1.32 | |||
53
Table of Contents
For additional information regarding outstanding employee stock options and outstanding warrants, see Note 13 to the Consolidated Financial Statements.
In 2009, 2008 and 2007, options and warrants to purchase 2,218,914 shares, 993,352 shares and 279,081 shares, respectively, at exercise prices of $46.56-$60.53, $47.32-$60.53 and $38.57-$59.70, respectively, were not included in the computation of diluted earnings per share (“EPS”) because the effect would be antidilutive.
At December 31, 2009, we had no warrants outstanding.
NOTE 13—STOCK BASED COMPENSATION
Stock Plans:
We have adopted six stock option plans:
| (i) | the 2008 Incentive Stock Plan, which our stockholders approved in May 2008; |
| (ii) | the 2005 Incentive Stock Plan, which our stockholders approved in April 2005; |
| (iii) | the 2000 Nonstatutory Stock Option Plan, which our Board of Directors adopted in February 2000; |
| (iv) | the 1997 Stock Option Plan, which expired in January 2007; |
| (v) | the Directors Stock Option Plan, which expired in May 2006; |
| (vi) | the 1995 Incentive Compensation Plan, which expired in July 2005. |
The 2008 Plan authorized awards of stock options and stock appreciation rights for a total of 3,500,000 shares; the 2005 Plan authorizes awards of stock options and stock appreciation rights for a total of 4,800,000 shares; as amended, the 2000 Plan authorizes stock option grants for a total of 7,000,000 shares; the 1997 and 1995 Plans each authorized stock option grants for a total of 6,000,000 shares; and as amended, the Directors Plan authorized stock option grants for a total of 2,340,000 shares.
Both the 2008 Plan and 2005 Plan provide for the grant of nonstatutory stock options (“NSOs”) and incentive stock options intended to qualify under section 422 of the Internal Revenue Code (“ISOs”) as well as stock appreciation rights. In addition, the 2008 Plan provides for the grant of Restricted Stock Awards and RSU Awards; the 2000 Plan provides for the grant of NSOs; the 1997 and 1995 Plans each provided for the grant of NSOs and ISOs; and the Directors Plan provided for the grant of NSOs.
The 2008 and 2005 Plans authorize awards to our officers, employees and consultants and, following the expiration of the Directors Plan in May 2006, to our directors; the 2000 Plan authorizes stock option grants to our employees and consultants, but not to our officers and directors; the 1997 and 1995 Plans each authorized stock option grants to our officers, directors, employees and consultants; and the Directors Plan authorized stock option grants to our outside directors.
As of December 31, 2009, we reserved the following shares for issuance, consisting of both shares available for option grants under the 2008 Plan, 2005 Plan, 2000 Plan, 1997 Plan and shares granted as options under all five of our plans, but not yet exercised:
| 1995 Plan options |
36,270 | |
| 1996 Directors Plan options |
235,175 | |
| 1997 Plan options |
1,033,098 | |
| 2000 Plan options |
1,682,693 | |
| 2005 Plan options |
4,400,517 | |
| 2008 Plan options |
3,500,000 | |
| Warrants |
— | |
| Total shares reserved |
10,887,753 | |
54
Table of Contents
Employee Stock Purchase Plan:
In October 2000, our Board of Directors adopted the Employee Stock Purchase Plan (“ESPP”) effective as of July 1, 2001. Our stockholders approved the ESPP in May 2001. The ESPP authorizes 600,000 shares of our common stock to be purchased by employees at a 15% discount from the market price of the stock through payroll deductions during two six-month offerings each year. An employee who elects to participate in an offering is granted an option on the first day of the offering for a number of shares equal to the employee’s payroll deductions under the ESPP during the offering period (which may not exceed $5,000) divided by the option price per share. The option price per share is the lower of 85% of the closing price of a share of our common stock on the first trading day of the offering period or 85% of the closing price on the last trading day of the offering period. We recognize compensation expense for the ESPP, which is reflected in the statement of income. Every employee who has completed six months employment as of the first day of an offering and who is a full-time employee, or a part-time employee who customarily works at least 20 hours per week, is eligible to participate in the offering. During 2009, 2008 and 2007, 56,145 shares, 48,836 shares and 43,777 shares, respectively, were issued through the ESPP.
Stock Based Compensation Expense:
We recognized stock compensation expense in accordance FASB accounting standards. During 2009, there have been no changes to our stock compensation plans or modifications to outstanding stock-based awards which would change the value of any awards outstanding. Compensation expense for all stock-based compensation awards granted subsequent to January 1, 2006 was based on the grant-date fair value determined in accordance with the provisions of FASB accounting standards for share-based payments. During the years ended December 31, 2009, 2008 and 2007, we recognized compensation expense of $14.0 million, $11.2 million and $10.3 million, respectively, for stock options, and $0.7 million, $0.6 million and $0.4 million, respectively, for the ESPP, which is reflected in the statement of income. There were no significant capitalized stock-based compensation costs at December 31, 2009, 2008 and 2007.
The following table presents the total stock-based compensation expense resulting from stock option awards and the ESPP included in the consolidated statements of income:
In thousands
| Years Ended December 31, | |||||||||
| 2009 | 2008 | 2007 | |||||||
| Cost of revenues – stock option plan |
$ | 366 | $ | 403 | $ | 477 | |||
| Selling, general and administrative – stock option plan |
13,599 | 10,768 | 9,818 | ||||||
| Selling, general and administrative – ESPP |
673 | 584 | 419 | ||||||
| Total |
$ | 14,638 | $ | 11,755 | $ | 10,714 | |||
As of December 31, 2009, there were $19.8 million of total unrecognized compensation expenses, related to non-vested option awards, which is expected to be recognized over a weighted-average period of 1.49 years.
The following table sets forth the tax benefits related to stock compensation:
In thousands
| Years Ended December 31, | |||||||||
| 2009 | 2008 | 2007 | |||||||
| Tax benefit recognized in income statement |
$ | 5,329 | $ | 4,341 | $ | 4,207 | |||
| Excess tax benefit realized |
10,905 | 9,319 | 8,054 | ||||||
55
Table of Contents
Stock Options:
Options granted to officers and employees generally vest over five years. During 2009, 2008 and 2007, options granted to officers and employees generally vested at the rate of 20% of the option shares on each of the first five anniversaries of the option grant date. Expense related to the graded vesting options is recognized using the straight-line method over the vesting period.
The exercise price per share of an option granted under any of our stock option plans may not be less than the closing price of a share of our common stock on the date of grant. The maximum term of an option granted under any plan may not exceed 10 years. An option may be exercised only when it is vested and, in the case of an option granted to an employee (including an officer), only while he or she remains an employee and for a limited period following the termination of his or her employment. New shares are issued upon exercise of stock options. Option activity for the years ended December 31, 2009, 2008 and 2007 is summarized as follows:
| 2009 | 2008 | 2007 | ||||||||||||||||
| Number of Options |
Weighted Average Exercise Price per Share |
Number of Options |
Weighted Average Exercise Price per Share |
Number of Options |
Weighted Average Exercise Price per Share | |||||||||||||
| Outstanding at beginning of year |
7,297,399 | $ | 30.97 | 7,258,795 | $ | 25.44 | 7,037,310 | $ | 20.96 | |||||||||
| Granted |
1,368,476 | 47.39 | 1,202,964 | 53.85 | 1,472,403 | 40.24 | ||||||||||||
| Exercised |
(1,107,063 | ) | 19.61 | (987,284 | ) | 17.38 | (1,013,290 | ) | 14.86 | |||||||||
| Forfeited |
(162,470 | ) | 42.84 | (175,734 | ) | 34.39 | (232,533 | ) | 29.78 | |||||||||
| Cancelled or expired |
(8,589 | ) | 53.37 | (1,342 | ) | 5.89 | (5,095 | ) | 26.68 | |||||||||
| Outstanding at end of year |
7,387,753 | $ | 35.43 | 7,297,399 | $ | 30.97 | 7,258,795 | $ | 25.44 | |||||||||
| Exercisable at end of year |
3,884,494 | $ | 28.58 | 3,815,882 | $ | 23.36 | 3,526,237 | $ | 18.62 | |||||||||
| Available for future grant |
3,939,210 | 5,136,621 | 2,655,845 | |||||||||||||||
The total intrinsic value of options exercised for the years ended December 31, 2009 and 2008 was $37.6 million and $39.4 million, respectively. The total intrinsic value represents the total pre-tax intrinsic value (the difference between our closing stock price on the last day of trading for the year ended December 31, 2009 and the exercise price, multiplied by the number of in-the-money options) that would have been received by the option holders assuming all option holders had exercised their options on December 31, 2009; this amount changes based on the fair market value of our stock.
Outstanding options at December 31, 2009 and 2008 had a weighted average remaining contractual life of 6.5 years and 6.6 years, respectively, with an aggregate intrinsic value of $146.4 million and $156.3 million, respectively. Exercisable options had a weighted average remaining contractual life of 5.3 years at both December 31, 2009 and 2008, with an aggregate intrinsic value of $103.6 million and $109.7 million, respectively.
56
Table of Contents
Options outstanding and exercisable as of December 31, 2009 by price range are presented below:
| Options Outstanding | Options Exercisable | |||||||||||
| Range of Exercise Price |
Shares | Outstanding Average Remaining Life in Years |
Weighted Average Exercise Price |
Shares | Weighted Average Exercise Price | |||||||
| $5.063-$20.900 |
774,358 | 2.50 | $ | 15.23 | 774,358 | $ | 15.23 | |||||
| $21.125-$22.110 |
610,021 | 4.11 | 22.11 | 604,021 | 22.11 | |||||||
| $22.485-$22.900 |
814,875 | 5.09 | 22.89 | 610,862 | 22.88 | |||||||
| $22.985-$24.300 |
160,228 | 4.61 | 23.64 | 160,228 | 23.64 | |||||||
| $24.355-$29.540 |
898,671 | 6.06 | 29.43 | 501,283 | 29.41 | |||||||
| $29.590-$35.590 |
436,140 | 6.33 | 32.06 | 262,134 | 31.97 | |||||||
| $35.780-$38.565 |
939,613 | 7.09 | 38.52 | 356,182 | 38.51 | |||||||
| $38.905-$43.330 |
137,794 | 7.34 | 42.51 | 105,184 | 42.68 | |||||||
| $43.340-$46.830 |
1,129,051 | 9.05 | 46.76 | 71,801 | 46.42 | |||||||
| $46.870-$60.530 |
1,487,002 | 8.34 | 52.94 | 438,441 | 53.46 | |||||||
| 7,387,753 | 6.48 | $ | 35.43 | 3,884,494 | $ | 28.58 | ||||||
The Black-Scholes option-pricing model was used in determining the fair value of each option grant. The expected term of options granted is based on historical experience. Expected volatility is based upon historical volatility. The expected dividend yield is zero. The risk-free interest rate is based upon the U.S. Treasury yield rates of a comparable period. The assumptions that we used in the Black-Scholes model are as follows:
| Years Ended December 31, | ||||||||||||
| 2009 | 2008 | 2007 | ||||||||||
| Stock options granted |
1,368,476 | 1,202,964 | 1,472,403 | |||||||||
| Weighted average grant date fair value |
$ | 11.90 | $ | 13.53 | $ | 11.43 | ||||||
| Expected term (in years) |
5.5 | 5.5 | 5.0 | |||||||||
| Expected volatility |
28.28 | % | 26.29 | % | 27.07 | % | ||||||
| Expected dividend yield |
0.00 | % | 0.00 | % | 0.00 | % | ||||||
| Risk free interest rate |
2.08 | % | 2.76 | % | 4.52 | % | ||||||
NOTE 14—PREFERRED STOCK AND WARRANTS
Preferred Stock:
At December 31, 2009 and 2008, we had 1,000,000 authorized shares of preferred stock and no shares issued or outstanding.
Warrants:
At December 31, 2009, we had no warrants issued or outstanding.
NOTE 15—EMPLOYEE BENEFIT PLAN
We have a 401(k) defined contribution retirement savings plan covering substantially all employees. Each participant may elect to defer a portion of his or her compensation subject to certain limitations. We may contribute up to 50% of the first 5% of compensation contributed to the plan by each employee up to a maximum of $1,750 per annum. Our contributions for the years ended December 31 2009, 2008 and 2007 were approximately $2.1 million, $1.7 million and $1.6 million, respectively.
57
Table of Contents
The Company has several foreign defined contribution plans, which require the Company to contribute a percentage of the participating employee’s salary according to local regulations. For the years ended December 31, 2009, 2008 and 2007, total contributions made by the Company for these plans were approximately $0.6 million, $0.7 million and $0.5 million, respectively.
NOTE 16—RESTRUCTURING COSTS
In December of 2009, we announced the consolidation of operations within our Returns Management Services segment. This consolidation will result in the closure of our facilities in Boynton Beach, Florida and Conyers, Georgia. The operations of those facilities will be moved to our Indianapolis, Indiana location. We have recognized $1.6 million in expense during the fourth quarter of 2009 related to this restructuring, of which $0.9 million was fixed asset write-offs and $0.7 was primarily severance, which will be paid in 2010. We estimate an additional $1.6 million in expense during 2010 of which approximately $0.8 million will be related to severance and other employee expenses, and $0.8 million will be related to lease and related occupancy charges. We expect that our restructuring will be completed by the end of 2010. We believe this restructuring will allow us to maximize the efficiency of our Returns Management Services at a single location and management infrastructure.
NOTE 17—LEGAL PROCEEDINGS
We operate in a highly regulated industry and must deal with regulatory inquiries or investigations from time to time that may be instituted for a variety of reasons. We are also involved in a variety of civil litigation from time to time.
On November 30, 2009, we entered into an agreement with the United States Department of Justice (“DOJ”) and the States of Missouri and Nebraska providing clearance under the Hart-Scott-Rodino Antitrust Improvements Act of 1976 that allowed us to complete our pending acquisition of MedServe, Inc., which we closed on December 4, 2009.
Our agreement with the DOJ and the States of Missouri and Nebraska agreement requires us to divest certain assets that we acquired from MedServe consisting of an autoclave treatment facility in Newton, Kansas, four transfer stations in Kansas, Oklahoma, Nebraska and Missouri and certain large customer accounts and associated assets related to these facilities. We are in the process of complying with the required divestiture. In addition, our agreement requires us for a period of ten years to notify the DOJ and the States of Missouri and Nebraska before acquiring any business that is engaged in both the collection and treatment of infectious waste in Kansas, Missouri, Nebraska or Oklahoma.
In April 2008, Stericycle and Daniels Corporation (UK) Limited (“Daniels UK”), a subsidiary of Daniels Sharpsmart Pty Limited (“Daniels”), and certain affiliated companies entered into a settlement of arbitration proceedings in the United Kingdom prior to any award by the arbitrator. At the same time, we entered into settlements with other subsidiaries of Daniels resolving various disputes, and we finalized the payment of the legal fees that SteriCorp Limited had been awarded under a November 2007 arbitrator’s award. In connection with these net settlements, we recognized a total pre-tax expense of $5.6 million, or an after-tax expense of $3.5 million for the year-ended December 31, 2008.
NOTE 18—PRODUCTS AND SERVICES AND GEOGRAPHIC INFORMATION
FASB ASC Topic 280 requires segment information to be reported based on information utilized by executive management to internally assess performance and make operating decisions. We have determined that we have three operating segments based on the organizational structure of our company and information reviewed. These operating segments are Foreign Regulated Waste Management Services (“Foreign Countries”), Domestic Regulated Waste Management Services (“United States”) and Domestic Returns Management
58
Table of Contents
Services. We have aggregated Domestic Regulated Waste Management Services and Domestic Returns Management Services into one reportable segment, United States, based on our consideration of the following aggregation criteria:
| • | they have similar economic characteristics; |
| • | the same services are provided; |
| • | the same types of customers are serviced; |
| • | the same types of waste collection, transportation and treatment methods are utilized; |
| • | their regulatory environments are similar, but vary based upon country specific regulations; and |
| • | they employ the same sales and marketing techniques and activities. |
Our two operating segments are United States (includes Puerto Rico) and Foreign Countries. Summary information for our reportable segments is as follows:
In thousands
| 2009 | 2008 | 2007 | |||||||
| Revenues: |
|||||||||
| United States |
$ | 912,594 | $ | 830,813 | $ | 721,408 | |||
| Europe |
158,577 | 156,309 | 149,467 | ||||||
| Other foreign countries |
106,565 | 96,557 | 61,892 | ||||||
| Total foreign countries |
265,142 | 252,866 | 211,359 | ||||||
| Total |
$ | 1,177,736 | $ | 1,083,679 | $ | 932,767 | |||
| Income before income taxes: |
|||||||||
| United States |
$ | 232,077 | $ | 205,183 | $ | 167,603 | |||
| Foreign countries |
45,611 | 33,884 | 23,912 | ||||||
| Total |
$ | 277,688 | $ | 239,067 | $ | 191,515 | |||
| Total assets: |
|||||||||
| United States |
$ | 1,453,546 | $ | 1,377,486 | $ | 1,304,248 | |||
| Foreign countries |
729,257 | 381,812 | 303,911 | ||||||
| Total |
$ | 2,182,803 | $ | 1,759,298 | $ | 1,608,159 | |||
| Property, Plant and Equipment, net: |
|||||||||
| United States |
$ | 184,089 | $ | 166,674 | $ | 149,168 | |||
| Europe |
32,592 | 18,803 | 25,027 | ||||||
| Other foreign countries |
29,473 | 21,667 | 18,844 | ||||||
| Total foreign countries |
62,065 | 40,470 | 43,871 | ||||||
| Total |
$ | 246,154 | $ | 207,144 | $ | 193,039 | |||
Revenues are attributed to countries based on the location of customers. Intercompany revenues recorded by the United States for work performed in Canada are eliminated prior to reporting United States revenues. The same accounting principles and critical accounting policies are used in the preparation of the financial statements for both reporting segments.
59
Table of Contents
Detailed information for our United States reporting segment is as follows:
In thousands
| 2009 | 2008 | 2007 | ||||||||
| Regulated waste management services |
$ | 842,479 | $ | 756,893 | $ | 637,731 | ||||
| Regulated returns management services |
70,115 | 73,920 | 83,677 | |||||||
| Total revenues |
912,594 | 830,813 | 721,408 | |||||||
| Net interest expense |
28,852 | 26,097 | 27,347 | |||||||
| Write-down of investment |
— | — | — | |||||||
| Proceeds from insurance |
— | — | (3,300 | ) | ||||||
| Income before income taxes |
232,077 | 205,183 | 167,603 | |||||||
| Income taxes |
88,113 | 81,689 | 64,562 | |||||||
| Net income attributable to Stericycle, Inc. |
$ | 143,964 | $ | 123,494 | $ | 103,041 | ||||
| Depreciation and amortization |
$ | 29,424 | $ | 24,296 | $ | 22,204 | ||||
| Capital expenditures |
29,479 | 34,353 | 37,222 | |||||||
Detailed information for our Foreign Countries reporting segment is as follows:
In thousands
| 2009 | 2008 | 2007 | |||||||
| Regulated waste management services |
$ | 265,142 | $ | 252,866 | $ | 211,359 | |||
| Net interest expense |
5,280 | 6,077 | 5,028 | ||||||
| Write-down of investment |
— | — | 2,930 | ||||||
| Income before income taxes |
45,611 | 33,884 | 23,912 | ||||||
| Income taxes |
13,186 | 8,607 | 8,300 | ||||||
| Net income |
32,425 | 25,277 | 15,612 | ||||||
| Net income attributable to noncontrolling interests |
698 | 63 | 275 | ||||||
| Net income attributable to Stericycle, Inc. |
$ | 31,727 | $ | 25,214 | $ | 15,337 | |||
| Depreciation and amortization |
$ | 10,566 | $ | 9,852 | $ | 8,933 | |||
| Capital expenditures |
10,431 | 13,167 | 11,175 | ||||||
60
Table of Contents
NOTE 19—ACCUMULATED OTHER COMPREHENSIVE INCOME
The components of total comprehensive income are net income, the change in cumulative currency translation adjustments and gains and losses on derivative instruments qualifying as cash flow hedges. The following table sets forth the components of total comprehensive income for 2009, 2008 and 2007:
In thousands
| Currency Translation Adjustments |
Unrealized Gains (Losses) on Cash Flow Hedges |
Total Accumulated Other Comprehensive Income |
||||||||||
| Beginning balance January 1, 2007 |
$ | 4,997 | $ | 232 | $ | 5,229 | ||||||
| Fiscal 2007 change |
25,125 | 166 | 25,291 | |||||||||
| Ending balance December 31, 2007 |
$ | 30,122 | $ | 398 | $ | 30,520 | ||||||
| Fiscal 2008 change |
(59,301 | ) | (3,294 | ) | (62,595 | ) | ||||||
| Ending balance December 31, 2008 |
$ | (29,179 | ) | $ | (2,896 | ) | $ | (32,075 | ) | |||
| Fiscal 2009 change |
17,595 | 2,188 | 19,783 | |||||||||
| Ending balance December 31, 2009 |
$ | (11,584 | ) | $ | (708 | ) | $ | (12,292 | ) | |||
The tax impact of the unrealized loss on cash flow hedges in accumulated other comprehensive income at December 31, 2009 and 2008 was $0.5 million and $1.9 million, respectively. The tax impact at December 31, 2007 was immaterial. Translation adjustments are not tax-effected as the company’s net investment in foreign subsidiaries and all related foreign earnings are deemed permanently invested.
NOTE 20—SELECTED QUARTERLY FINANCIAL DATA (UNAUDITED)
The following table summarizes our unaudited consolidated quarterly results of operations as reported for 2009 and 2008:
In thousands, except per share data
| First Quarter 2009 |
Second Quarter 2009 |
Third Quarter 2009 |
Fourth Quarter 2009 |
Year 2009 | ||||||||||||||||
| Revenues |
$ | 277,090 | $ | 289,268 | $ | 297,836 | $ | 313,542 | $ | 1,177,736 | ||||||||||
| Gross profit |
127,803 | 136,534 | 140,917 | 147,142 | 552,396 | |||||||||||||||
| Restructuring costs |
— | — | — | (905 | ) | (905 | ) | |||||||||||||
| Acquisition related transaction expenses |
(610 | ) | (1,330 | ) | (3,478 | ) | (1,915 | ) | (7,333 | ) | ||||||||||
| Acquisition integration expenses |
(111 | ) | (73 | ) | (282 | ) | (630 | ) | (1,096 | ) | ||||||||||
| Net income attributable to Stericycle, Inc. |
40,655 | 43,902 | 46,526 | 44,608 | 175,691 | |||||||||||||||
| * Basic earnings per common share |
$ | 0.48 | $ | 0.52 | $ | 0.55 | $ | 0.53 | $ | 2.07 | ||||||||||
| * Diluted earnings per common share |
$ | 0.47 | $ | 0.51 | $ | 0.54 | $ | 0.52 | $ | 2.03 | ||||||||||
61
Table of Contents
In thousands, except per share data
| First Quarter 2008 |
Second Quarter 2008 |
Third Quarter 2008 |
Fourth Quarter 2008 |
Year 2008 | ||||||||||||||||
| Revenues |
$ | 254,784 | $ | 277,786 | $ | 277,098 | $ | 274,011 | $ | 1,083,679 | ||||||||||
| Gross profit |
113,590 | 123,154 | 123,029 | 125,256 | 485,029 | |||||||||||||||
| Impairment of fixed assets |
— | — | — | (472 | ) | (472 | ) | |||||||||||||
| Arbitration award and related costs |
(5,352 | ) | (147 | ) | (96 | ) | — | (5,595 | ) | |||||||||||
| Acquisition integration expenses |
(713 | ) | (316 | ) | (210 | ) | (274 | ) | (1,513 | ) | ||||||||||
| Net income attributable to Stericycle, Inc. |
31,664 | 38,685 | 39,227 | 39,132 | 148,708 | |||||||||||||||
| * Basic earnings per common share |
$ | 0.36 | $ | 0.45 | $ | 0.46 | $ | 0.46 | $ | 1.73 | ||||||||||
| * Diluted earnings per common share |
$ | 0.35 | $ | 0.44 | $ | 0.45 | $ | 0.45 | $ | 1.68 | ||||||||||
| * | EPS calculated on a quarterly basis, and, as such, the amounts may not total the calculated full-year EPS. |
62
Table of Contents
STERICYCLE, INC. AND SUBSIDIARIES
SCHEDULE II—VALUATION AND ALLOWANCE ACCOUNTS
In thousands
| Balance 12/31/06 |
Charges to Expenses |
Other Charges(1) |
Write-offs/ Payments |
Balance 12/31/07 | ||||||||||||
| Allowance for doubtful accounts |
$ | 5,411 | $ | 4,392 | $ | 293 | $ | (3,939 | ) | $ | 6,157 | |||||
| Balance 12/31/07 |
Charges to Expenses |
Other Charges(1) |
Write-offs/ Payments |
Balance 12/31/08 | ||||||||||||
| Allowance for doubtful accounts |
$ | 6,157 | $ | 5,006 | $ | 30 | $ | (4,577 | ) | $ | 6,616 | |||||
| Balance 12/31/08 |
Charges to Expenses |
Other Charges(1) |
Write-offs/ Payments |
Balance 12/31/09 | ||||||||||||
| Allowance for doubtful accounts |
$ | 6,616 | $ | 6,866 | $ | 765 | $ | (5,538 | ) | $ | 8,709 | |||||
| (1) | Amounts consist primarily of valuation allowances assumed from acquired companies and currency translation adjustments. |
Item 9. Changes in and Disagreements with Accountants on Accounting and Financial Disclosure
None.
Item 9A. Controls and Procedures
(a) Evaluation of disclosure controls and procedures.
Our management, with the participation of our Chairman, President and Chief Executive Officer and our Chief Financial Officer, conducted an evaluation of the effectiveness of our disclosure controls and procedures as of the end of the fiscal year covered by this Report. On the basis of this evaluation, our Chairman, President and Chief Executive Officer and our Chief Financial Officer each concluded that our disclosure controls and procedures were effective.
The term “disclosure controls and procedures” is defined in Rule 13a-14(e) of the Securities Exchange Act of 1934 as “controls and other procedures designed to ensure that information required to be disclosed by the issuer in the reports, files or submits under the Act is recorded, processed, summarized and reported, within the time periods specified in the [Securities and Exchange] Commission’s rules and forms.” Our disclosure controls and procedures are designed to ensure that material information relating to us and our consolidated subsidiaries is accumulated and communicated to our management, including our Chairman, President and Chief Executive Officer and our Chief Financial Officer, as appropriate to allow timely decisions regarding our required disclosures.
(b) Internal control over financial reporting.
Management’s Report on Internal Control over Financial Reporting and our Independent Registered Public Accounting Firm’s Attestation Report are included in Item 8.
(c) Changes in internal controls.
There were no significant changes in our internal controls or in other factors that could materially affect those controls during the quarter ended December 31, 2009.
None.
63
Table of Contents
PART III
Item 10. Directors, Executive Officers and Corporate Governance
The information required by this Item regarding our directors is incorporated by reference to the information contained under the caption “Election of Directors” in our definitive proxy statement for our 2010 Annual Meeting of Stockholders to be held on May 25, 2010, to be filed pursuant to Regulation 14A.
The information required by this Item regarding our executive officers is contained under the caption “Executive Officers of the Registrant” in Part I of this Report.
The information required by this Item regarding compliance with Section 16(a) of the Securities Exchange Act of 1934 is incorporated by reference to the information contained under the caption “Section 16(a) Beneficial Ownership Reporting Compliance” in our definitive proxy statement for our 2010 Annual Meeting of Stockholders to be held on May 25, 2010, to be filed pursuant to Regulation 14A.
We have adopted a code of business conduct that applies generally to all of our employees and, in addition, we have a adopted a finance department code of ethics that applies specifically to our Chairman, President and Chief Executive Officer, Chief Financial Officer, Vice President of Corporate Finance and the members of our finance department. Both codes are available on our website, www.stericycle.com, under “About Us/Corporate Overview,” Any amendment to or waiver of the finance department code of ethics will be posted on our website within five business days after the date of the amendment or waiver.
The information required by this Item regarding certain corporate governance matters is incorporated by reference to the information contained under the caption “Election of Directors” in our definitive proxy statement for our 2010 Annual Meeting of Stockholders to be held on May 25, 2010, to be filed pursuant to Regulation 14A.
Item 11. Executive Compensation
The information required by this Item is incorporated by reference to the information contained under the caption “Compensation Discussion and Analysis” and following sections (up to Item 2) in our definitive proxy statement for our 2010 Annual Meeting of Stockholders to be held on May 25, 2010, to be filed pursuant to Regulation 14A.
Item 12. Security Ownership of Certain Beneficial Owners and Management and Related Stockholder Matters
The information required by this Item is incorporated by reference to the information contained under the captions “Stock Ownership” and “Compensation Discussion and Analysis” and following sections (up to Item 2) in our definitive proxy statement for our 2010 Annual Meeting of Stockholders to be held on May 25, 2010 to be filed pursuant to Regulation 14A.
Item 13. Certain Relationships and Related Transactions, and Director Independence
The information required by this Item regarding our policies and procedures for the review, approval or ratification transactions with related persons is incorporated by reference to the information contained under the caption “Policy and Related Party Transactions” in Item 1 of our definitive proxy statement for our 2010 Annual Meeting of Stockholders to be held on May 25, 2010, to be filed pursuant to Regulation 14A.
The information required by this Item regarding director independence is incorporated by reference to the information contained in Item 1 of our definitive proxy statement for our 2010 Annual Meeting of Stockholders to be held on May 25, 2010, to be filed pursuant to Regulation 14A.
64
Table of Contents
Item 14. Principal Accounting Fees and Services
Fees for professional services provided by our independent public accountants, Ernst & Young LLP, in each of the last two fiscal years, in each of the following categories are:
In thousands
| 2009 | 2008 | |||||
| Audit fees |
$ | 1,168 | $ | 1,150 | ||
| Audit-related fees |
— | — | ||||
| Tax fees |
— | 350 | ||||
| All other fees |
— | 2 | ||||
| $ | 1,168 | $ | 1,502 | |||
Fees for audit services include fees rendered in connection with the audit of our annual financial statements and the audit of our internal controls over financial reporting, and review of our interim financial statements included in our quarterly reports on Form 10-Q.
In accordance with policies adopted by the Audit Committee of our Board of Directors, all audit and non-audit related services to be performed for us by our independent public accountants must be approved in advance by the Audit Committee.
65
Table of Contents
PART IV
Item 15. Exhibits and Financial Statement Schedules
(a) List of Financial Statements, Financial Statement Schedule and Exhibits
We have filed the following financial statements and financial statement schedule as part of this report:
| Page | ||
| 31 | ||
| 32 | ||
| Consolidated Financial Statements—Stericycle, Inc. and Subsidiaries |
||
| Consolidated Balance Sheets as of December 31, 2009 and 2008 |
33 | |
| 34 | ||
| 35 | ||
| 36 | ||
| 37 | ||
| 63 |
All other financial statement schedules have been omitted because they are not applicable to us or the required information is shown in the consolidated financial statements or notes thereto.
66
Table of Contents
We have filed the following exhibits with this report:
| Exhibit |
Description |
Filed with Electronic Submission | ||
| 3.1* | Amended and restated certificate of incorporation (incorporated by reference to Exhibit 3.1 to our registration statement on Form S-1 declared effective on August 22, 1996 (Registration No. 333-05665)) | |||
| 3.2* | First certificate of amendment to amended and restated certificate of incorporation (incorporated by reference to Exhibit 3.1 to our current report on Form 8-K filed November 29, 1999) | |||
| 3.3* | Second certificate of amendment to amended and restated certificate of incorporation (incorporated by reference to Exhibit 3.4 to our annual report on Form 10-K for 2002) | |||
| 3.4* | Third certificate of amendment to amended and restated certificate of incorporation (incorporated by reference to Exhibit 3.4 to our registration statement on Form S-4 declared effective on October 10, 2007 (Registration No. 333-144613)) | |||
| 3.5* | Amended and restated bylaws (incorporated by reference to Exhibit 3(ii).1 to our current report on Form 8-K filed February 22, 2008) | |||
| 3.6* | Amendment to amended and restated bylaws (incorporated by reference to Exhibit 3(ii).1 to our current report on Form 8-K filed August 20, 2008) | |||
| 4.1* | Specimen certificate for shares of our common stock, par value $.01 per share (incorporated by reference to Exhibit 4.1 to our registration statement on Form S-1 declared effective on August 22, 1996 (Registration No. 333-05665)) | |||
| 10.1* | Term Loan Credit Agreement dated as of June 24, 2009 entered into by Stericycle, Inc., Bank of America, N.A., as administrative agent and a lender, other lenders from time to time party to the Credit Agreement, and a syndication agent to be determined (incorporated by reference to Exhibit 10.1 to our current report on Form 8-K filed June 26, 2009) | |||
| 10.2* | First Amendment [to Term Loan Credit Agreement dated as of June 24, 2009] and Increase Agreement, dated as of July 23, 2009 entered into by Stericycle, Inc., Stericycle International, LLC, Bank of America, N.A., as administrative agent and a lender, HSBC Bank USA, N.A., as syndication agent and a lender, and U.S. Bank National Association, National City Bank, The Bank of Nova Scotia, The Northern Trust Company and Fortis Bank SA/NV, New York Branch, as lenders (incorporated by reference to Exhibit 10.1 to our current report on Form 8-K filed July 28, 2009) | |||
| 10.3* | Note Purchase Agreement dated as of April 15, 2008 entered into by Stericycle, Inc., as issuer and seller, and The Northwestern Mutual Life Insurance Company, American United Life Insurance Company, The State Life Insurance Company, Pioneer Mutual Life Insurance Company, Knights of Columbus, Principal Life Insurance Company, CUNA Mutual Insurance Society, CUMIS Insurance Society, Inc. and Modern Woodmen of America, as purchasers (incorporated by reference to Exhibit 10.1 to our current report on Form 8-K filed April 18, 2008) | |||
| 10.4*† | Directors Stock Option Plan (Amended and Restated) (“Directors Plan”) (incorporated by reference to Exhibit 4.1 to our registration statement on Form S-8 filed August 2, 2001 (Registration No. 333-66542)) | |||
| 10.5*† | First amendment to Directors Plan (incorporated by reference to Exhibit 10.9 to our annual report on Form 10-K for 2001) |
67
Table of Contents
| Exhibit |
Description |
Filed with Electronic Submission | ||
| 10.6*† | Form of stock option agreement for option grant under Directors Plan (incorporated by reference to Exhibit 10.1 to our quarterly report on Form 10-Q for the quarter ended September 30, 2004) | |||
| 10.7*† | 1997 Stock Option Plan (“1997 Plan”) (incorporated by reference to Exhibit 10.3 to our annual report on Form 10-K for 1997) | |||
| 10.8*† | First amendment to 1997 Plan (incorporated by reference to Exhibit 10.9 to our registration statement on Form S-3 declared effective on February 4, 1999 (Registration No. 333-60591)) | |||
| 10.9*† | Second amendment to 1997 Plan (incorporated by reference to Exhibit 10.12 to our annual report on Form 10-K for 2001) | |||
| 10.10*† | Third amendment to 1997 Plan (incorporated by reference to Exhibit 10.16 to our annual report on Form 10-K for 2003) | |||
| 10.11*† | 2000 Nonstatutory Stock Option Plan (“2000 Plan”) (incorporated by reference to Exhibit 10.13 to our annual report on Form 10-K for 2001) | |||
| 10.12*† | First amendment to 2000 Plan (incorporated by reference to Exhibit 10.14 to our annual report on Form 10-K for 2001) | |||
| 10.13*† | Second amendment to 2000 Plan (incorporated by reference to Exhibit 10.15 to our annual report on Form 10-K for 2001) | |||
| 10.14*† | Third amendment to 2000 Plan (incorporated by reference to Exhibit 4.2 to our registration statement on Form S-8 filed December 20, 2002 (Registration No. 333-102097)) | |||
| 10.15*† | 2005 Incentive Stock Plan (“2005 Plan”) (incorporated by reference to Exhibit 4.1 to our registration statement on Form S-8 filed August 9, 2005 (Registration No. 333-127353)) | |||
| 10.16*† | First amendment to 2005 Plan (incorporated by reference to Exhibit 10.5 to our annual report on Form 10-K for 2005) | |||
| 10.17*† | Form of stock option agreement for option grant under 1997 Plan, 2000 Plan and 2005 Plan (incorporated by reference to Exhibit 10.5 to our annual report on Form 10-K for 2005) | |||
| 10.18*† | 2008 Incentive Stock Plan (“2008 Plan”) (incorporated by reference to Exhibit 4.1 to our registration statement on Form S-8 filed August 8, 2008 (Registration No. 333-152877)) | |||
| 10.19† | First amendment to 2008 Plan | x | ||
| 10.20† | Form of stock option agreement for option grant under 2008 Plan | x | ||
| 10.21† | Bonus conversion program (2010 plan year) | x | ||
| 10.22† | Form of stock option agreement for option grant under bonus conversion program | x | ||
| 10.23† | Employee Stock Purchase Plan (“ESPP”), as amended and restated May 16, 2007 and amended May 28, 2008 | x | ||
| 10.24† | Second amendment to ESPP | x | ||
| 10.25*† | Plan of Compensation for Outside Directors (incorporated by reference to Exhibit 10.1 to our current report on Form 8-K filed August 11, 2006) | |||
| 10.26*† | First amendment to Plan of Compensation for Outside Directors (incorporated by reference to Exhibit 10.19 to our annual report on Form 10-K for 2006) |
68
Table of Contents
| Exhibit |
Description |
Filed with Electronic Submission | ||
| 14 | Code of ethics (incorporated by reference to Exhibit 10.14 to our annual report on Form 10-K for 2003) | |||
| 21 | Subsidiaries | x | ||
| 23 | Consent of Independent Registered Public Accounting Firm | x | ||
| 31.1 | Rule 13a-14(a)/15d-14(a) Certification of Chief Executive Officer | x | ||
| 31.2 | Rule 13a-14(a)/15d-14(a) Certification of Chief Financial Officer | x | ||
| 32 | Section 1350 Certification of Chief Executive Officer and Chief Financial Officer | x |
| * | Previously filed |
| † | Management contract or compensatory plan required to be filed pursuant to Item 601 of Regulation S-K |
69
Table of Contents
Pursuant to the requirements of the Securities Exchange Act of 1934, the registrant has duly caused this report to be signed on its behalf by the undersigned, thereunto duly authorized.
Dated: February 26, 2010
| Name |
Title |
Date | ||
| /s/ JACK W. SCHULER Jack W. Schuler |
Lead Director of the Board of Directors | February 26, 2010 | ||
| /s/ MARK C. MILLER Mark C. Miller |
Chairman, President and Chief Executive Officer (Principal Executive Officer) | February 26, 2010 | ||
| /s/ FRANK J.M. TEN BRINK Frank J.M. ten Brink |
Executive Vice President and Chief Financial Officer (Principal Financial and Accounting Officer) | February 26, 2010 | ||
| /s/ ROD F. DAMMEYER Rod F. Dammeyer |
Director | February 26, 2010 | ||
| /s/ WILLIAM K. HALL William K. Hall |
Director | February 26, 2010 | ||
| /s/ JONATHAN T. LORD, M.D Jonathan T. Lord, M.D. |
Director | February 26, 2010 | ||
| /s/ JOHN PATIENCE John Patience |
Director | February 26, 2010 | ||
| /s/ JAMES W.P. REID-ANDERSON James W.P. Reid-Anderson |
Director | February 26, 2010 | ||
| /s/ THOMAS D. BROWN Thomas D. Brown |
Director | February 26, 2010 | ||
| /s/ RONALD G. SPAETH Ronald G. Spaeth |
Director | February 26, 2010 | ||
70