Attached files
| file | filename |
|---|---|
| EX-31 - EX-31 - Simpson Manufacturing Co., Inc. | a09-35825_1ex31.htm |
| EX-23 - EX-23 - Simpson Manufacturing Co., Inc. | a09-35825_1ex23.htm |
| EX-32 - EX-32 - Simpson Manufacturing Co., Inc. | a09-35825_1ex32.htm |
| EX-21 - EX-21 - Simpson Manufacturing Co., Inc. | a09-35825_1ex21.htm |
UNITED STATES
SECURITIES AND EXCHANGE COMMISSION
Washington, D.C. 20549
FORM 10-K
(Mark One)
x Annual Report Pursuant to Section 13 or 15(d) of the Securities Exchange Act of 1934
for the fiscal year ended December 31, 2009
OR
o Transition Report Pursuant to Section 13 or 15(d) of the Securities Exchange Act of 1934
for the transition period from to .
Commission file number: 1-13429
Simpson Manufacturing Co., Inc.
(Exact name of registrant as specified in its charter)
|
Delaware |
|
94-3196943 |
|
(State or other jurisdiction of |
|
(I.R.S. Employer |
|
incorporation or organization) |
|
Identification No.) |
5956 W. Las Positas Blvd., Pleasanton, CA 94588
(Address of principal executive offices)
Registrant’s telephone number, including area code: (925) 560-9000
Securities registered pursuant to Section 12(b) of the Act:
|
Common Stock, par value $0.01 |
|
New York Stock Exchange, Inc. |
|
(Title of each class) |
|
(Name of each exchange on which registered) |
Securities registered pursuant to Section 12(g) of the Act:
None
(Title of class)
Indicate by check mark if the registrant is a well-known seasoned issuer, as defined in Rule 405 of the Securities Act. Yes x No o
Indicate by check mark if the registrant is not required to file reports pursuant to Section 13 or 15(d) of the Exchange Act. Yes o No x
Indicate by check mark whether the registrant (1) has filed all reports required to be filed by Section 13 or 15(d) of the Securities Exchange Act of 1934 during the preceding 12 months (or for such shorter period that the registrant was required to file such reports), and (2) has been subject to such filing requirements for the past 90 days. Yes x No o
Indicate by check mark whether the registrant has submitted electronically and posted on its corporate Web site, if any, every Interactive Data File required to be submitted and posted pursuant to Rule 405 of Regulation S-T (§232.405 of this chapter) during the preceding 12 months (or for such shorter period that the registrant was required to submit and post such files). Yes o No o
Indicate by check mark if disclosure of delinquent filers pursuant to Item 405 of Regulation S-K is not contained herein, and will not be contained, to the best of registrant’s knowledge, in definitive proxy or information statements incorporated by reference in Part III of this Form 10-K or any amendment to this Form 10-K. o
Indicate by check mark whether the registrant is a large accelerated filer, an accelerated filer, a non-accelerated filer, or a smaller reporting company. See the definitions of “large accelerated filer,” “accelerated filer” and “smaller reporting company” in Rule 12b-2 of the Exchange Act.
|
Large accelerated filer x |
|
Accelerated filer o |
|
Non-accelerated filer o |
|
Smaller reporting company o |
|
(Do not check if a smaller reporting company) |
|
|
Indicate by check mark whether the registrant is a shell company (as defined in Rule 12b-2 of the Exchange Act).
Yes o No x
As of June 30, 2009, there were outstanding 49,049,791 shares of the registrant’s common stock, par value $0.01, which is the only outstanding class of common or voting stock of the registrant. The aggregate market value of the shares of common stock held by nonaffiliates of the registrant (based on the closing price for the common stock on the New York Stock Exchange on June 30, 2009) was approximately $830,099,403. As of February 9, 2010, 49,387,761 shares of the registrant’s common stock were outstanding.
Documents Incorporated by Reference
The information called for by Part III is incorporated by reference to the definitive Proxy Statement for the Annual Meeting of Stockholders of the Company to be held April 28, 2010, which will be filed with the Securities and Exchange Commission not later than 120 days after December 31, 2009.
This document contains forward-looking statements, based on numerous assumptions and subject to risks and uncertainties. Although the Company believes that the forward-looking statements are reasonable, it does not and cannot give any assurance that its beliefs and expectations will prove to be correct. Many factors could significantly affect the Company’s operations and cause the Company’s actual results to be substantially different from the Company’s expectations. Those factors include, but are not limited to: (i) general economic and construction business conditions; (ii) customer acceptance of the Company’s products; (iii) relationships with key customers; (iv) materials and manufacturing costs; (v) the financial condition of customers, competitors and suppliers; (vi) technological developments; (vii) increased competition; (viii) changes in capital and credit markets; (ix) governmental and business conditions in countries where the Company’s products are manufactured and sold; (x) changes in trade regulations; (xi) the effect of acquisition activity; (xii) changes in the Company’s plans, strategies, objectives, expectations or intentions; and (xiii) other risks and uncertainties indicated from time to time in the Company’s filings with the Securities and Exchange Commission. Actual results might differ materially from results suggested by any forward-looking statements in this report. The Company does not have an obligation to publicly update any forward-looking statements, whether as a result of the receipt of new information, the occurrence of future events or otherwise. See “Item 1A — Risk Factors.”
PART I
Item 1. Business.
Background
Simpson Manufacturing Co., Inc., a Delaware Corporation, (the “Company”), through its subsidiary, Simpson Strong-Tie Company Inc. (“Simpson Strong-Tie” or “SST”), designs, engineers and is a leading manufacturer of wood-to-wood, wood-to-concrete and wood-to-masonry connectors, SST Quik Drive screw fastening systems and collated screws, stainless steel fasteners, and pre-fabricated shearwalls. SST Anchor Systems also offers a full line of adhesives, mechanical anchors, carbide drill bits and powder actuated tools for concrete, masonry and steel. SST also offers screw fastening systems and collated screws for various construction applications through the Quik Drive product line and a line of stainless steel fasteners through the Swan Secure product line. SST is the Company’s connector products segment. The Company’s subsidiary, Simpson Dura-Vent Company, Inc. (“Simpson Dura-Vent” or “SDV”), designs, engineers and manufactures venting systems for gas, wood, oil, pellet and other alternative fuel burning appliances. SDV is the Company’s venting products segment. The Company markets its products to the residential construction, light industrial and commercial construction, remodeling and do-it-yourself (“DIY”) markets. The Company believes that SST benefits from strong brand name recognition among architects and engineers who frequently specify in building plans the use of SST products, and that SDV benefits from strong brand name recognition among contractors, dealers, distributors and SDV’s relationships with original equipment manufacturers (“OEMs”) to which SDV markets its products. SST has continuously manufactured structural connectors since 1956. See Note 14 to the Company’s Consolidated Financial Statements for information regarding the net sales, income (loss) from operations, depreciation and amortization, significant non-cash charges, goodwill impairment, income tax expense (benefit), capital expenditures and acquisitions and total assets for the Company’s two operating segments. See “Item 1A — Risk Factors.”
Connectors produced by Simpson Strong-Tie typically are steel devices that are used to strengthen, support and connect joints in residential and commercial construction and DIY projects. SST’s Anchor Systems product line is included in the connector product segment. SST’s connector products enhance the safety and durability of the structures in which they are installed and can save time and labor costs. SST’s connector products contribute to structural integrity and resistance to seismic, wind and other forces. Applications range from commercial and residential building, to deck construction, to DIY projects.
Simpson Dura-Vent’s venting systems are used to vent gas furnaces, water heaters, including tankless water heaters, fireplaces and stoves, wood and oil burning appliances, condensing appliances and wood pellet and corn stoves. SDV’s metal vents, chimneys and chimney liner systems exhaust combustion products to the exterior of the building. SDV designs its products for ease of assembly and safe operation and to achieve a high level of performance.
The Company emphasizes continuous new product development and often obtains patent protection for its new products. The Company’s products are marketed in all 50 states of the United States and in Europe, Canada, Asia, Australia, New Zealand, Mexico and several countries in Central and South America and the Middle East. Both Simpson Strong-Tie and Simpson Dura-Vent products are distributed to home centers, through wholesale distributors, to contractors and dealers and to OEMs.
The Company has developed and uses automated manufacturing processes. Its innovative manufacturing systems and techniques have allowed it to control manufacturing costs, while developing both new products and products that meet customized requirements and specifications. The Company’s development of specialized manufacturing processes has also permitted increased operating flexibility and enhanced product design innovation. The Company has 21 manufacturing locations in the United States, Canada, France, Denmark, Ireland, Germany, China and England. In 2009, SST opened a new manufacturing facility in Zhangjiagang, China, and moved its production of mechanical anchors to the new facility from its facility in Brampton, Ontario. In 2008, SDV consolidated its production of venting products in Vacaville, California, and discontinued production at its Vicksburg, Mississippi, facility. SDV also added a manufacturing and distribution facility in Albany, New York, with the acquisition of ProTech Systems, Inc. in June 2008.
Industry and Market Trends
Based on trade periodicals, participation in trade and professional associations and communications with governmental and quasi-governmental organizations and with customers and suppliers, the Company believes that a variety of events and trends have resulted in significant developments in the markets that the Company serves. The Company’s products are designed to respond to increasing demand resulting from these trends. Some of these events and trends are discussed below.
Natural disasters throughout the world have focused attention on safety concerns relating to the structural integrity of homes and other buildings. The 1995 earthquake in Kobe, Japan, the 1994 earthquake in Northridge, California, the 1989 Loma Prieta earthquake in Northern California, Hurricanes Hugo in 1989 and Andrew in 1992 and a series of hurricanes in 2004 and 2005, including Katrina, in the southeastern United States, and other less cataclysmic natural disasters, damaged and destroyed innumerable homes and other buildings, resulting in heightened consciousness of the fragility of some of those structures.
In recent years, architects, engineers, model code agencies, contractors, building inspectors and legislators have continued efforts to improve structural integrity and safety of homes and other buildings in the face of disasters of various types, including seismic events, storms and fires. Based on ongoing participation in trade and professional associations and communications with governmental and quasi-governmental regulatory agencies, the Company believes that building codes are being more uniformly applied around the country and their enforcement is becoming more rigorous.
Recently, there has been consolidation among several of the Company’s customer groups. The industry has experienced increased complexity in some home design, and builders are more aggressively trying to reduce their costs. The Company has responded to these trends by marketing its products as systems, in addition to individual parts. In some cases, the Company uses sophisticated design and specification software to facilitate systems marketing.
The requirements of the Endangered Species Act, the Federal Lands Policy Management Act and the National Forest Management Act have reduced the amount of timber available for harvest from public lands. Over the past several years, this and other factors have led to the increased use of engineered wood products. Engineered wood products, which substitute for strong, clear-grained lumber historically obtained from logging older, large-diameter trees, have been developed to conserve lumber. Engineered wood products frequently require specialized connectors and fasteners. Sales of Simpson Strong-Tie’s engineered wood connector and fastener products have contributed significant revenues over the past several years.
Concerns about energy conservation and air quality have led to increasing recognition of the advantages of natural gas as a heating fuel, including its clean burning characteristics. Use of natural gas for home heating has been increasing in the United States over a number of years. The cyclical nature of natural gas costs has resulted in fluctuating demand for Simpson Dura-Vent’s natural gas products and its products for alternative fuel appliances.
The Company continues to develop its distribution through home centers throughout the United States. The Company’s sales to home centers were flat in 2007 and declined in 2008 and 2009. See “Item 7 — Management’s Discussion and Analysis of Financial Condition and Results of Operations.”
The Company’s principal markets are in the building construction industry. That industry is subject to significant volatility due to real estate market cycles, fluctuations in interest rates, the availability, or lack thereof, of credit to builders, developers and consumers, inflation rates, weather, and other factors and trends. The world-wide recession and the declines in residential construction that began in 2007 have reduced the demand for the Company’s products. See “Item 1A — Risk Factors.”
Business Strategy
The Company designs, manufactures and sells products that are of high quality and performance, easy to use and cost-effective for customers. The Company provides rapid delivery of its products and prompt engineering and sales support. Based on its communications with customers, engineers, architects, contractors and other industry participants, the Company believes that its products have strong brand-name recognition, and the Company seeks to continue to develop the value of its brand names through a variety of customer-driven strategies. Information provided by customers has led to the development of many of the Company’s products, and the Company expects that customer needs will continue to shape the Company’s product development, marketing and services.
Specification in architects’ and engineers’ plans and drawings influences which products will be used for particular purposes and therefore is key to the use of the Company’s products in construction projects. The Company encourages architects and engineers to specify the installation of the Company’s products in projects they design and supervise, and encourages construction contractors to accept the Company’s products. The Company maintains frequent contacts with architects, engineers and contractors, as well as private organizations that provide information to building code officials, both to inform them regarding the quality, proper installation, capabilities and value of the Company’s products and to update them about product modifications and new products that may be useful or necessary. The Company sponsors seminars to inform architects, engineers, contractors and building officials on appropriate use and proper installation of the Company’s products. Additionally, the Company maintains relationships with home builders throughout the country to promote the use of its products.
The Company seeks to expand its product and distribution coverage through several channels:
Distributors. The Company regularly evaluates its distribution coverage and service levels provided by its distributors and from time to time modifies its distribution strategy and implements changes to address weaknesses and opportunities. The Company has various programs to evaluate distributor product mix and conducts promotions to encourage distributors to add Company products that complement the mix of product offerings in their markets.
Through its efforts to increase specifications by architects and engineers, and through increasing the number of products sold to particular contractors, the Company seeks to increase sales to channels that serve building contractors. The Company continuously seeks to expand the number of contractors served by each distributor through such sales efforts as demonstrations of product cost-effectiveness and information programs.
Home Centers. The Company intends to increase penetration of the DIY markets by solicitation of home centers. The Company’s sales force maintains on-going contact with home centers to work with them in a broad range of areas including inventory levels, retail display maintenance, and product knowledge training. To satisfy specialized requirements of the home center market, the Company has developed extensive bar coding and merchandising aids and has devoted a portion of its research efforts to the development of DIY products.
Dealers. In some markets, the Company sells its products directly to lumber dealers.
OEM Relationships. The Company works closely with manufacturers of engineered wood products and OEMs in developing and expanding the application and sales of Simpson Strong-Tie’s engineered wood connector and fastener products and Simpson Dura-Vent’s gas, wood and pellet stove venting products. SST has relationships with several of the largest manufacturers of engineered wood products, and SDV has OEM relationships with major fireplace and stove manufacturers.
While the Company is expanding its established facilities outside of California to increase its presence and sales in these markets, sales of some products may relate primarily to certain regions. For example, sales of SST’s line of shearwalls are concentrated mostly in the western region of the United States, because their use is primarily intended to resist the effects of seismic forces. Since 1993 the Company —
· has established operations in the United Kingdom,
· opened manufacturing and warehouse and distribution facilities in western Canada and the midwestern, northeastern, and eastern seaboard regions of the United States,
· purchased anchor products manufacturers in Illinois, eastern Canada and Ireland and connector product manufacturers in France, Denmark, Germany and Canada,
· acquired the assets of a leading manufacturer and distributor of screw fastening systems and collated screws with manufacturing and distribution operations in Tennessee and distribution in Canada, Europe, Australia and New Zealand, and acquired a German manufacturer with manufacturing in Germany, Czech Republic and China,
· acquired a manufacturer and distributor of stainless steel fasteners with manufacturing in Maryland and distribution in Maryland, Florida, Oregon and Massachusetts,
· purchased a venting products manufacturer in New York and acquired the assets of a specialized venting manufacturing line,
· built a manufacturing facility in China and opened sales offices in Hong Kong, Beijing, Shanghai and Dubai for distribution in Asia and the Middle East, and
· acquired the business of a software company which licenses deck design and estimation software.
The Company’s European investments have established a presence in the European Community through companies with existing customer bases and through servicing United States-based customers operating there. The Company also distributes connector, anchor and epoxy products in Mexico, Australia, New Zealand, Asia and the Middle East. The Company intends to continue to pursue and expand operations both inside and outside of the United States (see Note 14 to the Company’s Consolidated Financial Statements).
A Company goal is to manufacture and warehouse its products in geographic proximity to its markets to provide availability and rapid delivery of products to customers and prompt response to customer requests for specially designed products and services. With respect to the DIY and dealer markets, the Company’s strategy is to keep the customer’s retail stores continuously stocked with adequate supplies of the full line of the Company’s products that those stores carry. The Company manages its inventory to help assure continuous product availability. Most customer orders are filled within a few days. High levels of manufacturing automation and flexibility allow the Company to maintain its quality standards while continuing to provide prompt delivery.
The Company’s product research and development is based largely on needs that customers communicate to the Company. The Company typically has developed 10 to 25 new products annually (some of which may be produced in a range of sizes). The Company’s strategy is to develop new products on a proprietary basis, to patent them when appropriate and to seek trade secret protection for others.
The Company’s long-term strategy is to develop, acquire or invest in product lines or businesses that have the potential to increase the Company’s earnings per share over time and that—
· complement the Company’s existing product lines,
· can be marketed through its existing distribution channels,
· might benefit from use of the Simpson Strong-Tie or Simpson Dura-Vent brand names and expertise,
· are responsive to needs of the Company’s customers,
· expand the Company’s markets geographically and
· reduce the Company’s dependence on the United States residential construction market.
Simpson Strong-Tie
Overview
Connectors produced by Simpson Strong-Tie typically are steel devices that are used to strengthen, support and connect joints in residential and commercial construction and DIY projects. These products enhance the safety and durability of the structures in which they are installed and can save time and labor costs for the contractor. SST’s connector products increase structural integrity and improve structural resistance to seismic, wind and other forces. Applications range from building framing to deck construction to DIY projects. SST produces and markets over 11,000 standard and custom products.
In the United States, connector usage developed faster in the West than elsewhere due to the low cost and abundance of timber and to local construction practices. Increasingly, the market has been influenced both by a growing awareness that the devastation caused by seismic, wind and other disasters can be reduced through improved building codes and construction practices and by environmental concerns that contribute to the increasing cost and reduced availability of wood. Most Simpson Strong-Tie products are listed by recognized building standards agencies as complying with model building codes and are specified by architects and engineers for use in projects they are designing or supervising. The engineered wood products industry continues to develop in response to concerns about the availability of wood, and the Company believes that SST is the leading supplier of connectors for use with engineered wood products. SST operates manufacturing or warehouse facilities in California, Texas, Ohio, Florida, Connecticut, Illinois, Washington, Tennessee, Minnesota, North Carolina, Maryland, Massachusetts, British Columbia, Ontario, England, France, Denmark, Germany, Australia, Scotland, Poland, Ireland, Czech Republic, Hong Kong, Dubai and China.
Metal connectors, anchors and fasteners will corrode and lose load-carrying capacity when installed in corrosive environments or exposed to corrosive materials. There are many environments and materials that may cause corrosion, including ocean salt air, fire retardants, preservative-treated wood, dissimilar metals, fumes and fertilizers. The variables present in a single building environment make it impossible to predict accurately if, or when, significant corrosion will begin or reach a critical level. This relative uncertainty makes it crucial that the specifiers be knowledgeable of the potential risks and select a product coating or metal that is suitable for the intended use. Changes in the preservative-treated wood industry have created additional concerns. Effective December 31, 2003, the preservative-treated wood industry voluntarily transitioned from Chromated Copper Arsenate (“CCA-C”) used in residential applications to alternative treatments. Testing has shown that certain alternative replacement treatments are generally more corrosive than CCA-C. SST publishes technical bulletins on subjects such as this and others that affect the installation and use of its products. SST makes its technical bulletins available on its website at www.strongtie.com.
Products
Simpson Strong-Tie is a recognized brand name in the markets it serves. SST manufactures and markets products that strengthen the three types of connections typically found in residential and commercial construction: wood-to-wood, wood-to-concrete and wood-to-masonry. Many of the Company’s connector products, including its pre-fabricated shearwalls, are installed in a continuous load path from the foundation to the roof system. SST also markets specialty screws and nails for proper installation of certain of its connector products. These products have seismic, high-wind, retrofit and remodeling applications for both new construction and DIY markets. Through its Anchor Systems product line, SST offers a full line of adhesives, mechanical anchors, carbide drill bits and powder-actuated pins and tools for numerous anchoring applications in concrete, masonry and steel in both standard and metric sizes. SST also offers screw fastening systems and collated screws for various construction applications through the Quik Drive product line and a line of stainless steel fasteners through the Swan Secure product line.
Most of Simpson Strong-Tie’s products are listed by recognized model building code agencies. To achieve such listings, SST conducts extensive product testing, which is witnessed and certified by independent testing engineers. The tests also provide the basis for publication of load ratings for SST structural connectors, and this information is used by architects, engineers, contractors and homeowners. The information is useful across the range of applications of SST’s products, from the deck constructed by a homeowner to a multi-story structure designed by an architect or engineer in an earthquake zone.
Simpson Strong-Tie also manufactures connector products specifically designed for use with engineered wood products, such as wood I-joists. With increased timber costs and reduced availability of trees suitable for making traditional solid sawn lumber, construction with engineered wood products has increased substantially in the last several years. Sales of Simpson Strong-Tie’s engineered wood connector and fastener products have contributed significant revenues over the past several years.
New Product Development
Simpson Strong-Tie commits substantial resources to new product development. The majority of SST’s products have been developed through its internal research and development program. SST’s research and development expense for the three years ended December 31, 2009, 2008 and 2007, was $5,884,000, $6,148,000 and $5,206,000, respectively. SST is the only known United States manufacturer with the capability to test multi-story wall systems, thus enabling testing rather than calculations alone to prove system performance. SST engineering, sales, product management, and marketing teams work together with architects, engineers, building inspectors, code officials and customers in the new product development process.
SST typically develops 10 to 20 new products each year. In 2009, SST introduced the Strong Drive® SD screw for use with SST connectors. Designed to replace nails in many connectors, the new SD screws often increase load capacity and afford easier and more convenient installation in many applications. SST also developed new products for beam attachment to concrete masonry units (“CMUs”) and concrete piers when high uplift capacity is required, one-piece face-mount hangers to support beam attachments to CMUs and concrete walls using the Company’s Titen HD screw anchor, adjustable stair-stringer connectors for both wood-frame and deck construction, wood-fence-to-steel-post connectors, and several other products for general construction and DIY. SST developed additional fasteners and collated delivery systems for several applications, including metal roofing, composite decking, cooling towers, and other general construction fastening applications.
While continuing to service the new single-family residential housing market, SST has increased development efforts for products used in DIY, multi-family residential, and some light commercial and industrial markets.
Sales and Marketing
Simpson Strong-Tie’s sales and marketing programs are implemented through SST’s branch system. SST currently maintains branches in Northern and Southern California, Texas, Ohio, Canada, England, France, Germany, Denmark and China. Each branch is served by its own sales force, as well as manufacturing, warehouse and office facilities. Each branch is responsible for a broad geographic area. Each is responsible for setting and executing sales and marketing strategies that are consistent with the markets that the branch serves and the goals of SST. The domestic branches closely integrate their manufacturing activities to enhance product availability. Branch sales forces in the United States are supported by marketing managers in the home office in Pleasanton, California. The home office also coordinates issues affecting customers that operate in multiple regions. The sales force maintains close working relationships with customers, develops new business, calls on architects, engineers and building officials and participates in a range of educational seminars.
Simpson Strong-Tie sells its products through an extensive distribution system comprising dealer distributors supplying thousands of retail locations nationwide, contractor distributors, home centers, lumber dealers, manufacturers of engineered wood products, and specialized contractors such as roof framers. In recent years, home centers have been one of SST’s fastest growing distribution channels. A large part of that growth was sales to The Home Depot, which exceeded 10% of the Company’s consolidated net sales in both 2007 and 2009 (see “Item 1A — Risk Factors,” “Item 7 — Management’s Discussion and Analysis of Financial Condition and Results of Operations,” and Note 14 to the Company’s Consolidated Financial Statements). SST’s DIY and dealer products are used to build projects such as decks, patio covers and garage organization systems.
Simpson Strong-Tie dedicates substantial resources to customer service. SST produces numerous publications and point-of-sale marketing aids to serve specifiers, distributors, retailers and users for the various markets that it serves. These publications include general catalogs, as well as various specific catalogs, such as those for its Anchor System products. The catalogs and publications describe the products and provide load and installation information. SST also maintains several linked websites centered on www.strongtie.com, which include catalogs, product and technical information, code reports and other general information related to SST’s product lines and promotional programs.
Simpson Strong-Tie’s engineers not only design and test products, but also provide engineering support for customers. This support might range from the discussion of a load value in a catalog to testing the suitability of an existing product in a unique application. SST’s sales force communicates with customers in each of its marketing channels, through its publications, seminars and frequent sales calls.
Based on its communications with customers, Simpson Strong-Tie believes that its products are important to its customers’ businesses, and it is SST’s policy to ship products within a few days of receiving the order, with many of the orders shipped the same day as the order is received. Many of SST’s customers serve contractors that require rapid delivery of needed products. Home centers and dealers also require superior service because of fluctuating demand and to serve the needs of a broad base of customers. To satisfy these requirements, SST maintains appropriate inventory levels, has redundant manufacturing capability and some multiple dies to produce the same parts. SST also maintains information systems that provide sales and inventory control and forecasting capabilities throughout its network of factories and warehouses. SST also has special programs for contractors intended to ensure the prompt manufacture and delivery of custom products.
Simpson Strong-Tie believes that dealer and home center sales of SST products are significantly greater when the bins and racks at dealer and home center locations are adequately stocked with appropriate products. Various retailers carry varying numbers of SST products. SST’s sales force is engaged in ongoing efforts to inform retailers about SST’s merchandising programs and the appeal of the SST brand.
Simpson Dura-Vent
Overview
Simpson Dura-Vent’s venting systems are used to vent gas furnaces, water heaters, including tankless water heaters, fireplaces and stoves, wood and oil burning appliances, condensing appliances and wood pellet and corn stoves. SDV’s metal vents, chimneys and chimney liner systems exhaust the products of combustion to the exterior of the building. SDV’s products have been designed for ease of assembly and safe operation and to achieve a high level of performance. SDV produces and markets approximately 4,000 different venting products.
The clean burning characteristics of natural gas have gained public recognition, resulting in increased market share for natural gas appliances in the new construction and the appliance replacement markets. As a result, Simpson Dura-Vent has developed venting systems, such as Direct-Vent, to address changes in appliance technology. Fluctuations in natural gas prices, however, affect demand for gas appliances. Historically, during periods of high oil and natural gas prices and energy shortages, sales of wood and pellet burning stoves, considered alternative energy sources, have increased, while sales of gas burning appliances have tended to decline.
Simpson Dura-Vent’s objective is to expand market share in all of its distribution channels by entering expanding markets that address energy and environmental concerns. SDV’s strategy is to capitalize on its strengths in new product development and its established distribution network and to continue its commitment to high quality and service. SDV operates manufacturing and warehouse facilities in California, Mississippi, Minnesota and New York. In January 2008, SDV decided to close its Vicksburg, Mississippi, facility and consolidate its manufacturing operations in Vacaville, California.
In June 2008, SDV acquired the equity of ProTech Systems, Inc. (“ProTech”), which is based in Albany, New York. ProTech manufactures special gas vents for condensing appliances, including tankless water heaters and boilers. In July 2008, SDV acquired the assets and trademarks of Ventinox relining systems from American BOA, Inc.
Products
Simpson Dura-Vent is a leading supplier of double-wall Type B Gas Vent systems, used for venting gas furnaces, water heaters, boilers and decorative gas fireplaces. SDV’s Type B Gas Vent product line features heavy-duty quality construction and a twist-lock design that provides for fast and easy job-site assembly compared to conventional snap-together designs. The twist-lock design has broader applications and has been incorporated into SDV’s gas, pellet and Direct-Vent product lines. SDV also markets a patented flexible vent connector, Dura/Connect, for use between the gas appliance flue outlet and the connection to the Type B Gas Vent installed in the ceiling. Dura/Connect affords simple twist, bend and connect installation for water heaters and gas furnaces. As a result of the acquisition of ProTech in July 2008, SDV offers special gas vent and relining products.
Consumer concerns over the rising costs of natural gas and home heating oil in 2003 through the first half of 2006 increased demand for alternative fuel appliances. This resulted in increased demand for SDV’s all-fuel chimney and pellet vent products, although demand for these and other SDV products declined along with the slowdown in home building activity in the first half of 2006 and again in late 2007 and 2008. The gas fireplace market has evolved into two basic types of fireplace: top-vent fireplaces that are vented with the standard Type B Gas Vent and direct-vent fireplaces that use a special double-wall venting system. SDV’s Direct-Vent system is designed not only to exhaust the flue products, but also to draw in outside air for combustion, an important feature in modern energy-efficient home construction. Direct-Vent gas fireplace systems afford ease of installation, permitting horizontal through-the-wall venting or standard vertical through-the-roof venting. SDV has established relationships with several large manufacturers of gas stoves and gas fireplaces to supply Direct-Vent venting products.
New Product Development
Simpson Dura-Vent has gained industry recognition by offering innovative new products that meet changing needs of customers. SDV representatives serve on industry committees concerned with issues such as new appliance standards and government regulations. SDV’s research and development expense for the three years ended December 31, 2009, 2008 and 2007, was $655,000, $812,000 and $816,000, respectively. SDV also maintains working relationships with research and development departments of major appliance manufacturers, providing prototypes for field testing and conducting tests in SDV’s testing laboratory. SDV believes that such relationships provide competitive advantages. For example, SDV introduced the first venting system for Direct-Vent gas appliances. In 2004, SDV completed testing for a new chimney product line, Dura-Plus HTC, which is designed to meet Canadian standards for chimney systems, and began marketing in Canada in 2005. In 2006, SDV launched a new, improved PelletVent for venting pellet burning stoves. SDV manufactures the new PelletVent product line using laser welding equipment. SDV has patents pending for the PelletVent product line. In 2007, SDV determined that the exhaust gases that result from burning corn pellets and other bio fuels can be corrosive and has begun using material that is more suited to this application. Also in 2007, SDV launched improvements in its Direct-Vent categories, applying laser weld techniques, and launched a new air-cooled large diameter (10” through 16”) chimney product line, Dura-Chimney 2, for venting very large wood-burning fireplaces.
Sales and Marketing
Simpson Dura-Vent’s sales and marketing programs are implemented through SDV’s sales and marketing staff and a network of independent manufacturer’s agents. SDV markets venting systems for both gas and wood burning appliances through wholesale distributors in the United States, Canada and Australia to the HVAC (heating, ventilating and air conditioning) and PHC (plumbing, heating and cooling) contractor markets, and to fireplace specialty distributors. These customers sell to contractor and DIY markets. SDV also markets venting products to home center and hardware store chains. SDV has established OEM relationships with several major gas fireplace and gas stove manufacturers, which SDV believes are leaders in the direct-vent gas appliance market.
Simpson Dura-Vent responds to technological changes occurring in the industry through new product development and has developed a reputation for quality and service to its customers. To reinforce its reputation for quality, SDV produces extensive sales support literature and advertising materials. Recognizing the difficulty that customers and users may have in understanding correct sizing for venting, SDV publishes a sizing handbook to assist contractors, building officials and retail outlets. SDV has designed its advertising and promotional materials for use by distributors and their customers, as well as home centers and hardware chains.
To enhance its marketing effort, SDV maintains a website, www.duravent.com, that includes product descriptions, catalogs and installation instructions, as well as a direct link to SDV’s customer service and engineering departments. SDV also regularly publishes and sends e-mail newsletters to its distributors and authorized Dura-Pro dealers.
Manufacturing Process
The Company designs and manufactures most of its standard products. The Company has concentrated on making its manufacturing processes as efficient as possible without compromising the quality or flexibility necessary to serve the needs of its customers. The Company has developed and uses automated manufacturing processes. The Company’s innovative manufacturing systems and techniques have allowed it to control manufacturing costs, even while developing both new products and products that meet customized requirements and specifications. The Company’s development of specialized manufacturing processes also has permitted increased operating flexibility and enhanced product design innovation. The Company sources some products from third party vendors, both domestically and internationally.
The Company is committed to helping people build safer structures economically through the design, engineering and manufacturing of structural connectors, pre-fabricated shearwalls, anchors, fasteners and related products. With the support and involvement of management, the Company has developed a quality system that manages defined procedures to ensure consistent product quality and also meets the requirements of International Code Council (ICC) product evaluation reports. Simpson Strong-Tie is recognized in its industry as a manufacturer of high quality products. Since 1996, SST’s quality system has been registered under ISO 9001, an internationally recognized set of quality-assurance standards. The Company believes that ISO registration is a valuable tool for maintaining its high quality standards. As SST establishes new business locations through expansion or acquisitions, projects are established to integrate SST’s quality systems and achieve ISO 9001 registration. In addition, SST has five testing laboratories accredited to ISO standard 17025, an internationally accepted standard that provides requirements for the competence of testing and calibration laboratories.
Most of Simpson Strong-Tie’s products are produced with a high level of automation, using progressive dies run in automatic presses making parts from coiled sheet steel at rates that often exceed 100 strokes per minute. SST estimates that it produces over 500 million product pieces per year. Most of SST’s products (SKUs) are bar coded with UPC numbers for easy identification, and nearly all of the products sold to home centers are labeled with bar codes. SST has significant press capacity and has multiple dies for some of its high volume products because of the need to produce these products close to the customer and to provide backup capacity. The balance of production is accomplished through a combination of manual, blanking and numerically controlled (NC) processes that include robotic welders, lasers and turret punches. This capability allows SST to produce products with little redesign or set-up time, facilitating rapid turnaround for customers. New tooling is also highly automated. Dies are designed and produced using computer aided design (CAD) and computer aided machining (CAM) systems. CAD/CAM capability enables SST to create multiple dies quickly and design them to high standards. The Company is constantly reviewing its product line to reduce manufacturing costs, increase automation, and take advantage of new types of materials.
Simpson Strong-Tie also manufactures chemical anchoring products at its facility in Addison, Illinois. The chemicals are mixed in batches and are then loaded in two-part dispensers. These dispensers mix the product on the job site because set up times are usually very short. In addition, SST purchases a number of products, primarily fasteners, powder actuated pins and tools and accessories and certain of its mechanical anchoring products, from various sources around the world. These purchased products undergo inspections on a sample basis for conformance with ordered specifications and tolerances before being distributed.
Simpson Dura-Vent produces component parts for venting systems using NC-controlled punch presses equipped with high-speed progressive and compound tooling. SDV’s vent pipe and elbow assembly lines are automated, to produce finished products efficiently from large coils of steel and aluminum. UPC bar coding and computer tracking systems provide SDV’s industrial engineers and production supervisors with real-time productivity tools to measure and evaluate current production rates, methods and equipment.
Regulation
Simpson Strong-Tie’s product lines are subject to federal, state, county, municipal and other governmental and quasi-governmental regulations that affect product design, development, testing, applications, marketing, sales, installation and use. Most SST products are recognized by building code and standards agencies. Agencies that recognize Company products include the International Code Council Evaluation Service (ICC-ES), the International Association of Plumbing and Mechanical Officials (IAPMO), the City of Los Angeles, the State of Florida, and the California Division of the State Architect. These and other agencies adopt various testing and design standards and incorporate them into their related building codes. With the adoption of the International Residential Code and the International Building Code, these standards are being applied more uniformly, and these Codes are recognized throughout most of the United States. SST considers code recognition to be a significant marketing tool and devotes considerable effort to obtaining and maintaining appropriate approvals for its products. SST believes that architects, engineers, contractors and other customers are more likely to purchase structural products that have the appropriate code acceptance than competitive products that lack code acceptance. SST actively participates in industry related professional associations to keep abreast of regulatory changes and to provide information to regulatory agencies.
Simpson Dura-Vent operates under a regulatory environment that includes appliance and venting performance standards related to safety, energy efficiency and air quality. Gas venting regulations are contained in the National Fuel Gas Code (“NFGC”), while safety and performance regulations for wood burning appliances and chimney systems are contained in a National Fire Protection Association standard (“NFPA 211”). Standards for testing gas vents and chimneys are developed by testing laboratories such as Underwriter’s Laboratories (“UL”) in compliance with the American National Standards Institute. The Environmental Protection Agency (“EPA”) regulates clean air standards for both gas and wood burning appliances. The Department of Energy (“DOE”) regulates energy efficiency standards under the authority of the National Appliance Energy Conservation Act. Under this Act, the DOE periodically reviews the necessity for increased efficiency standards with respect to gas furnaces and gas water heaters. A substantial percentage of SDV’s Type B Gas Vent sales are for gas furnaces and gas water heaters. Minimum appliance efficiency standards have been enacted that could negatively affect sales of Type B Gas Vents, which could adversely affect the Company’s operating results. In turn, the various building codes could be adopted by local authorities, resulting in enforcement through the building permit process. Safety, air quality and energy efficiency requirements are enforced by local air quality districts and municipalities by requiring proper UL, EPA and DOE labels on appliances and venting systems.
Competition
The Company faces a variety of competition in all of the markets in which it participates. This competition ranges from subsidiaries of large national or international corporations to small regional manufacturers. While price is an important factor, the Company competes on the basis of quality, breadth of product line, technical support, availability of inventory, service (including custom design and manufacturing), field support and product innovation. As a result of differences in structural design and building practices and codes, Simpson Strong-Tie’s markets tend to differ by region. Within these regions, SST competes with companies of varying size, several of which also distribute their products nationally.
The venting industry is highly competitive. SDV’s competitors include a variety of manufacturers that have operations in the United States, Canada, China and Mexico. Most of its competitors do not compete in all of SDV’s product lines, and some have additional product lines that SDV does not offer. SDV competes on the basis of quality, service, breadth of product line, availability of inventory, technical support and product innovation.
Raw Materials
The principal raw material used by both Simpson Strong-Tie and Simpson Dura-Vent is steel, including stainless steel. The Company generally orders steel to specific American Society of Testing and Materials (“ASTM”) standards. SST also uses materials such as epoxies and acrylics in the manufacture of its chemical anchoring products. SDV also uses raw materials such as aluminum, aluminum alloys and ceramic and other insulation materials, and both SST and SDV use cartons. The Company purchases raw materials from a variety of commercial sources. The Company’s practice is to seek cost savings and enhanced quality by purchasing from a limited number of suppliers.
The steel industry is highly cyclical and prices for the Company’s raw materials are influenced by numerous factors beyond the Company’s control, including general economic conditions, competition, labor costs, foreign exchange rates, import duties, raw material shortages and trade restrictions. The steel market continues to be dynamic, with a high degree of uncertainty about future pricing trends. Steel prices have declined from their peak in July 2008, but the Company believes that they may have reached a low point in mid-2009 and that they may increase in 2010 as demand returns to the market and imports and steel mill capacity utilization remain constricted. Demand for steel, although slow, increased due to manufacturers’ low inventories in the fourth quarter of 2009. Numerous factors may cause steel prices to increase in the future. In addition to increases in steel prices, mills have added surcharges for zinc, energy and freight in response to increases in their costs. These and other factors could adversely affect the Company’s cost and access to steel in 2010. If steel prices increase and the Company is not able to maintain its prices or increase them sufficiently, the Company’s margins could deteriorate. See “Item 1A — Risk Factors” and “Item 7 — Management’s Discussion and Analysis of Financial Condition and Results of Operations.” The Company historically has not attempted to hedge against changes in prices of steel or other raw materials.
Patents and Proprietary Rights
The Company’s subsidiaries have United States and foreign patents, the majority of which cover products that they currently manufacture and market. These patents, and applications for new patents, cover various design aspects of the subsidiaries’ products, as well as processes used in their manufacture. The Company’s subsidiaries are continuing to develop new potentially patentable products, product enhancements and product designs. Although the Company’s subsidiaries do not intend to apply for additional foreign patents covering existing products, the Company has developed an international patent program to protect new products that its subsidiaries may develop. In addition to seeking patent protection, the Company relies on unpatented proprietary technology to maintain its competitive position. See “Item 1A — Risk Factors.”
Acquisitions and Expansion into New Markets
The Company’s future growth, if any, may depend to some extent on its ability to penetrate new markets, both domestically and internationally. See “Industry and Market Trends” and “Business Strategy.” Therefore, the Company may in the future pursue acquisitions of product lines or businesses. See “Item 1A — Risk Factors” and “Item 7 — Management’s Discussion and Analysis of Financial Condition and Results of Operations.”
In July 2007, the Company’s subsidiary, Simpson Strong-Tie Company Inc., purchased the stock of Swan Secure Products, Inc. (“Swan Secure”) for $42.1 million in cash, net of cash received. Swan Secure is a manufacturer and distributor of fasteners, largely stainless steel, and its products are marketed throughout the United States. In 2009, SST integrated the Swan Secure product line into its sales and distribution system and is transitioning the Swan secure brand to the SST brand.
In April 2008, the Company’s subsidiary, Simpson Strong-Tie Ireland Limited, purchased certain assets of Liebig International Ltd., an Irish company, Heinrich Liebig Stahldübelwerke GmbH, Liebig GmbH & Co. KG and Liebig International Verwaltungsgesellschaft GmbH, all German companies, Liebig Bolts Limited, an English company, and Liebig International Inc., a Virginia corporation (collectively “Liebig”). Liebig manufactures mechanical anchor products in Ireland and distributes them primarily throughout Europe through warehouses located in Germany and the United Kingdom. Liebig expands the Company’s anchor product offerings in its connector product segment. The purchase price was $19.2 million in cash, including due diligence and transaction costs. The Company recorded goodwill of $7.6 million and intangible assets subject to amortization of $2.7 million as a result of the acquisition. Tangible assets, including real estate, machinery and equipment, inventory and trade accounts receivable, accounted for the balance of the purchase price.
In June 2008, the Company’s subsidiary, Simpson Dura-Vent Company, Inc., purchased the equity of ProTech Systems, Inc., a New York corporation (“ProTech”). ProTech manufactures venting products in New York and distributes them throughout North America. ProTech expands the Company’s product offerings in the venting product segment. The purchase price was $8.3 million in cash, including due diligence and transaction costs and $1.4 million to be paid in the future, plus an additional earn-out of up to $2.25 million if certain future performance targets are met. The Company recorded goodwill of $2.2 million and intangible assets subject to amortization of $3.3 million as a result of the acquisition. Net tangible assets, including machinery and equipment, inventory and trade accounts receivable, accounted for the balance of the purchase price. In July 2008, Simpson Dura-Vent also purchased certain assets to produce the Ventinox stainless steel chimney liner product line from American BOA Inc. ProTech had been the distributor of Ventinox products. The purchase price was $1.6 million in cash, including due diligence and transaction costs. The Company recorded goodwill of $0.7 million and intangible assets subject to amortization of $0.1 million. Tangible assets, including machinery and equipment and inventory, accounted for the balance of the purchase price.
In July 2008, the Company’s subsidiary, Simpson Strong-Tie Company Inc., purchased the equity of Ahorn-Geräte & Werkzeuge Vertriebs GmbH, a German company, and its subsidiaries Ahorn Upevnovaci Technika s.r.o., a Czech company, and Ahorn Pacific Fasteners (Kunshan) Co., Ltd., a Chinese company (collectively “Ahorn”). The acquisition broadened Simpson Strong-Tie’s collated fastener product line and added production capacity in both Europe and China. The purchase price was $9.2 million in cash, including due diligence and transaction costs. The Company recorded goodwill of $3.3 million and intangible assets subject to amortization of $3.9 million as a result of the acquisition. Net tangible assets, including machinery and equipment, inventory and trade accounts receivable, accounted for the balance of the purchase price.
In January 2009, the Company’s subsidiary, Simpson Strong-Tie Company Inc., acquired the business of RO Design Corp, a Florida corporation doing business as DeckTools, which licenses deck design and estimation software. Payments under the purchase agreement total $4.0 million in cash, including $2.5 million to be paid in the future, which will be treated as compensation expense to the principal officer of RO Design Corp, who is now employed by the Company. As a result of the acquisition, the Company recorded goodwill of $0.4 million and intangible assets subject to amortization of $1.1 million.
In April 2009, the Company’s subsidiary, Simpson Strong-Tie Europe EURL, purchased the equity of Agence Internationale Commerciale et Industrielle, S.A.S. (“Aginco”). Aginco manufactures a line of high-quality builder products and distributes them in France. The purchase price was $22.2 million in cash. The Company has recorded goodwill in connection with the transaction of $10.5 million and intangible assets subject to amortization of $6.0 million. Net tangible assets, including machinery and equipment, inventory and trade accounts receivable, accounted for the balance of the purchase price.
Seasonality and Cyclicality
The Company’s sales are seasonal and cyclical. Operating results vary from quarter to quarter and with economic cycles. The Company’s sales are also dependent, to a large degree, on the North American residential home construction industry. See “Item 1A — Risk Factors” and “Item 7 — Management’s Discussion and Analysis of Financial Condition and Results of Operations.”
Environmental, Health and Safety Matters
The Company is subject to environmental laws and regulations governing emissions into the air, discharges into water, and generation, handling, storage, transportation, treatment and disposal of waste materials. The Company is also subject to other federal and state laws and regulations regarding health and safety matters. The Company believes that it has obtained all material licenses and permits required by environmental, health and safety laws and regulations in connection with the Company’s operations and that its policies and procedures comply in all material respects with existing environmental, health and safety laws and regulations. See “Item 1A — Risk Factors.”
Employees and Labor Relations
As of January 1, 2010, the Company had 2,138 full-time employees, of whom 1,116 were hourly employees and 1,022 were salaried employees. The Company believes that its overall compensation and benefits for the most part meet industry averages and that its relations with its employees are good.
A significant number of the employees at two of the Company’s facilities are represented by labor unions and are covered by collective bargaining agreements. Two of the Company’s collective bargaining agreements cover the Company’s tool and die craftsmen and maintenance workers and its sheetmetal workers in Brea, California. These two contracts expire February 2011 and June 2012, respectively. Simpson Strong-Tie’s facility in Stockton, California, is also a union facility with two collective bargaining agreements, which cover its tool and die craftsmen and maintenance workers, and its sheetmetal workers. These two contracts will expire June 2011 and September 2011, respectively. See “Item 1A — Risk Factors.”
Available Information
The SEC maintains an internet site (http://www.sec.gov) that contains reports, proxy and information statements, and other information regarding issuers that file electronically with the SEC. The Company makes available, free of charge, copies of its recent annual report on Form 10-K, quarterly reports on Form 10-Q, current reports on Form 8-K, proxy statement, company governance guidelines and code of ethics and the charters of the Audit Committee, Compensation and Leadership Development Committee, and Governance and Nominating Committee of its Board of Directors on its website at www.simpsonmfg.com. Printed copies of any of these materials will be provided free of charge on request.
Item 1A. Risk Factors.
You should carefully consider the following risks before you decide to buy or hold shares of our common stock. If any of the following risks actually occurs, our business, results of operations or financial condition would likely suffer. In such case, the trading price of our common stock could decline, and you may lose all or part of the money you paid to buy our stock.
This and other public reports may contain forward-looking statements based on current expectations, assumptions, estimates and projections about us and our industry. Those forward-looking statements involve risks and uncertainties. Our actual results could differ materially from those forward-looking statements as a result of many factors, as more fully described below and elsewhere in our public reports. We do not undertake to update publicly any forward-looking statements for any reason, even if new information becomes available or other events occur in the future.
Worldwide economic conditions and credit tightening materially and adversely affect our business.
Our business has been materially and adversely affected by changes in regional, national or global economic conditions. Such changes have included or may include reduced consumer spending, reduced availability of capital, inflation, deflation, adverse changes in interest rates, reduced energy availability and increased energy costs, and government initiatives to manage economic conditions. Continuing instability in financial markets and the deterioration of other national and global economic conditions may have further materially adverse effects on our operations, financial results or liquidity, including the following:
· the financial stability of our customers or suppliers may be compromised, which could result in additional bad debts for us or non-performance by suppliers;
· financial instability of the financial institutions where we have our cash balances invested could result in loss of our principal balance;
· one or more of the financial institutions that make available our revolving credit facility may become unable to fulfill their funding obligations, which could materially and adversely affect our liquidity;
· it may become even more costly or difficult for us to obtain the agreed or additional financing or to refinance our existing credit facility; or
· our assets may be impaired or subject to write down or write off.
Uncertainty about current global economic conditions may cause consumers of our products to postpone or refrain from spending in response to tighter credit, negative financial news, declines in income or asset values, or other adverse economic events or conditions, which could materially reduce demand for our products and materially and adversely affect our financial condition and operating results. Further deterioration of economic conditions would likely exacerbate these adverse effects, result in wide-ranging, adverse and prolonged effects on general business conditions, and materially and adversely affect our operations, financial results and liquidity.
Failure to comply with industry regulations could result in reduced sales and increased costs.
The design, capacity and quality of most of our products and manufacturing processes are subject to numerous and extensive regulations and standards promulgated by governmental, quasi-governmental and industry organizations. These regulations and standards are highly technical, complex and subject to frequent revision. If our products or manufacturing processes fail to comply with any regulations or standards, we may not be able to manufacture and market our products profitably. Failure to comply with regulations and standards could therefore materially reduce our sales and increase our costs.
If we fail to compete effectively, our revenue and profit margins could decline.
We face a variety of competition in all of the markets in which we participate. Many of our competitors have greater financial and other resources than we do. In addition, other technologies may be the bases for competitive products that could render our products obsolete or noncompetitive. Other companies may find our markets attractive and enter those markets. Competitive pricing, including price competition or the introduction of new products, could have material adverse effects on our revenues and profit margins.
Our ability to compete effectively depends to a significant extent on the specification or approval of our products by architects, engineers, building inspectors, building code officials and customers. If a significant segment of those communities were to decide that the design, materials, manufacturing, testing or quality control of our products is inferior to that of any of our competitors, our sales and profits would be materially reduced.
If we lose all or part of a large customer, our sales and profits would decline.
We have substantial sales to a few large customers. Loss of all or part of our sales to a large customer would have a material adverse effect on our revenues and profits. Our largest customer accounted for 11% of net sales for the year ended December 31, 2009, and slightly less than 10% of net sales for the year ended December 31, 2008. In August 2007, this customer sold a division, which is now a separate customer of the Company. As a combined company in 2007, these two customers accounted for 15% of our net sales. As two separate customers, neither would have accounted for more than 10% of our consolidated net sales for 2007. See Note 14 to the Company’s Consolidated Financial Statements. This customer may endeavor to replace, in some or all markets, our products with lower-priced products supplied by others or may otherwise reduce its purchases of our products. We also might reduce our dependence on our largest customer by reducing or terminating sales to one or more of the customer’s subsidiaries. Any reduction in, or termination of, our sales to this customer would at least temporarily, and possibly longer, cause a material reduction in our net sales, income from operations and net income. A reduction in or elimination of our sales to our largest customer, or another of our larger customers, would increase our relative dependence on our remaining large customers.
In addition, our customers include retailers and distributors. Retail and distribution businesses have consolidated over time, which could increase the material adverse effect of losing any of them.
Increases in prices of raw materials could negatively affect our sales and profits.
Our principal raw material is steel, including stainless steel. The steel industry is highly cyclical. Numerous factors beyond our control, such as general economic conditions, competition, worldwide demand, material and labor costs, energy costs, foreign exchange rates, import duties and other trade restrictions, influence prices for our raw materials. Consolidation among domestic integrated steel producers, changes in supply and demand in steel markets, changes in foreign currency exchange rates and economic conditions, and other events have led to volatility in steel costs. The domestic steel market is heavily influenced by three major United States manufacturers. We have not always been able, and in the future we might not be able, to increase our product prices in amounts that correspond to increases in costs of raw materials, without materially and adversely affecting our sales and profits.
We have not attempted to hedge against changes in prices of steel or other raw materials. In recent years, however, we have increased our steel purchases in an effort to mitigate the effects of rising steel prices. At the same time, since 2007 our sales have declined with the declines in the housing and financial markets. As a result, our inventory fluctuated substantially. Inventory fluctuation can materially and adversely affect our margins, cash flow and profits.
If we cannot protect our technology, we will not be able to compete effectively.
Our ability to compete effectively with other companies depends in part on our ability to maintain the proprietary nature of our technology, in part through patents. We might not be able to protect or rely on our patents. Patents might not issue pursuant to pending patent applications. Others might independently develop the same or similar technology, develop around the patented aspects of any of our products or proposed products, or otherwise obtain access to or circumvent our proprietary technology. We also rely on unpatented proprietary technology to maintain our competitive position. We might not be able to protect our know-how or other proprietary information. If we are unable to maintain the proprietary nature of our significant products, our sales and profits could be materially reduced.
In attempting to protect our proprietary information, we sometimes initiate lawsuits against competitors and others that we believe have infringed or are infringing our rights. In such an event, the defendant may assert counterclaims to complicate or delay the litigation or for other reasons. Litigation may be very costly and may result in adverse judgments that affect our sales and profits materially and adversely.
Integrating acquired businesses may divert management’s attention away from our day-to-day operations.
We may pursue acquisitions of product lines or businesses. Acquisitions involve numerous risks, including, for example:
· difficulties assimilating the operations and products of acquired businesses;
· diversion of management’s attention from other business concerns;
· overvaluation of acquired businesses;
· undisclosed existing or potential liabilities of acquired businesses;
· slow acceptance or rejection of acquired businesses’ products by our customers;
· risks of entering markets in which we have little or no prior experience;
· litigation involving activities, properties or products of acquired businesses;
· consumer and other claims related to products of acquired businesses; and
· the potential loss of key employees of acquired businesses.
In addition, future acquisitions may cause us to issue additional equity securities that dilute the value of our existing equity securities, increase our debt, and cause impairment and amortization expenses related to goodwill and other intangible assets, which could materially and adversely affect our profitability. Any acquisition could materially and adversely affect our business and operating results.
Significant costs to integrate our acquired operations may negatively affect our financial condition and the market price of our stock.
We will incur costs from integrating acquired business operations, products and personnel. These costs may be significant and may include expenses and other liabilities for employee redeployment, relocation or severance, combining teams and processes in various functional areas, reorganization or closures of facilities, and relocation or disposition of excess equipment. The integration costs that we incur may negatively affect our profitability and the market price of our stock.
Our future growth may depend on our ability to penetrate new domestic and international markets, which could reduce our profitability.
International construction customs, standards, techniques and methods differ from those in the United States. Laws and regulations applicable in new markets may be unfamiliar to us. Compliance may be substantially more costly than we anticipate. As a result, we may need to redesign products, or invent or design new products, to compete effectively and profitably in new markets. We expect that we will need significant time, which may be years, to generate substantial sales or profits in new markets.
Other significant challenges to conducting business in foreign countries include, among other factors, local acceptance of our products, political instability, changes in import and export regulations, changes in tariff and freight rates, fluctuations in foreign exchange rates and currency controls. We might not be able to penetrate these markets and any market penetration that occurs might not be timely or profitable. If we do not penetrate these markets within a reasonable time, we will be unable to recoup part or all of the significant investments we will have made in attempting to do so.
Seasons and business cycles affect our operating results.
Our sales are seasonal, with operating results varying from quarter to quarter. With some exceptions, our sales and income have historically been lower in the first and fourth quarters than in the second and third quarters of the year, as customers purchase construction materials in the late spring and summer months for the construction season. In addition, weather conditions, such as unseasonably warm, cold or wet weather, which affect, and sometimes delay or accelerate, installation of some of our products, significantly affect our results of operations. Political and economic events can also affect our sales and profitability.
We have little control over the timing of customer purchases. Sales that we anticipate in one quarter may occur in another quarter, affecting both quarters’ results. In addition, we incur significant expenses as we develop, produce and market our products in anticipation of future orders. We maintain high inventory levels and typically ship orders as we receive them, so we operate with little backlog. As a result, net sales in any quarter generally depend on orders booked and shipped in that quarter. A significant portion of our operating expenses is fixed. Planned expenditures are based primarily on sales forecasts. When sales do not meet our expectations, our operating results will be reduced for the relevant quarters, as we will have already incurred expenses based on those expectations.
Our principal markets are in the building construction industry. That industry is subject to significant volatility due to real estate market cycles, fluctuations in interest rates, the availability, or lack thereof, of credit to builders and developers, inflation rates, weather, and other factors and trends. None of these factors or trends is within our control. Declines in commercial and residential construction, such as housing starts, and remodeling projects have reduced, and in the future can be expected to reduce, the demand for our products. Negative economic or construction industry performance adversely affects our business. Declines in construction activity or demand for our products have materially and adversely affected, and could in the future materially and adversely affect, our sales and profitability.
Product liability claims and product recalls could harm our reputation, sales and financial condition.
We design and manufacture most of our standard products and expect to continue to do so, although we buy raw materials and some manufactured products from others. We have on occasion found flaws and deficiencies in the manufacturing, design or testing of our products. We also have on occasion found flaws and deficiencies in raw materials and finished goods produced by others. Some flaws and deficiencies have not been apparent until after the products were installed by customers.
Many of our products are integral to the structural soundness or safety of the structures in which they are used. If any flaws or deficiencies exist in our products and if such flaws or deficiencies are not discovered and corrected before our products are incorporated into structures, the structures could be unsafe or could suffer severe damage, such as collapse or fire, and personal injury could result. Errors in the installation of our products, even if the products are free of flaws and deficiencies, could also cause personal injury and unsafe structural conditions. To the extent that such damage or injury is not covered by our product liability insurance and we are held to be liable, we could be required to correct such damage and to compensate persons who might have suffered injury, and our reputation, business and financial condition could be materially and adversely affected.
Even if a flaw or deficiency is discovered before any damage or injury occurs, we may need to recall products, and we may be liable for any costs necessary to replace recalled products or retrofit the affected structures. Any such recall or retrofit could entail substantial costs and adversely affect our reputation, sales and financial condition. We do not carry insurance against recall costs or the adverse business effect of a recall, and our product liability insurance may not cover retrofit costs.
Claims resulting from a natural disaster might be made against us with regard to damage or destruction of structures incorporating our products. Any such claims, if asserted, could materially and adversely affect our business and financial condition.
Complying or failing to comply with environmental, health and safety laws and regulations could affect us materially and adversely.
We are subject to environmental laws and regulations governing emissions into the air, discharges into water, and generation, handling, storage, transportation, treatment and disposal of waste materials. We are also subject to other federal and state laws and regulations regarding health and safety matters.
Our manufacturing operations involve the use of solvents, chemicals, oils and other materials that are regarded as hazardous or toxic. We also use complex and heavy machinery and equipment that can pose severe safety hazards, especially if not properly and carefully used. Some of our products also incorporate materials that are hazardous or toxic in some forms, such as zinc and lead used in some steel galvanizing processes and chemicals used in our acrylic and epoxy anchoring products. The gun powder used in our powder-actuated tools is explosive. Misuse of other materials in some of our products could also cause injury or sickness.
If we do not obtain all material licenses and permits required by environmental, health and safety laws and regulations, we may be subject to regulatory action by governmental authorities. If our policies and procedures do not comply in all respects with existing environmental, health and safety laws and regulations, our activities might violate such laws and regulations. Even if our policies and procedures do comply, but our employees fail or neglect to follow them in all respects, we might incur similar liability. Relevant laws and regulations could change or new ones could be adopted that require us to obtain additional licenses and permits and cause us to incur substantial expense.
Our generation, handling, use, storage, transportation, treatment or disposal of hazardous or toxic materials, machinery and equipment might cause injury to persons or to the environment. We may need to take remedial action if properties that we occupy are contaminated by hazardous or toxic substances.
Any change in laws or regulations, any legal or regulatory violations, or any contamination, could materially and adversely affect our business and financial condition.
New appliance efficiency standards could materially and adversely affect our operating results and financial condition.
The Department of Energy regulates energy efficiency under the authority of the National Appliance Energy Conservation Act. Under this Act, the Department of Energy periodically reviews the need for increased efficiency standards with respect to gas furnaces and gas water heaters. A substantial percentage of our Type B Gas Vent sales are for gas furnaces and gas water heaters. The Department of Energy might adopt minimum appliance efficiency standards that negatively affect sales of Type B Gas Vents, which could materially and adversely affect our operating results.
We depend on key management and technical personnel, the loss of whom could harm our business.
We depend on certain key management and technical personnel, including, among others, Thomas J Fitzmyers, Michael J. Herbert, Phillip “Terry” Kingsfather, Barclay Simpson, Stephen P. Eberhard, Karen Colonias and Jeffrey E. Mackenzie. The loss of one or more key employees could materially and adversely affect us.
Our success also depends on our ability to attract and retain additional highly qualified technical, marketing and management personnel necessary for the maintenance and expansion of our activities. We face strong competition for such personnel. We might not be able to attract or retain such personnel. In addition, when we experience periods with little or no profits, a decrease in compensation based on our profits may make it difficult to attract and retain highly qualified personnel.
Any work stoppage or interruption by employees could materially and adversely affect our business and financial condition.
A significant number of our employees are represented by labor unions and are covered by collective bargaining agreements that will expire in 2011 and 2012. A work stoppage or interruption by a significant number of our employees could have a material and adverse effect on our sales and profitability.
International operations expose us to foreign exchange rate risk.
We have foreign exchange rate risk in our international operations and through purchases from foreign vendors. We do not currently hedge this risk. Changes in currency exchange rates could materially and adversely affect our sales and profitability.
Natural disasters could decrease our manufacturing capacity.
Most of our current and planned manufacturing facilities are located in geographic regions that have experienced major natural disasters, such as earthquakes, floods and hurricanes. For example, the earthquakes in Northridge, California, in January 1994, destroyed several freeways and numerous buildings in the region in which our facilities in Brea are located. Our disaster recovery plan may not be adequate or effective. We do not carry earthquake insurance. Other insurance that we carry is limited in the risks covered and the amount of coverage. Our insurance would not be adequate to cover all of our resulting costs, business interruption and lost profits when a major natural disaster occurs. A natural disaster rendering one or more of our manufacturing facilities totally or partially unusable, whether or not covered by insurance, would materially and adversely affect our business and financial condition.
Control by our principal stockholder reduces the ability of other stockholders to influence management.
Barclay Simpson, the Chairman of our Board of Directors, controls approximately 20% of the outstanding shares of our common stock. Mr. Simpson and Thomas J Fitzmyers, our President and Chief Executive Officer (even though he owns less than 1% of the outstanding shares of our common stock), have significant influence with respect to the election of our directors and over some fundamental changes affecting us, such as a merger or sale of assets or amendment of our Certificate of Incorporation or Bylaws.
Additional financing, if needed, to fund our working capital, growth or acquisitions may not be available on reasonable terms, or at all.
If our cash requirements for working capital or to fund our growth increase to a level that exceeds the amount of cash that we generate from operations, or if we should decide to make an acquisition that requires more cash than we have available internally and through our current credit arrangements, we will need to seek additional resources. In that event, we may need to enter into additional or new borrowing arrangements or consider equity financing. Additional or new borrowings may not be available on reasonable terms, or at all, especially under current conditions in the financial markets. Our ability to raise money by selling and issuing shares of our common or preferred stock would depend on general market conditions and the demand for our stock. We may be unable to raise adequate capital on reasonable terms by selling stock. If we sell stock, our existing stockholders could experience substantial dilution. Our inability to secure additional financing could prevent the expansion of our business, internally and through acquisitions.
Any issuance of preferred stock may dilute your investment and reduce funds available for dividends.
Our Board of Directors is authorized by our Certificate of Incorporation to determine the terms of one or more series of preferred stock and to authorize the issuance of shares of any such series on such terms as our Board of Directors may approve. Any such issuance could be used to impede an acquisition of our business that our Board of Directors does not approve, further dilute the equity investments of holders of our common stock and reduce funds available for the payment of dividends to holders of our common stock.
Our stock price is likely to be volatile and could drop.
The trading price of our common stock could be subject to wide fluctuations in response to period to period variations in operating results, changes in earnings estimates by analysts, announcements of technological innovations or new products by us or our competitors, general conditions in the construction and construction materials industries, relatively low trading volume in our common stock and other events or factors. In addition, the stock market is subject to extreme price fluctuations. This volatility has had a substantial effect on the market prices of securities issued by many companies for reasons unrelated to the operating performance of those companies. Securities market fluctuations may materially and adversely affect the market price of our common stock.
Future sales of common stock could adversely affect our stock price.
Sales of substantial amounts of our common stock in the public market could adversely affect the prevailing market price for our common stock. All of the outstanding shares of our common stock are freely tradable without restriction under the Securities Act of 1933, other than 10.0 million shares held (as of February 9, 2010) by our “affiliates,” as that term is defined in Rule 144 under the Securities Act of 1933. Options to purchase 1.8 million shares of our common stock were outstanding as of December 31, 2009, including options to purchase 1.7 million shares that were exercisable. If a substantial number of shares were sold in the public market pursuant to Rule 144 or on exercise of options, the trading price of our common stock in the public market could be adversely affected.
Delaware law and our stockholder rights plan contain anti-takeover provisions that could deter takeover attempts that might otherwise be beneficial to our stockholders.
Provisions of Delaware law could make it more difficult for a third party to acquire us. Section 203 of the Delaware General Corporation Law may make the acquisition of Simpson Manufacturing Co., Inc. and the removal of incumbent officers and directors more difficult by prohibiting stockholders holding 15% or more of our outstanding voting stock from acquiring Simpson Manufacturing Co., Inc. without the consent of our Board of Directors for at least three years from the date they first hold 15% or more of the voting stock. Barclay Simpson and his affiliates are not subject to this provision of Delaware law with respect to their investment in Simpson Manufacturing Co., Inc. In addition, our Stockholder Rights Plan has significant anti-takeover effects by causing substantial dilution to a person or group that attempts to acquire us on terms not approved by our Board of Directors.
We are subject to a number of significant risks that might cause our actual results to vary materially from our plans, targets or projections, including:
· lack of market acceptance of new products;
· failing to develop new products with significant market potential;
· increased labor costs, including significant increases in worker’s compensation insurance premiums and health care benefits;
· failing to increase, or even maintain, sales and profits;
· failing to anticipate, appropriately invest in and effectively manage the human, information technology and logistical resources necessary to support the growth of our business, including managing the costs associated with such resources;
· failing to integrate, leverage and generate expected rates of return on investments, including expansion of existing businesses and expansion through acquisitions;
· failing to generate sufficient future positive operating cash flows and, if necessary, secure adequate external financing to fund our growth; and
· interruptions in service by common carriers that ship goods within our distribution channels.
If we change significantly the location, nature or extent of some of our manufacturing operations, we may reduce our net income.
If we decide to change significantly the location, nature or extent of a portion of our manufacturing operations, we may need to record an impairment of our goodwill. Our goodwill totaled $81.6 million at December 31, 2009. Recording an impairment of our goodwill correspondingly reduces our net income. In 2007, for example, we decided to move part of our Canadian manufacturing operations to China in 2008 or 2009, and as a result, we recorded a goodwill impairment of $10.7 million, which materially reduced our net income in 2007. Other changes or events in the future could further impair our recorded goodwill, which could also materially and adversely affect our profitability.
Impairment charges on goodwill or other intangible assets would adversely affect our financial position and results of operations.
We are required to perform impairment tests on our goodwill and other intangible assets annually or at any time when events occur that could affect the value of our business segments. To determine whether a goodwill impairment has occurred, we compare fair value of each of our reporting units with its carrying value. Significant and unanticipated changes in circumstances, such as significant adverse changes in business climate, adverse actions by regulatory authorities, unanticipated competition, loss of key customers or changes in technology or markets, can require a charge for impairment that can materially and adversely affect our reported net income and our stockholders’ equity. For example, in 2008, our annual impairment test resulted in goodwill impairment charge of $3.0 million associated with assets acquired in England in 1999 as part of our U.K. reporting unit. Our U.K. reporting unit’s carrying value exceeded its fair value, primarily due to reduced future expected net cash flows. If current adverse conditions in the home-building industry, the financial markets or the economy generally should continue longer than we expect, we may need to take further charges for impairment, which we are not now able to estimate, but which may be substantial.
Failure of our internal control over financial reporting could harm our business and financial results.
Our management is responsible for establishing and maintaining adequate internal control over financial reporting. Internal control over financial reporting is a process to provide reasonable assurance regarding the reliability of financial reporting for external purposes in accordance with accounting principles generally accepted in the United States. Internal control over financial reporting includes:
· maintaining records that in reasonable detail accurately and fairly reflect our transactions;
· providing reasonable assurance that transactions are recorded as necessary for preparation of the consolidated financial statements;
· providing reasonable assurance that receipts and expenditures of our assets are made in accordance with management authorization; and
· providing reasonable assurance that unauthorized acquisition, use or disposition of our assets that could have a material effect on our consolidated financial statements would be prevented or detected on a timely basis.
Because of the inherent limitations of internal control, our internal control over financial reporting might not detect or prevent misstatement of our consolidated financial statements. Our growth and entry into new, globally dispersed markets puts significant additional pressure on our system of internal control over financial reporting. Failure to maintain an effective system of internal control over financial reporting could limit our ability to report our financial results accurately and timely or to detect and prevent fraud.
Failure of our accounting systems could harm our business and financial results.
We have implemented a new commercially available Microsoft third-party accounting software system, initially focused on replacing our internally developed general ledger and purchasing and payables systems, for use in our operations in the United States, Europe and Asia. Any errors or defects in, or unavailability of, third-party software or our implementation of the systems, could result in errors in our financial statements, which could materially and adversely affect our business. If we continue to use our other internally developed accounting systems and they are not able to accommodate our future business needs, or if we find that they or any new systems we may implement contain errors or defects, our business and financial condition could be materially and adversely affected.
Our international operations may be materially and adversely affected by factors beyond our control.
Economic, social and political conditions, laws, practices and customs vary widely among the countries where we produce or sell our products. Our operations outside of the United States are subject to a number of risks and potential costs, including, for example, lower profit margins, less protection of intellectual property and economic, political and social uncertainty in some countries, especially in China and other emerging markets. Our sales and profits depend, in part, on our ability to develop and implement policies and strategies that effectively anticipate and manage these and other risks in the countries where we do business. These and other risks may have a material adverse effect on our operations in any particular country and on our business as a whole. Inflation in emerging markets also makes our products more expensive there and increases the market and credit risks to which we are exposed.
Our international operations depend on our successful management of our subsidiaries outside of the United States.
We conduct most of our international business through wholly owned subsidiaries. Managing distant subsidiaries and fully integrating them into our business is challenging. We cannot directly supervise every aspect of the operations of our subsidiaries operating outside the United States. As a result, we rely on local managers and staff. Cultural factors and language differences can result in misunderstandings among internationally dispersed personnel. The risk that unauthorized conduct may go undetected may be greater in subsidiaries outside of the United States. These problems could adversely affect our sales and profits.
Our manufacturing facilities in China complicate our inventory management.
We maintain manufacturing capability in various parts of the world, in part to allow us to serve our customers with prompt delivery of needed products. Such customer service is a significant factor in our efforts to compete with larger companies that have greater resources than we have. We have expanded, substantially, our manufacturing in China. Much of the output of our manufacturing in China is and will be intended for export to other parts of Asia and elsewhere. Because of the unusually great distances between our manufacturing facilities in China and the markets to which the products made there will be shipped, we may have difficulty providing adequate service to our customers, which may put us at a competitive disadvantage. Our attempts to provide prompt delivery may necessitate that in China we produce and keep on hand substantially more inventory of finished products than would otherwise be needed. Inventory increases can materially and adversely affect our margins, cash flow and net income.
If we fail to keep pace with advances in our industry or fail to persuade customers to adopt new products we introduce, customers may not buy our products, which would adversely affect our sales and profits.
Constant development of new technologies and techniques, frequent new product introductions and strong price competition characterize the construction industry. The first company to introduce a new product or technique to the market gains a competitive advantage. Our future growth depends, in part, on our ability to develop products that are more effective, safer, or incorporate emerging technologies better than our competitors’ products. Sales of our existing products may decline rapidly if a competitor were to introduce superior products, or even if we announce a new product of our own. If we fail to make sufficient investments in research and development or if we focus on technologies that do not lead to better products, our current and planned products could be surpassed by more effective or advanced products. If we fail to manufacture our products economically and market them successfully, our sales and profits would be materially and adversely affected.
Changes in accounting standards could materially and adversely affect our financial results.
The accounting rules applicable to public companies are subject to frequent revision. Future changes in accounting standards, guidance and interpretations could require us to change the way we measure revenue, expense or balance sheet amounts, which could result in material and adverse change to our reported results of operations or financial condition.
Climate change could materially and adversely affect our business.
Scientific reports indicate that, as a result of human activity:
· temperatures around the world have been increasing and are likely to continue to increase as a result of increasing atmospheric concentrations of carbon dioxide and other carbon compounds,
· the frequency and severity of storms, and flooding, are likely to increase,
· severe weather is likely to occur in places where the climate has historically been more mild, and
· average sea levels have risen and are likely to rise more, threatening worldwide coastal development.
We cannot predict the effects that these phenomena may have on our business. They might, for example:
· depress or reverse economic development,
· reduce the demand for construction,
· increase the cost and reduce the availability of fresh water,
· destroy forests, increasing the cost and reducing the availability of wood products used in construction,
· increase the cost and reduce the availability of raw materials and energy,
· increase the cost of capital,
· increase the cost and reduce the availability of insurance covering damage from natural disasters,
· lead to claims regarding the content or adequacy of our public disclosures, and
· lead to new laws and regulations that increase our expenses and reduce our sales.
Any of these consequences, and other consequences of climate change that we do not foresee, could materially and adversely affect our sales, profits and financial condition.
We are subject to U.S. and international tax laws that could affect our financial results.
We conduct international operations through our subsidiaries. Tax laws affecting international operations are complex and subject to change. Our income tax liabilities in the different countries where we operate depend in part on internal settlement prices and administrative charges among us and our subsidiaries. These arrangements require us to make judgments with which tax authorities may disagree. Tax authorities may impose additional tariffs, duties, taxes, penalties and interest on us. For example, we manufacture steel products in foreign countries for importation into the U.S. and other countries, and government agencies may impose substantial prospective or retroactive tariffs on such products. Transactions that we have arranged in light of current tax rules could have material and adverse consequences if tax rules change, and changes in tax rules or imposition of any new or increased tariffs, duties and taxes could materially and adversely affect our sales, profits and financial condition.
Contracts that we file as exhibits to our public reports contain recitals, representations and warranties that may not be factually correct.
Any recital, representation, warranty or other statement of purported fact in any contract, agreement or similar instrument that we file as an exhibit to this or any other report may not be true or complete, either at the date of such instrument or at any later time. Even if such statements were accurate when made, they may not be accurate when we file the instrument as an exhibit to any of our reports. The parties to such instruments did not intend such statements to establish or confirm any facts, but intended such statements to allocate contractual risk between the parties. Such instruments may be subject to standards of materiality that differ from the standards applicable to our reports. In addition, such statements may have been qualified by schedules and other disclosures that we have not filed with (or incorporated by reference into) this or any other report or document. In reviewing any of our reports, you should rely on the text of the report, which we believed was complete and correct in all material respects when we filed the report. You should not assume that any statement of purported fact in any such instrument is accurate or complete, because such an assumption could result in misapprehension of the facts and circumstances.
If we are unable to protect our information systems against data corruption, cyber-based attacks or network security breaches, our operations could be disrupted.
We depend on information technology networks and systems, including the Internet, to process, transmit and store electronic information. We depend on our information technology infrastructure for electronic communications among our locations around the world and between our personnel and our subsidiaries, customers and suppliers. Security breaches of this infrastructure could create system disruptions, shutdowns or unauthorized disclosure of confidential information. Security breaches could disrupt our operations, and we could suffer financial damage or loss because of lost or misappropriated information.
Item 1B. Unresolved Staff Comments.
None.
Item 2. Properties.
The Company owns its home office in Pleasanton, California, and its principal United States manufacturing facilities in Stockton and Brea, California, McKinney, Texas, and Columbus, Ohio. The principal manufacturing facilities located outside the United States, the majority of which are owned, are in Canada, the United Kingdom, France, Denmark and China. The Company also owns and leases smaller manufacturing facilities, warehouses, research and development facilities and sales offices throughout the United States, Europe, Australia, Asia and the Middle East. As of February 26, 2010, the Company’s owned and leased facilities were as follows:
|
|
|
Number |
|
|
|
|
|
|
|
|
|
|
Of |
|
Approximate Square Footage |
|
||||
|
|
|
Properties |
|
Owned |
|
Leased |
|
Total |
|
|
|
|
|
|
(in thousands of square feet) |
|
||||
|
Connectors |
|
|
|
|
|
|
|
|
|
|
United States |
|
27 |
|
2,174 |
|
491 |
|
2,665 |
|
|
International |
|
23 |
|
682 |
|
301 |
|
983 |
|
|
Venting |
|
|
|
|
|
|
|
|
|
|
United States |
|
4 |
|
581 |
|
64 |
|
645 |
|
|
Administrative and all other |
|
1 |
|
89 |
|
— |
|
89 |
|
|
Total |
|
55 |
|
3,526 |
|
856 |
|
4,382 |
|
The Company’s properties are constructed primarily of steel, brick or concrete and, in management’s opinion, are maintained in good operating condition. The Company’s manufacturing facilities are equipped with specialized equipment and use extensive automation. The Company considers its existing and planned facilities to be suitable and adequate for its operations as currently conducted and as planned through 2010. The Company’s leased facilities typically have renewal options and have expiration dates through 2019. The Company believes it will be able to extend leases on its various facilities as necessary, as they expire. The manufacturing facilities currently are being operated with one full shift. The Company anticipates that it may require additional facilities to accommodate possible future growth.
The Company has classified its facility in San Leandro, California, as an asset held for sale. The Company intends to sell its facility in Vicksburg, Mississippi, and will close it at that time. On the sale of either facility, if it is sold below its carrying value, the Company will record an impairment charge equal to the amount by which its carrying value exceeds its net realized value.
The Company expects, in March 2010, to acquire a facility in San Bernadino, California, in which it will consolidate its owned manufacturing and warehouse facilities in Brea, California, and its leased warehouse in Ontario, California. The Company intends to sell the Brea facilities. The relocation is planned to be completed in late 2010 or in 2011.
Item 3. Legal Proceedings.
From time to time, the Company is involved in various legal proceedings and other matters arising in the normal course of business.
Four lawsuits (the “Hawaii Cases”) have been filed against the Company in the Hawaii First Circuit Court: Alvarez v. Haseko Homes, Inc. and Simpson Manufacturing, Inc., Civil No. 09-1-2697-11 (“Hawaii Case 1”); Ke Noho Kai Development, LLC v. Simpson Strong-Tie Company, Inc., and Honolulu Wood Treating Co., LTD., Hawaii Case No. 09-1-1491-06 SSM (“Hawaii Case 2”); North American Specialty Ins. Co. v. Simpson Strong-Tie Company, Inc. and K.C. Metal Products, Inc., Case No. 09-1-1490-06 VSM (“Hawaii Case 3”); and Charles et al. v. Haseko Homes, Inc. et al. and Third Party Plaintiffs Haseko Homes, Inc. et al. v Simpson Strong-Tie Company, Inc., et al., Civil No. 09-1-1932-08 (“Hawaii Case 4”). Hawaii Case 1 was filed on November 18, 2009. Hawaii Cases 2 and 3 were originally filed on June 30, 2009. Hawaii Case 4 was filed on August 19, 2009. The Hawaii Cases all relate to alleged premature corrosion of the Company’s strap tie holdown products installed in buildings in a housing development known as Ocean Pointe in Honolulu, Hawaii, allegedly causing property damage. Hawaii Case 1 is a putative class action brought by the owners of allegedly affected Ocean Pointe houses. Hawaii Case 1 was originally filed as Kai et al. v. Haseko Homes, Inc., Haseko Construction, Inc. and Simpson Manufacturing, Inc., Case No. 09-1-1476, but was voluntarily dismissed and then re-filed with a new representative plaintiff. Hawaii Case 2 is an
action by the builders and developers of Ocean Pointe against the Company, claiming that either the Company’s strap tie holdowns are defective in design or manufacture or the Company failed to provide adequate warnings regarding the products’ susceptibility to corrosion in certain environments. Hawaii Case 3 is a subrogation action brought by the insurance company for the builders and developers against the Company claiming the insurance company expended funds to correct problems allegedly caused by the Company’s products. Hawaii Case 4, like Hawaii Case 1, is a putative class action brought by owners of allegedly affected Ocean Pointe homes. In Hawaii Case 4, Haseko Homes, Inc. (“Haseko”), the developer of the Ocean Pointe development, has brought a third party complaint against the Company alleging that any damages for which Haseko may be liable are actually the fault of the Company. None of the Hawaii Cases alleges a specific amount of damages sought, although each of the Hawaii Cases seeks compensatory damages, and Hawaii Case 1 seeks punitive damages. The Company is currently investigating the facts underlying the claims asserted in the Hawaii Cases, including, among other things, the cause of the alleged corrosion; the severity of any problems shown to exist; the buildings affected; the responsibility of the general contractor, various subcontractors and other construction professionals for the alleged damages; the amount, if any, of damages suffered; and the costs of repair, if needed. At this time, the likelihood that the Company will be found liable for any property damage allegedly suffered and the extent of such liability, if any, are unknown. Based on facts currently known to the Company, the Company believes that all or part of the claims alleged in the Hawaii Cases may be covered by its insurance policies. The Company intends to defend itself vigorously in connection with the Hawaii Cases.
The Company is not engaged in any other legal proceedings as of the date hereof, which the Company expects individually or in the aggregate to have a material adverse effect on the Company’s financial condition, cash flows or results of operations. The resolution of claims and litigation, however, is subject to inherent uncertainty and could have a material adverse effect on the Company’s financial condition, cash flows or results of operations.
Item 4. Submission of Matters to a Vote of Security Holders.
No matters were submitted to a vote of security holders during the fourth quarter of the fiscal year covered by this report.
PART II
Item 5. Market for Registrant’s Common Equity, Related Stockholder Matters and Issuer Purchases of Equity Securities.
The Company’s common stock is listed on the New York Stock Exchange (“NYSE”) under the symbol “SSD.” The following table shows the range of high and low closing sale prices per share of the common stock as reported by the NYSE and dividends paid per share of common stock for the calendar quarters indicated:
|
|
|
Market Price |
|
Dividends |
|
|||||
|
|
|
High |
|
Low |
|
Paid |
|
|||
|
Quarter |
|
|
|
|
|
|
|
|||
|
2009 |
|
|
|
|
|
|
|
|||
|
Fourth |
|
$ |
27.31 |
|
$ |
23.39 |
|
$ |
0.10 |
|
|
Third |
|
29.60 |
|
20.10 |
|
0.10 |
|
|||
|
Second |
|
24.08 |
|
17.98 |
|
0.10 |
|
|||
|
First |
|
27.65 |
|
13.80 |
|
0.10 |
|
|||
|
2008 |
|
|
|
|
|
|
|
|||
|
Fourth |
|
$ |
29.23 |
|
$ |
19.70 |
|
$ |
0.10 |
|
|
Third |
|
31.90 |
|
20.72 |
|
0.10 |
|
|||
|
Second |
|
28.25 |
|
23.26 |
|
0.10 |
|
|||
|
First |
|
28.43 |
|
22.97 |
|
0.10 |
|
|||
The Company estimates that as of February 9, 2010, approximately 12,000 persons beneficially owned shares of the Company’s common stock either directly or through nominees.
In February 2010, the Company’s Board of Directors declared a dividend of $0.10 per share to be paid on April 29, 2010, to stockholders of record on April 8, 2010. The Company began declaring quarterly dividends of $0.05 per common share in January 2004. Future dividends, if any, will be determined by the Company’s Board of Directors, based on the Company’s earnings, cash flows, financial condition and other factors deemed relevant by the Board of Directors.
In December 2009, the Board of Directors authorized the Company to repurchase up to $50.0 million of the Company’s common stock. The authorization will remain in effect through the end of 2010. This replaces the $50.0 million repurchase authorization from December 2008. The Company did not repurchase any shares in 2009 or 2008. In February 2007, the Company repurchased 122,500 shares of its common stock for $4.2 million, which the Company retired in March 2007, with the excess over the par value of the repurchased shares recorded against retained earnings.
The following table sets forth certain information as of December 31, 2009, concerning (a) all equity compensation plans of the Company previously approved by the stockholders and (b) all equity compensation plans of the Company not previously approved by the stockholders.
|
|
|
|
|
|
|
(c) |
|
|
|
|
|
|
|
|
|
Number of |
|
|
|
|
|
(a) |
|
|
|
securities remaining |
|
|
|
|
|
Number of securities |
|
(b) |
|
available for future |
|
|
|
|
|
to be issued |
|
Weighted-average |
|
issuance under equity |
|
|
|
|
|
on exercise of |
|
exercise price of |
|
compensation plans |
|
|
|
|
|
outstanding options, |
|
outstanding options, |
|
(excluding securities |
|
|
|
Plan Category |
|
warrants & rights |
|
warrants & rights |
|
reflected in column (a)) |
|
|
|
|
|
|
|
|
|
|
|
|
|
Equity compensation plans approved by stockholders |
|
1,792,160 |
(1) |
$ |
31.31 |
|
7,295,223 |
(2) |
|
|
|
|
|
|
|
|
|
|
|
Equity compensation plans not approved by stockholders |
|
0 |
|
N/A |
|
83,400 |
(3) |
|
|
|
|
|
|
|
|
|
|
|
|
Total |
|
1,792,160 |
|
$ |
31.31 |
|
7,378,623 |
|
(1) Excludes an additional 148,000 shares subject to options granted under the Company’s 1994 Stock Option Plan on February 2, 2010.
(2) Includes 148,000 shares subject to options granted under the Company’s 1994 Stock Option Plan on February 2, 2010.
(3) Excludes an additional 10,300 shares issued on January 4, 2010, under the Company’s 1994 Employee Stock Bonus Plan. As of December 31, 2009, the Company had reserved 200,000 shares of common stock for issuance as bonuses under the 1994 Employee Stock Bonus Plan, of which 116,600 shares had been issued.
Company Stock Price Performance
The graph below compares the cumulative total stockholder return on the Company’s common stock from December 31, 2004, through December 31, 2009, with the cumulative total return on the S & P 500 Index and the Dow Jones Building Materials Index over the same period (assuming the investment of $100 in the Company’s common stock and in each of the indices on December 31, 2004, and reinvestment of all dividends).
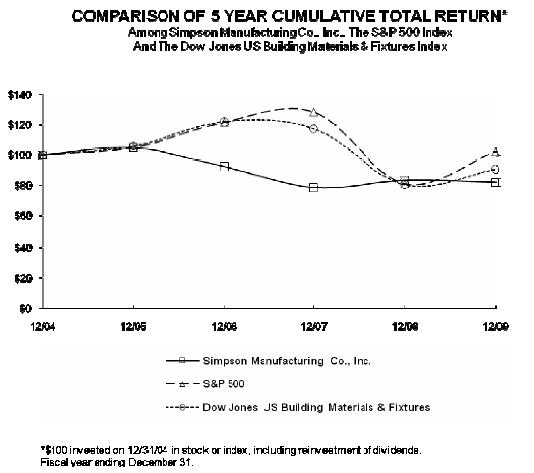
Item 6. Selected Financial Data.
The following table sets forth selected consolidated financial information with respect to the Company for each of the five years ended December 31, 2009, 2008, 2007, 2006 and 2005 (presented in thousands, except per share amounts), derived from the audited Consolidated Financial Statements of the Company, the most recent three years of which appear elsewhere herein. The Company adopted the revised business combinations guidance codified as the “Business Combinations” topic and the revised guidance in the “Income Taxes” topic of the Financial Accounting Standards Board (“FASB”) Accounting Standards CodificationTM (“ASC”) regarding the accounting for the uncertainty in income taxes, on January 1, 2009, and January 1, 2007, respectively. The selected consolidated statement of operations data for the year ended December 31, 2006, and the consolidated balance sheet data as of December 31, 2005, have been recast for the retrospective application of new accounting guidance for noncontrolling interests in a consolidated subsidiary, to which the Company became subject beginning January 1, 2009. The presentation of the information in the tables below complies with the accounting pronouncements, but is not necessarily comparable with prior years. These results include acquired company results of operations beginning on the dates of acquisition. For a summary of recent acquisitions, see “Note 2 — Acquisitions” to the consolidated financial statements included herein. The data presented below should be read in conjunction with the Consolidated Financial Statements and related Notes thereto and “Item 7 — Management’s Discussion and Analysis of Financial Condition and Results of Operations” included elsewhere herein.
|
|
|
Years Ended December 31, |
|
|||||||||||||
|
|
|
2009 |
|
2008 |
|
2007 |
|
2006 |
|
2005 |
|
|||||
|
Statement of Operations Data: |
|
|
|
|
|
|
|
|
|
|
|
|||||
|
Net sales |
|
$ |
585,070 |
|
$ |
756,499 |
|
$ |
816,988 |
|
$ |
863,180 |
|
$ |
846,256 |
|
|
Cost of sales |
|
391,496 |
|
474,190 |
|
511,499 |
|
517,885 |
|
515,420 |
|
|||||
|
Gross profit |
|
193,574 |
|
282,309 |
|
305,489 |
|
345,295 |
|
330,836 |
|
|||||
|
|
|
|
|
|
|
|
|
|
|
|
|
|||||
|
Research and development and other engineering expense |
|
19,993 |
|
21,327 |
|
20,115 |
|
19,254 |
|
14,573 |
|
|||||
|
Selling expense |
|
64,294 |
|
80,703 |
|
75,954 |
|
72,199 |
|
64,317 |
|
|||||
|
General and administrative expense |
|
79,880 |
|
89,897 |
|
88,618 |
|
91,975 |
|
100,261 |
|
|||||
|
Impairment of goodwill |
|
— |
|
2,964 |
|
10,666 |
|
— |
|
— |
|
|||||
|
Loss (gain) on sale of assets |
|
797 |
|
(124 |
) |
(713 |
) |
457 |
|
(2,044 |
) |
|||||
|
Income from operations |
|
28,610 |
|
87,542 |
|
110,849 |
|
161,410 |
|
153,729 |
|
|||||
|
|
|
|
|
|
|
|
|
|
|
|
|
|||||
|
Income (loss) in equity method investment, before tax |
|
(194 |
) |
(486 |
) |
(33 |
) |
(97 |
) |
284 |
|
|||||
|
Interest income, net |
|
75 |
|
2,596 |
|
5,759 |
|
3,719 |
|
1,551 |
|
|||||
|
Income before income taxes |
|
28,491 |
|
89,652 |
|
116,575 |
|
165,032 |
|
155,564 |
|
|||||
|
|
|
|
|
|
|
|
|
|
|
|
|
|||||
|
Provision for income taxes |
|
16,274 |
|
35,718 |
|
47,833 |
|
62,370 |
|
57,170 |
|
|||||
|
Net income attributable to non-controlling interest |
|
— |
|
— |
|
— |
|
166 |
|
— |
|
|||||
|
Net income attributable to Simpson Manufacturing Co., Inc. stockholders |
|
$ |
12,217 |
|
$ |
53,934 |
|
$ |
68,742 |
|
$ |
102,496 |
|
$ |
98,394 |
|
|
|
|
|
|
|
|
|
|
|
|
|
|
|||||
|
Basic net income per share of common stock attributable to Simpson Manufacturing Co., Inc. stockholders |
|
$ |
0.25 |
|
$ |
1.11 |
|
$ |
1.42 |
|
$ |
2.12 |
|
$ |
2.05 |
|
|
|
|
|
|
|
|
|
|
|
|
|
|
|||||
|
Diluted net income per share of common stock attributable to Simpson Manufacturing Co., Inc. stockholders |
|
$ |
0.25 |
|
$ |
1.10 |
|
$ |
1.40 |
|
$ |
2.10 |
|
$ |
2.02 |
|
|
|
|
|
|
|
|
|
|
|
|
|
|
|||||
|
Cash dividends declared per share of common stock |
|
$ |
0.40 |
|
$ |
0.40 |
|
$ |
0.40 |
|
$ |
0.32 |
|
$ |
0.23 |
|
|
|
|
December 31, |
|
|||||||||||||
|
|
|
2009 |
|
2008 |
|
2007 |
|
2006 |
|
2005 |
|
|||||
|
Balance Sheet Data: |
|
|
|
|
|
|
|
|
|
|
|
|||||
|
Working capital |
|
$ |
458,607 |
|
$ |
455,703 |
|
$ |
438,538 |
|
$ |
399,082 |
|
$ |
342,496 |
|
|
Property, plant and equipment, net |
|
187,814 |
|
193,318 |
|
198,117 |
|
197,180 |
|
166,480 |
|
|||||
|
Total assets |
|
843,805 |
|
830,200 |
|
817,679 |
|
735,334 |
|
659,715 |
|
|||||
|
Line of credit and long-term debt, including current portion |
|
— |
|
26 |
|
1,029 |
|
665 |
|
5,114 |
|
|||||
|
Total liabilities |
|
80,021 |
|
81,174 |
|
94,279 |
|
82,459 |
|
96,249 |
|
|||||
|
Non-controlling interest |
|
— |
|
— |
|
— |
|
— |
|
5,337 |
|
|||||
|
Total Simpson Manufacturing Co., Inc. stockholders’ equity |
|
763,784 |
|
749,026 |
|
723,400 |
|
652,875 |
|
558,129 |
|
|||||
Item 7. Management’s Discussion and Analysis of Financial Condition and Results of Operations.
This document contains forward-looking statements, based on numerous assumptions and subject to risks and uncertainties. Although the Company believes that the forward-looking statements are reasonable, it does not and cannot give any assurance that its beliefs and expectations will prove to be correct. Many factors could significantly affect the Company’s operations and cause the Company’s actual results to be substantially different from the Company’s expectations. See “Item 1A - Risk Factors.” Actual results might differ materially from results suggested by any forward-looking statements in this report. The Company does not have an obligation to publicly update any forward-looking statements, whether as a result of the receipt of new information, the occurrence of future events or otherwise.
The following is a discussion and analysis of the consolidated financial condition and results of operations for the Company for the years ended December 31, 2009, 2008 and 2007, and of certain factors that may affect the Company’s prospective financial condition and results of operations. The following should be read in conjunction with the Consolidated Financial Statements and related Notes appearing elsewhere herein.
Overview
The Company’s net sales decreased to $585.1 million in 2009 from $817.0 million in 2007, reflecting slower homebuilding activity. Net sales decreased in 2009 from 2007 in all regions of the United States, with above-average rates of decline in California and the western portions of the country, and net sales to home centers decreased significantly over the same period. Expansion into international markets helped to offset in part the sales decline in the United States over the last three years. Sales outside of the United States have increased, due in part to the acquisitions of:
· Certain assets of Liebig International Ltd., an Irish company, Heinrich Liebig Stahldübelwerke GmbH, Liebig GmbH & Co. KG and Liebig International Verwaltungsgesellschaft GmbH, all German companies, Liebig Bolts Limited, an English company, and Liebig International Inc., a Virginia corporation (collectively “Liebig”), in April 2008,
· Ahorn-Geräte & Werkzeuge Vertriebs GmbH, a German company, and its subsidiaries Ahorn Upevnovaci Technika s.r.o., a Czech company, and Ahorn Pacific Fasteners (Kunshan) Co., Ltd., a Chinese company (collectively “Ahorn”), in July 2008, and
· Agence Internationale Commerciale et Industrielle, S.A.S., a French company (“Aginco”), in April 2009.
Gross profit margin decreased to 33.1% in 2009 from 37.4% in 2007 primarily due to increased costs of steel and other materials, a higher proportion of fixed overhead costs and higher distribution costs, partly offset by reduced labor costs.
In recent years, home center sales have declined, although at a lower rate than the Company’s consolidated net sales. A large part of the home center sales was sales to The Home Depot, which exceeded 10% of the Company’s consolidated net sales in the years ended December 31, 2009, and 2007, but not in the year ended December 31, 2008. (see “Item 1A — Risk Factors” and Note 14 to the Company’s Consolidated Financial Statements). Consolidation of retailers and distributors has occurred over time. While the consolidation of these large retailers and distributors provides the Company with opportunities for growth, the increasing size and importance of individual customers exposes Simpson Strong-Tie to potential over-dependence. The loss of any of the larger home centers and distributors as customers would have a material adverse effect on SST, unless and until either such customers are replaced or SST makes the necessary adjustments (if possible) to compensate for the loss of business.
Results of Operations
The following table sets forth, for the years indicated, the percentage of net sales of certain items in the Company’s Consolidated Statements of Operations.
|
|
|
Years Ended December 31, |
|
||||
|
|
|
2009 |
|
2008 |
|
2007 |
|
|
Net sales |
|
100.0 |
% |
100.0 |
% |
100.0 |
% |
|
Cost of sales |
|
66.9 |
% |
62.7 |
% |
62.6 |
% |
|
Gross profit |
|
33.1 |
% |
37.3 |
% |
37.4 |
% |
|
Research and development and other engineering |
|
3.4 |
% |
2.8 |
% |
2.5 |
% |
|
Selling expense |
|
11.0 |
% |
10.7 |
% |
9.3 |
% |
|
General and administrative expense |
|
13.7 |
% |
11.9 |
% |
10.8 |
% |
|
Impairment of goodwill |
|
— |
|
0.4 |
% |
1.3 |
% |
|
Loss (gain) on sale of assets |
|
0.1 |
% |
— |
|
(0.1 |
)% |
|
Income from operations |
|
4.9 |
% |
11.5 |
% |
13.6 |
% |
|
Income (loss) in equity method investment |
|
— |
|
(0.1 |
)% |
— |
|
|
Interest income, net |
|
— |
|
0.4 |
% |
0.7 |
% |
|
Income before income taxes |
|
4.9 |
% |
11.8 |
% |
14.3 |
% |
|
Provision for income taxes |
|
2.8 |
% |
4.7 |
% |
5.9 |
% |
|
Net income |
|
2.1 |
% |
7.1 |
% |
8.4 |
% |
In December 2009, the Board of Directors authorized the Company to repurchase up to $50.0 million of the Company’s common stock. The authorization will remain in effect through the end of 2010. This replaced the $50.0 million repurchase authorization from December 2008. The Company made no repurchases during 2009 or 2008. In February 2007, the Company repurchased 122,500 shares of its common stock for $4.2 million, which the Company retired in March 2007.
Comparison of the Years Ended December 31, 2009 and 2008
Consolidated Company
Net Sales
In 2009, net sales decreased 22.7% to $585.1 million compared to net sales of $756.5 million for 2008. In 2009, sales declined throughout the United States. The western and southeastern regions had the largest decreases in sales. Sales decreased overall during the year in Europe and Canada. Simpson Strong-Tie’s sales for 2009 decreased 22.2% from 2008, while Simpson Dura-Vent’s sales decreased 26.6%. Simpson Strong-Tie’s sales to contractor distributors and dealer distributors decreased as a result of the weakness in the U.S. housing market. Sales to home centers also decreased. Sales decreased across all of Simpson Strong-Tie’s major product lines, particularly those used in new home construction. Sales of Simpson Dura-Vent’s Direct-Vent and gas vent, hearth and pellet vent product lines decreased, while sales of special gas vent and relining products increased, primarily as a result of the acquisition of ProTech Systems, Inc. in June 2008.
Gross Profit
Gross profit decreased 31.4% from $282.3 million in 2008 to $193.6 million in 2009. As a percentage of net sales, gross profit decreased from 37.3% in 2008 to 33.1% in 2009. The decrease in gross margins was primarily due to reduced absorption of fixed overhead, as a result of lower production volumes, as well as higher manufacturing costs, including higher costs of material and labor. The Company continues to face uncertainty in the cost and availability of steel. Several factors are contributing to this uncertainty. The price of steel, the Company’s primary raw material, increased in the second half of 2009. The Company expects steel prices to continue to increase into 2010 as demand returns to the market. The steel market continues to be dynamic, however, with a high degree of uncertainty about future pricing trends. If steel prices increase and the Company is not able to maintain its prices or increase them sufficiently, the Company’s margins could deteriorate further.
Research and Development and Other Engineering Expense
Research and development and other engineering expense decreased 6.3% from $21.3 million in 2008 to $20.0 million in 2009, primarily due to a $0.9 million decrease in professional service fees and a $0.8 million decrease in personnel expenses, partly offset by various other items.
Selling Expense
Selling expense decreased 20.3% from $80.7 million in 2008 to $64.3 million in 2009. This decrease resulted primarily from a $9.3 million decrease in expenses associated with sales and marketing personnel, most of which was related to cost-cutting measures, a $4.3 million decrease in promotional expenditures and a $1.9 million decrease in commissions paid to selling agents.
General and Administrative Expense
General and administrative expense decreased 11.1% from $89.9 million in 2008 to $79.9 million in 2009. This decrease resulted primarily from a $6.1 million decrease in cash profit sharing, a $2.4 million decrease in administrative personnel expenses, related in part to cost-cutting measures, a $1.6 million decrease in legal and professional service expenses and a $1.0 million decrease in the provision for bad debt, partly offset by a $1.1 million increase in amortization of intangible assets, primarily related to the businesses acquired since June 2008.
Stock Option Expense
The Company believes that the pre-tax stock option expense for 2010 will be $0.9 million related to stock options granted during 2006, 2007, 2008, 2009 and through February 2010.
Interest Income and Expense
Interest income is generated on the Company’s cash and cash equivalents balances. Interest income decreased primarily as a result of lower interest rates. Interest expense includes interest, account maintenance fees and bank charges.
Provision for Income Taxes
The effective tax rate was 57.1% in 2009, up from 39.8% in 2008. The effective tax rate is higher than the statutory rate primarily due to the valuation allowances taken on foreign losses, differences between the U.S. statutory tax rate and the local tax rate in countries where the Company operates and a reduced benefit from the reduction or loss of enterprise zone tax credits at two of the Company’s facilities in California.
Connector Products — Simpson Strong-Tie (SST)
Simpson Strong-Tie’s income from operations decreased 63.1% from $91.6 million in 2008 to $33.8 million in 2009.
Net Sales
Simpson Strong-Tie’s net sales decreased 22.2% from $676.7 million in 2008 to $526.5 million in 2009. SST accounted for 90.0% of the Company’s total net sales in 2009, a slight increase from 89.5% in 2008. The decrease in net sales at SST resulted from a decrease in sales volume, partly offset by an increase in average prices of 9.9%. In 2009, sales declined throughout the United States, with above-average decreases in the western and southeastern regions. Sales decreased overall during the year in Europe and Canada. Simpson Strong-Tie’s sales to contractor distributors and dealer distributors decreased as a result of the weakness in the U.S. housing market. Sales to home centers also decreased. Sales decreased across all of Simpson Strong-Tie’s major product lines, particularly those used in new home construction.
Gross Profit
Simpson Strong-Tie’s gross profit decreased 32.3% from $272.2 million in 2008 to $184.4 million in 2009. As a percentage of net sales, gross profit decreased from 40.2% in 2008 to 35.0% in 2009. This decrease was primarily due to higher manufacturing costs, including material and labor costs, and higher fixed overhead costs as a percentage of sales, as a result of the lower sales volume.
Research and Development and Other Engineering Expense
Simpson Strong-Tie’s research and development and other engineering expenses decreased 6.9% from $20.1 million in 2008 to $18.8 million in 2009, primarily due to a $1.0 million decrease in professional service fees and a $0.8 million decrease in personnel expenses, partly offset by various other items.
Selling Expense
Simpson Strong-Tie’s selling expense decreased 19.9% from $73.4 million in 2008 to $58.8 million in 2009, primarily due to a $9.0 million decrease in expenses associated with sales and marketing personnel, most of which was related to cost-cutting measures, a $4.3 million decrease in promotional expenditures, and a $0.5 million decrease in professional service fees.
General and Administrative Expense
Simpson Strong-Tie’s general and administrative expense decreased 14.3% from $84.3 million in 2008 to $72.2 million in 2009. This decrease resulted primarily from a $6.0 million decrease in cash profit sharing, a $3.3 million decrease in administrative personnel expenses, related in part to cost-cutting measures, a $1.5 million decrease in legal and professional service expenses, a $1.2 million decrease in the provision for bad debt and a $1.1 million decrease in information technology expenses, partly offset by a $0.7 million increase in amortization of intangible assets, primarily related to the businesses acquired since June 2008.
European Operations
For its European operations, Simpson Strong-Tie recorded after-tax loss of $11.4 million in 2009 compared to after-tax loss of $3.7 million in 2008. The 2009 loss was primarily related to the continuing integration costs associated with acquisitions since April 2008.
Venting Products — Simpson Dura-Vent (SDV)
Simpson Dura-Vent’s loss from operations increased 47.5% to $3.9 million in 2009 from $2.6 million in 2008.
Net Sales
Simpson Dura-Vent’s net sales decreased 26.6% from $79.8 million in 2008 to $58.5 million in 2009. SDV accounted for 10.0% of the Company’s total net sales in 2009, a slight decrease from 10.5% in 2008. The decrease in net sales at SDV resulted from a decrease in sales volume, partly offset by price increases that averaged 3.7%. In 2009, sales declined throughout the United States, with above-average decreases in the northeastern region. Sales of Simpson Dura-Vent’s Direct-Vent and gas vent, hearth and pellet vent product lines decreased, while sales of special gas vent and relining products increased, primarily as a result of the acquisition of ProTech in June 2008.
Gross Profit
Simpson Dura-Vent’s gross profit decreased 9.6% from $10.4 million in 2008 to $9.4 million in 2009. As a percentage of net sales, gross profit increased from 13.0% in 2008 to 16.0% in 2009. This increase was primarily due to lower fixed overhead costs as a percentage of net sales, partly offset by higher material costs.
Selling Expense
Simpson Dura-Vent’s selling expense decreased 23.5% from $7.2 million in 2008 to $5.5 million in 2009, primarily due to a $1.4 million decrease in commissions paid to selling agents, a $0.3 million decrease in promotional expenditures and a $0.2 million decrease in expenses associated with sales and marketing personnel, most of which was related to cost-cutting measures.
General and Administrative Expense
Simpson Dura-Vent’s general and administrative expense increased 40.0% to $6.5 million in 2009 from $4.6 million in 2008 primarily due to increases in intangible amortization expense of $0.5 million, primarily related to the businesses acquired since June 2008, and various other items.
Administrative and All Other (Company)
Interest Income and Expense
Interest income is generated on the Company’s cash and cash equivalents balances. Interest income decreased primarily as a result of lower interest rates. Interest expense includes interest, account maintenance fees and bank charges.
Comparison of the Years Ended December 31, 2008 and 2007
Consolidated Company
Net Sales
In 2008, net sales decreased 7.4% to $756.5 million compared to net sales of $817.0 million for 2007. In 2008, sales declined throughout the United States, with the exception of the northeastern region of the country. California and the western states had the largest decrease in sales. Sales during the year in continental Europe, Canada and Asia increased, while sales were down in the United Kingdom. Simpson Strong-Tie’s sales to contractor distributors had the largest percentage rate decrease and sales to dealer distributors and home centers also decreased. Reflecting the deterioration of construction markets and economic conditions generally, sales decreased across all of Simpson Strong-Tie’s major product lines, particularly those used in new home construction. Sales of the Swan Secure product line, acquired in July 2007, accounted for slightly more than 4% of Simpson Strong-Tie’s 2008 sales. Anchor Systems sales, while down slightly, benefited from the acquisition of Liebig, as well as Simpson Strong-Tie’s increasing presence in Asia and the Middle East. Sales of Simpson Dura-Vent’s pellet vent, chimney, special gas vent and relining products increased, a significant portion of the increase having resulted from the ProTech acquisition. Sales of SDV’s Direct-Vent and gas vent product lines decreased as a result of several factors, including the continuing weakness in new home construction.
Gross Profit
Gross profit decreased 7.6% from $305.5 million in 2007 to $282.3 million in 2008. As a percentage of net sales, gross profit decreased slightly to 37.3% in 2008 from 37.4% in 2007. The decrease in gross margins was primarily due to higher distribution costs, partly offset by lower manufacturing costs. The Company continued to face uncertainty in the cost and availability of steel. Several factors contributed to this uncertainty. Steel prices had declined from their peak in July 2008. The steel market was dynamic, however, with a high degree of uncertainty about future pricing trends. Demand for steel had declined due to the weakening of the global economy and tightening of financial credit markets.
Selling Expense
Selling expense increased 6.3% to $80.7 million in 2008 from $76.0 million in 2007. The increase resulted primarily from an increase in expenses associated with sales and marketing personnel of $7.4 million, including those at businesses acquired since July 2007. This increase was partly offset by decreases in promotional expenses of $1.6 million and donations of $0.5 million, primarily related to the gift made to Habitat for Humanity International, Inc. in 2007.
General and Administrative Expense
General and administrative expenses increased 1.4% to $89.9 million in 2008 from $88.6 million in 2007. The major components of the increase were increases in administrative personnel expenses of $8.5 million, including those at businesses acquired since July 2007, increased legal and professional service expenses of $2.8 million, higher amortization expense of $1.9 million and higher bad debt expense of $1.7 million. These increases were mostly offset by a decrease in cash profit sharing of $14.2 million, which resulted primarily from decreased operating profit.
Impairment of Goodwill
Impairment of goodwill decreased 72.2% from $10.7 million in 2007 to $3.0 million in 2008. The impairment charge taken in 2008, which was a result of the Company’s annual impairment test in the fourth quarter of 2008, was associated with assets that were acquired in England in 1999 and was associated with the Company’s U.K. reporting unit. The reporting unit’s carrying value exceeded the fair value, primarily due to reduced future expected net cash flows. The method to determine the fair value of the U.K. reporting unit was a discounted cash flow model. In 2007, the Company recorded a goodwill impairment charge of $10.7 million, primarily as a result of decreased expected future cash flows from its Canadian unit that resulted from the move of production from Canada to China. The method to determine the fair value of the Canadian reporting unit was a discounted cash flow model supported by market approaches, which were based on earnings multiples realized by similar public companies and on representative merger and acquisition transactions of a similar nature and industry. These reporting units are associated with the connector products segment. See “Critical Accounting Policies and Estimates — Goodwill Impairment Testing.”
Interest Income and Expense
Interest income is generated on the Company’s cash and cash equivalents balances. Interest income decreased primarily as a result of lower interest rates. Interest expense includes interest, account maintenance fees and bank charges.
Provision for Income Taxes
The effective tax rate was 39.8% in 2008, down from 41.0 % in 2007. The decrease in the effective tax rate was caused primarily by the decrease of the impairment of goodwill charge taken in the fourth quarter of 2007, the majority of which was not deductible for tax purposes.
Connector Products — Simpson Strong-Tie (SST)
Simpson Strong-Tie’s income from operations decreased 19.9% from $114.4 million in 2007 to $91.6 million in 2008.
Net Sales
Simpson Strong-Tie’s net sales decreased 9.2% from $745.7 million in 2007 to $676.7 million in 2008. SST accounted for 89.5% of the Company’s total net sales in 2008, a decrease from 91.3% in 2007. The decrease in net sales at SST resulted from a decrease in sales volume, partly offset by an increase in average prices of 8.3%. In 2008, sales declined throughout the United States, with the exception of the northeastern region of the country, which increased slightly. California and the western states had the largest decrease in sales. Sales during the year in continental Europe, Canada and Asia increased, while sales were down in the United Kingdom. Simpson Strong-Tie’s sales to contractor distributors had the largest percentage rate decrease and sales to dealer distributors and home centers also decreased. Reflecting the deterioration of construction markets and economic conditions generally, sales decreased across all of Simpson Strong-Tie’s major product lines, particularly those used in new home construction. Sales of the Swan Secure product line, acquired in July 2007, accounted for slightly more than 4% of Simpson Strong-Tie’s 2008 sales. Anchor Systems sales, while down slightly, benefited from the acquisition of Liebig, as well as Simpson Strong-Tie’s increased presence in Asia and the Middle East.
Gross Profit
Simpson Strong-Tie’s gross profit decreased 8.1% from $296.2 million in 2007 to $272.2 million in 2008. As a percentage of net sales, gross profit increased from 39.7% in 2007 to 40.2% in 2008. This slight increase was primarily due to lower manufacturing costs, including material and labor costs, partly offset by higher fixed overhead costs as a percentage of sales, as a result of the lower sales volume, and higher distribution costs.
Research and Development and Other Engineering Expense
Simpson Strong-Tie’s research and development and other engineering expenses increased 6.2% to $20.1 million in 2008 from $19.0 million in 2007. The increase resulted primarily from a $1.5 million increase in expenses related to additional personnel from the acquisitions during 2008, partly offset by an overall reduction in other departmental overhead expenses.
Selling Expense
Simpson Strong-Tie’s selling expense increased 6.7% to $73.4 million in 2008 from $68.8 million in 2007. The increase resulted primarily from a $7.3 million increase in expenses associated with sales and marketing personnel, including those at businesses acquired since July 2007, partly offset by decreases in promotional expenses of $1.5 million and donations of $0.5 million, primarily related to the gift made to Habitat for Humanity International, Inc. in 2007.
Impairment of Goodwill
Impairment of goodwill decreased 72.2% from $10.7 million in 2007 to $3.0 million in 2008. The impairment charge taken in 2008, which was a result of the Company’s annual impairment test in the fourth quarter of 2008, was associated with assets that were acquired in England in 1999 and was associated with the Company’s U.K. reporting unit. In 2007, the Company recorded a goodwill impairment charge of $10.7 million, primarily as a result of decreased expected future cash flows from its Canadian unit that resulted from the move of production from Canada to China.
European Operations
For its European operations, Simpson Strong-Tie recorded after-tax loss of $3.7 million in 2008 compared to after-tax net income of $2.4 million in 2007. The loss was primarily related to the goodwill impairment charge associated with the U.K. reporting unit.
Venting Products — Simpson Dura-Vent (SDV)
Simpson Dura-Vent’s loss from operations was flat at $2.6 million in both 2007 and 2008.
Net Sales
Simpson Dura-Vent’s net sales increased 11.9% to $79.8 million in 2008 from $71.3 million in 2007. SDV accounted for 10.5% of the Company’s total net sales in 2008, an increase from 8.7% in 2007. The increase in net sales at SDV resulted from an increase in sales volume, as well as price increases that averaged 4.0%. Sales were down in California and the western and southeastern regions of the United States and were up in the midwestern and northeastern regions of the United States in 2008 compared to 2007. Sales of Simpson Dura-Vent’s pellet vent, chimney, special gas vent and relining products increased, a significant portion of the increase having resulted from the ProTech acquisition. Sales of Direct-Vent and gas vent product lines decreased as a result of several factors, including the continued weakness in new home construction.
Gross Profit
Simpson Dura-Vent’s gross profit increased 10.5% to $10.4 million in 2008 from $9.4 million in 2007. As a percentage of net sales, gross profit decreased slightly to 13.0% in 2008 from 13.1% in 2007. This decrease was primarily due to higher fixed overhead costs as a percentage of net sales and higher distribution costs, offset by lower manufacturing costs, including material and labor costs.
General and Administrative Expense
Simpson Dura-Vent’s general and administrative expense increased 16.7% to $4.6 million in 2008 from $4.0 million in 2007 primarily due to increases in administrative personnel expenses of $0.5 million, including those at businesses acquired in 2008.
Administrative and All Other (Company)
Interest Income and Expense
Interest income is generated on the Company’s cash and cash equivalents balances. Interest income decreased primarily as a result of lower interest rates. Interest expense includes interest, account maintenance fees and bank charges.
Critical Accounting Policies and Estimates
The critical policies described below affect the Company’s more significant judgments and estimates used in the preparation of the Consolidated Financial Statements. If the Company’s business conditions change or if it uses different assumptions or estimates in the application of these and other accounting policies, the Company’s future results of operations could be adversely affected.
Inventory Valuation
Inventories are stated at the lower of cost or net realizable value (market). Cost includes all costs incurred in bringing each product to its present location and condition, as follows:
· Raw materials and purchased finished goods — principally valued at cost determined on a weighted average basis.
· In-process products and finished goods — cost of direct materials and labor plus attributable overhead based on a normal level of activity.
The Company writes the gross value of the inventory down to its net realizable value. The Company estimates net realizable value based on estimated selling price less further costs to completion and disposal. The Company impairs slow moving product by comparing inventories on hand to future projected demand. Obsolete inventory is on-hand supply of a product in excess of two years’ sales of that product or a supply of that product that the Company believes is no longer marketable. The Company revalues obsolete inventory as having no net realizable value and impairs its full carrying value. The Company has consistently applied this methodology. The Company believes that this approach is prudent and makes suitable provisions for slow moving and obsolete inventory. When provisions are established, a new cost basis of the inventory is created.
Comparable inventory values are as follows (in thousands):
|
|
|
December 31, |
|
||||
|
|
|
2009 |
|
2008 |
|
||
|
Gross Inventories: |
|
|
|
|
|
||
|
Raw materials |
|
$ |
61,408 |
|
$ |
92,638 |
|
|
In-process products |
|
21,113 |
|
26,371 |
|
||
|
Finished goods |
|
92,115 |
|
142,898 |
|
||
|
|
|
|
|
|
|
||
|
Less: |
|
|
|
|
|
||
|
Slow moving, obsolete and net realizable value provisions |
|
(10,882 |
) |
(10,029 |
) |
||
|
Net inventory valuation |
|
$ |
163,754 |
|
$ |
251,878 |
|
Activity in the inventory reserve is summarized as follows (in thousands):
|
|
|
Years ended December 31, |
|
|||||||
|
|
|
2009 |
|
2008 |
|
2007 |
|
|||
|
|
|
|
|
|
|
|
|
|||
|
Beginning balance |
|
$ |
10,029 |
|
$ |
10,338 |
|
$ |
5,480 |
|
|
Provisions released following disposal of inventory |
|
(47 |
) |
(749 |
) |
57 |
|
|||
|
Additional provisions made |
|
900 |
|
440 |
|
4,801 |
|
|||
|
Ending balance |
|
$ |
10,882 |
|
$ |
10,029 |
|
$ |
10,338 |
|
Unexpected change in market demand, building codes or buyer preferences could reduce the rate of inventory turnover and require the Company to increase its reserve for obsolescence.
Revenue Recognition
The Company recognizes revenue when the earnings process is complete, net of applicable provision for discounts, returns and incentives, whether actual or estimated based on the Company’s experience. This generally occurs when products are shipped to the customer in accordance with the sales agreement or purchase order, ownership and risk of loss pass to the customer, collectibility is reasonably assured and pricing is fixed or determinable. The Company’s general shipping terms are F.O.B. shipping point, where title is transferred and revenue is recognized when the products are shipped to customers. When the Company sells F.O.B. destination point, title is transferred and the Company recognizes revenue on delivery or customer acceptance, depending on terms of the sales agreement. Service sales, representing after-market repair and maintenance, engineering activities and software sales and service, though significantly less than 1% of net sales and not material to the consolidated financial statements, are recognized as the services are completed or the software products and services are delivered. If actual costs of sales returns, incentives and discounts were to significantly exceed the recorded estimated allowance, the Company’s sales would be adversely affected.
Allowance for Doubtful Accounts
The Company assesses the collectibility of specific customer accounts that would be considered doubtful based on the customer’s financial condition, payment history, credit rating and other factors that the Company considers relevant, or accounts that the Company assigns for collection. The Company reserves for the portion of those outstanding balances that the Company believes it is not likely to collect, based on historical collection experience. The Company also reserves 100% of the amount that it deems potentially uncollectible due to a customer’s bankruptcy or deteriorating financial condition. If the financial condition of the Company’s customers were to deteriorate, resulting in inability to make payments, additional allowances may be required.
Activity in the allowance for doubtful accounts is summarized as follows (in thousands):
|
|
|
Years ended December 31, |
|
|||||||
|
|
|
2009 |
|
2008 |
|
2007 |
|
|||
|
|
|
|
|
|
|
|
|
|||
|
Beginning balance |
|
$ |
4,368 |
|
$ |
2,724 |
|
$ |
2,286 |
|
|
Adjustments, recoveries and write-offs |
|
(367 |
) |
(787 |
) |
(275 |
) |
|||
|
Increase to bad debt provision |
|
666 |
|
2,431 |
|
713 |
|
|||
|
Ending balance |
|
$ |
4,667 |
|
$ |
4,368 |
|
$ |
2,724 |
|
Goodwill Impairment Testing
The “Intangibles—Goodwill and Other” topic of the FASB ASC requires that goodwill be tested for impairment at the reporting unit level (operating segment or one level below an operating segment) on an annual basis (in the fourth quarter for the Company) and between annual tests if an event occurs or circumstances change that would more likely than not reduce the fair value of a reporting unit below its carrying value. These events or circumstances could include a significant change in the business climate, legal factors, operating performance indicators, competition, or disposition or relocation of a significant portion of a reporting unit. Application of the goodwill impairment test requires judgment, including the identification of reporting units, assignment of assets and liabilities to reporting units, assignment of goodwill to reporting units, and determination of the fair value of each reporting unit. The fair value of each reporting unit is estimated using discounted cash flow methodologies or a combination of market approaches, if information is readily available, and discounted cash flow methodologies. This process requires significant judgments, including estimation of future cash flows, which depends on internal forecasts, estimation of the long-term rate of growth for the Company’s business, the useful life over which cash flows will occur, and determination of the Company’s weighted average cost of capital. Changes in these estimates and assumptions could materially affect the determination of fair value or goodwill impairment for each reporting unit. Actual cash flows in the future may differ significantly from those assumed. The Company has allocated goodwill to reporting units based on the reporting unit or units expected to benefit from the acquisition. Reporting units are generally determined based on product type and country or region of operations.
The impairment charge taken in 2008, which was a result of the Company’s annual impairment test in the fourth quarter of 2008, was associated with assets that were acquired in England in 1999 and was associated with the Company’s U.K. reporting unit. The reporting unit’s carrying value exceeded the fair value, primarily due to reduced future expected net cash flows. The method to determine the fair value of the U.K. reporting unit was a discounted cash flow model. In 2007, the Company recorded a goodwill impairment charge of $10.7 million related to its Canadian reporting unit, resulting primarily from decreased expected future cash flows due to the move of production from Canada to China. The method to determine the fair value of the Canadian reporting unit was a discounted cash flow model supported by market approaches, which were based on earnings multiples realized by similar public companies and on representative merger and acquisition transactions of a similar nature and industry. At December 31, 2009, the remaining balances of goodwill of the U.K. and Canadian reporting units were $1.3 million and $3.7 million, respectively. These reporting units are associated with the connector products segment.
Effect of New Accounting Standards
On January 1, 2009, the Company adopted new or revised guidance in the following FASB ASC topics: “Business Combinations,” “Intangibles—Goodwill and Other,” “Subsequent Events,” and “Generally Accepted Accounting Principles.” As of December 31, 2009, the Company had not yet adopted the revised guidance codified in the “Consolidations” topic of the FASB ASC. See Note 1 to the Company’s Consolidated Financial Statements.
Liquidity and Sources of Capital
The Company’s liquidity needs arise principally from working capital requirements, capital expenditures and business acquisitions. During the three years ended December 31, 2009, the Company relied on internally generated funds to finance these needs. The Company’s working capital requirements are seasonal with the highest need typically occurring in the second and third quarters of the year. Cash and cash equivalents were $250.4 million and $170.8 million at December 31, 2009 and 2008, respectively. Working capital was $458.6 million and $455.7 million at December 31, 2009 and 2008, respectively. As of December 31, 2009, the Company had no borrowings on its revolving line of credit. The Company had unused capacity on these credit facilities of $205.0 million.
The Company’s operating activities provided $126.2 million, $56.1 million and $126.8 million in net cash in 2009, 2008 and 2007, respectively. In 2009, cash was provided by net income of $12.2 million and noncash expenses, including depreciation and amortization and noncash compensation related to stock plans, totaling $31.6 million, a decrease in inventories of $92.6 million, an increase in trade accounts payable of $4.8 million and a decrease in trade accounts receivable of $2.6 million. These increases were partially offset by an increase in other current assets of $4.1 million, and decreases in other accrued liabilities, income taxes payable and accrued cash profit sharing of $6.8 million, $4.5 million and $2.6 million, respectively. Raw material inventories decreased 33.7% from December 31, 2008, and in-progress and finished goods inventories decreased 35.7% over the same period. The decrease in inventories resulted primarily from decreased raw material purchases. The balance of the cash provided in 2009 resulted from changes in other asset and liability accounts, none of which was material.
The Company’s investing activities used $39.5 million, $51.0 million and $75.2 million in net cash in 2009, 2008 and 2007, respectively. Cash paid for asset acquisitions, primarily for the acquisitions of Aginco and RO Design Corp, was $24.3 million in 2009, down from $36.3 million for acquisitions in 2008 when the Company acquired Liebig, ProTech, Ventinox and Ahorn. Cash paid for capital expenditures was $15.2 million in 2009, down from $16.0 million in 2008. The cash paid was partly offset by sales of assets $1.2 million. The Company used $5.8 million of these expenditures in 2009 to improve its real estate, primarily to construct an addition to its manufacturing facility in France. The Company also used $9.4 million in 2009 to purchase machinery and equipment for its facilities in the United States, Europe and Asia. The Company’s planned capital expenditures for 2010 total approximately $28 million. The Company also used $1.2 million in 2009 to make loans to related parties.
In January 2009, the Company acquired the assets of RO Design Corp, a Florida corporation doing business as DeckTools, which licenses deck design and estimation software. The software provides professional deck builders, home centers and lumber yards a simple, graphics-driven, solution for designing decks and estimating material and labor costs for the project. The purchase price was $4.0 million in cash, including $2.5 million to be paid in the future.
In April 2009, the Company’s subsidiary, Simpson Strong-Tie Europe EURL, purchased the equity of Aginco, which manufactures a line of high-quality builder products and distributes them in France, for $22.2 million in cash.
The Company’s vacant facility in San Leandro, California, is classified as an asset held for sale. The Company completed its environmental remediation at this facility and is actively marketing the facility. The Company plans to sell its facility in Vicksburg, Mississippi, and will cease use of it around that time. If either facility is expected to be sold below its carrying value, the Company will record an impairment charge equal to the amount by which its carrying value exceeds its net realized value. As of December 31, 2009, the property in Vicksburg, Mississippi, did not qualify for held-for-sale accounting treatment, as the Company continues to use this facility as a warehouse, and the Company expects to record a charge in the range of $2 million to $3 million, based on current market conditions, when the held-for-sale accounting treatment is met.
The Company expects, in March 2010, to acquire a facility in San Bernadino, California, for $19.2 million, in which it will consolidate its owned manufacturing and warehouse facilities in Brea, California, and its leased warehouse in Ontario, California. The Company intends to sell the Brea facilities. The relocation is planned to be completed in late 2010 or in 2011.
The Company’s financing activities used $11.7 million, $13.0 million, and $17.4 million in net cash in 2009, 2008 and 2007, respectively. Uses of cash for financing activities were primarily from payments of cash dividends of $19.6 million. Cash provided by financing activities was primarily from the issuance of the Company’s common stock through the exercise of stock options totaling $7.6 million. In February 2010, the Company’s Board of Directors declared a dividend of $0.10 per share, a total of $4.9 million, to be paid on April 29, 2010, to stockholders of record on April 8, 2010.
In October 2007, the Company entered into an unsecured credit agreement with a syndicate of banks providing for a 5-year revolving credit facility of $200 million. The Company has the ability to increase the amount available under the credit agreement by an additional $200 million, to a maximum of $400 million, by obtaining additional commitments from existing lenders or new lenders and satisfying certain other conditions. Under existing conditions in credit markets, the Company does not believe that additional commitments will be available on terms the Company considers reasonable. The Company is required to pay an annual facility fee of 0.08% to 0.10% of the available commitments under the credit agreement, regardless of usage, with the applicable fee determined on a quarterly basis based on the Company’s leverage ratio. Amounts borrowed under the credit agreement will bear interest at an annual rate equal to either, at the Company’s option, (a) the British Bankers Association London Interbank Offered Rate for the appropriate currency appearing on Reuters Screen LIBOR01-02 Page (the “LIBO Rate”) plus a spread of from 0.27% to 0.40%, as determined on a quarterly basis based on the Company’s leverage ratio, or (b) the Base Rate, plus a spread of 0.50%. The Company will pay participation fees for outstanding standby letters of credit at an annual rate equal to the LIBO Rate plus the applicable spreads described in the preceding sentence, and will pay market-based fees for commercial letters of credit. Loans outstanding under the credit agreement may be prepaid at any time without penalty except for LIBO Rate breakage costs and expenses.
The proceeds of loans advanced under the credit agreement and letters of credit issued thereunder may be used for working capital and other general corporate needs of the Company, to pay dividends to the Company’s stockholders or to repurchase outstanding securities of the Company as permitted by the credit agreement, and to finance acquisitions by the Company permitted by the credit agreement. No loans or letters of credit are currently outstanding under the credit agreement. The Company and its subsidiaries are required to comply with various affirmative and negative covenants. The covenants include provisions that would limit the availability of funds as a result of a material adverse change to the Company’s financial position or results of operations. The Company is in compliance with its financial covenants under the loan agreement.
The Company’s contractual obligations, as of December 31, 2009, for future payments are as follows, in thousands:
|
|
|
Payments Due by Period |
|
|||||||||||||
|
|
|
Total |
|
Less |
|
|
|
|
|
More |
|
|||||
|
|
|
all |
|
than 1 |
|
1 — 3 |
|
3 — 5 |
|
than 5 |
|
|||||
|
Contractual Obligation |
|
periods |
|
year |
|
years |
|
years |
|
years |
|
|||||
|
|
|
|
|
|
|
|
|
|
|
|
|
|||||
|
Debt interest obligations |
|
453 |
|
160 |
|
293 |
|
— |
|
— |
|
|||||
|
Operating lease obligations |
|
18,334 |
|
6,149 |
|
8,545 |
|
1,541 |
|
2,099 |
|
|||||
|
Purchase obligations |
|
26,836 |
|
24,524 |
|
1,730 |
|
582 |
|
— |
|
|||||
|
Total |
|
$ |
45,623 |
|
$ |
30,833 |
|
$ |
10,568 |
|
$ |
2,123 |
|
$ |
2,099 |
|
Purchase obligations consist of commitments primarily related to the acquisition, construction or expansion of facilities and equipment, consulting agreements, and minimum purchase quantities of certain raw materials. The Company is not a party to any long-term supply contracts with respect to the purchase of raw materials or finished goods. Debt interest obligations include interest payments on fixed-term debt, line-of-credit borrowings and annual maintenance fees on the Company’s primary line-of-credit facility. Interest on line-of-credit facilities was estimated based on historical borrowings and repayment patterns. The Company’s primary line-of-credit facility includes annual maintenance fees from 0.08% to 0.10%, depending on the Company’s leverage ratio, on the unused portion of the facilities.
The Company adopted the revised guidance in the “Income Taxes” topic of the FASB ASC regarding uncertain tax positions on January 1, 2007. At December 31, 2009, the Company’s expected payment for contractual obligations includes $7.9 million of gross liability for uncertain tax positions, although the Company cannot estimate the amount realized or the timing of cash settlement of this liability. This amount does not include any amount receivable that may arise from the settlement of the Company’s uncertain tax positions. See Notes 1 and 10 to the Company’s Consolidated Financial Statements.
Inflation
The Company believes that the effect of inflation on the Company has not been material in recent years, as general inflation rates have remained relatively low. The Company’s main raw material, however, is steel, and increases in steel prices may adversely affect the Company’s gross margins if it cannot recover the higher costs through price increases.
Item 7A. Quantitative and Qualitative Disclosures About Market Risk
The Company has no variable interest-rate debt investments.
The Company has foreign exchange rate risk in its international operations, primarily Europe and Canada, and through purchases from foreign vendors. The Company does not currently hedge this risk. If the exchange rate were to change by 10% in any one country where the Company has operations, the change in net income would not be material to the Company’s operations taken as a whole. The translation adjustment resulted in an increase in accumulated other comprehensive income of $13.0 million for the year ended December 31, 2009, primarily due to the effect of the weakening of the United States dollar in relation to the European and Canadian currencies.
Item 8. Consolidated Financial Statements and Supplementary Data.
SIMPSON MANUFACTURING CO., INC.
INDEX TO CONSOLIDATED FINANCIAL STATEMENTS
|
Consolidated financial statements |
|
|
41 |
|
|
42 |
|
|
Consolidated Statements of Operations for the years ended December 31, 2009, 2008 and 2007 |
43 |
|
Consolidated Statements of Stockholders’ Equity for the years ended December 31, 2007, 2008 and 2009 |
44 |
|
Consolidated Statements of Cash Flows for the years ended December 31, 2009, 2008 and 2007 |
45 |
|
46 |
|
|
|
|
|
Financial Statement Schedule |
|
|
72 |
Report of Independent Registered Public Accounting Firm
To the Board of Directors and Stockholders of Simpson Manufacturing Co., Inc.:
In our opinion, the consolidated financial statements listed in the accompanying index present fairly, in all material respects, the financial position of Simpson Manufacturing Co., Inc. and its subsidiaries at December 31, 2009 and 2008, and the results of their operations and their cash flows for each of the three years in the period ended December 31, 2009, in conformity with accounting principles generally accepted in the United States of America. In addition, in our opinion, the financial statement schedule listed in the accompanying index presents fairly, in all material respects, the information set forth therein when read in conjunction with the related consolidated financial statements. Also in our opinion, the Company maintained, in all material respects, effective internal control over financial reporting as of December 31, 2009, based on criteria established in Internal Control - Integrated Framework issued by the Committee of Sponsoring Organizations of the Treadway Commission (COSO). The Company’s management is responsible for these financial statements and financial statement schedule, for maintaining effective internal control over financial reporting and for its assessment of the effectiveness of internal control over financial reporting, included in Item 9A of the 2009 Annual Report. Our responsibility is to express opinions on these financial statements, on the financial statement schedule, and on the Company’s internal control over financial reporting based on our integrated audits. We conducted our audits in accordance with the standards of the Public Company Accounting Oversight Board (United States). Those standards require that we plan and perform the audits to obtain reasonable assurance about whether the financial statements are free of material misstatement and whether effective internal control over financial reporting was maintained in all material respects. Our audits of the financial statements included examining, on a test basis, evidence supporting the amounts and disclosures in the financial statements, assessing the accounting principles used and significant estimates made by management, and evaluating the overall financial statement presentation. Our audit of internal control over financial reporting included obtaining an understanding of internal control over financial reporting, assessing the risk that a material weakness exists, and testing and evaluating the design and operating effectiveness of internal control based on the assessed risk. Our audits also included performing such other procedures as we considered necessary in the circumstances. We believe that our audits provide a reasonable basis for our opinions.
A company’s internal control over financial reporting is a process designed to provide reasonable assurance regarding the reliability of financial reporting and the preparation of financial statements for external purposes in accordance with generally accepted accounting principles. A company’s internal control over financial reporting includes those policies and procedures that (i) pertain to the maintenance of records that, in reasonable detail, accurately and fairly reflect the transactions and dispositions of the assets of the company; (ii) provide reasonable assurance that transactions are recorded as necessary to permit preparation of financial statements in accordance with generally accepted accounting principles, and that receipts and expenditures of the company are being made only in accordance with authorizations of management and directors of the company; and (iii) provide reasonable assurance regarding prevention or timely detection of unauthorized acquisition, use, or disposition of the company’s assets that could have a material effect on the financial statements.
Because of its inherent limitations, internal control over financial reporting may not prevent or detect misstatements. Also, projections of any evaluation of effectiveness to future periods are subject to the risk that controls may become inadequate because of changes in conditions, or that the degree of compliance with the policies or procedures may deteriorate.
As described in Item 9A of the 2009 Annual Report, management has excluded Agence Internationale Commerciale et Industrielle, S.A.S. (“Aginco”) from its assessment of internal control over financial reporting as of December 31, 2009, because they were purchased by the Company through a business combination during 2009. We have also excluded Aginco from our audit of internal control over financial reporting. Aginco is a division of Simpson Strong-Tie Company Inc. whose combined total assets and total revenues represent approximately 3% and 1%, respectively, of the related consolidated financial statement amounts as of and for the year ended December 31, 2009.
/s/ PricewaterhouseCoopers LLP
San Francisco, California
February 26, 2010
Simpson Manufacturing Co., Inc. and Subsidiaries
(In thousands, except per share data)
|
|
|
December 31, |
|
||||
|
|
|
2009 |
|
2008 |
|
||
|
ASSETS |
|
|
|
|
|
||
|
Current assets |
|
|
|
|
|
||
|
Cash and cash equivalents |
|
$ |
250,381 |
|
$ |
170,750 |
|
|
Trade accounts receivable, net |
|
77,317 |
|
76,005 |
|
||
|
Inventories |
|
163,754 |
|
251,878 |
|
||
|
Deferred income taxes |
|
13,970 |
|
11,995 |
|
||
|
Assets held for sale |
|
7,887 |
|
8,387 |
|
||
|
Other current assets |
|
16,766 |
|
8,582 |
|
||
|
Total current assets |
|
530,075 |
|
527,597 |
|
||
|
|
|
|
|
|
|
||
|
Property, plant and equipment, net |
|
187,814 |
|
193,318 |
|
||
|
Goodwill |
|
81,626 |
|
68,619 |
|
||
|
Equity method investment |
|
748 |
|
214 |
|
||
|
Intangible assets |
|
28,852 |
|
23,453 |
|
||
|
Deferred income taxes |
|
5,598 |
|
8,755 |
|
||
|
Other noncurrent assets |
|
9,092 |
|
8,244 |
|
||
|
Total assets |
|
$ |
843,805 |
|
$ |
830,200 |
|
|
|
|
|
|
|
|
||
|
LIABILITIES AND STOCKHOLDERS’ EQUITY |
|
|
|
|
|
||
|
Current liabilities |
|
|
|
|
|
||
|
Line of credit |
|
$ |
— |
|
$ |
26 |
|
|
Trade accounts payable |
|
28,462 |
|
21,675 |
|
||
|
Accrued liabilities |
|
29,209 |
|
34,102 |
|
||
|
Accrued profit sharing trust contributions |
|
7,018 |
|
9,541 |
|
||
|
Accrued cash profit sharing and commissions |
|
2,427 |
|
2,264 |
|
||
|
Accrued workers’ compensation |
|
4,352 |
|
4,286 |
|
||
|
Total current liabilities |
|
71,468 |
|
71,894 |
|
||
|
|
|
|
|
|
|
||
|
Long-term liabilities |
|
8,553 |
|
9,280 |
|
||
|
Total liabilities |
|
80,021 |
|
81,174 |
|
||
|
|
|
|
|
|
|
||
|
Commitments and contingencies (Note 9) |
|
|
|
|
|
||
|
|
|
|
|
|
|
||
|
Stockholders’ equity |
|
|
|
|
|
||
|
Preferred stock, par value $0.01; authorized shares, 5,000; issued and outstanding shares, none |
|
— |
|
— |
|
||
|
Common stock, par value $0.01; authorized shares, 160,000; issued and outstanding shares, 49,377 and 48,971 at December 31, 2009 and 2008, respectively |
|
493 |
|
490 |
|
||
|
Additional paid-in capital |
|
146,036 |
|
136,867 |
|
||
|
Retained earnings |
|
598,493 |
|
605,950 |
|
||
|
Accumulated other comprehensive income |
|
18,762 |
|
5,719 |
|
||
|
Total stockholders’ equity |
|
763,784 |
|
749,026 |
|
||
|
Total liabilities and stockholders’ equity |
|
$ |
843,805 |
|
$ |
830,200 |
|
The accompanying notes are an integral part of these consolidated financial statements.
Simpson Manufacturing Co., Inc. and Subsidiaries
Consolidated Statements of Operations
(In thousands, except per share data)
|
|
|
Years Ended December 31, |
|
|||||||
|
|
|
2009 |
|
2008 |
|
2007 |
|
|||
|
|
|
|
|
|
|
|
|
|||
|
Net sales |
|
$ |
585,070 |
|
$ |
756,499 |
|
$ |
816,988 |
|
|
Cost of sales |
|
391,496 |
|
474,190 |
|
511,499 |
|
|||
|
Gross profit |
|
193,574 |
|
282,309 |
|
305,489 |
|
|||
|
|
|
|
|
|
|
|
|
|||
|
Operating expenses |
|
|
|
|
|
|
|
|||
|
Research and development and other engineering |
|
19,993 |
|
21,327 |
|
20,115 |
|
|||
|
Selling |
|
64,294 |
|
80,703 |
|
75,954 |
|
|||
|
General and administrative |
|
79,880 |
|
89,897 |
|
88,618 |
|
|||
|
Impairment of goodwill |
|
— |
|
2,964 |
|
10,666 |
|
|||
|
Loss (gain) on sale of assets |
|
797 |
|
(124 |
) |
(713 |
) |
|||
|
|
|
164,964 |
|
194,767 |
|
194,640 |
|
|||
|
|
|
|
|
|
|
|
|
|||
|
Income from operations |
|
28,610 |
|
87,542 |
|
110,849 |
|
|||
|
|
|
|
|
|
|
|
|
|||
|
Loss in equity method investment, before tax |
|
(194 |
) |
(486 |
) |
(33 |
) |
|||
|
Interest income |
|
542 |
|
2,977 |
|
5,988 |
|
|||
|
Interest expense |
|
(467 |
) |
(381 |
) |
(229 |
) |
|||
|
Income before income taxes |
|
28,491 |
|
89,652 |
|
116,575 |
|
|||
|
|
|
|
|
|
|
|
|
|||
|
Provision for income taxes |
|
16,274 |
|
35,718 |
|
47,833 |
|
|||
|
|
|
|
|
|
|
|
|
|||
|
Net income |
|
$ |
12,217 |
|
$ |
53,934 |
|
$ |
68,742 |
|
|
|
|
|
|
|
|
|
|
|||
|
Net income per common share |
|
|
|
|
|
|
|
|||
|
Basic |
|
$ |
0.25 |
|
$ |
1.11 |
|
$ |
1.42 |
|
|
Diluted |
|
$ |
0.25 |
|
$ |
1.10 |
|
$ |
1.40 |
|
|
|
|
|
|
|
|
|
|
|||
|
Weighted average number of shares outstanding |
|
|
|
|
|
|
|
|||
|
Basic |
|
49,135 |
|
48,636 |
|
48,472 |
|
|||
|
Diluted |
|
49,256 |
|
48,970 |
|
48,928 |
|
|||
The accompanying notes are an integral part of these consolidated financial statements.
Simpson Manufacturing Co., Inc. and Subsidiaries
Consolidated Statements of Stockholders’ Equity
for the years ended December 31, 2007, 2008 and 2009
(In thousands, except per share data)
|
|
|
|
|
|
|
|
|
|
|
Accumulated |
|
|
|
|
|
|
|
|
|
|
|
|
Additional |
|
|
|
Other |
|
|
|
|
|
|
|
|
Common Stock |
|
Paid-in |
|
Retained |
|
Comprehensive |
|
Treasury |
|
|
|
||
|
|
|
Shares |
|
Par Value |
|
Capital |
|
Earnings |
|
Income |
|
Stock |
|
Total |
|
|
Balance, January 1, 2007 |
|
48,412 |
|
$484 |
|
$114,535 |
|
$526,346 |
|
$11,494 |
|
$— |
|
$652,859 |
|
|
Comprehensive income: |
|
|
|
|
|
|
|
|
|
|
|
|
|
|
|
|
Net income |
|
— |
|
— |
|
— |
|
68,742 |
|
— |
|
— |
|
68,742 |
|
|
Other comprehensive income: |
|
|
|
|
|
|
|
|
|
|
|
|
|
|
|
|
Translation adjustment |
|
— |
|
— |
|
— |
|
— |
|
13,803 |
|
— |
|
13,803 |
|
|
Comprehensive income |
|
|
|
|
|
|
|
|
|
|
|
|
|
82,545 |
|
|
Options exercised |
|
252 |
|
2 |
|
4,830 |
|
— |
|
— |
|
— |
|
4,832 |
|
|
Stock compensation expense |
|
— |
|
— |
|
5,893 |
|
— |
|
— |
|
— |
|
5,893 |
|
|
Tax benefit of options exercised |
|
— |
|
— |
|
554 |
|
— |
|
— |
|
— |
|
554 |
|
|
Cash dividends declared on common stock, $0.40 per share |
|
— |
|
— |
|
— |
|
(19,399 |
) |
— |
|
— |
|
(19,399 |
) |
|
Repurchase of common stock |
|
(122 |
) |
— |
|
— |
|
— |
|
— |
|
(4,191 |
) |
(4,191 |
) |
|
Retirement of treasury stock |
|
— |
|
(1 |
) |
— |
|
(4,190 |
) |
— |
|
4,191 |
|
— |
|
|
Common stock issued at $31.65 per share |
|
10 |
|
— |
|
307 |
|
— |
|
— |
|
— |
|
307 |
|
|
Balance, December 31, 2007 |
|
48,552 |
|
485 |
|
126,119 |
|
571,499 |
|
25,297 |
|
— |
|
723,400 |
|
|
Comprehensive income: |
|
|
|
|
|
|
|
|
|
|
|
|
|
|
|
|
Net income |
|
— |
|
— |
|
— |
|
53,934 |
|
— |
|
— |
|
53,934 |
|
|
Other comprehensive income: |
|
|
|
|
|
|
|
|
|
|
|
|
|
|
|
|
Translation adjustment |
|
— |
|
— |
|
— |
|
— |
|
(19,578 |
) |
— |
|
(19,578 |
) |
|
Comprehensive income |
|
|
|
|
|
|
|
|
|
|
|
|
|
34,356 |
|
|
Options exercised |
|
410 |
|
5 |
|
6,876 |
|
— |
|
— |
|
— |
|
6,881 |
|
|
Stock compensation expense |
|
— |
|
— |
|
3,249 |
|
— |
|
— |
|
— |
|
3,249 |
|
|
Tax benefit of options exercised |
|
— |
|
— |
|
376 |
|
— |
|
— |
|
— |
|
376 |
|
|
Cash dividends declared on common stock, $0.40 per share |
|
— |
|
— |
|
— |
|
(19,483 |
) |
— |
|
— |
|
(19,483 |
) |
|
Common stock issued at $26.59 per share |
|
9 |
|
— |
|
247 |
|
— |
|
— |
|
— |
|
247 |
|
|
Balance, December 31, 2008 |
|
48,971 |
|
490 |
|
136,867 |
|
605,950 |
|
5,719 |
|
— |
|
749,026 |
|
|
Comprehensive income: |
|
|
|
|
|
|
|
|
|
|
|
|
|
|
|
|
Net income |
|
— |
|
— |
|
— |
|
12,217 |
|
— |
|
— |
|
12,217 |
|
|
Other comprehensive income: |
|
|
|
|
|
|
|
|
|
|
|
|
|
|
|
|
Translation adjustment |
|
— |
|
— |
|
— |
|
— |
|
13,043 |
|
— |
|
13,043 |
|
|
Comprehensive income |
|
|
|
|
|
|
|
|
|
|
|
|
|
25,260 |
|
|
Options exercised |
|
396 |
|
3 |
|
7,624 |
|
— |
|
— |
|
— |
|
7,627 |
|
|
Stock compensation expense |
|
— |
|
— |
|
1,690 |
|
— |
|
— |
|
— |
|
1,690 |
|
|
Tax benefit of options exercised |
|
— |
|
— |
|
(445 |
) |
— |
|
— |
|
— |
|
(445 |
) |
|
Cash dividends declared on common stock, $0.40 per share |
|
— |
|
— |
|
— |
|
(19,674 |
) |
— |
|
— |
|
(19,674 |
) |
|
Common stock issued at $27.76 per share |
|
10 |
|
— |
|
300 |
|
— |
|
— |
|
— |
|
300 |
|
|
Balance, December 31, 2009 |
|
49,377 |
|
$493 |
|
$146,036 |
|
$598,493 |
|
$18,762 |
|
$— |
|
$763,784 |
|
The accompanying notes are an integral part of these consolidated financial statements.
Simpson Manufacturing Co., Inc. and Subsidiaries
Consolidated Statements of Cash Flows
(In thousands)
|
|
|
Years Ended December 31, |
|
|||||||
|
|
|
2009 |
|
2008 |
|
2007 |
|
|||
|
Cash flows from operating activities |
|
|
|
|
|
|
|
|||
|
Net income |
|
$ |
12,217 |
|
$ |
53,934 |
|
$ |
68,742 |
|
|
Adjustments to reconcile net income to net cash provided by operating activities: |
|
|
|
|
|
|
|
|||
|
Loss (gain) on sale of assets |
|
797 |
|
(124 |
) |
(713 |
) |
|||
|
Depreciation and amortization |
|
29,387 |
|
30,209 |
|
27,984 |
|
|||
|
Impairment of long-lived assets |
|
— |
|
— |
|
465 |
|
|||
|
Impairment of goodwill |
|
— |
|
2,964 |
|
10,666 |
|
|||
|
Deferred income taxes |
|
(2,198 |
) |
(1,079 |
) |
(3,745 |
) |
|||
|
Noncash compensation related to stock plans |
|
2,200 |
|
3,823 |
|
6,333 |
|
|||
|
Loss in equity method investment |
|
194 |
|
486 |
|
33 |
|
|||
|
Excess tax benefit of options exercised |
|
(359 |
) |
(515 |
) |
(746 |
) |
|||
|
Write down of obsolete inventory |
|
900 |
|
440 |
|
4,801 |
|
|||
|
Provision for doubtful accounts |
|
666 |
|
2,431 |
|
713 |
|
|||
|
Accrued interest earned from related party |
|
(78 |
) |
— |
|
— |
|
|||
|
Changes in operating assets and liabilities, net of effects of acquisitions: |
|
|
|
|
|
|
|
|||
|
Trade accounts receivable |
|
2,574 |
|
9,862 |
|
12,999 |
|
|||
|
Inventories |
|
92,589 |
|
(32,408 |
) |
5,803 |
|
|||
|
Other current assets |
|
(4,123 |
) |
174 |
|
(1,540 |
) |
|||
|
Other noncurrent assets |
|
(1,146 |
) |
(1,213 |
) |
340 |
|
|||
|
Trade accounts payable |
|
4,770 |
|
(7,456 |
) |
3,105 |
|
|||
|
Accrued liabilities |
|
(6,754 |
) |
(5,433 |
) |
(503 |
) |
|||
|
Accrued profit sharing trust contributions |
|
(2,614 |
) |
1,070 |
|
(77 |
) |
|||
|
Accrued cash profit sharing and commissions |
|
92 |
|
(1,773 |
) |
(3,748 |
) |
|||
|
Other long-term liabilities |
|
1,520 |
|
(684 |
) |
(536 |
) |
|||
|
Accrued workers’ compensation |
|
66 |
|
170 |
|
404 |
|
|||
|
Income taxes payable |
|
(4,540 |
) |
1,254 |
|
(3,935 |
) |
|||
|
Net cash provided by operating activities |
|
126,160 |
|
56,132 |
|
126,845 |
|
|||
|
|
|
|
|
|
|
|
|
|||
|
Cash flows from investing activities |
|
|
|
|
|
|
|
|||
|
Capital expenditures |
|
(15,226 |
) |
(15,984 |
) |
(36,091 |
) |
|||
|
Asset acquisitions, net of cash acquired |
|
(24,261 |
) |
(36,346 |
) |
(42,470 |
) |
|||
|
Loans made to related parties |
|
(1,204 |
) |
(1,300 |
) |
— |
|
|||
|
Contribution to equity investment |
|
— |
|
(700 |
) |
— |
|
|||
|
Proceeds from sale of capital assets |
|
1,218 |
|
3,305 |
|
3,363 |
|
|||
|
Net cash used in investing activities |
|
(39,473 |
) |
(51,025 |
) |
(75,198 |
) |
|||
|
|
|
|
|
|
|
|
|
|||
|
Cash flows from financing activities |
|
|
|
|
|
|
|
|||
|
Line of credit borrowings |
|
1,514 |
|
3,655 |
|
7,166 |
|
|||
|
Repayment of debt and line of credit borrowings |
|
(1,540 |
) |
(4,659 |
) |
(6,868 |
) |
|||
|
Debt issuance costs |
|
— |
|
— |
|
(687 |
) |
|||
|
Repurchase of common stock |
|
— |
|
— |
|
(4,191 |
) |
|||
|
Issuance of Company’s common stock |
|
7,627 |
|
6,881 |
|
4,832 |
|
|||
|
Excess tax benefit of options exercised |
|
359 |
|
515 |
|
746 |
|
|||
|
Dividends paid |
|
(19,633 |
) |
(19,440 |
) |
(18,415 |
) |
|||
|
Net cash used in financing activities |
|
(11,673 |
) |
(13,048 |
) |
(17,417 |
) |
|||
|
|
|
|
|
|
|
|
|
|||
|
Effect of exchange rate changes on cash |
|
4,617 |
|
(7,451 |
) |
3,613 |
|
|||
|
|
|
|
|
|
|
|
|
|||
|
Net increase (decrease) in cash and cash equivalents |
|
79,631 |
|
(15,392 |
) |
37,843 |
|
|||
|
Cash and cash equivalents at beginning of year |
|
170,750 |
|
186,142 |
|
148,299 |
|
|||
|
Cash and cash equivalents at end of year |
|
$ |
250,381 |
|
$ |
170,750 |
|
$ |
186,142 |
|
|
|
|
|
|
|
|
|
|
|||
|
Supplemental Disclosure of Cash Flow Information |
|
|
|
|
|
|
|
|||
|
Cash paid during the year for |
|
|
|
|
|
|
|
|||
|
Interest |
|
$ |
287 |
|
$ |
296 |
|
$ |
264 |
|
|
Income taxes |
|
23,322 |
|
36,956 |
|
50,637 |
|
|||
|
Noncash activity during the year for |
|
|
|
|
|
|
|
|||
|
Noncash capital expenditures |
|
$ |
278 |
|
$ |
296 |
|
$ |
1,081 |
|
|
Noncash asset acquisition |
|
— |
|
1,457 |
|
1,308 |
|
|||
|
Common stock issued for compensation |
|
300 |
|
247 |
|
307 |
|
|||
|
Dividends declared but not paid |
|
4,939 |
|
4,897 |
|
4,854 |
|
|||
|
Noncash equity method investment acquisition (Note 6) |
|
728 |
|
— |
|
— |
|
|||
The accompanying notes are an integral part of these consolidated financial statements.
Simpson Manufacturing Co., Inc. and Subsidiaries
Notes to Consolidated Financial Statements
1. Operations and Summary of Significant Accounting Policies
Nature of Operations
Simpson Manufacturing Co., Inc., through its subsidiaries Simpson Strong-Tie Company Inc. (“Simpson Strong-Tie”) and Simpson Dura-Vent Company, Inc. and its other subsidiaries (collectively, the “Company”), designs, engineers and manufactures wood-to-wood, wood-to-concrete and wood-to-masonry connectors, screw fastening systems and collated screws, stainless steel fasteners, pre-fabricated shearwalls and moment-frames and venting systems for gas and wood burning and alternative fuel appliances. The Company markets its products to the residential construction, light industrial and commercial construction, remodeling and do-it-yourself markets. Simpson Strong-Tie also offers a line of adhesives, mechanical anchors and powder-actuated tools for concrete, masonry and steel.
The Company operates exclusively in the building products industry. The Company’s products are sold primarily in the United States, Canada, Europe and Asia. Revenues have some geographic market concentration on the west coast of the United States. A portion of the Company’s business is therefore dependent on economic activity within this region and market. The Company is dependent on the availability of steel, its primary raw material.
Principles of Consolidation
The consolidated financial statements include the accounts of Simpson Manufacturing Co., Inc. and its subsidiaries. Investments in 50% or less owned entities are accounted for using either cost or the equity method. The Company consolidates all variable interest entities (VIEs) where it is the primary beneficiary. There were no VIEs as of December 31, 2008 or 2009. All significant intercompany transactions have been eliminated.
Use of Estimates
The preparation of consolidated financial statements in conformity with accounting principles generally accepted in the United States of America (“GAAP”) requires management to make estimates and assumptions that affect the reported amounts of assets and liabilities and disclosure of contingent assets and liabilities at the date of the consolidated financial statements and the reported amounts of revenues and expenses during the reporting period. Actual results could differ from those estimates.
Subsequent Events
The Company has evaluated the financial statements for subsequent events through the date of the issuance of these financial statements. See Note 15 “Subsequent Events.”
Revenue Recognition
The Company recognizes revenue when the earnings process is complete, net of applicable provision for discounts, returns and incentives, whether actual or estimated based on the Company’s experience. This generally occurs when products are shipped to the customer in accordance with the sales agreement or purchase order, ownership and risk of loss pass to the customer, collectibility is reasonably assured and pricing is fixed or determinable. The Company’s general shipping terms are F.O.B. shipping point, where title is transferred and revenue is recognized when the products are shipped to customers. When the Company sells F.O.B. destination point, title is transferred and the Company recognizes revenue on delivery or customer acceptance, depending on terms of the sales agreement. Service sales, representing after-market repair and maintenance, engineering activities and software sales and service, though significantly less than 1% of net sales and not material to the consolidated financial statements, are recognized as the services are completed or the software products and services are delivered. If actual costs of sales returns, incentives and discounts were to significantly exceed the recorded estimated allowance, the Company’s sales would be adversely affected.
Cash Equivalents
The Company considers all highly liquid investments with an original or remaining maturity of three months or less at the time of purchase to be cash equivalents.
Investments
The Company has a minority investment in a privately held company. These kinds of investments are carried either at cost or by the equity method of accounting, depending on the Company’s ownership interest and its ability to influence the operating or financial decisions of the investee, and are classified as long-term investments.
The Company periodically reviews its investments for impairment. If the carrying value of an investment exceeds its fair value and the decline in fair value is determined to be other-than-temporary, the Company writes down the value of the investment to its fair value. The Company generally believes an other-than-temporary decline occurs when the fair value of an investment is below the carrying value for two consecutive quarters.
Allowance for Doubtful Accounts
The Company assesses the collectibility of specific customer accounts that would be considered doubtful based on the customer’s financial condition, payment history, credit rating and other factors that the Company considers relevant, or accounts that the Company assigns for collection. The Company reserves for the portion of those outstanding balances that the Company believes it is not likely to collect based on historical collection experience. The Company also reserves 100% of the amount that it deems potentially uncollectible due to a customer’s deteriorating financial condition or bankruptcy. If the financial condition of the Company’s customers were to deteriorate, resulting in probable inability to make payments, additional allowances may be required.
Inventory Valuation
Inventories are stated at the lower of cost or net realizable value (market). Cost includes all costs incurred in bringing each product to its present location and condition, as follows:
· Raw materials and purchased finished goods for resale — principally valued at cost determined on a weighted average basis.
· In-process products and finished goods — cost of direct materials and labor plus attributable overhead based on a normal level of activity.
The Company applies net realizable value and obsolescence to the gross value of the inventory. The Company estimates net realizable value based on estimated selling price less further costs to completion and disposal. The Company provides for slow moving product by comparing inventories on hand to future projected demand. Obsolete inventory is on-hand supply of a product in excess of two years’ sales of that product or a supply of that product that the Company believes is no longer marketable. The Company revalues obsolete inventory as having no net realizable value and writes off its full carrying value. The Company has consistently applied this methodology. The Company believes that this approach is prudent and makes suitable provisions for slow moving and obsolete inventory. When provisions are established, a new cost basis of the inventory is created.
Sales Incentive and Advertising Allowances
The Company records estimated reductions to revenues for sales incentives, primarily rebates for volume discounts, and allowances for co-operative advertising.
Allowances for Sales Discounts
The Company records estimated reductions to revenues for discounts taken on early payment of invoices by its customers.
Warranties
The Company provides product warranties for specific product lines and accrues for estimated future warranty costs, none of which has been material to the consolidated financial statements, in the period in which the sale is recorded. In a limited number of circumstances, the Company may also agree to indemnify customers against legal claims made against those customers by the end users of the Company’s products. Historically, payments made by the Company, if any, under such agreements have not had a material effect on the Company’s consolidated results of operations, cash flows or financial position.
Fair Value of Financial Instruments
The “Fair Value Measurements and Disclosures” topic of the Financial Accounting Standards Board (“FASB”) Accounting Standards CodificationTM (“ASC”) establishes a valuation hierarchy for disclosure of the inputs used to measure fair value. This hierarchy prioritizes the inputs into three broad levels as follows: Level 1 inputs are quoted prices (unadjusted) in active markets for identical assets or liabilities; Level 2 inputs are quoted prices for similar assets and liabilities in active markets or inputs that are observable for the asset or liability, either directly or indirectly through market corroboration, for substantially the full term of the financial instrument; Level 3 inputs are unobservable inputs based on the Company’s assumptions used to measure assets and liabilities at fair value. A financial asset’s or liability’s classification within the hierarchy is determined based on the lowest level input that is significant to the fair value measurement.
As of December 31, 2009, the Company’s investments consisted of only United States Treasury securities and money market funds aggregating $154.5 million, which are maintained in cash equivalents and are carried at cost, approximating fair value, based on Level 1 inputs.
Property, Plant and Equipment
Property, plant and equipment are carried at cost. Major renewals and betterments are capitalized. Maintenance and repairs are expensed on a current basis. When assets are sold or retired, their costs and accumulated depreciation are removed from the accounts, and the resulting gains or losses are reflected in the consolidated statements of operations.
The “Intangibles—Goodwill and Other” topic of the FASB ASC provides guidance on capitalization of the costs incurred for computer software developed or obtained for internal use. The Company capitalizes substantially all external costs and qualifying internal costs related to the purchase and implementation of software projects used for business operations and engineering design activities. Capitalized software costs primarily include purchased software and external consulting fees. Capitalized software projects are amortized over the estimated useful lives of the software.
Depreciation and Amortization
Depreciation of property, plant and equipment is provided for using accelerated methods over the following estimated useful lives:
|
Software |
|
3 to 5 years |
|
Machinery and equipment |
|
3 to 10 years |
|
Buildings and site improvements |
|
15 to 45 years |
Leasehold improvements are amortized using the straight-line method over the shorter of the expected life or the remaining term of the lease. Amortization of purchased intangible assets with finite useful lives is computed using the straight-line method over the estimated useful lives of the assets.
Cost of Sales
The types of costs included in cost of sales include material, labor, factory and tooling overhead, shipping, and freight costs. Major components of these expenses are material costs, such as steel, packaging and cartons, personnel costs and facility costs such as rent, depreciation and utilities related to the production and distribution of the Company’s products. Inbound freight charges, purchasing and receiving costs, inspection costs, warehousing costs, internal transfer costs, and other costs of the Company’s distribution network are also included in cost of sales.
Tool and Die Costs
Tool and die costs are included in product costs in the year incurred.
Shipping and Handling Fees and Costs
The Company’s general shipping terms are F.O.B. shipping point. Shipping and handling fees and costs are included in revenues and product costs, as appropriate, in the year incurred.
Product Research and Development Costs
Product research and development costs, which are included in operating expenses and are charged against income as incurred, were $6.5 million, $7.0 million and $6.0 million in 2009, 2008 and 2007, respectively. The types of costs included as product research and development expenses are typically related to salaries and benefits and supplies. The Company amortizes acquired patents over their remaining lives and performs periodic reviews for impairment. The cost of internally developed patents is expensed as incurred.
Selling Costs
Selling costs include expenses associated with selling, merchandising and marketing the Company’s products. Major components of these expenses are personnel, sales commissions, facility costs such as rent, depreciation and utilities, professional services, information technology related costs, sales promotion, advertising, literature and trade shows.
Advertising Costs
Advertising costs are included in selling expenses, are expensed when the advertising occurs, and were $6.0 million, $9.6 million and $9.5 million in 2009, 2008 and 2007, respectively.
General and Administrative Costs
General and administrative costs include personnel, information technology related costs, facility costs such as rent, depreciation and utilities, professional services, amortization of intangibles and bad debt charges.
Income Taxes
Income taxes are calculated using an asset and liability approach. The provision for income taxes includes federal, state and foreign taxes currently payable and deferred taxes, due to temporary differences between the financial statement and tax bases of assets and liabilities. In addition, future tax benefits are recognized to the extent that realization of such benefits is more likely than not.
Sales Taxes
Pursuant to the “Revenue Recognition” topic of the FASB ASC, the Company presents taxes collected and remitted to governmental authorities on a net basis in the accompanying consolidated statements of operations.
Foreign Currency Translation
The local currency is the functional currency of the Company’s operations in Europe, Canada, Asia, Australia and New Zealand. Assets and liabilities denominated in foreign currencies are translated using the exchange rate on the balance sheet date. Revenues and expenses are translated using average exchange rates prevailing during the year. The translation adjustment resulting from this process is shown separately as a component of stockholders’ equity. Foreign currency transaction gains or losses are included in general and administrative expenses and have not been significant in any of the years presented.
Common Stock
Subject to the rights of holders of any preferred stock that may be issued in the future, holders of common stock are entitled to receive such dividends, if any, as may be declared from time to time by the Board of Directors (the “Board”) out of legally available funds, and in the event of liquidation, dissolution or winding-up of the Company, to share ratably in all assets available for distribution. The holders of common stock have no preemptive or conversion rights. Subject to the rights of any preferred stock that may be issued in the future, the holders of common stock are entitled to one vote per share on any matter submitted to a vote of the stockholders, except that, subject to compliance with pre-meeting notice and other conditions pursuant to the Company’s Bylaws, stockholders may cumulate their votes in an election of directors, and each stockholder may give one candidate a number of votes equal to the number of directors to be elected multiplied by the number of shares held by such stockholder or may distribute such stockholder’s votes on the same principle among as many candidates as such stockholder thinks fit. There are no redemption or sinking fund provisions applicable to the common stock.
In 1999, the Company declared a dividend distribution of one Right to purchase Series A Participating preferred stock per share of common stock. The Rights will be exercisable, unless redeemed earlier by the Company, if a person or group acquires, or obtains the right to acquire, 15% or more of the outstanding shares of common stock or commences a tender or exchange offer that would result in it acquiring 15% or more of the outstanding shares of common stock, either event occurring without the prior consent of the Company. The amount of Series A Participating preferred stock that the holder of a Right is entitled to receive and the purchase price payable on exercise of a Right are both subject to adjustment. Any person or group that acquires 15% or more of the outstanding shares of common stock without the prior consent of the Company would not be entitled to this purchase. Any stockholder who held 25% or more of the Company’s common stock when the Rights were originally distributed would not be treated as having acquired 15% or more of the outstanding shares unless such stockholder’s ownership is increased to more than 40% of the outstanding shares.
The Rights will expire on June 14, 2019, or they may be redeemed by the Company at one cent per Right prior to that date. The Rights do not have voting or dividend rights and, until they become exercisable, have no dilutive effect on the earnings of the Company. One million shares of the Company’s preferred stock have been designated Series A Participating preferred stock and reserved for issuance on exercise of the Rights. No event during 2009 made the Rights exercisable.
Preferred Stock
The Board has the authority to issue the authorized and unissued preferred stock in one or more series with such designations, rights and preferences as may be determined from time to time by the Board. Accordingly, the Board is empowered, without stockholder approval, to issue preferred stock with dividend, redemption, liquidation, conversion, voting or other rights that could adversely affect the voting power or other rights of the holders of the Company’s common stock.
Net Income per Common Share
Basic net income per common share is computed based on the weighted average number of common shares outstanding. Potentially dilutive shares, using the treasury stock method, are included in the diluted per-share calculations for all periods when the effect of their inclusion is dilutive.
The following is a reconciliation of basic earnings per share (“EPS”) to diluted EPS:
|
|
|
Years ended December 31, |
|
||||||||||||||||||||||
|
|
|
2009 |
|
2008 |
|
2007 |
|
||||||||||||||||||
|
|
|
|
|
Weighted |
|
|
|
|
|
Weighted |
|
|
|
|
|
Weighted |
|
|
|
||||||
|
(in thousands, except |
|
Net |
|
Average |
|
Per |
|
Net |
|
Average |
|
Per |
|
Net |
|
Average |
|
Per |
|
||||||
|
per-share amounts) |
|
Income |
|
Shares |
|
Share |
|
Income |
|
Shares |
|
Share |
|
Income |
|
Shares |
|
Share |
|
||||||
|
Basic EPS |
|
|
|
|
|
|
|
|
|
|
|
|
|
|
|
|
|
|
|
||||||
|
Income available to common stockholders |
|
$ |
12,217 |
|
49,135 |
|
$ |
0.25 |
|
$ |
53,934 |
|
48,636 |
|
$ |
1.11 |
|
$ |
68,742 |
|
48,472 |
|
$ |
1.42 |
|
|
|
|
|
|
|
|
|
|
|
|
|
|
|
|
|
|
|
|
|
|
||||||
|
Effect of Dilutive Securities |
|
|
|
|
|
|
|
|
|
|
|
|
|
|
|
|
|
|
|
||||||
|
Stock options |
|
— |
|
121 |
|
— |
|
— |
|
334 |
|
(0.01 |
) |
— |
|
456 |
|
(0.02 |
) |
||||||
|
|
|
|
|
|
|
|
|
|
|
|
|
|
|
|
|
|
|
|
|
||||||
|
Diluted EPS |
|
|
|
|
|
|
|
|
|
|
|
|
|
|
|
|
|
|
|
||||||
|
Income available to common stockholders |
|
$ |
12,217 |
|
49,256 |
|
$ |
0.25 |
|
$ |
53,934 |
|
48,970 |
|
$ |
1.10 |
|
$ |
68,742 |
|
48,928 |
|
$ |
1.40 |
|
Anti-dilutive shares attributable to outstanding stock options were excluded from the calculation of diluted net income per share. For the years ended December 31, 2009, 2008, and 2007, 1.0 million, 1.1 million and 1.0 million shares, respectively, subject to stock options were anti-dilutive.
The potential tax benefits derived from the amount of the average stock price for the period in excess of the grant date fair value of stock options, known as the windfall tax benefit, is added to the proceeds of stock option exercises under the treasury stock method for computing the amount of dilutive securities used to determine the outstanding shares for the calculation of diluted earnings per share.
Comprehensive Income
Comprehensive income, which is included in the consolidated statements of stockholders’ equity, is defined as net income plus other comprehensive income. Other comprehensive income consists of changes in foreign currency translation adjustments recorded directly into stockholders’ equity. The components of accumulated other comprehensive income as of December 31, 2009, were $18.8 million, net of tax of $0.9 million, and as of December 31, 2008, were $5.7 million, net of tax of $0.9 million, all of which comprised foreign currency translation adjustments.
Concentration of Credit Risk
Financial instruments that potentially subject the Company to concentrations of credit risk consist of cash in banks, short-term investments in United States Treasury securities, money market funds and trade accounts receivable. The Company maintains its cash in demand deposit and money market accounts held primarily at seven banks.
Accounting for Stock-Based Compensation
The Company maintains two stock option plans under which it may grant incentive stock options and non-qualified stock options, although the Company has granted only non-qualified stock options under these plans. The Simpson Manufacturing Co., Inc. 1994 Stock Option Plan (the “1994 Plan”) is principally for the Company’s employees, and the Simpson Manufacturing Co., Inc. 1995 Independent Director Stock Option Plan (the “1995 Plan”) is for its independent directors. The Company generally grants options under each of the 1994 Plan and the 1995 Plan once each year. The exercise price per share of each option granted in February 2009, February 2008 and April 2008 under the 1994 Plan equaled the closing market price per share of the Company’s common stock as reported by the New York Stock Exchange on the day preceding the day that the Compensation Committee of the Company’s Board of Directors met to approve the grant of the options. The exercise price per share under each option granted under the 1995 Plan is at the fair market value on the date specified in the 1995 Plan. Options vest and expire according to terms established at the grant date.
Under the 1994 Plan, no more than 16 million shares of the Company’s common stock may be sold (including shares already sold) pursuant to all options granted under the 1994 Plan. Under the 1995 Plan, no more than 320 thousand shares of common stock may be sold (including shares already sold) pursuant to all options granted under the 1995 Plan. Options granted under the 1994 Plan typically vest evenly over the requisite service period of four years and have a term of seven years. The vesting of options granted under the 1994 Plan will be accelerated if the grantee ceases to be employed by the Company after reaching age sixty or if there is a change in control of the Company. Options granted under the 1995 Plan are fully vested on the date of grant.
The following table represents the Company’s stock option activity for the years ended December 31, 2009, 2008 and 2007:
|
|
|
Years Ended December 31, |
|
|||||||
|
(in thousands) |
|
2009 |
|
2008 |
|
2007 |
|
|||
|
|
|
|
|
|
|
|
|
|||
|
Stock option expense recognized in operating expenses |
|
$ |
1,746 |
|
$ |
3,400 |
|
$ |
5,906 |
|
|
|
|
|
|
|
|
|
|
|||
|
Tax benefit of stock option expense in provision for income taxes |
|
544 |
|
1,341 |
|
2,330 |
|
|||
|
|
|
|
|
|
|
|
|
|||
|
Stock option expense, net of tax |
|
$ |
1,202 |
|
$ |
2,059 |
|
$ |
3,576 |
|
|
|
|
|
|
|
|
|
|
|||
|
Fair value of shares vested |
|
$ |
1,690 |
|
$ |
3,249 |
|
$ |
5,893 |
|
|
|
|
|
|
|
|
|
|
|||
|
Proceeds to the Company from the exercise of stock options |
|
$ |
7,627 |
|
$ |
6,881 |
|
$ |
4,832 |
|
|
|
|
|
|
|
|
|
|
|||
|
Tax benefit from exercise of stock options, including windfall (shortfall) tax benefits |
|
$ |
(445 |
) |
$ |
376 |
|
$ |
554 |
|
|
|
|
At December 31, |
|
|||||||
|
(in thousands) |
|
2009 |
|
2008 |
|
2007 |
|
|||
|
|
|
|
|
|
|
|
|
|||
|
Stock option cost capitalized in inventory |
|
$ |
45 |
|
$ |
101 |
|
$ |
252 |
|
The stock compensation expense included in cost of sales, research and development and engineering, selling, or general and administrative expenses depend on the job functions performed by the employees to whom the stock options were granted. Shares of common stock issued on exercise of stock options under the plans are registered under the Securities Act of 1933.
The assumptions used to calculate the fair value of options granted are evaluated and revised, as necessary, to reflect market conditions and the Company’s experience.
Under the 1994 Plan, the Company allows for full vesting on ceasing to be employed by the Company if the employee becomes “retirement-eligible” by reaching age sixty. Prior to the adoption of revised stock compensation guidance in the “Compensation — Stock Compensation” topic of the FASB ASC in 2006, stock-based employee compensation expense was recorded over the nominal vesting period and if a retirement-eligible employee retired before the end of the vesting period, the Company recorded unrecognized compensation cost at the date of retirement (the “nominal vesting period approach”). The nominal vesting period is four years of service subsequent to the grant date. The “non-substantive vesting period approach” specifies that awards, in substance, become vested when the employee’s retention of the award is no longer contingent on providing service. Under this approach, the unrecorded compensation cost is expensed when that condition is met even if the employee continues providing service to the Company. This would be the case for existing grants when an employee becomes retirement-eligible, as well as when a retirement-eligible employee is granted an award.
Goodwill
The Company reviews for impairment its indefinite lived intangible assets annually, in the fourth quarter of each year, and whenever events or changes in circumstances indicate the carrying value of an asset may not be recoverable in accordance with the “Intangibles—Goodwill and Other” topic of the FASB ASC. These events or circumstances could include a significant change in the business climate, legal factors, operating performance indicators, competition, or disposition or relocation of a significant portion of a reporting unit. This topic requires that management perform a two-step impairment test on goodwill. In the first step, management compares the fair value of each reporting unit to its carrying value. The fair value calculation uses discounted cash flow model and may be supplemented by market approaches if information is readily available. If the carrying value of the net assets assigned to the reporting unit exceeds the fair value of the reporting unit, a second step of the impairment test must be performed to determine the implied fair value of the reporting unit’s goodwill. If the carrying value of a reporting unit’s goodwill exceeds its implied fair value, an impairment charge equal to the difference between the implied fair value of the goodwill and the carrying cost would be recorded.
Determining the fair value of a reporting unit or an indefinite-lived purchased intangible asset is a judgment involving significant estimates and assumptions. These estimates and assumptions include revenue growth rates and operating margins used to calculate projected future cash flows, risk-adjusted discount rates, and future economic and market conditions. The Company bases its fair value estimates on assumptions that management believes to be reasonable but that are unpredictable and inherently uncertain. Actual future results may differ from those estimates. The $3.0 million impairment charge taken in 2008, which was a result of the Company’s annual impairment test in the fourth quarter of 2008, was associated with assets that were acquired in England in 1999 and was associated with the Company’s U.K. reporting unit. The reporting unit’s carrying value exceeded the fair value, primarily due to reduced future expected net cash flows. The method to determine the fair value of the U.K. reporting unit was a discounted cash flow model. The $10.7 million impairment charge taken in 2007 was primarily attributed to the decision by the Company, in October 2007, to move production of certain products from the Canadian reporting unit to China in late 2008 and early 2009. The method to determine the fair value of the Canadian reporting unit was a combination of a discounted cash flow model and market approaches. The market approaches were based on multiples realized by similar public companies and on representative merger and acquisition transactions of a similar nature and industry. At December 31, 2009, the remaining balances of goodwill of the U.K. and Canadian reporting units were $1.3 million and $3.7 million, respectively. The Company’s annual goodwill impairment analysis did not result in any impairment charges in 2009 or any additional impairment charges in 2008 or 2007.
The changes in the carrying amount of goodwill as of December 31, 2008 and 2009, were as follows:
|
|
|
Connector |
|
Venting |
|
|
|
|||
|
(in thousands) |
|
Products |
|
Products |
|
Total |
|
|||
|
Balance at January 1, 2008: |
|
|
|
|
|
|
|
|||
|
Goodwill |
|
$ |
68,084 |
|
$ |
— |
|
$ |
68,084 |
|
|
Accumulated impairment losses |
|
(10,666 |
) |
— |
|
(10,666 |
) |
|||
|
|
|
57,418 |
|
— |
|
57,418 |
|
|||
|
|
|
|
|
|
|
|
|
|||
|
Goodwill Acquired |
|
14,163 |
|
2,975 |
|
17,138 |
|
|||
|
Adjustments due to recognition of deferred tax assets |
|
— |
|
1,439 |
|
1,439 |
|
|||
|
Impairment losses |
|
(2,964 |
) |
— |
|
(2,964 |
) |
|||
|
Foreign exchange |
|
(4,412 |
) |
— |
|
(4,412 |
) |
|||
|
|
|
|
|
|
|
|
|
|||
|
Balance as of December 31, 2008: |
|
|
|
|
|
|
|
|||
|
Goodwill |
|
77,835 |
|
4,414 |
|
82,249 |
|
|||
|
Accumulated impairment losses |
|
(13,630 |
) |
— |
|
(13,630 |
) |
|||
|
|
|
64,205 |
|
4,414 |
|
68,619 |
|
|||
|
|
|
|
|
|
|
|
|
|||
|
Goodwill Acquired |
|
11,109 |
|
— |
|
11,109 |
|
|||
|
Adjustments due to recognition of deferred tax assets |
|
3,474 |
|
(1 |
) |
3,473 |
|
|||
|
Reclassifications |
|
(4,166 |
) |
22 |
|
(4,144 |
) |
|||
|
Foreign exchange |
|
2,569 |
|
— |
|
2,569 |
|
|||
|
|
|
|
|
|
|
|
|
|||
|
Balance as of December 31, 2009: |
|
|
|
|
|
|
|
|||
|
Goodwill |
|
90,821 |
|
4,435 |
|
95,256 |
|
|||
|
Accumulated impairment losses |
|
(13,630 |
) |
— |
|
(13,630 |
) |
|||
|
|
|
$ |
77,191 |
|
$ |
4,435 |
|
$ |
81,626 |
|
The goodwill associated with the venting products operating segment resulted from the acquisitions of the equity of ProTech Systems, Inc. (“ProTech”) and the Ventinox assets that were completed in 2008. The balance of the additions to goodwill resulted from the acquisitions related to the connector products operating segment (see Note 2). The goodwill impairment charges taken in 2008 and 2007 were associated with the connector products operating segment.
Intangible Assets
The total gross carrying amount and accumulated amortization of intangible assets subject to amortization at December 31, 2009, were $41.3 million and $12.4 million, respectively. The aggregate amount of amortization expense of intangible assets for the year ended December 31, 2009, was $6.1 million.
The changes in the carrying amounts of patents, unpatented technologies and non-compete agreements and other intangible assets subject to amortization as of December 31, 2008 and 2009, were as follows:
|
|
|
|
|
Accumulated |
|
|
|
|||
|
(in thousands) |
|
Patents |
|
Amortization |
|
Net Patents |
|
|||
|
|
|
|
|
|
|
|
|
|||
|
Balance at January 1, 2008 |
|
$ |
6,953 |
|
$ |
(2,500 |
) |
$ |
4,453 |
|
|
Amortization |
|
— |
|
(630 |
) |
(630 |
) |
|||
|
Foreign exchange |
|
(24 |
) |
— |
|
(24 |
) |
|||
|
Balance at December 31, 2008 |
|
6,929 |
|
(3,130 |
) |
3,799 |
|
|||
|
Amortization |
|
— |
|
(628 |
) |
(628 |
) |
|||
|
Foreign exchange |
|
10 |
|
— |
|
10 |
|
|||
|
Balance at December 31, 2009 |
|
$ |
6,939 |
|
$ |
(3,758 |
) |
$ |
3,181 |
|
|
|
|
|
|
|
|
Net |
|
|||
|
|
|
Unpatented |
|
Accumulated |
|
Unpatented |
|
|||
|
|
|
Technology |
|
Amortization |
|
Technology |
|
|||
|
|
|
|
|
|
|
|
|
|||
|
Balance at January 1, 2008 |
|
$ |
3,835 |
|
$ |
(2,461 |
) |
$ |
1,374 |
|
|
Amortization |
|
— |
|
(767 |
) |
(767 |
) |
|||
|
Balance at December 31, 2008 |
|
3,835 |
|
(3,228 |
) |
607 |
|
|||
|
Acquisition |
|
1,070 |
|
— |
|
1,070 |
|
|||
|
Reclassifications |
|
1,866 |
|
— |
|
1,866 |
|
|||
|
Amortization |
|
— |
|
(1,088 |
) |
(1,088 |
) |
|||
|
Foreign exchange |
|
26 |
|
— |
|
26 |
|
|||
|
Write-off fully amortized asset |
|
(3,835 |
) |
3,835 |
|
— |
|
|||
|
Balance at December 31, 2009 |
|
$ |
2,962 |
|
$ |
(481 |
) |
$ |
2,481 |
|
|
|
|
|
|
|
|
Net |
|
|||
|
|
|
Non-Compete |
|
|
|
Non-Compete |
|
|||
|
|
|
Agreements, |
|
|
|
Agreements, |
|
|||
|
|
|
Trademarks |
|
Accumulated |
|
Trademarks |
|
|||
|
|
|
and Other |
|
Amortization |
|
and Other |
|
|||
|
|
|
|
|
|
|
|
|
|||
|
Balance at January 1, 2008 |
|
$ |
7,166 |
|
$ |
(2,107 |
) |
$ |
5,059 |
|
|
Acquisition |
|
2,793 |
|
— |
|
2,793 |
|
|||
|
Amortization |
|
— |
|
(1,555 |
) |
(1,555 |
) |
|||
|
Write-off fully amortized asset |
|
(1,696 |
) |
1,696 |
|
— |
|
|||
|
Foreign exchange |
|
(270 |
) |
— |
|
(270 |
) |
|||
|
Balance at December 31, 2008 |
|
7,993 |
|
(1,966 |
) |
6,027 |
|
|||
|
Acquisition |
|
90 |
|
— |
|
90 |
|
|||
|
Reclassifications |
|
240 |
|
— |
|
240 |
|
|||
|
Amortization |
|
— |
|
(1,547 |
) |
(1,547 |
) |
|||
|
Foreign exchange |
|
62 |
|
— |
|
62 |
|
|||
|
Write-off fully amortized asset |
|
(290 |
) |
290 |
|
— |
|
|||
|
Balance at December 31, 2009 |
|
$ |
8,095 |
|
$ |
(3,223 |
) |
$ |
4,872 |
|
|
|
|
|
|
|
|
Net |
|
|||
|
|
|
Customer |
|
Accumulated |
|
Customer |
|
|||
|
|
|
Relationships |
|
Amortization |
|
Relationships |
|
|||
|
|
|
|
|
|
|
|
|
|||
|
Balance at January 1, 2008 |
|
$ |
14,095 |
|
$ |
(1,742 |
) |
$ |
12,353 |
|
|
Acquisition |
|
2,886 |
|
— |
|
2,886 |
|
|||
|
Amortization |
|
— |
|
(2,112 |
) |
(2,112 |
) |
|||
|
Foreign exchange |
|
(107 |
) |
— |
|
(107 |
) |
|||
|
Balance at December 31, 2008 |
|
16,874 |
|
(3,854 |
) |
13,020 |
|
|||
|
Acquisition |
|
5,880 |
|
— |
|
5,880 |
|
|||
|
Reclassifications |
|
1,786 |
|
— |
|
1,786 |
|
|||
|
Amortization |
|
— |
|
(2,865 |
) |
(2,865 |
) |
|||
|
Foreign exchange |
|
497 |
|
— |
|
497 |
|
|||
|
Write-off fully amortized asset |
|
(1,755 |
) |
1,755 |
|
— |
|
|||
|
Balance at December 31, 2009 |
|
$ |
23,282 |
|
$ |
(4,964 |
) |
$ |
18,318 |
|
Intangible assets, net, by segment were as follows:
|
|
|
At December 31, 2008 |
|
|||||||
|
|
|
Gross |
|
|
|
Net |
|
|||
|
|
|
Carrying |
|
Accumulated |
|
Carrying |
|
|||
|
|
|
Amount |
|
Amortization |
|
Amount |
|
|||
|
|
|
|
|
|
|
|
|
|||
|
Connector Products |
|
$ |
32,669 |
|
$ |
(11,780 |
) |
$ |
20,889 |
|
|
Venting Products |
|
2,962 |
|
(398 |
) |
2,564 |
|
|||
|
Total |
|
$ |
35,631 |
|
$ |
(12,178 |
) |
$ |
23,453 |
|
|
|
|
At December 31, 2009 |
|
|||||||
|
|
|
Gross |
|
|
|
Net |
|
|||
|
|
|
Carrying |
|
Accumulated |
|
Carrying |
|
|||
|
|
|
Amount |
|
Amortization |
|
Amount |
|
|||
|
|
|
|
|
|
|
|
|
|||
|
Connector Products |
|
$ |
37,987 |
|
$ |
(11,182 |
) |
$ |
26,805 |
|
|
Venting Products |
|
3,291 |
|
(1,244 |
) |
2,047 |
|
|||
|
Total |
|
$ |
41,278 |
|
$ |
(12,426 |
) |
$ |
28,852 |
|
At December 31, 2009, estimated future amortization of intangible assets was as follows:
|
(in thousands) |
|
|
|
|
|
2010 |
|
$ |
5,082 |
|
|
2011 |
|
5,010 |
|
|
|
2012 |
|
4,124 |
|
|
|
2013 |
|
3,186 |
|
|
|
2014 |
|
3,060 |
|
|
|
Thereafter |
|
8,390 |
|
|
|
|
|
$ |
28,852 |
|
Adoption of Statements of Financial Accounting Standards
Effective January 1, 2009, the Company adopted the revised business combinations guidance codified as the “Business Combinations” topic of the FASB ASC. This revised guidance requires the acquiring entity in a business combination to recognize the full fair value of assets acquired and liabilities assumed in the transaction (whether a full or partial acquisition); establishes the acquisition-date fair value as the measurement objective for all assets acquired and liabilities assumed; requires expensing of most transaction and restructuring costs; and requires the acquirer to disclose to investors and other users the information needed to evaluate and understand the nature and financial effect of the business combination. The revised business combination guidance applies to all transactions or other events in which the Company obtains control of one or more businesses, including combinations achieved without the transfer of consideration, such as by contract alone or through the lapse of minority veto rights. This guidance applies prospectively to business combinations for which the acquisition date is on or after January 1, 2009, except that resolution of certain tax contingencies and adjustments to valuation allowances related to business combinations, which previously were adjusted to goodwill, will be adjusted to income tax expense for all such adjustments after January 1, 2009, regardless of the date of the original business combination. While this guidance did not have a material effect on the Company’s consolidated financial statements on adoption, the effects on future periods will depend on the nature and significance of future business combinations subject to this guidance.
Effective January 1, 2009, the Company adopted the revised guidance codified in the “Intangibles—Goodwill and Other” topic of the FASB ASC. This guidance removes the requirement of prior guidance for an entity to consider, when determining the useful life of a recognized intangible asset, whether an intangible asset can be renewed without substantial cost or material modifications to the existing terms and conditions. This guidance requires an entity to consider its own historical experience in developing renewal or extension assumptions. In the absence of entity-specific experience, this guidance requires an entity to consider assumptions that a marketplace participant would use about renewal or extension that are consistent with the highest and best use of the asset by a marketplace participant. This guidance is effective prospectively for all intangible assets acquired after its effective date, with additional disclosures required for all recognized intangible assets as of the effective date. The adoption of this guidance did not have a material effect on the Company’s consolidated financial statements.
In April 2009, the FASB issued new guidance to the “Business Combinations” topic of the FASB ASC, which applies to all assets and liabilities assumed in a business combination that would be within the scope of the “Contingencies” topic of the FASB ASC, if not acquired in a business combination, except for assets or liabilities arising from contingencies that are subject to specific guidance in the “Business Combinations” topic of the FASB ASC. An acquirer must recognize at fair value, at the acquisition date, an asset or liability assumed in a business combination that arises from a contingency if the acquisition-date fair value of that asset or liability can be determined during the measurement period. If the acquisition-date fair value of an asset acquired or liability assumed in a business combination that arises from a contingency cannot be determined during the measurement period, an asset or liability must be recognized at the acquisition date if both information available before the end of the measurement period indicates that it is probable that an asset existed or that a liability had been incurred at the acquisition date and the amount of the assets or liability can be reasonably estimated. This new guidance became effective for the Company for business combinations for which the acquisition date was on or after January 1, 2009, and has not and is not currently expected to have a material effect on the Company’s consolidated financial statements.
In May 2009, the FASB issued guidance codified in the “Subsequent Events” topic of the FASB ASC, which establishes general standards of accounting for, and disclosure of, events that occur after the balance sheet date but before the financial statements are issued or are available to be issued. The subsequent events guidance requires the disclosure of the date through which an entity has evaluated subsequent events and is effective for interim and annual reporting periods ending after June 15, 2009. The Company adopted the new disclosure requirements in its June 30, 2009, condensed consolidated financial statements and the adoption did not have a material effect on the Company’s consolidated financial statements.
In June 2009, the FASB issued guidance codified as the “Generally Accepted Accounting Principles” topic of the FASB ASC. The ASC is the sole source of authoritative GAAP for companies that are registered under section 12 of the Securities Exchange Act of 1934. This guidance was effective for financial statements issued for interim and annual periods ending after September 15, 2009. The ASC superseded all then-existing non-SEC accounting and reporting standards, and all other non-grandfathered non-SEC accounting literature not included in the ASC became non-authoritative. This guidance only required a change in disclosure and did not affect the Company’s consolidated financial statements.
Recently Issued Accounting Standards
In June 2009, the FASB issued guidance codified in the “Consolidation” topic of the FASB ASC, amending the accounting and disclosure requirements for the consolidation of variable interest entities. This guidance clarifies the characteristics that identify a variable interest entity (“VIE”) and changes how a reporting entity identifies a primary beneficiary that would consolidate the VIE from a quantitative risks and rewards calculation to a qualitative approach based on which variable interest holder has controlling financial interest and the ability to direct the most significant activities that affect the VIE’s economic performance. This guidance requires the primary beneficiary assessment to be performed on a continuous basis and also requires additional disclosures about an entity’s involvement with the VIE, restrictions on the VIE’s assets and liabilities that are included in the reporting entity’s consolidated balance sheet, significant risk exposures due to the entity’s involvement with the VIE, and how its involvement with a VIE affects the reporting entity’s consolidated financial statements. It is effective for fiscal years beginning after November 15, 2009. The adoption is not currently expected to have a material effect on the Company’s financial statements for its fiscal year ending December 31, 2010.
2. Acquisitions
In July 2007, the Company’s subsidiary, Simpson Strong-Tie, purchased the stock of Swan Secure Products, Inc. (“Swan Secure”) for $42.1 million in cash, net of cash received. Swan Secure is a manufacturer and distributor of fasteners, largely stainless steel, and its products are marketed throughout the United States. Swan Secure expands the Company’s fastener product offerings in its connector products segment. The Company recorded goodwill of $20.1 million, all of which is expected to be deductible for income tax purposes, and intangible assets subject to amortization of $16.7 million as a result of the acquisition. The weighted-average amortization period for the intangible assets is 11.1 years. Tangible assets, net of liabilities assumed, including inventory and trade accounts receivable, accounted for the balance of the purchase price. Swan Secure’s results of operations have been included in the Company’s consolidated results of operations as of the date of the acquisition. Through this acquisition, the Company increased its presence in the stainless-steel fastener market. The Company believes that the additional product line will further its position in the construction products market. These factors contributed to a purchase price in excess of fair market value of Swan Secure’s net tangible and intangible assets acquired, and as a result, the Company has recorded goodwill in connection with the transaction.
In April 2008, the Company’s subsidiary, Simpson Strong-Tie Ireland Limited, purchased certain assets of Liebig International Ltd., an Irish company, Heinrich Liebig Stahldübelwerke GmbH, Liebig GmbH & Co. KG and Liebig International Verwaltungsgesellschaft GmbH, all German companies, Liebig Bolts Limited, an English company, and Liebig International Inc., a Virginia corporation (collectively “Liebig”). Liebig manufactures mechanical anchor products in Ireland and distributes them primarily throughout Europe through warehouses located in Germany and the United Kingdom. Liebig expands the Company’s anchor product offerings in its connector product segment. The purchase price was $19.2 million in cash, including due diligence and transaction costs. The Company recorded goodwill of $7.6 million, none of which is expected to be deductible for income tax purposes, and intangible assets subject to amortization of $2.7 million as a result of the acquisition. The weighted-average amortization period for the intangible assets is 9.6 years. Tangible assets, net of liabilities assumed, including real estate, machinery and equipment, inventory and trade accounts receivable, accounted for the balance of the purchase price. Through this acquisition, the Company increased its presence in the European and Asian anchor markets with metric size products. The Company believes that the additional product line and geographic sales coverage will further its position in the construction products market. These factors contributed to a purchase price in excess of fair market value of Liebig’s net tangible and intangible assets acquired, and as a result, the Company has recorded goodwill in connection with the transaction.
In June 2008, the Company’s subsidiary, Simpson Dura-Vent Company, Inc., purchased the equity of ProTech Systems, Inc., a New York corporation (“ProTech”). ProTech manufactures venting products in New York and distributes them throughout North America. ProTech expands the Company’s product offerings in the venting product segment. The purchase price was $8.3 million in cash, including due diligence and transaction costs and $1.4 million to be paid in the future, plus an additional earn-out of up to $2.25 million if certain future performance targets are met. The Company recorded goodwill of $2.2 million, none of which is expected to be deductible for income tax purposes, and intangible assets subject to amortization of $3.3 million as a result of the acquisition. The weighted-average amortization period for the intangible assets is 4.1 years. Tangible assets, net of liabilities assumed, including machinery and equipment, inventory and trade accounts receivable, accounted for the balance of the purchase price. In July 2008, Simpson Dura-Vent also purchased certain assets to produce the Ventinox stainless steel chimney liner product line from American BOA Inc. ProTech had been the distributor of Ventinox products. The purchase price was $1.6 million in cash, including due diligence and transaction costs. The Company recorded goodwill of $0.7 million, all of which is expected to be deductible for income tax purposes, and intangible assets subject to amortization of $0.1 million. The weighted-average amortization period for the intangible assets is 5.0 years. Through these acquisitions, the Company increased its presence in the venting market with additional products and geographic distribution. The Company believes that the additional product line and geographic distribution will further its position in the venting products market. These factors contributed to a purchase price in excess of fair market value of ProTech’s and Ventinox’s net tangible and intangible assets acquired, and as a result, the Company has recorded goodwill in connection with the transaction.
In July 2008, the Company’s subsidiary, Simpson Strong-Tie Company Inc., purchased the equity of Ahorn-Geräte & Werkzeuge Vertriebs GmbH, a German company, and its subsidiaries Ahorn Upevnovaci Technika s.r.o., a Czech company, and Ahorn Pacific Fasteners (Kunshan) Co., Ltd., a Chinese company (collectively “Ahorn”). The acquisition will broaden Simpson Strong-Tie’s collated fastener product line and add production capacity in Europe. The purchase price was $9.2 million in cash, including due diligence and transaction costs. The Company recorded goodwill of $3.3 million, none of which is expected to be deductible for income tax purposes, and intangible assets subject to amortization of $3.9 million, as a result of the acquisition. The weighted-average amortization period for the intangible assets is 7.0 years. Tangible assets, net of liabilities assumed, including machinery and equipment, inventory and trade accounts receivable, accounted for the balance of the purchase price. The Company believes that the additional product lines and geographic production and distribution will further its position in the collated fastener product line markets. These factors contributed to a purchase price in excess of fair market value of Ahorn’s net tangible and intangible assets acquired, and as a result, the Company has recorded goodwill in connection with the transaction.
In January 2009, the Company’s subsidiary, Simpson Strong-Tie Company Inc., acquired the business of RO Design Corp, a Florida corporation doing business as DeckTools, which licenses deck design and estimation software. The software provides professional deck builders, home centers and lumber yards a simple, graphics-driven solution for designing decks and estimating material and labor costs for the project. Payments under the purchase agreement total $4.0 million in cash, including $2.5 million to be paid in the future, which will be treated as compensation expense to the principal officer of RO Design Corp, who is now employed by the Company. As a result of the acquisition, the Company recorded goodwill of $0.4 million, all of which is expected to be deductible for income tax purposes, and intangible assets subject to amortization of $1.1 million in the connector products segment. The weighted-average amortization period for the intangible assets is 6.0 years. The Company believes that the software will add software-related sales and further its position in the connector products market. These factors contributed to a purchase price in excess of fair market value of RO Design’s net tangible and intangible assets acquired, and as a result, the Company has recorded goodwill in connection with the transaction.
In April 2009, the Company’s subsidiary, Simpson Strong-Tie Europe EURL, purchased the equity of Agence Internationale Commerciale et Industrielle, S.A.S. (“Aginco”). Aginco manufactures a line of high-quality builder products and distributes them in France. The purchase price was $22.2 million in cash. Through this acquisition, the Company increased its presence in the connector market primarily in France. The Company believes that the additional presence will further its position in the construction products market. This factor contributed to a purchase price in excess of fair market value of Aginco’s net tangible and intangible assets acquired, and as a result, the Company has recorded goodwill in connection with the transaction of $10.5 million, none of which is expected to be deductible for income tax purposes, and intangible assets subject to amortization of $6.0 million in the connector products segment. The weighted-average amortization period for the intangible assets is 7.9 years. Tangible assets, net of liabilities assumed, including machinery and equipment, inventory and trade accounts receivable, accounted for the balance of the purchase price. The Company believes that the increased presence will further its position in the European connector products market. This factor contributed to a purchase price in excess of fair market value of Aginco’s net tangible and intangible assets acquired, and as a result, the Company has recorded goodwill in connection with the transaction.
The results of operations of the businesses acquired in 2009 are included in the Company’s consolidated results of operations since the respective dates of the acquisitions. Results of operations for periods prior to the 2009 acquisitions were not material to the Company on either an individual or aggregate basis, and accordingly, pro forma results of operations have not been presented.
3. Trade Accounts Receivable, net
Trade accounts receivable consisted of the following:
|
|
|
December 31, |
|
||||
|
(in thousands) |
|
2009 |
|
2008 |
|
||
|
|
|
|
|
|
|
||
|
Trade accounts receivable |
|
$ |
83,892 |
|
$ |
81,929 |
|
|
Allowance for doubtful accounts |
|
(4,667 |
) |
(4,368 |
) |
||
|
Allowance for sales discounts |
|
(1,908 |
) |
(1,556 |
) |
||
|
|
|
$ |
77,317 |
|
$ |
76,005 |
|
The Company sells products on credit and generally does not require collateral. The Company’s largest customer accounted for 10% of trade accounts receivable as of December 31, 2009. Due to the financial condition of another customer, the Company in 2009 and 2008 reserved $0.6 million and $2.0 million, respectively, that it believes it is not likely to collect.
4. Inventories
The components of inventories consisted of the following:
|
|
|
December 31, |
|
||||
|
(in thousands) |
|
2009 |
|
2008 |
|
||
|
|
|
|
|
|
|
||
|
Raw materials |
|
$ |
61,408 |
|
$ |
92,638 |
|
|
In-process products |
|
21,113 |
|
26,371 |
|
||
|
Finished products |
|
81,233 |
|
132,869 |
|
||
|
|
|
$ |
163,754 |
|
$ |
251,878 |
|
5. Property, Plant and Equipment, net
Property, plant and equipment consisted of the following:
|
|
|
December 31, |
|
||||
|
(in thousands) |
|
2009 |
|
2008 |
|
||
|
|
|
|
|
|
|
||
|
Land |
|
$ |
23,729 |
|
$ |
23,989 |
|
|
Buildings and site improvements |
|
148,381 |
|
135,992 |
|
||
|
Leasehold improvements |
|
3,893 |
|
4,287 |
|
||
|
Machinery and equipment |
|
226,436 |
|
219,641 |
|
||
|
|
|
402,439 |
|
383,909 |
|
||
|
Less accumulated depreciation and amortization |
|
(216,157 |
) |
(193,639 |
) |
||
|
|
|
186,282 |
|
190,270 |
|
||
|
Capital projects in progress |
|
1,532 |
|
3,048 |
|
||
|
|
|
$ |
187,814 |
|
$ |
193,318 |
|
Included in property, plant and equipment at December 31, 2009 and 2008, are fully depreciated assets with an original cost of $105.8 million and $96.7 million, respectively. These fully depreciated assets are still in use in the Company’s operations.
Depreciation expense for the years ended December 31, 2009, 2008 and 2007, was $23.1 million, $25.0 million and $24.7 million, respectively.
In April 2008, the Company completed the sale of its vacant warehouse in McKinney, Texas, previously classified as an asset held for sale, for $1.8 million, and no significant gain or loss was realized. The Company’s vacant facility in San Leandro, California, remains classified as an asset held for sale as of December 31, 2009, consistent with the classification at December 31, 2008, and is being actively marketed. These facilities are associated with the connector segment.
The Company plans to sell its facility in Vicksburg, Mississippi, and will cease use of it around that time. As of December 31, 2009, this property did not qualify for held-for-sale accounting treatment, as the Company continues to use this facility as a warehouse, and the Company expects to record a charge in the range of $2 million to $3 million, based on current market conditions, when the held-for-sale accounting treatment is met.
The Company expects, in March 2010, to acquire a facility in San Bernadino, California, for $19.2 million, in which it will consolidate its owned manufacturing and warehouse facilities in Brea, California, and its leased warehouse in Ontario, California. The Company intends to sell the Brea facilities.
6. Investments
At December 31, 2009, the Company had a 40.6% equity interest in Keymark Enterprises, LLC (“Keymark”), for which the Company accounts using the equity method. Keymark develops software that assists in designing and engineering residential structures. The Company’s relationship with Keymark includes the specification of the Company’s products in the Keymark software. The Company has no obligation to make any additional capital contributions to Keymark. In October 2008, the Company made an additional voluntary capital contribution of $0.7 million to Keymark and at the same time lent $1.3 million to Keymark’s other owner, which concurrently contributed that amount to Keymark’s capital. Keymark’s other owner pledged 10% of equity interest (subject to adjustment) in Keymark for the loan and interest. The Company’s sole recourse is to this equity interest. Of the $1.3 million loan, $0.7 million remained outstanding at December 31, 2009. In October 2009, the Company foreclosed on a 5.6% equity interest in Keymark, which brought the Company’s equity interest to its current equity interest of 40.6%, due to a default by Keymark’s other owner under terms of the loan and pledge agreement. The loan bears interest at the annual rate of 6%. The remaining amounts outstanding will mature in October 2010. The loan is backed by the pledge of the additional ownership interest in Keymark of 5% (subject to adjustment) and is non-recourse.
7. Accrued Liabilities
Accrued liabilities consisted of the following:
|
|
|
December 31, |
|
||||
|
(in thousands) |
|
2009 |
|
2008 |
|
||
|
|
|
|
|
|
|
||
|
Sales incentive and advertising accruals |
|
$ |
11,823 |
|
$ |
14,916 |
|
|
Labor related liabilities |
|
4,950 |
|
4,667 |
|
||
|
Vacation liability |
|
5,449 |
|
5,418 |
|
||
|
Dividend payable |
|
4,939 |
|
4,897 |
|
||
|
Other |
|
2,048 |
|
4,204 |
|
||
|
|
|
$ |
29,209 |
|
$ |
34,102 |
|
8. Debt
The outstanding debt at December 31, 2009 and 2008, and the available credit at December 31, 2009, consisted of the following:
|
|
|
Available on |
|
|
|
|||||
|
|
|
Credit Facility |
|
Debt Outstanding |
|
|||||
|
|
|
at December 31, |
|
at December 31, |
|
|||||
|
(dollar amounts in thousands) |
|
2009 |
|
2009 |
|
2008 |
|
|||
|
|
|
|
|
|
|
|
|
|||
|
Revolving line of credit, interest at LIBOR plus 0.27% (at December 31, 2009, LIBOR plus 0.27% was 0.50%), matures October 2012, commitment fees payable at the annual rate of 0.08% on the unused portion of the facility |
|
$ |
200,000 |
|
$ |
— |
|
$ |
— |
|
|
|
|
|
|
|
|
|
|
|||
|
Revolving line of credit, interest at the bank’s base rate plus 3% (at December 31, 2009, the bank’s base rate plus 3% was 3.50%), expires December 2010 |
|
405 |
|
— |
|
— |
|
|||
|
|
|
|
|
|
|
|
|
|||
|
Revolving lines of credit, interest rates between 1.15% and 3.35%, expirations through August 2010 |
|
4,586 |
|
— |
|
26 |
|
|||
|
|
|
204,991 |
|
— |
|
26 |
|
|||
|
Less current portion |
|
|
|
— |
|
(26 |
) |
|||
|
|
|
|
|
$ |
— |
|
$ |
— |
|
|
|
Available credit |
|
$ |
204,991 |
|
|
|
|
|
||
The revolving lines of credit are guaranteed by the Company and its designated subsidiaries.
In October 2007, the Company entered into an unsecured credit agreement with a syndicate of banks providing for a 5-year revolving credit facility of $200 million. The Company has the ability to increase the amount available under the credit agreement by an additional $200 million, to a maximum of $400 million, by obtaining additional commitments from existing lenders or new lenders and satisfying certain other conditions. Under existing conditions in credit markets, the Company does not believe that additional commitments will be available on terms the Company considers reasonable. The Company is required to pay an annual facility fee of 0.08% to 0.10% on the available commitments under the credit agreement, regardless of usage, with the applicable fee determined on a quarterly basis based on the Company’s leverage ratio. Amounts borrowed under the credit agreement will bear interest at an annual rate equal to either, at the Company’s option, (a) the British Bankers Association London Interbank Offered Rate for the appropriate currency appearing on Reuters Screen LIBOR01-02 Page (the “LIBO Rate”) plus a spread of from 0.27% to 0.40%, as determined on a quarterly basis based on the Company’s leverage ratio, or (b) the Base Rate, plus a spread of 0.50%. The Company will pay participation fees for outstanding standby letters of credit at an annual rate equal to the LIBO Rate plus the applicable spreads described in the preceding sentence, and will pay market-based fees for commercial letters of credit. Loans outstanding under the credit agreement may be prepaid at any time without penalty except for LIBO Rate breakage costs and expenses.
The proceeds of loans advanced under the credit agreement and letters of credit issued thereunder may be used for working capital and other general corporate needs of the Company, to pay dividends to the Company’s stockholders or to repurchase outstanding securities of the Company as permitted by the credit agreement, and to finance acquisitions by the Company permitted by the credit agreement. No loans or letters of credit are currently outstanding under the credit agreement.
The Company and its subsidiaries are required to comply with various affirmative and negative covenants. The covenants include provisions that would limit the availability of funds as a result of a material adverse change to the Company’s financial position or results of operations. The Company is in compliance with its financial covenants under the loan agreement.
The Company incurs interest costs, which include interest, maintenance fees and bank charges. The amount of costs incurred, capitalized, and expensed for the years ended December 31, 2009, 2008 and 2007, consisted of the following:
|
|
|
Years Ended December 31, |
|
|||||||
|
(in thousands) |
|
2009 |
|
2008 |
|
2007 |
|
|||
|
|
|
|
|
|
|
|
|
|||
|
Interest costs incurred |
|
$ |
571 |
|
$ |
558 |
|
$ |
481 |
|
|
Less: Interest capitalized |
|
(104 |
) |
(177 |
) |
(252 |
) |
|||
|
Interest expense |
|
$ |
467 |
|
$ |
381 |
|
$ |
229 |
|
9. Commitments and Contingencies
Leases
Certain properties occupied by the Company are leased. The leases expire at various dates through 2019 and generally require the Company to assume the obligations for insurance, property taxes and maintenance of the facilities.
Rental expense for 2009, 2008 and 2007 with respect to all leased property was approximately $6.9 million, $6.6 million and $5.7 million, respectively.
At December 31, 2009, minimum rental commitments under all noncancelable leases were as follows:
|
(in thousands) |
|
|
|
|
|
|
|
|
|
|
|
2010 |
|
$ |
6,149 |
|
|
2011 |
|
4,750 |
|
|
|
2012 |
|
3,796 |
|
|
|
2013 |
|
999 |
|
|
|
2014 |
|
541 |
|
|
|
Thereafter |
|
2,099 |
|
|
|
|
|
$ |
18,334 |
|
Some of these minimum rental commitments contain renewal options and provide for periodic rental adjustments based on changes in the consumer price index or current market rental rates.
The nominal term of Simpson Strong-Tie International Inc.’s (“SSTI’s”) lease in the United Kingdom is 25 years (expiring in 2022) but provides an option to terminate without penalty in either the fifteenth year (2012) or twentieth year (2017) on one year’s written notice by SSTI. Future minimum rental payments associated with the remaining two to three years under the first cancellation option of this lease are included in minimum rental commitments in the table above.
Employee Relations
Approximately 14% of the Company’s employees are represented by labor unions and are covered by collective bargaining agreements. Two of the Company’s collective bargaining agreements cover the Company’s tool and die craftsmen and maintenance workers and its sheetmetal workers in Brea, California. These two contracts expire February 2011 and June 2012, respectively. Simpson Strong-Tie’s facility in Stockton, California, is also a union facility with two collective bargaining agreements, which cover it’s tool and die craftsmen and maintenance workers, and its sheetmetal workers. These two contracts will expire June 2011 and September 2011, respectively.
Environmental
The Company’s policy with regard to environmental liabilities is to accrue for future environmental assessments and remediation costs when information becomes available that indicates that it is probable that the Company is liable for any related claims and assessments and the amount of the liability is reasonably estimable. The Company does not believe that these matters will have a material adverse effect on the Company’s financial condition, cash flows or results of operations. The Company has completed its environmental remediation at its San Leandro, California, facility.
Litigation
From time to time, the Company is involved in litigation that it considers to be in the normal course of its business. The resolution of claims and litigation is subject to inherent uncertainty and could have a material adverse effect on the Company’s financial condition, cash flows and results of operations. No such litigation within the last five years resulted in any material loss.
Four lawsuits (the “Hawaii Cases”) have been filed against the Company in the Hawaii First Circuit Court: Alvarez v. Haseko Homes, Inc. and Simpson Manufacturing, Inc., Civil No. 09-1-2697-11 (“Hawaii Case 1”); Ke Noho Kai Development, LLC v. Simpson Strong-Tie Company, Inc., and Honolulu Wood Treating Co., LTD., Hawaii Case No. 09-1-1491-06 SSM (“Hawaii Case 2”); North American Specialty Ins. Co. v. Simpson Strong-Tie Company, Inc. and K.C. Metal Products, Inc., Case No. 09-1-1490-06 VSM (“Hawaii Case 3”); and Charles et al. v. Haseko Homes, Inc. et al. and Third Party Plaintiffs Haseko Homes, Inc. et al. v Simpson Strong-Tie Company, Inc., et al., Civil No. 09-1-1932-08 (“Hawaii Case 4”). Hawaii Case 1 was filed on November 18, 2009. Hawaii Cases 2 and 3 were originally filed on June 30, 2009. Hawaii Case 4 was filed on August 19, 2009. The Hawaii Cases all relate to alleged premature corrosion of the Company’s strap tie holdown products installed in buildings in a housing development known as Ocean Pointe in Honolulu, Hawaii, allegedly causing property damage. Hawaii Case 1 is a putative class action brought by the owners of allegedly affected Ocean Pointe houses. Hawaii Case 1 was originally filed as Kai et al. v. Haseko Homes, Inc., Haseko Construction, Inc. and Simpson Manufacturing, Inc., Case No. 09-1-1476, but was voluntarily dismissed and then re-filed with a new representative plaintiff. Hawaii Case 2 is an action by the builders and developers of Ocean Pointe against the Company, claiming that either the Company’s strap tie holdowns are defective in design or manufacture or the Company failed to provide adequate warnings regarding the products’ susceptibility to corrosion in certain environments. Hawaii Case 3 is a subrogation action brought by the insurance company for the builders and developers against the Company claiming the insurance company expended funds to correct problems allegedly caused by the Company’s products. Hawaii Case 4, like Hawaii Case 1, is a putative class action brought by owners of allegedly affected Ocean Pointe homes. In Hawaii Case 4, Haseko Homes, Inc. (“Haseko”), the developer of the Ocean Pointe development, has brought a third party complaint against the Company alleging that any damages for which Haseko may be liable are actually the fault of the Company. None of the Hawaii Cases alleges a specific amount of damages sought, although each of the Hawaii Cases seeks compensatory damages, and Hawaii Case 1 seeks punitive damages. The Company is currently investigating the facts underlying the claims asserted in the Hawaii Cases, including, among other things, the cause of the alleged corrosion; the severity of any problems shown to exist; the buildings affected; the responsibility of the general contractor, various subcontractors and other construction professionals for the alleged damages; the amount, if any, of damages suffered; and the costs of repair, if needed. At this time, the likelihood that the Company will be found liable for any property damage allegedly suffered and the extent of such liability, if any, are unknown. Based on facts currently known to the Company, the Company believes that all or part of the claims alleged in the Hawaii Cases may be covered by its insurance policies. The Company intends to defend itself vigorously in connection with the Hawaii Cases.
The Company is not engaged in any other legal proceedings as of the date hereof, which the Company expects individually or in the aggregate to have a material adverse effect on the Company’s financial condition, cash flows or results of operations. Litigation is, however, subject to inherent uncertainties and actual results could differ.
Other
Corrosion, hydrogen enbrittlement, cracking, material hardness, wood pressure-treating chemicals, misinstallations, misuse, design and assembly flaws, environmental conditions or other factors can contribute to failure of fasteners, connectors, tools and venting products. On occasion, some of the fasteners and connectors that the Company sells have failed, although the Company has not incurred any material liability resulting from those failures. The Company attempts to avoid such failures by establishing and monitoring appropriate product specifications, manufacturing quality control procedures, inspection procedures and information on appropriate installation methods and conditions. The Company subjects its products to extensive testing, with results and conclusions published in Company catalogues and on its websites. Based on test results to date, the Company believes that, generally, if its products are appropriately selected, installed and used in accordance with the Company’s guidance, they may be reliably used in appropriate applications.
10. Income Taxes
The provision for income taxes consisted of the following:
|
|
|
Years Ended December 31, |
|
|||||||
|
(in thousands) |
|
2009 |
|
2008 |
|
2007 |
|
|||
|
|
|
|
|
|
|
|
|
|||
|
Current |
|
|
|
|
|
|
|
|||
|
Federal |
|
$ |
15,319 |
|
$ |
28,003 |
|
$ |
40,429 |
|
|
State |
|
3,171 |
|
5,098 |
|
8,313 |
|
|||
|
Foreign |
|
(18 |
) |
3,696 |
|
2,836 |
|
|||
|
Deferred |
|
|
|
|
|
|
|
|||
|
Federal |
|
(791 |
) |
(1,544 |
) |
(1,798 |
) |
|||
|
State |
|
(86 |
) |
(56 |
) |
(119 |
) |
|||
|
Foreign |
|
(1,321 |
) |
521 |
|
(1,828 |
) |
|||
|
|
|
$ |
16,274 |
|
$ |
35,718 |
|
$ |
47,833 |
|
Income before income taxes for the years ended December 31, 2009, 2008 and 2007, consisted of the following:
|
|
|
Years Ended December 31, |
|
|||||||
|
(in thousands) |
|
2009 |
|
2008 |
|
2007 |
|
|||
|
|
|
|
|
|
|
|
|
|||
|
Domestic |
|
$ |
46,948 |
|
$ |
86,635 |
|
$ |
125,193 |
|
|
Foreign |
|
(18,457 |
) |
3,017 |
|
(8,618 |
) |
|||
|
|
|
$ |
28,491 |
|
$ |
89,652 |
|
$ |
116,575 |
|
Reconciliations between the statutory federal income tax rates and the Company’s effective income tax rates as a percentage of income before income taxes were as follows:
|
|
|
Years Ended December 31, |
|
||||
|
(in thousands) |
|
2009 |
|
2008 |
|
2007 |
|
|
|
|
|
|
|
|
|
|
|
Federal tax rate |
|
35.0 |
% |
35.0 |
% |
35.0 |
% |
|
State taxes, net of federal benefit |
|
7.5 |
% |
3.7 |
% |
4.4 |
% |
|
Tax benefit of domestic manufacturing deduction |
|
(3.3 |
)% |
(2.0 |
)% |
(2.1 |
)% |
|
Nondeductible Canadian goodwill writedown |
|
— |
|
— |
|
2.3 |
% |
|
Change in valuation allowance |
|
8.4 |
% |
1.6 |
% |
0.4 |
% |
|
Difference between United States statutory and local tax rates |
|
8.4 |
% |
0.3 |
% |
0.2 |
% |
|
Change in uncertain tax position |
|
(1.8 |
)% |
— |
|
0.7 |
% |
|
Other |
|
2.9 |
% |
1.2 |
% |
0.1 |
% |
|
Effective income tax rate |
|
57.1 |
% |
39.8 |
% |
41.0 |
% |
The tax effects of the significant temporary differences that constitute the deferred tax assets and liabilities at December 31, 2009, 2008 and 2007, were as follows:
|
|
|
December 31, |
|
|||||||
|
(in thousands) |
|
2009 |
|
2008 |
|
2007 |
|
|||
|
|
|
|
|
|
|
|
|
|||
|
Current deferred tax assets (liabilities) |
|
|
|
|
|
|
|
|||
|
State tax |
|
$ |
1,061 |
|
$ |
1,958 |
|
$ |
2,760 |
|
|
Workers’ compensation |
|
1,719 |
|
1,685 |
|
1,624 |
|
|||
|
Health claims |
|
391 |
|
540 |
|
591 |
|
|||
|
Vacation liability |
|
843 |
|
611 |
|
655 |
|
|||
|
Allowance for doubtful accounts |
|
1,614 |
|
1,450 |
|
806 |
|
|||
|
Inventories |
|
7,150 |
|
5,344 |
|
4,712 |
|
|||
|
Sales incentive and advertising allowances |
|
781 |
|
683 |
|
813 |
|
|||
|
State tax credit carry forward |
|
126 |
|
— |
|
— |
|
|||
|
Accrued rent reserves |
|
5 |
|
— |
|
70 |
|
|||
|
Unrealized foreign exchange gain or loss |
|
96 |
|
— |
|
— |
|
|||
|
Other, net |
|
549 |
|
75 |
|
(108 |
) |
|||
|
|
|
14,335 |
|
12,346 |
|
11,923 |
|
|||
|
Less valuation allowance |
|
(365 |
) |
(351 |
) |
(300 |
) |
|||
|
|
|
$ |
13,970 |
|
$ |
11,995 |
|
$ |
11,623 |
|
|
|
|
|
|
|
|
|
|
|||
|
Long-term deferred tax assets (liabilities) |
|
|
|
|
|
|
|
|||
|
Depreciation |
|
$ |
259 |
|
$ |
(535 |
) |
$ |
(402 |
) |
|
Goodwill and other intangibles amortization |
|
(3,704 |
) |
(1,106 |
) |
(795 |
) |
|||
|
Deferred compensation related to stock options |
|
6,562 |
|
7,550 |
|
7,512 |
|
|||
|
State tax credit carry forward |
|
— |
|
126 |
|
145 |
|
|||
|
Uncertain tax positions’ unrecognized tax benefits |
|
1,250 |
|
1,551 |
|
1,957 |
|
|||
|
Keymark investments basis difference |
|
447 |
|
593 |
|
506 |
|
|||
|
Non-United States tax loss carry forward |
|
5,011 |
|
2,499 |
|
1,959 |
|
|||
|
Tax effect on cumulative translation adjustment |
|
(799 |
) |
(850 |
) |
(1,502 |
) |
|||
|
Other |
|
1,095 |
|
952 |
|
857 |
|
|||
|
|
|
10,121 |
|
10,780 |
|
10,237 |
|
|||
|
Less valuation allowance |
|
(4,523 |
) |
(2,025 |
) |
(618 |
) |
|||
|
|
|
$ |
5,598 |
|
$ |
8,755 |
|
$ |
9,619 |
|
The total deferred tax assets for the years ended December 31, 2009, 2008 and 2007, were $25.0 million, $24.3 million and $25.3 million, respectively. The total deferred tax liabilities for the years ended December 31, 2009, 2008, and 2007, were $5.5 million, $3.6 million and $4.0 million, respectively.
At December 31, 2009, the Company had $22.0 million of tax loss carryforwards in various non-United States taxing jurisdictions. Tax loss carryforwards of $41 thousand, $1.3 million and $4.7 million will expire in 2012, 2013 and 2014, respectively, if not utilized. The remaining tax losses can be carried forward indefinitely.
At December 31, 2009 and 2008, the Company had deferred tax valuation allowances of $4.9 million and $2.4 million, respectively. The changes in the valuation allowance for the years ended December 31, 2009, 2008 and 2007, were $2.5 million, $1.5 million and $0.5 million, respectively.
The Company does not provide for federal income taxes on the undistributed earnings of its international subsidiaries because such earnings are reinvested and, in the Company’s opinion, will continue to be reinvested indefinitely. At December 31, 2009, 2008 and 2007, the Company had not provided federal income taxes on undistributed earnings of $12.9 million, $16.2 million and $10.2 million, respectively, from its international subsidiaries. Should these earnings be distributed in the form of dividends or otherwise, the Company would be subject to both United States income taxes and withholding taxes in various international jurisdictions. These taxes may be partially offset by United States foreign tax credits. Determination of the related amount of unrecognized deferred United States income taxes is not practicable because of the complexities associated with this hypothetical calculation. United States federal income taxes are provided on the earnings of the Company’s foreign branches, which are included in the United States federal income tax return.
The Company adopted the revised guidance in the “Income Taxes” topic of the FASB ASC regarding uncertain tax positions on January 1, 2007. The topic prescribes a recognition threshold that a tax position is required to meet before being recognized in the financial statements and provides guidance on derecognition, measurement, classification, interest and penalties, accounting in interim periods, disclosure and transition issues.
A reconciliation of the beginning and ending amounts of unrecognized tax benefits in 2009, 2008 and 2007 was as follows:*
|
(in thousands) |
|
2009 |
|
2008 |
|
2007 |
|
|||
|
|
|
|
|
|
|
|
|
|||
|
Balance at January 1 |
|
$ |
6,705 |
|
$ |
7,668 |
|
$ |
7,497 |
|
|
Additions based on tax positions related to prior years |
|
640 |
|
573 |
|
308 |
|
|||
|
Reductions based on tax positions related to prior years |
|
(632 |
) |
(875 |
) |
(749 |
) |
|||
|
Additions for tax positions of the current year |
|
902 |
|
801 |
|
1,432 |
|
|||
|
Settlements |
|
— |
|
— |
|
(413 |
) |
|||
|
Lapse of statute of limitations |
|
(1,193 |
) |
(1,462 |
) |
(407 |
) |
|||
|
Balance at December 31 |
|
$ |
6,422 |
|
$ |
6,705 |
|
$ |
7,668 |
|
* Foreign currency translation amounts are included within each line as applicable.
Included in the balance of unrecognized tax benefits at December 31, 2009, 2008 and 2007, are tax positions of $1.5 million, $1.8 million and $2.0 million, respectively, which, if recognized, would reduce the effective tax rate. The Company does not believe it is reasonably possible that the total amounts of unrecognized tax benefits will significantly increase or decrease within the next 12 months.
The Company recognizes accrued interest and penalties related to unrecognized tax benefits in income tax expense, which is a continuation of the Company’s historical accounting policy. During the year ended December 31, 2009, accrued interest decreased by $88 thousand as a result of the reversal of accrued interest, associated with the lapse of statutes of limitations. During the years ended December 31, 2008 and 2007, the Company recognized $0.2 million and $0.5 million, respectively, in potential interest payments before income tax benefits. At December 31, 2009, 2008 and 2007, the Company had accrued $1.6 million, $1.7 million and $1.5 million, respectively, for the potential payment of interest, before income tax benefits.
At December 31, 2009, the Company remained subject to United States federal income tax examinations for the tax years 2006 through 2009. In addition, the Company remained subject to state, local and foreign income tax examinations primarily for the tax years 2004 through 2009.
11. Retirement Plans
The Company has six defined contribution retirement plans covering substantially all salaried employees and nonunion hourly employees. Two of the plans, covering United States employees, provide for annual contributions in amounts that the Company’s Board of Directors may authorize, subject to certain limitations, but in no event more than the amounts permitted under the Internal Revenue Code as deductible expense. The other four plans, covering the Company’s European and Canadian employees, require the Company to make contributions ranging from 3% to 15% of the employees’ compensation. The total cost for these retirement plans for the years ended December 31, 2009, 2008 and 2007, was $7.8 million, $10.5 million and $9.6 million, respectively.
The Company also contributes to various industry-wide, union-sponsored pension funds for hourly employees who are union members. Payments to these funds aggregated $1.7 million, $2.6 million and $2.8 million for the years ended December 31, 2009, 2008 and 2007, respectively.
12. Related Party Transactions
The Company pays a airplane charter company standard hourly rates when an airplane is hired for use by its Chief Executive Officer in travel between his home and Company offices or by him and other Company employees in travel on business. The total cost to the Company for this and other airplanes that are used, including $27 thousand, $21 thousand and $20 thousand paid to the Company’s Chief Executive Officer for compensation for the years ended December 31, 2009, 2008 and 2007, was $409 thousand, $274 thousand and $345 thousand, respectively. The independent members of the Board unanimously approved this arrangement. The Company computes the compensation cost of the use of airplanes using the Standard Industrial Fare Level (“SIFL”) tables prescribed under applicable Internal Revenue Service regulations.
In January 2005, Michael Petrovic was appointed as an officer of Simpson Strong-Tie Canada, Limited (“SSTC”), a wholly-owned subsidiary of Simpson Strong-Tie. Mr. Petrovic was an owner of MGA Construction Hardware & Steel Fabricating Limited and MGA Connectors Limited (collectively, “MGA”), which SSTC acquired in 2003, and is a co-lessor of the property that SSTC leases in Maple Ridge, British Columbia. SSTC paid $170 thousand per year to lease the property from Mr. Petrovic and his associates. In February 2007, the Company purchased the building from Mr. Petrovic and his associates for $4.0 million.
In December 2007, the Company extended its lease on a property in Addison, Illinois, which is co-owned by Gerald Hagel, who was appointed as a vice president of the Simpson Strong-Tie in March 2007. The renewal is for an additional five years through 2012. The Company paid $270 thousand per year to lease the property from Mr. Hagel and his wife Susan Hagel, a former employee of Simpson Strong-Tie.
In October 2008, the Company voluntarily contributed $0.7 million to Keymark, for which the Company accounts using the equity method, and lent $1.3 million to Keymark’s other owner, which concurrently contributed that amount to Keymark’s capital. Of the $1.3 million loan, $0.7 million was outstanding at December 31, 2009, after the Company foreclosed on an additional 5.6% equity interest in Keymark as a result of a default in payment in October 2009 by Keymark’s other owner under terms of the loan and pledge agreement. The loan bears interest at the annual rate of 6%, will mature in October 2010, is backed by a pledge of an additional ownership interest in Keymark of 5% (subject to adjustment), and is non-recourse. See Note 6.
In 2009, the Company paid Keymark $0.2 million in professional fees related to software development. In December 2009, the Company lent $0.6 million to Keymark for working capital needs. This loan bears interest at an annual rate of 7%, payable monthly, and the principal amount will be due and payable in December 2012. This loan is backed the intellectual property of Keymark.
In December 2009 and January 2010, the Company made loans of $0.7 million and $1.7 million to two entities related to Keymark. Both of these loans bear interest at an annual rate of 5.5%, payable monthly, and the principal amounts will be due and payable in February 2013, or earlier if Keymark is sold. Each of these loans is backed by a real property deed of trust.
13. Stock Option and Stock Bonus Plans
The Company currently has two stock option plans (see Note 1 — Accounting for Stock-Based Compensation). Participants are granted stock options only if the applicable company-wide or profit-center operating goals, or both, established by the Compensation Committee of the Board at the beginning of the year, are met.
The fair value of each option award is estimated on the date of grant using the Black-Scholes option pricing model. Expected volatility is based on historical volatilities of the Company’s common stock measured monthly over a term that is equivalent to the expected life of the option. The expected terms of options granted are estimated based on the Company’s prior exercise experience and future expectations of the exercise and termination behavior of the grantees. The risk-free rate is based on the yield of United States Treasury zero-coupon bonds with maturities comparable to the expected life in effect at the time of grant. The dividend yield is based on the expected dividend rate on the grant date.
Black-Scholes option pricing model assumptions for options committed to be granted in 2010, and for those granted in 2009, 2008 and
2007, were as follows:
|
Number |
|
Grant |
|
Risk- |
|
Dividend |
|
Expected |
|
Volatility |
|
Exercise Price |
|
Fair |
|
||
|
|
|
|
|
|
|
|
|
|
|
|
|
|
|
|
|
||
|
1994 Plan |
|
|
|
|
|
|
|
|
|
|
|
|
|
|
|
||
|
148 |
|
02/02/10 |
|
2.93 |
% |
1.62 |
% |
6.5 years |
|
36.0 |
% |
$ |
24.75 |
|
$ |
8.46 |
|
|
24 |
|
02/23/09 |
|
2.08 |
% |
2.48 |
% |
6.5 years |
|
30.9 |
% |
$ |
16.10 |
|
$ |
4.06 |
|
|
29 |
|
02/04/09 |
|
2.17 |
% |
1.88 |
% |
6.5 years |
|
30.9 |
% |
$ |
21.25 |
|
$ |
5.86 |
|
|
14 |
|
04/23/08 |
|
3.15 |
% |
1.55 |
% |
6.0 years |
|
27.1 |
% |
$ |
25.74 |
|
$ |
6.92 |
|
|
40 |
|
02/13/08 |
|
2.90 |
% |
1.68 |
% |
6.0 years |
|
27.1 |
% |
$ |
23.78 |
|
$ |
6.16 |
|
|
123 |
|
02/02/07 |
|
4.84 |
% |
1.19 |
% |
5.9 years |
|
29.0 |
% |
$ |
33.62 |
|
$ |
11.11 |
|
No options were granted under the 1995 Plan in 2009, 2008 or 2007.
The following table summarizes the Company’s stock option activity for the year ended December 31, 2009:
|
Non-Qualified Stock Options |
|
Shares |
|
Weighted- |
|
Weighted- |
|
Aggregate |
|
||
|
|
|
|
|
|
|
|
|
|
|
||
|
Outstanding at January 1, 2009 |
|
2,250 |
|
$ |
29.70 |
|
2.8 |
|
$ |
5,424 |
|
|
Granted |
|
53 |
|
$ |
18.92 |
|
|
|
|
|
|
|
Exercised |
|
(396 |
) |
$ |
19.26 |
|
|
|
|
|
|
|
Forfeited |
|
(115 |
) |
$ |
35.61 |
|
|
|
|
|
|
|
Outstanding at December 31, 2009 |
|
1,792 |
|
$ |
31.31 |
|
2.2 |
|
$ |
1,680 |
|
|
Outstanding and expected to vest at December 31, 2009 |
|
1,786 |
|
$ |
31.34 |
|
2.2 |
|
$ |
1,649 |
|
|
Exercisable at December 31, 2009 |
|
1,652 |
|
$ |
31.57 |
|
1.9 |
|
$ |
1,253 |
|
* The intrinsic value represents the amount by which the fair market value of the underlying common stock exceeds the exercise price of the option, using the closing price per share of $26.89 on December 31, 2009.
The total intrinsic value of options exercised during the three years ended December 31, 2009, 2008 and 2007, was $3.0 million, $3.7 million and $3.5 million, respectively.
A summary of the status of unvested options as of December 31, 2009, and changes during the year ended December 31, 2009, is presented below:
|
Unvested Options |
|
Shares |
|
Weighted- |
|
|
|
|
|
|
|
|
|
|
|
Unvested at January 1, 2009 |
|
258 |
|
$ |
11.58 |
|
|
Granted |
|
53 |
|
$ |
5.04 |
|
|
Vested |
|
(166 |
) |
$ |
12.00 |
|
|
Forfeited |
|
(5 |
) |
$ |
13.27 |
|
|
Unvested at December 31, 2009 |
|
140 |
|
$ |
8.57 |
|
As of December 31, 2009, $1.8 million of total unrecognized compensation cost was related to unvested share-based compensation arrangements granted under the 1994 Plan. This cost is expected to be recognized over a weighted-average period of 0.6 years. Options granted under the 1995 Plan are fully vested and recorded as expense on the date of grant.
The Company also maintains a Stock Bonus Plan whereby it awards shares to employees, who do not otherwise participate in one of the Company’s stock option plans. The number of shares awarded, as well as the period of service, are considered by the Compensation Committee of the Board, at its discretion. In 2009, 2008 and 2007, the Company committed to issue 10 thousand, 11 thousand and 9 thousand shares, respectively, which resulted in pre-tax compensation charges of $0.5 million for the year ended December 31, 2009, and $0.4 million for each year ended December 31, 2008, and 2007. These employees are also awarded cash bonuses, which are included in these charges, to compensate for their income taxes payable as a result of the stock bonuses. Shares have been issued under this Plan in the year following the year in which the employee reached the tenth anniversary of employment with the Company.
14. Segment Information
The Company is organized into two primary operating segments. The segments are defined by types of products manufactured, marketed and distributed to the Company’s customers. The two product segments are connector products and venting products. These segments are differentiated in several ways, including the types of materials, the production processes, the distribution channels and the product applications. Transactions between the two segments were immaterial for each of the years presented.
The following table illustrates certain measurements used by management to assess the performance of the segments described above as of December 31, 2009, 2008 and 2007, or for the years then ended:
(in thousands)
|
2009 |
|
Connector |
|
Venting |
|
Administrative |
|
Total |
|
||||
|
|
|
|
|
|
|
|
|
|
|
||||
|
Net sales |
|
$ |
526,544 |
|
$ |
58,526 |
|
$ |
— |
|
$ |
585,070 |
|
|
Income (loss) from operations |
|
33,832 |
|
(3,859 |
) |
(1,363 |
) |
28,610 |
|
||||
|
Depreciation and amortization |
|
23,040 |
|
4,713 |
|
1,634 |
|
29,387 |
|
||||
|
Significant non-cash charges |
|
2,050 |
|
60 |
|
90 |
|
2,200 |
|
||||
|
Income tax expense (benefit) |
|
15,631 |
|
(1,609 |
) |
2,252 |
|
16,274 |
|
||||
|
Capital expenditures and acquisitions |
|
37,861 |
|
375 |
|
1,251 |
|
39,487 |
|
||||
|
Total assets |
|
650,796 |
|
71,587 |
|
121,422 |
|
843,805 |
|
||||
|
2008 |
|
Connector |
|
Venting |
|
Administrative |
|
Total |
|
||||
|
|
|
|
|
|
|
|
|
|
|
||||
|
Net sales |
|
$ |
676,724 |
|
$ |
79,775 |
|
$ |
— |
|
$ |
756,499 |
|
|
Income (loss) from operations |
|
91,567 |
|
(2,616 |
) |
(1,409 |
) |
87,542 |
|
||||
|
Depreciation and amortization |
|
24,082 |
|
4,903 |
|
1,224 |
|
30,209 |
|
||||
|
Significant non-cash charges |
|
3,289 |
|
259 |
|
275 |
|
3,823 |
|
||||
|
Goodwill impairment |
|
2,964 |
|
— |
|
— |
|
2,964 |
|
||||
|
Income tax expense (benefit) |
|
35,861 |
|
(1,046 |
) |
903 |
|
35,718 |
|
||||
|
Capital expenditures and acquisitions |
|
41,933 |
|
9,968 |
|
429 |
|
52,330 |
|
||||
|
Total assets |
|
612,733 |
|
77,218 |
|
140,249 |
|
830,200 |
|
||||
|
2007 |
|
Connector |
|
Venting |
|
Administrative |
|
Total |
|
||||
|
|
|
|
|
|
|
|
|
|
|
||||
|
Net sales |
|
$ |
745,692 |
|
$ |
71,296 |
|
$ |
— |
|
$ |
816,988 |
|
|
Income (loss) from operations |
|
114,433 |
|
(2,629 |
) |
(955 |
) |
110,849 |
|
||||
|
Depreciation and amortization |
|
23,044 |
|
4,891 |
|
49 |
|
27,984 |
|
||||
|
Significant non-cash charges |
|
5,246 |
|
444 |
|
643 |
|
6,333 |
|
||||
|
Goodwill impairment |
|
10,666 |
|
— |
|
— |
|
10,666 |
|
||||
|
Long-lived asset impairment |
|
465 |
|
— |
|
— |
|
465 |
|
||||
|
Income tax expense (benefit) |
|
49,127 |
|
(878 |
) |
(416 |
) |
47,833 |
|
||||
|
Capital expenditures and acquisitions |
|
72,418 |
|
5,664 |
|
479 |
|
78,561 |
|
||||
|
Total assets |
|
575,707 |
|
78,541 |
|
163,431 |
|
817,679 |
|
||||
Cash collected by the Company’s subsidiaries is routinely transferred into the Company’s cash management accounts, and therefore has been included in the total assets of “Administrative and All Other.” Cash and short-term investment balances in the Administrative and All Other segment were $205.1 million, $136.2 million and $159.8 million as of December 31, 2009, 2008 and 2007, respectively. The significant non-cash charges comprise compensation related to the awards under the stock option plans and the stock bonus plan. The Company’s measure of profit or loss for its reportable segments is income (loss) from operations. The reconciling amounts between consolidated income before tax and consolidated income from operations are net interest income, which is primarily attributed to “Administrative and All Other,” and loss from equity method investment, which is attributed to the connector products segment.
The following table illustrates how the Company’s net sales and long-lived assets were distributed geographically as of December 31, 2009, 2008 and 2007, or for the years then ended:
|
|
|
2009 |
|
2008 |
|
2007 |
|
||||||||||||
|
(in thousands) |
|
Net |
|
Long-Lived |
|
Net |
|
Long-Lived |
|
Net |
|
Long-Lived |
|
||||||
|
|
|
|
|
|
|
|
|
|
|
|
|
|
|
||||||
|
United States |
|
$ |
451,604 |
|
$ |
157,228 |
|
$ |
590,111 |
|
$ |
172,185 |
|
$ |
679,050 |
|
$ |
185,685 |
|
|
Denmark |
|
18,893 |
|
4,658 |
|
29,175 |
|
4,616 |
|
17,985 |
|
5,496 |
|
||||||
|
Canada |
|
34,121 |
|
5,818 |
|
42,334 |
|
5,231 |
|
35,692 |
|
8,470 |
|
||||||
|
United Kingdom |
|
18,157 |
|
2,150 |
|
25,882 |
|
1,248 |
|
32,787 |
|
1,985 |
|
||||||
|
France |
|
31,897 |
|
13,634 |
|
30,538 |
|
5,952 |
|
25,917 |
|
6,800 |
|
||||||
|
Germany |
|
21,269 |
|
1,434 |
|
28,315 |
|
1,990 |
|
22,248 |
|
258 |
|
||||||
|
Ireland |
|
2,552 |
|
3,993 |
|
3,637 |
|
4,177 |
|
— |
|
— |
|
||||||
|
China/Hong Kong |
|
2,890 |
|
11,105 |
|
2,659 |
|
9,056 |
|
90 |
|
60 |
|
||||||
|
Australia |
|
2,610 |
|
344 |
|
2,685 |
|
72 |
|
2,488 |
|
9 |
|
||||||
|
Other countries |
|
1,077 |
|
626 |
|
1,163 |
|
495 |
|
731 |
|
621 |
|
||||||
|
|
|
$ |
585,070 |
|
$ |
200,990 |
|
$ |
756,499 |
|
$ |
205,022 |
|
$ |
816,988 |
|
$ |
209,384 |
|
Net sales and long-lived assets, net of intangible assets, are attributable to the country where the operations are located.
The Company’s largest customer, attributable mostly to the connector products segment, accounted for 11% of net sales for the year ended December 31, 2009, and slightly less than 10% of net sales for the year ended December 31, 2008. In August 2007, this customer sold a division, which is now a separate customer of the Company attributable mostly to the connector products segment. As a combined company in 2007, these two customers accounted for 15% of the Company’s net sales. As two separate customers, neither would have accounted for net sales greater than 10% of consolidated net sales for 2007.
15. Subsequent Events
In February 2010, the Board declared a dividend of $0.10 per share, a total currently estimated at $4.9 million, to be paid on April 29, 2010, to stockholders of record on April 8, 2010.
In January 2010, the Company made a loan to an entity related to Keymark. See Note 12.
16. Selected Quarterly Financial Data (Unaudited)
The following table sets forth selected quarterly financial data for each of the quarters in 2009 and 2008:
|
|
|
2009 |
|
2008 |
|
||||||||||||||||||||
|
(in
thousands, except |
|
Fourth |
|
Third |
|
Second |
|
First |
|
Fourth |
|
Third |
|
Second |
|
First |
|
||||||||
|
|
|
|
|
|
|
|
|
|
|
|
|
|
|
|
|
|
|
||||||||
|
Net sales |
|
$ |
132,624 |
|
$ |
167,200 |
|
$ |
165,923 |
|
$ |
119,323 |
|
$ |
149,756 |
|
$ |
219,823 |
|
$ |
219,263 |
|
$ |
167,656 |
|
|
Cost of sales |
|
91,902 |
|
106,299 |
|
104,686 |
|
88,610 |
|
97,251 |
|
130,143 |
|
135,398 |
|
111,398 |
|
||||||||
|
Gross profit |
|
40,722 |
|
60,901 |
|
61,237 |
|
30,713 |
|
52,505 |
|
89,680 |
|
83,865 |
|
56,258 |
|
||||||||
|
|
|
|
|
|
|
|
|
|
|
|
|
|
|
|
|
|
|
||||||||
|
Research and development and other engineering |
|
4,996 |
|
4,971 |
|
5,161 |
|
4,864 |
|
4,951 |
|
5,662 |
|
5,610 |
|
5,103 |
|
||||||||
|
Selling expense |
|
15,854 |
|
15,563 |
|
16,852 |
|
16,025 |
|
17,439 |
|
21,323 |
|
22,134 |
|
19,807 |
|
||||||||
|
General and administrative expense |
|
20,288 |
|
19,187 |
|
20,133 |
|
20,273 |
|
22,684 |
|
25,555 |
|
23,786 |
|
17,872 |
|
||||||||
|
Impairment of goodwill |
|
— |
|
— |
|
— |
|
— |
|
2,964 |
|
— |
|
— |
|
— |
|
||||||||
|
Loss (gain) on sale of assets |
|
561 |
|
164 |
|
182 |
|
(111 |
) |
(66 |
) |
(41 |
) |
(19 |
) |
2 |
|
||||||||
|
Income (loss) from operations |
|
(977 |
) |
21,016 |
|
18,909 |
|
(10,338 |
) |
4,533 |
|
37,181 |
|
32,354 |
|
13,474 |
|
||||||||
|
|
|
|
|
|
|
|
|
|
|
|
|
|
|
|
|
|
|
||||||||
|
Income (loss) in equity method Investment |
|
20 |
|
— |
|
(21 |
) |
(193 |
) |
(486 |
) |
— |
|
— |
|
— |
|
||||||||
|
Interest income (expense), net |
|
11 |
|
— |
|
(38 |
) |
102 |
|
383 |
|
579 |
|
505 |
|
1,128 |
|
||||||||
|
Income (loss) before income taxes |
|
(946 |
) |
21,016 |
|
18,850 |
|
(10,429 |
) |
4,430 |
|
37,760 |
|
32,859 |
|
14,602 |
|
||||||||
|
|
|
|
|
|
|
|
|
|
|
|
|
|
|
|
|
|
|
||||||||
|
Provision for (benefit from) income taxes |
|
1,869 |
|
8,258 |
|
8,167 |
|
(2,020 |
) |
2,591 |
|
14,398 |
|
12,478 |
|
6,250 |
|
||||||||
|
Net income (loss) |
|
$ |
(2,815 |
) |
$ |
12,758 |
|
$ |
10,683 |
|
$ |
(8,409 |
) |
$ |
1,839 |
|
$ |
23,362 |
|
$ |
20,381 |
|
$ |
8,352 |
|
|
|
|
|
|
|
|
|
|
|
|
|
|
|
|
|
|
|
|
||||||||
|
Net income (loss) per common share |
|
|
|
|
|
|
|
|
|
|
|
|
|
|
|
|
|
||||||||
|
Basic |
|
$ |
(0.06 |
) |
$ |
0.26 |
|
$ |
0.22 |
|
$ |
(0.17 |
) |
$ |
0.04 |
|
$ |
0.48 |
|
$ |
0.42 |
|
$ |
0.17 |
|
|
Diluted |
|
(0.06 |
) |
0.26 |
|
0.22 |
|
(0.17 |
) |
0.04 |
|
0.48 |
|
0.42 |
|
0.17 |
|
||||||||
|
|
|
|
|
|
|
|
|
|
|
|
|
|
|
|
|
|
|
||||||||
|
Cash dividends declared per common share |
|
$ |
0.10 |
|
$ |
0.10 |
|
$ |
0.10 |
|
$ |
0.10 |
|
$ |
0.10 |
|
$ |
0.10 |
|
$ |
0.10 |
|
$ |
0.10 |
|
Basic and diluted income per common share for each of the quarters presented above is based on the respective weighted average numbers of common and dilutive potential common shares outstanding for each quarter, and the sum of the quarters may not necessarily be equal to the full year basic and diluted net income per common share amounts.
In the fourth quarter of 2008, the Company recorded an impairment charge of goodwill of $3.0 million. See Note 1 — “Goodwill and Intangible Assets.”
Simpson Manufacturing Co., Inc. and Subsidiaries
VALUATION AND QUALIFYING ACCOUNTS
for the years ended December 31, 2009, 2008 and 2007
|
Column A |
|
Column B |
|
Column C |
|
Column D |
|
Column E |
|
|||||||
|
|
|
|
|
Additions |
|
|
|
|
|
|||||||
|
|
|
|
|
Charged |
|
Charged |
|
|
|
|
|
|||||
|
|
|
Balance at |
|
to Costs |
|
to Other |
|
|
|
Balance |
|
|||||
|
(in thousands) |
|
Beginning |
|
and |
|
Accounts – |
|
|
|
at End |
|
|||||
|
Classification |
|
of Year |
|
Expenses |
|
Write-offs |
|
Deductions |
|
of Year |
|
|||||
|
|
|
|
|
|
|
|
|
|
|
|
|
|||||
|
Year Ended December 31, 2009 |
|
|
|
|
|
|
|
|
|
|
|
|||||
|
Allowance for doubtful accounts |
|
$ |
4,368 |
|
$ |
666 |
|
$ |
— |
|
$ |
367 |
|
$ |
4,667 |
|
|
Allowance for obsolete inventory |
|
10,029 |
|
900 |
|
— |
|
47 |
|
10,882 |
|
|||||
|
Allowance for sales discounts |
|
1,556 |
|
1,623 |
|
— |
|
1,271 |
|
1,908 |
|
|||||
|
Allowance for deferred tax assets |
|
2,376 |
|
2,685 |
|
— |
|
173 |
|
4,888 |
|
|||||
|
Year Ended December 31, 2008 |
|
|
|
|
|
|
|
|
|
|
|
|||||
|
Allowance for doubtful accounts |
|
2,724 |
|
2,431 |
|
— |
|
787 |
|
4,368 |
|
|||||
|
Allowance for obsolete inventory |
|
10,338 |
|
440 |
|
— |
|
749 |
|
10,029 |
|
|||||
|
Allowance for sales discounts |
|
1,815 |
|
1,600 |
|
— |
|
1,859 |
|
1,556 |
|
|||||
|
Allowance for deferred tax assets |
|
918 |
|
1,507 |
|
— |
|
49 |
|
2,376 |
|
|||||
|
Year Ended December 31, 2007 |
|
|
|
|
|
|
|
|
|
|
|
|||||
|
Allowance for doubtful accounts |
|
2,286 |
|
713 |
|
— |
|
275 |
|
2,724 |
|
|||||
|
Allowance for obsolete inventory |
|
5,480 |
|
4,801 |
|
— |
|
(57 |
) |
10,338 |
|
|||||
|
Allowance for sales discounts |
|
1,920 |
|
1,604 |
|
— |
|
1,709 |
|
1,815 |
|
|||||
|
Allowance for deferred tax assets |
|
459 |
|
489 |
|
— |
|
30 |
|
918 |
|
|||||
Item 9. Changes in and Disagreements with Accountants on Accounting and Financial Disclosures.
None.
Item 9A. Controls and Procedures.
Disclosure Controls and Procedures. As of December 31, 2009, an evaluation was performed under the supervision and with the participation of the Company’s management, including the chief executive officer (“CEO”) and the chief financial officer (“CFO”), of the effectiveness of the design and operation of the Company’s disclosure controls and procedures. Based on that evaluation, the CEO and the CFO concluded that the Company’s disclosure controls and procedures were effective as of that date.
Changes in Internal Control over Financial Reporting. During the three months ended December 31, 2009, the Company made no changes to its internal controls over financial reporting (as defined in Rules 13a-15(f) and 15d-15(f) under the Securities Exchange Act of 1934, as amended (the “Exchange Act”), that have materially affected, or are reasonably likely to materially affect, its internal controls over financial reporting.
Management’s Report on Internal Control over Financial Reporting. Management is responsible for establishing and maintaining adequate internal control over financial reporting (as defined in Exchange Act Rule 13a-15(f)). Management assessed the effectiveness of the Company’s internal control over financial reporting as of December 31, 2009, using criteria established in Internal Control-Integrated Framework issued by the Committee of Sponsoring Organizations of the Treadway Commission (“COSO”) and concluded that the Company maintained effective internal control over financial reporting as of December 31, 2009.
Because of its inherent limitations, internal control over financial reporting may not prevent or detect misstatements. In addition, projections of any evaluation of effectiveness to future periods are subject to the risk that controls may become inadequate because of changes in conditions, or that the degree of compliance with the policies and procedures may deteriorate.
The Company’s management has excluded Aginco, a division of Simpson Strong-Tie, from its assessment of internal control over financial reporting as of December 31, 2009, because it was acquired by the Company during 2009. The total assets and total revenues of this acquisition represents approximately 3% and 1%, respectively, of the related consolidated financial statement amounts as of and for the year ended December 31, 2009.
PricewaterhouseCoopers LLP, an independent registered public accounting firm that audited the Company’s consolidated financial statements included in this Form 10-K, has issued a report on the Company’s internal control over financial reporting, which is included herein.
Item 9B. Other Information.
None
PART III
Item 10. Directors, Executive Officers and Corporate Governance.
Information required by this Item will be contained in the Company’s proxy statement for the annual meeting of its stockholders to be held on April 28, 2010, to be filed with the Securities and Exchange Commission not later than 120 days following the end of the Company’s fiscal year ended December 31, 2009, which information is incorporated herein by reference.
Item 11. Executive Compensation.
Information required by this Item will be contained in the Company’s proxy statement for the annual meeting of its stockholders to be held on April 28, 2010, to be filed with the Securities and Exchange Commission not later than 120 days following the end of the Company’s fiscal year ended December 31, 2009, which information is incorporated herein by reference.
Item 12. Security Ownership of Certain Beneficial Owners and Management and Related Stockholder Matters.
Certain information required by this Item will be contained in the Company’s proxy statement for the annual meeting of its stockholders to be held on April 28, 2010, to be filed with the Securities and Exchange Commission not later than 120 days following the end of the Company’s fiscal year ended December 31, 2009, which information is incorporated herein by reference. The other information required by this Item appears in this report under “Item 5 — Market for Company’s Common Equity, Related Stockholder Matters and Issuer Purchases of Equity Securities,” which is incorporated herein by reference.
Item 13. Certain Relationships and Related Transactions, and Director Independence.
Information required by this Item will be contained in the Company’s proxy statement for the annual meeting of its stockholders to be held on April 28, 2010, to be filed with the Securities and Exchange Commission not later than 120 days following the end of the Company’s fiscal year ended December 31, 2009, which information is incorporated herein by reference.
Item 14. Principal Accounting Fees and Services.
Information required by this Item will be contained in the Company’s proxy statement for the annual meeting of its stockholders to be held on April 28, 2010, to be filed with the Securities and Exchange Commission not later than 120 days following the end of the Company’s fiscal year ended December 31, 2009, which information is incorporated herein by reference.
PART IV
Item 15. Exhibits and Financial Statement Schedules.
(a) The following documents are filed as part of this Annual Report:
1. Consolidated financial statements
The following consolidated financial statements are filed as a part of this report:
Report of Independent Registered Public Accounting Firm
Consolidated Balance Sheets as of December 31, 2009 and 2008
Consolidated Statements of Operations for the years ended December 31, 2009, 2008 and 2007
Consolidated Statements of Stockholders’ Equity for the years ended December 31, 2007, 2008 and 2009
Consolidated Statements of Cash Flows for the years ended December 31, 2009, 2008 and 2007
Notes to Consolidated Financial Statements
2. Financial Statement Schedules
The following consolidated financial statement schedule for each of the years in the three-year period ended December 31, 2009, is filed as part of this Annual Report:
Schedule II—Valuation and Qualifying Accounts—Years ended December 31, 2009, 2008 and 2007
All other schedules have been omitted as the required information is not present or is not present in amounts sufficient to require submission of the schedule, or because the information required is included in the consolidated financial statements and notes thereto.
(b) Exhibits
The following exhibits are either incorporated by reference into this report or filed with this report, as indicated below.
3.1 Certificate of Incorporation of Simpson Manufacturing Co., Inc., as amended, is incorporated by reference to Exhibit 3.1 of its Quarterly Report on Form 10-Q for the quarter ended September 30, 2007.
3.2 Bylaws of Simpson Manufacturing Co., Inc., as amended through August 1, 2008, are incorporated by reference to Exhibit 3.2 of its Current Report on Form 8-K dated August 4, 2008.
4.1 Amended Rights Agreement dated as of June 15, 2009, between Simpson Manufacturing Co., Inc. and Computershare Trust Company, N.A., which includes as Exhibit B the form of Rights Certificate, is incorporated by reference to Exhibit 4.1 of Simpson Manufacturing Co., Inc.’s Registration Statement on Form 8-A/A dated June 15, 2009.
4.2 Certificate of Designation, Preferences and Rights of Series A Participating Preferred Stock of Simpson Manufacturing Co., Inc., dated July 30, 1999, is incorporated by reference to Exhibit 4.2 of its Registration Statement on Form 8-A dated August 4, 1999.
10.1 Simpson Manufacturing Co., Inc. 1994 Stock Option Plan, as amended through February 13, 2008, is incorporated by reference to Exhibit 10.1 of Simpson Manufacturing Co., Inc.’s Quarterly Report on Form 10-Q for the quarter ended June 30, 2008.
10.2 Simpson Manufacturing Co., Inc. 1995 Independent Director Stock Option Plan, as amended through November 18, 2004, is incorporated by reference to Exhibit 10.2 of Simpson Manufacturing Co., Inc.’s Quarterly Report on Form 10-Q for the quarter ended June 30, 2008.
10.3 Simpson Manufacturing Co., Inc. Executive Officer Cash Profit Sharing Plan, as amended through February 25, 2008, is incorporated by reference to Exhibit 10.3 of Simpson Manufacturing Co., Inc.’s Quarterly Report on Form 10-Q for the quarter ended June 30, 2008.
10.4 Credit Agreement dated as of October 10, 2007, among Simpson Manufacturing Co., Inc. as Borrower, the Lenders party thereto, Wells Fargo Bank as Agent, and Simpson Dura-Vent Company, Inc., Simpson Strong Tie Company Inc., and Simpson Strong-Tie International, Inc. as Guarantors, is incorporated by reference to Exhibit 10.1 of Simpson Manufacturing Co., Inc.’s Current Report on Form 8-K dated October 15, 2007.
10.5 Form of Indemnification Agreement between Simpson Manufacturing Co., Inc. and its directors and executive officers, as well as the officers of Simpson Strong-Tie Company Inc. and Simpson Dura-Vent Company, Inc., is incorporated by reference to Exhibit 10.2 of Simpson Manufacturing Co., Inc.’s Annual Report on Form 10-K for the year ended December 31, 2004.
10.6 Compensation of Named Executive Officers of Simpson Manufacturing Co., Inc. is incorporated by reference to Exhibit 10 of Simpson Manufacturing Co., Inc.’s Current Report on Form 8-K dated October 2, 2009.
10.7 Compensation of Named Executive Officers is incorporated by reference to Exhibit 10 of Simpson Manufacturing Co., Inc.’s Current Report on Form 8-K dated December 18, 2009.
21. List of Subsidiaries of the Registrant is filed herewith.
23. Consent of Independent Registered Public Accounting Firm is filed herewith.
31. Rule 13a-14(a)/15d-14(a) Certifications are filed herewith.
32. Section 1350 Certifications are filed herewith.
99.1 Simpson Manufacturing Co., Inc. 1994 Employee Stock Bonus Plan, as amended through November 18, 2004, is incorporated by reference to Exhibit 99.1 of Simpson Manufacturing Co., Inc.’s Annual Report on Form 10-K for the year ended December 31, 2007.
SIGNATURES
Pursuant to the requirements Section 13 or 15(d) of the Securities Exchange Act of 1934, the Registrant has duly caused this report to be signed on its behalf by the undersigned, thereunto duly authorized.
|
Dated: February 26, 2010 |
|
Simpson Manufacturing Co., Inc. |
|
|
|
(Registrant) |
|
|
|
|
|
|
|
|
|
|
By |
/s/Karen Colonias |
|
|
|
Karen Colonias |
|
|
|
Chief Financial Officer |
|
|
|
and Duly Authorized Officer |
|
|
|
of the Registrant |
|
|
|
(principal accounting and financial officer) |
Pursuant to the requirements of the Securities Exchange Act of 1934, this report has been signed below by the following persons on behalf of the Registrant and in the capacities and on the dates indicated below.
|
Signature |
|
Title |
|
Date |
|
|
|
|
|
|
|
Chief Executive Officer: |
|
|
|
|
|
|
|
|
|
|
|
/s/Thomas J Fitzmyers |
|
President, Chief Executive |
|
February 26, 2010 |
|
(Thomas J Fitzmyers) |
|
Officer and Director |
|
|
|
|
|
|
|
|
|
Chief Financial Officer: |
|
|
|
|
|
|
|
|
|
|
|
/s/Karen Colonias |
|
Chief Financial Officer, |
|
February 26, 2010 |
|
(Karen Colonias) |
|
Treasurer and Secretary |
|
|
|
|
(principal accounting and financial officer) |
|
|
|
|
|
|
|
|
|
|
Directors: |
|
|
|
|
|
|
|
|
|
|
|
/s/Barclay Simpson |
|
Chairman of the Board |
|
February 26, 2010 |
|
(Barclay Simpson) |
|
|
|
|
|
|
|
|
|
|
|
/s/Jennifer A. Chatman |
|
Director |
|
February 26, 2010 |
|
(Jennifer A. Chatman) |
|
|
|
|
|
|
|
|
|
|
|
/s/Earl F. Cheit |
|
Director |
|
February 26, 2010 |
|
(Earl F. Cheit) |
|
|
|
|
|
|
|
|
|
|
|
/s/Gary M. Cusumano |
|
Director |
|
February 26, 2010 |
|
(Gary M. Cusumano) |
|
|
|
|
|
|
|
|
|
|
|
/s/Peter N. Louras |
|
Director |
|
February 26, 2010 |
|
(Peter N. Louras) |
|
|
|
|
|
|
|
|
|
|
|
/s/Robin G. MacGillivray |
|
Director |
|
February 26, 2010 |
|
(Robin G. MacGillivray) |
|
|
|
|
|
|
|
|
|
|
|
/s/Barry Lawson Williams |
|
Director |
|
February 26, 2010 |
|
(Barry Lawson Williams) |
|
|
|
|