Attached files
Table of Contents
UNITED STATES
SECURITIES AND EXCHANGE COMMISSION
Washington, DC 20549
FORM 10-K
| x | ANNUAL REPORT PURSUANT TO SECTION 13 OR 15(d) OF THE SECURITIES EXCHANGE ACT OF 1934 |
For the fiscal year ended December 31, 2009
or
| ¨ | TRANSITION REPORT PURSUANT TO SECTION 13 OR 15(d) OF THE SECURITIES EXCHANGE ACT OF 1934 |
For the transition period from to
Commission File Number 1-12298 (Regency Centers Corporation)
Commission File Number 0-24763 (Regency Centers, L.P.)
REGENCY CENTERS CORPORATION
REGENCY CENTERS, L.P.
(Exact name of registrant as specified in its charter)
| FLORIDA (REGENCY CENTERS CORPORATION) | 59-3191743 | |
| DELAWARE (REGENCY CENTERS, L.P) | 59-3429602 | |
| (State or other jurisdiction of incorporation or organization) |
(I.R.S. Employer identification No.) |
| One Independent Drive, Suite 114 Jacksonville, Florida 32202 |
(904) 598-7000 | |
| (Address of principal executive offices) (zip code) | (Registrant’s telephone No.) |
Securities registered pursuant to Section 12(b) of the Act:
Regency Centers Corporation
| Title of each class |
Name of each exchange on which registered | |
| Common Stock, $.01 par value | New York Stock Exchange | |
| 7.45% Series 3 Cumulative Redeemable Preferred Stock, $.01 par value | New York Stock Exchange | |
| 7.25% Series 4 Cumulative Redeemable Preferred Stock, $.01 par value | New York Stock Exchange | |
| 6.70% Series 5 Cumulative Redeemable Preferred Stock, $.01 par value | New York Stock Exchange |
Regency Centers, L.P.
| Title of each class |
Name of each exchange on which registered | |
| None | N/A |
Securities registered pursuant to Section 12(g) of the Act:
Regency Centers Corporation: None
Regency Centers, L.P.: Class B Units of Partnership Interest
Indicate by check mark if the registrant is a well-known seasoned issuer, as defined in Rule 405 of the Securities Act.
| Regency Centers Corporation | YES x NO ¨ | Regency Centers, L.P. | YES x NO ¨ |
Indicate by check mark if the registrant is not required to file reports pursuant to Section 13 or Section 15(d) of the Act.
| Regency Centers Corporation | YES ¨ NO x | Regency Centers, L.P. | YES ¨ NO x |
Indicate by check mark whether the registrant (1) has filed all reports required to be filed by Section 13 or 15(d) of the Securities Exchange Act of 1934 during the preceding 12 months, and (2) has been subject to such filing requirements for the past 90 days.
| Regency Centers Corporation | YES x NO ¨ | Regency Centers, L.P. | YES x NO ¨ |
Indicate by check mark whether the registrant has submitted electronically and posted on its corporate Web site, if any, every Interactive Data File required to be submitted and posted pursuant to Rule 405 of Regulation S-T during the preceding 12 months (or for such shorter period that the registrant was required to submit and post such files).
| Regency Centers Corporation | YES ¨ NO ¨ | Regency Centers, L.P. | YES ¨ NO ¨ |
Table of Contents
Indicate by check mark if disclosure of delinquent filers pursuant to Item 405 of Regulation S-K is not contained herein, and will not be contained, to the best of registrant’s knowledge, in definitive proxy or information statements incorporated by reference in Part III of this Form 10-K or any amendment to this Form 10-K.
| Regency Centers Corporation | ¨ | Regency Centers, L.P. | ¨ |
Indicate by check mark whether the registrant is a large accelerated filer, an accelerated filer, a non-accelerated filer, or a smaller reporting company. See the definitions of “large accelerated filer,” “accelerated filer” and “smaller reporting company” in Rule 12b-2 of the Exchange Act. (Check one):
Regency Centers Corporation:
| Large accelerated filer | x | Accelerated filer | ¨ | |||
| Non-accelerated filer | ¨ | Smaller reporting company | ¨ | |||
Regency Centers, L.P.:
| Large accelerated filer | ¨ | Accelerated filer | x | |||
| Non-accelerated filer | ¨ | Smaller reporting company | ¨ | |||
Indicate by check mark whether the registrant is a shell company.
| Regency Centers Corporation | YES ¨ NO x | Regency Centers, L.P. | YES ¨ NO x |
State the aggregate market value of the voting and non-voting common equity held by non-affiliates computed by reference to the price at which the common equity was last sold, or the average bid and asked price of such common equity, as of the last business day of the registrant’s most recently completed second fiscal quarter.
| Regency Centers Corporation: $2,744,244,309 | Regency Centers, L.P.: N/A |
The number of shares outstanding of the Regency Centers Corporation’s voting common stock was 81,561,952 as of February 26, 2010.
Documents Incorporated by Reference
Portions of Regency Centers Corporation’s proxy statement in connection with its 2010 Annual Meeting of Stockholders are incorporated by reference in Part III.
Table of Contents
EXPLANATORY NOTE
This report combines the annual reports on Form 10-K for the year ended December 31, 2009 of Regency Centers Corporation and Regency Centers, L.P. Unless stated otherwise or the context otherwise requires, references to “Regency Centers Corporation” or the “Parent Company” mean Regency Centers Corporation and its controlled subsidiaries; and references to “Regency Centers, L.P.” or the “Operating Partnership” mean Regency Centers, L.P. and its controlled subsidiaries. The term “the Company” or “Regency” means the Parent Company and the Operating Partnership, collectively.
The Parent Company is a real estate investment trust (“REIT”) and the general partner of the Operating Partnership. The Operating Partnership’s capital includes general and limited common Partnership Units (“Units”). As of December 31, 2009, the Parent Company owned approximately 99% of the Units in the Operating Partnership and the remaining limited Units are owned by investors. The Parent Company owns all of the Series 3, 4 and 5 Preferred Units of the Operating Partnership. As the sole general partner of the Operating Partnership, the Parent Company has exclusive control of the Operating Partnership’s day-to-day management.
The Company believes combining the annual reports on Form 10-K of the Parent Company and the Operating Partnership into this single report provides the following benefits:
| • | enhances investors’ understanding of the Parent Company and the Operating Partnership by enabling investors to view the business as a whole in the same manner as management views and operates the business; |
| • | eliminates duplicative disclosure and provides a more streamlined and readable presentation since a substantial portion of the Company’s disclosure applies to both the Parent Company and the Operating Partnership; and |
| • | creates time and cost efficiencies through the preparation of one combined report instead of two separate reports. |
Management operates the Parent Company and the Operating Partnership as one business. The management of the Parent Company consists of the same members as the management of the Operating Partnership. These members are officers of the Parent Company and employees of the Operating Partnership.
The Company believes it is important to understand the few differences between the Parent Company and the Operating Partnership in the context of how the Parent Company and the Operating Partnership operate as a consolidated company. The Parent Company is a REIT, whose only material asset is its ownership of partnership interests of the Operating Partnership. As a result, the Parent Company does not conduct business itself, other than acting as the sole general partner of the Operating Partnership, issuing public equity from time to time and guaranteeing certain debt of the Operating Partnership. The Parent Company does not hold any indebtedness, but guarantees all of the unsecured public debt and less than 10% of the secured debt of the Operating Partnership. The Operating Partnership holds all the assets of the Company and retains the ownership interests in the Company’s joint ventures. Except for net proceeds from public equity issuances by the Parent Company, which are contributed to the Operating Partnership in exchange for partnership units, the Operating Partnership generates all remaining capital required by the Company’s business. These sources include the Operating Partnership’s operations, its direct or indirect incurrence of indebtedness, and the issuance of partnership units.
Stockholders’ equity, partners’ capital, and noncontrolling interests are the main areas of difference between the consolidated financial statements of the Parent Company and those of the Operating Partnership. The Operating Partnership’s capital includes general and limited common Partnership Units, Series 3, 4, and 5 Preferred Units owned by the Parent Company, and Series D Preferred Units owned by institutional investors. The Series D preferred units and limited partners’ units in the Operating Partnership owned by third parties are accounted for in partners’ capital in the Operating Partnership’s financial statements and outside of stockholders’ equity in noncontrolling interests in the Parent Company’s financial statements. The Series 3, 4, and 5 Preferred Units owned by the Parent Company are eliminated in consolidation in the accompanying consolidated financial statements of the Parent Company and are classified as preferred units of general partner in the accompanying consolidated financial statements of the Operating Partnership.
In order to highlight the differences between the Parent Company and the Operating Partnership, there are sections in this report that separately discuss the Parent Company and the Operating Partnership, including separate
Table of Contents
financial statements, controls and procedures sections, and separate Exhibit 31 and 32 certifications. In the sections that combine disclosure for the Parent Company and the Operating Partnership, this report refers to actions or holdings as being actions or holdings of the Company.
As general partner with control of the Operating Partnership, the Parent Company consolidates the Operating Partnership for financial reporting purposes, and the Parent Company does not have assets other than its investment in the Operating Partnership. Therefore, while stockholders’ equity and partners’ capital differ as discussed above, the assets and liabilities of the Parent Company and the Operating Partnership are the same on their respective financial statements.
Table of Contents
| Item No. |
Form 10-K Report Page | |||
| PART I | ||||
| 1. |
1 | |||
| 1A. |
4 | |||
| 1B. |
12 | |||
| 2. |
13 | |||
| 3. |
29 | |||
| 4. |
29 | |||
| PART II | ||||
| 5. |
29 | |||
| 6. |
32 | |||
| 7. |
Management’s Discussion and Analysis of Financial Condition and Results of Operations |
34 | ||
| 7A. |
63 | |||
| 8. |
65 | |||
| 9. |
Changes in and Disagreements with Accountants on Accounting and Financial Disclosure |
128 | ||
| 9A. |
128 | |||
| 9B. |
129 | |||
| PART III | ||||
| 10. |
130 | |||
| 11. |
130 | |||
| 12. |
Security Ownership of Certain Beneficial Owners and Management and Related Stockholder Matters |
131 | ||
| 13. |
Certain Relationships and Related Transactions, and Director Independence |
131 | ||
| 14. |
131 | |||
| PART IV | ||||
| 15. |
132 | |||
| SIGNATURES | ||||
| 16. |
137 | |||
Table of Contents
Forward-Looking Statements
In addition to historical information, the following information contains forward-looking statements as defined under federal securities laws. These forward-looking statements include statements about anticipated changes in our revenues, the size of our development program, earnings per share and unit, returns and portfolio value, and expectations about our liquidity. These statements are based on current expectations, estimates and projections about the industry and markets in which Regency Centers Corporation (the “Parent Company”) and Regency Centers, L.P. (the “Operating Partnership”), collectively “Regency” or “the Company”, operate, and management’s beliefs and assumptions. Forward-looking statements are not guarantees of future performance and involve certain known and unknown risks and uncertainties that could cause actual results to differ materially from those expressed or implied by such statements. Such risks and uncertainties include, but are not limited to, changes in national and local economic conditions including the impact of a slowing economy; financial difficulties of tenants; competitive market conditions, including timing and pricing of acquisitions and sales of properties and out-parcels; changes in expected leasing activity and market rents; timing of development starts and sales of properties and out-parcels; meeting development schedules; our inability to exercise voting control over the co-investment partnerships through which we own or develop many of our properties; weather; consequences of any armed conflict or terrorist attack against the United States; and the ability to obtain governmental approvals. For additional information, see “Risk Factors” elsewhere herein. The following discussion should be read in conjunction with the accompanying Consolidated Financial Statements and Notes thereto of Regency Centers Corporation and Regency Centers, L.P. appearing elsewhere herein.
PART I
| Item 1. | Business |
Regency Centers Corporation began its operations as a Real Estate Investment Trust (“REIT”) in 1993 and is the managing general partner in Regency Centers, L.P. ). The term “the Company” or “Regency” means the Parent Company and the Operating Partnership, collectively. Our key strategic goals are focused on total share and unit holder return in excess of peer indices and sustaining growth in net asset value and earnings. We will achieve these goals through owning, operating and investing in a high-quality portfolio of primarily grocery-anchored shopping centers that are tenanted by market-dominant grocers, category-leading anchors, specialty retailers, and restaurants located in areas with above average household incomes and population densities. All of our operating, investing, and financing activities are performed through the Operating Partnership, its wholly-owned subsidiaries, and through its investments in real estate partnerships with third parties (also referred to as co-investment partnerships or joint ventures). The Parent Company currently owns 99% of the outstanding common partnership units of the Operating Partnership. Because of our structure and certain public debt financing, the Operating Partnership is also a registrant.
At December 31, 2009, we directly owned 216 shopping centers located in 23 states representing 23.0 million square feet of gross leasable area (“GLA”). Through co-investment partnerships, we own partial ownership interests in 184 shopping centers located in 25 states and the District of Columbia representing 22.0 million square feet of GLA. The shopping center portfolio that we manage, on a Combined Basis, represents 400 shopping centers located in 28 states and the District of Columbia and contains 45.0 million square feet of GLA.
We earn revenues and generate cash flow by leasing space in our shopping centers to grocery stores, major retail anchors, side-shop retailers, and restaurants, including ground leasing or selling building pads (out-parcels) to these same types of tenants. Historically, we have experienced growth in revenues by increasing occupancy and rental rates in our existing shopping centers, and by acquiring and developing new shopping centers. Our shopping centers generate substantial daily traffic by conveniently offering necessities and services. This high traffic generates increased sales, thereby driving higher occupancy and rental-rate growth, which we expect will provide sustained growth in earnings per share and unit, and net asset value over the long term.
We seek a range of strong national, regional and local specialty retailers, for the same reason that we choose to anchor our centers with leading grocers and major retailers who provide a mix of goods and services that meet consumer needs. We have created a formal partnering process, the Premier Customer Initiative (“PCI”), to promote mutually beneficial relationships with our side-shop retailers. The objective of PCI is for us to build a base of non-anchor tenants who represent the “best-in-class” operators in their respective merchandising categories. Such retailers reinforce the consumer appeal and other strengths of a center’s anchor, help grow and stabilize a center’s occupancy, reduce re-leasing downtime, reduce tenant turnover, and yield higher sustainable rents.
We grow our shopping center portfolio through acquisitions of operating centers and shopping center development. We will continue to use our unique combination of development capabilities, market presence, and
1
Table of Contents
anchor relationships to invest in value-added opportunities sourced from distressed owners, the redevelopment of existing centers, developing land that we already own, and other opportunities. Development is customer driven, meaning we generally have an executed lease from the anchor before we start construction. Developments serve the growth needs of our anchors and specialty retailers, resulting in modern shopping centers with long-term anchor leases that produce attractive returns on our invested capital. This development process typically requires three to five years from initial land or redevelopment acquisition through construction, lease-up, and stabilization of rental income, but can take longer depending upon tenant demand for new stores and the size of the project.
We also invest in real estate partnerships. These co-investment partnerships provide us with a reliable capital source for shopping center acquisitions, as well as the opportunity to earn fees for asset management, property management, and other investing and financing services. As asset manager, we are engaged by our partners to apply similar operating, investment and capital strategies to the portfolios owned by the co-investment partnerships as those applied to the portfolio that we wholly-own. Co-investment partnerships also grow their shopping center investments through acquisitions from third parties or direct purchases from us.
Competition
We are among the largest owners of shopping centers in the nation based on revenues, number of properties, gross leasable area, and market capitalization. There are numerous companies and private individuals engaged in the ownership, development, acquisition, and operation of shopping centers which compete with us in our targeted markets. This results in competition for attracting anchor tenants, as well as the acquisition of existing shopping centers and new development sites. We believe that the principal competitive factors in attracting tenants in our market areas are location, demographics, rental costs, tenant mix, property age, and property maintenance. We believe that our competitive advantages include our locations within our market areas, the design quality of our shopping centers, the strong demographics surrounding our shopping centers, our relationships with our anchor tenants and our side-shop and out-parcel retailers, our PCI program that allows us to provide retailers with multiple locations, our practice of maintaining and renovating our shopping centers, and our ability to source and develop new shopping centers.
Changes in Policies
Our Board of Directors establishes the policies that govern our investment and operating strategies including, among others, development and acquisition of shopping centers, tenant and market focus, debt and equity financing policies, quarterly distributions to stock and unit holders, and REIT tax status. The Board of Directors may amend these policies at any time without a vote of our stockholders.
Employees
Our headquarters are located at One Independent Drive, Suite 114, Jacksonville, Florida. We presently maintain 18 market offices nationwide where we conduct management, leasing, construction, and investment activities. At December 31, 2009, we had 380 employees and we believe that our relations with our employees are good.
Compliance with Governmental Regulations
Under various federal, state and local laws, ordinances and regulations, we may be liable for the cost to remove or remediate certain hazardous or toxic substances at our shopping centers. These laws often impose liability without regard to whether the owner knew of, or was responsible for, the presence of the hazardous or toxic substances. The cost of required remediation and the owner’s liability for remediation could exceed the value of the property and/or the aggregate assets of the owner. The presence of such substances, or the failure to properly remediate such substances, may adversely affect our ability to sell or lease the property or borrow using the property as collateral. We have a number of properties that could require or are currently undergoing varying levels of environmental remediation. Environmental remediation is not currently expected to have a material financial impact on us due to reserves for remediation, insurance programs designed to mitigate the cost of remediation, and various state-regulated programs that shift the responsibility and cost to the state.
Executive Officers
The executive officers of the Company are appointed each year by the Board of Directors. Each of the executive officers has been employed by the Company in the position or positions indicated in the list and pertinent notes below. Each of the executive officers has been employed by the Company for more than five years.
2
Table of Contents
| Name |
Age | Title |
Executive Officer in Position Shown Since |
||||
| Martin E. Stein, Jr. |
57 | Chairman and Chief Executive Officer | 1993 | ||||
| Brian M. Smith |
55 | President and Chief Operating Officer | 2005 | (1) | |||
| Bruce M. Johnson |
62 | Executive Vice President and Chief Financial Officer |
1993 |
| (1) | In February 2009, Brian M. Smith, Managing Director and Chief Investment Officer of the Company since 2005, was appointed to the position of President. Prior to serving as our Managing Director and Chief Investment Officer, from March 1999 to September 2005, Mr. Smith served as Managing Director of Investments for our Pacific, Mid-Atlantic, and Northeast divisions. |
Company Website Access and SEC Filings
The Company’s website may be accessed at www.regencycenters.com. All of our filings with the Securities and Exchange Commission (“SEC”) can be accessed through our website promptly after filing; however, in the event that the website is inaccessible, we will provide paper copies of our most recent annual report on Form 10-K, the most recent quarterly report on Form 10-Q, current reports filed or furnished on Form 8-K, and all related amendments, excluding exhibits, free of charge upon request. These filings are also accessible on the SEC’s website at www.sec.gov.
General Information
The Company’s registrar and stock transfer agent is American Stock Transfer & Trust Company (“AST”), New York, New York. The Company offers a dividend reinvestment plan (“DRIP”) that enables its stockholders to reinvest dividends automatically, as well as to make voluntary cash payments toward the purchase of additional shares. For more information, contact AST’s Shareholder Services Group toll free at (866) 668-6550 or the Company’s Shareholder Relations Department.
The Company’s Independent Registered Public Accounting Firm is KPMG LLP, Jacksonville, Florida. The Company’s General Counsel is Foley & Lardner LLP, Jacksonville, Florida.
Annual Meeting
The Company’s annual meeting will be held at The River Club, One Independent Drive, 35th Floor, Jacksonville, Florida, at 11:00 a.m. on Tuesday, May 4, 2010.
3
Table of Contents
| Item 1A. | Risk Factors |
Risk Factors Related to Our Industry and Real Estate Investments
Our revenues and cash flow could be adversely affected by poor market conditions where our properties are geographically concentrated.
Our performance depends on the economic conditions in markets in which our properties are concentrated. During the year ended December 31, 2009, our properties in California, Florida, and Texas accounted for 32.0%, 13.6%, and 15.4%, respectively, of our consolidated net operating income. Our revenues and cash available for distribution to stock and unit holders could be adversely affected by this geographic concentration if market conditions, such as supply of retail space or demand for shopping centers, deteriorate in California, Florida, and Texas relative to other geographic areas.
Loss of revenues from major tenants could reduce distributions to stock and unit holders.
We derive significant revenues from anchor tenants such as Kroger, Publix and Safeway that occupy more than one center. Kroger, Publix, and Safeway are our three largest tenants and accounted for 4.9%, 4.2%, and 3.7%, respectively, of our annualized base rent on a pro-rata basis for the year ended December 31, 2009. Distributions to stock and unit holders could be adversely affected by the loss of revenues in the event a major tenant:
| • | becomes bankrupt or insolvent; |
| • | experiences a downturn in its business; |
| • | materially defaults on its leases; |
| • | does not renew its leases as they expire; or |
| • | renews at lower rental rates. |
Vacated anchor space, including space owned by the anchor, can reduce rental revenues generated by the shopping center because of the loss of the departed anchor tenant’s customer drawing power. Most anchors have the right to vacate and prevent re-tenanting by paying rent for the balance of the lease term. If major tenants vacate a property, then other tenants may be entitled to terminate their leases at the property.
Our net income depends on the success and continued presence of our tenants.
Our net income could be adversely affected if we fail to lease significant portions of our new developments or in the event of bankruptcy or insolvency of any anchors or of a significant number of our non-anchor tenants within a shopping center. The adverse impact on our net income may be greater than the loss of rent from the resulting unoccupied space because co-tenancy clauses may allow other tenants to modify or terminate their rent or lease obligations. Co-tenancy clauses have several variants: they may allow a tenant to postpone a store opening if certain other tenants fail to open their store; they may allow a tenant the opportunity to close their store prior to lease expiration if another tenant closes their store prior to lease expiration; or more commonly, they may allow a tenant to pay reduced levels of rent until a certain number of tenants open their stores within the same shopping center. As the current recession continues to depress retail sales, we could experience reductions in rent and occupancy related to tenants exercising their co-tenancy clauses.
Downturns in the retail industry likely will have a direct adverse impact on our revenues and cash flow.
Our properties consist primarily of grocery-anchored shopping centers. Our performance therefore is generally linked to economic conditions in the market for retail space. The market for retail space has been or could be adversely affected by any of the following:
| • | weakness in the national, regional and local economies, which could adversely impact consumer spending and retail sales and in turn tenant demand for space and increased store closings; |
| • | consequences of any armed conflict involving, or terrorist attack against, the United States; |
| • | the adverse financial condition of some large retail companies; |
| • | the ongoing consolidation in the retail sector; |
| • | the excess amount of retail space in a number of markets; |
4
Table of Contents
| • | increasing consumer purchases through catalogs; |
| • | reduction in the demand by tenants to occupy our shopping centers as a result of reduced consumer demand for certain retail formats such as video rental stores; |
| • | the timing and costs associated with property improvements and rentals; |
| • | changes in taxation and zoning laws; |
| • | adverse government regulation; |
| • | a shift in retail shopping from brick and mortar stores to Internet retailers; |
| • | the growth of super-centers, such as those operated by Wal-Mart, and their adverse effect on major grocery chains; and |
| • | the impact of increased energy costs on consumers and its consequential effect on the number of shopping visits to our centers; |
To the extent that any of these conditions occur, they are likely to impact market rents for retail space, occupancy in the operating portfolios, our ability to recycle capital, and our cash available for distributions to stock and unit holders.
Our real estate assets may be subject to impairment charges.
On a periodic basis, we assess whether there are any indicators that the value of our real estate properties and other investments may be impaired. A property’s value is impaired only if our estimate of the aggregate future cash flows (undiscounted and without interest charges) to be generated by the property are less than the carrying value of the property. If the aggregate future cash flows are less than the carrying value of property, we write down the property to its fair value. In our estimate of cash flows, we consider factors such as expected future operating income, trends and prospects, the effects of demand, competition and other factors. We are required to make subjective assessments as to whether there are impairments in the value of our real estate properties and other investments. These assessments have a direct impact on our net income because recording an impairment charge results in an immediate negative adjustment to net income. There can be no assurance that we will not take additional charges in the future related to the impairment of our assets. Any future impairment could have a material adverse effect on our results of operations in the period in which the charge is taken.
Unsuccessful development activities or a slowdown in development activities could reduce distributions to stock and unit holders.
We actively pursue development activities as opportunities arise. Development activities require various government and other approvals for entitlements which can significantly delay the development process. We may not recover our investment in development projects for which approvals are not received. We incur other risks associated with development activities, including:
| • | the ability to lease up developments to full occupancy on a timely basis; |
| • | the risk that anchor tenants will not open and operate in accordance with their lease agreement; |
| • | the risk that occupancy rates and rents of a completed project will not be sufficient to make the project profitable and available for contribution to our co-investment partnerships or sale to third parties; |
| • | the risk that the current size in our development pipeline will strain the organization’s capacity to complete the developments within the targeted timelines and at the expected returns on invested capital; |
| • | the risk that we may abandon development opportunities and lose our investment in these developments; |
| • | the risk that development costs of a project may exceed original estimates, possibly making the project unprofitable; |
| • | delays in the development and construction process; and |
| • | the lack of cash flow during the construction period. |
If developments are unsuccessful, funding provided from sales to co-investment partnerships and third parties may be materially reduced and our cash flow available for distribution to stock and unit holders will be reduced. Our earnings and cash flow available for distribution to stock and unit holders also may be reduced if we experience a significant slowdown in our development activities.
5
Table of Contents
We may experience difficulty or delay in renewing leases or re-leasing space.
We derive most of our revenue directly or indirectly from rent received from our tenants. We are subject to the risks that, upon expiration or termination of leases, whether by their terms, as a result of a tenant bankruptcy or otherwise, leases for space in our properties may not be renewed, space may not be re-leased, or the terms of renewal or re-lease, including the cost of required renovations or concessions to tenants, may be less favorable than current lease terms. As a result, our results of operations and our net income could be reduced.
Many real estate costs are fixed, even if income from our properties decreases.
Our financial results depend primarily on leasing space in our properties to tenants on terms favorable to us. Costs associated with real estate investment, such as real estate taxes, insurance and maintenance costs, generally are not reduced even when a property is not fully occupied, rental rates decrease, or other circumstances cause a reduction in income from the property. As a result, cash flow from the operations of our properties may be reduced if a tenant does not pay its rent or we are unable to rent our properties on favorable terms. Under those circumstances, we might not be able to enforce our rights as landlord without delays and may incur substantial legal costs. Additionally, new properties that we may acquire or develop may not produce any significant revenue immediately, and the cash flow from existing operations may be insufficient to pay the operating expenses and debt service associated with such new properties until they are fully leased.
We may be unable to sell properties when appropriate because real estate investments are illiquid.
Real estate investments generally cannot be sold quickly. We may not be able to alter our portfolio promptly in response to changes in economic or other conditions including being unable to sell a property at a return we believe is appropriate due to the current economic environment. Our inability to respond quickly to adverse changes in the performance of our investments could have an adverse effect on our ability to meet our obligations and make distributions to our stock and unit holders.
We carry comprehensive liability, fire, flood, extended coverage, rental loss, and environmental insurance for our properties with policy specifications and insured limits customarily carried for similar properties. We believe that the insurance carried on our properties is adequate and in accordance with industry standards. There are, however, some types of losses, such as from hurricanes, terrorism, wars or earthquakes, which may be uninsurable, or the cost of insuring against such losses may not be economically justifiable. If an uninsured loss occurs, we could lose both the invested capital in and anticipated revenues from the property, but we would still be obligated to repay any recourse mortgage debt on the property. In that event, our distributions to stock and unit holders could be reduced.
Adverse global market and economic conditions may continue to adversely affect us and could cause us to recognize additional impairment charges or otherwise harm our performance.
Ongoing adverse market and economic conditions and market volatility will likely continue to make it difficult to value the properties and investments owned by us and our joint ventures. There may be significant uncertainty in the valuation, or in the stability of the value, of such properties and investments that could result in a substantial decrease in the value thereof. No assurance can be given that we will be able to recover the current carrying amount of all of our properties, investments and intangibles and those of our joint ventures in the future. Our failure to do so would require us to recognize additional impairment charges for the period in which we reached that conclusion, which could materially and adversely affect us and the market price of our common stock.
We are unable to predict whether, or to what extent or for how long, these adverse market and economic conditions will persist. The continuation and/or intensification of these conditions may impede our ability to generate sufficient operating cash flow to pay expenses, maintain properties, pay dividends, distributions, and refinance debt.
We face competition from numerous sources.
The ownership of shopping centers is highly fragmented, with less than 10% owned by REIT’s. We face competition from other REIT’s as well as from numerous small owners in the acquisition, ownership, and leasing of shopping centers. We compete to develop shopping centers with other real estate investment trusts engaged in development activities as well as with local, regional, and national real estate developers.
6
Table of Contents
We compete for the acquisition of properties through proprietary research that identifies opportunities in markets with high barriers to entry and higher-than-average population growth and household income. We seek to maximize rents per square foot by (i) establishing relationships with supermarket chains that are first or second in their markets or other category-leading anchors and (ii) leasing non-anchor space in multiple centers to national or regional tenants. We compete to develop properties by applying our proprietary research methods to identify development and leasing opportunities and by pre-leasing a significant portion of a center before beginning construction.
There can be no assurance, however, that other real estate owners or developers will not utilize similar research methods and target the same markets and anchor tenants. These entities may successfully control these markets and tenants to our exclusion. If we cannot successfully compete in our targeted markets, our cash flow, and therefore distributions to stock and unit holders, may be adversely affected.
Costs of environmental remediation could reduce our cash flow available for distribution to stock and unit holders.
Under various federal, state and local laws, an owner or manager of real property may be liable for the costs of removal or remediation of hazardous or toxic substances on the property. These laws often impose liability without regard to whether the owner knew of, or was responsible for, the presence of hazardous or toxic substances. The cost of any required remediation could exceed the value of the property and/or the aggregate assets of the owner.
We are subject to numerous environmental laws and regulations as they apply to our shopping centers pertaining to chemicals used by the dry cleaning industry, the existence of asbestos in older shopping centers, and underground petroleum storage tanks (UST’s). The presence of, or the failure to properly remediate, hazardous or toxic substances may adversely affect our ability to sell or lease a contaminated property or to borrow using the property as collateral. Any of these developments could reduce cash flow and distributions to stock and unit holders.
Risk Factors Related to Our Co-investment Partnerships and Acquisition Structure
We do not have voting control over our joint venture investments, so we are unable to ensure that our objectives will be pursued.
We have invested as a co-venturer in the acquisition or development of properties. These investments involve risks not present in a wholly-owned project. We do not have voting control over the ventures. The other co-venturer might (i) have interests or goals that are inconsistent with our interests or goals or (ii) otherwise impede our objectives. The other co-venturer also might become insolvent or bankrupt.
Our co-investment partnerships are an important part of our growth strategy. The termination of our co-investment partnerships could adversely affect distributions to stock and unit holders.
Our management fee income has increased significantly as our participation in co-investment partnerships has increased. If co-investment partnerships owning a significant number of properties were dissolved for any reason, we would lose the asset and property management fees from these co-investment partnerships, which could adversely affect our cash available for distribution to stock and unit holders.
In addition, termination of the co-investment partnerships without replacing them with new co-investment partnerships could adversely affect our growth strategy. Property sales to the co-investment partnerships provide us with an important source of funding for additional developments and acquisitions. Without this source of capital, our ability to recycle capital, fund developments and acquisitions, and increase distributions to stock and unit holders could be adversely affected.
Our co-investment partnerships have $2.5 billion of debt as of December 31, 2009, of which 54.8% will mature through 2012, which is subject to significant refinancing risks. We anticipate that as real estate values decline, the refinancing of maturing loans, including those maturing in our joint ventures, will require us and our joint venture partners to contribute our respective pro-rata shares of capital in order to reduce refinancing requirements to acceptable loan to value levels required for new financings. The long-term impact of the current economic crisis on our ability to access capital, including access by our joint venture partners, or to obtain future financing to fund maturing debt is unclear.
7
Table of Contents
Our partnership structure may limit our flexibility to manage our assets.
We invest in retail shopping centers through the Operating Partnership in which the Parent Company currently owns 99% of the outstanding common partnership units. From time to time, we have acquired properties through the Operating Partnership in exchange for limited partnership interests. This acquisition structure may permit limited partners who contribute properties to us to defer some, if not all, of the income tax liability that they would incur if they sold the property for cash.
Properties contributed to the Operating Partnership may have unrealized gains attributable to the difference between the fair market value and adjusted tax basis in the properties prior to contribution. As a result, our sale of these properties could cause adverse tax consequences to the limited partners who contributed them.
Generally, the Operating Partnership has no obligation to consider the tax consequences of its actions to any limited partner. However, the Operating Partnership may acquire properties in the future subject to material restrictions on refinancing or resale designed to minimize the adverse tax consequences to the limited partners who contribute those properties. These restrictions could significantly reduce our flexibility to manage our assets by preventing us from reducing mortgage debt or selling a property when such a transaction might be in our best interest in order to reduce interest costs or dispose of an under-performing property.
Risk Factors Related to Our Capital Recycling and Capital Structure
Lack of available credit could reduce capital available for new developments and other investments and could increase refinancing risks.
The lack of available credit in the commercial real estate market is causing a decline in the sale of shopping centers and their values. This reduces the available capital for new developments or other new investments, which is a key part of our capital recycling strategy. The lack of liquidity in the capital markets has also resulted in a significant increase in the cost to refinance maturing loans and a significant increase in refinancing risks. We anticipate that as real estate values decline, refinancing maturing secured loans, including those maturing in our joint ventures, may require us and our joint venture partners to contribute our respective pro-rata shares of capital in order to reduce refinancing requirements to acceptable loan to value levels required for new financings. Whether the credit markets will hinder our ability to access capital, including access by our joint venture partners, or to obtain future financing to fund maturing debt is unclear.
A reduction in the availability of capital, an increase in the cost of capital, and higher market capitalization rates could adversely impact our ability to recycle capital and fund developments and acquisitions, and could dilute earnings.
As part of our capital recycling program, we sell operating properties that no longer meet our investment standards. We also develop certain retail centers because of their attractive margins with the intent of selling them to co-investment partnerships or other third parties for a profit. These sales proceeds are used to fund the construction of new developments. An increase in market capitalization rates could cause a reduction in the value of centers identified for sale, which would have an adverse impact on our capital recycling program by reducing the amount of cash generated and profits realized. In order to meet the cash requirements of our development program, we may be required to sell more properties than initially planned, which would have a negative impact on our earnings.
Our debt financing may reduce distributions to stock and unit holders.
We do not expect to generate sufficient funds from operations to make balloon principal payments on our debt when due. If we are unable to refinance our debt on acceptable terms, we might be forced (i) to dispose of properties, which might result in losses, or (ii) to obtain financing at unfavorable terms. Either could reduce the cash flow available for distributions to stock and unit holders.
In addition, if we cannot make required mortgage payments, the mortgagee could foreclose on the property securing the mortgage, causing the loss of cash flow from that property. Furthermore, substantially all of our debt is cross-defaulted, which means that a default under one loan could trigger defaults under other loans.
Our organizational documents do not limit the amount of debt that may be incurred. The degree to which we are leveraged could have important consequences, including the following:
8
Table of Contents
| • | leverage could affect our ability to obtain additional financing in the future to repay indebtedness or for working capital, capital expenditures, acquisitions, development, or other general corporate purposes; |
| • | leverage could make us more vulnerable to a downturn in our business or the economy generally; and |
| • | as a result, our leverage could lead to reduced distributions to stock and unit holders. |
Covenants in our debt agreements may restrict our operating activities and adversely affect our financial condition.
Our revolving line of credit and our unsecured notes contain customary covenants, including compliance with financial ratios, such as ratios of total debt to gross asset value and coverage ratios. Coverage ratio is defined as EBITDA divided by the sum of the gross interest and scheduled mortgage principal paid to our lenders plus dividends paid to our preferred stockholders. Our line of credit also restricts our ability to enter into a transaction that would result in a change of control. These covenants may limit our operational flexibility and our acquisition activities. Moreover, if we breach any of the covenants in our debt agreements, including the covenants above, and did not cure the breach within any applicable cure period, our lenders could require us to repay the debt immediately, even in the absence of a payment default. Many of our debt arrangements, including our unsecured notes, unsecured line of credit, and our revolving credit facility, are cross-defaulted, which means that the lenders under those debt arrangements can put us in default and require immediate repayment of their debt if we breach and fail to cure a default under certain of our other debt obligations. As a result, any default under our debt covenants could have an adverse effect on our financial condition, our results of operations, our ability to meet our obligations, and the market value of our stock.
We depend on external sources of capital, which may not be available in the future.
To qualify as a REIT, the Parent Company must, among other things, distribute to its stockholders each year at least 90% of its REIT taxable income (excluding any net capital gains). Because of these distribution requirements, we likely will not be able to fund all future capital needs, including capital for acquisitions or developments, with income from operations. We therefore will have to rely on third-party sources of capital, which may or may not be available on favorable terms or at all. Our access to third-party sources of capital depends on a number of things, including the market’s perception of our growth potential and our current and potential future earnings. In addition, our line of credit imposes covenants that limit our flexibility in obtaining other financing, such as a prohibition on negative pledge agreements.
Additional equity offerings may result in substantial dilution of stockholders’ interests and additional debt financing may substantially increase our degree of leverage.
Settlement provisions contained in forward sale agreements subject us to certain risks.
The Company entered into forward sale agreements in December 2009 with each of J.P. Morgan Securities Inc. and Wells Fargo Securities, LLC. The forward sale agreements relate to the forward sale by the Company of a number of shares of common stock equal to the number of shares of common stock to be borrowed and sold by each forward seller. Depending on the price of our common stock at the time of settlement and the relevant settlement method, we may receive proceeds from the sale of common stock upon settlement of the forward sale agreements, which settlement must occur within approximately 15 months after December 2009. We intend to use any proceeds that we receive upon settlement of the forward sale agreements to repay or refinance maturing 2010 debt which may include a portion of our pro-rata share of the existing mortgage debt of Macquarie CountryWide-Regency II, LLC as the debt comes due beginning in 2010 and other general corporate purposes, which may include the payment of future maturing debt or the acquisition of additional properties.
Each forward purchaser has the right to accelerate its respective forward sale agreement and require us to physically settle its forward sale agreement on a date specified by such forward purchaser upon the occurrence of certain events. Each forward purchaser’s decision to exercise its right to require us to settle its forward sale agreement will be made irrespective of our interests, including our need for capital. In such cases, we could be required to issue and deliver our common stock under the terms of the physical settlement provisions of the relevant forward sale agreement irrespective of our capital needs, which would result in dilution to our earnings per share and unit and return on equity. In addition, upon certain events of bankruptcy, insolvency, or reorganization relating to
9
Table of Contents
us, the forward sale agreements will terminate without further liability of either party. Following any such termination, we would not issue any shares and we would not receive any proceeds pursuant to the forward sale agreements.
The forward sale agreements provide for settlement on a settlement date or dates to be specified at our discretion within approximately 15 months from December 7, 2009. Each forward sale agreement will be physically settled, unless we elect to settle such forward sale agreement in cash. If we decide to physically settle a forward sale agreement, delivery of our shares on any physical settlement of such forward sale agreement will result in dilution to our earnings per share and unit and return on equity. If we elect cash settlement for all or a portion of the shares of our common stock included in a forward sale agreement, we would expect the relevant forward purchaser or one of its affiliates to repurchase a number of shares equal to the portion for which we elect cash settlement in order to cover its obligation to return the shares of our common stock it had borrowed in connection with sales of our common stock. If the market value of our common stock at the time of the repurchase is above the forward price, we would pay the relevant forward purchaser under such forward sale agreement an amount in cash equal to the difference. Thus, we would be responsible for a potentially substantial cash payment.
In addition, the purchase of our common stock by the forward purchasers or their respective affiliates, to unwind their hedge positions, could cause the price of our common stock to increase over time, thereby increasing the amount of cash we would owe to the forward purchasers upon a cash settlement of the forward sale agreements.
Risk Factors Related to Interest Rates and the Market for Our Stock
We may be forced to deleverage our business with our operating cash flows, which could result in the reduction of distributions to our stock and unit holders, a reduction in investments into our business or additional equity offerings that dilute our stock and unit holders’ interests.
We depend on external financing, principally debt financing, to fund the growth of our business and to ensure that we can meet ongoing maturities of our outstanding debt. Our access to financing depends on our credit rating, the willingness of creditors to lend to us and conditions in the capital markets. The disruption in the capital markets that began in 2008 has continued into 2009, limiting access to financing for many companies. Without access to external financing, we would be required to pay outstanding debt with our operating cash flows and our operating cash flows may not be sufficient to pay our outstanding debt as it comes due. If we are required to deleverage our business with operating cash flows, we may be forced to reduce the amount of, or eliminate altogether, our distributions to stock and unit holders or refrain from making investments in our business.
We and our joint ventures have a significant amount of debt maturing in 2010, 2011, and 2012. During this time period, we have $624.7 million maturing and our joint ventures have $1.3 billion maturing (our pro-rata share is $333.8 million). In addition to finding creditors willing to lend to us, we are dependent upon our joint venture partners to contribute their share of any amount needed to repay or refinance existing debt when lenders reduce the amount of debt our joint ventures are refinancing.
Increased interest rates may reduce distributions to stock and unit holders.
We are obligated on floating rate debt, of which we had $5.6 million as of December 31, 2009. If we do not eliminate our exposure to increases in interest rates through interest rate protection or cap agreements, these increases may reduce cash flow and our ability to make distributions to stock and unit holders.
Although swap agreements enable us to convert floating rate debt to fixed rate debt and cap agreements enable us to cap our maximum interest rate, they expose us to the risk that the counterparties to these hedge agreements may not perform, which could increase our exposure to rising interest rates. If we enter into swap agreements, decreases in interest rates will increase our interest expense as compared to the underlying floating rate debt. This could result in our making payments to unwind these agreements, such as in connection with a prepayment of our floating rate debt.
Increased market interest rates could reduce the Parent Company’s stock price.
The annual dividend rate on our common stock as a percentage of its market price may influence the trading price of our stock. An increase in market interest rates may lead purchasers to demand a higher annual dividend rate, which could adversely affect the market price of our stock. A decrease in the market price of our
10
Table of Contents
common stock could reduce our ability to raise additional equity in the public markets. Selling common stock at a decreased market price would have a dilutive impact on existing stockholders.
The price of our common stock may fluctuate significantly.
The market price of our common stock may fluctuate significantly in response to many factors, many of which are out of our control, including:
| • | actual or anticipated variations in our operating results or dividends; |
| • | changes in our funds from operations or earnings estimates; |
| • | publication of research reports about us or the real estate industry in general and recommendations by financial analysts or actions taken by rating agencies with respect to our securities or those of other REIT’s; |
| • | the ability of our tenants to pay rent and meet their other obligations to us under current lease terms and our ability to re-lease space as leases expire; |
| • | increases in market interest rates that drive purchasers of our shares to demand a higher dividend yield; |
| • | changes in market valuations of similar companies; |
| • | adverse market reaction to any additional debt we incur in the future; |
| • | any future issuances of equity securities; |
| • | additions or departures of key management personnel; |
| • | strategic actions by us or our competitors, such as acquisitions or restructurings; |
| • | actions by institutional stockholders; |
| • | speculation in the press or investment community; |
| • | general market and economic conditions. |
These factors may cause the market price of our common stock to decline, regardless of our financial condition, results of operations, business or prospects. It is impossible to ensure that the market price of our common stock will not fall in the future.
Risk Factors Related to Federal Income Tax Laws
If the Parent Company fails to qualify as a REIT for federal income tax purposes, it would be subject to federal income tax at regular corporate rates.
We believe that we qualify for taxation as a REIT for federal income tax purposes, and we plan to operate so that we can continue to meet the requirements for taxation as a REIT. If we qualify as a REIT, we generally will not be subject to federal income tax on our income that we distribute currently to our stockholders. Many of the REIT requirements, however, are highly technical and complex. The determination that we are a REIT requires an analysis of various factual matters and circumstances, some of which may not be totally within our control and some of which involve questions of interpretation. For example, to qualify as a REIT, at least 95% of our gross income must come from specific passive sources, like rent, that are itemized in the REIT tax laws. There can be no assurance that the Internal Revenue Service (“IRS”) or a court would agree with the positions we have taken in interpreting the REIT requirements. We are also required to distribute to our stockholders at least 90% of our REIT taxable income, excluding capital gains. The fact that we hold many of our assets through co-investment partnerships and their subsidiaries further complicates the application of the REIT requirements. Even a technical or inadvertent mistake could jeopardize our REIT status. Furthermore, Congress and the IRS might make changes to the tax laws and regulations, and the courts might issue new rulings, that make it more difficult, or impossible, for us to remain qualified as a REIT.
Also, unless the IRS granted us relief under certain statutory provisions, we would remain disqualified as a REIT for four years following the year we first failed to qualify. If we failed to qualify as a REIT, we would have to pay significant income taxes and this would likely have a significant adverse affect on the value of our securities. In addition, we would no longer be required to pay any dividends to stockholders.
Even if we qualify as a REIT for federal income tax purposes, we are required to pay certain federal, state and local taxes on our income and property. For example, if we have net income from “prohibited transactions,” that income will be subject to a 100% tax. In general, prohibited transactions include sales or other dispositions of property held primarily for sale to customers in the ordinary course of business. The determination as to whether a
11
Table of Contents
particular sale is a prohibited transaction depends on the facts and circumstances related to that sale. While we have undertaken a significant number of asset sales in recent years, we do not believe that those sales should be considered prohibited transactions, but there can be no assurance that the IRS would not contend otherwise.
In addition, any net taxable income earned directly by our taxable affiliates, including Regency Realty Group, Inc. (“RRG”), our taxable REIT subsidiary, is subject to federal and state corporate income tax. Several provisions of the laws applicable to REIT’s and their subsidiaries ensure that a taxable REIT subsidiary will be subject to an appropriate level of federal income taxation. For example, a taxable REIT subsidiary is limited in its ability to deduct interest payments made to an affiliated REIT. In addition, a REIT has to pay a 100% penalty tax on some payments that it receives if the economic arrangements between the REIT, the REIT’s tenants and the taxable REIT subsidiary are not comparable to similar arrangements between unrelated parties. Finally, some state and local jurisdictions may tax some of our income even though as a REIT, we are not subject to federal income tax on that income. To the extent that we and our affiliates are required to pay federal, state and local taxes, we will have less cash available for dividends to our stockholders.
A REIT may not own securities in any one issuer if the value of those securities exceeds 5% of the value of the REIT’s total assets or the securities owned by the REIT represent more than 10% of the issuer’s outstanding voting securities or 10% of the value of the issuer’s outstanding securities. An exception to these tests allows a REIT to own securities of a subsidiary that exceed the 5% value test and the 10% value tests if the subsidiary elects to be a “taxable REIT subsidiary.” We are not able to own securities of taxable REIT subsidiaries that represent in the aggregate more than 25% of the value of our total assets. We currently own more than 10% of the total value of the outstanding securities of RRG.
Risk Factors Related to Our Ownership Limitations and the Florida Business Corporation Act
Restrictions on the ownership of the Parent Company’s capital stock to preserve our REIT status could delay or prevent a change in control.
Ownership of more than 7% by value of our outstanding capital stock by certain persons is restricted for the purpose of maintaining our qualification as a REIT, with certain exceptions. This 7% limitation may discourage a change in control and may also (i) deter tender offers for our capital stock, which offers may be attractive to our stockholders, or (ii) limit the opportunity for our stockholders to receive a premium for their capital stock that might otherwise exist if an investor attempted to assemble a block in excess of 7% of our outstanding capital stock or to effect a change in control.
The issuance of the Parent Company’s capital stock could delay or prevent a change in control.
Our articles of incorporation authorize our Board of Directors to issue up to 30,000,000 shares of preferred stock and 10,000,000 shares of special common stock and to establish the preferences and rights of any shares issued. The issuance of preferred stock or special common stock could have the effect of delaying or preventing a change in control even if a change in control were in our stockholders’ interest. The provisions of the Florida Business Corporation Act regarding control share acquisitions and affiliated transactions could also deter potential acquisitions by preventing the acquiring party from voting the common stock it acquires or consummating a merger or other extraordinary corporate transaction without the approval of our disinterested stockholders.
| Item 1B. | Unresolved Staff Comments |
Regency Centers Corporation and Regency Centers, L.P. have received no written comments regarding its periodic or current reports from the staff of the Securities and Exchange Commission that were issued 180 days or more preceding December 31, 2009 that remain unresolved.
12
Table of Contents
| Item 2. | Properties |
The following table is a list of the shopping centers summarized by state and in order of largest holdings presented on a Combined Basis (includes properties owned by unconsolidated co-investment partnerships):
| December 31, 2009 | December 31, 2008 | |||||||||||||||||||
| Location |
# Properties |
GLA | % of Total GLA |
% Leased |
# Properties |
GLA | % of Total GLA |
% Leased |
||||||||||||
| California |
71 | 8,743,529 | 19.4 | % | 92.5 | % | 76 | 9,597,194 | 19.3 | % | 91.9 | % | ||||||||
| Florida |
56 | 5,432,000 | 12.1 | % | 91.3 | % | 60 | 6,050,697 | 12.2 | % | 93.9 | % | ||||||||
| Texas |
35 | 4,358,457 | 9.7 | % | 89.8 | % | 36 | 4,404,025 | 8.9 | % | 90.5 | % | ||||||||
| Virginia |
29 | 3,635,546 | 8.1 | % | 94.9 | % | 30 | 3,799,919 | 7.6 | % | 95.6 | % | ||||||||
| Illinois |
23 | 2,769,037 | 6.2 | % | 89.7 | % | 24 | 2,901,919 | 5.8 | % | 90.0 | % | ||||||||
| Missouri |
23 | 2,265,466 | 5.0 | % | 96.8 | % | 23 | 2,265,422 | 4.6 | % | 96.8 | % | ||||||||
| Ohio |
15 | 2,245,341 | 5.0 | % | 93.1 | % | 17 | 2,631,530 | 5.3 | % | 86.7 | % | ||||||||
| North Carolina |
15 | 2,073,487 | 4.6 | % | 89.7 | % | 15 | 2,107,442 | 4.2 | % | 91.9 | % | ||||||||
| Colorado |
20 | 2,070,251 | 4.6 | % | 90.4 | % | 22 | 2,285,926 | 4.6 | % | 91.4 | % | ||||||||
| Maryland |
16 | 1,873,908 | 4.2 | % | 92.8 | % | 16 | 1,873,759 | 3.8 | % | 94.0 | % | ||||||||
| Georgia |
19 | 1,661,612 | 3.7 | % | 92.0 | % | 30 | 2,648,555 | 5.3 | % | 92.7 | % | ||||||||
| Pennsylvania |
12 | 1,414,123 | 3.1 | % | 92.4 | % | 12 | 1,441,791 | 2.9 | % | 90.1 | % | ||||||||
| Washington |
11 | 1,038,514 | 2.3 | % | 95.4 | % | 13 | 1,255,836 | 2.5 | % | 97.0 | % | ||||||||
| Oregon |
8 | 752,162 | 1.7 | % | 98.1 | % | 11 | 1,087,738 | 2.2 | % | 97.1 | % | ||||||||
| Tennessee |
7 | 565,386 | 1.3 | % | 91.8 | % | 8 | 574,114 | 1.2 | % | 92.0 | % | ||||||||
| Massachusetts |
3 | 564,386 | 1.2 | % | 95.2 | % | 3 | 561,186 | 1.1 | % | 93.4 | % | ||||||||
| Arizona |
4 | 496,073 | 1.1 | % | 89.4 | % | 4 | 496,073 | 1.0 | % | 94.3 | % | ||||||||
| Minnesota |
3 | 483,938 | 1.1 | % | 97.3 | % | 3 | 483,938 | 1.0 | % | 92.9 | % | ||||||||
| Delaware |
4 | 472,005 | 1.0 | % | 91.0 | % | 4 | 472,005 | 0.9 | % | 95.2 | % | ||||||||
| Nevada |
2 | 432,990 | 1.0 | % | 78.0 | % | 3 | 528,368 | 1.1 | % | 83.4 | % | ||||||||
| South Carolina |
6 | 360,718 | 0.8 | % | 95.2 | % | 8 | 451,494 | 0.9 | % | 96.7 | % | ||||||||
| Indiana |
6 | 273,253 | 0.6 | % | 80.3 | % | 6 | 273,279 | 0.6 | % | 76.4 | % | ||||||||
| Wisconsin |
2 | 269,128 | 0.6 | % | 97.7 | % | 2 | 269,128 | 0.5 | % | 97.7 | % | ||||||||
| Alabama |
2 | 203,206 | 0.4 | % | 72.0 | % | 3 | 278,299 | 0.6 | % | 78.3 | % | ||||||||
| Connecticut |
1 | 179,860 | 0.4 | % | 100.0 | % | 1 | 179,860 | 0.4 | % | 100.0 | % | ||||||||
| New Jersey |
2 | 156,482 | 0.3 | % | 95.2 | % | 2 | 156,482 | 0.3 | % | 96.2 | % | ||||||||
| Michigan |
2 | 118,273 | 0.3 | % | 85.8 | % | 2 | 118,273 | 0.2 | % | 84.9 | % | ||||||||
| Dist. of Columbia |
2 | 39,647 | 0.1 | % | 100.0 | % | 2 | 39,647 | 0.1 | % | 100.0 | % | ||||||||
| Kentucky |
1 | 23,184 | 0.1 | % | 63.7 | % | 3 | 325,853 | 0.7 | % | 90.2 | % | ||||||||
| New Hampshire |
— | — | — | — | 1 | 84,793 | 0.2 | % | 80.4 | % | ||||||||||
| Total |
400 | 44,971,962 | 100.0 | % | 92.1 | % | 440 | 49,644,545 | 100.0 | % | 92.3 | % | ||||||||
The Combined Properties include the consolidated and unconsolidated properties encumbered by mortgage loans of $404.4 million and $2.5 billion, respectively.
13
Table of Contents
| Item 2. | Properties (continued) |
The following table is a list of the shopping centers summarized by state and in order of largest holdings presented for Consolidated Properties (excludes properties owned by unconsolidated co-investment partnerships):
| December 31, 2009 | December 31, 2008 | |||||||||||||||||||
| Location |
# Properties |
GLA | % of Total GLA |
% Leased |
# Properties |
GLA | % of Total GLA |
% Leased |
||||||||||||
| California |
44 | 5,340,854 | 23.3 | % | 93.1 | % | 46 | 5,668,350 | 23.5 | % | 89.7 | % | ||||||||
| Florida |
44 | 4,421,788 | 19.2 | % | 91.2 | % | 41 | 4,198,414 | 17.4 | % | 94.4 | % | ||||||||
| Texas |
24 | 2,978,018 | 13.0 | % | 88.8 | % | 28 | 3,371,380 | 13.9 | % | 89.9 | % | ||||||||
| Ohio |
13 | 1,708,268 | 7.4 | % | 93.6 | % | 14 | 1,985,392 | 8.2 | % | 85.3 | % | ||||||||
| Georgia |
16 | 1,418,261 | 6.2 | % | 91.4 | % | 16 | 1,409,622 | 5.8 | % | 92.0 | % | ||||||||
| Colorado |
14 | 1,123,006 | 4.9 | % | 87.1 | % | 14 | 1,130,771 | 4.7 | % | 86.2 | % | ||||||||
| North Carolina |
9 | 873,943 | 3.8 | % | 92.3 | % | 9 | 951,177 | 3.9 | % | 94.6 | % | ||||||||
| Virginia |
7 | 864,116 | 3.8 | % | 93.2 | % | 7 | 958,825 | 4.0 | % | 90.8 | % | ||||||||
| Oregon |
7 | 659,061 | 2.9 | % | 98.0 | % | 8 | 733,068 | 3.0 | % | 98.4 | % | ||||||||
| Tennessee |
6 | 479,321 | 2.1 | % | 91.3 | % | 7 | 488,049 | 2.0 | % | 91.2 | % | ||||||||
| Washington |
6 | 461,073 | 2.0 | % | 93.5 | % | 7 | 538,155 | 2.2 | % | 95.9 | % | ||||||||
| Nevada |
2 | 432,990 | 1.9 | % | 78.0 | % | 2 | 429,304 | 1.8 | % | 81.1 | % | ||||||||
| Illinois |
3 | 414,168 | 1.8 | % | 85.2 | % | 3 | 414,996 | 1.7 | % | 84.7 | % | ||||||||
| Arizona |
3 | 388,440 | 1.7 | % | 90.4 | % | 3 | 388,440 | 1.6 | % | 93.0 | % | ||||||||
| Massachusetts |
2 | 379,107 | 1.6 | % | 92.9 | % | 2 | 375,907 | 1.6 | % | 90.5 | % | ||||||||
| Pennsylvania |
4 | 320,279 | 1.4 | % | 88.7 | % | 4 | 347,430 | 1.4 | % | 77.6 | % | ||||||||
| Delaware |
2 | 240,418 | 1.0 | % | 93.3 | % | 2 | 240,418 | 1.0 | % | 99.2 | % | ||||||||
| Michigan |
2 | 118,273 | 0.5 | % | 85.8 | % | 2 | 118,273 | 0.5 | % | 84.9 | % | ||||||||
| Maryland |
1 | 107,063 | 0.5 | % | 75.4 | % | 1 | 106,915 | 0.4 | % | 77.8 | % | ||||||||
| Alabama |
1 | 84,740 | 0.4 | % | 76.2 | % | 1 | 84,741 | 0.4 | % | 68.7 | % | ||||||||
| South Carolina |
2 | 74,421 | 0.3 | % | 90.6 | % | 2 | 74,422 | 0.3 | % | 90.6 | % | ||||||||
| Indiana |
3 | 54,484 | 0.2 | % | 44.7 | % | 3 | 54,510 | 0.2 | % | 34.1 | % | ||||||||
| Kentucky |
1 | 23,184 | 0.1 | % | 63.7 | % | 1 | 23,184 | 0.1 | % | 33.6 | % | ||||||||
| New Hampshire |
— | — | — | — | 1 | 84,793 | 0.4 | % | 80.4 | % | ||||||||||
| Total |
216 | 22,965,276 | 100.0 | % | 91.0 | % | 224 | 24,176,536 | 100.0 | % | 90.2 | % | ||||||||
The Consolidated Properties are encumbered by mortgage loans of $404.4 million.
14
Table of Contents
| Item 2. | Properties (continued) |
The following table is a list of the shopping centers summarized by state and in order of largest holdings presented for Unconsolidated Properties (only properties owned by unconsolidated co-investment partnerships):
| December 31, 2009 | December 31, 2008 | |||||||||||||||||||
| Location |
# Properties |
GLA | % of Total GLA |
% Leased |
# Properties |
GLA | % of Total GLA |
% Leased |
||||||||||||
| California |
27 | 3,402,675 | 15.5 | % | 91.6 | % | 30 | 3,928,844 | 15.4 | % | 94.9 | % | ||||||||
| Virginia |
22 | 2,771,430 | 12.6 | % | 95.4 | % | 23 | 2,841,094 | 11.2 | % | 97.2 | % | ||||||||
| Illinois |
20 | 2,354,869 | 10.7 | % | 90.5 | % | 21 | 2,486,923 | 9.8 | % | 90.9 | % | ||||||||
| Missouri |
23 | 2,265,466 | 10.3 | % | 96.8 | % | 23 | 2,265,422 | 8.9 | % | 96.8 | % | ||||||||
| Maryland |
15 | 1,766,845 | 8.0 | % | 93.8 | % | 15 | 1,766,844 | 6.9 | % | 95.0 | % | ||||||||
| Texas |
11 | 1,380,439 | 6.3 | % | 92.1 | % | 8 | 1,032,645 | 4.0 | % | 92.6 | % | ||||||||
| North Carolina |
6 | 1,199,544 | 5.5 | % | 87.8 | % | 6 | 1,156,265 | 4.5 | % | 89.7 | % | ||||||||
| Pennsylvania |
8 | 1,093,844 | 5.0 | % | 93.5 | % | 8 | 1,094,361 | 4.3 | % | 94.1 | % | ||||||||
| Florida |
12 | 1,010,212 | 4.6 | % | 92.0 | % | 19 | 1,852,283 | 7.3 | % | 92.6 | % | ||||||||
| Colorado |
6 | 947,245 | 4.3 | % | 94.4 | % | 8 | 1,155,155 | 4.5 | % | 96.4 | % | ||||||||
| Washington |
5 | 577,441 | 2.6 | % | 96.9 | % | 6 | 717,681 | 2.8 | % | 97.8 | % | ||||||||
| Ohio |
2 | 537,073 | 2.4 | % | 91.6 | % | 3 | 646,138 | 2.5 | % | 91.0 | % | ||||||||
| Minnesota |
3 | 483,938 | 2.2 | % | 97.3 | % | 3 | 483,938 | 1.9 | % | 92.9 | % | ||||||||
| South Carolina |
4 | 286,297 | 1.3 | % | 96.4 | % | 6 | 377,072 | 1.5 | % | 98.0 | % | ||||||||
| Wisconsin |
2 | 269,128 | 1.2 | % | 97.7 | % | 2 | 269,128 | 1.1 | % | 97.7 | % | ||||||||
| Georgia |
3 | 243,351 | 1.1 | % | 95.6 | % | 14 | 1,238,933 | 4.9 | % | 93.6 | % | ||||||||
| Delaware |
2 | 231,587 | 1.1 | % | 88.5 | % | 2 | 231,587 | 0.9 | % | 91.1 | % | ||||||||
| Indiana |
3 | 218,769 | 1.0 | % | 89.1 | % | 3 | 218,769 | 0.9 | % | 87.0 | % | ||||||||
| Massachusetts |
1 | 185,279 | 0.8 | % | 100.0 | % | 1 | 185,279 | 0.7 | % | 99.4 | % | ||||||||
| Connecticut |
1 | 179,860 | 0.8 | % | 100.0 | % | 1 | 179,860 | 0.7 | % | 100.0 | % | ||||||||
| New Jersey |
2 | 156,482 | 0.7 | % | 95.2 | % | 2 | 156,482 | 0.6 | % | 96.2 | % | ||||||||
| Alabama |
1 | 118,466 | 0.5 | % | 69.1 | % | 2 | 193,558 | 0.8 | % | 82.5 | % | ||||||||
| Arizona |
1 | 107,633 | 0.5 | % | 85.8 | % | 1 | 107,633 | 0.4 | % | 98.9 | % | ||||||||
| Oregon |
1 | 93,101 | 0.4 | % | 98.1 | % | 3 | 354,670 | 1.4 | % | 94.3 | % | ||||||||
| Tennessee |
1 | 86,065 | 0.4 | % | 94.8 | % | 1 | 86,065 | 0.3 | % | 96.2 | % | ||||||||
| Dist. of Columbia |
2 | 39,647 | 0.2 | % | 100.0 | % | 2 | 39,647 | 0.2 | % | 100.0 | % | ||||||||
| Nevada |
— | — | — | — | 1 | 99,064 | 0.4 | % | 93.0 | % | ||||||||||
| Kentucky |
— | — | — | — | 2 | 302,669 | 1.2 | % | 94.6 | % | ||||||||||
| Total |
184 | 22,006,686 | 100.0 | % | 93.2 | % | 216 | 25,468,009 | 100.0 | % | 94.3 | % | ||||||||
The Unconsolidated Properties are encumbered by mortgage loans of $2.5 billion.
15
Table of Contents
| Item 2. | Properties (continued) |
The following table summarizes the largest tenants occupying our shopping centers for Consolidated Properties plus Regency’s pro-rata share of Unconsolidated Properties as of December 31, 2009 based upon a percentage of total annualized base rent exceeding or equal to .5%.
| Tenant |
GLA | Percent to Company Owned GLA |
Rent | Percentage of Annualized Base Rent |
Number of Leased Stores |
Anchor Owned Stores (a) | |||||||||
| Kroger |
2,209,184 | 8.0 | % | $ | 20,462,378 | 4.8 | % | 46 | 9 | ||||||
| Publix |
1,902,503 | 6.9 | % | 17,615,932 | 4.2 | % | 54 | 1 | |||||||
| Safeway |
1,601,669 | 5.8 | % | 15,488,636 | 3.7 | % | 55 | 6 | |||||||
| Supervalu |
882,406 | 3.2 | % | 10,337,559 | 2.4 | % | 28 | 3 | |||||||
| CVS |
449,045 | 1.6 | % | 6,923,620 | 1.6 | % | 50 | — | |||||||
| Blockbuster Video |
268,623 | 1.0 | % | 5,708,551 | 1.4 | % | 71 | — | |||||||
| TJX Companies |
406,252 | 1.5 | % | 4,149,162 | 1.0 | % | 23 | — | |||||||
| Whole Foods |
139,796 | 0.5 | % | 3,952,760 | 0.9 | % | 5 | — | |||||||
| Ross Dress For Less |
241,538 | 0.9 | % | 3,782,603 | 0.9 | % | 16 | — | |||||||
| Sports Authority |
181,523 | 0.7 | % | 3,458,514 | 0.8 | % | 5 | — | |||||||
| Starbucks |
98,478 | 0.4 | % | 3,302,076 | 0.8 | % | 88 | — | |||||||
| Sears Holdings |
435,250 | 1.6 | % | 3,297,617 | 0.8 | % | 14 | 1 | |||||||
| PETCO |
189,538 | 0.7 | % | 3,273,941 | 0.8 | % | 23 | — | |||||||
| Wells Fargo Bank |
61,579 | 0.2 | % | 3,178,196 | 0.8 | % | 49 | — | |||||||
| Walgreens |
176,165 | 0.6 | % | 2,971,809 | 0.7 | % | 17 | — | |||||||
| Rite Aid |
198,992 | 0.7 | % | 2,924,740 | 0.7 | % | 25 | — | |||||||
| H.E.B. |
210,413 | 0.8 | % | 2,771,745 | 0.7 | % | 4 | — | |||||||
| Schnucks |
308,578 | 1.1 | % | 2,687,565 | 0.6 | % | 31 | — | |||||||
| Bank of America |
68,847 | 0.2 | % | 2,611,264 | 0.6 | % | 32 | — | |||||||
| Subway |
90,705 | 0.3 | % | 2,571,552 | 0.6 | % | 111 | — | |||||||
| The UPS Store |
95,313 | 0.3 | % | 2,442,339 | 0.6 | % | 98 | — | |||||||
| Target |
268,922 | 1.0 | % | 2,392,748 | 0.6 | % | 4 | 20 | |||||||
| Hallmark |
135,374 | 0.5 | % | 2,366,096 | 0.6 | % | 51 | — | |||||||
| Ahold |
135,773 | 0.5 | % | 2,348,193 | 0.6 | % | 10 | — | |||||||
| Harris Teeter |
182,108 | 0.7 | % | 2,315,621 | 0.5 | % | 7 | — | |||||||
| Michael’s |
190,501 | 0.7 | % | 2,284,210 | 0.5 | % | 12 | — | |||||||
| JPMorgan Chase Bank |
59,161 | 0.2 | % | 2,277,678 | 0.5 | % | 23 | — | |||||||
| Home Depot |
135,604 | 0.5 | % | 2,250,231 | 0.5 | % | 4 | — | |||||||
| PetSmart |
140,491 | 0.5 | % | 2,159,950 | 0.5 | % | 9 | — | |||||||
| Stater Bros. |
139,961 | 0.5 | % | 2,122,914 | 0.5 | % | 4 | — | |||||||
| Staples |
147,382 | 0.5 | % | 2,116,261 | 0.5 | % | 12 | — | |||||||
| (a) | Stores owned by anchor tenant that are attached to our centers. |
Regency’s leases for tenant space under 5,000 square feet generally have terms ranging from three to five years. Leases greater than 10,000 square feet generally have lease terms in excess of five years, mostly comprised of anchor tenants. Many of the anchor leases contain provisions allowing the tenant the option of extending the term of the lease at expiration. The leases provide for the monthly payment in advance of fixed minimum rent, additional rents calculated as a percentage of the tenant’s sales, the tenant’s pro-rata share of real estate taxes, insurance, and common area maintenance (“CAM”) expenses, and reimbursement for utility costs if not directly metered.
16
Table of Contents
| Item 2. | Properties (continued) |
The following table sets forth a schedule of lease expirations for the next ten years and thereafter, assuming no tenants renew their leases:
| Lease Expiration Year |
Expiring GLA (2) |
Percent of Total Company GLA (2) |
Minimum Rent Expiring Leases (3) |
Percent of Minimum Rent (3) |
|||||||
| (1) |
332,341 | 1.3 | % | $ | 6,597,904 | 1.6 | % | ||||
| 2010 |
2,403,843 | 9.6 | % | 46,441,879 | 11.0 | % | |||||
| 2011 |
2,865,300 | 11.5 | % | 50,980,187 | 12.1 | % | |||||
| 2012 |
3,305,426 | 13.2 | % | 61,187,816 | 14.5 | % | |||||
| 2013 |
2,435,983 | 9.7 | % | 46,169,653 | 10.9 | % | |||||
| 2014 |
2,254,932 | 9.0 | % | 42,849,004 | 10.1 | % | |||||
| 2015 |
756,837 | 3.0 | % | 12,883,157 | 3.0 | % | |||||
| 2016 |
700,283 | 2.8 | % | 12,135,224 | 2.9 | % | |||||
| 2017 |
1,215,920 | 4.9 | % | 21,081,969 | 5.0 | % | |||||
| 2018 |
1,251,759 | 5.0 | % | 19,545,813 | 4.6 | % | |||||
| 2019 |
1,127,900 | 4.5 | % | 16,444,918 | 3.9 | % | |||||
| Thereafter |
6,350,888 | 25.5 | % | 86,676,290 | 20.4 | % | |||||
| Total |
25,001,412 | 100.0 | % | $ | 422,993,814 | 100.0 | % | ||||
| (1) | leased currently under month to month rent or in process of renewal |
| (2) | represents GLA for Consolidated Properties plus Regency’s pro-rata share of Unconsolidated Properties |
| (3) | minimum rent includes current minimum rent and future contractual rent steps for the Consolidated Properties plus Regency’s pro-rata share from Unconsolidated Properties, but excludes additional rent such as percentage rent, common area maintenance, real estate taxes and insurance reimbursements |
17
Table of Contents
See the following Combined Basis property table and also see Item 7, Management’s Discussion and Analysis for further information about Regency’s properties.
| Property Name |
Year Acquired |
Year Constructed (1) |
Gross Leasable Area (GLA) |
Percent Leased (2) |
Grocer & Major Tenant(s) >40,000sf |
Drug Store & Other Anchors > 10,000 Sq Ft | |||||||
| CALIFORNIA |
|||||||||||||
| Los Angeles/ Southern CA |
|||||||||||||
| 4S Commons Town Center |
2004 | 2004 | 240,060 | 96.6 | % | Ralphs, Jimbo’s...Naturally! | Bed Bath & Beyond, Cost Plus World Market, CVS, Griffin Ace Hardware | ||||||
| Amerige Heights Town Center |
2000 | 2000 | 96,680 | 98.0 | % | Albertsons, (Target) | — | ||||||
| Brea Marketplace (4) |
2005 | 1987 | 193,235 | 84.2 | % | Sprout’s Markets | 24 Hour Fitness, Big 5 Sporting Goods, Beverages & More!, Childtime Childcare | ||||||
| Costa Verde Center |
1999 | 1988 | 178,623 | 92.2 | % | Bristol Farms | Bookstar, The Boxing Club, Pharmaca Integrative Pharmacy | ||||||
| El Camino Shopping Center |
1999 | 1995 | 135,728 | 100.0 | % | Von’s Food & Drug | Sav-On Drugs | ||||||
| El Norte Pkwy Plaza |
1999 | 1984 | 90,549 | 95.9 | % | Von’s Food & Drug | Longs Drug | ||||||
| Falcon Ridge Town Center Phase I (4) |
2003 | 2004 | 232,754 | 85.2 | % | Stater Bros., (Target) | Sports Authority, Ross Dress for Less, Party City, Michaels, Pier 1 Imports | ||||||
| Falcon Ridge Town Center Phase II (4) |
2005 | 2005 | 66,864 | 100.0 | % | 24 Hour Fitness | CVS | ||||||
| Five Points Shopping Center (4) |
2005 | 1960 | 144,553 | 100.0 | % | Albertsons | Longs Drug, Ross Dress for Less, Big 5 Sporting Goods | ||||||
| French Valley Village Center |
2004 | 2004 | 98,752 | 92.7 | % | Stater Bros. | CVS | ||||||
| Friars Mission Center |
1999 | 1989 | 146,898 | 98.6 | % | Ralphs | Longs Drug | ||||||
| Gelson’s Westlake Market Plaza |
2002 | 2002 | 84,975 | 90.8 | % | Gelson’s Markets | — | ||||||
| Golden Hills Promenade (3) |
2006 | 2006 | 216,846 | 92.7 | % | Lowe’s | Bed Bath & Beyond | ||||||
| Granada Village (4) |
2005 | 1965 | 224,649 | 68.9 | % | — | Rite Aid, TJ Maxx, Stein Mart | ||||||
| Hasley Canyon Village (4) |
2003 | 2003 | 65,801 | 95.7 | % | Ralphs | — | ||||||
| Heritage Plaza |
1999 | 1981 | 231,582 | 99.7 | % | Ralphs | CVS, Hands On Bicycles, Total Woman, Ace Hardware | ||||||
| Highland Crossing |
2007 | 2007 | 45,000 | 100.0 | % | LA Fitness | — | ||||||
| Indio Towne Center (3) |
2006 | 2006 | 142,790 | 53.4 | % | (Home Depot), (WinCo) | CVS, 24 Hour Fitness, PETCO | ||||||
| Jefferson Square (3) |
2007 | 2007 | 38,013 | 74.7 | % | Fresh & Easy | CVS | ||||||
| Laguna Niguel Plaza (4) |
2005 | 1985 | 41,943 | 96.1 | % | (Albertsons) | CVS | ||||||
| Marina Shores (4) |
2008 | 2001 | 67,727 | 89.5 | % | — | PETCO | ||||||
| Morningside Plaza |
1999 | 1996 | 91,212 | 93.1 | % | Stater Bros. | — | ||||||
| Navajo Shopping Center (4) |
2005 | 1964 | 102,138 | 97.7 | % | Albertsons | Rite Aid, Kragen Auto Parts | ||||||
| Newland Center |
1999 | 1985 | 149,140 | 100.0 | % | Albertsons | — | ||||||
| Oakbrook Plaza |
1999 | 1982 | 83,279 | 97.2 | % | Albertsons | (Longs Drug) | ||||||
| Park Plaza Shopping Center (4) |
2001 | 1991 | 194,396 | 93.6 | % | Henry’s Marketplace | CVS, PETCO, Ross Dress For Less, Office Depot, Tuesday Morning | ||||||
| Plaza Hermosa |
1999 | 1984 | 94,940 | 100.0 | % | Von’s Food & Drug | Sav-On Drugs | ||||||
| Point Loma Plaza (4) |
2005 | 1987 | 212,415 | 96.3 | % | Von’s Food & Drug | Sport Chalet 5, 24 Hour Fitness, Jo-Ann Fabrics | ||||||
| Rancho San Diego Village (4) |
2005 | 1981 | 153,256 | 94.1 | % | Von’s Food & Drug | (Longs Drug), 24 Hour Fitness | ||||||
| Rio Vista Town Center (3) |
2005 | 2005 | 79,519 | 64.4 | % | Stater Bros. | (CVS) | ||||||
| Rona Plaza |
1999 | 1989 | 51,760 | 100.0 | % | Superior Super Warehouse | — | ||||||
| Santa Ana Downtown Plaza |
1999 | 1987 | 100,306 | 90.7 | % | Food 4 Less | Famsa, Inc. | ||||||
| Seal Beach (4) |
2002 | 1966 | 96,858 | 91.7 | % | Von’s Food & Drug | CVS | ||||||
| Paseo Del Sol (3) |
2004 | 2004 | 54,778 | 64.5 | % | Whole Foods | — | ||||||
| Twin Oaks Shopping Center (4) |
2005 | 1978 | 98,399 | 100.0 | % | Ralphs | Rite Aid | ||||||
| Twin Peaks |
1999 | 1988 | 198,139 | 95.5 | % | Albertsons, Target | — | ||||||
| Valencia Crossroads |
2002 | 2003 | 172,856 | 94.1 | % | Whole Foods, Kohl’s | — | ||||||
| Ventura Village |
1999 | 1984 | 76,070 | 95.2 | % | Von’s Food & Drug | — | ||||||
| Vine at Castaic (3) |
2005 | 2005 | 30,236 | 62.6 | % | — | — | ||||||
| Vista Village Phase I (4) |
2002 | 2003 | 129,009 | 91.8 | % | Krikorian Theaters, (Lowe’s) | — | ||||||
| Vista Village Phase II (4) |
2002 | 2003 | 55,000 | 45.5 | % | Sprout’s Markets | — | ||||||
| Vista Village IV |
2006 | 2006 | 11,000 | 100.0 | % | — | — | ||||||
| Westlake Village Plaza and Center |
1999 | 1975 | 190,529 | 98.1 | % | Von’s Food & Drug | (CVS), Longs Drug, Total Woman | ||||||
| Westridge Village |
2001 | 2003 | 92,287 | 100.0 | % | Albertsons | Beverages & More! | ||||||
| Woodman Van Nuys |
1999 | 1992 | 107,614 | 100.0 | % | El Super | — | ||||||
| San Francisco/ Northern CA |
|||||||||||||
| Applegate Ranch Shopping Center (3) |
2006 | 2006 | 144,444 | 66.2 | % | (Super Target), (Home Depot) | Marshalls, PETCO, Big 5 Sporting Goods | ||||||
| Auburn Village (4) |
2005 | 1990 | 133,944 | 96.3 | % | Bel Air Market | Dollar Tree, Goodwill Industries, (Longs Drug) | ||||||
| Bayhill Shopping Center (4) |
2005 | 1990 | 121,846 | 100.0 | % | Mollie Stone’s Market | Longs Drug | ||||||
18
Table of Contents
| Property Name |
Year Acquired |
Year Constructed (1) |
Gross Leasable Area (GLA) |
Percent Leased (2) |
Grocer & Major Tenant(s) >40,000sf |
Drug Store & Other Anchors > 10,000 Sq Ft | |||||||
| CALIFORNIA (continued) |
|||||||||||||
| Blossom Valley (4) |
1999 | 1990 | 93,316 | 93.8 | % | Safeway | Longs Drug | ||||||
| Clayton Valley Shopping Center |
2003 | 2004 | 260,671 | 96.8 | % | Fresh & Easy, Home Depot | Longs Drugs, Dollar Tree, Ross Dress For Less | ||||||
| Clovis Commons |
2004 | 2004 | 174,990 | 98.4 | % | (Super Target) | Petsmart, TJ Maxx, Office Depot, Best Buy | ||||||
| Corral Hollow (4) |
2000 | 2000 | 167,184 | 98.7 | % | Safeway, Orchard Supply & Hardware | Longs Drug | ||||||
| Diablo Plaza |
1999 | 1982 | 63,265 | 96.7 | % | (Safeway) | (Longs Drug), Jo-Ann Fabrics | ||||||
| El Cerrito Plaza |
2000 | 2000 | 256,035 | 98.0 | % | (Lucky’s) | (Longs Drug), Bed Bath & Beyond, Barnes & Noble, Jo-Ann Fabrics, PETCO, Ross Dress For Less | ||||||
| Encina Grande |
1999 | 1965 | 102,413 | 95.8 | % | Safeway | Walgreens | ||||||
| Folsom Prairie City Crossing |
1999 | 1999 | 90,237 | 95.7 | % | Safeway | — | ||||||
| Gateway 101 |
2008 | 2008 | 92,110 | 100.0 | % | (Home Depot), (Best Buy), Sports Authority, Nordstrom Rack | — | ||||||
| Loehmanns Plaza California |
1999 | 1983 | 113,310 | 99.1 | % | (Safeway) | Longs Drug, Loehmann’s | ||||||
| Mariposa Shopping Center (4) |
2005 | 1957 | 126,658 | 100.0 | % | Safeway | Longs Drug, Ross Dress for Less | ||||||
| Pleasant Hill Shopping Center (4) |
2005 | 1970 | 234,061 | 83.6 | % | Target, Toys “R” Us | Barnes & Noble | ||||||
| Powell Street Plaza |
2001 | 1987 | 165,928 | 83.6 | % | Trader Joe’s | PETCO, Beverages & More!, Ross Dress For Less, DB Shoe Company | ||||||
| Raley’s Supermarket (4) |
2007 | 1964 | 62,827 | 100.0 | % | Raley’s | — | ||||||
| San Leandro Plaza |
1999 | 1982 | 50,432 | 100.0 | % | (Safeway) | (Longs Drug) | ||||||
| Sequoia Station |
1999 | 1996 | 103,148 | 86.3 | % | (Safeway) | Longs Drug, Barnes & Noble, Old Navy | ||||||
| Silverado Plaza (4) |
2005 | 1974 | 84,916 | 100.0 | % | Nob Hill | Longs Drug | ||||||
| Snell & Branham Plaza (4) |
2005 | 1988 | 99,350 | 98.3 | % | Safeway | — | ||||||
| Stanford Ranch Village (4) |
2005 | 1991 | 89,875 | 95.1 | % | Bel Air Market | — | ||||||
| Strawflower Village |
1999 | 1985 | 78,827 | 94.4 | % | Safeway | (Longs Drug) | ||||||
| Tassajara Crossing |
1999 | 1990 | 146,188 | 96.7 | % | Safeway | Longs Drug, Ace Hardware | ||||||
| West Park Plaza |
1999 | 1996 | 88,104 | 98.0 | % | Safeway | Rite Aid | ||||||
| Woodside Central |
1999 | 1993 | 80,591 | 100.0 | % | (Target) | Chuck E. Cheese, Marshalls | ||||||
| Ygnacio Plaza (4) |
2005 | 1968 | 109,701 | 99.0 | % | Fresh & Easy | Sports Basement | ||||||
| Subtotal/Weighted Average (CA) |
8,743,529 | 92.5 | % | ||||||||||
| FLORIDA |
|||||||||||||
| Ft. Myers / Cape Coral |
|||||||||||||
| Corkscrew Village |
2007 | 1997 | 82,011 | 91.9 | % | Publix | — | ||||||
| First Street Village (3) |
2006 | 2006 | 54,926 | 89.4 | % | Publix | — | ||||||
| Grande Oak |
2000 | 2000 | 78,784 | 100.0 | % | Publix | — | ||||||
| Jacksonville / North Florida |
|||||||||||||
| Anastasia Plaza |
1993 | 1988 | 102,342 | 95.0 | % | Publix | — | ||||||
| Canopy Oak Center (3)(4) |
2006 | 2006 | 90,041 | 77.8 | % | Publix | — | ||||||
| Carriage Gate |
1994 | 1978 | 76,784 | 91.4 | % | — | Leon County Tax Collector, TJ Maxx | ||||||
| Courtyard Shopping Center |
1993 | 1987 | 137,256 | 100.0 | % | (Publix), Target | — | ||||||
| Fleming Island |
1998 | 2000 | 136,663 | 63.9 | % | Publix, (Target) | — | ||||||
| Hibernia Pavilion (3) |
2006 | 2006 | 51,298 | 92.5 | % | Publix | — | ||||||
| Hibernia Plaza (3) |
2006 | 2006 | 8,400 | 33.3 | % | — | (Walgreens) | ||||||
| Horton’s Corner |
2007 | 2007 | 14,820 | 100.0 | % | — | Walgreens | ||||||
| John’s Creek Center (4) |
2003 | 2004 | 75,101 | 100.0 | % | Publix | — | ||||||
| Julington Village (4) |
1999 | 1999 | 81,820 | 100.0 | % | Publix | (CVS) | ||||||
| Millhopper Shopping Center |
1993 | 1974 | 84,065 | 100.0 | % | Publix | CVS, Jo-Ann Fabrics | ||||||
| Newberry Square |
1994 | 1986 | 180,524 | 95.6 | % | Publix, K-Mart | Jo-Ann Fabrics | ||||||
| Nocatee Town Center (3) |
2007 | 2007 | 69,679 | 86.0 | % | Publix | — | ||||||
| Oakleaf Commons (3) |
2006 | 2006 | 73,717 | 79.1 | % | Publix | (Walgreens) | ||||||
| Old St Augustine Plaza |
1996 | 1990 | 232,459 | 99.1 | % | Publix, Burlington Coat Factory, Hobby Lobby | CVS | ||||||
| Pine Tree Plaza |
1997 | 1999 | 63,387 | 98.4 | % | Publix | — | ||||||
| Plantation Plaza (4) |
2004 | 2004 | 77,747 | 98.2 | % | Publix | — | ||||||
| Seminole Shoppes (3) |
2009 | 2009 | 73,240 | 74.2 | % | Publix | — | ||||||
| Shoppes at Bartram Park (4) |
2005 | 2004 | 105,319 | 95.3 | % | Publix, (Kohl’s) | Toll Brothers | ||||||
| Shoppes at Bartram Park Phase II (3)(4) |
2008 | 2008 | 14,639 | 49.3 | % | — | (Tutor Time) | ||||||
| Shops at John’s Creek |
2003 | 2004 | 15,490 | 72.6 | % | — | — | ||||||
| Starke |
2000 | 2000 | 12,739 | 100.0 | % | — | CVS | ||||||
19
Table of Contents
| Property Name |
Year Acquired |
Year Constructed (1) |
Gross Leasable Area (GLA) |
Percent Leased (2) |
Grocer & Major Tenant(s) >40,000sf |
Drug Store & Other Anchors > 10,000 Sq Ft | |||||||
| FLORIDA (continued) |
|||||||||||||
| Vineyard Shopping Center (4) |
2001 | 2002 | 62,821 | 88.9 | % | Publix | — | ||||||
| Miami / Fort Lauderdale |
|||||||||||||
| Aventura Shopping Center |
1994 | 1974 | 102,876 | 92.2 | % | Publix | CVS | ||||||
| Berkshire Commons |
1994 | 1992 | 106,354 | 100.0 | % | Publix | Walgreens | ||||||
| Caligo Crossing (3) |
2007 | 2007 | 10,762 | 74.9 | % | (Kohl’s) | — | ||||||
| Five Corners Plaza (4) |
2005 | 2001 | 44,647 | 88.1 | % | Publix | — | ||||||
| Garden Square |
1997 | 1991 | 90,258 | 98.6 | % | Publix | CVS | ||||||
| Naples Walk Shopping Center |
2007 | 1999 | 125,390 | 91.7 | % | Publix | — | ||||||
| Pebblebrook Plaza (4) |
2000 | 2000 | 76,767 | 100.0 | % | Publix | (Walgreens) | ||||||
| Shoppes @ 104 |
1998 | 1990 | 108,192 | 97.4 | % | Winn-Dixie | Navarro Discount Pharmacies | ||||||
| Welleby Plaza |
1996 | 1982 | 109,949 | 93.1 | % | Publix | Bealls | ||||||
| Tampa / Orlando |
|||||||||||||
| Beneva Village Shops |
1998 | 1987 | 141,532 | 79.6 | % | Publix | Walgreens, Harbor Freight Tools | ||||||
| Bloomingdale Square |
1998 | 1987 | 267,736 | 96.7 | % | Publix, Wal-Mart, Bealls | Ace Hardware | ||||||
| East Towne Center |
2002 | 2003 | 69,841 | 92.0 | % | Publix | — | ||||||
| Kings Crossing Sun City |
1999 | 1999 | 75,020 | 98.4 | % | Publix | — | ||||||
| Lynnhaven (4) |
2001 | 2001 | 63,871 | 100.0 | % | Publix | — | ||||||
| Marketplace Shopping Center |
1995 | 1983 | 90,296 | 33.2 | % | — | — | ||||||
| Regency Square |
1993 | 1986 | 349,848 | 93.1 | % | AMC Theater, Michaels, (Best Buy), (Macdill) | Dollar Tree, Marshalls, Shoe Carnival, Staples, TJ Maxx, PETCO, Hobbytown USA | ||||||
| Suncoast Crossing Phase I (3) |
2007 | 2007 | 108,434 | 91.9 | % | Kohl’s | — | ||||||
| Suncoast Crossing Phase II (3) |
2008 | 2008 | 9,451 | 0.0 | % | (Target) | — | ||||||
| Town Square |
1997 | 1999 | 44,380 | 100.0 | % | — | PETCO, Pier 1 Imports | ||||||
| Village Center |
1995 | 1993 | 181,110 | 96.5 | % | Publix | Walgreens, Stein Mart | ||||||
| Northgate Square |
2007 | 1995 | 75,495 | 100.0 | % | Publix | — | ||||||
| Westchase |
2007 | 1998 | 78,998 | 95.2 | % | Publix | — | ||||||
| Willa Springs (4) |
2000 | 2000 | 89,930 | 98.3 | % | Publix | — | ||||||
| West Palm Beach / Treasure Cove |
|||||||||||||
| Boynton Lakes Plaza |
1997 | 1993 | 124,924 | 83.5 | % | Winn-Dixie | Citi Trends | ||||||
| Chasewood Plaza |
1993 | 1986 | 155,603 | 97.7 | % | Publix | Bealls, Books-A-Million | ||||||
| East Port Plaza |
1997 | 1991 | 113,281 | 90.4 | % | Publix | Walgreens | ||||||
| Island Crossing (4) |
2007 | 1996 | 58,456 | 100.0 | % | Publix | — | ||||||
| Martin Downs Village Center |
1993 | 1985 | 112,666 | 87.3 | % | — | Bealls, Coastal Care | ||||||
| Martin Downs Village Shoppes |
1993 | 1998 | 48,937 | 87.1 | % | — | Walgreens | ||||||
| Town Center at Martin Downs |
1996 | 1996 | 64,546 | 100.0 | % | Publix | — | ||||||
| Village Commons Shopping Center (4) |
2005 | 1986 | 169,053 | 80.6 | % | Publix | CVS | ||||||
| Wellington Town Square |
1996 | 1982 | 107,325 | 98.9 | % | Publix | CVS | ||||||
| Subtotal/Weighted Average (FL) |
5,432,000 | 91.3 | % | ||||||||||
| TEXAS |
|||||||||||||
| Austin |
|||||||||||||
| Hancock |
1999 | 1998 | 410,438 | 96.0 | % | H.E.B., Sears | Twin Liquors, PETCO, 24 Hour Fitness | ||||||
| Market at Round Rock |
1999 | 1987 | 122,646 | 57.7 | % | Sprout’s Markets | — | ||||||
| North Hills |
1999 | 1995 | 144,020 | 95.1 | % | H.E.B. | — | ||||||
| Dallas / Ft. Worth |
|||||||||||||
| Bethany Park Place (4) |
1998 | 1998 | 98,906 | 96.6 | % | Kroger | — | ||||||
| Cooper Street |
1999 | 1992 | 133,196 | 91.5 | % | (Home Depot) | Office Max, K&G Men’s Company | ||||||
| Hickory Creek Plaza (3) |
2006 | 2006 | 28,134 | 47.2 | % | (Kroger) | — | ||||||
| Highland Village (3) |
2005 | 2005 | 351,635 | 79.2 | % | AMC Theater | Barnes & Noble | ||||||
| Hillcrest Village |
1999 | 1991 | 14,530 | 100.0 | % | — | — | ||||||
| Keller Town Center |
1999 | 1999 | 114,937 | 95.2 | % | Tom Thumb | — | ||||||
| Lebanon/Legacy Center |
2000 | 2002 | 56,674 | 91.8 | % | (Albertsons) | — | ||||||
| Main Street Center (4) |
2002 | 2002 | 42,754 | 59.3 | % | (Albertsons) | — | ||||||
| Market at Preston Forest |
1999 | 1990 | 96,353 | 100.0 | % | Tom Thumb | — | ||||||
| Mockingbird Common |
1999 | 1987 | 120,321 | 100.0 | % | Tom Thumb | Ogle School of Hair Design | ||||||
| Preston Park |
1999 | 1985 | 239,333 | 92.9 | % | Tom Thumb | Gap | ||||||
| Prestonbrook |
1998 | 1998 | 91,537 | 95.3 | % | Kroger | — | ||||||
| Prestonwood Park |
1999 | 1999 | 101,167 | 51.4 | % | (Albertsons) | — | ||||||
| Rockwall Town Center |
2002 | 2004 | 46,095 | 94.6 | % | (Kroger) | (Walgreens) | ||||||
20
Table of Contents
| Property Name |
Year Acquired |
Year Constructed (1) |
Gross Leasable Area (GLA) |
Percent Leased (2) |
Grocer &
Major |
Drug Store & Other Anchors > 10,000 Sq Ft | |||||||
| TEXAS (continued) |
|||||||||||||
| Shiloh Springs (4) |
1998 | 1998 | 110,040 | 91.2 | % | Kroger | — | ||||||
| Signature Plaza |
2003 | 2004 | 32,414 | 68.8 | % | (Kroger) | — | ||||||
| Trophy Club |
1999 | 1999 | 106,507 | 88.6 | % | Tom Thumb | (Walgreens) | ||||||
| Houston |
|||||||||||||
| Alden Bridge (4) |
2002 | 1998 | 138,953 | 91.1 | % | Kroger | Walgreens | ||||||
| Atascocita Center |
2002 | 2003 | 97,240 | 94.3 | % | Kroger | — | ||||||
| Cochran’s Crossing |
2002 | 1994 | 138,192 | 97.1 | % | Kroger | CVS | ||||||
| Fort Bend Center |
2000 | 2000 | 30,164 | 92.1 | % | (Kroger) | — | ||||||
| Indian Springs Center (4) |
2002 | 2003 | 136,625 | 98.9 | % | H.E.B. | — | ||||||
| Kleinwood Center (4) |
2002 | 2003 | 148,964 | 79.7 | % | H.E.B. | (Walgreens) | ||||||
| Memorial Collection Shopping Center (4) |
2005 | 1974 | 103,330 | 97.5 | % | Randall’s Food | Walgreens | ||||||
| Panther Creek |
2002 | 1994 | 165,560 | 92.1 | % | Randall’s Food | CVS, Sears Paint & Hardware | ||||||
| Sterling Ridge |
2002 | 2000 | 128,643 | 100.0 | % | Kroger | CVS | ||||||
| Sweetwater Plaza (4) |
2001 | 2000 | 134,045 | 96.6 | % | Kroger | Walgreens | ||||||
| Waterside Marketplace (3) |
2007 | 2007 | 24,858 | 92.5 | % | (Kroger) | — | ||||||
| Weslayan Plaza East (4) |
2005 | 1969 | 169,693 | 94.8 | % | — | Berings, Ross Dress for Less, Michaels, Berings Warehouse, Chuck E. Cheese, The Next Level Fitness, Spec’s Liquor | ||||||
| Weslayan Plaza West (4) |
2005 | 1969 | 185,964 | 98.8 | % | Randall’s Food | Walgreens, PETCO, Jo Ann’s, Office Max, Tuesday Morning | ||||||
| Westwood Village (3) |
2006 | 2006 | 183,424 | 85.3 | % | (Target) | Gold’s Gym, PetSmart, Office Max, Ross Dress For Less, TJ Maxx | ||||||
| Woodway Collection (4) |
2005 | 1974 | 111,165 | 85.1 | % | Randall’s Food | — | ||||||
| Subtotal/Weighted Average (TX) |
4,358,457 | 89.8 | % | ||||||||||
| VIRGINIA |
|||||||||||||
| Richmond |
|||||||||||||
| Gayton Crossing (4) |
2005 | 1983 | 156,917 | 97.1 | % | Ukrop’s | — | ||||||
| Hanover Village Shopping Center (4) |
2005 | 1971 | 93,147 | 72.2 | % | — | Tractor Supply Company | ||||||
| Village Shopping Center (4) |
2005 | 1948 | 111,177 | 100.0 | % | Ukrop’s | CVS | ||||||
| Other Virginia |
|||||||||||||
| 601 King Street (4) |
2005 | 1980 | 8,349 | 73.7 | % | — | — | ||||||
| Ashburn Farm Market Center |
2000 | 2000 | 91,905 | 95.7 | % | Giant Food | — | ||||||
| Ashburn Farm Village Center (4) |
2005 | 1996 | 88,897 | 89.3 | % | Shoppers Food Warehouse | — | ||||||
| Braemar Shopping Center (4) |
2004 | 2004 | 96,439 | 94.8 | % | Safeway | — | ||||||
| Centre Ridge Marketplace (4) |
2005 | 1996 | 104,100 | 94.5 | % | Shoppers Food Warehouse | Sears | ||||||
| Cheshire Station |
2000 | 2000 | 97,156 | 100.0 | % | Safeway | PETCO | ||||||
| Culpeper Colonnade |
2006 | 2006 | 62,114 | 93.8 | % | Martin’s, (Target) | PetSmart, Staples | ||||||
| Fairfax Shopping Center |
2007 | 1955 | 78,711 | 78.2 | % | -- | Direct Furniture | ||||||
| Festival at Manchester Lakes (4) |
2005 | 1990 | 165,130 | 97.9 | % | Shoppers Food Warehouse | — | ||||||
| Fortuna Center Plaza (4) |
2004 | 2004 | 90,131 | 100.0 | % | Shoppers Food Warehouse, (Target) | Rite Aid | ||||||
| Fox Mill Shopping Center (4) |
2005 | 1977 | 103,269 | 96.1 | % | Giant Food | — | ||||||
| Greenbriar Town Center (4) |
2005 | 1972 | 340,006 | 97.6 | % | Giant Food | CVS, HMY Roomstore, Total Beverage, Ross Dress for Less, Marshalls, PETCO | ||||||
| Hollymead Town Center (4) |
2003 | 2004 | 153,739 | 97.0 | % | Harris Teeter, (Target) | Petsmart | ||||||
| Kamp Washington Shopping Center (4) |
2005 | 1960 | 71,825 | 95.8 | % | — | Borders Books | ||||||
| Kings Park Shopping Center (4) |
2005 | 1966 | 74,702 | 95.6 | % | Giant Food | CVS | ||||||
| Lorton Station Marketplace (4) |
2006 | 2005 | 132,445 | 97.3 | % | Shoppers Food Warehouse | Advanced Design Group | ||||||
| Lorton Town Center (4) |
2006 | 2005 | 51,807 | 88.5 | % | — | ReMax | ||||||
| Market at Opitz Crossing |
2003 | 2003 | 149,791 | 91.4 | % | Safeway | Boat U.S. | ||||||
| Saratoga Shopping Center (4) |
2005 | 1977 | 113,013 | 97.8 | % | Giant Food | — | ||||||
| Shops at County Center |
2005 | 2005 | 96,695 | 96.9 | % | Harris Teeter | — | ||||||
| Signal Hill (4) |
2003 | 2004 | 95,172 | 97.5 | % | Shoppers Food Warehouse | — | ||||||
| Stonewall (3) |
2007 | 2007 | 287,744 | 93.8 | % | Wegmans | Staples, Ross Dress For Less, Bed Bath & Beyond, Michaels | ||||||
21
Table of Contents
| Property Name |
Year Acquired |
Year Constructed (1) |
Gross Leasable Area (GLA) |
Percent Leased (2) |
Grocer &
Major |
Drug Store & Other Anchors > | |||||||
| VIRGINIA (continued) |
|||||||||||||
| Town Center at Sterling Shopping Center (4) |
2005 | 1980 | 190,069 | 92.4 | % | Giant Food | Washington Sports Club, Party Depot | ||||||
| Village Center at Dulles (4) |
2002 | 1991 | 298,271 | 97.7 | % | Shoppers Food Warehouse, Gold’s Gym | CVS, Advance Auto Parts, Chuck E. Cheese, PETCO, Staples, The Thrift Store | ||||||
| Willston Centre I (4) |
2005 | 1952 | 105,376 | 92.3 | % | — | CVS, Baileys Health Care | ||||||
| Willston Centre II (4) |
2005 | 1986 | 127,449 | 96.0 | % | Safeway, (Target) | — | ||||||
| Subtotal/Weighted Average (VA) |
3,635,546 | 94.9 | % | ||||||||||
| ILLINOIS |
|||||||||||||
| Chicago |
|||||||||||||
| Baker Hill Center (4) |
2004 | 1998 | 135,355 | 94.6 | % | Dominick’s | — | ||||||
| Brentwood Commons (4) |
2005 | 1962 | 125,585 | 91.8 | % | Dominick’s | Dollar Tree | ||||||
| Civic Center Plaza (4) |
2005 | 1989 | 264,973 | 98.0 | % | Super H Mart, Home Depot | Murray’s Discount Auto, King Spa | ||||||
| Deer Grove Center (4) |
2004 | 1996 | 236,173 | 73.4 | % | Dominick’s, (Target) | Michaels, PETCO, Factory Card Outlet, Dress Barn, Staples | ||||||
| Frankfort Crossing Shpg Ctr |
2003 | 1992 | 114,534 | 91.8 | % | Jewel / OSCO | Ace Hardware | ||||||
| Geneva Crossing (4) |
2004 | 1997 | 123,182 | 98.8 | % | Dominick’s | Goodwill | ||||||
| Hinsdale |
1998 | 1986 | 178,960 | 81.0 | % | Dominick’s | Ace Hardware | ||||||
| McHenry Commons Shopping Center (4) |
2005 | 1988 | 100,526 | 16.6 | % | — | — | ||||||
| Oaks Shopping Center (4) |
2005 | 1983 | 135,005 | 87.3 | % | Dominick’s | — | ||||||
| Riverside Sq & River’s Edge (4) |
2005 | 1986 | 169,435 | 98.6 | % | Dominick’s | Ace Hardware, Party City | ||||||
| Riverview Plaza (4) |
2005 | 1981 | 139,256 | 97.7 | % | Dominick’s | Walgreens, Toys “R” Us | ||||||
| Shorewood Crossing (4) |
2004 | 2001 | 87,705 | 96.5 | % | Dominick’s | — | ||||||
| Shorewood Crossing II (4) |
2007 | 2005 | 86,276 | 98.1 | % | — | Babies R Us, Staples, PETCO, Factory Card Outlet | ||||||
| Stearns Crossing (4) |
2004 | 1999 | 96,613 | 92.6 | % | Dominick’s | — | ||||||
| Stonebrook Plaza Shopping Center (4) |
2005 | 1984 | 95,825 | 100.0 | % | Dominick’s | — | ||||||
| Westbrook Commons |
2001 | 1984 | 120,674 | 85.2 | % | Dominick’s | — | ||||||
| Champaign/Urbana |
|||||||||||||
| Champaign Commons (4) |
2007 | 1990 | 88,105 | 90.7 | % | Schnucks | — | ||||||
| Urbana Crossing (4) |
2007 | 1997 | 85,196 | 96.7 | % | Schnucks | — | ||||||
| Springfield |
|||||||||||||
| Montvale Commons (4) |
2007 | 1996 | 73,937 | 98.1 | % | Schnucks | — | ||||||
| Other Illinois |
|||||||||||||
| Carbondale Center (4) |
2007 | 1997 | 59,726 | 100.0 | % | Schnucks | — | ||||||
| Country Club Plaza (4) |
2007 | 2001 | 86,867 | 98.4 | % | Schnucks | — | ||||||
| Granite City (4) |
2007 | 2004 | 46,237 | 100.0 | % | Schnucks | — | ||||||
| Swansea Plaza (4) |
2007 | 1988 | 118,892 | 97.1 | % | Schnucks | Fashion Bug | ||||||
| Subtotal/Weighted Average (IL) |
2,769,037 | 89.7 | % | ||||||||||
| MISSOURI |
|||||||||||||
| St. Louis |
|||||||||||||
| Affton Plaza (4) |
2007 | 2000 | 67,760 | 100.0 | % | Schnucks | — | ||||||
| Bellerive Plaza (4) |
2007 | 2000 | 115,252 | 93.3 | % | Schnucks | — | ||||||
| Brentwood Plaza (4) |
2007 | 2002 | 60,452 | 96.5 | % | Schnucks | — | ||||||
| Bridgeton (4) |
2007 | 2005 | 70,762 | 100.0 | % | Schnucks, (Home Depot) | — | ||||||
| Butler Hill Centre (4) |
2007 | 1987 | 90,889 | 98.5 | % | Schnucks | — | ||||||
| City Plaza (4) |
2007 | 1998 | 80,149 | 94.9 | % | Schnucks | — | ||||||
| Crestwood Commons (4) |
2007 | 1994 | 67,285 | 100.0 | % | Schnucks, (Best Buy), (Gordman’s) | — | ||||||
| Dardenne Crossing (4) |
2007 | 1996 | 67,430 | 100.0 | % | Schnucks | — | ||||||
| Dorsett Village (4) |
2007 | 1998 | 104,217 | 100.0 | % | Schnucks, (Orlando Gardens Banquet Center) | SSM Care Management Company | ||||||
| Kirkwood Commons (4) |
2007 | 2000 | 467,703 | 100.0 | % | Wal-Mart, (Target), (Lowe’s) | TJ Maxx, HomeGoods, Famous Footwear | ||||||
| Lake St. Louis (4) |
2007 | 2004 | 75,643 | 98.1 | % | Schnucks | — | ||||||
| O’Fallon Centre (4) |
2007 | 1984 | 71,300 | 87.5 | % | Schnucks | — | ||||||
22
Table of Contents
| Property Name |
Year Acquired |
Year Constructed (1) |
Gross Leasable Area (GLA) |
Percent Leased (2) |
Grocer & Major Tenant(s) >40,000sf |
Drug Store & Other Anchors > 10,000 Sq Ft | |||||||
| MISSOURI (continued) |
|||||||||||||
| Plaza 94 (4) |
2007 | 2005 | 66,555 | 95.4 | % | Schnucks | — | ||||||
| Richardson Crossing (4) |
2007 | 2000 | 82,994 | 97.1 | % | Schnucks | — | ||||||
| Shackelford Center (4) |
2007 | 2006 | 49,635 | 97.4 | % | Schnucks | — | ||||||
| Sierra Vista Plaza (4) |
2007 | 1993 | 74,666 | 98.4 | % | Schnucks | — | ||||||
| Twin Oaks (4) |
2007 | 2006 | 71,682 | 98.3 | % | Schnucks | (Walgreens) | ||||||
| University City Square (4) |
2007 | 1997 | 79,230 | 100.0 | % | Schnucks | — | ||||||
| Washington Crossing (4) |
2007 | 1999 | 117,626 | 95.1 | % | Schnucks | Michaels, Altmueller Jewelry | ||||||
| Wentzville Commons (4) |
2007 | 2000 | 74,205 | 98.1 | % | Schnucks, (Home Depot) | — | ||||||
| Wildwood Crossing (4) |
2007 | 1997 | 108,200 | 79.5 | % | Schnucks | — | ||||||
| Zumbehl Commons (4) |
2007 | 1990 | 116,682 | 94.2 | % | Schnucks | Ace Hardware | ||||||
| Other Missouri |
|||||||||||||
| Capital Crossing (4) |
2007 | 2002 | 85,149 | 98.6 | % | Schnucks | — | ||||||
| Subtotal/Weighted Average (MO) |
2,265,466 | 96.8 | % | ||||||||||
| OHIO |
|||||||||||||
| Cincinnati |
|||||||||||||
| Beckett Commons |
1998 | 1995 | 121,498 | 100.0 | % | Kroger | Stein Mart | ||||||
| Cherry Grove |
1998 | 1997 | 195,513 | 95.5 | % | Kroger | Hancock Fabrics, Shoe Carnival, TJ Maxx | ||||||
| Hyde Park |
1997 | 1995 | 396,861 | 96.5 | % | Kroger, Biggs | Walgreens, Jo-Ann Fabrics, Ace Hardware, Michaels, Staples | ||||||
| Indian Springs Market Center (4) |
2005 | 2005 | 146,116 | 100.0 | % | Kohl’s, (Wal-Mart Supercenter) | Office Depot, HH Gregg Appliances | ||||||
| Red Bank Village (3) |
2006 | 2006 | 174,315 | 91.0 | % | Wal-Mart | — | ||||||
| Regency Commons |
2004 | 2004 | 30,770 | 80.5 | % | — | — | ||||||
| Shoppes at Mason |
1998 | 1997 | 80,800 | 96.5 | % | Kroger | — | ||||||
| Sycamore Crossing & Sycamore Plaza (4) |
2008 | 1966 | 390,957 | 88.4 | % | Fresh Market, Macy’s Furniture Gallery, Toys ‘R Us, Dick’s Sporting Goods | Barnes & Noble, Old Navy, Staples, Identity Salon & Day Spa | ||||||
| Westchester Plaza |
1998 | 1988 | 88,181 | 98.4 | % | Kroger | — | ||||||
| Columbus |
|||||||||||||
| East Pointe |
1998 | 1993 | 86,503 | 100.0 | % | Kroger | — | ||||||
| Kroger New Albany Center |
1999 | 1999 | 93,285 | 96.6 | % | Kroger | — | ||||||
| Maxtown Road (Northgate) |
1998 | 1996 | 85,100 | 98.4 | % | Kroger, (Home Depot) | — | ||||||
| Park Place Shopping Center |
1998 | 1988 | 106,832 | 61.2 | % | — | Big Lots | ||||||
| Windmiller Plaza Phase I |
1998 | 1997 | 140,437 | 98.5 | % | Kroger | Sears Hardware | ||||||
| Wadsworth Crossing (3) |
2005 | 2005 | 108,173 | 88.7 | % | (Kohl’s), (Lowe’s), (Target) | Office Max, Bed, Bath & Beyond, MC Sports, PETCO | ||||||
| Subtotal/Weighted Average (OH) |
2,245,341 | 93.1 | % | ||||||||||
| NORTH CAROLINA |
|||||||||||||
| Charlotte |
|||||||||||||
| Carmel Commons |
1997 | 1979 | 132,651 | 99.1 | % | Fresh Market | Chuck E. Cheese, Party City, Eckerd, Casual Furniture Marketplace | ||||||
| Cochran Commons (4) |
2007 | 2003 | 66,020 | 91.6 | % | Harris Teeter | (Walgreens) | ||||||
| Greensboro |
|||||||||||||
| Harris Crossing (3) |
2007 | 2007 | 65,367 | 83.9 | % | Harris Teeter | — | ||||||
| Raleigh / Durham |
|||||||||||||
| Cameron Village (4) |
2004 | 1949 | 635,918 | 84.5 | % | Harris Teeter, Fresh Market | Eckerd, Talbots, Wake County Public Library, Great Outdoor Provision Co., York Properties, The Bargain Box, K&W Cafeteria, Johnson-Lambe Sporting Goods, Pier 1 Imports, Pirate’s Chest Fine Antiques | ||||||
| Colonnade Center (3) |
2009 | 2009 | 57,000 | 70.2 | % | Whole Foods | — | ||||||
| Fuquay Crossing (4) |
2004 | 2002 | 124,774 | 97.1 | % | Kroger | Peak’s Fitness, Dollar Tree | ||||||
| Garner Towne Square |
1998 | 1998 | 221,776 | 95.8 | % | Kroger, (Home Depot), (Target) | Office Max, Petsmart, Shoe Carnival, United Artist Theater | ||||||
| Glenwood Village |
1997 | 1983 | 42,864 | 100.0 | % | Harris Teeter | — | ||||||
23
Table of Contents
| Property Name |
Year Acquired |
Year Constructed (1) |
Gross Leasable Area (GLA) |
Percent Leased (2) |
Grocer & Major Tenant(s) >40,000sf |
Drug Store & Other Anchors > 10,000 | |||||||
| NORTH CAROLINA (continued) |
|||||||||||||
| Lake Pine Plaza |
1998 | 1997 | 87,690 | 88.0 | % | Kroger | — | ||||||
| Maynard Crossing (4) |
1998 | 1997 | 122,782 | 95.3 | % | Kroger | — | ||||||
| Middle Creek Commons (3) |
2006 | 2006 | 73,634 | 81.3 | % | Lowes Foods | — | ||||||
| Shoppes of Kildaire (4) |
2005 | 1986 | 148,204 | 92.4 | % | Trader Joe’s | Home Comfort Furniture, Gold’s Gym, Staples | ||||||
| Southpoint Crossing |
1998 | 1998 | 103,128 | 97.8 | % | Kroger | — | ||||||
| Sutton Square (4) |
2006 | 1985 | 101,846 | 79.0 | % | Fresh Market | Rite Aid | ||||||
| Woodcroft Shopping Center |
1996 | 1984 | 89,833 | 97.0 | % | Food Lion | Triangle True Value Hardware | ||||||
| Subtotal/Weighted Average (NC) |
2,073,487 | 89.7 | % | ||||||||||
| COLORADO |
|||||||||||||
| Colorado Springs |
|||||||||||||
| Falcon Marketplace (3) |
2005 | 2005 | 22,491 | 65.8 | % | (Wal-Mart Supercenter) | — | ||||||
| Marketplace at Briargate |
2006 | 2006 | 29,075 | 90.0 | % | (King Soopers) | — | ||||||
| Monument Jackson Creek |
1998 | 1999 | 85,263 | 100.0 | % | King Soopers | — | ||||||
| Woodmen Plaza |
1998 | 1998 | 116,233 | 86.3 | % | King Soopers | — | ||||||
| Denver |
|||||||||||||
| Applewood Shopping Center (4) |
2005 | 1956 | 375,622 | 93.5 | % | King Soopers, Wal-Mart | Applejack Liquors, PetSmart, Wells Fargo Bank | ||||||
| Arapahoe Village (4) |
2005 | 1957 | 159,237 | 94.2 | % | Safeway | Jo-Ann Fabrics, PETCO, Pier 1 Imports, Bottles Wine & Spirit | ||||||
| Belleview Square |
2004 | 1978 | 117,335 | 100.0 | % | King Soopers | — | ||||||
| Boulevard Center |
1999 | 1986 | 88,512 | 76.7 | % | (Safeway) | One Hour Optical | ||||||
| Buckley Square |
1999 | 1978 | 116,147 | 91.4 | % | King Soopers | Ace Hardware | ||||||
| Centerplace of Greeley Phase III (3) |
2007 | 2007 | 94,090 | 76.6 | % | Sports Authority | Best Buy | ||||||
| Cherrywood Square (4) |
2005 | 1978 | 86,162 | 93.6 | % | King Soopers | — | ||||||
| Crossroads Commons (4) |
2001 | 1986 | 143,444 | 96.8 | % | Whole Foods | Barnes & Noble, Bicycle Village | ||||||
| Hilltop Village (4) |
2002 | 2003 | 100,030 | 93.7 | % | King Soopers | — | ||||||
| NorthGate Village (3) |
2008 | 2008 | 25,375 | 0.0 | % | (King Soopers) | — | ||||||
| South Lowry Square |
1999 | 1993 | 119,916 | 87.7 | % | Safeway | — | ||||||
| Littleton Square |
1999 | 1997 | 94,222 | 91.2 | % | King Soopers | Walgreens | ||||||
| Lloyd King Center |
1998 | 1998 | 83,326 | 100.0 | % | King Soopers | — | ||||||
| Ralston Square Shopping Center (4) |
2005 | 1977 | 82,750 | 96.1 | % | King Soopers | — | ||||||
| Shops at Quail Creek (3) |
2008 | 2008 | 37,585 | 61.5 | % | (King Soopers) | — | ||||||
| Stroh Ranch |
1998 | 1998 | 93,436 | 97.0 | % | King Soopers | — | ||||||
| Subtotal/Weighted Average (CO) |
2,070,251 | 90.4 | % | ||||||||||
| MARYLAND |
|||||||||||||
| Baltimore |
|||||||||||||
| Elkridge Corners (4) |
2005 | 1990 | 73,529 | 100.0 | % | Super Fresh | Rite Aid | ||||||
| Festival at Woodholme (4) |
2005 | 1986 | 81,028 | 88.1 | % | Trader Joe’s | — | ||||||
| Lee Airport (3) |
2005 | 2005 | 107,063 | 75.4 | % | Giant Food, (Sunrise) | — | ||||||
| Parkville Shopping Center (4) |
2005 | 1961 | 162,435 | 96.7 | % | Super Fresh | Rite Aid, Parkville Lanes, Castlewood Realty | ||||||
| Southside Marketplace (4) |
2005 | 1990 | 125,146 | 95.6 | % | Shoppers Food Warehouse | Rite Aid | ||||||
| Valley Centre (4) |
2005 | 1987 | 247,837 | 95.8 | % | — | TJ Maxx, Sony Theatres, Ross Dress for Less, HomeGoods, Staples, PetSmart | ||||||
| Other Maryland |
|||||||||||||
| Bowie Plaza (4) |
2005 | 1966 | 104,037 | 80.8 | % | Giant Food | CVS | ||||||
| Clinton Park (4) |
2003 | 2003 | 206,050 | 95.3 | % | Giant Food, Sears, (Toys “R” Us) | Fitness For Less | ||||||
| Cloppers Mill Village (4) |
2005 | 1995 | 137,035 | 95.5 | % | Shoppers Food Warehouse | CVS | ||||||
| Firstfield Shopping Center (4) |
2005 | 1978 | 22,328 | 93.3 | % | — | — | ||||||
| Goshen Plaza (4) |
2005 | 1987 | 45,654 | 84.6 | % | — | CVS | ||||||
| King Farm Village Center (4) |
2004 | 2001 | 118,326 | 96.4 | % | Safeway | — | ||||||
| Mitchellville Plaza (4) |
2005 | 1991 | 156,125 | 90.1 | % | Food Lion | — | ||||||
| Takoma Park (4) |
2005 | 1960 | 106,469 | 99.5 | % | Shoppers Food Warehouse | — | ||||||
| Watkins Park Plaza (4) |
2005 | 1985 | 113,443 | 94.9 | % | Safeway | CVS | ||||||
| Woodmoor Shopping Center (4) |
2005 | 1954 | 67,403 | 88.5 | % | — | CVS | ||||||
| Subtotal/Weighted Average (MD) |
1,873,908 | 92.8 | % | ||||||||||
24
Table of Contents
| Property Name |
Year Acquired |
Year Constructed (1) |
Gross Leasable Area (GLA) |
Percent Leased (2) |
Grocer & Major Tenant(s) >40,000sf |
Drug Store & Other Anchors > 10,000 Sq Ft | |||||||
| GEORGIA |
|||||||||||||
| Atlanta |
|||||||||||||
| Ashford Place |
1997 | 1993 | 53,449 | 78.3 | % | — | — | ||||||
| Briarcliff La Vista |
1997 | 1962 | 39,204 | 100.0 | % | — | Michaels | ||||||
| Briarcliff Village |
1997 | 1990 | 187,156 | 88.3 | % | Publix | Office Depot, Party City, PETCO, TJ Maxx | ||||||
| Buckhead Court |
1997 | 1984 | 48,338 | 97.7 | % | — | — | ||||||
| Cambridge Square |
1996 | 1979 | 71,474 | 99.9 | % | Kroger | — | ||||||
| Chapel Hill Centre |
2005 | 2005 | 66,970 | 96.4 | % | (Kohl’s), Hobby Lobby | — | ||||||
| Cromwell Square |
1997 | 1990 | 70,282 | 91.5 | % | — | CVS, Hancock Fabrics, Antiques & Interiors of Sandy Springs | ||||||
| Delk Spectrum |
1998 | 1991 | 100,539 | 84.3 | % | Publix | Eckerd | ||||||
| Dunwoody Hall (4) |
1997 | 1986 | 89,351 | 100.0 | % | Publix | Eckerd | ||||||
| Dunwoody Village |
1997 | 1975 | 120,598 | 89.8 | % | Fresh Market | Walgreens, Dunwoody Prep | ||||||
| Howell Mill Village |
2004 | 1984 | 97,990 | 87.7 | % | Publix | Eckerd | ||||||
| King Plaza (4) |
2007 | 1998 | 81,432 | 94.3 | % | Publix | — | ||||||
| Loehmanns Plaza Georgia |
1997 | 1986 | 137,139 | 96.5 | % | — | Loehmann’s, Dance 101, Office Max | ||||||
| Lost Mountain Crossing (4) |
2007 | 1994 | 72,568 | 91.5 | % | Publix | — | ||||||
| Paces Ferry Plaza |
1997 | 1987 | 61,697 | 100.0 | % | — | Harry Norman Realtors | ||||||
| Powers Ferry Square |
1997 | 1987 | 95,703 | 93.4 | % | — | CVS, Pearl Arts & Crafts | ||||||
| Powers Ferry Village |
1997 | 1994 | 78,896 | 100.0 | % | Publix | CVS, Mardi Gras | ||||||
| Rivermont Station |
1997 | 1996 | 90,267 | 78.0 | % | Kroger | — | ||||||
| Russell Ridge |
1994 | 1995 | 98,559 | 91.8 | % | Kroger | — | ||||||
| Subtotal/Weighted Average (GA) |
1,661,612 | 92.0 | % | ||||||||||
| PENNSYLVANIA |
|||||||||||||
| Allentown / Bethlehem |
|||||||||||||
| Allen Street Shopping Center (4) |
2005 | 1958 | 46,228 | 96.7 | % | Ahart Market | Rite Aid | ||||||
| Lower Nazareth Commons (3) |
2007 | 2007 | 80,122 | 75.5 | % | (Target), Sports Authority | — | ||||||
| Stefko Boulevard Shopping Center (4) |
2005 | 1976 | 133,824 | 90.2 | % | Valley Farm Market | — | ||||||
| Harrisburg |
|||||||||||||
| Silver Spring Square (4) |
2005 | 2005 | 314,449 | 95.9 | % | Wegmans, (Target) | Ross Dress For Less, Bed Bath and Beyond, Best Buy, Office Max, Ulta, PETCO | ||||||
| Philadelphia |
|||||||||||||
| City Avenue Shopping Center (4) |
2005 | 1960 | 159,094 | 95.6 | % | — | Ross Dress for Less, TJ Maxx, Sears | ||||||
| Gateway Shopping Center |
2004 | 1960 | 219,337 | 92.4 | % | Trader Joe’s | Staples, TJ Maxx, Famous Footwear, Jo-Ann Fabrics | ||||||
| Kulpsville Village Center |
2006 | 2006 | 14,820 | 100.0 | % | — | Walgreens | ||||||
| Mayfair Shopping Center (4) |
2005 | 1988 | 112,276 | 89.7 | % | Shop ‘N Bag | Dollar Tree | ||||||
| Mercer Square Shopping Center (4) |
2005 | 1988 | 91,400 | 92.1 | % | Genuardi’s | — | ||||||
| Newtown Square Shopping Center (4) |
2005 | 1970 | 146,893 | 88.8 | % | Acme Markets | Rite Aid | ||||||
| Warwick Square Shopping Center (4) |
2005 | 1999 | 89,680 | 98.0 | % | Genuardi’s | — | ||||||
| Other Pennsylvania |
|||||||||||||
| Hershey |
2000 | 2000 | 6,000 | 100.0 | % | — | — | ||||||
| Subtotal/Weighted Average (PA) |
1,414,123 | 92.4 | % | ||||||||||
| WASHINGTON |
|||||||||||||
| Portland |
|||||||||||||
| Orchards Market Center I (4) |
2002 | 2004 | 100,663 | 100.0 | % | Wholesale Sports | Jo-Ann Fabrics, PETCO, (Rite Aid) | ||||||
| Orchards Market Center II |
2005 | 2005 | 77,478 | 89.9 | % | LA Fitness | Office Depot | ||||||
| Seattle |
|||||||||||||
| Aurora Marketplace (4) |
2005 | 1991 | 106,921 | 97.2 | % | Safeway | TJ Maxx | ||||||
| Cascade Plaza (4) |
1999 | 1999 | 211,072 | 94.2 | % | Safeway | Bally Total Fitness, Fashion Bug, Jo-Ann Fabrics, Ross Dress For Less, Big Lots | ||||||
| Eastgate Plaza (4) |
2005 | 1956 | 78,230 | 100.0 | % | Albertsons | Rite Aid | ||||||
| Inglewood Plaza |
1999 | 1985 | 17,253 | 100.0 | % | — | — | ||||||
| Overlake Fashion Plaza (4) |
2005 | 1987 | 80,555 | 96.9 | % | (Sears) | Marshalls | ||||||
| Pine Lake Village |
1999 | 1989 | 102,899 | 100.0 | % | Quality Foods | Rite Aid | ||||||
| Sammamish-Highlands |
1999 | 1992 | 101,289 | 95.1 | % | (Safeway) | Bartell Drugs, Ace Hardware | ||||||
25
Table of Contents
| Property Name |
Year Acquired |
Year Constructed (1) |
Gross Leasable Area (GLA) |
Percent Leased (2) |
Grocer & Major Tenant(s) >40,000sf |
Drug Store & Other Anchors > 10,000 Sq Ft | |||||||
| WASHINGTON (continued) |
|||||||||||||
| Southcenter |
1999 | 1990 | 58,282 | 77.2 | % | (Target) | — | ||||||
| Thomas Lake |
1999 | 1998 | 103,872 | 96.4 | % | Albertsons | Rite Aid | ||||||
| Subtotal/Weighted Average (WA) |
1,038,514 | 95.4 | % | ||||||||||
| OREGON |
|||||||||||||
| Portland |
|||||||||||||
| Greenway Town Center (4) |
2005 | 1979 | 93,101 | 98.1 | % | Lamb’s Thriftway | Rite Aid, Dollar Tree | ||||||
| Murrayhill Marketplace |
1999 | 1988 | 148,967 | 97.6 | % | Safeway | Segal’s Baby News | ||||||
| Sherwood Crossroads |
1999 | 1999 | 87,966 | 98.4 | % | Safeway | — | ||||||
| Sherwood Market Center |
1999 | 1995 | 124,259 | 98.6 | % | Albertsons | — | ||||||
| Sunnyside 205 |
1999 | 1988 | 52,710 | 88.3 | % | — | — | ||||||
| Tanasbourne Market |
2006 | 2006 | 71,000 | 100.0 | % | Whole Foods | — | ||||||
| Walker Center |
1999 | 1987 | 89,610 | 100.0 | % | Sports Authority | — | ||||||
| Other Oregon |
|||||||||||||
| Corvallis Market Center |
2006 | 2006 | 84,549 | 100.0 | % | Trader Joe’s | TJ Maxx, Michael’s | ||||||
| Subtotal/Weighted Average (OR) |
752,162 | 98.1 | % | ||||||||||
| TENNESSEE |
|||||||||||||
| Memphis |
|||||||||||||
| Collierville Crossing (4) |
2007 | 2004 | 86,065 | 94.8 | % | Schnucks, (Target) | — | ||||||
| Nashville |
|||||||||||||
| Lebanon Center (3) |
2006 | 2006 | 63,800 | 86.8 | % | Publix | — | ||||||
| Harpeth Village Fieldstone |
1997 | 1998 | 70,091 | 100.0 | % | Publix | — | ||||||
| Nashboro Village |
1998 | 1998 | 86,811 | 95.2 | % | Kroger | (Walgreens) | ||||||
| Northlake Village |
2000 | 1988 | 137,807 | 80.6 | % | Kroger | PETCO | ||||||
| Peartree Village |
1997 | 1997 | 109,904 | 97.9 | % | Harris Teeter | Eckerd, Office Max | ||||||
| Other Tennessee |
|||||||||||||
| Dickson Tn |
1998 | 1998 | 10,908 | 100.0 | % | — | Eckerd | ||||||
| Subtotal/Weighted Average (TN) |
565,386 | 91.8 | % | ||||||||||
| MASSACHUSETTS |
|||||||||||||
| Boston |
|||||||||||||
| Shops at Saugus (3) |
2006 | 2006 | 97,404 | 91.3 | % | Trader Joe’s | La-Z-Boy, PetSmart | ||||||
| Speedway Plaza (4) |
2006 | 1988 | 185,279 | 100.0 | % | Stop & Shop, BJ’s Warehouse | — | ||||||
| Twin City Plaza |
2006 | 2004 | 281,703 | 93.4 | % | Shaw’s, Marshall’s | Rite Aid, K&G Fashion, Dollar Tree, Gold’s Gym, Extra Space Storage | ||||||
| Subtotal/Weighted Average (MA) |
564,386 | 95.2 | % | ||||||||||
| ARIZONA |
|||||||||||||
| Phoenix |
|||||||||||||
| Anthem Marketplace |
2003 | 2000 | 113,292 | 91.8 | % | Safeway | — | ||||||
| Palm Valley Marketplace (4) |
2001 | 1999 | 107,633 | 85.8 | % | Safeway | — | ||||||
| Pima Crossing |
1999 | 1996 | 239,438 | 90.1 | % | Golf & Tennis Pro Shop, Inc. | Life Time Fitness, E & J Designer Shoe Outlet, Paddock Pools Store, Pier 1 Imports, Stein Mart | ||||||
| Shops at Arizona |
2003 | 2000 | 35,710 | 87.7 | % | — | Ace Hardware | ||||||
| Subtotal/Weighted Average (AZ) |
496,073 | 89.4 | % | ||||||||||
| MINNESOTA |
|||||||||||||
| Apple Valley Square (4) |
2006 | 1998 | 184,841 | 98.8 | % | Rainbow Foods, Jo-Ann Fabrics, (Burlington Coat Factory) | Savers, PETCO | ||||||
| Colonial Square (4) |
2005 | 1959 | 93,200 | 98.3 | % | Lund’s | — | ||||||
| Rockford Road Plaza (4) |
2005 | 1991 | 205,897 | 95.5 | % | Rainbow Foods | PetSmart, Homegoods, TJ Maxx | ||||||
| Subtotal/Weighted Average (MN) |
483,938 | 97.3 | % | ||||||||||
26
Table of Contents
| Property Name |
Year Acquired |
Year Constructed (1) |
Gross Leasable Area (GLA) |
Percent Leased (2) |
Grocer & Major Tenant(s) >40,000sf |
Drug Store & Other Anchors > 10,000 Sq Ft | |||||||
| DELAWARE |
|||||||||||||
| Dover |
|||||||||||||
| White Oak—Dover, DE |
2000 | 2000 | 10,908 | 100.0 | % | — | Eckerd | ||||||
| Wilmington |
|||||||||||||
| First State Plaza (4) |
2005 | 1988 | 164,779 | 86.8 | % | Shop Rite | Cinemark, Dollar Tree, US Post Office | ||||||
| Pike Creek |
1998 | 1981 | 229,510 | 93.0 | % | Acme Markets, K-Mart | Rite Aid | ||||||
| Shoppes of Graylyn (4) |
2005 | 1971 | 66,808 | 92.9 | % | — | Rite Aid | ||||||
| Subtotal/Weighted Average (DE) |
472,005 | 91.0 | % | ||||||||||
| NEVADA |
|||||||||||||
| Anthem Highlands Shopping Center |
2004 | 2004 | 93,516 | 79.2 | % | Albertsons | CVS | ||||||
| Deer Springs Town Center (3) |
2007 | 2007 | 339,474 | 77.6 | % | (Target), Home Depot, Toys “R” Us | Party Superstores, PetSmart, Ross Dress For Less, Staples | ||||||
| Subtotal/Weighted Average (NV) |
432,990 | 78.0 | % | ||||||||||
| SOUTH CAROLINA |
|||||||||||||
| Charleston |
|||||||||||||
| Merchants Village (4) |
1997 | 1997 | 79,724 | 97.0 | % | Publix | — | ||||||
| Orangeburg |
2006 | 2006 | 14,820 | 100.0 | % | — | Walgreens | ||||||
| Queensborough Shopping Center (4) |
1998 | 1993 | 82,333 | 95.9 | % | Publix | — | ||||||
| Columbia |
|||||||||||||
| Murray Landing (4) |
2002 | 2003 | 64,359 | 97.8 | % | Publix | — | ||||||
| Greenville |
|||||||||||||
| Other South Carolina |
|||||||||||||
| Buckwalter Village (3) |
2006 | 2006 | 59,601 | 88.3 | % | Publix | — | ||||||
| Surfside Beach Commons (4) |
2007 | 1999 | 59,881 | 94.7 | % | Bi-Lo | — | ||||||
| Subtotal/Weighted Average (SC) |
360,718 | 95.2 | % | ||||||||||
| INDIANA |
|||||||||||||
| Chicago |
|||||||||||||
| Airport Crossing (3) |
2006 | 2006 | 11,924 | 66.4 | % | (Kohl’s) | — | ||||||
| Augusta Center |
2006 | 2006 | 14,532 | 55.5 | % | (Menards) | — | ||||||
| Evansville |
|||||||||||||
| Evansville West Center (4) |
2007 | 1989 | 79,885 | 91.9 | % | Schnucks | — | ||||||
| Indianapolis |
|||||||||||||
| Greenwood Springs |
2004 | 2004 | 28,028 | 29.9 | % | (Gander Mountain), (Wal-Mart Supercenter) | — | ||||||
| Willow Lake Shopping Center (4) |
2005 | 1987 | 85,923 | 79.8 | % | (Kroger) | Factory Card Outlet | ||||||
| Willow Lake West Shopping Center (4) |
2005 | 2001 | 52,961 | 100.0 | % | Trader Joe’s | — | ||||||
| Subtotal/Weighted Average (IN) |
273,253 | 80.3 | % | ||||||||||
| WISCONSIN |
|||||||||||||
| Racine Centre Shopping Center (4) |
2005 | 1988 | 135,827 | 98.2 | % | Piggly Wiggly | Office Depot, Factory Card Outlet, Dollar Tree | ||||||
| Whitnall Square Shopping Center (4) |
2005 | 1989 | 133,301 | 97.2 | % | Pick ‘N’ Save | Harbor Freight Tools, Dollar Tree, Walgreens | ||||||
| Subtotal/Weighted Average (WI) |
269,128 | 97.7 | % | ||||||||||
| ALABAMA |
|||||||||||||
| Shoppes at Fairhope Village (3) |
2008 | 2008 | 84,740 | 76.2 | % | Publix | — | ||||||
| Valleydale Village Shop Center (4) |
2002 | 2003 | 118,466 | 69.1 | % | Publix | — | ||||||
| Subtotal/Weighted Average (AL) |
203,206 | 72.0 | % | ||||||||||
27
Table of Contents
| Property Name |
Year Acquired |
Year Constructed (1) |
Gross Leasable Area (GLA) |
Percent Leased (2) |
Grocer & Major Tenant(s) >40,000sf |
Drug Store & Other Anchors > 10,000 Sq Ft | |||||||
| CONNECTICUT |
|||||||||||||
| Corbin’s Corner (4) |
2005 | 1962 | 179,860 | 100.0 | % | Trader Joe’s | Toys “R” Us, Best Buy, Old Navy, Office Depot, Pier 1 Imports | ||||||
| Subtotal/Weighted Average (CT) |
179,860 | 100.0 | % | ||||||||||
| NEW JERSEY |
|||||||||||||
| Haddon Commons (4) |
2005 | 1985 | 52,640 | 93.4 | % | Acme Markets | CVS | ||||||
| Plaza Square (4) |
2005 | 1990 | 103,842 | 96.1 | % | Shop Rite | — | ||||||
| Subtotal/Weighted Average (NJ) |
156,482 | 95.2 | % | ||||||||||
| MICHIGAN |
|||||||||||||
| Fenton Marketplace |
1999 | 1999 | 97,224 | 91.4 | % | Farmer Jack | Michaels | ||||||
| State Street Crossing (3) |
2006 | 2006 | 21,049 | 60.0 | % | (Wal-Mart) | — | ||||||
| Subtotal/Weighted Average (MI) |
118,273 | 85.8 | % | ||||||||||
| DISTRICT OF COLUMBIA |
|||||||||||||
| Shops at The Columbia (4) |
2006 | 2006 | 22,812 | 100.0 | % | Trader Joe’s | — | ||||||
| Spring Valley Shopping Center (4) |
2005 | 1930 | 16,835 | 100.0 | % | — | CVS | ||||||
| Subtotal/Weighted Average (DC) |
39,647 | 100.0 | % | ||||||||||
| KENTUCKY |
|||||||||||||
| Walton Towne Center (3) |
2007 | 2007 | 23,184 | 63.7 | % | (Kroger) | — | ||||||
| Subtotal/Weighted Average (KY) |
23,184 | 63.7 | % | ||||||||||
| Total/Weighted Average |
44,971,962 | 92.1 | % | ||||||||||
| (1) | Or latest renovation. |
| (2) | Includes development properties. If development properties are excluded, the total percentage leased would be 93.1% for Regency shopping centers. |
| (3) | Property under development or redevelopment. |
| (4) | Owned by a co-investment partnership with outside investors in which the Operating Partnership or an affiliate is the general partner. |
Note: Shadow anchor is indicated by parentheses.
28
Table of Contents
| Item 3. | Legal Proceedings |
We are a party to various legal proceedings which arise in the ordinary course of our business. We are not currently involved in any litigation nor to our knowledge, is any litigation threatened against us, the outcome of which would, in our judgment based on information currently available to us, have a material adverse effect on our financial position or results of operations.
| Item 4. | Submission of Matters to a Vote of Security Holders |
No matters were submitted for a stockholder vote during the fourth quarter of 2009.
PART II
| Item 5. | Market for the Registrant’s Common Equity, Related Stockholder Matters and Issuer Purchases of Equity Securities |
Our common stock is traded on the New York Stock Exchange (“NYSE”) under the symbol “REG”. As of February 16, 2010, we had approximately 17,700 holders of common equity. The following table sets forth the high and low prices and the cash dividends declared on our common stock by quarter for 2009 and 2008.
| 2009 | 2008 | ||||||||||||
| Quarter Ended |
High Price |
Low Price |
Cash Dividends Declared |
High Price |
Low Price |
Cash Dividends Declared | |||||||
| March 31 |
$ | 46.54 | 22.02 | .7250 | 67.08 | 52.86 | .7250 | ||||||
| June 30 |
38.63 | 26.55 | .4625 | 73.52 | 58.13 | .7250 | |||||||
| September 30 |
41.05 | 28.50 | .4625 | 73.10 | 51.67 | .7250 | |||||||
| December 31 |
36.24 | 31.62 | .4625 | 66.19 | 23.36 | .7250 | |||||||
We intend to pay regular quarterly dividends to Regency Centers Corporations’ common stockholders. Future dividends will be declared and paid at the discretion of our Board of Directors, and will depend upon cash generated by operating activities, our financial condition, capital requirements, annual dividend requirements under the REIT provisions of the Internal Revenue Code of 1986, as amended, and such other factors as our Board of Directors deem relevant. Distributions by us to the extent of our current and accumulated earnings and profits for federal income tax purposes will be taxable to stockholders as either ordinary dividend income or capital gain income if so declared by us. Distributions in excess of earnings and profits generally will be treated as a non-taxable return of capital. Such distributions have the effect of deferring taxation until the sale of a stockholder’s common stock. In order to maintain Regency Centers Corporation’s qualification as a REIT, we must make annual distributions to stockholders of at least 90% of our taxable income. Under certain circumstances, which we do not expect to occur, we could be required to make distributions in excess of cash available for distributions in order to meet such requirements. We currently maintain the Regency Centers Corporation Dividend Reinvestment and Stock Purchase Plan which enables our stockholders to automatically reinvest dividends, as well as make voluntary cash payments towards the purchase of additional shares.
Under the loan agreement of our line of credit, in the event of any monetary default, we may not make distributions to stockholders except to the extent necessary to maintain our REIT status.
29
Table of Contents
| Item 5. | Market for the Registrant’s Common Equity, Related Stockholder Matters and Issuer Purchases of Equity Securities (continued) |
The following table provides information about the Company’s purchases of equity securities that are registered by the Company pursuant to Section 12 of the Exchange Act during the quarter ended December 31, 2009:
| Period |
Total number of shares purchased (1) |
Average price paid per share |
Total number of shares purchased as part of publicly announced plans or programs |
Maximum number or approximate dollar value of shares that may yet be purchased under the plans or programs | |||||
| October 1 through October 31, 2009 |
197 | $ | 36.26 | — | — | ||||
| November 1 through November 30, 2009 |
98 | 34.19 | — | — | |||||
| December 1 through December 31, 2009 |
— | — | — | — | |||||
| Total |
295 | $ | 35.57 | — | — | ||||
| (1) | Represents shares delivered in payment of withholding taxes in connection with options exercised and restricted stock vesting by participants under Regency’s Long-Term Omnibus Plan. |
30
Table of Contents
| Item 5. | Market for the Registrant’s Common Equity, Related Stockholder Matters and Issuer Purchases of Equity Securities (continued) |
The performance graph furnished below compares Regency’s cumulative total stockholder return since December 31, 2004. The stock performance graph should not be deemed filed or incorporated by reference into any other filing made by us under the Securities Act of 1933 or the Securities Exchange Act of 1934, except to the extent that we specifically incorporate the stock performance graph by reference in another filing.
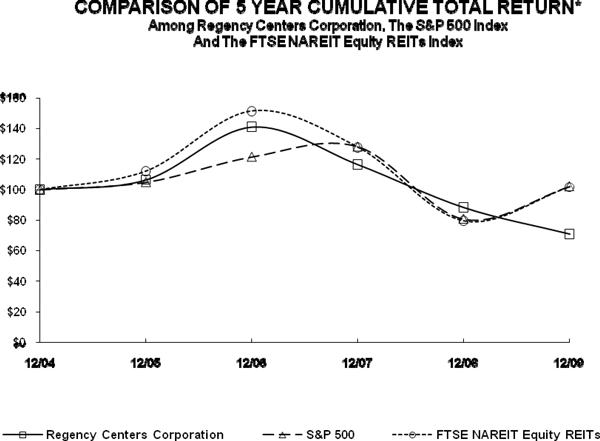
| * | $100 invested on 12/31/04 in stock or index, including reinvestment of dividends. Fiscal year ending December 31. |
Copyright© 2010 S&P, a division of The McGraw-Hill Companies Inc. All rights reserved.
31
Table of Contents
| Item 6. | Selected Financial Data (in thousands, except per share and unit data, number of properties, and ratio of earnings to fixed charges) |
The following table sets forth Selected Financial Data for Regency on a historical basis for the five years ended December 31, 2009. This historical Selected Financial Data has been derived from the audited consolidated financial statements as reclassified for discontinued operations. This information should be read in conjunction with the consolidated financial statements of Regency Centers Corporation and Regency Centers, L.P. (including the related notes thereto) and Management’s Discussion and Analysis of the Financial Condition and Results of Operations, each included elsewhere in this Form 10-K.
Parent Company
| 2009 | 2008 | 2007 | 2006 | 2005 | ||||||||||||
| Operating Data: |
||||||||||||||||
| Revenues |
$ | 489,232 | 495,895 | 436,006 | 405,480 | 374,112 | ||||||||||
| Operating expenses |
308,019 | 277,710 | 247,912 | 232,988 | 200,672 | |||||||||||
| Other expense (income) |
193,479 | 103,907 | 30,174 | 13,748 | 66,884 | |||||||||||
| Income (loss) before equity in income (loss) of investments in real estate partnerships |
(12,266 | ) | 114,278 | 157,920 | 158,744 | 106,556 | ||||||||||
| Equity in income (loss) of investments in real estate partnerships |
(26,373 | ) | 5,292 | 18,093 | 2,580 | (2,908 | ) | |||||||||
| Income (loss) from continuing operations |
(38,639 | ) | 119,570 | 176,013 | 161,324 | 103,648 | ||||||||||
| Income (loss) from discontinued operations |
5,896 | 21,951 | 34,003 | 68,651 | 70,651 | |||||||||||
| Net income (loss) |
(32,743 | ) | 141,521 | 210,016 | 229,975 | 174,299 | ||||||||||
| Net income attributable to noncontrolling interests |
(3,961 | ) | (5,333 | ) | (6,365 | ) | (11,464 | ) | (11,652 | ) | ||||||
| Net income (loss) attributable to controlling interests |
(36,704 | ) | 136,188 | 203,651 | 218,511 | 162,647 | ||||||||||
| Preferred stock dividends |
(19,675 | ) | (19,675 | ) | (19,675 | ) | (19,675 | ) | (16,744 | ) | ||||||
| Net income (loss) attributable to common stockholders |
(56,379 | ) | 116,513 | 183,976 | 198,836 | 145,903 | ||||||||||
| Income per common share - diluted: |
||||||||||||||||
| Income (loss) attributable continuing operations |
$ | (0.82 | ) | 1.35 | 2.16 | 1.89 | 1.15 | |||||||||
| Net income (loss) for common stockholders |
$ | (0.74 | ) | 1.66 | 2.65 | 2.89 | 2.23 | |||||||||
| Other Information: |
||||||||||||||||
| Common dividends declared per share |
$ | 2.11 | 2.90 | 2.64 | 2.38 | 2.20 | ||||||||||
| Common stock outstanding including exchangeable operating partnership units |
82,008 | 70,505 | 70,112 | 69,759 | 69,218 | |||||||||||
| Combined Basis gross leasable area (GLA) |
44,972 | 49,645 | 51,107 | 47,187 | 46,243 | |||||||||||
| Combined Basis number of properties owned |
400 | 440 | 451 | 405 | 393 | |||||||||||
| Ratio of earnings to fixed charges |
1.0 | 1.6 | 2.0 | 2.0 | 1.9 | |||||||||||
| Balance Sheet Data: |
||||||||||||||||
| Real estate investments before accumulated depreciation |
$ | 4,259,990 | 4,425,895 | 4,367,191 | 3,870,629 | 3,744,429 | ||||||||||
| Total assets |
3,973,806 | 4,142,375 | 4,114,773 | 3,643,546 | 3,587,976 | |||||||||||
| Total debt |
1,886,380 | 2,135,571 | 2,007,975 | 1,575,386 | 1,613,942 | |||||||||||
| Total liabilities |
2,030,412 | 2,380,093 | 2,194,244 | 1,734,572 | 1,739,225 | |||||||||||
| Noncontrolling interests |
68,227 | 65,421 | 77,468 | 83,020 | 87,305 | |||||||||||
| Stockholders’ equity |
1,875,167 | 1,696,861 | 1,843,061 | 1,825,954 | 1,761,446 | |||||||||||
32
Table of Contents
Operating Partnership
| 2009 | 2008 | 2007 | 2006 | 2005 | ||||||||||||
| Operating Data: |
||||||||||||||||
| Revenues |
$ | 489,232 | 495,895 | 436,006 | 405,480 | 374,112 | ||||||||||
| Operating expenses |
308,019 | 277,710 | 247,912 | 232,988 | 200,672 | |||||||||||
| Other expense (income) |
193,479 | 103,907 | 30,174 | 13,748 | 66,884 | |||||||||||
| Income (loss) before equity in income (loss) of investments in real estate partnerships |
(12,266 | ) | 114,278 | 157,920 | 158,744 | 106,556 | ||||||||||
| Equity in income (loss) of investments in real estate partnerships |
(26,373 | ) | 5,292 | 18,093 | 2,580 | (2,908 | ) | |||||||||
| Income (loss) from continuing operations |
(38,639 | ) | 119,570 | 176,013 | 161,324 | 103,648 | ||||||||||
| Income (loss) from discontinued operations |
5,896 | 21,951 | 34,003 | 68,651 | 70,651 | |||||||||||
| Net income (loss) |
(32,743 | ) | 141,521 | 210,016 | 229,975 | 174,299 | ||||||||||
| Net income attributable to noncontrolling interests |
(452 | ) | (701 | ) | (990 | ) | (4,863 | ) | (263 | ) | ||||||
| Net income (loss) attributable to controlling interests |
(33,195 | ) | 140,820 | 209,026 | 225,112 | 174,036 | ||||||||||
| Preferred unit distributions |
(23,400 | ) | (23,400 | ) | (23,400 | ) | (23,400 | ) | (24,849 | ) | ||||||
| Net income (loss) attributable to common unit holders |
(56,595 | ) | 117,420 | 185,626 | 201,712 | 149,187 | ||||||||||
| Income per common unit - diluted: |
||||||||||||||||
| Income (loss) attributable continuing operations |
$ | (0.82 | ) | 1.35 | 2.16 | 1.89 | 1.15 | |||||||||
| Net income (loss) for common unit holders |
$ | (0.74 | ) | 1.66 | 2.65 | 2.89 | 2.23 | |||||||||
| Other Information: |
||||||||||||||||
| Distributions per unit |
$ | 2.11 | 2.90 | 2.64 | 2.38 | 2.20 | ||||||||||
| Common units outstanding |
82,008 | 70,505 | 70,112 | 69,759 | 69,218 | |||||||||||
| Preferred units outstanding |
500 | 500 | 500 | 500 | 1,040 | |||||||||||
| Combined Basis gross leasable area (GLA) |
44,972 | 49,645 | 51,107 | 47,187 | 46,243 | |||||||||||
| Combined Basis number of properties owned |
400 | 440 | 451 | 405 | 393 | |||||||||||
| Ratio of earnings to fixed charges |
1.0 | 1.6 | 2.0 | 2.0 | 1.9 | |||||||||||
| Balance Sheet Data: |
||||||||||||||||
| Real estate investments before accumulated depreciation |
$ | 4,259,990 | 4,425,895 | 4,367,191 | 3,870,629 | 3,744,429 | ||||||||||
| Total assets |
3,973,806 | 4,142,375 | 4,114,773 | 3,643,546 | 3,587,976 | |||||||||||
| Total debt |
1,886,380 | 2,135,571 | 2,007,975 | 1,575,386 | 1,613,942 | |||||||||||
| Total liabilities |
2,030,412 | 2,380,093 | 2,194,244 | 1,734,572 | 1,739,225 | |||||||||||
| Noncontrolling interests |
11,748 | 7,980 | 18,391 | 17,797 | 11,089 | |||||||||||
| Partners’ capital |
1,931,646 | 1,754,302 | 1,902,138 | 1,891,177 | 1,837,662 | |||||||||||
33
Table of Contents
| Item 7. | Management’s Discussion and Analysis of Financial Condition and Results of Operations |
Overview of Our Strategy
Regency Centers Corporation (the “Parent Company”) began its operations as a Real Estate Investment Trust (“REIT”) in 1993 and is the managing general partner in Regency Centers, L.P. (the “Operating Partnership”). The term “the Company” or “Regency” means the Parent Company and the Operating Partnership, collectively. Our key strategic goals are focused on total share and unit holder return in excess of peer indices and sustaining growth in net asset value and earnings. We will achieve these goals through owning, operating and investing in a high-quality portfolio of primarily grocery-anchored shopping centers that are tenanted by market-dominant grocers, category-leading anchors, specialty retailers, and restaurants located in areas with above average household incomes and population densities. All of our operating, investing, and financing activities are performed through the Operating Partnership, its wholly-owned subsidiaries, and through its investments in real estate partnerships with third parties (also referred to as co-investment partnerships or joint ventures). The Parent Company currently owns 99% of the outstanding common partnership units of the Operating Partnership. Because of our structure and certain public debt financing, the Operating Partnership is also a registrant.
At December 31, 2009, we directly owned 216 shopping centers (the “Consolidated Properties”) located in 23 states representing 23.0 million square feet of gross leasable area (“GLA”). Our cost of these shopping centers and those under development is $3.9 billion before depreciation. Through co-investment partnerships, we own partial ownership interests in 184 shopping centers (the “Unconsolidated Properties”) located in 25 states and the District of Columbia representing 22.0 million square feet of GLA. Our investment in the partnerships that own the Unconsolidated Properties is $326.2 million. Certain portfolio information described below is presented (a) on a Combined Basis, which is a total of the Consolidated Properties and the Unconsolidated Properties, (b) for our Consolidated Properties only and (c) for the Unconsolidated Properties that we own through co-investment partnerships. We believe that presenting the information under these methods provides a more complete understanding of the properties that we wholly-own versus those that we indirectly own through entities we do not control, but for which we provide asset management, property management, leasing, investing, and financing services. The shopping center portfolio that we manage, on a Combined Basis, represents 400 shopping centers located in 28 states and the District of Columbia and contains 45.0 million square feet of GLA.
We earn revenues and generate cash flow by leasing space in our shopping centers to grocery stores, major retail anchors, side-shop retailers, and restaurants, including ground leasing or selling building pads (out-parcels) to these same types of tenants. Historically, we have experienced growth in revenues by increasing occupancy and rental rates in our existing shopping centers, and by acquiring and developing new shopping centers. Our shopping centers generate substantial daily traffic by conveniently offering necessities and services. This high traffic generates increased sales, thereby driving higher occupancy and rental-rate growth, which we expect will provide sustained growth in earnings per share and unit and net asset value over the long term.
We seek a range of strong national, regional and local specialty retailers, for the same reason that we choose to anchor our centers with leading grocers and major retailers who provide a mix of goods and services that meet consumer needs. We have created a formal partnering process, the Premier Customer Initiative (“PCI”), to promote mutually beneficial relationships with our side-shop retailers. The objective of PCI is for us to build a base of non-anchor tenants who represent the “best-in-class” operators in their respective merchandising categories. Such retailers reinforce the consumer appeal and other strengths of a center’s anchor, help grow and stabilize a center’s occupancy, reduce re-leasing downtime, reduce tenant turnover, and yield higher sustainable rents.
The recession that ended in 2009 had a significant negative impact on our 2009 operating results. During 2009 we experienced less tenant demand for vacant space as well as a higher level of retail store closings, although the rate of closure appears to be slowing. Our rent collection losses increased in most
34
Table of Contents
of our shopping centers and markets, as we experienced a higher level of tenants defaulting on their leases, a result of lower retail sales. These factors contributed to a decline in our occupancy percentages, new leasing rental rates, and rental revenues. At December 31, 2009 our operating portfolio of shopping centers including our pro-rata share of our co-investment partnerships, were 93.1% leased as compared to 93.8% at the end of 2008 and 95.0% leased at the end of 2007. Increasing occupancy in our shopping centers to historical levels of 95% is a key objective of our strategic plan that should generate substantial growth in our future earnings and net asset value, but will likely require several years to accomplish.
We continue to closely monitor tenants who have co-tenancy clauses in their lease agreements. These tenants are typically located in larger format community shopping centers that contain multiple anchor tenants whose leases contain these types of clauses. Co-tenancy clauses have several variants: they may allow a tenant to postpone a store opening if certain other tenants fail to open their store; they may allow a tenant the opportunity to close their store prior to lease expiration if another tenant closes their store prior to lease expiration; or more commonly, they may allow a tenant to pay reduced levels of rent until a certain number of tenants open their stores within the same shopping center. As the weak economy continues to depress retail sales, we could experience further reductions in rent and occupancy related to tenants exercising their co-tenancy clauses.
During 2009 we experienced a higher tenant default rate as compared to previous years due to a national decline in retail sales. These defaults were primarily local tenants, which are generally defined as tenants operating five or fewer stores, such as restaurants, fitness centers, dry cleaners, and tanning salons. We are closely monitoring the operating performance, collections, and sales of all of the tenants in our shopping centers especially those tenants operating retail formats that are experiencing significant changes in competition, business practice, reductions in sales, and store closings in other locations. We expect that as the current economy remains weak, additional retailers will announce store closings and/or bankruptcies that could negatively impact our shopping centers.
We grow our shopping center portfolio through acquisitions of operating centers and shopping center development. We will continue to use our unique combination of development capabilities, market presence, and anchor relationships to invest in value-added opportunities sourced from distressed owners, the redevelopment of existing centers, developing land that we already own, and other opportunities. Development is customer driven, meaning we generally have an executed lease from the anchor before we start construction. Developments serve the growth needs of our anchors and specialty retailers, resulting in modern shopping centers with long-term anchor leases that produce attractive returns on our invested capital. This development process typically requires three to five years from initial land or redevelopment acquisition through construction, lease-up, and stabilization of rental income, but can take longer depending upon tenant demand for new stores and the size of the project.
In the near term, fewer new store openings by retailers are resulting in reduced demand for new retail space and causing corresponding reductions in new leasing rental rates and development pre-leasing. As a result, we have scaled back our development program by decreasing the number of new projects started, phasing existing developments that lack retail demand, and decreasing overhead costs through reductions in force. Although our development program will continue to play a part of our long term business strategy, new development projects will be rigorously evaluated in regard to the cost and availability of capital, visibility of tenant demand to achieve a stabilized occupancy, and sufficient investment returns.
We strive to maintain a conservative capital structure. We will continue to cost effectively and opportunistically strengthen our balance sheet, which should allow us to access various sources of capital to fund our future commitments. We endeavor to continue improving our key financial ratios and to maintain a high percentage of unencumbered assets: 81.6% of our consolidated real estate assets at December 31, 2009 are unencumbered. Such assets allow us to access the secured and unsecured debt markets and maintain significant availability on our $713.8 million line of credit commitment, which had no outstanding balance at December 31, 2009. Our debt to asset ratio (before the effect of accumulated depreciation), including our pro-rata share of the debt and assets of joint ventures is 45.9% at December 31,
35
Table of Contents
2009, which is favorably lower than our ratio at December 31, 2008 of 50.0%. If we were to repay a portion of our outstanding debt with our available cash balances, our current debt to asset ratio would fall to 44.9% at December 31, 2009. For the year ended 2009, our coverage ratio with our pro-rata share of our partnerships declined to 2.0 times as compared to 2.4 times in 2008, directly related to a reduction in our EBITDA (Earnings Before Interest, Taxes, Depreciation and Amortization), which was negatively impacted by the recent recession. We define our Coverage ratio as EBITDA divided by the sum of the gross interest and scheduled mortgage principal paid to our lenders plus dividends paid to our preferred stockholders. During 2009, Standard and Poor’s Rating Services lowered our corporate credit rating and senior unsecured debt rating from BBB+ to BBB primarily due to the decline in our Coverage ratio and a negative retail outlook. We plan to grow EBITDA through growth in net operating income by returning the occupancy percentages in our shopping centers back to historic levels and by acquiring or developing shopping centers, which in combination with a conservative capital structure should favorably impact our Coverage ratio on a long-term basis.
Capital recycling involves contributing shopping centers to co-investment partnerships and culling non-strategic assets from our real estate portfolio and selling those in the open market. These sales proceeds are either reserved for future capital commitments related to in process development, redevelopments or debt maturities, or re-deployed into even higher-quality new developments or acquisitions that will generate sustainable revenue growth and attractive returns. To the extent that we are unable to generate capital in excess of our current commitments, we will reduce our new investment activity accordingly.
Co-investment partnerships provide us with a reliable capital source for shopping center acquisitions, as well as the opportunity to earn fees for asset management, property management, and other investing and financing services. As asset manager, we are engaged by our partners to apply similar operating, investment and capital strategies to the portfolios owned by the co-investment partnerships as those applied to the portfolio that we wholly-own. Co-investment partnerships grow their shopping center investments through acquisitions from third parties or direct purchases from us. Although selling properties to co-investment partnerships reduces our direct ownership interest, it provides a source of capital that further strengthens our balance sheet while we continue to share, to the extent of our ownership interest, in the risks and rewards of shopping centers that meet our high quality standards and long-term investment strategy.
Our co-investment partnerships have significant levels of debt that mature through 2012 and are subject to significant borrowing risks if the capital markets again become unavailable as they were during the recent recession. As a result of the declines in commercial real estate values over the past 18 months, the refinancing of maturing loans will require us and our joint venture partners to each contribute our respective pro-rata share of capital to the joint ventures in order to reduce the amount of borrowing to acceptable loan to value levels which we expect will be required for new financings. While we have to date successfully refinanced our maturing loans, the weak U.S. economy may hinder our ability to access capital, including access by our joint venture partners, or to obtain future financing to fund maturing debt. While we believe that our joint venture partners have sufficient capital or access thereto for these future capital requirements, we can provide no assurance that the weak economy will not inhibit their ability to access capital and meet their future funding commitments. The impact to the Company of a co-investment partner defaulting on its share of a capital call is discussed below under “Liquidity and Capital Resources”.
36
Table of Contents
Shopping Center Portfolio
The following tables summarize general information related to our shopping center portfolio, which we use to evaluate and monitor our performance.
| December 31, 2009 |
December 31, 2008 |
|||||
| Number of Properties (a) (d) |
400 | 440 | ||||
| Number of Properties (b) (d) |
216 | 224 | ||||
| Number of Properties (c) (d) |
184 | 216 | ||||
| Properties in Development (a) |
40 | 45 | ||||
| Properties in Development (b) |
39 | 44 | ||||
| Properties in Development (c) |
1 | 1 | ||||
| Gross Leasable Area (a) |
44,971,962 | 49,644,545 | ||||
| Gross Leasable Area (b) |
22,965,276 | 24,176,536 | ||||
| Gross Leasable Area (c) |
22,006,686 | 25,468,009 | ||||
| % Leased – Operating and Development (a) |
92.1 | % | 92.3 | % | ||
| % Leased – Operating and Development (b) |
91.0 | % | 90.2 | % | ||
| % Leased – Operating and Development (c) |
93.2 | % | 94.3 | % | ||
| % Leased – Operating (a) |
93.2 | % | 94.1 | % | ||
| % Leased – Operating (b) |
93.2 | % | 93.7 | % | ||
| % Leased – Operating (c) |
93.3 | % | 94.4 | % | ||
| (a) | Combined Basis (includes properties owned by unconsolidated co-investment partnerships) |
| (b) | Consolidated Properties (excludes properties owned by unconsolidated co-investment partnerships) |
| (c) | Unconsolidated Properties (only properties owned by unconsolidated co-investment partnerships) |
| (d) | Includes Properties in Development |
We seek to reduce our operating and leasing risks through diversification which we achieve by geographically diversifying our shopping centers, avoiding dependence on any single property, market, or tenant, and owning a portion of our shopping centers through co-investment partnerships.
The following table summarizes our four largest tenants, each of which is a grocery tenant, occupying the shopping centers at December 31, 2009:
| Grocery Anchor |
Number of Stores (a) |
Percentage of Company- owned GLA (b) |
Percentage of Annualized Base Rent (b) |
|||||
| Kroger |
55 | 8.0 | % | 4.9 | % | |||
| Publix |
55 | 6.9 | % | 4.2 | % | |||
| Safeway |
61 | 5.8 | % | 3.7 | % | |||
| Super Valu |
31 | 3.2 | % | 2.5 | % |
| (a) | For the Combined Properties including stores owned by grocery anchors that are attached to our centers. |
| (b) | GLA and annualized base rent include the Consolidated Properties plus Regency’s pro-rata share of the Unconsolidated Properties (“Regency Pro-rata”). |
37
Table of Contents
The following table summarizes leasing activity in square feet (“SF”) for the year ended December 31, 2009 for the Combined Properties and Regency Pro-rata GLA (in thousands):
| Combined Properties (a) |
% of GLA |
Regency Pro-rata (b) |
% of GLA |
|||||||||
| Leasing Activity: |
||||||||||||
| New Leases Signed |
1,442 | 3.2 | % | 1,056 | 3.7 | % | ||||||
| Existing Leases Renewed |
3,889 | 8.6 | % | 2,241 | 7.9 | % | ||||||
| Total Leasing Activity |
5,331 | 11.8 | % | 3,297 | 11.6 | % | ||||||
| Leases Moved Out |
(2,042 | ) | -4.5 | % | (1,382 | ) | -4.9 | % | ||||
| New Leases less Moveouts |
(600 | ) | -1.3 | % | (326 | ) | -1.1 | % | ||||
| Rental Rate Growth % |
-2.0 | % | -2.7 | % | ||||||||
| Leases Expiring in 2010 (c) |
3,894 | 9.6 | % | 2,404 | 9.6 | % | ||||||
| Leases Expiring in 2011 |
4,298 | 10.6 | % | 2,865 | 11.5 | % | ||||||
| Leases Expiring in 2012 |
5,092 | 12.6 | % | 3,305 | 13.2 | % | ||||||
| (a) | Combined Properties includes Consolidated Properties and Unconsolidated Properties. |
| (b) | Regency Pro-rata includes Consolidated Properties and Regency’s pro-rata share of the Unconsolidated Properties. |
| (c) | Excludes 604 (Combined Properties) and 332 (Regency Pro-rata) SF of leases under month to month rental agreements or leases in process of renewal |
Although base rent is supported by long-term lease contracts, tenants who file bankruptcy are given the right to cancel any or all of their leases and close related stores, or continue to operate. In the event that a tenant with a significant number of leases in our shopping centers files bankruptcy and cancels its leases, we could experience a significant reduction in our revenues and tenant receivables. We are closely monitoring industry trends and sales data to help us identify declines in retail categories or tenants who might be experiencing financial difficulties as a result of slowing sales, lack of credit, changes in retail formats or increased competition. As a result of our findings, we may reduce new leasing, suspend leasing, or curtail the allowance for the construction of leasehold improvements within a certain retail category or to a specific retailer.
As of December 31, 2009, we had 82 video rental stores occupying our shopping centers on a Combined Basis that represent $6.7 million of annual base rent on a pro-rata basis. Blockbuster Video represents the majority of our video rental leases with 71 stores and annual base rent of $5.7 million or 1.4% of our annualized base rent including our pro-rata share of 28 stores in the Unconsolidated Properties. Blockbuster has announced publicly that it will close many of its stores and we expect that during 2010 they will close some of the stores that they occupy in our shopping centers. Movie Gallery/Hollywood Video filed for Chapter 11 bankruptcy protection on February 2, 2010. We currently have four Movie Gallery/Hollywood Video stores occupying our shopping centers and we anticipate that these stores could close during 2010. The base rent associated with these four stores is insignificant to our annual base rent on a pro-rata basis.
During 2009, EJ’s Shoes, Eddie Bauer, Bi-Lo Supermarkets, Ritz Camera/Wolf Camera/Boater’s World, the Walking Company, and Max & Erma’s each filed for Chapter 11 bankruptcy protection and InkStop filed for Chapter 7 bankruptcy liquidation. Of these 22 leases, six leases have been assumed and 14 leases have been rejected. The combined annual base rent on a pro-rata basis associated with these leases is approximately $1.3 million or less than 1% of our annual base rent on a pro-rata basis.
In January and February 2010, Fili’s Enterprises, Inc. doing business as Daphne’s Cafe, along with Pizzeria Uno, and Hollywood Video/Movie Gallery, filed for Chapter 11 bankruptcy protection. Of these 20 leases, none have been assumed and 11 leases have been rejected. The combined annual
38
Table of Contents
base rent on a pro-rata basis associated with these leases is approximately $1.4 million or less than 1% of our annual base rent on a pro-rata basis.
We continue to monitor and communicate with those tenants who have announced store closings or are experiencing financial distress. We expect as the weak economy continues, additional retailers will announce store closings and/or bankruptcies that could negatively impact our shopping centers. While retail sales remain depressed, we could experience further reductions in rent and occupancy related to tenants exercising their co-tenancy clauses as discussed previously. However, we are not currently aware of the pending bankruptcy or announced store closings of any tenants in our shopping centers beyond those described above that would individually cause a material reduction in our revenues, and no tenant represents more than 5% of our annual base rent on a pro-rata basis.
Liquidity and Capital Resources
Our Parent Company has no capital commitments other than its guarantees of the commitments of our Operating Partnership, which are discussed further below under Contractual Obligations. The Parent Company will from time to time access the capital markets for the purpose of issuing new equity and will simultaneously contribute all of the offering proceeds to the Operating Partnership in exchange for additional partnership units. Any new debt is issued by our Operating Partnership or by our co-investment partnerships. Accordingly, the discussion below regarding liquidity and capital resources is presented on a consolidated basis for the Company. The following table summarizes net cash flows related to operating, investing, and financing activities of the Company for the years ended December 31, 2009, 2008, and 2007 (in thousands):
| 2009 | 2008 | 2007 | ||||||||
| Net cash provided by operating activities |
$ | 193,862 | 219,169 | 218,167 | ||||||
| Net cash provided by (used in) investing activities |
45,729 | (105,775 | ) | (412,161 | ) | |||||
| Net cash (used in) provided by financing activities |
(161,647 | ) | (110,529 | ) | 178,616 | |||||
| Net increase (decrease) in cash and cash equivalents |
$ | 77,944 | 2,865 | (15,378 | ) | |||||
During 2009, we completed the following capital sourcing transactions:
| • | On April 24, 2009, we completed a public offering of 10.0 million common shares at $32.50 per share resulting in proceeds of $310.9 million, net of issuance costs, a portion of which was used to fully repay the Company’s $180.0 million balance on its line of credit and fund construction costs. |
| • | On July 1, 2009, we closed on mortgage loans of $106.0 million secured by eight wholly-owned properties (the “Allianz Loan”). Additionally, during 2009, our co-investment partnerships closed on $348.3 million of mortgage loans for which our pro-rata share based upon our partnership ownership interests was $77.2 million. |
| • | On October 27, 2009 we finalized the formation of a new co-investment partnership with the United Services Automobile Association (the “USAA” partnership) in which we have a 20% ownership interest. During 2009, we sold eight operating properties to the USAA partnership for $133.9 million, providing us with net proceeds of $103.3 million. |
| • | On December 9, 2009, we completed a public offering of 8,000,000 common shares at $30.75 per share which will result in net proceeds of $235.8, net of issuance costs at a future settlement date expected to occur no later than 2011. In connection with this offering, we entered into forward sale agreements with affiliates of J.P. Morgan Securities Inc. and Wells Fargo Securities, LLC, as forward purchasers. We intend to use the proceeds, once settled, to repay debt of the Operating Partnership. This offering also included an over-allotment option of 1,200,000 shares which closed simultaneously with the offering providing us with additional net proceeds of $35.4 million. |
On December 31, 2009 our cash balance was $99.5 million. We operate our business such that we expect net cash provided by operating activities in combination with proceeds generated from gains realized on sales of development properties and land will provide the necessary funds to pay our
39
Table of Contents
scheduled mortgage loan principal payments, capital expenditures necessary to maintain our shopping centers, and distributions to our share and unit holders. Net cash provided by operating activities plus gains from the sale of development properties and land of $5.8 million, $34.3 million and $63.9 million totaled $199.7 million, $253.5 million, and $282.1 million for the years ended December 31, 2009, 2008 and 2007, respectively. During the years ended December 31, 2009, 2008, and 2007, we incurred capital expenditures to maintain our shopping centers of $14.4 million, $15.4 million, and $15.1 million; we paid scheduled principal payments of $5.2 million, $4.8 million, and $4.5 million; and we paid distributions of $183.1 million, $222.9 million, and $204.3 million, respectively. During 2009, these expenditures and distributions exceeded our cash provided by operating activities and gains by $3.0 million due to a decline in our revenues and gains, which is discussed further below under Results from Operations. Our Board of Directors anticipated these declines; and accordingly, reduced our quarterly dividend to $0.4625 per share and unit beginning in May 2009 from the previous $0.725 paid in March 2009 Our dividend distribution policy is set by our Board of Directors who continuously review our financial results and make decisions they believe prudent about distribution rates. We plan to continue paying an aggregate amount of distributions to our stock and unit holders that at a minimum meet the requirements to continue qualifying as a REIT for Federal income tax purposes.
Commitments available to us under our Operating Partnership’s unsecured line of credit (the “Line”) and revolving credit facility total $713.8 million. As of February 26, 2010, we had no balance outstanding on the Line or the revolving credit facility. The Line is available to us through January 2011, at which time we have the option to extend $600.0 million of the commitment to January 2012. Based upon our on-going discussions with our Line banks, we believe we will be able to successfully negotiate and extend the Line at a commitment level sufficient to meet our working capital and investment needs when it matures.
We currently estimate that we will require approximately $916.1 million through 2012 primarily to repay $624.7 million of maturing debt, complete in-process developments, and to fund our pro-rata share of estimated capital contributions to our co-investment partnerships for repayment of debt. Included in these capital requirements are $584.0 million of unsecured public debt as further described below under Notes Payable, which we intend to repay at maturity from the proceeds of new unsecured issues. To the extent that issuing unsecured debt is cost prohibitive or unavailable, we believe that we have sufficient unsecured assets available for secured mortgage financing whose proceeds could be used to repay the unsecured debt at maturity. When necessary, the Line is available to fund our capital needs. Also, as mentioned previously, we will receive $235.8 million of net proceeds once we settle the 8.0 million common share forward equity offering in the future.
At December 31, 2009 we had 40 properties under construction or undergoing major renovations on a Combined Basis, which when completed, will represent a net investment of $820.7 million after projected sales of adjacent land and out-parcels. This compares to 45 properties that were under construction at December 31, 2008 representing an investment of $993.2 million upon completion. We estimate that we will earn an average return on investment from our current development projects of 6.6% when completed and fully leased. Average returns have declined over previous years’ primarily as a result of longer lease up periods and reduced market rental rates. Costs necessary to complete the current development projects, net of reimbursements and projected land sales, are estimated to be approximately $34.1 million.
Our joint ventures have $1.3 billion of secured mortgage loans and credit lines maturing through 2012. We believe that in order to refinance the maturing joint venture loans, we, along with our joint venture partners, will be required to contribute our pro-rata share of the capital necessary to reduce the amount of borrowings to acceptable loan to value levels required for this type of financing. We currently estimate that we will contribute approximately $206.4 million to our joint ventures through 2012 for our pro-rata share of the repayment of maturing debt, net of the proceeds from new debt issues, and we estimate our joint venture partners will contribute $304.8 million for their share. A more detailed loan maturity schedule is included below under Notes Payable.
We believe that our joint venture partners are financially sound and have sufficient capital or
40
Table of Contents
access thereto to fund future capital requirements. We communicate with our co-investment partners regularly regarding the operating and capital budgets of our co-investment partnerships, and believe that we will successfully complete the refinancing of our joint venture debt as it matures. In the event that a co-investment partner was unable to fund its share of the capital requirements of the co-investment partnership, we would have the right, but not the obligation, to loan the defaulting partner the amount of its capital call at an interest rate at the lesser of prime plus a pre-defined spread or the maximum rate allowed by law. A decision to loan to a defaulting joint venture partner, which would be secured by the defaulting partner’s partnership interest, would be based on the fair value of the co-investment partnership assets, our joint venture partner’s financial health and would be subject to an evaluation of our own capital commitments and sources to fund those commitments. Alternatively, should we determine that our joint venture partners will not have sufficient capital to meet future capital needs, we could trigger liquidation of the partnership. For the co-investment partnerships that have distribution-in-kind (“DIK”) provisions, and own multiple properties, a liquidation of the co-investment partnership could be completed by either a DIK of the properties to each joint venture partner in proportion to its partnership interest, open market sale, or a combination of both methods. Our co-investment partnership properties have been financed with non-recourse loans that represent 99% of the total debt of the co-investment partnerships at December 31, 2009 including lines of credit. We and our partners have no guarantees related to these loans. In those co-investment partnerships which have DIK provisions, if we trigger liquidation by distribution in kind, each partner would receive title to properties selected in a rotation process for distribution and would assume any related loans secured by the properties distributed. The loan agreements generally provide for assumption by either joint venture partner after obtaining any required lender consent. We would only be responsible for those loans we assume through the DIK, and only to the extent of the value of the property we receive since after assumption through the DIK the loans would remain non-recourse. We also have a 50% investment interest in a single asset joint venture with an $8.5 million loan which contains guarantees from each partner limited however to their respective interest.
Our preferred stock and preferred units, though callable by us, are not redeemable in cash at the option of the holders.
Although common or preferred equity raised in the public markets by the Parent Company is an option to fund future capital needs, access to these markets could be limited at times. During 2009, we successfully completed $607.9 million of common stock offerings. When conditions for the issuance of equity are acceptable, we will evaluate issuing equity to fund new acquisition opportunities, fund new developments, or repay maturing debt. At December 31, 2009, the Parent Company and the Operating Partnership each had existing shelf registration statements available for the issuance of new equity or debt securities, respectively.
Investments in Real Estate Partnerships
We account for certain investments in real estate partnerships using the equity method. We have determined that these investments are not variable interest entities and do not require consolidation under Financial Accounting Standards Board (“FASB”) Accounting Standards Codification (“ASC”) Topic 810, and therefore are subject to the voting interest model in determining our basis of accounting. Major decisions, including property acquisitions not meeting pre-established investment criteria, dispositions, financings, annual budgets and dissolution of the joint ventures are subject to the approval of all partners.
Recognition of gains from sales to co-investment partnerships is recorded on only that portion of the sales not attributable to our ownership interest unless there are certain provisions in the partnership agreement which allow the Company a unilateral right to initiate a DIK upon liquidation, as described further below under our Critical Accounting Policies and Note 1(b) Summary of Significant Accounting Policies in our Consolidated Financial Statements each included herein. The presence of such DIK provisions requires that we apply a more restrictive method of gain recognition (“Restricted Gain Method”) on sales of properties to these co-investment partnerships. This method considers our potential ability to receive property through a DIK on which partial gain has been recognized, and ensures maximum gain deferral upon sale to a co-investment partnership containing these unilateral DIK rights (“DIK-JV”).
41
Table of Contents
The operations and gains related to properties sold to our investments in real estate partnerships are not classified as discontinued operations because we continue to provide to these shopping centers property management services under market rate agreements with our co-investment partnerships. For those properties acquired by the joint venture from unrelated parties, we are required to contribute our pro-rata share based on our ownership interest of the purchase price to the co-investment partnerships.
At December 31, 2009, we had investments in real estate partnerships of $326.2 million. The following table is a summary of unconsolidated combined assets and liabilities of these co-investment partnerships and our pro-rata share (see note below) at December 31, 2009 and 2008 (dollars in thousands):
| 2009 | 2008 | |||||||
| Number of Joint Ventures |
18 | 19 | ||||||
| Regency’s Ownership |
16.35%-50 | % | 16.35%-50 | % | ||||
| Number of Properties |
184 | 216 | ||||||
| Combined Assets |
$ | 4,185,181 | $ | 4,862,730 | ||||
| Combined Liabilities |
2,644,948 | 2,973,410 | ||||||
| Combined Equity |
1,540,233 | 1,889,320 | ||||||
| Regency’s Share of (a): |
||||||||
| Assets |
$ | 998,960 | $ | 1,171,218 | ||||
| Liabilities |
623,884 | 705,452 | ||||||
| (a) | Pro-rata financial information is not, and is not intended to be, a presentation in accordance with U.S. generally accepted accounting principles. However, management believes that providing such information is useful to investors in assessing the impact of its investments in real estate partnership activities on the operations of Regency, which includes such items on a single line presentation under the equity method in its consolidated financial statements. |
Investments in real estate partnerships are primarily composed of co-investment partnerships in which we currently invest with four co-investment partners and an open-end real estate fund (“Regency Retail Partners” or the “Fund”), as further described below. In addition to earning our pro-rata share of net income or loss (including impairments) in each of these co-investment partnerships, we received market-based fees for asset management, disposition, property management, leasing, investment, and financing services of $29.1 million, $31.6 million, and $28.3 million and transaction fees of $7.8 million, $23.7 million, and $4.0 million for the years ended December 31, 2009, 2008, and 2007, respectively.
42
Table of Contents
Our investments in real estate partnerships as of December 31, 2009 and 2008 consist of the following (in thousands):
| Ownership | 2009 | 2008 | ||||||
| Macquarie CountryWide-Regency (MCWR I) (1) |
— | $ | — | 11,137 | ||||
| Macquarie CountryWide Direct (MCWR I) (1) |
— | — | 3,760 | |||||
| Macquarie CountryWide-Regency II (MCWR II) (2) |
25.00 | % | 154,350 | 197,602 | ||||
| Macquarie CountryWide-Regency III (MCWR III) |
24.95 | % | 351 | 623 | ||||
| Macquarie CountryWide-Regency-DESCO (MCWR-DESCO) |
16.35 | % | 24,374 | 21,924 | ||||
| Columbia Regency Retail Partners (Columbia I) |
20.00 | % | 28,347 | 29,704 | ||||
| Columbia Regency Partners II (Columbia II) |
20.00 | % | 11,202 | 12,858 | ||||
| Cameron Village LLC (Cameron) |
30.00 | % | 18,285 | 19,479 | ||||
| RegCal, LLC (RegCal) |
25.00 | % | 12,863 | 13,766 | ||||
| Regency Retail Partners (the Fund) |
20.00 | % | 22,114 | 23,838 | ||||
| US Regency Retail I, LLC (USAA) |
20.01 | % | 5,111 | — | ||||
| Other investments in real estate partnerships |
50.00 | % | 49,215 | 48,717 | ||||
| Total |
$ | 326,212 | 383,408 | |||||
| (1) | At December 31, 2008, the Company’s ownership interest in MCWR I was 25.00%. The liquidation of MCWR I was completed in 2009. |
| (2) | At December 31, 2008, the Company’s ownership interest in MCWR II was 24.95%. |
Investments in real estate partnerships are reported net of deferred gains of $52.0 million and $88.3 million at December 31, 2009 and December 31, 2008, respectively. Cumulative deferred gain amounts related to each co-investment partnership are described below.
We co-invest with the Oregon Public Employees Retirement Fund (“OPERF”) in three co-investment partnerships, two of which we have ownership interests of 20% (“Columbia I” and “Columbia II”) and one in which we have an ownership interest of 30% (“Cameron”). Our investment in the three co-investment partnerships with OPERF totals $57.8 million and represents 1.5% of our total assets at December 31, 2009. At December 31, 2009, the Columbia co-investment partnerships had total assets of $743.3 million and net income of $5.4 million for the year ended. Our share of Columbia’s total assets was $160.5 million which represents 4.0% of our total assets.
As of December 31, 2009, Columbia I owned 14 shopping centers, had total assets of $320.4 million, and net income of $6.7 million for the year ended. The partnership agreement has a unilateral right to elect to dissolve the partnership and receive a DIK upon liquidation; therefore, we have applied the Restricted Gain Method to determine the amount of gain that we recognize on property sales to Columbia. During 2009, we did not sell any properties to Columbia I. Since the inception of Columbia in 2001, we have recognized gain of $2.0 million on partial sales to Columbia and deferred gain of $4.3 million. In December 2008, we earned and recognized a $19.7 million Portfolio Incentive Return fee from OPERF based on Columbia I’s out performance of the cumulative National Council of Real Estate Investment Fiduciaries (“NCREIF”) index since the inception of the partnership and a hurdle rate as outlined in the partnership agreement. We collected this fee in full in April 2009.
As of December 31, 2009, Columbia II owned 16 shopping centers, had total assets of $313.3 million, and net income of approximately $159,000 for the year ended. The partnership agreement has a unilateral right to elect to dissolve the partnership and receive a DIK upon liquidation; therefore, we have applied the Restricted Gain Method to determine the amount of gain that we recognize on property sales to Columbia II. During 2009, we did not sell any properties to Columbia II. Since the inception of Columbia II in 2004, we have recognized gain of $9.1 million on partial sales to Columbia II and deferred gain of $15.7 million.
43
Table of Contents
As of December 31, 2009, Cameron owned one shopping center, had total assets of $109.6 million, and a net loss of $1.4 million for the year ended. The partnership agreement does not contain any DIK provisions that would require us to apply the Restricted Gain Method. Since the inception of Cameron in 2004, we have not sold any properties to Cameron.
We co-invest with the California State Teachers’ Retirement System (“CalSTRS”) in a joint venture (“RegCal”) in which we have a 25% ownership interest. As of December 31, 2009, RegCal owned seven shopping centers, had total assets of $155.1 million, and net income of approximately $493,000 for the year ended. Our share of RegCal’s total assets was $38.8 million which represents 1.0% of our total assets. The partnership agreement has a unilateral right to elect to dissolve the partnership and receive a DIK upon liquidation; therefore, we have applied the Restricted Gain Method to determine the amount of gain that we recognize on property sales to RegCal. During 2009, we did not sell any properties to RegCal. Since the inception of RegCal in 2004, we have recognized gain of $10.1 million on partial sales to RegCal and deferred gain of $3.4 million.
We co-invest with Macquarie CountryWide Trust of Australia (“MCW”) as the only other partner in three co-investment partnerships, one in which we had an ownership interest of 25% (“MCWR I”) which was liquidated during 2009 as discussed below, one in which we have an ownership interest of 24.95% (“MCWR III”), and one in which we have an ownership interest of 16.35% (“MCWR-DESCO”). Our investment in the three co-investment partnerships with MCW totals $24.7 million and represents less than 1% of our total assets at December 31, 2009. The MCW co-investment partnerships had total assets of $447.1 million and a net loss of approximately $915,000 for the year ended. Our share of the co-investment partnerships’ total assets was $78.8 million which represents 2.0% of our total assets.
On January 14, 2009, under the terms of the MCWR I partnership agreement, MCW elected to dissolve the partnership. During 2009, we completed the liquidation of the partnership through a DIK, which provided for distribution of the properties to each partner under an alternating selection process, in proportion to the value of each partner’s respective capital account in the partnership as of the date of liquidation. The total fair value of the properties was $467.3 million, net of debt, based on third party appraisals. As a result of the liquidation, MCW received 34 properties and we received six properties through the DIK. The six properties the Company received had a fair value of $131.9 million, net of debt, which represents a return of our investment and a $13.1 million promote, which was not recognized in net income in accordance with the Restricted Gain Method. Consistent with the Restricted Gain Method, the properties that we received in liquidation were recorded at the net carrying value of our investment of $29.9 million, which is net of deferred gain previously recorded of $40.8 million. As a result, no gain or loss was recognized on the dissolution. During 2009, MCWR I sold one shopping center to a third party for $7.8 million and recognized a gain of $3.7 million.
As of December 31, 2009, MCWR III owned four shopping centers, had total assets of $65.1 million, and a net loss of approximately $436,000 for the year ended. Effective January 1, 2010, the partnership agreement was amended to include a unilateral right to elect to dissolve the partnership and receive a DIK upon liquidation; therefore, we will apply the Restricted Gain Method if additional properties are sold to MCWR III on or after January 1, 2010. Accordingly, we will recognize gains on such future sales only when such gains exceed amounts required to be deferred under the Restricted Gain Method. During 2009, we did not sell any properties to MCWR III. Since the inception of MCWR III in 2005, we have recognized gain of $14.1 million on partial sales to MCWR III and deferred gain of $4.7 million.
As of December 31, 2009, MCWR-DESCO owned 32 shopping centers, had total assets of $382.1 million and recorded a net loss of $5.3 million for the year ended. The partnership agreement does not contain any DIK provisions that would require us to apply the Restricted Gain Method. Since the inception of MCWR-DESCO in 2007, we have not sold any properties to MCWR-DESCO.
We co-invest with MCW and Global Retail Investors LLC (“GRI”), a joint venture between the California Public Employees’ Retirement System (“CalPERS”) and an affiliate of First Washington Realty, Inc. in one co-investment partnership in which we have an ownership interest of 25% (“MCWR II”). Our
44
Table of Contents
investment in MCWR II totals $154.4 million and represents 3.9% of our total assets at December 31, 2009.
On July 17, 2009, we announced that MCW had agreed to sell 60% of its partnership interest in MCWR II to GRI in two closings. The initial closing was completed on July 31, 2009, with MCW selling 45% of its 75% interest to GRI. As part of the closing, we acquired Macquarie-Regency Management, LLC’s (“US Manager”) 0.1% ownership of MCWR II. US Manager was owned 50/50 by us and an affiliate of Macquarie Bank Limited. The transaction increased our ownership in MCWR II to 25% from 24.95%. At the initial closing we received a disposition fee of $7.8 million from MCW equal to 1% of the gross sales price paid by GRI. At the second closing, GRI will acquire from MCW, an incremental 15% interest increasing its total ownership in MCWR II to 60%. We expect this to occur during 2010 once the existing mortgage lenders consent to the transaction. We will retain asset management, property management, and leasing responsibilities. For our ongoing services, we are to receive an additional disposition fee from MCW equal to 1% of the gross sales price paid by GRI at future closings. As part of the agreement, we negotiated two separate options to acquire additional interests in the partnership less a discount of 7.7%. If both options were exercised, we would acquire 15% interest in MCWR II, increasing our total ownership to 40%. In November 2009, we exercised our two options to acquire the additional 15% interest in MCWR II. Closing is contingent upon obtaining lender consents and is expected in early 2010. We funded the purchase price of $16.0 million on December 23, 2009, which will be held in escrow until closing.
As of December 31, 2009, MCWR II owned 86 shopping centers, had total assets of $2.2 billion and net loss of $112.4 million for the year ended. The net loss was primarily related to the provision for impairment recorded during 2009 as a result of MCW’s decision to sell its interest in MCWR II which resulted in a change in holding period for certain properties. As part of the sale negotiations, the joint venture identified 14 properties that it would target for sale over the next three years. These properties were previously expected to be held and used long term and this change in the properties’ holding periods resulted in a provision for impairment of $104.4 million. Effective January 1, 2010, the partnership agreement was amended to include a unilateral right to elect to dissolve the partnership and receive a DIK upon liquidation; therefore, we will apply the Restricted Gain Method if additional properties are sold to MCWR II on or after January 1, 2010. Accordingly, we will recognize gains on such future sales only when such gains exceed amounts required to be deferred under the Restricted Gain Method. During 2009, we did not sell any properties to MCWR II. Since the inception of MCWR II in 2005, we have recognized gain of $2.3 million on partial sales to MCWR II and deferred gain of approximately $766,000.
We co-invest with Regency Retail Partners (the “Fund”), an open-ended, infinite life investment fund in which we have an ownership interest of 20%. As of December 31, 2009, the Fund owned nine shopping centers, had total assets of $367.4 million, and recorded a net loss of $3.4 million for the year ended. Our share of the Fund’s total assets was $73.4 million which represents 1.8% of our total assets. The partnership agreement does not contain any DIK provisions that would require us to apply the Restricted Gain Method. During 2009, we did not sell any properties to the Fund. Since the inception of the Fund in 2006, we have recognized gains of $71.6 million on partial sales to the Fund and deferred gains of $17.9 million.
On October 27, 2009, we finalized the formation of a new real estate partnership, US Regency Retail I, LLC, with United Services Automobile Association (the “USAA partnership”) in which we have an ownership interest of 20.01%, and sold seven shopping centers to the real estate partnership. One additional property was sold to the USAA partnership on November 3, 2009. The eight properties were sold for $133.9 million and net proceeds from the sale to the Company were $103.4 million. The partnership agreement has a unilateral right to elect to dissolve the partnership and receive a DIK upon liquidation; therefore, we applied the Restricted Gain Method to determine the amount of gain recognized. We recognized gain of $19.1 million and deferred gain of $8.1 million on these partial sales to the USAA partnership.
45
Table of Contents
Contractual Obligations
We have debt obligations related to our mortgage loans, unsecured notes, and our Unsecured credit facilities as described further below. We have shopping centers that are subject to non-cancelable long-term ground leases where a third party owns and has leased the underlying land to us to construct and/or operate a shopping center. In addition, we have non-cancelable operating leases pertaining to office space from which we conduct our business. The table excludes reserves for approximately $3.2 million related to environmental remediation as discussed below under Environmental Matters as the timing of the remediation is not currently known. The table also excludes obligations related to construction or development contracts because payments are only due upon satisfactory performance under the contract.
The following table of Contractual Obligations summarizes our debt maturities including interest, (excluding recorded debt premiums or discounts that are not obligations), and our obligations under non-cancelable operating and ground leases as of December 31, 2009 including our pro-rata share of obligations within co-investment partnerships excluding interest (in thousands):
| Payments Due by Period | Total | ||||||||||||||
| 2010 | 2011 | 2012 | 2013 | 2014 | Beyond 5 years |
||||||||||
| Notes Payable: |
|||||||||||||||
| Regency (1) |
$ | 280,083 | 316,704 | 344,807 | 93,822 | 241,097 | 1,120,511 | 2,397,024 | |||||||
| Regency’s share of JV (2) |
160,173 | 112,037 | 61,551 | 8,982 | 21,540 | 220,159 | 584,442 | ||||||||
| Operating Leases: |
|||||||||||||||
| Regency |
4,990 | 4,898 | 4,612 | 4,405 | 3,465 | 8,113 | 30,483 | ||||||||
| Regency’s share of JV |
— | — | — | — | — | — | — | ||||||||
| Ground Leases: |
|||||||||||||||
| Regency |
2,108 | 2,123 | 2,211 | 2,521 | 2,525 | 110,475 | 121,963 | ||||||||
| Regency’s share of JV |
204 | 204 | 204 | 204 | 204 | 7,255 | 8,275 | ||||||||
| Total |
$ | 447,558 | 435,966 | 413,385 | 109,934 | 268,831 | 1,466,513 | 3,142,187 | |||||||
| (1) | Amounts include interest payments |
| (2) | Amounts exclude interest payments |
Off-Balance Sheet Arrangements
We do not have off-balance sheet arrangements, financings, or other relationships with other unconsolidated entities (other than our co-investment partnerships) or other persons, also known as variable interest entities not previously discussed.
Notes Payable
The Line commitment is currently $600.0 million under an agreement with Wells Fargo Bank and a syndicate of other banks that matures in February 2011 with a one-year extension at our option. We have the right to expand the Line commitment by an additional $150.0 million subject to additional lender syndication. The Line has a current interest rate of LIBOR plus 55 basis points and an annual facility fee of 15 basis points subject to maintaining our corporate credit and senior unsecured ratings at BBB. In April, 2009, we paid down the Line balance to zero and there was no balance at December 31, 2009. The balance on the Line was $70.0 million at December 31, 2008 with a contractual interest rate of 1.34% based on LIBOR plus 40 basis points.
46
Table of Contents
During 2008 we entered into a $341.5 million, term loan facility (the “Term Facility”) under an agreement with Wells Fargo Bank and a syndicate of other banks that matures in February 2011. The Term Facility originally included a term loan of $227.7 million plus a $113.8 million revolving credit facility. In December, 2009, we paid off the balance of the term loan and it is no longer available to us; however, the revolving credit facility remains available to us at our discretion. At December 31, 2009 and 2008, the balance on the Term Facility was zero and $227.7 million, respectively. At December 31, 2009, the revolving credit facility had a variable interest rate equal to LIBOR plus 100 basis points as compared to LIBOR plus 90 basis points at December 31, 2008 and an annual facility fee of 20 basis points subject to maintaining our corporate credit and senior unsecured ratings at BBB. At December 31, 2008, the term loan had a variable interest rate of 3.30% or LIBOR plus 105 basis points.
On September 30, 2009 Standard and Poor’s Rating Services lowered our corporate credit rating and senior unsecured debt rating to BBB from BBB+ primarily related to the reduction in our Coverage ratio in 2009. As a result of this downgrade, the interest rate on the Line increased to LIBOR plus 55 basis points and the interest rate on the revolving portion of the Term Facility increased to LIBOR plus 100 basis points, respectively, effective October 1, 2009.
Including both the Line commitment and the Term Facility (collectively, “Unsecured credit facilities”), we currently have $713.8 million of total capacity and the interest rate spread paid is dependent upon our maintaining specific investment-grade ratings. We are also required to comply with certain financial covenants as defined in the Credit Agreement such as Minimum Net Worth, Ratio of Total Liabilities to Gross Asset Value (“GAV”) and Ratio of Recourse Secured Indebtedness to GAV, Ratio of EBITDA to Fixed Charges, and other covenants customary with this type of unsecured financing. As of December 31, 2009, management believes we are in compliance with all financial covenants for our Unsecured credit facilities. Our Unsecured credit facilities are used to finance the acquisition and development of real estate, and for general working-capital purposes.
Notes payable consist of secured mortgage loans and unsecured public debt. Mortgage loans may be prepaid, but could be subject to yield maintenance premiums. Mortgage loans are generally due in monthly installments of principal and interest or interest only, and mature over various terms through 2019, whereas, interest on unsecured public debt is payable semi-annually and matures over various terms through 2017. We intend to repay mortgage loans at maturity with proceeds from similar new issues or from the Line. Fixed interest rates on mortgage notes payable range from 4.44% to 8.40% and average 6.63%. During 2009, we completed the following financing transactions:
| • | On October 23, 2009, we closed on an amendment on our only variable rate mortgage loan in the amount of $5.0 million with an interest rate equal to LIBOR plus 350 basis points originally maturing on October 1, 2009 extending the loan maturity to October 1, 2014 with an interest rate equal to LIBOR plus 380 basis points. |
| • | On September 3, 2009, we closed on a $10.7 million two-year construction loan for a development project with an interest rate of LIBOR plus 300 basis points. The balance outstanding was approximately $992,000 at December 31, 2009. |
| • | On July 1, 2009, we closed on mortgage loans of $106.0 million secured by eight properties with an interest rate of 7.75% and a ten-year term. |
| • | In conjunction with properties distributed to us as part of the liquidation of MCWR I, we assumed four mortgage loans. During January 2009, we assumed two mortgage loans with carrying values of $17.0 million and $42.1 million with ten-year terms and interest rates of 6.13% and 6.38%, respectively. During December 2009, we assumed two mortgage loans with carrying values of $4.5 million and $7.0 million maturing on May 1, 2010 with interest rates of 4.44%. |
On August 18, 2009, we completed a cash tender offer and purchased $19.5 million in principal of our $150 million 8.45% unsecured notes due September 1, 2010 and $46.5 million in principal of our $220 million 7.95% unsecured notes due January 15, 2011 (the “Notes”). The total consideration paid for the Notes was $69.5 million or $1,035 per $1,000 in principal, plus accrued and unpaid interest. The
47
Table of Contents
payment was funded from available cash and we recorded a loss of $2.7 million for this early extinguishment of debt.
Outstanding debt at December 31, 2009 and 2008 consists of the following (in thousands):
| 2009 | 2008 | ||||
| Notes payable: |
|||||
| Fixed rate mortgage loans |
$ | 398,820 | 235,150 | ||
| Variable rate mortgage loans |
5,596 | 5,130 | |||
| Fixed rate unsecured loans |
1,481,964 | 1,597,624 | |||
| Total notes payable |
1,886,380 | 1,837,904 | |||
| Unsecured credit facilities |
— | 297,667 | |||
| Total |
$ | 1,886,380 | 2,135,571 | ||
At December 31, 2009, 99.7% of our total debt had fixed interest rates, compared with 85.8% at December 31, 2008. We intend to limit the percentage of variable interest rate debt to be no more than 30% of total debt, which we believe to be an acceptable risk. Currently, our variable rate debt represents less than 1% of our total debt.
The carrying value of our variable rate notes payable and the Unsecured credit facilities are based upon a spread above LIBOR which is lower than the spreads available in the current credit market, causing the fair value of such variable rate debt to be below its carrying value. The fair value of fixed rate loans are estimated using cash flows discounted at current market rates available to us for debt with similar terms and maturities. Fixed rate loans assumed in connection with real estate acquisitions are recorded in the accompanying consolidated financial statements at fair value at the time of acquisition excluding those loans assumed in DIK liquidations which are assumed at carrying value. Based on the estimates used, the fair value of notes payable and the Unsecured credit facilities is approximately $1.4 billion and $1.3 billion at December 31, 2009 and 2008, respectively.
As of December 31, 2009, scheduled principal repayments on notes payable and the Unsecured credit facilities were as follows (in thousands):
| Scheduled Principal Payments by Year: |
Scheduled Principal Payments |
Mortgage Loan Maturities |
Unsecured Public Debt |
Total | ||||||||
| 2010 |
$ | 4,986 | 28,523 | 140,461 | 173,970 | |||||||
| 2011 |
4,837 | 12,268 | 193,486 | 210,591 | ||||||||
| 2012 |
5,105 | — | 250,000 | 255,105 | ||||||||
| 2013 |
4,979 | 16,348 | — | 21,327 | ||||||||
| 2014 |
8,168 | 11,916 | 150,000 | 170,084 | ||||||||
| Beyond 5 Years |
8,853 | 299,280 | 750,000 | 1,058,133 | ||||||||
| Unamortized debt discounts, net |
— | (847 | ) | (1,983 | ) | (2,830 | ) | |||||
| Total |
$ | 36,928 | 367,488 | 1,481,964 | 1,886,380 | |||||||
At December 31, 2009, our investments in real estate partnerships had notes payable of $2.5 billion maturing through 2028, of which 97.0% had weighted average fixed interest rates of 5.6%. The remaining notes payable had variable interest rates based on LIBOR plus a spread in a range of 145 to 150 basis points. Our pro-rata share of these loans was $585.5 million. We and our partners have no guarantees related to these loans except for an $8.5 million loan related to our ownership interest in one single asset real estate partnership where we are only responsible for our pro-rata share of the loan. As of December 31, 2009, scheduled principal repayments on notes payable held by our investments in real estate partnerships were as follows (in thousands):
48
Table of Contents
| Scheduled Principal Payments by Year: |
Scheduled Principal Payments |
Mortgage Loan Maturities |
Unsecured Maturities |
Total | Regency’s Pro-Rata Share | ||||||
| 2010 |
$ | 3,642 | 613,310 | 26,858 | 643,810 | 160,173 | |||||
| 2011 |
3,578 | 448,787 | — | 452,365 | 112,037 | ||||||
| 2012 |
4,396 | 244,418 | — | 248,814 | 61,551 | ||||||
| 2013 |
4,226 | 32,447 | — | 36,673 | 8,982 | ||||||
| 2014 |
4,213 | 77,290 | — | 81,503 | 21,540 | ||||||
| Beyond 5 Years |
25,555 | 983,875 | — | 1,009,430 | 220,159 | ||||||
| Unamortized debt premiums, net |
— | 5,333 | — | 5,333 | 1,030 | ||||||
| Total |
$ | 45,610 | 2,405,460 | 26,858 | 2,477,928 | 585,472 | |||||
We are exposed to capital market risk such as changes in interest rates. In order to manage the volatility related to interest rate risk, we originate new debt with fixed interest rates, or we may enter into interest rate hedging arrangements. We do not utilize derivative financial instruments for trading or speculative purposes. On March 10, 2006, we entered into four forward-starting interest rate swaps totaling $396.7 million with fixed rates of 5.399%, 5.415%, 5.399%, and 5.415%. On April 16, 2009, we paid $20.0 million to partially settle $106.0 million of the $396.7 million interest rate swaps in place to hedge the $106.0 million mortgage loan issued on July 1, 2009 described previously. For $90.7 million of the remaining Swaps, we continue to expect to issue new secured or unsecured debt for a term of 7 to 12 years prior to July 1, 2010. For $200.0 million of the remaining Swaps, we continue to expect to issue new debt for a term of 7 to 12 years during the period between March 31, 2010 and March 31, 2011. The fair value of these swaps was a liability of $28.4 million at December 31, 2009. If we were to no longer expect to issue new debt within the terms and periods described above, we would be required to immediately charge the change in the fair value of these Swaps to net income as well as all future changes in value. During December 2009, following the successful completion of our 8.0 million share common stock offering discussed previously, we revised our assumptions of future debt issues by delaying a portion of our expected issuances into 2011. Although we still expect to issue new debt within the time frames originally contemplated, the change in our issuance assumptions caused a portion of our Swaps to become ineffective due to an over-hedged position and resulted in us recognizing a loss on hedge ineffectiveness of $3.3 million. The valuation of these derivative instruments is determined using widely accepted valuation techniques including discounted cash flow analysis on the expected cash flows of each derivative. This analysis reflects the contractual terms of the derivatives, including the period to maturity, and uses observable market-based inputs, including interest rate curves, and implied volatilities. We incorporate credit valuation adjustments to appropriately reflect both our nonperformance risk and the respective counterparty’s nonperformance risk in the fair value measurements. Although we have determined that the majority of the inputs used to value our derivatives fall within Level 2 of the fair value hierarchy, the credit valuation adjustments associated with our derivatives utilize Level 3 inputs, such as estimates of current credit spreads, to evaluate the likelihood of default by ourselves and our counterparties.
Equity and Capital
We have issued common and preferred stock from the Parent Company and common and preferred units from the Operating Partnership to fund our capital commitments and to maintain a conservative capital structure as described below.
Equity of the Parent Company
The Series 3, 4, and 5 preferred shares are perpetual, are not convertible into common stock of the Parent Company, and are redeemable at par upon our election beginning five years after the issuance date. None of the terms of the preferred stock contain any unconditional obligations that would require us to redeem the securities at any time or for any purpose and we do not currently anticipate redeeming any preferred stock. Terms and conditions of the three series of preferred stock outstanding as of December 31, 2009 are summarized as follows:
49
Table of Contents
| Series |
Shares Outstanding |
Liquidation Preference |
Distribution Rate |
Callable By Company | ||||||
| Series 3 |
3,000,000 | $ | 75,000,000 | 7.45 | % | 04/03/08 | ||||
| Series 4 |
5,000,000 | 125,000,000 | 7.25 | % | 08/31/09 | |||||
| Series 5 |
3,000,000 | 75,000,000 | 6.70 | % | 08/02/10 | |||||
| 11,000,000 | $ | 275,000,000 | ||||||||
Common Stock
On December 9, 2009, the Parent Company completed a public offering of 8.0 million common shares at $30.75 per share which will result in net proceeds of $235.8, net of issuance costs. These shares are subject to the forward sale agreements described below. This offering also included an over-allotment option of 1.2 million shares which closed simultaneously for proceeds of $35.4 million.
In connection with this offering, the Parent Company entered into forward sale agreements with affiliates of J.P. Morgan and Wells Fargo Securities, as forward purchasers. We intend to use the proceeds upon settlement of the forward sale agreements to refinance debt maturing in 2010, which includes a portion of our pro-rata share of existing debt of MCWR II, as such joint venture debt matures, and for general corporate purposes.
On April 24, 2009, the Parent Company completed a public offering of 10.0 million common shares at $32.50 per share resulting in proceeds of $310.9 million, net of issuance costs. The funds were used to pay-off the $180.0 million Line balance, with the remaining funds retained for future working capital needs including repayment of maturing debt, investments in real estate partnership capital calls to the extent required based on our respective ownership interest in such partnership, and costs to complete in-process development projects.
Treasury Stock
On December 31, 2009, the Parent Company cancelled the 5,661,520 treasury shares outstanding.
Noncontrolling Interests of Preferred Units
We have issued Preferred Units through the Operating Partnership in various amounts since 1998 primarily to institutional investors in private placements. Generally, the Preferred Units may be exchanged by the holders for Cumulative Redeemable Preferred Stock of the Parent Company after a specified date at an exchange rate of one share for one unit. The Preferred Units of the Operating Partnership and the related Preferred Stock of the Parent Company are not convertible into common stock of the Parent Company. At December 31, 2009 and 2008, only the Series D Preferred Units were outstanding with a face value of $50.0 million and a fixed distribution rate of 7.45%. These Units could be called by the Parent Company beginning September 29, 2009, and have no stated maturity or mandatory redemption. Included in the Series D Preferred Units are original issuance costs of approximately $842,000 that will be expensed if they are redeemed in the future.
Noncontrolling Interest of Exchangeable Operating Partnerships Units
As of December 31, 2009 and 2008, the Operating Partnership had 468,211 limited Partnership Units outstanding that were not owned by the Parent Company, representing less than 1% of the outstanding Partnership Units of the Operating Partnership. The redemption value of the limited Partnership Units is based on the closing market price of the Parent Company’s common stock, which was $35.06 and $46.70 per share as of December 31, 2009 and 2008, respectively, an aggregate redemption value of $16.4 million and $21.9 million, respectively.
50
Table of Contents
Noncontrolling Interests of Limited Partners’ Interest in Consolidated Partnerships
Limited partners’ interests in consolidated partnerships not owned by us are classified as noncontrolling interests on the accompanying Consolidated Balance Sheets. Subject to certain conditions and pursuant to the conditions of the agreement, we have the right, but not the obligation, to purchase the other member’s interest or sell our own interest in these consolidated partnerships. At December 31, 2009 and 2008, the noncontrolling interest in these consolidated partnerships was $11.7 million and $8.0 million, respectively.
Capital of the Operating Partnership
Preferred Units
The Series D Preferred Units are owned by institutional investors. At December 31, 2009 and 2008, the face value of the Series D Preferred Units was $50.0 million with a fixed distribution rate of 7.45% and recorded in the accompanying Consolidated Balance Sheets net of original issuance costs of approximately $842,000 that will be expensed if redeemed in the future. See above for further discussion.
Preferred Units of General Partner
The Parent Company, as general partner, owns corresponding Series 3, 4, and 5 preferred unit interests (“Series 3, 4, and 5 Preferred Units”) in the Operating Partnership. See above for further discussion.
General Partner
As of December 31, 2009, the Parent Company, as general partner, owned approximately 99% or 81,539,296 of the total 82,007,507 Partnership Units outstanding.
Limited Partners
As of December 31, 2009 and 2008, the Operating Partnership had 468,211 limited Partnership Units outstanding.
Noncontrolling Interests of Limited Partners’ Interests in Consolidated Partnerships
See above for further discussion.
Critical Accounting Policies and Estimates
Knowledge about our accounting policies is necessary for a complete understanding of our financial statements. The preparation of our financial statements requires that we make certain estimates that impact the balance of assets and liabilities at a financial statement date and the reported amount of income and expenses during a financial reporting period. These accounting estimates are based upon, but not limited to, our judgments about historical results, current economic activity, and industry accounting standards. They are considered to be critical because of their significance to the financial statements and the possibility that future events may differ from those judgments, or that the use of different assumptions could result in materially different estimates. We review these estimates on a periodic basis to ensure reasonableness; however, the amounts we may ultimately realize could differ from such estimates.
Revenue Recognition and Accounts Receivable – Accounts receivable represent revenues recognized in our financial statements, and include base rent, percentage rent, and expense recoveries from tenants for common area maintenance costs, insurance and real estate taxes. We analyze tenant receivables, historical bad debt levels, customer credit-worthiness and current economic trends when
51
Table of Contents
evaluating the adequacy of our allowance for doubtful accounts. Our reported net income (loss) is directly affected by our estimate of the recoverability of accounts receivable.
Recognition of Gains from the Sales of Real Estate – Profits from sales of real estate are not recognized under the full accrual method by us unless a sale is consummated; the buyer’s initial and continuing investment is adequate to demonstrate a commitment to pay for the property; a receivable, if applicable, is not subject to future subordination; we have transferred to the buyer the usual risks and rewards of ownership; and we do not have substantial continuing involvement with the property.
We sell shopping center properties to joint ventures in exchange for cash equal to the fair value of the percentage interest acquired by our partners. We have accounted for those sales as “partial sales” and recognized gains on those partial sales in the period the properties were sold to the extent of the percentage interest sold, and in the case of certain joint venture partnerships, we apply a more restrictive method of recognizing gains, as discussed further below. The gains and operations associated with properties sold to these joint venture partnerships are not classified as discontinued operations because we continue to partially own and manage these shopping centers.
Certain DIK-JVs give either partner the unilateral right to elect to dissolve the joint venture partnership and, upon such an election, receive a distribution in-kind of the assets of the joint venture partnership equal to its respective ownership interests. The liquidation provisions require that all of the properties owned by the joint venture partnership be appraised to determine their respective and collective fair values. As a general rule, if we initiate the liquidation process, our partner has the right to choose the first property that it will receive in liquidation and we have the right to choose the next property that we will receive in liquidation; if our partner initiates the liquidation process, the order of the selection process is reversed. The process then continues with alternating selection of properties by each partner until the balance of each partner’s capital account on a fair value basis has been distributed. After the final selection, to the extent that the fair value of properties in the DIK-JV is not distributable in a manner that equals the balance of each partner’s capital account, a cash payment would be made to the other partner by the partner receiving a fair value in excess of its capital account. The partners may also elect to liquidate some or all of the properties through sales rather than through the DIK process.
We have concluded that these DIK dissolution provisions constitute in-substance call/put options, and represent a form of continuing involvement with respect to property that we sold to these joint venture partnerships, limiting our recognition of gain related to the partial sale. This more restrictive method of gain recognition, the Restricted Gain Method, considers our potential ability to receive property through a DIK on which partial gain has been recognized, and ensures, as discussed below, maximum gain deferral upon sale to a DIK-JV. We have applied the Restricted Gain Method to partial sales of property to joint venture partnerships that contain such unilateral DIK provisions.
Profit shall be recognized by a method determined by the nature and extent of the seller’s continuing involvement and the profit recognized shall be reduced by the maximum exposure to loss. We have concluded that the Restricted Gain Method accomplishes this objective.
Under the Restricted Gain Method, for purposes of gain deferral, we consider the aggregate pool of properties sold into the DIK-JV as well as the aggregate pool of properties which will be distributed in the DIK process. As a result, upon the sale of properties to a DIK-JV, we perform a hypothetical DIK liquidation analysis assuming that we would choose only those properties that we have sold to the DIK-JV in an amount equal to our capital account. For purposes of calculating the gain to be deferred, we assume that the Company will select properties in a DIK liquidation that would otherwise have generated the highest gain to us when originally sold to the DIK-JV and include for such determination the fair value in properties that could be received in excess of the Company’s capital account. The deferred gain to be recorded upon a sale of a property to a DIK-JV is calculated whenever a property is sold to the DIK-JV by us. During the periods when there are no property sales to a DIK-JV, the deferred gain is not recalculated.
Because the contingency associated with the possibility of receiving a particular property back
52
Table of Contents
upon liquidation, which forms the basis of the Restricted Gain Method, is not satisfied at the property level, but at the aggregate level, no gain is recognized on property sold by the DIK-JV to a third party or received by us upon actual dissolution. Instead, the property received upon actual dissolution is recorded at the carrying value of our investment in the DIK-JV on the date of dissolution, reduced by the deferred gain.
Capitalization of Costs – We capitalize the acquisition of land, the construction of buildings and other specifically identifiable development costs incurred by recording them into properties in development in our accompanying Consolidated Balance Sheets. In summary, a project changes from non-operating to operating when it is substantially completed and held available for occupancy. At that time, costs are no longer capitalized. Other development costs include pre-development costs essential to the development of the property, as well as, interest, real estate taxes, and direct employee costs incurred during the development period. Pre-development costs are incurred prior to land acquisition during the due diligence phase and include contract deposits, legal, engineering, and other professional fees related to evaluating the feasibility of developing a shopping center. At December 31, 2009 and 2008, we capitalized pre-development costs of approximately $816,000 and $7.7 million, respectively, of which approximately $325,000 and $2.3 million, respectively, were refundable contract deposits. If we determine that the development of a specific project undergoing due diligence is no longer probable, we immediately expense all related capitalized pre-development costs not considered recoverable. During the years ended December 31, 2009, 2008, and 2007, we expensed pre-development costs of approximately $3.8 million, $15.5 million, and $5.3 million, respectively, recorded in other expenses in the accompanying Consolidated Statements of Operations. Interest costs are capitalized into each development project based on applying our weighted average borrowing rate to that portion of the actual development costs expended. We cease interest cost capitalization when the property is no longer being developed or is available for occupancy upon substantial completion of tenant improvements, but in no event would we capitalize interest on the project beyond 12 months after substantial completion of the building shell. During the years ended December 31, 2009, 2008, and 2007, we capitalized interest of $19.1 million, $36.5 million, and $35.4 million, respectively, on our development projects. We have a staff of employees (the “Investment Group”) who support our development program. All direct internal costs attributable to these development activities are capitalized as part of each development project. During the years ended December 31, 2009, 2008, and 2007, we capitalized $6.5 million, $27.8 million, and $39.0 million, respectively, of direct costs incurred by the Investment Group. The capitalization of costs is directly related to the actual level of development activity occurring. As a result of the current economic downturn, development activity slowed significantly during 2009 resulting in a reduction in capitalized costs and a corresponding increase in general and administrative expenses as non-capitalized Investment Group costs were charged to earnings. During 2009 we significantly reduced our Investment Group staff to adjust to a lower level of development activity expected in the future, as compared to periods prior to 2009. If accounting standards issued in the future were to limit the amount of internal costs that may be capitalized we could incur additional increases in general and administrative expenses which would further reduce net income.
Real Estate Acquisitions – Upon acquisition of operating real estate properties, we estimate the fair value of acquired tangible assets (consisting of land, building and improvements), and identify intangible assets and liabilities (consisting of above- and below-market leases, in-place leases and tenant relationships) and assumed debt. Based on these estimates, we allocate the purchase price to the applicable assets acquired, the liabilities assumed, and any noncontrolling interest in the acquiree. We utilize methods similar to those used by independent appraisers in estimating the fair value of acquired assets and liabilities. We evaluate the useful lives of amortizable intangible assets each reporting period and account for any changes in estimated useful lives over the revised remaining useful life.
Valuation of Real Estate Investments – Our long-lived assets, primarily real estate held for investment, are carried at cost unless circumstances indicate that the carrying value of the assets may not be recoverable. We review long-lived assets for impairment whenever events or changes in circumstances indicate such an evaluation is warranted. If we determine that the carrying amount of a property is not recoverable, we write down the asset to fair value. For properties to be “held and used” for long term investment, we estimate undiscounted future cash flows over the expected investment term
53
Table of Contents
including the estimated future value of the asset upon sale at the end of the investment period. Future value is generally determined by applying a market-based capitalization rate to the estimated future net operating income in the final year of the expected investment term. If after applying this method a property is determined to be impaired, we determine the provision for impairment based upon current market resale values through comparable sales information and other market data if available, or by applying a market capitalization rate to current estimated net operating income. For properties “held for sale”, we estimate current market resale values through appraisal less expected costs to sell. A loss in value of an investment under the equity method of accounting, which is other than a temporary decline, must be recognized in the period in which the loss occurs. In the case of our investments in unconsolidated real estate partnerships, we calculate the present value of our investment by discounting estimated future cash flows over the expected term of the investment. Methods of determining fair value can fluctuate as a result of a number of factors, including changes in the general economy of those markets in which we operate, our estimated holding period of the property, tenant credit quality, and demand for new retail stores. If as a result of a change in our strategy for a specific property which we own directly or through our co-investment partnerships, a property previously classified as held and used is changed to held for sale, or if its estimated holding period changes, such change could cause us to determine that the property is impaired and a provision for impairment in relation to that property would be recorded by us either directly or through a reduction of our equity in income of real estate partnerships.
Discontinued Operations – The application of current accounting principles that govern the classification of any of our properties as held-for-sale on the balance sheet, or the presentation of results of operations and gains on the sale of these properties as discontinued, requires management to make certain significant judgments. We classify an operating property or a property in development as held-for-sale when we determine that the property is available for immediate sale in its present condition, the property is being actively marketed for sale, and management believes it is probable that a sale will be consummated within one year. Given the nature of real estate sales contracts, it is not unusual for such contracts to allow a contractual buyer a due diligence period to evaluate the property with the right to cancel the contract without any financial loss. In addition, certain other matters critical to the final sale, such as financing arrangements often remain pending even upon contract acceptance. As a result, properties under contract may not close within the expected time period, or may not close at all. Therefore, any properties categorized as held-for-sale represent only those properties that management has determined are likely to close within the requirements set forth above. In order to determine if the results of operations and gain on sale should be reflected as discontinued operations, prior to the sale, we evaluate the extent of involvement and significance of cash flows the sale will have with a property after the sale. Any property sold in which we have significant continuing involvement or cash flows (most often sales to co-investment partnerships in which we continue to manage the property) is not considered to be discontinued. In addition, any property which we sell to an unrelated third party, but which we retain a property management function, is not considered discontinued. Therefore, only properties sold, or to be sold, to unrelated third parties, where we will have no significant continuing involvement or significant cash flows are classified as discontinued and its operations, including any mortgage interest and gain on sale, are reported in discontinued operations so that the operations are clearly distinguished. Prior periods are also reclassified to reflect the operations of these properties as discontinued operations. When we sell operating properties to our joint ventures or to third parties, and will have continuing involvement, the operations and gains on sales are included in income from continuing operations. If circumstances arise that previously were considered unlikely and, as a result, we decide not to sell a property previously classified as held for sale, the property is reclassified as held and used and is measured individually at the lower of its (i) carrying amount before the property was classified as held for sale, adjusted for any depreciation and amortization expense that would have been recognized had the property been continuously classified as held and used or (ii) the fair value at the date of the subsequent decision not to sell. Any required adjustment to the carrying amount of the property reclassified as held and used is included in income from continuing operations in the period of the subsequent decision not to sell. If a property is reclassified as held and used, the results of operations of the property previously reported in discontinued operations are reclassified and included in income from continuing operations for all periods presented.
Investments in Real Estate Partnerships – In addition to owning real estate directly, we invest in
54
Table of Contents
real estate through our co-investment partnerships. As asset and property manager, we conduct the business of the Unconsolidated Properties held in the co-investment partnerships in the same way that we conduct the business of the Consolidated Properties that are wholly-owned; therefore, the Critical Accounting Policies as described are also applicable to our investments in the real estate partnerships. We account for all investments in which we do not have a controlling financial ownership interest using the equity method. We have determined that these investments are not variable interest entities and do not require consolidation, and therefore, are subject to the voting interest model in determining our basis of accounting. Decisions, including property acquisitions and dispositions, financings, certain leasing arrangements, annual budgets and dissolution of the joint ventures are subject to the approval of all partners, or in the case of the Fund, its advisory committee.
Income Tax Status – The prevailing assumption underlying the operation of our business is that the Parent Company will continue to operate in order to qualify as a REIT, as defined under the Internal Revenue Code (the “Code”). The Parent Company is required to meet certain income and asset tests on a periodic basis to ensure that it continues to qualify as a REIT. As a REIT, the Parent Company is allowed to reduce taxable income by all or a portion of its distributions to stockholders. We evaluate the transactions that we enter into and determine their impact on our REIT status. Determining our taxable income, calculating distributions, and evaluating transactions requires us to make certain judgments and estimates as to the positions we take in our interpretation of the Code. Because many types of transactions are susceptible to varying interpretations under federal and state income tax laws and regulations, our positions are subject to change at a later date upon final determination by the taxing authorities, however, we reassess such positions at each reporting period.
Recent Accounting Pronouncements
In January 2010, the FASB issued Accounting Standards Update (“ASU”) No. 2010-06, “Fair Value Measurements and Disclosures (820) – Improving Disclosures about Fair Value Measurements” (“ASU 2010-06”). ASU 2010-06 provides amendments to Subtopic 820-10 and requires new disclosures for transfers in and out of Levels 1 and 2 and activity in Level 3 fair value measurements. ASU 2010-06 also clarifies existing disclosure requirements for the level of disaggregation for each class of assets and liabilities and for the inputs and valuation techniques used to measure fair value. ASU 2010-06 is effective for financial statements issued for interim and annual periods ending after December 15, 2009, except for the disclosures about purchases, sales, issuances, and settlements in the roll forward of activity in Level 3 fair value measurements which is effective for fiscal years beginning after December 15, 2010, and for interim periods within those fiscal years. We adopted this ASU on December 31, 2009.
In December 2009, the FASB issued ASU No. 2009-17 “Improvements to Financial Reporting by Enterprises Involved with Variable Interest Entities” (“ASU 2009-17”). ASU 2009-17 was issued to reflect the amendments from Statement 167 “Amendments to FASB Interpretation No. 46(R)” as a revision to FASB Interpretation No. 46 (Revised December 2003), “Consolidation of Variable Interest Entities”. ASU 2009-17 changes how a reporting entity determines when an entity that is insufficiently capitalized or is not controlled through voting (or similar rights) should be consolidated. The determination of whether a reporting entity is required to consolidate another entity is based on, among other things, the other entity’s purpose and design and the reporting entity’s ability to direct the activities of the other entity that most significantly impact the other entity’s economic performance. ASU 2009-17 was effective January 1, 2010 and early application is not permitted. We have evaluated the adoption of this ASU and it will not have an effect on our results of operations or financial position, as we do not currently have any variable interests that we believe would require consolidation.
Results from Operations – 2009 vs. 2008
Comparison of the years ended December 31, 2009 to 2008:
At December 31, 2009, on a Combined Basis, we were operating or developing 400 shopping centers, as compared to 440 shopping centers at December 31, 2008. The decline in properties is related to the liquidation of the assets of MCWR I where the properties were distributed through a DIK to
55
Table of Contents
MCW and Regency, and in which we received six properties.
We identify our shopping centers as either properties in development or operating properties. Properties in development are defined as properties that are in the construction or lease-up process and have not reached their initial full occupancy. A development property becomes an operating property at the earlier to occur of attaining 95% leased and rent paying or four years from the start of site work, regardless of the % leased. At December 31, 2009, on a Combined Basis, we had 40 development properties, as compared to 45 properties at December 31, 2008.
Our revenues decreased by $6.7 million or 1.3% to $489.2 million in 2009, as summarized in the following table (in thousands):
| 2009 | 2008 | Change | ||||||
| Minimum rent |
$ | 345,610 | 334,509 | 11,101 | ||||
| Percentage rent |
3,585 | 4,258 | (673 | ) | ||||
| Recoveries from tenants and other income |
101,748 | 101,096 | 652 | |||||
| Management, transaction, and other fees |
38,289 | 56,032 | (17,743 | ) | ||||
| Total revenues |
$ | 489,232 | 495,895 | (6,663 | ) | |||
Our decline in revenues was related to a one-time transaction fee earned and recognized in 2008, which is more fully described in the table and discussion below. The increase in minimum rent relates primarily to new properties distributed to us as part of the MCWR I DIK liquidation and new rent generated by the development properties. In addition to collecting minimum rent from our tenants, we also collect percentage rent from certain tenants based on their sales volumes, which is lower than 2008 due to previous percentage rent tenants renewing their leases upon expiration and converting their percentage rent to higher base rent. Recoveries from tenants represent reimbursements from tenants for their pro-rata share of the operating, maintenance, and real estate tax expenses that we incur to operate our shopping centers. Recoveries from tenants were higher in 2009 due to increases in our operating expenses, but our recoveries as a percentage of the expenses related only to our operating properties declined to 77.3% from 83.0% in 2008 as a result of a decline in our occupancy percentage and an increase in non-recoverable expenses.
Our operating properties, excluding those in development, on a pro-rata basis were 93.1% leased at December 31, 2009 as compared to 93.8% at the end of 2008. Our renewal rate of expiring leases was 74.7% for the year ended, but rental rates on leases executed during 2009 declined 2.7% as compared to the previous rental rates earned on the same GLA under previous leases. During 2008, our renewal rate was 79.5% and rental rates on leases executed grew by 10.6%. Our lease renewal rates and rental growth rates in 2009 were severely impacted by the recent recession. We anticipate that occupancy levels in our operating properties could fluctuate between 90.0% and 92.5% during 2010 and average rental rates on leases executed in 2010 could decline by 2% to 8%, both of which could result in reduced revenues through 2010.
We earn fees, at market-based rates, for asset management, disposition, property management, leasing, acquisition, and financing services that we provide to our co-investment partnerships and third parties as follows (in thousands):
| 2009 | 2008 | Change | ||||||
| Asset management fees |
$ | 9,671 | 11,673 | (2,002 | ) | |||
| Property management fees |
15,031 | 16,132 | (1,101 | ) | ||||
| Leasing commissions |
4,012 | 2,363 | 1,649 | |||||
| Transaction fees |
9,249 | 25,155 | (15,906 | ) | ||||
| Other third party fees |
326 | 709 | (383 | ) | ||||
| $ | 38,289 | 56,032 | (17,743 | ) | ||||
Asset management fees, which are tied to the value of the real estate we manage in the co-investment partnerships, declined during 2009 due to an overall decline in commercial real estate values
56
Table of Contents
during the past 18 months, and also due to a reduction in the number of joint venture partnership properties we manage as a result of the DIK liquidation of MCWR I. Property management fees, which are calculated based on a percentage of revenues earned in the joint venture partnerships, declined as a result of an 11.6% decline in 2009 joint venture partnership revenues as compared to 2008. Leasing commissions were higher in 2009 as we leased more space in 2009 as compared to 2008, however, tenant moveouts, on a square foot basis outpaced new leasing during 2009 causing a net decline in our occupancy rate. The decrease in transaction fees relates to a $19.7 million Portfolio Incentive Return Fee earned and recognized in 2008 not recurring in 2009. During 2009 we received a $7.8 million disposition fee from MCW in relation to MCW’s partial sale of its investment in MCWR II to GRI.
Our operating expenses increased by $30.3 million or 10.9% to $308.0 million in 2009. The following table summarizes our operating expenses (in thousands):
| 2009 | 2008 | Change | ||||||
| Operating, maintenance and real estate taxes |
$ | 119,884 | 107,652 | 12,232 | ||||
| General and administrative |
54,136 | 49,495 | 4,641 | |||||
| Depreciation and amortization |
116,924 | 104,569 | 12,355 | |||||
| Provision for doubtful accounts |
8,791 | 1,170 | 7,621 | |||||
| Other expenses, net |
8,284 | 14,824 | (6,540 | ) | ||||
| Total operating expenses |
$ | 308,019 | 277,710 | 30,309 | ||||
Increases in operating, maintenance, and real estate taxes along with depreciation and amortization expense are primarily related to the six properties distributed to us as part of the MCWR I DIK liquidation during 2009 not included in the 2008 amounts, $111.3 million of recently completed developments commencing operations in the current year, and general increases in expenses incurred by the operating properties. General and administrative expense is 9.4% higher in 2009 primarily related to $7.5 million in severance and benefit payments associated with two reductions in force completed during 2009, offset by reductions in incentive compensation for not achieving targeted performance levels. During 2009 we increased the allowance for doubtful accounts to reserve for past due amounts reflecting to a significantly higher tenant default rate on rental payments as tenants struggled in a period of much lower consumer spending. The decline in other expenses is due to a reduction in pre-acquisition development costs being written off as a result of much lower new development pursuit activity.
The following table presents the change in interest expense from 2009 to 2008 (in thousands):
| 2009 | 2008 | Change | ||||||||
| Interest on Unsecured credit facilities |
$ | 5,985 | 12,655 | (6,670 | ) | |||||
| Interest on notes payable |
126,083 | 121,335 | 4,748 | |||||||
| Capitalized interest |
(19,062 | ) | (36,510 | ) | 17,448 | |||||
| Interest income |
(3,767 | ) | (4,696 | ) | 929 | |||||
| $ | 109,239 | 92,784 | 16,455 | |||||||
Interest on Unsecured credit facilities decreased by $6.7 million as a result of lower average outstanding balances on our credit facilities in 2009 as compared to 2008. At December 31, 2009, the balance of our Line was zero, we had repaid the term loan portion of our unsecured Term Facility and we completed a partial tender offer of outstanding unsecured debt. Interest on notes payable increased as a result of issuing $106.0 million secured mortgage loans in addition to four mortgage loans assumed as part of the MCWR I DIK liquidation. Capitalized interest declined as in-process developments were completed during 2009 and new development activity declined.
During 2009, we sold 18 out-parcels for net proceeds of $27.8 million and recognized a gain of approximately $219,000, whereas during 2008, we sold 12 out-parcels for net proceeds of $38.2 million and recognized a gain of $1.2 million. During 2009, we also sold eight operating properties to the USAA
57
Table of Contents
partnership for net proceeds of $103.3 million and recognized gains of $19.1 million recorded under the Restricted Gain Method. During 2008, we sold four properties to several joint ventures for net proceeds of $110.5 million and recognized gains of $13.8 million recorded under the Restricted Gain Method.
During the year ended December 31, 2009, we recorded a provision for impairment of $104.4 million, of which $93.7 million related to land held for future development or sale. During 2009, a prospective anchor tenant for several development sites expressed considerable uncertainty about the timing and location of future stores given the continuation of the weak economy and reductions in consumer spending. As a result, we reevaluated and reduced the probability of future development at these sites and accordingly reduced our carrying value in the land parcels to estimated fair value. Included in the impairment loss was a $10.2 million provision related to operating properties that became targeted for sale in the near future, which caused us to re-evaluate and reduce our expected holding periods for these assets and corresponding future cash flows. We also recorded a reserve of $465,000 on a note receivable in default. During the year ended December 31, 2008, we recorded a provision for impairment of $34.9 million of which $7.2 million related to land held for future development or sale, $20.6 million related to operating properties, $1.1 million related to a note receivable in default, and $6.0 related to our investment in real estate partnerships.
Our equity in income (loss) of investments in real estate partnerships decreased by $31.7 million during 2009 as follows (in thousands):
| Ownership | 2009 | 2008 | Change | ||||||||||
| Macquarie CountryWide-Regency (MCWR I) (1) |
— | $ | 1,207 | 488 | 719 | ||||||||
| Macquarie CountryWide Direct (MCWR I) (1) |
— | — | 697 | (697 | ) | ||||||||
| Macquarie CountryWide-Regency II (MCWR II) (2) |
25.00 | % | (28,308 | ) | (672 | ) | (27,636 | ) | |||||
| Macquarie CountryWide-Regency III (MCWR III) |
24.95 | % | 150 | 203 | (53 | ) | |||||||
| Macquarie CountryWide-Regency-DESCO (MCWR-DESCO) |
16.35 | % | (883 | ) | (823 | ) | (60 | ) | |||||
| Columbia Regency Retail Partners (Columbia I) |
20.00 | % | 914 | 2,105 | (1,191 | ) | |||||||
| Columbia Regency Partners II (Columbia II) |
20.00 | % | 28 | 169 | (141 | ) | |||||||
| Cameron Village LLC (Cameron) |
30.00 | % | (436 | ) | (65 | ) | (371 | ) | |||||
| RegCal, LLC (RegCal) |
25.00 | % | 123 | 1,678 | (1,555 | ) | |||||||
| Regency Retail Partners (the Fund) |
20.00 | % | (464 | ) | (233 | ) | (231 | ) | |||||
| US Regency Retail I, LLC (USAA) |
20.01 | % | (6 | ) | — | (6 | ) | ||||||
| Other investments in real estate partnerships |
50.00 | % | 1,302 | 1,745 | (443 | ) | |||||||
| Total |
$ | (26,373 | ) | 5,292 | (31,665 | ) | |||||||
| (1) | At December 31, 2008, the Company’s ownership interest in MCWR I was 25.00%. The liquidation of MCWR I was complete effective December 31, 2009. |
| (2) | At December 31, 2008, the Company’s ownership interest in MCWR II was 24.95%. |
The decrease in our equity in income (loss) of investments in real estate partnerships is primarily related to a provision for impairment of $104.4 million recognized by MCWR II associated with multiple shopping centers that became targeted for sale in the near future. Our pro-rata share of this provision for impairment was $26.1 million. Excluding the impairment, the declines in revenues or losses incurred by our co-investment partnerships were directly related to reductions in operating revenues as occupancy levels declined in 2009 and to increased allowances for doubtful accounts as they also experienced a significantly higher tenant default rate during a difficult economic environment.
Income from discontinued operations was $5.9 million for the year ended December 31, 2009 related to the operations of shopping centers sold or classified as held-for-sale in 2009 and 2008 whereas income from discontinued operations was $22.0 million for the year ended December 31, 2008. Income from discontinued operations for the year ended December 31, 2009 includes gains from the sale of four properties in development for net proceeds of $29.8 million and gains of $5.6 million, one operating
58
Table of Contents
property which was sold for net proceeds of $19.5 million and a gain of approximately $273,000, and the operations of shopping centers sold or classified as held-for-sale in 2009 and 2008. Income from discontinued operations for the year ended December 31, 2008 includes gains from the sale of seven properties in development for net proceeds of $55.3 million and gains of $14.0 million, three operating properties which were sold for net proceeds of $30.9 million and gains of $3.5 million, and the operations of shopping centers sold or classified as held-for-sale in 2009 and 2008. If we sell a property or classify a property as held-for-sale, we are required to reclassify its operations into discontinued operations for all prior periods which results in a reclassification of amounts previously reported as continuing operations into discontinued operations.
Related to our Parent Company’s results, our net loss attributable to common stockholders for the year ended 2009 was $56.4 million, a decrease of $172.9 million as compared with net income of $116.5 million in 2008. The decline in net income was primarily related to the $104.4 million provision for impairment recorded in 2009, our $26.1 million pro-rata share of the provision for impairment recorded by MCWR II, and a reduction in gains from the sale of real estate during 2009 as compared to 2008. Our diluted net loss per share was $0.74 in 2009 as compared to diluted net income per share of $1.66 in 2008.
Related to our Operating Partnership results, our net loss attributable to common unit holders for the year ended 2009 was $56.6 million, a decrease $174.0 million as compared with net income of $117.4 million in 2008 for the same reasons stated above. Our diluted net loss per unit was $0.74 in 2009 as compared to net income per unit of $1.66 in 2008.
Comparison of the years ended December 31, 2008 to 2007:
Our revenues increased by $59.9 million, or 13.7%, to $495.9 million in 2008 as summarized in the following table (in thousands):
| 2008 | 2007 | Change | ||||||
| Minimum rent |
$ | 334,509 | 308,108 | 26,401 | ||||
| Percentage rent |
4,258 | 4,655 | (397 | ) | ||||
| Recoveries from tenants and other income |
101,096 | 90,179 | 10,917 | |||||
| Management, transaction, and other fees |
56,032 | 33,064 | 22,968 | |||||
| Total revenues |
$ | 495,895 | 436,006 | 59,889 | ||||
The increase in revenues was primarily related to higher minimum rent from (i) growth in rental rates from the renewal of expiring leases or re-leasing vacant space in the operating properties, (ii) minimum rent generated from shopping center acquisitions in 2007, and (iii) recently completed shopping center developments commencing operations in the current year. Recoveries increased as a result of an increase in our operating expenses. The increase in management, transaction, and other fees is primarily related to the recognition of a $19.7 million Portfolio Incentive Return fee in December 2008. The fee was earned based upon Columbia outperforming the NCREIF index since the inception of the partnership and a hurdle rate outlined in the partnership agreement.
Fees earned for asset management, disposition, property management, leasing, acquisition, and financing services from our co-investment partnerships and third parties are summarized as follows (in thousands):
59
Table of Contents
| 2008 | 2007 | Change | ||||||
| Asset management fees |
$ | 11,673 | 11,021 | 652 | ||||
| Property management fees |
16,132 | 13,865 | 2,267 | |||||
| Leasing commissions |
2,363 | 2,319 | 44 | |||||
| Transaction fees |
25,155 | 5,055 | 20,100 | |||||
| Other third party fees |
709 | 804 | (95 | ) | ||||
| $ | 56,032 | 33,064 | 22,968 | |||||
The increase in transaction fees of $20.1 million is related to the $19.7 million Portfolio Incentive Return fee discussed above. Asset and property management fees increased during 2008 as a result of providing those management services to MCWR-DESCO for the entire year during 2008 as compared to only a portion of 2007 when MCWR-DESCO was formed.
Our operating expenses increased by $29.8 million, or 12.0%, to $277.7 million in 2008 as summarized in the following table (in thousands):
| 2008 | 2007 | Change | ||||||
| Operating, maintenance and real estate taxes |
$ | 107,652 | 97,910 | 9,742 | ||||
| General and administrative |
49,495 | 50,580 | (1,085 | ) | ||||
| Depreciation and amortization |
104,569 | 89,365 | 15,204 | |||||
| Provision for doubtful accounts |
1,170 | — | 1,170 | |||||
| Other expenses, net |
14,824 | 10,057 | 4,767 | |||||
| Total operating expenses |
$ | 277,710 | 247,912 | 29,798 | ||||
The increase in operating, maintenance, and real estate taxes was primarily due to new properties acquired during 2007 operating for the entire year during 2008, recently completed developments commencing operations during 2007, and to general increases in expenses incurred by the operating properties. On average, approximately 79% of these costs are recovered from our tenants through recoveries included in our revenues. General and administrative expense declined as a result of reducing incentive compensation directly tied to performance targets associated with reductions in new development and reduced earning metrics, both of which were directly impacted by the economic downturn during 2008. During 2008, we also recorded restructuring charges of $2.4 million for employee severance and benefits related to employee reductions in force. The increase in depreciation and amortization expense is primarily related to acquisitions in 2007 operating for a full year in 2008 and recently completed developments commencing operations in the current year. The increase in other expenses is related to expensing more pre-development costs in 2008 than in 2007 directly related to a slowing development program due to the current economic environment.
The following table presents the change in interest expense from 2008 to 2007 (in thousands):
| 2008 | 2007 | Change | ||||||||
| Interest on Unsecured credit facilities |
$ | 12,655 | 10,117 | 2,538 | ||||||
| Interest on notes payable |
121,335 | 110,775 | 10,560 | |||||||
| Capitalized interest |
(36,510 | ) | (35,424 | ) | (1,086 | ) | ||||
| Interest income |
(4,696 | ) | (3,079 | ) | (1,617 | ) | ||||
| $ | 92,784 | 82,389 | 10,395 | |||||||
Interest on Unsecured credit facilities increased during 2008 by $2.5 million due to the increase in the outstanding balance under the Unsecured credit facilities. Interest expense on notes payable increased during 2008 by $10.6 million due to higher outstanding debt balances including the issuance of $400.0 million of unsecured debt in September 2007, the acquisition of shopping centers in 2007, and the mortgage debt placed on a consolidated joint venture in 2008. The higher development project costs also
60
Table of Contents
resulted in an increase in capitalized interest.
Gains on sale of real estate included in continuing operations were $20.3 million in 2008 as compared to $52.2 million in 2007. Included in 2008 gains are a $5.3 million gain from the sale of 12 out-parcels for net proceeds of $38.2 million, a $1.2 million gain recognized on two out-parcels originally deferred at the time of sale, and a $13.8 million gain (net of the greater of our ownership interest or the gain deferral under the Restricted Gain Method described in our Critical Accounting Policies) from the sale of four properties in development to joint ventures for net proceeds of $110.5 million. Included in 2007 gains are a $7.2 million gain from the sale of 27 out-parcels for net proceeds of $55.9 million, a $40.9 million gain from the sale of five properties in development to the Fund for net proceeds of $102.8 million, a $2.2 million gain related to the partial sale of our interest in the Fund, and a $1.9 million gain from our share of a contractual earn out payment related to a property previously sold to a joint venture. There were no property sales to DIK-JV’s in 2007.
During 2008, we established a provision for impairment of approximately $34.9 million, $3.4 million of which was reclassed to discontinued operations when the property was sold in 2009. Included in the provision is $27.8 million for estimated impairment losses on eight operating properties, one large parcel of land held for future development, along with several smaller land out-parcels; $6.0 million on two of our investments in real estate partnerships; and $1.1 million related to a note receivable.
Our equity in income (loss) of investments in real estate partnerships decreased by $12.8 million during 2008 as follows (in thousands):
| Ownership | 2008 | 2007 | Change | ||||||||||
| Macquarie CountryWide-Regency (MCWR I) |
25.00 | % | $ | 488 | 9,871 | (9,383 | ) | ||||||
| Macquarie CountryWide Direct (MCWR I) |
25.00 | % | 697 | 457 | 240 | ||||||||
| Macquarie CountryWide-Regency II (MCWR II) |
24.95 | % | (672 | ) | (3,236 | ) | 2,564 | ||||||
| Macquarie CountryWide-Regency III (MCWR III) |
24.95 | % | 203 | 67 | 136 | ||||||||
| Macquarie CountryWide-Regency-DESCO (MCWR-DESCO) |
16.35 | % | (823 | ) | (465 | ) | (358 | ) | |||||
| Columbia Regency Retail Partners (Columbia I) |
20.00 | % | 2,105 | 2,440 | (335 | ) | |||||||
| Columbia Regency Partners II (Columbia II) |
20.00 | % | 169 | 189 | (20 | ) | |||||||
| Cameron Village LLC (Cameron) |
30.00 | % | (65 | ) | (74 | ) | 9 | ||||||
| RegCal, LLC (RegCal) |
25.00 | % | 1,678 | 662 | 1,016 | ||||||||
| Regency Retail Partners (the Fund) |
20.00 | % | (233 | ) | 326 | (559 | ) | ||||||
| Other investments in real estate partnerships |
50.00 | % | 1,745 | 7,856 | (6,111 | ) | |||||||
| Total |
$ | 5,292 | 18,093 | (12,801 | ) | ||||||||
The decrease in our equity in income (loss) of investments in real estate partnerships is primarily related to higher gains recorded in 2007 from the sale of shopping centers sold by MCWR I, as well as, the sale of a shopping center owned by a joint venture classified above in other investments in real estate partnerships.
Income from discontinued operations was $22.0 million for the year ended December 31, 2008 related to the sale of seven properties in development and three operating properties sold to unrelated parties for net proceeds of $86.2 million, including the operations of shopping centers sold or classified as held-for-sale in 2008. Income from discontinued operations was $34.0 million for the year ended December 31, 2007 related to the sale of four properties in development and three operating properties to unrelated parties for net proceeds of $112.3 million and including the operations of shopping centers sold or classified as held-for-sale in 2008 and 2007. In compliance with Statement 144, if we sell a property or classify a property as held-for-sale, we are required to reclassify its operations into discontinued operations for all prior periods which results in a reclassification of amounts previously reported as continuing operations into discontinued operations. Our income from discontinued operations is shown net of income taxes of $2.0 million for the year ended December 31, 2007.
61
Table of Contents
Related to our Parent Company’s results, net income attributable to common stockholders for the year ended decreased $67.5 million to $116.5 million in 2008 as compared with $184.0 million in 2007 primarily related to lower gains recognized from the sale of real estate and the provision for impairment recorded in 2008 as discussed previously. Diluted earnings per share was $1.66 in 2008 as compared to $2.65 in 2007.
Related to our Operating Partnership’s results, net income attributable to common unit holders for the year ended decreased $68.2 million to $117.4 million in 2008 as compared with $185.6 million in 2007 for the reasons stated above. Diluted earnings per unit was $1.66 in 2008 as compared to $2.65 in 2007.
Environmental Matters
We are subject to numerous environmental laws and regulations as they apply to our shopping centers pertaining to chemicals used by the dry cleaning industry, the existence of asbestos in older shopping centers, and underground petroleum storage tanks. We believe that the tenants who currently operate dry cleaning plants or gas stations do so in accordance with current laws and regulations. Generally, we use all legal means to cause tenants to remove dry cleaning plants from our shopping centers or convert them to non-chlorinated solvent systems. Where available, we have applied and been accepted into state-sponsored environmental programs. We have a blanket environmental insurance policy that covers us against third-party liabilities and remediation costs on shopping centers that currently have no known environmental contamination. We have also placed environmental insurance, where possible, on specific properties with known contamination, in order to mitigate our environmental risk. We monitor the shopping centers containing environmental issues and in certain cases voluntarily remediate the sites. We also have legal obligations to remediate certain sites and we are in the process of doing so. We estimate the cost associated with these legal obligations to be approximately $3.2 million, all of which has been reserved. We believe that the ultimate disposition of currently known environmental matters will not have a material effect on our financial position, liquidity, or operations; however, we can give no assurance that existing environmental studies on our shopping centers have revealed all potential environmental liabilities; that any previous owner, occupant or tenant did not create any material environmental condition not known to us; that the current environmental condition of the shopping centers will not be affected by tenants and occupants, by the condition of nearby properties, or by unrelated third parties; or that changes in applicable environmental laws and regulations or their interpretation will not result in additional environmental liability to us.
Inflation/Deflation
Inflation has been historically low and has had a minimal impact on the operating performance of our shopping centers; however, more recent data suggests inflation will eventually become a greater concern as the economy begins to recover from the recent recession. Substantially all of our long-term leases contain provisions designed to mitigate the adverse impact of inflation. Such provisions include clauses enabling us to receive percentage rent based on tenants’ gross sales, which generally increase as prices rise; and/or escalation clauses, which generally increase rental rates during the terms of the leases. Such escalation clauses are often related to increases in the consumer price index or similar inflation indices. In addition, many of our leases are for terms of less than ten years, which permits us to seek increased rents upon re-rental at market rates. Most of our leases require tenants to pay their pro-rata share of operating expenses, including common-area maintenance, real estate taxes, insurance and utilities, thereby reducing our exposure to increases in costs and operating expenses resulting from inflation. However, during deflationary periods or periods of economic weakness, minimum rents and percentage rents will decline as the supply of available retail space exceeds demand and consumer spending declines. Occupancy declines resulting from a weak economic period will also likely result in lower recovery rates of our operating expenses.
62
Table of Contents
| Item 7A. | Quantitative and Qualitative Disclosures about Market Risk |
Market Risk
We are exposed to two significant components of interest rate risk. Our Line commitment has a variable interest rate that is based upon LIBOR plus a spread of 55 basis points and our revolving credit facility has a variable interest rate based upon LIBOR plus a spread of 100 basis points. LIBOR rates charged on our Unsecured credit facilities change monthly. The spread on the Unsecured credit facilities is dependent upon maintaining specific credit ratings. If our credit ratings are downgraded, the spread on the Unsecured credit facilities would increase, resulting in higher interest costs. We are also exposed to higher interest rates when we refinance our existing long-term fixed rate debt. The objective of our interest rate risk management is to limit the impact of interest rate changes on earnings and cash flows and to lower our overall borrowing costs. To achieve these objectives, we borrow primarily at fixed interest rates and may enter into derivative financial instruments such as interest rate swaps, caps, or treasury locks in order to mitigate our interest rate risk on a related financial instrument. We do not enter into derivative or interest rate transactions for speculative purposes.
We have $375.2 million of fixed rate debt maturing in 2010 and 2011 that has a weighted average fixed interest rate of 7.95%, which includes $334.0 million of unsecured long-term debt. During 2006 we entered into four forward-starting interest rate swaps (the “Swaps”) totaling $396.7 million with fixed rates of 5.399%, 5.415%, 5.399%, and 5.415%. We designated these Swaps as cash flow hedges to lock in the underlying treasury rates on $334.0 million of the financing expected to occur in 2010 and 2011. As a result of a decline in 10 year Treasury interest rates since the inception of the Swaps, the fair value of the Swaps as of December 31, 2009 is reflected as a liability of $28.4 million in accompanying consolidated balance sheet. It remains highly probable that the forecasted transactions will occur as projected at the inception of the Swaps and therefore, the change in fair value of the Swaps is reflected in accumulated other comprehensive income (loss) in the accompanying consolidated financial statements. If we were to no longer expect to issue debt as originally forecasted, we would be required to immediately expense the change in fair value of the Swaps to net income including all future changes until settled. During the year ended December 31, 2009, we had $3.3 million of hedge ineffectiveness recognized in earnings attributable to our revised assumptions of future debt issues. To the extent that future 10-year Treasury rates (at the future settlement dates) are higher than current rates, this liability will decline. If a liability exists at the dates the Swaps are settled, the liability will be amortized over the term of the respective debt issuances as additional interest expense in addition to the stated interest rates on the new debt. On April 16, 2009, we paid $20.0 million to settle and partially settle $106.0 million of our $396.7 million of interest rate swaps in place to hedge forecasted debt. On July 1, 2009, we closed on mortgage loans of $106.0 million secured by eight properties with an interest rate of 7.75% and a 10-year term. For $90.7 million of the remaining Swaps, we continue to expect to issue new secured or unsecured debt for a term of 7 to 12 years prior to July 1, 2010. For $200.0 million of the remaining Swaps, we continue to expect to issue new debt for a term of 7 to 12 years during the period between March 31, 2010 and March 31, 2011. We continuously monitor the capital markets and evaluate our ability to issue new debt to repay maturing debt or fund our commitments. Based upon the current capital markets, our current credit ratings, and the number of high quality, unencumbered properties that we own which could collateralize borrowings, we expect that we will be able to successfully issue new secured or unsecured debt to fund our obligations. An increase of 1.0% in the interest rate of new debt issued, above that of maturing debt, would result in additional annual interest expense of $3.3 million subject to the impact of the annual amortization that would be incurred as a result of settling the Swaps.
Our interest rate risk is monitored using a variety of techniques. The table below presents the principal cash flows (in thousands), weighted average interest rates of remaining debt, and the fair value of total debt (in thousands) as of December 31, 2009, by year of expected maturity to evaluate the expected cash flows and sensitivity to interest rate changes. Although the average interest rate for variable rate debt is included in the table, those rates represent rates that existed at December 31, 2009 and are subject to change on a monthly basis.
63
Table of Contents
The table incorporates only those exposures that exist as of December 31, 2009 and does not consider exposures or positions that could arise after that date. Since firm commitments are not presented, the table has limited predictive value. As a result, our ultimate realized gain or loss with respect to interest rate fluctuations will depend on the exposures that arise during the period, our hedging strategies at that time, and actual interest rates.
| 2010 | 2011 | 2012 | 2013 | 2014 | Thereafter | Total | Fair Value | ||||||||||||||||
| Fixed rate debt |
$ | 173,766 | 209,395 | 254,901 | 21,123 | 166,296 | 1,058,133 | 1,883,614 | 1,433,836 | ||||||||||||||
| Average interest rate forall fixed rate debt (a) |
6.19 | % | 5.96 | % | 5.80 | % | 5.78 | % | 5.90 | % | 6.26 | % | — | — | |||||||||
| Variable rate LIBOR debt |
$ | 204 | 1,196 | 204 | 204 | 3,788 | — | 5,596 | 4,573 | ||||||||||||||
| Average interest rate forall variable rate debt (a) |
5.33 | % | 5.80 | % | 5.80 | % | 5.80 | % | — | — | — | — | |||||||||||
| (a) | Average interest rates at the end of each year presented. |
The fair value of total debt in the table above is $1.4 billion versus the face value of $1.9 billion, which suggests that as new debt is issued in the future to repay maturing debt, the cost of new debt issuances will be higher than the current cost of existing debt.
64
Table of Contents
| Item 8. | Consolidated Financial Statements and Supplementary Data |
Regency Centers Corporation and Regency Centers, L.P.
Index to Financial Statements
| 66 | ||
| Regency Centers Corporation: |
||
| Consolidated Balance Sheets as of December 31, 2009 and 2008 |
70 | |
| Consolidated Statements of Operations for the years ended |
71 | |
| 72 | ||
| Consolidated Statements of Cash Flows for the years ended |
73 | |
| Regency Centers, L.P.: |
||
| Consolidated Balance Sheets as of December 31, 2009 and 2008 |
75 | |
| Consolidated Statements of Operations for the years ended |
76 | |
| 77 | ||
| Consolidated Statements of Cash Flows for the years ended |
78 | |
| 80 | ||
| Financial Statement Schedule |
||
| Schedule III – Combined Real Estate and Accumulated Depreciation – |
123 | |
All other schedules are omitted because of the absence of conditions under which they are required, materiality or because information required therein is shown in the consolidated financial statements or notes thereto.
65
Table of Contents
Report of Independent Registered Public Accounting Firm
The Board of Directors and Stockholders
Regency Centers Corporation:
We have audited the accompanying consolidated balance sheets of Regency Centers Corporation and subsidiaries (the Company) as of December 31, 2009 and 2008, and the related consolidated statements of operations, equity and comprehensive income (loss), and cash flows for each of the years in the three-year period ended December 31, 2009. In connection with our audits of the consolidated financial statements, we also have audited financial statement Schedule III. These consolidated financial statements and financial statement schedule are the responsibility of the Company’s management. Our responsibility is to express an opinion on these consolidated financial statements and financial statement schedule based on our audits.
We conducted our audits in accordance with the standards of the Public Company Accounting Oversight Board (United States). Those standards require that we plan and perform the audit to obtain reasonable assurance about whether the financial statements are free of material misstatement. An audit includes examining, on a test basis, evidence supporting the amounts and disclosures in the financial statements. An audit also includes assessing the accounting principles used and significant estimates made by management, as well as evaluating the overall financial statement presentation. We believe that our audits provide a reasonable basis for our opinion.
In our opinion, the consolidated financial statements referred to above present fairly, in all material respects, the financial position of Regency Centers Corporation and subsidiaries as of December 31, 2009 and 2008, and the results of their operations and their cash flows for each of the years in the three-year period ended December 31, 2009, in conformity with U.S. generally accepted accounting principles. Also in our opinion, the related financial statement schedule, when considered in relation to the basic consolidated financial statements taken as a whole, presents fairly, in all material respects, the information set forth therein.
As discussed in note 1 to the consolidated financial statements, in 2009 the Company retrospectively changed its method of accounting for noncontrolling interests due to the adoption of new accounting requirements.
We also have audited, in accordance with the standards of the Public Company Accounting Oversight Board (United States), Regency Centers Corporation’s internal control over financial reporting as of December 31, 2009, based on criteria established in Internal Control – Integrated Framework issued by the Committee of Sponsoring Organizations of the Treadway Commission (COSO), and our report dated February 26, 2010 expressed an unqualified opinion on the effectiveness of the Company’s internal control over financial reporting.
February 26, 2010
Jacksonville, Florida
Certified Public Accountants
66
Table of Contents
Report of Independent Registered Public Accounting Firm
The Board of Directors and Stockholders
Regency Centers Corporation:
We have audited Regency Centers Corporation’s (the Company’s) internal control over financial reporting as of December 31, 2009, based on criteria established in Internal Control – Integrated Framework issued by the Committee of Sponsoring Organizations of the Treadway Commission (COSO). Regency Centers Corporation’s management is responsible for maintaining effective internal control over financial reporting and for its assessment of the effectiveness of internal control over financial reporting, included in the accompanying Management’s Report on Internal Control Over Financial Reporting. Our responsibility is to express an opinion on the Company’s internal control over financial reporting based on our audit.
We conducted our audit in accordance with the standards of the Public Company Accounting Oversight Board (United States). Those standards require that we plan and perform the audit to obtain reasonable assurance about whether effective internal control over financial reporting was maintained in all material respects. Our audit included obtaining an understanding of internal control over financial reporting, evaluating management’s assessment, testing and evaluating the design and operating effectiveness of internal control, and performing such other procedures as we considered necessary in the circumstances. We believe that our audit provides a reasonable basis for our opinion.
A company’s internal control over financial reporting is a process designed to provide reasonable assurance regarding the reliability of financial reporting and the preparation of financial statements for external purposes in accordance with generally accepted accounting principles. A company’s internal control over financial reporting includes those policies and procedures that (1) pertain to the maintenance of records that, in reasonable detail, accurately and fairly reflect the transactions and dispositions of the assets of the company; (2) provide reasonable assurance that transactions are recorded as necessary to permit preparation of financial statements in accordance with generally accepted accounting principles, and that receipts and expenditures of the company are being made only in accordance with authorizations of management and directors of the company; and (3) provide reasonable assurance regarding prevention or timely detection of unauthorized acquisition, use, or disposition of the company’s assets that could have a material effect on the financial statements.
Because of its inherent limitations, internal control over financial reporting may not prevent or detect misstatements. Also, projections of any evaluation of effectiveness to future periods are subject to the risk that controls may become inadequate because of changes in conditions, or that the degree of compliance with the policies or procedures may deteriorate.
In our opinion, Regency Centers Corporation maintained, in all material respects, effective internal control over financial reporting as of December 31, 2009, based on criteria established in Internal Control—Integrated Framework issued by the Committee of Sponsoring Organizations of the Treadway Commission (COSO) .
We also have audited, in accordance with the standards of the Public Company Accounting Oversight Board (United States), the consolidated balance sheets of Regency Centers Corporation and subsidiaries as of December 31, 2009 and 2008, and the related consolidated statements of operations, equity and comprehensive income (loss), and cash flows for each of the years in the three-year period ended December 31, 2009 and the related financial statement schedule, and our report dated February 26, 2010 expressed an unqualified opinion on those consolidated financial statements and the related financial statement schedule.
February 26, 2010
Jacksonville, Florida
Certified Public Accountants
67
Table of Contents
Report of Independent Registered Public Accounting Firm
The Unit holders of Regency Centers, L.P. and
the Board of Directors and Stockholders of
Regency Centers Corporation:
We have audited the accompanying consolidated balance sheets of Regency Centers, L.P. and subsidiaries (the Partnership) as of December 31, 2009 and 2008, and the related consolidated statements of operations, changes in capital and comprehensive income (loss), and cash flows for each of the years in the three-year period ended December 31, 2009. In connection with our audits of the consolidated financial statements, we also have audited financial statement Schedule III. These consolidated financial statements and financial statement schedule are the responsibility of the Partnership’s management. Our responsibility is to express an opinion on these consolidated financial statements and financial statement schedule based on our audits.
We conducted our audits in accordance with the standards of the Public Company Accounting Oversight Board (United States). Those standards require that we plan and perform the audit to obtain reasonable assurance about whether the financial statements are free of material misstatement. An audit includes examining, on a test basis, evidence supporting the amounts and disclosures in the financial statements. An audit also includes assessing the accounting principles used and significant estimates made by management, as well as evaluating the overall financial statement presentation. We believe that our audits provide a reasonable basis for our opinion.
In our opinion, the consolidated financial statements referred to above present fairly, in all material respects, the financial position of Regency Centers, L.P. and subsidiaries as of December 31, 2009 and 2008, and the results of their operations and their cash flows for each of the years in the three-year period ended December 31, 2009, in conformity with U.S. generally accepted accounting principles. Also in our opinion, the related financial statement schedule, when considered in relation to the basic consolidated financial statements taken as a whole, presents fairly, in all material respects, the information set forth therein.
As discussed in note 1 to the consolidated financial statements, in 2009 the Company retrospectively changed its method of accounting for noncontrolling interests due to the adoption of new accounting requirements.
We also have audited, in accordance with the standards of the Public Company Accounting Oversight Board (United States), Regency Centers, L.P.’s internal control over financial reporting as of December 31, 2009, based on criteria established in Internal Control – Integrated Framework issued by the Committee of Sponsoring Organizations of the Treadway Commission (COSO), and our report dated February 26, 2010 expressed an unqualified opinion on the effectiveness of the Partnership’s internal control over financial reporting.
February 26, 2010
Jacksonville, Florida
Certified Public Accountants
68
Table of Contents
Report of Independent Registered Public Accounting Firm
The Unit holders of Regency Centers, L.P. and
the Board of Directors and Stockholders of
Regency Centers Corporation:
We have audited Regency Centers, L.P.’s (the Partnership’s) internal control over financial reporting as of December 31, 2009, based on criteria established in Internal Control – Integrated Framework issued by the Committee of Sponsoring Organizations of the Treadway Commission (COSO). Regency Centers, L.P.’s management is responsible for maintaining effective internal control over financial reporting and for its assessment of the effectiveness of internal control over financial reporting, included in the accompanying Management’s Report on Internal Control Over Financial Reporting. Our responsibility is to express an opinion on the Partnership’s internal control over financial reporting based on our audit.
We conducted our audit in accordance with the standards of the Public Company Accounting Oversight Board (United States). Those standards require that we plan and perform the audit to obtain reasonable assurance about whether effective internal control over financial reporting was maintained in all material respects. Our audit included obtaining an understanding of internal control over financial reporting, evaluating management’s assessment, testing and evaluating the design and operating effectiveness of internal control, and performing such other procedures as we considered necessary in the circumstances. We believe that our audit provides a reasonable basis for our opinion.
A company’s internal control over financial reporting is a process designed to provide reasonable assurance regarding the reliability of financial reporting and the preparation of financial statements for external purposes in accordance with generally accepted accounting principles. A company’s internal control over financial reporting includes those policies and procedures that (1) pertain to the maintenance of records that, in reasonable detail, accurately and fairly reflect the transactions and dispositions of the assets of the company; (2) provide reasonable assurance that transactions are recorded as necessary to permit preparation of financial statements in accordance with generally accepted accounting principles, and that receipts and expenditures of the company are being made only in accordance with authorizations of management and directors of the company; and (3) provide reasonable assurance regarding prevention or timely detection of unauthorized acquisition, use, or disposition of the company’s assets that could have a material effect on the financial statements.
Because of its inherent limitations, internal control over financial reporting may not prevent or detect misstatements. Also, projections of any evaluation of effectiveness to future periods are subject to the risk that controls may become inadequate because of changes in conditions, or that the degree of compliance with the policies or procedures may deteriorate.
In our opinion, Regency Centers, L.P. maintained, in all material respects, effective internal control over financial reporting as of December 31, 2009, based on criteria established in Internal Control—Integrated Framework issued by the Committee of Sponsoring Organizations of the Treadway Commission (COSO) .
We also have audited, in accordance with the standards of the Public Company Accounting Oversight Board (United States), the consolidated balance sheets of Regency Centers, L.P. and subsidiaries as of December 31, 2009 and 2008, and the related consolidated statements of operations, changes in capital and comprehensive income (loss), and cash flows for each of the years in the three-year period ended December 31, 2009 and the related financial statement schedule, and our report dated February 26, 2010 expressed an unqualified opinion on those consolidated financial statements and the related financial statement schedule.
February 26, 2010
Jacksonville, Florida
Certified Public Accountants
69
Table of Contents
Consolidated Balance Sheets
December 31, 2009 and 2008
(in thousands, except share data)
| 2009 | 2008 | ||||||
| Assets |
|||||||
| Real estate investments at cost (notes 2, 3, 4, and 14): |
|||||||
| Land |
$ | 975,861 | 923,062 | ||||
| Buildings and improvements |
2,017,843 | 1,974,093 | |||||
| Properties in development |
920,427 | 1,078,885 | |||||
| 3,914,131 | 3,976,040 | ||||||
| Less: accumulated depreciation |
622,163 | 554,595 | |||||
| 3,291,968 | 3,421,445 | ||||||
| Operating properties held for sale, net |
19,647 | 66,447 | |||||
| Investments in real estate partnerships |
326,212 | 383,408 | |||||
| Net real estate investments |
3,637,827 | 3,871,300 | |||||
| Cash and cash equivalents |
99,477 | 21,533 | |||||
| Notes receivable (note 5) |
37,753 | 31,438 | |||||
| Accounts receivable, net of allowance for doubtful accounts of $6,567 and $1,837 at December 31, 2009 and 2008, respectively |
40,871 | 46,501 | |||||
| Straight line rent receivable, net of reserve of $1,899 at December 31, 2009 |
39,292 | 37,595 | |||||
| Other receivables (note 4) |
— | 19,700 | |||||
| Deferred costs, less accumulated amortization of $58,861 and $51,549 at December 31, 2009 and 2008, respectively |
58,376 | 57,477 | |||||
| Acquired lease intangible assets, less accumulated amortization of $11,632 and $11,204 at December 31, 2009 and 2008, respectively (note 6) |
10,007 | 12,903 | |||||
| Other assets |
50,203 | 43,928 | |||||
| Total assets |
$ | 3,973,806 | 4,142,375 | ||||
| Liabilities and Equity |
|||||||
| Liabilities: |
|||||||
| Notes payable (note 8) |
$ | 1,886,380 | 1,837,904 | ||||
| Unsecured credit facilities (note 8) |
— | 297,667 | |||||
| Accounts payable and other liabilities |
99,145 | 141,395 | |||||
| Derivative instruments, at fair value (note 9) |
28,363 | 83,691 | |||||
| Acquired lease intangible liabilities, less accumulated accretion of $9,715 and $8,829 at December 31, 2009 and 2008, respectively (note 6) |
5,896 | 7,865 | |||||
| Tenants’ security and escrow deposits |
10,628 | 11,571 | |||||
| Total liabilities |
2,030,412 | 2,380,093 | |||||
| Commitments and contingencies (notes 14 and 15) |
|||||||
| Equity: |
|||||||
| Stockholders’ equity (notes 9, 11, 12, and 13): |
|||||||
| Preferred stock, $.01 par value per share, 30,000,000 shares authorized; 11,000,000 Series 3-5 shares issued and outstanding at December 31, 2009 and 2008 with liquidation preferences of $25 per share |
275,000 | 275,000 | |||||
| Common stock $.01 par value per share, 150,000,000 shares authorized; 81,539,296 and 75,634,881 shares issued at December 31, 2009 and 2008, respectively |
815 | 756 | |||||
| Treasury stock at cost, 5,598,211 shares held at December 31, 2008 |
— | (111,414 | ) | ||||
| Additional paid in capital |
2,022,670 | 1,778,265 | |||||
| Accumulated other comprehensive income (loss) |
(49,973 | ) | (90,689 | ) | |||
| Distributions in excess of net income |
(373,345 | ) | (155,057 | ) | |||
| Total stockholders’ equity |
1,875,167 | 1,696,861 | |||||
| Noncontrolling interests: |
|||||||
| Series D preferred units, aggregate redemption value of $50,000 at December 31, 2009 and 2008 |
49,158 | 49,158 | |||||
| Exchangeable operating partnership units, aggregate redemption value of $16,415 and $21,865 at December 31, 2009 and 2008, respectively (note 10) |
7,321 | 8,283 | |||||
| Limited partners’ interest in consolidated partnerships |
11,748 | 7,980 | |||||
| Total noncontrolling interests |
68,227 | 65,421 | |||||
| Total equity |
1,943,394 | 1,762,282 | |||||
| Total liabilities and equity |
$ | 3,973,806 | 4,142,375 | ||||
See accompanying notes to consolidated financial statements.
70
Table of Contents
Consolidated Statements of Operations
For the years ended December 31, 2009, 2008 and 2007
(in thousands, except per share data)
| 2009 | 2008 | 2007 | ||||||||
| Revenues: |
||||||||||
| Minimum rent (note 14) |
$ | 345,610 | 334,509 | 308,108 | ||||||
| Percentage rent |
3,585 | 4,258 | 4,655 | |||||||
| Recoveries from tenants and other income |
101,748 | 101,096 | 90,179 | |||||||
| Management, transaction, and other fees |
38,289 | 56,032 | 33,064 | |||||||
| Total revenues |
489,232 | 495,895 | 436,006 | |||||||
| Operating expenses: |
||||||||||
| Depreciation and amortization |
116,924 | 104,569 | 89,365 | |||||||
| Operating and maintenance |
66,061 | 59,140 | 54,095 | |||||||
| General and administrative |
54,136 | 49,495 | 50,580 | |||||||
| Real estate taxes |
53,823 | 48,512 | 43,815 | |||||||
| Provision for doubtful accounts |
8,791 | 1,170 | — | |||||||
| Other expenses |
8,284 | 14,824 | 10,057 | |||||||
| Total operating expenses |
308,019 | 277,710 | 247,912 | |||||||
| Other expense (income): |
||||||||||
| Interest expense, net of interest income of $3,767, $4,696 and $3,079 in 2009, 2008 and 2007, respectively |
109,239 | 92,784 | 82,389 | |||||||
| Gain on sale of operating properties and properties in development |
(19,357 | ) | (20,346 | ) | (52,215 | ) | ||||
| Provision for impairment |
97,519 | 31,469 | — | |||||||
| Early extinguishment of debt |
2,784 | — | — | |||||||
| Loss on derivative instruments (note 9) |
3,294 | — | — | |||||||
| Total other expense (income) |
193,479 | 103,907 | 30,174 | |||||||
| Income (loss) before equity in income (loss) of investments in real estate partnerships |
(12,266 | ) | 114,278 | 157,920 | ||||||
| Equity in income (loss) of investments in real estate partnerships (note 4) |
(26,373 | ) | 5,292 | 18,093 | ||||||
| Income (loss) from continuing operations |
(38,639 | ) | 119,570 | 176,013 | ||||||
| Discontinued operations, net (note 3): |
||||||||||
| Operating income (loss) from discontinued operations |
61 | 4,570 | 8,718 | |||||||
| Gain on sale of operating properties and properties in development |
5,835 | 17,381 | 25,285 | |||||||
| Income (loss) from discontinued operations |
5,896 | 21,951 | 34,003 | |||||||
| Net income (loss) |
(32,743 | ) | 141,521 | 210,016 | ||||||
| Noncontrolling interests: |
||||||||||
| Preferred units |
(3,725 | ) | (3,725 | ) | (3,725 | ) | ||||
| Exchangeable operating partnership units |
216 | (907 | ) | (1,650 | ) | |||||
| Limited partners’ interests in consolidated partnerships |
(452 | ) | (701 | ) | (990 | ) | ||||
| Net income attributable to controlling interests |
(3,961 | ) | (5,333 | ) | (6,365 | ) | ||||
| Net income (loss) attributable to controlling interests |
(36,704 | ) | 136,188 | 203,651 | ||||||
| Preferred stock dividends |
(19,675 | ) | (19,675 | ) | (19,675 | ) | ||||
| Net income (loss) attributable to common stockholders |
$ | (56,379 | ) | 116,513 | 183,976 | |||||
| Income (loss) per common share - basic (note 13): |
||||||||||
| Continuing operations |
$ | (0.82 | ) | 1.35 | 2.16 | |||||
| Discontinued operations |
0.08 | 0.31 | 0.49 | |||||||
| Net income (loss) attributable to common stockholders per share |
$ | (0.74 | ) | 1.66 | 2.65 | |||||
| Income (loss) per common share - diluted (note 13): |
||||||||||
| Continuing operations |
$ | (0.82 | ) | 1.35 | 2.16 | |||||
| Discontinued operations |
0.08 | 0.31 | 0.49 | |||||||
| Net income (loss) attributable to common stockholders per share |
$ | (0.74 | ) | 1.66 | 2.65 | |||||
See accompanying notes to consolidated financial statements.
71
Table of Contents
Consolidated Statements of Equity and Comprehensive Income (Loss)
For the years ended December 31, 2009, 2008 and 2007
(In thousands, except per share data)
| Noncontrolling Interests | ||||||||||||||||||||||||||||||||||||
| Preferred Stock |
Common Stock |
Treasury Stock |
Additional Paid In Capital |
Accumulated Other Comprehensive Loss |
Distributions in Excess of Net Income |
Total Stockholders’ Equity |
Preferred Units |
Exchangeable Operating Partnership Units |
Limited Partners’ Interest in Consolidated Partnerships |
Total Noncontrolling Interests |
Total Equity |
|||||||||||||||||||||||||
| Balance at December 31, 2006 |
$ | 275,000 | 744 | (111,414 | ) | 1,744,201 | (13,061 | ) | (69,516 | ) | 1,825,954 | 49,158 | 16,065 | 17,797 | 83,020 | 1,908,974 | ||||||||||||||||||||
| Comprehensive Income (note 9): |
||||||||||||||||||||||||||||||||||||
| Net income |
— | — | — | — | — | 203,651 | 203,651 | 3,725 | 1,650 | 990 | 6,365 | 210,016 | ||||||||||||||||||||||||
| Amortization of loss on derivative instruments |
— | — | — | — | 1,297 | — | 1,297 | — | 9 | — | 9 | 1,306 | ||||||||||||||||||||||||
| Change in fair value of derivative instruments |
— | — | — | — | (6,858 | ) | — | (6,858 | ) | — | (47 | ) | — | (47 | ) | (6,905 | ) | |||||||||||||||||||
| Total comprehensive income (loss) |
198,090 | 6,327 | 204,417 | |||||||||||||||||||||||||||||||||
| Restricted stock issued, net of amortization (note 12) |
— | 2 | — | 17,723 | — | — | 17,725 | — | — | — | — | 17,725 | ||||||||||||||||||||||||
| Common stock redeemed for taxes withheld for stock based compensation, net |
— | 2 | — | (7,813 | ) | — | — | (7,811 | ) | — | — | — | — | (7,811 | ) | |||||||||||||||||||||
| Common stock issued for dividend reinvestment plan |
— | 1 | — | 4,075 | — | — | 4,076 | — | — | — | — | 4,076 | ||||||||||||||||||||||||
| Tax benefit for issuance of stock options |
— | — | — | 1,909 | — | — | 1,909 | — | — | — | — | 1,909 | ||||||||||||||||||||||||
| Common stock issued for partnership units exchanged |
— | 3 | — | 8,604 | — | — | 8,607 | — | (8,607 | ) | — | (8,607 | ) | — | ||||||||||||||||||||||
| Reallocation of limited partners’ interest |
— | — | — | (2,419 | ) | — | — | (2,419 | ) | — | 2,419 | — | 2,419 | — | ||||||||||||||||||||||
| Contributions from partners |
— | — | — | — | — | — | — | — | — | 4,483 | 4,483 | 4,483 | ||||||||||||||||||||||||
| Distributions to partners |
— | — | — | — | — | — | — | — | — | (4,879 | ) | (4,879 | ) | (4,879 | ) | |||||||||||||||||||||
| Cash dividends declared: |
||||||||||||||||||||||||||||||||||||
| Preferred stock/unit |
— | — | — | — | — | (19,675 | ) | (19,675 | ) | (3,725 | ) | — | — | (3,725 | ) | (23,400 | ) | |||||||||||||||||||
| Common stock/unit ($2.64 per share) |
— | — | — | — | — | (183,395 | ) | (183,395 | ) | — | (1,570 | ) | — | (1,570 | ) | (184,965 | ) | |||||||||||||||||||
| Balance at December 31, 2007 |
$ | 275,000 | 752 | (111,414 | ) | 1,766,280 | (18,622 | ) | (68,935 | ) | 1,843,061 | 49,158 | 9,919 | 18,391 | 77,468 | 1,920,529 | ||||||||||||||||||||
| Comprehensive Income (note 9): |
||||||||||||||||||||||||||||||||||||
| Net income |
— | — | — | — | — | 136,188 | 136,188 | 3,725 | 907 | 701 | 5,333 | 141,521 | ||||||||||||||||||||||||
| Amortization of loss on derivative instruments |
— | — | — | — | 1,297 | — | 1,297 | — | 9 | — | 9 | 1,306 | ||||||||||||||||||||||||
| Change in fair value of derivative instruments |
— | — | — | — | (73,364 | ) | — | (73,364 | ) | — | (491 | ) | — | (491 | ) | (73,855 | ) | |||||||||||||||||||
| Total comprehensive income (loss) |
64,121 | 4,851 | 68,972 | |||||||||||||||||||||||||||||||||
| Restricted stock issued, net of amortization (note 12) |
— | 3 | — | 8,190 | — | — | 8,193 | — | — | — | — | 8,193 | ||||||||||||||||||||||||
| Common stock redeemed for taxes withheld for stock based compensation, net |
— | — | — | (3,659 | ) | — | — | (3,659 | ) | — | — | — | — | (3,659 | ) | |||||||||||||||||||||
| Common stock issued for dividend reinvestment plan |
— | 1 | — | 4,473 | — | — | 4,474 | — | — | — | — | 4,474 | ||||||||||||||||||||||||
| Tax benefit for issuance of stock options |
— | — | — | 2,285 | — | — | 2,285 | — | — | — | — | 2,285 | ||||||||||||||||||||||||
| Common stock issued for partnership units exchanged |
— | — | — | 232 | — | — | 232 | — | (232 | ) | — | (232 | ) | — | ||||||||||||||||||||||
| Reallocation of limited partners’ interest |
— | — | — | 464 | — | — | 464 | — | (464 | ) | — | (464 | ) | — | ||||||||||||||||||||||
| Contributions from partners |
— | — | — | — | — | — | — | — | — | 3,157 | 3,157 | 3,157 | ||||||||||||||||||||||||
| Distributions to partners |
— | — | — | — | — | — | — | — | — | (14,269 | ) | (14,269 | ) | (14,269 | ) | |||||||||||||||||||||
| Cash dividends declared: |
||||||||||||||||||||||||||||||||||||
| Preferred stock/unit |
— | — | — | — | — | (19,675 | ) | (19,675 | ) | (3,725 | ) | — | — | (3,725 | ) | (23,400 | ) | |||||||||||||||||||
| Common stock/unit ($2.90 per share) |
— | — | — | — | — | (202,635 | ) | (202,635 | ) | — | (1,365 | ) | — | (1,365 | ) | (204,000 | ) | |||||||||||||||||||
| Balance at December 31, 2008 |
$ | 275,000 | 756 | (111,414 | ) | 1,778,265 | (90,689 | ) | (155,057 | ) | 1,696,861 | 49,158 | 8,283 | 7,980 | 65,421 | 1,762,282 | ||||||||||||||||||||
| Comprehensive Income (note 9): |
||||||||||||||||||||||||||||||||||||
| Net income (loss) |
— | — | — | — | — | (36,704 | ) | (36,704 | ) | 3,725 | (216 | ) | 452 | 3,961 | (32,743 | ) | ||||||||||||||||||||
| Loss on settlement of derivative instruments |
— | — | — | — | (19,863 | ) | — | (19,863 | ) | — | (114 | ) | — | (114 | ) | (19,977 | ) | |||||||||||||||||||
| Amortization of loss on derivative instruments |
— | — | — | — | 2,292 | — | 2,292 | — | 13 | — | 13 | 2,305 | ||||||||||||||||||||||||
| Loss on derivative instruments |
— | — | — | — | 3,275 | — | 3,275 | — | 19 | — | 19 | 3,294 | ||||||||||||||||||||||||
| Change in fair value of derivative instruments |
— | — | — | — | 55,012 | — | 55,012 | — | 316 | — | 316 | 55,328 | ||||||||||||||||||||||||
| Total comprehensive income (loss) |
4,012 | 4,195 | 8,207 | |||||||||||||||||||||||||||||||||
| Restricted stock issued, net of amortization (note 12) |
— | 2 | — | 5,961 | — | — | 5,963 | — | — | — | — | 5,963 | ||||||||||||||||||||||||
| Common stock redeemed for taxes withheld for stock based compensation, net |
— | — | — | 343 | — | — | 343 | — | — | — | — | 343 | ||||||||||||||||||||||||
| Common stock issued for dividend reinvestment plan |
— | 1 | — | 3,222 | — | — | 3,223 | — | — | — | — | 3,223 | ||||||||||||||||||||||||
| Tax benefit for issuance of stock options |
— | — | — | 552 | — | — | 552 | — | — | — | — | 552 | ||||||||||||||||||||||||
| Common stock issued for stock offerings, net of issuance costs |
— | 112 | — | 345,685 | — | — | 345,797 | — | — | — | — | 345,797 | ||||||||||||||||||||||||
| Treasury stock cancellation |
— | (56 | ) | 111,414 | (111,358 | ) | — | — | — | — | — | — | — | — | ||||||||||||||||||||||
| Contributions from partners |
— | — | — | — | — | — | — | — | — | 4,197 | 4,197 | 4,197 | ||||||||||||||||||||||||
| Distributions to partners |
— | — | — | — | — | — | — | — | — | (881 | ) | (881 | ) | (881 | ) | |||||||||||||||||||||
| Cash dividends declared: |
||||||||||||||||||||||||||||||||||||
| Preferred stock/unit |
— | — | — | — | — | (19,675 | ) | (19,675 | ) | (3,725 | ) | — | — | (3,725 | ) | (23,400 | ) | |||||||||||||||||||
| Common stock/unit ($2.11 per share) |
— | — | — | — | — | (161,909 | ) | (161,909 | ) | — | (980 | ) | — | (980 | ) | (162,889 | ) | |||||||||||||||||||
| Balance at December 31, 2009 |
$ | 275,000 | 815 | — | 2,022,670 | (49,973 | ) | (373,345 | ) | 1,875,167 | 49,158 | 7,321 | 11,748 | 68,227 | 1,943,394 | |||||||||||||||||||||
See accompanying notes to consolidated financial statements.
72
Table of Contents
Consolidated Statements of Cash Flows
For the years ended December 31, 2009, 2008, and 2007
(in thousands)
| 2009 | 2008 | 2007 | ||||||||
| Cash flows from operating activities: |
||||||||||
| Net income (loss) |
$ | (32,743 | ) | 141,521 | 210,016 | |||||
| Adjustments to reconcile net income (loss) to net cash provided by operating activities: |
||||||||||
| Depreciation and amortization |
117,979 | 107,846 | 93,508 | |||||||
| Deferred loan cost and debt premium amortization |
5,822 | 4,287 | 3,249 | |||||||
| Above and below market lease intangibles amortization and accretion |
(1,867 | ) | (2,376 | ) | (1,926 | ) | ||||
| Stock-based compensation, net of capitalization |
4,668 | 5,950 | 11,572 | |||||||
| Equity in (income) loss of investments in real estate partnerships |
26,373 | (5,292 | ) | (18,093 | ) | |||||
| Net gain on sale of properties |
(25,192 | ) | (37,843 | ) | (79,627 | ) | ||||
| Provision for doubtful accounts |
9,078 | 1,197 | — | |||||||
| Provision for impairment |
104,402 | 34,855 | — | |||||||
| Early extinguishment of debt |
2,784 | — | — | |||||||
| Distribution of earnings from operations of investments in real estate partnerships |
31,252 | 30,730 | 30,547 | |||||||
| Settlement of derivative instruments |
(19,953 | ) | — | — | ||||||
| Loss on derivative instruments |
3,294 | — | — | |||||||
| Changes in assets and liabilities: |
||||||||||
| Accounts receivable |
(2,995 | ) | (6,621 | ) | (5,665 | ) | ||||
| Straight-line rent receivables, net |
(3,959 | ) | (3,709 | ) | (4,375 | ) | ||||
| Other receivables |
19,700 | (19,700 | ) | — | ||||||
| Deferred leasing costs |
(9,799 | ) | (6,734 | ) | (8,126 | ) | ||||
| Other assets |
(16,493 | ) | (12,839 | ) | (15,861 | ) | ||||
| Accounts payable and other liabilities |
(18,035 | ) | (12,423 | ) | 2,101 | |||||
| Tenants’ security and escrow deposits |
(454 | ) | 320 | 847 | ||||||
| Net cash provided by operating activities |
193,862 | 219,169 | 218,167 | |||||||
| Cash flows from investing activities: |
||||||||||
| Acquisition of operating real estate |
— | — | (63,117 | ) | ||||||
| Development of real estate including acquisition of land |
(142,989 | ) | (388,783 | ) | (619,282 | ) | ||||
| Proceeds from sale of real estate investments |
180,307 | 274,417 | 270,981 | |||||||
| Collection of notes receivable |
13,572 | 28,287 | 545 | |||||||
| Investments in real estate partnerships |
(28,709 | ) | (48,619 | ) | (42,660 | ) | ||||
| Distributions received from investments in real estate partnerships |
23,548 | 28,923 | 41,372 | |||||||
| Net cash provided by (used in) investing activities |
45,729 | (105,775 | ) | (412,161 | ) | |||||
| Cash flows from financing activities: |
||||||||||
| Net proceeds from common stock issuance |
345,800 | 1,020 | 2,383 | |||||||
| Distributions to limited partners in consolidated partnerships, net |
(872 | ) | (14,134 | ) | (4,632 | ) | ||||
| Distributions to exchangeable operating partnership unit holders |
(980 | ) | (1,363 | ) | (1,572 | ) | ||||
| Distributions to preferred unit holders |
(3,725 | ) | (3,725 | ) | (3,725 | ) | ||||
| Dividends paid to common stockholders |
(158,690 | ) | (198,165 | ) | (179,325 | ) | ||||
| Dividends paid to preferred stockholders |
(19,675 | ) | (19,675 | ) | (19,675 | ) | ||||
| Repayment of fixed rate unsecured notes |
(116,053 | ) | — | — | ||||||
| Proceeds from issuance of fixed rate unsecured notes |
— | — | 398,108 | |||||||
| (Repayment of) proceeds from unsecured credit facilities |
(297,667 | ) | 89,667 | 87,000 | ||||||
| Proceeds from notes payable |
106,992 | 62,500 | — | |||||||
| Repayment of notes payable |
(8,056 | ) | (19,932 | ) | (89,719 | ) | ||||
| Scheduled principal payments |
(5,214 | ) | (4,806 | ) | (4,545 | ) | ||||
| Payment of loan costs |
(1,195 | ) | (1,916 | ) | (5,682 | ) | ||||
| Payment of premium on tender offer |
(2,312 | ) | — | — | ||||||
| Net cash (used in) provided by financing activities |
(161,647 | ) | (110,529 | ) | 178,616 | |||||
| Net increase (decrease) in cash and cash equivalents |
77,944 | 2,865 | (15,378 | ) | ||||||
| Cash and cash equivalents at beginning of the year |
21,533 | 18,668 | 34,046 | |||||||
| Cash and cash equivalents at end of the year |
$ | 99,477 | 21,533 | 18,668 | ||||||
73
Table of Contents
REGENCY CENTERS CORPORATION
Consolidated Statements of Cash Flows
For the years ended December 31, 2009, 2008, and 2007
(in thousands)
| 2009 | 2008 | 2007 | |||||||
| Supplemental disclosure of cash flow information: |
|||||||||
| Cash paid for interest (net of capitalized interest of $19,062 $36,510 and $35,424 in 2009, 2008, and 2007, respectively) |
$ | 112,730 | 94,632 | 82,833 | |||||
| Supplemental disclosure of non-cash transactions: |
|||||||||
| Common stock issued for partnership units exchanged |
$ | — | 232 | 8,607 | |||||
| Real estate received through distribution in kind |
$ | 100,717 | — | — | |||||
| Mortgage loans assumed through distribution in kind |
$ | 70,541 | — | — | |||||
| Security deposits received through distribution in kind |
$ | 265 | — | — | |||||
| Mortgage loans assumed for the acquisition of real estate |
$ | — | — | 42,272 | |||||
| Real estate contributed for investments in real estate partnerships |
$ | 26,410 | 6,825 | 11,007 | |||||
| Notes receivable taken in connection with sales of properties in development |
$ | 11,413 | 16,294 | 25,099 | |||||
| Change in fair value of derivative instruments |
$ | 55,328 | (73,855 | ) | (6,905 | ) | |||
| Common stock issued for dividend reinvestment plan |
$ | 3,219 | 4,470 | 4,070 | |||||
| Stock-based compensation capitalized |
$ | 1,574 | 3,606 | 7,565 | |||||
| Contributions from limited partners in consolidated partnerships, net |
$ | 4,188 | 3,020 | 4,237 | |||||
See accompanying notes to consolidated financial statements.
74
Table of Contents
Consolidated Balance Sheets
December 31, 2009 and 2008
(in thousands, except unit data)
| 2009 | 2008 | ||||||
| Assets |
|||||||
| Real estate investments at cost (notes 2, 3, 4, and 14): |
|||||||
| Land |
$ | 975,861 | 923,062 | ||||
| Buildings and improvements |
2,017,843 | 1,974,093 | |||||
| Properties in development |
920,427 | 1,078,885 | |||||
| 3,914,131 | 3,976,040 | ||||||
| Less: accumulated depreciation |
622,163 | 554,595 | |||||
| 3,291,968 | 3,421,445 | ||||||
| Operating properties held for sale, net |
19,647 | 66,447 | |||||
| Investments in real estate partnerships |
326,212 | 383,408 | |||||
| Net real estate investments |
3,637,827 | 3,871,300 | |||||
| Cash and cash equivalents |
99,477 | 21,533 | |||||
| Notes receivable (note 5) |
37,753 | 31,438 | |||||
| Accounts receivable, net of allowance for doubtful accounts of $6,567 and $1,837 at December 31, 2009 and 2008, respectively |
40,871 | 46,501 | |||||
| Straight line rent receivable, net of reserve of $1,899 at December 31, 2009 |
39,292 | 37,595 | |||||
| Other receivables (note 4) |
— | 19,700 | |||||
| Deferred costs, less accumulated amortization of $58,861 and $51,549 at December 31, 2009 and 2008, respectively |
58,376 | 57,477 | |||||
| Acquired lease intangible assets, less accumulated amortization of $11,632 and $11,204 at December 31, 2009 and 2008, respectively (note 6) |
10,007 | 12,903 | |||||
| Other assets |
50,203 | 43,928 | |||||
| Total assets |
$ | 3,973,806 | 4,142,375 | ||||
| Liabilities and Capital |
|||||||
| Liabilities: |
|||||||
| Notes payable (note 8) |
$ | 1,886,380 | 1,837,904 | ||||
| Unsecured credit facilities (note 8) |
— | 297,667 | |||||
| Accounts payable and other liabilities |
99,145 | 141,395 | |||||
| Derivative instruments, at fair value (note 9) |
28,363 | 83,691 | |||||
| Acquired lease intangible liabilities, less accumulated accretion of $9,715 and $8,829 at December 31, 2009 and 2008, respectively (note 6) |
5,896 | 7,865 | |||||
| Tenants’ security and escrow deposits |
10,628 | 11,571 | |||||
| Total liabilities |
2,030,412 | 2,380,093 | |||||
| Commitments and contingencies (notes 14 and 15) |
|||||||
| Capital: |
|||||||
| Partners’ capital (notes 9, 11, 12, and 13): |
|||||||
| Series D preferred units, par value $100: 500,000 units issued and outstanding at December 31, 2009 and 2008 |
49,158 | 49,158 | |||||
| Preferred units of general partner, $.01 par value per unit, 11,000,000 units issued and outstanding at December 31, 2009 and 2008, liquidation preference of $25 per unit |
275,000 | 275,000 | |||||
| General partner; 81,539,296 and 70,036,670 units outstanding at December 31, 2009 and 2008, respectively |
1,650,140 | 1,512,550 | |||||
| Limited partners; 468,211 units outstanding at December 31, 2009 and 2008 |
7,321 | 8,283 | |||||
| Accumulated other comprehensive income (loss) |
(49,973 | ) | (90,689 | ) | |||
| Total partners’ capital |
1,931,646 | 1,754,302 | |||||
| Noncontrolling interests: |
|||||||
| Limited partners’ interest in consolidated partnerships |
11,748 | 7,980 | |||||
| Total noncontrolling interests |
11,748 | 7,980 | |||||
| Total capital |
1,943,394 | 1,762,282 | |||||
| Total liabilities and capital |
$ | 3,973,806 | 4,142,375 | ||||
See accompanying notes to consolidated financial statements.
75
Table of Contents
Consolidated Statements of Operations
For the years ended December 31, 2009, 2008, and 2007
(in thousands, except per unit data)
| 2009 | 2008 | 2007 | ||||||||
| Revenues: |
||||||||||
| Minimum rent (note 14) |
$ | 345,610 | 334,509 | 308,108 | ||||||
| Percentage rent |
3,585 | 4,258 | 4,655 | |||||||
| Recoveries from tenants and other income |
101,748 | 101,096 | 90,179 | |||||||
| Management, transaction, and other fees |
38,289 | 56,032 | 33,064 | |||||||
| Total revenues |
489,232 | 495,895 | 436,006 | |||||||
| Operating expenses: |
||||||||||
| Depreciation and amortization |
116,924 | 104,569 | 89,365 | |||||||
| Operating and maintenance |
66,061 | 59,140 | 54,095 | |||||||
| General and administrative |
54,136 | 49,495 | 50,580 | |||||||
| Real estate taxes |
53,823 | 48,512 | 43,815 | |||||||
| Provision for doubtful accounts |
8,791 | 1,170 | — | |||||||
| Other expenses |
8,284 | 14,824 | 10,057 | |||||||
| Total operating expenses |
308,019 | 277,710 | 247,912 | |||||||
| Other expense (income): |
||||||||||
| Interest expense, net of interest income of $3,767, $4,696 and $3,079 in 2009, 2008, and 2007, respectively |
109,239 | 92,784 | 82,389 | |||||||
| Gain on sale of operating properties and properties in development |
(19,357 | ) | (20,346 | ) | (52,215 | ) | ||||
| Provision for impairment |
97,519 | 31,469 | — | |||||||
| Early extinguishment of debt |
2,784 | — | — | |||||||
| Loss on derivative instruments (note 9) |
3,294 | — | — | |||||||
| Total other expense (income) |
193,479 | 103,907 | 30,174 | |||||||
| Income (loss) before equity in income (loss) of investments in real estate partnerships |
(12,266 | ) | 114,278 | 157,920 | ||||||
| Equity in income (loss) of investments in real estate partnerships (note 4) |
(26,373 | ) | 5,292 | 18,093 | ||||||
| Income (loss) from continuing operations |
(38,639 | ) | 119,570 | 176,013 | ||||||
| Discontinued operations, net (note 3): |
||||||||||
| Operating income (loss) from discontinued operations |
61 | 4,570 | 8,718 | |||||||
| Gain on sale of operating properties and properties in development |
5,835 | 17,381 | 25,285 | |||||||
| Income (loss) from discontinued operations |
5,896 | 21,951 | 34,003 | |||||||
| Net income (loss) |
(32,743 | ) | 141,521 | 210,016 | ||||||
| Noncontrolling interests: |
||||||||||
| Limited partners’ interest in consolidated partnerships |
(452 | ) | (701 | ) | (990 | ) | ||||
| Net income (loss) attributable to noncontrolling interests |
(452 | ) | (701 | ) | (990 | ) | ||||
| Net income attributable to controlling interests |
(33,195 | ) | 140,820 | 209,026 | ||||||
| Preferred unit distributions |
(23,400 | ) | (23,400 | ) | (23,400 | ) | ||||
| Net income (loss) attributable to common unit holders |
$ | (56,595 | ) | 117,420 | 185,626 | |||||
| Income (loss) per common unit - basic (note 13): |
||||||||||
| Continuing operations |
$ | (0.82 | ) | 1.35 | 2.16 | |||||
| Discontinued operations |
0.08 | 0.31 | 0.49 | |||||||
| Net income (loss) attributable to common unit holders per unit |
$ | (0.74 | ) | 1.66 | 2.65 | |||||
| Income (loss) per common unit - diluted (note 13): |
||||||||||
| Continuing operations |
$ | (0.82 | ) | 1.35 | 2.16 | |||||
| Discontinued operations |
0.08 | 0.31 | 0.49 | |||||||
| Net income (loss) attributable to common unit holders per unit |
$ | (0.74 | ) | 1.66 | 2.65 | |||||
See accompanying notes to consolidated financial statements.
76
Table of Contents
Consolidated Statements of Changes in Capital and Comprehensive Income (Loss)
For the years ended December 31, 2009, 2008, and 2007
(in thousands)
| Preferred Units | General Partner Preferred and Common Units |
Limited Partners |
Accumulated Other Comprehensive Income (Loss) |
Total Partners’ Capital |
Noncontrolling Interests in Limited Partners’ Interest in Consolidated Partnerships |
Total Capital |
||||||||||||||||
| Balance at December 31, 2006 |
$ | 49,158 | 1,839,015 | 16,065 | (13,061 | ) | 1,891,177 | 17,797 | 1,908,974 | |||||||||||||
| Comprehensive income (note 9): |
||||||||||||||||||||||
| Net income |
3,725 | 203,651 | 1,650 | — | 209,026 | 990 | 210,016 | |||||||||||||||
| Amortization of loss on derivative instruments |
— | — | 9 | 1,297 | 1,306 | — | 1,306 | |||||||||||||||
| Change in fair value of derivative instruments |
— | — | (47 | ) | (6,858 | ) | (6,905 | ) | — | (6,905 | ) | |||||||||||
| Total comprehensive income (loss) |
203,427 | 204,417 | ||||||||||||||||||||
| Contributions from partners |
— | — | — | — | — | 4,483 | 4,483 | |||||||||||||||
| Distributions to partners |
— | (183,395 | ) | (1,570 | ) | — | (184,965 | ) | (4,879 | ) | (189,844 | ) | ||||||||||
| Preferred unit distributions |
(3,725 | ) | (19,675 | ) | — | — | (23,400 | ) | — | (23,400 | ) | |||||||||||
| Restricted stock issued by Parent Company, net of amortization (note 12) |
— | 17,725 | — | — | 17,725 | — | 17,725 | |||||||||||||||
| Common units issued as a result of common stock issued by Parent Company, net of repurchases |
— | (1,826 | ) | — | — | (1,826 | ) | — | (1,826 | ) | ||||||||||||
| Common units exchanged for common stock of Parent Company |
— | 8,607 | (8,607 | ) | — | — | — | — | ||||||||||||||
| Reallocation of limited partners’ interest |
— | (2,419 | ) | 2,419 | — | — | — | — | ||||||||||||||
| Balance at December 31, 2007 |
$ | 49,158 | 1,861,683 | 9,919 | (18,622 | ) | 1,902,138 | 18,391 | 1,920,529 | |||||||||||||
| Comprehensive income (note 9): |
||||||||||||||||||||||
| Net income |
3,725 | 136,188 | 907 | — | 140,820 | 701 | 141,521 | |||||||||||||||
| Amortization of loss on derivative instruments |
— | — | 9 | 1,297 | 1,306 | — | 1,306 | |||||||||||||||
| Change in fair value of derivative instruments |
— | — | (491 | ) | (73,364 | ) | (73,855 | ) | — | (73,855 | ) | |||||||||||
| Total comprehensive income (loss) |
68,271 | 68,972 | ||||||||||||||||||||
| Contributions from partners |
— | — | — | — | — | 3,157 | 3,157 | |||||||||||||||
| Distributions to partners |
— | (202,635 | ) | (1,365 | ) | — | (204,000 | ) | (14,269 | ) | (218,269 | ) | ||||||||||
| Preferred unit distributions |
(3,725 | ) | (19,675 | ) | — | — | (23,400 | ) | — | (23,400 | ) | |||||||||||
| Restricted stock issued by Parent Company, net of amortization (note 12) |
— | 8,193 | — | — | 8,193 | — | 8,193 | |||||||||||||||
| Common units issued as a result of common stock issued by Parent Company, net of repurchases |
— | 3,100 | — | — | 3,100 | — | 3,100 | |||||||||||||||
| Common units exchanged for common stock of Parent Company |
— | 232 | (232 | ) | — | — | — | — | ||||||||||||||
| Reallocation of limited partners’ interest |
— | 464 | (464 | ) | — | — | — | — | ||||||||||||||
| Balance at December 31, 2008 |
$ | 49,158 | 1,787,550 | 8,283 | (90,689 | ) | 1,754,302 | 7,980 | 1,762,282 | |||||||||||||
| Comprehensive income (note 9): |
||||||||||||||||||||||
| Net income (loss) |
3,725 | (36,704 | ) | (216 | ) | — | (33,195 | ) | 452 | (32,743 | ) | |||||||||||
| Loss on settlement of derivative instruments |
— | — | (114 | ) | (19,863 | ) | (19,977 | ) | — | (19,977 | ) | |||||||||||
| Amortization of loss on derivative instruments |
— | — | 13 | 2,292 | 2,305 | — | 2,305 | |||||||||||||||
| Loss on derivative instruments |
— | — | 19 | 3,275 | 3,294 | — | 3,294 | |||||||||||||||
| Change in fair value of derivative instruments |
— | — | 316 | 55,012 | 55,328 | — | 55,328 | |||||||||||||||
| Total comprehensive income (loss) |
7,755 | 8,207 | ||||||||||||||||||||
| Contributions from partners |
— | — | — | — | — | 4,197 | 4,197 | |||||||||||||||
| Distributions to partners |
— | (161,909 | ) | (980 | ) | — | (162,889 | ) | (881 | ) | (163,770 | ) | ||||||||||
| Preferred unit distributions |
(3,725 | ) | (19,675 | ) | — | — | (23,400 | ) | — | (23,400 | ) | |||||||||||
| Restricted stock issued by Parent Company, net of amortization (note 12) |
— | 5,963 | — | — | 5,963 | — | 5,963 | |||||||||||||||
| Common units issued as a result of common stock issued by Parent Company, net of repurchases |
— | 349,915 | — | — | 349,915 | — | 349,915 | |||||||||||||||
| Balance at December 31, 2009 |
49,158 | 1,925,140 | 7,321 | (49,973 | ) | 1,931,646 | 11,748 | 1,943,394 | ||||||||||||||
See accompanying notes to consolidated financial statements.
77
Table of Contents
Consolidated Statements of Cash Flows
For the years ended December 31, 2009, 2008, and 2007
(in thousands)
| 2009 | 2008 | 2007 | ||||||||
| Cash flows from operating activities: |
||||||||||
| Net income (loss) |
$ | (32,743 | ) | 141,521 | 210,016 | |||||
| Adjustments to reconcile net income (loss) to net cash provided by operating activities: |
||||||||||
| Depreciation and amortization |
117,979 | 107,846 | 93,508 | |||||||
| Deferred loan cost and debt premium amortization |
5,822 | 4,287 | 3,249 | |||||||
| Above and below market lease intangibles amortization and accretion |
(1,867 | ) | (2,376 | ) | (1,926 | ) | ||||
| Stock-based compensation, net of capitalization |
4,668 | 5,950 | 11,572 | |||||||
| Equity in (income) loss of investments in real estate partnerships |
26,373 | (5,292 | ) | (18,093 | ) | |||||
| Net gain on sale of properties |
(25,192 | ) | (37,843 | ) | (79,627 | ) | ||||
| Provision for doubtful accounts |
9,078 | 1,197 | — | |||||||
| Provision for impairment |
104,402 | 34,855 | — | |||||||
| Early extinguishment of debt |
2,784 | — | — | |||||||
| Distribution of earnings from operations of investments in real estate partnerships |
31,252 | 30,730 | 30,547 | |||||||
| Settlement of derivative instruments |
(19,953 | ) | — | — | ||||||
| Loss on derivative instruments |
3,294 | — | — | |||||||
| Changes in assets and liabilities: |
||||||||||
| Accounts receivable |
(2,995 | ) | (6,621 | ) | (5,665 | ) | ||||
| Straight-line rent receivables, net |
(3,959 | ) | (3,709 | ) | (4,375 | ) | ||||
| Other receivables |
19,700 | (19,700 | ) | — | ||||||
| Deferred leasing costs |
(9,799 | ) | (6,734 | ) | (8,126 | ) | ||||
| Other assets |
(16,493 | ) | (12,839 | ) | (15,861 | ) | ||||
| Accounts payable and other liabilities |
(18,035 | ) | (12,423 | ) | 2,101 | |||||
| Tenants’ security and escrow deposits |
(454 | ) | 320 | 847 | ||||||
| Net cash provided by operating activities |
193,862 | 219,169 | 218,167 | |||||||
| Cash flows from investing activities: |
||||||||||
| Acquisition of operating real estate |
— | — | (63,117 | ) | ||||||
| Development of real estate including acquisition of land |
(142,989 | ) | (388,783 | ) | (619,282 | ) | ||||
| Proceeds from sale of real estate investments |
180,307 | 274,417 | 270,981 | |||||||
| Collection of notes receivable |
13,572 | 28,287 | 545 | |||||||
| Investments in real estate partnerships |
(28,709 | ) | (48,619 | ) | (42,660 | ) | ||||
| Distributions received from investments in real estate partnerships |
23,548 | 28,923 | 41,372 | |||||||
| Net cash provided by (used in) investing activities |
45,729 | (105,775 | ) | (412,161 | ) | |||||
| Cash flows from financing activities: |
||||||||||
| Net proceeds from Common Units issued as a result of common stock issued by Parent Company |
345,800 | 1,020 | 2,383 | |||||||
| Distributions to limited partners in consolidated partnerships, net |
(872 | ) | (14,134 | ) | (4,632 | ) | ||||
| Distributions paid to preferred unit holders |
(159,670 | ) | (199,528 | ) | (180,897 | ) | ||||
| Cash distributions to partners |
(23,400 | ) | (23,400 | ) | (23,400 | ) | ||||
| Repayment of fixed rate unsecured notes |
(116,053 | ) | — | — | ||||||
| Proceeds from issuance of fixed rate unsecured notes, net |
— | — | 398,108 | |||||||
| (Repayment of) proceeds from unsecured credit facilities |
(297,667 | ) | 89,667 | 87,000 | ||||||
| Proceeds from notes payable |
106,992 | 62,500 | — | |||||||
| Repayment of notes payable |
(8,056 | ) | (19,932 | ) | (89,719 | ) | ||||
| Scheduled principal payments |
(5,214 | ) | (4,806 | ) | (4,545 | ) | ||||
| Payment of loan costs |
(1,195 | ) | (1,916 | ) | (5,682 | ) | ||||
| Payment of premium on tender offer |
(2,312 | ) | — | — | ||||||
| Net cash provided by (used in) financing activities |
(161,647 | ) | (110,529 | ) | 178,616 | |||||
| Net increase (decrease) in cash and cash equivalents |
77,944 | 2,865 | (15,378 | ) | ||||||
| Cash and cash equivalents at beginning of the year |
21,533 | 18,668 | 34,046 | |||||||
| Cash and cash equivalents at end of the year |
$ | 99,477 | 21,533 | 18,668 | ||||||
78
Table of Contents
REGENCY CENTERS, L.P.
Consolidated Statements of Cash Flows
For the years ended December 31, 2009, 2008, and 2007
(in thousands)
| 2009 | 2008 | 2007 | |||||||
| Supplemental disclosure of cash flow information: |
|||||||||
| Cash paid for interest (net of capitalized interest of $19,062 $36,510 and $35,424 in 2009, 2008, and 2007, respectively) |
$ | 112,730 | 94,632 | 82,833 | |||||
| Supplemental disclosure of non-cash transactions: |
|||||||||
| Parent common stock issued for partnership units exchanged |
$ | — | 232 | 8,607 | |||||
| Real estate received through distribution in kind |
$ | 100,717 | — | — | |||||
| Mortgage loans assumed through distribution in kind |
$ | 70,541 | — | — | |||||
| Security deposits received through distribution in kind |
$ | 265 | — | — | |||||
| Mortgage loans assumed for the acquisition of real estate |
$ | — | — | 42,272 | |||||
| Real estate contributed for investments in real estate partnerships |
$ | 26,410 | 6,825 | 11,007 | |||||
| Notes receivable taken in connection with sales of properties in development |
$ | 11,413 | 16,294 | 25,099 | |||||
| Change in fair value of derivative instruments |
$ | 55,328 | (73,855 | ) | (6,905 | ) | |||
| Common stock issued by Parent Company for dividend reinvestment plan |
$ | 3,219 | 4,470 | 4,070 | |||||
| Stock-based compensation capitalized |
$ | 1,574 | 3,606 | 7,565 | |||||
| Contributions from limited partners in consolidated partnerships, net |
$ | 4,188 | 3,020 | 4,237 | |||||
See accompanying notes to consolidated financial statements.
79
Table of Contents
Regency Centers Corporation and Regency Centers, L.P.
Notes to Consolidated Financial Statements
December 31, 2009
1. Summary of Significant Accounting Policies
(a) Organization and Principles of Consolidation
General
Regency Centers Corporation (the “Parent Company”) began its operations as a Real Estate Investment Trust (“REIT”) in 1993 and is the managing general partner of Regency Centers, L.P. (the “Operating Partnership”). The Parent Company currently owns approximately 99% of the outstanding common Partnership Units of the Operating Partnership. The Parent Company engages in the ownership, management, leasing, acquisition, and development of retail shopping centers through the Operating Partnership, and has no other assets or liabilities other than through its investment in the Operating Partnership. At December 31, 2009, the Parent Company, the Operating Partnership and their controlled subsidiaries on a consolidated basis (“the Company” or “Regency”) directly owned 216 retail shopping centers and held partial interests in an additional 184 retail shopping centers through investments in real estate partnerships (also referred to as joint ventures or real estate partnerships).
Estimates, Risks, and Uncertainties
The preparation of financial statements in conformity with U.S. generally accepted accounting principles (“U.S. GAAP”) requires the Company’s management to make estimates and assumptions that affect the reported amounts of assets and liabilities, and disclosure of contingent assets and liabilities, at the date of the financial statements and the reported amounts of revenues and expenses during the reporting period. Actual results could differ from those estimates. The most significant estimates in the Company’s financial statements relate to the carrying values of its investments in real estate including its shopping centers, properties in development and its investments in real estate partnerships, accounts receivable, net, and derivative instruments. Each of these items could be significantly affected by the continued weak economy.
Because of the adverse conditions that exist in the real estate markets, as well as, the credit and financial markets, it is possible that the estimates and assumptions that have been utilized in the preparation of the consolidated financial statements could change significantly. Specifically as it relates to the Company’s business, the current weak economic period is expected to result in a higher level of retail store closings nationally, which could reduce the demand for leasing space in the Company’s shopping centers and result in a decline in occupancy and rental revenues in its real estate portfolio. The lack of available credit in the commercial real estate market is causing a decline in the values of commercial real estate nationally and the Company’s ability to sell shopping centers to raise capital. The reduction in the demand for new retail space and available capital have caused the Company to significantly reduce its new shopping center development program until markets become less volatile.
Consolidation
The accompanying consolidated financial statements include the accounts of the Parent Company, the Operating Partnership, its wholly-owned subsidiaries, and consolidated partnerships in which the Company has a controlling ownership interest. All significant inter-company balances and transactions are eliminated in the consolidated financial statements.
80
Table of Contents
Regency Centers Corporation and Regency Centers, L.P.
Notes to Consolidated Financial Statements—(Continued)
December 31, 2009
Ownership of the Parent Company
The Parent Company has a single class of common stock outstanding and three series of preferred stock outstanding (“Series 3, 4, and 5 Preferred Stock”). The dividends on the Series 3, 4, and 5 Preferred Stock are cumulative and payable in arrears on the last day of each calendar quarter. The Parent Company owns corresponding Series 3, 4, and 5 preferred unit interests (“Series 3, 4, and 5 Preferred Units”) in the Operating Partnership that entitle the Parent Company to income and distributions from the Operating Partnership in amounts equal to the dividends paid on the Parent Company’s Series 3, 4, and 5 Preferred Stock.
Ownership of the Operating Partnership
The Operating Partnership’s capital includes general and limited common Partnership Units, Series 3, 4, and 5 Preferred Units owned by the Parent Company, and Series D Preferred Units owned by institutional investors. At December 31, 2009, the Parent Company owned approximately 99% or 81,539,296 of the total 82,007,507 Partnership Units outstanding.
Net income and distributions of the Operating Partnership are allocable first to the Preferred Units and the remaining amounts to the general and limited common Partnership Units in accordance with their ownership percentages. The Series 3, 4, and 5 Preferred Units owned by the Parent Company are eliminated in consolidation in the accompanying consolidated financial statements of the Parent Company and are classified as preferred units of general partner in the accompanying consolidated financial statements of the Operating Partnership.
Investments in Real Estate Partnerships
Investments in real estate partnerships not controlled by the Company are accounted for under the equity method. The Company has evaluated its investment in the real estate partnerships and has concluded that they are not variable interest entities. Further, the joint venture partners in the real estate partnerships have significant ownership rights, including approval over operating budgets and strategic plans, capital spending, sale or financing, and admission of new partners. Upon formation of the joint ventures, the Company, through the Operating Partnership, also became the managing member, responsible for the day-to-day operations of the real estate partnerships. In accordance with the Financial Accounting Standards Board (“FASB”) Accounting Standards Codification (“ASC”) Topic 810, the Company evaluated its investment in each real estate partnership and concluded that the other partners have substantive participating rights and, therefore, the Company has concluded that the equity method of accounting is appropriate for these investments and they do not require consolidation. Under the equity method of accounting, investments in real estate partnerships are initially recorded at cost, subsequently increased for additional contributions and allocations of income, and reduced for distributions received and allocations of loss. These investments are included in the consolidated financial statements as investments in real estate partnerships.
81
Table of Contents
Regency Centers Corporation and Regency Centers, L.P.
Notes to Consolidated Financial Statements—(Continued)
December 31, 2009
Noncontrolling Interests
The Company consolidates all entities in which it has a controlling financial interest. A controlling financial interest is typically attributable to the entity with a majority voting interest. Noncontrolling interest is the portion of equity not attributable, directly or indirectly to the Company. Such noncontrolling interests are reported on the consolidated balance sheets within equity or capital, but separately from stockholders’ equity or partners’ capital. On the consolidated statements of operations, all of the revenues and expenses from less-than-wholly-owned consolidated subsidiaries are reported in net income (loss), including both the amounts attributable to the Company and noncontrolling interests. The amounts of consolidated net income (loss) attributable to the Company and to the noncontrolling interests are clearly identified on the accompanying Consolidated Statements of Operations.
Noncontrolling Interests of the Parent Company
The consolidated financial statements of the Parent Company include the following ownership interests held by owners other than the Parent Company: the preferred units in the Operating Partnership held by third parties (“Series D preferred units”), the limited Partnership Units in the Operating Partnership held by third parties (“Exchangeable operating partnership units”), and the minority-owned interest held by third parties in consolidated partnerships (“Limited partners’ interests in consolidated partnerships”). The Parent Company has included all of these noncontrolling interests in permanent equity, separate from the Parent Company’s stockholders’ equity, in the accompanying Consolidated Balance Sheets and Consolidated Statements of Equity and Comprehensive Income (Loss). The portion of net income (loss) or comprehensive income (loss) attributable to these noncontrolling interests is included in net income (loss) and comprehensive income (loss) in the accompanying Consolidated Statements of Operations and Consolidated Statements of Equity and Comprehensive Income (Loss) of the Parent Company.
In accordance with the FASB ASC Topic 480, securities that are redeemable for cash or other assets at the option of the holder, not solely within the control of the issuer, are classified as redeemable noncontrolling interests outside of permanent equity in the consolidated balance sheets. The Parent Company has evaluated the conditions as specified under the FASB ASC Topic 480 as it relates to Preferred Units and exchangeable operating partnership units outstanding and concluded that it has the right to satisfy the redemption requirements of the units by delivering unregistered preferred or common stock. Each outstanding Preferred Unit and exchangeable operating partnership unit is exchangeable for one share of preferred stock or common stock, respectively, and the unit holder cannot require redemption in cash or other assets. Limited partners’ interests in consolidated partnerships are not redeemable by the holders. The Parent Company’s only asset is its investment in the Operating Partnership, and therefore settlement in shares would not be a surrender of assets, but a contra-equity. The Parent Company also evaluated its fiduciary duties to itself, its shareholders, and, as the managing general partner of the Operating Partnership, to the Operating Partnership, and concluded its fiduciary duties are not in conflict with each other or the underlying agreements. Therefore, the Parent Company classifies such units and interests as permanent equity in the accompanying Consolidated Balance Sheets and Consolidated Statements of Equity and Comprehensive Income (Loss).
82
Table of Contents
Regency Centers Corporation and Regency Centers, L.P.
Notes to Consolidated Financial Statements—(Continued)
December 31, 2009
Noncontrolling Interests of the Operating Partnership
The Operating Partnership has determined that Limited partners’ interest in consolidated partnerships are noncontrolling interests. The Operating Partnership has included these noncontrolling interests in permanent capital, separate from partners’ capital, in the accompanying Consolidated Balance Sheets and Consolidated Statements of Changes in Capital and Comprehensive Income (Loss). The portion of net income (loss) or comprehensive income (loss) attributable to these noncontrolling interests is included in net income (loss) and comprehensive income (loss) in the accompanying Consolidated Statements of Operations and Consolidated Statements of Changes in Capital and Comprehensive Income (Loss) of the Operating Partnership.
(b) Revenues
The Company leases space to tenants under agreements with varying terms. Leases are accounted for as operating leases with minimum rent recognized on a straight-line basis over the term of the lease regardless of when payments are due. The Company estimates the collectibility of the accounts receivable related to base rents, straight-line rents, expense reimbursements, and other revenue taking into consideration the Company’s experience in the retail sector, available internal and external tenant credit information, payment history, industry trends, tenant credit-worthiness, and remaining lease terms. In some cases, primarily related to straight-line rents, the ultimate collection of these amounts are associated with increased rents to be collected in future years which extend beyond one year. During 2009, the Company experienced a significant increase in tenant defaults, as well as, deterioration in tenant receivable collection rates, as compared to historical collection rates. As a result, the Company increased its allowance for doubtful accounts to fully reserve for these specifically identified tenant defaults and adjusted the collectibility rates used to estimate the allowance to reflect such deterioration in collection rates. During the years ended December 31, 2009 and 2008, the Company recorded provisions for doubtful accounts of $9.1 million and $1.2 million, respectively, of which approximately $287,000 and $41,000, respectively, is included in discontinued operations.
The following table represents the components of accounts receivable, net of allowance for doubtful accounts, as of December 31, 2009 and 2008 in the accompanying Consolidated Balance Sheets (in thousands):
| 2009 | 2008 | ||||
| Tenant receivables |
$ | 22,395 | 20,942 | ||
| CAM and tax reimbursements |
15,099 | 15,697 | |||
| Other receivables |
9,944 | 11,699 | |||
| Less: allowance for doubtful accounts |
6,567 | 1,837 | |||
| Total |
$ | 40,871 | 46,501 | ||
Substantially all of the lease agreements with anchor tenants contain provisions that provide for additional rents based on tenants’ sales volume (percentage rent) and reimbursement of the tenants’ share of real estate taxes, insurance, and common area maintenance (“CAM”) costs. Percentage rents are recognized when the tenants achieve the specified targets as defined in their lease agreements. Recovery of real estate taxes, insurance, and CAM costs are recognized as the respective costs are incurred in accordance with the lease agreements.
83
Table of Contents
Regency Centers Corporation and Regency Centers, L.P.
Notes to Consolidated Financial Statements—(Continued)
December 31, 2009
As part of the leasing process, the Company may provide the lessee with an allowance for the construction of leasehold improvements. These leasehold improvements are capitalized and recorded as tenant improvements, and depreciated over the shorter of the useful life of the improvements or the lease term. If the allowance represents a payment for a purpose other than funding leasehold improvements, or in the event the Company is not considered the owner of the improvements, the allowance is considered to be a lease incentive and is recognized over the lease term as a reduction of minimum rent. Factors considered during this evaluation include, among other things, who holds legal title to the improvements as well as other controlling rights provided by the lease agreement and provisions for substantiation of such costs (e.g. unilateral control of the tenant space during the build-out process). Determination of the appropriate accounting for the payment of a tenant allowance is made on a lease-by-lease basis, considering the facts and circumstances of the individual tenant lease. When the Company is the owner of the leasehold improvements, recognition of lease revenue commences when the lessee is given possession of the leased space upon completion of tenant improvements. However, when the leasehold improvements are owned by the tenant, the lease inception date is the date the tenant obtains possession of the leased space for purposes of constructing its leasehold improvements.
Profits from sales of real estate are not recognized under the full accrual method by the Company unless a sale is consummated; the buyer’s initial and continuing investment is adequate to demonstrate a commitment to pay for the property; the Company’s receivable, if applicable, is not subject to future subordination; the Company has transferred to the buyer the usual risks and rewards of ownership; and the Company does not have substantial continuing involvement with the property.
The Company sells shopping center properties to joint ventures in exchange for cash equal to the fair value of the ownership interest of its partners. The Company accounts for those sales as “partial sales” and recognizes gains on those partial sales in the period the properties were sold to the extent of the percentage interest sold, and in the case of certain real estate partnerships, applies a more restrictive method of recognizing gains, as discussed further below. The gains and operations associated with properties sold to these real estate partnerships are not classified as discontinued operations because the Company continues to partially own and manage these shopping centers.
As of December 31, 2009, four of the Company’s joint ventures (“DIK-JV”) give each partner the unilateral right to elect to dissolve the real estate partnership and, upon such an election, receive a distribution in-kind (“DIK”) of the assets of the real estate partnership equal to their respective capital account, which could include properties the Company previously sold to the real estate partnership. The liquidation provisions require that all of the properties owned by the real estate partnership be appraised to determine their respective fair values. As a general rule, if the Company initiates the liquidation process, its partner has the right to choose the first property that it will receive in liquidation with the Company choosing the next property that it will receive in liquidation. If the Company’s partner initiates the liquidation process, the order of the selection process is reversed. The process then continues with an alternating selection of properties by each partner until the balance of each partner’s capital account on a fair value basis has been distributed. After the final selection, to the extent that the fair value of properties in the DIK-JV are not distributable in a manner that equals the balance of each partner’s capital account, a cash payment would be made to the other partner by the partner receiving a property distribution in excess of its capital account. The
84
Table of Contents
Regency Centers Corporation and Regency Centers, L.P.
Notes to Consolidated Financial Statements—(Continued)
December 31, 2009
partners may also elect to liquidate some or all of the properties through sales rather than through the DIK process.
The Company has concluded that these DIK dissolution provisions constitute in-substance call/put options and represent a form of continuing involvement with respect to property that the Company has sold to these real estate partnerships, limiting the Company’s recognition of gain related to the partial sale. This more restrictive method of gain recognition (“Restricted Gain Method”) considers the Company’s potential ability to receive property through a DIK on which partial gain has been recognized, and ensures, as discussed below, maximum gain deferral upon sale to a DIK-JV. The Company has applied the Restricted Gain Method to partial sales of property to real estate partnerships that contain unilateral DIK provisions.
Profit shall be recognized under a method determined by the nature and extent of the seller’s continuing involvement and the profit recognized shall be reduced by the maximum exposure to loss. The Company has concluded that the Restricted Gain Method accomplishes this objective.
Under the Restricted Gain Method, for purposes of gain deferral, the Company considers the aggregate pool of properties sold into the DIK-JV as well as the aggregate pool of properties which will be distributed in the DIK process. As a result, upon the sale of properties to a DIK-JV, the Company performs a hypothetical DIK liquidation assuming that it would choose only those properties that it has sold to the DIK-JV in an amount equal to its capital account. For purposes of calculating the gain to be deferred, the Company assumes that it will select properties in a DIK liquidation that would otherwise have generated the highest gain to the Company when originally sold to the DIK-JV. The deferred gain recorded upon the sale of a property to a DIK-JV is calculated whenever a property is sold to the DIK-JV by the Company. During the periods when there are no property sales to a DIK-JV, the deferred gain is not recalculated.
Because the contingency associated with the possibility of receiving a particular property back upon liquidation, which forms the basis of the Restricted Gain Method, is not satisfied at the property level, but at the aggregate level, no gain is recognized on property sold by the DIK-JV to a third party or received by the Company upon actual dissolution. Instead, the property received upon dissolution is recorded at the carrying value of the Company’s investment in the DIK-JV on the date of dissolution, reduced by the deferred gain.
The Company has been engaged under agreements with its joint venture partners to provide asset management, property management, leasing, investing, and financing services for such joint ventures’ shopping centers. The Company also receives transaction fees, as contractually agreed upon with a joint venture, which include fees such as acquisition fees, disposition fees, “promotes”, or “earnouts”. The fees are market-based, generally calculated as a percentage of either revenues earned or the estimated values of the properties managed or the proceeds received, and are recognized as services are rendered, when fees due are determinable, and collectibility is reasonably assured.
(c) Real Estate Investments
Land, buildings, and improvements are recorded at cost. All specifically identifiable costs related to development activities are capitalized into properties in development on the
85
Table of Contents
Regency Centers Corporation and Regency Centers, L.P.
Notes to Consolidated Financial Statements—(Continued)
December 31, 2009
accompanying Consolidated Balance Sheets. Properties in development are defined as properties that are in the construction or initial lease-up process and have not reached their initial full occupancy. In summary, a project changes from non-operating to operating when it is substantially completed and available for occupancy. At that time, costs are no longer capitalized. The capitalized costs include pre-development costs essential to the development of the property, development costs, construction costs, interest costs, real estate taxes, and allocated direct employee costs incurred during the period of development. Interest costs are capitalized into each development project based on applying the Company’s weighted average borrowing rate to that portion of the actual development costs expended. The Company ceases interest cost capitalization when the property is no longer being developed or is available for occupancy upon substantial completion of tenant improvements, but in no event would the Company capitalize interest on the project beyond 12 months after substantial completion of the building shell.
The following table represents the components of properties in development as of December 31, 2009 and 2008 in the accompanying Consolidated Balance Sheets (in thousands):
| 2009 | 2008 | ||||
| Construction in process |
$ | 127,376 | 338,606 | ||
| Construction complete and in lease-up |
673,052 | 548,132 | |||
| Land held for future development |
119,999 | 192,147 | |||
| Total |
$ | 920,427 | 1,078,885 | ||
Construction in process represents developments where the Company has not yet incurred at least 90% of the expected costs to complete. Construction complete and in lease-up represents developments where the Company has incurred at least 90% of the estimated costs to complete, but is still completing lease-up and final tenant build out. Land held for future development represents projects not in construction, but identified and available for future development if and when the market demand for a new shopping center exists.
The Company incurs costs prior to land acquisition including contract deposits, as well as legal, engineering, and other external professional fees related to evaluating the feasibility of developing a shopping center. These pre-development costs are included in properties in development in the accompanying Consolidated Balance Sheets. At December 31, 2009 and 2008, the Company capitalized pre-development costs of approximately $816,000 and $7.7 million, respectively, of which approximately $325,000 and $2.3 million, respectively, were refundable deposits. If the Company determines that the development of a particular shopping center is no longer probable, any related pre-development costs previously capitalized are immediately expensed in other expenses in the accompanying Consolidated Statements of Operations. During the years ended December 31, 2009, 2008, and 2007, the Company expensed pre-development costs of $3.8 million, $15.5 million, and $5.3 million, respectively, in other expenses in the accompanying Consolidated Statements of Operations.
Maintenance and repairs that do not improve or extend the useful lives of the respective assets are recorded in operating and maintenance expense.
Depreciation is computed using the straight-line method over estimated useful lives of up to 40 years for buildings and improvements, the shorter of the useful life or the lease term for tenant improvements, and three to seven years for furniture and equipment.
86
Table of Contents
Regency Centers Corporation and Regency Centers, L.P.
Notes to Consolidated Financial Statements—(Continued)
December 31, 2009
The Company and the real estate partnerships allocate the purchase price of assets acquired (net tangible and identifiable intangible assets) and liabilities assumed based on their relative fair values at the date of acquisition. The Company’s methodology for this allocation includes estimating an “as-if vacant” fair value of the physical property, which is allocated to land, building, and improvements. The difference between the purchase price and the “as-if vacant” fair value is allocated to intangible assets. There are three categories of intangible assets considered: (i) value of in-place leases, (ii) above and below-market value of in-place leases, and (iii) customer relationship value.
The value of in-place leases is estimated based on the value associated with the costs avoided in originating leases compared to the acquired in-place leases as well as the value associated with lost rental and recovery revenue during the assumed lease-up period. The value of in-place leases is recorded to amortization expense over the remaining initial term of the respective leases.
Above-market and below-market in-place lease values for acquired properties are recorded based on the present value of the difference between (i) the contractual amounts to be paid pursuant to the in-place leases and (ii) management’s estimate of fair market lease rates for comparable in-place leases, measured over a period equal to the remaining non-cancelable term of the lease. The value of above-market leases is amortized as a reduction of minimum rent over the remaining terms of the respective leases and the value of below-market leases is accreted to minimum rent over the remaining terms of the respective leases, including below-market renewal options, if applicable. If a tenant exercises an option to renew a lease as per the lease agreement, the Company capitalizes any related leasing commissions and recognizes any related option fees as agreed upon. The Company does not allocate value to customer relationship intangibles if it has pre-existing business relationships with the major retailers in the acquired property since they do not provide incremental value over the Company’s existing relationships.
The Company classifies an operating property or a property in development as held-for-sale when the Company determines that the property is available for immediate sale in its present condition, the property is being actively marketed for sale, and management believes it is probable that a sale will be consummated within one year. Given the nature of all real estate sales contracts, it is not unusual for such contracts to allow prospective buyers a period of time to evaluate the property prior to formal acceptance of the contract. In addition, certain other matters critical to the final sale, such as financing arrangements, often remain pending even upon contract acceptance. As a result, properties under contract may not close within the expected time period, or may not close at all. Therefore, any properties categorized as held-for-sale represent only those properties that management has determined are probable to close within the requirements set forth above. Operating properties held-for-sale are carried at the lower of cost or fair value less costs to sell. The recording of depreciation and amortization expense is suspended during the held-for-sale period. If circumstances arise that previously were considered unlikely and, as a result, the Company decides not to sell a property previously classified as held-for-sale, the property is reclassified as held and used and is measured individually at the lower of its (i) carrying amount before the property was classified as held-for-sale, adjusted for any depreciation and amortization expense that would have been recognized had the property been continuously classified as held and used or (ii) the fair value at the date of the subsequent decision not to sell. Any required adjustment to the carrying amount of the property
87
Table of Contents
Regency Centers Corporation and Regency Centers, L.P.
Notes to Consolidated Financial Statements—(Continued)
December 31, 2009
reclassified as held and used is included in income from continuing operations in the period of the subsequent decision not to sell. If a property is reclassified as held and used, the results of operations of the property previously reported in discontinued operations are reclassified and included in income from continuing operations for all periods presented.
When the Company sells a property or classifies a property as held-for-sale and will not have significant continuing involvement in the operation of the property, the operations of the property are eliminated from ongoing operations and classified in discontinued operations. Its operations, including any mortgage interest and gain on sale, are reported in discontinued operations so that the operations are clearly distinguished. Prior periods are also reclassified to reflect the operations of the property as discontinued operations. When the Company sells an operating property to a joint venture or to a third party, and will continue to manage the property, the operations and gain on sale are included in income from continuing operations.
The Company reviews its real estate portfolio including the properties owned through real estate partnerships for impairment whenever events or changes in circumstances indicate that the carrying amount may not be recoverable. For properties to be “held and used” for long term investment, the Company estimates undiscounted future cash flows over the expected investment term including the estimated future value of the asset upon sale at the end of the investment period. Future value is generally determined by applying a market-based capitalization rate to the estimated future net operating income in the final year of the expected investment term. If after applying this method a property is determined to be impaired, the Company determines the provision for impairment based upon applying a market capitalization rate to current estimated net operating income as if the sale were to occur immediately. For properties “held-for-sale”, the Company estimates current resale values through appraisal information and other market data, less expected costs to sell. These methods of determining fair value can fluctuate significantly as a result of a number of factors, including changes in the general economy for those markets in which the Company operates, the Company’s estimated holding period of the property, tenant credit quality, and demand for new retail stores. If as a result of a change in the Company’s strategy for a specific property which the Company owns directly or through real estate partnerships, a property previously classified as held and used is changed to held-for-sale, or if its estimated holding period changes, such change could cause the Company to determine that the property is impaired and a provision for impairment would be recorded by the Company either directly or through a reduction of the Company’s equity in income (loss) of investments in real estate partnerships. During the years ended December 31, 2009 and 2008, the Company established a provision for impairment of $104.4 million and $34.9 million, respectively, of which $6.9 million and $3.4 million, respectively, is included in discontinued operations. See Note 10 for further discussion.
A loss in value of investments in real estate partnerships under the equity method of accounting, other than a temporary decline, must be recognized in the period in which the loss occurs. To evaluate the Company’s investment in real estate partnerships, the Company calculates the fair value of the investment by discounting estimated future cash flows over the expected term of the investment. During the year ended December 31, 2008, the Company established a $6.0 million provision for impairment on two investments in real estate partnerships as a result of this evaluation.
88
Table of Contents
Regency Centers Corporation and Regency Centers, L.P.
Notes to Consolidated Financial Statements—(Continued)
December 31, 2009
(d) Cash and Cash Equivalents
Any instruments which have an original maturity of 90 days or less when purchased are considered cash equivalents. At December 31, 2009 and 2008, $3.6 million and $8.7 million, respectively, of cash was restricted through escrow agreements required for a development and certain mortgage loans.
(e) Notes Receivable
The Company records notes receivable at cost on the accompanying Consolidated Balance Sheets and interest income is accrued as earned and netted against interest expense in the accompanying Consolidated Statements of Operations. If a note receivable is past due, meaning the debtor is past due per contractual obligations, the Company ceases to accrue interest. However, in the event the debtor subsequently becomes current, the Company will resume accruing interest and record the interest income accordingly. The Company evaluates the collectibility of both interest and principal for all notes receivable to determine whether impairment exists using the present value of expected cash flows discounted at the note receivable’s effective interest rate or, alternatively, at the observable market price of the loan or the fair value of the collateral if the loan is collateral dependent. In the event the Company determines a note receivable or a portion thereof is considered uncollectible, the Company records a provision for impairment. The Company estimates the collectibility of notes receivable taking into consideration the Company’s experience in the retail sector, available internal and external credit information, payment history, market and industry trends, and debtor credit-worthiness. During the years ended December 31, 2009 and 2008, the Company recorded a provision for impairment of approximately $465,000 and $1.1 million, respectively. See Notes 5 for further discussion.
(f) Deferred Costs
Deferred costs include leasing costs and loan costs, net of accumulated amortization. Such costs are amortized over the periods through lease expiration or loan maturity, respectively. If the lease is terminated early or if the loan is repaid prior to maturity, the remaining leasing costs or loan costs are written off. Deferred leasing costs consist of internal and external commissions associated with leasing the Company’s shopping centers. Net deferred leasing costs were $49.9 million and $46.8 million at December 31, 2009 and 2008, respectively. Deferred loan costs consist of initial direct and incremental costs associated with financing activities. Net deferred loan costs were $8.5 million and $10.7 million at December 31, 2009 and 2008, respectively.
(g) Derivative Financial Instruments
All derivative instruments, whether designated in hedging relationships or not, are recorded on the balance sheet at their fair values. The accounting for changes in the fair value of derivatives depends on the intended use of the derivative, whether the Company has elected to designate a derivative in a hedging relationship and apply hedge accounting and whether the hedging relationship has satisfied the criteria necessary to apply hedge accounting. Derivatives designated and qualifying as a hedge of the exposure to changes in the fair value of an asset, liability, or firm commitment attributable to a particular risk, such as interest rate risk, are considered fair value hedges. Derivatives designated and qualifying as a hedge of the exposure to variability in expected future cash flows, or other types of
89
Table of Contents
Regency Centers Corporation and Regency Centers, L.P.
Notes to Consolidated Financial Statements—(Continued)
December 31, 2009
forecasted transactions, are considered cash flow hedges. Hedge accounting generally provides for the matching of the timing of gain or loss recognition on the hedging instrument with the recognition of the changes in the fair value of the hedged asset or liability attributable to the hedged risk in a fair value hedge or the earnings effect of the hedged forecasted transactions in a cash flow hedge. The Company may enter into derivative contracts that are intended to economically hedge certain risks, even though hedge accounting does not apply or the Company elects not to apply hedge accounting.
The Company’s use of derivative financial instruments is intended to mitigate its interest rate risk on a related financial instrument or forecasted transaction through the use of interest rate swaps (the “Swaps”) and the Company designates these interest rate swaps as cash flow hedges. The gains or losses resulting from changes in fair value of derivatives that qualify as cash flow hedges are recognized in other comprehensive income (“OCI”) while the ineffective portion of the derivative’s change in fair value is recognized in the income statement as a loss on derivative instruments. Upon the settlement of a hedge, gains and losses remaining in OCI are amortized over the underlying term of the hedged transaction. The Company formally documents all relationships between hedging instruments and hedged items, as well as its risk management objectives and strategies for undertaking various hedge transactions. The Company assesses, both at inception of the hedge and on an ongoing basis, whether the derivatives that are used in hedging transactions are highly effective in offsetting changes in the cash flows and/or forecasted cash flows of the hedged items.
In assessing the valuation of the hedges, the Company uses standard market conventions and techniques such as discounted cash flow analysis, option pricing models, and termination costs at each balance sheet date. All methods of assessing fair value result in a general approximation of value, and such value may never actually be realized. See Notes 9 and 10 for further discussion.
The settlement of swap terminations are presented in cash flows provided by operating activities in the accompanying Consolidated Statements of Cash Flows.
(h) Income Taxes
The Parent Company believes it qualifies, and intends to continue to qualify, as a REIT under the Internal Revenue Code (the “Code”). As a REIT, the Parent Company will generally not be subject to federal income tax, provided that distributions to its stockholders are at least equal to REIT taxable income. Regency Realty Group, Inc. (“RRG”), a wholly-owned subsidiary of the Operating Partnership, is a Taxable REIT Subsidiary (“TRS”) as defined in Section 856(l) of the Code. RRG is subject to federal and state income taxes and files separate tax returns. As a pass through entity, the Operating Partnership’s taxable income or loss is reported by its partners, of which the Parent Company as general partner and 99% owner, is allocated its pro-rata share of tax attributes.
Income taxes are accounted for under the asset and liability method. Deferred tax assets and liabilities are recognized for the estimated tax consequences attributable to differences between the financial statement carrying amounts of existing assets and liabilities and their respective tax bases. Deferred tax assets and liabilities are measured using the enacted tax rates in effect for the year in which these temporary differences are expected to be recovered or settled. Deferred tax assets are evaluated to determine if a valuation
90
Table of Contents
Regency Centers Corporation and Regency Centers, L.P.
Notes to Consolidated Financial Statements—(Continued)
December 31, 2009
allowance is required and if, based on available evidence, it is more likely than not that all or some portion of the asset will not be realized, the Company records a valuation allowance.
Earnings and profits, which determine the taxability of dividends to stockholders, differs from net income reported for financial reporting purposes primarily because of differences in depreciable lives and cost bases of the operating properties, as well as other timing differences. See Note 7 for further discussion.
Tax positions are initially recognized in the financial statements when it is more likely than not the position will be sustained upon examination by the tax authorities. Such tax positions shall initially and subsequently be measured as the largest amount of tax benefit that has a greater than 50% likelihood of being realized upon ultimate settlement with the tax authority assuming full knowledge of the position and relevant facts. The Company believes that it has appropriate support for the income tax positions taken and to be taken on its tax returns and that its accruals for tax liabilities are adequate for all open tax years based on an assessment of many factors including past experience and interpretations of tax laws applied to the facts of each matter.
(i) Earnings per Share and Unit
Basic earnings per share of common stock and unit are computed based upon the weighted average number of common shares and units, respectively, outstanding during the period. Diluted earnings per share and unit reflect the conversion of obligations and the assumed exercises of securities including the effects of shares issuable under the Company’s share-based payment arrangements, if dilutive. Dividends paid on the Company’s share-based payment transactions are not participating securities as they are forfeitable. See Note 13 for the calculation of earnings per share (“EPS”) and earnings per unit (“EPU”).
(j) Treasury Stock
Repurchases of the Parent Company’s common stock are recorded at cost and are reflected as treasury stock in the accompanying Consolidated Statements of Equity and Comprehensive Income (Loss) of the Parent Company and in general partner preferred and common units in the accompanying Consolidated Statements of Changes in Capital and Comprehensive Income (Loss) of the Operating Partnership. Concurrent with stock repurchases by the Parent Company, the Operating Partnership repurchases the same amount of Partnership Units from the Parent Company.
In December 2009, the Company cancelled all 5,661,520 shares classified as treasury shares. As a result, additional paid-in capital was reduced by the amount in excess of the stated value.
k) Stock-Based Compensation
The Company grants stock-based compensation to its employees and directors. When the Parent Company issues common shares as compensation, it receives a like number of common units from the Operating Partnership. The Company is committed to contribute to the Operating Partnership all proceeds from the exercise of stock options or other share-based awards granted under the Parent Company’s Long-Term Omnibus Plan (the “Plan”). Accordingly, the Parent Company’s ownership in the Operating Partnership will increase
91
Table of Contents
Regency Centers Corporation and Regency Centers, L.P.
Notes to Consolidated Financial Statements—(Continued)
December 31, 2009
based on the amount of proceeds contributed to the Operating Partnership for the common units it receives. As a result of the issuance of common units to the Parent Company for stock-based compensation, the Operating Partnership accounts for stock-based compensation in the same manner as the Parent Company.
The Company recognizes stock-based compensation based on the grant-date fair value of the award and the cost of the stock-based compensation is expensed over the vesting period. See Note 12 for further discussion.
(l) Segment Reporting
The Company’s business is investing in retail shopping centers through direct ownership or through joint ventures. The Company actively manages its portfolio of retail shopping centers and may from time to time make decisions to sell lower performing properties or developments not meeting its long-term investment objectives. The proceeds from sales are reinvested into higher quality retail shopping centers, through acquisitions or new developments, which management believes will meet its expected rate of return. It is management’s intent that all retail shopping centers will be owned or developed for investment purposes; however, the Company may decide to sell all or a portion of a development upon completion. The Company’s revenues and net income are generated from the operation of its investment portfolio. The Company also earns fees from third parties for services provided to manage and lease retail shopping centers owned through joint ventures.
The Company’s portfolio is located throughout the United States; however, management does not distinguish or group its operations on a geographical basis for purposes of allocating resources or measuring performance. The Company reviews operating and financial data for each property on an individual basis; therefore, the Company defines an operating segment as its individual properties. The individual properties have been aggregated into one reportable segment based upon their similarities with regard to both the nature and economics of the centers, tenants and operational processes, as well as long-term average financial performance. In addition, no single tenant accounts for 5% or more of revenue and none of the shopping centers are located outside the United States.
(m) Financial Instruments with Characteristics of Both Liabilities and Equity
The Company accounts for the fair value of noncontrolling interests in consolidated entities with specified termination dates in accordance with FASB ASC Topic 480. See Note 10 for further discussion.
(n) Assets and Liabilities Measured at Fair Value
Fair value is a market-based measurement, not an entity-specific measurement. Therefore, a fair value measurement is determined based on the assumptions that market participants would use in pricing the asset or liability. As a basis for considering market participant assumptions in fair value measurements, the Company uses a fair value hierarchy that distinguishes between market participant assumptions based on market data obtained from independent sources (observable inputs that are classified within Levels 1 and 2 of the hierarchy) and the Company’s own assumptions about market participant assumptions
92
Table of Contents
Regency Centers Corporation and Regency Centers, L.P.
Notes to Consolidated Financial Statements—(Continued)
December 31, 2009
(unobservable inputs classified within Level 3 of the hierarchy). The three levels of inputs used to measure fair value are as follows:
| • | Level 1 - Quoted prices (unadjusted) in active markets for identical assets or liabilities that the Company has the ability to access. |
| • | Level 2 - Inputs other than quoted prices included in Level 1 that are observable for the asset or liability, either directly or indirectly. |
| • | Level 3 - Unobservable inputs for the asset or liability, which are typically based on the Company’s own assumptions, as there is little, if any, related market activity. |
The Company also remeasures nonfinancial assets and nonfinancial liabilities, initially measured at fair value in a business combination or other new basis event, at fair value in subsequent periods. See Note 10 for all fair value measurements of assets and liabilities made on a recurring and nonrecurring basis.
(o) Recent Accounting Pronouncements
In January 2010, the FASB issued Accounting Standards Update (“ASU”) No. 2010-06, “Fair Value Measurements and Disclosures (820) – Improving Disclosures about Fair Value Measurements” (“ASU 2010-06”). ASU 2010-06 provides amendments to Subtopic 820-10 and requires new disclosures for transfers in and out of Levels 1 and 2 and activity in Level 3 fair value measurements. ASU 2010-06 also clarifies existing disclosure requirements for the level of disaggregation for each class of assets and liabilities and for the inputs and valuation techniques used to measure fair value. ASU 2010-06 is effective for financial statements issued for interim and annual periods ending after December 15, 2009, except for the disclosures about purchases, sales, issuances, and settlements in the roll forward of activity in Level 3 fair value measurements which is effective for fiscal years beginning after December 15, 2010, and for interim periods within those fiscal years. The Company adopted this ASU on December 31, 2009.
In December 2009, the FASB issued ASU No. 2009-17 “Improvements to Financial Reporting by Enterprises Involved with Variable Interest Entities” (“ASU 2009-17”). ASU 2009-17 was issued to reflect the amendments from Statement 167 “Amendments to FASB Interpretation No. 46(R)” as a revision to FASB Interpretation No. 46 (Revised December 2003), “Consolidation of Variable Interest Entities”. ASU 2009-17 changes how a reporting entity determines when an entity that is insufficiently capitalized or is not controlled through voting (or similar rights) should be consolidated. The determination of whether a reporting entity is required to consolidate another entity is based on, among other things, the other entity’s purpose and design and the reporting entity’s ability to direct the activities of the other entity that most significantly impact the other entity’s economic performance. ASU 2009-17 was effective January 1, 2010 and early application is not permitted. The Company has evaluated the adoption of this ASU and it will not have an effect on its results of operations or financial position, as the Company does not currently have any variable interests that it believes would require consolidation.
93
Table of Contents
Regency Centers Corporation and Regency Centers, L.P.
Notes to Consolidated Financial Statements—(Continued)
December 31, 2009
(p) Reclassifications
Certain reclassifications have been made to the 2008 and 2007 amounts to conform to classifications adopted in 2009.
2. Real Estate Investments
During 2009 and 2008, the Company did not have any acquisition activity, other than through its investments in real estate partnerships.
3. Discontinued Operations
The Company maintains a conservative capital structure to fund its growth program without compromising its investment-grade ratings. This approach is founded on a self-funding business model which utilizes center “recycling” as a key component and requires ongoing monitoring of each center to ensure that it meets the Company’s investment standards. This recycling strategy calls for the Company to sell non-strategic assets and re-deploy the proceeds into new, high-quality developments and acquisitions that are expected to generate sustainable revenue growth and more attractive returns.
During the year ended December 31, 2009, the Company sold 100% of its ownership interest in one operating property and four properties in development for proceeds of $73.0 million, net of notes receivable taken by the Company of $20.4 million of which $8.9 million was subsequently paid in full in May 2009. The combined operating income and gain on the sale of these properties and properties classified as held-for-sale were reclassified to discontinued operations. The revenues from properties included in discontinued operations were $8.7 million, $16.4 million, and $19.9 million for the years ended December 31, 2009, 2008, and 2007, respectively. The operating income and gains on sales of properties included in discontinued operations are reported net of income taxes, if the property is sold by the TRS. During 2009, approximately $2.1 million of income tax benefit was allocated to operating income (loss) from discontinued operations. During 2007, approximately $85,000 of income tax expense was allocated to operating income (loss) from discontinued operations and $1.9 million of income taxes was allocated to gain on sale of operating properties and properties in development.
4. Investments in Real Estate Partnerships
The Company’s investments in real estate partnerships were $326.2 million and $383.4 million at December 31, 2009 and 2008, respectively. Net income or loss from these real estate partnerships, which includes all operating results (including impairments) and gains on sales of properties within the joint ventures, is allocated to the Company in accordance with the respective partnership agreements. Such allocations of net income or loss are recorded in equity in income (loss) of investments in real estate partnerships in the accompanying Consolidated Statements of Operations. The net difference between the carrying amount of these investments and the underlying equity in net assets was $43.8 million and $77.3 million at December 31, 2009 and 2008, respectively. For non-DIK-JV’s, the net difference is accreted to income and recorded in equity in income (loss) of investments in real estate partnerships in the accompanying Consolidated Statements of Operations over the expected useful lives of the properties and other intangible assets, which range in lives from 10 to 40 years, whereas for DIK-JV’s, the net difference is recognized at liquidation.
94
Table of Contents
Regency Centers Corporation and Regency Centers, L.P.
Notes to Consolidated Financial Statements—(Continued)
December 31, 2009
Cash distribution of earnings from operations from investments in real estate partnerships are presented in cash flows provided by operating activities in the accompanying Consolidated Statements of Cash Flows. Cash distributions from the sale of a property or loan proceeds received from the placement of debt on a property included in investments in real estate partnerships are presented in cash flows provided by investing activities in the accompanying Consolidated Statements of Cash Flows.
Investments in real estate partnerships are primarily composed of real estate partnerships where the Company invests with four co-investment partners and an open-end real estate fund (“Regency Retail Partners” or the “Fund”), as further described below. In addition to earning its pro-rata share of net income or loss in each of these real estate partnerships, the Company received recurring market-based fees for asset management, property management, leasing, investment, and financing services of $29.1 million, $31.6 million, and $28.3 million and transaction fees of $7.8 million, $23.7 million, and $4.0 million for the years ended December 31, 2009, 2008, and 2007, respectively.
Investments in real estate partnerships as of December 31, 2009 and 2008 consist of the following (in thousands):
| Ownership | 2009 | 2008 | ||||||
| Macquarie CountryWide-Regency (MCWR I) (1) |
— | $ | — | 11,137 | ||||
| Macquarie CountryWide Direct (MCWR I) (1) |
— | — | 3,760 | |||||
| Macquarie CountryWide-Regency II (MCWR II) (2) |
25.00 | % | 154,350 | 197,602 | ||||
| Macquarie CountryWide-Regency III (MCWR III) |
24.95 | % | 351 | 623 | ||||
| Macquarie CountryWide-Regency-DESCO (MCWR-DESCO) |
16.35 | % | 24,374 | 21,924 | ||||
| Columbia Regency Retail Partners (Columbia I) |
20.00 | % | 28,347 | 29,704 | ||||
| Columbia Regency Partners II (Columbia II) |
20.00 | % | 11,202 | 12,858 | ||||
| Cameron Village LLC (Cameron) |
30.00 | % | 18,285 | 19,479 | ||||
| RegCal, LLC (RegCal) |
25.00 | % | 12,863 | 13,766 | ||||
| Regency Retail Partners (the Fund) |
20.00 | % | 22,114 | 23,838 | ||||
| US Regency Retail I, LLC (USAA) |
20.01 | % | 5,111 | — | ||||
| Other investments in real estate partnerships |
50.00 | % | 49,215 | 48,717 | ||||
| Total |
$ | 326,212 | 383,408 | |||||
| (1) | At December 31, 2008, the Company’s ownership interest in MCWR I was 25.00%. The liquidation of MCWR I was completed in 2009. |
| (2) | At December 31, 2008, the Company’s ownership interest in MCWR II was 24.95%. |
Investments in real estate partnerships are reported net of deferred gains of $52.0 million and $88.3 million at December 31, 2009 and 2008, respectively. Cumulative deferred gain amounts related to each real estate partnership are described below.
The Company co-invests with the Oregon Public Employees Retirement Fund (“OPERF”) in three real estate partnerships, two of which the Company has ownership interests of 20% (“Columbia I” and “Columbia II”) and one in which the Company has an ownership interest of 30% (“Cameron”). The Company’s investment in these three real estate partnerships totals $57.8 million and represents 1.5% of the Company’s total assets at December 31, 2009. At December 31, 2009,
95
Table of Contents
Regency Centers Corporation and Regency Centers, L.P.
Notes to Consolidated Financial Statements—(Continued)
December 31, 2009
the OPERF joint ventures had total assets of $743.3 million and net income of $5.4 million for the year ended and the Company’s share of its total assets and net income was $160.5 million and approximately $506,000, respectively.
As of December 31, 2009, Columbia I owned 14 shopping centers, had total assets of $320.4 million, and net income of $6.7 million for the year ended. The partnership agreement has a unilateral right to elect to dissolve the partnership and receive a DIK upon liquidation; therefore, the Company has applied the Restricted Gain Method to determine the amount of gain recognized on property sales to Columbia I. During 2009, the Company did not sell any properties to Columbia I. Since the inception of Columbia I in 2001, the Company has recognized gain of $2.0 million on partial sales to Columbia I and deferred gain of $4.3 million. In December 2008, the Company earned and recognized a $19.7 million Portfolio Incentive Return fee from OPERF based on Columbia I’s outperformance of the cumulative National Council of Real Estate Investment Fiduciaries (“NCREIF”) index since the inception of the partnership and a cumulative hurdle rate as outlined in the partnership agreement which was reflected in other receivables as of December 31, 2008. The Company collected the receivable in full in April 2009.
As of December 31, 2009, Columbia II owned 16 shopping centers, had total assets of $313.3 million and net income of approximately $159,000 for the year ended. The partnership agreement has a unilateral right to elect to dissolve the partnership and receive a DIK upon liquidation; therefore, the Company has applied the Restricted Gain Method to determine the amount of gain recognized on property sales to Columbia II. During 2009, the Company did not sell any properties to Columbia II. Since the inception of Columbia II in 2004, the Company has recognized gain of $9.1 million on partial sales to Columbia II and deferred gain of $15.7 million.
As of December 31, 2009, Cameron owned one shopping center, had total assets of $109.6 million and a net loss of $1.4 million for the year ended. The partnership agreement does not contain any DIK provisions that would require the Company to apply the Restricted Gain Method. Since the inception of Cameron in 2004, the Company has not sold any properties to Cameron.
The Company co-invests with the California State Teachers’ Retirement System (“CalSTRS”) in a joint venture (“RegCal”) in which the Company has a 25% ownership interest. As of December 31, 2009, RegCal owned seven shopping centers, had total assets of $155.1 million, and net income of approximately $493,000 for the year ended and the Company’s share of its total assets and net income was $38.8 million and approximately $123,000, respectively. The partnership agreement has a unilateral right to elect to dissolve the partnership and receive a DIK upon liquidation; therefore, the Company has applied the Restricted Gain Method to determine the amount of gain recognized on property sales to RegCal. During 2009, the Company did not sell any properties to RegCal. Since the inception of RegCal in 2004, the Company has recognized gain of $10.1 million on partial sales to RegCal and deferred gain of $3.4 million.
The Company co-invests with Macquarie CountryWide Trust of Australia (“MCW”) as the only other partner in three real estate partnerships, one in which the Company had an ownership interest of 25% (“MCWR I”) which was liquidated during 2009 as discussed below, one in which the Company has an ownership interest of 24.95% (““MCWR III”), and one in which the Company has an ownership interest of 16.35% (“MCWR-DESCO”). The Company’s investment with MCW totals $24.7 million and represents less than 1% of the Company’s total assets at December 31, 2009.
96
Table of Contents
Regency Centers Corporation and Regency Centers, L.P.
Notes to Consolidated Financial Statements—(Continued)
December 31, 2009
On January 14, 2009, under the terms of the MCWR I partnership agreement, MCW elected to dissolve the partnership. During 2009, the Company completed the liquidation of the partnership through a DIK, which provided for distribution of the properties to each partner under an alternating selection process, in proportion to the value of each partner’s respective capital account in the partnership as of the date of liquidation. The total fair value of the properties was $467.3 million, net of debt, based on third party appraisals. As a result of the liquidation, MCW received 34 properties and the Company received six properties through the DIK. The six properties the Company received had a fair value of $131.9 million, net of debt, which represents a return of the Company’s investment and a $13.1 million promote, which was not recognized in net income in accordance with the Restricted Gain Method. Consistent with the Restricted Gain Method, the properties that the Company received in liquidation were recorded at the net carrying value of its investment of $29.9 million, which is net of deferred gain previously recorded of $40.8 million. As a result, no gain or loss was recognized on the dissolution. MCWR I had net income of $4.8 million for the year ended and the Company’s share was $1.2 million. During 2009, MCWR I sold one shopping center to a third party for $7.8 million and recognized a gain of $3.7 million.
As of December 31, 2009, MCWR III owned four shopping centers, had total assets of $65.1 million, and a net loss of approximately $436,000 for the year ended and the Company’s share of its total assets and net loss was $16.2 million and net income of approximately $150,000, respectively, which includes the Company’s share of the net loss offset by the accretion of the basis difference. Effective January 1, 2010, the partnership agreement was amended to include a unilateral right to elect to dissolve the partnership and receive a DIK upon liquidation; therefore, the Company will apply the Restricted Gain Method if properties are sold to MCWR III on or after January 1, 2010. Accordingly, the Company will recognize gains on such future sales only when such gains exceed amounts required to be deferred under the Restricted Gain Method. During 2009, the Company did not sell any properties to MCWR III. Since the inception of MCWR III in 2005, the Company has recognized gain of $14.1 million on partial sales to MCWR III and deferred gain of $4.7 million.
As of December 31, 2009, MCWR-DESCO owned 32 shopping centers, had total assets of $382.1 million, and recorded a net loss of $5.3 million for the year ended and the Company’s share of its total assets and net loss was $62.5 million and approximately $883,000, respectively. The partnership agreement does not contain any DIK provisions that would require the Company to apply the Restricted Gain Method. Since the inception of MCWR-DESCO in 2007, the Company has not sold any properties to the real estate partnership.
The Company co-invests with MCW and Global Retail Investors LLC (“GRI”), a joint venture between the California Public Employees’ Retirement System (“CalPERS”) and an affiliate of First Washington Realty, Inc. in one real estate partnership in which the Company has an ownership interest of 25% (“MCWR II”). The Company’s investment in MCWR II totals $154.4 million and represents 3.9% of the Company’s total assets at December 31, 2009.
On July 17, 2009, the Company announced that MCW had agreed to sell 60% of its partnership interest in MCWR II to GRI in two closings. The initial closing was completed on July 31, 2009, with MCW selling 45% of its 75% interest to GRI. As part of the closing, the Company acquired Macquarie-Regency Management, LLC’s (“US Manager”) 0.1% ownership of MCWR II. US Manager was owned 50/50 by the Company and an affiliate of Macquarie Bank Limited. The transaction increased the Company’s ownership in MCWR II to 25% from 24.95%. At the initial
97
Table of Contents
Regency Centers Corporation and Regency Centers, L.P.
Notes to Consolidated Financial Statements—(Continued)
December 31, 2009
closing the Company received a disposition fee of $7.8 million from MCW equal to 1% of the gross sales price paid by GRI. At the second closing, GRI will acquire from MCW, an incremental 15% interest increasing its total ownership in MCWR II to 60%. The Company expects this to occur once the existing mortgage lenders consent to the transaction or MCW prepays the mortgage loans. The Company will retain asset management, property management, and leasing responsibilities. The Company will receive an additional disposition fee equal to 1% of gross sales price paid by GRI at future closings. As part of the agreement, the Company negotiated two separate options to acquire additional interests in the partnership at a 7.7% discount. If both options were exercised, Regency would acquire MCW’s then remaining 15% interest in MCWR II, increasing Regency’s total ownership to 40%. In November 2009, the Company exercised its two options to acquire the additional 15% interest in MCWR II. Closing is contingent upon obtaining lender consents and is expected in early 2010. The Company funded the purchase price of $16.0 million on December 23, 2009, which will be held in escrow until closing, and the deposit is recorded in other assets in the accompanying Consolidated Balance Sheets.
As of December 31, 2009, MCWR II owned 86 shopping centers, had total assets of $2.2 billion and a net loss of $112.4 million for the year ended and the Company’s share of its total assets and net loss was $550.8 million and $28.3 million, respectively. The net loss was primarily related to the provision for impairment recorded during 2009 as a result of MCW’s decision to sell its interest in MCWR II which resulted in a change in holding period for certain properties. As part of the sales negotiation, the joint venture identified 14 properties that it would target for sale over the next three years. These properties were previously expected to be held and used long term and this change in the holding period resulted in a provision for impairment of $104.4 million. Effective January 1, 2010, the partnership agreement was amended to include a unilateral right to elect to dissolve the partnership and receive a DIK upon liquidation; therefore, the Company will apply the Restricted Gain Method if properties are sold to MCWR II on or after January 1, 2010. Accordingly, the Company will recognize gains on such future sales only when such gains exceed amounts required to be deferred under the Restricted Gain Method. During 2009, the Company did not sell any properties to MCWR II. Since the inception of MCWR II in 2005, the Company has recognized gain of $2.3 million on partial sales to MCWR II and deferred gain of approximately $766,000.
The Company co-invests with Regency Retail Partners (the “Fund”), an open-ended, infinite life investment fund in which the Company has an ownership interest of 20%. As of December 31, 2009, the Fund owned nine shopping centers, had total assets of $367.4 million, and recorded a net loss of $3.4 million for the year ended and the Company’s share of its total assets and net loss was $73.4 million and approximately $464,000, respectively. The partnership agreement does not contain any DIK provisions that would require the Company to apply the Restricted Gain Method. During 2009, the Company did not sell any properties to the Fund. Since the inception of the Fund in 2006, the Company has recognized gains of $71.6 million on partial sales to the Fund and deferred gain of $17.9 million.
On October 27, 2009 the Company finalized the formation of a new real estate partnership, US Regency Retail I, LLC, with United Services Automobile Association (the “USAA partnership”) in which the Company has an ownership interest of 20.01%, and sold seven shopping centers to the real estate partnership. One additional property was sold to the USAA partnership on November 3, 2009. The eight properties were sold for $133.9 million and net proceeds to the Company from the sale were $103.3 million. The partnership agreement has a unilateral right to elect to dissolve the partnership and receive a DIK upon liquidation; therefore, the Company applied the Restricted
98
Table of Contents
Regency Centers Corporation and Regency Centers, L.P.
Notes to Consolidated Financial Statements—(Continued)
December 31, 2009
Gain Method to determine the amount of gain recognized. The Company recognized gain of $19.1 million and deferred gain of $8.1 million on partial sales to the USAA partnership.
Summarized financial information for the investments in real estate partnerships on a combined basis, is as follows (in thousands):
| December 30, 2009 |
December 31, 2008 | ||||
| Investment in real estate, net |
$ | 3,900,277 | 4,518,783 | ||
| Acquired lease intangible assets, net |
147,151 | 186,141 | |||
| Other assets |
137,753 | 157,806 | |||
| Total assets |
$ | 4,185,181 | 4,862,730 | ||
| Notes payable |
$ | 2,477,928 | 2,792,450 | ||
| Acquired lease intangible liabilities, net |
87,009 | 97,146 | |||
| Other liabilities |
80,011 | 83,814 | |||
| Members’ or Partners’ capital |
1,540,233 | 1,889,320 | |||
| Total liabilities and capital |
$ | 4,185,181 | 4,862,730 | ||
Investments in real estate partnerships had notes payable of $2.5 billion and $2.8 billion as of December 31, 2009 and 2008, respectively, and the Company’s proportionate share of these loans was $585.5 million and $664.1 million, respectively. The Company does not guarantee these loans with the exception of an $8.5 million loan related to its 50% ownership interest in a single asset real estate partnership where the loan agreement contains “several” guarantees from each partner.
As of December 31, 2009, scheduled principal repayments on notes payable of the investments in real estate partnerships were as follows (in thousands):
| Scheduled Principal Payments by Year: |
Scheduled Principal Payments |
Mortgage Loan Maturities |
Unsecured Maturities |
Total | Regency’s Pro-Rata Share | ||||||
| 2010 |
$ | 3,642 | 613,310 | 26,858 | 643,810 | 160,173 | |||||
| 2011 |
3,578 | 448,787 | — | 452,365 | 112,037 | ||||||
| 2012 |
4,396 | 244,418 | — | 248,814 | 61,551 | ||||||
| 2013 |
4,226 | 32,447 | — | 36,673 | 8,982 | ||||||
| 2014 |
4,213 | 77,290 | — | 81,503 | 21,540 | ||||||
| Beyond 5 Years |
25,555 | 983,875 | — | 1,009,430 | 220,159 | ||||||
| Unamortized debt premiums, net |
— | 5,333 | — | 5,333 | 1,030 | ||||||
| Total |
$ | 45,610 | 2,405,460 | 26,858 | 2,477,928 | 585,472 | |||||
99
Table of Contents
Regency Centers Corporation and Regency Centers, L.P.
Notes to Consolidated Financial Statements—(Continued)
December 31, 2009
The revenues and expenses for the investments in real estate partnerships on a combined basis are summarized as follows (in thousands):
| For the years ended December 31, | ||||||||||
| 2009 | 2008 | 2007 | ||||||||
| Total revenues |
$ | 434,050 | 491,246 | 453,580 | ||||||
| Operating expenses: |
||||||||||
| Depreciation and amortization |
160,484 | 182,844 | 176,597 | |||||||
| Operating and maintenance |
63,855 | 70,158 | 64,917 | |||||||
| General and administrative |
8,247 | 8,860 | 9,589 | |||||||
| Real estate taxes |
59,339 | 63,393 | 53,845 | |||||||
| Provision for doubtful accounts |
10,062 | 2,765 | 1,512 | |||||||
| Other expenses |
2,098 | 658 | 304 | |||||||
| Total operating expenses |
304,085 | 328,678 | 306,764 | |||||||
| Other expense (income): |
||||||||||
| Interest expense, net |
137,794 | 146,765 | 135,760 | |||||||
| Gain on sale of real estate |
(6,141 | ) | (14,461 | ) | (38,165 | ) | ||||
| Provision for impairment |
104,416 | — | — | |||||||
| Other income |
72 | 139 | 138 | |||||||
| Total other expense (income) |
236,141 | 132,443 | 97,733 | |||||||
| Net income (loss) |
$ | (106,176 | ) | 30,125 | 49,083 | |||||
5. Notes Receivable
The Company had notes receivable outstanding of $37.8 million and $31.4 million at December 31, 2009 and 2008, respectively. The notes receivable have fixed interest rates ranging from 6.0% to 10.0% with maturity dates through January 2019. During the years ended December 31, 2009 and 2008, impairment losses of approximately $465,000 related to an $879,000 note receivable and $1.1 million related to a $3.6 million note receivable, respectively, were recorded in provision for impairment in the accompanying Consolidated Statements of Operations. During the years ended December 31, 2009 and 2008, the Company recorded approximately $50,000 and $417,000 in interest income related to these impaired loans of which $296,000 was recognized on a cash basis during the year ended December 31, 2008.
On December 18, 2009, the Company provided a $11.4 million note receivable maturing in January 2019 with a fixed interest rate of 7% in connection with a property sale to a third party. On February 20, 2009, the Company received a repayment of a $3.2 million note receivable originally maturing in December 2010.
6. Acquired Lease Intangibles
The Company had acquired lease intangible assets, net of amortization, of $10.0 million and $12.9 million at December 31, 2009 and 2008, respectively, of which $9.7 million and $12.5 million, respectively relates to in-place leases. These in-place leases had a remaining weighted
100
Table of Contents
Regency Centers Corporation and Regency Centers, L.P.
Notes to Consolidated Financial Statements—(Continued)
December 31, 2009
average amortization period of 5.6 years and the aggregate amortization expense recorded for these in-place leases was approximately $2.7 million, $4.2 million, and $4.3 million for the years ended December 31, 2009, 2008, and 2007, respectively. The Company had above-market lease intangible assets, net of amortization, of approximately $341,000 and $442,000 at December 31, 2009 and 2008, respectively. The remaining weighted average amortization period was 3.4 years and the aggregate amortization expense recorded as a reduction to minimum rent for these above-market leases was approximately $102,000, $113,000, and $115,000 for the years ended December 31, 2009, 2008, and 2007, respectively.
The Company had acquired lease intangible liabilities, net of accretion, of $5.9 million and $7.9 million as of December 31, 2009 and 2008, respectively. The remaining weighted average accretion period is 4.0 years and the aggregate amount recorded as an increase to minimum rent for these below-market rents was approximately $1.9 million, $2.5 million, and $2.0 million for the years ended December 31, 2009, 2008, and 2007, respectively.
The estimated aggregate amortization and net accretion amounts from acquired lease intangibles for the next five years are as follows (in thousands):
| Year Ending December 31, |
Amortization Expense |
Minimum Rent, Net | |||
| 2010 |
$ | 2,100 | 752 | ||
| 2011 |
1,614 | 676 | |||
| 2012 |
1,203 | 607 | |||
| 2013 |
1,049 | 598 | |||
| 2014 |
851 | 581 | |||
7. Income Taxes
The net book basis of the Company’s real estate assets exceeds the tax basis by approximately $78.7 million and $97.5 million at December 31, 2009 and 2008, respectively, primarily due to the difference between the cost basis of the assets acquired and their carryover basis recorded for tax purposes.
The following summarizes the tax status of dividends paid during the respective years:
| 2009 | 2008 | 2007 | ||||||||
| Dividend per share |
$ | 2.11 | 2.90 | 2.64 | ||||||
| Ordinary income |
54 | % | 73 | % | 85 | % | ||||
| Capital gain |
14 | % | 22 | % | 15 | % | ||||
| Return of capital |
32 | % | 5 | % | — | |||||
101
Table of Contents
Regency Centers Corporation and Regency Centers, L.P.
Notes to Consolidated Financial Statements—(Continued)
December 31, 2009
RRG is subject to federal and state income taxes and files separate tax returns. Income tax expense is included in other expenses in the accompanying Consolidated Statements of Operations and consists of the following for the years ended December 31, 2009, 2008, and 2007 (in thousands):
| 2009 | 2008 | 2007 | |||||||
| Income tax (benefit) expense: |
|||||||||
| Current |
$ | 4,692 | 88 | 5,669 | |||||
| Deferred |
(4,894 | ) | (1,688 | ) | 530 | ||||
| Total income tax (benefit) expense |
$ | (202 | ) | (1,600 | ) | 6,199 | |||
Income tax expense (benefit) is included in either other expenses if the related income is from continuing operations or discontinued operations on the Consolidated Statements of Operations as follows for the years ended December 31, 2009, 2008, and 2007 (in thousands):
| 2009 | 2008 | 2007 | |||||||
| Income tax expense (benefit) from: |
|||||||||
| Continuing operations |
$ | 1,883 | (1,600 | ) | 4,197 | ||||
| Discontinued operations |
(2,085 | ) | — | 2,002 | |||||
| Total income tax expense (benefit) |
$ | (202 | ) | (1,600 | ) | 6,199 | |||
Income tax expense (benefit) differed from the amounts computed by applying the U.S. Federal income tax rate of 34% to pretax income of RRG for the years ended December 31, 2009, 2008, and 2007, respectively as follows (in thousands):
| 2009 | 2008 | 2007 | |||||||
| Computed expected tax expense (benefit) |
$ | (4,791 | ) | (2,324 | ) | 3,974 | |||
| Increase in income tax resulting from state taxes |
(558 | ) | (197 | ) | 443 | ||||
| Provision for valuation allowance |
4,755 | — | — | ||||||
| All other items |
392 | 921 | 1,782 | ||||||
| Total income tax expense (benefit) |
$ | (202 | ) | (1,600 | ) | 6,199 | |||
All other items principally represent the tax effect of gains associated with the sale of properties to joint ventures. Included in the income tax expense (benefit) disclosed above, the Company has approximately $600,000 of state income tax expense at the Operating Partnership for the Texas Gross Margin Tax recorded in other expenses in the accompanying Consolidated Statements of Operations for the years ended December 31, 2009, 2008, and 2007.
To the extent of any taxable losses of the TRS, RRG could elect to carryback the loss up to five years under the Worker, Homeownership, and Business Assistance Act of 2009.
102
Table of Contents
Regency Centers Corporation and Regency Centers, L.P.
Notes to Consolidated Financial Statements—(Continued)
December 31, 2009
The following table represents the Company’s net deferred tax assets as of December 31, 2009 and 2008 recorded in other assets in the accompanying Consolidated Balance Sheets (in thousands):
| 2009 | 2008 | ||||||
| Deferred tax assets |
$ | 19,802 | 17,887 | ||||
| Deferred tax liabilities |
(1,057 | ) | (825 | ) | |||
| Provision for valuation allowance |
(4,755 | ) | — | ||||
| Total |
$ | 13,990 | 17,062 | ||||
During 2009, a valuation allowance of $4.8 million was established representing 100% of the disallowed interest, under Section 163(j) of the Code, included in the deferred tax assets. It was determined to be more likely than not that it will not be realized. Other deferred tax assets and deferred tax liabilities relate primarily to differences in the timing of the recognition of income or loss between U.S. GAAP and tax basis of accounting. Excluding the provision for valuation allowance, significant portions of the deferred tax assets and deferred tax liabilities include a $5.6 million deferred tax asset for capitalized costs under Section 263A of the Code, an $8.0 million deferred tax asset related to the provision for impairment, and approximately $811,000 deferred tax liability for other differences.
The Company accounts for uncertainties in income tax law in accordance with FASB ASC Topic 740. Under FASB ASC Topic 740, tax positions shall initially be recognized in the financial statements when it is more likely than not the position will be sustained upon examination by the tax authorities. Such tax positions shall initially and subsequently be measured as the largest amount of tax benefit that has a greater than 50% likelihood of being realized upon ultimate settlement with the tax authority assuming full knowledge of the position and relevant facts. The Company believes that it has appropriate support for the income tax positions taken and to be taken on its tax returns and that its accruals for tax liabilities are adequate for all open tax years based on an assessment of many factors including past experience and interpretations of tax laws applied to the facts of each matter. Federal and state tax returns are open from 2006 and forward for the Company and federal returns are open from 2008 and forward for the TRS.
During 2008, the Internal Revenue Service (“IRS”) commenced an examination of RRG’s U.S. income tax returns for 2006 and 2007 which was completed in June 2009. The IRS did not propose any adjustments to the open tax years under audit.
8. Notes Payable and Unsecured Credit Facilities
The Parent Company does not hold any indebtedness, but guarantees all of the unsecured public debt and less than 10% of the secured debt of the Operating Partnership.
Secured debt
On October 23, 2009, the Company closed on an amendment of its only variable rate mortgage loan in the amount of $5.0 million with an interest rate equal to LIBOR plus 350 basis points originally maturing on October 1, 2009 extending the loan maturity to October 1, 2014 with an interest rate equal to LIBOR plus 380 basis points.
103
Table of Contents
Regency Centers Corporation and Regency Centers, L.P.
Notes to Consolidated Financial Statements—(Continued)
December 31, 2009
On September 3, 2009, the Company closed on a $10.7 million two-year construction loan for a development project with an interest rate of LIBOR plus 300 basis points. The balance was approximately $992,000 at December 31, 2009.
On July 1, 2009, the Company closed on mortgage loans of $106.0 million secured by eight properties with an interest rate of 7.75% and a ten-year term.
In conjunction with properties distributed to the Company as part of the liquidation of MCWR I, the Company assumed four mortgage loans. In January 2009, the Company assumed two mortgage loans with carrying values of $17.0 million and $42.1 million with ten-year terms and interest rates of 6.13% and 6.38%, respectively, and in December 2009, the Company assumed two mortgage loans with carrying values of $4.5 million and $7.0 million maturing on May 1, 2010 with interest rates of 4.44%.
Unsecured debt
The Line commitment is currently $600.0 million under an agreement with Wells Fargo Bank and a syndicate of other banks that matures in February 2011 with a one-year extension at the Company’s option. The Company has the right to expand the Line commitment by an additional $150.0 million subject to additional lender syndication. The Line has a current interest rate of LIBOR plus 55 basis points and an annual facility fee of 15 basis points subject to maintaining its corporate credit and senior unsecured ratings at BBB. In April, 2009, the Company paid down the Line balance to zero and there was no balance at December 31, 2009. The balance on the Line was $70.0 million at December 31, 2008 with a contractual interest rate of 1.34% based on LIBOR plus 40 basis points.
During 2008, the Company entered into a $341.5 million, term loan facility (the “Term Facility”) under an agreement with Wells Fargo Bank and a syndicate of other banks that matures in February 2011. The Term Facility originally included a term loan of $227.7 million plus a $113.8 million revolving credit facility. In December 2009, the Company paid off the balance of the term loan and it is no longer available; however, the revolving credit facility remains available to the Company at its discretion. At December 31, 2009 and 2008, the balance on the Term Facility was zero and $227.7 million, respectively. At December 31, 2009, the revolving credit facility had a variable interest rate equal to LIBOR plus 100 basis points as compared to LIBOR plus 90 basis points at December 31, 2008 and an annual facility fee of 20 basis points subject to maintaining its corporate credit and senior unsecured ratings at BBB. At December 31, 2008, the term loan had a variable interest rate of 3.30% or LIBOR plus 105 basis points.
On September 30, 2009 Standard and Poor’s Rating Services lowered the Company’s corporate credit rating and senior unsecured debt rating to BBB from BBB+ primarily related to the reduction in its fixed charge coverage ratio in 2009. As a result of this downgrade, the interest rate on the Line increased to LIBOR plus 55 basis points and the interest rate on the revolving portion of the Term Facility increased to LIBOR plus 100 basis points effective October 1, 2009.
Including both the Line commitment and the Term Facility (collectively, “Unsecured credit facilities”), the Company currently has $713.8 million of total capacity and the spread paid is dependent upon the Company maintaining specific investment-grade ratings. The Company is also required to comply with certain financial covenants as defined in the Credit Agreement such as Minimum Net Worth, Ratio of Total Liabilities to Gross Asset Value (“GAV”) and Ratio of Recourse Secured Indebtedness to GAV, Ratio of Earnings Before Interest Taxes Depreciation
104
Table of Contents
Regency Centers Corporation and Regency Centers, L.P.
Notes to Consolidated Financial Statements—(Continued)
December 31, 2009
and Amortization (“EBITDA”) to Fixed Charges, and other covenants customary with this type of unsecured financing. As of December 31, 2009, management of the Company believes it is in compliance with all financial covenants for the Unsecured credit facilities. The Unsecured credit facilities are used to finance the acquisition and development of real estate and for general working-capital purposes.
Notes payable consist of mortgage loans secured by properties and unsecured public debt. Mortgage loans may be prepaid, but could be subject to yield maintenance premiums. Mortgage loans are generally due in monthly installments of principal and interest or interest only, and mature over various terms through 2019, whereas, interest on unsecured public debt is payable semi-annually and the debt matures over various terms through 2017. Fixed interest rates on mortgage loans range from 4.44% to 8.40% and average 6.63%. As of December 31, 2009, the Company had one variable rate mortgage loan in the amount of $4.6 million with an interest rate equal to LIBOR plus 380 basis points maturing on October 1, 2014. The Company has a variable rate construction loan in the amount of approximately $992,000 with an interest rate of LIBOR plus 300 basis points maturing on September 2, 2011.
On August 18, 2009, the Company completed a cash tender offer and purchased $19.5 million in principal of its $150.0 million 8.45% unsecured notes due September 1, 2010 and $46.5 million in principal of its $220.0 million 7.95% unsecured notes due January 15, 2011 (the “Notes”). The total consideration paid for the Notes was $69.5 million or $1,035 per $1,000 in principal, plus accrued interest. The payment was funded from available cash and the Company recorded a $2.8 million expense for loss on early extinguishment of debt in the accompanying Consolidated Statement of Operations.
The Company’s outstanding debt at December 31, 2009 and 2008 consists of the following (in thousands):
| 2009 | 2008 | ||||
| Notes payable: |
|||||
| Fixed rate mortgage loans |
$ | 398,820 | 235,150 | ||
| Variable rate mortgage loans |
5,596 | 5,130 | |||
| Fixed rate unsecured loans |
1,481,964 | 1,597,624 | |||
| Total notes payable |
1,886,380 | 1,837,904 | |||
| Unsecured credit facilities |
— | 297,667 | |||
| Total |
$ | 1,886,380 | 2,135,571 | ||
105
Table of Contents
Regency Centers Corporation and Regency Centers, L.P.
Notes to Consolidated Financial Statements—(Continued)
December 31, 2009
As of December 31, 2009, scheduled principal repayments on notes payable and the Unsecured credit facilities were as follows (in thousands):
| Scheduled Principal Payments by Year: |
Scheduled Principal Payments |
Mortgage Loan Maturities |
Unsecured Public Debt |
Total | ||||||||
| 2010 |
$ | 4,986 | 28,523 | 140,461 | 173,970 | |||||||
| 2011 |
4,837 | 12,268 | 193,486 | 210,591 | ||||||||
| 2012 |
5,105 | — | 250,000 | 255,105 | ||||||||
| 2013 |
4,979 | 16,348 | — | 21,327 | ||||||||
| 2014 |
8,168 | 11,916 | 150,000 | 170,084 | ||||||||
| Beyond 5 Years |
8,853 | 299,280 | 750,000 | 1,058,133 | ||||||||
| Unamortized debt discounts, net |
— | (847 | ) | (1,983 | ) | (2,830 | ) | |||||
| Total |
$ | 36,928 | 367,488 | 1,481,964 | 1,886,380 | |||||||
9. Derivative Financial Instruments
Risk Management Objective of Using Derivatives
The Company is exposed to certain risks arising from both its business operations and economic conditions. The Company principally manages its exposures to a wide variety of business and operational risks through management of its core business activities. The Company manages economic risks, including interest rate, liquidity, and credit risk primarily by managing the amount, sources, and duration of its debt funding and the use of derivative financial instruments. Specifically, the Company enters into derivative financial instruments to manage exposures that arise from business activities that result in the receipt or payment of future known and uncertain cash amounts, the value of which are determined by interest rates. The Company’s derivative financial instruments are used to manage differences in the amount, timing, and duration of the Company’s known or expected cash payments principally related to the Company’s borrowings.
Cash Flow Hedges of Interest Rate Risk
The Company’s objectives in using interest rate derivatives are to add stability to interest expense and to manage its exposure to interest rate movements. To accomplish this objective, the Company primarily uses interest rate swaps as part of its interest rate risk management strategy. Interest rate swaps designated as cash flow hedges involve the receipt of variable-rate amounts from a counterparty in exchange for the Company making fixed-rate payments over the life of the agreements without exchange of the underlying notional amount.
The effective portion of changes in the fair value of derivatives designated that qualify as cash flow hedges is recorded in accumulated other comprehensive loss and subsequently reclassified into earnings in the period that the hedged forecasted transaction affects earnings. During 2009, such derivatives were used to hedge the variable cash flows associated with forecasted issuances of debt (see “Objectives and Strategies” below for further discussion). The ineffective portion of the change in fair value of the derivatives is recognized directly in earnings as loss on derivative instruments. During the year ended December 31, 2009, the Company had $3.3 million of hedge ineffectiveness recognized in earnings attributable to the Company’s revised assumptions of future debt issuances.
106
Table of Contents
Regency Centers Corporation and Regency Centers, L.P.
Notes to Consolidated Financial Statements—(Continued)
December 31, 2009
On April 16, 2009, the Company paid $20.0 million to settle and partially settle $106.0 million of its $396.7 million of interest rate swaps in place to hedge forecasted debt. On July 1, 2009, the Company closed on mortgage loans of $106.0 million secured by eight properties with a fixed interest rate of 7.75% and a ten-year term. The $20.0 million loss realized from the swap settlement began amortization over a ten year period in July 2009; therefore, the effective interest rate on these mortgage loans is 9.63%.
Realized losses associated with the interest rate swaps settled in 2004, 2005, and 2009 and unrealized gains or losses associated with the swaps entered into in 2006 have been included in accumulated other comprehensive loss in the accompanying Consolidated Statements of Equity and Comprehensive Income (Loss) of the Parent Company and the accompanying Consolidated Statements of Changes in Capital and Comprehensive Income (Loss) of the Operating Partnership. Unrealized gains or losses will not be amortized until such time that the probable debt issuances are completed as long as the interest rate swaps continue to qualify for hedge accounting.
The tables below represent the effect of the derivative financial instruments on the accompanying consolidated financial statements for the years ended (in thousands):
| Derivatives in FASB ASC Topic 815 Cash Flow |
Amount of Gain (Loss) Recognized in OCI on Derivative (Effective Portion) |
Location of Gain (Loss) Reclassified from |
Amount of Gain (Loss) Reclassified from Accumulated OCI into Income (Effective Portion) | ||||||||||||||
| December 31, | December 31, | ||||||||||||||||
| 2009 | 2008 | 2007 | 2009 | 2008 | 2007 | ||||||||||||
| Interest rate products |
$ | (17,672 | ) | 1,306 | 1,306 | Interest expense |
$ | 2,305 | 1,306 | 1,306 | |||||||
The unamortized balance of the settled interest rate swaps at December 31, 2009 and 2008 was $25.4 million and $7.8 million, respectively.
As of December 31, 2009, the Company had the following outstanding interest rate derivatives that were designated as cash flow hedges of interest rate risk (dollars in thousands):
| Notional Value | Interest Rate | Maturity | Fair Value | |||||||
| $ | 100,000 | 5.415 | % | 09/15/20 | $ | (8,805 | ) | |||
| 90,700 | 5.399 | % | 01/15/20 | (10,802 | ) | |||||
| 100,000 | 5.415 | % | 09/15/20 | (8,756 | ) | |||||
| $ | 290,700 | $ | (28,363 | ) | ||||||
107
Table of Contents
Regency Centers Corporation and Regency Centers, L.P.
Notes to Consolidated Financial Statements—(Continued)
December 31, 2009
The table below presents the fair value of the Company’s derivative financial instruments as well as their classification on the Consolidated Balance Sheets as of December 31, 2009 and 2008 (in thousands):
| Liability Derivatives |
||||||||||
| 2009 |
2008 |
|||||||||
| Balance Sheet Location |
Fair Value | Balance Sheet Location |
Fair Value | |||||||
| Derivative instruments |
$ | (28,363 | ) | Derivative instruments |
$ | (83,691 | ) | |||
Non-designated Hedges
The Company does not use derivatives for trading or speculative purposes and currently does not have any derivatives that are not designated as hedges.
Objectives and Strategies
For $90.7 million of the remaining Swaps, the Company continues to expect to issue new secured or unsecured debt for a term of 7 to 12 years prior to July 1, 2010. For $200.0 million of the remaining Swaps, the Company continues to expect to issue new debt for a term of 7 to 12 years during the period between March 31, 2010 and March 31, 2011. The Company continuously monitors the capital markets and evaluates its ability to issue new debt to repay maturing debt or fund its commitments. Based upon the current capital markets, the Company’s current credit ratings, and the number of high quality, unencumbered properties that it owns which could collateralize borrowings, the Company expects that it will successfully issue new secured or unsecured debt to fund its obligations. However, in the current environment, interest rates on new loans are expected to be significantly higher than on historical issuances. An increase of 1.0% in the interest rate of new debt issued above that of maturing debt would result in additional annual interest expense of $3.3 million in addition to the impact of the annual amortization that would be incurred as a result of settling the respective interest rate swaps.
10. Fair Value Measurements
Derivative Financial Instruments
The valuation of these instruments is determined using widely accepted valuation techniques including discounted cash flow analysis on the expected cash flows of each derivative. This analysis reflects the contractual terms of the derivatives, including the period to maturity, and uses observable market-based inputs, including interest rate curves, and implied volatilities. The Company incorporates credit valuation adjustments to appropriately reflect both its own nonperformance risk and the respective counterparty’s nonperformance risk in the fair value measurements.
Although the Company has determined that the majority of the inputs used to value its derivatives fall within Level 2 of the fair value hierarchy, the credit valuation adjustments associated with its derivatives utilize Level 3 inputs, such as estimates of current credit spreads to evaluate the likelihood of default by the Company and its counterparties.
108
Table of Contents
Regency Centers Corporation and Regency Centers, L.P.
Notes to Consolidated Financial Statements—(Continued)
December 31, 2009
As of December 31, 2009 the Company’s liabilities measured at fair value on a recurring basis, aggregated by the level in the fair value hierarchy within which those measurements fall were as follows (in thousands):
| Fair Value Measurements Using: | |||||||||||||
| Liabilities |
Balance | Quoted Prices in Active Markets for Identical Liabilities (Level 1) |
Significant Other Observable Inputs (Level 2) |
Significant Unobservable Inputs (Level 3) |
Total Gains | ||||||||
| Derivative instruments |
$ | (28,363 | ) | — | (29,040 | ) | 677 | 55,328 | |||||
Changes in Level 3 inputs are not considered significant enough to warrant reconciliation for the year ended December 31, 2009.
Impairment of Long-lived Assets
Long-lived assets held and used are comprised primarily of real estate. During the years ended December 31, 2009 and 2008 the Company established provisions for impairment as follows:
| 2009 | 2008 | ||||
| Land held for future development or sale |
$ | 93,710 | 7,216 | ||
| Operating and development properties |
10,227 | 20,527 | |||
| Total |
$ | 103,937 | 27,743 | ||
The principal triggering event that led to the impairment charges during 2009 related to a prospective anchor tenant for several development sites that expressed considerable uncertainty about the timing and location of future stores given the continuation of the weak economy and reductions in consumer spending. As a result, the Company reevaluated its development plans incorporating revisions to its assumptions such as declines in lease up periods, lower rental rates, rising vacancies, and higher capitalization rates. The Company also reduced its overall probability of future development at some of the sites as well as its estimated holding period and corresponding future cash flows on several operating and development properties as a result of weaker operating environments in the markets in which these properties are located. Additional impairments may be necessary in the future in the event that market conditions continue to deteriorate and impact the factors used to estimate fair value, the Company reduces the holding period on properties held and used, or it decides to classify properties as held for sale where they were previously classified as held and used. See Note 1(c) for a discussion of the inputs used in determining the fair value of long-lived assets. The Company has determined that the inputs used to value its long-lived assets fall within Levels 2 and 3 of the fair value hierarchy.
109
Table of Contents
Regency Centers Corporation and Regency Centers, L.P.
Notes to Consolidated Financial Statements—(Continued)
December 31, 2009
The Company’s assets measured at fair value on a nonrecurring basis are those assets for which the Company has recorded a provision for impairment during 2009. The assets measured at fair value on a nonrecurring basis are as follows:
| Fair Value Measurements Using: | ||||||||||||
| Assets |
Balance | Quoted Prices in Active Markets for Identical Assets (Level 1) |
Significant Other Observable Inputs (Level 2) |
Significant Unobservable Inputs (Level 3) |
Total (Losses) |
|||||||
| Long-lived assets held and used: |
||||||||||||
| Land held for future development or sale |
$ | 76,879 | — | 19,796 | 57,083 | (93,710 | ) | |||||
| Operating and development properties |
49,222 | — | 27,955 | 21,267 | (10,227 | ) | ||||||
| Notes receivable |
414 | — | — | 414 | (465 | ) | ||||||
| Total |
$ | 126,515 | — | 47,751 | 78,764 | (104,402 | ) | |||||
The following represent additional fair value disclosures for other assets and liabilities that are included in the accompanying consolidated financial statements.
Notes Payable
The carrying value of the Company’s Unsecured credit facilities are based upon a spread above LIBOR which is lower than the spreads available in the current credit markets, causing the fair value of such variable rate debt to be below its carrying value. The other variable rate loans approximate fair value as they were refinanced or entered into during 2009. The fair value of fixed rate loans are estimated using cash flows discounted at current market rates available to the Company for debt with similar terms and maturities. Fixed rate loans assumed in connection with real estate acquisitions are recorded in the accompanying consolidated financial statements at fair value at the time of acquisition excluding those loans assumed in DIK liquidations. Based on the estimates used by the Company, the fair value of notes payable and the Unsecured credit facilities was approximately $1.4 billion and $1.3 billion at December 31, 2009 and 2008.
Noncontrolling Interests of the Parent Company and Partners’ Capital
As of December 31, 2009 and 2008, the Operating Partnership had 468,211 limited Partnership Units outstanding. The limited Partnership Units are exchangeable for the Parent Company’s common stock. The redemption value of the limited Partnership Units are based on the closing market price of the Parent Company’s common stock, which was $35.06 and $46.70 per share as of December 31, 2009 and 2008, respectively, and the aggregate redemption value was $16.4 million and $21.9 million, respectively.
Noncontrolling Interests of the Parent Company and the Operating Partnership
At December 31, 2009, the Company held a majority interest in four consolidated entities with specified termination dates through 2049. The noncontrolling interests in these entities will be settled upon termination by distribution or transfer of either cash or specific assets of the
110
Table of Contents
Regency Centers Corporation and Regency Centers, L.P.
Notes to Consolidated Financial Statements—(Continued)
December 31, 2009
underlying entities. The estimated fair value of the noncontrolling interests in entities with specified termination dates was approximately $9.1 million and $9.5 million at December 31, 2009 and 2008, respectively. Their related carrying value was $6.6 million and $6.3 million as of December 31, 2009 and 2008, respectively, which is included within noncontrolling interests of Limited partners’ interests in consolidated partnerships in the accompanying Consolidated Balance Sheets.
11. Equity and Capital
Equity of the Parent Company
Preferred Stock
The Series 3, 4, and 5 preferred shares are perpetual, are not convertible into common stock of the Parent Company, and are redeemable at par upon the Company’s election beginning five years after the issuance date. None of the terms of the preferred stock contain any unconditional obligations that would require the Company to redeem the securities at any time or for any purpose and the Company does not currently anticipate redeeming any preferred stock. Terms and conditions of the three series of preferred stock outstanding as of December 31, 2009 are summarized as follows:
| Series |
Shares Outstanding |
Liquidation Preference |
Distribution Rate |
Callable By Company | ||||||
| Series 3 |
3,000,000 | $ | 75,000,000 | 7.45 | % | 04/03/08 | ||||
| Series 4 |
5,000,000 | 125,000,000 | 7.25 | % | 08/31/09 | |||||
| Series 5 |
3,000,000 | 75,000,000 | 6.70 | % | 08/02/10 | |||||
| 11,000,000 | $ | 275,000,000 | ||||||||
Common Stock
On December 9, 2009, the Parent Company completed a public offering of 8.0 million shares of common stock at $30.75 per share which will result in net proceeds of $235.8 million, net of issuance costs. In connection with this offering, the Parent Company entered into forward sale agreements with affiliates of J.P. Morgan and Wells Fargo Securities, as forward purchasers. The Company intends to use the proceeds it receives upon settlement of the forward sale agreements to repay maturing or outstanding debt balances. This offering also included an over-allotment option of 1.2 million shares which closed simultaneously with the offering providing the Company with net proceeds of $35.4 million.
On April 24, 2009, the Parent Company completed a public offering of 10.0 million common shares at $32.50 per share resulting in proceeds of $310.9 million, net of issuance costs. The funds were used to pay off the balance of the Line, which had a balance of $180.0 million, and the remaining amount of approximately $130.0 million was deposited in the Company’s cash accounts and was used for general working capital needs including repayment of maturing debt, capital calls from real estate partnerships to the extent required based on the Company’s respective ownership interest in such real estate partnership, and costs to complete in-process development projects.
111
Table of Contents
Regency Centers Corporation and Regency Centers, L.P.
Notes to Consolidated Financial Statements—(Continued)
December 31, 2009
Treasury Stock
On December 31, 2009, the Parent Company cancelled the 5,661,520 treasury shares outstanding.
Noncontrolling Interest of Preferred Units
At December 31, 2009 and 2008, the face value of the Series D preferred units was $50.0 million with a fixed distribution rate of 7.45% and recorded in the accompanying Consolidated Balance Sheets net of original issuance costs of approximately $842,000 which will be expensed if redeemed in the future.
Terms and conditions for the Series D preferred units outstanding as of December 31, 2009 and 2008 are summarized as follows:
| Units Outstanding |
Amount Outstanding |
Distribution Rate |
Callable by Company |
Exchangeable by Unit holder | ||||||
| 500,000 | $ | 50,000,000 | 7.45 | % | 09/29/09 | 01/01/14 | ||||
The Series D preferred units, which could be called by the Operating Partnership at par beginning September 29, 2009, have no stated maturity or mandatory redemption and pay a cumulative, quarterly dividend at a fixed rate. The Series D preferred units may be exchanged by the holder for cumulative redeemable preferred stock of the Parent Company at an exchange rate of one unit for one share. The Series D preferred units and the related preferred stock are not convertible into common stock of the Parent Company.
Noncontrolling Interest of Exchangeable Operating Partnership Units
As of December 31, 2009 and 2008, the Operating Partnership had 468,211 limited Partnership Units outstanding. See Note 10 for further discussion.
Noncontrolling Interests of Limited Partners’ Interests in Consolidated Partnerships
Limited partners’ interests in consolidated partnerships not owned by the Company are classified as noncontrolling interests on the accompanying Consolidated Balance Sheets of the Parent Company. Subject to certain conditions and pursuant to the conditions of the agreement, the Company has the right, but not the obligation, to purchase the other member’s interest or sell its own interest in these consolidated partnerships. At December 31, 2009 and 2008, the Company’s noncontrolling interest in these consolidated partnerships was $11.7 million and $8.0 million, respectively.
Capital of the Operating Partnership
Preferred Units
The Series D Preferred Units are owned by institutional investors. At December 31, 2009 and 2008, the face value of the Series D Preferred Units was $50.0 million with a fixed distribution rate of 7.45% and recorded in the accompanying Consolidated Balance Sheets net of original issuance costs of approximately $842,000 that will be expensed if redeemed in the future. See above for further discussion.
112
Table of Contents
Regency Centers Corporation and Regency Centers, L.P.
Notes to Consolidated Financial Statements—(Continued)
December 31, 2009
Preferred Units of General Partner
The Parent Company, as general partner, owns corresponding Series 3, 4, and 5 preferred unit interests (“Series 3, 4, and 5 Preferred Units”) in the Operating Partnership. See above for further discussion.
General Partner
As of December 31, 2009, the Parent Company, as general partner, owned approximately 99% or 81,539,296 of the total 82,007,507 Partnership Units outstanding.
Limited Partners
As of December 31, 2009 and 2008, the Operating Partnership had 468,211 limited Partnership Units outstanding. See Note 10 for further discussion.
Noncontrolling Interests of Limited Partners’ Interests in Consolidated Partnerships
See above for further discussion.
12. Stock-Based Compensation
The Company recorded stock-based compensation in general and administrative expenses in the accompanying Consolidated Statements of Operations, the components of which are further described below (in thousands):
| 2009 | 2008 | 2007 | |||||
| Restricted stock |
$ | 5,227 | 8,193 | 17,725 | |||
| Stock options |
— | 988 | 1,024 | ||||
| Directors’ fees paid in common stock |
279 | 375 | 389 | ||||
| Total |
$ | 5,506 | 9,556 | 19,138 | |||
The recorded amounts of stock-based compensation expense represent amortization of deferred compensation related to share-based payments. During 2009 and 2008, compensation expense declined as a result of the Company reducing estimated payout amounts related to incentive compensation tied directly to Company performance. Compensation expense specifically identifiable to development and leasing activities is capitalized and included above. During the years ended December 31, 2009, 2008, and 2007, compensation expense of approximately $1.6 million, $3.6 million, and $7.6 million, respectively, was capitalized.
The Company established the Plan under which the Board of Directors may grant stock options and other stock-based awards to officers, directors, and other key employees. The Plan allows the Company to issue up to 5.0 million shares in the form of the Parent Company’s common stock or stock options. The plan permits the grant of any type of stock-based award but limits non-option awards to no more than 2.75 million shares. At December 31, 2009, there were approximately 2.4 million shares available for grant under the Plan either through options or
113
Table of Contents
Regency Centers Corporation and Regency Centers, L.P.
Notes to Consolidated Financial Statements—(Continued)
December 31, 2009
restricted stock. The Plan also limits outstanding awards to no more than 12% of the Parent Company’s outstanding common stock.
Stock options are granted under the Plan with an exercise price equal to the Parent Company’s stock’s price at the date of grant. All stock options granted have ten-year lives, contain vesting terms of one to five years from the date of grant and some have dividend equivalent rights. Stock options granted prior to 2005 also contained “reload” rights, which allowed an option holder the right to receive new options each time existing options were exercised, if the existing options were exercised under specific criteria provided for in the Plan. In 2005 and 2007, the Parent Company acquired the “reload” rights of existing employees’ and directors’ stock options from the option holders, substantially canceling all of the “reload” rights on existing stock options in exchange for new options. These new stock options vest 25% per year and are expensed ratably over a four-year period beginning in year of grant. Options granted under the reload buy-out plan do not earn dividend equivalents.
The fair value of each option award is estimated on the date of grant using the Black-Scholes-Merton closed-form (“Black-Scholes”) option valuation model. Expected volatilities are based on historical volatility of the Parent Company’s stock and other factors. The Company uses historical data and other factors to estimate option exercises and employee terminations within the valuation model. The expected term of options granted is derived from the output of the option valuation model and represents the period of time that options granted are expected to be outstanding. The risk-free rate for periods within the contractual life of the option is based on the U.S. Treasury yield curve in effect at the time of grant. The Company believes that the use of the Black-Scholes model meets the fair value measurement objectives of FASB ASC Topic 718 and reflects all substantive characteristics of the instruments being valued.
The following table reports stock option activity during the year ended December 31, 2009:
| Number of Options |
Weighted Average Exercise Price |
Weighted Average Remaining Contractual Term (in years) |
Aggregate Intrinsic Value (in thousands) |
|||||||
| Outstanding December 31, 2008 |
574,027 | $ | 51.24 | |||||||
| Less: Exercised |
9,032 | 30.28 | ||||||||
| Less: Forfeited |
36,113 | 54.33 | ||||||||
| Less: Expired |
75,419 | 48.25 | ||||||||
| Outstanding December 31, 2009 |
453,463 | $ | 51.90 | 4.5 | (7,638 | ) | ||||
| Vested and expected to vest - December 31, 2009 |
453,463 | $ | 51.90 | 4.5 | (7,638 | ) | ||||
| Exercisable December 31, 2009 |
449,094 | $ | 51.55 | 4.4 | (7,404 | ) | ||||
There were no stock options granted in 2009 or 2008. The weighted-average grant price for stock options granted during 2007 was $88.49. The total intrinsic value of options exercised
114
Table of Contents
Regency Centers Corporation and Regency Centers, L.P.
Notes to Consolidated Financial Statements—(Continued)
December 31, 2009
during the years ended December 31, 2009, 2008, and 2007 was approximately $19,000, $2.3 million, and $20.2 million, respectively. The Company received cash proceeds for stock option exercises of $1.0 million and $2.4 million during 2008 and 2007, respectively. The Company issues new shares to fulfill option exercises from its authorized shares available.
The following table presents information regarding non-vested option activity during the year ended December 31, 2009:
| Non-vested Number of Options |
Weighted Average Grant-Date Fair Value | ||||
| Non-vested at December 31, 2008 |
180,020 | $ | 6.04 | ||
| Less: Forfeited |
2,307 | 8.78 | |||
| Less: 2009 Vesting |
173,344 | 5.96 | |||
| Non-vested at December 31, 2009 |
4,369 | $ | 8.78 | ||
The Company grants restricted stock under the Plan to its employees as a form of long-term compensation and retention. The terms of each grant vary depending upon the participant’s responsibilities and position within the Company. The Company’s stock grants can be categorized into three types: (i) 4-year vesting, (ii) performance-based vesting, and (iii) 8-year cliff vesting.
| • | The 4-year vesting grants vest 25% per year beginning on the date of grant. These grants are not subject to future performance measures, and if such vesting criteria are not met, the compensation cost previously recognized would be reversed. |
| • | Performance-based vesting grants are earned subject to future performance measurements, which include individual goals, annual growth in earnings, compounded three-year growth in earnings, and a three-year total shareholder return peer comparison (“TSR Grant”). Once the performance criteria are met and the actual number of shares earned is determined, certain shares will vest immediately while others will vest over an additional service period. |
| • | The 8-year cliff vesting grants fully vest at the end of the eighth year from the date of grant; however, as a result of the achievement of future performance, primarily growth in earnings, the vesting of these grants may be accelerated over a shorter term. |
Performance-based vesting grants and 8-year cliff vesting grants are currently only granted to the Company’s senior management. The Company considers the likelihood of meeting the performance criteria based upon managements’ estimates and analysis of future earnings growth from which it determines the amounts recognized as expense on a periodic basis. The Company determines the grant date fair value of TSR Grants based upon a Monte Carlo Simulation model. Compensation expense is measured at the grant date and recognized over the vesting period.
115
Table of Contents
Regency Centers Corporation and Regency Centers, L.P.
Notes to Consolidated Financial Statements—(Continued)
December 31, 2009
The following table reports non-vested restricted stock activity during the year ended December 31, 2009:
| Number of Shares |
Intrinsic Value (in thousands) |
Weighted Average Grant Price | ||||||
| Non-vested at December 31, 2008 |
508,773 | |||||||
| Add: Granted |
285,542 | $ | 38.91 | |||||
| Less: Vested and Distributed |
253,723 | $ | 37.88 | |||||
| Less: Forfeited |
172,930 | $ | 62.39 | |||||
| Non-vested at December 31, 2009 |
367,662 | $ | 12,890 | |||||
The weighted-average grant price for restricted stock granted during the years 2009, 2008, and 2007 was $38.91, $63.76, and $84.52, respectively. The total intrinsic value of restricted stock vested during the years ended December 31, 2009, 2008, and 2007 was $9.6 million, $12.3 million, and $29.7 million, respectively. As of December 31, 2009, there was 11.0 million of unrecognized compensation cost related to non-vested restricted stock granted under the Plan, when recognized is recorded in additional paid in capital of the accompanying Consolidated Statements of Equity and Comprehensive Income (Loss) of the Parent Company and in General partner preferred and common units of the accompanying Consolidated Statements of Changes in Capital and Comprehensive Income (Loss) of the Operating Partnership. This unrecognized compensation cost is expected to be recognized over the next four years, through 2013. The Company issues new restricted stock from its authorized shares available at the date of grant.
The Company maintains a 401(k) retirement plan covering substantially all employees, which permits participants to defer up to the maximum allowable amount determined by the IRS of their eligible compensation. This deferred compensation, together with Company matching contributions equal to 100% of employee deferrals up to a maximum of $3,800 of their eligible compensation, is fully vested and funded as of December 31, 2009. Costs related to the matching portion of the plan were approximately $1.4 million, $1.5 million, and $1.3 million for the years ended December 31, 2009, 2008, and 2007, respectively.
116
Table of Contents
Regency Centers Corporation and Regency Centers, L.P.
Notes to Consolidated Financial Statements—(Continued)
December 31, 2009
13. Earnings per Share and Unit
Parent Company Earnings per Share
The following summarizes the calculation of basic and diluted earnings per share for the years ended December 31, 2009, 2008, and 2007, respectively (in thousands except per share data):
| 2009 | 2008 | 2007 | ||||||
| Numerator: |
||||||||
| Income (loss) from continuing operations |
$ | (38,639 | ) | 119,570 | 176,013 | |||
| Discontinued operations |
5,896 | 21,951 | 34,003 | |||||
| Net income (loss) |
(32,743 | ) | 141,521 | 210,016 | ||||
| Less: Preferred stock dividends |
19,675 | 19,675 | 19,675 | |||||
| Less: Noncontrolling interests |
3,961 | 5,333 | 6,365 | |||||
| Net income (loss) attributable to common stockholders |
(56,379 | ) | 116,513 | 183,976 | ||||
| Less: Dividends paid on unvested restricted stock |
488 | 733 | 842 | |||||
| Net income (loss) attributable to common stockholders - basic |
(56,867 | ) | 115,780 | 183,134 | ||||
| Add: Dividends paid on Treasury Method restricted stock |
— | — | 49 | |||||
| Net income (loss) attributable to common stockholders - diluted |
$ | (56,867 | ) | 115,780 | 183,183 | |||
| Denominator: |
||||||||
| Weighted average common shares outstanding for basic EPS |
76,829 | 69,578 | 68,954 | |||||
| Incremental shares to be issued under common stock options |
— | 84 | 244 | |||||
| Incremental shares to be issued under Forward Equity Offering |
67 | — | — | |||||
| Weighted average common shares outstanding for diluted EPS |
76,896 | 69,662 | 69,198 | |||||
| Income (loss) per common share – basic |
||||||||
| Continuing operations |
$ | (0.82 | ) | 1.35 | 2.16 | |||
| Discontinued operations |
0.08 | 0.31 | 0.49 | |||||
| Net income (loss) attributable to common stockholders per share |
$ | (0.74 | ) | 1.66 | 2.65 | |||
| Income (loss) per common share – diluted |
||||||||
| Continuing operations |
$ | (0.82 | ) | 1.35 | 2.16 | |||
| Discontinued operations |
0.08 | 0.31 | 0.49 | |||||
| Net income (loss) attributable to common stockholders per share |
$ | (0.74 | ) | 1.66 | 2.65 | |||
117
Table of Contents
Regency Centers Corporation and Regency Centers, L.P.
Notes to Consolidated Financial Statements—(Continued)
December 31, 2009
Operating Partnership Earnings per Unit
The following summarizes the calculation of basic and diluted earnings per unit for the years ended December 31, 2009, 2008, and 2007, respectively (in thousands except per unit data):
| 2009 | 2008 | 2007 | ||||||
| Numerator: |
||||||||
| Income (loss) from continuing operations |
$ | (38,639 | ) | 119,570 | 176,013 | |||
| Discontinued operations |
5,896 | 21,951 | 34,003 | |||||
| Net income (loss) |
(32,743 | ) | 141,521 | 210,016 | ||||
| Less: Preferred unit distributions |
23,400 | 23,400 | 23,400 | |||||
| Less: Noncontrolling interests |
452 | 701 | 990 | |||||
| Net income (loss) attributable to common unit holders |
(56,595 | ) | 117,420 | 185,626 | ||||
| Less: Dividends paid on unvested restricted stock |
488 | 733 | 842 | |||||
| Net income (loss) attributable to common unit holders - basic |
$ | (57,083 | ) | 116,687 | 184,784 | |||
| Add: Dividends paid on Treasury Method restricted stock |
— | — | 49 | |||||
| Net income (loss) attributable to common unit holders - diluted |
$ | (57,083 | ) | 116,687 | 184,833 | |||
| Denominator: |
||||||||
| Weighted average common units outstanding for basic EPU |
77,297 | 70,048 | 69,540 | |||||
| Incremental units to be issued under common stock options |
— | 84 | 244 | |||||
| Incremental units to be issued under Forward Equity Offering |
67 | — | — | |||||
| Weighted average common units outstanding for diluted EPU |
77,364 | 70,132 | 69,784 | |||||
| Income (loss) from continuing operations - basic |
||||||||
| Continuing operations |
$ | (0.82 | ) | 1.35 | 2.16 | |||
| Discontinued operations |
0.08 | 0.31 | 0.49 | |||||
| Net income (loss) attributable to common unit holders per unit |
$ | (0.74 | ) | 1.66 | 2.65 | |||
| Income (loss) from continuing operations - diluted |
||||||||
| Continuing operations |
$ | (0.82 | ) | 1.35 | 2.16 | |||
| Discontinued operations |
0.08 | 0.31 | 0.49 | |||||
| Net income (loss) attributable to common unit holders per unit |
$ | (0.74 | ) | 1.66 | 2.65 | |||
118
Table of Contents
Regency Centers Corporation and Regency Centers, L.P.
Notes to Consolidated Financial Statements—(Continued)
December 31, 2009
14. Operating Leases
The Company’s properties are leased to tenants under operating leases with expiration dates extending to the year 2084. Future minimum rents under non-cancelable operating leases as of December 31, 2009, excluding both tenant reimbursements of operating expenses and additional percentage rent based on tenants’ sales volume, are as follows (in thousands):
| Year Ending December 31, |
Amount | ||
| 2010 |
$ | 320,361 | |
| 2011 |
299,131 | ||
| 2012 |
255,441 | ||
| 2013 |
211,214 | ||
| 2014 |
174,950 | ||
| Thereafter |
1,046,337 | ||
| Total |
$ | 2,307,434 | |
The shopping centers’ tenant base includes primarily national and regional supermarkets, drug stores, discount department stores and other retailers and, consequently, the credit risk is concentrated in the retail industry. There were no tenants that individually represented more than 5% of the Company’s annualized future minimum rents.
The Company has shopping centers that are subject to non-cancelable long-term ground leases where a third party owns and has leased the underlying land to the Company to construct and/or operate a shopping center. Ground leases expire through the year 2085 and in most cases provide for renewal options. In addition, the Company has non-cancelable operating leases pertaining to office space from which it conducts its business. Office leases expire through the year 2017 and in most cases provide for renewal options. Leasehold improvements are capitalized, recorded as tenant improvements, and depreciated over the shorter of the useful life of the improvements or the lease term. Operating lease expense, including capitalized ground lease payments on properties in development, was $7.9 million, $8.1 million, and $7.5 million for the years ended December 31, 2009, 2008, and 2007, respectively. The following table summarizes the future obligations under non-cancelable operating leases as of December 31, 2009 (in thousands):
| Year Ending December 31, |
Amount | ||
| 2010 |
$ | 7,098 | |
| 2011 |
7,021 | ||
| 2012 |
6,823 | ||
| 2013 |
6,926 | ||
| 2014 |
5,990 | ||
| Thereafter |
118,588 | ||
| Total |
$ | 152,446 | |
119
Table of Contents
Regency Centers Corporation and Regency Centers, L.P.
Notes to Consolidated Financial Statements—(Continued)
December 31, 2009
15. Commitments and Contingencies
The Company is involved in litigation on a number of matters and is subject to certain claims which arise in the normal course of business, none of which, in the opinion of management, is expected to have a material adverse effect on the Company’s consolidated financial position, results of operations, or liquidity. The Company is also subject to numerous environmental laws and regulations as they apply to real estate pertaining to chemicals used by the dry cleaning industry, the existence of asbestos in older shopping centers, and underground petroleum storage tanks. The Company believes that the tenants who currently operate dry cleaning plants or gas stations do so in accordance with current laws and regulations. The Company has placed environmental insurance, when possible, on specific properties with known contamination, in order to mitigate its environmental risk. The Company monitors the shopping centers containing environmental issues and in certain cases voluntarily remediates the sites. If an operating or development property requires remediation to be performed by the Company prior to development or as a condition of sale, environmental remediation obligations are estimated and are considered in the assessment of the property’s value. In the event environmental remediation is required, the Company adjusts the sales price of the property for the environmental remediation to be performed, funds the cash in escrow to remediate the environmental issues, or agrees to remain responsible for the future environmental remediation expenses in which case the Company would accrue the estimated maximum potential liability. If the Company is liable for remediation of environmental damage relating to properties previously disposed, the likelihood of a material unfavorable outcome of that contingency is remote, as a thorough environmental assessment is performed during the due diligence required by a sale of a property. The Company also has legal obligations to remediate certain sites and is in the process of doing so. The Company estimates the cost associated with remediating these environmental obligations to be approximately $3.2 million, all of which has been reserved in accounts payable and other liabilities on the accompanying Consolidated Balance Sheets. The Company believes that the ultimate disposition of currently known environmental matters will not have a material effect on its financial position, liquidity, or operations; however, it can give no assurance that existing environmental studies with respect to the shopping centers have revealed all potential environmental liabilities; that any previous owner, occupant or tenant did not create any material environmental condition not known to it; that the current environmental condition of the shopping centers will not be affected by tenants and occupants, by the condition of nearby properties, or by unrelated third parties; or that changes in applicable environmental laws and regulations or their interpretation will not result in additional environmental liability to the Company.
The Company has the right to issue letters of credit under the Line discussed above up to an amount not to exceed $50.0 million that reduce the credit availability under the Line. The Company also has stand alone letters of credit with other banks. These letters of credit are primarily issued as collateral to facilitate the construction of development projects. As of December 31, 2009 and 2008, the Company had $9.5 million and $16.2 million letters of credit outstanding, respectively.
120
Table of Contents
Regency Centers Corporation and Regency Centers, L.P.
Notes to Consolidated Financial Statements—(Continued)
December 31, 2009
16. Reorganization and Restructuring Charges
During 2009 and 2008, the Company announced restructuring plans designed to align employee headcount with projected workload. During 2009, the Company severed 103 employees with no future service requirement and recorded restructuring charges of $7.5 million for employee severance benefits. During 2008, the Company severed 50 employees and recorded restructuring charges of $2.4 million for employee severance benefits. Restructuring charges are included in general and administrative expenses in the accompanying Consolidated Statements of Operations. All severance payouts were completed by January 2010 and funded using cash from operations. The component charges of the restructuring program for the years ended December 31, 2009 and 2008 follows (in thousands):
| 2009 | 2008 | ||||
| Severance |
$ | 5,966 | 2,086 | ||
| Health insurance |
1,092 | 150 | |||
| Placement services |
431 | 187 | |||
| Total |
$ | 7,489 | 2,423 | ||
As of December 31, 2009 and 2008, the remaining accrued liabilities are as follows:
| 2009 | 2008 | ||||
| Accrued Liabilities: |
|||||
| Compensation |
$ | 1,160 | 1,046 | ||
| Insurance |
— | 150 | |||
| Other |
— | 51 | |||
| Total |
$ | 1,160 | 1,247 | ||
121
Table of Contents
Regency Centers Corporation and Regency Centers, L.P.
Notes to Consolidated Financial Statements—(Continued)
December 31, 2009
17. Summary of Quarterly Financial Data (Unaudited)
The following table sets forth selected Quarterly Financial Data for the Company on a historical basis for each of the years ended December 31, 2009 and 2008 and has been derived from the accompanying consolidated financial statements as reclassified for discontinued operations.
| First Quarter |
Second Quarter |
Third Quarter |
Fourth Quarter | |||||||||
| 2009: |
||||||||||||
| Operating Data: |
||||||||||||
| Revenues as originally reported |
$ | 120,159 | 116,461 | 133,742 | 121,625 | |||||||
| Reclassified to discontinued operations |
(445 | ) | (1,167 | ) | (1,143 | ) | — | |||||
| Adjusted Revenues |
$ | 119,714 | 115,294 | 132,599 | 121,625 | |||||||
| Net income (loss) attributable to common stockholders |
$ | 19,563 | (17,180 | ) | (84,092 | ) | 25,329 | |||||
| Net income (loss) of limited partners |
164 | (92 | ) | (462 | ) | 174 | ||||||
| Net income (loss) attributable to common unit holders |
$ | 19,727 | (17,272 | ) | (84,554 | ) | 25,503 | |||||
| Net income (loss) attributable to common stock and unit holders per share: |
||||||||||||
| Basic |
$ | 0.28 | (0.23 | ) | (1.05 | ) | 0.31 | |||||
| Diluted |
$ | 0.28 | (0.23 | ) | (1.05 | ) | 0.31 | |||||
| 2008: |
||||||||||||
| Operating Data: |
||||||||||||
| Revenues as originally reported |
$ | 119,647 | 123,456 | 122,798 | 138,683 | |||||||
| Reclassified to discontinued operations |
(4,421 | ) | (3,608 | ) | (2,626 | ) | 1,966 | |||||
| Adjusted Revenues |
$ | 115,226 | 119,848 | 120,172 | 140,649 | |||||||
| Net income (loss) attributable to common stockholders |
$ | 26,719 | 31,866 | 43,900 | 14,028 | |||||||
| Net income (loss) of limited partners |
213 | 245 | 328 | 121 | ||||||||
| Net income (loss) attributable to common unit holders |
$ | 26,932 | 32,111 | 44,228 | 14,149 | |||||||
| Net income (loss) attributable to common stock and unit holders per share: |
||||||||||||
| Basic |
$ | 0.38 | 0.45 | 0.63 | 0.20 | |||||||
| Diluted |
$ | 0.38 | 0.45 | 0.63 | 0.20 | |||||||
122
Table of Contents
REGENCY CENTERS CORPORATION
Combined Real Estate and Accumulated Depreciation
December 31, 2009
(in thousands)
| Initial Cost | Cost Capitalized Subsequent to Acquisition(b) |
Total Cost | Total Cost Net of Accumulated Depreciation |
||||||||||||||||||
| Shopping Centers(a) |
Land | Building & Improvements |
Land | Building & Improvements |
Properties held for Sale |
Total | Accumulated Depreciation |
Mortgages | |||||||||||||
| 4S Commons Town Center |
30,760 | 35,830 | (240 | ) | 30,812 | 35,538 | — | 66,350 | 5,835 | 60,515 | 62,500 | ||||||||||
| Amerige Heights Town Center |
10,109 | 11,288 | — | 10,109 | 11,288 | — | 21,397 | 443 | 20,954 | 17,000 | |||||||||||
| Anastasia Plaza |
9,065 | — | — | 9,065 | — | — | 9,065 | — | 9,065 | 4,480 | |||||||||||
| Anthem Highlands Shopping Ctr |
8,643 | 11,981 | — | 8,643 | 11,981 | — | 20,624 | 1,187 | 19,437 | — | |||||||||||
| Anthem Marketplace |
6,714 | 13,696 | 35 | 6,714 | 13,731 | — | 20,445 | 3,118 | 17,327 | — | |||||||||||
| Ashburn Farm Market Center |
9,835 | 4,812 | 9 | 9,835 | 4,821 | — | 14,656 | 2,122 | 12,534 | — | |||||||||||
| Ashford Place |
2,584 | 9,865 | 25 | 2,584 | 9,890 | — | 12,474 | 4,180 | 8,294 | — | |||||||||||
| Atascocita Center |
3,997 | 6,279 | 13 | 3,997 | 6,292 | — | 10,289 | 1,549 | 8,740 | — | |||||||||||
| Augusta Center |
5,142 | 2,720 | (1,376 | ) | 3,740 | 2,746 | — | 6,486 | 330 | 6,156 | — | ||||||||||
| Aventura Shopping Center |
2,751 | 10,459 | 32 | 2,751 | 10,491 | — | 13,242 | 8,040 | 5,202 | — | |||||||||||
| Beckett Commons |
1,625 | 10,960 | 69 | 1,625 | 11,029 | — | 12,654 | 3,049 | 9,605 | — | |||||||||||
| Belleview Square |
8,132 | 9,756 | 58 | 8,132 | 9,814 | — | 17,946 | 2,502 | 15,444 | 8,373 | |||||||||||
| Beneva Village Shops |
2,484 | 10,162 | 281 | 2,484 | 10,443 | — | 12,927 | 3,289 | 9,638 | — | |||||||||||
| Berkshire Commons |
2,295 | 9,551 | 49 | 2,295 | 9,600 | — | 11,895 | 4,130 | 7,765 | 7,500 | |||||||||||
| Bloomingdale Square |
3,940 | 14,912 | 89 | 3,940 | 15,001 | — | 18,941 | 4,913 | 14,028 | — | |||||||||||
| Boulevard Center |
3,659 | 10,787 | 477 | 3,659 | 11,264 | — | 14,923 | 3,350 | 11,573 | — | |||||||||||
| Boynton Lakes Plaza |
2,628 | 11,236 | 185 | 2,628 | 11,421 | — | 14,049 | 3,764 | 10,285 | — | |||||||||||
| Briarcliff La Vista |
694 | 3,292 | 143 | 694 | 3,435 | — | 4,129 | 1,680 | 2,449 | — | |||||||||||
| Briarcliff Village |
4,597 | 24,836 | 292 | 4,597 | 25,128 | — | 29,725 | 10,782 | 18,943 | — | |||||||||||
| Buckhead Court |
1,417 | 7,432 | 82 | 1,417 | 7,514 | — | 8,931 | 3,451 | 5,480 | — | |||||||||||
| Buckley Square |
2,970 | 5,978 | 93 | 2,970 | 6,071 | — | 9,041 | 2,063 | 6,978 | — | |||||||||||
| Cambridge Square |
774 | 4,347 | 216 | 774 | 4,563 | — | 5,337 | 1,636 | 3,701 | — | |||||||||||
| Carmel Commons |
2,466 | 12,548 | 149 | 2,466 | 12,697 | — | 15,163 | 4,348 | 10,815 | — | |||||||||||
| Carriage Gate |
833 | 4,974 | 30 | 833 | 5,004 | — | 5,837 | 2,972 | 2,865 | — | |||||||||||
| Chapel Hill Centre |
3,932 | 3,897 | 2,317 | 4,062 | 6,084 | — | 10,146 | 437 | 9,709 | — | |||||||||||
| Chasewood Plaza |
4,612 | 20,829 | 24 | 4,612 | 20,853 | — | 25,465 | 9,939 | 15,526 | — | |||||||||||
| Cherry Grove |
3,533 | 15,862 | 145 | 3,533 | 16,007 | — | 19,540 | 4,944 | 14,596 | — | |||||||||||
| Cheshire Station |
9,896 | 8,344 | 26 | 9,896 | 8,370 | — | 18,266 | 4,324 | 13,942 | — | |||||||||||
| Clayton Valley Shopping Center |
24,189 | 35,422 | 854 | 24,465 | 36,000 | — | 60,465 | 6,729 | 53,736 | — | |||||||||||
| Clovis Commons |
11,100 | 32,692 | 98 | 11,100 | 32,790 | — | 43,890 | 3,721 | 40,169 | — | |||||||||||
| Cochran'S Crossing |
13,154 | 12,315 | 98 | 13,154 | 12,413 | — | 25,567 | 4,310 | 21,257 | — | |||||||||||
| Cooper Street |
2,079 | 10,682 | 13 | 2,079 | 10,695 | — | 12,774 | 3,130 | 9,644 | — | |||||||||||
| Corkscrew Village |
8,407 | 8,004 | 6 | 8,407 | 8,010 | — | 16,417 | 815 | 15,602 | 9,096 | |||||||||||
| Corvallis Market Center |
6,674 | 12,244 | — | 6,674 | 12,244 | — | 18,918 | 837 | 18,081 | — | |||||||||||
| Costa Verde Center |
12,740 | 26,868 | 111 | 12,740 | 26,979 | — | 39,719 | 9,027 | 30,692 | — | |||||||||||
| Courtyard Shopping Center |
5,867 | 4 | 3 | 5,867 | 7 | — | 5,874 | — | 5,874 | — | |||||||||||
| Cromwell Square |
1,772 | 6,944 | 7 | 1,772 | 6,951 | — | 8,723 | 2,935 | 5,788 | — | |||||||||||
| Culpeper Colonnade |
15,944 | 10,601 | — | 15,944 | 10,601 | — | 26,545 | 1,553 | 24,992 | — | |||||||||||
| Delk Spectrum |
2,985 | 12,001 | 21 | 2,985 | 12,022 | — | 15,007 | 3,819 | 11,188 | — | |||||||||||
| Diablo Plaza |
5,300 | 8,181 | 55 | 5,300 | 8,236 | — | 13,536 | 2,465 | 11,071 | — | |||||||||||
| Dickson Tn |
675 | 1,568 | — | 675 | 1,568 | — | 2,243 | 400 | 1,843 | — | |||||||||||
| Dunwoody Village |
3,342 | 15,934 | 334 | 3,342 | 16,268 | — | 19,610 | 6,746 | 12,864 | — | |||||||||||
| East Pointe |
1,730 | 7,189 | 3 | 1,730 | 7,192 | — | 8,922 | 2,667 | 6,255 | — | |||||||||||
| East Port Plaza |
3,257 | 10,051 | 348 | 3,257 | 10,399 | — | 13,656 | 2,825 | 10,831 | — | |||||||||||
| East Towne Center |
2,957 | 4,938 | (113 | ) | 2,957 | 4,825 | — | 7,782 | 1,492 | 6,290 | — | ||||||||||
| El Camino Shopping Center |
7,600 | 11,538 | 11 | 7,600 | 11,549 | — | 19,149 | 3,493 | 15,656 | — | |||||||||||
| El Cerrito Plaza |
11,025 | 27,371 | — | 11,025 | 27,371 | — | 38,396 | 969 | 37,427 | 41,619 | |||||||||||
| El Norte Pkwy Plaza |
2,834 | 7,370 | 49 | 2,834 | 7,419 | — | 10,253 | 2,332 | 7,921 | — | |||||||||||
| Encina Grande |
5,040 | 11,572 | 32 | 5,040 | 11,604 | — | 16,644 | 3,473 | 13,171 | — | |||||||||||
| Fairfax Shopping Center |
15,239 | 11,367 | (3,873 | ) | 13,311 | 9,422 | — | 22,733 | 1,757 | 20,976 | — | ||||||||||
| Fenton Marketplace |
2,298 | 8,510 | 7 | 2,298 | 8,517 | — | 10,815 | 2,136 | 8,679 | — | |||||||||||
| Fleming Island |
3,077 | 11,587 | 167 | 3,077 | 11,754 | — | 14,831 | 3,351 | 11,480 | 1,603 | |||||||||||
| Fort Bend Center |
2,594 | 3,175 | (42 | ) | 2,552 | 3,175 | — | 5,727 | 1,534 | 4,193 | — | ||||||||||
| Fortuna |
2,025 | — | — | 2,025 | — | — | 2,025 | — | 2,025 | — | |||||||||||
123
Table of Contents
REGENCY CENTERS CORPORATION
Combined Real Estate and Accumulated Depreciation
December 31, 2009
(in thousands)
| Initial Cost | Cost Capitalized Subsequent to Acquisition(b) |
Total Cost | Total Cost Net of Accumulated Depreciation |
||||||||||||||||||
| Shopping Centers(a) |
Land | Building & Improvements |
Land | Building & Improvements |
Properties held for Sale |
Total | Accumulated Depreciation |
Mortgages | |||||||||||||
| Frankfort Crossing Shpg Ctr |
7,417 | 8,065 | 235 | 7,418 | 8,299 | — | 15,717 | 3,070 | 12,647 | — | |||||||||||
| French Valley Village Center |
11,924 | 16,856 | (33 | ) | 11,924 | 16,823 | — | 28,747 | 3,142 | 25,605 | — | ||||||||||
| Friars Mission Center |
6,660 | 28,021 | 135 | 6,660 | 28,156 | — | 34,816 | 7,712 | 27,104 | 704 | |||||||||||
| Gardens Square |
2,136 | 8,273 | 180 | 2,136 | 8,453 | — | 10,589 | 2,715 | 7,874 | — | |||||||||||
| Garner Towne Square |
5,591 | 21,866 | 75 | 5,591 | 21,941 | — | 27,532 | 6,284 | 21,248 | — | |||||||||||
| Gateway 101 |
24,971 | 9,113 | — | 24,971 | 9,113 | — | 34,084 | 289 | 33,795 | — | |||||||||||
| Gateway Shopping Center |
52,665 | 7,134 | 29 | 52,665 | 7,163 | — | 59,828 | 4,301 | 55,527 | 19,296 | |||||||||||
| Gelson'S Westlake Market Plaza |
3,157 | 11,153 | 110 | 3,157 | 11,263 | — | 14,420 | 2,401 | 12,019 | — | |||||||||||
| Glenwood Village |
1,194 | 5,381 | 38 | 1,194 | 5,419 | — | 6,613 | 2,476 | 4,137 | — | |||||||||||
| Greenwood Springs |
2,720 | 3,059 | (17 | ) | 2,665 | 3,097 | — | 5,762 | 656 | 5,106 | — | ||||||||||
| Hancock |
8,232 | 28,260 | 207 | 8,232 | 28,467 | — | 36,699 | 8,705 | 27,994 | — | |||||||||||
| Harpeth Village Fieldstone |
2,284 | 9,443 | — | 2,284 | 9,443 | — | 11,727 | 2,868 | 8,859 | — | |||||||||||
| Heritage Land |
12,390 | — | — | 12,390 | — | — | 12,390 | — | 12,390 | — | |||||||||||
| Heritage Plaza |
— | 26,097 | 261 | — | 26,358 | — | 26,358 | 8,140 | 18,218 | — | |||||||||||
| Hershey |
7 | 808 | — | 7 | 808 | — | 815 | 186 | 629 | — | |||||||||||
| Highland Crossroads |
2,260 | 4,924 | 2,532 | — | — | 9,716 | 9,716 | — | 9,716 | — | |||||||||||
| Hillcrest Village |
1,600 | 1,909 | — | 1,600 | 1,909 | — | 3,509 | 537 | 2,972 | — | |||||||||||
| Hinsdale |
5,734 | 16,709 | 279 | 5,734 | 16,988 | — | 22,722 | 5,098 | 17,624 | — | |||||||||||
| Horton'S Corner |
3,137 | 2,779 | 60 | 3,137 | 2,839 | — | 5,976 | 189 | 5,787 | — | |||||||||||
| Howell Mill Village |
5,157 | 14,279 | — | 5,157 | 14,279 | — | 19,436 | 447 | 18,989 | — | |||||||||||
| Hyde Park |
9,809 | 39,905 | 349 | 9,809 | 40,254 | — | 50,063 | 13,545 | 36,518 | — | |||||||||||
| Inglewood Plaza |
1,300 | 2,159 | 28 | 1,300 | 2,187 | — | 3,487 | 671 | 2,816 | — | |||||||||||
| Keller Town Center |
2,294 | 12,841 | 24 | 2,294 | 12,865 | — | 15,159 | 3,600 | 11,559 | — | |||||||||||
| Kings Crossing Sun City |
515 | 1,246 | (1 | ) | 514 | 1,246 | — | 1,760 | 55 | 1,705 | — | ||||||||||
| Kroger New Albany Center |
3,844 | 6,599 | 151 | 3,844 | 6,750 | — | 10,594 | 2,919 | 7,675 | 4,604 | |||||||||||
| Kulpsville |
5,518 | 3,756 | — | 5,518 | 3,756 | — | 9,274 | 39 | 9,235 | — | |||||||||||
| Lake Pine Plaza |
2,008 | 7,632 | 27 | 2,029 | 7,638 | — | 9,667 | 2,325 | 7,342 | — | |||||||||||
| Lebanon/Legacy Center |
3,913 | 7,874 | 237 | 3,913 | 8,111 | — | 12,024 | 2,828 | 9,196 | — | |||||||||||
| Legacy West |
1,770 | — | (241 | ) | 1,529 | — | — | 1,529 | — | 1,529 | — | ||||||||||
| Littleton Square |
2,030 | 8,859 | 60 | 2,030 | 8,919 | — | 10,949 | 2,488 | 8,461 | — | |||||||||||
| Lloyd King Center |
1,779 | 10,060 | 56 | 1,779 | 10,116 | — | 11,895 | 3,015 | 8,880 | — | |||||||||||
| Loehmanns Plaza |
3,983 | 18,687 | 39 | 3,983 | 18,726 | — | 22,709 | 7,041 | 15,668 | — | |||||||||||
| Loehmanns Plaza California |
5,420 | 9,450 | 140 | 5,420 | 9,590 | — | 15,010 | 2,869 | 12,141 | — | |||||||||||
| Loveland Shopping Center |
157 | — | — | 157 | — | — | 157 | — | 157 | — | |||||||||||
| Market At Opitz Crossing |
9,902 | 9,248 | 20 | 9,902 | 9,268 | — | 19,170 | 3,153 | 16,017 | 11,517 | |||||||||||
| Market At Preston Forest |
4,400 | 11,445 | 573 | 4,400 | 12,018 | — | 16,418 | 3,141 | 13,277 | — | |||||||||||
| Market At Round Rock |
2,000 | 9,676 | 527 | 2,000 | 10,203 | — | 12,203 | 2,904 | 9,299 | — | |||||||||||
| Marketplace At Briargate |
1,706 | 4,885 | 47 | 1,727 | 4,911 | — | 6,638 | 602 | 6,036 | — | |||||||||||
| Marketplace Shopping Center |
1,287 | 5,509 | — | 1,287 | 5,509 | — | 6,796 | 2,111 | 4,685 | — | |||||||||||
| Martin Downs Town Center |
1,364 | 5,187 | 15 | 1,364 | 5,202 | — | 6,566 | 1,753 | 4,813 | — | |||||||||||
| Martin Downs Village Center |
2,438 | 9,142 | 223 | 2,438 | 9,365 | — | 11,803 | 5,104 | 6,699 | — | |||||||||||
| Martin Downs Village Shoppes |
817 | 4,965 | 29 | 817 | 4,994 | — | 5,811 | 2,253 | 3,558 | — | |||||||||||
| Maxtown Road (Northgate) |
1,769 | 6,652 | 6 | 1,769 | 6,658 | — | 8,427 | 2,135 | 6,292 | — | |||||||||||
| Merrimack Shopping Center |
285 | — | — | 285 | — | — | 285 | — | 285 | — | |||||||||||
| Millhopper Shopping Center |
1,073 | 5,358 | — | 1,073 | 5,358 | — | 6,431 | 3,818 | 2,613 | — | |||||||||||
| Mockingbird Common |
3,000 | 10,728 | 53 | 3,000 | 10,781 | — | 13,781 | 3,383 | 10,398 | 10,300 | |||||||||||
| Monument Jackson Creek |
2,999 | 6,765 | 12 | 2,999 | 6,777 | — | 9,776 | 2,790 | 6,986 | — | |||||||||||
| Morningside Plaza |
4,300 | 13,951 | 121 | 4,300 | 14,072 | — | 18,372 | 4,043 | 14,329 | — | |||||||||||
| Murrayhill Marketplace |
2,670 | 18,401 | 105 | 2,670 | 18,506 | — | 21,176 | 5,817 | 15,359 | 8,019 | |||||||||||
| Naples Walk |
18,173 | 13,554 | (12 | ) | 18,173 | 13,542 | — | 31,715 | 1,304 | 30,411 | 17,251 | ||||||||||
| Nashboro Village |
1,824 | 7,678 | — | 1,824 | 7,678 | — | 9,502 | 2,094 | 7,408 | — | |||||||||||
| Newberry Square |
2,412 | 10,150 | 205 | 2,412 | 10,355 | — | 12,767 | 5,149 | 7,618 | — | |||||||||||
| Newland Center |
12,500 | 10,697 | 29 | 12,500 | 10,726 | — | 23,226 | 3,665 | 19,561 | — | |||||||||||
| North Hills |
4,900 | 19,774 | 196 | 4,900 | 19,970 | — | 24,870 | 5,479 | 19,391 | — | |||||||||||
124
Table of Contents
REGENCY CENTERS CORPORATION
Combined Real Estate and Accumulated Depreciation
December 31, 2009
(in thousands)
| Initial Cost | Cost Capitalized Subsequent to Acquisition(b) |
Total Cost | Total Cost Net of Accumulated Depreciation |
||||||||||||||||||
| Shopping Centers(a) |
Land | Building & Improvements |
Land | Building & Improvements |
Properties held for Sale |
Total | Accumulated Depreciation |
Mortgages | |||||||||||||
| Northgate Square |
5,011 | 8,692 | 18 | 5,011 | 8,710 | — | 13,721 | 820 | 12,901 | 6,364 | |||||||||||
| Northlake Village |
2,662 | 11,284 | 67 | 2,662 | 11,351 | — | 14,013 | 2,989 | 11,024 | — | |||||||||||
| Oakbrook Plaza |
4,000 | 6,668 | 20 | 4,000 | 6,688 | — | 10,688 | 2,113 | 8,575 | — | |||||||||||
| Old St Augustine Plaza |
2,368 | 11,405 | 174 | 2,368 | 11,579 | — | 13,947 | 4,080 | 9,867 | — | |||||||||||
| Orangeburg & Central |
2,071 | 2,384 | — | 2,071 | 2,384 | — | 4,455 | 212 | 4,243 | — | |||||||||||
| Orchards Market Center II |
6,602 | 9,690 | — | 6,602 | 9,690 | — | 16,292 | 1,118 | 15,174 | — | |||||||||||
| Paces Ferry Plaza |
2,812 | 12,639 | 31 | 2,812 | 12,670 | — | 15,482 | 5,153 | 10,329 | — | |||||||||||
| Panther Creek |
14,414 | 14,748 | 84 | 14,414 | 14,832 | — | 29,246 | 5,222 | 24,024 | 9,698 | |||||||||||
| Park Place Shopping Center |
2,232 | 5,027 | 61 | 2,232 | 5,088 | — | 7,320 | 3,116 | 4,204 | — | |||||||||||
| Pasel Del Sol |
9,477 | 1,331 | 18,267 | 17,246 | 11,829 | — | 29,075 | 1,790 | 27,285 | — | |||||||||||
| Peartree Village |
5,197 | 19,746 | 1 | 5,197 | 19,747 | — | 24,944 | 6,690 | 18,254 | 9,927 | |||||||||||
| Phenix Crossing |
1,544 | — | (26 | ) | 1,518 | — | — | 1,518 | — | 1,518 | — | ||||||||||
| Pike Creek |
5,153 | 20,652 | 161 | 5,153 | 20,813 | — | 25,966 | 6,647 | 19,319 | — | |||||||||||
| Pima Crossing |
5,800 | 28,143 | 90 | 5,800 | 28,233 | — | 34,033 | 8,191 | 25,842 | — | |||||||||||
| Pine Lake Village |
6,300 | 10,991 | 461 | 6,300 | 11,452 | — | 17,752 | 3,108 | 14,644 | — | |||||||||||
| Pine Tree Plaza |
668 | 6,220 | 1 | 668 | 6,221 | — | 6,889 | 1,929 | 4,960 | — | |||||||||||
| Plaza Hermosa |
4,200 | 10,109 | 68 | 4,200 | 10,177 | — | 14,377 | 2,840 | 11,537 | 13,800 | |||||||||||
| Powell Street Plaza |
8,248 | 30,716 | 319 | 8,248 | 31,035 | — | 39,283 | 6,389 | 32,894 | — | |||||||||||
| Powers Ferry Square |
3,687 | 17,965 | 57 | 3,687 | 18,022 | — | 21,709 | 7,511 | 14,198 | — | |||||||||||
| Powers Ferry Village |
1,191 | 4,672 | 46 | 1,191 | 4,718 | — | 5,909 | 1,960 | 3,949 | 2,378 | |||||||||||
| Prairie City Crossing |
4,164 | 13,032 | 344 | 4,164 | 13,376 | — | 17,540 | 2,939 | 14,601 | — | |||||||||||
| Preston Park |
6,400 | 54,817 | (611 | ) | 5,733 | 54,873 | — | 60,606 | 16,205 | 44,401 | — | ||||||||||
| Prestonbrook |
7,069 | 8,622 | 4 | 7,069 | 8,626 | — | 15,695 | 3,786 | 11,909 | 6,800 | |||||||||||
| Prestonwood Park |
7,399 | 9,012 | 13 | 7,399 | 9,025 | — | 16,424 | 4,483 | 11,941 | — | |||||||||||
| Regency Commons |
3,917 | 3,616 | 37 | 3,917 | 3,653 | — | 7,570 | 844 | 6,726 | — | |||||||||||
| Regency Square |
4,770 | 25,191 | 112 | 4,770 | 25,303 | — | 30,073 | 14,977 | 15,096 | — | |||||||||||
| Rivermont Station |
2,887 | 10,648 | 20 | 2,887 | 10,668 | — | 13,555 | 3,396 | 10,159 | — | |||||||||||
| Rockwall Town Center |
4,438 | 5,140 | (68 | ) | 4,438 | 5,072 | — | 9,510 | 992 | 8,518 | — | ||||||||||
| Rona Plaza |
1,500 | 4,917 | 11 | 1,500 | 4,928 | — | 6,428 | 1,470 | 4,958 | — | |||||||||||
| Russell Ridge |
2,234 | 6,903 | 141 | 2,233 | 7,045 | — | 9,278 | 2,755 | 6,523 | 5,231 | |||||||||||
| Sammamish-Highlands |
9,300 | 8,075 | 195 | 9,300 | 8,270 | — | 17,570 | 2,320 | 15,250 | — | |||||||||||
| San Leandro Plaza |
1,300 | 8,226 | 7 | 1,300 | 8,233 | — | 9,533 | 2,409 | 7,124 | — | |||||||||||
| Santa Ana Downtown Plaza |
4,240 | 8,514 | (2,823 | ) | — | — | 9,931 | 9,931 | — | 9,931 | — | ||||||||||
| Sequoia Station |
9,100 | 18,356 | 28 | 9,100 | 18,384 | — | 27,484 | 5,113 | 22,371 | 21,100 | |||||||||||
| Sherwood Crossroads |
2,731 | 6,360 | 32 | 2,731 | 6,392 | — | 9,123 | 1,255 | 7,868 | — | |||||||||||
| Sherwood Market Center |
3,475 | 16,362 | 9 | 3,475 | 16,371 | — | 19,846 | 4,801 | 15,045 | — | |||||||||||
| Shoppes @ 104 |
11,193 | — | — | 11,193 | — | — | 11,193 | — | 11,193 | 7,000 | |||||||||||
| Shoppes At Mason |
1,577 | 5,685 | 111 | 1,577 | 5,796 | — | 7,373 | 1,760 | 5,613 | — | |||||||||||
| Shoppes Of Grande Oak |
5,091 | 5,985 | 43 | 5,091 | 6,028 | — | 11,119 | 2,267 | 8,852 | — | |||||||||||
| Shops At Arizona |
3,063 | 3,243 | 28 | 3,063 | 3,271 | — | 6,334 | 992 | 5,342 | — | |||||||||||
| Shops At County Center |
9,957 | 11,269 | 48 | 9,988 | 11,286 | — | 21,274 | 1,700 | 19,574 | — | |||||||||||
| Shops At John'S Creek |
1,863 | 2,014 | 21 | 1,870 | 2,028 | — | 3,898 | 433 | 3,465 | — | |||||||||||
| Signature Plaza |
2,396 | 3,898 | 82 | 2,396 | 3,980 | — | 6,376 | 1,109 | 5,267 | — | |||||||||||
| South Lowry Square |
3,434 | 10,445 | 31 | 3,434 | 10,476 | — | 13,910 | 2,999 | 10,911 | — | |||||||||||
| South Mountain |
146 | — | — | 146 | — | — | 146 | — | 146 | — | |||||||||||
| Southcenter |
1,300 | 12,750 | 273 | 1,300 | 13,023 | — | 14,323 | 3,613 | 10,710 | — | |||||||||||
| Southpoint Crossing |
4,412 | 12,235 | 45 | 4,412 | 12,280 | — | 16,692 | 3,517 | 13,175 | — | |||||||||||
| Starke |
71 | 1,683 | — | 71 | 1,683 | — | 1,754 | 384 | 1,370 | — | |||||||||||
| Sterling Ridge |
12,846 | 12,162 | 53 | 12,846 | 12,215 | — | 25,061 | 4,257 | 20,804 | 13,900 | |||||||||||
| Strawflower Village |
4,060 | 8,084 | 14 | 4,060 | 8,098 | — | 12,158 | 2,470 | 9,688 | — | |||||||||||
| Stroh Ranch |
4,280 | 8,189 | 49 | 4,280 | 8,238 | — | 12,518 | 3,319 | 9,199 | — | |||||||||||
| Sunnyside 205 |
1,200 | 9,459 | 24 | 1,200 | 9,483 | — | 10,683 | 2,785 | 7,898 | — | |||||||||||
| Tanasbourne Market |
3,269 | 10,861 | 8 | 3,269 | 10,869 | — | 14,138 | 843 | 13,295 | — | |||||||||||
| Tassajara Crossing |
8,560 | 15,464 | 89 | 8,560 | 15,553 | — | 24,113 | 4,321 | 19,792 | 19,800 | |||||||||||
125
Table of Contents
REGENCY CENTERS CORPORATION
Combined Real Estate and Accumulated Depreciation
December 31, 2009
(in thousands)
| Initial Cost | Cost Capitalized Subsequent to Acquisition(b) |
Total Cost | Total Cost Net of Accumulated Depreciation |
|||||||||||||||||||
| Shopping Centers(a) |
Land | Building & Improvements |
Land | Building & Improvements |
Properties held for Sale |
Total | Accumulated Depreciation |
Mortgages | ||||||||||||||
| Thomas Lake |
6,000 | 10,628 | — | 6,000 | 10,628 | — | 16,628 | 3,054 | 13,574 | — | ||||||||||||
| Town Square |
883 | 8,132 | — | 883 | 8,132 | — | 9,015 | 2,798 | 6,217 | — | ||||||||||||
| Trace Crossing |
279 | — | — | 279 | — | — | 279 | — | 279 | — | ||||||||||||
| Trophy Club |
2,595 | 11,023 | 7 | 2,595 | 11,030 | — | 13,625 | 2,998 | 10,627 | — | ||||||||||||
| Twin City Plaza |
17,245 | 44,225 | 554 | 17,263 | 44,761 | — | 62,024 | 4,975 | 57,049 | 43,085 | ||||||||||||
| Twin Peaks |
5,200 | 25,827 | 47 | 5,200 | 25,874 | — | 31,074 | 7,188 | 23,886 | — | ||||||||||||
| Valencia Crossroads |
17,921 | 17,659 | 40 | 17,921 | 17,699 | — | 35,620 | 7,424 | 28,196 | — | ||||||||||||
| Ventura Village |
4,300 | 6,648 | 42 | 4,300 | 6,690 | — | 10,990 | 1,917 | 9,073 | — | ||||||||||||
| Village Center |
3,885 | 14,131 | 119 | 3,885 | 14,250 | — | 18,135 | 5,037 | 13,098 | — | ||||||||||||
| Vista Village IV |
2,287 | 2,765 | 15 | 2,287 | 2,780 | — | 5,067 | 651 | 4,416 | — | ||||||||||||
| Walker Center |
3,840 | 7,232 | 30 | 3,840 | 7,262 | — | 11,102 | 2,178 | 8,924 | — | ||||||||||||
| Welleby Plaza |
1,496 | 7,787 | 69 | 1,496 | 7,856 | — | 9,352 | 3,946 | 5,406 | — | ||||||||||||
| Wellington Town Square |
2,041 | 12,131 | 50 | 2,041 | 12,181 | — | 14,222 | 3,771 | 10,451 | 12,800 | ||||||||||||
| West Park Plaza |
5,840 | 5,759 | 90 | 5,840 | 5,849 | — | 11,689 | 1,638 | 10,051 | — | ||||||||||||
| Westbrook Commons |
3,366 | 11,751 | 361 | 3,366 | 12,112 | — | 15,478 | 3,197 | 12,281 | — | ||||||||||||
| Westchase |
5,302 | 8,273 | 31 | 5,302 | 8,304 | — | 13,606 | 741 | 12,865 | 8,526 | ||||||||||||
| Westchester Plaza |
1,857 | 7,572 | 32 | 1,857 | 7,604 | — | 9,461 | 3,034 | 6,427 | — | ||||||||||||
| Westlake Plaza And Center |
7,043 | 27,195 | 130 | 7,043 | 27,325 | — | 34,368 | 8,365 | 26,003 | — | ||||||||||||
| Westridge Village |
9,529 | 11,397 | 70 | 9,529 | 11,467 | — | 20,996 | 3,019 | 17,977 | — | ||||||||||||
| White Oak—Dover, De |
2,144 | 3,069 | — | 2,144 | 3,069 | — | 5,213 | 2,372 | 2,841 | — | ||||||||||||
| Windmiller Plaza Phase I |
2,638 | 13,241 | 7 | 2,638 | 13,248 | — | 15,886 | 4,191 | 11,695 | — | ||||||||||||
| Woodcroft Shopping Center |
1,419 | 6,284 | 68 | 1,421 | 6,350 | — | 7,771 | 2,339 | 5,432 | — | ||||||||||||
| Woodman Van Nuys |
5,500 | 7,195 | 17 | 5,500 | 7,212 | — | 12,712 | 2,166 | 10,546 | — | ||||||||||||
| Woodmen Plaza |
7,621 | 11,018 | 90 | 7,621 | 11,108 | — | 18,729 | 5,779 | 12,950 | — | ||||||||||||
| Woodside Central |
3,500 | 9,288 | 44 | 3,500 | 9,332 | — | 12,832 | 2,621 | 10,211 | — | ||||||||||||
| Properties In Development |
(200 | ) | 1,078,886 | (158,260 | ) | — | 920,426 | — | 920,426 | 28,170 | 892,256 | 992 | ||||||||||
| 978,196 | 3,085,138 | (129,556 | ) | 975,861 | 2,938,270 | 19,647 | 3,933,778 | 622,163 | 3,311,615 | 405,263 | ||||||||||||
| (a) | See Item 2. Properties for geographic location and year acquired. |
| (b) | The negative balance for costs capitalized subsequent to acquisition could include out-parcels sold, provision for loss recorded and development transfers subsequent to the initial costs. |
126
Table of Contents
REGENCY CENTERS CORPORATION
Combined Real Estate and Accumulated Depreciation
December 31, 2009
(in thousands)
Depreciation and amortization of the Company's investment in buildings and improvements reflected in the statements of operations is calculated over the estimated useful lives of the assets as follows:
Buildings and improvements up to 40 years
The aggregate cost for Federal income tax purposes was approximately $3.2 billion at December 31, 2009.
The changes in total real estate assets for the years ended December 31, 2009, 2008, and 2007:
| 2009 | 2008 | 2007 | ||||||||
| Balance, beginning of year |
$ | 4,042,487 | 3,965,285 | 3,467,543 | ||||||
| Developed or acquired properties |
180,346 | 358,155 | 545,814 | |||||||
| Improvements |
15,617 | 15,995 | 18,022 | |||||||
| Sale of properties |
(150,792 | ) | (202,758 | ) | (66,094 | ) | ||||
| Properties held for sale |
(19,647 | ) | (66,447 | ) | — | |||||
| Properties reclassed to held for use |
(30,296 | ) | — | — | ||||||
| Provision for loss |
(103,937 | ) | (27,743 | ) | — | |||||
| Balance, end of year |
$ | 3,933,778 | 4,042,487 | 3,965,285 | ||||||
| The changes in accumulated depreciation for the years ended December 31, 2009, 2008, and 2007: | ||||||||||
| 2,009 | 2,008 | 2,007 | ||||||||
| Balance, beginning of year |
$ | 554,595 | 497,498 | 427,389 | ||||||
| Depreciation for year |
97,020 | 88,509 | 76,069 | |||||||
| Sale of properties |
(31,792 | ) | (19,771 | ) | (5,960 | ) | ||||
| Accumulated depreciation related |
||||||||||
| to properties held for sale |
(3,066 | ) | (11,641 | ) | — | |||||
| Accumulated depreciation related |
||||||||||
| to properties reclassed to held for use |
5,406 | — | — | |||||||
| Balance, end of year |
$ | 622,163 | 554,595 | 497,498 | ||||||
127
Table of Contents
| Item 9. | Changes in and Disagreements with Accountants on Accounting and Financial Disclosure |
None.
| Item 9A. | Controls and Procedures (Regency Centers Corporation) |
Conclusion Regarding the Effectiveness of Disclosure Controls and Procedures
Under the supervision and with the participation of the Parent Company’s management, including its chief executive officer and chief financial officer, the Parent Company conducted an evaluation of its disclosure controls and procedures, as such term is defined under Rule 13a-15(e) promulgated under the Securities Exchange Act of 1934, as amended (the Exchange Act). Based on this evaluation, the Parent Company’s chief executive officer and chief financial officer concluded that its disclosure controls and procedures were effective as of the end of the period covered by this annual report on Form 10-K to ensure information required to be disclosed in the reports filed or submitted under the Exchange Act is recorded, processed, summarized and reported, within the time period specified in the SEC’s rules and forms. These disclosure controls and procedures include controls and procedures designed to ensure that information required to be disclosed by the Parent Company in the reports it files or submits is accumulated and communicated to management, including its chief executive officer and chief financial officer, as appropriate, to allow timely decisions regarding required disclosure.
Management’s Report on Internal Control over Financial Reporting
The Parent Company’s management is responsible for establishing and maintaining adequate internal control over financial reporting, as such term is defined in Exchange Act Rules 13a-15(f). Under the supervision and with the participation of its management, including its chief executive officer and chief financial officer, the Parent Company conducted an evaluation of the effectiveness of its internal control over financial reporting based on the framework in Internal Control - Integrated Framework issued by the Committee of Sponsoring Organizations of the Treadway Commission. Based on its evaluation under the framework in Internal Control - Integrated Framework, the Parent Company’s management concluded that its internal control over financial reporting was effective as of December 31, 2009.
KPMG LLP, an independent registered public accounting firm, has audited the consolidated financial statements included in this annual report on Form 10-K and, as part of their audit, has issued a report, included herein, on the effectiveness of the Parent Company’s internal control over financial reporting.
The Parent Company’s system of internal control over financial reporting was designed to provide reasonable assurance regarding the preparation and fair presentation of published financial statements in accordance with accounting principles generally accepted in the United States. All internal control systems, no matter how well designed, have inherent limitations. Therefore, even those systems determined to be effective can provide only reasonable assurance and may not prevent or detect misstatements. Also, projections of any evaluation of effectiveness to future periods are subject to the risk that controls may become inadequate because of changes in conditions, or that the degree of compliance with the policies or procedures may deteriorate.
Changes in Internal Controls
There have been no changes in the Parent Company’s internal controls over financial reporting identified in connection with this evaluation that occurred during the fourth quarter of 2009 and that have materially affected, or are reasonably likely to materially affect, its internal controls over financial reporting.
Controls and Procedures (Regency Centers, L.P.)
Conclusion Regarding the Effectiveness of Disclosure Controls and Procedures
Under the supervision and with the participation of the Operating Partnership’s management, including the chief executive officer and chief financial officer of its general partner, the Operating Partnership conducted an evaluation of its disclosure controls and procedures, as such term is defined under Rule 13a-15(e) promulgated under the Securities Exchange Act of 1934, as amended (the Exchange Act). Based on this evaluation, the chief executive officer and chief financial officer of its general partner concluded that its disclosure controls and procedures were effective as of the end of the period covered by this annual report on Form 10-K to ensure information required to be disclosed in the reports filed or submitted under the Exchange Act is recorded, processed, summarized and reported, within the time period specified in the SEC’s rules and forms. These disclosure controls and procedures include controls and procedures designed to ensure that information required to
128
Table of Contents
be disclosed by the Operating Partnership in the reports it files or submits is accumulated and communicated to management, including the chief executive officer and chief financial officer of its general partner, as appropriate, to allow timely decisions regarding required disclosure.
Management’s Report on Internal Control over Financial Reporting
The Operating Partnership’s management is responsible for establishing and maintaining adequate internal control over financial reporting, as such term is defined in Exchange Act Rules 13a-15(f). Under the supervision and with the participation of its management, including the chief executive officer and chief financial officer of its general partner, the Operating Partnership conducted an evaluation of the effectiveness of its internal control over financial reporting based on the framework in Internal Control - Integrated Framework issued by the Committee of Sponsoring Organizations of the Treadway Commission. Based on its evaluation under the framework in Internal Control - Integrated Framework, the Operating Partnership’s management concluded that its internal control over financial reporting was effective as of December 31, 2009.
KPMG LLP, an independent registered public accounting firm, has audited the consolidated financial statements included in this annual report on Form 10-K and, as part of their audit, has issued a report, included herein, on the effectiveness of the Operating Partnership’s internal control over financial reporting.
The Operating Partnership’s system of internal control over financial reporting was designed to provide reasonable assurance regarding the preparation and fair presentation of published financial statements in accordance with accounting principles generally accepted in the United States. All internal control systems, no matter how well designed, have inherent limitations. Therefore, even those systems determined to be effective can provide only reasonable assurance and may not prevent or detect misstatements. Also, projections of any evaluation of effectiveness to future periods are subject to the risk that controls may become inadequate because of changes in conditions, or that the degree of compliance with the policies or procedures may deteriorate.
Changes in Internal Controls
There have been no changes in the Operating Partnership’s internal controls over financial reporting identified in connection with this evaluation that occurred during the fourth quarter of 2009 and that have materially affected, or are reasonably likely to materially affect, its internal controls over financial reporting.
| Item 9B. | Other Information |
Not applicable
129
Table of Contents
PART III
| Item 10. | Directors, Executive Officers and Corporate Governance |
Information concerning the directors of Regency is incorporated herein by reference to Regency’s definitive proxy statement to be filed with the Securities and Exchange Commission within 120 days after the end of the fiscal year covered by this Form 10-K with respect to its 2010 Annual Meeting of Stockholders.
Information regarding executive officers is included in Part I of this Form 10-K as permitted by General Instruction G(3).
Audit Committee, Independence, Financial Experts. Incorporated herein by reference to Regency’s definitive proxy statement to be filed with the Securities and Exchange Commission within 120 days after the end of the fiscal year covered by this Form 10-K with respect to its 2010 Annual Meeting of Stockholders.
Compliance with Section 16(a) of the Exchange Act. Information concerning filings under Section 16(a) of the Exchange Act by the directors or executive officers of Regency is incorporated herein by reference to Regency’s definitive proxy statement to be filed with the Securities and Exchange Commission within 120 days after the end of the fiscal year covered by this Form 10-K with respect to its 2010 Annual Meeting of Stockholders.
Code of Ethics. We have adopted a code of ethics applicable to our Board of Directors, principal executive officers, principal financial officer, principal accounting officer and persons performing similar functions. The text of this code of ethics may be found on our web site at “www.regencycenters.com.” We intend to post notice of any waiver from, or amendment to, any provision of our code of ethics on our web site.
| Item 11. | Executive Compensation |
Incorporated herein by reference to Regency’s definitive proxy statement to be filed with the Securities and Exchange Commission within 120 days after the end of the fiscal year covered by this Form 10-K with respect to its 2010 Annual Meeting of Stockholders.
130
Table of Contents
| Item 12. | Security Ownership of Certain Beneficial Owners and Management and Related Stockholder Matters |
Equity Compensation Plan Information
| (a) | (b) | (c) | |||||
| Plan Category |
Number of securities to be issued upon exercise of outstanding options, warrants and rights |
Weighted-average exercise price of outstanding options, warrants and rights(1) |
Number of securities remaining available for future issuance under equity compensation plans (excluding securities reflected in column (2) | ||||
| Equity compensation plans approved by security holders |
453,463 | $ | 51.90 | ||||
| Equity compensation plans not approved by security holders |
N/A | N/A | N/A | ||||
| Total |
453,463 | $ | 51.90 | ||||
| (1) | The weighted average exercise price excludes stock rights awards, which we sometimes refer to as unvested restricted stock. |
| (2) | Our Long Term Omnibus Plan, as amended and approved by stockholders at our 2003 annual meeting, provides for the issuance of up to 5.0 million shares of common stock or stock options for stock compensation; however, outstanding unvested grants plus vested but unexercised options cannot exceed 12% of our outstanding common stock and common stock equivalents (excluding options and other stock equivalents outstanding under the plan). The plan permits the grant of any type of share-based award but limits restricted stock awards, stock rights awards, performance shares, dividend equivalents settled in stock and other forms of stock grants to 2.75 million shares, of which 924,402 shares were available at December 31, 2009 for future issuance. |
Information about security ownership is incorporated herein by reference to Regency’s definitive proxy statement to be filed with the Securities and Exchange Commission within 120 days after the end of the fiscal year covered by this Form 10-K with respect to its 2010 Annual Meeting of Stockholders.
| Item 13. | Certain Relationships and Related Transactions, and Director Independence |
Incorporated herein by reference to Regency’s definitive proxy statement to be filed with the Securities and Exchange Commission within 120 days after the end of the fiscal year covered by this Form 10-K with respect to its 2010 Annual Meeting of Stockholders.
| Item 14. | Principal Accountant Fees and Services |
Incorporated herein by reference to Regency’s definitive proxy statement to be filed with the Securities and Exchange Commission within 120 days after the end of the fiscal year covered by this Form 10-K with respect to its 2010 Annual Meeting of Stockholders.
131
Table of Contents
PART IV
| Item 15. | Exhibits and Financial Statement Schedules |
| (a) | Financial Statements and Financial Statement Schedules: |
Regency Centers Corporation and Regency Centers, L.P. 2009 financial statements and financial statement schedule, together with the reports of KPMG LLP are listed on the index immediately preceding the financial statements in Item 8, Consolidated Financial Statements and Supplemental Data.
| (b) | Exhibits: |
In reviewing the agreements included as exhibits to this report, please remember they are included to provide you with information regarding their terms and are not intended to provide any other factual or disclosure information about the Company, its subsidiaries or other parties to the agreements. The Agreements contain representations and warranties by each of the parties to the applicable agreement. These representations and warranties have been made solely for the benefit of the other parties to the applicable agreement and:
| • | should not in all instances be treated as categorical statements of fact, but rather as a way of allocating the risk to one of the parties if those statements prove to be inaccurate; |
| • | have been qualified by disclosures that were made to the other party in connection with the negotiation of the applicable agreement, which disclosures are not necessarily reflected in the agreement; |
| • | may apply standards of materiality in a way that is different from what may be viewed as material to you or other investors; and |
| • | were made only as of the date of the applicable agreement or such other date or dates as may be specified in the agreement and are subject to more recent developments. |
Accordingly, these representations and warranties may not describe the actual state of affairs as of the date they were made or at any other time. Additional information about the Company may be found elsewhere in this report and the Company’s other public files, which are available without charge through the SEC’s website at http://www.sec.gov.
Unless otherwise indicated below, the Commission file number to the exhibit is No. 001-12298.
3. Articles of Incorporation and Bylaws
| (a) | Restated Articles of Incorporation of Regency Centers Corporation (incorporated by reference to Exhibit 3.1 of the Company’s Form 8-K filed February 19, 2008). |
| (b) | Amended and Restated Bylaws of Regency Centers Corporation (incorporated by reference to Exhibit 3.2(b) of the Company’s Form 8-K filed November 7, 2008). |
| (c) | Fourth Amended and Restated Certificate of Limited Partnership of Regency Centers, L.P. (incorporated by reference to Exhibit 3(a) to Regency Centers, L.P.’s Form 10-K filed March 17, 2009). |
132
Table of Contents
| (d) | Fourth Amended and Restated Agreement of Limited Partnership of Regency Centers, L.P., as amended (incorporated by reference to Exhibit 10(m) to the Company’s Form 10-K filed March 12, 2004). |
| (i) | Amendment to Fourth Amended and Restated Agreement of Limited Partnership of Regency Centers, L.P. relating to 6.70% Series 5 Cumulative Redeemable Preferred Units (incorporated by reference to Exhibit 3.3 to the Company’s Form 8-K filed August 1, 2005). |
| (ii) | Amended and Restated Amendment dated January 1, 2008 to Fourth Amended and Restated Agreement of Limited Partnership of Regency Centers, L.P. relating to 7.45% Series 3 Cumulative Redeemable Preferred Units (incorporated by reference to Exhibit 3.1 to Regency Centers, L.P.’s Form 8-K filed January 7, 2008). |
| (iii) | Amended and Restated Amendment dated January 1, 2008 to Fourth Amended and Restated Agreement of Limited Partnership of Regency Centers, L.P. relating to 7.25% Series 4 Cumulative Redeemable Preferred Units (incorporated by reference to Exhibit 3.2 to Regency Centers, L.P.’s Form 8-K filed January 7, 2008). |
4. Instruments Defining Rights of Security Holders
| (a) | See Exhibits 3(a) and 3(b) for provisions of the Articles of Incorporation and Bylaws of the Company defining the rights of security holders. See Exhibit 3(d) for provisions of the Partnership Agreement of Regency Centers, L.P. defining rights of security holders. |
| (b) | Indenture dated March 9, 1999 between Regency Centers, L.P., the guarantors named therein and First Union National Bank, as trustee (incorporated by reference to Exhibit 4.1 to the registration statement on Form S-3 of Regency Centers, L.P. filed February 24, 1999, No. 333-72899). |
| (c) | Indenture dated December 5, 2001 between Regency Centers, L.P., the guarantors named therein and First Union National Bank, as trustee (incorporated by reference to Exhibit 4.4 of Form 8-K of Regency Centers, L.P. filed December 10, 2001). |
| (i) | First Supplemental Indenture dated as of June 5, 2007 among Regency Centers, L.P., the Company as guarantor and U.S. Bank National Association, as successor to Wachovia Bank, National Association (formerly known as First Union National Bank), as trustee (incorporated by reference to Exhibit 4.1 of Form 8-K of Regency Centers, L.P. filed June 5, 2007). |
| (d) | Indenture dated July 18, 2005 between Regency Centers, L.P., the guarantors named therein and Wachovia Bank, National Bank, as trustee (incorporated by reference to Exhibit 4.1 to the registration statement on Form S-4 of Regency Centers, L.P. filed August 5, 2005, No. 333-127274). |
| (e) | Confirmation of Forward Sale Transaction dated as of December 4, 2009 among Regency Centers Corporation and Wachovia Bank, National Association (incorporated by reference to Exhibit 4.1 to the Company’s Form 8-K filed December 7, 2009). |
| (f) | Confirmation of Forward Sale Transaction dated as of December 4, 2009 among Regency Centers Corporation and JPMorgan Chase Bank, National |
133
Table of Contents
| Association (incorporated by reference to Exhibit 4.2 to the Company’s Form 8-K filed December 7, 2009) . |
10. Material Contracts
| ~(a) | Regency Centers Corporation Long Term Omnibus Plan (incorporated by reference to Exhibit 10.9 to the Company’s Form 10-Q filed May 8, 2008). |
| ~(i) | Form of Stock Rights Award Agreement pursuant to the Company’s Long Term Omnibus Plan (incorporated by reference to Exhibit 10(b) to the Company’s Form 10-K filed March 10, 2006). |
| ~(ii) | Form of 409A Amendment to Stock Rights Award Agreement (incorporated by reference to Exhibit 10(b)(i) to the Company’s Form 10-K filed March 17, 2009). |
| ~(iii) | Form of Nonqualified Stock Option Agreement pursuant to the Company’s Long Term Omnibus Plan (incorporated by reference to Exhibit 10(c) to the Company’s Form 10-K filed March 10, 2006). |
| ~(iv) | Form of 409A Amendment to Stock Option Agreement (incorporated by reference to Exhibit 10(c)(i) to the Company’s Form 10-K filed March 17, 2009). |
| ~(v) | Amended and Restated Deferred Compensation Plan dated May 6, 2003 (incorporated by reference to Exhibit 10(k) to the Company’s Form 10-K filed March 12, 2004). |
| ~(vi) | Regency Centers Corporation 2005 Deferred Compensation Plan (incorporated by reference to Exhibit 10(s) to the Company’s Form 8-K filed December 21, 2004). |
| ~(vii) | First Amendment to Regency Centers Corporation 2005 Deferred Compensation Plan dated December 2005 (incorporated by reference to Exhibit 10(q)(i) to the Company’s Form 10-K filed March 10, 2006). |
| ~(b) | Form of Director/Officer Indemnification Agreement (filed as an Exhibit to Pre-effective Amendment No. 2 to the Company registration statement on Form S-11 filed October 5, 1993 (33-67258), and incorporated by reference). |
| ~(c) | 2008 Amended and Restated Severance and Change of Control Agreement dated as of January 1, 2008 by and between the Company and Martin E. Stein, Jr. (incorporated by reference to Exhibit 10.1 of the Company’s Form 8-K filed January 7, 2008). |
| ~(d) | 2008 Amended and Restated Severance and Change of Control Agreement dated as of January 1, 2008 by and between the Company and Bruce M. Johnson (incorporated by reference to Exhibit 10.3 of the Company’s Form 8-K filed January 7, 2008). |
| ~(e) | 2008 Amended and Restated Severance and Change of Control Agreement dated as of January 1, 2008 by and between the Company and Brian M. Smith (incorporated by reference to Exhibit 10.4 of the Company’s Form 8-K filed January 7, 2008). |
134
Table of Contents
| ~(i) | Addendum No. 1 dated March 17, 2008 to 2008 Amended and Restated Severance and Change of Control Agreement dated as of January 1, 2008 by and between the Company and Brian M. Smith (incorporated by reference to Exhibit 10.1 of the Company’s Form 8-K filed March 21, 2008). |
| (f) | Second Amended and Restated Credit Agreement dated as of February 9, 2007 by and among Regency Centers, L.P., the Company, each of the financial institutions initially a signatory thereto, and Wells Fargo Bank, National Association (incorporated by reference to Exhibit 10.1 to the Company’s Form 10-Q filed May 9, 2007). |
| (i) | First Amendment to Second Amended and Restated Credit Agreement (incorporated by reference to Exhibit 10.2 to the Company’s Form 10-Q filed May 8, 2008). |
| (g) | Credit Agreement dated as of March 5, 2008 by and among Regency Centers, L.P., the Company, each of the financial institutions party thereto and Wells Fargo Bank, National Association (incorporated by reference to Exhibit 10.1 to the Company’s Form 10-Q filed May 8, 2008). |
| (h) | Second Amended and Restated Limited Liability Company Agreement of Macquarie CountryWide-Regency II, LLC dated as of July 31, 2009 by and among Global Retail Investors, LLC, Regency Centers, L.P. and Macquarie CountryWide (US) No. 2 LLC (incorporated by reference to Exhibit 10.1 to the Company’s Form 10-Q filed November 6, 2009). |
| (i) | Limited Partnership Agreement dated as of December 21, 2006 of RRP Operating, LP (incorporated by reference to Exhibit 10(u) to the Company’s Form 10-K filed February 27, 2007. |
21. Subsidiaries of Regency Centers Corporation.
23. Consents of KPMG LLP.
| 23.1 | Consent of KPMG LLP for Regency Centers Corporation. |
| 23.2 | Consent of KPMG LLP for Regency Centers, L.P. |
31. Rule 13a-14(a)/15d-14(a) Certifications.
| 31.1 | Rule 13a-14 Certification of Chief Executive Officer for Regency Centers Corporation. |
| 31.2 | Rule 13a-14 Certification of Chief Financial Officer for Regency Centers Corporation. |
| 31.3 | Rule 13a-14 Certification of Chief Executive Officer for Regency Centers, L.P. |
| ~ | Management contract or compensatory plan |
135
Table of Contents
| 31.4 | Rule 13a-14 Certification of Chief Financial Officer for Regency Centers, L.P. |
32. Section 1350 Certifications.
The certifications in this exhibit are being furnished solely to accompany this report pursuant to 18 U.S.C. § 1350, and are not being filed for purposes of Section 18 of the Securities Exchange Act of 1934, as amended, and are not to be incorporated by reference into any of the Company’s filings, whether made before or after the date hereof, regardless of any general incorporation language in such filing.
| 32.1 | 18 U.S.C. § 1350 Certification of Chief Executive Officer for Regency Centers Corporation. |
| 32.2 | 18 U.S.C. § 1350 Certification of Chief Financial Officer for Regency Centers Corporation. |
| 32.3 | 18 U.S.C. § 1350 Certification of Chief Executive Officer for Regency Centers, L.P. |
| 32.4 | 18 U.S.C. § 1350 Certification of Chief Financial Officer for Regency Centers, L.P. |
136
Table of Contents
Pursuant to the requirements of Section 13 or 15(d) of the Securities Exchange Act of 1934, the registrant has duly caused this report to be signed on its behalf by the undersigned, thereunto duly authorized.
| REGENCY CENTERS CORPORATION and REGENCY CENTERS, L.P. | ||
| February 26, 2010 | /S/ MARTIN E. STEIN, JR. | |
| Martin E. Stein, Jr., Chairman of the Board and Chief Executive Officer | ||
Pursuant to the requirements of the Securities Exchange Act of 1934, this report has been signed below by the following persons on behalf of the registrant and in the capacities and on the dates indicated.
| February 26, 2010 | /S/ MARTIN E. STEIN, JR. | |
| Martin E. Stein, Jr., Chairman of the Board and Chief Executive Officer | ||
| February 26, 2010 | /S/ MARY LOU FIALA | |
| Mary Lou Fiala, Vice Chairman of the Board | ||
| February 26, 2010 | /S/ BRIAN M. SMITH | |
| Brian M. Smith, President, Chief Operating Officer and Director | ||
| February 26, 2010 | /S/ BRUCE M. JOHNSON | |
| Bruce M. Johnson, Executive Vice President, Chief Financial Officer (Principal Financial Officer), and Director | ||
| February 26, 2010 | /S/ J. CHRISTIAN LEAVITT | |
| J. Christian Leavitt, Senior Vice President, Secretary, and Treasurer (Principal Accounting Officer) | ||
| February 26, 2010 | /S/ RAYMOND L. BANK | |
| Raymond L. Bank, Director | ||
| February 26, 2010 | /S/ C. RONALD BLANKENSHIP | |
| C. Ronald Blankenship, Director | ||
| February 26, 2010 | /S/ A. R. CARPENTER | |
| A. R. Carpenter, Director | ||
137
Table of Contents
| February 26, 2010 | /S/ J. DIX DRUCE | |
| J. Dix Druce, Director | ||
| February 26, 2010 | /S/ DOUGLAS S. LUKE | |
| Douglas S. Luke, Director | ||
| February 26, 2010 | /S/ JOHN C. SCHWEITZER | |
| John C. Schweitzer, Director | ||
| February 26, 2010 | /S/ THOMAS G. WATTLES | |
| Thomas G. Wattles, Director | ||
138