Attached files
Exhibit 13
STOCKHOLDER RETURN PERFORMANCE GRAPH
The following line graph compares the yearly percentage change in the cumulative total stockholder return on the Company’s common stock, to the cumulative total return of the Standard & Poor’s Composite 500 Stock Index and the return of the industry peer group of companies identified in the graph (the Peer Group Index) for the last five fiscal years ending December 31, 2009. Standard & Poor’s has calculated a return for each company in the Peer Group Index weighted according to its respective capitalization at the beginning of each period with dividends reinvested on a monthly basis. Management believes that the identified companies and methodology used in the graph for the peer group indices provides a better comparison than other indices available. The Peer Group Index consists of Caterpillar Inc., Cummins Inc., Danaher Corporation, Deere & Company, Dover Corporation, Eaton Corporation, Harley-Davidson, Inc., Honeywell International Inc., Illinois Tool Works Inc., Ingersoll-Rand Company Ltd. and United Technologies Corporation. The comparison assumes that $100 was invested on December 31, 2004 in the Company’s common stock and in the stated indices and assumes reinvestment of dividends.
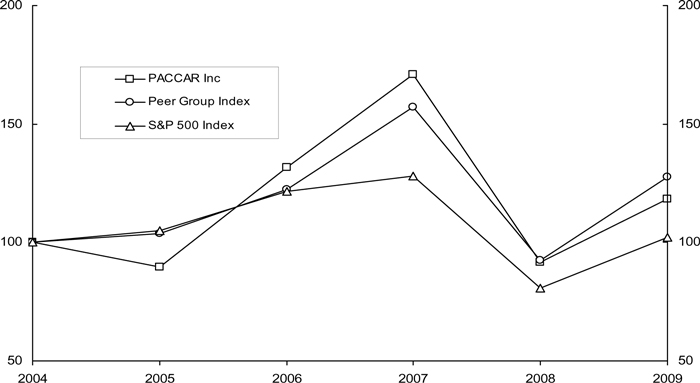
| 2004 |
2005 |
2006 |
2007 |
2008 |
2009 | |||||||
| PACCAR Inc |
100 | 89.58 | 131.71 | 170.96 | 91.71 | 118.42 | ||||||
| S&P 500 Index |
100 | 104.91 | 121.48 | 128.16 | 80.74 | 102.11 | ||||||
| Peer Group Index |
100 | 103.87 | 122.43 | 156.99 | 92.51 | 127.43 |
23
MANAGEMENT’S DISCUSSION AND ANALYSIS OF FINANCIAL CONDITION AND RESULTS OF OPERATIONS
(tables in millions, except truck unit and per share data)
RESULTS OF OPERATIONS:
| 2009 | 2008 | 2007 | ||||||||||
| Net sales and revenues: |
||||||||||||
| Truck and Other |
$ | 7,076.7 | $ | 13,709.6 | $ | 14,030.4 | ||||||
| Financial Services |
1,009.8 | 1,262.9 | 1,191.3 | |||||||||
| $ | 8,086.5 | $ | 14,972.5 | $ | 15,221.7 | |||||||
| Income before taxes: |
||||||||||||
| Truck and Other |
$ | 68.1 | $ | 1,162.5 | $ | 1,384.8 | ||||||
| Financial Services |
84.6 | 216.9 | 284.1 | |||||||||
| Investment income |
22.3 | 84.6 | 95.4 | |||||||||
| Income taxes |
(63.1 | ) | (446.1 | ) | (537.0 | ) | ||||||
| Net Income |
$ | 111.9 | $ | 1,017.9 | $ | 1,227.3 | ||||||
| Diluted Earnings Per Share |
$ | .31 | $ | 2.78 | $ | 3.29 | ||||||
Overview:
PACCAR is a global technology company whose principal businesses include the design, manufacture and distribution of high-quality, light-, medium- and heavy-duty commercial trucks and related aftermarket parts and the financing and leasing of its trucks and related equipment. The Company also manufactures and markets industrial winches.
2009 Compared to 2008:
Consolidated net sales and revenues were $8.09 billion in 2009, compared to $14.97 billion in 2008, reflecting the recessionary conditions that dampened demand for the Company’s products throughout the world.
PACCAR achieved net income for the 71st consecutive year in 2009 under very difficult business conditions. Net income was $111.9 million ($.31 per diluted share) in 2009 compared to $1.02 billion ($2.78 per diluted share) in 2008. Net income included $41.5 million ($.11 per diluted share) of curtailment gains related to postretirement health care plans ($66.0 million, pretax) and $11.4 million ($.03 per diluted share) of income tax expense from the retroactive effects of a new income tax law in Mexico.
Net sales and revenues in the Truck and Other businesses of $7.08 billion in 2009 were 48% lower than the $13.71 billion in 2008. The decrease in sales and revenues for 2009 resulted from lower truck unit and parts sales in all markets due to lower overall market demand.
Cost of sales and revenues in the Truck and Other businesses were $6.48 billion in 2009 compared to $11.74 billion in 2008. Cost of sales and revenues declined primarily due to the decrease in worldwide truck deliveries. Cost of sales included employee severance costs of $19.2 million in 2009 compared to severance costs of $13.1 million in 2008.
Research and development expenditures declined to $199.2 million in 2009 from $341.8 million in 2008 primarily due to lower spending on engine development and reduced spending for new vehicle development.
Selling, general and administrative (SG&A) expense for Truck and Other declined to $348.4 million in 2009 compared to $470.2 million in 2008. The lower spending was a result of focused efforts to reduce costs in response to the global economic recession and consisted primarily of reduced staffing , sales and marketing and travel costs. Foreign currency translation effects reduced SG&A by $10.8 million. Severance costs included in SG&A were $6.4 million in 2009 compared to $3.4 million in 2008. As a percentage of sales, SG&A increased to 4.9% in 2009 from 3.4% in 2008 due to lower sales volumes.
Interest and other expense, net in 2009 of $43.6 million includes $22.2 million of expense for changes in fair values of economic hedges and $14.2 million of expense for foreign currency translation adjustments primarily in Mexico and Canada.
24
Financial Services revenues decreased to $1.01 billion in 2009 from $1.26 billion in 2008. The decreased revenues in 2009 resulted from lower earning asset balances in all markets and lower yields in North America and Europe. Financial Services income before income taxes was $84.6 million in 2009 compared to $216.9 million in 2008. The decrease of $132.3 million was primarily due to lower finance margin from the reduced finance receivables and net operating lease income partially offset by a decline in SG&A expense.
Investment income declined to $22.3 million in 2009 compared to $84.6 million in 2008 primarily due to lower market interest rates.
The 2009 effective income tax rate was 36.1% compared to 30.5% in 2008. The higher rate in 2009 was due to the tax law change in Mexico. Excluding the retroactive effect of the Mexican tax law change the effective tax rate was 29.5%.
The Company’s return on revenues was 1.4% in 2009 and 6.8% in 2008.
2008 Compared to 2007:
Consolidated net sales and revenues were $14.97 billion in 2008 compared to $15.22 billion in 2007, reflecting strong but slowing demand for the Company’s high quality trucks in Europe. The U.S. and Canada truck markets were lower but there was continued solid aftermarket parts and financial services revenues.
PACCAR achieved net income of $1.02 billion ($2.78 per diluted share) in 2008 compared to $1.23 billion ($3.29 per diluted share) in 2007, the fourth best result in the Company’s 103 year history. Net sales and revenues in the Truck and Other businesses of $13.71 billion were slightly lower than the $14.03 billion in 2007 as an increase in European truck sales was more than offset by decreased truck sales in North America and Australia.
Cost of sales and revenues in the Truck and Other businesses were $11.74 billion in 2008, down 1.5% compared to $11.92 billion in 2007. Cost of sales and revenues declined primarily due to 6% lower truck deliveries partially offset by the weaker U.S. dollar vs. the euro and higher material costs related to higher crude oil, copper, steel and other commodities.
Research and development expenditures were $341.8 million in 2008, an increase of 34% from $255.5 million in 2007 due to spending in preparation for EPA engine emission requirements in the U.S. in 2010, expenses related to the introduction of the Company’s proprietary 12.9 liter engine in North America and increased spending on vehicle updates in the U.S. and Europe.
SG&A expense for Truck and Other declined to $470.2 million in 2008 compared to $491.4 million in 2007. This was due to $35.5 million of reductions in worldwide spending partially offset by $14.3 million of foreign currency translation effects, primarily the euro. The spending reductions resulted from staffing reductions, lower sales and marketing costs and lower general and administrative spending in the fourth quarter in response to the global recession. SG&A expense as a percent of revenues decreased to 3.4% in 2008 from 3.5% in 2007.
Financial Services revenues increased to $1.26 billion in 2008 from $1.19 billion in 2007 as increased revenues in Europe and Mexico more than offset a decrease in the U.S. Financial Services income before taxes was $216.9 million compared to $284.1 million in 2007 as the additional finance margin from asset growth in Europe and Mexico was reduced by higher provisions for credit losses in the U.S. and Europe.
Investment income declined to $84.6 million in 2008 compared to $95.4 million in 2007 due to lower invested balances and interest rates.
The 2008 effective income tax rate of 30.5% was comparable to the 30.4% in 2007.
The Company’s return on revenues was 6.8% in 2008 and 8.1% in 2007.
25
Truck
PACCAR’s truck segment, which includes the manufacture and distribution of trucks and related aftermarket parts, accounted for 86%, 90% and 91% of revenues in 2009, 2008 and 2007, respectively. In North America, trucks are sold under the Kenworth and Peterbilt nameplates and, in Europe, under the DAF nameplate.
2009 Compared to 2008:
| 2009 | 2008 | % change | |||||||
| Truck net sales and revenues: |
|||||||||
| U.S. and Canada |
$ | 3,566.0 | $ | 4,823.7 | (26 | ) | |||
| Europe |
2,520.2 | 6,624.8 | (62 | ) | |||||
| Mexico, Australia and other |
907.8 | 2,098.9 | (57 | ) | |||||
| $ | 6,994.0 | $ | 13,547.4 | (48 | ) | ||||
| Truck income before taxes |
$ | 25.9 | $ | 1,156.5 | (98 | ) | |||
The Company’s new truck deliveries are summarized below:
| 2009 | 2008 | % change | |||||
| United States |
28,300 | 38,200 | (26 | ) | |||
| Canada |
4,400 | 6,700 | (34 | ) | |||
| U.S. and Canada |
32,700 | 44,900 | (27 | ) | |||
| Europe |
22,200 | 63,700 | (65 | ) | |||
| Mexico, Australia and other |
6,100 | 17,300 | (65 | ) | |||
| Total units |
61,000 | 125,900 | (52 | ) | |||
PACCAR’s worldwide truck sales and revenues were $6.99 billion in 2009 compared to $13.55 billion in 2008 due to lower market demand worldwide attributable to global recessionary conditions. 2009 truck net sales and revenues and income before income taxes were also affected by the translation of weaker foreign currencies, primarily the euro and British pound. The translation effect of all currencies decreased 2009 sales and revenues by $260.9 million and income before income taxes by $30.9 million compared to 2008.
In the U.S. and Canada, 2009 net sales and revenues decreased to $3.57 billion compared to $4.82 billion in 2008. Industry retail sales in the heavy-duty market in U.S. and Canada declined 29% to 108,000 units in 2009 compared to 153,000 units in 2008 and were at their lowest levels since 1991. The Company’s market share was 25.1% in 2009 and 26.0% in 2008. The medium-duty market was 40,000 units in 2009 compared to 63,000 units in 2008. The Company achieved record medium-duty market share of 15.3% in 2009 compared to 14.1% in 2008.
In Europe, 2009 net sales and revenues decreased to $2.52 billion compared to $6.62 billion in 2008. The 15 tonne and above truck market in Western and Central Europe was 168,000 units compared to 330,000 units in 2008. The Company’s market share was a record 14.8% in 2009 compared to 14.2% in 2008. DAF market share in the 6 to 15 tonne market in 2009 was 9.3%, the same as in 2008. The 6 to 15 tonne market was 51,000 units in 2009, compared to 79,000 units in 2008.
Net sales and revenues in Mexico, Australia and other countries outside the Company’s primary markets declined to $.91 billion in 2009 from $2.10 billion in 2008 due to lower new truck deliveries reflecting lower overall market demand.
Truck segment income before income taxes decreased to $25.9 million in 2009 from $1.16 billion in 2008 from lower truck unit and aftermarket parts sales and margins in all markets, partially offset by lower research and development spending as well as lower SG&A spending.
26
Net sales and revenues and gross margins for truck units and aftermarket parts are provided below. The aftermarket parts gross margin includes direct revenues and costs, but excludes certain truck segment costs.
| 2009 | 2008 | % change | |||||||||
| Truck net sales and revenues: |
|||||||||||
| Trucks |
$ | 5,103.3 | $ | 11,281.3 | (55 | ) | |||||
| Aftermarket parts |
1,890.7 | 2,266.1 | (17 | ) | |||||||
| $ | 6,994.0 | $ | 13,547.4 | (48 | ) | ||||||
| Gross margin: |
|||||||||||
| Trucks |
$ | (46.6 | ) | $ | 1,141.7 | (104 | ) | ||||
| Aftermarket parts |
625.7 | 795.2 | (21 | ) | |||||||
| $ | 579.1 | $ | 1,936.9 | (70 | ) | ||||||
| Gross margin %: |
|||||||||||
| Trucks |
(.9 | )% | 10.1 | % | |||||||
| Aftermarket parts |
33.1 | % | 35.1 | % | |||||||
| 8.3 | % | 14.3 | % | ||||||||
Total truck segment gross margins for 2009 decreased to 8.3% from 14.3% in 2008. The lower gross margins were primarily the result of lower truck gross margins. Gross margins on trucks declined to negative .9% in 2009, reflecting lower industry demand and reduced absorption of fixed costs resulting from the decline in truck production. 2009 parts gross margins declined from the prior year primarily due to a sales mix shift to lower margin replacement parts.
2008 Compared to 2007:
| 2008 | 2007 | % change | |||||||||
| Truck net sales and revenues: |
|||||||||||
| U.S. and Canada |
$ | 4,823.7 | $ | 5,648.8 | (15 | ) | |||||
| Europe |
6,624.8 | 5,859.6 | 13 | ||||||||
| Mexico, Australia and other |
2,098.9 | 2,345.9 | (11 | ) | |||||||
| $ | 13,547.4 | $ | 13,854.3 | (2 | ) | ||||||
| Truck income before taxes |
$ | 1,156.5 | $ | 1,352.8 | (15 | ) | |||||
The Company’s new truck deliveries are summarized below:
| 2008 | 2007 | % change | |||||||
| United States |
38,200 | 44,700 | (15 | ) | |||||
| Canada |
6,700 | 8,300 | (19 | ) | |||||
| U.S. and Canada |
44,900 | 53,000 | (15 | ) | |||||
| Europe |
63,700 | 60,100 | 6 | ||||||
| Mexico, Australia, and other |
17,300 | 20,800 | (17 | ) | |||||
| Total units |
125,900 | 133,900 | (6 | ) | |||||
PACCAR’s worldwide truck sales and revenues were $13.55 billion in 2008 compared to $13.85 billion in 2007 due to higher demand for the Company’s trucks in Europe more than offset by lower demand in the U.S. and Canada, and other international markets. The impact of a weaker U.S. dollar relative to the Company’s other currencies (primarily the euro) increased revenues and pretax profit by approximately $445.0 million and $49.5 million, respectively.
In the U.S. and Canada, net sales and revenues decreased 15% to $4.82 billion from $5.65 billion in 2007 mainly as a result of fewer new truck deliveries. In the U.S. and Canada, Peterbilt and Kenworth delivered 44,900 heavy and medium duty trucks during 2008, a decrease of 8,100 units or 15% from 2007 primarily due to a lower truck market size. The Class 8 market decreased 13% to 153,000 units in 2008 from 176,000 units in 2007. PACCAR’s market share was 26.0% in 2008 compared to 26.4% in 2007. The medium duty market decreased 28% to 63,000 units.
27
European net sales and revenues increased 13% to $6.62 billion from $5.86 billion in 2007 as DAF achieved higher market share in a similar sized truck market to 2007. DAF trucks delivered a record 63,700 units during 2008, a 6% increase over 2007. The 15 tonne and above truck market in Western and Central Europe was 330,000 units compared to 337,000 units in 2007. DAF’s 2008 market share of the 15 tonne and above market increased to 14.2% compared to 13.9% in 2007. DAF market share in the 6 to 15 tonne market increased to 9.3% in 2008 from 8.3% in 2007. In Europe, demand was strong for the Company’s high-quality trucks and parts during the first nine months of 2008, including growth in Central and Eastern Europe. Industry demand slowed throughout Europe in the fourth quarter.
Net sales and revenues in Mexico, Australia and other countries outside the Company’s primary markets declined 11% to $2.10 billion in 2008 due to lower new truck deliveries. Truck unit deliveries in Mexico, Australia and other countries outside the Company’s primary markets decreased 17%.
Truck income before taxes was $1.16 billion compared to $1.35 billion in 2007. The lower income reflects the effects of lower truck production and gross margins from reduced demand and higher material costs, partially mitigated by improved operating efficiency.
Net sales and revenues and gross margins for truck units and aftermarket parts are provided below. The aftermarket parts gross margin includes direct revenues and costs, but excludes certain truck segment costs.
| 2008 | 2007 | % change | |||||||||
| Truck net sales and revenues: |
|||||||||||
| Trucks |
$ | 11,281.3 | $ | 11,571.3 | (3 | ) | |||||
| Aftermarket parts |
2,266.1 | 2,283.0 | (1 | ) | |||||||
| $ | 13,547.4 | $ | 13,854.3 | (2 | ) | ||||||
| Gross margin: |
|||||||||||
| Trucks |
$ | 1,141.7 | $ | 1,242.9 | (8 | ) | |||||
| Aftermarket parts |
795.2 | 816.7 | (3 | ) | |||||||
| $ | 1,936.9 | $ | 2,059.6 | (6 | ) | ||||||
| Gross margin %: |
|||||||||||
| Trucks |
10.1 | % | 10.7 | % | |||||||
| Aftermarket parts |
35.1 | % | 35.8 | % | |||||||
| 14.3 | % | 14.9 | % | ||||||||
Truck segment gross margin as a percentage of net sales and revenues was 14.3% in 2008 and 14.9% in 2007. The decrease in margin from 2007 resulted from the effects of weaker truck demand in North America and higher material costs partially mitigated by strong demand for the Company’s products in Europe in the first nine months.
Truck Outlook
Worldwide recessionary economic conditions are expected to continue to affect demand for heavy duty trucks in 2010. The heavy duty truck sales in the U.S. and Canada are expected to be in the range of 110,000–140,000 units, up slightly from 2009, reflecting general economic growth and an aging truck fleet. The current challenging economic conditions in Europe are expected to continue in 2010 with the market size of above 15-tonne vehicles expected to be in the range of 150,000–180,000 units. International markets are also expected to remain weak into 2010. Research and development spending in 2010 is expected to be between $225-$250 million, focusing on new product development and manufacturing efficiency improvements. The Company will begin assembling PACCAR MX engines at the Columbus, Mississippi engine production facility in mid 2010. See the Forward Looking Statement section of Management’s Discussion and Analysis for factors that may affect this outlook.
28
Financial Services
The PACCAR Financial Services (PFS) segment, which includes wholly owned subsidiaries in the U.S., Canada, Mexico, Europe and Australia, derives its earnings primarily from financing or leasing PACCAR products.
2009 Compared to 2008:
| 2009 | 2008 | % change | |||||||
| New loan and lease volume: |
|||||||||
| U.S. and Canada |
$ | 1,175.0 | $ | 1,674.0 | (30 | ) | |||
| Europe |
433.5 | 947.6 | (54 | ) | |||||
| Mexico and Australia |
306.1 | 728.6 | (58 | ) | |||||
| $ | 1,914.6 | $ | 3,350.2 | (43 | ) | ||||
| Average earning assets: |
|||||||||
| U.S. and Canada |
$ | 4,795.5 | $ | 5,692.4 | (16 | ) | |||
| Europe |
2,535.9 | 3,065.6 | (17 | ) | |||||
| Mexico and Australia |
1,321.9 | 1,621.0 | (18 | ) | |||||
| $ | 8,653.3 | $ | 10,379.0 | (17 | ) | ||||
| Average earning assets by product: |
|||||||||
| Loans and finance leases |
$ | 5,141.0 | $ | 6,295.3 | (18 | ) | |||
| Dealer wholesale financing |
1,221.2 | 1,693.0 | (28 | ) | |||||
| Equipment on lease and other |
2,291.1 | 2,390.7 | (4 | ) | |||||
| $ | 8,653.3 | $ | 10,379.0 | (17 | ) | ||||
| Revenues: |
|||||||||
| U.S. and Canada |
$ | 501.8 | $ | 602.9 | (17 | ) | |||
| Europe |
318.5 | 429.3 | (26 | ) | |||||
| Mexico and Australia |
189.5 | 230.7 | (18 | ) | |||||
| $ | 1,009.8 | $ | 1,262.9 | (20 | ) | ||||
| Revenue by product: |
|||||||||
| Loans and finance leases |
$ | 449.3 | $ | 567.3 | (21 | ) | |||
| Dealer wholesale financing |
52.5 | 116.1 | (55 | ) | |||||
| Equipment on lease and other |
508.0 | 579.5 | (12 | ) | |||||
| $ | 1,009.8 | $ | 1,262.9 | (20 | ) | ||||
| Income before taxes |
$ | 84.6 | $ | 216.9 | (61 | ) | |||
Revenues:
PFS revenues in 2009 declined 20% compared to 2008 due to lower average earning assets and lower yields primarily in the U.S., Canada, and in Europe. Average earning assets declined in 2009 due to lower new loan and lease volume in all markets and a reduction in dealer wholesale financing of new trucks. New loan and lease volume declined due to lower new PACCAR truck production. PFS market share in 2009 was 26%, down from 28% in 2008 reflecting lower market share in the first half of 2009.
29
| At December 31, |
2009 | 2008 | ||||
| Percentage of retail loan and lease accounts 30+ days past-due: |
||||||
| U.S. and Canada |
1.8 | % | 2.6 | % | ||
| Europe |
4.4 | % | 2.8 | % | ||
| Mexico and Australia |
9.5 | % | 6.2 | % | ||
| Total |
3.8 | % | 3.3 | % | ||
Worldwide PFS accounts 30+ days past-due at December 31, 2009, were 3.8% of portfolio balances compared to 3.3% at December 31, 2008, due to a decline in freight tonnage, freight rates and customer cash flows in Europe and Mexico.
Interest income and fees in 2009 declined from 2008 due to lower average earning assets and lower asset yields summarized as follows:
| Interest and fees - 2008 |
$ | 683.4 | ||
| Lower average asset balances |
(131.3 | ) | ||
| Decrease in yield |
(50.3 | ) | ||
| Interest and fees - 2009 |
$ | 501.8 | ||
The decline in average earning assets was due to lower retail loan and lease business, as well as lower dealer wholesale financing, as dealer inventory levels reduced in Europe. Yield declined due to lower market interest rates.
Operating lease, rental and other income in 2009 of $508.0 million declined from the $579.5 million in 2008 due to lower average assets, lower rental utilization and a decrease in yields. The decline in average operating lease assets was due to lower new business volume. The lower rental utilization reflected the weaker economic environment and the decline in yields was due to lower market rates.
Expenses:
Interest and other borrowing expenses decreased in 2009 from 2008 due to lower average debt balances and lower borrowing rates as summarized below:
| Interest and other borrowing expenses - 2008 |
$ | 394.1 | ||
| Lower average debt balances |
(73.3 | ) | ||
| Lower borrowing rates |
(29.0 | ) | ||
| Interest and other borrowing expenses - 2009 |
$ | 291.8 | ||
Average debt balances decreased due to the lower level of funding needed to fund the smaller financial services portfolio. Lower borrowing rates resulted due to lower commercial paper rates.
2009 depreciation and other expenses increased to $442.5 million from $437.8 million in 2008. This resulted from higher depreciation partially offset by lower costs from a smaller portfolio. 2009 depreciation increased to $331.2 million compared to $304.1 million in the prior year. The higher depreciation was from both an increase in impairments on existing operating lease assets of $19.6 million, as well as higher losses on returned operating lease assets of $20.1 million reflecting the impact of lower used truck prices.
SG&A expense of $86.5 million in 2009 declined by $24.7 million from $111.2 million in 2008. Lower spending was a result of focused efforts to reduce costs in response to global economic conditions and consisted primarily of lower staffing levels and travel costs.
30
The provision for losses on receivables is summarized below:
| 2009 | 2008 | |||||||||||||||||||
| Net Charge-offs |
Decrease in allowance |
Provision for losses on receivables |
Net Charge-offs |
Increase (decrease) in allowance |
Provision for losses on receivables | |||||||||||||||
| U.S. and Canada |
$ | 63.9 | $ | (14.1 | ) | $ | 49.8 | $ | 85.7 | $ | (5.8 | ) | $ | 79.9 | ||||||
| Europe |
43.6 | (2.0 | ) | 41.6 | 11.8 | 3.2 | 15.0 | |||||||||||||
| Mexico and Australia |
14.3 | (1.3 | ) | 13.0 | 7.3 | .7 | 8.0 | |||||||||||||
| $ | 121.8 | $ | (17.4 | ) | $ | 104.4 | $ | 104.8 | $ | (1.9 | ) | $ | 102.9 | |||||||
The provision for losses on receivables in 2009 of $104.4 million was comparable to 2008 as higher net portfolio charge-offs in Europe, Mexico and Australia were offset by lower net charge-offs in the U.S. and Canada. There was a decrease in the allowance for losses in all markets due to declining receivable portfolios.
2008 Compared to 2007:
| 2008 | 2007 | % change | |||||||
| New loan and lease volume: |
|||||||||
| U.S. and Canada |
$ | 1,674.0 | $ | 2,195.6 | (24 | ) | |||
| Europe |
947.6 | 923.5 | 3 | ||||||
| Mexico and Australia |
728.6 | 812.1 | (10 | ) | |||||
| $ | 3,350.2 | $ | 3,931.2 | (15 | ) | ||||
| Average earning assets: |
|||||||||
| U.S. and Canada |
$ | 5,692.4 | $ | 6,517.1 | (13 | ) | |||
| Europe |
3,065.6 | 2,360.9 | 30 | ||||||
| Mexico and Australia |
1,621.0 | 1,279.6 | 27 | ||||||
| $ | 10,379.0 | $ | 10,157.6 | 2 | |||||
| Average earning assets by product: |
|||||||||
| Loans and finance leases |
$ | 6,295.3 | $ | 6,461.9 | (3 | ) | |||
| Dealer wholesale financing |
1,693.0 | 1,507.3 | 12 | ||||||
| Equipment on lease and other |
2,390.7 | 2,188.4 | 9 | ||||||
| $ | 10,379.0 | $ | 10,157.6 | 2 | |||||
| Revenues: |
|||||||||
| U.S. and Canada |
$ | 602.9 | $ | 682.8 | (12 | ) | |||
| Europe |
429.3 | 320.2 | 34 | ||||||
| Mexico and Australia |
230.7 | 188.3 | 23 | ||||||
| $ | 1,262.9 | $ | 1,191.3 | 6 | |||||
| Revenue by product: |
|||||||||
| Loans and finance leases |
$ | 567.3 | $ | 561.5 | 1 | ||||
| Dealer wholesale financing |
116.1 | 111.3 | 4 | ||||||
| Equipment on lease and other |
579.5 | 518.5 | 12 | ||||||
| $ | 1,262.9 | $ | 1,191.3 | 6 | |||||
| Income before taxes |
$ | 216.9 | $ | 284.1 | (24 | ) | |||
PFS revenues increased 6% in 2008 to $1.26 billion from $1.19 billion in 2007 due to higher earning assets in all markets outside the U.S. and Canada partially offset by lower market interest rates. Revenues in the U.S. and Canada declined 12%, principally as a result of lower average assets. Total average assets declined in the U.S. and Canada due to lower new business volume from fewer new trucks sold and lower finance market share which declined from 29% to 28%. The decline in share is due to competition from banks and independent finance companies.
31
Revenues in Europe grew by 34% as average earning assets increased 30% from higher new loan and lease volume and wholesale flooring growth attributed to higher DAF truck production. PFS revenues in Mexico and Australia increased 23%, to $230.7 million, primarily due to increases in average earning assets which grew 27% as new loan and lease volume exceeded repayments. This was partially offset by lower interest rates. Worldwide new business volume was $3.35 billion in 2008 compared to $3.93 billion in 2007. Worldwide, PFS provided loan and lease financing for 28% of PACCAR new trucks delivered in 2008 compared to 29% in 2007.
Interest and other borrowing expenses and Depreciation and other of $831.9 million increased 10% from the $755.3 million in 2007. This was primarily due to higher depreciation expense on operating leases which increased to $304.1 million in 2008 from $238.6 million in 2007 as a result of an increase in average operating lease assets in service during 2008. Interest expense in 2008 was similar to 2007 as slightly higher average borrowings to support portfolio growth were offset by lower average borrowing rates. Selling, general and administrative expenses of $111.2 million were comparable to the prior year.
Income before taxes was $216.9 million in 2008 compared to $284.1 million in 2007 primarily due to a higher provision for losses on receivables. Net portfolio charge-offs were $104.8 million compared to $25.8 million in 2007 due to recessionary conditions in the U.S. and Canada and to a lesser extent in Europe. At December 31, 2008, the percentage of accounts 30+ days past-due was 3.3%, up from 2.0% at the end of 2007. The increase in the percentage of past due accounts reflected the difficult economic conditions worldwide. The increase in past due accounts in Mexico and Australia to 6.2% from 2.5% was primarily due to Mexico where a significant decline in the value of the peso compared to the dollar in the fourth quarter of 2008 resulted in cash flow difficulty for some customers.
Financial Services Outlook
Financial Services segment results are dependent on the generation of loans and leases and the related spread between the yields on loans and leases and borrowing costs, as well as access to liquidity to generate new business and the level of credit losses. The asset base in 2010 is expected to be comparable to 2009 levels. Recessionary economic conditions will continue to exert pressure on the profit margins of truck operators and challenge some customers ability to make timely payments to the Company. Improvement in past-due accounts and used truck values, fewer truck repossessions and voluntary truck returns are projected to benefit in 2010. See the Forward Looking Statement section of Management’s Discussion and Analysis for factors that may affect this outlook.
Other Business
Included in Truck and Other is the Company’s winch manufacturing business. Sales from this business represent approximately 1% of net sales for 2009, 2008 and 2007.
LIQUIDITY AND CAPITAL RESOURCES:
| At December 31 |
2009 | 2008 | 2007 | ||||||
| Cash and cash equivalents |
$ | 1,912.0 | $ | 1,955.2 | $ | 1,858.1 | |||
| Marketable debt securities |
219.5 | 175.4 | 778.5 | ||||||
| $ | 2,131.5 | $ | 2,130.6 | $ | 2,636.6 | ||||
The Company’s total cash and marketable debt securities increased $.9 million for the year ended December 31, 2009, as a decrease in cash and cash equivalents of $43.2 million was more than offset by an increase in marketable securities of $44.1 million.
32
The change in cash and cash equivalents is summarized below.
| For Years Ended December 31 |
2009 | 2008 | 2007 | |||||||||
| Operating Activities: |
||||||||||||
| Net Income |
$ | 111.9 | $ | 1,017.9 | $ | 1,227.3 | ||||||
| Net income items not affecting cash |
874.3 | 882.2 | 589.3 | |||||||||
| Changes in operating assets and liabilities |
387.1 | (595.2 | ) | 238.8 | ||||||||
| Net cash provided by operating activities |
1,373.3 | 1,304.9 | 2,055.4 | |||||||||
| Net cash provided by (used in) investing activities |
310.6 | (251.9 | ) | (1,296.8 | ) | |||||||
| Net cash used in financing activities |
(1,816.2 | ) | (868.1 | ) | (838.5 | ) | ||||||
| Effect of exchange rate changes on cash |
89.1 | (87.8 | ) | 85.5 | ||||||||
| Net (decrease) increase in cash and cash equivalents |
(43.2 | ) | 97.1 | 5.6 | ||||||||
| Cash and cash equivalents at beginning of the year |
1,955.2 | 1,858.1 | 1,852.5 | |||||||||
| Cash and cash equivalents at end of the year |
$ | 1,912.0 | $ | 1,955.2 | $ | 1,858.1 | ||||||
2009 Compared to 2008:
Operating activities: The Company’s operating cash flow increased $68.4 million compared to 2008. A decrease in net income of $906.0 million was more than offset by a reduction in receivables of $1,135.6 million primarily related to $888.1 million of higher collections of wholesale receivables reflecting a reduction in funding of dealer new truck inventory, predominately in Europe. In addition there was a reduction of trade receivables of $218.7 million as a result of lower sales levels.
Investing activities: Cash provided by investing activities increased by $562.5 million to $310.6 million in 2009 compared to 2008. Cash was provided by a larger decrease in the retail loan and lease portfolio of $539.8 million as collections on outstanding balances exceeded net new loan and lease volume reflecting lower new truck sales. Investments in capital equipment decreased $579.0 million, primarily due to reduced expenditures related to the current economic environment offset by $614.9 million of lower cash provided by net purchases and sales of marketable securities compared to 2008.
Financing activities: The cash used in financing activities increased $948.1 million to $1,816.2 million in 2009 due to higher net debt repayments of $1,601.7 million related to lower funding needed to finance a smaller financial services asset base. This was partially offset by no stock repurchases in 2009 compared to $230.6 million in 2008 and a lower dividend of $232.1 million compared to $629.2 million in 2008.
2008 Compared to 2007:
Operating activities: The Company’s operating cash flow of $1,304.9 million decreased $750.5 million compared to 2007. Net income in 2008 of $1,017.9 million decreased by $209.4 million compared to 2007. This was more than offset by a $292.9 million increase relating to net income items not affecting cash to $882.2 million in 2008. This is mainly from increased depreciation on higher depreciable assets and higher deferred taxes related to tax incentive depreciation in the U.S. Changes in operating assets and liabilities were a net cash outflow in 2008 of $595.2 million compared to an inflow of $238.8 million in 2007. The change of $834.0 million was due in part to purchasing finished goods to secure inventory from a supplier exiting the business. In addition, $246.3 million of cash was used for increased funding of dealer inventory by the Company’s Financial Services segment primarily in Europe due to the abrupt market slowdown in the fourth quarter compared to a reduction of $81.3 million in 2007.
Investing activities: Cash used in investing activities decreased to $251.9 million in 2008 from $1,296.8 million in 2007. The Company liquidated $572.1 million of its marketable debt securities portfolio to improve liquidity due to the more difficult credit markets. The Financial Services segment experienced lower new loan and lease originations from lower demand for truck financing.
33
Financing activities: 2008 financing cash outflow of $868.1 million was slightly higher than 2007 as the effect of lower net borrowings from a declining financial services asset base was offset by $129.9 million of lower treasury stock repurchases in 2008 and $107.5 million of lower cash dividends as a result of a smaller extra dividend in 2008.
Credit Lines and Other:
The Company has line of credit arrangements of $3.67 billion, of which $3.35 billion was unused at the end of December 2009. Included in these arrangements are $3.0 billion of syndicated bank facilities. Of the $3.0 billion bank facilities, $2.0 billion matures in June 2010 and $1.0 billion matures in June 2012. The Company intends to replace these credit facilities as they expire with facilities of similar amounts and duration. These credit facilities are maintained primarily to provide backup liquidity for commercial paper borrowings and maturing medium-term notes. There were no borrowings under the syndicated bank lines for the year ended December 31, 2009.
PACCAR Inc periodically files shelf registrations under the Securities Act of 1933. The total amount of medium-term notes outstanding for PACCAR Inc as of December 31, 2009, is $870.0 million. The current registration expires in 2011 and does not limit the principal amount of debt securities that may be issued during the period.
The Company believes its strong liquidity position and AA- investment grade credit rating will continue to provide financial stability and access to capital markets at competitive interest rates.
In October 2007, PACCAR’s Board of Directors approved the repurchase of $300 million of the Company’s common stock. Through December 31, 2009, $292 million of shares have been repurchased. In July 2008, PACCAR’s Board of Directors approved the repurchase of an additional $300 million of the Company’s common stock. No shares have been repurchased pursuant to the July 2008 authorization.
Truck and Other
The Company provides funding for working capital, capital expenditures, research and development, dividends, stock repurchases and other business initiatives and commitments primarily from cash provided by operations. Management expects this method of funding to continue in the future. Long-term debt totaled $172.3 million as of December 31, 2009.
Expenditures for property, plant and equipment in 2009 totaled $127.7 million compared to $462.8 million in 2008 as the Company reduced its spending to reflect the current economic environment. Over the last ten years, the Company’s combined investments in worldwide capital projects and research and development totaled $3.77 billion which have significantly increased capacity, efficiency and quality of the Company’s premier products.
Capital spending in 2010 is expected to be approximately $175 to $200 million. Spending on research and development in 2010 is expected to be $225 to $250 million. PACCAR’s will continue to focus on manufacturing efficiency improvements, engine development and new product programs.
Financial Services
The Company funds its financial services activities primarily from collections on existing finance receivables and borrowings in the capital markets. An additional source of funds is loans from other PACCAR companies.
The primary sources of borrowings in the capital markets are commercial paper and medium-term notes issued in the public markets and, to a lesser extent, bank loans. The majority of the medium-term notes are issued by PACCAR’s largest financial services subsidiary, PACCAR Financial Corp. (PFC).
34
In November 2009, PFC filed a shelf registration under the Securities Act of 1933. In December 2009, PFC issued $250.0 million of fixed rate medium-term notes under this registration. The registration expires in 2012 and does not limit the principal amount of debt securities that may be issued during the period. The total amount of medium-term notes outstanding for PFC as of December 31, 2009, was $1,148.5 million.
In the third quarter of 2009, PACCAR’s European finance subsidiary, PACCAR Financial Europe, renewed the registration of a €1.5 billion medium-term note program with the London Stock Exchange. On December 31, 2009, €850 million remained available for issuance. This program is renewable annually through the filing of a new prospectus.
In June 2008, PACCAR Mexico registered a 7.0 billion peso medium-term note program with the Comision Nacional Bancaria y de Valores. The registration expires in 2012 and at December 31, 2009, 6.1 billion pesos remained available for issuance.
PACCAR believes its Financial Services companies will be able to continue funding receivables, servicing debt and paying dividends through internally generated funds, access to public and private debt markets and lines of credit.
Commitments
The following summarizes the Company’s contractual cash commitments at December 31, 2009:
| Maturity | |||||||||||||||
| Within 1 Year | 1-3 Years | 3-5 Years | More than 5 Years |
Total | |||||||||||
| Borrowings* |
$ | 3,580.5 | $ | 1,950.1 | $ | 522.6 | $ | 6,053.2 | |||||||
| Interest on term debt** |
123.8 | 127.8 | 39.3 | 290.9 | |||||||||||
| Operating leases |
27.0 | 27.2 | 8.8 | $ | .5 | 63.5 | |||||||||
| Purchase obligations |
147.2 | 237.3 | 2.0 | 386.5 | |||||||||||
| Other obligations |
11.1 | 6.4 | 2.2 | 17.4 | 37.1 | ||||||||||
| $ | 3,889.6 | $ | 2,348.8 | $ | 574.9 | $ | 17.9 | $ | 6,831.2 | ||||||
| * | Borrowings also include commercial paper and other short-term debt. |
| ** | Includes interest on fixed- and floating-rate term debt. Interest on floating-rate debt is based on the applicable market rates at December 31, 2009. |
The Company had $6.83 billion of cash commitments. Of the total cash commitments for borrowings and interest on term debt, $6.14 billion were related to the Financial Services segment. As described in Note J of the consolidated financial statements, borrowings consist primarily of term notes and commercial paper issued by the Financial Services segment. The Company expects to fund its maturing Financial Services debt obligations principally from funds provided by collections from customers on loans and lease contracts, as well as from the proceeds of commercial paper and medium-term note borrowings. Purchase obligations are the Company’s contractual commitment to acquire future production inventory and capital equipment. Other obligations include deferred cash compensation.
35
The Company’s other commitments include the following at December 31, 2009:
| Commitment Expiration | |||||||||||||||
| Within 1 Year | 1-3 Years | 3-5 Years | More than 5 Years |
Total | |||||||||||
| Letters of credit |
$ | 18.4 | $ | 2.0 | $ | .1 | $ | 20.5 | |||||||
| Loan and lease commitments |
105.3 | 105.3 | |||||||||||||
| Equipment acquisition commitments |
53.4 | 53.4 | |||||||||||||
| Residual value guarantees |
106.3 | 118.8 | 72.9 | $ | 10.0 | 308.0 | |||||||||
| $ | 230.0 | $ | 174.2 | $ | 73.0 | $ | 10.0 | $ | 487.2 | ||||||
Loan and lease commitments are for funding new retail loan and lease contracts. Equipment acquisition commitments require the Company, under specified circumstances, to purchase equipment. Residual value guarantees represent the Company’s commitment to acquire trucks at a guaranteed value if the customer decides to return the truck at a specified date in the future.
IMPACT OF ENVIRONMENTAL MATTERS:
The Company, its competitors and industry in general are subject to various domestic and foreign requirements relating to the environment. The Company believes its policies, practices and procedures are designed to prevent unreasonable risk of environmental damage and that its handling, use and disposal of hazardous or toxic substances have been in accordance with environmental laws and regulations enacted at the time such use and disposal occurred.
The Company is involved in various stages of investigations and cleanup actions in different countries related to environmental matters. In certain of these matters, the Company has been designated as a “potentially responsible party” by domestic and foreign environmental agencies. The Company has provided an accrual for the estimated costs to investigate and complete cleanup actions where it is probable that the Company will incur such costs in the future. Expenditures related to environmental activities in 2009, 2008 and 2007 were $1.3 million, $3.8 million and $1.9 million, respectively. Management expects that these matters will not have a significant effect on the Company’s consolidated cash flow, liquidity or financial condition.
CRITICAL ACCOUNTING POLICIES:
In the preparation of the Company’s financial statements, in accordance with U.S. generally accepted accounting principles, management uses estimates and makes judgments and assumptions that affect asset and liability values and the amounts reported as income and expense during the periods presented. The following are accounting policies which, in the opinion of management, are particularly sensitive and which, if actual results are different from estimates used by management, may have a material impact on the financial statements.
Operating Leases
The accounting for trucks sold pursuant to agreements accounted for as operating leases is discussed in Notes A and F of the consolidated financial statements. In determining its estimate of the residual value of such vehicles, the Company considers the length of the lease term, the truck model, the expected usage of the truck and anticipated market demand. Operating lease terms generally range from three to seven years. The resulting residual values on operating leases generally range between 30% and 50% of original equipment cost. If the sales price of the trucks at the end of the term of the agreement differs from the Company’s estimate, a gain or loss will result.
Future market conditions, changes in government regulations and other factors outside the Company’s control could impact the ultimate sales price of trucks returned under these contracts. Residual values are reviewed regularly and adjusted if market conditions warrant. A decrease in the estimated equipment residual values would increase annual depreciation expense over the remaining lease term.
36
During 2007 and 2008 market values on vehicles returning upon operating lease maturity were generally higher than the residual values on these vehicles resulting in a decrease of depreciation expense of $15.5 million and $6.9 million, respectively. During 2009, lower market values on trucks returning upon lease maturity, as well as impairments on existing operating leases resulted in additional depreciation expense $45.6 million.
At December 31, 2009, the aggregate residual value of equipment on operating leases in the Financial Services segment and residual value guarantee on trucks accounted for as operating leases in the Truck segment was $1.14 billion. A 10% decrease in used truck values worldwide, expected to persist over the remaining maturities of the Company’s operating leases, would reduce residual values estimates and result in the Company recording approximately $30 million of additional depreciation per year.
Allowance for Credit Losses
The accounting for allowance for credit losses related to the Company’s loans and finance leases is discussed in Note E of the consolidated financial statements. The Company determines the allowance for credit losses on financial services retail and wholesale receivables based on historical loss information, using past due account data, current market conditions and expectations about the future. The allowance for credit losses consists of both a specific reserve and a general reserve based on estimates, including assumptions regarding the likelihood of collecting current and past-due accounts, repossession rates and the recovery rate on the underlying collateral based on used truck values and other pledged collateral or recourse. The Company specifically evaluates large retail and wholesale accounts with past-due balances or that otherwise are deemed to be at a higher risk of credit loss. All other past-due customers, dealers and current accounts are evaluated as a group.
The Company has developed a range of specific loss estimates for each of its portfolios by country based on historical experience, taking into account loss frequency and severity in both strong and weak truck market conditions. A projection is made of the range of estimated credit losses inherent in the portfolio from which an amount is determined as probable based on current market conditions and other factors impacting the creditworthiness of the Company’s borrowers and their ability to repay. The projected amount is then compared to the allowance for credit loss balance and an appropriate adjustment is made.
The adequacy of the allowance is evaluated quarterly based on the most recent information and expectations about the future. As accounts become past due, the likelihood increases they will not be fully collected. The Company’s experience indicates the probability of not fully collecting past-due accounts range between 20% and 80%. Over the past three years, the Company’s year-end 30+ days past-due accounts have ranged between 2.0% and 3.8% of average loan and lease receivables. Historically, a 100 basis point increase in the 30+ days past-due percentage has resulted in an increase in future credit losses of 10 to 35 basis points of average receivables. Past-dues were 3.8% at December 31, 2009. If past-dues were 100 basis points higher or 4.8% as of December 31, 2009, the Company’s estimate of future credit losses would likely have increased by approximately $5 to $20 million depending on the extent of the past-dues, the estimated value of the collateral as compared to amounts owed and general economic factors.
Product Warranty
The accounting for product warranty is discussed in Note I of the consolidated financial statements. The expenses related to product warranty are estimated and recorded at the time products are sold based on historical and current data and reasonable expectations for the future regarding the frequency and cost of warranty claims, net of recoveries. Management takes actions to minimize warranty costs through quality-improvement programs; however, actual claim costs incurred could materially differ from the estimated amounts and require adjustments to the reserve. Historically those adjustments have not been material. Over the past three years, the Company’s year-end warranty expense as a percentage of net sales and revenues has ranged between 1.2% and 1.3%. For 2009, warranty expense was 1.2% of net sales and revenues. If warranty expense were .2% higher as a percentage of truck net sales and revenues in 2009, warranty expense would have increased by approximately $17 million.
37
Pension Benefits
The Company’s accounting for employee pension benefit costs and obligations is based on management assumptions about the future used by actuaries to estimate net costs and liabilities. These assumptions include discount rates, long-term rates of return on plan assets, inflation rates, retirement rates, mortality rates and other factors. Management bases these assumptions on historical results, the current environment and reasonable estimates of future events.
The discount rate for pension benefits is based on market interest rates of high-quality corporate bonds with a maturity profile that matches the timing of the projected benefit payments of the plans. Changes in the discount rate affect the valuation of the plan benefits obligation and funded status of the plans. The long-term rate of return on plan assets is based on projected returns for each asset class and relative weighting of those asset classes in the plans.
Because differences between actual results and the assumptions for returns on plan assets, retirement rates and mortality rates are accumulated and amortized into expense over future periods, management does not believe these differences or a typical percentage change in these assumptions worldwide would have a material effect on its financial results in the next year. The most significant assumption which could negatively affect pension expense is a decrease in the discount rate. If the discount rate was to decrease .5%, 2009 net pension expense would increase to $36.8 million from $25.3 million, and the projected benefit obligation would increase $97.1 million to $1,421.9 million from $1,324.8 million.
Income Taxes
The accounting for income taxes is discussed in Note N of the consolidated financial statements. The Company calculates income tax expense on pretax income based on current tax law. Deferred tax assets and liabilities are recorded for future tax consequences on temporary differences between recorded amounts in the financial statements and their respective tax basis. The determination of income tax expense requires management estimates and involves judgment regarding indefinitely reinvested foreign earnings, jurisdictional mix of earnings and future outcomes regarding tax law issues included in tax returns. The Company updates its assumptions based on all of these factors each quarter as well as new information on tax laws and differences between estimated tax returns and actual returns when filed. If the Company’s assessment of these matters changes, the effect is accounted for in earnings in the period the change is made.
FORWARD-LOOKING STATEMENTS:
Certain information presented in this report contains forward-looking statements made pursuant to the Private Securities Litigation Reform Act of 1995, which are subject to risks and uncertainties that may affect actual results. Risks and uncertainties include, but are not limited to: a significant decline in industry sales; competitive pressures; reduced market share; reduced availability of or higher prices for fuel; increased safety, emissions, or other regulations resulting in higher costs and/or sales restrictions; currency or commodity price fluctuations; lower used truck prices; insufficient or under-utilization of manufacturing capacity; supplier interruptions; insufficient liquidity in the capital markets; fluctuations in interest rates; changes in the levels of the Financial Services segment new business volume due to unit fluctuations in new PACCAR truck sales; changes affecting the profitability of truck owners and operators; price changes impacting equipment costs and residual values; insufficient supplier capacity or access to raw materials; labor disruptions; shortages of commercial truck drivers; increased warranty costs or litigation; or legislative and governmental regulations. A more detailed description of these and other risks is included under the heading Part 1, Item 1A, “Risk Factors” in the Company’s Annual Report on Form 10-K for the year ended December 31, 2009.
38
CONSOLIDATED STATEMENTS OF INCOME
| Year Ended December 31 |
2009 | 2008 | 2007 | |||||||||
| (millions except per share data) | ||||||||||||
| TRUCK AND OTHER: |
||||||||||||
| Net sales and revenues |
$ | 7,076.7 | $ | 13,709.6 | $ | 14,030.4 | ||||||
| Cost of sales and revenues |
6,483.4 | 11,736.9 | 11,917.3 | |||||||||
| Research and development |
199.2 | 341.8 | 255.5 | |||||||||
| Selling, general and administrative |
348.4 | 470.2 | 491.4 | |||||||||
| Curtailment gain |
(66.0 | ) | ||||||||||
| Interest and other expense (income), net |
43.6 | (1.8 | ) | (18.6 | ) | |||||||
| 7,008.6 | 12,547.1 | 12,645.6 | ||||||||||
| Truck and Other Income Before Income Taxes |
68.1 | 1,162.5 | 1,384.8 | |||||||||
| FINANCIAL SERVICES: |
||||||||||||
| Interest and fees |
501.8 | 683.4 | 672.8 | |||||||||
| Operating lease, rental and other income |
508.0 | 579.5 | 518.5 | |||||||||
| Revenues |
1,009.8 | 1,262.9 | 1,191.3 | |||||||||
| Interest and other borrowing expenses |
291.8 | 394.1 | 391.2 | |||||||||
| Depreciation and other |
442.5 | 437.8 | 364.1 | |||||||||
| Selling, general and administrative |
86.5 | 111.2 | 110.9 | |||||||||
| Provision for losses on receivables |
104.4 | 102.9 | 41.0 | |||||||||
| 925.2 | 1,046.0 | 907.2 | ||||||||||
| Financial Services Income Before Income Taxes |
84.6 | 216.9 | 284.1 | |||||||||
| Investment income |
22.3 | 84.6 | 95.4 | |||||||||
| Total Income Before Income Taxes |
175.0 | 1,464.0 | 1,764.3 | |||||||||
| Income taxes |
63.1 | 446.1 | 537.0 | |||||||||
| Net Income |
$ | 111.9 | $ | 1,017.9 | $ | 1,227.3 | ||||||
| Net Income Per Share |
||||||||||||
| Basic |
$ | .31 | $ | 2.79 | $ | 3.31 | ||||||
| Diluted |
$ | .31 | $ | 2.78 | $ | 3.29 | ||||||
| Weighted average number of common shares outstanding |
||||||||||||
| Basic |
363.8 | 364.2 | 371.1 | |||||||||
| Diluted |
364.9 | 365.9 | 373.3 | |||||||||
See notes to consolidated financial statements
39
CONSOLIDATED BALANCE SHEETS
ASSETS
| December 31 |
2009 | 2008 | ||||
| (millions of dollars) | ||||||
| TRUCK AND OTHER: |
||||||
| Current Assets |
||||||
| Cash and cash equivalents |
$ | 1,836.5 | $ | 1,899.2 | ||
| Trade and other receivables, net |
554.7 | 698.7 | ||||
| Marketable debt securities |
219.5 | 175.4 | ||||
| Inventories |
632.1 | 658.1 | ||||
| Other current assets |
224.3 | 211.7 | ||||
| Total Truck and Other Current Assets |
3,467.1 | 3,643.1 | ||||
| Equipment on operating leases, net |
503.8 | 425.3 | ||||
| Property, plant and equipment, net |
1,757.7 | 1,782.8 | ||||
| Other noncurrent assets |
409.1 | 368.2 | ||||
| Total Truck and Other Assets |
6,137.7 | 6,219.4 | ||||
| FINANCIAL SERVICES: |
||||||
| Cash and cash equivalents |
75.5 | 56.0 | ||||
| Finance and other receivables, net |
6,497.7 | 8,036.4 | ||||
| Equipment on operating leases, net |
1,513.2 | 1,534.8 | ||||
| Other assets |
344.9 | 403.2 | ||||
| Total Financial Services Assets |
8,431.3 | 10,030.4 | ||||
| $ | 14,569.0 | $ | 16,249.8 | |||
40
LIABILITIES AND STOCKHOLDERS’ EQUITY
| December 31 |
2009 | 2008 | ||||||
| (millions of dollars) | ||||||||
| TRUCK AND OTHER: |
||||||||
| Current Liabilities |
||||||||
| Accounts payable, accrued expenses and other |
$ | 1,490.0 | $ | 1,792.3 | ||||
| Dividend payable |
36.3 | |||||||
| Total Truck and Other Current Liabilities |
1,490.0 | 1,828.6 | ||||||
| Long-term debt |
172.3 | 19.3 | ||||||
| Residual value guarantees and deferred revenues |
547.2 | 470.8 | ||||||
| Other liabilities |
405.3 | 636.6 | ||||||
| Total Truck and Other Liabilities |
2,614.8 | 2,955.3 | ||||||
| FINANCIAL SERVICES: |
||||||||
| Accounts payable, accrued expenses and other |
215.2 | 249.2 | ||||||
| Commercial paper and bank loans |
3,011.2 | 3,576.2 | ||||||
| Term notes |
2,889.3 | 3,889.3 | ||||||
| Deferred taxes and other liabilities |
734.8 | 733.1 | ||||||
| Total Financial Services Liabilities |
6,850.5 | 8,447.8 | ||||||
| STOCKHOLDERS’ EQUITY |
||||||||
| Preferred stock, no par value - authorized 1.0 million shares, none issued Common stock, $1 par value - authorized 1.2 billion shares; issued 364.4 million and 363.1 million shares |
364.4 | 363.1 | ||||||
| Additional paid-in capital |
80.0 | 46.1 | ||||||
| Treasury stock - at cost |
(17.4 | ) | (17.4 | ) | ||||
| Retained earnings |
4,640.5 | 4,724.7 | ||||||
| Accumulated other comprehensive income (loss) |
36.2 | (269.8 | ) | |||||
| Total Stockholders’ Equity |
5,103.7 | 4,846.7 | ||||||
| $ | 14,569.0 | $ | 16,249.8 | |||||
41
CONSOLIDATED STATEMENTS OF CASH FLOWS
| Year Ended December 31 |
2009 | 2008 | 2007 | |||||||||
| (millions of dollars) | ||||||||||||
| OPERATING ACTIVITIES: |
||||||||||||
| Net Income |
$ | 111.9 | $ | 1,017.9 | $ | 1,227.3 | ||||||
| Items included in net income not affecting cash: |
||||||||||||
| Depreciation and amortization: |
||||||||||||
| Property, plant and equipment |
188.0 | 226.5 | 196.4 | |||||||||
| Equipment on operating leases and other |
450.1 | 422.9 | 330.0 | |||||||||
| Provision for losses on financial services receivables |
104.4 | 102.9 | 41.0 | |||||||||
| Curtailment gain |
(66.0 | ) | ||||||||||
| Gain on sale of property |
.9 | (21.7 | ) | |||||||||
| Deferred taxes |
159.7 | 131.0 | 38.3 | |||||||||
| Other, net |
37.2 | (1.1 | ) | 5.3 | ||||||||
| Change in operating assets and liabilities: |
||||||||||||
| Decrease (increase) in assets other than cash and equivalents: |
||||||||||||
| Receivables: |
||||||||||||
| Trade and other |
163.2 | (55.5 | ) | 143.6 | ||||||||
| Wholesale receivables on new trucks |
641.8 | (246.3 | ) | 81.3 | ||||||||
| Sales-type finance leases and dealer direct loans on new trucks |
81.6 | 52.8 | 40.3 | |||||||||
| Inventories |
53.4 | (85.2 | ) | 114.4 | ||||||||
| Other, net |
8.1 | 8.8 | 16.8 | |||||||||
| (Decrease) increase in liabilities: |
||||||||||||
| Accounts payable and accrued expenses |
(271.8 | ) | (239.3 | ) | (277.6 | ) | ||||||
| Residual value guarantees and deferred revenues |
48.2 | 118.1 | 85.1 | |||||||||
| Pension and post retirement contributions |
(176.6 | ) | (68.0 | ) | (16.8 | ) | ||||||
| Other, net |
(160.8 | ) | (80.6 | ) | 51.7 | |||||||
| Net Cash Provided by Operating Activities |
1,373.3 | 1,304.9 | 2,055.4 | |||||||||
| INVESTING ACTIVITIES: |
||||||||||||
| Retail loans and direct financing leases originated |
(1,282.2 | ) | (2,307.5 | ) | (3,116.6 | ) | ||||||
| Collections on retail loans and direct financing leases |
2,285.5 | 2,771.0 | 2,837.3 | |||||||||
| Net decrease in wholesale receivables on used equipment |
3.5 | 10.4 | 13.7 | |||||||||
| Marketable securities purchases |
(288.3 | ) | (667.3 | ) | (1,282.9 | ) | ||||||
| Marketable securities sales and maturities |
245.5 | 1,239.4 | 1,345.5 | |||||||||
| Acquisition of property, plant and equipment |
(127.7 | ) | (462.8 | ) | (425.7 | ) | ||||||
| Acquisition of equipment for operating leases |
(843.3 | ) | (1,087.2 | ) | (841.7 | ) | ||||||
| Proceeds from asset disposals |
317.6 | 239.3 | 240.1 | |||||||||
| Other, net |
12.8 | (66.5 | ) | |||||||||
| Net Cash Provided by (Used in) Investing Activities |
310.6 | (251.9 | ) | (1,296.8 | ) | |||||||
| FINANCING ACTIVITIES: |
||||||||||||
| Cash dividends paid |
(232.1 | ) | (629.2 | ) | (736.7 | ) | ||||||
| Purchase of treasury stock |
(230.6 | ) | (360.5 | ) | ||||||||
| Stock compensation transactions |
17.6 | 11.5 | 30.8 | |||||||||
| Net decrease in commercial paper and short-term bank loans |
(789.8 | ) | (482.0 | ) | (366.1 | ) | ||||||
| Proceeds from long-term debt |
1,373.0 | 1,190.9 | 879.5 | |||||||||
| Payments on long-term debt |
(2,184.9 | ) | (728.7 | ) | (285.5 | ) | ||||||
| Net Cash Used in Financing Activities |
(1,816.2 | ) | (868.1 | ) | (838.5 | ) | ||||||
| Effect of exchange rate changes on cash |
89.1 | (87.8 | ) | 85.5 | ||||||||
| Net (Decrease) Increase in Cash and Cash Equivalents |
(43.2 | ) | 97.1 | 5.6 | ||||||||
| Cash and Cash Equivalents at beginning of year |
1,955.2 | 1,858.1 | 1,852.5 | |||||||||
| Cash and Cash Equivalents at end of year |
$ | 1,912.0 | $ | 1,955.2 | $ | 1,858.1 | ||||||
See notes to consolidated financial statements
42
CONSOLIDATED STATEMENTS OF STOCKHOLDERS’ EQUITY
| December 31 |
2009 | 2008 | 2007 | |||||||||
| (millions except per share data) | ||||||||||||
| COMMON STOCK, $1 PAR VALUE: |
||||||||||||
| Balance at beginning of year |
$ | 363.1 | $ | 368.4 | $ | 248.5 | ||||||
| Treasury stock retirement |
(5.9 | ) | (3.8 | ) | ||||||||
| 50% stock dividend |
122.8 | |||||||||||
| Stock compensation |
1.3 | .6 | .9 | |||||||||
| Balance at end of year |
364.4 | 363.1 | 368.4 | |||||||||
| ADDITIONAL PAID-IN CAPITAL: |
||||||||||||
| Balance at beginning of year |
46.1 | 37.7 | 27.5 | |||||||||
| Treasury stock retirement |
(14.0 | ) | (33.8 | ) | ||||||||
| Stock compensation and tax benefit |
33.9 | 22.4 | 44.0 | |||||||||
| Balance at end of year |
80.0 | 46.1 | 37.7 | |||||||||
| TREASURY STOCK, AT COST: |
||||||||||||
| Balance at beginning of year |
(17.4 | ) | (61.7 | ) | (2.1 | ) | ||||||
| Purchases: (shares) 2008-5.1; 2007-5.1 |
(230.6 | ) | (359.6 | ) | ||||||||
| Retirements |
274.9 | 300.0 | ||||||||||
| Balance at end of year |
(17.4 | ) | (17.4 | ) | (61.7 | ) | ||||||
| RETAINED EARNINGS: |
||||||||||||
| Balance at beginning of year |
4,724.7 | 4,260.6 | 4,026.1 | |||||||||
| Net income |
111.9 | 1,017.9 | 1,227.3 | |||||||||
| Cash dividends declared on common stock, per share: 2009-$.54; 2008-$.82; 2007-$1.65 |
(196.1 | ) | (298.8 | ) | (607.6 | ) | ||||||
| Treasury stock retirement |
(255.0 | ) | (262.4 | ) | ||||||||
| 50% stock dividend |
(122.8 | ) | ||||||||||
| Balance at end of year |
4,640.5 | 4,724.7 | 4,260.6 | |||||||||
| ACCUMULATED OTHER COMPREHENSIVE INCOME (LOSS): |
||||||||||||
| Balance at beginning of year |
(269.8 | ) | 408.1 | 156.2 | ||||||||
| Other comprehensive income (loss) |
306.0 | (677.9 | ) | 251.9 | ||||||||
| Balance at end of year |
36.2 | (269.8 | ) | 408.1 | ||||||||
| Total Stockholders’ Equity |
$ | 5,103.7 | $ | 4,846.7 | $ | 5,013.1 | ||||||
See notes to consolidated financial statements
43
CONSOLIDATED STATEMENTS OF COMPREHENSIVE INCOME
| Year Ended December 31 |
2009 | 2008 | 2007 | |||||||||
| (millions of dollars) | ||||||||||||
| Net income |
$ | 111.9 | $ | 1,017.9 | $ | 1,227.3 | ||||||
| Other comprehensive income (loss): |
||||||||||||
| Unrealized (losses) gains on derivative contracts |
||||||||||||
| Losses arising during the period |
(71.6 | ) | (85.5 | ) | (32.5 | ) | ||||||
| Tax effect |
21.3 | 24.7 | 15.9 | |||||||||
| Reclassification adjustment |
119.9 | (17.4 | ) | (14.8 | ) | |||||||
| Tax effect |
(35.7 | ) | 4.1 | 5.6 | ||||||||
| 33.9 | (74.1 | ) | (25.8 | ) | ||||||||
| Unrealized (losses) gains on investments |
||||||||||||
| Net holding (loss) gain |
(.3 | ) | 2.9 | 5.2 | ||||||||
| Tax effect |
.1 | (.9 | ) | (2.1 | ) | |||||||
| Reclassification adjustment |
.7 | (5.1 | ) | .2 | ||||||||
| Tax effect |
(.2 | ) | 1.8 | (.1 | ) | |||||||
| .3 | (1.3 | ) | 3.2 | |||||||||
| Pension and postretirement |
||||||||||||
| Gains (losses) arising during the period |
73.0 | (395.1 | ) | 87.0 | ||||||||
| Tax effect |
(32.1 | ) | 144.7 | (32.2 | ) | |||||||
| Reclassification adjustment |
11.2 | 6.0 | 12.7 | |||||||||
| Tax effect |
(3.9 | ) | (2.1 | ) | (4.6 | ) | ||||||
| 48.2 | (246.5 | ) | 62.9 | |||||||||
| Foreign currency translation gains (losses) |
223.6 | (356.0 | ) | 211.6 | ||||||||
| Net other comprehensive income (loss) |
306.0 | (677.9 | ) | 251.9 | ||||||||
| Comprehensive Income |
$ | 417.9 | $ | 340.0 | $ | 1,479.2 | ||||||
See notes to consolidated financial statements
NOTES TO CONSOLIDATED FINANCIAL STATEMENTS
December 31, 2009, 2008 and 2007 (currencies in millions)
A. SIGNIFICANT ACCOUNTING POLICIES
Description of Operations: PACCAR Inc (the Company or PACCAR) is a multinational company operating in two segments: (1) the design, manufacture and distribution of light-, medium- and heavy-duty commercial trucks and related aftermarket parts and (2) finance and leasing products and services provided to customers and dealers. PACCAR’s sales and revenues are derived primarily from North America and Europe. The Company also operates in Australia and sells trucks and parts outside its primary markets to customers in Asia, Africa and South America.
Principles of Consolidation: The consolidated financial statements include the accounts of the Company and its wholly owned domestic and foreign subsidiaries. All significant intercompany accounts and transactions are eliminated in consolidation.
Use of Estimates: The preparation of financial statements in conformity with accounting principles generally accepted in the United States requires management to make estimates and assumptions that affect the amounts reported in the financial statements and accompanying notes. Actual results could differ from those estimates.
Cash and Cash Equivalents: Cash equivalents consist of liquid investments with a maturity at date of purchase of three months or less.
Trade and Other Receivables: The Company’s trade and other receivables are recorded at cost on the balance sheet net of allowances.
44
NOTES TO CONSOLIDATED FINANCIAL STATEMENTS
December 31, 2009, 2008 and 2007 (currencies in millions)
Long-lived Assets, Goodwill and Other Intangible Assets: The Company evaluates the carrying value of long-lived assets (including property and equipment, goodwill and other intangible assets) when events and circumstances warrant such a review. Goodwill is tested for impairment on an annual basis. Impairment charges were insignificant during the three years ended December 31, 2009.
Revenue Recognition: Substantially all sales and revenues of trucks and related aftermarket parts are recorded by the Company when products are shipped to dealers or customers, except for certain truck shipments that are subject to a residual value guarantee to the customer. Revenues related to these shipments are recognized on a straight-line basis over the guarantee period (see Note F). At the time certain truck and parts sales to a dealer are recognized, the Company records an estimate of the future sales incentive costs related to such sales. The estimate is based on historical data and announced incentive programs.
Interest income from finance and other receivables is recognized using the interest method. Certain loan origination costs are deferred and amortized to interest income over the expected life of the contracts, generally three to six years, using the straight-line method which approximates the interest method. For operating leases, rental revenue is recognized on a straight-line basis over the lease term. Recognition of interest income and rental revenue is suspended when management determines that collection is not probable (generally after 90 days past the contractual due date). Recognition is resumed if the receivable becomes contractually current and the collection of amounts is again considered probable. Payments received while the loan is in non-accrual status are applied to interest and principal amounts in accordance with the contractual terms.
Foreign Currency Translation: For most of PACCAR’s foreign subsidiaries, the local currency is the functional currency. All assets and liabilities are translated at year-end exchange rates and all income statement amounts are translated at the weighted average rates for the period. Translation adjustments are recorded in accumulated other comprehensive income (loss), a component of stockholders’ equity. PACCAR uses the U.S. dollar as the functional currency for its Mexican subsidiaries. Accordingly, inventories, cost of sales, property, plant and equipment, and depreciation are remeasured at historical rates and resulting adjustments are included in net income.
Earnings per Share: Basic earnings per common share are computed by dividing earnings by the weighted average number of commons shares outstanding, plus the effect of any participating securities. Diluted earnings per common share are computed assuming that all potentially dilutive securities are converted into common shares under the treasury stock method. The dilutive and antidilutive options are shown separately in the table below.
| Year Ended December 31 |
2009 | 2008 | 2007 | |||
| Additional shares |
1,103,600 | 1,721,300 | 2,206,800 | |||
| Antidilutive options |
2,290,400 | 1,397,800 | ||||
New Accounting Pronouncements: The Company adopted Statement No. 161, Disclosures about Derivative Instruments and Hedging Activities (FAS 161) effective January 1, 2009. FAS 161 amends and expands the disclosure requirements for derivative instruments and hedging activities. Accordingly, the Company’s disclosure in Note P has been updated to comply with this standard.
The Company adopted Statement No. 165, Subsequent Events effective July 1, 2009, with no significant effect on the financial statements.
The Company adopted FASB Staff Position FAS 132(R)-1, Employers’ Disclosures about Postretirement Benefit Plan Assets effective for the year ended December 31, 2009. FSP FAS 132(R)-1 requires additional disclosures relating to investment of plan assets. Accordingly, the Company’s disclosure in Note M has been updated to comply with this standard.
Subsequent Events: The Company has evaluated subsequent events through the date the financial statements were issued on February 26, 2010.
45
NOTES TO CONSOLIDATED FINANCIAL STATEMENTS
December 31, 2009, 2008 and 2007 (currencies in millions)
B. INVESTMENTS IN MARKETABLE SECURITIES
The Company’s investments in marketable securities are classified as available-for-sale. These investments are stated at fair value with any unrealized gains or losses, net of tax, included as a component of accumulated other comprehensive income. The proceeds from sales and maturities of marketable securities during 2009 were $245.5. Gross realized gains and losses were $1.2, $5.1, and nil, and $.1, $.1 and $.1 for the years ended December 31, 2009, 2008 and 2007, respectively.
The cost of marketable debt securities is adjusted for amortization of premiums and accretion of discounts to maturity. Amortization, accretion, interest and dividend income and realized gains and losses are included in investment income. The cost of securities sold is based on the specific identification method.
Marketable debt securities consisted of the following at December 31:
| 2009 |
AMORTIZED COST |
UNREALIZED GAINS |
UNREALIZED LOSSES |
FAIR VALUE | ||||||||
| U.S. government and agency securities |
$ | 6.5 | $ | 6.5 | ||||||||
| U.S. tax-exempt securities |
141.2 | $ | 1.3 | 142.5 | ||||||||
| U.S. corporate securities |
22.0 | .2 | $ | .1 | 22.1 | |||||||
| Non U.S. corporate securities |
22.0 | 22.0 | ||||||||||
| Non U.S. government securities |
12.2 | 12.2 | ||||||||||
| Other debt securities |
14.2 | 14.2 | ||||||||||
| $ | 218.1 | $ | 1.5 | $ | .1 | $ | 219.5 | |||||
| 2008 |
AMORTIZED COST |
UNREALIZED GAINS |
UNREALIZED LOSSES |
FAIR VALUE | ||||||||
| U.S. tax-exempt securities |
$ | 167.2 | $ | 1.7 | $ | .4 | $ | 168.5 | ||||
| Non U.S. corporate securities |
4.3 | .3 | 4.0 | |||||||||
| Non U.S. government securities |
2.9 | 2.9 | ||||||||||
| $ | 174.4 | $ | 1.7 | $ | .7 | $ | 175.4 | |||||
The fair value of marketable debt securities that have been in a continuous unrealized loss position for 12 months or greater at December 31, 2009 and 2008 were $27.4 and $16.7, and their unrealized losses were $.1 and $.6, respectively.
Contractual maturities at December 31, 2009, were as follows:
| Maturities: |
AMORTIZED COST |
FAIR VALUE | ||||
| Within one year |
$ | 99.7 | $ | 100.3 | ||
| One to five years |
104.5 | 105.3 | ||||
| Ten or more years |
13.9 | 13.9 | ||||
| $ | 218.1 | $ | 219.5 | |||
Marketable debt securities included $11.6 and $65.9 of variable-rate demand obligations (VRDOs) at December 31, 2009 and 2008, respectively. VRDOs are debt instruments with long-term scheduled maturities which have interest rates that reset periodically.
46
NOTES TO CONSOLIDATED FINANCIAL STATEMENTS
December 31, 2009, 2008 and 2007 (currencies in millions)
C. INVENTORIES
Inventories include the following:
| At December 31, |
2009 | 2008 | ||||||
| Finished products |
$ | 312.5 | $ | 394.3 | ||||
| Work in process and raw materials |
487.5 | 421.7 | ||||||
| 800.0 | 816.0 | |||||||
| Less LIFO reserve |
(167.9 | ) | (157.9 | ) | ||||
| $ | 632.1 | $ | 658.1 | |||||
Inventories are stated at the lower of cost or market. Cost of inventories in the United States is determined principally by the last-in, first-out (LIFO) method. Cost of all other inventories is determined principally by the first-in, first-out (FIFO) method. Inventories valued using the LIFO method comprised 58% and 52% of consolidated inventories before deducting the LIFO reserve at December 31, 2009 and 2008.
D. FINANCE AND OTHER RECEIVABLES
Finance and other receivables include the following:
| At December 31, |
2009 | 2008 | ||||||
| Loans |
$ | 2,875.2 | $ | 3,506.7 | ||||
| Retail direct financing leases |
2,260.0 | 2,558.4 | ||||||
| Sales-type finance leases |
764.9 | 817.9 | ||||||
| Dealer wholesale financing |
1,015.2 | 1,635.0 | ||||||
| Interest and other receivables |
109.6 | 127.3 | ||||||
| Unearned interest: Finance leases |
(359.6 | ) | (430.6 | ) | ||||
| 6,665.3 | 8,214.7 | |||||||
| Less allowance for losses (see Note E): |
||||||||
| Loans, leases and other |
(157.1 | ) | (167.1 | ) | ||||
| Dealer wholesale |
(10.5 | ) | (11.2 | ) | ||||
| $ | 6,497.7 | $ | 8,036.4 | |||||
Loans represent fixed- or floating-rate loans to customers collateralized by the vehicles purchased. Retail direct financing and sales-type finance leases are contracts that lease equipment to retail customers and dealers, respectively. These leases are reported as the sum of minimum lease payments receivable and estimated residual value of the property subject to the contracts, reduced by unearned interest on finance leases which is shown separately. Dealer wholesale financing represents floating-rate wholesale loans to PACCAR dealers for new and used trucks. The loans are collateralized by the trucks being financed. Interest and other receivables are interest due on loans and leases and other amounts due in the normal course of business.
47
NOTES TO CONSOLIDATED FINANCIAL STATEMENTS
December 31, 2009, 2008 and 2007 (currencies in millions)
Annual minimum payments due on loans and leases are as follows:
| LOANS | FINANCE LEASES |
DEALER WHOLESALE | |||||||
| 2010 |
$ | 1,123.3 | $ | 984.7 | $ | 815.3 | |||
| 2011 |
817.1 | 792.0 | 199.9 | ||||||
| 2012 |
525.4 | 527.4 | |||||||
| 2013 |
283.3 | 309.8 | |||||||
| 2014 |
108.0 | 141.3 | |||||||
| Thereafter |
18.1 | 82.9 | |||||||
| $ | 2,875.2 | $ | 2,838.1 | $ | 1,015.2 | ||||
Included in Loans are dealer direct loans on the sale of new trucks of $143.7 and $171.6 as of December 31, 2009 and 2008. Estimated residual values included with finance leases amounted to $186.8 in 2009 and $190.6 in 2008. Repayment experience indicates that some loan and lease receivables will be paid prior to contract maturity, while others may be extended or revised. Experience also indicates that the majority of dealer wholesale financing will be repaid within one year. Items included in Interest and other receivables are all due within one year. The effects of sales-type leases, dealer direct loans and wholesale financing of new trucks are shown in the consolidated statements of cash flows as operating activities since they finance the sale of company inventory.
E. ALLOWANCES FOR LOSSES
Allowance for losses for loans, leases and other are evaluated together as a group since they relate to a similar customer base and their contractual terms require regular payment of principal and interest principally over 36 to 60 months and they are secured by the same type of collateral. The allowance for credit losses consists of both a specific reserve and a general reserve.
Receivables are charged to the allowance for losses when, in the judgment of management, they are considered uncollectible (generally upon repossession of the collateral). The provision for losses on finance, trade and other receivables is charged to income based on management’s estimate of incurred credit losses, net of recoveries, inherent in the portfolio.
The allowance for losses is summarized as follows:
| TRUCK AND OTHER |
FINANCIAL SERVICES |
|||||||
| Balance, December 31, 2006 |
$ | 5.7 | $ | 169.0 | ||||
| Provision for losses |
.2 | 41.0 | ||||||
| Net charge-offs |
(.5 | ) | (25.8 | ) | ||||
| Acquisitions |
.2 | 1.8 | ||||||
| Currency translation |
1.9 | 7.4 | ||||||
| Balance, December 31, 2007 |
7.5 | 193.4 | ||||||
| Provision for losses |
(.3 | ) | 102.9 | |||||
| Net charge-offs |
(2.0 | ) | (104.8 | ) | ||||
| Currency translation |
(.3 | ) | (13.2 | ) | ||||
| Balance, December 31, 2008 |
4.9 | 178.3 | ||||||
| Provision for losses |
1.1 | 104.4 | ||||||
| Net charge-offs |
(1.8 | ) | (121.8 | ) | ||||
| Currency translation |
.1 | 6.7 | ||||||
| Balance, December 31, 2009 |
$ | 4.3 | $ | 167.6 | ||||
The Company’s customers are principally concentrated in the transportation industry in North America and Europe. There are no significant concentrations of credit risk in terms of a single customer. Generally, receivables are collateralized by the related equipment and parts.
48
NOTES TO CONSOLIDATED FINANCIAL STATEMENTS
December 31, 2009, 2008 and 2007 (currencies in millions)
Impaired finance and other receivables include accounts that may or may not have a specific reserve and certain accounts that are placed on non-accrual status. The majority of the loans that have a specific reserve are also on non-accrual status.
The Company’s Financial Services segment information on impaired finance and other receivables is as follows:
| As of and for the Years Ended December 31, |
2009 | 2008 | ||||
| Finance receivables on non-accrual status |
$ | 88.4 | $ | 59.8 | ||
| Impaired receivables with specific reserve |
38.3 | 28.5 | ||||
| Impaired receivables with no specific reserve |
29.1 | 34.5 | ||||
| Specific loss reserves on impaired receivables |
7.3 | 4.8 | ||||
| Average balance of impaired receivables |
84.9 | 80.0 | ||||
| Interest recognized on impaired receivables |
4.3 | 2.6 | ||||
The Company repossesses vehicles which serve as collateral for loans and finance leases and records the vehicles as used truck inventory included in Financial Services Other Assets on the balance sheet. The Company repossessed collateral valued at $203.0 and recorded $106.5 of credit losses upon repossession in 2009. Repossessed assets are typically disposed of promptly after repossession with differences between the estimated market value and the ultimate sales price resulting in an adjustment to credit losses. The Company sold $213.1 of repossessed assets and recorded an additional loss of $10.6 in 2009. As of December 31, 2009 and 2008, a total of $28.5 and $41.9, respectively, of repossessed assets were held for sale.
F. EQUIPMENT ON OPERATING LEASES
The Company leases equipment under operating leases to customers in the financial services segment. In addition, in the truck segment, equipment sold to customers in Europe subject to a residual value guarantee (RVG) is accounted for as operating leases. Equipment is recorded at cost and is depreciated on the straight-line basis to the lower of the estimated residual value or guarantee value. Lease and guarantee periods generally range from three to seven years. Estimated useful lives of the equipment range from five to eight years. The Company reviews residual values of equipment on operating leases periodically to determine that recorded amounts are appropriate.
A summary of equipment on operating leases for the Truck and Other segment and for the Financial Services segment is as follows:
| TRUCK AND OTHER | FINANCIAL SERVICES | |||||||||||||||
| At December 31, |
2009 | 2008 | 2009 | 2008 | ||||||||||||
| Equipment on operating leases |
$ | 730.6 | $ | 610.6 | $ | 2,090.8 | $ | 2,053.4 | ||||||||
| Less allowance for depreciation |
(226.8 | ) | (185.3 | ) | (577.6 | ) | (518.6 | ) | ||||||||
| $ | 503.8 | $ | 425.3 | $ | 1,513.2 | $ | 1,534.8 | |||||||||
Annual minimum lease payments due on financial services operating leases beginning January 1, 2010, are $383.0, $254.6, $157.0, $79.7, $27.9 and $2.9 thereafter.
When the equipment is sold subject to an RVG, the full sales price is received from the customer. A liability is established for the residual value obligation with the remainder of the proceeds recorded as deferred lease revenue.
These amounts are summarized below:
| TRUCK AND OTHER | ||||||
| At December 31, |
2009 | 2008 | ||||
| Deferred lease revenues |
$ | 239.2 | $ | 204.8 | ||
| Residual value guarantees |
308.0 | 266.0 | ||||
| Total |
$ | 547.2 | $ | 470.8 | ||
49
NOTES TO CONSOLIDATED FINANCIAL STATEMENTS
December 31, 2009, 2008 and 2007 (currencies in millions)
The deferred lease revenue is amortized on a straight-line basis over the RVG contract period. At December 31, 2009, the annual amortization of deferred revenues beginning January 1, 2010 is $82.5, $53.4, $39.0, $40.8, $15.6 and $7.9 thereafter. Annual maturities of the residual value guarantees beginning January 1, 2010, are $106.3, $68.7, $50.1, $52.7, $20.2 and $10.0 thereafter.
G. PROPERTY, PLANT AND EQUIPMENT
Property, plant and equipment are stated at cost. Depreciation is computed principally by the straight-line method based on the estimated useful lives of the various classes of assets. Certain production tooling is amortized on a unit of production basis. Property, plant and equipment include the following:
| At December 31, |
USEFUL LIVES | 2009 | 2008 | |||||||
| Land |
$ | 206.3 | $ | 186.8 | ||||||
| Buildings and improvements |
10-40 years | 1,007.6 | 951.1 | |||||||
| Machinery, equipment and production tooling |
3-12 years | 2,489.0 | 2,355.2 | |||||||
| 3,702.9 | 3,493.1 | |||||||||
| Less allowance for depreciation |
(1,945.2 | ) | (1,710.3 | ) | ||||||
| $ | 1,757.7 | $ | 1,782.8 | |||||||
H. ACCOUNTS PAYABLE, ACCRUED EXPENSES AND OTHER
Accounts payable, accrued expenses and other include the following:
| At December 31, |
2009 | 2008 | ||||
| Truck and Other: |
||||||
| Accounts payable |
$ | 622.5 | $ | 617.9 | ||
| Accrued expenses |
226.0 | 388.4 | ||||
| Salaries and wages |
132.9 | 168.7 | ||||
| Product support reserves |
230.8 | 298.6 | ||||
| Other |
277.8 | 318.7 | ||||
| $ | 1,490.0 | $ | 1,792.3 | |||
50
NOTES TO CONSOLIDATED FINANCIAL STATEMENTS
December 31, 2009, 2008 and 2007 (currencies in millions)
I. PRODUCT SUPPORT LIABILITIES
Product support liabilities include reserves related to product warranties and optional extended warranties and repair and maintenance (R&M) contracts. The Company generally offers one-year warranties covering most of its vehicles and related aftermarket parts. Specific terms and conditions vary depending on the product and the country of sale. Optional extended warranty and R&M contracts can be purchased for periods which generally range up to five years. Warranty expenses and reserves are estimated and recorded at the time products or contracts are sold based on historical data regarding the source, frequency and cost of claims, net of any recoveries. PACCAR periodically assesses the adequacy of its recorded liabilities and adjusts them as appropriate to reflect actual experience.
Changes in warranty and R&M reserves are summarized as follows:
| At December 31, |
2009 | 2008 | 2007 | |||||||||
| Beginning balance |
$ | 450.4 | $ | 483.3 | $ | 458.3 | ||||||
| Cost accruals and revenue deferrals |
169.0 | 312.3 | 339.2 | |||||||||
| Payments and revenue recognized |
(245.6 | ) | (304.6 | ) | (345.1 | ) | ||||||
| Currency translation |
12.6 | (40.6 | ) | 30.9 | ||||||||
| $ | 386.4 | $ | 450.4 | $ | 483.3 | |||||||
Warranty and R&M reserves are included in the accompanying consolidated balance sheets as follows:
| At December 31, |
2009 | 2008 | ||||
| Truck and Other: |
||||||
| Accounts payable, accrued expenses and other |
$ | 230.8 | $ | 298.6 | ||
| Other liabilities |
84.3 | 83.9 | ||||
| Financial Services: |
||||||
| Deferred taxes and other liabilities |
71.3 | 67.9 | ||||
| $ | 386.4 | $ | 450.4 | |||
J. BORROWINGS AND CREDIT ARRANGEMENTS
Truck and Other long-term debt at December 31, 2009, consisted of $150.0 of notes bearing interest at 6.9% which mature in 2014 and $22.3 of non-interest bearing notes which mature in 2011. In 2008, long-term debt consisted of non-interest bearing notes of $19.3.
Financial Services borrowings include the following:
| At December 31, |
EFFECTIVE RATE |
2009 | 2008 | ||||||
| Commercial paper |
2.8 | % | $ | 2,695.6 | $ | 3,332.6 | |||
| Bank loans: |
|||||||||
| Short-term |
50.4 | ||||||||
| Medium-term |
7.6 | % | 315.6 | 193.2 | |||||
| 3,011.2 | 3,576.2 | ||||||||
| Term notes |
4.8 | % | 2,889.3 | 3,889.3 | |||||
| $ | 5,900.5 | $ | 7,465.5 | ||||||
The term notes of $2,889.3 at December 31, 2009, include an increase in fair value of $19.6 for notes designated to fair value hedges. The effective rate is the weighted average rate as of December 31, 2009, and includes the effects of interest rate contracts.
51
NOTES TO CONSOLIDATED FINANCIAL STATEMENTS
December 31, 2009, 2008 and 2007 (currencies in millions)
The annual maturities of the financial services borrowings are as follows:
| Beginning January 1, 2010 |
COMMERCIAL PAPER |
BANK LOANS |
TERM NOTES |
TOTAL | ||||||||
| 2010 |
$ | 2,695.6 | $ | 95.1 | $ | 789.8 | $ | 3,580.5 | ||||
| 2011 |
154.7 | 1,109.9 | 1,264.6 | |||||||||
| 2012 |
43.2 | 620.0 | 663.2 | |||||||||
| 2013 |
22.6 | 22.6 | ||||||||||
| 2014 |
350.0 | 350.0 | ||||||||||
| $ | 2,695.6 | $ | 315.6 | $ | 2,869.7 | $ | 5,880.9 | |||||
Interest paid on borrowings was $267.6, $327.1 and $339.0 in 2009, 2008 and 2007. The weighted average interest rate on consolidated commercial paper and short-term bank loans was 2.8% and 3.8% at December 31, 2009 and 2008, respectively.
The primary sources of borrowings are commercial paper and medium-term notes issued in the public markets. The medium-term notes are issued by PACCAR Inc, PACCAR Financial Corp. (PFC), PACCAR Financial Europe and PACCAR Mexico.
PACCAR Inc intends to periodically file shelf registrations under the Securities Act of 1933. The total amount of medium-term notes outstanding for PACCAR Inc as of December 31, 2009, is $870.0. The current registration expires in 2011 and does not limit the principal amount of debt securities that may be issued during the period.
In November 2009, the Company’s U.S. finance subsidiary, PFC, filed a shelf registration under the Securities Act of 1933. In December 2009, PFC issued $250.0 of fixed-rate medium-term notes under this registration. The total amount of medium-term notes outstanding for PFC as of December 31, 2009, was $1,148.5. The registration expires in 2012 and does not limit the principal amount of debt securities that may be issued during the period.
At December 31, 2009, PACCAR’s European finance subsidiary, PACCAR Financial Europe, had €850.0 available for issuance under a €1,500.0 medium-term note program registered with the London Stock Exchange. The program was renewed in the third quarter of 2009 and is renewable annually.
In June 2008, PACCAR Mexico registered a 7,000 peso medium-term note program with the Comision Nacional Bancaria y de Valores. The registration expires in 2012 and at December 31, 2009, 6,100 pesos remained available for issuance.
The Company has line of credit arrangements of $3,668.2, of which $3,352.6 was unused at the end of December 2009. Included in these arrangements is $3,000.0 of syndicated bank facilities. Of the $3,000.0 bank facilities, $2,000.0 matures in June 2010 and $1,000.0 matures in June 2012. The Company intends to replace these credit facilities as they expire with facilities of similar amounts and duration. These credit facilities are maintained primarily to provide backup liquidity for commercial paper borrowings and maturing medium-term notes. There were no borrowings under the syndicated bank lines for the year ended December 31, 2009.
52
NOTES TO CONSOLIDATED FINANCIAL STATEMENTS
December 31, 2009, 2008 and 2007 (currencies in millions)
K. LEASES
The Company leases certain facilities, computer equipment and aircraft under operating leases. Leases expire at various dates through the year 2017. Annual minimum rent payments under non-cancelable operating leases having initial or remaining terms in excess of one year at January 1, 2010, are $27.0, $17.5, $9.7, $6.1, $2.7 and $.5 thereafter. Total rental expenses under all leases amounted to $40.6, $43.3 and $41.1 for 2009, 2008 and 2007, respectively.
L. COMMITMENTS AND CONTINGENCIES
The Company is involved in various stages of investigations and cleanup actions in different countries related to environmental matters. In certain of these matters, the Company has been designated as a “potentially responsible party” by domestic and foreign environmental agencies. The Company has an accrual to provide for the estimated costs to investigate and complete cleanup actions where it is probable that the Company will incur such costs in the future. Expenditures related to environmental activities in 2009, 2008 and 2007 were $1.3, $3.8, and $1.9, respectively.
While the timing and amount of the ultimate costs associated with future environmental cleanup cannot be determined, management expects that these matters will not have a significant effect on the Company’s consolidated financial position.
At December 31, 2009, PACCAR had standby letters of credit of $20.5, which guarantee various insurance and financing activities. The Company is committed, under specific circumstances, to purchase equipment at a cost of $53.4 in 2011. At December 31, 2009, PACCAR’s financial services companies, in the normal course of business, had outstanding commitments to fund new loan and lease transactions amounting to $105.3. The commitments generally expire in 90 days. At December 31, 2009, the Company had commitments related to the construction of its engine facility in Columbus, Mississippi of $11.4 in 2010 and $56.2 thereafter. The Company had other commitments, primarily to purchase production inventory, amounting to $113.7 in 2010 and $183.1 thereafter.
PACCAR is a defendant in various legal proceedings and, in addition, there are various other contingent liabilities arising in the normal course of business. After consultation with legal counsel, management does not anticipate that disposition of these proceedings and contingent liabilities will have a material effect on the consolidated financial statements.
M. EMPLOYEE BENEFITS
Severance Costs: During 2009 and 2008, the Company incurred severance costs as summarized below. These costs were the result of work force adjustments reflecting low truck demand, primarily in Europe.
| 2009 | 2008 | |||||
| Truck and Other: |
||||||
| Cost of sales and revenues |
$ | 19.2 | $ | 13.1 | ||
| Selling, general and administrative |
6.4 | 3.4 | ||||
| $ | 25.6 | $ | 16.5 | |||
| Financial Services: |
||||||
| Selling, general, and administrative |
.3 | .8 | ||||
| Total Severance Costs |
$ | 25.9 | $ | 17.3 | ||
At December 31, 2009, the Company had $3.6 accrued for future severance payments expected in the next year, compared to an accrual of $4.6 at December 31, 2008.
53
NOTES TO CONSOLIDATED FINANCIAL STATEMENTS
December 31, 2009, 2008 and 2007 (currencies in millions)
Employee Benefit Plans: PACCAR has several defined benefit pension plans, which cover a majority of its employees. The Company evaluates its actuarial assumptions on an annual basis and considers changes based upon market conditions and other factors.
The Company funds its pensions in accordance with applicable employee benefit and tax laws. The Company contributed $173.4 to its pension plans in 2009 and $63.9 in 2008. The Company expects to contribute in the range of $25.0 to $75.0 to its pension plans in 2010 of which $10.3 is estimated to satisfy minimum funding requirements. Annual benefits expected to be paid beginning January 1, 2010, are $55.6, $58.8, $64.9, $68.7, $75.8 and for the five years thereafter, a total of $433.6.
Plan assets are invested in global equity and debt securities through professional investment managers with the objective to achieve targeted risk adjusted returns and maintain liquidity sufficient to fund current benefit payments. Typically, each defined benefit plan has an investment policy that includes a target for asset mix including maximum and minimum ranges for allocation percentages by investment category. The actual allocation of assets may vary at times based upon rebalancing policies and other factors. The Company periodically assesses the target asset mix by evaluating external sources of information regarding the long-term historical return, volatilities and expected future returns for each investment category. In addition, the long-term rates of return assumptions for pension accounting are reviewed annually to ensure they are appropriate. Target asset mix and forecast long-term returns by asset category are considered in determining the assumed long-term rates of return, although historical returns realized are given some consideration.
The following information details the allocation of plan assets by investment type. See Note Q for definitions of fair value levels.
| At December 31, 2009 |
TARGET | LEVEL 1 | LEVEL 2 | TOTAL | ||||||||
| Equity Funds: |
||||||||||||
| U.S. equity funds |
$ | 29.2 | $ | 374.2 | $ | 403.4 | ||||||
| Global equity funds |
311.4 | 311.4 | ||||||||||
| Total equity funds |
50-70 | % | 29.2 | 685.6 | 714.8 | |||||||
| Fixed Income Funds: |
||||||||||||
| U.S. fixed income funds |
303.2 | 109.3 | 412.5 | |||||||||
| Non U.S. fixed income funds |
13.8 | 102.4 | 116.2 | |||||||||
| Total fixed income funds |
30-50 | % | 317.0 | 211.7 | 528.7 | |||||||
| Cash and other |
5.6 | 27.2 | 32.8 | |||||||||
| Total plan assets |
$ | 351.8 | $ | 924.5 | $ | 1,276.3 | ||||||
The following additional data relates to all pension plans of the Company, except for certain multi-employer and foreign-insured plans:
| At December 31, |
2009 | 2008 | ||||
| Weighted Average Assumptions: |
||||||
| Discount rate |
5.9 | % | 6.2 | % | ||
| Rate of increase in future compensation levels |
3.9 | % | 4.3 | % | ||
| Assumed long-term rate of return on plan assets |
7.4 | % | 7.4 | % | ||
54
NOTES TO CONSOLIDATED FINANCIAL STATEMENTS
December 31, 2009, 2008 and 2007 (currencies in millions)
The components of the Change in Projected Benefit Obligation and Change in Plan Assets are as follows:
| 2009 | 2008 | |||||||
| Change in Projected Benefit Obligation: |
||||||||
| Benefit obligation at January 1 |
$ | 1,196.4 | $ | 1,201.0 | ||||
| Service cost |
36.2 | 46.6 | ||||||
| Interest cost |
71.1 | 73.9 | ||||||
| Benefits paid |
(59.6 | ) | (48.8 | ) | ||||
| Actuarial loss |
46.7 | 3.0 | ||||||
| Curtailment gain |
(.1 | ) | (3.3 | ) | ||||
| Currency translation |
31.0 | (80.9 | ) | |||||
| Participant contributions |
3.1 | 4.9 | ||||||
| Projected benefit obligation at December 31 |
$ | 1,324.8 | $ | 1,196.4 | ||||
| Change in Plan Assets: |
||||||||
| Fair value of plan assets at January 1 |
$ | 913.8 | $ | 1,312.5 | ||||
| Employer contributions |
173.4 | 63.9 | ||||||
| Actual return on plan assets |
215.9 | (336.4 | ) | |||||
| Benefits paid |
(59.6 | ) | (48.8 | ) | ||||
| Currency translation |
29.7 | (82.3 | ) | |||||
| Participant contributions |
3.1 | 4.9 | ||||||
| Fair value of plan assets at December 31 |
1,276.3 | 913.8 | ||||||
| Funded Status at December 31 |
$ | (48.5 | ) | $ | (282.6 | ) | ||
| Amounts Recorded in Balance Sheet |
2009 | 2008 | ||||||
| Other noncurrent assets |
$ | 59.9 | $ | 5.5 | ||||
| Other liabilities |
(108.4 | ) | (288.1 | ) | ||||
| Accumulated other comprehensive loss: |
||||||||
| Actuarial loss |
291.0 | 334.5 | ||||||
| Prior service cost |
9.5 | 10.1 | ||||||
| Net initial transition amount |
.5 | 1.0 | ||||||
Of the December 31, 2009 amounts in accumulated other comprehensive loss, $14.8 of unrecognized actuarial loss, $1.8 of unrecognized prior service cost and $.1 of unrecognized net initial transition amount are expected to be amortized into net pension expense in 2010.
The accumulated benefit obligation for all pension plans of the Company, except for certain multi-employer and foreign-insured plans was $1,214.0 at December 31, 2009, and $1,037.6 at December 31, 2008.
Information for all plans with accumulated benefit obligation in excess of plan assets is as follows:
| At December 31, |
2009 | 2008 | ||||
| Projected benefit obligation |
$ | 429.0 | $ | 933.7 | ||
| Accumulated benefit obligation |
418.9 | 791.9 | ||||
| Fair value of plan assets |
322.9 | 650.9 | ||||
55
NOTES TO CONSOLIDATED FINANCIAL STATEMENTS
December 31, 2009, 2008 and 2007 (currencies in millions)
| Year Ended December 31, |
2009 | 2008 | 2007 | |||||||||
| Components of Pension Expense: |
||||||||||||
| Service cost |
$ | 36.2 | $ | 46.6 | $ | 49.7 | ||||||
| Interest on projected benefit obligation |
71.1 | 73.9 | 68.7 | |||||||||
| Expected return on assets |
(93.1 | ) | (92.8 | ) | (89.7 | ) | ||||||
| Amortization of prior service costs |
1.7 | 2.4 | 2.9 | |||||||||
| Recognized actuarial loss |
9.5 | 3.0 | 8.4 | |||||||||
| Curtailment (gain) loss |
(.1 | ) | .9 | 2.7 | ||||||||
| Net pension expense |
$ | 25.3 | $ | 34.0 | $ | 42.7 | ||||||
Pension expense for multi-employer and foreign-insured plans was $41.2, $45.8 and $37.9 in 2009, 2008 and 2007.
The Company has certain defined contribution benefit plans whereby it generally matches employee contributions up to 5% of base wages. In 2009, the Company match was 1% of base wages and 5% in 2008 and 2007. The majority of participants in these plans are non-union employees located in the United States. Expenses for these plans were $6.8, $22.1 and $22.6 in 2009, 2008 and 2007.
During the second quarter of 2009, the Company discontinued subsidizing postretirement medical costs for the majority of its U.S. employees and recognized a curtailment gain of $47.7. The Company also recognized a curtailment gain of $18.3 in the third quarter for the discontinuation of postretirement healthcare related to the permanent closure of the Peterbilt facility in Madison, Tennessee.
The following data relates to unfunded postretirement medical and life insurance plans:
| 2009 | 2008 | |||||||
| Change in Projected Benefit Obligation: |
||||||||
| Benefit obligation at January 1 |
$ | 80.9 | $ | 88.0 | ||||
| Service cost |
3.2 | |||||||
| Interest cost |
.5 | 4.7 | ||||||
| Benefits paid |
(3.2 | ) | (4.1 | ) | ||||
| Curtailment gain |
(66.0 | ) | ||||||
| Actuarial gain |
(5.5 | ) | (10.9 | ) | ||||
| Projected benefit obligation at December 31 |
6.7 | 80.9 | ||||||
| Unfunded status at December 31 |
$ | (6.7 | ) | $ | (80.9 | ) | ||
| Amounts Recorded in Balance Sheet: |
||||||||
| Other liabilities |
$ | (6.7 | ) | $ | (80.9 | ) | ||
| Accumulated other comprehensive (income) loss: |
||||||||
| Actuarial (gain) loss |
(.9 | ) | 1.8 | |||||
| Prior service cost |
.1 | |||||||
| Net initial transition amount |
.8 | |||||||
| Year Ended December 31, |
2009 | 2008 | 2007 | |||||||
| Components of Retiree Expense: |
||||||||||
| Service cost |
$ | 3.2 | $ | 4.8 | ||||||
| Interest cost |
$ | .5 | 4.7 | 5.2 | ||||||
| Recognized actuarial loss |
.9 | |||||||||
| Recognized prior service cost |
.1 | .1 | ||||||||
| Curtailment gain |
(66.0 | ) | ||||||||
| Recognized net initial obligation |
.4 | .4 | ||||||||
| Net retiree (income) expense |
$ | (65.5 | ) | $ | 8.4 | $ | 11.4 | |||
56
NOTES TO CONSOLIDATED FINANCIAL STATEMENTS
December 31, 2009, 2008 and 2007 (currencies in millions)
N. INCOME TAXES
The Company’s tax rate is based on income and statutory tax rates in the various jurisdictions in which the Company operates. Tax law requires items to be included in the Company’s tax returns at different times than the items reflected in the Company’s financial statements. As a result, the Company’s annual tax rate reflected in its financial statements is different than that reported in its tax returns. Some of these differences are permanent, such as expenses that are not deductible in the Company’s tax return, and some differences reverse over time, such as depreciation expense. These temporary differences create deferred tax assets and liabilities. The Company establishes valuation allowances for its deferred tax assets if, based on the available evidence, it is more likely than not that some portion or all of the deferred tax assets will not be realized.
The components of the Company’s income before income taxes include the following:
| Year Ended December 31, |
2009 | 2008 | 2007 | ||||||
| Domestic |
$ | 79.1 | $ | 96.0 | $ | 419.1 | |||
| Foreign |
95.9 | 1,368.0 | 1,345.2 | ||||||
| $ | 175.0 | $ | 1,464.0 | $ | 1,764.3 | ||||
The components of the Company’s provision for income taxes include the following:
| Year Ended December 31, |
2009 | 2008 | 2007 | |||||||||
| Current provision (benefit): |
||||||||||||
| Federal |
$ | (102.4 | ) | $ | (24.7 | ) | $ | 120.5 | ||||
| State |
(2.5 | ) | (7.9 | ) | 11.1 | |||||||
| Foreign |
8.3 | 347.7 | 367.1 | |||||||||
| (96.6 | ) | 315.1 | 498.7 | |||||||||
| Deferred provision (benefit): |
||||||||||||
| Federal |
125.4 | 123.7 | 41.9 | |||||||||
| State |
8.2 | 12.5 | 3.6 | |||||||||
| Foreign |
26.1 | (5.2 | ) | (7.2 | ) | |||||||
| 159.7 | 131.0 | 38.3 | ||||||||||
| $ | 63.1 | $ | 446.1 | $ | 537.0 | |||||||
Tax benefits recognized for net operating loss carryforwards were $27.8, $4.7 and $21.2 for the years ended 2009, 2008 and 2007. Tax expense for the year ended December 31, 2009, includes a charge of $11.4 resulting from the retroactive effects of a Mexican tax law enacted in December 2009.
A reconciliation of the statutory U.S federal tax rate to the effective income tax rate is as follows:
| 2009 | 2008 | 2007 | |||||||
| Statutory rate |
35.0 | % | 35.0 | % | 35.0 | % | |||
| Effect of: |
|||||||||
| Mexican tax law change |
6.5 | ||||||||
| Qualified dividends to defined contribution plan |
(2.3 | ) | (.4 | ) | (.7 | ) | |||
| Research and development credit |
(2.1 | ) | (.4 | ) | (.3 | ) | |||
| Tax on foreign earnings |
.8 | (4.6 | ) | (4.1 | ) | ||||
| Tax contingencies |
2.2 | (.3 | ) | (.1 | ) | ||||
| Other, net |
(4.0 | ) | 1.2 | .6 | |||||
| 36.1 | % | 30.5 | % | 30.4 | % | ||||
57
NOTES TO CONSOLIDATED FINANCIAL STATEMENTS
December 31, 2009, 2008 and 2007 (currencies in millions)
U.S. income taxes are not provided on the undistributed earnings of the Company’s foreign subsidiaries that are considered to be indefinitely reinvested. At December 31, 2009, the amount of undistributed earnings which are considered to be indefinitely reinvested is $3,117.8.
At December 31, 2009, the Company had net operating loss carryforwards of $365.7, of which $209.0 were in foreign subsidiaries and $156.7 were in the U.S. The related deferred tax asset was $70.9. The carryforward periods range from five years to indefinite, subject to certain limitations under applicable laws. At December 31, 2009, the Company has U.S. tax credit carryforwards of $68.4, most of which expire in 2018 and 2019. The future tax benefits of net operating loss and credit carryforwards are evaluated on a regular basis, including a review of historical and projected operating results.
The tax effects of temporary differences representing deferred tax assets and liabilities are as follows:
| At December 31, |
2009 | 2008 | ||||||
| Assets: |
||||||||
| Accrued expenses |
$ | 123.2 | $ | 156.4 | ||||
| Net operating loss carryforwards |
70.9 | 54.0 | ||||||
| Tax credit carryfowards |
68.4 | |||||||
| Allowances for losses on receivables |
54.4 | 58.0 | ||||||
| Postretirement benefit plans |
15.6 | 124.3 | ||||||
| Other |
98.7 | 152.1 | ||||||
| 431.2 | 544.8 | |||||||
| Valuation Allowance |
(4.0 | ) | (5.4 | ) | ||||
| 427.2 | 539.4 | |||||||
| Liabilities: |
||||||||
| Financial Services leasing depreciation |
(524.1 | ) | (524.1 | ) | ||||
| Depreciation and amortization |
(167.9 | ) | (116.4 | ) | ||||
| Other |
(16.9 | ) | (55.1 | ) | ||||
| (708.9 | ) | (695.6 | ) | |||||
| Net deferred tax liability |
$ | (281.7 | ) | $ | (156.2 | ) | ||
The balance sheet classification of the Company’s deferred tax assets and liabilities are as follows:
| At December 31, |
2009 | 2008 | ||||||
| Truck and Other: |
||||||||
| Other current assets |
$ | 76.9 | $ | 83.5 | ||||
| Other noncurrent assets |
135.8 | 195.3 | ||||||
| Accounts payable, accrued expenses and other |
(.1 | ) | (13.3 | ) | ||||
| Other liabilities |
(35.0 | ) | (13.1 | ) | ||||
| Financial Services: |
||||||||
| Other assets |
68.0 | 56.4 | ||||||
| Deferred taxes and other liabilities |
(527.3 | ) | (465.0 | ) | ||||
| Net deferred tax liability |
$ | (281.7 | ) | $ | (156.2 | ) | ||
Cash paid for income taxes was $67.3, $452.0 and $412.9 in 2009, 2008 and 2007.
58
NOTES TO CONSOLIDATED FINANCIAL STATEMENTS
December 31, 2009, 2008 and 2007 (currencies in millions)
A reconciliation of the beginning and ending amount of unrecognized tax benefits is as follows:
| 2009 | 2008 | 2007 | ||||||||||
| Balance at January 1 |
$ | 37.1 | $ | 57.9 | $ | 54.3 | ||||||
| Additions based on tax positions and settlements related to the current year |
1.1 | 7.1 | 11.4 | |||||||||
| Additions based on tax positions and settlements related to the prior year |
14.9 | 2.6 | 8.7 | |||||||||
| Reductions for tax positions of prior years |
(6.5 | ) | (20.7 | ) | (11.6 | ) | ||||||
| Lapse of statute of limitations |
(2.5 | ) | (9.8 | ) | (4.9 | ) | ||||||
| Balance at December 31 |
$ | 44.1 | $ | 37.1 | $ | 57.9 | ||||||
The Company had $21.8 and $15.3 of related assets at December 31, 2009 and 2008. All of the unrecognized tax benefits and related assets would impact the effective tax rate if recognized. Based on the resolution of certain tax examinations in January 2010, the Company anticipates a decrease of $11.3 to its unrecognized tax benefits during the first quarter of 2010.
Interest and penalties are classified as income taxes in the accompanying statements of income and were not significant during any of the three years ended December 31, 2009, 2008 and 2007. Amounts accrued for the payment of penalties and interest at December 31, 2009 and 2008 were also not significant.
As of December 31, 2009, the United States Internal Revenue Service has completed examinations of the Company’s tax returns for all years through 2004. The Company’s tax returns for other major jurisdictions remain potentially subject to examination for the years ranging from 2003 through 2009.
O. STOCKHOLDERS’ EQUITY
Accumulated Other Comprehensive Income (Loss): Following are the components of accumulated other comprehensive income:
| At December 31, |
2009 | 2008 | 2007 | |||||||||
| Unrealized gain on investments |
$ | 1.4 | $ | 1.0 | $ | 3.2 | ||||||
| Tax effect |
(.5 | ) | (.4 | ) | (1.3 | ) | ||||||
| .9 | .6 | 1.9 | ||||||||||
| Unrealized loss on derivative contracts |
(73.4 | ) | (121.7 | ) | (18.8 | ) | ||||||
| Tax effect |
25.0 | 39.4 | 10.6 | |||||||||
| (48.4 | ) | (82.3 | ) | (8.2 | ) | |||||||
| Pension and postretirement: |
||||||||||||
| Unrecognized: |
||||||||||||
| Actuarial loss |
(444.7 | ) | (525.9 | ) | (131.6 | ) | ||||||
| Prior service cost |
(14.7 | ) | (16.0 | ) | (20.0 | ) | ||||||
| Net initial obligation |
(.6 | ) | (2.3 | ) | (3.5 | ) | ||||||
| Tax effect |
159.9 | 195.9 | 53.3 | |||||||||
| (300.1 | ) | (348.3 | ) | (101.8 | ) | |||||||
| Currency translation adjustment |
383.8 | 160.2 | 516.2 | |||||||||
| Accumulated other comprehensive income (loss) |
$ | 36.2 | $ | (269.8 | ) | $ | 408.1 | |||||
Other Capital Stock Changes: PACCAR had 409,000 treasury shares at December 31, 2009 and 2008, and 1,278,900 treasury shares at December 31, 2007.
Stock Dividend: A 50% common stock dividend was paid in October 2007. This resulted in the issuance of 122,775,211 additional shares and 613 fractional shares paid in cash.
59
NOTES TO CONSOLIDATED FINANCIAL STATEMENTS
December 31, 2009, 2008 and 2007 (currencies in millions)
P. DERIVATIVE FINANCIAL INSTRUMENTS
Derivative financial instruments are used to hedge exposures to fluctuations in interest rates and foreign currency exchange rates. Certain derivative instruments designated as either cash flow hedges or fair value hedges are subject to hedge accounting. Derivative instruments that are not subject to hedge accounting are held as economic hedges. The Company’s policies prohibit the use of derivatives for speculation or trading. At inception of each hedge relationship, the Company documents its risk management objectives, procedures and accounting treatment. Exposure limits and minimum credit ratings are used to minimize the risks of counterparty default. The Company had no material exposures to default at December 31, 2009.
Interest-Rate Contracts: The Company enters into various interest-rate contracts, including interest-rate swaps and cross currency interest-rate swaps. Interest-rate swaps involve the exchange of fixed for floating rate or floating for fixed rate interest payments based on the contractual notional amounts in a single currency. Cross currency interest-rate swaps involve the exchange of notional amounts and interest payments in different currencies. These contracts are used to manage exposures to fluctuations in interest rates and foreign currency exchange rates. Net amounts paid or received are reflected as adjustments to interest expense.
At December 31, 2009, the notional amount of the Company’s interest-rate contracts was $3,541.2. Notional maturities for all interest-rate contracts are $1,396.0 for 2010, $1,148.9 for 2011, $826.5 for 2012, $29.3 for 2013 and $140.5 for 2014. The majority of these contracts are floating to fixed swaps that effectively convert an equivalent amount of commercial paper and other variable rate debt to fixed rates.
Foreign-Exchange Contracts: The Company enters into foreign-exchange contracts to hedge certain anticipated transactions and assets and liabilities denominated in foreign currencies, particularly the Canadian dollar, the euro, the British pound, the Australian dollar and the Mexican peso. At December 31, 2009, the notional amount of the outstanding foreign-exchange contracts was $155.1. Foreign-exchange contracts mature within one year.
The following table presents the balance sheet locations and fair value of derivative financial instruments:
| At December 31, 2009 |
ASSETS | LIABILITIES | ||||
| Derivatives designated under hedge accounting: |
||||||
| Interest-rate contracts: |
||||||
| Financial Services: |
||||||
| Other assets |
$ | 10.8 | ||||
| Deferred taxes and other liabilities |
$ | 107.1 | ||||
| Foreign-exchange contracts: |
||||||
| Truck and Other: |
||||||
| Deferred taxes and other current assets |
.1 | |||||
| Accounts payable, accrued expenses and other |
.2 | |||||
| Total |
$ | 10.9 | $ | 107.3 | ||
| Economic hedges: |
||||||
| Interest-rate contracts: |
||||||
| Financial Services: |
||||||
| Other assets |
$ | .4 | ||||
| Deferred taxes and other liabilities |
$ | 9.0 | ||||
| Foreign-exchange contracts: |
||||||
| Truck and Other: |
||||||
| Accounts payable, accrued expenses and other |
.2 | |||||
| Financial Services: |
||||||
| Other assets |
.3 | |||||
| Deferred taxes and other liabilities |
.1 | |||||
| Total |
$ | .7 | $ | 9.3 | ||
60
NOTES TO CONSOLIDATED FINANCIAL STATEMENTS
December 31, 2009, 2008 and 2007 (currencies in millions)
Substantially all of the Company’s interest-rate contracts and some foreign-exchange contracts have been designated as cash flow hedges. The Company uses regression analysis to assess and measure effectiveness of interest-rate contracts. For foreign-exchange contracts, the Company performs quarterly assessments to ensure that critical terms continue to match. Gains or losses on the ineffective portion of cash flow hedges are recognized currently in earnings and were immaterial for 2009. Hedge accounting is discontinued prospectively when the Company determines that a derivative financial instrument has ceased to be a highly effective hedge.
Fair Value Hedges: Changes in the fair value of derivatives designated as fair value hedges are recorded in earnings together with the changes in fair value of the hedged item attributable to the risk being hedged. In 2009, the Company recognized income of $3.6 on interest-rate swaps designated as fair value hedges which was offset by $3.9 of expense on the fixed-rate term notes being hedged. Both the income and expense were recorded in the Financial Services segment in Interest and other borrowing expenses.
Cash Flow Hedges: Changes in the fair value of derivatives designated as cash flow hedges are recorded in accumulated other comprehensive income to the extent such hedges are considered effective. Amounts in accumulated other comprehensive income are reclassified into net income in the same period in which the hedged transaction affects earnings. Net realized gains and losses from interest-rate contracts are recognized as an adjustment to interest expense. Net realized gains and losses from foreign-exchange contracts are recognized as an adjustment to cost of sales or to financial services interest expense, consistent with the hedged transaction.
The following table presents the pre-tax effects of derivative instruments recognized in earnings and Other Comprehensive Income (OCI):
| Year Ended December 31, 2009 |
INTEREST-RATE CONTRACTS |
FOREIGN- EXCHANGE CONTRACTS |
|||||
| (Gain) loss recognized in OCI: |
|||||||
| Truck and Other |
$ | (.6 | ) | ||||
| Financial Services |
$ | 72.0 | .2 | ||||
| Total |
$ | 72.0 | $ | (.4 | ) | ||
| (Income) expense reclassified from Accumulated OCI into income: |
|||||||
| Truck and Other: |
|||||||
| Cost of sales and revenues |
$ | (10.0 | ) | ||||
| Interest and other expense (income), net |
(1.7 | ) | |||||
| Financial Services: |
|||||||
| Interest and other borrowing expenses |
$ | 131.4 | .2 | ||||
| Total |
$ | 131.4 | $ | (11.5 | ) | ||
Of the $48.4 accumulated net loss on derivative contracts included in accumulated other comprehensive income as of December 31, 2009, $39.3, net of taxes, is expected to be reclassified to interest expense or cost of sales in the following 12 months. The fixed interest earned on finance receivables will offset the amount recognized in interest expense, resulting in a stable interest margin consistent with the Company’s risk management strategy.
61
NOTES TO CONSOLIDATED FINANCIAL STATEMENTS
December 31, 2009, 2008 and 2007 (currencies in millions)
Economic Hedges: Changes in the fair value of economic hedges are recorded in earnings in the period in which the change occurs.
The (income) or expense recognized in earnings related to economic hedges is as follows:
| Year Ended December 31, 2009 |
INTEREST-RATE CONTRACTS |
FOREIGN- EXCHANGE CONTRACTS |
|||||
| Truck and Other: |
|||||||
| Cost of sales and revenues |
$ | (14.4 | ) | ||||
| Interest and other expense (income), net |
$ | 6.1 | 18.3 | ||||
| Financial Services: |
|||||||
| Interest and other borrowing expenses |
4.0 | 2.3 | |||||
| Total |
$ | 10.1 | $ | 6.2 | |||
Q. FAIR VALUE MEASUREMENTS
Fair value represents the price that would be received to sell an asset or paid to transfer a liability in an orderly transaction between market participants at the measurement date. The hierarchy of fair value measurements is described below.
Level 1 – Valuations are based on quoted prices that the Company has the ability to obtain in actively traded markets for identical assets or liabilities. Since valuations are based on quoted prices that are readily and regularly available in an active market or exchange traded market, valuation of these instruments does not require a significant degree of judgment.
Level 2 – Valuations are based on quoted prices for similar instruments in active markets, quoted prices for identical or similar instruments in markets that are not active, and model-based valuation techniques for which all significant assumptions are observable in the market.
Level 3 – Valuations are based on model-based techniques for which some or all of the assumptions are obtained from indirect market information that is significant to the overall fair value measurement and which require a significant degree of management judgment. The Company has no financial instruments requiring Level 3 valuation.
The Company uses the following methods and assumptions to measure fair value for assets and liabilities subject to recurring fair value measurements.
Marketable Securities: The Company’s marketable debt securities consist of municipal bonds, government obligations and investment-grade corporate bonds. The fair value of government obligations is based on quoted prices in active markets. These are categorized as Level 1. The fair value of municipal bonds and corporate bonds are estimated using recent transactions, market price quotations and pricing models that consider, where applicable, interest rates and other observable market information. These bonds are categorized as Level 2.
Derivative Financial Instruments: The Company’s derivative contracts consist of interest rate contracts and foreign currency exchange contracts. These derivative contracts are over the counter and their fair value is determined using modeling techniques that include market inputs such as interest rates, yield curves and currency exchange rates. These contracts are categorized as Level 2. A portion of the Company’s fixed-rate term notes has been converted to variable-rate term notes using fair value hedges for interest-rate risk. Fair value is determined using modeling techniques that include market inputs for interest rates.
62
NOTES TO CONSOLIDATED FINANCIAL STATEMENTS
December 31, 2009, 2008 and 2007 (currencies in millions)
PACCAR’s assets and liabilities subject to recurring fair value measurements, are either Level 1 or Level 2 as follows:
| At December 31, 2009 |
LEVEL 1 | LEVEL 2 | TOTAL | ||||||
| Assets: |
|||||||||
| Marketable debt securities |
$ | 6.5 | $ | 213.0 | $ | 219.5 | |||
| Derivative contracts |
11.6 | 11.6 | |||||||
| Liabilities: |
|||||||||
| Derivative contracts |
116.6 | 116.6 | |||||||
| At December 31, 2008 |
LEVEL 1 | LEVEL 2 | TOTAL | ||||||
| Assets: |
|||||||||
| Marketable debt securities |
$ | 6.9 | $ | 168.5 | $ | 175.4 | |||
| Derivative contracts |
60.4 | 60.4 | |||||||
| Liabilities: |
|||||||||
| Derivative contracts |
173.0 | 173.0 | |||||||
Other nonfinancial assets that are measured at fair value on a nonrecurring basis are as follows:
| At December 31, |
2009 | 2008 | ||||
| LEVEL 2 | LEVEL 2 | |||||
| Used trucks held for sale: |
||||||
| Truck and Other |
$ | 28.1 | $ | 27.9 | ||
| Financial Services |
124.7 | 96.6 | ||||
| $ | 152.8 | $ | 124.5 | |||
The carrying amount of used trucks held for sale is written down when appropriate to reflect their fair value. The fair value of used trucks is determined based on management’s evaluation of factors such as recent sales prices of comparable units, the condition of the vehicles and the number of similar units to be sold. Used truck write-downs during 2009 were $34.7. Of the $34.7 recorded in 2009, $18.0 was recorded in cost of sales in the truck segment and $16.7 was recorded in the financial services segment (credit losses of $4.7 and depreciation and other expense of $12.0). The amount of used truck write-downs was $23.5 for the year ended December 31, 2008, of which $12.1 was recorded in cost of sales in the truck segment and $11.4 was recorded in the financial services segment (credit losses of $9.2 and depreciation and other expense of $2.2).
The Company used the following methods and assumptions to determine the fair value of financial instruments that are not recognized at fair value as described below.
Cash and Cash Equivalents: Carrying amounts approximate fair value.
Financial Services Net Receivables: For floating-rate loans, wholesale financings, and interest and other receivables, fair values approximate carrying values. For fixed-rate loans, fair values are estimated using discounted cash flow analysis based on current rates for comparable loans. Finance lease receivables and related loss provisions have been excluded from the accompanying table.
Debt: The carrying amounts of financial services commercial paper, variable-rate bank loans and variable-rate term notes approximate fair value. For fixed-rate debt, fair values are estimated using discounted cash flow analysis based on current rates for comparable debt.
Trade Receivables and Payables: Carrying amounts approximate fair value.
63
NOTES TO CONSOLIDATED FINANCIAL STATEMENTS
December 31, 2009, 2008 and 2007 (currencies in millions)
Fixed-rate loans that are not carried at approximate fair value are as follows:
| At December 31, |
2009 | 2008 | ||||||||||
| CARRYING AMOUNT |
FAIR VALUE |
CARRYING AMOUNT |
FAIR VALUE | |||||||||
| Assets: |
||||||||||||
| Financial Services fixed-rate loans |
$ | 2,491.1 | $ | 2,539.0 | $ | 3,011.1 | $ | 3,030.8 | ||||
| Liabilities: |
||||||||||||
| Truck and Other fixed-rate debt |
172.3 | 192.4 | 19.3 | 18.6 | ||||||||
| Financial Services fixed-rate debt |
1,645.4 | 1,746.7 | 752.7 | 788.1 | ||||||||
R. STOCK COMPENSATION PLANS
PACCAR has certain plans under which officers and key employees may be granted options to purchase shares of the Company’s authorized but unissued common stock. Non-employee directors and certain officers may be granted restricted shares of the Company’s common stock. The maximum number of shares of the Company’s common stock authorized for issuance under these plans is 46.7 million, and as of December 31, 2009, the maximum number of shares available for future grants was 17.7 million. Options outstanding under these plans were granted with exercise prices equal to the fair market value of the Company’s common stock at the date of grant. Options expire no later than ten years from the grant date and generally vest within three years. Stock option activity is summarized below:
| NUMBER OF SHARES |
EXERCISE PRICE* | |||||
| Outstanding at 12/31/06 |
6,162,000 | $ | 19.50 | |||
| Granted |
824,200 | 44.56 | ||||
| Exercised |
(1,168,200 | ) | 14.79 | |||
| Cancelled |
(109,000 | ) | 34.80 | |||
| Outstanding at 12/31/07 |
5,709,000 | 23.79 | ||||
| Granted |
734,300 | 45.74 | ||||
| Exercised |
(403,000 | ) | 16.95 | |||
| Cancelled |
(241,000 | ) | 39.50 | |||
| Outstanding at 12/31/08 |
5,799,300 | 26.39 | ||||
| Granted |
1,182,800 | 30.81 | ||||
| Exercised |
(1,181,900 | ) | 14.99 | |||
| Cancelled |
(232,500 | ) | 41.36 | |||
| Outstanding at 12/31/09 |
5,567,700 | $ | 29.12 | |||
| * | Weighted Average |
For options exercised, the aggregate difference between the market price and strike price on the date of exercise was $22.7 in 2009, $10.8 in 2008 and $40.4 in 2007.
64
NOTES TO CONSOLIDATED FINANCIAL STATEMENTS
December 31, 2009, 2008 and 2007 (currencies in millions)
The following tables summarize information about options outstanding at December 31, 2009:
| RANGE OF EXERCISE PRICES |
NUMBER OF SHARES |
REMAINING CONTRACTUAL LIFE IN YEARS |
AVERAGE EXERCISE PRICE* | ||||
| Exercisable: |
|||||||
| $ 8.25-10.20 |
464,600 | 1.1 | $ | 10.16 | |||
| 12.54-13.96 |
958,300 | 2.6 | 13.28 | ||||
| 25.31 |
437,800 | 4.0 | 25.31 | ||||
| 32.11-32.23 |
1,340,700 | 5.6 | 32.17 | ||||
| 3,201,400 | 3.8 | 22.39 | |||||
| Not Exercisable: |
|||||||
| 44.56 |
624,400 | 7.1 | 44.56 | ||||
| 45.74 |
601,700 | 8.1 | 45.74 | ||||
| 30.81 |
1,140,200 | 9.1 | 30.81 | ||||
| 2,366,300 | 8.3 | 38.23 | |||||
| 5,567,700 | 5.7 | $ | 29.12 | ||||
| * | Weighted Average |
The fair value of restricted stock awards was determined based on the stock price at the award date. Certain restricted stock awards granted in 2008 and 2007 contain conditions tied to the Company’s performance over a five year period. Compensation expense for awards with performance conditions is recorded only when it is probable that the requirements will be achieved. Compensation expense related to restricted stock awards with only service conditions is recognized over the requisite service period.
Realized tax benefits for 2009 of $7.1 and 2008 of $3.7 related to the excess of deductible amounts over compensation costs recognized have been classified as a financing cash flow. Stock based compensation expense was $9.5, $10.2 and $12.3 in 2009, 2008 and 2007 respectively. As of December 31, 2009, there was $7.7 of unrecognized compensation cost related to unvested stock options, which is expected to be recognized over a remaining weighted-average vesting period of 1.7 years. Unrecognized compensation cost at December 31, 2009, related to unvested restricted stock awards of $1.0, is expected to be recognized over a remaining weighted-average vesting period of 2.2 years.
The estimated fair value of stock options granted during 2009, 2008 and 2007 was $8.47, $8.58 and $10.10 per share. These amounts were determined using the Black-Scholes-Merton option-pricing model, which values options based on the stock price at the grant date and the following assumptions:
| 2009 | 2008 | 2007 | |||||||
| Risk-free interest rate |
2.00 | % | 2.86 | % | 4.80 | % | |||
| Expected volatility |
39 | % | 29 | % | 30 | % | |||
| Expected dividend yield |
3.0 | % | 4.0 | % | 4.0 | % | |||
| Expected term |
5 years | 5 years | 5 years | ||||||
65
NOTES TO CONSOLIDATED FINANCIAL STATEMENTS
December 31, 2009, 2008 and 2007 (currencies in millions)
S. SEGMENT AND RELATED INFORMATION
PACCAR operates in two principal segments, Truck and Financial Services.
The Truck segment includes the manufacture of trucks and the distribution of related aftermarket parts, both of which are sold through a network of independent dealers. This segment derives a large proportion of its revenues and operating profits from operations in North America and Europe.
The Financial Services segment is composed of finance and leasing products and services provided to truck customers and dealers. Revenues are primarily generated from operations in North America and Europe.
Included in All Other is PACCAR’s industrial winch manufacturing business. Also within this category are other sales, income and expenses not attributable to a reportable segment, including a portion of corporate expense. Intercompany interest income on cash advances to the financial services companies is included in All Other and was nil, $17.2 and $24.9 for 2009, 2008 and 2007, respectively. Included in All Other income before income taxes of $42.2 in 2009 was $66.0 of curtailment gains and $22.2 of expense related to economic hedges. Geographic revenues from external customers are presented based on the country of the customer.
PACCAR evaluates the performance of its Truck segment based on operating profits, which excludes investment income, other income and expense and income taxes. The Financial Services segment’s performance is evaluated based on income before income taxes.
| Geographic Area Data |
2009 | 2008 | 2007 | |||||||||
| Revenues: |
||||||||||||
| United States |
$ | 3,594.4 | $ | 4,765.6 | $ | 5,517.5 | ||||||
| Europe |
2,828.3 | 7,023.4 | 6,159.6 | |||||||||
| Other |
1,663.8 | 3,183.5 | 3,544.6 | |||||||||
| $ | 8,086.5 | $ | 14,972.5 | $ | 15,221.7 | |||||||
| Property, plant and equipment, net: |
||||||||||||
| United States |
$ | 814.6 | $ | 820.7 | $ | 621.1 | ||||||
| The Netherlands |
452.8 | 467.3 | 480.7 | |||||||||
| Other |
490.3 | 494.8 | 540.8 | |||||||||
| $ | 1,757.7 | $ | 1,782.8 | $ | 1,642.6 | |||||||
| Equipment on operating leases, net: |
||||||||||||
| United States |
$ | 686.6 | $ | 634.9 | $ | 464.4 | ||||||
| Germany |
362.7 | 358.4 | 243.3 | |||||||||
| United Kingdom |
349.7 | 290.9 | 342.8 | |||||||||
| Mexico |
186.7 | 212.4 | 186.6 | |||||||||
| Other |
431.3 | 463.5 | 570.8 | |||||||||
| $ | 2,017.0 | $ | 1,960.1 | $ | 1,807.9 | |||||||
| Business Segment Data: |
2009 | 2008 | 2007 | |||||||||
| Net sales and revenues: |
||||||||||||
| Truck |
$ | 7,388.6 | $ | 14,142.7 | $ | 14,295.7 | ||||||
| Less intersegment |
(394.6 | ) | (595.3 | ) | (441.4 | ) | ||||||
| Net Truck |
6,994.0 | $ | 13,547.4 | $ | 13,854.3 | |||||||
| All Other |
82.7 | 162.2 | 176.1 | |||||||||
| Truck and Other |
7,076.7 | $ | 13,709.6 | $ | 14,030.4 | |||||||
| Financial Services |
1,009.8 | 1,262.9 | 1,191.3 | |||||||||
| $ | 8,086.5 | $ | 14,972.5 | $ | 15,221.7 | |||||||
66
NOTES TO CONSOLIDATED FINANCIAL STATEMENTS
December 31, 2009, 2008 and 2007 (currencies in millions)
| Business Segment Data: |
2009 | 2008 | 2007 | ||||||
| Income before income taxes: |
|||||||||
| Truck |
$ | 25.9 | $ | 1,156.5 | $ | 1,352.8 | |||
| All Other |
42.2 | 6.0 | 32.0 | ||||||
| 68.1 | 1,162.5 | 1,384.8 | |||||||
| Financial Services |
84.6 | 216.9 | 284.1 | ||||||
| Investment income |
22.3 | 84.6 | 95.4 | ||||||
| $ | 175.0 | $ | 1,464.0 | $ | 1,764.3 | ||||
| Depreciation and amortization: |
|||||||||
| Truck |
$ | 277.2 | $ | 309.0 | $ | 261.4 | |||
| Financial Services |
350.8 | 329.4 | 252.7 | ||||||
| All Other |
10.1 | 11.0 | 12.3 | ||||||
| $ | 638.1 | $ | 649.4 | $ | 526.4 | ||||
| Expenditures for long-lived assets: |
|||||||||
| Truck |
$ | 324.2 | $ | 671.6 | $ | 562.3 | |||
| Financial Services |
646.0 | 859.4 | 671.7 | ||||||
| All Other |
.8 | 19.0 | 33.4 | ||||||
| $ | 971.0 | $ | 1,550.0 | $ | 1,267.4 | ||||
| Segment assets: |
|||||||||
| Truck |
$ | 3,849.1 | $ | 3,939.3 | $ | 3,846.7 | |||
| Other |
232.6 | 205.5 | 238.2 | ||||||
| Cash and marketable securities |
2,056.0 | 2,074.6 | 2,515.0 | ||||||
| 6,137.7 | 6,219.4 | 6,599.9 | |||||||
| Financial Services |
8,431.3 | 10,030.4 | 10,710.3 | ||||||
| $ | 14,569.0 | $ | 16,249.8 | $ | 17,310.2 | ||||
67
MANAGEMENT’S REPORT ON INTERNAL CONTROL OVER
FINANCIAL REPORTING
The management of PACCAR Inc (the Company) is responsible for establishing and maintaining satisfactory internal control over financial reporting. Internal control over financial reporting is a process designed to provide reasonable assurance regarding the reliability of financial reporting and the preparation of financial statements for external purposes in accordance with generally accepted accounting principles.
Internal control over financial reporting may not prevent or detect misstatements because of its inherent limitations. Projections of any evaluation of effectiveness to future periods are subject to the risk that controls may become inadequate because of changes in conditions, or that the degree of compliance with the policies and procedures may deteriorate.
Management assessed the Company’s internal control over financial reporting as of December 31, 2009, based on criteria for effective internal control over financial reporting described in Internal Control—Integrated Framework issued by the Committee of Sponsoring Organizations of the Treadway Commission. Based on this assessment, we concluded that the Company maintained effective internal control over financial reporting as of December 31, 2009.
Ernst & Young LLP, the Independent Registered Public Accounting Firm that audited the financial statements included in this Annual Report, has issued an attestation report on the Company’s internal control over financial reporting. The attestation report is included on page 69.
| /s/ Mark C. Pigott |
| Chairman and Chief Executive Officer |
REPORT OF INDEPENDENT REGISTERED PUBLIC ACCOUNTING FIRM ON
THE COMPANY’S CONSOLIDATED FINANCIAL STATEMENTS
The Board of Directors and Stockholders of PACCAR Inc
We have audited the accompanying consolidated balance sheets of PACCAR Inc as of December 31, 2009 and 2008, and the related consolidated statements of income, comprehensive income, stockholders’ equity, and cash flows for each of the three years in the period ended December 31, 2009. These financial statements are the responsibility of the Company’s management. Our responsibility is to express an opinion on these financial statements based on our audits.
We conducted our audits in accordance with the standards of the Public Company Accounting Oversight Board (United States). Those standards require that we plan and perform the audit to obtain reasonable assurance about whether the financial statements are free of material misstatement. An audit includes examining, on a test basis, evidence supporting the amounts and disclosures in the financial statements. An audit also includes assessing the accounting principles used and significant estimates made by management, as well as evaluating the overall financial statement presentation. We believe that our audits provide a reasonable basis for our opinion.
In our opinion, the financial statements referred to above present fairly, in all material respects, the consolidated financial position of PACCAR Inc at December 31, 2009 and 2008, and the consolidated results of its operations and its cash flows for each of the three years in the period ended December 31, 2009, in conformity with U.S. generally accepted accounting principles.
We also have audited, in accordance with the standards of the Public Company Accounting Oversight Board (United States), PACCAR Inc’s internal control over financial reporting as of December 31, 2009, based on criteria established in Internal Control—Integrated Framework issued by the Committee of Sponsoring Organizations of the Treadway Commission and our report dated February 26, 2010 expressed an unqualified opinion thereon.
| /s/ Ernst & Young LLP |
| Ernst & Young LLP |
Seattle, Washington
February 26, 2010
68
REPORT OF INDEPENDENT REGISTERED PUBLIC ACCOUNTING FIRM ON THE
COMPANY’S INTERNAL CONTROLS
The Board of Directors and Stockholders of PACCAR Inc
We have audited PACCAR Inc’s internal control over financial reporting as of December 31, 2009, based on criteria established in Internal Control—Integrated Framework issued by the Committee of Sponsoring Organizations of the Treadway Commission (the COSO criteria). PACCAR Inc’s management is responsible for maintaining effective internal control over financial reporting, and for its assessment of the effectiveness of internal control over financial reporting included in the accompanying Management’s Report on Internal Control Over Financial Reporting. Our responsibility is to express an opinion on the company’s internal control over financial reporting based on our audit.
We conducted our audit in accordance with the standards of the Public Company Accounting Oversight Board (United States). Those standards require that we plan and perform the audit to obtain reasonable assurance about whether effective internal control over financial reporting was maintained in all material respects. Our audit included obtaining an understanding of internal control over financial reporting, assessing the risk that a material weakness exists, testing and evaluating the design and operating effectiveness of internal control based on the assessed risk, and performing such other procedures as we considered necessary in the circumstances. We believe that our audit provides a reasonable basis for our opinion.
A company’s internal control over financial reporting is a process designed to provide reasonable assurance regarding the reliability of financial reporting and the preparation of financial statements for external purposes in accordance with generally accepted accounting principles. A company’s internal control over financial reporting includes those policies and procedures that (1) pertain to the maintenance of records that, in reasonable detail, accurately and fairly reflect the transactions and dispositions of the assets of the company; (2) provide reasonable assurance that transactions are recorded as necessary to permit preparation of financial statements in accordance with generally accepted accounting principles, and that receipts and expenditures of the company are being made only in accordance with authorizations of management and directors of the company; and (3) provide reasonable assurance regarding prevention or timely detection of unauthorized acquisition, use or disposition of the company’s assets that could have a material effect on the financial statements.
Because of its inherent limitations, internal control over financial reporting may not prevent or detect misstatements. Also, projections of any evaluation of effectiveness to future periods are subject to the risk that controls may become inadequate because of changes in conditions, or that the degree of compliance with the policies or procedures may deteriorate.
In our opinion, PACCAR Inc maintained, in all material respects, effective internal control over financial reporting as of December 31, 2009, based on the COSO criteria.
We also have audited, in accordance with the standards of the Public Company Accounting Oversight Board (United States), the consolidated balance sheets of PACCAR Inc as of December 31, 2009 and 2008 and the related consolidated statements of income, comprehensive income, stockholders’ equity, cash flows for each of the three years in the period ended December 31, 2009 and our report dated February 26, 2010 expressed an unqualified opinion thereon.
| /s/ Ernst & Young LLP Ernst & Young LLP |
Seattle, Washington
February 26, 2010
69
SELECTED FINANCIAL DATA
| 2009 | 2008 | 2007 | 2006 | 2005 | |||||||||||
| (millions except per share data) | |||||||||||||||
| Truck and Other Net Sales and Revenues |
$ | 7,076.7 | $ | 13,709.6 | $ | 14,030.4 | $ | 15,503.3 | $ | 13,298.4 | |||||
| Financial Services Revenue |
1,009.8 | 1,262.9 | 1,191.3 | 950.8 | 759.0 | ||||||||||
| Total Revenues |
$ | 8,086.5 | $ | 14,972.5 | $ | 15,221.7 | $ | 16,454.1 | $ | 14,057.4 | |||||
| Net Income |
$ | 111.9 | $ | 1,017.9 | $ | 1,227.3 | $ | 1,496.0 | $ | 1,133.2 | |||||
| Net Income Per Share: |
|||||||||||||||
| Basic |
.31 | 2.79 | 3.31 | 3.99 | 2.93 | ||||||||||
| Diluted |
.31 | 2.78 | 3.29 | 3.97 | 2.92 | ||||||||||
| Cash Dividends Declared Per Share |
.54 | .82 | 1.65 | 1.84 | 1.28 | ||||||||||
| Total Assets: |
|||||||||||||||
| Truck and Other |
6,137.7 | 6,219.4 | 6,599.9 | 6,296.2 | 5,359.5 | ||||||||||
| Financial Services |
8,431.3 | 10,030.4 | 10,710.3 | 9,811.2 | 8,355.9 | ||||||||||
| Truck and Other Long-Term Debt |
172.3 | 19.3 | 23.6 | 20.2 | 20.2 | ||||||||||
| Financial Services Debt |
5,900.5 | 7,465.5 | 7,852.2 | 7,259.8 | 6,226.1 | ||||||||||
| Stockholders’ Equity |
5,103.7 | 4,846.7 | 5,013.1 | 4,456.2 | 3,901.1 | ||||||||||
| Ratio of Earnings to Fixed Charges |
1.57x | 4.58x | 5.36x | 7.78x | 9.62x | ||||||||||
COMMON STOCK MARKET PRICES AND DIVIDENDS
Common stock of the Company is traded on the NASDAQ Global Select Market under the symbol PCAR. The table below reflects the range of trading prices as reported by The NASDAQ Stock Market LLC, and cash dividends declared. There were 2,273 record holders of the common stock at December 31, 2009.
| Quarter |
2009 | 2008 | ||||||||||||||||
| DIVIDENDS | STOCK PRICE | DIVIDENDS | STOCK PRICE | |||||||||||||||
| DECLARED | HIGH | LOW | DECLARED | HIGH | LOW | |||||||||||||
| First |
$ | .18 | $ | 32.04 | $ | 20.89 | $ | .18 | $ | 55.54 | $ | 41.14 | ||||||
| Second |
.18 | 35.83 | 26.14 | .18 | 53.81 | 41.36 | ||||||||||||
| Third |
.09 | 39.74 | 29.13 | .18 | 45.95 | 36.22 | ||||||||||||
| Fourth |
.09 | 39.68 | 35.31 | .18 | 37.99 | 21.96 | ||||||||||||
| Year-End Extra |
.10 | |||||||||||||||||
The Company expects to continue paying regular cash dividends, although there is no assurance as to future dividends because they are dependent upon future earnings, capital requirements and financial conditions.
70
QUARTERLY RESULTS (UNAUDITED)
| QUARTER | ||||||||||||
| FIRST | SECOND | THIRD | FOURTH | |||||||||
| (millions except per share data) | ||||||||||||
| 2009 |
||||||||||||
| Truck and Other: |
||||||||||||
| Net sales and revenues |
$ | 1,730.4 | $ | 1,602.3 | $ | 1,758.5 | $ | 1,985.5 | ||||
| Cost of sales and revenues |
1,561.1 | 1,492.8 | 1,646.5 | 1,783.0 | ||||||||
| Research and development |
52.3 | 52.8 | 43.4 | 50.7 | ||||||||
| Financial Services: |
||||||||||||
| Revenues |
255.8 | 246.6 | 252.5 | 254.9 | ||||||||
| Interest and other borrowing expenses |
91.3 | 73.0 | 66.7 | 60.8 | ||||||||
| Depreciation and other |
102.9 | 107.6 | 120.0 | 112.0 | ||||||||
| Net Income |
26.3 | 26.5 | 13.0 | 46.1 | ||||||||
| Net Income Per Share (1): |
||||||||||||
| Basic |
$ | .07 | $ | .07 | $ | .04 | $ | .13 | ||||
| Diluted |
.07 | .07 | .04 | .13 | ||||||||
| 2008 |
||||||||||||
| Truck and Other: |
||||||||||||
| Net sales and revenues |
$ | 3,621.0 | $ | 3,782.0 | $ | 3,682.1 | $ | 2,624.5 | ||||
| Cost of sales and revenues |
3,079.3 | 3,202.2 | 3,113.5 | 2,341.9 | ||||||||
| Research and development |
82.9 | 90.7 | 88.1 | 80.1 | ||||||||
| Financial Services: |
||||||||||||
| Revenues |
317.4 | 330.5 | 322.8 | 292.2 | ||||||||
| Interest and other borrowing expenses |
95.7 | 104.9 | 102.1 | 91.4 | ||||||||
| Depreciation and other |
107.9 | 112.5 | 113.1 | 104.3 | ||||||||
| Net Income |
292.3 | 313.5 | 299.0 | 113.1 | ||||||||
| Net Income Per Share (1): |
||||||||||||
| Basic |
$ | .80 | $ | .86 | $ | .82 | $ | .31 | ||||
| Diluted |
.79 | .86 | .82 | .31 | ||||||||
| (1) | The sum of quarterly per share amounts may not equal per share amounts reported for year-to-date periods. This is due to changes in the number of weighted shares outstanding and the effects of rounding for each period. |
71
MARKET RISKS AND DERIVATIVE INSTRUMENTS
(currencies in millions)
Interest-Rate Risks - See Note P for a description of the Company’s hedging programs and exposure to interest-rate fluctuations. The Company measures its interest-rate risk by estimating the amount by which the fair value of interest rate sensitive assets and liabilities, including derivative financial instruments, would change assuming an immediate 100 basis point increase across the yield curve as shown in the following table:
| Fair Value Gains (Losses) |
2009 | 2008 | ||||||
| CONSOLIDATED: |
||||||||
| Assets |
||||||||
| Cash equivalents and marketable securities |
$ | (2.4 | ) | $ | (1.4 | ) | ||
| TRUCK AND OTHER: |
||||||||
| Liabilities |
||||||||
| Fixed-rate long-term debt |
6.8 | .5 | ||||||
| FINANCIAL SERVICES: |
||||||||
| Assets |
||||||||
| Fixed-rate loans |
(40.1 | ) | (50.0 | ) | ||||
| Liabilities |
||||||||
| Fixed-rate term debt |
39.7 | 14.8 | ||||||
| Interest rate swaps related to financial services debt |
30.8 | 51.8 | ||||||
| Total |
$ | 34.8 | $ | 15.7 | ||||
Currency Risks - The Company enters into foreign currency exchange contracts to hedge its exposure to exchange rate fluctuations of foreign currencies, particularly the Canadian dollar, the euro, the British pound and the Mexican peso (See Note P for additional information concerning these hedges). Based on the Company’s sensitivity analysis, the potential loss in fair value for such financial instruments from a 10% unfavorable change in quoted foreign currency exchange rates would be a loss of $24.0 related to contracts outstanding at December 31, 2009, compared to a loss of $103.0 at December 31, 2008. These amounts would be largely offset by changes in the values of the underlying hedged exposures.
72