Attached files
Table of Contents
UNITED STATES
SECURITIES AND EXCHANGE COMMISSION
Washington, DC 20549
FORM 10-K
(Mark One)
| x | ANNUAL REPORT PURSUANT TO SECTION 13 OR 15(d) OF THE SECURITIES EXCHANGE ACT OF 1934 |
For the fiscal year ended December 31, 2009
or
| ¨ | TRANSITION REPORT PURSUANT TO SECTION 13 OR 15(d) OF THE SECURITIES EXCHANGE ACT OF 1934 |
For the transition period from to .
Commission File No. 001-32342
NALCO HOLDING COMPANY
(Exact name of registrant as specified in its charter)
| Delaware | 16-1701300 | |
| (State or other jurisdiction of Incorporation or Organization) |
(I.R.S. Employer Identification Number) |
1601 West Diehl Road
Naperville, IL 60563-1198
(630) 305-1000
(Address, Including Zip Code, and Telephone Number, Including Area Code, of Registrant’s Principal Executive Offices)
Securities registered pursuant to Section 12(b) of the Act:
| Title of each class | Name of each exchange on which registered | |
| Common Stock, $0.01 par value | New York Stock Exchange |
Securities registered pursuant to Section 12(g) of the Act:
None
Indicate by check mark if the registrant is a well-known seasoned issuer, as defined in Rule 405 of the Securities Act. Yes x No ¨
Indicate by check mark if the registrant is not required to file reports pursuant to Section 13 or Section 15(d) of the Act. Yes ¨ No x
Indicate by check mark whether the registrant (1) has filed all reports required to be filed by Section 13 or 15(d) of the Securities Exchange Act of 1934 during the preceding 12 months (or for such shorter period that the registrant was required to file such reports), and (2) has been subject to such filing requirements for the past 90 days. Yes x No ¨
Indicate by check mark whether the registrant has submitted electronically and posted on its corporate Web site, if any, every Interactive Data File required to be submitted and posted pursuant to Rule 405 of Regulation S-T (§232.405 of this chapter) during the preceding 12 months (or for such shorter period that the registrant was required to submit and post such files). Yes ¨ No ¨
Indicate by check mark if disclosure of delinquent filers pursuant to Item 405 of Regulation S-K (§229.405 of this chapter) is not contained herein, and will not be contained, to the best of registrant’s knowledge, in definitive proxy or information statements incorporated by reference in Part III of this Form 10-K or any amendment to this Form 10-K. ¨
Indicate by check mark whether the registrant is a large accelerated filer, an accelerated filer, a non-accelerated filer, or a smaller reporting company. See the definitions of “large accelerated filer”, “accelerated filer” and “smaller reporting company” in Rule 12b-2 of the Exchange Act.
Large accelerated filer x Accelerated filer ¨ Non-accelerated filer ¨
Indicate by check mark whether the registrant is a shell company, as defined in Rule 12b-2 of the Exchange Act. Yes ¨ No x
The aggregate market value of voting and non-voting common stock held by non-affiliates of the registrant as of June 30, 2009 was $2,289,363,225.
As of January 31, 2010, the number of shares of the registrant’s common stock, par value $0.01 per share, outstanding was 138,314,524 shares.
DOCUMENTS INCORPORATED BY REFERENCE
Portions of the registrant’s proxy statement (the “Proxy Statement”) for the annual meeting of shareholders to be held April 30, 2010 are incorporated by reference into Part III.
Table of Contents
NALCO HOLDING COMPANY
TABLE OF CONTENTS
| Part I | ||||
| Item 1. | 1 | |||
| Item 1A. | 18 | |||
| Item 1B. | 24 | |||
| Item 2. | 24 | |||
| Item 3. | 24 | |||
| Item 4. | 24 | |||
| Part II | ||||
| Item 5. | Market for Registrant’s Common Equity, Related Stockholder Matters and Issuer Purchases of Equity Securities |
25 | ||
| Item 6. | 27 | |||
| Item 7. | Management’s Discussion and Analysis of Financial Condition and Results of Operations |
30 | ||
| Item 7A. | 54 | |||
| Item 8. | 55 | |||
| Item 9. | Changes in and Disagreements with Accountants on Accounting and Financial Disclosure |
103 | ||
| Item 9A. | 103 | |||
| Item 9B. | 103 | |||
| Part III | ||||
| Item 10. | 104 | |||
| Item 11. | 104 | |||
| Item 12. | Security Ownership of Certain Beneficial Owners and Management and Related Stockholder Matters | 104 | ||
| Item 13. | Certain Relationships and Related Transactions, and Director Independence |
104 | ||
| Item 14. | 104 | |||
| Part IV | ||||
| Item 15. | 105 | |||
| Signatures | 111 | |||
Table of Contents
PART I
| ITEM 1. | BUSINESS |
Overview
Nalco Holding Company is the global leader in water, energy, air and process technologies and services that deliver savings for customers and improve the environment. Our principal executive offices are located at 1601 West Diehl Road, Naperville, Illinois, 60563.
On August 31, 2003, Nalco Holdings LLC, our subsidiary and a company formed by The Blackstone Group, Apollo Management, L.P. and GS Capital Partners (the “Sponsors”), entered into a stock purchase agreement pursuant to which it agreed to purchase all of the outstanding shares of capital stock of Ondeo Nalco Company (which is now known as Nalco Company) and the Nalco International SAS Subsidiaries, which had been operated as a single business unit, from subsidiaries of Suez S.A. (“Suez” or “Seller”). The Transactions closed on November 4, 2003. In this report, we refer to this acquisition as the “Acquisition,” and the term “Transactions” means, collectively, the Acquisition and the related financings to fund the Acquisition.
All references in this report to “Nalco, “ the “Company,” “we,” “our,” and “us” mean, unless the context indicates otherwise, (1) Nalco Holding Company and its subsidiaries and affiliates on a consolidated basis, (2) the Predecessor, and (3) the Successor. In addition, when the context so requires, we use the term “Predecessor” to refer to the historical operations of the Predecessor prior to the Acquisition and “Successor” to refer to our historical operations following the Acquisition.
3D TRASAR®, ADOMITE®, BrightWater®, Clean n Cor®, Essential Expertise for Water, Energy and AirSM, EXTRA WHITE™, Nalco 360™ , OxiPRO™, PARETO™, PORTA-FEED®, RO TRASAR®, SMART Solutions®, SULFA-CHECK®, SurFlo Certified®, TIORCO®, TRASAR®, ULTIMER®, UltraTreat®, VALUELINE®, VANTAGE®, and certain other products and services named in this document are our registered trademarks and service marks.
Our programs and services are used in water treatment applications to prevent corrosion, contamination and the buildup of harmful deposits and in production processes to enhance process efficiency, extend asset life, improve our customers’ end products, and enhance air quality. We also help our customers reduce energy, water and other natural resource consumption, minimizing environmental releases while improving their bottom line. Together our comprehensive solutions contribute to the sustainable development of customer operations.
Through our sales, service, research and marketing teams of more than 7,000 technically trained professionals, we serve nearly 50,000 customer locations in a broad range of end markets, including aerospace, chemical, pharmaceutical, petroleum, steel, power, food and beverage, medium and light manufacturing, marine and pulp and papermaking industries as well as institutions such as hospitals, universities and hotels. We focus on providing our customers with sustainable, technologically advanced, engineered solutions and services.
We have an established global presence with more than 11,500 employees working in more than 150 countries, supported by a comprehensive network of manufacturing facilities, sales offices and research centers. This global presence provides a competitive advantage by enabling us to offer a high level of service to our local, regional and multinational customers.
Our Competitive Strengths
Our Company has benefited from the following competitive strengths:
Leading Market Positions. We are the #1 provider of water treatment services to industrial and institutional end markets. We are also a leading provider of integrated water treatment and process
1
Table of Contents
improvement services, maintaining the #1 position in the petroleum and petrochemical markets and a #3 position in the pulp and paper market. We believe that our leading positions across our primary markets provide a competitive advantage in retaining existing business and competing for new business. Broader water markets, including additional industrial water application types and the full scope of municipal and agricultural water markets, are estimated by various sources to be several hundred billion dollars in total size.
Diverse Customers and Industries Served. We provide products and services to nearly 50,000 customer locations around the world, a reduced number from just a few years ago in part due to the impact of the economic recession on customer facility closures, but largely due to Nalco actions to turn over or sell large numbers of low-dollar accounts to distributors, agents or other channels to market.
In 2009, no single customer accounted for more than 4% of our net sales. Our business is also diversified geographically. In 2009, 48% of our net sales were to customer destinations in North America, 26% in Europe, Africa and the Middle East, 10% in Latin America and 16% in the Asia/Pacific region. We believe this diversification helps to lessen the impact of volatility from any one customer, industry or geographic area.
Global Reach. We have a direct sales and marketing presence in more than 150 countries across six continents. This enables us to provide a high level of service to local, regional and multinational customers. We believe our global presence offers us a competitive advantage to meet the global needs of our multinational customers, which are increasingly seeking single-source suppliers. This positions us to extend our reach to higher growth markets. Our geographic diversity also mitigates the potential impact of volatility in any individual country or region. In 2009, we derived approximately $2,228 million, or 59% of our net sales, from customer destinations outside the United States.
World Class Sales Team. Through the expertise of our more than 7,000 sales engineers and service technicians, we provide our customers with relevant industry knowledge and experience in order to solve technically challenging and dynamic problems. Our team of experts has significant experience, with more than 40% of our approximately 2,000-person North American sales team having more than ten years of service with our Company. We believe this contributes significantly to the number and strength of relationships with our customers. We also invest heavily in recruiting and continuously training our sales professionals. For example, new hires spend more than half of their first year on training. Sales and marketing expense was $880.2 million, $972.4 million, and $915.1 million for the years 2009, 2008 and 2007, respectively. Of those amounts, approximately 90% represented the cost of our sales force and related expenses during these time periods.
Integrated Technology, Sales and Service. We combine on-site service, innovative technology and engineering excellence to create value for our customers. Our technical sales professionals identify problems and opportunities at the customer’s plant and our research teams then work to develop effective solutions to these needs, often working jointly with our customers. Many of our customers specify our formulations into their processes and products. This approach has led to over 4,700 unique formulations, the development of more than 1,800 active patents worldwide and a high degree of customer loyalty.
Stable and Significant Cash Flow Generation. We have produced consistent cash flows and maintained high margins over a sustained period of time. We attribute this to (1) the diversity of our revenues, (2) the service nature of our business, (3) the high value we offer our customers, including through patented technology, (4) the strength of our customer relationships, (5) our limited dependency on any single raw material and (6) our low capital expenditures relative to our net sales.
Deep Management Team. Our senior management team consists of professionals with significant experience within our Company and the water treatment and industrial process improvement industry. J. Erik Fyrwald, a veteran of 28 years with E.I. du Pont de Nemours and Company, most recently as Group Vice President of its Agriculture and Nutrition Division, joined Nalco in 2008 as our Chairman,
2
Table of Contents
President and Chief Executive Officer. Bradley J. Bell, former Chief Financial Officer of Rohm and Haas Company, is our Executive Vice President and Chief Financial Officer. Our Energy Services and European divisions are led by Steve M. Taylor and David Johnson, respectively, both long-time Nalco veterans. Additionally, established industry veterans who joined the Company in 2008, David E. Flitman and Eric G. Melin, lead our Water and Process Services and Asia/Pacific divisions, respectively.
Our Business Strategy
We have established a recently modified six-part business strategy designed to focus internal resources on the issues and opportunities with the greatest opportunity to improve our performance for many years to come.
1. Improve Safety.
Given our exposure to critical processes through a wide range of industrial applications, we put a strong focus on our ability to ensure that we maintain the safety of our customers and our employees. In 2009, we maintained our Total Recordable Incident Rate at top quartile levels, recording 0.56 incidents per 100 workers while making significant gains in reducing total and severe vehicle accident rates. Improving our safety performance remains a critical objective of senior management.
2. Generate Focused, Profitable Growth.
We have historically experienced sales growth in excess of industrial production growth in our core markets. We are now pursuing a strategy designed to double our sales growth rate to a 6- to 8-percent range as a run rate by the end of 2011 from a historic growth rate of 3 to 4 percent that was calculated as excluding price increases designed to only offset higher raw material costs. The key elements of our sales growth strategy are:
| • | Pursue High-Growth Geographies. We intend to continue to focus on high-growth markets and segments, implementing a “BRIC+” strategy that prioritizes resources — particularly hiring and training sales engineers — to areas with the greatest growth potential. Over the long term, we believe Brazil, Russia, India and China are among the countries offering the highest growth potential. Modernization in those markets is expected to drive water treatment growth at a rate faster than industrial production. China and India were our top growth priorities in 2009, and we added 180 employees in those countries last year. The “+” part of the BRIC+ strategy is focused on markets with emerging or expanding oil and gas production, refining and petrochemical operations, including the Caspian, Middle East and West Africa. During 2009, Steve Taylor, President of Energy Services, relocated to Dubai to help drive success in these regions. |
| • | Maintain Technological Leadership. We invest to develop new technologies and products through a focused commitment to technology, research and development. The evolution of our existing products and the development of new technologies have historically allowed us to sustain and enhance the profitability of our business and further penetrate our target markets, including our existing customer base. For example, over the past 15 years we have developed several generations of our TRASAR automated feed and control technology for cooling water treatment programs. We launched the latest generation of this technology, our 3D TRASAR cooling water program, in 2004. In 2007, we extended our reach with this platform by introducing 3D TRASAR Technology for Reverse Osmosis membrane control. In 2009, we further expanded on this breakthrough technology concept by introducing 3D TRASAR Technology for Boilers and the Nalco Corrosion Stress Monitor™ for pre-boiler corrosion control in many industrial markets. Our engineers will continue to work closely with our customers in an effort to identify new product opportunities, jointly develop new technologies and accelerate penetration of this important automation offering. |
| • | Pursue High-Growth Industry Segments. While we have shown the ability to exceed market growth rates even in many mature markets through innovative technology and advanced engineering, monitoring and control services, we believe that selecting the right industries on |
3
Table of Contents
| which to focus resources helps us exceed underlying market growth rates. In the late 1990s, we decided to disproportionately invest in research, development and training resources to support fast growth in the deepwater oil production industry. As a result, we continue to exceed our average market share in our overall Energy Services business capture in deepwater and ultra-deepwater (UDW) sectors. In addition to substantial investments in internally developed technology, we continue to pursue technology ventures and acquisitions that expand the expertise we can bring to customers in growing segments. During 2008, we acquired TIORCO, Inc. to add reservoir-engineering expertise to our enhanced oil recovery offering, and GL OneSource to expand our natural gas production maximization offering. We also bought Data Mobility Systems to expand our engineered modeling capabilities to optimize performance of various customer processes and Veranum Tempus Engenharia to expand our indoor climate control capabilities. In 2009, we purchased Crossbow Water, expanding our capabilities in water pre-treatment technologies and services in the Midwest region of the United States. |
| • | Build Upon Our Customer Base. We seek to strengthen our position with our existing customer base as well as pursue new customers by continuing to serve as the leading global provider of fully integrated water treatment services and industrial process solutions, while building an air quality control platform. An essential element of our strategy is to continue integrating our sales and technical staff into our customers’ daily operations and process planning. Historically, this strategy has allowed us to expand our service and product offerings with existing customers and has led to the development of new technologies. We continually seek to add value for our customers by identifying those services, products and equipment that will enhance their profitability through reduced costs, improved yields and decreased capital spending — generally with substantial environmental benefits that include water use reduction, improved water quality, energy efficiency, waste reductions and air quality improvements. |
| • | Benefit from our Global Resource Advantage. As one of a small number of companies that can provide turnkey water management solutions on a global basis, we seek to leverage our relationships with multinational companies by servicing them globally. We expect to benefit significantly as larger customers further consolidate their supplier base and increase their reliance on full service providers, such as our Company. |
3. Increase Sales Time.
With more than 7,000 sales engineers and services technicians spread around the world, we must be vigilant in ensuring that our sales teams spend as much of their time as possible in front of customers identifying new performance improvement opportunities, creating solutions and selling new business. During 2009, we launched a Commercial Excellence project designed to free up sales engineers to focus on the best service and sales initiatives — in large part by reducing the amount of time spent on administrative tasks and in non-value-added travel. We began implementation of this project in some parts of the Company in 2009 and will extend this effort fully — with improved performance metrics to ensure that gains are lasting — during 2010.
4. Continue to Reduce Costs.
Our ongoing comprehensive cost productivity plan yielded savings in 2009 of $122 million, surpassing our increased annual goal of $100 million in savings. In addition, we gained $38 million of one-time expense reductions to address tight economic conditions. These one-time cost savings are largely expected to return to our operating expenses and costs of goods sold in 2010. Through work process redesign and other cost control initiatives, we achieved average annual savings of $84 million over the five years prior to 2009, during which our historic annual target was $75 million. We expect our cost reduction plan to achieve sustainable efficiencies using our Nalco Seven Steps process improvement methodology and the best of several other productivity improvement approaches. Our productivity improvement programs include focus on individual spending accountability, team- or department-based efficiency improvements, and mid-sized and larger transformational process improvements. All of these efforts
4
Table of Contents
target greater efficiencies in our sales, marketing, service, supply chain and corporate functions globally. We pay particular attention to ensuring that internal efficiency efforts are developed with a clear focus on improving customer service levels.
5. Generate Cash Flow.
We believe that there are significant opportunities to generate cash flow. We believe that the capital expenditures required to maintain our business are low relative to our sales, particularly compared to companies in the chemical industry. We generally expect capital expenditures at or near $120 to $170 million annually, with spending at the higher end of that range occurring if tied to specific customer contracts. In 2010, we expect to spend $140 to $170 million on capital expenditures, as we make up for projects delayed in 2009 and as we increase sales growth rates. In 2008 and 2009, net capital expenditures were $133.1 million and $102.2 million, respectively. Working capital management remains a source of opportunity for our Company, although significant progress was made in 2009. While management has historically focused on particular components of working capital, the large increase in raw material costs and commensurate price increases achieved to cover these costs had substantially driven up working capital requirements during the 2004 to 2008 timeframe. Through a new integrated business management approach, combined with improved Sales and Operations Planning processes, we began to reduce inventories meaningfully, taking 15 days out of Days Investment in Inventory in 2009 alone. During 2009, we also substantially reduced Days Sales Outstanding to levels last seen at year end prior to 2003. During the year ended December 31, 2009, we used cash flow from operations of $593.8 million for capital expenditures, a small acquisition, common stock dividends, and meaningful debt payments.
6. Strengthen our Future.
Several elements of our operations are critical to our long-term success, including training and developing our people, developing broader recognition of our global brand, increasing customer satisfaction through a broader and more thorough implementation of our Six Service Standards approach to customer service management, and development of ever-increasing value from our technology pipeline. All of these issues attract substantial and ongoing senior leadership attention.
Our Segments and Offerings
| Water Services | Paper Services | Energy Services | ||||
| Market | $6.5 billion global market (1)(2) | $7.3 billion global market (1) | $4.3 billion global market (1) | |||
| Positions | #1 Market Position | #3 Market Position | #1 Market Position | |||
| Market Share (3) | 18% | 9% | 33% | |||
| 2009 Net Sales | $1,662 million | $666 million | $1,418 million | |||
| Representative Markets |
Food, Beverage Buildings, Hotels, Hospitals Chemicals, Pharmaceuticals |
Fine Paper Uncoated Free Sheet Coated Free Sheet Newsprint Tissue and Towel Containerboard |
Well Stimulation & Completion Enhanced Oil Recovery Production Refining Petrochemical Fuel Additives | |||
| (1) | Approximate market size based on internal estimates and industry publications and surveys. |
| (2) | Represents the water treatment and services markets, which accounted for approximately 71% of our Water Services segment’s net sales in 2009. |
| (3) | Market share calculations include end-market allocations from an all-inclusive Emerging Market business unit within Water Services. |
Detailed results by Segment are available in Note 22 to our Consolidated Financial Statements.
5
Table of Contents
Water and Process Services
Our Water and Process Services Division encompasses two reporting segments — Paper Services, serving the pulp and paper industries, and Water Services, which focuses on customers across industrial and institutional markets. Within both segments, we provide water, air and process applications aimed at combining environmental benefits with economic gains for our customers. Typically, water savings, energy savings, maintenance and capital expenditure avoidance are among the primary sources of value to our customers, with product quality and production enhancement improvements also being a key differentiating feature for many of our offerings.
Our offerings are organized according to the markets we serve so we can address the unique drivers faced by each segment. Innovative treatment of boiler water, cooling water, influent, and wastewater, along with practical solutions for process improvements and pollutant control, allow our customers to capture benefits from our programs. Typically, these benefits are measured with a return on investment calculation that incorporates reductions in total costs of operation, capital expenditure avoidance and improvements in our customers’ product pricing. We serve customers in the aerospace, chemical, pharmaceutical, mining and primary metals, power, food and beverage, medium and light manufacturing, marine and pulp and papermaking industries as well as institutional clients such as hospitals, universities, commercial buildings and hotels. Our Paper segment offers a comprehensive portfolio of programs that are used in all principal steps of the papermaking process and across all grades of paper, including graphic grades, board and packaging, and tissue and towel. We have typically served our largest customers in Water and Process Services for 15 years or longer. Our Water Services segment generated net sales of $1,662.4 million in 2009, representing 44% of net sales. Our Paper Services segment generated 2009 net sales of $666.0 million, representing 18% of our net sales.
Water Treatment Applications
Our water treatment capabilities are applied across our divisions. In the Water Services segment, water treatment programs accounted for 71% of net sales in 2009. Water applications accounted for 15% of net sales in our Paper Services segment. In our Energy Services segment, water applications accounted for 15% of net sales in 2009. The following descriptions include water treatment applications used across all of our segments.
Boiler Water Applications. Nalco is the world leader in boiler water treatment technology. We have more than 80 years of experience in this core area and continue to invest and innovate to enhance reliability, reduce water use and improve efficiency for our customers. Corrosion and scale buildup are the most common problems addressed by our boiler water treatment programs. We have helped our customers overcome various boiler system challenges by providing integrated chemical solutions, process improvements and mechanical component modifications to optimize boiler performance. In 2009, we expanded introduction of 3D TRASAR Technology for Boilers and the Nalco Corrosion Stress Monitor to most industrial markets — adding cutting-edge automation and control capabilities to our offering.
Cooling Water Applications. Our cooling water treatment programs are designed to control the main problems associated with cooling water systems — corrosion, scale and microbial fouling and contamination — in open recirculating, once-through and closed systems. Our 3D TRASAR technology for cooling water is the world’s first automated system for simultaneous control of corrosion, scale and microbial fouling and contamination. This multi-patented combination of services, equipment, chemistry, automation and control was recognized with a United States Presidential Green Chemistry Challenge Award in 2008.
Raw Water/Potable Water Preparation. Our programs assist customers making potable water or water for plant processes by optimizing the performance of treatment chemicals and equipment in order to minimize costs and maximize return on investment. Nalco offers a number of creative solutions, helping meet the most stringent water quality requirements. Some applications include treatment of natural water sources for drinking water, boiler makeup, cooling tower makeup and other industrial processes,
6
Table of Contents
as well as treatment and servicing of wastewater treatment plants to help meet environmental standards for discharges to municipal systems or directly to the environment.
Wastewater Applications. Our wastewater products and programs focus on improving overall plant economics, addressing compliance issues, optimizing equipment efficiency and improving operator capabilities and effectiveness. This is accomplished by a team of highly trained sales engineers, marketers, and technical support staff members along with innovative programs, such as our water-based ULTIMER polymers, for which Nalco won a United States Presidential Green Chemistry Challenge Award and a Research and Development 100 Award in 1999.
Wastewater treatment has traditionally been viewed typically as “end of pipe,” or as one combined stream. However, because Nalco takes a holistic approach to integrated water system management, we identify innovative ways to isolate and treat particular waste streams. We combine practical engineering approaches and hands-on knowledge of system operations to design, build, operate and/or maintain the optimal reuse solution for each application and customer.
Water Reuse and Recycling. As demands for better water stewardship increase throughout the world, Nalco is cognizant of the need for effective management of this precious resource in industrial operations. This includes understanding all water uses in an industrial complex, water conservation programs, development of innovative ways to treat single or combined wastewater streams, and recycling of water to improve water and energy efficiency.
Nalco understands all of the uses of water within an industrial complex, from water for utilities to facility management to process applications. We have proprietary knowledge and tools to increase customers’ awareness of water usage in either an individual facility or across several facilities. Additionally, we effectively document best practices across several regions and industries to benchmark consumption and also to identify key areas for conserving water and energy.
Clean Air Technologies
Nalco’s 2007 acquisition of an 87.5% interest in Mobotec USA, Inc., led to the formation of Nalco Mobotec, which provides innovative solutions to the world’s global air pollution challenges and offers practical approaches for the control of nitrogen and sulfur oxides (NOx /SOx), carbon monoxide, mercury and particulates. Nalco Mobotec’s patented solutions can accommodate fuel flexibility, biomass conversions, or co-firing in boilers. Instead of requiring major capital equipment purchases, its engineered solutions approach optimizes current assets. In addition to air quality improvements, Nalco Mobotec’s technologies can increase combustion efficiency — saving on energy costs and reducing greenhouse gas releases.
Pulp and Papermaking Applications
Today’s pulp and papermakers are under constant pressure to improve the overall efficiency of their operations in the face of excess capacity, shifting market demand for their finished products and escalating costs. To help our customers excel, we developed our SMART Solutions offering, a grade-based approach for improving customers’ end-product performance and optimizing operational efficiency.
Pulp Applications. Careful management of fiber and energy resources is critical to both the quality and the efficiency of the pulping operation, especially when wood and energy costs force manufacturers to use variable sources of fiber. Our SMART Solutions for Fiber and Energy Management provide pulp manufacturers the answers to help increase efficiency, improve pulp quality and decrease the total cost of operation.
Whether it is the mechanical, chemical, or de-inked pulping process, our programs and services are designed and tailored to meet the individual customer’s needs for every phase of the pulping and
7
Table of Contents
bleaching process. Our programs maximize process efficiency and increase pulp cleanliness and brightness in bleaching operations, as well as predict and monitor scaling potential utilizing on-line monitoring to design effective treatment programs and avoid costly failures.
Paper Applications. Our paper process applications focus on the key business drivers that our customers determine are critical to the success of their business. For example, manufacturers of board and packaging, graphic papers, and tissue and towel have very different customer needs. Maintaining strength in board and packaging is achieved very differently from the softness demanded by consumers of tissue and towel products. Different paper segments also have varying needs based on current market trends. Some may need to maximize production rates and optimize finished quality while others may need to improve operating efficiencies and reduce total cost of operations.
We integrate the entire papermaking process through mechanical, operational and chemical means to concentrate specifically on what our customers need to succeed in their market segments and improve overall their operational efficiency. Advanced sensing, monitoring and automation combine with innovative chemistries and detailed process knowledge to provide a broad range of customer solutions.
Our PARETO Technology for Wet-End Optimization improves and optimizes the delivery of retention aid chemicals to the paper machine while minimizing water and energy use for improved environmental performance. OxiPRO Technology for Deposit Control uses a combination of proactive monitoring tools, individually tailored chemistry strategies, and local application expertise to reduce sheet defects, improve runnability and increase paper machine uptime. EXTRA WHITE Technology for Brightness delivers cost-effective brightness and whiteness development in an environmentally friendly and safe manner, while having a positive impact on operational efficiency as compared to traditional brightness development methods.
Mining and Mineral Processing Applications
We provide a wide range of quality products, programs and services to help the mining and mineral processing industry improve product quality and productivity in a safe and environmentally responsible manner. Specifically, these offerings help increase recovery of the valued mineral, improve water quality for re-use or discharge to the environment, reduce contaminants in our customers’ products, increase plant throughput/utilization, reduce energy consumption, increase equipment life through scale and corrosion control and reduce or eliminate dust. The industries we serve include alumina and bauxite, coal, copper, precious metals, iron ore, aggregates, kaolin, phosphate, and soda ash.
Colloidal Technologies Applications
We invented and patented a commercial process for the production of stable concentrated silica solutions in 1941. Today, we operate one of the single largest colloidal silica facilities in the world, and our broad range of colloidal silica products, other specialty colloidal particles and complementary process chemicals are used in the polishing of silicon wafers, semiconductor chips, memory disks and other electronic substrates; in the manufacture of catalyst supports, vacuum formed shapes, high temperature refractories and specialty coatings; and in the precision investment casting of metal parts.
Membrane Technologies Applications
Membrane technology is being adopted at an ever-increasing rate as a cost-effective technology for purifying water for both industrial and potable applications. Our products address the needs of all types of membrane systems, ranging from seawater desalination and well and surface water purification, to advanced water recycle processes and wastewater treatment.
Environmental Hygiene Services
We offer a complete line of specialized water hygiene services designed to assess, control and reduce risk from water-borne pathogens such as Legionella. Trained hygiene service specialists perform risk
8
Table of Contents
assessments to identify areas within water systems that could be at risk for pathogen proliferation. We then develop a site-specific, prioritized recommendation plan to reduce the risk of pathogen exposure that can lead to illnesses such as Legionnaires’ Disease. Our water system Cleaning & Disinfection services remediate sources of pathogen risk. We also offer Pathogen Analytical services to measure program performance. Our protocols aim to help customers comply with guidelines created by professional organizations, state and federal government agencies, and local governments.
Energy Services
Our Energy Services division provides on-site, technology-driven solutions to the global drilling, oil and gas production, refining, and petrochemical industries. In addition to recovery, production and process enhancements, we deliver a full range of water treatment offerings to refineries and petrochemical plants. Our upstream process applications improve oil and gas recovery and production, extend production equipment life and decrease operating costs through services that include scale, paraffin and corrosion control, oil and water separation, and gas hydrate management solutions. Our downstream process applications increase refinery and petrochemical plant efficiency and the useful life of customer assets, while improving refined and petrochemical product quality and yields. We continue to emphasize safety and environmental leadership in our product development and implementation efforts. Our customers include nearly all of the largest publicly traded oil companies. Our 10 largest Energy Services customers in 2009 have been with us for more than 10 years, with most more than 20 years. Our Energy Services division generated 2009 net sales of $1,418.4 million, representing 38% of our net sales.
The Energy Services division is divided into a Downstream refinery and petrochemical processing service business and an Upstream group composed of our Oilfield Chemicals and Adomite businesses.
Well Stimulation and Completion
Our Adomite group offers a range of product solutions specifically designed to enhance performance even in the most severe environments. We supply chemicals for the cementing, drilling, fracturing and acidizing phases of well drilling and stimulation. Our integrated approach to product development combines marketing and research efforts supported with process simulation, pilot plants and full-scale manufacturing capabilities. In addition, we are committed to the development of sustainable solutions to meet the demanding environmental requirements in the industry.
Oilfield Applications
Nalco’s Oilfield Services Group is the recognized, global leader in providing solutions to the oil and gas production sector. We have expertise in crude oil and natural gas production, pipeline gathering/transmission systems, gas processing, and heavy oil and bitumen upgrading. Our priority is to safely manage the critical challenges facing today’s oil and gas producers throughout the lifecycle of their assets. Starting with the design/CAPEX phase to asset decommission, a lifecycle approach to chemical solutions and services helps our customers minimize risk, achieve their production targets and maximize profitability.
As onshore oil reserves become increasingly difficult to recover, producers are relying more on deepwater and ultra-deepwater (UDW) operations for new discoveries. Nalco offers comprehensive services to support our customers’ deepwater and UDW operations worldwide. Our three-tiered approach includes an experienced project-development engineering team committed to saving our customers time and money on their CAPEX projects, dedicated research and development efforts for industry technical leadership and an extensive manufacturing certification program to ensure chemical integrity.
The Nalco Manufacturing Certification Program represents a paradigm shift in quality assurance in terms of SAE specifications and other built-in checks and balances to assure that our product reaches
9
Table of Contents
our customers’ umbilicals uncompromised. Our SurFlo Plus certification seal is an assurance of chemical integrity to overcome asphaltene, paraffin, corrosion, scale, hydrate and emulsion-viscosity problems.
Nalco’s Asset Integrity team uses industry-leading processes and technologies to help producers mitigate corrosion. We work with our customers to utilize state-of-the-art laboratory methods to design best-in-class chemistries like our Clean n Cor technology, and we monitor oil and gas systems to track the success of corrosion mitigation programs. We also deploy the latest molecular monitoring tools to measure and control microbiological influenced corrosion (MIC) and provide environmentally friendly chemistries worldwide.
Enhanced Oil Recovery
In 2008 we formed a joint venture with Stepan Company to globally market custom-engineered chemical solutions that increase production of crude oil and gas from existing fields. Operating under the TIORCO brand, the company integrates enhanced oil recovery (EOR) processes by leveraging TIORCO’s 30 years of experience in EOR polymer and reservoir expertise, Nalco’s extensive reach in global upstream energy markets and Stepan’s global surfactant technology and manufacturing capabilities. Customers receive seamless sales and service with the first unified approach to the EOR market — identifying, evaluating and implementing solutions that optimize oil recovery. TIORCO markets our proprietary BrightWater Reservoir Sweep Efficiency Technology that was jointly developed with major oil companies. Early applications of BrightWater have demonstrated crude oil production increases of 25% to 80% in test wells.
Downstream Refining Applications
Our industry-focused sales engineers provide process and water treatment applications specific to the petroleum refining and fuels industry, enabling our customers to profitably refine and upgrade hydrocarbons. Our heavy oil upgrading programs minimize operation costs and mitigate fouling, corrosion, foaming and the effects of heavy metals when refining opportunity crudes.
Our total systems approach to water and process enables our customers to minimize energy use on the utilities side. With advances in monitoring, chemistry and application, 3D TRASAR technology for cooling water has reduced shutdowns for customers, resulting in maximum operational efficiency. Following successful trials in 2009, the rollout of 3D TRASAR Boiler Technology is scheduled for 2010. Increased boiler system reliability, reduced total cost of operation, and significant energy and water savings are key benefits delivered by this state-of-the-art technology.
Clean fuels regulations require drastic reduction in the level of sulfur allowed in fuels. Our H2S Scavengers, such as the SULFA-CHECK system, help our customers to comply with all regulatory standards. We offer an entire line of fuel additives, including corrosion inhibitors, to protect engine fuel systems and pre-market underground storage tanks and piping. In addition, we offer fuel stabilizers, pour point depressants, cetane improvers, detergents and antioxidants for home heating oil and premium diesel and gasoline packages.
Downstream Chemical Processing Applications
Nalco has 30+ years of experience in petrochemical plant operations. We work with customers globally to overcome the increasing challenges associated with capacity increases, plant revamps and constantly changing feedstocks. Our customized process and water treatment programs are delivered by onsite technical experts who are focused on providing improved system reliability, reduced total cost of operations, environmental compliance, sustainability in the form of energy and water savings and reduced carbon emissions.
10
Table of Contents
Water Treatment Applications
We provide total water management solutions specific to customers’ refining and chemical processing needs including boiler treatment, cooling water treatment and wastewater treatment. See “— Water and Process Services — Water Treatment Applications.”
Our Services
Our business is focused on providing integrated solutions to complex issues for our customers. These solutions are often adapted on-site by our technical sales professionals, and our sales teams are supported by a variety of innovative service offerings.
Analytical Services
Our highly trained analytical researchers combine in-field work and laboratory analysis to develop recommendations. Our ISO 9001:2000-certified laboratories use state-of-the-art equipment, including mass and nuclear magnetic resonance spectrometers and scanning electron microscopes, to conduct sample testing and process failure analysis for a range of water treatment and process applications. We have provided analytical services for more than 50 years and our more than 100 analytical researchers have an average of more than 10 years of experience in this field.
Consulting Services
Our on-site experts, industry technical consultants and researchers develop appropriate solutions for a broad range of customer requirements, such as single process optimization, system-wide program implementation, troubleshooting or increasing efficiencies. We provide numerous plant, process and application audits and surveys in water, energy or paper processing. We offer consulting for all water use and discharge areas and make recommendations for improvements, cost reductions or efficiency improvements through our Advanced Recycle Technology programs. Our technically trained sales professionals can also rely on guidance from a global knowledge management system that allows access to our specialized experts anywhere in the world. We take a multi-disciplinary approach to developing solutions by evaluating the mechanical, operational and chemical aspects of each process. By monitoring interactions among these three system components, our field engineers are able to anticipate and solve problems and prevent damage to customer processes. We utilize advanced database and computer analytical programs to support these efforts, including our VANTAGE database, which captures analytical data, prepares diagnostic images and reports on a real-time basis.
Eco-Efficiency Services
Nalco’s Eco-Efficiency Services deliver impactful, step-change improvements in our customers’ operations. We combined our knowledge of industrial best practices with a proprietary approach to identify and implement improvements to effectively maximize the achieve customer objectives around water use optimizations, energy efficiency (water, utility, and process areas), waste minimization and beneficial disposition, and greenhouse gas reduction. Through our total systems approach, we effectively identify and implement creative solutions to address our customers’ most pressing needs through a detailed opportunity assessment, improvement plan development, and effective solution implementation.
Predictive Modeling Services/DMS
Nalco owns Data Mobility Systems (DMS), a software and engineering firm that uses Advanced Modeling Systems (AMS) to predict water treatment needs and gas turbine maintenance for owners, developers and engineers. We are able to supply information based on data that can range from a bare minimum of data at a project’s inception through to in-depth review using detailed water analysis.
DMS has consulted on over 400 systems in various capacities and our information has been used for over $24 billion of new power plant investment globally. Additionally, DMS has already programmed AMS,
11
Table of Contents
our modeling software, with the information to create plants virtually. From simple designs to the much more complex operations that can involve several recirculation loops, AMS is a powerful method of improving information used to make better decisions.
Nalco 360 Remote Monitoring Services
Our team of Nalco experts is able to monitor our customers’ water systems 24 hours a day, 7 days a week, 365 days a year, ensuring the highest level of expertise is always available to monitor and treat a system. The Nalco 360 Expert Center routinely makes recommendations for operational improvements and will also take immediate action on alarms. All of our expert center professionals hold degrees in Chemistry or Chemical Engineering and have real world experience in water treatment.
More than 80 years of water treatment expertise drives our comprehensive, on-going training program, resulting in a team of highly trained specialists. Our system helps our customers with water and energy savings, while making efficient use of chemistry is taken to the next level through the use of the Nalco 360 program.
Technical and Field Services
We provide expert technical assistance for chemical feed and control equipment installation, start-up, calibration, preventative maintenance and repair throughout the world. In addition to the components we maintain regionally, we provide on-site services, including on-site testing, on-site system troubleshooting, inventory management, chemical usage determination, chemical dosage audits and cleaning services.
Customer Training
To educate our customers and promote more efficient and effective systems and processes in their operations, we have developed various classroom and online training programs that teach operators and engineers how to work more effectively and efficiently. We conduct water treatment seminars to formally train our customers how to use our equipment and chemicals and how to implement best practices. These water treatment workshops are held in a classroom setting, allowing attendees to discuss technical and industry-related issues among their peers and to review tailored answers to their operation-specific questions. Facilitators guide the attendees through various topics such as trending, energy management, cost implications, and best practices. These peer group discussions help the attendees troubleshoot and create informal support networks. Our interactive, Web-based program, Nalco Customer University, provides an economical and convenient alternative to our classroom seminars.
Equipment
We offer complete equipment systems as part of our integrated offering, ranging from reusable shipping containers and feed and process control equipment to integrated wireless, Web-based, data collection services. In addition, we offer a range of field test kits, process-monitoring equipment, and complete chemical feed and storage systems proven and tested for industrial environments.
We recognize the importance of accurate, reliable chemical feed to the success of manufacturing process and water treatment programs. Pre-packaged chemical feed systems ensure easy installation, start-up and reliable chemical feed, including our ValueLine Polymer Feeders and a line of modular pump and control systems. These chemical feed systems are used to pump chemicals into a customer’s manufacturing and/or water treatment process. Some feed systems also have mixing technologies that produce high-quality solutions without using mechanical agitators. Additionally, we have set the standard for returnable chemical delivery systems and “hands-off” chemical handling. Our PORTA-FEED units are returnable shipping containers set up at a customer’s plant to feed our chemicals into the customer’s system. When the chemical level is low, a refill unit is delivered to the plant and we take the
12
Table of Contents
empty PORTA-FEED unit back for cleaning and re-use. Since the introduction of the PORTA-FEED program in 1985, we have eliminated the disposal of over four million chemical drums.
We also understand that it is crucial to all businesses to have the power to monitor and control their chemical treatment programs on an on-going basis in an efficient and easy-to-use manner. We have developed equipment that works with our innovative TRASAR and 3D TRASAR technology to provide real-time, on-line monitoring of actual chemical levels in a system. Through our TRASAR system, we chemically “bar-code” treatment molecules with a fluorescent tracer that reacts to specific light wavelengths. Once in the system, the tracer is optically excited and detected. Our equipment monitors the level of chemicals and continuously makes automatic adjustments as necessary through chemical injection systems linked to the TRASAR or 3D TRASAR controller. By preventing overfeeding and underfeeding, and eliminating the unnecessary application of chemicals, this real-time, on-line monitoring capability saves water and energy as well as improves efficiency, reliability and productivity.
We offer integrated UltraTreat systems that include industrial reverse osmosis systems, water softening equipment, multi-media and carbon filtration and high efficiency filters.
Joint Ventures
During our history, we have entered into general partnerships or joint ventures for limited scope business opportunities. We have a joint venture with Siemens Water Technologies Inc., Treated Water Outsourcing, to pursue process water treatment outsourcing projects and to supply standard water treatment equipment packages with our chemicals and service offerings. In June 2004, we entered into a joint venture with Katayama Chemical, Inc., or KCI, for the marketing and sale of our water treatment and process chemicals in Japan. KCI is a leading participant in these markets in Japan and the venture permits the combination of our broad product portfolio with KCI’s strong market presence. This joint venture does not include manufacturing, research and administrative resources, which are provided to the joint venture by the parents. In 2008 we formed a joint venture with Stepan Company operating under the TIORCO brand to globally market custom engineered chemical solutions for increased production of crude oil and gas from existing fields. The joint venture is equally owned and controlled by Nalco and Stepan. The two partners will capture most of the value generation directly. Additionally, we maintain longstanding partnerships in Saudi Arabia, relating to base-water treatment, and in Spain, relating to oil-free emulsion polymers.
We will continue to evaluate the potential for partnerships and joint ventures that can assist us in increasing our geographic, technological and product reach. For example, we continue to evaluate partnerships that will expand our offerings to our middle market customers and that will permit us a more significant local identity in certain Asian countries.
Competition
Water management and process improvement service companies compete on the basis of their demonstrated value, technical expertise, chemical formulations, consulting services, detection equipment, monitoring services, and dosing and metering equipment. In general, the markets in which our Company competes are led by a few large companies, with the rest of the market served by smaller entities focusing on more limited geographic regions.
The market for water treatment chemicals is highly fragmented, but is led by our Company. The remainder of the market is comprised of mainly regional and local players, with GE Water Technologies, the Ashland Hercules Water Technologies business of Ashland Inc., Danaher Corporation’s ChemTreat business, and Kurita Water Industries Ltd. present in two or more regions. Regional service providers tend to be modestly sized and focus either on a limited geographic region or a smaller subset of products and services. Collectively, local players have the largest share of the market, but are individually much smaller and tend to focus on servicing local businesses typically requiring less sophisticated applications.
13
Table of Contents
The largest participants in the energy services sector are our Company, the Baker Petrolite Division of Baker Hughes Corporation, GE Water Technologies and Champion Technologies, Inc. The remainder of the market consists of smaller, regional niche companies focused on limited geographic areas.
The market for specialty and water treatment chemicals used in the pulp and paper industry is fragmented. The top suppliers of water treatment services to the pulp and paper industry are our Company, the Ashland Hercules Water Technologies business of Ashland Inc., Kemira Oyj, Akzo Nobel N.V.’s EKA Chemicals AB and BASF AG’s Paper Chemicals business. The remainder of the market is comprised of smaller, regional participants.
Research and Development
We benefit from a high quality research and development effort consisting of more than 560 personnel worldwide, more than 250 of whom have Ph.D.s, dedicated to developing new technology and providing support. Our laboratories, which are located in the United States, the Netherlands, China and Singapore, are involved in the research and development of chemical products and in providing technical support, including chemical analyses of water and process samples. Research and development spending was $74.6 million, $73.5 million and $65.8 million and for the years ended December 31, 2009, 2008 and 2007, respectively. In recent years, we have received numerous research and development awards, including a United States Presidential Green Chemistry Achievement Award in 2008 for our 3D TRASAR technology for cooling water.
We believe that continued research and development activities are critical to maintaining our leadership position within the industry and will provide us with a competitive advantage as we seek additional business with new and existing customers.
Intellectual Property
We own or have licenses to use a large number of patents relating to a large number of products and processes. We currently have nearly 550 patents in the United States and more than 1,800 worldwide with remaining durations ranging from less than one year to 20 years. The average remaining duration is approximately 10 years. We also have nearly 300 registered U.S. trademarks covering our products. Our rights under such patents and licenses and trademarks are of significant importance in the operation of the business. Patents related to our TRASAR and 3D TRASAR technology and trademarks related to Nalco Company, 3D TRASAR and BrightWater are considered material to our business. U.S. and foreign patents protect aspects of our key TRASAR and 3D TRASAR technology until at least 2024. The Nalco Company, 3D TRASAR and BrightWater trademarks are registered or applied for in all of our key markets, and we anticipate maintaining them indefinitely. We believe that no other patent, trademark or license is material to our business.
Raw Materials
We purchase more than 7,000 raw materials, with the largest single raw material representing less than 1% of sales, or less than 3% of raw material purchases. The principal raw materials purchased by us are ordinarily available in adequate quantities from several sources of supply in the United States and foreign countries. While single raw material purchases are not significant to us, we do purchase similar categories of products in many cases. Four categories of raw material purchases each represented more than 10% of our total North American purchases in a recent analysis: Organics; Monomers; Polymers; and Solvents, Oils and Alcohols. Our raw material purchases also include a variety of amines, surfactants, biocides, inorganics, salts, packages, bases, defoamers, fatty acids and phosphonates, among many other types of materials. For the years ended December 31, 2009, 2008 and 2007, we purchased direct materials valued at $881 million, $1,265 million and $1,126 million, respectively. In addition to lower costs of materials and reduced sales, inventory reductions contributed to the decline in direct material purchases in 2009. Joint ventures consolidated by us made direct material purchases valued at $76 million, $88 million and $80 million in the years ended December 31, 2009, 2008 and 2007, respectively.
14
Table of Contents
Employees
As of December 31, 2009, we had approximately 11,590 employees, of whom approximately 4,655 were employed in North America, approximately 2,780 were employed in Europe, the Middle East and Africa, approximately 1,650 were employed in Latin America and approximately 2,505 were employed in the Pacific region. We consider relations with our employees to be good.
Environmental Matters
Governmental provisions regulating the discharge of materials into the environment or otherwise relating to the protection of the environment, have had, and will continue to have, an effect on us and on our operations. Under some environmental laws, we may be jointly and severally liable for the costs of environmental contamination on or emanating from our properties and at off-site locations where we disposed or arranged for the disposal or treatment of regulated materials, and may also incur liability for damages to natural resources. We have made and continue to make expenditures for projects relating to the environment. We are currently identified as a potentially responsible party at certain contaminated waste disposal sites. We do not anticipate that these matters will result in material liabilities; however, there can be no assurance that discovery of previously unknown conditions or other circumstances will not require significant expenditures by us.
We do not believe that compliance with individual environmental protection laws and regulations will have a material effect upon our capital expenditures, earnings or competitive position, although there can be no assurance to that effect. However, increased air and water environmental enforcement in developing countries, implementation of greenhouse gas controls in various regions of the world and requirements on industry to improve environmental performance through the European Union’s Integrated Pollution Prevention and Control directive all are supportive of Nalco’s environmental performance improvement/sustainable development business approach. Agency delays in issuing proposed revisions to the Clean Air Interstate Rule and Clean Air Mercury Rule have temporarily reduced customer interest in the air protection offerings of Nalco Mobotec.
Our capital expenditures for environmental control facilities during 2009 and future periods are not presently expected to be material to us. We believe that any liability that may result from the resolution of environmental matters for which sufficient information is available to support cost estimates will not have a material adverse effect on our financial position or results of operations. However, we cannot predict the effect on our financial position of expenditures for aspects of certain matters for which there is insufficient information. In addition, we cannot predict the effect of compliance with environmental laws and regulations with respect to unknown environmental matters or future environmental requirements on our financial position, results of operations, liquidity or cash flow.
We have been named as a defendant in multi-party lawsuits based on our claimed involvement in the supply of allegedly hazardous materials. The plaintiffs seek damages for alleged personal injury or the potential of personal injury resulting from exposure to various chemicals. These matters have had de minimis impact on our business historically, and we do not anticipate that these matters present any material risk to our business or competitive position in the future. Notwithstanding our past experience, we cannot predict with certainty the outcome of any such tort claims or the involvement we might have in such matters in the future.
We are also subject to a variety of regulations relating to the production and handling of our products, as well as the conduct and condition of our production facilities. We do not believe that these regulatory requirements will have a material effect on capital expenditures, earnings or competitive position. Chemical registration regulations in the European Union, referred to as REACH, will result in additional costs to us and our competitors. These costs are presently not anticipated to materially impact earnings or our competitive position and we have developed a program to meet the regulations.
15
Table of Contents
Executive Officers
| Name |
Title |
Age | ||
| J. Erik Frywald |
Chairman, President and Chief Executive Officer | 50 | ||
| Bradley J. Bell |
Executive Vice President and Chief Financial Officer | 57 | ||
| David E. Flitman |
Senior ExecutiveVice President and President, Water and Process Services Division | 45 | ||
| David Johnson |
Executive Vice President and President, Europe, Africa and Middle East | 49 | ||
| Mary Kay Kaufmann |
Chief Marketing Officer and Group Vice President, Commercial Operations, Water and Process Services Americas | 50 | ||
| Eric G. Melin |
Executive Vice President and President, Asia Pacific | 49 | ||
| Dr. Manian Ramesh |
Chief Technology Officer | 52 | ||
| Steve M. Taylor |
Executive Vice President and President, Energy Services Division | 47 |
J. Erik Fyrwald has been our Chairman, President and Chief Executive Officer since February 2008. From 2003 to 2008, Mr. Fyrwald served as Group Vice President of the Agriculture and Nutrition division of E.I. du Pont de Nemours and Company.
Bradley J. Bell has been our Executive Vice President and Chief Financial Officer since joining us in November 2003. From 1997 to 2003, Mr. Bell served as Senior Vice President and Chief Financial Officer of Rohm and Haas Company.
David E. Flitman became our Senior Executive Vice President and President, Water and Process Services division, effective January 1, 2010. Prior to joining Nalco in August 2008 as Executive Vice President and President, Water and Process Services, Mr. Flitman was President of Allegheny Power, the energy delivery arm of Allegheny Energy Inc. He joined Allegheny in 2005 as Vice President of Distribution. Before that, he was Global Business Director for the Nonwovens Business Group of E.I. du Pont de Nemours and Company.
David Johnson is our Executive Vice President and President of Europe, Africa and Middle East (EAME) Operations. From May 2007 until January 2009, he was Group Vice President and President of Europe, Africa and Middle East (EAME) Operations. Prior to that, Mr. Johnson was Vice President of the global Downstream business for our Energy Services division since 2006. He was the Global Strategic Business Leader for Energy Services Downstream from 2004 to 2005. In 2003, Mr. Johnson was General Sales Manager for the Downstream business in North America.
Mary Kay Kaufmann is our Chief Marketing Officer and Group Vice President, Commercial Operations for Water and Process Services Americas. She has held this position since January 2010, after serving as Chief Marketing Officer since August 2008. In May 2007, she was named Group Vice President and President, Water Services — Middle Market. Beginning in 2006, Ms. Kaufmann was Vice President, Nalco Business Transformation Team. From 2004 to 2006, she was Strategic Business Unit Leader for Food, Beverage and Pharmaceutical industries in the Americas and Europe. Ms. Kaufmann was Vice President of Sales for Industrial and Institutional Services — North America from 2002 to 2004.
Eric G. Melin is Executive Vice President and President, Asia Pacific. Prior to being named to his present position in September 2008, Mr. Melin worked for Nalco as a consultant on growth in Asia from May 2008. Prior to that, he had been Chief Operating Officer, President and Board Member of Isola Corporation, a private-equity-owned global designer, developer and manufacturer of high-performance materials used in electronic systems, from May 2006 until February 2008. He was Vice President and General Manager of E.I. du Pont de Nemours and Company’s Refinish Systems from August 2001 until he joined Isola Corporation.
16
Table of Contents
Dr. Manian Ramesh was named Chief Technology Officer in September 2008. Prior to that, he had been our Corporate Vice President for Research and Development since May 2007; Vice President, Process, Water and Core Technologies from July 2006 to May 2007; Vice President, Water and Core Technologies from October 2003 to July 2006; and Vice President, Research and Development from September 2002 to October 2003.
Steve M. Taylor is Executive Vice President and President, Energy Services division. From May 2007 until January 2009, he was Group Vice President and President of our Energy Services division. Prior to that, he served as Vice President of Upstream Energy Services since 2006. In 2005, Mr. Taylor served as Strategic Business Unit Leader of our Oilfield Chemicals group. In 2004, he was named Division Vice President of Marketing for Upstream and Downstream in our Energy Services division. From 2002 to 2004, Mr. Taylor served as Worldwide Marketing Manager.
Web Site
The Company’s Web site address is www.nalco.com. The Company makes available free of charge on or through its Web site its Code of Ethical Business Conduct, Officer Code of Ethics, annual report on Form 10-K, quarterly reports on Form 10-Q, current reports on Form 8-K, and all amendments to those reports as soon as reasonably practicable after such material is electronically filed with or furnished to the Securities and Exchange Commission. The Web site also includes the Company’s corporate governance guidelines and the charters for the audit, compensation, nominating and corporate governance and safety, health and environment committees of the Board of Directors.
17
Table of Contents
| ITEM 1A. | RISK FACTORS |
If we are unable to respond to the changing needs of a particular industry and to anticipate, respond to or utilize changing technologies and develop new offerings, it could become more difficult for us to respond to our customers’ needs and cause us to be less competitive.
We have historically been able to maintain our market positions and margins through continuous innovation of products and development of new offerings to create value for our customers. Recent innovations and developments that we have relied on include our 3D TRASAR system for controlling and monitoring chemical feed. We may not be successful in continuing to make similar innovations in the future. Our future operating results will depend to a significant extent on our ability to continue to introduce new products and applications and to develop new offerings that offer distinct value for our customers. Many of our products may be affected by rapid technological change and new product introductions and enhancements. We expect to continue to enhance our existing products and identify, develop and manufacture new products with improved capabilities and make improvements in our productivity in order to maintain our competitive position. We intend to devote sizeable resources to the development of new technologically advanced products and systems and to continue to devote a substantial amount of expenditures to the research and development functions of our business. However, we cannot assure you that:
| • | we will be successful in developing new products or systems or bringing them to market in a timely manner; |
| • | products or technologies developed by others will not render our offerings obsolete or non-competitive; |
| • | the market will accept our innovations; |
| • | our competitors will not be able to produce our core non-patented products at a lower cost; |
| • | we will have sufficient resources to research and develop all promising new technologies and products; or |
| • | significant research and development efforts and expenditures for products will ultimately prove successful. |
Our ability to anticipate, respond to and utilize changing technologies is crucial because we compete with many companies in each of the markets in which we operate. For example, we compete with hundreds of companies in the water treatment chemicals market, including our largest global water treatment competitor, GE Water Technologies. Our ability to compete effectively is based on a number of considerations, such as product and service innovation, product and service quality, distribution capability and price. Moreover, water treatment for industrial customers depends on the particular needs of the industry. For example, the paper industry requires a specific water quality for bleaching paper; certain industrial boilers require demineralized water; the pharmaceuticals industry requires ultra pure water for processing; and, in the case of municipal services, water treatment includes clarification for re-use, sludge dewatering and membrane ultra filtration. We may not have sufficient financial resources to respond to the changing needs of a particular industry and to continue to make investments in our business, which could cause us to become less competitive.
Our substantial leverage could harm our business by limiting our available cash and our access to additional capital.
As of December 31, 2009, our total consolidated indebtedness was $2,944.1 million and we had $231.6 million of borrowing capacity available under our revolving credit facility, which reflects no outstanding borrowings and reduced availability as a result of $18.4 million in outstanding letters of credit.
18
Table of Contents
Our high degree of leverage could have important consequences for you, including the following:
| • | It may limit our and our subsidiaries’ ability to obtain additional financing for working capital, capital expenditures, product development, debt service requirements, acquisitions and general corporate or other purposes on favorable terms or at all; |
| • | A substantial portion of our subsidiaries’ cash flows from operations must be dedicated to the payment of principal and interest on their and our indebtedness and thus will not be available for other purposes, including operations, capital expenditures and future business opportunities; |
| • | It may limit our ability to adjust to changing market conditions and place us at a competitive disadvantage compared to those of our competitors that are less highly-leveraged; |
| • | It may restrict our ability to make strategic acquisitions or cause us to make non-strategic divestitures; and |
| • | We may be more vulnerable than a less leveraged company to a downturn in general economic conditions or in our business, or we may be unable to carry out capital spending that is important to our growth. |
At December 31, 2009, we had $1,224.1 million of variable rate debt. A 1% increase in the average interest rate would increase future interest expense by approximately $12.2 million per year.
Despite our current leverage, we may still be able to substantially increase our indebtedness. This could further exacerbate the risks that we and our subsidiaries face.
We and our subsidiaries may be able to substantially increase our indebtedness in the future. The terms of the indentures governing our subsidiaries’ notes do not fully prohibit our subsidiaries or us from doing so. Nalco Company’s revolving credit facility provides commitments of up to $250.0 million, of which $231.6 million would have been available for future borrowings as of December 31, 2009, due to $18.4 million in outstanding letters of credit. If new debt is added to our current debt levels, the related risks that we and our subsidiaries now face could intensify.
Our subsidiaries’ debt agreements contain restrictions that limit our flexibility in operating our business.
Nalco Company’s senior credit agreement and the indentures governing our subsidiaries’ existing notes contain a number of significant covenants that, among other things, restrict our or our subsidiaries’ ability to:
| • | incur additional indebtedness; |
| • | pay dividends on or make other distributions or repurchase certain capital stock; |
| • | make certain investments; |
| • | enter into certain types of transactions with our affiliates; |
| • | pay dividends or other payments by restricted subsidiaries; |
| • | use assets as security in other transactions; and |
| • | sell certain assets or merge with or into other companies. |
In addition, under the senior credit agreement, Nalco Holdings LLC is required to satisfy and maintain specified financial ratios and tests. Events beyond our control may affect its ability to comply with those provisions and Nalco Holdings LLC may not be able to meet those ratios and tests. The breach of any of these covenants would result in a default under the senior credit agreement and the lenders could elect to declare all amounts borrowed under the senior credit agreement, together with accrued interest, to be due and payable and could proceed against the collateral securing that indebtedness.
19
Table of Contents
The terms of Nalco Company’s senior credit agreement limit Nalco Holdings LLC and its subsidiaries from paying dividends or otherwise transferring their assets to us.
Our operations are conducted through our subsidiaries and our ability to make payments on any obligations we may have is dependent on the earnings and the distribution of funds from our subsidiaries. However, the terms of Nalco Company’s senior credit agreement limit the amount of dividends and other transfers by Nalco Holdings LLC and its subsidiaries to us.
We could suffer material claims arising from the supply of products and services.
We assume contractual and tort risks as a natural result of providing sophisticated services and products to our customers. Broadly speaking, this includes risk of product liability claims (negligence and strict liability), contract claims, professional liability claims or other tort claims, including Legionella exposure. The types of damage that might be claimed include property damage, personal injury or economic losses. Although we take reasonable steps to limit exposure to these types of claims and mitigate losses should a claim occur, the nature of our business raises the potential of this risk.
The effects of the recent global economic crisis may impact our business, operating results or financial condition.
The recent global economic crisis has caused a general tightening in the credit markets, lower levels of liquidity, increases in the rates of default and bankruptcy, and extreme volatility in credit, equity and fixed income markets. These macroeconomic developments could negatively affect our business, operating results or financial condition in a number of ways, including impairments of goodwill and other intangible and tangible assets. When general economic conditions deteriorate, we may suffer reductions in our sales and profitability. In addition, the financial stability of our customers and suppliers may be compromised, which could result in additional bad debts for us or non-performance by suppliers. We may also find it more costly or difficult to obtain financing to fund operations or investment opportunities, or to refinance our debt in the future.
Our significant non-U.S. operations expose us to global economic and political changes that could impact our profitability.
We have significant operations outside the United States, including joint ventures and other alliances. We conduct business in approximately 150 countries and, in 2009, approximately 55% of our net sales originated outside the United States and some of our business is conducted in politically unstable countries. There are inherent risks in our international operations, including:
| • | exchange controls and currency restrictions; |
| • | currency fluctuations and devaluations; |
| • | tariffs and trade barriers; |
| • | export duties and quotas; |
| • | changes in local economic conditions; |
| • | changes in laws and regulations; |
| • | difficulties in managing international operations and the burden of complying with foreign laws; |
| • | exposure to possible expropriation or other government actions; |
| • | restrictions on our ability to repatriate dividends from our subsidiaries; |
| • | unsettled political conditions and possible terrorist attacks against American interests; and |
| • | countries whose governments have been hostile to U.S.-based businesses. |
Our international operations also expose us to different local political and business risks and challenges. For example, in certain countries we are faced with periodic political issues that could result in currency
20
Table of Contents
risks or the risk that we are required to include local ownership or management in our businesses. Also, because of uncertainties regarding the interpretation and application of laws and regulations and the enforceability of intellectual property and contract rights, we face risks in some countries that our intellectual property rights and contract rights would not be enforced by local governments. We are also periodically faced with the risk of economic uncertainty, which has impacted our business in these countries. Other risks in international business also include difficulties in staffing and managing local operations, including our obligations to design local solutions to manage credit risk to local customers and distributors.
Our overall success as a global business depends, in part, upon our ability to succeed in differing economic, social and political conditions. We may not continue to succeed in developing and implementing policies and strategies that are effective in each location where we do business, which could negatively affect our profitability.
Environmental, safety and production and product regulations or concerns could subject us to liability for fines or damages, require us to modify our operations and increase our manufacturing and delivery costs.
We are subject to the requirements of environmental and occupational safety and health laws and regulations in the United States and other countries. These include obligations to investigate and clean up environmental contamination on or from properties or at off-site locations where we are identified as a responsible party. For example, we are currently identified as a potentially responsible party at certain waste management sites.
We have also been named as a defendant in multi-party and individual lawsuits based on claims of exposure to hazardous materials and claims that our products are defective or dangerous. We have also been named as a defendant in lawsuits where our products have not caused injuries, but the claimants wish to be monitored for potential future injuries. We cannot predict with certainty the outcome of any such tort claims or the involvement we or our products might have in such matters in the future and there can be no assurance that the discovery of previously unknown conditions will not require significant expenditures. In each of these chemical exposure cases, our insurance carriers have accepted the claims on our behalf (with or without reservation) and our financial exposure should be limited to the amount of our deductible; however, we cannot predict the number of claims that we may have to defend in the future and we may not be able to continue to maintain such insurance.
We have made and will continue to make capital and other expenditures to comply with environmental requirements. Although we believe we are in material compliance with environmental law requirements, we may not have been and will not at all times be in complete compliance with all of these requirements, and may incur material costs, including fines or damages, or liabilities in connection with these requirements in excess of amounts we have reserved. In addition, these requirements are complex, change frequently and have tended to become more stringent over time. In the future, we may discover previously unknown contamination that could subject us to additional expense and liability. In addition, future requirements could be more onerous than current requirements.
The activities at our production facilities are subject to a variety of federal, state, local and foreign laws and regulations (“production regulations”). Similarly, the solid, air and liquid waste streams produced from our production facilities are subject to a variety of regulations (“waste regulations”) and many of our products and the handling of our products are governmentally regulated or registered (“product regulations”). Each of the production, waste and product regulations is subject to expansion or enhancement. Any new or tightened regulations could lead to increases in the direct and indirect costs we incur in manufacturing and delivering products to our customers. For example, the European Commission has imposed new chemical registration requirements on the manufacturers and users of all chemicals, not just those which are considered to be harmful or hazardous. Such regulations, referred to as REACH, will cause all chemical companies to incur additional costs to conduct their businesses in
21
Table of Contents
European Commission countries. Similarly, the need for certain of our products and services is dependent upon — or triggered by — governmental regulation, and changes in such regulation could impact our sales of these products or services. In addition to an increase in costs in manufacturing and delivering products, a change in production regulations or product regulations could result in interruptions to our business and potentially cause economic or consequential losses should we be unable to meet the demands of our customers for products.
We may not be able to achieve all of our expected cost savings.
For the years 2004 through 2008, our average annual cost savings were $84 million, during which our historic annual target was $75 million. In 2009, we achieved cost savings of $122 million, which was well above our increased annual goal of $100 million. A variety of risks could cause us not to achieve the benefits of our expected cost savings, including, among others, the following:
| • | higher than expected severance costs related to staff reductions; |
| • | higher than expected retention costs for employees that will be retained; |
| • | delays in the anticipated timing of activities related to our cost-saving plan, including the reduction of inefficiencies in our administrative and overhead functions; and |
| • | other unexpected costs associated with operating the business. |
We have experienced in the past, and could again experience in the future, difficulties in securing the supply of certain raw materials we and our competitors need to manufacture some of our products, and we have also been impacted by significant increases in raw material costs.
In 2004 and 2005, certain of the raw materials used by us and other chemical companies faced supply limitation. If these limitations occur again in the future, we risk shortfalls in our sales and the potential of claims from our customers if we are unable to fully meet contractual requirements.
Also, limitations on raw materials and rising prices for underlying materials have resulted in the past, and could result in the future, in price increases for raw materials we purchase. In the past, our margins have been impacted by such raw materials price increases, and our margins could be similarly impacted in the future if we are unable to pass any future raw material price increases through to our customers.
Our pension plans are currently underfunded and we may have to make significant cash payments to the plans, reducing the cash available for our business.
We sponsor various pension plans worldwide that are underfunded and require significant cash payments. For example, in 2008 and 2009, we contributed $86.2 million and $72.9 million, respectively, to our pension plans. We expect to contribute approximately $68 million to our pension plans in 2010. If the performance of the assets in our pension plans does not meet our expectations, or if other actuarial assumptions are modified, our contributions could be even higher than we expect. If our cash flow from operations is insufficient to fund our worldwide pension liability, we may be forced to reduce or delay capital expenditures, seek additional capital or seek to restructure or refinance our indebtedness.
As of December 31, 2009, our worldwide pension plans were underfunded by $418.7 million (based on the actuarial assumptions used for financial reporting purposes). Our U.S. pension plans are subject to the Employee Retirement Income Security Act of 1974, or ERISA. Under ERISA, the Pension Benefit Guaranty Corporation, or PBGC, has the authority to terminate an underfunded pension plan under certain circumstances. In the event our U.S. pension plans are terminated for any reason while the plans are underfunded, we will incur a liability to the PBGC that may be equal to the entire amount of the underfunding.
We have recorded a significant amount of goodwill and other identifiable intangible assets, and we may never realize the full value of our intangible assets.
We have recorded a significant amount of goodwill and other identifiable intangible assets, including customer relationships, trademarks and developed technologies. Goodwill and other net identifiable
22
Table of Contents
intangible assets were approximately $2.9 billion as of December 31, 2009, or approximately 58% of our total assets. Goodwill, which represents the excess of cost over the fair value of the net assets of the businesses acquired, was $1.8 billion as of December 31, 2009, or 36% of our total assets. Goodwill and net identifiable intangible assets are recorded at fair value on the date of acquisition and, in accordance with authoritative guidance issued by the Financial Accounting Standards Board, will be reviewed at least annually for impairment. Impairment may result from, among other things, deterioration in our performance, adverse market conditions, adverse changes in applicable laws or regulations, including changes that restrict the activities of or affect the products and services sold by our business, and a variety of other factors. We recognized a $544.2 million goodwill impairment charge in 2008, reducing the goodwill balance of our Paper Services reporting unit to zero. Some of the products and services we sell to our customers are dependent upon laws and regulations, and changes to such laws or regulations could impact the demand for our products and services. The amount of any quantified impairment must be expensed immediately as a charge to results of operations. Depending on future circumstances, it is possible that we may never realize the full value of our intangible assets. Any future determination of impairment of a significant portion of goodwill or other identifiable intangible assets would have an adverse effect on our financial condition and results of operations.
Our future success will depend in part on our ability to protect our intellectual property rights, and our inability to enforce these rights could permit others to offer products competitive with ours, which could reduce our ability to maintain our market position and maintain our margins.
We rely on the patent, trademark, copyright and trade secret laws of the United States and other countries to protect our intellectual property rights. However, we may be unable to prevent third parties from using our intellectual property without authorization, and we face risks in some countries that our intellectual property rights and contract rights would not be enforced by local governments. The use of our intellectual property by others could reduce any competitive advantage we have developed or otherwise harm our business. If we had to litigate to protect these rights, any proceedings could be costly, and we may not prevail.
We have obtained and applied for several U.S. and foreign trademark registrations, and will continue to evaluate the registration of additional service marks and trademarks, as appropriate. Our pending applications may not be approved by the applicable governmental authorities and, even if the applications are approved, third parties may seek to oppose or otherwise challenge these registrations. A failure to obtain trademark registrations in the United States and in other countries could limit our ability to protect our trademarks and impede our marketing efforts in those jurisdictions.
We may be subject to information technology system failures, network disruptions and breaches in data security.
We rely to a large extent upon sophisticated information technology systems and infrastructure. The size and complexity of our computer systems make them potentially vulnerable to breakdown, malicious intrusion and random attack. Likewise, data privacy breaches by employees and others with permitted access to our systems may pose a risk that sensitive data may be exposed to unauthorized persons or to the public. While we have invested heavily in protection of data and information technology, there can be no assurance that our efforts will prevent breakdowns or breaches in our systems that could adversely affect our business.
The market price of our common stock may be volatile, which could cause the value of your investment to decline.
Securities markets worldwide experience significant price and volume fluctuations. This market volatility, as well as general economic, market or potential conditions, could reduce the market price of our common stock in spite of our operating performance. In addition, our operating results could be below the expectations of securities analysts and investors, and in response, the market price of our common stock could decrease significantly.
23
Table of Contents
Provisions in our amended and restated certificate of incorporation and bylaws and Delaware law may discourage a takeover attempt.
Provisions contained in our amended and restated certificate of incorporation and bylaws and Delaware law could make it more difficult for a third party to acquire us, even if doing so might be beneficial to our stockholders. Provisions of our amended and restated certificate of incorporation and bylaws impose various procedural and other requirements, which could make it more difficult for stockholders to effect certain corporate actions. For example, our amended and restated certificate of incorporation authorizes our Board of Directors to determine the rights, preferences, privileges and restrictions of unissued series of preferred stock, without any vote or action by our stockholders. Thus, our Board of Directors can authorize and issue shares of preferred stock with voting or conversion rights that could adversely affect the voting or other rights of holders of our common stock. These rights may have the effect of delaying or deterring a change of control of our company. In addition, a change of control of our company may be delayed or deterred as a result of our having three classes of directors. Additionally, Section 203 of the Delaware General Corporation Law provides that, subject to specified exceptions, a Delaware corporation shall not engage in business combinations with any entity that acquires enough shares of our common stock without the consent of our Board of Directors to be considered an “interested stockholder” under Delaware law for a three-year period following the time that the stockholder became an interested stockholder. These provisions could limit the price that certain investors might be willing to pay in the future for shares of our common stock.
| ITEM 1B. | UNRESOLVED STAFF COMMENTS |
We have received no written comments regarding our periodic or current reports from the staff of the Securities and Exchange Commission that were issued 180 days or more preceding the end of our 2009 fiscal year and that remain unresolved.
| ITEM 2. | PROPERTIES |
Our principal administrative offices and research center are located in Naperville, Illinois. These facilities are leased. We maintain administrative and research facilities in Sugar Land, Texas and Leiden, Netherlands, both of which we own, and in Singapore and Shanghai, China, both of which we lease. We position our manufacturing locations and warehouses in a manner to permit ready access to our customers. We operate 16 plants in North America, 6 plants in Latin America, 10 plants in Europe and the Middle East and 13 plants in the Asia/Pacific region. We own all of our major manufacturing facilities and we also have a network of small leased sales offices in the United States and, to a lesser extent, in other parts of the world.
| ITEM 3. | LEGAL PROCEEDINGS |
Various claims, lawsuits and administrative proceedings are pending or threatened against us and our subsidiaries, arising from the ordinary course of business with respect to commercial, contract, intellectual property, product liability, employee, environmental and other matters. Historically, we have not faced any litigation matters or series of litigation matters that have had a material adverse impact on our business. In addition, we do not believe that there is any pending or reasonably predictable litigation, either individually or in the aggregate, that is likely to have a material adverse effect on our financial condition, results of operations, liquidity or cash flow. However, we cannot predict with certainty the outcome of any litigation or the potential for future litigation.
| ITEM 4. | SUBMISSION OF MATTERS TO A VOTE OF SECURITY HOLDERS |
None.
24
Table of Contents
PART II
| ITEM 5. | MARKET FOR REGISTRANT’S COMMON EQUITY, RELATED STOCKHOLDER MATTERS AND ISSUER PURCHASES OF EQUITY SECURITIES |
Our common stock is traded on the New York Stock Exchange (ticker symbol NLC). As of February 8, 2010, the number of holders of record of our common stock was approximately 48,100.
High and low sales prices per share of our common stock for each quarter during 2009 and 2008 were as follows:
| 2009 | 2008 | |||||||||||
| Quarter Ended |
High | Low | High | Low | ||||||||
| March 31 |
$ | 13.21 | $ | 9.38 | $ | 24.50 | $ | 17.32 | ||||
| June 30 |
18.34 | 12.82 | 26.28 | 21.11 | ||||||||
| September 30 |
21.05 | 15.22 | 25.90 | 17.60 | ||||||||
| December 31 |
26.05 | 18.76 | 18.84 | 7.80 | ||||||||
The closing sales price on December 31, 2009 was $25.51.
Our Board of Directors instituted a quarterly cash dividend by declaring a dividend of $0.035 per share of common stock in the quarter ended March 31, 2007 and in each succeeding quarter. Nalco Holding Company’s operations are conducted through its subsidiaries and its ability to make payments on any obligations it may have is dependent on the earnings and the distribution of funds from its subsidiaries. However, the terms of Nalco Company’s senior credit agreement limit the amount of dividends and other transfers by Nalco Holdings LLC and its subsidiaries to Nalco Holding Company. As a result, Nalco Holding Company is limited in its ability to pay dividends on its common stock.
On July 31, 2007, our Board of Directors authorized a $300 million share repurchase program, and gave our management discretion in determining the conditions under which shares may be purchased from time to time. We intend to repurchase all shares under this authorization in open market transactions. There is no set timetable for share repurchases, and the program has no stated expiration date. There were no repurchases of any of the Company’s common stock by or on behalf of the Company during the fourth quarter 2009.
25
Table of Contents
The following graph compares the cumulative total return of our common stock to the cumulative total return of the S&P 500 Stock Index, the S&P Specialty Chemicals Index and the Dow Jones Sustainability Index through the year ended December 31, 2009, the last trading day of our fiscal year. The graph assumes that the value of the investment in our common stock and each index was $100 at December 31, 2004 and that all dividends were reinvested.
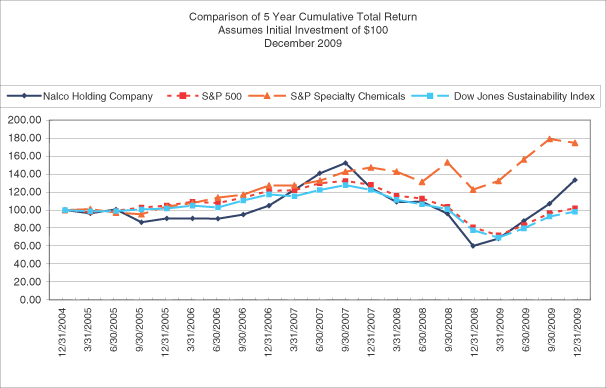
26
Table of Contents
| ITEM 6. | SELECTED FINANCIAL DATA |
The Nalco Holding Company financial statements include the consolidated audited financial statements of Nalco Holding Company and its subsidiaries.
You should read the following data in conjunction with “Management’s Discussion and Analysis of Financial Condition and Results of Operations” and the consolidated financial statements included elsewhere in this Annual Report.
| Year ended December 31 | ||||||||||||||||||||
| (dollars in millions, except per share data) | 2009 | 2008 | 2007 | 2006 | 2005 | |||||||||||||||
| Statement of Operations Data: |
||||||||||||||||||||
| Net sales |
$ | 3,746.8 | $ | 4,212.4 | $ | 3,912.5 | $ | 3,602.6 | $ | 3,312.4 | ||||||||||
| Operating costs and expenses: |
||||||||||||||||||||
| Costs of product sold |
2,037.0 | 2,378.3 | 2,152.8 | 1,995.3 | 1,841.0 | |||||||||||||||
| Selling, administrative, and research expenses |
1,210.2 | 1,250.0 | 1,206.1 | 1,094.7 | 1,020.9 | |||||||||||||||
| Amortization of intangible assets |
47.9 | 56.8 | 62.1 | 70.1 | 81.6 | |||||||||||||||
| Restructuring expenses (1) |
47.8 | 33.4 | 15.3 | 9.5 | 25.6 | |||||||||||||||
| Gain on divestiture |
— | (38.1 | ) | — | — | — | ||||||||||||||
| Impairment of goodwill (2) |
— | 544.2 | — | — | — | |||||||||||||||
| Operating costs and expenses |
3,342.9 | 4,224.6 | 3,436.3 | 3,169.6 | 2,969.1 | |||||||||||||||
| Operating earnings (loss) |
403.9 | (12.2 | ) | 476.2 | 433.0 | 343.3 | ||||||||||||||
| Other income (expense), net (3) |
(17.6 | ) | (17.4 | ) | (4.8 | ) | (4.4 | ) | 3.1 | |||||||||||
| Interest income |
3.9 | 8.3 | 9.1 | 9.1 | 8.4 | |||||||||||||||
| Interest expense |
(254.5 | ) | (258.8 | ) | (274.0 | ) | (272.0 | ) | (258.0 | ) | ||||||||||
| Earnings (loss) before income taxes |
135.7 | (280.1 | ) | 206.5 | 165.7 | 96.8 | ||||||||||||||
| Income tax provision |
67.8 | 54.5 | 69.3 | 58.9 | 43.3 | |||||||||||||||
| Net earnings (loss) |
67.9 | (334.6 | ) | 137.2 | 106.8 | 53.5 | ||||||||||||||
| Less: Net earnings attributable to noncontrolling interests |
7.4 | 8.0 | 8.2 | 7.9 | 5.7 | |||||||||||||||
| Net earnings (loss) attributable to Nalco Holding Company |
$ | 60.5 | $ | (342.6 | ) | $ | 129.0 | $ | 98.9 | $ | 47.8 | |||||||||
| Common Share Data: |
||||||||||||||||||||
| Net earnings (loss) per share attributable to Nalco Holding Company common shareholders (4): |
||||||||||||||||||||
| Basic |
$ | 0.44 | $ | (2.44 | ) | $ | 0.90 | $ | 0.69 | $ | 0.34 | |||||||||
| Diluted |
$ | 0.44 | $ | (2.44 | ) | $ | 0.88 | $ | 0.67 | $ | 0.33 | |||||||||
| Weighted average shares (millions): |
||||||||||||||||||||
| Basic |
138.2 | 140.1 | 143.2 | 143.0 | 141.7 | |||||||||||||||
| Diluted |
138.6 | 140.1 | 146.7 | 146.7 | 146.6 | |||||||||||||||
| Cash dividends declared per share |
$ | 0.14 | $ | 0.14 | $ | 0.14 | — | — | ||||||||||||
| Statement of Cash Flows Data: |
||||||||||||||||||||
| Net cash provided by (used for): |
||||||||||||||||||||
| Operating activities |
$ | 593.8 | $ | 283.1 | $ | 323.4 | $ | 284.8 | $ | 199.9 | ||||||||||
| Investing activities |
(135.8 | ) | (95.4 | ) | (141.7 | ) | (99.6 | ) | (75.9 | ) | ||||||||||
| Financing activities |
(398.6 | ) | (232.9 | ) | (105.3 | ) | (179.6 | ) | (125.9 | ) | ||||||||||
| Other Financial Data (unaudited): |
||||||||||||||||||||
| EBITDA (5) |
$ | 569.1 | $ | 155.8 | $ | 657.6 | $ | 621.8 | $ | 555.6 | ||||||||||
| Capital expenditures, net (6) |
102.2 | 133.1 | 114.6 | 93.4 | 74.6 | |||||||||||||||
| Depreciation |
142.3 | 136.6 | 132.3 | 131.0 | 133.3 | |||||||||||||||
| Amortization of intangible assets |
47.9 | 56.8 | 62.1 | 70.1 | 81.6 | |||||||||||||||
27
Table of Contents
| As of December 31 | |||||||||||||||
| (dollars in millions) | 2009 | 2008 | 2007 | 2006 | 2005 | ||||||||||
| Balance Sheet Data: |
|||||||||||||||
| Cash and cash equivalents |
$ | 127.6 | $ | 61.8 | $ | 119.9 | $ | 37.3 | $ | 30.8 | |||||
| Working capital (7) |
421.2 | 684.8 | 629.7 | 560.9 | 498.0 | ||||||||||
| Property, plant and equipment, net |
678.1 | 703.7 | 762.3 | 743.4 | 755.3 | ||||||||||
| Total assets |
4,964.8 | 5,042.0 | 5,978.6 | 5,656.5 | 5,552.4 | ||||||||||
| Total debt (including current portion of long-term debt) |
2,944.1 | 3,223.4 | 3,324.1 | 3,188.8 | 3,266.8 | ||||||||||
| Nalco Holding Company shareholders’ equity |
471.6 | 393.3 | 1,117.8 | 890.9 | 705.5 | ||||||||||
| (1) | We incur restructuring expenses, representing mostly employee severance and related costs, in connection with our programs to redesign and optimize our business and work processes. |
| (2) | During the fourth quarter of 2008, we recorded a goodwill impairment charge of $544.2 million, reducing the goodwill balance of our Paper Services reporting unit to zero. |
| (3) | Other income (expense), net consists of recognized gains and losses on foreign currency transactions, equity earnings of unconsolidated subsidiaries, franchise taxes, and other miscellaneous income (expense). Included for the year ended December 31, 2009 was a $20.5 million charge for the early repayment of debt. The year ended December 31, 2008 included $10.7 million of foreign currency transaction losses. |
| (4) | Net earnings (loss) per share attributable to Nalco Holding Company common shareholders is calculated by dividing net earnings (loss) attributable to Nalco Holding Company by the weighted average shares outstanding. |
| (5) | EBITDA, a measure used by management to measure operating performance, is defined as net earnings plus interest, taxes, depreciation and amortization. EBITDA is reconciled to net earnings (loss) in the following table. We believe EBITDA is useful to the investors because it is frequently used by securities analysts, investors and other interested parties in the evaluation of companies in our industry. EBITDA is not a recognized term under U.S. GAAP and does not purport to be an alternative to net earnings (loss) attributable to Nalco Holding Company as an indicator of operating performance or to cash flows from operating activities as a measure of liquidity. Because not all companies use identical calculations, this presentation of EBITDA may not be comparable to other similarly titled measures of other companies. Additionally, EBITDA is not intended to be a measure of cash flow for management’s discretionary use, as it does not consider certain cash requirements such as interest payments, tax payments and debt service requirements. The amounts shown for EBITDA as presented herein differ from the amounts calculated under the definition of EBITDA used in our debt instruments. The definition of EBITDA used in our debt instruments is further adjusted for certain cash and non-cash charges and is used to determine compliance with financial covenants and our ability to engage in certain activities such as incurring additional debt and making certain payments. |
The following is a reconciliation of net earnings (loss) attributable to Nalco Holding Company to EBITDA:
| Year ended December 31 | ||||||||||||||||
| (dollars in millions) | 2009 | 2008 | 2007 | 2006 | 2005 | |||||||||||
| Net earnings (loss) attributable to Nalco Holding Company |
$ | 60.5 | $ | (342.6 | ) | $ | 129.0 | $ | 98.9 | $ | 47.8 | |||||
| Interest expense, net |
250.6 | 250.5 | 264.9 | 262.9 | 249.6 | |||||||||||
| Income tax provision |
67.8 | 54.5 | 69.3 | 58.9 | 43.3 | |||||||||||
| Depreciation |
142.3 | 136.6 | 132.3 | 131.0 | 133.3 | |||||||||||
| Amortization of intangible assets |
47.9 | 56.8 | 62.1 | 70.1 | 81.6 | |||||||||||
| EBITDA |
$ | 569.1 | $ | 155.8 | $ | 657.6 | $ | 621.8 | $ | 555.6 | ||||||
| (6) | Capital expenditures are net of proceeds from disposal of assets. |
28
Table of Contents
| (7) | Working capital is defined as current assets (excluding cash and cash equivalents) less current liabilities (excluding short-term debt and current portion of long-term debt) and calculated as follows: |
| As of December 31 | ||||||||||||||||||||
| (dollars in millions) | 2009 | 2008 | 2007 | 2006 | 2005 | |||||||||||||||
| Current assets less current liabilities |
$ | 319.0 | $ | 652.8 | $ | 619.2 | $ | 448.0 | $ | 506.2 | ||||||||||
| Less: cash and cash equivalents |
(127.6 | ) | (61.8 | ) | (119.9 | ) | (37.3 | ) | (30.8 | ) | ||||||||||
| Plus: short-term debt |
229.8 | 93.8 | 130.4 | 150.2 | 22.6 | |||||||||||||||
| Working capital as defined |
$ | 421.2 | $ | 684.8 | $ | 629.7 | $ | 560.9 | $ | 498.0 | ||||||||||
29
Table of Contents
| ITEM 7. | MANAGEMENT’S DISCUSSION AND ANALYSIS OF FINANCIAL CONDITION AND RESULTS OF OPERATIONS |
The following discussion and analysis of our financial condition and results of operations includes references to the Transactions, defined as the acquisition of Ondeo Nalco Group, comprised of Nalco Company and Nalco International SAS Subsidiaries, by Nalco Holdings from Suez (“Suez”) and the related financings in connection with such acquisition (the “Acquisition”).
“Safe Harbor” Statement Under Private Securities Litigation Reform Act of 1995
This Annual Report for the fiscal year ended December 31, 2009 (the “Annual Report”) includes “forward-looking statements” within the meaning of Section 27A of the Securities Act of 1933 and Section 21E of the Securities Exchange Act of 1934. These forward-looking statements include statements concerning our plans, objectives, goals, strategies, future events, future revenue or performance, capital expenditures, financing needs, plans or intentions relating to acquisitions, business trends and other information that is not historical information. When used in this Annual Report, the words “estimates,” “expects,” “anticipates,” “projects,” “plans,” “intends,” “believes,” “forecasts,” or future or conditional verbs, such as “should,” “could” or “may,” and variations of such words or similar expressions are intended to identify forward-looking statements. All forward-looking statements, including, without limitation, management’s examination of historical operating trends and data are based upon our current expectations and various assumptions. Our expectations, beliefs and projections are expressed in good faith and we believe there is a reasonable basis for them. However, there can be no assurance that management’s expectations, beliefs and projections will be achieved.
There are a number of risks and uncertainties that could cause our actual results to differ materially from the forward-looking statements contained in this Annual Report. Additionally, important factors could cause our actual results to differ materially from the forward-looking statements we make in this Annual Report. As stated in Item 1A, “Risk Factors,” such risks, uncertainties and other important factors include, among others:
| • | our substantial leverage; |
| • | limitations on flexibility in operating our business contained in our debt agreements; |
| • | increases in interest rates as a result of our variable rate indebtedness; |
| • | pricing pressure from our customers; |
| • | technological change and innovation; |
| • | risks associated with our non-U.S. operations; |
| • | fluctuations in currency exchange rates; |
| • | high competition in the markets in which we operate; |
| • | products or services claims that might arise out of our activities; |
| • | adverse changes to environmental, health and safety regulations; |
| • | operating hazards in our production facilities; |
| • | inability to achieve expected cost savings; |
| • | difficulties in securing the raw materials we use; |
| • | our significant pension benefit obligations and the current underfunding of our pension plans; |
| • | our ability to realize the full value of our intangible assets; |
| • | our ability to attract and retain skilled employees, particularly research scientists, technical sales professionals and engineers; and |
| • | our ability to protect our intellectual property rights. |
30
Table of Contents
There may be other factors that may cause our actual results to differ materially from the forward-looking statements.
All forward-looking statements attributable to us or persons acting on our behalf apply only as of the date of this Annual Report and are expressly qualified in their entirety by the cautionary statements included in this Annual Report. We undertake no obligation to update or revise forward-looking statements which may be made to reflect events or circumstances that arise after the date made or to reflect the occurrence of unanticipated events.
Use of Non-GAAP Financial Measures
Direct contribution, EBITDA, Adjusted EBITDA, Adjusted Effective Tax Rate, Adjusted Earnings Per Share and Free Cash Flow are measures used by management to evaluate operating performance.
Direct contribution is defined as net sales, less cost of product sold, selling and service expenses, marketing expenses, and research expenses. EBITDA is defined as net earnings attributable to Nalco Holding Company plus interest, taxes, depreciation and amortization. Adjusted EBITDA is defined as EBITDA further adjusted for restructuring expenses and certain unusual items. Adjusted Effective Tax Rate is defined as the income tax provision, excluding the tax expense (benefit) of specified transactions, divided by earnings (loss) before income taxes, excluding the earnings (loss) before income taxes attributable to those specified transactions. Adjusted Earnings Per Share is defined as diluted net earnings per share attributable to Nalco Holding Company common shareholders, adjusted for the per-share impact of restructuring expenses, which fluctuate significantly from year to year, and other specified transactions that are unusual in nature. Free Cash Flow is defined as net cash provided by operating activities, less capital expenditures and net earnings attributable to noncontrolling interests.
Direct contribution provides investors with the measurement used by our management to evaluate the performance of our segments. We believe EBITDA is useful to the investors because it is frequently used by securities analysts, investors and other interested parties in the evaluation of companies in our industry. We believe Adjusted EBITDA, Adjusted Effective Tax Rate and Adjusted Earnings Per Share are useful for investors to fully understand our operating performance. We believe Free Cash Flow provides investors with a measure of our ability to generate cash for the optimization of our capital structure.
Direct contribution, EBITDA, Adjusted EBITDA and Free Cash Flow are not recognized terms under U.S. GAAP and do not purport to be alternatives to net earnings as an indicator of operating performance or to cash flows from operating activities as a measure of liquidity. Adjusted Effective Tax Rate and Adjusted Earnings Per Share also are not recognized terms under U.S. GAAP. Adjusted Effective Tax Rate does not purport to be an alternative to the actual effective tax rate as a measure of the relationship between the income tax provision and earnings (loss) before income taxes, and Adjusted Earnings Per Share does not purport to be an alternative to diluted earnings per share as a measure of operating performance. Direct contribution is reconciled to consolidated earnings before income taxes in Note 22 of our consolidated financial statements included in Item 8 of this Annual Report. The most direct comparable GAAP financial measures of each other non-GAAP financial measure, as well as the reconciliation between each other non-GAAP financial measure and the GAAP financial measure, are presented in the discussions of the non-GAAP financial measures below. Because not all companies use identical calculations, our measures may not be comparable to other similarly titled measures of other companies.
Critical Accounting Policies and Estimates
Revenue Recognition
Revenue from sales of products, including chemicals and equipment, is recognized at the time: (1) persuasive evidence of an arrangement exists, (2) ownership and all risks of loss have been
31
Table of Contents
transferred to the buyer, which is generally upon shipment, (3) the price is fixed and determinable, and (4) collectibility is reasonably assured. Revenue from services is recognized when the services are provided to the customer.
Significant estimates used in recognizing revenues include (1) the delay between the time that chemicals/equipment are shipped and when they are received by customers and title transfers and (2) the amount of credit memos to be issued in subsequent periods.
We provide our chemical and equipment offerings to our customers using various commercial arrangements, but the following are most commonly used:
Ship-and-bill arrangements. Following the receipt of a purchase order from the customer, we invoice the customer at the time that the chemicals/equipment are shipped, based on agreed pricing and the volume of chemicals shipped or units of equipment shipped. At the end of each period, for those shipments where title to the product and the risks of loss and rewards of ownership do not transfer until the product has been received by the customer, adjustments to revenues and cost of product sold are made to account for the delay between the time that the chemicals/equipment are shipped and when they are received by the customer. Our sales policy does not provide for general rights of return and does not contain customer acceptance clauses.
Usage with level billing arrangements. At the beginning of the contractual relationship, we prepare an estimate of the chemicals that will be used by the customer. As agreed with the customer, a fixed amount is invoiced monthly based on this estimate. At the end of each quarter, we reconcile the actual amount of chemicals used by the customer and bill the customer for products actually used during that period. Revenue is recognized to reflect actual usage. For any products not consumed in the customer’s operations in a particular period, we retain ownership of such products on a consigned basis and do not recognize any revenue.
Fixed-fee arrangements. At the beginning of the contractual relationship, we prepare an estimate of the chemicals that will be used by the customer during the contractual period, which is usually twelve months. A fixed amount is automatically invoiced to the customer on a periodic basis, typically monthly. We retain ownership, on a consigned basis, of any inventory at the customer site that is not consumed in the customer’s operations in a particular period. Revenue is recognized on a ratable basis over the contractual period, which is generally consistent with the customer’s usage of the chemicals.
Under these arrangements, as part of the sales cycle for our chemical programs, our technical and sales representatives may visit our customers’ facilities to develop and monitor the chemical programs. Typically, there is no contractual obligation for these visits, or any penalty for not visiting the customer sites. During these visits, our employees perform routine testing activities to ensure that our chemical products’ functionalities are having the desired effect on the customers’ equipment (e.g., boilers, chillers and water treatment plants). In the majority of instances, our customers perform the on-going application of the chemicals. At the same time, the sales representatives investigate and determine whether the customers have needs for additional applications from Nalco. We consider our technical and sales representatives’ activities in this regard to be an integral and inherent part of our selling process and not a separate deliverable for revenue recognition purposes.
Some of our customers, however, look to us for our technical expertise only, without the purchase of chemicals/equipment. We offer specialized services designed to assess, control, and reduce risk from water-borne pathogens such as Legionella, and we provide other technical and analytical services.
We invoice for our services using various commercial arrangements, but the following arrangements are the most common:
Perform-and-bill arrangements. Revenue is recognized in the same period that the related service is performed, based on the agreed pricing, which can be either a price per hour or a fixed fee.
32
Table of Contents
Fixed-fee arrangements. At the beginning of the contractual relationship, we estimate the saleable service that will be performed during a given period, usually twelve months. A fixed amount is automatically invoiced to the customer on a periodic basis, which may be monthly, quarterly, or annually, either in arrears or in advance of the services provided. Because an unspecified number of similar acts are performed within a fixed period of performance, revenue is recognized ratably over the period of performance.
Time and material arrangements. The fee with the customer is structured on a time and material basis, and revenue is recognized in the same period that the work is completed.
In certain arrangements, which are usually reserved for our largest customers, we provide some combination or all of the following deliverables: (1) chemicals, (2) equipment and (3) on-site technical expertise. In these arrangements, we usually remain the owner of any equipment at the customer site. At the end of the contractual relationship, the equipment is either recovered or sold to the customer or a competitor. Additionally, our representatives may have a regular presence at a customer’s facility, which is provided under a contract. Over time, the representatives have gained a true expertise in the particular production/water treatment process at the customer’s facility, and are able to selectively apply our specific chemical programs given the customer environment (water quality, equipment type, etc.). The regular presence of the representative permits us to closely track the results of the program and to make modifications to the program as necessary for the highest efficiency.
The following two types of commercial arrangements are the most commonly used for the sale of multiple deliverables:
Production-based arrangements. Our billing is based on a customer’s production-based formula (e.g., dollars per ton of paper produced) within certain technical parameters. We use a combination of our service chemicals, on-site technical expertise and equipment to satisfy the customer requirement. The chemicals and equipment used and on-site technical expertise required are highly correlated with the customer’s production. Revenue is recognized monthly based on the production-based formula.
Usage-based arrangements. For these arrangements, we invoice according to the consumption of chemicals by the customer. The agreed price by kilogram or pound of chemical consumed also includes the availability of on-site expertise and the use of equipment to satisfy the customer requirement. Revenue is recognized monthly based on the usage-based formula.
For all of our commercial arrangements, we also record estimated reserves for anticipated non-collectible accounts and for product returns and other credits at the time revenue is recognized.
Impairment of Long-Lived Assets Other Than Intangibles
Property, plant, and equipment held for use is grouped for impairment testing at the lowest level for which there is identifiable cash flows. Impairment testing of an asset group occurs whenever events or changes in circumstances indicate that the carrying amount of the assets may not be recoverable. Such circumstances may include, for example, a significant decrease in the market price of a long-lived asset grouping, a significant adverse change in the manner in which the asset grouping is being used or in its physical condition, a history of operating or cash flow losses associated with the use of the asset grouping, or changes in the expected useful life of the long-lived assets.
If such circumstances are determined to exist, an estimate of undiscounted future cash flows produced by that asset group is compared to the carrying value to determine whether impairment exists. If an asset group is determined to be impaired, the loss is measured based on the difference between the asset group’s fair value and its carrying value. The asset group’s fair value is based on quoted market prices in active markets, if available. If quoted market prices are not available, the estimate of fair value is based on various valuation techniques, including a discounted value of estimated future cash flows. Assets to be disposed of by sale are reported at the lower of carrying amount or fair value less cost to sell.
33
Table of Contents
The assumptions underlying cash flow projections represent management’s best estimate at the time of the impairment review. Factors that management must estimate include industry and market conditions, sales volume and prices, costs to produce, inflation, etc. Changes in key assumptions or actual conditions that differ from estimates could result in an impairment charge. We use reasonable and supportable assumptions when performing impairment reviews and cannot predict the occurrence of future events and circumstances that could result in impairment charges.
As of December 31, 2009, we had not identified any significant asset groups that had expected undiscounted future cash flows that were not substantially in excess of the carrying values, other than certain long-lived assets held and used that were written down to their estimated fair value during 2009, which resulted in an impairment loss of $20.2 million.
PORTA-FEED stainless steel containers, utilized to ship chemicals, represent approximately 6.9% of our property, plant and equipment and are managed globally to optimize the delivery of chemicals to customer and company sites around the world. Due to their high mobility, there is a risk that PORTA-FEED units could be damaged or lost in transit. We perform continuous cycle counts of our PORTA-FEED units and when such counts are inconsistent with our tracking system, we investigate the discrepancy in order to locate the container. If the PORTA-FEED unit is not found, we write off the asset immediately.
We capitalize qualifying costs incurred in the acquisition and development of software for internal use, including the costs of the software, materials, consultants, interest and payroll and payroll-related costs for employees dedicated to the development. We must use our judgment in determining whether the direct costs of materials and services consumed in developing or obtaining internal-use computer software and an employee’s time and travel expenses directly associated with developing software are recoverable and should be capitalized. We base our determination on the nature and the extent of the activity that the employee is performing.
Goodwill and Other Intangible Assets
The carrying values of goodwill and other intangible assets with indefinite lives are reviewed for possible impairment annually on the first day of our fourth quarter, October 1, or when events or changes in business circumstances indicate that the carrying value may not be recoverable. The carrying values of intangible assets with finite lives are reviewed for possible impairment when events or changes in business circumstances indicate that the carrying value may not be recoverable.
We have defined our reportable segments as our reporting units for our goodwill impairment testing. We use a two-step process to test goodwill for impairment. First, the reporting unit’s fair value is compared to its carrying value. Fair value is estimated using the market approach, as well as the income approach, based on discounted cash flow projections. If a reporting unit’s carrying amount exceeds its fair value, an indication exists that the reporting unit’s goodwill may be impaired, and the second step of the impairment test would be performed. The second step of the goodwill impairment test is used to measure the amount of the impairment loss, if any. In the second step, the implied fair value of the reporting unit’s goodwill is determined by allocating the reporting unit’s fair value to all of its identifiable assets and liabilities other than goodwill in a manner similar to a purchase price allocation. The implied fair value of the goodwill that results from the application of this second step is then compared to the carrying amount of the goodwill and an impairment charge would be recorded for the difference if the carrying value exceeds the implied fair value of the goodwill.
We test the carrying value of other intangible assets with indefinite lives by comparing the fair value of the intangible assets to the carrying value. Fair value is estimated using a relief of royalty approach, a discounted cash flow methodology, using market-based royalty rates.
The estimates and assumptions we use are consistent with the business plans and estimates we use to manage operations and to make acquisition and divestiture decisions. The use of different assumptions
34
Table of Contents
could impact whether an impairment charge is required and, if so, the amount of such impairment. Future outcomes may also differ. If we fail to achieve estimated volume and pricing targets, experience unfavorable market conditions or achieve results that differ from our estimates, then revenue and cost forecasts may not be achieved, and we may be required to recognize impairment charges.
We performed our annual impairment test as of October 1, 2009. Because the goodwill of our Paper Services reporting unit was written down to zero in 2008, it was not necessary to include it in our annual impairment test for 2009. However, we did estimate its fair value in order to compare the aggregate fair value of all of our reporting units to our market capitalization as of October 1, 2009. The fair value of our reporting units was estimated based on a discounted projection of cash flows. The rates used in determining discounted cash flows for each of our reporting units was a rate corresponding to our cost of capital, adjusted for risk where appropriate. In determining estimated future cash flows, current and future levels of income were considered that reflected business trends and market conditions.
The aggregate fair value of our reporting units as determined in the first step of our annual impairment test was reconciled to our market capitalization as of October 1, 2009. The aggregate fair value of our reporting units was 44% higher than our market capitalization, which represented an implied control premium. We believe this implied control premium is reasonable in light of market and economic conditions.
Critical assumptions used in estimating the fair value of our Water Services and Energy Services reporting units for the impairment test included the discount rate and the terminal growth rate for each unit. The following table summarizes those assumptions:
| Discount Rate | Terminal Growth Rate |
|||||
| Water Services |
10.0 | % | 3.0 | % | ||
| Energy Services |
10.0 | % | 3.0 | % |
The results of the first step of our 2009 annual impairment test indicated that the fair values of our reporting units exceeded their carrying values. The following table presents the amount of headroom (the percentage difference between each reporting unit’s fair value and carrying value) of our Water Services and Energy Services reporting units as of the date of our annual impairment test, October 1, 2009:
| Headroom (1) | |||
| Water Services |
84 | % | |
| Energy Services |
169 | % |
| (1) | Headroom = (fair value – carrying value) / carrying value, expressed as a percentage. |
The following table presents the impact on the resultant headroom if there was a one-percentage-point change in the discount rate and terminal growth rate from what was actually used for the impairment test:
| Headroom as of October 1, 2009 | ||||||
| Water Services | Energy Services | |||||
| One-percentage-point: |
||||||
| Increase in discount rate |
61 | % | 135 | % | ||
| Decrease in discount rate |
116 | % | 213 | % | ||
| Increase in terminal growth rate |
108 | % | 202 | % | ||
| Decrease in terminal growth rate |
67 | % | 144 | % | ||
35
Table of Contents
Pensions
Accounting for pensions involves the selection of a discount rate and an expected rate of return that we apply to a market-related value of plan assets. This methodology generally reduces the volatility of pension expense that would have otherwise resulted from changes in the value of the pension plan assets and pension liability discount rates. The discount rate used to determine the present value of our future U.S. pension obligations is based on a yield curve constructed from a portfolio of high quality corporate debt securities with various maturities. Each year’s expected future benefit payments are discounted to their present value at the appropriate yield curve rate, thereby generating the overall discount rate for U.S. pension obligations. The discount rates for our foreign pension plans are selected by reference to high quality corporate bond rates in those countries that have developed corporate bond markets. In those countries where developed corporate bond markets do not exist, the discount rates are selected by reference to local government bond rates with a premium added to reflect the additional risk for corporate bonds.
The assets in the principal domestic pension plan are diversified across equity and fixed income investments. The investment portfolio has target allocations of approximately 49% equity, 32% fixed income and 19% alternative investments such as hedge funds and private equity. Other assets such as real estate may be used judiciously to enhance portfolio returns and diversification.
The expected long-term rate of return on plan assets is established using historical market data for each asset class as well as the target allocation. Historical markets are analyzed and long-term historical relationships between equity and fixed income investments are preserved consistent with the widely accepted capital market principle that assets with higher volatility will generate a greater return over the long run. Active management is employed in most asset classes, which also contributes to the return assumption. The total weighted-average return on each asset class supports our long-term expected rate of return assumption.
We review our long-term rate of return assumptions annually. While we believe our assumptions of future returns are reasonable and appropriate, significant differences in our actual experience or significant changes in our assumptions may materially affect our pension obligations and our future pension expense. The expected long-term rate of return is applied to a calculated value of plan assets, which recognizes changes in the fair value of plan assets in a systematic manner over five years in determining pension expense.
For the year ended December 31, 2009, we recognized consolidated pension expense, including settlements, of approximately $47 million. We expect pension expense, including forecasted settlements, to decrease to about $21 million in 2010. Holding all other factors constant, an increase/decrease in the discount rate used to measure plan liabilities of one quarter of a percentage-point would decrease/increase 2010 pension expense and the benefit obligation by approximately $2 million and $40 million, respectively. Also, holding all other factors constant, an increase/decrease in the expected long-term rate of return of one quarter of a percentage-point would decrease/increase 2010 pension expense by approximately $1 million.
Other Postretirement Benefits
Accounting for other postretirement benefits requires the selection of a discount rate and health care cost trend rates used to value benefit obligations. The discount rate used to determine the present value of our future postretirement benefit obligations other than pensions is based on a yield curve constructed from a portfolio of high quality corporate debt securities with various maturities. Each year’s expected future benefit payments are discounted to their present value at the appropriate yield curve rate, thereby generating the overall discount rate for our other postretirement benefit obligations. We develop our estimate of the health care cost trend rates through review of our recent health care cost trend experience and discussions with our actuary regarding the experience of similar companies.
For the year ended December 31, 2009, we recognized consolidated other postretirement benefit expense of approximately $6 million, and we expect it to be approximately $11 million in 2010. Holding
36
Table of Contents
all other factors constant, an increase/decrease in the discount rate used to measure plan liabilities of one quarter of a percentage-point would decrease/increase 2010 other postretirement benefit expense by less than $1 million. See Note 14 of our consolidated financial statements included in Item 8 of this Annual Report for details of the impact of a one-percentage-point change in assumed health care cost trend rates on other postretirement benefit expense and the postretirement benefit obligation.
Income Taxes
We estimate our income tax expense in each of the jurisdictions in which we operate in accordance with authoritative guidance issued by the Financial Accounting Standards Board (FASB). This results in our recording deferred tax assets and liabilities in the consolidated balance sheet to recognize the temporary differences caused by the timing of recognition of income and expense for financial statement and tax purposes. Valuation allowances are recorded based on the realizability of the deferred tax assets. Relevant factors to determine the realizability of the assets include future taxable income, the expected timing of the reversal of temporary differences, tax planning strategies and the expiration dates of the various tax attributes. Valuation allowances are established for those assets that are determined to be more likely than not to expire without benefit, or for which income of the proper character is not anticipated.
The effect of a valuation allowance for a deferred tax asset that is expected to originate in the current year is included in the annual effective tax rate for the year. The effect of a change in the beginning-of-the-year balance of a valuation allowance resulting from a change in judgment about the realizability of the related deferred tax asset in future years is recognized in the interim period in which the change occurs.
The tax positions we take are based on our interpretations of tax laws and regulations in the applicable federal, state and international jurisdictions. We believe that our tax returns properly reflect the tax consequences of our operations, and that our reserves for tax contingencies are appropriate and sufficient for the positions taken. However, these positions are subject to audit and review by the tax authorities, which may result in future taxes, interest and penalties. Because of the uncertainty of the final outcome of these examinations, we have reserved for potential reductions of tax benefits (including related interest and penalties) for amounts that do not meet the more-likely-than-not thresholds for recognition and measurement as required by authoritative guidance issued by the FASB. The tax reserves are reevaluated throughout the year, taking into account new legislation, regulations, case law and audit results.
Environmental
Our business and operations are subject to extensive environmental laws and regulations governing, among other things, air emissions, wastewater discharges, the use and handling of hazardous substances, waste disposal and the investigation and remediation of soil and groundwater contamination. As with other companies engaged in similar manufacturing activities and providing similar services, some risk of environmental liability is inherent in our operations.
We have been named as a potentially responsible party, or PRP, by the Environmental Protection Agency or state enforcement agencies at seven waste sites where some financial contribution is or may be required. These agencies have also identified many other parties who may be responsible for clean up costs at the waste disposal sites. Our financial contribution to remediate these sites is expected to be minor. There has been no significant financial impact on us up to the present, nor is it anticipated that there will be in the future, as a result of these matters. We have made and will continue to make provisions for these costs if our liability becomes probable and when costs can be reasonably estimated.
We have also been named as a defendant in a number of lawsuits alleging personal injury due to exposure to hazardous substances, including multi-party lawsuits alleging personal injury in connection with our products and services. While we do not believe that based upon present information that any of these suits will be material to us, there can be no assurance that these environmental matters could not have, either individually or in the aggregate, a material adverse effect on our future financial condition or results of operations.
37
Table of Contents
Historically, our expenditures relating to environmental compliance and clean up activities have not been significant. The environmental reserves represent our current estimate of our proportional clean up costs and are based upon negotiation and agreement with enforcement agencies, our previous experience with respect to clean up activities, detailed review of known conditions, and information about other PRPs. The reserves are not reduced by any possible recoveries from insurance companies or other PRPs not specifically identified. Although given the evolving nature of environmental regulations, we cannot determine whether or not a material effect on future operations is reasonably likely to occur, we believe that the recorded reserve levels are appropriate estimates of the potential liability. Although settlements will require future cash outlays, it is not expected that such outlays will materially impact our liquidity position, although there can be no assurance that such impacts could not occur.
Executive Level Overview
Nalco delivered strong performance in 2009 against the top priorities we established at the beginning of the year, particularly given the very difficult business economy.
| • | We made continued improvement in safety, maintaining top quartile status in our Total Recordable Incident Rate. |
| • | We significantly exceeded our goal of $100 million in cost savings and efficiency improvements, by delivering $122 million of ongoing productivity gains and an additional $38 million of one-time savings. Nearly two-thirds of these savings were realized in cost of product sold, which contributed to the gross profit margin for 2009 increasing to 45.6% from the 43.5% for 2008. |
| • | We focused on profitable growth opportunities by shifting our employee base to markets such as China and India, and by strengthening our executive leadership capability in growth markets. We continued to expand the capabilities of our key technologies, such as 3D TRASAR, and we began to implement a Commercial Excellence project that is aimed at gaining market share by improving sales alignment with customer needs. |
| • | We substantially increased our cash flow by strengthening operating discipline, as we significantly reduced our days of inventory and receivables and extended payables. |
| • | We strengthened our future by expanding our research and development centers, commercializing new technologies, developing a comprehensive industrial water treatment strategy to broaden and differentiate our offerings in the industrial water market, and developing our brand as a sustainable solutions provider through extensive media coverage. |
Net sales for the year ended December 31, 2009 declined 11.1% to $3,746.8 million from $4,212.4 million in 2008 due to weakness in paper markets, depressed natural gas drilling activity, and extended shutdowns and permanent closures amongst customers in the mining, manufacturing and primary metals markets. Organic sales, defined as nominal, or actual, sales less the impacts of changes in foreign currency translation rates and acquisitions and divestitures, decreased 6.9%.
Diluted earnings per share was 44 cents in 2009, compared to a goodwill-impairment-driven diluted loss per share of $2.44 in 2008. Adjusted Earnings Per Share, which excludes the after-tax impacts of restructuring expenses and other specified transactions that are unusual in nature, was 92 cents in 2009, compared to $1.24 in 2008. Adjusted Earnings Per Share is reconciled to the diluted earnings (loss) per share as follows:
| Year ended December 31 | ||||||||
| 2009 | 2008 | |||||||
| Adjusted Earnings Per Share (1) |
$ | 0.92 | $ | 1.24 | ||||
| Restructuring expenses, net of tax |
(0.29 | ) | (0.17 | ) | ||||
| Pension settlement expense, net of tax |
(0.10 | ) | — | |||||
| Loss on early extinguishment of debt, net of tax |
(0.09 | ) | — | |||||
| Impairment of goodwill, net of tax |
— | (3.63 | ) | |||||
| Gain on divestiture, net of tax |
— | 0.11 | ||||||
| Diluted earnings (loss) per share, as reported |
$ | 0.44 | $ | (2.44 | ) | |||
38
Table of Contents
| (1) | Excludes after-tax impact of restructuring expenses, pension settlement expense, loss on early extinguishment of debt, impairment of goodwill, and gain on divestiture, and reflects the additional dilutive effect of potentially dilutive securities. |
EBITDA was $569.1 million and $155.8 million for the years 2009 and 2008, respectively. Adjusted EBITDA, which adjusts EBITDA for restructuring expenses and certain other unusual items, decreased 5.2% to $658.8 million in 2009 from the $695.3 million for 2008. The decrease was mostly due to unfavorable changes in foreign currency translation rates. Net earnings (loss) attributable to Nalco Holding Company is reconciled to EBITDA and Adjusted EBITDA as follows:
| Year ended December 31 | |||||||
| (dollars in millions) | 2009 | 2008 | |||||
| Net earnings (loss) attributable to Nalco Holding Company |
$ | 60.5 | $ | (342.6 | ) | ||
| Income tax provision |
67.8 | 54.5 | |||||
| Interest expense, net of interest income |
250.6 | 250.5 | |||||
| Depreciation |
142.3 | 136.6 | |||||
| Amortization |
47.9 | 56.8 | |||||
| EBITDA |
569.1 | 155.8 | |||||
| Restructuring expenses |
47.8 | 33.4 | |||||
| Pension settlement loss |
21.4 | — | |||||
| Loss on early extinguishment of debt |
20.5 | — | |||||
| Impairment of goodwill |
— | 544.2 | |||||
| Gain on divestiture |
— | (38.1 | ) | ||||
| Adjusted EBITDA |
$ | 658.8 | $ | 695.3 | |||
Free Cash Flow was $484.2 million for the year ended December 31, 2009, compared to the $142.0 million of Free Cash Flow generated in 2008. Net cash provided by operating activities is reconciled to Free Cash Flow as follows:
| Year ended December 31 | ||||||||
| (dollars in millions) | 2009 | 2008 | ||||||
| Net cash provided by operating activities |
$ | 593.8 | $ | 283.1 | ||||
| Minority interests |
(7.4 | ) | (8.0 | ) | ||||
| Additions to property, plant, and equipment, net |
(102.2 | ) | (133.1 | ) | ||||
| Free Cash Flow |
$ | 484.2 | $ | 142.0 | ||||
Among the items that contributed to such strong results in 2009 were focused efforts and resulting improvements in our management of working capital, as evidenced by:
| • | A reduction in accounts receivable days sales outstanding to 64 days from 71 days. |
| • | A reduction in days investment in inventory to 55 days from 70 days. |
| • | An increase in accounts payable days outstanding to 54 days from 47 days. |
The significant Free Cash flow generated during 2009 was mostly used to pay down more than $300 million of debt, and our performance was instrumental in our ability to undertake refinancings that moved a significant portion of nearer-term maturities to 2016 and beyond.
Other significant items included in our 2009 financial results are the following:
| • | We incurred $47.8 million in restructuring expenses compared to $33.4 million in 2008, as we continuously redesign and optimize business and work processes. The 2009 amount includes $20.2 million of non-cash asset impairment charges associated with plant closings, as we move to a more optimal manufacturing footprint. |
39
Table of Contents
| • | A pension settlement charge of $21.4 million was recognized in 2009, as a result of an unusually high level of lump-sum payments made to employees retiring in the U.S. |
| • | In connection with our debt repayments and refinancings, we recognized a $20.5 million loss on early extinguishment of debt. |
2010 Outlook
We are stepping up our growth efforts as we see the beginning of an economic recovery that should create increased demand for our expertise in creating an efficient, recyclable and reliable source of clean industrial water. Also, as energy costs continue to rise, our energy production and efficiency expertise has increased value to energy customers pursuing natural resources and industrial customers concerned with efficient use of energy and cost control. Against this backdrop of growing demand and our proven ability to strengthen our capabilities, even in a tumultuous business environment such as 2009, our priorities in 2010 will start, as always, with safety, and will continue the focus on activities that improve our top and bottom line results.
| • | First, continue to improve our safety performance. |
| • | Second, generate focused, profitable growth by pursuing high-growth geographies and industry segments, maintaining technological leadership, building upon our existing customer base, and benefiting from our global resource advantage. |
| • | Third, increase the amount of time that our sales teams spend in front of customers identifying new performance improvement opportunities, creating solutions and selling new business, while reducing time spent on administrative tasks and low-value activities. |
| • | Fourth, continue to achieve improvements in productivity, with a goal of at least $100 million in cost savings and efficiency gains. |
| • | Fifth, generate Free Cash Flow of more than $100 million, recognizing that returning to growth will require more working capital dollars and capital investment. |
| • | Sixth, continue to strengthen our future, by training and developing our employees, strengthening our technology leadership through continued market-focused innovation, building the Nalco brand, and increasing customer loyalty through a broader and more thorough implementation of our Six Service Standards approach to customer service management. |
We are optimistic about the success we can achieve in 2010 in a slowly recovering economy, because of our demonstrated capabilities in creating value for our customers and the increased customer emphasis on water, energy and air issues that drive our clean technology business.
Results of Operations
Year Ended December 31, 2009 Compared to the Year Ended December 31, 2008
Consolidated
Net sales for the year ended December 31, 2009 were $3,746.8 million, a decrease of 11.1% from the $4,212.4 million reported for the year ended December 31, 2008. On an organic basis, which excludes the impacts of changes in foreign currency translation rates and acquisitions and divestitures, net sales declined 6.9% as a result of the weak global economic environment. Changes in foreign currency translation rates accounted for a 3.4% drop in our sales, and the 2008 divestiture of our Finishing Technologies surface treatment business accounted for the majority of the remaining 0.8% sales decline. Nominal, or actual, sales were lower in every region, with Europe, Africa and Middle East down 16.8%, and North America, Asia/Pacific and Latin America down 11.3%, 4.6%, and 3.6% respectively. On an organic basis, Latin America grew 5.2%, but North America reported an organic decline of 9.6%, Europe, Africa and Middle East was down 9.1%, and Asia/Pacific was lower by 2.2%.
Gross profit, defined as the difference between net sales and cost of product sold, of $1,709.8 million for the year ended December 31, 2009 dropped $124.3 million, or 6.8%, from the $1,834.1 million for 2008.
40
Table of Contents
On an organic basis, gross profit decreased by 2.4%, driven by the 6.9% organic sales decline; however, the decline was successfully tempered by cost savings and process efficiencies. As a result, the gross profit margin improved by 2.1 percentage points to 45.6% in 2009 compared to 43.5% in 2008.
Selling, administrative, and research expenses for the year ended December 31, 2009 of $1,210.2 million decreased $39.8 million, or 3.2%, from the $1,250.0 million for the year ended December 31, 2008. Organically, selling, administrative, and research expenses increased by $10.4 million, or 0.8%. Lower selling expenses, reflecting cost reductions and efficiencies achieved, were offset by higher administrative costs resulting from a settlement charge of $21.4 million for the principal U.S. pension plan, consulting costs to assist us with certain elements of our productivity initiatives, higher incentive plan expenses, and software asset write-offs.
Amortization of intangible assets was $47.9 million and $56.8 million for the year ended December 31, 2009 and 2008, respectively. The decrease was attributable to lower amortization of customer relationships, which are amortized using an accelerated method that declines over time.
Restructuring expenses were $47.8 million and $33.4 million for the year ended December 31, 2009 and 2008, respectively. In addition to employee severance and related costs associated with the continuing redesign and optimization of business and work processes, the 2009 amount also includes $20.2 million of asset impairment charges associated with planned plant closings to move to a more optimal manufacturing footprint.
Gain on divestiture of $38.1 million in 2008 resulted from the sale of our Finishing Technologies surface treatment business to Chemetall Corp., a subsidiary of Rockwood Holdings.
Impairment of goodwill of $544.2 million in 2008 represents the write off of all goodwill previously allocated to Paper Services at the time of the Acquisition in 2003. The impairment resulted from a sharp deterioration in conditions within the paper industry and the general economy in late 2008.
Other income (expense), net was a net expense of $ 17.6 million and $17.4 million for the year ended December 31, 2009 and 2008, respectively. A $12.6 million favorable change in foreign currency transaction gains and losses and other favorable period-over-period changes were offset by a $20.5 million loss on extinguishment of debt in 2009.
Net interest expense, defined as the combination of interest income and interest expense, of $250.6 million for the year ended December 31, 2009 was comparable to the $250.5 million reported for the year ended December 31, 2008. The impacts of slightly lower average debt levels compared to the year-ago period and lower interest expense on our euro-denominated debt due to translation rate changes were offset by higher interest expense on our senior discount notes.
The tax provision for 2009 resulted in a 50.0% effective income tax rate, significantly higher than the U.S. federal statutory tax rate of 35%. This mostly resulted from an increase in valuation allowances of $29.0 million during 2009, which added 21.4 percentage-points to the effective income tax rate. The valuation allowances were recorded for deferred tax assets that are not likely to be realized, and were due to losses in specific jurisdictions and reduced ability to utilize certain tax loss carryforwards. Restructuring expenses, primarily in Europe, were a significant cause of the losses.
Our 2009 effective tax rate was favorably impacted by 4.0 percentage-points because we reduced our deferred tax liabilities for future U.S. state income taxes, primarily due to favorable law changes in key states related to apportioning of income.
The tax provision for 2008 resulted in tax expense on a pretax loss primarily because of two transactions that resulted in expensing goodwill for book purposes that had very little tax basis. The larger of the two transactions was the impairment of $544.2 million of goodwill that only had $93.7 million of tax basis. As a result, pretax income was reduced by $544.2 million, while the tax provision was only reduced $35.6 million. The second transaction was the sale of the Finishing Technologies surface treatment business, which resulted in $28.3 million of goodwill being expensed with only $1.6 million of tax benefit. The overall Finishing Technologies sale resulted in $38.1 million of pretax gain and $23.2 million of tax expense.
41
Table of Contents
With these two transactions removed, the Adjusted Effective Tax Rate for 2008 was 29.6% as shown below:
| (dollars in millions) | Reported Results |
Goodwill Impairment |
Finishing Technologies Divestiture |
Excluding Impairment Charge & Divestiture Gain |
||||||||||||
| Income (loss) before tax |
$ | 280.1 | $ | (544.2 | ) | $ | 38.1 | $ | 226.0 | |||||||
| Tax expense (benefit) |
54.5 | (35.6 | ) | 23.2 | 66.9 | |||||||||||
| Effective tax rate |
(19.5 | )% | 6.5 | % | 60.9 | % | 29.6 | % | ||||||||
We believe excluding these two items from the actual effective tax rate provides a better basis for comparison to other periods.
During 2008, our U.S. tax position changed such that we are now able to credit rather than deduct certain foreign taxes. The ability to credit removes nearly all of the incremental tax cost of repatriating dividends to the U.S. from our foreign subsidiaries. The ability to credit also reduces our expense related to most withholding taxes incurred by the U.S. parent company. The 2008 tax benefit of being able to credit foreign taxes was to release $35.4 million of valuation allowance related to prior year credits, and to further reduce 2008 expense by $29.4 million related to 2008 withholding taxes and foreign dividends, and other foreign taxes.
We assessed the realizability of the foreign tax credit carryforwards by considering historical trends and future projections of U.S. taxable income, including temporary differences. Our historical U.S. GAAP income includes significant expenses that are not deductible for U.S. tax purposes, including the 2008 impairment charge, which accelerates the use of the carryforwards on our tax returns. Utilization of the foreign tax credits is dependent upon future U.S. taxable income with the appropriate attributes. The U.S. income expectations were evaluated along with the expiration dates of the carryforwards, and we concluded that recognition of the tax benefits was appropriate.
Also during 2008, we provided valuation allowances on deferred tax assets in the U.K., primarily related to tax loss carryforwards and future pension obligations. The tax impact was to increase 2008 tax expense by $20.4 million.
Both 2009 and 2008 were also impacted by foreign taxes provided at other than the 35% U.S. statutory rate, U.S. state income taxes, nondeductible expense and other permanent differences. See Note 10 of our consolidated financial statements included in Item 8 of this Annual Report for an analysis of the difference between the U.S. statutory federal tax rate and the effective income tax rate.
Net earnings attributable to noncontrolling interests declined by $0.6 million to $7.4 million for the year ended December 31, 2009 from $8.0 million in 2008, mainly as the result of a decrease in earnings in our Nalco Mobotec Air Protection Technology business.
Segment Reporting
Net sales by reportable segment for the years ended December 31, 2009 and 2008 may be compared as follows:
| Year Ended December 31 | Attributable to Changes in the Following Factors |
|||||||||||||||||
| (dollars in millions) | 2009 | 2008 | % Change | Currency Translation |
Acquisitions/ Divestitures |
Organic | ||||||||||||
| Water Services |
$ | 1,662.4 | $ | 1,919.0 | (13.4 | )% | (4.0 | )% | (1.7 | )% | (7.7 | )% | ||||||
| Paper Services |
666.0 | 778.0 | (14.4 | )% | (2.6 | )% | — | (11.8 | )% | |||||||||
| Energy Services |
1,418.4 | 1,515.4 | (6.4 | )% | (3.1 | )% | 0.2 | % | (3.5 | )% | ||||||||
| Net sales |
$ | 3,746.8 | $ | 4,212.4 | (11.1 | )% | (3.4 | )% | (0.8 | )% | (6.9 | )% | ||||||
42
Table of Contents
Water Services reported sales of $1,662.4 million for the year ended December 31, 2009, a 13.4% decrease from the year ended December 31, 2008. On an organic basis, sales declined 7.7%, with some of the most significant decreases reported by the mining, manufacturing, and metals business. Geographically, every region reported lower sales, although Latin America ended the year with a 2.8% organic increase over 2008. The 1.7% decrease in sales from acquisitions/divestitures was attributable to the divestiture of our Finishing Technologies surface treatment business in September 2008, partly offset by the Crossbow acquisition in March 2009.
Paper Services reported sales of $666.0 million for the year ended December 31, 2009, a 14.4% decrease from the $778.0 million reported for 2008. Organic revenues declined 11.8% due to continued weakness in the market across all regions, except Latin America, where sales grew 4.6%.
Energy Services reported sales of $1,418.4 million for the year ended December 31, 2009, a 6.4% decline from the $1,515.4 million for the year-ago-period. Organically, sales decreased 3.5%, which was mostly attributable to our Adomite business in North America, due to the slowdown in drilling rig activity during 2009. The decline in Adomite revenues was partly offset by organic growth in the Upstream Oilfield business, with improvements reported by all regions except North America, which reported slightly lower organic sales from 2008.
Direct contribution by reportable segment for the years ended December 31, 2009 and 2008 may be compared as follows:
| Year Ended December 31 | Attributable to Changes in the Following Factors |
|||||||||||||||||
| (dollars in millions) | 2009 | 2008 | % Change | Currency Translation |
Acquisitions/ Divestitures |
Organic | ||||||||||||
| Water Services |
$ | 322.4 | $ | 370.8 | (13.1 | )% | (4.2 | )% | (1.8 | )% | (7.1 | )% | ||||||
| Paper Services |
117.7 | 101.9 | 15.5 | % | (4.2 | )% | — | 19.7 | % | |||||||||
| Energy Services |
314.9 | 315.5 | (0.2 | )% | (3.3 | )% | (0.3 | )% | 3.4 | % | ||||||||
Direct contribution of Water Services was $322.4 million for the year ended December 31, 2009, a decrease of 13.1% from the $370.8 million reported for the year-ago period. Organically, direct contribution deceased 7.1%, as the impact of lower sales volumes more than offset productivity savings and cost controls. The 1.8% decrease in direct contribution from acquisitions/divestitures was mostly attributable to the September 2008 sale of the Finishing Technologies surface treatment business.
Paper Services reported direct contribution of $117.7 million for the year ended December 31, 2009, a 15.5% improvement over the direct contribution of $101.9 million reported for the year ended December 31, 2008. Organically, direct contribution grew 19.7%, reflecting the positive results of organizational changes, productivity savings and cost controls, which more than offset the organic sales decrease. As a result, direct contribution as a percent of sales rose to 17.7% in 2009 from 13.1% in 2008.
Energy Services reported direct contribution of $314.9 million for the year ended December 31, 2009, comparable to the $315.5 million reported for 2008. On an organic basis, direct contribution rose 3.4%, despite the 3.5% organic sales decline, as a result of cost controls and productivity savings. Direct contribution as a percent of sales increased to 22.2% in 2009 from 20.8% in 2008.
Year Ended December 31, 2008 Compared to the Year Ended December 31, 2007
Consolidated
Net sales for the year ended December 31, 2008, exceeding $4.0 billion for the first time, were $4,212.4 million, an increase of 7.7% over the $3,912.5 million reported for the year ended December 31, 2007. On an organic basis, which excludes the impacts of changes in foreign currency translation rates and acquisitions and divestitures, net sales were up 7.8%. Every geographic region reported organic growth, including Europe, where previous sales declines reversed, and Asia/Pacific, where the economic downturn was experienced first and more severely than other regions.
43
Table of Contents
Gross profit, defined as the difference between net sales and cost of product sold, of $1,834.1 million for the year ended December 31, 2008 rose $74.4 million, or 4.2%, over the $1,759.7 million for 2007. On an organic basis, gross profit increased by 3.6%. Contributing to the improvement were the impacts of higher sales volumes and cost savings, which were partly offset by higher product and freight costs. A $12.3 million business interruption insurance settlement from the 2005 U.S. Gulf hurricanes that we received in 2007 also benefited that year. Gross profit margin for the year ended December 31, 2008 declined to 43.5% compared to 45.0% for the year ended December 31, 2007, mostly as the result of increases in direct material and freight costs of $170.5 million that were not fully offset by $159.2 million of price increases.
Selling, administrative, and research expenses for the year ended December 31, 2008 of $1,250.0 million increased $43.9 million, or 3.6%, from $1,206.1 million for the year ended December 31, 2007. Organically, selling, administrative, and research expenses grew by $17.0 million, or 1.4%. The greatest portion of this increase was attributable to selling expense, as a result of our higher salaries, employee incentives, employee benefits, training, travel, and outside services, as we invested in the hiring and training of our sales force in growth markets. Administrative expenses actually declined by $26.1 million on an organic basis, partly because 2007 expenses included $12.0 million of compensation cost for a grant of nonvested common stock as part of an agreement with our former Chairman and Chief Executive Officer, Dr. William H. Joyce, who retired effective December 30, 2007. In addition, outside consulting costs related to our work process redesign and legal entity restructuring initiatives were significantly higher in 2007.
Amortization of intangible assets was $56.8 million and $62.1 million for the year ended December 31, 2008 and 2007, respectively. The decrease was attributable to lower amortization of customer relationships, which are amortized using an accelerated method that declines over time.
Restructuring expenses, representing mostly employee severance and related costs associated with the continuing redesign and optimization of business and work processes, were $33.4 million and $15.3 million for the year ended December 31, 2008 and 2007, respectively. The increase was mainly the result of a reduction in force of more than 400 positions begun during the fourth quarter of 2008 as part of an organizational realignment.
Gain on divestiture of $38.1 million in 2008 resulted from the sale of our Finishing Technologies surface treatment business to Chemetall Corp., a subsidiary of Rockwood Holdings.
Impairment of goodwill of $544.2 million in 2008 represents the write off of all goodwill previously allocated to Paper Services at the time of the Acquisition in 2003. The impairment resulted from a sharp deterioration in conditions within the paper industry and the general economy in late 2008.
Other income (expense), net was a net expense of $17.4 million and $4.8 million for the year ended December 31, 2008 and 2007, respectively. The $12.6 million increase was mainly attributable to an unfavorable change in foreign currency transaction gains and losses of $9.6 million.
Net interest expense, defined as the combination of interest income and interest expense, of $250.5 million for the year ended December 31, 2008 decreased by $14.4 million from the $264.9 million reported for the year ended December 31, 2007. Translation rate changes due to the weaker U.S. dollar versus the euro increased interest expense by $3.6 million, and accretion of our senior discount notes was $3.2 million higher than in 2007. However, lower interest rates on our variable rate debt and slightly lower average debt levels compared to 2007 more than offset these increases.
The tax provision for 2008 resulted in tax expense on a pretax loss primarily because of two transactions that resulted in expensing goodwill for book purposes that had very little tax basis. The larger of the two transactions was the impairment of $544.2 million of goodwill that only had $93.7 million of tax basis. As a result, pretax income was reduced by $544.2 million, while the tax provision was only reduced $35.6 million. The second transaction was the sale of the Finishing Technologies surface treatment business, which resulted in $28.3 million of goodwill being expensed with only $1.6 million of tax benefit. The overall Finishing Technologies sale resulted in $38.1 million of pretax gain and $23.2 million of tax expense.
44
Table of Contents
With these two transactions removed, the Adjusted Effective Tax Rate for 2008 was 29.6% as shown below:
| (dollars in millions) | Reported Results | Goodwill Impairment | Finishing Technologies Divestiture |
Excluding Impairment Charge & Divestiture Gain |
||||||||||||
| Income (loss) before tax |
$ | (280.1 | ) | $ | (544.2 | ) | $ | 38.1 | $ | 226.0 | ||||||
| Tax expense (benefit) |
54.5 | (35.6 | ) | 23.2 | 66.9 | |||||||||||
| Effective tax rate |
(19.5 | )% | 6.5 | % | 60.9 | % | 29.6 | % | ||||||||
We believe excluding these two items from the actual effective tax rate provides a better basis for comparison to other periods. The Adjusted Effective Tax Rate of 29.6% compares to the 2007 rate of 33.6%. In 2007, the effective tax varied from the U.S. federal statutory rate of 35% primarily due to incremental U.S. federal income taxes on dividends received from non-U.S. subsidiaries, foreign taxes provided at other than the 35% U.S. statutory rate, U.S. state income taxes, nondeductible expenses and other permanent differences between income and expense for financial statement and tax purposes. Except as described below, these differences also apply to 2008.
During 2008, our U.S. tax position changed such that we are now able to credit rather than deduct certain foreign taxes. The ability to credit removes nearly all of the incremental tax cost of repatriating dividends to the U.S. from our foreign subsidiaries. The ability to credit also reduces our expense related to most withholding taxes incurred by the U.S. parent company. The 2008 tax benefit of being able to credit foreign taxes was to release $35.4 million of valuation allowance related to prior year credits, and to further reduce 2008 expense by $29.4 million related to 2008 withholding taxes and foreign dividends, and other foreign taxes.
We assessed the realizability of the foreign tax credit carryforwards by considering historical trends and future projections of U.S. taxable income, including temporary differences. Our historical U.S. GAAP income includes significant expenses that are not deductible for U.S. tax purposes, including the impairment charge in 2008, which accelerates the use of the carryforwards on our tax returns. Utilization of the foreign tax credits is dependent upon future U.S. taxable income with the appropriate attributes. The U.S. income expectations were evaluated along with the expiration dates of the carryforwards, and we concluded that recognition of the tax benefits was appropriate.
Also during 2008, we provided valuation allowances on deferred tax assets in the U.K., primarily related to tax loss carryforwards and future pension obligations. The tax impact was to increase 2008 tax expense by $20.4 million.
Net earnings attributable to noncontrolling interests remained relatively flat, declining by $0.2 million to $8.0 million for the year ended December 31, 2008.
Segment Reporting
Net sales by reportable segment for the years ended December 31, 2008 and 2007 may be compared as follows:
| Year Ended December 31 | Attributable to Changes in the Following Factors |
|||||||||||||||||
| (dollars in millions) | 2008 | 2007 | % Change | Currency Translation |
Acquisitions/ Divestitures |
Organic | ||||||||||||
| Water Services |
$ | 1,919.0 | $ | 1,846.0 | 4.0 | % | 1.8 | % | (3.2 | )% | 5.4 | % | ||||||
| Paper Services |
778.0 | 778.4 | — | 2.1 | % | — | (2.1 | )% | ||||||||||
| Energy Services |
1,515.4 | 1,288.1 | 17.6 | % | 0.6 | % | (0.4 | )% | 17.4 | % | ||||||||
| Net sales |
$ | 4,212.4 | $ | 3,912.5 | 7.7 | % | 1.5 | % | (1.6 | )% | 7.8 | % | ||||||
Water Services reported sales of $1,919.0 million for the year ended December 31, 2008, a 4.0% increase over the year ended December 31, 2007. On an organic basis, sales rose 5.4% and more than offset the loss of $79.5 million in revenues earned in 2007 by our waste coal agglomeration (synfuel) business that ended with a December 31, 2007 tax code expiration.
45
Table of Contents
Paper Services reported sales of $778.0 million for the year ended December 31, 2008, comparable to the $778.4 million reported for 2007. Organically, sales were down 2.1% from 2007, which reflected a sharp deterioration in paper market conditions. Only Latin America reported good organic growth in 2008 over 2007.
Energy Services reported sales of $1,515.4 million for the year ended December 31, 2008, a 17.6% improvement over the $1,288.1 million for 2007. Organically, sales increased 17.4%, spurred by strong double-digit increases for the year in the Upstream Oilfield and Adomite business units.
Direct contribution by reportable segment for the years ended December 31, 2008 and 2007 may be compared as follows:
| Year Ended December 31 | Attributable to Changes in the Following Factors |
|||||||||||||||||
| (dollars in millions) | 2008 | 2007 | % Change | Currency Translation |
Acquisitions/ Divestitures |
Organic | ||||||||||||
| Water Services |
$ | 370.8 | $ | 368.6 | 0.6 | % | 2.4 | % | (6.6 | )% | 4.8 | % | ||||||
| Paper Services |
101.9 | 127.1 | (19.8 | )% | 1.7 | % | — | (21.5 | )% | |||||||||
| Energy Services |
315.5 | 283.1 | 11.4 | % | 0.8 | % | (0.2 | )% | 10.8 | % | ||||||||
Direct contribution of Water Services was $370.8 million for the year ended December 31, 2008, an increase of 0.6% from the $368.6 million reported for 2007 which included the synfuel business. Organically, direct contribution improved 4.8%, as a result of the 5.4% organic increase in sales. Gross earnings as a percent of sales were unchanged from 2007 at 47.8% during a year of rapid product and freight cost increases, and total operating expenses were up 4.0% organically.
Paper Services reported direct contribution of $101.9 million for the year ended December 31, 2008, a 19.8% decline from the direct contribution of $127.1 million reported for the year ended December 31, 2007. Organically, direct contribution was down 21.5%, as improvements in Latin America sales and profitability were more than offset by declines in other regions. Operating expenses were up down 1.2% organically.
Energy Services reported direct contribution of $315.5 million for the year ended December 31, 2008, an 11.4% increase over the $283.1 million reported for 2007. On an organic basis, direct contribution rose 10.8%. Higher sales volumes drove this growth, but higher product costs reduced gross earnings to 42.2% of sales from 44.8% in 2007. Investments in additional manpower contributed to increased compensation costs that drove operating expenses up 8.5% organically, with related increases in travel and outside services.
Liquidity and Capital Resources
Operating activities. Historically, our main source of liquidity has been our solid cash flow generated by operating activities. For the year ended December 31, 2009, cash provided by operating activities was $593.8 million, an increase of $310.7 million over 2008. The improvement was mostly the result of lower inventory and accounts receivable levels, which resulted in favorable changes from 2008 of $209.9 million and $151.7 million, respectively.
For the year ended December 31, 2008, cash provided by operating activities was $283.1 million, a decrease of $40.3 million from 2007. The decline was mostly the result of higher inventory levels, which utilized $92.8 million of cash in 2008. A $37.4 million favorable change from 2007 in cash used for accounts receivable offset part of the higher cash usage for inventories.
Investing activities. Net property additions of $102.2 million accounted for most of the $135.8 million of cash used for investing activities during the year ended December 31, 2009. The remainder was mostly attributable to $27.6 million of cash used for business acquisitions. We acquired the assets and business of Crossbow Water for $22.1 million in March 2009, and we paid $5.5 million of contingent consideration related to acquisitions made prior to 2009.
46
Table of Contents
Cash used for investing activities was $95.4 million for the year ended December 31, 2008, which was mostly attributable to net property additions of $133.1 million and business purchases of $21.7 million. Partly offsetting these uses of cash was $74.1 million of net proceeds from the sale of the Finishing Technologies business in September 2008.
Cash used for investing activities was $141.7 million for the year ended December 31, 2007, most of which was attributable to net property additions of $114.6 million. Of the remainder, $27.9 million relates to net cash used to acquire an 87.5% interest in Nalco Mobotec.
Financing activities. Net cash used to decrease borrowings of $307.0 million accounted for more than three-fourths of the $398.6 million of net cash used for financing activities for the year ended December 31, 2009. We repaid $0.7 billion of term loans and nearly $1.0 billion of senior notes that were due to mature in 2010 and 2011, respectively, using cash from operations and the proceeds from new term loan borrowings of $1.0 billion and a new senior notes issue of $0.5 billion. Most of the new term loan borrowings become due in 2016, and the new senior notes mature in 2017. Operating cash was also used to repay $98.0 million of borrowings under an accounts receivable securitization facility. Other significant financing cash outflows during 2009 included $54.7 million to issue the new debt, a $9.2 million premium to redeem a portion of the 2011 senior notes, and common stock dividends of $19.3 million.
Net cash used for financing activities was $232.9 million for the year ended December 31, 2008. Share repurchases of $103.3 million, common stock dividends of $19.7 million, a net reduction in long-term debt borrowings of $36.8 million, and a $65.8 million net reduction in short-term debt accounted for most of that amount.
Net cash used for financing activities totaled $105.3 million for the year ended December 31, 2007, which was mostly attributable to share repurchases of $108.0 million, common stock dividends of $15.1 million, term loan repayments of $48.3 million and a $12.8 million reduction in bank overdrafts. These uses were partially offset by $50.0 million borrowed short-term against our revolving credit facility and a $34.0 million increase in our securitized accounts receivable facility.
Upon the expiration of our $100 million receivables facility in June 2007, we entered into a new three-year receivables facility that provides up to $160 million in funding.
On July 31, 2007, our Board of Directors authorized a $300 million share repurchase program, and gave our management discretion in determining the conditions under which shares may be purchased from time to time. The program has no stated expiration date. Under the program, we repurchased 4.6 million of our common shares at a cost of $108.0 million in 2007 and 4.9 million shares at a cost of $103.3 million in 2008, with the last purchase made on November 11, 2008.
Our liquidity requirements are significant, primarily due to debt service requirements as well as research and development and capital investment. Our primary source of liquidity will continue to be cash flow generated from operations, but we also have availability under a $250 million revolving credit facility and a $160 million receivables facility that matures in June 2010, in each case subject to certain conditions. We believe that our financial position and financing structure will provide flexibility in worldwide financing activities and permit us to respond to changing conditions in credit markets.
On May 13, 2009, Nalco Company, an indirect subsidiary of Nalco Holding Company, entered into new senior secured credit facilities (the “New Senior Secured Credit Facilities”) consisting of a revolving credit facility expiring in May 2014 (the “New Revolving Credit Facility”) and a $750.0 million term loan facility expiring in May 2016 (the “New Term Loan B”). The New Revolving Credit Facility provides for borrowings of up to $250.0 million and replaced the former $250.0 million revolving credit facility that would have otherwise expired on November 4, 2009. The U.S. dollar equivalent of $150.0 million under the New Revolving Credit Facility can be used, subject to certain collateral obligations, for borrowings by Nalco Company and certain non-U.S. subsidiaries in euros, pounds sterling and other currencies to be agreed. At December 31, 2009, no borrowings were outstanding under the New Revolving Credit Facility.
47
Table of Contents
Also on May 13, 2009, Nalco Company issued $500.0 million aggregate principal amount of 8 1/4% senior unsecured notes (the “Notes”). The Notes were issued at a discount of $10.7 million. The Notes mature on May 15, 2017, with interest payable semi-annually on May 15 and November 15 of each year, commencing on November 15, 2009. The Notes do not have required principal payments prior to maturity. Each of the direct and indirect subsidiaries of Nalco Holdings LLC and Nalco Company that guarantees its obligations under the New Senior Secured Credit Facilities guarantees the Notes.
The terms of the New Senior Secured Credit Facilities also allowed us to make future additional term loan borrowings of up to $250.0 million on terms to be agreed with future lenders. On November 25, 2009, we entered into Amendment No. 1 (the “Amendment”) to the New Senior Secured Credit Facilities, which increased the amount of future additional term loan borrowings from $250.0 million to $550.0 million. The Amendment required that after giving effect to the incurrence of any such additional term loans and the application of the proceeds of such term loans to redeem our 7 3/4% senior notes due 2011, no more than $200.0 million of the 7 3/4% senior notes due 2011 could remain outstanding. The Amendment also permitted us to use up to $200.0 million of our cash to redeem our 7 3/4% senior notes due 2011 for a period of 180 days from the date of the Amendment, which was done.
On December 7, 2009, Nalco Company entered into a Joinder Agreement to the New Senior Secured Credit Facilities that provided for an additional $300.0 million term loan credit facility expiring in May 2016 (the “Term Loan C”). We borrowed the full amount of Term Loan C on December 7, 2009, at a discount of $27.0 million, or 9.00%, of such new term loan.
Borrowings under the New Revolving Credit Facility, New Term Loan B and Term Loan C bear interest at a floating base rate plus an applicable margin. The applicable margin for borrowings under the New Revolving Credit Facility ranges from 2.00% to 3.00% with respect to base rate borrowings and 3.00% to 4.00% with respect to LIBOR or Eurocurrency borrowings depending on our leverage ratio as defined by the revolving credit agreement. The initial margin for the New Revolving Credit Facility is 2.50% with respect to base rate borrowings and 3.50% with respect to LIBOR or Eurocurrency borrowings. The applicable margin for borrowings under New Term Loan B is 2.50% with respect to base rate borrowings and 3.50% with respect to LIBOR or Eurocurrency borrowings, with a base rate floor of 4.00% and a LIBOR or Eurocurrency floor of 3.00%. The applicable margin for borrowings under Term Loan C is 0.75% with respect to base rate borrowings and 1.75% with respect to LIBOR or Eurocurrency borrowings.
New Term Loan B and Term Loan C are subject to amortization at 1% of the initial principal amount per annum, payable quarterly. The remaining principal amount of the term loans is due on May 13, 2016.
The New Senior Secured Credit Facilities are unconditionally guaranteed by Nalco Company, Nalco Holdings LLC (the direct parent company of Nalco Company), and certain domestic subsidiaries of Nalco Holdings LLC. The repayment of these facilities is secured by substantially all the assets of Nalco Company and the guarantors, including, but not limited to, a pledge of their capital stock and 65% of the capital stock of each non-U.S. subsidiary owned by the guarantors.
The New Senior Secured Credit Facilities and Notes contain a number of covenants that, among other things, restrict, subject to certain exceptions, our ability to sell assets; incur additional indebtedness or issue preferred stock; repay other indebtedness; pay dividends and distributions or repurchase certain capital stock; create liens on assets; make investments, loans or advances; make acquisitions, mergers or consolidations; enter into sale and leaseback transactions; engage in certain transactions with affiliates; amend certain material agreements governing our indebtedness; change our business; and enter into hedging agreements. In addition, the New Senior Secured Credit Facilities and Notes require Nalco Company to maintain the following financial covenants: a maximum total leverage ratio, a senior secured leverage ratio, a minimum interest coverage ratio and a maximum capital expenditures limitation. We were in compliance with all covenants at December 31, 2009.
48
Table of Contents
Net proceeds from New Term Loan B and the Notes were used to repay the remaining $15.0 million balance of the existing term loan A maturing on November 4, 2009, to repay $720.0 million of the existing term loan B maturing on November 4, 2010, and to redeem $475.0 million aggregate principal amount of senior notes due November 2011. Available cash and net proceeds from Term Loan C were used to redeem €200.0 million aggregate principal amount of senior notes due November 2011 and the remaining $190.0 million aggregate principal amount of senior notes due November 2011. We refer to these transactions, the issuance of the Notes, and our entry into the New Revolving Credit Facility, New Term Loan B and Term Loan C, collectively, as the “Refinancing.”
As a result of the Refinancing, we incurred a $20.5 million loss on extinguishment of debt, which is included in other income (expense), net. The loss was comprised of $10.4 million of accelerated amortization of deferred financing costs related to the existing term loans and senior notes, a $9.2 million premium paid to redeem the $475.0 million of existing senior notes, and $0.9 million of other related charges.
In connection with the Refinancing, we recorded deferred financing costs of $54.7 million related to the New Revolving Credit Facility, New Term Loan B, Term Loan C and the Notes, which will be amortized over their respective terms.
Senior credit facilities. Our senior credit facilities that were entered into in November 2003 initially included a revolving credit facility expiring on November 4, 2009, a $300.0 million term loan A facility (including an €88.0 million tranche) maturing on November 4, 2009 and a $1,300.0 million term loan B facility maturing on November 4, 2010.
At December 31, 2009, the outstanding balance of the term loan B facility was $167.0 million. Borrowings under the term loan B facility bear interest at a floating base rate plus an applicable margin of 0.75% with respect to base rate borrowings and 1.75% with respect to LIBOR or Eurocurrency borrowings.
The senior credit facilities that were entered into in November 2003 contain a number of covenants that, among other things, require Nalco Company to maintain the following financial covenants: a maximum total leverage ratio, a minimum interest coverage ratio and a maximum capital expenditures limitation. We were in compliance with all covenants at December 31, 2009.
Senior discount notes, senior notes and senior subordinated notes. In November 2003, Nalco Company issued $665.0 million aggregate principal amount of 7 3/4% U.S. dollar-denominated senior notes due 2011, €200.0 million aggregate principal amount of 7 3/4% euro-denominated senior notes due 2011, $465.0 million aggregate principal amount of 8 7/8% U.S. dollar-denominated senior subordinated notes due 2013 and €200.0 million aggregate principal amount of 9% euro-denominated senior subordinated notes due 2013. As part of the Refinancing, Nalco Company redeemed the $665.0 million aggregate principal amount of 7 3/4% U.S. dollar-denominated senior notes due 2011 and the €200.0 million aggregate principal amount of 7 3/4% euro-denominated senior notes due 2011.
In January 2004, our subsidiaries, Nalco Finance Holdings LLC and Nalco Finance Holdings Inc., issued $694.0 million aggregate principal amount at maturity of 9.0% senior discount notes due 2014. In December 2004, Nalco Finance Holdings LLC and Nalco Finance Holdings Inc. redeemed a portion of the senior discount notes using proceeds from the initial public offering of common stock of Nalco Holding Company.
After the partial redemption, the aggregate principal amount at maturity of the notes declined to $460.8 million. Prior to February 1, 2009, interest accrued on the notes in the form of an increase in the accreted value of such notes. The accreted value of each note increased from the date of issuance until February 1, 2009 at a rate of 9.0% per annum, reflecting the accrual of non-cash interest, such that the accreted value equals the principal amount at maturity of $460.8 million. Cash interest payments on the notes became due and payable beginning in August 2009.
49
Table of Contents
The indentures governing the senior subordinated notes and the senior discount notes limit our ability and the ability of our restricted subsidiaries to:
| • | incur additional indebtedness; |
| • | pay dividends on or make other distributions or repurchase certain capital stock; |
| • | make certain investments; |
| • | enter into certain types of transactions with affiliates; |
| • | limit dividends or other payments by our restricted subsidiaries; |
| • | use assets as security in other transactions; and |
| • | sell certain assets or merge with or into other companies. |
Subject to certain exceptions, the indentures governing the senior subordinated notes and the senior discount notes permit our restricted subsidiaries and us to incur additional indebtedness, including secured indebtedness.
Local lines of credit. Certain of our non-U.S. subsidiaries have lines of credit to support local requirements. As of December 31, 2009, the aggregate outstanding balance under these local lines of credit was approximately $52.7 million. Certain of these lines of credit are equally and ratably secured with obligations under our senior credit facilities.
Receivables facility. Nalco Company entered into a three-year receivables facility on June 22, 2007 that provides up to $160 million in funding from a commercial paper conduit sponsored by Bank of America, N.A., one of the lenders under Nalco Company’s senior credit facilities, based on availability of eligible receivables and satisfaction of other customary conditions.
Availability of funding under the receivables facility in a given month depends primarily upon the outstanding trade accounts receivable balance at the end of the previous month. Aggregate availability is determined by using a formula that reduces the gross receivables balance by factors that take into account historical default and dilution rates, excessive concentrations and average days outstanding and the costs of the facility. As of December 31, 2009, we had no outstanding borrowings under this facility, although there was $121.0 million of available funding based on the amount of receivables eligible for financing as of November 30, 2009.
This facility is treated as a general financing agreement resulting in the borrowings and related receivables being shown as liabilities and assets, respectively, on our consolidated balance sheet and the costs associated with the receivables facility being recorded as interest expense.
50
Table of Contents
Contractual Obligations and Commitments
The following table summarizes our expected cash outflows resulting from our contractual obligations as of December 31, 2009:
| Payments Due By Period | |||||||||||||||
| (dollars in millions) | Total | 2010 | 2011 to 2012 |
2013 to 2014 |
2015 and beyond | ||||||||||
| Contractual Obligations: |
|||||||||||||||
| Debt obligations: |
|||||||||||||||
| Principal |
$ | 2,927.2 | $ | 177.5 | $ | 21.2 | $ | 1,234.8 | $ | 1,493.7 | |||||
| Interest |
1,081.5 | 209.8 | 412.7 | 292.0 | 167.0 | ||||||||||
| Total debt obligations |
4,008.7 | 387.3 | 433.9 | 1,526.8 | 1,660.7 | ||||||||||
| Operating lease obligations (1) |
279.9 | 35.2 | 68.2 | 32.9 | 143.6 | ||||||||||
| Purchase obligations (2) |
— | — | — | — | — | ||||||||||
| Other long-term liabilities (3)(4) |
171.7 | 50.0 | 100.0 | 21.7 | — | ||||||||||
| Total |
$ | 4,460.3 | $ | 472.5 | $ | 602.1 | $ | 1,581.4 | $ | 1,804.3 | |||||
| (1) | Represents future minimum rental payments related to administrative, research, manufacturing, and warehouse facilities. Operating leases are also in place for vehicles and office equipment, the amounts of which are not readily available. |
| (2) | Excluded from the table are open purchase orders for raw materials and supplies used in the normal course of business, supply contracts with customers, distribution agreements, joint venture agreements and other contracts without express funding requirements. |
| (3) | Does not reflect obligations under the Contribution Agreement relating to our Profit Sharing and Savings Plan, for which Suez has agreed to reimburse us. Our remaining obligations under the Contribution Agreement will be satisfied in 2010. |
| (4) | The amounts in long-term liabilities represent our expected pension funding for the principal domestic defined benefit pension plan. We currently intend to contribute approximately $50.0 million each year until the plan is fully funded, although this could increase or decrease as a result of changes in interest rates and returns on plan assets from what is currently assumed. |
Our contractual obligations and commitments over the next several years are significant. Our primary source of liquidity will continue to be cash flow generated from operations. In the period January 1, 2007 through December 31, 2009, our cumulative cash flow from operations was $1,200.3 million. We have availability under a $250 million revolving credit facility to assist us, if required, in meeting our working capital needs and other contractual obligations. This multi-year revolving credit facility matures in May 2014. If our cash flow from operations is insufficient to fund our debt service and other obligations, we may be forced to reduce or delay capital expenditures, seek additional capital or seek to restructure or refinance our indebtedness. At December 31, 2009, we had $231.6 million of borrowing capacity available under our revolving credit facility, which reflects no outstanding borrowings and reduced availability as a result of $18.4 million in outstanding letters of credit.
We believe that cash flow generated from operations and our borrowing capacity will be adequate to meet our obligations and business requirements. Our ability to fund these items and to reduce debt may be affected by general economic, financial, competitive, legislative and regulatory factors, and the cost of litigation claims, among other things.
51
Table of Contents
The following table summarizes our expected cash outflows resulting from commercial commitments as of December 31, 2009. Commercial commitments include lines of credit, guarantees and other potential cash outflows resulting from a contingent event that requires our performance pursuant to a funding commitment.
| Amount of Commitment Expiration Per Period | |||||||||||||||
| (dollars in millions) | Total | 2010 | 2011 to 2012 |
2013 to 2014 |
2015 and beyond | ||||||||||
| Commercial Commitments: |
|||||||||||||||
| Standby letters of credit (1) |
$ | 47.8 | $ | 44.9 | $ | 2.8 | $ | 0.1 | $ | — | |||||
| Guarantees |
— | — | — | — | — | ||||||||||
| Other commercial commitments |
0.7 | 0.7 | — | — | — | ||||||||||
| Total |
$ | 48.5 | $ | 45.6 | $ | 2.8 | $ | 0.1 | $ | — | |||||
| (1) | The final maturity of current instruments is subject to annual renewal. |
Off-Balance Sheet Arrangements
We do not have any off-balance sheet financing or unconsolidated special purpose entities.
Recent Accounting Pronouncements
In September 2006, the FASB issued authoritative guidance for fair value measurements, which defines fair value, establishes a framework for measuring fair value, and expands disclosures about fair value measurements in the financial statements. In February 2008, the FASB issued authoritative guidance that delayed by one year the effective date for applying the guidance for fair value measurements to nonfinancial assets and nonfinancial liabilities measured at fair value on a nonrecurring basis. We adopted the authoritative guidance for fair value measurements for our nonfinancial assets and nonfinancial liabilities measured on a nonrecurring basis effective January 1, 2009, which did not have a material impact on our financial statements.
In December 2007, the FASB revised the authoritative guidance for business combinations. The guidance retains the underlying concepts of earlier authoritative guidance in that all business combinations are required to be accounted for under the acquisition method of accounting, but changes the method of applying the acquisition method in a number of significant aspects. We adopted the revised authoritative guidance effective January 1, 2009, which did not have a material impact on our financial statements.
In December 2007, the FASB issued authoritative guidance that amends earlier guidance for consolidation procedures for consistency with the requirements of the revised authoritative guidance for business combinations. The guidance also requires noncontrolling interests to be separately presented as a component of equity in the consolidated balance sheet and the amount of net earnings attributable to noncontrolling interests to be included in consolidated net earnings on the face of the income statement. We adopted the accounting provisions of the guidance on a prospective basis effective January 1, 2009. In addition, we adopted the presentation and disclosure requirements of the guidance on a retrospective basis in the first quarter of 2009.
In March 2008, the FASB issued authoritative guidance that amends and expands the disclosure requirements of earlier guidance with regard to derivatives and hedging activities. We adopted the guidance effective January 1, 2009. See Note 17 of our consolidated financial statements included in Item 8 of this Annual Report.
In December 2008, the FASB issued authoritative guidance to require additional disclosures about assets held in an employer’s pension and other postretirement benefit plans. The guidance is effective for fiscal years ending after December 15, 2009. The additional disclosures are included in Note 14 of our consolidated financial statements included in Item 8 of this Annual Report. Adoption of this guidance did not have an impact on our financial position, results of operations or cash flows.
52
Table of Contents
In April 2009, the FASB issued additional authoritative guidance about (1) measuring the fair value of financial instruments when the markets become inactive and quoted prices may reflect distressed transactions, and (2) recording impairment charges on investments in debt instruments. We adopted the guidance in the second quarter of 2009, which did not have a material impact on our financial statements.
In May 2009, the FASB issued authoritative guidance that establishes general standards of accounting for and disclosure of events that occur after the balance sheet date but before financial statements are issued or are available to be issued. We adopted the guidance in the second quarter of 2009, which did not have an impact on our financial statements.
In June 2009, the FASB issued authoritative guidance that eliminates the qualifying special purpose entity concept, changes the requirements for derecognizing financial assets and requires enhanced disclosures about transfers of financial assets. The guidance also revises earlier guidance for determining whether an entity is a variable interest entity, requires a new approach for determining who should consolidate a variable interest entity, changes when it is necessary to reassess who should consolidate a variable interest entity, and requires enhanced disclosures related to an enterprise’s involvement in variable interest entities. The guidance is effective for the first annual reporting period that begins after November 15, 2009. We are currently evaluating the effects that the guidance may have on our financial statements.
In June 2009, the FASB issued authoritative guidance that provides for the FASB Accounting Standards Codification (the “Codification”) to become the single official source of authoritative, nongovernmental U.S. generally accepted accounting principles (GAAP). The Codification did not change GAAP but reorganizes the literature. The guidance was effective for interim and annual periods ending after September 15, 2009, and we adopted the guidance in our financial statements for the third quarter of 2009. Adoption of this guidance did not have an impact on our financial position, results of operations or cash flows.
In August 2009, the FASB issued authoritative guidance on measuring the fair value of liabilities. The guidance clarifies that in circumstances in which a quoted price in an active market for the identical liability is not available, an entity is required to use one or more of the following valuation techniques to measure fair value: (1) the quoted price of the identical liability when traded as an asset, (2) quoted prices of similar liabilities or similar liabilities when traded as assets, and (3) an income approach, such as a present value technique, or a market approach, such as a technique that is based on the amount at the measurement date that the entity would pay to transfer the identical liability or would receive to enter into the identical liability. The guidance was effective for the first interim or annual reporting period beginning after its issuance (our fourth quarter of 2009). Adoption of the guidance did not have a material impact on our financial statements.
In October 2009, the FASB issued authoritative guidance that amends earlier guidance addressing the accounting for contractual arrangements in which an entity provides multiple products or services (deliverables) to a customer. The amendments address the unit of accounting for arrangements involving multiple deliverables and how arrangement consideration should be allocated to the separate units of accounting, when applicable, by establishing a selling price hierarchy for determining the selling price of a deliverable. The selling price used for each deliverable will be based on vendor-specific objective evidence if available, third-party evidence if vendor-specific objective evidence is not available, or estimated selling price if neither vendor-specific nor third-party evidence is available. The amendments also require that arrangement consideration be allocated at the inception of an arrangement to all deliverables using the relative selling price method. The guidance is effective for fiscal years beginning on or after June 15, 2010, with earlier application permitted. We are currently evaluating the effects that the guidance may have on our financial statements.
In October 2009, the FASB issued authoritative guidance that amends earlier guidance for revenue arrangements that include both tangible products and software elements. Tangible products containing software components and nonsoftware components that function together to deliver the tangible
53
Table of Contents
product’s essential functionality are no longer within the scope of guidance for recognizing revenue from the sale of software, but would be accounted for in accordance with other authoritative guidance. The guidance is effective for fiscal years beginning on or after June 15, 2010, with earlier application permitted. We are currently evaluating the effects that the guidance may have on our financial statements.
| ITEM 7A. | QUANTITATIVE AND QUALITATIVE DISCLOSURES ABOUT MARKET RISK |
We are subject to inherent risks attributed to operating in a global economy. We may utilize derivative financial instruments as necessary to manage foreign currency exchange rate risks. We manage foreign currency exchange risk arising from financial activities pursuant to our corporate guidelines. Forward contracts and, occasionally, swaps and options are utilized to protect these cash flows from adverse movements in exchange rates, and we account for these instruments by marking them to market at each balance sheet date. We may also employ hedge accounting as permitted by authoritative guidance issued by the FASB. In addition, we use certain foreign currency debt as a hedge of the foreign currency exposure of a portion of our net investment in foreign operations.
Upon issuance, we designated the €200.0 million aggregate principal amount of 7 3/4% senior notes due 2011, the €200.0 million aggregate principal amount of 9% senior subordinated notes due 2013, and an €88.0 million term loan as a hedge of our net investment in subsidiary companies whose assets, liabilities, and operations are measured using the euro as their functional currency. Because of the high degree of effectiveness between the hedging instruments and the exposure being hedged, fluctuations in the value of the euro-denominated debt due to exchange rate changes are offset by changes in the net investment. Accordingly, changes in the value of the euro-denominated debt are recognized in foreign currency translation adjustment, a component of accumulated other comprehensive income, to offset changes in the value of our net investment in subsidiary companies whose financial statements are measured using the euro as their functional currency. The carrying value of euro-denominated debt designated as a net investment hedge was $287.7 million at December 31, 2009.
We formally assess, on a quarterly basis, whether the euro-denominated debt is effective at offsetting changes in the value of the underlying exposure. For the year ended December 31, 2009, we recorded a $22.4 million non-cash pretax loss in the accumulated foreign currency translation adjustment account related to this hedge. No hedge ineffectiveness was recorded in income.
We also manage operational (transactional) foreign currency risk, particularly in emerging markets, by closely managing both pricing and raw material sourcing. Risks associated with foreign exchange translation exposures are not hedged.
We have exposure to fluctuations in foreign currency exchange rates. Based on our derivative foreign currency instruments outstanding at December 31, 2009 and 2008, a 10% strengthening or weakening in the value of the U.S. dollar relative to the currencies in which those derivative foreign currency instruments are denominated would result in a gain or loss in fair values of less than $5.8 million and $2.7 million for the respective year.
At December 31, 2009, we had $1,224.1 million of variable rate debt. A 1% increase in the average interest rate would increase future interest expense by approximately $12.2 million per year.
Our sensitivity analysis of the effects of the changes in interest rates and foreign currency exchange rates do not reflect the effect of such changes on the related hedged transactions or on other operating transactions. The analysis also does not factor in a potential change in the level of variable rate borrowings or derivative instruments outstanding that could take place if these hypothetical conditions prevailed.
We are exposed to credit loss in the event of nonperformance by the other party to the derivative financial instruments. We limit this exposure by entering into agreements directly with a number of major financial institutions that meet our credit standards and that are expected to satisfy fully their obligations under the contracts. We view derivative financial instruments as a risk management tool and do not use them for speculative or trading purposes.
54
Table of Contents
| ITEM 8. | FINANCIAL STATEMENTS AND SUPPLEMENTARY DATA |
Index to Financial Statements
Nalco Holding Company and Subsidiaries
Consolidated Financial Statements
55
Table of Contents
Report of Independent Registered Public Accounting Firm
The Board of Directors and Shareholders of Nalco Holding Company
We have audited the accompanying consolidated balance sheets of Nalco Holding Company and subsidiaries as of December 31, 2009 and 2008, and the related consolidated statements of operations, equity, and cash flows for each of the three years in the period ended December 31, 2009. Our audits also included the financial statement schedules listed in the Index at Item 15(a)(2). These financial statements and schedules are the responsibility of the Company’s management. Our responsibility is to express an opinion on these financial statements and schedules based on our audits.
We conducted our audits in accordance with the standards of the Public Company Accounting Oversight Board (United States). Those standards require that we plan and perform the audit to obtain reasonable assurance about whether the financial statements are free of material misstatement. An audit includes examining, on a test basis, evidence supporting the amounts and disclosures in the financial statements. An audit also includes assessing the accounting principles used and significant estimates made by management, as well as evaluating the overall financial statement presentation. We believe that our audits provide a reasonable basis for our opinion.
In our opinion, the financial statements referred to above present fairly, in all material respects, the consolidated financial position of Nalco Holding Company and subsidiaries at December 31, 2009 and 2008, and the consolidated results of their operations and their cash flows for each of the three years in the period ended December 31, 2009, in conformity with U.S. generally accepted accounting principles. Also, in our opinion, the related financial statement schedules, when considered in relation to the basic financial statements taken as a whole, present fairly in all material respects the information set forth therein.
As described in Note 2 to the consolidated financial statements, effective January 1, 2009, the Company adopted new rules regarding the accounting, presentation and disclosure requirements for noncontrolling interests.
We also have audited, in accordance with the standards of the Public Company Accounting Oversight Board (United States), Nalco Holding Company and subsidiaries’ internal control over financial reporting as of December 31, 2009, based on criteria established in Internal Control — Integrated Framework issued by the Committee of Sponsoring Organizations of the Treadway Commission and our report dated February 26, 2010 expressed an unqualified opinion thereon.
/s/ ERNST & YOUNG LLP
Chicago, Illinois
February 26, 2010
56
Table of Contents
Report of Independent Registered Public Accounting Firm
The Board of Directors and Shareholders of Nalco Holding Company
We have audited Nalco Holding Company and subsidiaries’ internal control over financial reporting as of December 31, 2009, based on criteria established in Internal Control — Integrated Framework issued by the Committee of Sponsoring Organizations of the Treadway Commission (the COSO criteria). Nalco Holding Company and subsidiaries’ management is responsible for maintaining effective internal control over financial reporting, and for its assessment of the effectiveness of internal control over financial reporting included in the accompanying Management’s Report on Internal Control over Financial Reporting. Our responsibility is to express an opinion on the company’s internal control over financial reporting based on our audit.
We conducted our audit in accordance with the standards of the Public Company Accounting Oversight Board (United States). Those standards require that we plan and perform the audit to obtain reasonable assurance about whether effective internal control over financial reporting was maintained in all material respects. Our audit included obtaining an understanding of internal control over financial reporting, assessing the risk that a material weakness exists, testing and evaluating the design and operating effectiveness of internal control based on the assessed risk, and performing such other procedures as we considered necessary in the circumstances. We believe that our audit provides a reasonable basis for our opinion.
A company’s internal control over financial reporting is a process designed to provide reasonable assurance regarding the reliability of financial reporting and the preparation of financial statements for external purposes in accordance with generally accepted accounting principles. A company’s internal control over financial reporting includes those policies and procedures that (1) pertain to the maintenance of records that, in reasonable detail, accurately and fairly reflect the transactions and dispositions of the assets of the company; (2) provide reasonable assurance that transactions are recorded as necessary to permit preparation of financial statements in accordance with generally accepted accounting principles, and that receipts and expenditures of the company are being made only in accordance with authorizations of management and directors of the company; and (3) provide reasonable assurance regarding prevention or timely detection of unauthorized acquisition, use, or disposition of the company’s assets that could have a material effect on the financial statements.
Because of its inherent limitations, internal control over financial reporting may not prevent or detect misstatements. Also, projections of any evaluation of effectiveness to future periods are subject to the risk that controls may become inadequate because of changes in conditions, or that the degree of compliance with the policies or procedures may deteriorate.
In our opinion, Nalco Holding Company and subsidiaries maintained, in all material respects, effective internal control over financial reporting as of December 31, 2009, based on the COSO criteria.
We also have audited, in accordance with the standards of the Public Company Accounting Oversight Board (United States), the consolidated balance sheets of Nalco Holding Company and subsidiaries as of December 31, 2009 and 2008, and the related consolidated statements of operations, equity, and cash flows for each of the three years in the period ended December 31, 2009, and our report dated February 26, 2010, expressed an unqualified opinion thereon.
/s/ ERNST & YOUNG LLP
Chicago, Illinois
February 26, 2010
57
Table of Contents
Nalco Holding Company and Subsidiaries
Consolidated Balance Sheets
(dollars in millions)
| December 31, 2009 |
December 31, 2008 |
|||||||
| Assets |
||||||||
| Current assets: |
||||||||
| Cash and cash equivalents |
$ | 127.6 | $ | 61.8 | ||||
| Trade accounts receivable, less allowances of $17.8 and $23.8 in 2009 and 2008, respectively |
681.2 | 774.0 | ||||||
| Inventories |
313.8 | 411.8 | ||||||
| Deferred income taxes |
25.6 | 25.7 | ||||||
| Prepaid expenses, taxes and other current assets |
96.6 | 114.4 | ||||||
| Total current assets |
1,244.8 | 1,387.7 | ||||||
| Property, plant, and equipment, net |
678.1 | 703.7 | ||||||
| Goodwill |
1,800.0 | 1,700.1 | ||||||
| Other intangible assets, net |
1,055.9 | 1,076.4 | ||||||
| Deferred financing costs |
60.9 | 24.4 | ||||||
| Receivable from former shareholder |
— | 3.4 | ||||||
| Other noncurrent assets |
125.1 | 146.3 | ||||||
| Total assets |
$ | 4,964.8 | $ | 5,042.0 | ||||
| Liabilities and equity |
||||||||
| Current liabilities: |
||||||||
| Accounts payable |
$ | 315.4 | $ | 299.2 | ||||
| Accrued expenses |
192.6 | 199.2 | ||||||
| Accrued compensation |
139.0 | 110.2 | ||||||
| Short-term debt |
229.8 | 93.8 | ||||||
| Income taxes |
49.0 | 32.5 | ||||||
| Total current liabilities |
925.8 | 734.9 | ||||||
| Long-term debt |
2,714.3 | 3,129.6 | ||||||
| Deferred income taxes |
202.9 | 258.8 | ||||||
| Accrued pension benefits |
418.1 | 322.2 | ||||||
| Other liabilities |
212.1 | 183.8 | ||||||
| Equity: |
||||||||
| Nalco Holding Company shareholders’ equity: |
||||||||
| Common stock |
1.4 | 1.4 | ||||||
| Additional paid-in capital |
776.1 | 764.5 | ||||||
| Treasury stock |
(211.3 | ) | (211.3 | ) | ||||
| Accumulated deficit |
(227.8 | ) | (268.8 | ) | ||||
| Accumulated other comprehensive income |
133.2 | 107.5 | ||||||
| Nalco Holding Company shareholders’ equity |
471.6 | 393.3 | ||||||
| Noncontrolling interests |
20.0 | 19.4 | ||||||
| Total equity |
491.6 | 412.7 | ||||||
| Total liabilities and equity |
$ | 4,964.8 | $ | 5,042.0 | ||||
See notes to consolidated financial statements.
58
Table of Contents
Nalco Holding Company and Subsidiaries
Consolidated Statements of Operations
(dollars in millions, except per share amounts)
| Year ended December 31 | ||||||||||||
| 2009 | 2008 | 2007 | ||||||||||
| Net sales |
$ | 3,746.8 | $ | 4,212.4 | $ | 3,912.5 | ||||||
| Operating costs and expenses: |
||||||||||||
| Cost of product sold |
2,037.0 | 2,378.3 | 2,152.8 | |||||||||
| Selling, administrative and research expenses |
1,210.2 | 1,250.0 | 1,206.1 | |||||||||
| Amortization of intangible assets |
47.9 | 56.8 | 62.1 | |||||||||
| Restructuring expenses |
47.8 | 33.4 | 15.3 | |||||||||
| Gain on divestiture |
— | (38.1 | ) | — | ||||||||
| Impairment of goodwill |
— | 544.2 | — | |||||||||
| Total operating costs and expenses |
3,342.9 | 4,224.6 | 3,436.3 | |||||||||
| Operating earnings (loss) |
403.9 | (12.2 | ) | 476.2 | ||||||||
| Other income (expense), net |
(17.6 | ) | (17.4 | ) | (4.8 | ) | ||||||
| Interest income |
3.9 | 8.3 | 9.1 | |||||||||
| Interest expense |
(254.5 | ) | (258.8 | ) | (274.0 | ) | ||||||
| Earnings (loss) before income taxes |
135.7 | (280.1 | ) | 206.5 | ||||||||
| Income tax provision |
67.8 | 54.5 | 69.3 | |||||||||
| Net earnings (loss) |
67.9 | (334.6 | ) | 137.2 | ||||||||
| Less: Net earnings attributable to noncontrolling interests |
7.4 | 8.0 | 8.2 | |||||||||
| Net earnings (loss) attributable to Nalco Holding Company |
$ | 60.5 | $ | (342.6 | ) | $ | 129.0 | |||||
| Net earnings (loss) per share attributable to Nalco Holding Company common shareholders: |
||||||||||||
| Basic |
$ | 0.44 | $ | (2.44 | ) | $ | 0.90 | |||||
| Diluted |
$ | 0.44 | $ | (2.44 | ) | $ | 0.88 | |||||
| Weighted-average shares |
||||||||||||
| Basic |
138.2 | 140.1 | 143.2 | |||||||||
| Diluted |
138.6 | 140.1 | 146.7 | |||||||||
See notes to consolidated financial statements.
59
Table of Contents
Nalco Holding Company and Subsidiaries
Consolidated Statements of Equity
(dollars in millions, except per share amounts)
| Nalco Holding Company Shareholders’ Equity | ||||||||||||||||||||||||||||||
| Common Stock | Treasury Stock | Additional Paid-In Capital |
Retained Earnings (Accumulated Deficit) |
Accumulated Other Comprehensive Income |
Noncontrolling Interests |
Comprehensive Income (Loss) |
||||||||||||||||||||||||
| Shares | Amount | Shares | Amount | |||||||||||||||||||||||||||
| Balance at January 1, 2007 |
143,055,013 | $ | 1.4 | — | $ | — | $ | 740.9 | $ | (16.2 | ) | $ | 164.8 | $ | 12.6 | |||||||||||||||
| Share-based compensation |
56,249 | — | — | — | 8.8 | — | — | — | ||||||||||||||||||||||
| Warrant exercise |
1,265,806 | — | — | — | — | — | — | — | ||||||||||||||||||||||
| Purchases of treasury stock |
— | — | 4,588,500 | (108.0 | ) | — | — | — | — | |||||||||||||||||||||
| Dividends on common stock ($0.14 per share) |
— | — | — | — | — | (20.0 | ) | — | — | |||||||||||||||||||||
| Dividends paid to noncontrolling interests on subsidiary common stock |
— | — | — | — | — | — | — | (6.0 | ) | |||||||||||||||||||||
| Other changes in noncontrolling interests |
— | — | — | — | — | — | — | 0.4 | ||||||||||||||||||||||
| Adoption of uncertain tax position standard |
— | — | — | — | — | 7.9 | — | — | ||||||||||||||||||||||
| Net earnings |
— | — | — | — | — | 129.0 | — | 8.2 | $ | 137.2 | ||||||||||||||||||||
| Other comprehensive income (loss): |
||||||||||||||||||||||||||||||
| Net actuarial gains — net of tax of $26.4 |
— | — | — | — | — | — | 57.5 | — | 57.5 | |||||||||||||||||||||
| Net prior service credit — net of tax of $6.5 |
— | — | — | — | — | — | 11.8 | — | 11.8 | |||||||||||||||||||||
| Loss on derivatives — net of tax benefit of $0.4 |
— | — | — | — | — | — | (0.6 | ) | — | (0.6 | ) | |||||||||||||||||||
| Currency translation adjustments — net of tax of $22.3 |
— | — | — | — | — | — | 140.5 | 1.5 | 142.0 | |||||||||||||||||||||
| Comprehensive income |
— | 347.9 | ||||||||||||||||||||||||||||
| Less: Comprehensive income attributable to noncontrolling interests |
9.7 | |||||||||||||||||||||||||||||
| Comprehensive income attributable to Nalco Holding Company |
$ | 338.2 | ||||||||||||||||||||||||||||
| Balance at December 31, 2007 |
144,377,068 | 1.4 | 4,588,500 | (108.0 | ) | 749.7 | 100.7 | 374.0 | 16.7 | |||||||||||||||||||||
| Share-based compensation |
238,647 | — | — | — | 6.5 | — | — | — | ||||||||||||||||||||||
| Reclassification of restricted stock no longer subject to cash settlement |
— | — | — | — | 8.0 | — | — | — | ||||||||||||||||||||||
| Warrant exercise |
2,126,650 | — | — | — | — | — | — | — | ||||||||||||||||||||||
| Exercise of stock options |
21,665 | — | — | — | 0.3 | — | — | — | ||||||||||||||||||||||
| Increase in redemption value of noncontrolling interest |
— | — | — | — | — | (5.1 | ) | — | — | |||||||||||||||||||||
| Purchases of treasury stock |
— | — | 4,947,443 | (103.3 | ) | — | — | — | — | |||||||||||||||||||||
| Dividends on common stock ($0.14 per share) |
— | — | — | — | — | (19.6 | ) | — | — | |||||||||||||||||||||
| Dividends paid to noncontrolling interests on subsidiary common stock |
— | — | — | — | — | — | — | (7.7 | ) | |||||||||||||||||||||
| Other changes in noncontrolling interests |
— | — | — | — | — | — | — | (0.3 | ) | |||||||||||||||||||||
| Net loss |
— | — | — | — | — | (342.6 | ) | — | 8.0 | $ | (334.6 | ) | ||||||||||||||||||
| Other comprehensive income (loss): |
||||||||||||||||||||||||||||||
| Net actuarial losses — net of tax benefit of $18.6 |
— | — | — | — | — | — | (30.7 | ) | — | (30.7 | ) | |||||||||||||||||||
| Net prior service cost — net of tax benefit of $1.6 |
— | — | — | — | — | — | (5.2 | ) | — | (5.2 | ) | |||||||||||||||||||
| Gain on derivatives — net of tax of $0.8 |
— | — | — | — | — | — | 1.3 | — | 1.3 | |||||||||||||||||||||
| Currency translation adjustments — net of tax of $12.3 |
— | — | — | — | — | — | (231.4 | ) | 2.7 | (228.7 | ) | |||||||||||||||||||
| Comprehensive loss |
(597.9 | ) | ||||||||||||||||||||||||||||
| Less: Comprehensive income attributable to noncontrolling interests |
— | 10.7 | ||||||||||||||||||||||||||||
| Comprehensive loss attributable to Nalco Holding Company |
— | $ | (608.6 | ) | ||||||||||||||||||||||||||
60
Table of Contents
Nalco Holding Company and Subsidiaries
Consolidated Statements of Equity (continued)
(dollars in millions, except per share amounts)
| Nalco Holding Company Shareholders’ Equity | ||||||||||||||||||||||||||||||
| Common Stock | Treasury Stock | Additional Paid-In Capital |
Retained Earnings (Accumulated Deficit) |
Accumulated Other Comprehensive Income |
Noncontrolling Interests |
Comprehensive Income (Loss) |
||||||||||||||||||||||||
| Shares | Amount | Shares | Amount | |||||||||||||||||||||||||||
| Adjustment to adopt ASC 715-20-65-1 measurement provision: |
||||||||||||||||||||||||||||||
| Service cost, interest cost and expected return on plan assets for December 2007, net of tax benefit of $1.4 |
— | — | — | — | — | (2.7 | ) | — | — | |||||||||||||||||||||
| Amortization of net prior service credit for December 2007, net of tax of $0.2 |
— | — | — | — | — | 0.4 | (0.4 | ) | — | |||||||||||||||||||||
| Amortization of net gain for December 2007, net of tax of $0.1 |
— | — | — | — | — | 0.1 | (0.1 | ) | — | |||||||||||||||||||||
| Balance at December 31, 2008 |
146,764,030 | 1.4 | 9,535,943 | (211.3 | ) | 764.5 | (268.8 | ) | 107.5 | 19.4 | ||||||||||||||||||||
| Share-based compensation |
308,272 | — | — | — | 11.1 | — | — | — | ||||||||||||||||||||||
| Warrant exercise |
625,299 | — | — | — | — | — | — | — | ||||||||||||||||||||||
| Exercise of stock options |
32,930 | — | — | — | 0.5 | — | — | — | ||||||||||||||||||||||
| Increase in redemption value of noncontrolling interest |
— | — | — | — | — | (0.2 | ) | — | — | |||||||||||||||||||||
| Dividends on common stock ($0.14 per share) |
— | — | — | — | — | (19.3 | ) | — | — | |||||||||||||||||||||
| Dividends paid to noncontrolling interests on subsidiary common stock |
— | — | — | — | — | — | — | (7.2 | ) | |||||||||||||||||||||
| Other changes in noncontrolling interests |
— | — | — | — | — | — | — | 0.5 | ||||||||||||||||||||||
| Net earnings |
— | — | — | — | — | 60.5 | — | 7.4 | $ | 67.9 | ||||||||||||||||||||
| Other comprehensive income (loss): |
||||||||||||||||||||||||||||||
| Net actuarial losses – net of tax benefit of $36.2 |
— | — | — | — | — | — | (106.4 | ) | — | (106.4 | ) | |||||||||||||||||||
| Net prior service credit – net of tax benefit of $2.1 |
— | — | — | — | — | — | 14.0 | — | 14.0 | |||||||||||||||||||||
| Gain on derivatives – net of tax of $0.4 |
— | — | — | — | — | — | 0.6 | — | 0.6 | |||||||||||||||||||||
| Currency translation adjustments – net of tax benefit of $8.1 |
— | — | — | — | — | — | 117.5 | (0.1 | ) | 117.4 | ||||||||||||||||||||
| Comprehensive income |
93.5 | |||||||||||||||||||||||||||||
| Less: Comprehensive income attributable to noncontrolling interests |
7.3 | |||||||||||||||||||||||||||||
| Comprehensive income attributable to Nalco Holding Company |
$ | 86.2 | ||||||||||||||||||||||||||||
| Balance at December 31, 2009 |
147,730,531 | $ | 1.4 | 9,535,943 | $ | (211.3 | ) | $ | 776.1 | $ | (227.8 | ) | $ | 133.2 | $ | 20.0 | ||||||||||||||
See notes to consolidated financial statements.
61
Table of Contents
Nalco Holding Company and Subsidiaries
Consolidated Statements of Cash Flows
(dollars in millions)
| Year ended December 31 | ||||||||||||
| 2009 | 2008 | 2007 | ||||||||||
| Operating activities |
||||||||||||
| Net earnings (loss) |
$ | 67.9 | $ | (334.6 | ) | $ | 137.2 | |||||
| Adjustments to reconcile net earnings (loss) to net cash provided by operating activities: |
||||||||||||
| Depreciation |
142.3 | 136.6 | 132.3 | |||||||||
| Amortization |
47.9 | 56.8 | 62.1 | |||||||||
| Gain on divestiture |
— | (38.1 | ) | — | ||||||||
| Impairment of goodwill |
— | 544.2 | — | |||||||||
| Amortization of deferred financing costs and accretion of senior discount notes |
11.0 | 48.0 | 45.1 | |||||||||
| Loss on early extinguishment of debt |
20.5 | — | — | |||||||||
| Equity in earnings of unconsolidated subsidiaries, net of distributions |
1.2 | 1.9 | 0.9 | |||||||||
| Deferred income taxes |
(6.3 | ) | (30.7 | ) | 0.2 | |||||||
| Amortization of unearned employee compensation and accretion of obligation |
23.3 | 20.1 | 28.6 | |||||||||
| Defined benefit pension plan expense |
47.3 | 45.1 | 41.4 | |||||||||
| Defined benefit pension plan contributions |
(72.9 | ) | (86.2 | ) | (86.8 | ) | ||||||
| Other, net |
42.6 | 14.2 | 13.4 | |||||||||
| Changes in current assets and liabilities: |
||||||||||||
| Trade accounts receivable |
133.7 | (18.0 | ) | (55.4 | ) | |||||||
| Inventories |
117.1 | (92.8 | ) | 6.2 | ||||||||
| Accounts payable |
7.5 | (7.0 | ) | 7.3 | ||||||||
| Other |
10.7 | 23.6 | (9.1 | ) | ||||||||
| Net cash provided by operating activities |
593.8 | 283.1 | 323.4 | |||||||||
| Investing activities |
||||||||||||
| Additions to property, plant, and equipment, net |
(102.2 | ) | (133.1 | ) | (114.6 | ) | ||||||
| Business purchases |
(27.6 | ) | (21.7 | ) | (28.3 | ) | ||||||
| Net proceeds from divestiture |
— | 74.1 | — | |||||||||
| Other investing activities |
(6.0 | ) | (14.7 | ) | 1.2 | |||||||
| Net cash used for investing activities |
(135.8 | ) | (95.4 | ) | (141.7 | ) | ||||||
| Financing activities |
||||||||||||
| Cash dividends |
(19.3 | ) | (19.7 | ) | (15.1 | ) | ||||||
| Proceeds from long-term debt |
1,511.6 | 34.0 | 50.2 | |||||||||
| Payments of long-term debt |
(1,772.9 | ) | (70.8 | ) | (40.1 | ) | ||||||
| Short-term debt, net |
(45.7 | ) | (65.8 | ) | 13.6 | |||||||
| Redemption premium on early extinguishment of debt |
(9.2 | ) | — | — | ||||||||
| Deferred financing costs |
(54.7 | ) | — | — | ||||||||
| Purchases of treasury stock |
— | (103.3 | ) | (108.0 | ) | |||||||
| Other financing activities |
(8.4 | ) | (7.3 | ) | (5.9 | ) | ||||||
| Net cash used for financing activities |
(398.6 | ) | (232.9 | ) | (105.3 | ) | ||||||
| Effect of foreign exchange rate changes on cash and cash equivalents |
6.4 | (12.9 | ) | 6.2 | ||||||||
| Increase (decrease) in cash and cash equivalents |
65.8 | (58.1 | ) | 82.6 | ||||||||
| Cash and cash equivalents at beginning of the period |
61.8 | 119.9 | 37.3 | |||||||||
| Cash and cash equivalents at end of the period |
$ | 127.6 | $ | 61.8 | $ | 119.9 | ||||||
| Supplemental cash flows information |
||||||||||||
| Cash paid during the period for: |
||||||||||||
| Interest |
$ | 234.0 | $ | 213.7 | $ | 227.8 | ||||||
| Income taxes |
68.5 | 84.5 | 81.4 | |||||||||
See notes to consolidated financial statements.
62
Table of Contents
Nalco Holding Company and Subsidiaries
Notes to Consolidated Financial Statements
(dollars in millions, except per share amounts)
December 31, 2009
1. Description of Business and Change in Ownership
Description of Business
We are engaged in the worldwide manufacture and sale of highly specialized service chemical programs. This includes production and service related to the sale and application of chemicals and technology used in water treatment, pollution control, energy conservation, oil production and refining, steelmaking, papermaking, mining, and other industrial processes.
Change in Ownership
On November 4, 2003, Nalco Holding Company’s indirect subsidiary, Nalco Holdings LLC (the “Buyer”), a newly formed entity controlled by affiliates of The Blackstone Group, L.P., Apollo Management, L.P., and The Goldman Sachs Group, Inc. (collectively, the “Sponsors”), pursuant to a Stock Purchase Agreement (as amended, the “Stock Purchase Agreement”) with Suez S.A. (“Suez”) and certain of its affiliates, acquired the net assets of Ondeo Nalco Group (as defined below) for $4,127.1 million, including direct costs of the acquisition of $125.6 million, excluding assumed debt of $30.2 million, and subject to certain closing and post-closing adjustments (the “Acquisition”).
The Ondeo Nalco Group (the “Predecessor”) included Ondeo Nalco Company and subsidiaries (“ONC”) and certain subsidiaries of Nalco International SAS (“NIS”) plus Calgon Europe Limited (UK), owned by Degremont (a former related party). Ondeo Industrial Solutions North America, a subsidiary of ONC, was excluded from the Predecessor, as the Buyer did not acquire it.
2. Summary of Significant Accounting Policies
Basis of Presentation
All intercompany balances and transactions are eliminated. Investments in companies or partnerships in which we do not have control, but have the ability to exercise significant influence over operating and financial policies, are reported using the equity method.
Use of Estimates
The preparation of financial statements in conformity with accounting principles generally accepted in the United States requires management to make estimates and assumptions that affect the reported amounts of assets and liabilities and disclosure of contingent assets and liabilities at the date of the financial statements and the reported amounts of revenues and expenses during the reporting period. Actual results could differ from those estimates.
Reclassifications
Certain reclassifications have been made to the consolidated statements of operations for the years ended December 31, 2008 and 2007 to conform to the current year presentation.
These reclassifications had no effect on net earnings reported for any period.
Foreign Currency Translation
Local currencies are the functional currencies for most foreign operations. Their balance sheets and income statements are translated at current and average exchange rates, respectively, with any resulting translation adjustments included in the currency translation adjustment account in shareholders’ equity.
63
Table of Contents
2. Summary of Significant Accounting Policies (continued)
The financial statements of any foreign subsidiaries that operate in highly inflationary environments are translated using a combination of current, average, and historical exchange rates, with the resulting translation impact included in results of operations. Exchange adjustments resulting from transactions executed in different currencies are included in other income (expense), net in the statements of operations.
Concentration of Credit Risk
Credit risk represents the accounting loss that would be recognized at the reporting date if counterparties failed to perform as contracted. We believe the likelihood of incurring material losses due to concentration of credit risk is remote. The principal financial instruments subject to credit risk are as follows:
Cash and Cash Equivalents
A formal policy exists of placing these instruments in investment grade companies and institutions and limiting the size of an investment with any single entity.
Accounts Receivable
A large number of customers in diverse industries and geographies, as well as the practice of establishing reasonable credit lines, limits credit risk. The allowance for doubtful accounts is adequate to cover potential credit risk losses.
Foreign Exchange Contracts and Derivatives
Formal policies exist, which establish credit limits and investment grade credit criteria of “A” or better for all counterparties.
Cash and Cash Equivalents
Cash and cash equivalents include all cash balances and highly liquid investments with original maturities of three months or less.
Accounts Receivable and Allowance for Doubtful Accounts
Accounts receivable are carried at their face amounts less an allowance for doubtful accounts. On a periodic basis, we evaluate our accounts receivable and establish the allowance for doubtful accounts based on a combination of specific customer circumstances and credit conditions and based on a history of write-offs and collections. Our policy is generally to not charge interest on trade receivables after the invoice becomes past due. A receivable is considered past due if payments have not been received within agreed upon invoice terms. Write-offs are recorded at the time a customer receivable is deemed uncollectible.
Inventory Valuation
Inventories are valued at the lower of cost or market. Approximately 64% of the inventories at both December 31, 2009 and 2008 are valued using the average cost or first-in, first-out (FIFO) method. The remaining inventories are valued using the last-in, first-out (LIFO) method. Reported inventory amounts would have been $9.7 million and $30.5 million higher at December 31, 2009 and 2008, respectively, if the FIFO method of accounting had been used for all inventories.
The LIFO method is used only in the United States. Most of the countries outside of the United States where we have subsidiaries do not permit the use of the LIFO method. In those countries where its use is permitted, we have not adopted the LIFO method of inventory valuation because the value of the inventories in those countries is not significant.
64
Table of Contents
2. Summary of Significant Accounting Policies (continued)
Goodwill and Other Intangible Assets
We assess the recoverability of goodwill and other intangible assets with indefinite lives annually or whenever events or changes in circumstances indicate that the carrying amount of the asset may not be fully recoverable.
We have defined our operating segments as our reporting units. We use a two-step process to test goodwill for impairment. First, the reporting unit’s fair value is compared to its carrying value. Fair value is estimated using a discounted cash flow approach. If a reporting unit’s carrying amount exceeds its fair value, an indication exists that the reporting unit’s goodwill may be impaired, and the second step of the impairment test would be performed, which is used to measure the amount of the impairment loss, if any. In the second step, the implied fair value of the reporting unit’s goodwill is determined by allocating the reporting unit’s fair value to all of its assets and liabilities other than goodwill in a manner similar to a purchase price allocation. The implied fair value of the goodwill that results from the application of this second step is then compared to the carrying amount of the goodwill and an impairment charge would be recorded for the difference if the carrying value exceeds the implied fair value of the goodwill.
We test the carrying value of other intangible assets with indefinite lives by comparing the fair value of the intangible assets to the carrying value. Fair value is estimated using a relief of royalty approach, a discounted cash flow methodology.
We amortize most customer relationship intangibles using a declining-balance method over an estimated useful life of 16 years to reflect the pattern in which the economic benefits of that asset are realized. This amortization method considers the expected rate of customer attrition, which was based on historical attrition data that was also used in estimating the fair value of the customer relationship intangible acquired.
The straight-line method is used for all other assets subject to amortization. Patents and developed technology are primarily being amortized over an estimated useful life of 10 years.
Deferred Financing Costs
Deferred financing costs are incurred to obtain long-term financing and are amortized using the effective interest method over the term of the related debt. The amortization of deferred financing costs, which is classified in interest expense in the statement of operations, was $7.7 million, $9.7 million and $10.1 million for the years ended December 31, 2009, 2008 and 2007, respectively.
Asset Retirement Obligations
The fair value of a liability for an asset retirement obligation is recognized in the period in which it is incurred. The liability is adjusted to its present value in subsequent periods as accretion expense is recorded. The corresponding asset retirement costs are capitalized as part of the carrying amount of the related long-lived asset and depreciated over the asset’s useful life.
The liability for asset retirement obligations was $14.7 million and $4.8 million at December 31, 2009 and 2008, respectively, for remediation and demolition activities at certain manufacturing sites where legal obligations associated with the retirement of tangible long-lived assets exist and potential settlement dates can be determined. The liability for other asset retirement obligations cannot currently be measured as the retirement dates are not yet determinable. We will recognize the liability when sufficient information exists to estimate potential settlement dates. The increase in the liability during 2009 was mostly due to additional obligations recognized and revisions in estimated cash flows required to settle certain obligations.
Income Taxes
Income taxes are recognized during the period in which transactions enter into the determination of financial statement income, with deferred income taxes being provided for the tax effect of temporary differences between the carrying amount of assets and liabilities and their tax bases.
65
Table of Contents
2. Summary of Significant Accounting Policies (continued)
Deferred income taxes are provided on the undistributed earnings of foreign subsidiaries except to the extent such earnings are considered to be permanently reinvested in the subsidiary. In cases where available foreign tax credits will not offset income taxes, appropriate provisions are included in the consolidated statement of operations.
Valuation allowances are determined based on the realizability of the deferred tax assets. Relevant factors to determine the realizability of the assets include future taxable income, the expected timing of the reversal of temporary differences, tax planning strategies and the expiration dates of the various tax attributes. Valuation allowances are established for those assets that are determined to be more likely than not to expire without benefit, or for which income of the proper character is not anticipated.
The effect of a valuation allowance for a deferred tax asset that is expected to originate in the current year is included in the annual effective tax rate for the year. The effect of a change in the beginning-of-the-year balance of a valuation allowance resulting from a change in judgment about the realizability of the related deferred tax asset in future years is recognized in the interim period in which the change occurs.
We record liabilities for income tax uncertainties in accordance with the recognition and measurement criteria prescribed in authoritative guidance issued by the Financial Accounting Standards Board (“FASB”). The tax benefits and related reserves are measured throughout the year, taking into account new legislation, regulations, case law and audit results. We recognize income tax-related interest and penalties within the income tax provision.
Derivative Instruments
Derivatives are recognized as either assets or liabilities in the balance sheets at fair value.
Revenue Recognition
Revenue from sales of products, including amounts billed to customers for shipping and handling costs, is recognized at the time: (1) persuasive evidence of an arrangement exists, (2) ownership and all risks of loss have been transferred to the buyer, which is generally upon shipment, (3) the price is fixed and determinable, and (4) collectibility is reasonably assured. Revenue from services is recognized when the services are provided to the customer.
Cost of Product Sold
Cost of product sold includes the cost of inventory (materials and conversion costs) sold to customers, shipping and handling costs, and certain warehousing costs. It also includes inbound freight charges, purchasing and receiving costs, packaging, quality assurance costs, internal transfer costs, and other costs of our distribution network. It also includes supply chain administration, safety, health and environmental administration, and the costs of labor for services provided, whether as saleable services or as part of a multiple deliverables arrangement.
Selling, Administrative and Research Expenses
Selling expenses, which include the cost of our sales force and marketing staff and their related expenses, were $880.2 million, $972.4 million and $915.1 million for the years ended December 31, 2009, 2008 and 2007, respectively.
Administrative expenses primarily represent the cost of support functions, including information technology, finance, human resources and legal, as well as expenses for support facilities, executive management and management incentive plans. Administrative expenses were $255.4 million, $204.1 million and $225.2 million for the years ended December 31, 2009, 2008 and 2007, respectively.
Research and development expenses represent the cost of our research and development personnel and their related expenses, including research facilities in the United States, the Netherlands and Singapore.
66
Table of Contents
2. Summary of Significant Accounting Policies (continued)
Research and development expenses, totaled $74.6 million, $73.5 million and $65.8 million for the years ended December 31, 2009, 2008 and 2007, respectively. Research and development costs are charged to expense as incurred.
Recent Accounting Pronouncements
In September 2006, the FASB issued authoritative guidance for fair value measurements, which defines fair value, establishes a framework for measuring fair value, and expands disclosures about fair value measurements in the financial statements. In February 2008, the FASB issued authoritative guidance that delayed by one year the effective date for applying the guidance for fair value measurements to nonfinancial assets and nonfinancial liabilities measured at fair value on a nonrecurring basis. We adopted the authoritative guidance for fair value measurements for our nonfinancial assets and nonfinancial liabilities measured on a nonrecurring basis effective January 1, 2009, which did not have a material impact on our financial statements.
In December 2007, the FASB revised the authoritative guidance for business combinations. The guidance retains the underlying concepts of earlier authoritative guidance in that all business combinations are required to be accounted for under the acquisition method of accounting, but changes the method of applying the acquisition method in a number of significant aspects. We adopted the revised authoritative guidance effective January 1, 2009, which did not have a material impact on our financial statements.
In December 2007, the FASB issued authoritative guidance that amends earlier guidance for consolidation procedures for consistency with the requirements of the revised authoritative guidance for business combinations. The guidance also requires noncontrolling interests to be separately presented as a component of equity in the consolidated balance sheet and the amount of net earnings attributable to noncontrolling interests to be included in consolidated net earnings on the face of the income statement. We adopted the accounting provisions of the guidance on a prospective basis effective January 1, 2009. In addition, we adopted the presentation and disclosure requirements of the guidance on a retrospective basis in the first quarter of 2009.
In March 2008, the FASB issued authoritative guidance that amends and expands the disclosure requirements of earlier guidance with regard to derivatives and hedging activities. We adopted the guidance effective January 1, 2009. See Note 17.
In December 2008, the FASB issued authoritative guidance to require additional disclosures about assets held in an employer’s pension and other postretirement benefit plans. The guidance is effective for fiscal years ending after December 15, 2009. The additional disclosures are included in Note 14. Adoption of this guidance did not have an impact on our financial position, results of operations or cash flows.
In April 2009, the FASB issued additional authoritative guidance about (1) measuring the fair value of financial instruments when the markets become inactive and quoted prices may reflect distressed transactions, and (2) recording impairment charges on investments in debt instruments. We adopted the guidance in the second quarter of 2009, which did not have a material impact on our financial statements.
In May 2009, the FASB issued authoritative guidance that establishes general standards of accounting for and disclosure of events that occur after the balance sheet date but before financial statements are issued or are available to be issued. We adopted the guidance in the second quarter of 2009, which did not have an impact on our financial statements.
In June 2009, the FASB issued authoritative guidance that eliminates the qualifying special purpose entity concept, changes the requirements for derecognizing financial assets and requires enhanced disclosures about transfers of financial assets. The guidance also revises earlier guidance for determining whether an entity is a variable interest entity, requires a new approach for determining who should consolidate a variable interest entity, changes when it is necessary to reassess who should consolidate a
67
Table of Contents
2. Summary of Significant Accounting Policies (continued)
variable interest entity, and requires enhanced disclosures related to an enterprise’s involvement in variable interest entities. The guidance is effective for the first annual reporting period that begins after November 15, 2009. We are currently evaluating the effects that the guidance may have on our financial statements.
In June 2009, the FASB issued authoritative guidance that provides for the FASB Accounting Standards Codification (the “Codification”) to become the single official source of authoritative, nongovernmental U.S. generally accepted accounting principles (GAAP). The Codification did not change GAAP but reorganizes the literature. The guidance was effective for interim and annual periods ending after September 15, 2009, and we adopted the guidance in our financial statements for the third quarter of 2009. Adoption of this guidance did not have an impact on our financial position, results of operations or cash flows.
In August 2009, the FASB issued authoritative guidance on measuring the fair value of liabilities. The guidance clarifies that in circumstances in which a quoted price in an active market for the identical liability is not available, an entity is required to use one or more of the following valuation techniques to measure fair value: (1) the quoted price of the identical liability when traded as an asset, (2) quoted prices of similar liabilities or similar liabilities when traded as assets, and (3) an income approach, such as a present value technique, or a market approach, such as a technique that is based on the amount at the measurement date that the entity would pay to transfer the identical liability or would receive to enter into the identical liability. The guidance was effective for the first interim or annual reporting period beginning after its issuance (our fourth quarter of 2009). Adoption of the guidance did not have a material impact on our financial statements.
In October 2009, the FASB issued authoritative guidance that amends earlier guidance addressing the accounting for contractual arrangements in which an entity provides multiple products or services (deliverables) to a customer. The amendments address the unit of accounting for arrangements involving multiple deliverables and how arrangement consideration should be allocated to the separate units of accounting, when applicable, by establishing a selling price hierarchy for determining the selling price of a deliverable. The selling price used for each deliverable will be based on vendor-specific objective evidence if available, third-party evidence if vendor-specific objective evidence is not available, or estimated selling price if neither vendor-specific nor third-party evidence is available. The amendments also require that arrangement consideration be allocated at the inception of an arrangement to all deliverables using the relative selling price method. The guidance is effective for fiscal years beginning on or after June 15, 2010, with earlier application permitted. We are currently evaluating the effects that the guidance may have on our financial statements.
In October 2009, the FASB issued authoritative guidance that amends earlier guidance for revenue arrangements that include both tangible products and software elements. Tangible products containing software components and nonsoftware components that function together to deliver the tangible product’s essential functionality are no longer within the scope of guidance for recognizing revenue from the sale of software, but would be accounted for in accordance with other authoritative guidance. The guidance is effective for fiscal years beginning on or after June 15, 2010, with earlier application permitted. We are currently evaluating the effects that the guidance may have on our financial statements.
68
Table of Contents
3. Acquisitions and Divestitures
In March 2009, we acquired the assets of Crossbow Water, a regional high-purity water and water pre-treatment company, for $22.1 million. The purchase agreement provides for up to $21.0 million of additional contingent consideration based upon the achievement of specified revenue targets. The purchase price, including the estimated fair value of the additional contingent consideration, exceeded the fair value of the net tangible assets acquired by $30.3 million, which was allocated to goodwill and other intangible assets.
During 2008, we purchased 100% of the outstanding shares of TIORCO, Inc., a company engaged in the enhanced oil recovery business, for $8.5 million, net of cash acquired. The purchase agreement included a provision for two contingent payments. The first payment of $3.1 million was paid during 2008, and the second payment, which was paid in 2009, was $4.8 million. Both payments were accounted for as additional purchase price. The purchase price, including the contingent payments, exceeded the fair value of the net tangible assets acquired by $15.8 million, which was allocated to goodwill and other intangible assets.
In August 2008, we purchased the assets of G&L Soap Injection Enterprise, LLC and Six Degrees, LLC, companies engaged in the business of treating gas and oil wells, for $7.0 million. The purchase price exceeded the fair value of the net tangible assets acquired by $6.3 million, which was allocated to goodwill and other intangible assets. The purchase agreement included a provision for three contingent payments totaling $2.0 million that are earned if certain targets are achieved in the years 2009, 2010 and 2011. The 2009 target was achieved, and a payment of $0.7 million was made in 2009, which was accounted for as additional purchase price.
Other small business acquisitions were made during 2008 for a combined purchase price of $3.1 million, net of cash acquired. The purchase price exceeded the fair value of the net tangible assets acquired by $2.1 million, which was allocated to goodwill.
In September 2008, we completed the sale of our Finishing Technologies surface treatment business to Chemetall Corp., a subsidiary of Rockwood Holdings, Inc. Proceeds from the sale were $74.1 million, net of selling and other cash expenses of $0.9 million, and resulted in a gain of $38.1 million before income taxes. A plant in Jackson, Michigan, dedicated to the Finishing Technologies business, was included in the sale, along with dedicated Finishing Technologies sales, service, marketing, research and supply chain employees. The sale also included products, goodwill, customer relationships and other related assets. The Finishing Technologies business was not presented as a discontinued operation because its operations and cash flows were not clearly distinguished from the rest of the entity. On an after-tax basis, the transaction increased diluted earnings per share by 11 cents for the year ended December 31, 2008.
On December 10, 2007 (the “Effective Date”), we purchased an 87.5% interest in Mobotec USA, Inc. (“Mobotec”), a leading provider of combustion optimization and emission reduction capabilities, including engineering, equipment and chemistry for industrial and utility boilers. We accounted for the acquisition as a purchase, and the results of Mobotec’s operations were included in our consolidated financial statements from the date of acquisition. The purchase price was $27.9 million, net of $6.4 million of cash acquired. The purchase price is subject to certain adjustments as defined by the share purchase agreement. The purchase price exceeded the fair value of the net tangible assets acquired by $39.1 million, which was allocated to goodwill and other intangible assets.
Concurrent with the purchase of the 87.5% interest in Mobotec, we entered into an agreement with the minority shareholder that provides us with two options to purchase the remaining shares of Mobotec. Each option provides us with the right to purchase 50% of the remaining shares of Mobotec. The first option and second option can be exercised no earlier than two years and four years, respectively, after the Effective Date. Both options expire five years after the Effective Date. The exercise price for each option is based on Mobotec’s EBITDA, as defined in the agreement, for the four calendar quarters that precede the exercise date. The agreement also provides the minority shareholder with two options to sell the remaining shares of Mobotec to us, with terms identical to our purchase options.
The pro forma impact as if the aforementioned acquisitions had occurred at the beginning of the respective years is not significant.
69
Table of Contents
4. Securitization of Accounts Receivable
We have an accounts receivable securitization facility with a commercial paper conduit sponsored by one of the lenders under our senior credit facilities that provides up to $160.0 million in funding, based on availability of eligible receivables and satisfaction of other customary conditions, and which expires in June 2010.
Under the facility, Nalco Company (the Seller), a wholly owned indirect subsidiary of the Company, transfers all eligible trade accounts receivable (the Receivables) to a bankruptcy-remote, wholly owned, special purpose limited liability company (the Transferor). Pursuant to a Receivables Transfer Agreement, the Transferor then transfers an undivided interest in the Receivables to the commercial paper conduit or the related bank sponsor (the Transferees) in exchange for cash.
The financing fee charged by the Transferees under the facility is based on the amount funded and the conduit’s cost of funds for issuing commercial paper plus a margin that varies based on the leverage ratio as calculated under our senior credit facilities. The Transferees also charge a facility fee, which varies based on the same ratio, on 102% of the total funding commitment under the facility. Nalco Company services, administers and collects the Receivables, for which it receives a monthly servicing fee of 1% per annum of the average daily outstanding balance of Receivables.
Availability of funding under the facility depends primarily upon the outstanding Receivables balance from time to time. The facility may be terminated for, among other reasons, material breaches of representations and warranties, bankruptcies of the Seller or the Transferor, a judgment or order for the payment of money rendered against the Transferor, cross-defaults to our other debt, or breach of specified financial covenants. We are currently in compliance with these covenants.
The facility is accounted for as a secured borrowing, resulting in the funding and related Receivables being shown as liabilities and assets, respectively, on our consolidated balance sheet and the costs associated with the facility being recorded as interest expense. We had no outstanding borrowings at December 31, 2009 and $98.0 million of outstanding borrowings at December 31, 2008 under the facility.
5. Inventories
Inventories consist of the following:
| December 31, 2009 |
December 31, 2008 | |||||
| Finished products |
$ | 232.6 | $ | 301.6 | ||
| Raw materials and work-in-process |
81.2 | 110.2 | ||||
| $ | 313.8 | $ | 411.8 | |||
As of December 31, 2009 and 2008, our finished products inventories included $47.4 million and $56.0 million, respectively, of consignment inventories at customer sites to better serve and meet the needs of our customers.
70
Table of Contents
6. Goodwill
Changes in the carrying value of goodwill from January 1, 2008 to December 31, 2009 are summarized below:
| Water Services |
Paper Services |
Energy Services |
Total | |||||||||||||
| Balance as of January 1, 2008: |
||||||||||||||||
| Goodwill |
$ | 1,333.0 | $ | 563.0 | $ | 563.8 | $ | 2,459.8 | ||||||||
| Accumulated impairment losses |
— | — | — | — | ||||||||||||
| 1,333.0 | 563.0 | 563.8 | 2,459.8 | |||||||||||||
| Acquisitions |
4.5 | — | 12.3 | 16.8 | ||||||||||||
| Divestiture |
(28.3 | ) | — | — | (28.3 | ) | ||||||||||
| Impairment charge |
— | (544.2 | ) | — | (544.2 | ) | ||||||||||
| Purchase price allocations |
(20.5 | ) | — | — | (20.5 | ) | ||||||||||
| Other |
(8.1 | ) | (4.1 | ) | (4.6 | ) | (16.8 | ) | ||||||||
| Effect of foreign currency translation |
(103.8 | ) | (14.7 | ) | (48.2 | ) | (166.7 | ) | ||||||||
| Balance as of December 31, 2008: |
||||||||||||||||
| Goodwill |
1,176.8 | 544.2 | 523.3 | 2,244.3 | ||||||||||||
| Accumulated impairment losses |
— | (544.2 | ) | — | (544.2 | ) | ||||||||||
| 1,176.8 | — | 523.3 | 1,700.1 | |||||||||||||
| Acquisitions |
16.2 | — | — | 16.2 | ||||||||||||
| Contingent consideration |
— | — | 5.5 | 5.5 | ||||||||||||
| Purchase price allocations |
— | — | (3.5 | ) | (3.5 | ) | ||||||||||
| Other |
1.6 | — | — | 1.6 | ||||||||||||
| Effect of foreign currency translation |
58.0 | — | 22.1 | 80.1 | ||||||||||||
| Balance as of December 31, 2009: |
||||||||||||||||
| Goodwill |
1,252.6 | 544.2 | 547.4 | 2,344.2 | ||||||||||||
| Accumulated impairment losses |
— | (544.2 | ) | — | (544.2 | ) | ||||||||||
| $ | 1,252.6 | $ | — | $ | 547.4 | $ | 1,800.0 | |||||||||
We performed our annual impairment test during the fourth quarter 2009 and 2008. As a result of a significant decline in our stock price in the fourth quarter 2008 and a sharp deterioration in conditions within the paper industry and the general economy during that quarter, our impairment test indicated the potential for impairment in our Paper Services reporting unit. We performed the second step of the goodwill impairment test and determined that an impairment of goodwill existed. Accordingly, we recorded a non-cash goodwill impairment charge of $544.2 million in the fourth quarter 2008, reducing the goodwill balance of our Paper Services reporting unit to zero.
7. Other Intangible Assets
Intangible assets are summarized as follows:
| December 31, 2009 | December 31, 2008 | |||||||||||||
| Gross Amount |
Accumulated Amortization |
Gross Amount |
Accumulated Amortization |
|||||||||||
| Intangible assets subject to amortization: |
||||||||||||||
| Customer relationships |
$ | 521.5 | $ | (365.4 | ) | $ | 488.2 | $ | (315.8 | ) | ||||
| Patents and developed technology |
130.4 | (67.8 | ) | 126.3 | (55.0 | ) | ||||||||
| Other |
5.4 | (2.6 | ) | 4.9 | (2.2 | ) | ||||||||
| Intangibles not subject to amortization: |
||||||||||||||
| Trademarks and trade names |
834.4 | — | 830.0 | — | ||||||||||
| $ | 1,491.7 | $ | (435.8 | ) | $ | 1,449.4 | $ | (373.0 | ) | |||||
71
Table of Contents
7. Other Intangible Assets (continued)
Estimated annual amortization expense for the years 2010 through 2014 is as follows:
| Year ending December 31 |
|||
| 2010 |
$ | 42.9 | |
| 2011 |
38.0 | ||
| 2012 |
34.0 | ||
| 2013 |
28.9 | ||
| 2014 |
17.8 |
8. Contribution Agreement With Profit-Sharing Trust and Reimbursement Agreement with Suez
The Predecessor previously had an Employee Stock Ownership Plan (“ESOP”), which gave most U.S. employees an additional opportunity to share in the ownership of the Predecessor’s stock. Preferred shares were allocated to eligible employees based on a percentage of pretax earnings.
At the inception of the ESOP, the Predecessor and a trustee entered into a trust agreement, constituting the ESOP Trust, to fund benefits under the Predecessor’s ESOP. As part of its acquisition of Nalco Chemical Company in November 1999, Suez purchased from the trustee all of the issued and outstanding Series B ESOP Convertible Preferred Stock at a price of $1,060 per share. The trustee credited proceeds from the sale of allocated shares to participants’ accounts. Under the terms of an agreement (the “Contribution Agreement”), the Predecessor and the ESOP trustee agreed that the trustee would use proceeds from the sale of shares held in the loan suspense account to repay the outstanding principal and accrued interest on the ESOP loans. It was also agreed that all proceeds remaining after the repayment of the loans and accrued interest would be allocated to participants’ accounts. In return, the Predecessor agreed to make contributions to the Profit Sharing, Investment and Pay Deferral Plan Trust (the “Trust”) on or before December 31, 2010, having a present value equal to $124.6 million, the outstanding principal and accrued interest paid on the ESOP loans. The plan was amended effective January 1, 2003 to also permit matching contributions under the Company’s 401(k) plan to count as contributions to the Trust. The Contribution Agreement provides for specified minimum annual contributions to be made to the Trust, with interest accruing on the outstanding contribution balance at an annual rate of 8.5% compounded monthly. The contribution commitment becomes due and payable in its entirety if one or more events that are specified in the Contribution Agreement occur.
Pursuant to the Stock Purchase Agreement, we entered into an agreement (the “Reimbursement Agreement”) with Suez on November 4, 2003, whereby Suez shall reimburse us for all contributions we make to the Trust in order to satisfy our obligations under the Contribution Agreement. As part of the allocation of the Acquisition purchase price, we recorded a receivable from Suez of $112.7 million, equivalent to our recorded liability to the Trust, and recorded a $115.0 million unearned employee profit sharing asset, which was being amortized to reflect profit sharing and 401(k) matching contribution expenses in the period earned by employees. Interest accretes on the Suez receivable at the same rate that it accretes on our obligation to the Trust. The receivable does not have specific due dates, but under the terms of the Reimbursement Agreement, Suez is required to reimburse us immediately after we make any contributions to the Trust. The receivable is not secured by any Suez asset. However, under the terms of a sublease agreement with Leo Holding Company (“Leo”), a subsidiary of Suez, whereby we sublease our corporate headquarters and research facility from Leo, if Suez fails to pay any of the payments it is required to make under the Reimbursement Agreement, we have the right to set off such overdue amounts against the rent due under the sublease agreement (see Note 13). Conversely, under the terms of the Reimbursement Agreement, if we fail to pay when due any sublease rent (as defined in the sublease agreement), Suez shall have the right to reduce its reimbursement obligations to us pursuant to the Reimbursement Agreement by an amount equal to such shortfall.
The unamortized unearned employee profit sharing asset of $22.1 million as of December 31, 2008 was fully amortized in 2009, and an additional $7.4 million of profit sharing and 401(k) matching contribution
72
Table of Contents
8. Contribution Agreement With Profit-Sharing Trust and Reimbursement Agreement with Suez (continued)
expenses were accrued in the period. The receivable from Suez and the payable to the Trust were $14.6 million and $23.0 million, respectively, at December 31, 2009. Because Suez has been reimbursing us for all payments that we have made toward satisfying our obligations under the Contribution Agreement, expenses related to the Contribution Agreement had been non-cash in nature. Because our profit sharing and 401(k) matching contribution expenses for 2009 exceeded the remaining Contribution Agreement obligations, those excess expenses and future years’ expenses will require the use of cash.
Contributions to the Trust, profit sharing and 401(k) matching contribution expenses, and expenses recorded related to the Contribution Agreement are as follows:
| Year ended December 31 | |||||||||
| 2009 | 2008 | 2007 | |||||||
| Contributions to the Trust |
$ | 19.0 | $ | 27.0 | $ | 24.9 | |||
| Expense recorded: |
|||||||||
| Amortization of unearned employee profit sharing |
$ | 22.1 | $ | 17.4 | $ | 24.5 | |||
| Profit sharing and 401(k) matching contribution expense |
7.4 | — | — | ||||||
| Accretion of obligation to Trust |
1.3 | 2.7 | 4.1 | ||||||
| Total included in operating expenses |
$ | 30.8 | $ | 20.1 | $ | 28.6 | |||
Payments received from Suez and income recorded related to the reimbursement arrangement are as follows:
| Year ended December 31 | |||||||||
| 2009 | 2008 | 2007 | |||||||
| Payments received from Suez |
$ | 20.0 | $ | 27.0 | $ | 24.9 | |||
| Income recorded: |
|||||||||
| Accretion of receivable from Suez |
$ | 1.3 | $ | 2.7 | $ | 4.1 | |||
9. Property, Plant, and Equipment
Property, plant, and equipment (including major improvements) are recorded at cost. Depreciation of buildings and equipment is calculated over their estimated useful lives generally using the straight-line method. We classify depreciation expense in our consolidated statements of operations as cost of product sold or selling, administrative and research expenses consistent with the utilization of the underlying assets. Total depreciation expense for the years ended December 31, 2009, 2008 and 2007 was $142.3 million, $136.6 million and $132.3 million, respectively.
The estimated useful lives of the major classes of depreciable assets are as follows: buildings — 33 to 40 years; software — 5 years; equipment — 3 to 15 years.
Property, plant, and equipment consist of the following:
| December 31, 2009 |
December 31, 2008 |
|||||||
| Land |
$ | 83.6 | $ | 73.0 | ||||
| Buildings |
226.3 | 194.9 | ||||||
| Software |
154.9 | 154.2 | ||||||
| Equipment |
1,018.0 | 920.8 | ||||||
| 1,482.8 | 1,342.9 | |||||||
| Accumulated depreciation |
(804.7 | ) | (639.2 | ) | ||||
| Property, plant, and equipment, net |
$ | 678.1 | $ | 703.7 | ||||
73
Table of Contents
10. Income Tax
The provision for income taxes was calculated based upon the following components of earnings (loss) before income taxes:
| Year ended December 31 | ||||||||||
| 2009 | 2008 | 2007 | ||||||||
| United States |
$ | 34.5 | $ | (120.8 | ) | $ | 41.3 | |||
| Foreign |
101.2 | (159.3 | ) | 165.2 | ||||||
| Earnings (loss) before income taxes |
$ | 135.7 | $ | (280.1 | ) | $ | 206.5 | |||
The components of the income tax provision are as follows:
| Year ended December 31 | ||||||||||||
| 2009 | 2008 | 2007 | ||||||||||
| Current: |
||||||||||||
| Federal |
$ | — | $ | 2.1 | $ | — | ||||||
| State and local |
1.8 | 4.1 | 0.5 | |||||||||
| Foreign |
72.3 | 79.0 | 68.6 | |||||||||
| Total current |
74.1 | 85.2 | 69.1 | |||||||||
| Deferred: |
||||||||||||
| Federal |
2.7 | (36.1 | ) | 17.8 | ||||||||
| State and local |
(6.1 | ) | 0.1 | 0.6 | ||||||||
| Foreign |
(2.9 | ) | 5.3 | (18.2 | ) | |||||||
| Total deferred |
(6.3 | ) | (30.7 | ) | 0.2 | |||||||
| Income tax provision |
$ | 67.8 | $ | 54.5 | $ | 69.3 | ||||||
Deferred tax assets and liabilities are recognized for the expected future tax consequences of temporary differences between the financial statement basis and the tax basis of assets and liabilities using enacted statutory tax rates applicable to future years. Net deferred income tax assets (liabilities) are as follows:
| December 31, 2009 |
December 31, 2008 |
|||||||
| Retirement benefits |
$ | 59.7 | $ | 61.1 | ||||
| Pension |
116.2 | 78.4 | ||||||
| State and local net operating loss carryforwards |
8.9 | 8.5 | ||||||
| Foreign tax loss carryforwards |
66.9 | 47.0 | ||||||
| United States foreign tax credits |
73.6 | 70.0 | ||||||
| Other deferred tax assets |
136.8 | 108.2 | ||||||
| Total deferred tax assets |
462.1 | 373.2 | ||||||
| Valuation allowance |
(95.2 | ) | (49.6 | ) | ||||
| Net deferred tax assets |
$ | 366.9 | $ | 323.6 | ||||
| Property |
$ | (87.7 | ) | $ | (95.9 | ) | ||
| Intangible assets |
(437.0 | ) | (432.0 | ) | ||||
| Other deferred tax liabilities |
(22.8 | ) | (23.0 | ) | ||||
| Total deferred tax liabilities |
(547.5 | ) | (550.9 | ) | ||||
| Net deferred tax assets |
366.9 | 323.6 | ||||||
| Total deferred income taxes |
$ | (180.6 | ) | $ | (227.3 | ) | ||
| Included in: |
||||||||
| Deferred income taxes — current asset |
$ | 25.6 | $ | 25.7 | ||||
| Other noncurrent assets |
8.5 | 11.7 | ||||||
| Income taxes |
(11.8 | ) | (5.9 | ) | ||||
| Deferred income taxes — noncurrent liability |
(202.9 | ) | (258.8 | ) | ||||
| $ | (180.6 | ) | $ | (227.3 | ) | |||
74
Table of Contents
10. Income Tax (continued)
These deferred tax assets and liabilities are classified in the balance sheet based on the balance sheet classification of the related assets and liabilities.
Nalco Holding Company and its subsidiaries file income tax returns in the U.S. federal jurisdiction, various states and foreign jurisdictions, as required. With few exceptions, we are no longer subject to U.S. federal, state and local, or foreign income tax examinations by tax authorities for periods prior to 2004. To the extent that we are subject to additional tax assessments greater than $150,000 that relate to tax periods before November 4, 2003, we are indemnified by our former shareholder, Suez, and therefore have recorded a receivable for the related indemnity claim.
Authoritative guidance issued by the FASB clarifies the accounting for uncertainty in income taxes recognized in an enterprise’s financial statements by prescribing a recognition threshold and measurement attribute for the financial statement recognition and measurement of a tax position taken or expected to be taken in a tax return.
A reconciliation of the beginning and ending amounts of unrecognized tax benefits is as follows:
| Unrecognized Tax Benefit |
Suez Portion |
Nalco Portion |
||||||||||
| Balance at January 1, 2007 |
$ | 12.5 | $ | 3.0 | $ | 9.5 | ||||||
| Additions related to current year |
2.4 | — | 2.4 | |||||||||
| Additions related to prior years |
0.9 | 0.9 | — | |||||||||
| Reduction for positions taken in prior years |
(9.2 | ) | (1.2 | ) | (8.0 | ) | ||||||
| Settlements |
(1.4 | ) | (1.1 | ) | (0.3 | ) | ||||||
| Balance at December 31, 2007 |
5.2 | 1.6 | 3.6 | |||||||||
| Additions related to current year |
0.3 | — | 0.3 | |||||||||
| Additions related to prior years |
6.6 | 0.2 | 6.4 | |||||||||
| Reduction for positions taken in prior years |
(5.1 | ) | — | (5.1 | ) | |||||||
| Settlements |
(1.0 | ) | — | (1.0 | ) | |||||||
| Balance at December 31. 2008 |
6.0 | 1.8 | 4.2 | |||||||||
| Additions related to current year |
2.3 | — | 2.3 | |||||||||
| Additions related to prior years |
0.8 | 0.1 | 0.7 | |||||||||
| Reduction for positions taken in prior years |
(0.4 | ) | — | (0.4 | ) | |||||||
| Settlements |
— | — | — | |||||||||
| Balance at December 31, 2009 |
$ | 8.7 | $ | 1.9 | $ | 6.8 | ||||||
| Unrecognized tax benefits were comprised of the following at December 31, 2009: | ||||||||||||
| Unrecognized tax position |
$ | 7.5 | $ | 1.3 | $ | 6.2 | ||||||
| Interest |
1.2 | 0.6 | 0.6 | |||||||||
| Penalties |
— | — | — | |||||||||
| Balance at December 31, 2009 |
$ | 8.7 | $ | 1.9 | $ | 6.8 | ||||||
As of December 31, 2009, full recognition of the $8.7 million of tax benefits not previously recognized would have resulted in a reduction of the Suez receivable of $1.9 million and a favorable impact to the income tax provision of $6.8 million.
75
Table of Contents
10. Income Tax (continued)
The effective rate of the provision for income taxes differs from the United States statutory federal tax rate due to the following items:
| Year ended December 31 | ||||||||||||
| 2009 | 2008 | 2007 | ||||||||||
| United States statutory federal tax rate |
$ | 47.5 | $ | (98.0 | ) | $ | 72.3 | |||||
| State income taxes, net of federal benefits |
1.1 | 5.5 | 1.4 | |||||||||
| Change in state income tax rate |
(5.4 | ) | — | — | ||||||||
| Nondeductible goodwill |
— | 163.3 | — | |||||||||
| Foreign tax rate differential |
(19.3 | ) | (27.4 | ) | (25.1 | ) | ||||||
| Withholding taxes |
9.6 | 7.0 | 7.8 | |||||||||
| United States tax on foreign earnings |
1.9 | 4.6 | 11.4 | |||||||||
| Credits and incentives |
(2.5 | ) | (4.6 | ) | (1.6 | ) | ||||||
| Changes in valuation allowances |
29.0 | (15.6 | ) | 1.6 | ||||||||
| Uncertain tax positions |
2.6 | 1.6 | (5.9 | ) | ||||||||
| Nondeductible items |
8.2 | 18.1 | 10.3 | |||||||||
| Other |
(4.9 | ) | — | (2.9 | ) | |||||||
| Income tax provision |
$ | 67.8 | $ | 54.5 | $ | 69.3 | ||||||
No provision has been made for United States or foreign income taxes related to approximately $368.8 million of undistributed earnings of foreign subsidiaries at December 31, 2009, as we consider these earnings to be permanently reinvested. It is not practicable to estimate the additional income taxes and applicable withholding tax that would be payable on the remittance of such undistributed earnings.
At the end of 2007, we were carrying forward United States federal net operating losses of approximately $144.9 million ($50.7 million tax effect) expiring between 2024 and 2027. These losses were partly the result of deducting rather than crediting certain foreign taxes. The additional tax benefit of crediting the foreign taxes was reported in our balance sheet at December 31, 2007 as a deferred tax asset of $35.4 million, offset by a full valuation allowance. Because of a change in our U.S. tax position in 2008, we have amended the previous U.S. tax returns to realize the tax benefits of crediting foreign taxes and have credited foreign taxes in 2008 and 2009. Conversion of the previous foreign tax deductions to credits reduced the net operating loss carryforward, and the remaining federal net operating loss carryforward was fully consumed in 2008. Our balance sheet continues to report state and local tax loss carryforwards.
The U.S. foreign tax credit carryforward has increased to $73.6 million. The credits have a ten-year carryforward period, and will expire between 2015 and 2020 if not utilized. We assessed the realizability of the foreign tax credit carryforwards by considering historical trends and future projections of U.S. taxable income, including temporary differences. Our historical U.S. GAAP income includes significant expenses that are not deductible for U.S. tax purposes, including the 2008 goodwill impairment charge, which accelerates the use of the carryforwards on our tax returns. Utilization of the foreign tax credits is dependent upon future U.S. taxable income with the appropriate attributes. The U.S. income expectations were evaluated along with the expiration dates of the carryforwards, and we concluded that recognition of the tax benefits was appropriate.
We have approximately $92.6 million ($25.9 million tax effect) of U.K. capital loss carryforwards that do not expire. The losses can only be used to offset future capital gains in the U.K. A full valuation allowance has been established on these deferred tax assets.
We also have other net deferred tax assets in the U.K. of approximately $125.1 million ($35.0 million tax effect), including ordinary tax loss carryforwards of $52.8 million ($14.8 million tax effect) that do not expire. A full valuation allowance has been established on these deferred tax assets.
We have a net operating loss carryforward in Brazil of approximately $15.3 million ($5.2 million tax effect) that does not expire. A full valuation allowance has been established, as we do not foresee future taxable income to utilize the carryforward in this entity.
76
Table of Contents
10. Income Tax (continued)
We have net deferred tax assets in The Netherlands of approximately $76.1 million ($19.4 million tax effect). This includes net operating loss carryforwards of approximately $55.0 million ($14.0 million tax effect) that will expire between 2013 and 2019 if not utilized. A valuation allowance has been established on $63.1 million ($16.1 million tax effect) in part because of constraints on the utilization of the losses to shelter future income. In addition, projections of future income of the appropriate character are not sufficient to realize the benefits within a relevant period.
We have net deferred tax assets in France of $17.9 million ($6.1 million tax effect), including net operating losses that do not expire. A full valuation allowance has been established on these deferred tax assets.
We have valuation allowances on certain other foreign net deferred tax assets, including net operating loss carryforwards, with approximately $6.9 million tax effect.
11. Debt
Debt consists of the following:
| December 31, 2009 |
December 31, 2008 | |||||
| Short-term |
||||||
| Checks outstanding and bank overdrafts |
$ | 7.5 | $ | 24.7 | ||
| Notes payable to banks |
44.8 | 38.5 | ||||
| Current maturities of long-term debt |
177.5 | 30.6 | ||||
| $ | 229.8 | $ | 93.8 | |||
| Long-term |
||||||
| Securitized trade accounts receivable facility |
$ | — | $ | 98.0 | ||
| Term loan A, due November 2009 |
— | 30.5 | ||||
| Term loan B, due November 2010 |
167.0 | 887.0 | ||||
| Term loan B, due May 2016 |
746.2 | — | ||||
| Term loan C, due May 2016 (including discount of $26.7) |
273.3 | — | ||||
| Senior notes, due November 2011 |
— | 942.6 | ||||
| Senior subordinated notes, due November 2013 |
752.7 | 742.6 | ||||
| Senior discount notes, due February 2014 (including premium of $1.1 in 2009 and $1.4 in 2008) |
461.9 | 458.9 | ||||
| Senior notes, due May 2017 (including discount of $9.8) |
490.2 | — | ||||
| Other |
0.5 | 0.6 | ||||
| 2,891.8 | 3,160.2 | |||||
| Less: Current portion |
177.5 | 30.6 | ||||
| $ | 2,714.3 | $ | 3,129.6 | |||
The weighted-average interest rate on short-term debt was 2.80% and 5.05% at December 31, 2009 and December 31, 2008, respectively.
2009 Refinancing
On May 13, 2009, Nalco Company, an indirect subsidiary of Nalco Holding Company, entered into new senior secured credit facilities (the “New Senior Secured Credit Facilities”) consisting of a revolving credit facility expiring in May 2014 (the “New Revolving Credit Facility”) and a $750.0 million term loan facility expiring in May 2016 (the “New Term Loan B”). The New Revolving Credit Facility provides for borrowings of up to $250.0 million and replaced the former $250.0 million revolving credit facility that would have otherwise expired on November 4, 2009. The U.S. dollar equivalent of $150.0 million under
77
Table of Contents
11. Debt (continued)
the New Revolving Credit Facility can be used, subject to certain collateral obligations, for borrowings by Nalco Company and certain non-U.S. subsidiaries in euros, pounds sterling and other currencies to be agreed. The New Revolving Credit Facility also includes borrowing capacity available for letters of credit.
The terms of the New Senior Secured Credit Facilities also allowed us to make future additional term loan borrowings of up to $250.0 million on terms to be agreed with future lenders. On November 25, 2009, we entered into Amendment No. 1 (the “Amendment”) to the New Senior Secured Credit Facilities, which increased the amount of future additional term loan borrowings from $250.0 million to $550.0 million. The Amendment required that after giving effect to the incurrence of any such additional term loans and the application of the proceeds of such term loans to redeem our 7.75% senior notes due 2011, no more than $200.0 million of the 7.75% senior notes due 2011 could remain outstanding. The Amendment also permitted us to use up to $200.0 million of our cash to redeem our 7.75% senior notes due 2011 for a period of 180 days from the date of the Amendment, which was done.
On December 7, 2009, Nalco Company entered into a Joinder Agreement to the New Senior Secured Credit Facilities that provided for an additional $300.0 million term loan credit facility expiring in May 2016 (the “Term Loan C”). We borrowed the full amount of Term Loan C on December 7, 2009, at a discount of $27.0 million, or 9.00%, of such new term loan.
Borrowings under the New Revolving Credit Facility, New Term Loan B and Term Loan C bear interest at a floating base rate plus an applicable margin. The applicable margin for borrowings under the New Revolving Credit Facility ranges from 2.00% to 3.00% with respect to base rate borrowings and 3.00% to 4.00% with respect to LIBOR or Eurocurrency borrowings depending on our leverage ratio as defined by the revolving credit agreement. The initial margin for the New Revolving Credit Facility is 2.50% with respect to base rate borrowings and 3.50% with respect to LIBOR or Eurocurrency borrowings. The applicable margin for borrowings under New Term Loan B is 2.50% with respect to base rate borrowings and 3.50% with respect to LIBOR or Eurocurrency borrowings, with a base rate floor of 4.00% and a LIBOR or Eurocurrency floor of 3.00%. The applicable margin for borrowings under Term Loan C is 0.75% with respect to base rate borrowings and 1.75% with respect to LIBOR or Eurocurrency borrowings.
Interest is generally due quarterly in arrears, and is also due upon expiration of any particular loan. In addition, there is an annual loan commitment fee of 0.50% on the unused portion of the New Revolving Credit Facility. We are also required to pay a participation fee in respect of the undrawn portion of the letters of credit, at a rate per annum equal to the applicable margin for LIBOR or Eurocurrency borrowings under the New Revolving Credit Facility, a fronting fee at a rate of 0.25% per annum of the daily average amount, as well as customary letter of credit fees. As of December 31, 2009, we had $18.4 million in outstanding letters of credit, none of which had been drawn against.
New Term Loan B and Term Loan C are subject to amortization at 1% of the initial principal amount per annum, payable quarterly. The remaining principal amount of New Term Loan B and Term Loan C is due on May 13, 2016.
The New Senior Secured Credit Facilities are unconditionally guaranteed by Nalco Company, Nalco Holdings LLC (the direct parent company of Nalco Company), and certain domestic subsidiaries of Nalco Holdings LLC. The repayment of these facilities is secured by substantially all the assets of Nalco Company and the guarantors, including, but not limited to, a pledge of their capital stock and 65% of the capital stock of each non-U.S. subsidiary owned by the guarantors.
78
Table of Contents
11. Debt (continued)
At December 31, 2009, the weighted-average interest rate on borrowings under the New Senior Secured Credit Facilities was 5.21%. Amounts outstanding, as well as the base rates and applicable margins, at December 31, 2009 were as follows:
| 2009 | |||||||||
| Amount | Weighted Average Base Rate |
Applicable Margin |
|||||||
| New Revolving Credit Facility |
$ | — | — | — | |||||
| New Term Loan B |
746.2 | 3.00 | % | 3.50 | % | ||||
| Term Loan C (before discount of $26.7) |
300.0 | 0.23 | % | 1.75 | % | ||||
Also on May 13, 2009, Nalco Company issued $500.0 million aggregate principal amount of 8.25% senior unsecured notes (the “Notes”). The Notes were issued at a discount of $10.7 million. The Notes mature on May 15, 2017, with interest payable semi-annually on May 15 and November 15 of each year. The Notes do not have required principal payments prior to maturity. Each of the direct and indirect subsidiaries of Nalco Holdings LLC and Nalco Company that guarantees its obligations under the New Senior Secured Credit Facilities guarantees the Notes.
At its option, Nalco Company has the right to redeem some or all of the Notes beginning May 15, 2013, at the redemption prices set forth below (expressed as a percentage principal amount), plus accrued interest, if any, if redeemed during the twelve-month period commencing on May 15 of the years set forth below:
| Period |
Redemption Price |
||
| 2013 |
104.125 | % | |
| 2014 |
102.063 | % | |
| 2015 and thereafter |
100.000 | % |
Nalco Company also has the right to redeem some or all of the Notes prior to May 15, 2013, at a price equal to the principal amount of the notes, plus a specified “make-whole” premium.
Net proceeds from New Term Loan B and the Notes were used to repay the remaining $15.0 million balance of the existing term loan A maturing on November 4, 2009, to repay $720.0 million of the existing term loan B maturing on November 4, 2010, and to redeem $475.0 million aggregate principal amount of senior notes due November 2011. Available cash and net proceeds from Term Loan C were used to redeem €200.0 million aggregate principal amount of senior notes due November 2011 and the remaining $190.0 million aggregate principal amount of senior notes due November 2011. We refer to these transactions, the issuance of the Notes, and our entry into the New Revolving Credit Facility, New Term Loan B and Term Loan C, collectively, as the “Refinancing.”
As a result of the Refinancing, we incurred a $20.5 million loss on extinguishment of debt, which is included in other income (expense), net. The loss was comprised of $10.4 million of accelerated amortization of deferred financing costs related to the existing term loans and senior notes, a $9.2 million premium paid to redeem the $475.0 million of existing senior notes, and $0.9 million of other related charges.
In connection with the Refinancing, we recorded deferred financing costs of $54.7 million related to the New Revolving Credit Facility, New Term Loan B, Term Loan C and the Notes, which will be amortized over their respective terms using the effective interest method.
2003 Senior Secured Credit Facilities
On November 4, 2003, Nalco Company entered into senior secured credit facilities that included a $250.0 million revolving credit facility expiring in November 2009, a $200.0 million term loan A, a €88.0 million
79
Table of Contents
11. Debt (continued)
term loan A, and a $1,300.0 million term loan B. Nalco Holdings LLC, Nalco Company, and certain domestic subsidiaries of Nalco Holdings LLC unconditionally guarantee the senior secured credit facilities. The repayment of these facilities is secured by substantially all the assets of Nalco Company and the guarantors, including, but not limited to, a pledge of their capital stock and 65% of the capital stock of each non-U.S. subsidiary owned by the guarantors.
As part of the Refinancing, the New Revolving Credit Facility replaced the $250.0 million revolving facility that would have expired in November 2009, and we repaid the remaining $15.0 million balance of term loan A and $720.0 million of term loan B.
Borrowings under the term loan B facility bear interest at a floating base rate plus an applicable margin of 0.75% with respect to base rate borrowings and 1.75% with respect to LIBOR or Eurocurrency borrowings.
The weighted-average interest rate on borrowings under the 2003 senior secured credit facilities was 2.06% at December 31, 2009. Amounts outstanding, as well as the base rates and applicable margins, at December 31, 2009 and December 31, 2008 were as follows:
| 2009 | 2008 | |||||||||||||||||
| Amount | Weighted Average Base Rate |
Applicable Margin |
Amount | Weighted Average Base Rate |
Applicable Margin |
|||||||||||||
| Revolving credit facility |
$ | — | — | — | $ | — | — | — | ||||||||||
| Term loan A (euro) |
— | — | — | € | 22.0 | 3.00 | % | 2.00 | % | |||||||||
| Term loan B |
$ | 167.0 | 0.31 | % | 1.75 | % | $ | 887.0 | 2.37 | % | 1.75 | % | ||||||
Senior Notes, Senior Subordinated Notes and Senior Discount Notes
On November 4, 2003, Nalco Company issued senior notes and senior subordinated notes. The senior notes were issued in the principal amount of $665.0 million and €200.0 million and an interest rate of 7.75%. The senior subordinated notes were issued in the principal amount of $465.0 million and €200.0 million and interest rates of 8.875% and 9.00%, respectively. Interest is payable semi-annually on May 15 and November 15. The notes do not have required principal payments prior to maturity. The indirect subsidiaries of Nalco Holding Company and the direct and indirect subsidiaries of Nalco Company that guarantee Nalco Company’s obligations under the New Senior Secured Credit Facilities and the senior secured credit facilities guarantee the notes.
As part of the Refinancing, Nalco Company redeemed the $665.0 million and €200.0 million senior notes due 2011.
At its option, Nalco Company has the right to redeem some or all of the senior subordinated notes, beginning November 15, 2009, at the redemption prices set forth below (expressed as percentages of principal amount), plus accrued interest, if any, if redeemed during the twelve-month period commencing on November 15 of the years set forth below:
| Senior subordinated notes |
||||||
| Period |
U.S. dollar Redemption Price |
Euro Redemption Price |
||||
| 2009 |
102.958 | % | 103.000 | % | ||
| 2010 |
101.479 | % | 101.500 | % | ||
| 2011 and thereafter |
100.000 | % | 100.000 | % | ||
In January 2004, Nalco Holding Company’s 100%-owned subsidiaries, Nalco Finance Holdings LLC and Nalco Finance Holdings Inc. (together, the “Issuers”), issued $694.0 million aggregate principal amount at maturity of 9.00% senior discount notes due 2014. In December 2004, the Issuers redeemed a portion of the senior discount notes using proceeds from the initial public offering of common stock of Nalco Holding Company.
80
Table of Contents
11. Debt (continued)
After the partial redemption, the aggregate principal amount at maturity of the notes declined to $460.8 million. Prior to February 1, 2009, interest accrued on the notes in the form of an increase in the accreted value of such notes. The accreted value of each note increased from the date of issuance until February 1, 2009, at a rate of 9.00% per annum, reflecting the accrual of non-cash interest, such that the accreted value equaled the principal amount at maturity of $460.8 million. Cash interest payments on the notes became due and payable beginning in August 2009.
Nalco Holding Company and the Issuers do not generate any revenue, and Nalco Finance Holdings Inc. was incorporated solely to accommodate the issuance of the senior discount notes by Nalco Finance Holdings LLC. All of Nalco Holding Company’s consolidated assets are owned, and all of its consolidated net sales are earned, by its direct and indirect subsidiaries. As of December 31, 2009, Nalco Holding Company’s subsidiaries had $603.8 million of restricted net assets.
The terms of the New Senior Secured Credit Facilities and the 2003 senior credit facilities of Nalco Company limit the amount of dividends and other transfers by Nalco Holdings LLC and its subsidiaries to the Issuers or Nalco Holding Company. Further, the terms of the indentures governing the Notes and senior subordinated notes of Nalco Company significantly restrict Nalco Company and the Issuers’ other subsidiaries from paying dividends or otherwise transferring assets to the Issuers or Nalco Holding Company. The ability of Nalco Company to make such payments is governed by a formula based on its consolidated net income, as well as meeting certain other conditions. Notwithstanding such restrictions, such indentures permit an aggregate of $50.0 million of such payments to be made whether or not there is availability under the formula or the conditions to its use are met.
Covenants
The New Senior Secured Credit Facilities, the 2003 senior secured credit facilities, the Notes, the senior discount notes, and the senior subordinated notes contain a number of covenants that, among other things, restrict, subject to certain exceptions, our ability to sell assets; incur additional indebtedness or issue preferred stock; repay other indebtedness; pay dividends and distributions or repurchase certain capital stock; create liens on assets; make investments, loans or advances; make acquisitions, mergers or consolidations; enter into sale and leaseback transactions; engage in certain transactions with affiliates; amend certain material agreements governing our indebtedness; change our business; and enter into hedging agreements. In addition, we must maintain financial covenants, including a maximum total leverage ratio, a minimum interest coverage ratio, and a maximum capital expenditure limitation. The New Senior Secured Credit Facilities and the Notes also include a maximum total leverage ratio. We were in compliance with all covenants at December 31, 2009.
The following table presents the projected annual maturities of long-term debt for years after 2009:
| Year ending December 31 |
|||
| 2010 |
$ | 177.5 | |
| 2011 |
10.6 | ||
| 2012 |
10.6 | ||
| 2013 |
763.3 | ||
| 2014 |
471.5 | ||
| Thereafter |
1,493.7 | ||
| $ | 2,927.2 | ||
The $35.4 million difference between the total projected annual maturities of long-term debt of $2,927.2 million and the carrying value of $2,891.8 million is mostly attributable to the $26.7 million discount on Term Loan C and the $9.8 million discount on the Notes. Partly offsetting that difference is the $1.1 million unamortized premium attributable to the senior discount notes.
81
Table of Contents
12. Leases
We lease administrative, research, manufacturing, and warehouse facilities and data processing and other equipment under non-cancelable leases that expire at various dates through 2027. Rent expense totaled $44.4 million, $43.1 million and $39.4 million for the years ended December 31, 2009, 2008 and 2007, respectively.
Future minimum rental payments for operating leases related to facilities, with initial or remaining terms greater than one year, are as follows:
| Year ending December 31 |
|||
| 2010 |
$ | 35.2 | |
| 2011 |
47.0 | ||
| 2012 |
21.2 | ||
| 2013 |
17.3 | ||
| 2014 |
15.6 | ||
| Thereafter |
143.6 | ||
| $ | 279.9 | ||
The amounts in the table above include future minimum rental payments for our corporate headquarters and research facility of $17.1 million in 2010, $35.1 million in 2011, $12.7 million in 2012, $12.7 million in 2013, $12.7 million in 2014, and $112.0 million from 2015 through 2023.
13. Sale-Leaseback Transaction
In December 2002, the Predecessor entered into an agreement whereby it sold and leased back its corporate headquarters and research facility in Naperville, IL. As a result of the sale, the Predecessor received proceeds of $144.8 million, net of $5.2 million of transaction costs. The related lease was for an initial term of 25 years, and required the Predecessor to make total minimum payments of $264.2 million over the initial lease term. The lease agreement provided for two fixed rate renewal periods of 5 years each and two fair value renewal periods of 5 years each.
The Predecessor’s payment obligations, along with certain other items under the lease agreement, were fully guaranteed by Suez. Because of the guarantee, the Predecessor was precluded from accounting for this transaction as a sale and leaseback of the property and instead accounted for it as a financing, with an effective interest rate of 5.5%. The Predecessor provided a cross guarantee to Suez of any payments made by Suez under its guarantee.
Under the terms of an agreement executed November 4, 2003 between Leo Holding Company (Leo), a subsidiary of Suez, and us, we assigned our rights and obligations under the lease agreement to Leo. Simultaneously, Suez was released from its guarantee, and we entered into an agreement with Leo whereby we sublease our corporate headquarters and research facility from Leo. The terms of the sublease agreement are generally identical to those of the lease agreement that was assigned to Leo. As a result of these transactions, the leased property, the remaining obligation under the lease assigned to Leo, and the related deferred income taxes were removed from our balance sheet as part of the allocation of the Acquisition purchase price. We account for the sublease as an operating lease.
On November 4, 2003, we entered into a Reimbursement Agreement with Suez whereby Suez shall reimburse us for all contributions we make to the Profit Sharing, Investment and Pay Deferral Plan Trust (see Note 8). All remaining contributions for which Suez will be required to reimburse us will be made in 2010. Under the terms of the sublease agreement, if Suez fails to pay any of the payments required to be made under the Reimbursement Agreement, we shall have the right to set off such overdue amounts against the rent due under the sublease agreement.
82
Table of Contents
14. Pension and Other Postretirement Benefit Plans
We have several noncontributory, defined benefit pension plans covering most employees in the U.S. and those with certain foreign subsidiaries. We also provide a supplementary, nonqualified, unfunded plan for U.S. employees whose pension benefits exceed ERISA limitations. In addition, we have defined benefit postretirement plans that provide medical, dental, and life insurance benefits for substantially all U.S. retirees and eligible dependents. We retain the right to change or terminate these benefits.
At the end of 2002, the domestic pension plan was amended such that beginning January 2003, pension benefits no longer accrue for those participants in the pension plan hired or rehired after October 1999 and for those participants hired before November 1999, but with less than five years of vesting service at the end of 2002. However, these participants continued to earn vesting service. For those participants hired before November 1999 and with more than five years of vesting service, the pension plan was amended to reduce future benefit accruals and to increase the reduction factors for early retirement.
Also during 2002, eligibility for participation in the defined benefit postretirement medical and dental plans was changed from age 55 with at least ten years of service to age 55 with at least ten years of service after age 45. Also, employees with less than five years of service at the end of 2003 will only be provided access to coverage at retirement; we will not contribute to the cost of the coverage. The plans were also amended such that retirees and their dependents are required to pay 50% of plan costs in 2005 and beyond.
In 2009, the domestic pension plan was amended such that effective January 1, 2010, participants will no longer earn service credit. The defined benefit pension plan in the U.K. was similarly amended. The net periodic pension cost for those plans will no longer have a service component.
The following tables detail the changes in the funded status of defined benefit pension and other postretirement benefit plans:
83
Table of Contents
14. Pension and Other Postretirement Benefit Plans (continued)
| Pension Benefits | ||||||||||||||||
| U.S. | Non-U.S. | |||||||||||||||
| 2009 | 2008 | 2009 | 2008 | |||||||||||||
| Change in benefit obligation |
||||||||||||||||
| Benefit obligation at beginning of year |
$ | 391.0 | $ | 438.9 | $ | 290.5 | $ | 390.7 | ||||||||
| Service cost |
13.9 | 15.4 | 8.1 | 10.2 | ||||||||||||
| Interest cost |
25.3 | 26.6 | 18.0 | 20.9 | ||||||||||||
| Participant contributions |
— | — | 1.6 | 2.2 | ||||||||||||
| Plan amendments |
— | — | (17.3 | ) | — | |||||||||||
| Settlements and curtailments |
— | — | (5.3 | ) | (0.4 | ) | ||||||||||
| Actuarial (gain) loss |
105.6 | (28.2 | ) | 64.2 | (50.4 | ) | ||||||||||
| Benefits paid |
(76.0 | ) | (65.2 | ) | (11.0 | ) | (11.4 | ) | ||||||||
| Change in measurement date |
— | 3.5 | — | 2.5 | ||||||||||||
| Other |
— | — | 0.3 | (0.4 | ) | |||||||||||
| Foreign currency exchange rate changes |
— | — | 25.1 | (73.4 | ) | |||||||||||
| Benefit obligation at end of year |
459.8 | 391.0 | 374.2 | 290.5 | ||||||||||||
| Change in plan assets |
||||||||||||||||
| Fair value of plan assets at beginning of year |
183.4 | 276.8 | 176.3 | 239.3 | ||||||||||||
| Actual return on plan assets |
36.1 | (96.4 | ) | 20.4 | (22.7 | ) | ||||||||||
| Employer contributions |
53.8 | 66.3 | 19.1 | 19.9 | ||||||||||||
| Participant contributions |
— | — | 1.6 | 2.2 | ||||||||||||
| Settlements |
— | — | (5.1 | ) | (0.5 | ) | ||||||||||
| Benefits paid |
(76.0 | ) | (65.2 | ) | (11.0 | ) | (11.4 | ) | ||||||||
| Change in measurement date |
— | 1.9 | — | 1.1 | ||||||||||||
| Foreign currency exchange rate changes |
— | — | 16.7 | (51.6 | ) | |||||||||||
| Fair value of plan assets at end of year |
197.3 | 183.4 | 218.0 | 176.3 | ||||||||||||
| Funded status at December 31 |
$ | (262.5 | ) | $ | (207.6 | ) | $ | (156.2 | ) | $ | (114.2 | ) | ||||
| Accumulated benefit obligation |
$ | 353.1 | $ | 312.6 | $ | 333.9 | $ | 236.4 | ||||||||
| Other Postretirement Benefits | ||||||||
| 2009 | 2008 | |||||||
| Change in benefit obligation |
||||||||
| Benefit obligation at beginning of year |
$ | 140.4 | $ | 150.8 | ||||
| Service cost |
3.6 | 4.3 | ||||||
| Interest cost |
9.0 | 8.9 | ||||||
| Participant contributions |
7.0 | 7.1 | ||||||
| Medicare subsidy |
0.7 | 0.6 | ||||||
| Actuarial (gain) loss |
9.6 | (19.4 | ) | |||||
| Change in measurement date |
— | 1.1 | ||||||
| Other |
0.3 | (0.4 | ) | |||||
| Benefits paid |
(12.1 | ) | (12.6 | ) | ||||
| Benefit obligation at end of year |
158.5 | 140.4 | ||||||
| Change in plan assets |
||||||||
| Fair value of plan assets at beginning of year |
— | — | ||||||
| Employer contributions |
5.1 | 5.5 | ||||||
| Participant contributions |
7.0 | 7.1 | ||||||
| Benefits paid |
(12.1 | ) | (12.6 | ) | ||||
| Fair value of plan assets at end of year |
— | — | ||||||
| Funded status at December 31 |
$ | (158.5 | ) | $ | (140.4 | ) | ||
84
Table of Contents
14. Pension and Other Postretirement Benefit Plans (continued)
Amounts recognized in the balance sheets consist of:
| Pension Benefits | Other Postretirement Benefits |
|||||||||||||||||||||||
| U.S. | Non-U.S. | |||||||||||||||||||||||
| 2009 | 2008 | 2009 | 2008 | 2009 | 2008 | |||||||||||||||||||
| Other assets |
$ | — | $ | — | $ | 3.0 | $ | 4.7 | $ | — | $ | — | ||||||||||||
| Accrued compensation |
(0.4 | ) | (0.5 | ) | (3.2 | ) | (3.8 | ) | (7.2 | ) | (7.5 | ) | ||||||||||||
| Accrued pension benefits |
(262.1 | ) | (207.1 | ) | (156.0 | ) | (115.1 | ) | — | — | ||||||||||||||
| Other liabilities |
— | — | — | — | (151.3 | ) | (132.9 | ) | ||||||||||||||||
| Net amount recognized |
$ | (262.5 | ) | $ | (207.6 | ) | $ | (156.2 | ) | $ | (114.2 | ) | $ | (158.5 | ) | $ | (140.4 | ) | ||||||
The following amounts that have not yet been recognized in net pension expense and net other postretirement benefit expense are included in accumulated other comprehensive income at December 31, 2009:
| Pension Benefits | Other Postretirement Benefits |
|||||||||||
| U.S. | Non-U.S. | |||||||||||
| Net prior service (credit) |
$ | (18.4 | ) | $ | (16.2 | ) | $ | (1.3 | ) | |||
| Net actuarial loss (gain) |
144.3 | 16.4 | (30.5 | ) | ||||||||
The projected benefit obligation, accumulated benefit obligation, and fair value of plan assets for all defined benefit pension plans with projected benefit obligations in excess of plan assets were as follows:
| U.S. | Non-U.S. | |||||||||||
| 2009 | 2008 | 2009 | 2008 | |||||||||
| Projected benefit obligation |
$ | 459.8 | $ | 391.0 | $ | 359.0 | $ | 276.4 | ||||
| Accumulated benefit obligation |
353.1 | 312.6 | 323.6 | 226.1 | ||||||||
| Fair value of plan assets |
197.3 | 183.4 | 199.5 | 157.5 | ||||||||
The projected benefit obligation, accumulated benefit obligation, and fair value of plan assets for all defined benefit pension plans with accumulated benefit obligations in excess of plan assets were as follows:
| U.S. | Non-U.S. | |||||||||||
| 2009 | 2008 | 2009 | 2008 | |||||||||
| Projected benefit obligation |
$ | 459.8 | $ | 391.0 | $ | 352.3 | $ | 256.3 | ||||
| Accumulated benefit obligation |
353.1 | 312.6 | 319.2 | 210.6 | ||||||||
| Fair value of plan assets |
197.3 | 183.4 | 194.5 | 140.5 | ||||||||
Net pension expense for all defined benefit pension plans was comprised of:
| U.S. | Non-U.S. | |||||||||||||||||||||||
| 2009 | 2008 | 2007 | 2009 | 2008 | 2007 | |||||||||||||||||||
| Service cost |
$ | 13.9 | $ | 15.4 | $ | 16.8 | $ | 8.1 | $ | 10.2 | $ | 11.8 | ||||||||||||
| Interest cost |
25.3 | 26.6 | 26.5 | 18.0 | 20.9 | 18.8 | ||||||||||||||||||
| Expected return on plan assets |
(23.0 | ) | (22.2 | ) | (20.1 | ) | (13.8 | ) | (14.5 | ) | (13.7 | ) | ||||||||||||
| Amortization of prior service cost (credit) |
(2.3 | ) | (2.3 | ) | — | 0.1 | 0.1 | 0.1 | ||||||||||||||||
| Amortization of net actuarial (gain) loss |
0.6 | 0.2 | 0.2 | (2.3 | ) | 0.1 | 0.5 | |||||||||||||||||
| Settlements and curtailments |
22.2 | 10.5 | — | 0.5 | 0.1 | 0.5 | ||||||||||||||||||
| Net benefit expense |
$ | 36.7 | $ | 28.2 | $ | 23.4 | $ | 10.6 | $ | 16.9 | $ | 18.0 | ||||||||||||
85
Table of Contents
14. Pension and Other Postretirement Benefit Plans (continued)
The principal U.S. defined benefit pension plan provides terminating participants with an option to receive their pension benefits in the form of lump sum payments. Authoritative guidance for pension accounting requires settlement accounting if lump sum payments exceed the sum of the service and interest cost components of net periodic pension cost of the plan for the fiscal year. During 2009, a number of terminating participants received lump sum benefit payments, and the settlement accounting requirement was triggered, resulting in a $21.4 million settlement loss attributable to the principal U.S. pension plan in 2009.
Net other postretirement benefit expense was comprised of:
| 2009 | 2008 | 2007 | ||||||||||
| Service cost |
$ | 3.6 | $ | 4.3 | $ | 5.4 | ||||||
| Interest cost |
9.0 | 8.9 | 8.4 | |||||||||
| Amortization of prior service credit |
(3.3 | ) | (4.7 | ) | (4.7 | ) | ||||||
| Amortization of net actuarial gain |
(3.8 | ) | (2.6 | ) | (0.3 | ) | ||||||
| Net benefit expense |
$ | 5.5 | $ | 5.9 | $ | 8.8 | ||||||
The following amounts included in accumulated other comprehensive income at December 31, 2009 are expected to be recognized in net pension expense and net other postretirement benefit expense during the year ended December 31, 2010:
| Pension Benefits | Other Postretirement Benefits |
|||||||||||
| U.S. | Non-U.S. | |||||||||||
| Net prior service (credit) |
$ | (2.3 | ) | $ | (1.1 | ) | $ | (0.7 | ) | |||
| Net actuarial loss (gain) |
3.8 | 0.3 | (1.6 | ) | ||||||||
The weighted-average assumptions used for the U.S. defined benefit plan obligations as of the measurement date for each of the last two years were as follows:
| Pension Benefits | Other Postretirement Benefits |
|||||||||||
| 2009 | 2008 | 2009 | 2008 | |||||||||
| Discount rates |
5.50 | % | 6.85 | % | 5.85 | % | 6.80 | % | ||||
| Rates of increase in compensation levels |
4.44 | % | 4.44 | % | 4.37 | % | 4.37 | % | ||||
The weighted-average assumptions used for the non-U.S. defined benefit pension plan obligations as of the measurement date for each of the last two years were as follows:
| 2009 | 2008 | |||||
| Discount rates |
5.31 | % | 6.08 | % | ||
| Rates of increase in compensation levels |
2.43 | % | 3.48 | % |
The weighted-average assumptions used to determine net pension and other postretirement benefit expense for the U.S. defined benefit plans were as follows:
| 2009 | 2008 | 2007 | |||||||
| Discount rates: |
|||||||||
| Pension benefits |
6.02 | % | 6.25 | % | 5.65 | % | |||
| Other postretirement benefits |
6.80 | % | 6.45 | % | 5.65 | % | |||
| Rates of increase in compensation levels: |
|||||||||
| Pension benefits |
4.44 | % | 4.44 | % | 3.94 | % | |||
| Other postretirement benefits |
4.37 | % | 4.37 | % | 3.87 | % | |||
| Expected long-term return on plan assets |
8.25 | % | 8.25 | % | 8.50 | % |
86
Table of Contents
14. Pension and Other Postretirement Benefit Plans (continued)
The weighted-average assumptions used to determine net pension expense for the non-U.S. defined benefit pension plans were as follows:
| 2009 | 2008 | 2007 | |||||||
| Discount rates |
6.08 | % | 5.78 | % | 4.80 | % | |||
| Rates of increase in compensation levels |
3.48 | % | 3.88 | % | 3.62 | % | |||
| Expected long-term return on plan assets |
6.32 | % | 6.44 | % | 6.43 | % |
The assets in the principal domestic pension plan are invested to obtain a reasonable long-term rate of return at an acceptable level of investment risk. Risk tolerance is established through careful consideration of plan liabilities, plan funded status, and corporate financial condition. Investment risk is measured and monitored on an ongoing basis through periodic investment portfolio reviews, liability measurements and asset/liability studies. A similar approach to assessing investment risk and obtaining reasonable investment returns is employed for the foreign pension plans.
The assets in the principal domestic pension plan are diversified across equity, fixed income and alternative investments such as hedge funds and private equity. The investment portfolio has target allocations of approximately 49% equity, 32% fixed income and 19% alternative investments. Other assets such as real estate may be used judiciously to enhance portfolio returns and diversification. The foreign pension plans have comparable asset allocation to the principal domestic plan, with some variances for local practices.
The expected long-term rate of return is established using historical market data for each asset class as well as the target allocation. Historical markets are analyzed and long-term historical relationships between equity and fixed income investments are preserved consistent with the widely accepted capital market principle that assets with higher volatility will generate a greater return over the long run. Active management is employed in most asset classes, which also contributes to the return assumption. The total weighted-average return on each asset class supports the long-term expected rate of return assumption.
87
Table of Contents
14. Pension and Other Postretirement Benefit Plans (continued)
The fair values of our pension plan assets by asset category at December 31, 2009 were as follows:
| Asset Category |
Total | Quoted Prices (Level 1) |
Other Observable Inputs (Level 2) |
Unobservable Inputs (Level 3) | ||||||||
| U.S.: |
||||||||||||
| Equity securities: |
||||||||||||
| Large-cap disciplined (1) |
$ | 63.2 | $ | 63.2 | $ | — | $ | — | ||||
| Small/mid-cap (2) |
16.0 | 16.0 | — | — | ||||||||
| International |
24.0 | 24.0 | — | — | ||||||||
| Emerging markets |
2.2 | 2.2 | — | — | ||||||||
| Fixed income securities: |
||||||||||||
| Corporate and government |
41.1 | 41.1 | — | — | ||||||||
| High-yield bonds |
14.9 | 14.9 | — | — | ||||||||
| Emerging markets |
4.1 | 4.1 | — | — | ||||||||
| Alternative investments: |
||||||||||||
| Private equity funds (3) |
9.4 | — | — | 9.4 | ||||||||
| Hedge funds (4) |
21.3 | — | — | 21.3 | ||||||||
| Other |
1.1 | — | 1.1 | — | ||||||||
| Total plan assets – U.S. |
$ | 197.3 | $ | 165.5 | $ | 1.1 | $ | 30.7 | ||||
| Non-U.S.: |
||||||||||||
| Equity securities |
$ | 103.4 | $ | 103.4 | $ | — | $ | — | ||||
| Fixed income securities |
87.5 | 87.5 | — | — | ||||||||
| Other |
17.1 | 0.1 | 17.0 | — | ||||||||
| 208.0 | $ | 191.0 | $ | 17.0 | $ | — | ||||||
| All other |
10.0 | |||||||||||
| Total plan assets – Non-U.S. |
$ | 218.0 | ||||||||||
| (1) | Primarily common stocks included in the S&P 500 index. |
| (2) | Primarily common stocks with market capitalizations in the range of companies in the Russell 2500 index. |
| (3) | Primarily limited partnership interests in corporate finance and venture capital funds. |
| (4) | Consists of index-listed and over-the-counter securities including U.S. and international common and preferred stocks, debt securities, asset-backed securities and derivative instruments. |
Changes in the fair values of U.S. pension plan level 3 assets for the year ended December 31, 2009 were as follows:
| Total | Private Equity Funds |
Hedge Funds | |||||||||
| Balance at January 1, 2009 |
$ | 27.3 | $ | 9.2 | $ | 18.1 | |||||
| Actual return on plan assets: |
|||||||||||
| Relating to assets still held at year end |
(0.5 | ) | (3.2 | ) | 2.7 | ||||||
| Relating to assets sold during the year |
— | — | — | ||||||||
| Purchases, sales and settlements |
3.9 | 3.4 | 0.5 | ||||||||
| Balance at December 31, 2009 |
$ | 30.7 | $ | 9.4 | $ | 21.3 | |||||
88
Table of Contents
14. Pension and Other Postretirement Benefit Plans (continued)
The assumed health care cost trend rates used as of the measurement date for each of the last two years were as follows:
| 2009 | 2008 | |||||
| Health care cost trend rate assumed for next year |
||||||
| Pre-age 65 |
8.5 | % | 9.0 | % | ||
| Post-age 65 |
9.5 | % | 10.0 | % | ||
| Ultimate trend rate |
||||||
| Pre-age 65 |
5.5 | % | 5.5 | % | ||
| Post-age 65 |
5.5 | % | 5.5 | % | ||
| Year that the rate reaches the ultimate trend rate |
||||||
| Pre-age 65 |
2016 | 2015 | ||||
| Post-age 65 |
2018 | 2018 |
A one-percentage-point change in assumed health care cost trend rates would have the following effects:
| One-Percentage-Point | |||||||
| Increase | Decrease | ||||||
| Effect on total of service and interest cost components |
$ | 0.4 | $ | (0.5 | ) | ||
| Effect on postretirement benefit obligation |
5.1 | (6.0 | ) | ||||
We expect to contribute $67.7 million to our pension plans and $7.2 million to our other postretirement benefit plans in 2010.
The following estimated future benefit payments are expected to be paid in the years indicated:
| Pension Benefits | Other Postretirement Benefits | ||||||||||||||
| Year |
U.S. | Non-U.S. | Gross | Medicare Subsidy | Net | ||||||||||
| 2010 |
$ | 42.8 | $ | 10.9 | $ | 8.0 | $ | 0.8 | $ | 7.2 | |||||
| 2011 |
37.0 | 10.4 | 8.6 | 1.0 | 7.6 | ||||||||||
| 2012 |
40.0 | 11.1 | 9.3 | 1.1 | 8.2 | ||||||||||
| 2013 |
43.0 | 12.7 | 9.9 | 1.2 | 8.7 | ||||||||||
| 2014 |
46.7 | 13.1 | 10.7 | 1.4 | 9.3 | ||||||||||
| 2015-2019 |
272.3 | 73.0 | 64.7 | 7.0 | 57.7 | ||||||||||
15. Equity Compensation Plans
The Nalco Holding Company 2004 Stock Incentive Plan (the “Plan”) was adopted to aid us in recruiting and retaining key employees, directors and consultants and to motivate them to exert their best efforts on our behalf. The Plan, which permits the grant of stock options, stock appreciation rights, restricted stock and other stock-based awards for up to 7.5 million shares of common stock, is administered by the Compensation Committee of the Board of Directors. The Compensation Committee may delegate its duties and powers in whole or in part as it determines.
In connection with his employment as our President and Chief Executive Officer in 2008, J. Erik Fyrwald was granted 200,000 shares of restricted stock and 190,000 stock options outside the Plan. Of the restricted stock awards, 100,000 shares vest on each of the third and fourth anniversaries after the grant date. Of the stock option awards, which have a contractual term of ten years, 75,000 options vest on each of the third and fourth anniversaries after the grant date. The remaining 40,000 options vest ratably beginning on December 31, 2008, and on December 31 of the following three years.
Stock option awards granted under the Plan have a contractual term of ten years, and usually vest ratably over four years after the grant date. The exercise price of option awards is equal to the market price of Nalco Holding Company common stock on the date granted.
89
Table of Contents
15. Equity Compensation Plans (continued)
The fair value of option awards was estimated using the Black-Scholes option-pricing model and the following assumptions:
| 2009 | 2008 |
2007 | ||||||
| Expected life (years) |
6.25 | 6.125 – 6.75 | 6.25 | |||||
| Risk-free interest rate |
2.55 | % | 2.83% – 3.42% | 4.69 | % | |||
| Expected volatility |
58.68 | % | 38.34% –55.63% | 25.5 | % | |||
| Expected dividend yield |
1.17 | % | 0.61% – 0.98% | 0.58 | % |
Because Nalco Holding Company has been a public company only since November 2004, there is limited historical data on the volatility of its common stock. As a result, the expected volatility of the option awards was estimated using an implied volatility from traded options on Nalco Holding Company common stock. Since historical information concerning option exercise behavior by our employees is very limited and such information is not readily available from a peer group of companies, the expected life was estimated using the “simplified method” permitted by Staff Accounting Bulletin Nos. 107 and 110 issued by the SEC.
The following table summarizes the status of option awards as of December 31, 2009, and changes during the year then ended:
| Number of Shares |
Weighted- Average Exercise Price |
Weighted- Average Remaining Contractual Term |
Aggregate Intrinsic Value | ||||||||
| Outstanding at January 1, 2009 |
833,674 | $ | 19.32 | ||||||||
| Granted |
408,580 | 11.92 | |||||||||
| Exercised |
(32,930 | ) | 17.25 | ||||||||
| Forfeited |
(57,742 | ) | 17.52 | ||||||||
| Outstanding at December 31, 2009 |
1,151,582 | 16.86 | 8.4 | $ | 10.0 | ||||||
| Exercisable at December 31, 2009 |
465,518 | 17.70 | 7.9 | $ | 3.6 | ||||||
The weighted-average grant-date fair value of options granted during 2009, 2008 and 2007 was $6.16, $8.20 and $8.15, respectively.
Restricted stock awards are granted to non-management directors and certain key employees. Awards granted to non-management directors vest approximately two years after the grant date. Awards granted to key employees vest over periods ranging from approximately one to five years following the grant date. The fair value of restricted stock awards is determined based on the market price of Nalco Holding Company common stock on the date of grant. The weighted-average grant-date fair value of restricted stock awards granted during 2009, 2008 and 2007 was $12.49, $21.15 and $25.53, respectively.
The following table summarizes the status of restricted stock awards as of December 31, 2009, and changes during the year then ended:
| Number of Shares |
Weighted- Average Grant-Date Fair Value | |||||
| Nonvested restricted stock awards at January 1, 2009 |
438,176 | $ | 21.29 | |||
| Granted |
498,794 | 12.49 | ||||
| Vested |
(17,903 | ) | 22.35 | |||
| Forfeited |
(27,049 | ) | 11.92 | |||
| Nonvested restricted stock awards at December 31, 2009 |
892,018 | 16.63 | ||||
90
Table of Contents
15. Equity Compensation Plans (continued)
We recognize compensation expense related to option and restricted stock awards on a straight-line basis over the vesting periods. As of December 31, 2009, there was $12.5 million of total unrecognized compensation cost related to nonvested option and restricted stock awards. We expect to recognize that cost over a weighted-average period of 2.1 years. The fair value of restricted stock awards that vested during 2009, 2008 and 2007 was $0.4 million, $0.9 million and $0.9 million, respectively. The total intrinsic value of options exercised during 2009 and 2008 was $0.5 million in each year. Cash received from the exercise of stock options was $0.6 million and $0.4 million in 2009 and 2008, respectively. No option awards were exercised in 2007.
Performance share awards provide for the issuance of common stock to certain key employees if specified performance targets are achieved. For most performance share awards, the number of common shares that will be issued is dependent upon vesting and actual performance of the Company relative to certain financial targets approved by our Board of Directors, and could range from 0% to 150% of the performance shares granted. For certain performance share awards, the number of shares that will be issued could range from 0% to 200% of the performance shares granted. The performance shares vest approximately three years following the grant date. The fair value of performance share grants is determined based on the market price of Nalco Holding Company common stock on the date of grant, and the amount of compensation expense recognized reflects estimated forfeiture rates and management’s assessment of the probability that performance goals will be achieved. We recognize compensation expense related to performance share grants ratably over the vesting periods.
The following table summarizes the status of performance share awards as of December 31, 2009, and changes during the year then ended:
| Number of Shares |
Weighted- Average Grant-Date Fair Value | |||||
| Nonvested performance share awards at January 1, 2009 |
507,837 | $ | 21.63 | |||
| Granted |
656,782 | 11.92 | ||||
| Vested |
(81,300 | ) | 24.01 | |||
| Forfeited |
(232,653 | ) | 18.82 | |||
| Nonvested performance share awards at December 31, 2009 |
850,666 | 14.67 | ||||
There was $6.9 million of total unrecognized compensation cost related to performance share awards as of December 31, 2009, which we expect to recognize over a weighted-average period of 1.9 years. The fair value of performance share awards that vested during 2009, 2008 and 2007 was $2.1 million, $1.0 million and $1.1 million, respectively.
During 2004, Nalco LLC, wholly owned by the Sponsors and our direct parent company at the time, established the Nalco LLC 2004 Unit Plan (the “Unit Plan”) for purposes of (i) attracting and retaining exceptional officers and other key employees, non-employee directors and consultants and (ii) enabling such individuals to acquire an equity interest in Nalco LLC and to participate in its and our long-term growth and financial success.
During 2004, Nalco LLC granted certain of our officers and key employees rights to purchase a designated number of one or more classes of equity interests (“Units”) in Nalco LLC. Those officers and key employees who elected to purchase such Units did so at the Units’ fair value, discounted for any vesting provisions, as determined by a valuation consultant, since Nalco LLC is a private company and there is no public market for its shares.
The Units subject to the Unit Plan included class A, class B, class C, and class D Units. The class A Units were fully vested at the time of purchase by an employee and have economic characteristics that are similar to those of shares of common stock in a private corporation. The class B, class C, and class D Units were subject to vesting provisions, meaning that in order for such Units to be entitled to
91
Table of Contents
15. Equity Compensation Plans (continued)
distributions or other benefits, an employee would have to continue to provide services for a certain period of time. The Unit Plan was modified in 2006 to reduce the vesting period for class C and class D Units and to eliminate provisions that accelerated the vesting of those Units if specified EBITDA performance targets were achieved. The modifications did not result in incremental compensation expense.
Though Nalco LLC established the Unit Plan, we account for the Unit Plan since its economic substance is substantially the same for our employees and us. There has been no unrecognized compensation cost related to the Unit Plan since December 31, 2008.
Compensation cost charged to earnings for all equity compensation plans discussed above was $11.1 million, $5.9 million and $3.5 million for 2009, 2008 and 2007, respectively. The total income tax benefit recognized in the consolidated statement of operations was $4.2 million, $2.2 million and $1.3 million for 2009, 2008 and 2007, respectively.
We also recognized non-cash charges to earnings of $0.6 million during 2008 that resulted from modifying the terms of some Unit Plan awards for certain exiting employees. Most of these charges have been reported as part of restructuring expenses in the consolidated statement of operations. Due to the tax attributes of the Unit Plan, no tax benefit was recognized for the expense that resulted from modifying the terms of the awards.
In November 2007, it was announced that Dr. William H. Joyce, our Chairman and Chief Executive Officer, had stated his intention to retire on December 30, 2007. At the same time, it was also announced that we had entered into an amended Employment and Consulting Agreement with Dr. Joyce concerning his remaining service as CEO through the remainder of 2007, his consulting services through March 2008, and certain compensation matters. As part of the agreement, Dr. Joyce received a grant of nonvested common stock valued at $12.0 million. Vesting of the stock is subject to certain performance and other conditions. During 2008, 349,677 shares vested at a fair value of $5.6 million. No vesting occurred in 2009.
Because Dr. Joyce was not required to provide substantive services to us subsequent to 2007 and vesting of the stock was considered probable at the time, we charged the entire $12.0 million of compensation expense to earnings and recognized an income tax benefit of $4.6 million in 2007. Also, because the grant included a provision requiring cash settlement in the event of the death of Dr. Joyce, the $12.0 million was classified with other liabilities in the balance sheet until such time that cash settlement was no longer possible. We reclassified $8.0 million from other liabilities to additional paid-in capital during 2008 for that portion of the grant no longer subject to cash settlement. During 2009, $4.0 million of compensation cost related to 2009 performance was reversed once it was determined that targeted performance criteria would not be achieved. At December 31, 2009, there is no unrecognized compensation cost associated with this grant.
92
Table of Contents
16. Equity
Equity consists of the following:
| December 31, 2009 |
December 31, 2008 |
|||||||
| Preferred stock, par value $0.01 per share; authorized 100,000,000 shares; none issued |
$ | — | $ | — | ||||
| Common stock, par value $0.01 per share; authorized 500,000,000 shares; 147,730,531 shares and 146,764,030 shares issued at December 31, 2009 and December 31, 2008, respectively |
1.4 | 1.4 | ||||||
| Additional paid-in capital |
776.1 | 764.5 | ||||||
| Treasury stock, at cost; 9,535,943 shares at December 31, 2009 and December 31, 2008 |
(211.3 | ) | (211.3 | ) | ||||
| Accumulated deficit |
(227.8 | ) | (268.8 | ) | ||||
| Accumulated other comprehensive income: |
||||||||
| Net prior service credit |
28.8 | 14.8 | ||||||
| Net actuarial gain (loss) |
(91.1 | ) | 15.3 | |||||
| Derivatives |
— | (0.6 | ) | |||||
| Currency translation adjustments |
195.5 | 78.0 | ||||||
| 133.2 | 107.5 | |||||||
| Nalco Holding Company shareholders’ equity |
471.6 | 393.3 | ||||||
| Noncontrolling interests |
20.0 | 19.4 | ||||||
| Total equity |
$ | 491.6 | $ | 412.7 | ||||
In November 2004, a warrant to purchase, for $0.01 per share, up to 6,191,854 shares of Nalco Holding Company common stock was issued as part of a dividend to Nalco LLC, our sole stockholder on the record date of the dividend. The warrant enabled Nalco LLC to deliver shares to members of our management who had the right to put, or sell, their vested class B, class C and class D Units to Nalco LLC. Subject to limited exceptions, the warrant became exercisable upon the occurrence of the same specified events applicable to the vesting of the Nalco LLC class B Units, class C Units and class D Units (except that there was no service requirement comparable to that applicable to the individual holders of the class B, class C and class D Units). At December 31, 2008, Nalco LLC could repurchase up to 1,414,399 shares of Nalco Holding Company common stock under the warrant. Nalco LLC exercised warrants to acquire 625,299 shares of common stock during the year ended December 31, 2009, and agreed to terminate and waive all of its remaining rights under the warrant. Accordingly, the warrant for the remaining 789,100 shares was cancelled. Nalco LLC exercised warrants to acquire 2,126,650 and 1,265,806 shares of Nalco Holding Company common stock during 2008 and 2007, respectively.
On July 31, 2007, our Board of Directors authorized a $300 million share repurchase program, and gave our management discretion in determining the conditions under which shares may be purchased from time to time. The program has no stated expiration date. We repurchased 4,947,443 shares at a cost of $103.3 million during 2008 and 4,588,500 shares at a cost of $108.0 million during 2007.
17. Financial Instruments
We use derivative instruments to manage our foreign exchange and energy cost exposures. All derivative instruments are recognized in the consolidated balance sheets at fair value. Changes in the fair value of derivatives that are not designated as hedges are recognized in earnings as they occur. If the derivative instruments are designated as hedges, depending on their nature, the effective portions of changes in their fair values are either offset in earnings against the changes in the fair values of the items being hedged, or reflected initially as a separate component of equity and subsequently recognized in earnings when the hedged items are recognized in earnings. The ineffective portions of changes in the fair values of derivative instruments designated as hedges are immediately recognized in earnings.
93
Table of Contents
17. Financial Instruments (continued)
Counterparties to derivative financial instruments expose us to credit-related losses in the event of nonperformance, but we do not expect any counterparties to fail to meet their obligations given their high credit ratings.
Net Investment Hedges
We have used euro-denominated senior notes, senior subordinated notes and term loan borrowings as a hedge of our net investment in subsidiary companies whose assets, liabilities, and operations are measured using the euro as their functional currency. Because of the high degree of effectiveness between the hedging instruments and the exposure being hedged, fluctuations in the value of the euro-denominated debt due to exchange rate changes are offset by changes in the net investment. Accordingly, changes in the value of the euro-denominated debt are recognized in foreign currency translation adjustment, a component of accumulated other comprehensive income, to offset changes in the value of our net investment in subsidiary companies whose financial statements are measured using the euro as their functional currency.
The carrying value of euro-denominated debt designated as a net investment hedge was $287.7 million at December 31, 2009. Gains and losses from the net investment hedge reported as a component of other comprehensive income in the foreign currency translation adjustment account were as follows:
| Year ended December 31 | |||||||||||
| 2009 | 2008 | 2007 | |||||||||
| Gain (loss) before tax |
$ | (22.4 | ) | $ | 35.1 | $ | (71.0 | ) | |||
| Income tax (benefit) |
(8.6 | ) | 13.6 | (27.0 | ) | ||||||
| Net gain (loss) |
$ | (13.8 | ) | $ | 21.5 | $ | (44.0 | ) | |||
We formally assess, on a quarterly basis, whether the euro-denominated debt is effective at offsetting changes in the value of the underlying exposure. No hedge ineffectiveness was recorded in earnings during 2009, 2008 and 2007.
Cash Flow Hedges
We use derivative instruments such as foreign exchange forward contracts to hedge the variability of the cash flows from certain forecasted royalty payments due to changes in foreign exchange rates, and we use commodity forward contracts to manage our exposure to fluctuations in the cost of natural gas used in our business. These instruments are designated as cash flow hedges, with changes in their fair values included in other comprehensive income to the extent the hedges are effective. Amounts included in accumulated other comprehensive income are reclassified into earnings in the same period during which the hedged transaction is recognized in earnings. Changes in fair value representing hedge ineffectiveness are recognized in current earnings. No derivative instruments were designated as cash flow hedges at December 31, 2009, and no cash flow hedges were discontinued during 2009, 2008 and 2007.
Fair Value Hedges
For derivative instruments that are designated and qualify as a fair value hedge, the gain or loss on the derivative, as well as the offsetting loss or gain on the hedged item attributable to the hedged risk, are recognized in current earnings. No derivative instruments were designated as a fair value hedge at December 31, 2009.
Derivatives Not Designated as Hedging Instruments
We use foreign currency contracts to offset the impact of exchange rate changes on recognized assets and liabilities denominated in non-functional currencies, including intercompany receivables and payables.
94
Table of Contents
17. Financial Instruments (continued)
The gains or losses on these contracts, as well as the offsetting losses or gains resulting from the impact of changes in exchange rates on recognized assets and liabilities denominated in non-functional currencies, are recognized in current earnings.
Derivative instruments are not held or issued for trading or speculative purposes.
The notional amounts of derivative instruments outstanding as of December 31, 2009 were as follows:
| Notional Amount | |||
| Derivatives designated as hedges: |
|||
| Foreign exchange contracts |
$ | — | |
| Commodity contracts |
— | ||
| Total derivatives designated as hedges |
— | ||
| Derivatives not designated as hedges: |
|||
| Foreign exchange contracts |
119.4 | ||
| Total derivatives |
$ | 119.4 | |
The fair value and balance sheet presentation of derivative instruments as of December 31, 2009 were as follows:
| Balance Sheet Location |
Fair Value | ||||
| Asset derivatives: |
|||||
| Derivatives not designated as hedges: |
|||||
| Foreign exchange contracts |
Prepaid expenses, taxes and other current assets | $ | 0.3 | ||
| Total asset derivatives |
$ | 0.3 | |||
| Liability derivatives: |
|||||
| Derivatives not designated as hedges: |
|||||
| Foreign exchange contracts |
Other current liabilities | $ | 0.9 | ||
| $ | 0.9 | ||||
Gains and losses on derivative instruments for the year ended December 31, 2009 were as follows:
| Gain (Loss) Recognized in AOCI (1) (Effective Portion) |
Statement of Operations |
Gain (Loss) Recognized in Income (2) |
||||||||
| Derivatives designated as hedges: |
||||||||||
| Cash flow hedges: |
||||||||||
| Commodity contracts |
$ | (1.8 | ) | Cost of product sold | $ | (4.9 | ) | |||
| Foreign exchange contracts |
Other income (expense), net | 2.0 | ||||||||
| Net investment hedges: |
||||||||||
| Euro-denominated debt |
(22.4 | ) | N/A | |||||||
| Total derivatives designated as hedges |
(24.2 | ) | (2.9 | ) | ||||||
| Derivatives not designated as hedges: |
||||||||||
| Foreign exchange contracts |
— | Other income (expense), net | (2.9 | ) | ||||||
| Total derivatives |
$ | (24.2 | ) | $ | (5.8 | ) | ||||
| (1) | Accumulated other comprehensive income. |
| (2) | For derivatives designated as cash flow hedges, amounts represent the effective portion of the gains (losses) reclassified from AOCI; also includes immaterial amounts of hedge ineffectiveness. |
95
Table of Contents
18. Fair Value of Financial Instruments
Authoritative guidance issued by the FASB defines fair value as the price that would be received for an asset or paid to transfer a liability in an orderly transaction between market participants on the measurement date. The guidance establishes a fair value hierarchy that prioritizes observable and unobservable inputs used to measure fair value into three broad levels:
Level 1 — Quoted prices in active markets that are accessible at the measurement date for identical assets and liabilities. The fair value hierarchy gives the highest priority to Level 1 inputs.
Level 2 — Observable inputs other than quoted prices in active markets.
Level 3 — Unobservable inputs for which there is little or no market data available. The fair value hierarchy gives the lowest priority to Level 3 inputs.
The fair value of financial assets and liabilities measured at fair value on a recurring basis was as follows:
| Balance December 31, 2009 |
Level 1 | Level 2 | Level 3 | |||||||||
| Assets: |
||||||||||||
| Foreign exchange forward contracts |
$ | 0.3 | $ | — | $ | 0.3 | $ | — | ||||
| Liabilities: |
||||||||||||
| Foreign exchange forward contracts |
$ | 0.9 | $ | — | $ | 0.9 | $ | — | ||||
| Balance December 31, 2008 |
Level 1 | Level 2 | Level 3 | |||||||||
| Assets: |
||||||||||||
| Foreign exchange forward contracts |
$ | 2.5 | $ | — | $ | 2.5 | $ | — | ||||
| Liabilities: |
||||||||||||
| Foreign exchange forward contracts |
$ | 1.9 | $ | — | $ | 1.9 | $ | — | ||||
| Natural gas forward contracts |
3.1 | — | 3.1 | — | ||||||||
| $ | 5.0 | $ | — | $ | 5.0 | $ | — | |||||
Foreign exchange forward contracts are valued using quoted forward foreign exchange prices at the reporting date. Natural gas forward contracts are valued using NYMEX futures prices for natural gas at the reporting date.
The carrying values of cash and cash equivalents, trade accounts receivable, accounts payable and short-term debt approximate their fair values at December 31, 2009 and 2008, because of the short-term maturities and nature of these balances.
The estimated fair value of long-term debt at December 31, 2009 and 2008 was $2,769.7 million and $2,773.9 million, respectively, and the related carrying value was $2,714.3 million and $3,129.6 million, respectively. The fair value of our senior notes, senior subordinated notes and senior discount notes was estimated based on their quoted market prices. The carrying value of amounts outstanding under our senior secured credit facilities is considered to approximate fair value because interest accrues at rates that fluctuate with interest rate trends. The carrying value of other long-term debt outstanding also approximates fair value due to the variable nature of their interest rates.
19. Restructuring Expenses
We continuously redesign and optimize our business and work processes, and restructure our organization accordingly. During the year ended December 31, 2009, plans were approved to set a lower cost base through restructuring actions, primarily in Europe. As a result, we recognized $47.8 million of restructuring costs in 2009, which included $27.1 million in charges for employee severance and related
96
Table of Contents
19. Restructuring Expenses (continued)
costs, reflecting a reduction in force of more than 300 positions. In addition, certain long-lived assets held and used were written down to their estimated fair value, resulting in an impairment loss of $20.2 million. The fair value of the assets was measured using a combination of market participant inputs and internal cash flow estimates (i.e., Level 3 in the fair value hierarchy established by authoritative guidance issued by the FASB for fair value measurements). We also recognized $0.5 million of losses on assets disposed of as part of our restructuring activities.
Restructuring expenses, representing mostly employee severance and related costs, were $33.4 million and $15.3 million for the years ended December 31, 2008 and 2007, respectively. The increase in restructuring expenses in 2008 was mainly the result of a reduction in force of more than 400 positions as part of an organizational realignment.
Restructuring accruals of $29.5 million and $28.2 million as of December 31, 2009 and 2008, respectively, were included in other current liabilities on the consolidated balance sheet. All restructuring-related payments in 2009, 2008 and 2007 were funded with cash from operations, and we expect that future payments also will be funded with cash from operations. The following table summarizes the activity for the restructuring charges discussed above and the related accrual:
| Severance, Termination Benefits and Other |
Asset Impairments and Disposals |
Total | ||||||||||
| Balance as of December 31, 2006 |
$ | 7.1 | $ | — | $ | 7.1 | ||||||
| Charges to restructuring expense |
16.1 | (0.8 | ) | 15.3 | ||||||||
| Cash payments |
(15.5 | ) | — | (15.5 | ) | |||||||
| Asset writedowns and disposals |
— | 0.8 | 0.8 | |||||||||
| Currency translation adjustments |
0.7 | — | 0.7 | |||||||||
| Balance as of December 31, 2007 |
8.4 | — | 8.4 | |||||||||
| Charges to restructuring expense |
33.4 | — | 33.4 | |||||||||
| Cash payments |
(11.5 | ) | — | (11.5 | ) | |||||||
| Currency translation adjustments |
(2.1 | ) | — | (2.1 | ) | |||||||
| Balance as of December 31, 2008 |
28.2 | — | 28.2 | |||||||||
| Charges to restructuring expense |
27.1 | 20.7 | 47.8 | |||||||||
| Cash payments |
(26.5 | ) | — | (26.5 | ) | |||||||
| Asset writedowns and disposals |
— | (20.7 | ) | (20.7 | ) | |||||||
| Currency translation adjustments |
0.7 | — | 0.7 | |||||||||
| Balance as of December 31, 2009 |
$ | 29.5 | $ | — | $ | 29.5 | ||||||
20. Summary of Other Income (Expense), Net
The components of other income (expense), net in the statements of operations include the following:
| Year ended December 31 | ||||||||||||
| 2009 | 2008 | 2007 | ||||||||||
| Loss on early extinguishment of debt |
$ | (20.5 | ) | $ | — | $ | — | |||||
| Franchise taxes |
(0.9 | ) | 0.1 | (3.0 | ) | |||||||
| Equity in earnings of unconsolidated subsidiaries |
0.6 | 0.3 | 1.4 | |||||||||
| Foreign currency exchange adjustments |
1.9 | (10.7 | ) | (1.1 | ) | |||||||
| Other income (expense), net |
1.3 | (7.1 | ) | (2.1 | ) | |||||||
| $ | (17.6 | ) | $ | (17.4 | ) | $ | (4.8 | ) | ||||
97
Table of Contents
21. Earnings Per Share
Basic earnings per share is computed by dividing net earnings attributable to Nalco Holding Company common shareholders by the weighted-average number of common shares outstanding during the period. Diluted earnings per share reflects the potential dilution that could occur if securities or other contracts to issue common stock were exercised or converted into common stock or resulted in the issuance of common stock.
Basic and diluted earnings per share were calculated as follows:
| Year ended December 31 | ||||||||||
| (in millions) | 2009 | 2008 | 2007 | |||||||
| Numerator for basic and diluted earnings per share attributable to Nalco Holding Company common shareholders: |
||||||||||
| Net earnings (loss) attributable to Nalco Holding Company |
$ | 60.5 | $ | (342.6 | ) | $ | 129.0 | |||
| Denominator for basic earnings per share – weighted average common shares outstanding |
138.2 | 140.1 | 143.2 | |||||||
| Effect of dilutive securities: |
||||||||||
| Stock purchase warrant |
— | — | 3.4 | |||||||
| Share-based compensation plans |
0.4 | — | 0.1 | |||||||
| Denominator for diluted earnings per share |
138.6 | 140.1 | 146.7 | |||||||
There were 0.5 million shares, 2.4 million shares and 0.1 million shares potentially issuable under share-based compensation plans at December 31, 2009, 2008 and 2007, respectively, that were excluded from our diluted earnings per share computation, as the effect of including such shares would be anti-dilutive.
22. Segment Information
We provide integrated water treatment and process improvement services for industrial and institutional applications, using technologically advanced solutions, combining chemical products and equipment, and consistent, reliable on-site service and expertise.
These solutions and services enable our customers to improve production yields, lower manufacturing costs, extend asset lives and maintain environmental standards at costs that represent a small share of their overall production expense.
We operate three reportable segments:
Water Services — This segment serves the global water treatment and process chemical needs of the industrial, institutional, and municipal markets.
Paper Services — This segment serves the process chemicals and water treatment needs of the global pulp and paper industry.
Energy Services — This segment serves the process chemicals and water treatment needs of the global petroleum and petrochemical industries in both upstream and downstream applications.
In 2009, our Industrial and Institutional Services segment was renamed Water Services. We also began reporting Other segment results related to the Water Services, Paper Services and Energy Services segments with those segments. This former segment included an Integrated Channels group, supply chain activities, standard cost variances, and certain other operating expenses. In addition, we discontinued the assessment of an internal non-GAAP “capital charge” to each segment. Amounts for prior periods have been restated to conform with these changes.
98
Table of Contents
22. Segment Information (continued)
We evaluate the performance of our segments based on “direct contribution”, which is defined as net sales, less cost of products sold, selling and service expenses, marketing expenses, and research expenses directly attributable to each segment. There are no intersegment revenues.
Net sales by reportable segment were as follows:
| Year ended December 31 | |||||||||
| 2009 | 2008 | 2007 | |||||||
| Water Services |
$ | 1,662.4 | $ | 1,919.0 | $ | 1,846.0 | |||
| Paper Services |
666.0 | 778.0 | 778.4 | ||||||
| Energy Services |
1,418.4 | 1,515.4 | 1,288.1 | ||||||
| Net sales |
$ | 3,746.8 | $ | 4,212.4 | $ | 3,912.5 | |||
The following table presents direct contribution by reportable segment and reconciles the total segment direct contribution to earnings (loss) before income taxes:
| Year ended December 31 | ||||||||||||
| 2009 | 2008 | 2007 | ||||||||||
| Segment direct contribution: |
||||||||||||
| Water Services |
$ | 322.4 | $ | 370.8 | $ | 368.6 | ||||||
| Paper Services |
117.7 | 101.9 | 127.1 | |||||||||
| Energy Services |
314.9 | 315.5 | 283.1 | |||||||||
| Total segment direct contribution |
755.0 | 788.2 | 778.8 | |||||||||
| Expenses not allocated to segments: |
||||||||||||
| Administrative expenses |
255.4 | 204.1 | 225.2 | |||||||||
| Amortization of intangible assets |
47.9 | 56.8 | 62.1 | |||||||||
| Restructuring expenses |
47.8 | 33.4 | 15.3 | |||||||||
| Gain on divestiture |
— | (38.1 | ) | — | ||||||||
| Impairment of goodwill |
— | 544.2 | — | |||||||||
| Operating earnings (loss) |
403.9 | (12.2 | ) | 476.2 | ||||||||
| Other income (expense), net |
(17.6 | ) | (17.4 | ) | (4.8 | ) | ||||||
| Interest income |
3.9 | 8.3 | 9.1 | |||||||||
| Interest expense |
(254.5 | ) | (258.8 | ) | (274.0 | ) | ||||||
| Earnings (loss) before income taxes |
$ | 135.7 | $ | (280.1 | ) | $ | 206.5 | |||||
Administrative expenses primarily represent the cost of support functions, including information technology, finance, human resources and legal, as well as expenses for support facilities, executive management and management incentive plans.
We have a single supply chain function that serves all the reportable segments. As such, asset and capital expenditure information by reportable segment has not been reported and is not available, since we do not produce such information internally. In addition, although depreciation expense is a component of each reportable segment’s direct contribution, it is not discretely identifiable.
99
Table of Contents
22. Segment Information (continued)
Net sales by geographic region were as follows:
| Year ended December 31 | |||||||||
| 2009 | 2008 | 2007 | |||||||
| United States |
$ | 1,675.4 | $ | 1,884.1 | $ | 1,759.6 | |||
| Other Americas |
521.4 | 559.5 | 488.1 | ||||||
| Europe/Middle East/Africa |
961.8 | 1,154.8 | 1,103.2 | ||||||
| Asia/Pacific |
588.2 | 614.0 | 561.6 | ||||||
| $ | 3,746.8 | $ | 4,212.4 | $ | 3,912.5 | ||||
Long-lived assets by geographic region were as follows:
| December 31, 2009 |
December 31, 2008 | |||||
| United States |
$ | 2,168.6 | $ | 2,162.6 | ||
| Other Americas |
333.0 | 284.1 | ||||
| Europe/Middle East/Africa |
871.2 | 887.9 | ||||
| Asia/Pacific |
347.2 | 319.7 | ||||
| $ | 3,720.0 | $ | 3,654.3 | |||
Net sales by geographic area were determined based on origin of sale. Geographic data on long-lived assets is based on physical location of those assets. There were no sales from a single foreign country or customer that were material to our consolidated net sales.
23. Contingencies and Litigation
Various claims, lawsuits and administrative proceedings are pending or threatened against us, arising from the ordinary course of business with respect to commercial, contract, intellectual property, product liability, employee, environmental and other matters. Historically, these matters have not had a material impact on our consolidated financial position. However, we cannot predict the outcome of any litigation or the potential for future litigation.
We have been named as a potentially responsible party (PRP) by the Environmental Protection Agency or state enforcement agencies at seven waste sites where some financial contribution is or may be required. These agencies have also identified many other parties who may be responsible for clean up costs at these waste disposal sites. We are also remediating a small ground contamination that we discovered at our plant in Pilar, Argentina. Our financial contribution to remediate these sites is not expected to be material. There has been no significant financial impact on us up to the present, nor is it anticipated that there will be in the future, as a result of these matters. We have made and will continue to make provisions for these costs if our liability becomes probable and when costs can be reasonably estimated.
Our undiscounted reserves for known environmental clean up costs were $2.2 million at December 31, 2009. These environmental reserves represent our current estimate of our proportional clean-up costs and are based upon negotiation and agreement with enforcement agencies, our previous experience with respect to clean-up activities, a detailed review by us of known conditions, and information about other PRPs. They are not reduced by any possible recoveries from insurance companies or other PRPs not specifically identified. Although we cannot determine whether or not a material effect on future operations is reasonably likely to occur, given the evolving nature of environmental regulations, we believe that the recorded reserve levels are appropriate estimates of the potential liability. Although settlement will require future cash outlays, it is not expected that such outlays will materially impact our liquidity position.
100
Table of Contents
23. Contingencies and Litigation (continued)
Expenditures for the year ended December 31, 2009, relating to environmental compliance and clean up activities, were not significant.
We have been named as a defendant in lawsuits based on claimed involvement in the supply of allegedly defective or hazardous materials and the claimed presence of hazardous substances at our plants. We have also been named as a defendant in lawsuits where our products have not caused injuries, but the claimants seek amounts so they might be monitored in the future for potential injuries arising from our products. The plaintiffs in these cases seek damages for alleged personal injury or potential injury resulting from exposure to our products or other chemicals. These matters have had a de minimis impact on our business historically, and we do not anticipate these matters will present any material risk to our business in the future. Notwithstanding, we cannot predict the outcome of any such lawsuits or the involvement we might have in these matters in the future.
In the ordinary course of our business, we are also a party to a number of lawsuits and are subject to various claims relating to trademarks, employee matters, contracts, customer claims, negligence, transactions, chemicals and other matters, the outcome of which, in our opinion, should not have a material effect on our consolidated financial position.
However, we cannot predict the outcome of any litigation or the potential for future litigation. Were an unfavorable ruling to occur, there exists the possibility of a material adverse impact on the results of operations for the period in which the ruling occurs. We maintain accruals where the outcome of the matter is probable and can be reasonably estimated.
24. Quarterly Results of Operations (Unaudited)
| First Quarter |
Second Quarter (1) |
Third Quarter (2) |
Fourth Quarter (1) |
|||||||||||
| 2009 |
||||||||||||||
| Net sales |
$ | 868.4 | $ | 913.1 | $ | 957.0 | $ | 1,008.3 | ||||||
| Cost of product sold |
488.6 | 501.8 | 504.3 | 542.3 | ||||||||||
| Restructuring expenses |
0.3 | 43.9 | 2.7 | 0.9 | ||||||||||
| Earnings (loss) before income taxes |
36.3 | (29.1 | ) | 53.9 | 74.6 | |||||||||
| Net earnings (loss) |
24.7 | (27.3 | ) | 29.5 | 41.0 | |||||||||
| Net earnings (loss) attributable to Nalco Holding Company |
23.2 | (29.2 | ) | 28.0 | 38.5 | |||||||||
| Net earnings (loss) per share attributable to Nalco Holding Company common shareholders: |
||||||||||||||
| Basic |
$ | 0.17 | $ | (0.21 | ) | $ | 0.20 | $ | 0.28 | |||||
| Diluted |
$ | 0.17 | $ | (0.21 | ) | $ | 0.20 | $ | 0.28 | |||||
| First Quarter |
Second Quarter |
Third Quarter (3) |
Fourth Quarter (4) |
|||||||||||
| 2008 |
||||||||||||||
| Net sales |
$ | 999.7 | $ | 1,066.3 | $ | 1,115.5 | $ | 1,030.9 | ||||||
| Cost of product sold |
563.6 | 594.5 | 641.5 | 578.7 | ||||||||||
| Restructuring expenses |
1.0 | 1.4 | 10.4 | 20.6 | ||||||||||
| Earnings (loss) before income taxes |
44.1 | 54.9 | 102.7 | (481.8 | ) | |||||||||
| Net earnings (loss) |
30.6 | 45.9 | 58.8 | (469.9 | ) | |||||||||
| Net earnings (loss) attributable to Nalco Holding Company |
29.2 | 44.2 | 57.4 | (473.4 | ) | |||||||||
| Net earnings (loss) per share attributable to Nalco Holding Company common shareholders: |
||||||||||||||
| Basic |
$ | 0.20 | $ | 0.32 | $ | 0.41 | $ | (3.45 | ) | |||||
| Diluted |
$ | 0.20 | $ | 0.31 | $ | 0.41 | $ | (3.45 | ) | |||||
101
Table of Contents
24. Quarterly Results of Operations (Unaudited) (continued)
| (1) | Earnings (loss) before income taxes includes the impact of a loss on early extinguishment of debt of $16.4 million and $4.1 million in the second quarter 2009 and fourth quarter 2009, respectively. |
| (2) | Earnings (loss) before income taxes includes the impact of a $20.6 million settlement loss attributable to the principal domestic pension plan. |
| (3) | Earnings (loss) before income taxes includes the impact of a $38.1 million gain on divestiture of the Finishing Technologies surface treatment unit. |
| (4) | Earnings (loss) before income taxes includes the impact of a $544.2 million charge for the impairment of goodwill. |
25. Subsequent Event
Effective January 1, 2010, Venezuela’s economy is considered to be highly inflationary under U.S. generally accepted accounting principles, since it has experienced a rate of general inflation in excess of 100% over the last three-year period. Accordingly, all gains and losses resulting from the remeasurement of our financial statements are required to be recorded directly in the statement of operations. On January 8, 2010, the Venezuelan government announced the devaluation of the bolivar fuerte and the establishment of a two-tier exchange structure of 4.30 per U.S. dollar for non-essential items and 2.60 per U.S. dollar for food, medical supplies and other national priorities.
As a result, we expect to record a charge in the first quarter of 2010 in connection with the remeasurement of our balance sheet accounts to reflect the devaluation. If calculated at the exchange rate for non-essential items of 4.30 bolivares fuertes per U.S. dollar, the exchange loss is expected to be approximately $21 million. To the extent that our imports are classified as essential, this impact could be reduced.
102
Table of Contents
| ITEM 9. | CHANGES IN AND DISAGREEMENTS WITH ACCOUNTANTS ON ACCOUNTING AND FINANCIAL DISCLOSURE |
None.
| ITEM 9A. | CONTROLS AND PROCEDURES |
| (a) | Evaluation of disclosure controls and procedures. |
Our principal executive officer and chief financial officer, after evaluating the effectiveness of our “disclosure controls and procedures” (as defined in the Securities Exchange Act of 1934 Rules 13a-15(e) and 15d-15(e)) as of the end of the period, have concluded that our disclosure controls and procedures were effective.
| (b) | Management’s Report on Internal Control over Financial Reporting |
Our management is responsible for establishing and maintaining adequate internal control over financial reporting, as such term is defined in Securities Exchange Act of 1934 Rules 13a-15(f) and 15d-15(f). Under the supervision and with the participation of our management, including the principal executive officer and chief financial officer, an evaluation of the effectiveness of our internal control over financial reporting was conducted as of December 31, 2009 based on the framework in Internal Control—Integrated Framework issued by the Committee of Sponsoring Organizations of the Treadway Commission (COSO). Based on that evaluation, management concluded that our internal control over financial reporting was effective as of December 31, 2009.
The Company’s internal control over financial reporting as of December 31, 2009 has been audited by Ernst & Young LLP, an independent registered public accounting firm, as stated in their report, which is included in Item 8.
| (c) | Changes in internal controls over financial reporting. |
There were no changes in our internal controls over financial reporting that occurred during the fourth quarter of 2009 that have materially affected, or are reasonably likely to materially affect, our internal controls over financial reporting.
| ITEM 9B. | OTHER INFORMATION |
There was no information required to be disclosed in a report on Form 8-K during the fourth quarter of 2009 that was not previously reported.
103
Table of Contents
PART III
| ITEM 10. | DIRECTORS, EXECUTIVE OFFICERS AND CORPORATE GOVERNANCE |
Information regarding our executive officers is included in Item 1 of Part I of this report.
Information with respect to our directors, included under the headings “What is the composition of the Board of Directors and how often are members elected?”, “Who are this year’s nominees?”, “Class I Directors Term Expiring in 2011”, and “Class II Directors Term Expiring in 2012” in the Proxy Statement, is incorporated herein by reference.
Information with respect to the Audit Committee and Audit Committee financial experts, included under the heading “What are the committees of the board?” in the Proxy Statement, is incorporated herein by reference.
Information regarding Section 16(a) compliance, included under the heading “Section 16(a) Beneficial Ownership Reporting Compliance” in the Proxy Statement, is incorporated herein by reference.
Information regarding our code of ethics, included under the heading “Code of Ethical Business Conduct and Officer Code of Ethics” in the Proxy Statement, is incorporated herein by reference.
| ITEM 11. | EXECUTIVE COMPENSATION |
Information with respect to compensation of our executive officers and directors, included under the heading “COMPENSATION DISCUSSION AND ANALYSIS” in the Proxy Statement, is incorporated herein by reference.
| ITEM 12. | SECURITY OWNERSHIP OF CERTAIN BENEFICIAL OWNERS AND MANAGEMENT AND RELATED STOCKHOLDER MATTERS |
Information with respect to security ownership of certain beneficial owners and management, included under the heading “STOCK OWNERSHIP INFORMATION” in the Proxy Statement, is incorporated herein by reference.
Information with respect to the number of shares of our common stock that could be issued under equity compensation plans as of December 31, 2009, included in the table titled “EQUITY COMPENSATION PLAN INFORMATION” in the Proxy Statement, is incorporated herein by reference.
| ITEM 13. | CERTAIN RELATIONSHIPS AND RELATED TRANSACTIONS, AND DIRECTOR INDEPENDENCE |
Information regarding certain relationships and related transactions, and director independence, included under the headings “How does the Board determine which directors are considered independent?” and “Are there any other material business relationships with entities associated with any of the Company’s Directors or Executive Officers or any other “related persons”?” in the Proxy Statement, is incorporated herein by reference.
| ITEM 14. | PRINCIPAL ACCOUNTING FEES AND SERVICES |
Information with respect to principal accounting fees and services, included under the heading “What fees did the Company pay to Ernst & Young LLP for audit and other services for fiscal years 2009 and 2008?” in the Proxy Statement, is incorporated herein by reference.
104
Table of Contents
PART IV
| ITEM 15. | EXHIBITS, FINANCIAL STATEMENT SCHEDULES |
| (a) | (1) Financial Statements |
The following consolidated financial statements of Nalco Holding Company and subsidiaries are filed as part of this report under Item 8 — Financial Statements and Supplementary Data:
Consolidated Balance Sheets–December 31, 2009 and 2008
Consolidated Statements of Operations — Years ended December 31, 2009, 2008 and 2007
Consolidated Statements of Equity — Years ended December 31, 2009, 2008 and 2007
Consolidated Statements of Cash Flows — Years ended December 31, 2009, 2008 and 2007
Notes to Consolidated Financial Statements
| (a) | (2) Financial statement schedules: |
Schedule I — Condensed Financial Information
Schedule II — Valuation and Qualifying Accounts
All other financial statement schedules are not required under the relevant instructions or are inapplicable and therefore have been omitted.
| (a) | (3) Exhibits |
See index on pages 112 though 120 of this Annual Report on Form 10-K.
105
Table of Contents
Schedule I – Condensed Financial Information
Nalco Holding Company (Parent Company Only)
Condensed Balance Sheets
(dollars in millions)
| December 31, 2009 |
December 31, 2008 | |||||
| Assets |
||||||
| Investment in subsidiaries |
$ | 476.4 | $ | 398.1 | ||
| Total Assets |
$ | 476.4 | $ | 398.1 | ||
| Liabilities and Shareholders’ Equity |
||||||
| Dividends payable |
$ | 4.8 | $ | 4.8 | ||
| Total shareholders’ equity |
471.6 | 393.3 | ||||
| Total Liabilities and Shareholders’ Equity |
$ | 476.4 | $ | 398.1 | ||
See accompanying note to condensed financial statements.
106
Table of Contents
Schedule I – Condensed Financial Information – Continued
Nalco Holding Company (Parent Company Only)
Condensed Statements of Operations
(dollars in millions)
| Years ended December 31 | ||||||||||||
| 2009 | 2008 | 2007 | ||||||||||
| Net sales |
$ | — | $ | — | $ | — | ||||||
| Operating costs and expenses: |
||||||||||||
| Selling, administrative, and research expenses |
— | — | — | |||||||||
| Total operating costs and expenses |
— | — | — | |||||||||
| Operating earnings (loss) |
— | — | — | |||||||||
| Equity in earnings of subsidiaries |
46.0 | (355.5 | ) | 117.1 | ||||||||
| Other expenses |
— | — | (0.1 | ) | ||||||||
| Interest expense to subsidiaries |
— | (0.3 | ) | (0.5 | ) | |||||||
| Earnings (loss) before income taxes |
46.0 | (355.8 | ) | 116.5 | ||||||||
| Income tax provision (benefit) |
(14.5 | ) | (13.2 | ) | (12.5 | ) | ||||||
| Net earnings (loss) |
$ | 60.5 | $ | (342.6 | ) | $ | 129.0 | |||||
See accompanying note to condensed financial statements.
107
Table of Contents
Schedule I – Condensed Financial Information – Continued
Nalco Holding Company (Parent Company Only)
Condensed Statements of Cash Flows
(dollars in millions)
| Year ended December 31 | ||||||||||||
| 2009 | 2008 | 2007 | ||||||||||
| Operating activities |
||||||||||||
| Net earnings (loss) |
$ | 60.5 | $ | (342.6 | ) | $ | 129.0 | |||||
| Equity in earnings of subsidiaries |
(46.0 | ) | 355.5 | (117.1 | ) | |||||||
| Dividends from subsidiaries |
19.3 | 136.7 | 113.1 | |||||||||
| Deferred income taxes |
(14.5 | ) | (13.2 | ) | (12.5 | ) | ||||||
| Other |
— | (0.2 | ) | 0.2 | ||||||||
| Net cash provided by operating activities |
19.3 | 136.2 | 112.7 | |||||||||
| Investing activities |
||||||||||||
| Advances from (to) subsidiaries |
— | (13.2 | ) | 10.4 | ||||||||
| Net cash provided by (used for) investing activities |
— | (13.2 | ) | 10.4 | ||||||||
| Financing activities |
||||||||||||
| Cash dividends |
(19.3 | ) | (19.7 | ) | (15.1 | ) | ||||||
| Purchases of treasury stock |
— | (103.3 | ) | (108.0 | ) | |||||||
| Net cash used for financing activities |
(19.3 | ) | (123.0 | ) | (123.1 | ) | ||||||
| Increase (decrease) in cash |
— | — | — | |||||||||
| Cash at beginning of period |
— | — | — | |||||||||
| Cash at the end of period |
$ | — | $ | — | $ | — | ||||||
See accompanying note to condensed financial statements.
108
Table of Contents
Schedule I – Condensed Financial Information—Continued
Nalco Holding Company (Parent Company Only)
Note to Condensed Financial Statements
December 31, 2009
1. Basis of Presentation
Under the terms of agreements governing indebtedness of certain subsidiaries of Nalco Holding Company (the “Company”), such subsidiaries are significantly restricted from making dividend payments, loans or advances to the Company. These restrictions have resulted in the restricted net assets (as defined in Rule 4-08(e)(3) of Regulation S-X) of the Company’s subsidiaries exceeding 25% of the consolidated net assets of the Company and its subsidiaries.
The financial statements for Nalco Holding Company (Parent Company Only) summarize the results of operations and cash flows for the years ended December 31, 2009, 2008 and 2007, and the financial position as of December 31, 2009 and 2008. In these statements, the Company’s investment in subsidiaries is stated at cost plus equity in undistributed earnings of subsidiaries since the date of acquisition, November 4, 2003. The Company’s share of net income of its unconsolidated subsidiaries is included in consolidated income using the equity method. The Nalco Holding Company parent-company-only financial statements should be read in conjunction with the consolidated financial statements of Nalco Holding Company and subsidiaries.
109
Table of Contents
Schedule II – Valuation and Qualifying Accounts
Years Ended December 31, 2009, 2008 and 2007
| Additions | Other Changes Increase (Decrease) |
|||||||||||||||||||||
| (dollars in millions) | Balance at Beginning of Period |
Charged to Costs and Expenses |
Charged to Other Accounts |
Currency Translation Adjustments |
Other | Balance at End of Period | ||||||||||||||||
| Year Ended December 31, 2009 |
||||||||||||||||||||||
| Allowance for doubtful accounts |
$ | 23.8 | $ | 3.0 | $ | — | $ | 0.5 | $ | (9.5 | ) (1) | $ | 17.8 | |||||||||
| Deferred tax asset valuation allowance |
49.6 | 29.0 | 10.3 | (2) | 6.3 | — | 95.2 | |||||||||||||||
| Year Ended December 31, 2008 |
||||||||||||||||||||||
| Allowance for doubtful accounts |
$ | 19.5 | $ | 9.3 | $ | — | $ | (1.4 | ) | $ | (3.6 | ) (1) | $ | 23.8 | ||||||||
| Deferred tax asset valuation allowance |
88.1 | (19.7 | ) | (7.9) | (3) | (10.9 | ) | — | 49.6 | |||||||||||||
| Year Ended December 31, 2007 |
||||||||||||||||||||||
| Allowance for doubtful accounts |
$ | 19.0 | $ | 4.3 | $ | — | $ | 1.0 | $ | (4.8 | ) (1) | $ | 19.5 | |||||||||
| Deferred tax asset valuation allowance |
75.2 | 1.6 | 9.0 | (4) | 2.3 | — | 88.1 | |||||||||||||||
| (1) | Account write-offs net of recoveries. |
| (2) | Increased allowance charged to other comprehensive income of $6.1 million and reclassification from deferred tax assets of $4.2 million. |
| (3) | Reduced allowance resulting from the Acquisition charged to goodwill of $8.1 million and reclassification from deferred tax assets of $0.2 million. |
| (4) | Reclassification from deferred tax assets. |
110
Table of Contents
Pursuant to the requirements of Section 13 or 15(d) of the Securities Exchange Act of 1934, the registrant has duly caused this report to be signed on its behalf by the undersigned, thereunto duly authorized.
| NALCO HOLDING COMPANY (Registrant) | ||
| By: |
/s/ BRADLEY J. BELL | |
| Bradley J. Bell Executive Vice President and Chief Financial Officer (Principal Financial Officer) | ||
Date: February 26, 2010
Pursuant to the requirements of the Securities Exchange Act of 1934, this report has been signed below by the following persons on behalf of the registrant and in the capacities indicated on February 26, 2010.
| Signature |
Title | |
| /S/ J. ERIK FYRWALD J. Erik Fyrwald |
Chairman of the Board, President and Chief Executive Officer | |
| /S/ BRADLEY J. BELL Bradley J. Bell |
Executive Vice President and Chief Financial Officer | |
| /S/ SCOTT J. HINKLE Scott J. Hinkle |
Controller (Principal Accounting Officer) | |
| /S/ CARL M. CASALE Carl M. Casale |
Director | |
| /S/ RODNEY F. CHASE Rodney F. Chase |
Director | |
| /S/ RICHARD B. MARCHESE Richard B. Marchese |
Director | |
| /S/ PAUL J. NORRIS Paul J. Norris |
Director | |
| /S/ DOUGLAS A. PERTZ Douglas A. Pertz |
Director | |
| /S/ DANIEL S. SANDERS Daniel S. Sanders |
Director | |
| /S/ MARY M. VANDEWEGHE Mary M. VanDeWeghe |
Director | |
111
Table of Contents
INDEX TO EXHIBITS
| Exhibits required to be filed by Item 601 of Regulation S-K: | ||
| Exhibit Number |
||
| 2.1 | Stock Purchase Agreement among Nalco Holdings LLC (formerly known as Blackstone/Neptune Acquisition Company L.L.C.), Leo Holding Company and Nalco International SAS, dated as of August 31, 2003, which is incorporated herein by reference from Exhibit 2.1 of the Registration Statement on Form S-4 of Nalco Company filed on May 17, 2004 (File No. 333-115560). | |
| 3.1 | Amended and Restated Certificate of Incorporation of Nalco Holding Company, which is incorporated herein by reference from Exhibit 3.1 on Form 8-K of Nalco Holding Company filed on November 18, 2004 (File No. 001-32342). | |
| 3.2 | Amended and Restated By-laws of Nalco Holding Company, which are incorporated herein by reference from Exhibit 99.1 on Form 8-K of Nalco Holding Company filed on May 7, 2007 (File No. 001-32342). | |
| 4.1 | Form of Certificate of Common Stock, which is incorporated herein by reference from Exhibit 4.1 of Amendment No. 2 to the Registration Statement on Form S-1 of Nalco Holding Company filed on October 13, 2004 (File No. 333-118583). | |
| 4.2 | Indenture, dated as of May 1, 1998, between Nalco Chemical Company and The Chase Manhattan Bank, which is incorporated herein by reference from Exhibit 4.1 of the Registration Statement on Form S-4 of Nalco Company filed on May 17, 2004 (File No. 333-115560). | |
| 4.3 | First Supplemental Indenture, dated as of December 3, 1999, by and between Nalco Chemical Company and The Chase Manhattan Bank, which is incorporated herein by reference from Exhibit 4.2 of the Registration Statement on Form S-4 of Nalco Company filed on May 17, 2004 (File No. 333-115560). | |
| 4.4 | Senior Notes Indenture, dated as of November 4, 2003, among Nalco Company, the Guarantors named therein and The Bank of New York, as Trustee, which is incorporated herein by reference from Exhibit 4.3 of the Registration Statement on Form S-4 of Nalco Company filed on May 17, 2004 (File No. 333-115560). | |
| 4.5 | Senior Notes Supplemental Indenture, dated as of November 12, 2003, among Nalco Company, the guarantors named therein and The Bank of New York, as Trustee, which is incorporated herein by reference from Exhibit 4.4 of the Registration Statement on Form S-4 of Nalco Company filed on May 17, 2004 (File No. 333-115560). | |
| 4.6 | Senior Subordinated Notes Indenture, dated as of November 4, 2003, among Nalco Company, the Guarantors named therein and The Bank of New York, as Trustee, which is incorporated herein by reference from Exhibit 4.5 of the Registration Statement on Form S-4 of Nalco Company filed on May 17, 2004 (File No. 333-115560). | |
| 4.7 | Senior Subordinated Notes Supplemental Indenture, dated as of November 12, 2003, among Nalco Company, the guarantors named therein and The Bank of New York, as Trustee, which is incorporated herein by reference from Exhibit 4.6 of the Registration Statement on Form S-4 of Nalco Company filed on May 17, 2004 (File No. 333-115560). | |
| 4.8 | Indenture, dated as of January 21, 2004 among Nalco Finance Holdings LLC, Nalco Finance Holdings Inc. and The Bank of New York, as Trustee, which is incorporated herein by reference from Exhibit 4.7 of the Registration Statement on Form S-4 of Nalco Company filed on May 17, 2004 (File No. 333-115560). | |
| 4.9 | Indenture, dated as of May 13, 2009, among Nalco Company, the Guarantors named therein and the Bank of New York Mellon, as Trustee, which is incorporated herein by reference from Exhibit 4.1 on Form 8-K of Nalco Holding Company filed on May 15, 2009 (File No. 001-32342). | |
112
Table of Contents
| Exhibit Number |
||
| 4.10 |
Form of 8 1/4% Senior Notes due 2017 (included in Exhibit 4.9) , which is incorporated herein by reference from Exhibit 4.2 on Form 8-K of Nalco Holding Company filed on May 15, 2009 (File No. 001-32342). | |
| 10.1 |
Credit Agreement, dated as of November 4, 2003, among Nalco Holdings LLC, Nalco Company, as U.S. Borrower, the Foreign Subsidiary Borrowers from time to time party thereto, the Lenders party thereto, Citigroup Global Markets Inc. and Banc of America Securities LLC, as Global Coordinators, Citicorp North America, Inc., as Administrative Agent, Bank of America, N.A., as Documentation Agent, Deutsche Bank Securities Inc., J.P. Morgan Securities Inc., Goldman Sachs Credit Partners L.P. and UBS Securities LLC, as Co-Syndication Agents, Citigroup Global Markets Inc., Banc of America Securities LLC, Deutsche Bank Securities Inc., J.P. Morgan Securities Inc., Goldman Sachs Credit Partners L.P. and UBS Securities LLC, as Joint Lead Arrangers and Joint Book Managers, which is incorporated herein by reference from Exhibit 10.1 of the Registration Statement on Form S-4 of Nalco Company filed on May 17, 2004 (File No. 333-115560). | |
| 10.2 |
U.S. Guarantee and Collateral Agreement, dated as of November 4, 2003, among Nalco Holdings LLC, Nalco Company, each domestic subsidiary of Nalco Holdings LLC named therein and Citicorp North America, Inc., as Collateral Agent, which is incorporated herein by reference from Exhibit 10.2 of the Registration Statement on Form S-4 of Nalco Company filed on May 17, 2004 (File No. 333-115560). | |
| 10.3 |
Guarantee Agreement, dated as of August 31, 2003, between Suez and Blackstone/Neptune Acquisition Company L.L.C., which is incorporated herein by reference from Exhibit 10.3 of the Registration Statement on Form S-4 of Nalco Company filed on May 17, 2004 (File No. 333-115560). | |
| 10.4 |
Reimbursement Agreement, dated as of November 4, 2003 between Suez and Nalco Company, which is incorporated herein by reference from Exhibit 10.5 of the Registration Statement on Form S-4 of Nalco Company filed on May 17, 2004 (File No. 333-115560). | |
| 10.5 |
Sublease Agreement, dated as of November 4, 2003 between Leo Holding Company, as sublandlord and Ondeo Nalco Company, as subtenant, which is incorporated herein by reference from Exhibit 10.6 of the Registration Statement on Form S-4 of Nalco Company filed on May 17, 2004 (File No. 333-115560). | |
| 10.6† |
Employment agreement, effective as of November 1, 2003, between Nalco Company and Bradley J. Bell, which is incorporated herein by reference from Exhibit 10.11 of the Registration Statement on Form S-4 of Nalco Company filed on May 17, 2004 (File No. 333-115560). | |
| 10.7† |
Nalco LLC 2004 Unit Plan, which is incorporated herein by reference from Exhibit 10.24 of the Registration Statement on Form S-1 of Nalco Holding Company filed on August 26, 2004 (File No. 333-118583). | |
| 10.8 |
Nalco LLC Limited Liability Company Operating Agreement, dated May 17, 2004, which is incorporated herein by reference from Exhibit 10.25 of the Registration Statement on Form S-1 of Nalco Holding Company filed on August 26, 2004 (File No. 333-118583). | |
| 10.9 |
Warrant Agreement, which is incorporated herein by reference from Exhibit 10.4 on Form 8-K of the Nalco Holding Company filed on November 18, 2004 (File No. 001-32342). | |
| 10.10 |
Registration Rights Agreement, dated as of November 16, 2004, among Nalco Holding Company, Nalco LLC and the other parties named therein, which is incorporated herein by reference from Exhibit 10.1 on Form 8-K of the Nalco Holding Company filed on November 18, 2004 (File No. 001-32342). | |
| 10.11 |
Stockholders Agreement, dated as of November 16, 2004, between Nalco Holding Company and Nalco LLC, which is incorporated herein by reference from Exhibit 10.3 on Form 8-K of the Nalco Holding Company filed on November 18, 2004 (File No. 001-32342). | |
113
Table of Contents
| Exhibit Number |
||
| 10.12† |
Amended and Restated Nalco Holding Company 2004 Stock Incentive Plan, which is incorporated herein by reference from Annex A on Form Defr14a of Nalco Holding Company filed on April 18, 2007 (File No. 001-32342). | |
| 10.13† |
Management Members Agreement (class B, class C and class D Units), dated as of June 11, 2004, between Nalco LLC and Bradley J. Bell, which is incorporated herein by reference from Exhibit 10.36 of the Registration Statement on Form S-1 of Nalco Holding Company filed on August 26, 2004 (File No. 333-118583). | |
| 10.14† |
Form of Nalco Holding Company Amended and Restated 2004 Stock Incentive Plan Restricted Stock Unit Agreement for the 2008 Grant, which is incorporated herein by reference from Exhibit 99.1 on Form 8-K of Nalco Holding Company filed on February 11, 2008 (File No. 001-32342). | |
| 10.15† |
Second Amended and Restated Management Incentive Plan (as amended and restated May 4, 2006 and February 9, 2010), which is incorporated herein by reference from Exhibit 99.1 on Form 8-K of Nalco Holding Company filed on February 12, 2010 (File No. 001-32342). | |
| 10.16† |
Long Term Cash Incentive Plan of Nalco Company, which is incorporated herein by reference from Exhibit 99.2 on Form 8-K of Nalco Holding Company filed on March 1, 2005 (File No. 001-32342). | |
| 10.17† |
Form of Nalco Company Death Benefit Agreement and Addendum to Death Benefit Agreement, which is incorporated herein by reference from Exhibit 99.2 on Form 8-K of Nalco Holding Company filed on May 11, 2005 (File No. 001-32342). | |
| 10.18 |
Amendment No. 3, dated as of October 19, 2005, to the Credit Agreement, dated as of November 4, 2003, among Nalco Holdings LLC, Nalco Company, as U.S. Borrower, the Foreign Subsidiary Borrowers from time to time party thereto, the Lenders party thereto, Citigroup Global Markets Inc. and Banc of America Securities LLC, as Global Coordinators, Citicorp North America, Inc., as Administrative Agent, Bank of America, N.A., as Documentation Agent, Deutsche Bank Securities Inc., J.P. Morgan Securities Inc., Goldman Sachs Credit Partners L.P. and UBS Securities LLC, as Co-Syndication Agents, Citigroup Global Markets Inc., Banc of America Securities LLC, Deutsche Bank Securities Inc., J.P. Morgan Securities Inc., Goldman Sachs Credit Partners L.P. and UBS Securities LLC, as Joint Lead Arrangers and Joint Book Managers, which is incorporated herein by reference from Exhibit 10.2 on the Quarterly Report on Form 10-Q of Nalco Holding Company filed on November 14, 2005 (File No. 001-32342). | |
| 10.19 |
Amendment No. 1, dated as of December 30, 2005, to the Nalco LLC Limited Liability Company Operating Agreement, dated May 17, 2004, which is incorporated herein by reference from Exhibit 10.51 of the Annual Report Form 10-K Nalco Holding Company filed on March 2, 2006 (File No. 001-32342). | |
| 10.20 |
Amendment No. 4, dated as of February 22, 2006, to the Credit Agreement, dated as of November 4, 2003, among Nalco Holdings LLC, Nalco Company, as U.S. Borrower, the Foreign Subsidiary Borrowers from time to time party thereto, the Lenders party thereto, Citigroup Global Markets Inc. and Banc of America Securities LLC, as Global Coordinators, Citicorp North America, Inc., as Administrative Agent, Bank of America, N.A., as Documentation Agent, Deutsche Bank Securities Inc., J.P. Morgan Securities Inc., Goldman Sachs Credit Partners L.P. and UBS Securities LLC, as Co-Syndication Agents, Citigroup Global Markets Inc., Banc of America Securities LLC, Deutsche Bank Securities Inc., J.P. Morgan Securities Inc., Goldman Sachs Credit Partners L.P. and UBS Securities LLC, as Joint Lead Arrangers and Joint Book Managers, which is incorporated herein by reference from Exhibit 10.62 of the Annual Report Form 10-K Nalco Holding Company filed on March 2, 2006 (File No. 001-32342). | |
114
Table of Contents
| Exhibit Number |
||
| 10.21† |
Nalco Holding Company 2004 Stock Incentive Plan Restricted Stock Unit Agreement (2007 Grant), effective February 15, 2007, between Nalco Holding Company and Rodney F. Chase, which is incorporated herein by reference from Exhibit 99.1 on Form 8-K of Nalco Holding Company filed on February 20, 2007 (File No. 001-32342). | |
| 10.22† |
Nalco Holding Company 2004 Stock Incentive Plan Restricted Stock Unit Agreement (2007 Grant), effective February 15, 2007, between Nalco Holding Company and Richard B. Marchese, which is incorporated herein by reference from Exhibit 99.1 on Form 8-K of Nalco Holding Company filed on February 20, 2007 (File No. 001-32342). | |
| 10.23† |
Nalco Holding Company 2004 Stock Incentive Plan Restricted Stock Unit Agreement (2007 Grant), effective February 15, 2007, between Nalco Holding Company and Douglas A. Pertz, which is incorporated herein by reference from Exhibit 99.1 on Form 8-K of Nalco Holding Company filed on February 20, 2007 (File No. 001-32342). | |
| 10.24† |
Nalco Holding Company 2004 Stock Incentive Plan Restricted Stock Unit Agreement (2007 Grant), effective February 15, 2007, between Nalco Holding Company and Daniel S. Sanders, which is incorporated herein by reference from Exhibit 99.1 on Form 8-K of Nalco Holding Company filed on February 20, 2007 (File No. 001-32342). | |
| 10.25† |
Amendment No. 1 to the Nalco Company Supplemental Profit Sharing Plan, which is incorporated herein by reference from Exhibit 99.2 on Form 8-K of Nalco Holding Company filed on August 9, 2007 (File No. 001-32342). | |
| 10.26†* |
Amendment No. 2 to the Nalco Company Supplemental Profit Sharing Plan. | |
| 10.27† |
Amendment No. 1 to the Nalco Company Supplemental Retirement Income Plan, which is incorporated herein by reference from Exhibit 99.1 on Form 8-K of Nalco Holding Company filed on August 9, 2007 (File No. 001-32342). | |
| 10.28†* |
Amendment No. 2 to the Nalco Company Supplemental Retirement Income Plan. | |
| 10.29 |
Receivables Transfer Agreement of Nalco Company dated June 22, 2007, which is incorporated herein by reference from Exhibit 99.2 on Form 8-K of Nalco Holding Company filed on June 26, 2007 (File No. 001-32342). | |
| 10.30 |
Amendment No. 5, dated as of December 15, 2006, to the Credit Agreement, dated as of November 4, 2003, among Nalco Holdings LLC, Nalco Company, as U.S. Borrower, the Foreign Subsidiary Borrowers from time to time party thereto, the Lenders party thereto, Citigroup Global Markets Inc. and Banc of America Securities LLC, as Global Coordinators, Citicorp North America, Inc., as Administrative Agent, Bank of America, N.A., as Documentation Agent, Deutsche Bank Securities Inc., J.P. Morgan Securities Inc., Goldman Sachs Credit Partners L.P. and UBS Securities LLC, as Co-Syndication Agents, Citigroup Global Markets Inc., Banc of America Securities LLC, Deutsche Bank Securities Inc., J.P. Morgan Securities Inc., Goldman Sachs Credit Partners L.P. and UBS Securities LLC, as Joint Lead Arrangers and Joint Book Managers, which is incorporated herein by reference from Exhibit 10.81 of the Annual Report Form 10-K Nalco Holding Company filed on March 1, 2007 (File No. 001-32342). | |
| 10.31 |
Amended and Restated Receivables Purchase Agreement of Nalco Company dated June 22, 2007, which is incorporated herein by reference from Exhibit 99.1 on Form 8-K of Nalco Holding Company filed on June 26, 2007 (File No. 001-32342). | |
| 10.32† |
Nalco Holding Company Amended and Restated 2004 Stock Incentive Plan Restricted Stock Unit Agreement, effective March 7, 2008, between Nalco Holding Company and David Johnson, which is incorporated herein by reference from Exhibit 99.1 on Form 8-K of Nalco Holding Company filed on February 19, 2008 (File No. 001-32342). | |
115
Table of Contents
| Exhibit Number |
||
| 10.33† |
Nalco Holding Company 2004 Stock Incentive Plan Restricted Stock Unit Agreement, effective January 10, 2006, between Nalco Holding Company and David Johnson, which is incorporated herein by reference from Exhibit 10.68 on Form 10-K of Nalco Holding Company filed on February 28, 2008 (File No. 001-32342). | |
| 10.34† |
Nalco Holding Company 2004 Stock Incentive Plan Restricted Stock Unit Agreement, effective June 7, 2007, between Nalco Holding Company and David Johnson, which is incorporated herein by reference from Exhibit 10.69 on Form 10-K of Nalco Holding Company filed on February 28, 2008 (File No. 001-32342). | |
| 10.35† |
Form of Nalco Company Death Benefit Agreement and Addendum to Death Benefit Agreement, effective December 2, 2007, between Nalco Company and David Johnson, which is incorporated herein by reference from Exhibit 10.70 on Form 10-K of Nalco Holding Company filed on February 28, 2008 (File No. 001-32342). | |
| 10.36† |
Employment Letter Agreement dated as of February 21, 2008, between Nalco Holding Company and J. Erik Fyrwald, which is incorporated herein by reference from Exhibit 99.1 on Form 8-K of Nalco Holding Company filed on February 28, 2008 (File No. 001-32342). | |
| 10.37† |
Severance Agreement effective as of February 28, 2008, between Nalco Holding Company and J. Erik Fyrwald, which is incorporated herein by reference from Exhibit 99.2 on Form 8-K of Nalco Holding Company filed on February 28, 2008 (File No. 001-32342). | |
| 10.38† |
Non-Plan Stock Option Agreement effective as of March 7, 2008, between Nalco Holding Company and J. Erik Fyrwald, which is incorporated herein by reference from Exhibit 99.1 on Form 8-K of Nalco Holding Company filed on March 12, 2008 (File No. 001-32342). | |
| 10.39† |
Non-Plan Restricted Stock Agreement effective as of March 7, 2008, between Nalco Holding Company and J. Erik Fyrwald, which is incorporated herein by reference from Exhibit 99.2 on Form 8-K of Nalco Holding Company filed on March 12, 2008 (File No. 001-32342). | |
| 10.40† |
Employment Letter Agreement dated as of July 17, 2008, between David E. Flitman and Nalco Company, a subsidiary of Nalco Holding Company, which is incorporated herein by reference from Exhibit 99.1 on Form 8-K of Nalco Holding Company filed on July 22, 2008 (File No. 001-32342). | |
| 10.41 |
Asset Purchase Agreement dated as of July 24, 2008, between Chemetall Corp. and Nalco Company, a subsidiary of Nalco Holding Company, which is incorporated herein by reference from Exhibit 10.1 on Form 10-Q of Nalco Holding Company filed on August 1, 2008 (File No. 001-32342). | |
| 10.42† |
Employment Letter Agreement dated August 22, 2008, between Eric G. Melin and Nalco Company, a subsidiary of Nalco Holding Company, which is incorporated herein by reference from Exhibit 99.1 on Form 8-K of Nalco Holding Company filed on August 26, 2008 (File No. 001-32342). | |
| 10.43† |
Death Benefit Agreement effective August 22, 2008, between Eric G. Melin and Nalco Company, a subsidiary of Nalco Holding Company, which is incorporated herein by reference from Exhibit 99.2 on Form 8-K of Nalco Holding Company filed on August 26, 2008 (File No. 001-32342). | |
| 10.44† |
Employment Agreement effective August 22, 2008, between Eric G. Melin and Nalco Company, a subsidiary of Nalco Holding Company, which is incorporated herein by reference from Exhibit 99.3 on Form 8-K of Nalco Holding Company filed on August 26, 2008 (File No. 001-32342). | |
| 10.45† |
Severance Agreement effective August 22, 2008, between Eric G. Melin and Nalco Company, a subsidiary of Nalco Holding Company, which is incorporated herein by reference from Exhibit 99.4 on Form 8-K of Nalco Holding Company filed on August 26, 2008 (File No. 001-32342). | |
116
Table of Contents
| Exhibit Number |
||
| 10.46† |
Sign-On Restricted Share Award Agreement effective September 9, 2008, between David E. Flitman and Nalco Company, a subsidiary of Nalco Holding Company, which is incorporated herein by reference from Exhibit 99.1 on Form 8-K of Nalco Holding Company filed on September 11, 2008 (File No. 001-32342). | |
| 10.47† |
Severance Agreement effective September 9, 2008, between David E. Flitman and Nalco Company, a subsidiary of Nalco Holding Company, which is incorporated herein by reference from Exhibit 99.2 on Form 8-K of Nalco Holding Company filed on September 11, 2008 (File No. 001-32342). | |
| 10.48† |
Sign-On Restricted Share Award Agreement effective October 8, 2008, between Eric G. Melin and Nalco Company, a subsidiary of Nalco Holding Company, which is incorporated herein by reference from Exhibit 99.1 on Form 8-K of Nalco Holding Company filed on October 14, 2008 (File No. 001-32342). | |
| 10.49† |
Nonqualified Stock Option Agreement effective October 8, 2008, between Eric G. Melin and Nalco Company, a subsidiary of Nalco Holding Company, which is incorporated herein by reference from Exhibit 99.2 on Form 8-K of Nalco Holding Company filed on October 14, 2008 (File No. 001-32342). | |
| 10.50† |
Restricted Share Agreement effective January 1, 2009, between Bradley J. Bell and Nalco Holding Company, which is incorporated herein by reference from Exhibit 99.1 on Form 8-K of Nalco Holding Company filed on November 26, 2008 (File No. 001-32342). | |
| 10.51† |
Form of Severance Agreement effective January 1, 2009, between Bradley J. Bell and Nalco Company, a subsidiary of Nalco Holding Company, which is incorporated herein by reference from Exhibit 99.2 on Form 8-K of Nalco Holding Company filed on November 26, 2008 (File No. 001-32342). | |
| 10.52† |
Form of Severance Agreement effective January 1, 2009, between David Johnson and Nalco Company, a subsidiary of Nalco Holding Company, which is incorporated herein by reference from Exhibit 99.2 on Form 8-K of Nalco Holding Company filed on November 26, 2008 (File No. 001-32342). | |
| 10.53† |
Form of Change of Control Agreement effective January 1, 2009, between J. Erik Fyrwald and Nalco Holding Company, which is incorporated herein by reference from Exhibit 99.3 on Form 8-K of Nalco Holding Company filed on November 26, 2008 (File No. 001-32342). | |
| 10.54† |
Form of Change of Control Agreement effective January 1, 2009, between David E. Flitman and Nalco Holding Company, which is incorporated herein by reference from Exhibit 99.3 on Form 8-K of Nalco Holding Company filed on November 26, 2008 (File No. 001-32342). | |
| 10.55† |
Form of 2009 Restricted Stock Unit Agreement granted to non-employee directors under the 2004 Stock Incentive Plan, which is incorporated herein by reference from Exhibit 99.1 on Form 8-K of Nalco Holding Company filed on January 12, 2009 (File No. 001-32342). | |
| 10.56† |
Form of Change of Control Agreement effective January 1, 2009, between Bradley J. Bell and Nalco Holding Company, which is incorporated herein by reference from Exhibit 99.3 on Form 8-K of Nalco Holding Company filed on November 26, 2008 (File No. 001-32342). | |
| 10.57† |
Form of Change of Control Agreement effective January 1, 2009, between David Johnson and Nalco Holding Company, which is incorporated herein by reference from Exhibit 99.3 on Form 8-K of Nalco Holding Company filed on November 26, 2008 (File No. 001-32342). | |
| 10.58† |
Nalco Holding Company Amended and Restated 2004 Stock Incentive Plan Restricted Stock Unit Agreement for the 2008 Grant effective March 7, 2008, between Nalco Holding Company and David Johnson, which is incorporated herein by reference from Exhibit 99.1 on Form 8-K of Nalco Holding Company filed on February 19, 2008 (File No. 001-32342). | |
117
Table of Contents
| Exhibit Number |
||
| 10.59† |
Expatriate Agreement effective April 4, 2007 between David Johnson and Nalco Company, a subsidiary of Nalco Holding Company, which is incorporated herein by reference from Exhibit 10.69 on Form 10-K/A of Nalco Holding Company filed on March 10, 2009 (File No. 001-32342). | |
| 10.60† |
Form of Change of Control Agreement effective November 26, 2008, between Scott C. Mason and Nalco Holding Company, which is incorporated herein by reference from Exhibit 99.3 on Form 8-K of Nalco Holding Company filed on November 26, 2008 (File No. 001-32342). | |
| 10.61† |
Form of Nalco Company Death Benefit Agreement and Addendum to Death Benefit Agreement, effective January 16, 2006, between Nalco Company and Scott C. Mason, which is incorporated herein by reference from Exhibit 99.2 on Form 8-K of Nalco Holding Company filed on May 11, 2005 (File No. 001-32342). | |
| 10.62† |
Form of Severance Agreement effective November 26, 2008, between Scott C. Mason and Nalco Company, a subsidiary of Nalco Holding Company, which is incorporated herein by reference from Exhibit 99.2 on Form 8-K of Nalco Holding Company filed on November 26, 2008 (File No. 001-32342). | |
| 10.63†* |
Employment Separation and Consulting Agreement, effective December 14, 2009, between Nalco Company and Scott C. Mason. | |
| 10.64†* |
First Amendment to the Nalco Company Employee Welfare Benefits Plan. | |
| 10.65†* |
2009 Productivity Success Payments Plan. | |
| 10.66†* |
Amendment No. 5 to the Nalco Company Retirement Income Plan. | |
| 10.67 |
Amendment No. 6, dated as of May 13, 2009, to the Credit Agreement, dated as of November 4, 2003, among Nalco Holdings LLC, Nalco Company, as U.S. Borrower, the Foreign Subsidiary Borrowers from time to time party thereto, the Lenders party thereto, Citigroup Global Markets Inc. and Banc of America Securities LLC, as Global Coordinators, Citicorp North America, Inc., as Administrative Agent, Bank of America, N.A., as Documentation Agent, Deutsche Bank Securities Inc., J.P. Morgan Securities Inc., Goldman Sachs Credit Partners L.P. and UBS Securities LLC, as Co-Syndication Agents, Citigroup Global Markets Inc., Banc of America Securities LLC, Deutsche Bank Securities Inc., J.P. Morgan Securities Inc., Goldman Sachs Credit Partners L.P. and UBS Securities LLC, as Joint Lead Arrangers and Joint Book Managers, which is incorporated herein by reference from Exhibit 10.1 on Form 8-K of Nalco Holding Company filed on May 15, 2009 (File No. 001-32342). | |
| 10.68 |
Credit Agreement, dated as of May 13, 2009, among Nalco Holdings LLC, Nalco Company, as U.S. Borrower, the Foreign Subsidiary Borrowers from time to time party thereto, the Lenders party thereto, Bank of America, N.A., as Administrative Agent and Collateral Agent, Deutsche Bank Securities Inc., as Syndication Agent, HSBC Securities (USA) Inc. and BMO Capital Markets, as Co-Documentation Agents, Banc of America Securities LLC, Deutsche Bank Securities Inc. and HSBC Securities (USA) Inc., as Joint Lead Arrangers and Joint Book Managers with respect to the Revolving Credit Facility, Deutsche Bank Securities Inc., Banc of America Securities LLC and HSBC Securities (USA) Inc., as Joint Lead Arrangers and Joint Book Managers with respect to the Term Loan Facility and BMO Capital Markets, as Joint Book Manager with respect to the Term Loan Facility, which is incorporated herein by reference from Exhibit 10.2 on Form 8-K of Nalco Holding Company filed on May 15, 2009 (File No. 001-32342). | |
| 10.69 |
U.S. Guarantee and Collateral Agreement, dated as of May 13, 2009, among Nalco Holdings LLC, Nalco Company, each domestic subsidiary of Nalco Holdings LLC named therein and Citicorp North America, Inc., as Collateral Agent, which is incorporated herein by reference from Exhibit 10.3 on Form 8-K of Nalco Holding Company filed on May 15, 2009 (File No. 001-32342). | |
118
Table of Contents
| Exhibit Number |
||
| 10.70 |
Intercreditor Agreement, dated as of May 13, 2009, by and between Citicorp North America, Inc., as 2003 Credit Agent and Bank of America, N.A., as 2009 Credit Agent, which is incorporated herein by reference from Exhibit 10.4 on Form 8-K of Nalco Holding Company filed on May 15, 2009 (File No. 001-32342). | |
| 10.71 |
Amendment No. 1, dated as of November 25, 2009, to the Credit Agreement, dated as of May 13, 2009, among Nalco Holdings LLC, Nalco Company, as U.S. Borrower, the Foreign Subsidiary Borrowers from time to time party thereto, the Lenders party thereto, Bank of America, N.A., as Administrative Agent and Collateral Agent, Deutsche Bank Securities Inc., as Syndication Agent, HSBC Securities (USA) Inc. and BMO Capital Markets, as Co-Documentation Agents, Banc of America Securities LLC, Deutsche Bank Securities Inc. and HSBC Securities (USA) Inc., as Joint Lead Arrangers and Joint Book Managers with respect to the Revolving Credit Facility, Deutsche Bank Securities Inc., Banc of America Securities LLC and HSBC Securities (USA) Inc., as Joint Lead Arrangers and Joint Book Managers with respect to the Term Loan Facility and BMO Capital Markets, as Joint Book Manager with respect to the Term Loan Facility, which is incorporated herein by reference from Exhibit 10.1 on Form 8-K of Nalco Holding Company filed on November 30, 2009 (File No. 001-32342). | |
| 10.72 |
Amendment No. 7, dated as of November 25, 2009, to the Credit Agreement, dated as of November 4, 2003, among Nalco Holdings LLC, Nalco Company, as U.S. Borrower, the Foreign Subsidiary Borrowers from time to time party thereto, the Lenders party thereto, Citigroup Global Markets Inc. and Banc of America Securities LLC, as Global Coordinators, Citicorp North America, Inc., as Administrative Agent, Bank of America, N.A., as Documentation Agent, Deutsche Bank Securities Inc., J.P. Morgan Securities Inc., Goldman Sachs Credit Partners L.P. and UBS Securities LLC, as Co-Syndication Agents, Citigroup Global Markets Inc., Banc of America Securities LLC, Deutsche Bank Securities Inc., J.P. Morgan Securities Inc., Goldman Sachs Credit Partners L.P. and UBS Securities LLC, as Joint Lead Arrangers and Joint Book Managers, which is incorporated herein by reference from Exhibit 10.2 on Form 8-K of Nalco Holding Company filed on November 30, 2009 (File No. 001-32342). | |
| 10.73 |
Joinder Agreement, dated as of December 7, 2009, among Nalco Holdings LLC, Nalco Company, the financial institutions party thereto, and Bank of America, N.A., as administrative agent and collateral agent, to the Credit Agreement, dated as of May 13, 2009, among Nalco Holdings LLC, Nalco Company, the foreign subsidiary borrowers from time to time party thereto, the financial institutions party thereto, and Bank of America, N.A., as administrative Agent and collateral Agent, which is incorporated herein by reference from Exhibit 10.1 on Form 8-K of Nalco Holding Company filed on December 8, 2009 (File No. 001-32342). | |
| 10.74† |
Form of 2010 Restricted Stock Unit Agreement granted to non-employee directors under the 2004 Stock Incentive Plan, which is incorporated herein by reference from Exhibit 10.1 on Form 8-K of Nalco Holding Company filed on January 11, 2010 (File No. 001-32342). | |
| 10.75† |
Form of Director Indemnification Agreement, which is incorporated herein by reference from Exhibit 10.2 on Form 8-K of Nalco Holding Company filed on January 11, 2010 (File No. 001-32342). | |
| 14 |
Code of Ethical Business Conduct, which is incorporated herein by reference from Exhibit 99.2 on Form 8-K of Nalco Holding Company filed on May 7, 2008 (File No. 001-32342). | |
| 21.1* |
Active Subsidiaries of Nalco Holding Company. | |
| 23.1* |
Consent of Ernst & Young LLP. | |
119
Table of Contents
| Exhibit Number |
||
| 31.1* |
Certification of the Chairman, President and Chief Executive Officer pursuant to Rule 13a-14(a) of Securities Exchange Act of 1934, as adopted pursuant to Section 302 of the Sarbanes-Oxley Act of 2002. | |
| 31.2* |
Certification of the Executive Vice President, Chief Financial Officer and Treasurer pursuant to Rule 13a-14(a) of Securities Exchange Act of 1934, as adopted pursuant to Section 302 of the Sarbanes-Oxley Act of 2002. | |
| 32.1* |
Certification of J. Erik Fyrwald, our Chairman, President and Chief Executive Officer, and Bradley J. Bell, our Executive Vice President, Chief Financial Officer and Treasurer, pursuant to 18 U.S.C. Section 1350, as adopted pursuant to Section 906 of the Sarbanes-Oxley Act of 2002. | |
| * | Filed herewith |
| † | Indicates a management contract or compensatory plan. |
Shareholders may obtain copies of Exhibits without charge upon written request to the Corporate Secretary, Nalco Holding Company, 1601 West Diehl Road, Naperville, IL 60563.
120