Attached files
| file | filename |
|---|---|
| EX-32 - NEWALLIANCE BANCSHARES INC | e92512_ex321.htm |
| EX-23 - NEWALLIANCE BANCSHARES INC | e92512_ex231.htm |
| EX-32 - NEWALLIANCE BANCSHARES INC | e92512_ex322.htm |
| EX-31 - NEWALLIANCE BANCSHARES INC | e92512_ex312.htm |
| EX-31 - NEWALLIANCE BANCSHARES INC | e92512_ex311.htm |
| EX-10 - NEWALLIANCE BANCSHARES INC | e92512_ex1071.htm |
| EX-10 - NEWALLIANCE BANCSHARES INC | e92512_ex1017.htm |
| EX-10 - NEWALLIANCE BANCSHARES INC | e92512_ex1079.htm |
| EX-10 - NEWALLIANCE BANCSHARES INC | e92512_ex1073.htm |
| EX-10 - NEWALLIANCE BANCSHARES INC | e92512_ex1018.htm |
| EX-10 - NEWALLIANCE BANCSHARES INC | e92512_ex10711.htm |
| EX-10 - NEWALLIANCE BANCSHARES INC | e92512_ex10712.htm |
| EX-10 - NEWALLIANCE BANCSHARES INC | e92512_ex10710.htm |
| EX-10 - NEWALLIANCE BANCSHARES INC | e92512_ex1078.htm |
UNITED STATES
SECURITIES
AND EXCHANGE COMMISSION
Washington, D.C. 20549
FORM 10-K
[ X ] ANNUAL REPORT PURSUANT TO SECTION 13 OR 15(d) OF THE SECURITIES EXCHANGE ACT OF 1934
For the Fiscal Year Ended December 31, 2009
OR
[ ] TRANSITION REPORT PURSUANT TO SECTION 13 OR 15(d) OF THE SECURITIES EXCHANGE ACT OF 1934
Commission File Number: 001-32007
| Delaware | 52-2407114 | |||
| (State or other jurisdiction of incorporation or organization) | (I.R.S. Employer Identification No.) | |||
| 195 Church Street, New Haven, Connecticut | 06510 | |||
| (Address of principal executive offices) | (Zip Code) | |||
| Registrant’s telephone number, including area code: (203) 789-2767
Securities registered pursuant to Section 12(b) of the Act: None Securities registered pursuant to Section 12(g) of the Act: |
||||
| Title of each Class | Name of each exchange on which registered | |||
| Common Stock, par value $0.01 per share | New York Stock Exchange, Inc. | |||
Indicate by check mark whether
the registrant is a well-known seasoned issuer, as defined in Rule 405 of the Securities Act.
Indicate by check mark if the registrant is not required to file reports pursuant to Section 13 or Section 15(d) of the Act.
Indicate by check mark whether
the registrant (1) has filed all reports required to be filed by Section 13 or 15(d) of the Securities Exchange Act of 1934 during
the preceding 12 months (or for such shorter period that the registrant was required to file such reports), and (2) has been subject to such filing requirements for the past 90 days.
Indicate by check mark whether the registrant has submitted electronically and posted on its corporate website, if any, every Interactive Data File required to be
submitted and posted pursuant to Rule 405 of Regulation S-T (§232.405 of this chapter) during the preceding 12 months (or for such shorter period that the registrant
was required to submit and post such files).
Indicate by check mark if disclosure of delinquent filers pursuant to Item 405 of Regulation S-K (229.405 of this chapter) is not contained herein, and will not be contained, to the best of the registrant’s knowledge, in definitive proxy or information statements incorporated by reference in Part III of the Form 10-K or any amendment to this Form 10-K. X
Indicate by check mark whether the registrant is a large accelerated filer, an accelerated filer, a non-accelerated filer or a smaller reporting company. See the definitions of “large accelerated filer”, “accelerated filer” and “smaller reporting company” in Rule 12b-2 of the Exchange Act.
| Large accelerated filer X | Accelerated filer | |
| Non-accelerated filer | Smaller reporting company |
Indicate by check mark whether
the registrant is a shell company (as defined in Rule 12b-2 of the Act).
The market value of the common equity held by non-affiliates was $1.23 billion based upon the closing price of $11.50 as of June 30, 2009 as reported in The Wall Street Journal on July 1, 2009. Solely for the purposes of this calculation, directors and officers of the registrant are deemed to be affiliates. As of February 24, 2010 there were 105,971,903 shares of the registrant’s common stock outstanding.
Documents Incorporated by Reference
Portions of the definitive Proxy Statement for the Annual Meeting of Stockholders to be held on April 20, 2010 are incorporated by reference into Part III, Items 10 - 14 of this 10-K.
TABLE OF CONTENTS
2
Forward-Looking Statements
This report may contain certain forward-looking statements as that term is defined in the U.S. federal securities laws.
Forward-looking statements are based on
certain assumptions and describe future plans, strategies, and expectations of Management
and are generally identified by use of the word “plan”, “believe”, “expect”, “intend”, “anticipate”, “estimate”, “project”, or similar expressions. Management’s ability to
predict results or the actual effects of its plans or strategies is inherently uncertain.
Accordingly, actual results may differ materially from anticipated results.
Factors that could have a material adverse effect on the operations of NewAlliance
Bancshares, Inc. (“NewAlliance” or the “Company”) and its subsidiaries
include, but are not limited to:
| • | Changes in
the interest rate environment may reduce net interest margin and/or the volumes
and values of loans made or held as well as the value of other financial assets
held; |
| • | General economic
or business conditions, either nationally or regionally, may be less favorable than
expected, resulting in, among other things, a deterioration in credit quality and/or
a reduced demand for credit or other services; |
| • | Adverse changes may occur in the securities markets impacting the value of NewAlliance’s investments; |
| • | Competitive
pressures among depository and other financial institutions may increase significantly
and may decrease the profit margin associated with its business; |
| • | Recent government
initiatives are expected to have a profound effect on the financial services industry
and could dramatically change the competitive environment of the Company; |
| • | Other legislative
or regulatory changes, including those related to residential mortgages, changes
in accounting standards, and Federal Deposit Insurance Corporation (“FDIC”)
initiatives may adversely affect the businesses in which NewAlliance is engaged; |
| • | Local, state or federal taxing authorities may take tax positions that are adverse to NewAlliance; |
| • | Expected cost savings associated with mergers may not fully be realized or realized within expected time frames; |
| • | Deposit attrition, customer loss or revenue loss following completed mergers may be greater than expected; |
| • | Competitors of NewAlliance may have greater financial resources and develop products that enable them to compete more successfully than NewAlliance; |
| • | Costs or difficulties related to the integration of acquired businesses may be greater than expected; and |
| • | Unfavorable changes related to economic stress and dislocation may impact the Company’s vendors, counter-parties, and other entities on which the company has a dependence. |
Readers are cautioned not to place undue reliance on these forward-looking statements, which speak only as of the date of this report. Except as required by applicable law or regulation, Management undertakes no obligation to update these forward-looking statements to reflect events or circumstances that occur after the date on which such statements were made.
PART I
General
In 2003, NewAlliance was organized as a Delaware business corporation in connection with the conversion of NewAlliance Bank (the “Bank”), formerly New Haven Savings Bank, from mutual to capital stock form, which became effective on April 1, 2004. The Bank’s conversion resulted in the Company owning all of the Bank’s outstanding capital stock. The Bank is now a wholly-owned subsidiary of the Company, a bank holding company regulated by the Federal Reserve Board. On April 1, 2004, the Bank changed its name to NewAlliance Bank. The Bank was founded in 1838 as a Connecticut-chartered mutual savings bank and is regulated by the State of Connecticut Department of Banking and the FDIC.
By assets, NewAlliance is the third largest banking institution headquartered in Connecticut and the fourth largest based in New England with consolidated assets of $8.43 billion and stockholders’ equity of $1.43 billion at December 31, 2009. NewAlliance delivers financial services to individuals, families and businesses throughout Connecticut and Western Massachusetts. NewAlliance Bank provides commercial banking, retail banking, consumer financing, trust and investment services through 87 banking offices, 104 ATMs and its internet website (www.newalliancebank.com). NewAlliance common stock is traded on the New York Stock Exchange under the symbol “NAL”.
3
Lending Activities
General
The Company originates commercial loans, commercial real estate loans, residential
and commercial construction loans, residential real estate loans collateralized
by one- to four-family residences, home equity lines of credit and fixed rate loans
and other consumer loans predominantly in the States of Connecticut and Massachusetts.
Loan originations totaled $1.50 billion in 2009 as the Company was able to capitalize
on the opportunities in the marketplace by having the ability and liquidity to retain
or sell these loans. The Company also has a portfolio of purchased mortgage loans
as described below, with property locations throughout the United States.
Real estate secured the majority of the Company’s loans as of December 31, 2009, including some loans classified as commercial loans. Interest rates charged on loans are affected principally by the Company’s current asset/liability strategy, the demand for such loans, the cost and supply of money available for lending purposes and the rates offered by competitors. These factors are, in turn, affected by general economic and credit conditions, monetary policies of the federal government, including the Federal Reserve Board, federal and state tax policies and budgetary matters.
Residential Real Estate Loans
A principal lending activity of the Company is to originate prime
loans secured by first mortgages on one- to four-family residences in the states
of Connecticut and Massachusetts. The Company originates residential real estate
loans primarily through commissioned mortgage representatives and brokers across
our branch footprint. The Company originates both fixed rate and adjustable rate
mortgages and has purchased both adjustable rate and 10 and 15 year fixed rate mortgages
under its residential real estate purchase program. At December 31, 2009, the purchased
portfolio made up 21% and 10% of the total residential real estate and total loan
portfolios, respectively. Residential lending represents the largest single component
of our total portfolio.
The Company currently sells the majority of the fixed rate residential real estate loans it originates with terms of 15 years or more. During the third quarter of 2009, the Company allocated an initial pool of $50.0 million for the retention of jumbo 30 year fixed rate residential mortgage originations in its portfolio. In 2009, the Company originated $7.4 million in jumbo 30 year fixed rate mortgages that it retained in portfolio. Loans are originated for sale under forward rate commitments. The percentage of loans the Company sells will vary depending upon interest rates and our strategy for the management of interest rate risk. The majority of loans originated for sale are sold servicing released, but the bank continues to service loans both held in portfolio and those sold prior to May 2007.
Residential mortgage loan originations have remained very strong in 2009. The Company originated a record $1.04 billion in residential mortgage loans, including $475.9 million originated for sale. The decrease in conforming mortgage interest rates caused by government purchases of mortgage securities, a reduced number of competitors who have the ability and liquidity to retain or sell mortgage loans and enhanced sales efforts by the Bank were catalysts for the surge of mortgage originations we experienced throughout 2009.
In 2005, the Company began a strategy of purchasing adjustable rate and 10 and 15 year fixed rate residential mortgages and currently has purchased loans with property locations throughout the United States. The purchased portfolio is made up of prime loans individually re-underwritten by the Company to its underwriting criteria. In recent years, the mortgage market experienced extreme volatility and unusual pricing due to lower liquidity which led to a tightening of the credit markets and NewAlliance’s ensuing tightening of underwriting standards. The disruptions in the marketplace led to fewer residential mortgage purchases that met the Company’s pricing and underwriting criteria. In 2009 NewAlliance did not make any residential mortgage purchases and purchased $25.7 million during the twelve months ended December 31, 2008. NewAlliance plans on resuming purchases when loan pools are available that meet its criteria.
The retention of adjustable rate, shorter term fixed rate, or other designated pool allocations as discussed above of the jumbo 30 year fixed rate mortgages, as opposed to longer term, fixed rate residential mortgage loans in the portfolio helps reduce the Company’s exposure to interest rate risk. However, adjustable rate mortgages generally pose credit risks different from the credit risks inherent in fixed rate loans primarily because as interest rates rise, the underlying debt service payments of the borrowers rise, thereby increasing the potential for default. Management believes that these risks, which have not had a material adverse effect on the Company to date, generally are less onerous than the interest rate risks associated with holding long-term fixed rate loans in the loan portfolio. The Company’s residential real estate loan purchase program purchased adjustable rate mortgages and fixed rate mortgages with terms of maturity of less than 15 years. The servicing for these loans was retained by the seller. These purchases were originally concentrated in the Northeast and then expanded to locations across the United States following underwriting standards no less stringent than that used for the organic residential loan portfolio. The Company also purchases some fixed rate mortgages with terms greater than 15 years in low or moderate income areas within its Community Reinvestment Act assessment area.
4
On September 7, 2008, Federal Home Loan Mortgage Corporation (“FHLMC”) or (“Freddie Mac”) and Federal National Mortgage Association (“Fannie Mae”) or (“FNMA”) were placed into conservatorship by the United States Treasury Department (“Treasury”) and Federal Housing Finance Agency. This action, along with the softening of the real estate market, temporarily slowed originations and sales of fixed rate mortgages. By December 2008, however, and in conjunction with diminished competition and fixed mortgage rates dropping at times below 5%, originations surged. We expect the trend of low interest rates to continue into 2010 and have a positive effect on originations although not at the rate we experienced in 2009 due partly to the announced end of the government program to purchase mortgage-backed securities in March 2010. Lowering of interest rates has been one of the tools the government has used to stimulate the recessionary economy. The financial markets have become supportive of economic growth, however, the economic recovery is likely to be moderate for a time. With ready liquidity and adequate capital, the Company has been a leading originator in our market area throughout 2009 and expects to remain as such going forward.
Commercial Real Estate Loans
The Company makes commercial real estate loans throughout its
market area for the purpose of acquiring, developing, constructing, improving or
refinancing commercial real estate where the property is the primary collateral
securing the loan, and the income generated from the property is the primary repayment
source. Retail facilities, office buildings, light industrial, warehouse, multi-family
income properties, and medical facilities normally collateralize commercial real
estate loans. These properties are located primarily in Connecticut and Massachusetts.
Among the reasons for management’s continued emphasis on commercial real estate
lending is the desire to invest in assets with yields which are generally higher
than yields on one- to four-family residential mortgage loans, and are more sensitive
to changes in market interest rates. Terms generally range from five to 25 years,
with interest rates adjusting primarily in three, five and ten year intervals.
Commercial real estate lending generally poses a greater credit risk than residential mortgage lending to owner occupants. The repayment of commercial real estate loans depends on the business and financial condition of the borrower. Economic events and changes in government regulations, which the Company and its borrowers do not control, could have an adverse impact on the cash flows generated by properties securing commercial real estate loans and on the market value of such properties. Commercial properties tend to decline in value more rapidly than residential owner-occupied properties during economic recessions and individual loans on commercial properties tend to be larger than individual loans on residential properties.
Construction Loans
The Company originates both residential and commercial construction loans.
Typically loans are made to owner-borrowers who will occupy the properties (residential
construction) and to licensed and experienced developers for the construction of
single-family home developments (commercial construction).
Residential construction loans to owner-borrowers generally convert to a fully amortizing long-term mortgage loan upon completion of construction. Commercial construction loans generally have terms of six months to two years. Some construction-to-permanent loans have fixed interest rates for the permanent portion, but the Company originates mostly adjustable rate construction loans.
The proceeds of commercial construction loans are disbursed in stages and the terms may require developers to pre-sell a certain percentage of the properties they plan to build before the Company will advance any construction financing. Company officers, appraisers and/or independent engineers inspect each project’s progress before additional funds are disbursed to verify that borrowers have completed project phases.
Construction lending, particularly commercial construction lending, poses greater credit risk than mortgage lending to owner occupants. The repayment of commercial construction loans depends on the business and financial condition of the borrower and on the economic viability of the project financed. A number of borrowers have more than one construction loan outstanding with the Company at any one time. Economic events and changes in government regulations, which the Company and its borrowers do not control, could have an adverse impact on the value of properties securing construction loans and on the borrower’s ability to complete projects financed and, if not the borrower’s residence, sell them for amounts anticipated at the time the projects commenced.
The commercial construction portfolio includes loans to commercial borrowers for residential housing development including condominium projects. During 2008 and 2009, this segment related to residential development had been negatively impacted by the downturned economy as home sales volumes have been extremely low and prices have declined. The Company’s portfolio of these loans, however, is very small, at 2.3% and 3.9% of the total commercial real estate portfolio at December 31, 2009 and 2008, respectively, and less than one percent of the total loan portfolio for both periods.
Commercial Loans
Commercial loans are primarily collateralized by equipment, inventory, accounts
receivable and/or leases. Many of the Company’s commercial loans are also collateralized
by real estate, but are not classified as commercial real estate loans because such
loans are not
5
made for the purpose of acquiring, refinancing or constructing the real estate securing the loan. Commercial loans primarily provide working capital, equipment financing, financing for leasehold improvements and financing for expansion. The Company offers both term and revolving commercial loans. Term loans have either fixed or adjustable rates of interest and, generally, terms of between two and seven years. Term loans generally amortize during their life, although some loans require a balloon payment at maturity if the amortization exceeds seven years. Revolving commercial lines of credit typically have one or two-year terms, are renewable annually and have a floating rate of interest which is normally indexed to the Company’s “base rate” of interest and occasionally indexed to the London Interbank Offered Rated (“LIBOR”).
In the fourth quarter of 2009, NewAlliance launched a new division, NewAlliance Commercial Finance, the formation of an asset-based lending business. The new line of business expands the bank’s business lending offerings to include revolving lines of credit and term loans secured by accounts receivable, inventory, and other assets. An asset-based loan is collateralized with a customer’s balance sheet assets, which are considered the primary source of loan repayment. This type of financing is particularly attractive to start-up and growth companies, as well as those in restructuring, turn-around, or other financially distressed situations that result in the inability to secure traditional commercial lending. NewAlliance Bank is well capitalized and poised to expand its lending capabilities to business customers seeking relevant, flexible capital solutions beyond traditional commercial lending. The Company expects that asset-based lending will eventually represent five percent of total loans.
Commercial lending generally poses a higher degree of credit risk than real estate lending. Repayment of both secured and unsecured commercial loans depends substantially on the success of the borrower’s underlying business, financial condition and cash flows. Unsecured loans generally involve a higher degree of risk of loss than do secured loans because, without collateral, repayment is primarily dependent upon the success of the borrower’s business. There are very few unsecured loans in the Company’s portfolio. Secured commercial loans are generally collateralized by equipment, inventory, accounts receivable and leases. Compared to real estate, such collateral is more difficult to monitor, its value is more difficult to validate, it may depreciate more rapidly and it may not be as readily saleable if repossessed.
At December 31, 2009, the Company’s outstanding commercial loan portfolio included the following business sectors: manufacturing, professional services, wholesale trade, retail trade, transportation, educational and health services, contractors and real estate rental and leasing. Industry concentrations are reported quarterly to the Loan Committee of the Board of Directors.
Consumer Loans
The Company originates various types of consumer loans, including auto, mobile
home, boat, educational and personal installment loans. However, approximately 98%
of our consumer loan portfolio is comprised of home equity loans and lines of credit
secured by one- to four-family owner-occupied properties. These loans are typically
secured by second mortgages. Home equity loans have fixed interest rates, while
home equity lines of credit normally adjust based on the Company’s base rate
of interest. Consumer loans are originated through the branch network.
Credit Risk Management and Asset Quality
One of management’s key objectives has been and continues to be to maintain
a high level of asset quality. NewAlliance utilizes the following general practices
to manage credit risk:
| • | Limiting the amount of credit that individual lenders may extend; |
| • | Establishing a process for credit approval accountability; |
| • | Careful initial underwriting and analysis of borrower, transaction, market and collateral risks; |
| • | Ongoing servicing of the majority of individual loans and lending relationships; |
| • | Continuous monitoring of the portfolio, market dynamics and the economy; and |
| • | Periodically reevaluating the Bank’s strategy and overall exposure as economic, market and other relevant conditions change. |
NewAlliance’s lending strategy, which focuses on relationship-based lending within our markets, continues to produce excellent credit quality. As measured by relative levels of nonperforming assets, delinquencies, and net charge-offs, NewAlliance’s asset quality has consistently remained better than industry published averages.
Credit Administration is independent of the lending groups, and is responsible for the completion of credit analyses for all loans above a specific threshold, for determining loan loss reserve adequacy and for preparing monthly and quarterly reports regarding the credit quality of the loan portfolio, which are submitted to senior management and the Board of Directors, to ensure compliance with the credit policy. In addition, Credit Administration is responsible for managing nonperforming and classified assets. On a quarterly basis, the criticized loan portfolio which consists of commercial and commercial real estate loans that are risk rated Special Mention or worse, are reviewed by management, focusing on the current status and strategies to improve the credit.
6
The loan review function is outsourced to a third party to provide an evaluation of the creditworthiness of the borrower and the appropriateness of the risk rating classifications. The findings are reported to Credit Administration and summary information is then presented to the Loan Committee of the Board of Directors.
Trust Services
The Company provides a range of fiduciary and trust services and general investment management services to individuals, families and institutions. The Company will continue to emphasize the growth of its trust and investment management services to increase fee-based income. At December 31, 2009, Trust Services managed approximately 1,300 account relationships and had assets under management of $1.03 billion. These assets are not included in the Consolidated Financial Statements. For the years ended December 31, 2009, 2008 and 2007, revenues for this area were $5.8 million, $6.4 million and $6.8 million, respectively.
Brokerage, Investment Advisory and Insurance Services
The Company provides brokerage and insurance services through its wholly owned subsidiary, NewAlliance Investments, Inc., Member FINRA – Financial Industry Regulatory Authority /SIPC – Securities Investor Protection Corporation. The Firm offers traditional brokerage and insurance products through 23 registered representatives and 80 insurance licensed branch representatives offering customers an expansive array of investment products including stocks, bonds, mutual funds, fixed annuities, estate and retirement planning and life insurance. In 2007, the Company acquired Connecticut Investment Management Inc., an investment advisory firm.
Investment Activities
The primary objective of the investment portfolio is to achieve a profitable rate of return on the investments over a reasonable period of time based on prudent management practices and sensible risk taking. The portfolio is also used to help manage the net interest rate risk position of the Company. As a tool to manage interest rate risk, the flexibility to utilize long term fixed rate investments is quite limited. In view of the Company’s lending capacity and generally higher rates of return on loans, management prefers lending activities as its primary source of revenue with the securities portfolio serving a secondary role. The investment portfolio, however, is expected to continue to represent a significant portion of the Company’s assets, and includes U.S. Government and Agency securities, mortgage-backed securities, collateralized mortgage obligations, asset backed securities, high quality corporate debt, municipal bonds and corporate equities. The portfolio will continue to serve the Company’s liquidity needs as projected by management and as required by regulatory authorities.
Sources of Funds
The Company uses deposits, repayments and prepayments of loans and securities, proceeds from sales of loans and securities and proceeds from maturing securities and borrowings to fund lending, investing and general operations. Deposits represent the Company’s primary source of funds.
Deposits
The Company offers a variety of deposit accounts with a range of interest rates and
other terms, which are designed to meet customer financial needs. Retail and commercial
deposits are received through the Company’s banking offices. Additional deposit
services provided to customers are ATM, telephone, Internet Banking, Internet Bill
Pay, remote deposit capture and cash management.
The FDIC insures deposits up to certain limits (generally, $100,000 per depositor and $250,000 for certain retirement plan accounts). The Emergency Economic Stabilization Act of 2008 (“EESA”) signed into law on October 3, 2008 raised the $100,000 limit on insured deposits to $250,000, matching the limit on qualified retirement accounts through December 31, 2009. As part of the Helping Families Save Their Homes Act of 2009, the temporary deposit insurance limit was extended through December 31, 2013. In addition, under the FDIC’s Transaction Account Guarantee (“TAG”) portion of the Temporary Liquidity Guaranty Program (“TLGP”), non-interest bearing transaction deposit accounts and interest-bearing transaction accounts paying 50 basis points or less will be fully insured above and beyond the $250,000 limit through June 30, 2010.
Deposit flows are significantly influenced by economic conditions, the general level of interest rates and the relative attractiveness of competing deposit and investment alternatives. Deposit pricing strategy is monitored weekly by the Pricing Committee and results are reported monthly to the Asset/Liability Committee. When determining our deposit pricing, we consider strategic objectives, competitive market rates, deposit flows, funding commitments and investment alternatives, Federal Home Loan Bank (“FHLB”) advance rates and rates on other sources of funds.
7
National, regional and local economic and credit conditions, changes in competitor money market, savings and time deposit rates, prevailing market interest rates and competing investment alternatives all have a significant impact on the level of the Company’s deposits. In 2009, NewAlliance was successful in generating and maintaining core deposits due to the Company’s concerted marketing and sales efforts in conjunction with being seen as a safe haven and heightened consumer desire for cash liquidity. Deposit levels could come under pressure, however, as equity markets start to rebound.
Borrowings
The Company is a member of the FHLB which functions in a reserve credit capacity
for regulated, federally insured depository institutions and certain other home
financing institutions. As a member of the Federal Home Loan Bank of Boston (“FHLB
Boston”), a regional bank of the FHLB, NewAlliance Bank is required to own
capital stock in the FHLB Boston and is authorized to apply for advances on the
security of their FHLB Boston stock and certain home mortgages and other assets
(principally securities, which are obligations of, or guaranteed by, the United
States Government or its agencies) provided certain creditworthiness standards have
been met. Under its current credit policies, the FHLB Boston limits advances based
on a member’s assets, total borrowings and net worth. Long-term and short-term
FHLB Boston advances are utilized as a source of funding to meet liquidity and planning
needs when the cost of these funds are favorable as compared to deposits or alternate
funding sources.
Additional funding sources are available through securities sold under agreements to repurchase and the Federal Reserve Bank (“FRB”).
Acquisitions
The Company’s growth and increased market share have been achieved through both
internal growth and acquisitions. The Company continually evaluates acquisition
opportunities that would help meet our strategic objectives. NewAlliance will continue
to pursue economically advantageous acquisitions of banks, asset managers and leasing
and finance companies, and may pursue other strategic opportunities to grow existing
businesses or expand into other related financial businesses. NewAlliance’s
acquisition strategy is focused on three primary objectives:
| • | A return on investment that exceeds the Bank’s cost of capital; |
| • | Earnings accretion and franchise enhancement; and |
| • | An appropriate trade off between tangible book value dilution and earnings per share accretion/franchise enhancement. |
NewAlliance has completed six acquisitions since its conversion from a mutual bank to a stock bank in 2004, the most recent being in March of 2007. The volatility in the markets over the past 24 months has not been conducive to widespread acquisition activity, however, the Company continues to be interested in opportunities to expand the franchise if and when they arise. Opportunities may be in the form of whole institutions and individual or branch networks, all of which are in our acquisition growth strategy. The consideration paid for these acquisitions may be in the form of cash, debt or NewAlliance common stock. The amount of consideration paid to complete these transactions may be in excess of the book value of the underlying net assets acquired, which could have a dilutive effect on NewAlliance’s earnings and tangible capital. In addition, acquisitions result in front-end charges against earnings; however, cost savings and revenue enhancements are also typically anticipated. Additionally, to supplement its acquisition strategy, NewAlliance will also consider FDIC assisted acquisitions and growth through de-novo branches. In December 2009, NewAlliance announced the opening of a branch in downtown Hartford, Connecticut. The opening, which is expected to occur in April 2010, will increase the total number of banking offices to 88.
Subsidiary Activities
NewAlliance Bancshares, Inc. is a bank holding company and currently has the following wholly-owned subsidiaries. The Company has not participated in asset securitizations.
Alliance
Capital Trust I and Alliance Capital Trust II were organized by Alliance
Bancorp of New England, Inc. (“Alliance”) to facilitate the issuance of
“trust preferred” securities. The Company acquired these subsidiaries
when it acquired Alliance. The Company’s debt to Alliance Capital Trust II
is recorded as “Junior Subordinated Debentures issued to affiliated trusts” in Note 11 of the Notes to Consolidated Financial Statements contained elsewhere
in this report, and amounted to a total of $3.6 million at December 31, 2009. In
June 2009, the Company’s debt to Alliance Capital I was paid in full. |
||
Westbank
Capital Trust II and Westbank Capital Trust III were organized by Westbank Corporation
Inc. (“Westbank”) solely for the purpose of trust preferred financing.
The Company acquired these subsidiaries when it acquired Westbank on January 2,
2007. The Company’s debt to Westbank Capital Trust II and III is recorded as
“Junior Subordinated Debentures issued |
||
8
to affiliated trusts” in Note 11 of the Notes to Consolidated Financial Statements contained elsewhere in this report, and amounted
to a total of $17.5 million at December 31, 2009. |
||
NewAlliance
Bank is a Connecticut chartered capital stock savings bank and also has the
following wholly-owned subsidiaries all of which are incorporated in Connecticut. |
||
NewAlliance
Bank Community Development Corporation (“CDC”) was organized in 1999
pursuant to a federal law which encourages the creation of such bank subsidiaries
to further community development programs. The CDC has been funded by NewAlliance
Bank with $7.5 million in cash to provide flexible capital for community development
and neighborhood revitalization. The Bank intends to provide additional funding
to the CDC, up to $10.0 million in total, as the funds can be utilized. The CDC investments
can be in the form of equity, debt or mezzanine financing. Current investments include
artist housing, affordable housing loan pools, equity investments in downtown real
estate development and small business development funds. Fairbank Corporation is
a wholly-owned subsidiary of the CDC. Fairbank Corporation owns a 121-unit apartment
building in New Haven, Connecticut. The building includes tenants eligible for federal
“Section 8” housing cost assistance and a branch of the Bank. Fairbank
Corporation was formed and the investment made in 1971 to further the Bank’s
commitment to the New Haven community. |
||
The Loan
Source, Inc. is used to hold certain real estate that we may acquire through
acquisitions or foreclosure and other collection actions and investments in certain
limited partnerships. The Loan Source, Inc. currently has no foreclosure property
under ownership. |
||
NewAlliance
Servicing Company operates as the Bank’s passive investment company (“PIC”). A 1998 Connecticut law allows for the creation of PICs. A properly created
and maintained PIC allows the Bank to contribute its real estate loans to the PIC
where they are serviced. The PIC does not recognize income generated by the PIC
for the purpose of Connecticut business corporations’ tax, nor does the Bank
recognize income for these purposes on the dividends it receives from the PIC. Since
its establishment in 1998, the PIC has allowed the Bank, like many other banks with
Connecticut operations, to experience substantial savings on the Connecticut business
corporations tax that otherwise would have applied. |
||
NewAlliance
Investments Inc. offers brokerage and investment advisory services and fixed
annuities and other insurance products to its customers. NewAlliance Investments,
Inc. is a registered broker-dealer, registered investment advisor and is a member
of FINRA and SIPC. |
||
Employees
At December 31, 2009, the Company had 1,171 employees consisting of 932 full-time and 239 part-time employees. None of the employees were represented by a collective bargaining group. The Company maintains a comprehensive employee benefit program providing, among other benefits, group medical and dental insurance, life insurance, disability insurance, a pension plan, an employee 401(k) investment plan, an employee stock ownership plan and a stock-based long-term compensation plan. The Company’s pension plan was frozen to new participants hired after December 31, 2007. Management considers relations with its employees to be good. See Notes 12 and 13 of the Notes to Consolidated Financial Statements contained elsewhere within this report for additional information on certain benefit programs.
Market Area
The Company is headquartered in New Haven, Connecticut in New Haven County. The Company has 87 banking offices located throughout New Haven, Middlesex, Hartford, Tolland, Windham and Fairfield Counties in Connecticut and Hampden and Worcester Counties in Massachusetts. The Company’s primary deposit gathering area consists of the communities and surrounding towns that are served by its branch network. The Company’s primary lending area is much broader than its deposit gathering area and includes the entire State of Connecticut and Central and Western Massachusetts, although most of the Company’s loans are made to borrowers in its primary deposit gathering area.
Competition
The Company is subject to strong competition from banks and other financial institutions, including savings and loan associations, commercial banks, finance and mortgage companies, credit unions, consumer finance companies, brokerage firms and insurance companies. Certain of these competitors are larger financial institutions with substantially greater resources, lending limits, larger branch systems and a wider array of commercial banking services than NewAlliance. Competition from both bank and non-bank organizations is expected to continue.
9
The Company faces substantial competition for deposits and loans throughout its market area. The primary factors in competing for deposits are interest rates, personalized services, the quality and range of financial services, convenience of office locations, automated services and office hours. Competition for deposits comes primarily from other savings institutions, commercial banks, credit unions, mutual funds and other investment alternatives. The primary factors in competing for loans are interest rates, loan origination fees, the quality and range of lending services and personalized service. Competition for origination of first mortgage loans comes primarily from other savings institutions, mortgage banking firms, mortgage brokers and commercial banks and from other non-traditional lending financial service providers such as internet based lenders and insurance and securities companies. Competition for deposits, for the origination of loans and for the provision of other financial services may limit the Company’s future growth.
The banking industry is also experiencing rapid changes in technology. In addition to improving customer services, effective use of technology increases efficiency and enables financial institutions to reduce costs. Technological advances are likely to increase competition by enabling more companies to provide cost effective products and services.
Regulation and Supervision
General
The Company is required to file reports and otherwise comply with the rules and regulations
of the FRB, the FDIC, the Connecticut Banking Commissioner and the Securities and
Exchange Commission (“SEC”) under the federal securities laws.
The Bank is subject to extensive regulation by the Connecticut Department of Banking, as its chartering agency, and by the FDIC, as its deposit insurer. The Bank is required to file reports with, and is periodically examined by, the FDIC, the Connecticut Department of Banking and the FRB concerning its activities and financial condition. It must obtain regulatory approvals prior to entering into certain transactions, such as mergers.
In addition to federal and state banking laws and regulations, NewAlliance and certain of its subsidiaries including those that engage in brokerage, investment advisory and insurance activities, are subject to other federal and state laws and regulations. Changes in these laws and regulations are frequently introduced at both the federal and state levels. The likelihood and timing of any such changes and the impact such changes might have on NewAlliance and its subsidiaries are impossible to determine with certainty.
The following discussion of the laws and regulations material to the operations of the Company and the Bank is a summary and is qualified in its entirety by reference to such laws and regulations. Any change in such regulations, whether by the Connecticut Department of Banking, the FDIC, the SEC or the FRB, could have a material adverse impact on the Bank or the Company.
Holding Company Regulation
NewAlliance Bancshares, Inc. is a registered bank holding company
under the Bank Holding Company Act (“BHCA”) and is subject to comprehensive
regulation and regular examinations by the Federal Reserve Board. The Federal Reserve
Board also has extensive enforcement authority over bank holding companies, including,
among other things, the ability to assess civil money penalties, to issue cease
and desist or removal orders and to require that a holding company divest subsidiaries
(including its bank subsidiaries). In general, enforcement actions may be initiated
for violations of law and regulations and unsafe or unsound practices. Under Connecticut
banking law, no person may acquire beneficial ownership of more than 10% of any
class of voting securities of a Connecticut-chartered bank, or any bank holding
company of such a bank, without prior notification of, and lack of disapproval by,
the Connecticut Banking Commissioner.
Under Federal Reserve Board policy, a bank holding company must serve as a source of strength for its subsidiary bank. Under this policy, the Federal Reserve Board may require, and has required in the past, a holding company to contribute additional capital to an undercapitalized subsidiary bank.
Bank holding companies must obtain Federal Reserve Board approval before: (i) acquiring, directly or indirectly, ownership or control of any voting shares of another bank or bank holding company if, after such acquisition, it would own or control more than 5% of such shares (unless it already owns or controls the majority of such shares); (ii) acquiring all or substantially all of the assets of another bank or bank holding company; or (iii) merging or consolidating with another bank holding company.
The BHCA also prohibits a bank holding company, with certain exceptions, from acquiring direct or indirect ownership or control of more than 5% of the voting shares of any company which is not a bank or bank holding company, or from engaging directly or indirectly in activities other than those of banking, managing or controlling banks, or providing services for its subsidiaries. The principal exceptions to these prohibitions involve certain non-bank activities which, by statute or by FRB regulation or order, have been identified as activities closely related to the business of banking or managing or controlling banks. The list of activities permitted
10
by the FRB includes, among other things: (i) operating a savings institution, mortgage company, finance company, credit card company or factoring company; (ii) performing certain data processing operations; (iii) providing certain investment and financial advice; (iv) underwriting and acting as an insurance agent for certain types of credit-related insurance; (v) leasing property on a full-payout, non-operating basis; (vi) selling money orders, travelers’ checks and United States Savings Bonds; (vii) real estate and personal property appraising; (viii) providing tax planning and preparation services; (ix) financing and investing in certain community development activities; and (x) subject to certain limitations, providing securities brokerage services for customers.
Dividends
The Federal Reserve
Board has issued a policy statement on the payment of cash dividends by bank holding
companies, which expresses the Federal Reserve Board’s view that a bank holding
company should pay cash dividends only to the extent that the holding company’s
net income for the past year is sufficient to cover both the cash dividends and
a rate of earnings retention that is consistent with the holding company’s
capital needs, asset quality and overall financial condition. The FRB also indicated
that it would be inappropriate for a company experiencing serious financial problems
to borrow funds to pay dividends. Furthermore, under the prompt corrective action
regulations adopted by the Federal Reserve Board, the Federal Reserve Board may
prohibit a bank holding company from paying any dividends if the holding company’s bank subsidiary is classified as “undercapitalized.”
Financial Modernization
The Gramm-Leach-Bliley
Act (“GLBA”) permits greater affiliation among banks, securities firms,
insurance companies, and other companies under a new type of financial services
company known as a “financial holding company”. A financial holding company
essentially is a bank holding company with significantly expanded powers. Financial
holding companies are authorized by statute to engage in a number of financial activities
previously impermissible for bank holding companies, including securities underwriting,
dealing and market making; sponsoring mutual funds and investment companies; insurance
underwriting and agency; and merchant banking activities. The act also permits the
Federal Reserve Board and the Treasury Department to authorize additional activities
for financial holding companies if they are “financial in nature” or
“incidental” to financial activities. A bank holding company may become
a financial holding company if each of its subsidiary banks is well capitalized,
well managed, and has at least a “satisfactory” Community Reinvestment
Act rating. A financial holding company must provide notice to the Federal Reserve
Board within 30 days after commencing activities previously determined by statute
or by the Federal Reserve Board and Department of the Treasury to be permissible.
The Company has not submitted notice to the Federal Reserve Board of its intent
to be deemed a financial holding company. However, it is not precluded from submitting
a notice in the future should it wish to engage in activities only permitted to
financial holding companies.
Under GLBA, all financial institutions are required to establish policies and procedures to restrict the sharing of nonpublic customer data with nonaffiliated parties and to protect customer data from unauthorized access. In addition, the Fair and Accurate Credit Transactions Act of 2003 (“FACT Act”) includes many provisions concerning national credit reporting standards, and permits consumers, including customers of NewAlliance, to opt out of information sharing among affiliated companies for marketing purposes. The FACT Act also requires banks and other financial institutions to notify their customers if they report negative information about them to a credit bureau or if they are granted credit on terms less favorable than those generally available. The Federal Reserve and the Federal Trade Commission are granted extensive rulemaking authority under the FACT Act, and NewAlliance Bank and its affiliates are subject to those provisions. NewAlliance has developed policies and procedures for itself and its subsidiaries, including NewAlliance Bank, and believes it is in compliance with all privacy, information sharing, and notification provisions of GLBA and the FACT Act.
Connecticut Banking Laws and
Supervision
NewAlliance Bank is a state-chartered savings bank
under Connecticut law and as such is subject to regulation and examination by the
Commissioner and the Department of Banking of the State of Connecticut. The Department
of Banking regulates savings banks, among other financial institutions, for compliance
with the laws and regulations of the State of Connecticut, as well as the appropriate
rules and regulations of federal agencies. The approval of the Commissioner is required
for, among other things, the establishment of branch offices and business combination
transactions. The Commissioner conducts periodic examinations of Connecticut-chartered
banks. The FDIC also regulates many of the areas regulated by the Commissioner,
and federal law may limit some of the authority provided to Connecticut-chartered
banks by Connecticut law.
Lending Activities
Connecticut
banking laws grant savings banks broad lending authority, generally identical to
commercial banks. With certain limited exceptions, total loans made to any one obligor
under this statutory authority may not exceed 15% of a bank’s equity capital
and reserves for loan and lease losses, plus an additional 10% if the loan is fully
secured by readily marketable collateral.
11
Dividends
The Bank may pay cash dividends
out of its net profits. For purposes of this restriction, “net profits”
represents the remainder of all earnings from current operations. Further, the total
amount of all dividends declared by the Bank in any year may not exceed the sum
of its net profits for the year in question combined with its retained net profits
from the preceding two years, unless the Commissioner approves the larger dividend.
Federal law also prevents the Bank from paying dividends or making other capital
distributions that would cause it to become “undercapitalized.” The FDIC
may limit the Bank’s ability to pay dividends. No dividends may be paid to
the Bank’s stockholder if such dividends would reduce stockholders’ equity
below the amount of the liquidation account required by the Connecticut conversion
regulations.
Powers
Connecticut law permits Connecticut
banks to sell insurance and fixed- and variable-rate annuities if licensed to do
so by the Connecticut Insurance Commissioner. With the prior approval of the Commissioner,
Connecticut banks are also authorized to engage in a broad range of activities related
to the business of banking, or that are financial in nature or that are permitted
under the BHCA or the Home Owners’ Loan Act (“HOLA”), both federal
statutes, or the regulations promulgated as a result of these statutes. Connecticut
banks are also authorized to engage in any activity permitted for a national bank
or a federal savings association upon filing notice with the Commissioner, unless
the Commissioner disapproves the activity.
Assessments
Connecticut banks are required
to pay annual assessments to the Connecticut Department of Banking to fund the Department’s operations. The general assessments are paid pro-rata based upon a bank’s
asset size.
Enforcement
Under Connecticut law, the
Commissioner has extensive enforcement authority over Connecticut banks and, under
certain circumstances, affiliated parties, insiders, and agents. The Commissioner’s enforcement authority includes cease and desist orders, fines, receivership,
conservatorship, removal of officers and directors, emergency closures, dissolution
and liquidation.
Federal Regulations
Capital Requirements
Under FDIC regulations, federally insured state-chartered
banks that are not members of the FRB (“state non-member banks”), such
as NewAlliance Bank, are required to comply with minimum leverage capital requirements.
If the FDIC determines that an institution is not anticipating or experiencing significant
growth and is, in general, a strong banking organization, rated composite 1 under
the Uniform Financial Institutions Ranking System established by the Federal Financial
Institutions Examination Council, the minimum capital leverage requirement is a
ratio of Tier 1 capital to total assets of 3%. For all other institutions, the minimum
leverage capital ratio is not less than 4%. Tier 1 capital is the sum of common
stockholders’ equity, noncumulative perpetual preferred stock (including any
related surplus) and minority investments in certain subsidiaries, less intangible
assets (except for certain servicing rights and credit card relationships) and certain
other specified items.
The FDIC regulations require state non-member banks to maintain certain levels of regulatory capital in relation to regulatory risk-weighted assets. The ratio of regulatory capital to regulatory risk-weighted assets is referred to as a bank’s “risk-based capital ratio.” Risk-based capital ratios are determined by allocating assets and specified off-balance sheet items (including recourse obligations, direct credit substitutes and residual interests) to four risk-weighted categories ranging from 0% to 100%, with higher levels of capital being required for the categories perceived as representing greater risk. For example, under the FDIC’s risk-weighting system, cash and securities backed by the full faith and credit of the U.S. government are given a 0% risk weight, loans secured by one- to four-family residential properties generally have a 50% risk weight, and commercial loans have a risk weighting of 100%.
State non-member banks, such as the Bank, must maintain a minimum ratio of total capital to risk-weighted assets of at least 8%, of which at least one-half must be Tier 1 capital. Total capital consists of Tier 1 capital plus Tier 2 or supplementary capital items, which include allowances for loan losses in an amount of up to 1.25% of risk-weighted assets, cumulative preferred stock and certain other capital instruments, and a portion of the net unrealized gain on equity securities. The includable amount of Tier 2 capital cannot exceed the amount of the institution’s Tier 1 capital. Banks that engage in specified levels of trading activities are subject to adjustments in their risk based capital calculation to ensure the maintenance of sufficient capital to support market risk.
The Federal Deposit Insurance Corporation Improvement Act (the “FDICIA”) required each federal banking agency to revise its risk-based capital standards for insured institutions to ensure that those standards take adequate account of interest-rate risk, concentration of credit risk, and the risk of nontraditional activities, as well as to reflect the actual performance and expected risk of loss on multi-family residential loans. The FDIC, along with the other federal banking agencies, has adopted a regulation providing that the agencies will take into account the exposure of a bank’s capital and economic value to changes in interest rate risk in assessing a bank’s capital
12
adequacy. The FDIC also has authority to establish individual minimum capital requirements in appropriate cases upon determination that an institution’s capital level is, or is likely to become, inadequate in light of the particular circumstances.
As a bank holding company, the Company is subject to capital adequacy guidelines for bank holding companies similar to those of the FDIC for state-chartered banks.
Prompt Corrective Regulatory Action
Federal law requires, among other things, that federal bank regulatory authorities
take “prompt corrective action” with respect to banks that do not meet
minimum capital requirements. For these purposes, the law establishes five capital
categories:
| • | Well capitalized – at least 5% leverage capital, 6% tier one risk based capital and 10% total risk based capital. |
| • | Adequately capitalized – at least 4% leverage capital, 4% tier one risk based capital and 8% total risk based capital. |
| • | Undercapitalized
– less than 4% leverage capital, 4% tier one risk based capital and less than
8% total risk based capital. “Undercapitalized” banks must adhere to growth,
capital distribution (including dividend) and other limitations and are required
to submit a capital restoration plan. A bank’s compliance with such a plan
is required to be guaranteed by any company that controls the undercapitalized institution
in an amount equal to the lesser of 5% of the institution’s total assets when
deemed undercapitalized or the amount necessary to achieve the status of adequately
capitalized. |
| • | Significantly
undercapitalized – less than 3% leverage capital, 3% tier one risk based capital
and less than 6% total risk-based capital. “Significantly undercapitalized” banks must comply with one or more of a number of additional restrictions,
including but not limited to an order by the FDIC to sell sufficient voting stock
to become adequately capitalized, requirements to reduce total assets, cease receipt
of deposits from correspondent banks or dismiss directors or officers, and restrictions
on interest rates paid on deposits, compensation of executive officers and capital
distributions by the parent holding company. |
| • | Critically
undercapitalized – less than 2% tangible capital. “Critically undercapitalized” institutions are subject to additional measures including, subject to a narrow
exception, the appointment of a receiver or conservator within 270 days after it
obtains such status. |
As of December 31, 2009, NewAlliance Bank was “well capitalized”.
Transactions with Affiliates
Under federal
law, transactions between depository institutions and their affiliates are governed
by Sections 23A and 23B of the Federal Reserve Act (the “FRA”). In a holding
company context, at a minimum, the parent holding company of a bank and any companies
which are controlled by such parent holding company are affiliates of the bank.
Generally, sections 23A and 23B are intended to protect insured depository institutions
from suffering losses arising from transactions with non-insured affiliates, by
limiting the extent to which a bank or its subsidiaries may engage in covered transactions
with any one affiliate and with all affiliates of the bank in the aggregate, and
by requiring that such transactions be on terms that are consistent with safe and
sound banking practices.
Further, Section 22(h) of the FRA restricts loans to directors, executive officers, and principal stockholders (“insiders”). Under Section 22(h), loans to insiders and their related interests may not exceed, together with all other outstanding loans to such persons and affiliated entities, the institution’s total capital and surplus. Loans to insiders above specified amounts must receive the prior approval of the board of directors. Further, under Section 22(h), loans to directors, executive officers and principal stockholders must be made on terms substantially the same as offered in comparable transactions to other persons, except that such insiders may receive preferential loans made under a benefit or compensation program that is widely available to the bank’s employees and does not give preference to the insider over the employees. Section 22(g) of the FRA places additional limitations on loans to executive officers.
Enforcement
The FDIC has extensive enforcement
authority over insured banks, including NewAlliance Bank. This enforcement authority
includes, among other things, the ability to assess civil money penalties, issue
cease and desist orders and remove directors and officers. In general, these enforcement
actions may be initiated in response to violations of laws and regulations and unsafe
or unsound practices.
Insurance of Deposit Accounts
NewAlliance deposit accounts are insured by the FDIC up to applicable
legal limits (generally, $100,000 per depositor and $250,000 for certain retirement
plan accounts). Through the enactment of EESA, the $100,000 limit on insured deposits
was increased to $250,000, matching the limit on qualified retirement accounts,
through December 31, 2009 and was extended through December 31, 2013 as part of
the Helping Families Save Their Homes Act of 2009.
The Company and the Bank are participating in the FDIC’s TLGP. As a result, the Bank’s non-interest bearing transaction deposit accounts and interest-bearing transaction accounts paying 50 basis points or less will be fully insured above and beyond the $250,000
13
limit through June 30, 2010. The unlimited insurance coverage for covered deposits in excess of the $250,000 limit were subject to a surcharge to the Company of $0.10 per $100 of deposits by the FDIC in 2009 and will be assessed an annual rate of between $0.15 and $0.25 per $100, depending on the Risk Category of the institution during the extension period which is through June 30, 2010.
The FDIC has adopted a risk-based insurance assessment system. The FDIC assigns an institution to one of four risk categories based on the institution’s financial condition and supervisory ratings. An institution’s assessment rate depends on the capital category and supervisory category to which it is assigned. For 2008, assessment rates for insurance fund deposits varied from five basis points for the strongest institution to 43 basis points for the weakest. Effective January 1, 2009, the FDIC increased assessment rates uniformly by seven basis points for the first quarter of 2009 only, thereby making the assessment rates between twelve and 50 basis points. In February 2009, the FDIC adopted a final rule modifying the risk-based assessment system to change the way that the FDIC’s assessment system differentiates for risk and made corresponding changes to assessment rates beginning in the second quarter of 2009. Base assessment rates that took effect April 1, 2009 range between 12 and 45 basis points with three possible adjustments to assessment rates of (1) a decrease of up to five basis points for long-term unsecured debt, including subordinated debt and, for small institutions, a portion of Tier 1 capital (2) an increase not to exceed 50% percent of an institutions assessment rate before the increase for secured liabilities in excess of 25% of domestic deposits and (3) for non-Risk Category I institutions, an increase not to exceed 10 basis points for brokered deposits in excess of 10% of domestic deposits. This rule changed assessment rates to between seven and 77.5 basis points, depending on the risk category of the institution and its use of secured borrowings and brokered deposits. These rule changes by the FDIC had a significant effect on the Bank’s assessment costs. The assessment rate for NewAlliance Bank was approximately 14 basis points beginning April 1, 2009.
In November 2006, the FDIC Board of Directors approved a final rule to implement a One-Time Assessment Credit, as required by the Federal Deposit Insurance Reform Act of 2005 (“Reform Act”). For 2007 assessment periods, effective with the June 2007 invoice, credits were used to fully offset the Bank’s assessment. For assessment periods beginning in 2008, credits were applied to 90 percent of the Bank’s assessment and was exhausted in the first quarter of 2009.
In May 2009, the FDIC imposed a five basis point special assessment on each insured depository institutions assets minus Tier 1 capital as of June 30, 2009. This special assessment was due to recent and anticipated failures of FDIC-insured institutions resulting from the deterioration in banking and economic conditions that have significantly increased losses to the Deposit Insurance Fund (“DIF”).
In the fourth quarter of 2009, the FDIC voted to require insured institutions to prepay thirteen quarters of estimated insurance assessments. The estimated quarterly risk-based assessments for the fourth quarter of 2009, and for all of 2010, 2011, and 2012 was paid on December 30, 2009. Unlike the special assessment, the pre-payment allows the FDIC to strengthen the cash position of the DIF immediately without immediately impacting bank earnings.
In addition, FDIC insured institutions are required to pay assessments to the Federal Deposit Insurance Corporation at an annual rate of approximately 0.0114 of insured deposits to fund interest payments on bonds issued by the Financing Corporations, an agency of the federal government established to recapitalize the predecessor to the Savings Association Insurance Fund. These assessments will continue until the Financing Corporation bonds mature in 2017 through 2019. The assessment rate is adjusted quarterly to reflect changes in the assessment bases of the fund based on quarterly Call Report and Thrift Financial Report submissions.
The FDIC may terminate insurance of deposits if it finds that the institution is in an unsafe or unsound condition to continue operations, has engaged in unsafe or unsound practices, or has violated any applicable law, regulation, rule, order or condition imposed by the FDIC. The management of the Bank does not know of any practice, condition or violation that might lead to termination of deposit insurance.
Federal Reserve System
The FRB regulations require depository institutions to maintain reserves
against their transaction accounts (primarily NOW and regular checking accounts).
The FRB regulations generally require that reserves be maintained against aggregate
transaction accounts as follows: for that portion of transaction accounts aggregating
$55.2 million or less (which may be adjusted by the FRB) the reserve requirement
is 3%; and for amounts greater than $55.2 million, 10% (which may be adjusted by
the FRB between 8% and 14%), against that portion of total transaction accounts
in excess of $55.2 million. The first $10.7 million of otherwise reservable balances
(which may be adjusted by the FRB) are exempted from the reserve requirements. The
Bank is in compliance with these requirements.
The FRB pays interest on required
reserve balances held at Reserve Banks to satisfy reserve requirements and on excess
balances held in excess of required reserve balances and contractual clearing balances.
The interest rate paid on required reserve balances is determined by the Board of
Governors and is intended to eliminate effectively the implicit tax that reserve
requirements used to impose on depository institutions. The interest rate paid on
excess balances is also determined by the Board and gives the FRB an
14
additional
tool for the conduct of monetary policy. The interest rate paid as of December 31,
2009 was 25 basis points. The Board of Governors will continue to evaluate the appropriate
settings of the rates paid on balances in light of evolving market conditions and
make adjustments as needed.
Federal Home Loan Bank System
The Bank is a member of the FHLB, which consists of 12 regional FHLB’s. The FHLB provides a central credit facility primarily for member institutions.
Member institutions are required to acquire and hold shares of capital stock in
the FHLB in an amount at least equal to the sum of 0.35% of the aggregate principal
amount of its unpaid residential mortgage loans and similar obligations at the beginning
of each year and 4.5% of its advances (borrowings) from the FHLB. The Bank was in
compliance with this requirement with an investment in FHLB Boston stock at December
31, 2009 of $120.8 million. At December 31, 2009, the Bank had approximately $1.75
billion in FHLB Boston advances.
The FHLBs’ are required to provide funds for certain purposes including the resolution of insolvent thrifts in the late 1980s and contributing funds for affordable housing programs. These requirements could reduce the amount of dividends that the FHLB’s pay to their members and result in the FHLB’s imposing a higher rate of interest on advances to their members. If dividends were reduced, or interest on future FHLB advances increased, a member bank affected by such reduction or increase would likely experience a reduction in its net interest income. Recent legislation has changed the structure of the FHLBs’ funding obligations for insolvent thrifts, revised the capital structure of the FHLBs’ and implemented entirely voluntary membership for FHLBs’.
During the fourth quarter of 2008 and throughout 2009 several of the regional banks within the FHLB took significant credit related other-than-temporary impairment charges on certain private-label residential mortgage-backed securities and home equity loan investments. In February 2009, the FHLB Boston advised its members that, while it currently meets all its regulatory capital requirements, it was focusing on preserving capital in response to ongoing market volatility, and accordingly, suspended its quarterly dividend and extended the moratorium on excess stock purchases, primarily due to other-than-temporary impairment charges on its private-label mortgage-backed securities investments. The Boston regional bank recorded other-than-temporary impairment charges of approximately $370.0 million for the nine months ended September 30, 2009 on their portfolio of private-label mortgage-backed securities. The FHLB Boston has stated that it expects and intends to hold its private-label mortgage-backed securities to maturity. In a letter to member banks on October 29, 2009, the FHLB Boston announced the filing of its quarterly report to the SEC and disclosed that the credit quality of the loans underlying its portfolio of private-label mortgage-backed securities remains vulnerable to the housing and capital markets, which could result in additional losses. Accordingly, to protect its capital base and build the retained earnings, the moratorium on excess stock repurchases and the quarterly dividend payout suspension continue. Also, the FHLB Boston implemented a revised operating plan that includes certain revenue enhancement and expense reduction initiatives and the goal of the plan is to build retained earnings to an appropriate level so that they may eventually resume paying dividends and end the moratorium on excess stock repurchases.
Recent Regulatory Initiatives
Helping Families Save Their Homes Act of 2009
On May 20, 2009,
President Obama signed into law the Helping Families Save Their Homes Act of 2009.
This act was a step towards stabilizing and reforming the United States financial
and housing markets by helping American homeowners and increasing the flow of credit.
It expands the reach of the Making Home Affordable Program (a Troubled Asset Relief
Program (“TARP”) initiative) with a thrust on reducing foreclosures, makes
improvements to Hope for Homeowners which targets help to underwater borrowers and
made modifications to Federal Housing Authority and federally guaranteed farm loans.
The act also contains provisions to help restore and support the flow of credit
by increasing the borrowing authority of the FDIC and the National Credit Union
Administration as well as extending the temporary increase in deposit insurance.
The increase in deposit insurance provides added confidence to depositors and, in
turn, will provide depository institutions with a more stable source of funding
and enhanced ability to continue making credit available across the economy.
Real Estate Settlement Procedures Act
The U.S. Department of Housing and Urban Development (“HUD”) issued a final
rule effective January 1, 2010 that implements significant changes to the Real Estate
Settlement Procedures Act (“RESPA”). The new rules require a standard
form of Good Faith Estimate to disclose key terms and closing costs, including items
such as the loan term, fixed or adjustable interest rate, prepayment penalty, total
closing cost and cost of homeowners insurance. Additionally, changes to the settlement
statement are also required and will allow borrowers to compare their final closing
costs and loan terms against their good faith estimate. There are also limitations
on third-party costs and a 30 day window from the date of closing to correct any
errors or violations and reimburse the borrower for any overcharges.
15
Regulation E, Electronic Fund Transfers
The Board of Governors of the FRB amended Regulation E, Electronic Fund Transfers,
with final rules announced November 12, 2009 that prohibit financial institutions
from charging consumers fees for paying overdrafts on automated teller machine (“ATM”) and one-time debit card transactions, unless a consumer consents,
or opts in, to the overdraft service for those types of transactions. Consumers
will also be provided a clear disclosure of the fees and terms associated with the
institution’s overdraft service. The mandatory compliance date is July 1, 2010.
Other Regulation
Temporary Liquidity Guarantee Program
On November 21, 2008, the FDIC adopted
the Final Rule implementing the TLGP inaugurated October 14, 2008. The TLGP consists
of two basic components: (1) the Debt Guarantee Program which guarantees newly issued
senior unsecured debt of banks, thrifts, and certain holding companies and (2) the
Transaction Account Guarantee Program which guarantees certain non-interest bearing
deposit transaction accounts, such as business payroll accounts, regardless of dollar
amount. The purpose of the TLGP was to provide an initiative to counter the system
wide crisis in the nation’s financial sector by promoting financial stability
by preserving confidence in the banking system and encourages liquidity in order
to ease lending to creditworthy business and consumers.
The Company is participating in the TLGP and as a result, its non-interest bearing transaction deposit accounts and interest bearing transaction accounts paying 50 basis points or less will be fully insured through June 30, 2010. The Company did not participate in the Debt Guarantee portion of the TLGP.
Emergency Economic Stabilization Act of
2008
On October 3, 2008, President Bush signed into law the EESA. The legislation
was in response to the financial crises affecting the banking system and financial
markets. The TARP was established under the EESA with the specific goal of stabilizing
the United States financial system and preventing a systemic collapse. This was
initially done by infusing billions of dollars into financial institutions and U.S.
automakers. Since 2008, the U.S. Department of the Treasury has established several
programs under the TARP, including the Financial Stability Program to further stabilize
the financial system, restore the flow of credit to consumers and businesses and
tackle the foreclosure crisis to keep millions of Americans in their homes.
NewAlliance is not participating in the TARP due to having adequate capital and the restrictive nature of the TARP guidelines. TARP would place restrictions on common share dividend increases, dilute our existing shareholders through the grant of warrants, restrict share repurchases and reduce earnings per share and return on equity.
Sarbanes-Oxley Act of 2002
The stated
goals of the Sarbanes-Oxley Act of 2002 (“SOX”) are to increase corporate
responsibility, to provide for enhanced penalties for accounting and auditing improprieties
at publicly traded companies and to protect investors by improving the accuracy
and reliability of corporate disclosures pursuant to the securities laws.
SOX includes very specific additional disclosure requirements and new corporate governance rules, requires the SEC and securities exchanges to adopt extensive additional disclosure, corporate governance and other related rules and mandates further studies of certain issues by the SEC and the Comptroller General. SOX represents significant federal involvement in matters traditionally left to state regulatory systems, such as the regulation of the accounting profession, and to state corporate law, such as the relationship between a board of directors and management and between a board of directors and its committees.
SOX addresses, among other matters, audit committees; certification of financial statements and internal controls by the Chief Executive Officer and Chief Financial Officer; the forfeiture of bonuses or other incentive-based compensation and profits from the sale of an issuer’s securities by directors and senior officers in the twelve-month period following initial publication of any financial statements that later require restatement; a prohibition on insider trading during pension plan black-out periods; disclosure of off-balance sheet transactions; a prohibition on certain loans to directors and officers; expedited filing requirements for Forms 4; disclosure of a code of ethics and filing a Form 8-K for significant changes or waivers of such code; “real time” filing of periodic reports; the formation of a public company accounting oversight board (“PCAOB”); auditor independence; and various increased criminal penalties for violations of securities laws. The SEC has enacted rules to implement various provisions of SOX.
USA PATRIOT Act
Under Title III of the
USA PATRIOT Act, all financial institutions are required to take certain measures
to identify their customers, prevent money laundering, monitor customer transactions
and report suspicious activity to U.S. law enforcement agencies. Financial institutions
also are required to respond to requests for information from federal banking regulatory
authorities and law enforcement agencies. Information sharing among financial institutions
for the above purposes is encouraged by an exemption granted to complying financial
institutions from the privacy provisions of GLBA and other privacy laws. Financial
institutions that hold
16
correspondent accounts for foreign banks or provide private banking services to foreign individuals are required to take measures to avoid dealing with certain foreign individuals or entities, including foreign banks with profiles that raise money laundering concerns, and are prohibited from dealing with foreign “shell banks” and persons from jurisdictions of particular concern. The primary federal banking regulators and the Secretary of the Treasury have adopted regulations to implement several of these provisions. All financial institutions also are required to establish internal anti-money laundering programs. The effectiveness of a financial institution in combating money laundering activities is a factor to be considered in any application submitted by the financial institution under the Bank Merger Act or the BHCA. NewAlliance has in place a Bank Secrecy Act and USA PATRIOT Act compliance program, and engages in very few transactions of any kind with foreign financial institutions or foreign persons.
Community Reinvestment Act and Fair Lending
Laws
NewAlliance has a responsibility under the Community Reinvestment Act of
1977 (“CRA”) to help meet the credit needs of our communities, including
low- and moderate-income neighborhoods. The CRA does not establish specific lending
requirements or programs for financial institutions nor does it limit an institution’s discretion to develop the types of products and services that it believes
are best suited to its particular community, consistent with the CRA. In connection
with its examination, the FDIC assesses our record of compliance with the CRA. In
addition, the Equal Credit Opportunity Act and the Fair Housing Act prohibit discrimination
in lending practices on the basis of characteristics specified in those statutes.
Our failure to comply with the provisions of the CRA could, at a minimum, result
in regulatory restrictions on our activities. Our failure to comply with the Equal
Credit Opportunity Act and the Fair Housing Act could result in enforcement actions
against us by the FDIC as well as other federal regulatory agencies and the Department
of Justice. The Bank’s latest FDIC CRA rating was “outstanding”.
New York Stock Exchange Disclosure
The annual certification of NewAlliance’s Chief Executive Officer required to be furnished to the New York Stock Exchange pursuant to Section 303A.12(a) of the NYSE Listed Company Manual was previously filed with the New York Stock Exchange on May 20, 2009.
Impact of Inflation and Changing Prices
The Consolidated Financial Statements and their Notes presented within this document have been prepared in accordance with accounting principles generally accepted in the United States of America (“GAAP”), which requires the measurement of financial position and operating results in terms of historical dollar amounts without considering changes in the relative purchasing power of money over time due to inflation. The impact of inflation is reflected in the increased cost of the Company’s operations. Unlike the assets and liabilities of industrial companies, nearly all of the assets and liabilities of the Company are monetary in nature. As a result, interest rates have a greater impact on the Company’s performance than do the effects of general levels of inflation. Interest rates do not necessarily move in the same direction or to the same extent as the prices of goods and services.
Availability of Information
NewAlliance makes available free of charge on our website (http://www.newalliancebank.com), our annual report on Form 10-K, our quarterly reports on Form 10-Q, current reports on Form 8-K, and amendments to those reports filed or furnished pursuant to Section 13(a) of the Securities Exchange Act of 1934 as soon as practicable after we electronically file such reports with or furnish it to the SEC. NewAlliance is an electronic filer and as such reports filed with the SEC are also available on their website (http://www.sec.gov). The public may also read and copy any materials filed with the SEC at the SEC’s Public Reference Room, 100 F Street, NE, Washington, DC 20549. Information about the Public Reference Room can be obtained by calling 1-800-SEC-0330. Information on our website is not incorporated by reference into this report. Investors are encouraged to access these reports and the other information about our business and operations on our website.
17
An investment in our common stock involves certain risks inherent to our business. The material risks and uncertainties that management believes affect the Company are described below. To understand these risks and to evaluate an investment in our common stock, you should read this entire report, including the following risk factors.
If any of the following risks actually occur, the Company’s financial condition and results of operations could be materially and adversely affected. If this were to happen, the value of the Company’s common stock could decline significantly.
Changes in interest rates and spreads
could have a negative impact on earnings and results of operations, which could
have a negative impact on the value of NewAlliance stock.
NewAlliance’s
earnings and financial condition are dependent to a large degree upon net interest
income, which is the difference between interest earned from loans and investments
and interest paid on deposits and borrowings. The narrowing of interest rate spreads,
meaning the difference between interest rates earned on loans and investments and
the interest rates paid on deposits and borrowings, could adversely affect NewAlliance’s earnings, unrealized gains and financial condition. The Company cannot predict
with certainty or control changes in interest rates. Regional and local economic
conditions and the policies of regulatory authorities, including monetary policies
of the Federal Reserve Board, affect interest income and interest expense. The Company
has ongoing policies and procedures designed to manage the risks associated with
changes in market interest rates.
However, changes in interest rates still may have an adverse effect on NewAlliance’s profitability. For example, high interest rates could also affect the amount of loans that we originate, because higher rates could cause customers to apply for fewer mortgages, or cause depositors to shift funds from accounts that have a comparatively lower rate, to accounts with a higher rate or experience customer attrition due to competitor pricing. If the cost of interest-bearing deposits increases at a rate greater than the yields on interest-earning assets increase, net interest income will be negatively affected. Changes in the asset and liability mix may also affect net interest income. Similarly, lower interest rates cause higher yielding assets to prepay and floating or adjustable rate assets to reset to lower rates. If the Bank is not able to reduce its funding costs sufficiently, due to either competitive factors or the maturity schedule of existing liabilities, then the Bank’s net interest margin will decline.
Credit market conditions may impact NewAlliance’s investments.
Significant credit market anomalies may impact the valuation
and liquidity of the Company’s investment securities. The problems of numerous
financial institutions have reduced market liquidity, increased normal bid-asked
spreads and increased the uncertainty of market participants. Such illiquidity could
reduce the market value of the Company’s investments, even those with no apparent
credit exposure. The valuation of the Company’s investments requires judgment
and as market conditions change investment values may also change.
Weakness in the markets for residential
or commercial real estate, including the secondary residential mortgage loan markets,
could reduce NewAlliance’s net income and profitability.
Beginning in
2007 and continuing into 2010, softening residential housing markets, increasing
delinquency and default rates, and increasingly volatile and constrained secondary
credit markets began affecting the mortgage industry generally. NewAlliance’s
financial results may be adversely affected by changes in real estate values. Decreases
in real estate values could adversely affect the value of property used as collateral
for loans and investments. If poor economic conditions result in decreased demand
for real estate loans, the Company’s net income and profits may decrease.
The declines in home prices in many markets across the U.S., along with the reduced availability of mortgage credit, also may result in increases in delinquencies and losses in NewAlliance’s portfolio of loans related to residential real estate construction and development. Further declines in home prices coupled with a worsening economic recession and associated increases in unemployment levels could drive losses beyond that which is provided for in NewAlliance’s allowance for loan losses. In that event, NewAlliance’s earnings could be adversely affected.
Additionally, recent weakness in the secondary market for residential lending could have an adverse impact upon the Company’s profitability. Significant ongoing disruptions in the secondary market for residential mortgage loans have limited the market for and liquidity of most mortgage loans other than conforming Fannie Mae and Freddie Mac loans. The effects of ongoing mortgage market challenges, combined with the ongoing correction in residential real estate market prices and reduced levels of home sales, could result in further price reductions in single family home values, adversely affecting the value of collateral securing mortgage loans held, mortgage loan originations and gains on sale of mortgage loans. Continued declines in real estate values and home sales volumes, and financial stress on borrowers as a result of job losses, or other factors, could have further adverse effects on borrowers that result in higher delinquencies and greater charge-offs in future periods, which would adversely affect NewAlliance’s financial condition or results of operations.
18
NewAlliance may experience higher levels of loan
losses due to current economic conditions.
The current economic conditions
have led to declines in collateral values and stress on the cash flows of borrowers.
Therefore, NewAlliance’s allowance for loan losses may need to be increased,
or may be deemed insufficient by various regulatory agencies. Such agencies may
require the Bank to recognize an increase to the allowance for loan losses. Any
increases in the allowance for loan losses will result in a decrease in net income
and, possibly capital, and may have a material adverse effect on NewAlliance’s
financial condition and results of operations. See the sections titled “Allowance
for Loan Losses” and “Classification of Assets and Loan Review” in
Item 7, Management’s Discussion and Analysis of Financial Condition and Results
of Operation, located elsewhere in the Report for further discussion related to
the process for determining the appropriate level of the allowance for loan losses.
If the goodwill that the Company has
recorded in connection with its acquisitions becomes impaired, it could have a negative
impact on the Company’s profitability.
Applicable accounting standards
require that the purchase method of accounting be used for all business combinations.
Under purchase accounting, if the purchase price of an acquired company exceeds
the fair value of the company’s net assets, the excess is carried on the acquirer’s balance sheet as goodwill. At December 31, 2009, the Company had approximately
$527.2 million of goodwill on its balance sheet. Companies must evaluate goodwill
for impairment at least annually. Write-downs of the amount of any impairment, if
necessary, are to be charged to the results of operations in the period in which
the impairment occurs. There can be no assurance that future evaluations of goodwill
will not result in findings of impairment and related write-downs, which may have
a material adverse effect on NewAlliance’s financial condition and results
of operations.
NewAlliance’s business strategy
of growth through acquisitions could have an impact on earnings and results of operations
that may negatively impact the value of NewAlliance stock.
In recent years,
NewAlliance has focused, in part, on acquisitions. Over the past five years, the
Company has acquired four banking institutions, a non-depository trust company and
a registered investment advisory firm. From time to time in the ordinary course
of business, the Company engages in preliminary discussions with potential acquisition
targets. As of the date of this filing, there are no binding or definitive agreements,
plans, arrangements, or understandings for such acquisitions by the Company. Although
our business strategy includes both internal expansion and acquisitions, there can
be no assurance that, in the future, we will successfully identify suitable acquisition
candidates, complete acquisitions successfully, integrate acquired operations into
our existing operations or expand into new markets. Further, there can be no assurance
that acquisitions will not have an adverse effect upon our operating results while
the operations of the acquired businesses are being integrated into our operations.
In addition, once integrated, acquired operations may not achieve levels of profitability
comparable to those achieved by our existing operations, or otherwise perform as
expected. Further, transaction-related expenses or expenses related to the work
on transactions that do not close, may adversely affect our earnings. These adverse
effects on our earnings and results of operations may have a negative impact on
the value of our stock.
The impact on the Company and the Bank
of enacted legislation, in particular the Emergency Economic Stabilization Act of
2008 and its implementing regulations cannot be predicted at this time.
On October 3, 2008, President Bush signed into law the EESA, which includes the TARP.
The legislation was in response to the financial crises affecting the banking system
and financial markets. EESA is expected to have a profound effect on the financial
services industry. The effect of programs developed under EESA, including the TARP
and Capital Purchase Program (“CPP”), could dramatically change the competitive
environment of the Company.
TARP gave the Treasury authority to deploy up to $700.0 billion into the financial system with an objective of improving liquidity in capital markets. On October 14, 2008, Treasury announced plans to direct $250.0 billion of this authority into preferred stock investments in banks (the CPP), the first $125.0 billion of which was allocated to nine major financial institutions. By the end of December 2008, an additional $100.0 billion was allocated to American International Group, the Federal Reserve Bank of New York, Citigroup and U.S. automakers, GM and Chrysler. In January 2009, the remaining $350.0 billion was also released by Congress. Through September 30, 2009, the Treasury disbursed over $200.0 billion in capital to 685 institutions in 48 states under the CPP. Many of these institutions have since redeemed these investments. The general terms of this preferred stock program are as follows for a participating bank:
| - | Pay 5% dividends on the Treasury’s preferred stock for the first five years, and then 9% dividends thereafter (not tax deductible); | |
| - | Cannot increase common stock dividends for three years while Treasury is an investor; | |
| - | Cannot redeem the Treasury preferred stock for three years unless the participating bank raises high-quality private capital; | |
| - | Must receive Treasury’s consent to buy back their own stock; | |
| - | Treasury receives warrants entitling Treasury to buy participating bank’s common stock equal to 15% of Treasury’s total investment in the participating bank, and | |
| - | Participating bank executives must agree to certain compensation restrictions, and restrictions on the amount of executive compensation which is tax deductible. |
19
The President has recently proposed a program to incent small business lending activity by making unused TARP funds available for this purpose. The Company is not participating in the CPP, however, the actual impact that EESA and the implementation of exisiting programs, or any other governmental program will have on the financial markets and the Company cannot reliably be determined at this time.
Strong competition within NewAlliance’s market areas may limit growth and profitability.
Competition in the
banking and financial services industry is intense. In our market areas, we compete
with commercial banks, savings institutions, mortgage brokerage firms, credit unions,
finance companies, mutual funds, insurance companies, and brokerage and investment
banking firms operating locally and elsewhere. As we grow, we will be expanding
into market areas where we may not be as well known as other institutions that have
been operating in those areas for some time. In addition, larger banking institutions
have become increasingly active in our market areas. Many of these competitors have
substantially greater resources and lending limits than we have and may offer certain
services that we do not or cannot efficiently provide. Our profitability depends
upon our continued ability to successfully compete in our market areas. The greater
resources and deposit and loan products offered by some of our competitors may limit
our ability to grow profitably.
NewAlliance is subject to extensive government
regulation and supervision.
NewAlliance, primarily through NewAlliance Bank
and certain non-bank subsidiaries, is subject to extensive federal and state regulation
and supervision. Banking regulations are primarily intended to protect depositors’ funds, federal deposit insurance funds and the banking system as a whole,
not stockholders. These regulations affect the Company’s lending practices,
capital structure, investment practices, dividend policy and growth, among other
things. Congress and federal regulatory agencies continually review banking laws,
regulations and policies for possible changes. Changes to statutes, regulations
or regulatory policies, including changes in interpretation or implementation of
statutes, regulations or policies, could affect the Company in substantial and unpredictable
ways. Such changes could subject the Company to additional costs, limit the types
of financial services and products we may offer and/or increase the ability of non-banks
to offer competing financial services and products, among other things. Failure
to comply with laws, regulations or policies could result in sanctions by regulatory
agencies, civil money penalties and/or reputation damage, which could have a material
adverse effect on the Company’s business, financial condition and results of
operations. While NewAlliance has policies and procedures designed to prevent any
such violations, there can be no assurance that such violations will not occur.
See the section captioned “Regulation and Supervision” in Item 1 of this
report for further information.
NewAlliance may not pay you dividends
if NewAlliance is not able to receive dividends from its subsidiary, NewAlliance
Bank.
Cash dividends from NewAlliance Bank and our liquid assets are our
principal sources of funds for paying cash dividends on our common stock. Unless
we receive dividends from NewAlliance Bank or choose to use our liquid assets, we
may not be able to pay dividends. NewAlliance Bank’s ability to pay us dividends
is subject to its ability to earn net income and to meet certain regulatory requirements.
NewAlliance’s stock price can be
volatile.
NewAlliance’s stock price can fluctuate widely in response to a variety of factors
including:
| • | actual or anticipated variations in quarterly operating results; |
| • | recommendations by securities analysts; |
| • | new technology used, or services offered, by competitors; |
| • | significant acquisitions or business combinations, strategic partnerships, joint ventures or capital commitments by or involving the Company or the Company’s competitors; |
| • | failure to integrate acquisitions or realize anticipated benefits from acquisitions; |
| • | operating and stock price performance of other companies that investors deem comparable to NewAlliance; |
| • | news reports relating to trends, concerns and other issues in the financial services industry; |
| • | changes in government regulations; and |
| • | geopolitical conditions such as acts or threats of terrorism or military conflicts. |
General market fluctuations, industry factors and general economic and political conditions and events, such as economic slowdowns or recessions, interest rate changes, credit loss trends or currency fluctuations could also cause NewAlliance’s stock price to decrease regardless of the Company’s operating results.
NewAlliance may not be able to attract
and retain skilled people.
NewAlliance’s success depends, in large part,
on its ability to attract and retain key people. Competition for the best people
in most activities engaged in by the Company can be intense and we may not be able
to hire people or to retain them. The unexpected loss of services of one or more
of the Company’s key personnel could have a material adverse impact on the
business because of their skills, knowledge of the market, years of industry experience
and the difficulty of promptly finding qualified replacement personnel.
20
NewAlliance
continually encounters technological change.
The financial services industry
is continually undergoing rapid technological change with frequent introductions
of new technology-driven products and services. The effective use of technology
can increase efficiency and enable financial institutions to better serve customers
and to reduce costs. However, some new technologies needed to compete effectively
result in incremental operating costs. The Company’s future success depends,
in part, upon its ability to address the needs of its customers by using technology
to provide products and services that will satisfy customer demands, as well as
to create additional efficiencies in operations. Many of the Company’s competitors
have substantially greater resources to invest in technological improvements. The
Company may not be able to effectively implement new technology-driven products
and services or be successful in marketing these products and services to its customers.
Failure to successfully keep pace with technological change affecting the financial
services industry could have a material adverse impact on the Company’s business
and, in turn, its financial condition and results of operations.
NewAlliance’s controls and procedures
may fail or be circumvented.
Management regularly reviews and updates the
Company’s internal controls, disclosure controls and procedures, and corporate
governance policies and procedures. Any system of controls, however well designed
and operated, is based in part on certain assumptions and can provide only reasonable,
not absolute, assurances that the objectives of the system are met. Any failure
or circumvention of the controls and procedures or failure to comply with regulations
related to controls and procedures could have a material adverse effect on the Company’s business, results of operations and financial condition.
Customer information may be obtained
and used fraudulently.
Risk of theft of customer information resulting from
security breaches by third parties or the lack of controls by third party vendors
exposes the Company to reputation risk and potential monetary loss. The Company
has exposure to fraudulent use of our customer’s personal information resulting
from its general business operations through loss or theft of the information and
through customer use of financial instruments, such as debit cards.
Changes in accounting standards can materially
impact NewAlliance’s financial statements.
NewAlliance’s accounting
policies and methods are fundamental to how the Company records and reports its
financial condition and results of operations. From time to time, the Financial
Accounting Standards Board or regulatory authorities change the financial accounting
and reporting standards that govern the preparation of our financial statements.
These changes can be hard to predict and can materially impact how we record and
report our financial condition and results of operations. In some cases, we could
be required to apply a new or revised standard retroactively, resulting in the Company
restating prior period financial statements.
Changes and interpretations of tax laws
and regulations may adversely impact NewAlliance’s financial statements.
Local, state or federal tax authorities may interpret tax laws and regulations
differently than NewAlliance and challenge tax positions that NewAlliance has taken
on its tax returns. This may result in the disallowance of deductions or differences
in the timing of deductions and result in the payment of additional taxes, interest
or penalties that could materially affect NewAlliance’s performance.
Unpredictable catastrophic events could
have a material adverse effect on NewAlliance Bank.
The occurrence of catastrophic
events such as hurricanes, pandemic disease (including the H1N1 virus), windstorms,
floods, severe winter weather or other catastrophes could adversely affect NewAlliance’s business and, in turn, its financial condition or results of operations.
This may result in a significant number of employees that are unavailable to perform
critical operating functions at either their regular worksite or the disaster recovery
worksite. Unpredictable natural and other disasters could have an adverse effect
on the Company in that such events could materially disrupt its operations or the
ability or willingness of its customers to access the financial services offered
by NewAlliance Bank.
Unprecedented disruption and significantly
increased risk in the financial markets.
The banking industry experienced
unprecedented turmoil in 2008 as some of the world’s major financial institutions
collapsed, were seized or were forced into mergers as the credit markets tightened
and the economy headed into a recession and has eroded confidence in the world’s
financial system. In 2009, the banking industry stabilized somewhat but was still
operating in a recessionary economy as evidenced by the increase in the unemployment
rate and the increase in delinquencies and foreclosures across the country and the
failure of over 140 financial institutions by the FDIC in the past year. There can
be no assurance that NewAlliance Bank will not be impacted by the economic crisis
in a way we cannot currently predict or mitigate, but we will continue to attempt
to navigate this landscape for the long-term benefit of our shareholders.
21
Item 1B. Unresolved Staff Comments
None.
The Company conducts business from its executive offices at 195 Church Street, New Haven, Connecticut and its 75 banking offices located in Connecticut and 12 banking offices located in Massachusetts. Of the 87 banking offices, 30 are owned and 57 are leased. Lease expiration dates range from 3 months to 19 years with renewal options of 5 to 33 years.
The following table sets forth certain information with respect to our offices:
| Number of | ||||
| Location | Banking Offices |
|||
| Connecticut: | ||||
| New Haven County | 28 | |||
| Middlesex County | 6 | |||
| Hartford County | 16 | |||
| Tolland County | 12 | |||
| Windham County | 5 | |||
| Fairfield County | 8 | |||
Massachusetts: |
||||
| Worcester County | 1 | |||
| Hampden County | 11 | |||
| Total | 87 | |||
The total net book value of properties and equipment at December 31, 2009 was $57.1 million. For additional information regarding our premises and equipment and lease obligations, see Notes 7 and 15 of the Notes to Consolidated Financial Statements.
NewAlliance is not involved in any pending legal proceedings other than routine legal proceedings occurring in the ordinary course of business. NewAlliance believes that those routine proceedings involve, in the aggregate, amounts which are immaterial to the financial condition and results of operations of the Company.
Item 4. Submission of Matters to a Vote of Security Holders
None.
22
PART II
Item 5. Market for Registrant’s Common Equity, Related Stockholder Matters and Issuer Purchases of Equity Securities
Market Information
The Company’s common stock is traded on the New York Stock Exchange under the symbol “NAL”. The following table sets forth the high and low closing prices of our common
stock and the dividends declared per share of common stock for the periods indicated.
| Market Price | ||||||||||
| Dividends Declared | ||||||||||
| 2009 | High | Low | Per Share | |||||||
| First Quarter | $ | 13.06 | $ | 9.55 | $ | 0.070 | ||||
| Second Quarter | 13.70 | 11.50 | 0.070 | |||||||
| Third Quarter | 12.60 | 10.70 | 0.070 | |||||||
| Fourth Quarter | 12.45 | 10.68 | 0.070 | |||||||
| Market Price | ||||||||||
| Dividends Declared | ||||||||||
| 2008 | High | Low | Per Share | |||||||
| First Quarter | $ | 13.08 | $ | 10.34 | $ | 0.065 | ||||
| Second Quarter | 13.71 | 12.38 | 0.070 | |||||||
| Third Quarter | 16.00 | 11.66 | 0.070 | |||||||
| Fourth Quarter | 15.10 | 11.33 | 0.070 | |||||||
On February 24, 2010, the closing price for the Company’s common stock was $12.08.
Holders
As of January 31, 2010,
there were 105,971,903 shares of common stock outstanding, which were held by approximately
10,565 holders of record. The number of stockholders of record was determined by
American Stock Transfer and Trust Company. Such number of record holders does not
reflect the number of persons or entities holding stock in nominee name through
banks, brokerage firms, and other nominees.
Dividends
The Company began paying
quarterly dividends in 2004 on its common stock and currently intends to continue
to do so in the foreseeable future. The Company’s ability to pay dividends
depends on a number of factors, however, including the ability of the Bank to pay
dividends to the Company under federal laws and regulations, and as a result there
can be no assurance that dividends will continue to be paid in the future. See the
section captioned “Regulation and Supervision” in Item 1 of this report
for further information.
Securities Authorized for Issuance Under
Equity Compensation Plans
Information regarding equity-based compensation
awards outstanding and available for future grants as of December 31, 2009, segregated
between equity-based compensation plans approved by the stockholders and equity-based
compensation plans not approved by stockholders, is presented in the table below.
| Number of securities | ||||||||
| remaining available for | ||||||||
| future issuance under | ||||||||
| Number of securities to | Weighted-average | equity compensation | ||||||
| be issued upon exercise | exercise price of | plans (excluding | ||||||
| of outstanding options, | outstanding options, | securities reflected in | ||||||
| warrants and rights | warrants and rights | column (a)) | ||||||
| Plan category | (a) | (b) | (c) | |||||
| Equity compensation plans approved by security stockholders | 7,884,801 | $ | 14.30 | 4,778,280 | (1) | |||
| Equity compensation plans not approved by security stockholders | - | - | ||||||
| Total | 7,884,801 | $ | 14.30 | 4,778,280 | ||||
| (1) | This figure
includes 3,524,323 shares that may be issued pursuant to options presently authorized
but unissued, and 1,253,957 shares that may be issued as restricted stock, all in
accordance with the 2005 Long-Term Compensation Plan approved by the |
23
Company’s
stockholders in April 2005. In addition, in May 2009 performance shares were awarded
to executives and other key members of senior management. The target number of shares
awarded is 65,149. The actual number of shares earned may be more or less than 65,149
depending on the performance of NewAlliance stock total shareholder return against
a group of banks and thrifts as listed on the SNL Thrift Index. |
Recent Sales of Unregistered Securities;
Use of Proceeds From Registered Securities
None.
Purchases of Equity Securities by the
Issuer and Affiliated Purchasers
The following table sets forth information
about the Company’s stock repurchases for the three months ended December 31,
2009. Management may engage in future share repurchases as market conditions warrant.
| ISSUER PURCHASES OF EQUITY SECURITIES | ||||||||||
| Average Price | Maximum Number of | |||||||||
| Paid per Share | Total Number of Shares | Shares That May Yet Be | ||||||||
| Total Number of | (includes | Purchased as Part of Publicly | Purchased Under the Plans | |||||||
| Shares Purchased | commission) | Announced Plans or Programs | or Programs | |||||||
| Period | ||||||||||
| October 1 - 31, 2009 | 494,359 | $ | 10.89 | 494,359 | 2,392,913 | |||||
| November 1 - 30, 2009 | 89,100 | $ | 10.97 | 89,100 | 2,303,813 | |||||
| December 1-31, 2009 (1) | 4,854 | $ | 11.79 | - | 2,303,813 | |||||
| Total | 588,313 | $ | 10.91 | 583,459 | ||||||
On January 31, 2006, a second stock repurchase plan was announced and provides for the repurchase of up to 10.0 million shares of common stock of the Company. There is no set expiration date for this plan.
| (1) | Shares represent
common stock withheld by the Company to satisfy tax withholding requirements on
the vesting of shares under the Company’s benefit plans. |
24
Stock Performance Graph
The following graph compares the cumulative total return on NewAlliance Bancshares common stock over the last five fiscal years, as reported by the NYSE through December 31, 2009, with (i) the cumulative total return on the S&P 500 Index and (ii) the cumulative total return on the SNL Thrift Index for the period.
This graph assumes the investment of $100 on December 31, 2004 in our common stock, the S&P 500 Index and the SNL Thrift Index and assumes that dividends are reinvested.
COMPARISON
OF CUMULATIVE TOTAL RETURN
AMONG NEWALLIANCE BANCSHARES,
S&P 500 INDEX
AND SNL THRIFT INDEX
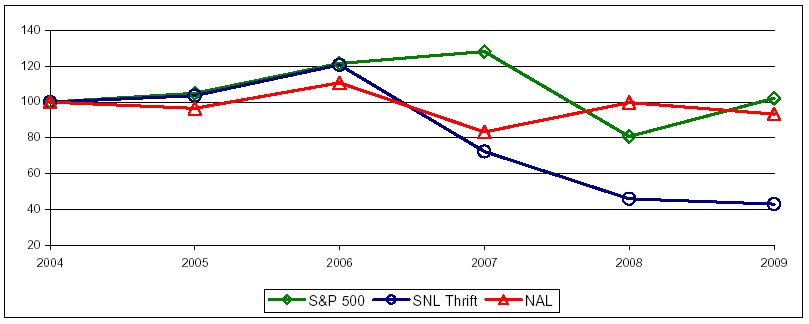
| Period Ending | ||||||||||||
| Total Return Indices | 12/31/04 | 12/31/05 | 12/31/06 | 12/31/07 | 12/31/08 | 12/31/09 | ||||||
| NewAlliance Bancshares, Inc. | 100.00 | 96.54 | 110.79 | 83.29 | 99.74 | 93.26 | ||||||
| S & P 500 | 100.00 | 104.91 | 121.48 | 128.16 | 80.74 | 102.11 | ||||||
| SNL Thrift | 100.00 | 103.53 | 120.68 | 72.40 | 46.07 | 42.97 | ||||||
| Source: SNL | ||||||||||||
25
Item 6. Selected Financial Data
The following tables contain certain information concerning the financial position and results of operations of the Company at the dates and for the periods indicated. This information should be read in conjunction with the Consolidated Financial Statements and related notes.
In July 2007 a restructuring of part of the available-for-sale securities portfolio was completed. A recognized loss in the amount of $28.3 million, or $18.4 million net of tax, was recorded to non-interest income as a result of this restructuring. Selected Financial Data includes the effect of this transaction at and for the year ended December 31, 2007.
| For the Year Ended December 31, | |||||||||||||||
| (In thousands, except per share data) | 2009 | 2008 | 2007 | 2006 | 2005 | ||||||||||
| Selected Operating Data | |||||||||||||||
| Interest and dividend income | $ | 371,799 | $ | 399,173 | $ | 403,280 | $ | 331,032 | $ | 276,570 | |||||
| Interest expense | 168,592 | 209,057 | 228,243 | 161,451 | 100,461 | ||||||||||
Net
interest income before provision for loan losses |
203,207 | 190,116 | 175,037 | 169,581 | 176,109 | ||||||||||
| Provision for loan losses | 18,000 | 13,400 | 4,900 | 500 | 400 | ||||||||||
Net
interest income after provision for loan losses |
185,207 | 176,716 | 170,137 | 169,081 | 175,709 | ||||||||||
| Non-interest income | 59,246 | 55,896 | 31,165 | 51,631 | 45,524 | ||||||||||
| Conversion and merger related charges | 84 | 185 | 2,523 | 3,389 | 2,156 | ||||||||||
| Other non-interest expense | 172,129 | 166,384 | 159,923 | 144,717 | 139,084 | ||||||||||
Income
before provision for income taxes |
72,240 | 66,043 | 38,856 | 72,606 | 79,993 | ||||||||||
| Income tax provision | 25,797 | 20,747 | 15,063 | 23,769 | 27,394 | ||||||||||
Net
income |
$ | 46,443 | $ | 45,296 | $ | 23,793 | $ | 48,837 | $ | 52,599 | |||||
| Basic and diluted earnings per share | $ | 0.47 | $ | 0.45 | $ | 0.23 | $ | 0.49 | $ | 0.50 | |||||
| Weighted-average shares outstanding | |||||||||||||||
Basic |
99,163 | 99,587 | 103,146 | 99,981 | 105,110 | ||||||||||
Diluted |
99,176 | 99,707 | 103,582 | 100,484 | 105,517 | ||||||||||
| Dividends per share | $ | 0.28 | $ | 0.275 | $ | 0.255 | $ | 0.235 | $ | 0.21 | |||||
| At December 31, | |||||||||||||||
| (In thousands) | 2009 | 2008 | 2007 | 2006 | 2005 | ||||||||||
| Selected Financial Data | |||||||||||||||
| Total assets | $ | 8,434,313 | $ | 8,299,518 | $ | 8,210,984 | $ | 7,247,696 | $ | 6,561,402 | |||||
| Loans (1) | 4,762,045 | 4,962,785 | 4,727,969 | 3,822,876 | 3,276,706 | ||||||||||
| Allowance for loan losses | 52,463 | 49,911 | 43,813 | 37,408 | 35,552 | ||||||||||
| Short-term investments | 50,000 | 55,000 | 51,962 | 28,077 | 46,497 | ||||||||||
| Investment securities | 2,568,621 | 2,238,344 | 2,377,733 | 2,386,985 | 2,388,789 | ||||||||||
| Goodwill | 527,167 | 527,167 | 531,191 | 454,258 | 425,001 | ||||||||||
| Identifiable intangible assets | 35,359 | 43,860 | 53,316 | 49,403 | 52,016 | ||||||||||
| Deposits | 5,024,220 | 4,447,830 | 4,373,665 | 3,900,667 | 3,798,112 | ||||||||||
| Borrowings | 1,889,928 | 2,376,496 | 2,355,504 | 1,903,864 | 1,380,755 | ||||||||||
| Stockholders’ equity | 1,434,953 | 1,381,216 | 1,407,107 | 1,362,305 | 1,310,868 | ||||||||||
| Nonperforming loans (2) | 50,507 | 38,331 | 16,386 | 12,468 | 7,391 | ||||||||||
| Nonperforming assets (3) | 54,212 | 40,354 | 17,283 | 12,468 | 7,391 | ||||||||||
26
| For the Year Ended December 31, | |||||||||||
| 2009 | 2008 | 2007 | 2006 | 2005 | |||||||
| Selected Operating Ratios and Other Data | |||||||||||
| Performance Ratios (4) | |||||||||||
Average
yield on interest-earning assets |
4.90 | % | 5.48 | % | 5.71 | % | 5.31 | % | 4.79 | % | |
Average
rate paid on interest-bearing liabilities |
2.61 | 3.35 | 3.80 | 3.16 | 2.20 | ||||||
Interest
rate spread (5) (7) |
2.29 | 2.13 | 1.91 | 2.15 | 2.59 | ||||||
Net
interest margin (6) (7) |
2.68 | 2.61 | 2.48 | 2.72 | 3.05 | ||||||
Ratio
of interest-bearing assets to interest-bearing liabilities |
117.42 | 116.57 | 117.63 | 121.99 | 126.65 | ||||||
Ratio of net interest income after provision for loan losses to non-interest expense |
107.55 | 106.09 | 104.73 | 114.16 | 124.40 | ||||||
Non-interest
expense as a percent of average assets |
2.03 | 2.03 | 2.04 | 2.12 | 2.18 | ||||||
Return
on average assets |
0.55 | 0.55 | 0.30 | 0.70 | 0.81 | ||||||
Return
on average equity |
3.30 | 3.22 | 1.69 | 3.65 | 3.76 | ||||||
Ratio
of average equity to average assets |
16.58 | 17.14 | 17.63 | 19.13 | 21.57 | ||||||
Dividend
payout ratio |
59.57 | 61.11 | 110.87 | 47.96 | 42.00 | ||||||
| Non-GAAP Ratios (8) | |||||||||||
Efficiency
ratio (9) |
66.58 | 67.93 | 69.95 | 67.39 | 63.56 | ||||||
Tangible
common equity ratio (10) |
11.08 | 10.48 | 10.79 | 12..73 | 13.70 | ||||||
| Regulatory Capital Ratios | |||||||||||
Leverage
capital ratio |
11.05 | 11.05 | 10.92 | 13.20 | 14.31 | ||||||
Tier
1 capital to risk-weighted assets |
19.92 | 18.71 | 18.60 | 22.71 | 24.99 | ||||||
Total
risk-based capital ratio |
21.11 | 19.80 | 19.58 | 23.67 | 26.02 | ||||||
| Asset Quality Ratios | |||||||||||
Nonperforming
loans as a percent of total loans (1) (2) |
1.06 | 0.77 | 0.35 | 0.33 | 0.23 | ||||||
Nonperforming
assets as a percent of total assets (3) |
0.64 | 0.49 | 0.21 | 0.17 | 0.11 | ||||||
Allowance
for loan losses as a percent of total loans |
1.10 | 1.01 | 0.93 | 0.98 | 1.08 | ||||||
Allowance
for loan losses as a percent of non-performing loans |
103.87 | 130.21 | 267.38 | 300.03 | 481.02 | ||||||
Net
loan charge-offs as a percent of average loans |
0.32 | 0.15 | 0.05 | 0.02 | 0.03 | ||||||
| (1) | Loans are stated at their principal amounts outstanding, net of deferred loan fees and costs and net unamortized premium on acquired loans. | |
| (2) | Nonperforming loans include all loans 90 days or more past due, restructured loans due to a weakening in the financial condition of the borrower and other loans which have been identified by the Company as presenting uncertainty with respect to the collectability of principal or interest. All of the Company’s nonperforming loans do not accrue interest. | |
| (3) | Nonperforming assets consist of nonperforming loans and other real estate owned. | |
| (4) | Performance ratios are based on average daily balances during the periods indicated and are annualized where appropriate. Regulatory Capital Ratios and Asset Quality Ratios are end-of-period ratios. | |
| (5) | Interest rate spread represents the difference between the weighted average yield on average interest-bearing assets and the weighted average cost of average interest-bearing liabilities. | |
| (6) | Net interest margin represents net interest income as a percentage of average interest-earning assets. | |
| (7) | No tax equivalent adjustments were made due to the fact that ratio would not be materially different. | |
| (8) | In light of diversity in presentation among financial institutions, the methodologies for determining the non-GAAP financial measures listed may vary significantly. | |
| (9) | The efficiency ratio represents the ratio of non-interest expenses, net of OREO expenses, to the sum of net interest income before provision for loan losses and non-interest income, excluding security and limited partnership gains or losses. The efficiency ratio is not a financial measurement required by accounting principles generally accepted in the United States of America. However, the efficiency ratio is used by management in its assessment of financial performance specifically as it relates to non-interest expense control and also believes such information is useful to investors in evaluating company performance. | |
| (10) | The tangible common equity ratio excludes goodwill and identifiable intangible assets. The ratio is not a financial measurement required by accounting principles generally accepted in the United States of America. However, management believes such information is useful to anlayze the relative strength of New Alliance’s captial position and is useful to investors in evaluating Company performance due to the importance that analysts placed on this ratio since the introduction of TARP. |
27
Item 7. Management’s Discussion and Analysis of Financial Condition and Results of Operations
Overview
The following
Management’s Discussion and Analysis of Financial Condition and Results of
Operations (“MD&A”) is intended to help the reader understand NewAlliance
Bancshares, Inc., our operations and our present business environment. We believe
transparency and clarity are the primary goals of successful financial reporting.
We remain committed to increasing the transparency of our financial reporting, providing
our stockholders with informative financial disclosures and presenting an accurate
view of our financial disclosures and presenting an accurate view of our financial
position and operating results.
In accordance with Section 404 of the Sarbanes-Oxley
Act of 2002, our management, including our Chief Executive Officer and Chief Financial
Officer, conducted an evaluation of our internal control over financial reporting
and concluded that such control was effective as of December 31, 2009. Management’s report on the effectiveness of our internal control over financial reporting
is included in Item 8, Financial Statements and Supplementary Data, of this report.
MD&A is provided as a supplement to—and should be read in conjunction with—our Consolidated Financial Statements and the accompanying notes thereto contained in Item 8, Financial Statements and Supplementary Data, of this report. This overview summarizes the MD&A, which includes the following sections:
| • | Our Business — a general description of our business, our objectives and the challenges and risks of our business. |
| • | Critical Accounting Estimates — a discussion of accounting estimates that require critical judgments and estimates. |
| • | Recent Accounting Estimates — a discussion of recently adopted accounting pronouncements or changes. |
| • | Operation Results — an analysis of our Company’s consolidated results of operations for the three years presented in our Consolidated Financial Statements. |
| • | Financial Condition, Liquidity and Capital Resources — an overview of financial condition, contractual obligations and liquidity and capital resources. |
Our Business
General
By assets, NewAlliance is the third largest banking institution headquartered in Connecticut and the fourth largest based in New England with consolidated assets of $8.43 billion and stockholders’ equity of $1.43 billion at December 31, 2009. Its business philosophy is to operate as a community bank with local decision-making authority. NewAlliance delivers financial services to individuals, families and businesses throughout Connecticut and Western Massachusetts. NewAlliance Bank provides commercial banking, retail banking, consumer financing, trust and investment services through 87 banking offices, 104 ATMs and its internet website (www.newalliancebank.com). NewAlliance common stock is traded on the New York Stock Exchange under the symbol “NAL”.
NewAlliance has a relentless commitment to improve the financial well-being of the people and businesses in the markets we serve, and to invest in the communities where they reside and work. We accomplish this by operating a community banking business model with a commitment to be a leader in our markets by seeking to continually deliver superior value to our customers, shareholders, employees and communities.
The Company’s results of operations depend primarily on net interest income, which is the difference between the income earned on its loan and securities portfolios and its cost of funds, consisting of the interest paid on deposits and borrowings. Results of operations are also affected by the Company’s provision for loan losses, income and expenses pertaining to other real estate owned, gains and losses from sales of loans and securities and non-interest income and expenses. Non-interest income primarily consists of fee income from depositors and wealth management services and increases in cash surrender value of bank owned life insurance (“BOLI”). Non-interest expenses consist principally of compensation and employee benefits, occupancy, data processing, amortization of acquisition related intangible assets, marketing, professional services, FDIC insurance assessments and other operating expenses.
28
Results of operations are also significantly
affected by general economic and competitive conditions and changes in interest
rates as well as government policies and actions of regulatory authorities. Future
changes in applicable laws, regulations or government policies may materially affect
the Company.
Our Objectives
NewAlliance seeks to continually deliver superior value to its customers, stockholders, employees and communities through achievement of its core operating objectives which are to:
| • | Grow and retain primary households to increase core deposit relationships with a focus on checking and savings accounts; |
| • | Build high quality, profitable loan portfolios using organic, purchase and acquisition strategies; |
| • | Build and diversify revenue steams through development of banking-related fee income and growth in wealth management services; |
| • | Grow through a disciplined acquisition strategy, de-novo branching and new business lines; |
| • | Maintain expense discipline and improve operating efficiencies; |
| • | Invest in technology to enhance superior customer service and products; and |
| • | Maintain a rigorous risk identification and management process. |
Significant factors management reviews to
evaluate achievement of the Company’s operating objectives and its operating
results and financial condition include, but are not limited to: net income and
earnings per share, performance of acquisitions and integration activities, return
on equity and assets, net interest margin, non-interest income, operating expenses
related to total assets and efficiency ratio, asset quality, loan and deposit growth,
capital management, liquidity and interest rate sensitivity levels, customer service
standards, market share and peer comparisons.
Challenges and Risks
As we look forward, management has identified
certain challenges and risks that are most relevant and likely to have a near term
impact on performance. Of these, five key challenges and risks are described below:
Net interest margin. The growth of the net interest margin is vital to our
continued success and enhanced profitability. For the year ended December 31, 2009,
our net interest margin increased seven basis points to 2.68%, by (a) significantly
reducing our deposit costs, particularly on higher cost time deposits, while growing
core deposits; (b) reducing our wholesale funding costs and (c) growth in our investment
portfolio compensating for the decline in income due to a lower yield. These positive
factors more than offset decreases in interest income on loans with interest rates
based on the prime rate and other indices. For the three months ended December
31, 2009, the net interest margin increased to 2.82% and was the fifth consecutive
quarterly increase in the margin. We expect to further increase the net interest
margin by continuing to focus on sensible deposit pricing and the generation of
organic loans, including expanding the number of commercial lending business lines
we offer. The risk associated with decreasing deposit costs is a potential outflow
of deposits to competitors as customers search for higher rates. However, we believe
that further strengthening our brand, focusing on providing quality products and
services that customers want and building on the momentum and deposit growth experienced
in 2009, will help mitigate this risk. Another aspect of the net interest margin
is the yield earned on the loan portfolio. Although interest rates remained at
historical lows in 2009, this was offset by record mortgage originations of $1.04
billion in residential mortgage loans and improved pricing. Additionally, the dislocations
in the credit markets are still present and therefore, we believe that there are
continued pricing opportunities in our lending area. We are well positioned to
maximize these opportunities because of our liquidity position and our ability to
retain loans on our balance sheet. Although the Federal Reserve has stated that
interest rates are expected to remain at very low levels for an extended period,
there is a belief that rates will need to be increased in the second half of
2010 to counterbalance the large amount of economic stimulus in the economy if the
Federal Reserve is to achieve its dual objective of price stability and long-term
growth. If interest rates do increase, the Company’s asset sensitive position
is expected to have a positive impact on our net interest margin in a rising interest
rate environment. See the discussion on the management of market and interest rate
risk under Item 7A, Quantitative and Qualitative Disclosures About Market Risk on
page 62 for further information.
29
Maintaining credit quality and rigorous risk management. The national economy experienced improvement through 2009 and home prices and home sales appear to have bottomed while high unemployment, delinquencies and foreclosures are still top concerns. During this turbulent time, NewAlliance continued to maintain its strong credit quality as delinquencies, nonperforming loans and charge-off’s all outperform the average of our peer group. Our ratios of nonperforming loans to total loans was 1.06%, total delinquencies to total loans was 1.54% and our allowance for loan losses to total loans was 1.10% at December 31, 2009. Net loan charge-offs increased to $15.4 million for the year ended December 31, 2009, an increase from $7.3 million for the year ended December 31, 2008. Net charge-offs in the fourth quarter of 2009, however, decreased by almost 50.0% from the third quarter 2009. We are not immune to the trends in loan delinquencies and provisions that permeate the industry, the effects of which will continue to be felt throughout 2010 as home sales are expected to remain somewhat stagnant and delinquencies and foreclosures rise throughout the country. However, we expect to be able to continue to maintain strong asset quality relative to industry levels as we have not experienced the severity of problems associated with the housing crisis nationally. In continuing to exercise rigorous risk management and prudent credit practices, we will also further enhance credit processes.
Deploying capital. We ended 2009 with Tier 1 leverage capital at 11.05%, which is substantially above our peer group average, has remained strong throughout the economic crisis and was achieved without Federal assistance as we are not a TARP recipient. We continuously search for the best use for our capital to enhance shareholder value. The Company has completed six acquisitions since 2004, the most recent being in the first quarter of 2007. While the volatility over the past 24 months has not been conducive to widespread acquisition activity, we believe that there are opportunities in the current environment on which we may be able to capitalize as a result of our flexibility and capital strength. Key tactics include de-novo branching, acquiring banks that provide earnings accretion, including FDIC assisted acquisitions of troubled banks and seizing opportunities to purchase regional bank branch divestitures. Additionally, investments in new business lines, technology and process improvements are also part of our capital deployment strategy.
Competition in the marketplace. NewAlliance faces competition within the financial services industry from some well established companies and many local players. We expect deposit competition to remain vigorous and face additional pressure as equity markets start to rebound. Additionally, we remain poised to take advantage of the current market conditions as we have sufficient liquidity and the ability to retain originated loans on our balance sheet. Moreover, consumers view “big banks” with skepticism and their willingness to switch is now at an historic high. Therefore, we must continue to expand our product offerings, improve operating efficiencies and develop and maintain our brand to increase market share to benefit from these opportunities.
New regulation. The banking industry continued to be impacted by regulatory changes during 2009 including several regulations that have been adopted and others that are pending. These regulatory changes encapsulate both short-term resolutions and to ensure long-term stability in the financial markets, including The Wall Street Reform and Consumer Protection Act of 2009, Real Estate Settlement Procedures Act (“RESPA”), Secure and Fair Enforcement Act (“SAFE Act”), overdraft legislation, compensation disclosures, prepayment of FDIC deposit assessments and potential consolidation of regulatory agencies. Although the full effect of these new regulations is not yet known, they are expected to have both financial and compliance repercussions. As we have seen in the past two years, there have been unintended consequences from the measures taken by the Government in an effort to stabilize the economy. In complying with new regulations, there can be no assurance that NewAlliance Bank will not be impacted in a way we cannot currently predict or mitigate, but we will continue to attempt to navigate this landscape for the long-term benefit of our shareholders.
All five of these challenges and risks—net interest margin, maintaining credit quality and rigorous risk management, deploying capital, competition and new regulation—have the potential to have a material adverse effect on NewAlliance; however, we believe NewAlliance is well positioned to appropriately address these challenges and risks.
See also Item 1A, Risk Factors in Part I of this report for additional information about risks and uncertainties facing NewAlliance.
Critical Accounting Estimates
Our Consolidated Financial Statements are prepared in accordance with GAAP. In connection
with the preparation of our financial statements, we are required to make assumptions
and estimates about future events, and apply judgments that affect the reported
amounts of assets, liabilities, revenue, expenses and the related disclosures. We
base our assumptions, estimates and judgments on historical experience, current
trends and other factors that management believes to be relevant at the time our
Consolidated Financial Statements are prepared. On a regular basis, management reviews
the accounting policies, assumptions, estimates and judgments to ensure that our
financial statements are presented fairly and in accordance with GAAP. However,
because future events and their effects cannot be determined with certainty, actual
results could differ from our assumptions and estimates, and such differences could
be material.
30
Our significant accounting policies are discussed in Note 1, of the Notes to Consolidated Financial Statements, included in Item 8, Financial Statements and Supplementary Data, of this report. Management believes that the following accounting estimates are the most critical to aid in fully understanding and evaluating our reported financial results, and they require management’s most difficult, subjective or complex judgments, resulting from the need to make estimates about the effect of matters that are inherently uncertain. Management has reviewed these critical accounting estimates and related disclosures with the Audit Committee of our Board.
Other-Than-Temporary Impairment of Investments
| Critical Estimates |
Judgment and Uncertainties |
Effect if Actual Results Differ from Assumptions |
||||
Our investment securities portfolio is comprised of available-for-sale and held-to-maturity investments. The available-for-sale portfolio is carried at estimated fair value, with any unrealized gains or losses, net of taxes, reported as accumulated other comprehensive income or loss in stockholders’ equity. The held-to-maturity portfolio is carried at amortized cost. Management determines the classification of a security at the time of its purchase. We conduct a periodic review of our investment securities portfolio to determine if the value of any security has declined below its cost or amortized cost, and whether such decline is other-than-temporary. If such decline is deemed other-than-temporary for debt securities, the security is written down to a new cost basis and the amount of impairment related to the credit loss component would be reported within non-interest income in the consolidated statement of income while the remaining amount would be recognized in other comprehensive income. For equity securities, the entire other-than-temporary would be considered credit related and would be recorded in earnings. During 2009, we recorded other-than-temporary credit impairment charges on two securities which totaled $1.4 million. At December 31, 2009, we have net unrealized gains on our available-for-sale portfolio of $45.8 million comprised of gains in the amount of $70.7 million and losses of $24.9 million. In the held-to-maturity portfolio, we have net unrealized gains of $11.6 million comprised of $11.6 million in gains and $38,000 in losses. For further discussion on other-than-temporary impairment of investments, see the “Investment Securities” section on page 46 of Item 7, Management’s Discussion and Analysis of Financial Condition and Results of Operations as well as Note 5 of the Notes to Consolidated Financial Statements. |
Significant judgment is involved in determining when a decline in fair value is other-than-temporary. The factors considered by management include, but are not limited to: |
Adverse changes in management’s assessment of the factors used to determine that a security was not other-than-temporarily impaired could lead to additional impairment charges. Conditions affecting a security that we determined to be temporary could become other than temporary and warrant an impairment charge. Additionally, a security that had no apparent risk could be affected by a sudden or acute market condition and necessitate an impairment charge. The Company has seven securities that are currently valued at 30.0% or more below book value that are not considered other than temporarily impaired. At December 31, 2009, these securities have a fair value of $16.3 million compared to a book value of $27.0 million. |
||||
| • | Percentage
and length of time by which an issue is below book value; |
|||||
| • | Financial
condition and near-term prospects of the issuer including their ability to meet
contractual obligations in a timely manner; |
|||||
| • | Ratings
of the security; |
|||||
| • | Whether
the decline in fair value appears to be issuer specific or, alternatively, a reflection
of general market or industry conditions; |
|||||
| • | Whether
the decline is due to interest rates and spreads or credit risk; |
|||||
| • | The value
of underlying collateral; and |
|||||
| • | Our intent
and ability to retain the investment for a period of time sufficient to allow for
the anticipated recovery in market value or more likely than not will be required
to sell a debt security before its anticipated recovery which may be until maturity. |
|||||
31
Goodwill and Identifiable Intangible Assets
| Critical Estimates |
Judgment and Uncertainties |
Effect if Actual Results Differ from Assumptions |
||||
|
|
|
||||
| • | A significant adverse change in legal factors or business climate, |
|||||
| • | An adverse action or assessment by a regulator, |
|||||
| • | Unanticipated competition, |
|||||
| • | A loss of key personnel, | |||||
| • | Impairment of other assets or the establishment of valuation allowances on deferred tax assets, |
|||||
| • | Cash flow or operating losses at the reporting unit level, |
|||||
| • | Negative current events or long-term outlooks for specific industries, |
|||||
| • | Not meeting analyst expectations or internal forecasts in consecutive periods or downward adjustments to further forecasts, |
|||||
| • | Planned or announced layoffs or asset dispositions, |
|||||
| • | Market capitalization of the Company below its book value. |
|||||
Upon consideration of the guidance on goodwill impairment and the Company’s financial position, the Company concluded that the fact that its market capitalization was below its book value at September 30, 2009 was outweighed by the lack of other triggering events and no other events or circumstances occurred that would trigger the requirement to perform an interim test for goodwill impairment. |
||||||
32
Allowance for Loan Losses
| Critical Estimates |
Judgment and Uncertainties |
Effect if Actual Results Differ from Assumptions |
||||
|
|
|
||||
33
Income Taxes
Deferred Tax Assets and Liabilities
| Critical Estimates |
Judgment and Uncertainties |
Effect if Actual Results Differ from Assumptions |
||||
|
|
|
||||
Tax Contingencies
| Critical Estimates |
Judgment and Uncertainties |
Effect if Actual Results Differ from Assumptions |
||||
|
|
|
||||
34
Pension and Other Post Retirement Benefits
| Critical Estimates |
Judgment and Uncertainties |
Effect if Actual Results Differ from Assumptions |
||||
|
|
|
||||
35
Recent Accounting Changes
We have adopted the following new accounting
pronouncements and authoritative guidance during 2009. Except as indicated, the
adoption of the following pronouncements did not have a material impact on the Company’s consolidated financial statements.
In June 2009, the Financial Accounting
Standards Board (“FASB”) issued Statement of Financial Accounting Standards
(“SFAS”) No. 168, “The FASB Accounting Standards CodificationTM
and the Hierarchy of Generally Accepted Accounting Principles –
a replacement of FASB Statement No. 162” (“SFAS No. 168”).
The objective of SFAS No. 168 is to replace SFAS No. 162,“The Hierarchy
of Generally Accepted Accounting Principles” and to establish the FASB
Accounting Standards CodificationTM (“Codification” or “FASB
ASC”) as the source of authoritative accounting principles recognized by the
FASB to be applied by nongovernmental entities in the preparation of financial
statements in conformity with U.S. generally accepted accounting principles
(“GAAP”). The Codification supersedes all previous level (a) through (d)
GAAP, aside from non-codified FASB statements and guidance issued by the SSEC.
The Codification did not change GAAP, but rather reorganized it into approximately
90 accounting topics within a consistent structure to simplify user access. Contents
in each of these accounting topics are further organized by subtopic, section
and paragraph. Changes to the Codification are in the form of Accounting Standards
Updates issued by the FASB. An Accounting Standards Update is not authoritative;
rather, it is a document that communicates the specific amendments that change
the Codification and provides background information about the guidance, including
the basis for conclusions on changes made to the Codification. The adoption of
SFAS No. 168 and the Codification did not have a material impact on the Company’s consolidated financial statements but changed the referencing system for
accounting standards from the legacy GAAP citations to codification topic numbers.
In June 2009, the FASB issued FASB Accounting Standards Update (“ASU”)
No. 2009-01, Topic 105, Generally Accepted Accounting Principles. This
ASU amends the Codification for the issuance of SFAS No. 168 in its entirety, including
the accounting standards update instructions contained in Appendix B of the statement.
SFAS No. 168 is summarized above.
The following pronouncements provide citations
to the applicable Codification, as appropriate.
FASB ASC 820-10, Effective
date of Fair Value Measurements and Disclosures. This guidance requires disclosure
of nonfinancial assets and liabilities in accordance with FASB ASC 820, Fair
Value Measurements and Disclosures.
FASB ASC 815-10, Disclosures about Derivative
Instruments and Hedging Activities. This guidance changes the disclosure
requirements regarding derivative instruments and hedging activities in accordance
with FASB ASC 815-10-65.
FASB ASC 350-30, Determination of the Useful Life
of Intangible Assets. This guidance amends the factors that should be considered
in developing renewal or extension assumptions used to determine the useful life
of a recognized intangible asset under FASB ASC 350, Intangibles – Goodwill
and Other.
FASB ASC 805, Business Combinations. This guidance became effective
on January 1, 2009 and applies prospectively to any future business combinations.
It is expected to have a significant effect on the Company’s consolidated financial
statements, when a business combination occurs.
FASB ASC 820-10, Determining
Fair Value When the Volume and Level of Activity for the Asset or Liability Have
Significantly Decreased and Identifying Transactions That Are Not Orderly. This guidance provides additional clarification for estimating fair value when
the volume and level of activity for the asset or liability have significantly decreased
and also includes guidance on identifying circumstances that indicate a transaction
is not orderly for fair value measurements.
FASB ASC 320-10, Recognition and
Presentation of Other-Than-Temporary Impairments. This guidance makes the accounting
for other-than-temporary impairments more operational and improves the presentation
of other-than-temporary impairments in the financial statements. The adoption
of this pronouncement resulted in a $1.0 million, net of tax, cumulative effect
adjustment increasing retained earnings and decreasing accumulated other comprehensive
income.
FASB ASC 825-10, Interim Disclosures about Fair Value of Financial
Instruments. This guidance requires disclosures about the fair value of financial
instruments not measured on the balance sheet at fair value in interim financial
statements as well as in annual financial statements.
FASB ASC 855-10,
Subsequent Events. This guidance establishes general standards of accounting
for and the disclosure of events that occur after the balance sheet date but
before the financial statements are issued or are available to be issued. For further
information, see Note 1 in Notes to Consolidated Financial Statements.
36
FASB ASC 715-20, Postretirement Benefit Plan Assets. This guidance provides for additional disclosures about plan assets of a defined benefit pension or other postretirement plan. Pursuant to the guidance, the added disclosures include: (1) how investment allocation decisions are made by management, (2) major categories of plan assets, and (3) significant concentrations of risk. Additionally, this requires an employer to disclose information about the valuation of plan assets similar to that required under FASB ASC 820, Fair Value Measurements and Disclosures. For further information, see Note 12 in Notes to Consolidated Financial Statements.
Operating Results
Table 1:
Summary Income Statements
| Year Ended December 31, | Change | ||||||||||||||||||||||
| 2009/2008 | 2008/2007 | ||||||||||||||||||||||
| (Dollars in thousands, except per share data) | 2009 | 2008 | 2007 | Amount | Percent | Amount | Percent | ||||||||||||||||
| Net interest income | $ | 203,207 | $ | 190,116 | $ | 175,037 | $ | 13,091 | 7 | % | $ | 15,079 | 9 | % | |||||||||
| Provision for loan losses | 18,000 | 13,400 | 4,900 | 4,600 | 34 | 8,500 | 173 | ||||||||||||||||
| Non-interest income | 59,246 | 55,896 | 31,165 | 3,350 | 6 | 24,731 | 79 | ||||||||||||||||
| Operating expenses | 172,129 | 166,384 | 159,923 | 5,745 | 3 | 6,461 | 4 | ||||||||||||||||
| Merger related charges | 84 | 185 | 2,523 | (101 | ) | (55 | ) | (2,338 | ) | (93 | ) | ||||||||||||
| Income before income taxes | 72,240 | 66,043 | 38,856 | 6,197 | 9 | 27,187 | 70 | ||||||||||||||||
| Income tax expense | 25,797 | 20,747 | 15,063 | 5,050 | 24 | 5,684 | 38 | ||||||||||||||||
| Net income | $ | 46,443 | $ | 45,296 | $ | 23,793 | $ | 1,147 | 3 | % | $ | 21,503 | 90 | % | |||||||||
| Basic and diluted earnings per share | $ | 0.47 | $ | 0.45 | $ | 0.23 | |||||||||||||||||
Earnings Summary
Comparison of 2009 and 2008
The year 2009 was one of continued
stress on the banking system, where raising capital and controlling credit costs
were top priorities for the industry. Assisted by numerous Government programs,
the longest and deepest economic downturn since the 1930’s appears to have
abated. However, continued credit market tightness, damage to household balance
sheets and lack of job security are tempering the economic recovery. NewAlliance
leveraged its position of financial and credit strength and proceeded aggressively
to take deposit market share, build revenue momentum and take advantage of disruption
in the marketplace.
As shown in Table 1, earnings per share for the year ended
December 31, 2009 increased $0.02 over the same period in 2008 primarily due
to a substantial reduction in our cost of funds while gaining deposit market share,
predominantly core deposits, gains on sales of mortgage-backed securities and
residential mortgages. These were the main drivers behind the increases in net interest
income before provision and non-interest income of $13.1 million and $3.4 million,
respectively. Additionally, these increases more than offset the $4.6 million
increase in the provision for loan losses due to the economic environment and loan
net charge-offs, the increase in operating expenses of $5.7 million, largely
due to the FDIC special assessment of $3.9 million and a $5.1 million increase
in income tax expense due to higher net income along with an increase in the effective
tax rate.
Comparison of 2008 and 2007
In a year that had unprecedented
turmoil in the economy and financial markets, NewAlliance improved the core performance
of the Company, was able to mitigate the steep declines in market interest rates
with new growth and avoided vast losses in its loan and investment securities
portfolios due to historically sound credit practices.
As shown in Table 1, net
income was $45.3 million for the year ended December 31, 2008, an increase of $21.5
million from the year ended December 31, 2007. The largest single component for
this year over year increase resulted from the securities restructuring in 2007
for which a net loss of $28.3 million ($18.4 million, net of tax) was recorded.
During the year ended December 31, 2007, NewAlliance sold approximately $759.0 million
of available-for-sale securities and realized net losses totaling $28.3 million.
The sale was undertaken to reduce the Company’s exposure to fixed rate assets
as well as to increase the yield on the portfolio, thereby providing a prospective
improvement in the net interest margin. NewAlliance replaced substantially all
of the assets sold with higher yielding agency hybrid adjustable rate mortgage-backed
securities.
Excluding the restructuring charge, net income increased $3.1 million
from the prior year period. The primary driver of this year-over-year increase
was the increase in net interest income of $15.1 million largely due to the reduction
of deposit costs and organic growth in the loan portfolio, partially offset by
declines in average loan yields and increased borrowings.
37
Mostly offsetting the increase in net interest
income was an increase in the provision for loan losses of $8.5 million due to the
increase in nonperforming loans and to reflect the rising risk inherent in the
loan portfolio owing to the current economic environment, an increase in operating
interest expenses of $6.5 million largely due to higher salaries and employee benefits
expense including payment of an executive severance and higher bonus accruals
as well as increased outside services expense for consulting. Income tax expense
also increased, primarily attributable to higher pre-tax income.
Average Balances, Interest and Average Yields/Cost
Table 2
below sets forth certain information concerning average interest-earning assets
and interest-bearing liabilities and their associated yields or rates for the
periods indicated. The average yields and costs are derived by dividing income or
expenses by the average balances of interest-earning assets or interest-bearing
liabilities, respectively, for the periods shown and reflect annualized yields
and costs. Average balances are computed using daily balances. Yields and amounts
earned include loan fees and fair value adjustments related to acquired loans.
Loans held for sale and nonaccrual loans have been included in interest-earning
assets for purposes of these computations. Interest on nonaccrual loans has been
included only to the extent reflected in the Consolidated Statements of Income.
Unrealized gain or losses on available-for-sale investment securities are excluded
from average yield calculations.
Table 2: Average Balance Sheets for the
Years Ended December 31, 2009, 2008 and 2007
| Twelve Months Ended December 31, | ||||||||||||||||||||||||||
| 2009 | 2008 | 2007 | ||||||||||||||||||||||||
| Average | Average | Average | ||||||||||||||||||||||||
| Average | Yield/ | Average | Yield/ | Average | Yield/ | |||||||||||||||||||||
| (Dollars in thousands) | Balance | Interest | Rate | Balance | Interest | Rate | Balance | Interest | Rate | |||||||||||||||||
| Interest-earning assets | ||||||||||||||||||||||||||
Loans |
||||||||||||||||||||||||||
Residential real estate |
$ | 2,497,784 | $ | 131,119 | 5.25 | % | $ | 2,503,135 | $ | 138,005 | 5.51 | % | $ | 2,303,785 | $ | 127,794 | 5.55 | % | ||||||||
Commercial real estate |
1,216,121 | 70,735 | 5.82 | 1,203,399 | 74,159 | 6.16 | 1,138,661 | 74,963 | 6.58 | |||||||||||||||||
Commercial business |
436,674 | 22,019 | 5.04 | 460,679 | 27,819 | 6.04 | 462,962 | 33,964 | 7.34 | |||||||||||||||||
Consumer |
736,764 | 34,207 | 4.64 | 710,132 | 38,984 | 5.49 | 665,433 | 43,802 | 6.58 | |||||||||||||||||
Total loans |
4,887,343 | 258,080 | 5.28 | 4,877,345 | 278,967 | 5.72 | 4,570,841 | 280,523 | 6.14 | |||||||||||||||||
Fed funds sold and other short-term investments |
92,253 | 387 | 0.42 | 46,211 | 1,209 | 2.62 | 59,340 | 3,172 | 5.35 | |||||||||||||||||
Federal Home Loan Bank of Boston stock |
120,821 | - | - | 118,985 | 4,526 | 3.80 | 105,838 | 6,777 | 6.40 | |||||||||||||||||
Securities |
2,493,186 | 113,332 | 4.55 | 2,238,586 | 114,471 | 5.11 | 2,321,527 | 112,808 | 4.86 | |||||||||||||||||
Total securities, short-term investments and Federal Home Loan Bank stock |
2,706,260 | 113,719 | 4.20 | 2,403,782 | 120,206 | 5.00 | 2,486,705 | 122,757 | 4.94 | |||||||||||||||||
Total interest-earning assets |
7,593,603 | $ | 371,799 | 4.90 | % | 7,281,127 | $ | 399,173 | 5.48 | % | 7,057,546 | $ | 403,280 | 5.71 | % | |||||||||||
Non-interest earning assets |
894,857 | 929,355 | 909,901 | |||||||||||||||||||||||
Total assets |
$ | 8,488,460 | $ | 8,210,482 | $ | 7,967,447 | ||||||||||||||||||||
| Interest-bearing liabilities | ||||||||||||||||||||||||||
Deposits |
||||||||||||||||||||||||||
Money Markets |
$ | 579,806 | $ | 9,170 | 1.58 | % | $ | 420,972 | $ | 9,315 | 2.21 | % | $ | 503,071 | $ | 16,979 | 3.38 | % | ||||||||
NOW |
363,621 | 1,069 | 0.29 | 368,277 | 1,368 | 0.37 | 407,835 | 4,466 | 1.10 | |||||||||||||||||
Savings |
1,756,246 | 23,881 | 1.36 | 1,257,542 | 29,047 | 2.31 | 893,562 | 17,545 | 1.96 | |||||||||||||||||
Certificates |
1,591,055 | 46,561 | 2.93 | 1,792,948 | 64,942 | 3.62 | 2,057,327 | 91,943 | 4.47 | |||||||||||||||||
Total interest-bearing deposits |
4,290,728 | 80,681 | 1.88 | 3,839,739 | 104,672 | 2.73 | 3,861,795 | 130,933 | 3.39 | |||||||||||||||||
Repurchase agreements |
138,219 | 1,663 | 1.20 | 183,650 | 4,021 | 2.19 | 205,055 | 7,580 | 3.70 | |||||||||||||||||
FHLB advances and other borrowings |
2,038,012 | 86,248 | 4.23 | 2,222,615 | 100,364 | 4.52 | 1,932,724 | 89,730 | 4.64 | |||||||||||||||||
Total interest-bearing liabilities |
6,466,959 | 168,592 | 2.61 | % | 6,246,004 | 209,057 | 3.35 | % | 5,999,574 | 228,243 | 3.80 | % | ||||||||||||||
Non-interest-bearing demand deposits |
518,596 | 484,090 | 492,658 | |||||||||||||||||||||||
Other non-interest-bearing liabilities |
95,880 | 73,389 | 71,145 | |||||||||||||||||||||||
Total liabilities |
7,081,435 | 6,803,483 | 6,563,377 | |||||||||||||||||||||||
Equity |
1,407,025 | 1,406,999 | 1,404,070 | |||||||||||||||||||||||
Total liabilities and equity |
$ | 8,488,460 | $ | 8,210,482 | $ | 7,967,447 | ||||||||||||||||||||
Net interest-earning assets |
$ | 1,126,644 | $ | 1,035,123 | $ | 1,057,972 | ||||||||||||||||||||
Net interest income |
$ | 203,207 | $ | 190,116 | $ | 175,037 | ||||||||||||||||||||
Interest rate spread |
2.29 | % | 2.13 | % | 1.91 | % | ||||||||||||||||||||
Net interest margin (net interest income as a percentage of total interest-earning assets |
2.68 | % | 2.61 | % | 2.48 | % | ||||||||||||||||||||
Ratio of total interest-earning assets to total interest-bearing liabilitites |
117.42 | % | 116.57 | % | 117.63 | % | ||||||||||||||||||||
Net Interest Income Analysis
Net interest income is the amount that interest and fees on earning
assets (loans and investments) exceeds the cost of funds, primarily interest
paid to the Company’s depositors and interest on external borrowings. Net interest
margin is the difference between the income on earning assets and the cost of
interest-bearing funds as a percentage of earning assets.
During 2009, the FRB
left the overnight lending target rate unchanged at a range between 0.0% and 0.25%.
For the twelve months ended December 31, 2008, the FRB lowered the target federal
funds rate seven times, for a total decrease of 400 basis points (from 4.25%
to between 0.00% and 0.25%). Decreases of 200 basis points and 25 basis points occurred
during the first and second quarters
38
of 2008, respectively, while the FRB left
the overnight federal funds target rate unchanged at 2.00% for the quarter ending
September 30, 2008. During the fourth quarter of 2008 the FRB reduced the target
federal funds rate by 175 basis points.
Comparison of 2009 and 2008
As shown in Table 2, net interest income for the year ended December 31, 2009 was
$203.2 million, an increase of $13.1 million from December 31, 2008. The increase
was due to: a) the average balances of interest-earning assets outpacing the growth
in interest-bearing liabilities by approximately $91.5 million; b) the repricing
or maturing of interest-bearing liabilities outpacing that of interest-earning
assets, thereby allowing us to reduce our cost of funds at a faster pace and c) the
shift in the mix of interest-bearing liabilities from higher cost time deposits
and borrowings to core deposits which reduced the cost of funds by 74 basis points.
The net interest margin increased seven basis points to 2.68% for the year ended
December 31, 2009 as compared to the year ended December 31, 2008. This increase
was a net result of the loss of the FHLB Boston dividend and a reduction in interest-earning
asset yields that were more than offset by the reduction in the costs of interest-bearing
liabilities.
As a voluntary member of the FHLB, the Company is required to invest
in stock of the FHLB in an amount based partly upon its outstanding advances
from the FHLB. Stock is purchased at par value. Upon redemption of the stock, which
is at the discretion of the FHLB, the Company would receive an amount equal to
the par value of the stock. At its discretion, the FHLB may also declare dividends
on its stock. No dividends have been received for the year ended December 31, 2009
compared to dividends of $4.5 million for the year ended December 31, 2008.
On February 26, 2009, the FHLB Boston advised its members that, while it currently
meets all its regulatory capital requirements, it is focusing on preserving capital
in response to ongoing market volatility, and accordingly, has suspended its quarterly
dividend and extended the moratorium on excess stock purchases, primarily due
to other-than-temporary impairment charges on its private-label mortgage-backed
securities investments. The FHLB Boston has stated that it expects and intends to
hold its private-label mortgagebacked securities to maturity. In a letter to
member banks on October 29, 2009, the FHLB Boston announced the filing of its quarterly
report to the SEC and disclosed that the credit quality of the loans underlying
the Bank’s portfolio of private-label mortgage-backed securities remains
vulnerable to the housing and capital markets, which could result in additional
losses. Accordingly, to protect its capital base and build retained earnings,
the moratorium on excess stock repurchases and the quarterly dividend payout suspension
continue. Also, the FHLB Boston has implemented a revised operating plan that
includes certain revenue enhancement and expense reduction initiatives and the
goal of the plan is to build retained earnings to an appropriate level so that they
may eventually resume paying dividends and end the moratorium on excess stock
repurchases. The Company does not anticipate a reinstatement of the FHLB Boston
dividend in 2010. Based on these facts, the Company evaluated its FHLB Boston capital
stock for potential impairment at December 31, 2009. Capital adequacy, credit
ratings, the value of the stock, overall financial condition of both the Federal
Home Loan Bank system (“FHLB”) and FHLB Boston as well as current economic
factors were analyzed in the impairment analysis.
FHLB Boston is one of the twelve
individual banks within the FHLB. Although the individual banks of the FHLB operate
as separate entities, the obligations of the individual home loan banks are joint
and several obligations of all twelve individual banks. Under this structure,
there have been no defaults and no interest deferrals for any of the FHLB’s
consolidated operations. As of September 30, 2009, the FHLB had regulatory capital
of $60.4 billion and all twelve individual banks were in compliance with risk based
capital rules and minimum leverage ratio requirements. FHLB Boston had regulatory
capital of $3.86 billion, or 6.4% and leverage capital of 9.6% at September 30,
2009, which were above the minimum requirements of 4% and 5%, respectively.
The core operations of the FHLB and the FHLB Boston of issuing debt into the capital
markets and making advances to their members remains a viable and profitable
business. They continue to have ample access to liquidity through the capital markets,
the investing of fed funds, term deposits and issuing member advances. Additionally,
the FHLB continues to have AAA rating from both Moody’s and Standard and
Poors and is not on a watchlist for downgrade. There is no indication that the stock
has traded at any price below its carrying value of $100 per share. The Company
therefore concluded that its position in Federal Home Loan Bank capital stock is
not impaired.
Interest and dividend income decreased $27.4 million to $371.8
million at December 31, 2009 compared to $399.2 million at December 31, 2008
comprising of a decrease of $40.9 million due to rate, offset by a $13.5 million
increase due to volume. The decline in rate was primarily due to a) newly originated
loans and adjustable or variable rate loans that were reset at reduced rates due
to the rate cuts imposed by the FRB throughout 2008, b) the absence of a quarterly
dividend from the FHLB Boston and c) a decline in the average yield in the investment
securities portfolio due to a decline in market interest rates resulting from the
current economic conditions. Loan yields have also been negatively impacted to
a lesser extent by the increase in nonperforming loans. Investment growth helped
to mitigate the effect of the rate decline on interest income as the average balance
increase of $302.5 million accounted for approximately $13.0 million of the increase
to interest income. Due to the growth in core deposits the Company has expanded
the securities portfolio primarily with purchases of adjustable rate mortgage-backed
securities. The average balance of the loan portfolio increased $10.0 million
for the period, which includes an increase of $23.1 million in the average balance
of loans held for sale.
39
Given the economic and market conditions
that have beset the industry over the last year, there have been fewer commercial
originations that meet our underwriting criteria and although residential mortgage
originations have been relatively strong, approximately half were originated
at fixed rates and sold in the secondary market.
The cost of funds for the year
ended December 31, 2009 decreased $40.5 million, or nearly 20.0% to $168.6 million,
compared to $209.1 million for the same period a year ago. The Company’s
continued strategy during this period was to reduce deposit costs and focus on
the growth of core interest and non-interest-bearing deposits. The result has been
a decrease of $24.0 million in deposit interest expense due to changes in the
mix of deposits with net average balance growth of $451.0 million and a decrease
of 85 basis points on the average rate paid. This decrease in deposit interest
expense was primarily in time deposits, which decreased $18.4 million due to
the declines in the average balances and average rate paid of $201.9 million and
69 basis points, respectively. Through targeted marketing campaigns and migration
from maturing time deposits as they repriced at reduced rates, the Company has been
able to grow core deposit average balances by a total of $652.9 million. The
main driver of core deposit growth has been savings and money market accounts
with an average balance increase of $498.7 million $158.8 million, respectively.
Additionally, when combined with the decline in the average rate paid of 95 basis
points on savings and 63 basis points on money market, interest expense decreased
by $5.3 million during this period for these products.
A further benefit of the
core deposit growth has been a substantial reduction in and reliance on borrowings
from the FHLB. FHLB advances and other borrowing costs decreased $14.1 million
due to the decline in the average balance and the average rate paid on FHLB advances
of $184.6 million and 29 basis points, respectively. The Company was able to replace
maturing advances with new advances at substantially lower rates or payoff maturing
advances.
Comparison of 2008 and 2007
As shown in Table 2, net interest
income for the year ended December 31, 2008 was $190.1 million compared to $175.0
million for the twelve months ended December 31, 2007. The increase was due to
a 13 basis point increase in the net interest margin to 2.61% at December 31,
2008 from 2.48% for the same period a year ago, primarily due to the significant
reduction in costs associated with higher priced certificate of deposit accounts,
growth in the loan portfolio and the investment portfolio restructuring in 2007,
partially offset by the effect of the decline in yield on adjustable and variable
rate commercial and consumer loans.
Interest income decreased $4.1 million from
the year ended December 31, 2007 and was comprised of a $17.9 million decrease due
to rate, offset by a $13.8 million increase due to volume. The decline due to
rate was primarily caused by the significant rate cuts enacted by the FRB in
2008 as average yields earned on loans and short-term investments decreased 42 basis
points and 273 basis points, respectively and the resulting decline in dividend
yields on equity securities, mainly FHLB Boston stock. Loan yields have also
been negatively impacted by an increase in nonperforming loans. Slightly offsetting
these rate declines was an increase in the average yield earned on the securities
portfolio as a result of the 2007 restructuring. Strong loan growth, however, made
the most substantial difference in mitigating the effects of the rate cuts as
average loan balances increased $306.5 million, or 6.7% from the prior year.
Three of the four loan categories experienced increases in average balances, with
the residential real estate loan portfolio as the main driver of the growth.
The increase in average balances was due to increased loan originations as the Company,
with ready liquidity and capital, was able to take advantage of the pricing opportunities
in our lending area due to the sustained dislocations in the credit market. We
expect this trend to continue in the near term, however, as other banks regain strength
after receiving infusions of capital from the EESA and begin lending again, competition
will likely increase.
For the year ended December 31, 2008 as compared to 2007,
the Company experienced a significant reduction in its cost of funds in the amount
of $19.2 million as a shift in the mix of interest-bearing liabilities reduced the
average rate paid by 45 basis points and helped to improve the net interest spread
by 22 basis points. The Company’s continuing strategy has been to reduce deposit
costs while being mindful of competitor pricing and focusing on growth of core
deposits. The shift was away from higher costing time deposits as well as from
money market and NOW deposits and into savings deposits. The “free savings” product, with an attractive interest rate, has been very successful for
the Company. Although the average rate paid on savings deposits increased by 35
basis points from the prior year, the average rate paid on all interest-bearing
deposits declined a net 66 basis points. For the year ended December 31, 2008,
total average interest-bearing deposits declined $22.1 million, however, average
interest-bearing core deposits increased $242.3 million at a much lower rate.
Partially offsetting the $26.3 million decline in deposit interest expense was an
increase in expense on borrowings of $7.1 million, principally due to an increase
of $289.9 million in the average balance of FHLB advances and other borrowings.
FHLB advances were used to fund loan growth and to counter deposit outflows that
occurred primarily in the first quarter of 2008.
40
Rate/Volume Analysis
The following table presents the extent to which changes in interest
rates and changes in volume of interest-earning assets and interest-bearing liabilities
have affected the Company’s interest income and interest expense during the
periods indicated. Information is provided in each category with respect to:
(i) changes attributable to changes in volume (changes in volume multiplied by prior
rate); (ii) changes attributable to changes in rate (changes in rate multiplied
by prior volume); and (iii) the net change. The changes attributable to the combined
impact of volume and rate have been allocated proportionately to the changes due
to volume and the changes due to rate.
Table 3: Rate/Volume Analysis
| Twelve Months Ended | Twelve Months Ended | ||||||||||||||||||||||
| December 31, 2009 | December 31, 2008 | ||||||||||||||||||||||
| Compared to | Compared to | ||||||||||||||||||||||
| Twelve Months Ended | Twelve Months Ended | ||||||||||||||||||||||
| December 31, 2008 | December 31, 2007 | ||||||||||||||||||||||
| Increase (Decrease) | Increase (Decrease) | ||||||||||||||||||||||
| Due to | Due to | ||||||||||||||||||||||
| (In thousands) | Rate | Volume | Net | Rate | Volume | Net | |||||||||||||||||
| Interest-earning assets | |||||||||||||||||||||||
Loans |
|||||||||||||||||||||||
Residential real estate |
$ | (6,592 | ) | $ | (294 | ) | $ | (6,886 | ) | $ | (783 | ) | $ | 10,994 | $ | 10,211 | |||||||
Commercial real estate |
(4,201 | ) | 777 | (3,424 | ) | (4,938 | ) | 4,134 | (804 | ) | |||||||||||||
Commercial business |
(4,407 | ) | (1,393 | ) | (5,800 | ) | (5,979 | ) | (166 | ) | (6,145 | ) | |||||||||||
Consumer |
(6,195 | ) | 1,418 | (4,777 | ) | (7,619 | ) | 2,801 | (4,818 | ) | |||||||||||||
Total loans |
(21,395 | ) | 508 | (20,887 | ) | (19,319 | ) | 17,763 | (1,556 | ) | |||||||||||||
Fed funds sold and other short-term investments |
(1,477 | ) | 655 | (822 | ) | (1,369 | ) | (594 | ) | (1,963 | ) | ||||||||||||
Federal Home Loan Bank stock |
(4,595 | ) | 69 | (4,526 | ) | (3,013 | ) | 762 | (2,251 | ) | |||||||||||||
Securities |
(13,427 | ) | 12,288 | (1,139 | ) | 5,779 | (4,116 | ) | 1,663 | ||||||||||||||
Total securities, short-term investments |
|||||||||||||||||||||||
and federal home loan bank stock |
(19,499 | ) | 13,012 | (6,487 | ) | 1,397 | (3,948 | ) | (2,551 | ) | |||||||||||||
Total interest-earning assets |
$ | (40,894 | ) | $ | 13,520 | $ | (27,374 | ) | $ | (17,922 | ) | $ | 13,815 | $ | (4,107 | ) | |||||||
| Interest-bearing liabilities | |||||||||||||||||||||||
Deposits |
|||||||||||||||||||||||
Money market |
$ | (3,089 | ) | $ | 2,944 | $ | (145 | ) | $ | (5,200 | ) | $ | (2,464 | ) | $ | (7,664 | ) | ||||||
NOW |
(282 | ) | (17 | ) | (299 | ) | (2,702 | ) | (396 | ) | (3,098 | ) | |||||||||||
Savings |
(14,360 | ) | 9,194 | (5,166 | ) | 3,479 | 8,023 | 11,502 | |||||||||||||||
Time |
(11,587 | ) | (6,794 | ) | (18,381 | ) | (16,091 | ) | (10,910 | ) | (27,001 | ) | |||||||||||
Total interest bearing deposits |
(29,318 | ) | 5,327 | (23,991 | ) | (20,514 | ) | (5,747 | ) | (26,261 | ) | ||||||||||||
Repurchase agreements |
(1,523 | ) | (835 | ) | (2,358 | ) | (2,834 | ) | (725 | ) | (3,559 | ) | |||||||||||
FHLB advances and other borrowings |
(6,077 | ) | (8,039 | ) | (14,116 | ) | (2,515 | ) | 13,149 | 10,634 | |||||||||||||
Total interest-bearing liabilities |
$ | (36,918 | ) | $ | (3,547 | ) | $ | (40,465 | ) | $ | (25,863 | ) | $ | 6,677 | $ | (19,186 | ) | ||||||
| Increase in net interest income | $ | (3,976 | ) | $ | 17,067 | $ | 13,091 | $ | 7,941 | $ | 7,138 | $ | 15,079 | ||||||||||
Provision for Loan Losses
The provision for loan losses (“provision”) is based on
management’s periodic assessment of the adequacy of the loan loss allowance
which, in turn, is based on such interrelated factors as the composition of the
loan portfolio and its inherent risk characteristics, the level of nonperforming
loans and charge-offs, both current and historic, local economic and credit conditions,
the direction of real estate values, and regulatory guidelines. The provision
is charged against earnings in order to maintain an allowance for loan losses
that reflects management’s best estimate of probable losses inherent in the
loan portfolio at the balance sheet date.
Management performs a monthly review
of the loan portfolio, and based on this review determines the level of the provision
necessary to maintain an adequate allowance for loan losses. Management recorded
a provision of $18.0 million for the year ended December 31, 2009. The primary
factors that influenced management’s decision to record this provision were
the increase in nonperforming loans of $12.2 million or 31.8%, continuing trends
in delinquencies, net charge-offs of $15.5 million and the ongoing support of
estimated credit losses embedded in the portfolio. Further details about nonperforming
loans can be found in the “Asset Quality” and “Allowance for Loan
Losses” sections beginning on page 52. Future provisions may be deemed necessary
if economic conditions do not improve or continue to deteriorate. A provision
of $13.4 million and $4.9 million was recorded for the years ended December 31,
2008 and 2007, respectively.
At December 31, 2009, the allowance for loan losses
was $52.5 million, which represented 1.10% of total loans and 103.87% of nonperforming
loans. In comparison, the allowance for loan losses was $49.9 million at December
31, 2008 representing 1.01% of
41
total loans and 130.21% of nonperforming loans. See the “Asset Quality” and “Allowance for Loan Losses” sections located on pages 52-56 for further information regarding the Company’s credit quality.
| Table 4: Non-Interest Income | ||||||||||||||||||||||||||
| Year Ended December 31, | Change | |||||||||||||||||||||||||
| 2009/2008 | 2008/2007 | |||||||||||||||||||||||||
| (Dollars in thousands) | 2009 | 2008 | 2007 | Amount | Percent | Amount | Percent | |||||||||||||||||||
| Depositor service charges | $ | 27,351 | $ | 27,180 | $ | 27,941 | $ | 171 | 1 | % | $ | (761 | ) | (3 | )% | |||||||||||
| Loan and servicing income | 819 | 968 | 2,002 | (149 | ) | (15 | ) | (1,034 | ) | (52 | ) | |||||||||||||||
| Trust fees | 5,790 | 6,351 | 6,783 | (561 | ) | (9 | ) | (432 | ) | (6 | ) | |||||||||||||||
| Investment management, brokerage & insurance fees | 6,723 | 7,893 | 6,811 | (1,170 | ) | (15 | ) | 1,082 | 16 | |||||||||||||||||
| Bank owned life insurance | 3,548 | 4,937 | 6,375 | (1,389 | ) | (28 | ) | (1,438 | ) | (23 | ) | |||||||||||||||
| Net gain (loss) on securities | 5,917 | 1,843 | (27,542 | ) | 4,074 | 221 | 29,385 | 107 | ||||||||||||||||||
| Mortgage origination activity & loan sale income | 5,586 | 1,551 | 1,489 | 4,035 | 260 | 62 | 4 | |||||||||||||||||||
| Other | 3,512 | 5,173 | 7,306 | (1,661 | ) | (32 | ) | (2,133 | ) | (29 | ) | |||||||||||||||
Total non-interest income |
$ | 59,246 | $ | 55,896 | $ | 31,165 | $ | 3,350 | 6 | % | $ | 24,731 | 79 | % | ||||||||||||
Non-Interest Income Analysis
The Company has two primary sources of non-interest income: (a)
banking services related to loans, deposits and other core customer activities
typically provided through the branch network as well as merchant services and (b)
financial services, comprised of trust, investment and insurance products and
brokerage and investment advisory services. The principal categories of non-interest
income are shown in Table 4.
Comparison of 2009 and 2008
As displayed in
Table 4, non-interest income increased $3.4 million to $59.2 million for the year
ended December 31, 2009 from the prior year period. The main drivers of the increase
were mortgage origination activity and loan sale income and net gain on securities. These
increases were partially offset by decreases in BOLI, investment management, brokerage
and insurance fees, trust fees and other income.
| • | Mortgage origination
activity and loan sale income increased $4.0 million due to a greater number of mortgage
loans originated for sale and sold in the secondary market during the year and the
effect of originations that were in the pipeline at December 31, 2009 under commitments
to be sold. The increased origination activity has been driven by the low interest
rate environment and the continued dislocation in the credit markets which has reduced
the number of competitors in the short term. |
|
| • | Net gain on
securities increased due to the gains recorded on the sale of mortgage-backed securities.
These securities were sold at a premium and were sold in order to reduce prepayment
risk, to reduce high price premium risk and to fund the pay-off of maturing FHLB
advances primarily earlier in the year. The increase in the net gain on securities
is also due to the prior year impairment charges related to an investment in a trust
preferred equity security in a regional bank and two preferred equity securities
issued by Freddie Mac and Lehman Brothers. Partially offsetting the net gain on
the sale of investments was other-than-temporary impairments recorded against the
Company’s investment in an adjustable rate mortgage mutual fund and a pooled
trust preferred security. |
|
| • | Trust fees
declined primarily due to a decrease in the year-to-date average assets under management.
The assets under management declined primarily as a result of the decline in the
market value of the assets, which caused the reduction in the amount of management
fees earned. Assets under management have begun to rebound in the second half of
the year evidenced by the recent market improvement. |
|
| • | Investment
management, brokerage and insurance fees declined due to prevailing depressed market
conditions and the ongoing lack of consumer confidence in longer-term investment
choices. |
|
| • | BOLI income
decreased due to a decline in the average yield earned as a result of current market
interest rates. |
|
| • | Other income
decreased due to: a) net loss of $575,000 recorded on limited partnerships during
2009 due to the decline in the fair-value of the underlying investments compared
to a net loss of $30,000 recorded in 2008, b) a decrease of approximately $380,000
in amounts earned on the outstanding balances of bank checks processed by a third-party
vendor |
42
due to the
decline in market interest rates and c) the prior year receipt of approximately
$500,000 from the partial redemption of the Company’s stake in Visa Inc., following
Visa’s initial public offering. |
Comparison of 2008 and 2007
As
displayed in Table 4, non-interest income increased $24.7 million to $55.9 million
compared to $31.2 million for the year ended December 31, 2007. The increase
in non-interest income was primarily attributable to the 2007 investment portfolio
restructuring that resulted in a net loss recorded in 2007 of $28.3 million.
Excluding the investment restructuring, non-interest income declined $3.5 million
primarily due to decreases in depositor service charges, loan and servicing income,
BOLI and other income, partially offset by increases in net gain/loss on securities
and investment management, brokerage and insurance fees.
| • | Depositor
service charges decreased due to a decline in overdraft fees, point of sale fees
and inactive and dormant account fees. The Company eliminated debit card point-of-sale,
inactive and dormant account service charges during the first quarter of 2008 for
promotional and competitive reasons, while overdraft fees declined due to volume.
These decreases were partially offset by increased check card revenue resulting
from expanded card usage due in part to a “rewards” program initiated
in 2008, which offers cash rewards to customers who use their check card, and an
increase in merchant services income. |
|
| • | Loan and servicing
income declined largely due to a write-down on the valuation of the bank’s
mortgage servicing asset and the decrease in commercial real estate prepayment fees
and letter of credit fees. |
|
| • | Investment
management, brokerage and insurance fees increased mainly due to the sales of fixed
annuity products resulting from a favorable rate environment for these products.
An increase in the number of sales personnel and increased marketing efforts have
contributed to the increased trading activity and the sales of investment products. |
|
| • | BOLI income
decreased due to a decline in the average yield earned as a result of current market
interest rates. |
|
| • | Net gain on
securities increased $29.4 million primarily due to the restructuring in 2007 which
resulted in a total charge of $28.3 million. Excluding the restructuring, net gain
on securities increased $1.1 million due to gains recorded on the sale of mortgage-backed
securities. These securities were sold at a premium and were sold in order to reduce
prepayment and duration risk. Partially offsetting the gain on mortgage-backed securities
were other-than-temporary impairment charges of $2.7 million and losses recorded
on the sale of bank stocks in the second quarter of 2008. The impairment charges
primarily relate to an investment in a trust preferred equity security issued by
a regional bank in the amount of $1.6 million and for preferred equity securities
issued by Freddie Mac and Lehman Brothers in the amounts of $850,000 and $195,000,
respectively, due to their sudden loss in market value. |
|
The Company
did not expect the financial position of the regional bank or the current price
of its security to improve meaningfully over the near term and also considered its
market price to reflect enhanced risk in the timely realization of cashflows and
it was, therefore, written down to market value through the income statement. |
||
The Lehman
Brothers preferred equity security was deemed impaired as a result of Lehman Brothers
declaration of Chapter 11 bankruptcy in September 2008. |
||
The Freddie
Mac preferred equity security was deemed impaired as a result of Freddie Mac being
placed in conservatorship by the U.S. Treasury, FRB and the Federal Housing Finance
Agency. Additionally, dividends were halted on existing common and preferred securities
and the U.S. Treasury invested $1.0 billion in the form of senior preferred equity,
which has priority over the Company’s preferred equity securities. |
||
| • | Other income
decreased mainly as a result of a prior year net gain on limited partnerships which
resulted from the sale of an underlying investment compared to a net loss on limited
partnerships in the current year period and a decrease in amounts earned on the
outstanding balances of bank checks processed by a third-party vendor due to the
decline in market interest rates. |
43
| Table 5: Non-Interest Expense | |||||||||||||||||||||||||
| Year Ended December 31, | Change | ||||||||||||||||||||||||
| 2009/2008 | 2008/2007 | ||||||||||||||||||||||||
| (Dollars in thousands) | 2009 | 2008 | 2007 | Amount | Percent | Amount | Percent | ||||||||||||||||||
| Salaries and employee benefits | $ | 89,646 | $ | 91,687 | $ | 84,513 | $ | (2,041 | ) | (2 | )% | $ | 7,174 | 8 | % | ||||||||||
| Occupancy | 18,202 | 18,091 | 17,338 | 111 | 1 | 753 | 4 | ||||||||||||||||||
| Furniture and fixtures | 5,808 | 6,550 | 6,874 | (742 | ) | (11 | ) | (324 | ) | (5 | ) | ||||||||||||||
| Outside services | 20,098 | 19,314 | 17,142 | 784 | 4 | 2,172 | 13 | ||||||||||||||||||
| Advertising, public relations, | |||||||||||||||||||||||||
and sponsorships |
5,664 | 6,152 | 7,667 | (488 | ) | (8 | ) | (1,515 | ) | (20 | ) | ||||||||||||||
| Amortization of identifiable | |||||||||||||||||||||||||
intangible assets |
8,501 | 9,456 | 11,682 | (955 | ) | (10 | ) | (2,226 | ) | (19 | ) | ||||||||||||||
| Merger related charges | 84 | 185 | 2,523 | (101 | ) | (55 | ) | (2,338 | ) | (93 | ) | ||||||||||||||
| FDIC insurance premiums | 10,479 | 721 | 549 | 9,758 | 1,353 | 172 | 31 | ||||||||||||||||||
| Other | 13,731 | 14,413 | 14,158 | (682 | ) | (5 | ) | 255 | 2 | ||||||||||||||||
Total non-interest expense |
$ | 172,213 | $ | 166,569 | $ | 162,446 | $ | 5,644 | 3 | % | $ | 4,123 | 3 | % | |||||||||||
Non-Interest Expense Analysis
Comparison of 2009 and 2008
As displayed in Table 5, non-interest
expense increased $5.6 million to $172.2 million for the year ended December 31,
2009 from $166.6 million for the same period a year ago. The main driver of the
increase was the FDIC insurance premium. There was also an increase in outside
services; however, there was a reduction in expenses associated with the majority
of all other non-interest expense categories.
| • | FDIC insurance
premium expense increased $9.8 million from last year due to: a) a seven basis point
increase in the assessment rate in the first quarter of 2009 and an additional two
basis point increase in the assessment rate bringing the rate to fourteen basis
points for the second quarter through the remainder of 2009, b) the exhaustion of
the Company’s one-time credit established by the Federal Deposit Insurance
Reform Act of 2005 in the first quarter of 2009 and c) the special assessment in
the second quarter of 2009 of $3.9 million imposed by the FDIC to provide for replenishment
of the Deposit Insurance Fund. In addition, the FDIC required institutions to prepay
their regular risk-based assessments for the fourth quarter of 2009 and for all
of 2010, 2011, and 2012 on December 30, 2009 which amounted to approximately $27.5
million. Included in the prepaid assessment was approximately $1.7 million, which
was recorded as expense in 2009. |
|
| • | Outside services
increased primarily due to consulting costs associated with strategic planning initiatives
and mortgage consulting costs. |
|
| • | Salaries and
employee benefits decreased as a result of reduced stock option expense as the majority
of options granted to date became fully vested on December 31, 2008 and a decrease
in restricted stock expense due to the retirement of executive officers in 2009
and 2008. Salary expense also decreased due to a prior year severance payment for
an executive who is no longer with the Company, which was partially offset by current
year severance payments. |
|
Partially
offsetting the decreases were increased bonus accruals, an increase in pension plan
expense due to the decline in the value of the pension assets and changes in assumptions
for 2009 and additional expense in 2009 related to the Supplemental Executive Retirement
Plan (“SERP”) of approximately $1.9 million resulting from the retirement
of an executive officer in May 2009 and an unfavorable change in the discount rate
associated with the measurement of the plan at December 31, 2009. |
||
We expect
to record additional SERP expense in 2010 of approximately $1.3 million due to the
retirement of an executive officer in January 2010 and pension expense is expected
to increase approximately $1.0 million due to a decline in the discount rate for
2010. |
||
| • | Advertising,
public relations and sponsorships declined primarily due to a reduction in expenses
related to various media advertising and bonus campaigns to promote an array of
business and consumer products. During the second half of 2009, advertising has
picked up and we expect this trend to continue into 2010 due to planned media campaigns. |
|
| • | Furniture
and fixture expense decreased primarily due to a decline in depreciation expenses
for various hardware and software that have been fully depreciated, i.e. branch
and corporate telephone and computer systems. |
44
| • | Amortization
of identifiable intangible assets decreased due to less amortization on core deposit
intangibles from using the accelerated method of accounting whereas there was more
amortization expense in 2008 compared to 2009. |
|
| • | Other expenses
decreased due to reductions in general operating expenses partially offset by an
increase in other real estate owned expenses as a result of the increased number
of foreclosed properties. |
Comparison of 2008 and 2007
As
displayed in Table 5, non-interest expense increased $4.1 million to $166.6 million
for the year ended December 31, 2008 from $162.4 million for the year ended December
31, 2007. The main drivers of the increase were salaries and employee benefits and
outside services, partially offset by decreases in amortization of identifiable
intangible assets, merger related charges, and advertising, public relations
and sponsorships.
| • | Salaries and
employee benefits increased as a result of a) severance recorded in the first quarter
of 2008 for an executive who is no longer with the Company b) increased employee
incentive accruals, including incentive payouts due to the increased sales of investment
products c) general merit increases d) a decrease in capitalized salaries primarily
due to the decline in commercial loan originations and e) increased expense on the
Company’s supplemental executive retirement plan compared to the twelve months
ended December 31, 2007 due to changes in assumptions. |
|
These increases
were partially offset by a decrease in charges associated with the 2005 Long-Term
Compensation Plan (“LTCP”) for executives that are no longer with the
Company and a decrease in Employee stock ownership plan expense due to the decline
in the Company’s average year-to-date stock price. |
||
| • | Outside services
increased due to consulting costs associated with the implementation of a performance
optimization project in an effort to enhance the overall effectiveness and revenue
performance of the Company. During 2008 consulting costs for this project were approximately $1.7
million. Outside services also increased due to charges incurred for outsourcing
general internal audit work, legal and consulting costs related to human resources,
partially offset by a decline in data processing expenses. |
|
| • | Amortization
of identifiable intangible assets decreased due to using an accelerated method of
amortization for core deposit intangibles which results in a higher level of expense
in earlier periods and amortization of non-compete agreements due to the expiration
of all agreements in the third quarter of 2007. |
|
| • | Conversion
and merger related charges decreased mainly due to charges for legal, consulting,
advertising and data processing expense associated with the Westbank acquisition
that occurred in 2007. |
Income Tax Expense
Income tax expense for 2009, 2008 and 2007 was $25.8 million, $20.7 million
and $15.1 million, respectively. The effective tax rates for the years ended
2009, 2008 and 2007 were 35.7%, 31.4%, and 38.8% respectively. The change in the
effective tax rate for the year ended December 31, 2009 in comparison to the
year ended December 31, 2008 was due to an additional state tax liability as a
result of new Massachusetts legislation enacted in 2008 but effective in 2009, an
increase in 2009 of estimated non-deductible excess remuneration pursuant to
Internal Revenue Code Section 162(m), the reduction in 2009 of favorable permanent
differences, including bank-owned life insurance income and the dividends received
deduction, and the recognition in 2008 of the reversal of $991,000 of unrecognized
tax benefits for tax positions of prior years resulting from the settlement of the
IRS audit in the first quarter of 2008.
The change in the effective tax rate
for the year ended December 31, 2008 in comparison to the year ended December 31,
2007 was primarily due to the $3.6 million increase in the valuation allowance
required for the charitable contribution carryforward in 2007 and the reduction
of $991,000 of unrecognized tax benefits for tax positions of prior years resulting
from the settlement of the IRS audit in the first quarter of 2008.
NewAlliance
continually monitors and evaluates the potential impact of current events and circumstances
on the estimates used in the analysis of its income tax positions, and accordingly,
NewAlliance’s effective tax rate may fluctuate in the future. NewAlliance
evaluates its income tax positions based on tax laws and appropriate regulations
and financial reporting considerations, and records adjustments as appropriate.
This evaluation takes into consideration the status of current taxing authorities’ examinations of NewAlliance’s tax returns and recent positions taken
by the taxing authorities on similar transactions, if any. Accordingly, the results
of these examinations may alter the timing or amount of taxable income or deductions
taken by the Company.
45
Financial Condition, Liquidity and
Capital Resources
Financial Condition Summary
From December 31, 2008 to December 31, 2009, total assets increased approximately
$134.8 million mainly due to an increase in investments, partially offset by
a decline in loans. Liabilities increased $81.1 million due to increases in deposits,
partially offset by a decrease in borrowings. Stockholders’ equity increased
$53.7 million to $1.43 billion due primarily to net income for the year ended
December 31, 2009 and an increase in accumulated other comprehensive income due to
the increase in the net unrealized gains on the investment portfolio, net of
tax and an increase to recognize the year-over-year change in the funded position
of the Company’s pension plans. These increases are partially offset by
dividends declared and treasury shares acquired.
Investment Securities
The Company maintains an investment securities portfolio that
is primarily structured to provide a source of liquidity for operating needs,
to generate interest income and to provide a means to balance interest-rate sensitivity.
The securities portfolio is managed in accordance with regulatory guidelines
and established internal corporate investment policies. The following table sets
forth certain financial information regarding the amortized cost and fair value
of the Company’s investment portfolio at the dates indicated.
Table 6:
Investment Securities
| December 31, 2009 | December 31, 2008 | December 31, 2007 | ||||||||||||||||||
| Amortized | Fair | Amortized | Fair | Amortized | Fair | |||||||||||||||
| (In thousands) | cost | value | cost | value | cost | value | ||||||||||||||
| Available for sale | ||||||||||||||||||||
U.S. Treasury obligations |
$ | 597 | $ | 597 | $ | 596 | $ | 597 | $ | 1,092 | $ | 1,095 | ||||||||
U.S. Government sponsored enterprise obligations |
198,692 | 199,730 | 228,844 | 233,349 | 201,408 | 202,059 | ||||||||||||||
Corporate obligations |
8,139 | 8,517 | 8,178 | 7,946 | 22,531 | 22,515 | ||||||||||||||
Other bonds and obligations |
14,625 | 13,234 | 17,654 | 15,449 | 19,853 | 19,634 | ||||||||||||||
Auction rate certficates |
27,550 | 24,795 | 28,000 | 23,479 | 33,000 | 33,000 | ||||||||||||||
Marketable equity securities |
8,567 | 8,783 | 19,039 | 19,134 | 36,204 | 35,634 | ||||||||||||||
Trust preferred equity securities |
48,754 | 33,296 | 47,708 | 31,265 | 50,339 | 47,832 | ||||||||||||||
Private label residential mortgage-backed securities |
23,871 | 20,856 | 33,027 | 25,136 | 45,415 | 45,519 | ||||||||||||||
Residential mortgage-backed securities |
1,951,297 | 2,018,047 | 1,543,403 | 1,572,207 | 1,661,551 | 1,679,973 | ||||||||||||||
Total available for sale |
2,282,092 | 2,327,855 | 1,926,449 | 1,928,562 | 2,071,393 | 2,087,261 | ||||||||||||||
| Held to maturity | ||||||||||||||||||||
Residential mortgage-backed securities |
230,596 | 240,956 | 299,222 | 308,016 | 282,887 | 286,968 | ||||||||||||||
Other bonds |
10,170 | 10,375 | 10,560 | 10,746 | 7,585 | 7,577 | ||||||||||||||
Total held to maturity |
240,766 | 251,331 | 309,782 | 318,762 | 290,472 | 294,545 | ||||||||||||||
Total securities |
$ | 2,522,858 | $ | 2,579,186 | $ | 2,236,231 | $ | 2,247,324 | $ | 2,361,865 | $ | 2,381,806 | ||||||||
At December 31, 2009, the Company had total
investments of $2.57 billion, or 30.4%, of total assets. The increase of $330.3
million, from $2.24 billion at December 31, 2008 was primarily the result of
purchasing mortgage-backed securities. The Company’s increase in the investment
portfolio was funded primarily by the growth in deposits and loan principal repayments.
While the Company prefers lending as the primary use of its excess cash flows,
the investment portfolio serves a secondary role in generating revenue while
managing interest-rate risk and liquidity.
The available for sale and held to
maturity securities portfolios are primarily composed of mortgage-backed securities.
At December 31, 2009, mortgage-backed securities comprised 87.6% and 95.8% of
the total available for sale and held to maturity securities portfolios, respectively,
the majority of which are issued by Fannie Mae and Freddie Mac. The duration of
the mortgage-backed securities portfolio was 1.62 years at December 31, 2009
compared to 1.55 years at December 31, 2008.
The Company’s underlying investment
strategy has been to purchase FNMA and FHLMC hybrid adjustable rate mortgage-backed
securities, and seasoned 15 and 20 year Government Sponsored Enterprise (“GSE”) fixed rate mortgage-backed securities. The Company has focused on the
purchases of these securities due to their attractive spreads versus funding costs
and for their monthly cash flows that provide the Company with liquidity. This
strategy is also supplemented with select purchases of bullet and callable agency
securities. The average life for mortgage-backed securities, when purchased,
would range between two and four years and the maturity dates for Agency obligations
would range between one and five years.
46
FASB guidance requires the Company to designate
its securities as held to maturity, available for sale or trading depending on the
Company’s intent regarding its investments at the time of purchase. The
Company does not currently maintain a portfolio of trading securities. As of
December 31, 2009, $2.33 billion, or 90.6% of the portfolio, was classified as available
for sale and $240.8 million of the portfolio was classified as held to maturity.
The Company believes that the high concentration of securities available for sale
allows flexibility in the day-to-day management of the overall investment portfolio,
consistent with the objectives of optimizing profitability and mitigating interest
rate risk. Securities available for sale are carried at estimated fair value. Additional
information about fair value measurements can be found in Note 3 of the Notes
to Consolidated Financial Statements.
During the second quarter of 2009 new other-than-temporary
impairment (“OTTI”) guidance, FASB ASC 320-10, Recognition and
Presentation of Other-Than-Temporary Impairments, was adopted and, for debt securities,
requires that credit related OTTI be recognized in earnings while non-credit
related OTTI be recognized in other comprehensive income (“OCI”) unless
there is intent to sell or are required to sell. The new guidance also requires
that previously recorded impairment charges that do not relate to a credit loss
be reclassified from retained earnings to accumulated other comprehensive income
(“AOCI”). Therefore, during the quarter ended June 30, 2009, the Company
reclassified the non-credit related portion of a previously recorded OTTI loss,
as described below. Also during 2009, the Company recorded current OTTI losses
on two securities in accordance with this new guidance, both of which are described
below.
During 2008, one of the “individual name” trust preferred securities
was deemed to be other-than-temporarily impaired and a charge of $1.6 million
was recorded in the third quarter. Upon the adoption of the OTTI guidance discussed
above, the Company recorded a cumulative effect adjustment that increased retained
earnings and decreased AOCI by $1.6 million, or $1.0 million, net of tax.
A credit
related OTTI loss in the amount of $816,000 was recorded against the Company’s
position in an adjustable rate mortgage mutual fund that holds positions in non-agency
mortgage-backed securities. During the second quarter of 2009, the fund experienced
its first realized loss on a mortgage investment and management determined that
the dollar amount of securities carrying a rating of CCC or lower had increased.
This decrease in the credit quality of the securities coupled with the loss recognized
by the fund, resulted in management’s determination that the fund was other-than-temporarily
impaired and a credit impairment of $626,000 was recorded. The credit-related
impairment was determined by applying the midpoint of the estimated default rates
of CCC, CC and C rated securities to the investments in the portfolio and adjusting
the par value downward by these estimated losses. A white paper written by one
of the rating agencies outlining estimated default ranges on residential private
mortgage-backed securities based upon credit rating was utilized by the Company
for its analysis. The non-credit related OTTI was $1.9 million, or $1.2 million, net of tax, and was recognized
in OCI. In December 2009, an additional credit impairment was recorded in the
amount of $190,000 and was determined using the same methodology. As of December
31, 2009, the fund has a current book value of $8.1 million. There is no intent
to sell nor is it more likely than not that the Company will be required to sell
these securities.
A credit related OTTI loss in the amount of $581,000 was recorded
on a pooled trust preferred security in December 2009 based on cash flow analyses.
The Company received nine cash flow scenarios from the underwriter which were utilized
by management to analyze this security for potential OTTI. The nine scenarios
covered various default rates, recovery rates and prepayment options over different
time periods. Two of the nine cash flow analyses indicated impairment over the life
of the security. The driver of the indicated impairment was the recovery rate,
which was modeled at 0% in these two cash flow scenarios. As the severity of the
estimated loss in these two cash flow scenarios doubled since the prior OTTI
analysis in the third quarter of 2009 and due to the fact that the past history
of the security indicates that there have not been any recoveries to date from securities
that have defaulted, the Company recorded a credit-related impairment charge.
The credit impairment represents the average loss of the two negative cash flow
analyses. The non-credit related impairment of $1.2 million, or $748,000, net of tax, was recognized in OCI.
After the write-down, the cost basis of the security was $1.4 million at December
31, 2009. There is no intent to sell nor is it more likely than not that the Company
will be required to sell this security.
The net unrealized gain on securities
classified as available for sale as of December 31, 2009 was $45.8 million compared
to an unrealized gain of $2.1 million as of December 31, 2008. The appreciation
in the market value of securities available for sale was primarily due to the
increase in the fair value of mortgage-backed securities and the unrealized gains
on the mortgage backed securities purchased during the year, partially offset
by gains on securities sold. The net unrealized gain on the available for sale
investment portfolio, that is primarily within the mortgage-backed securities, is partially
offset by unrealized losses on trust preferred equity securities and privately
issued mortgage-backed securities. The changes in unrealized gains and losses on
the investment portfolio are primarily due to credit spreads, liquidity and fluctuations
in market interest rates during the period.
The net unrealized gain on mortgage-backed
securities is primarily from agency mortgage-backed securities issued by FNMA and
FHLMC, partially offset by unrealized losses on mortgage-backed securities issued
by private institutions. The unrealized gain on agency mortgage-backed securities
is due to the general decline in interest rates and the tightening in mortgage-backed
security spreads. Spreads have tightened in part due to programs initiated by
the Federal Reserve to purchase the direct obligations of housing-related
47
GSE’s, Fannie Mae, Freddie Mac, and the FHLB’s, and mortgage-backed securities
issued by Fannie Mae, Freddie Mac, and Ginnie Mae. The goal of these purchases
has been to maintain lower long-term fixed mortgage rates to stimulate the housing
market and improve the overall conditions in private credit markets. These programs
consist of the FRB purchasing a total of $1.25 trillion of agency mortgage-backed
securities and up to $175 billion of agency debt.
The unrealized loss on mortgage-backed
securities primarily relates to securities issued by private institutions and is
primarily concentrated in one BBB rated private-label mortgage-backed security
which is substantially paid down, well seasoned and of an earlier vintage that
has not been significantly affected by high delinquency levels or vulnerable to
lower collateral coverage as seen in later issued pools. Widening in non-agency
mortgage spreads is the primary factor for the unrealized losses reported on private
label mortgage-backed securities. None of the securities are backed by subprime
mortgage loans and none have suffered losses. One of the private issue securities
was downgraded to BBB during the third quarter of 2009 and the remaining securities
are rated AAA. All are still paying principal and interest and are expected to
continue to pay their contractual cash flows. The Company does not have any
commercial mortgage-backed securities. Management’s review of the above factors
and issuer specific data concluded that these private-label mortgage-backed securities
are not other-than-temporarily impaired.
The unrealized losses on other bonds
and obligations primarily relates to the non-credit related OTTI loss on a position
in an adjustable rate mortgage mutual fund that holds positions in non-agency
mortgage-backed securities that are facing negative mark to market pressures
due to widening spreads in non-agency mortgage products. Although the fund has experienced
declines in credit ratings since the beginning of the year, it was not due to
customer redemptions or forced selling of the investments. The fund recorded
its first loss which factored into management’s determination that the fund
was other-than-temporarily impaired. As discussed above, a credit related OTTI
loss of $816,000 was recorded through earnings during the year ended December 31,
2009. The fund carries a market value to book value ratio of 81.21%, a weighted
average underlying investment credit rating of A+ and it continues to pay normal
monthly dividends. There is no intent to sell nor is it more likely than not that
the Company will be required to sell these securities.
The unrealized losses
on auction rate certificates relate to certificates issued by an investment banking
firm and are pools of government-guaranteed student loans that are issued by
state student loan departments. In the first half of 2008, the auction process for
auction rate certificates began to freeze resulting from the problems in the
credit markets. These securities are currently rated AAA and are still paying
their contractual cash flows and are expected to continue to pay their contractual
cash flows. Management has concluded that no other-than-temporary impairment
exists as of December 31, 2009. There is no intent to sell nor is it more likely
than not that the Company will be required to sell these securities. In 2008,
the underwriter entered into a settlement agreement with several state regulatory
agencies, whereby they have agreed to repurchase these certificates from both their
retail and institutional customers at par. The institutional buy-back of these
securities is scheduled on or around June 30, 2010.
Trust preferred securities
are comprised of two pooled trust preferreds with an amortized cost of $6.1 million,
one of which is rated BB and the other is rated BBB-. The remaining $42.6 million
are comprised of twelve “individual names” issues with the following
ratings: $6.0 million rated A to A-, $14.5 million rated BBB+ and $22.1 million rated
BB to BB+. Except for the BB rated pooled trust preferred security, the unrealized
losses reported for trust preferred equity securities relate to the financial and
liquidity stresses in the fixed income markets. Although the ratings on some
issues have been reduced since December 31, 2008, all are currently paying the
contractual principal and interest payments. A detailed review of the two pooled
trust preferreds and the “individual names” trust preferred equity
securities was completed which included an analysis of collateral reports, cash
flows, stress default levels and financial ratios of the underlying issuers.
As discussed above, a credit related OTTI loss of $581,000 was recorded through
earnings during the year ended December 31, 2009 on one of the pooled trust preferred securities.
Management has performed a review of all investments with unrealized losses and
determined that no other investments had credit related other-than-temporary
impairment. The Company has no intent to sell nor is it more likely than not that
the Company will be required to sell any of these securities within the time
necessary to recover the unrealized losses which may be until maturity. The
Company does not plan on investing in securities backed by subprime mortgage collateral.
The following table sets forth certain information regarding the carrying value,
weighted average yield and contractual maturities of the Company’s investment
portfolio as of December 31, 2009. In the case of mortgage-backed securities, the
table shows the securities by their contractual maturities; however, there are
scheduled principal payments and there will be unscheduled prepayments prior to
their contractual maturity. Income on obligations of states and political subdivisions
are taxable and no yield adjustment for dividend receivable deduction is made
because it is not material.
48
Table 7: Investment Maturities Schedule
| One year or less | Over one year through five years |
Over five years through ten years |
Over ten years | Total | |||||||||||||||||||||||||||||||||
| Weighted | Weighted | Weighted | Weighted | Weighted | |||||||||||||||||||||||||||||||||
| Amortized | average | Amortized | average | Amortized | average | Amortized | average | Amortized | average | ||||||||||||||||||||||||||||
| (Dollars in thousands) | cost | yield | cost | yield | cost | yield | cost | yield | cost | yield | |||||||||||||||||||||||||||
| Available for sale | |||||||||||||||||||||||||||||||||||||
U.S. Treasury obligations |
$ | 597 | 0.29 | % | $ | - | - | % | $ | - | - | % | $ | - | - | % | $ | 597 | 0.29 | % | |||||||||||||||||
U.S. Government sponsored enterprise obligations |
44,404 | 3.07 | 96,379 | 2.26 | 55,273 | 3.95 | 2,636 | 3.15 | 198,692 | 2.91 | |||||||||||||||||||||||||||
Corporate obligations |
- | - | 8,139 | 5.09 | - | - | - | - | 8,139 | 5.09 | |||||||||||||||||||||||||||
Other bonds and obligations |
1,590 | 3.64 | 2,690 | 4.93 | 2,269 | 5.82 | 8,076 | 3.04 | 14,625 | 3.88 | |||||||||||||||||||||||||||
Auction rate certificates |
27,550 | 1.47 | - | - | - | - | - | - | 27,550 | 1.47 | |||||||||||||||||||||||||||
Marketable equity securities |
8,567 | 0.72 | - | - | - | - | - | - | 8,567 | 0.72 | |||||||||||||||||||||||||||
Trust preferred equity securities |
- | - | - | - | - | - | 48,754 | 1.49 | 48,754 | 1.49 | |||||||||||||||||||||||||||
Private label residential mortgage backed securities |
- | - | - | - | - | - | 23,871 | 4.15 | 23,871 | 4.15 | |||||||||||||||||||||||||||
Residential mortgage-backed securities |
- | - | 65 | 3.60 | - | - | 1,951,232 | 4.46 | 1,951,297 | 4.46 | |||||||||||||||||||||||||||
Total available for sale |
82,708 | 2.28 | 107,273 | 2.54 | 57,542 | 4.02 | 2,034,569 | 4.37 | 2,282,092 | 4.20 | |||||||||||||||||||||||||||
| Held to maturity | |||||||||||||||||||||||||||||||||||||
Residential mortgage-backed securities |
- | - | - | - | 54,132 | 5.66 | 176,464 | 5.00 | 230,596 | 5.16 | |||||||||||||||||||||||||||
Other bonds |
1,780 | 4.56 | 6,840 | 4.66 | 550 | 5.55 | 1,000 | 5.15 | 10,170 | 4.74 | |||||||||||||||||||||||||||
Total held to maturity |
1,780 | 4.56 | 6,840 | 4.66 | 54,682 | 5.66 | 177,464 | 5.00 | 240,766 | 5.15 | |||||||||||||||||||||||||||
Total securities |
$ | 84,488 | 2.33 | % | $ | 114,113 | 2.67 | % | $ | 112,224 | 4.82 | % | $ | 2,212,033 | 4.42 | % | $ | 2,522,858 | 4.29 | % | |||||||||||||||||
49
Lending Activities
The Company originates residential real estate loans secured by one- to four-family
residences, commercial real estate loans, residential and commercial construction
loans, commercial loans, multi-family loans, home equity lines of credit and fixed
rate loans and other consumer loans throughout the States of Connecticut and Massachusetts.
Additionally, within the residential real estate loan category are loans with property
locations spread throughout the United States, as a result of the Company’s
residential real estate loan purchase program.
The following table summarizes the composition
of the Company’s total loan portfolio as of the dates presented:
Table
8: Loan Portfolio Analysis
| December 31, 2009 | December 31, 2008 | December 31, 2007 | December 31, 2006 | December 31, 2005 | ||||||||||||||||||||||||||||||||||||
| Percent | Percent | Percent | Percent | Percent | ||||||||||||||||||||||||||||||||||||
| (Dollars in thousands) | Amount | of Total | Amount | of Total | Amount | of Total | Amount | of Total | Amount | of Total | ||||||||||||||||||||||||||||||
| Residential real estate | $ | 2,382,514 | 50.0 | % | $ | 2,524,638 | 50.9 | % | $ | 2,360,921 | 49.9 | % | $ | 1,916,551 | 50.1 | % | $ | 1,638,409 | 50.0 | % | ||||||||||||||||||||
| Residential real estate construction | 13,789 | 0.3 | 21,380 | 0.4 | 29,023 | 0.6 | 8,097 | 0.2 | 12,118 | 0.4 | ||||||||||||||||||||||||||||||
Total residential real estate |
2,396,303 | 50.3 | 2,546,018 | 51.3 | 2,389,944 | 50.5 | 1,924,648 | 50.3 | 1,650,527 | 50.4 | ||||||||||||||||||||||||||||||
| Commercial real estate | 1,100,880 | 23.1 | 1,077,200 | 21.7 | 947,185 | 20.1 | 785,811 | 20.5 | 670,719 | 20.4 | ||||||||||||||||||||||||||||||
| Commercial real estate construction | 132,370 | 2.8 | 143,610 | 2.9 | 247,428 | 5.2 | 174,813 | 4.6 | 97,863 | 3.0 | ||||||||||||||||||||||||||||||
Total commercial real estate |
1,233,250 | 25.9 | 1,220,810 | 24.6 | 1,194,613 | 25.3 | 960,624 | 25.1 | 768,582 | 23.4 | ||||||||||||||||||||||||||||||
| Commercial business | 411,211 | 8.6 | 458,952 | 9.2 | 457,745 | 9.7 | 350,507 | 9.2 | 314,562 | 9.6 | ||||||||||||||||||||||||||||||
| Home equity and equity lines of credit | 705,673 | 14.9 | 714,444 | 14.4 | 652,107 | 13.8 | 570,493 | 14.9 | 520,290 | 15.9 | ||||||||||||||||||||||||||||||
| Other consumer | 15,608 | 0.3 | 22,561 | 0.5 | 33,560 | 0.7 | 16,604 | 0.4 | 22,745 | 0.7 | ||||||||||||||||||||||||||||||
Total consumer loans |
721,281 | 15.2 | 737,005 | 14.9 | 685,667 | 14.5 | 587,097 | 15.4 | 543,035 | 16.6 | ||||||||||||||||||||||||||||||
Total loans |
4,762,045 | 100.0 | % | 4,962,785 | 100.0 | % | 4,727,969 | 100.0 | % | 3,822,876 | 100.0 | % | 3,276,706 | 100.0 | % | |||||||||||||||||||||||||
| Allowance for loan losses | (52,463 | ) | (49,911 | ) | (43,813 | ) | (37,408 | ) | (35,552 | ) | ||||||||||||||||||||||||||||||
Loans, net |
$ | 4,709,582 | $ | 4,912,874 | $ | 4,684,156 | $ | 3,785,468 | $ | 3,241,154 | ||||||||||||||||||||||||||||||
50
As shown in Table 8, gross loans were $4.76
billion, down $200.7 million, at December 31, 2009 from year-end 2008. The Company
experienced a decrease in most loan categories due to higher levels of residential
mortgage prepayments and reduced business and consumer loan demand.
Residential
real estate loans continue to represent the largest segment of the Company’s
loan portfolio as of December 31, 2009, comprising over fifty percent of total loans.
The decrease of $149.7 million from December 31, 2008 was primarily due to prepayments
outweighing new originations for the portfolio during the year. This is attributable
to the decline in interest rates to historically low levels resulting in customer
refinancing to lock-in fixed rate mortgages. Although the Company had record originations
of both adjustable and fixed rate mortgages of $1.04 billion during the year, approximately
$567.7 million was originated for portfolio and the remainder was sold in the secondary
market. The Company currently sells the majority of all originated fixed rate residential
real estate loans with terms of 15 years or more. During the third quarter of 2009,
the Company began to retain in its portfolio 30 year jumbo fixed rate residential
mortgage originations and for 2009 these originations totaled approximately $7.4
million. The Company anticipates that mortgage origination activity will continue
to be robust while interest rates remain low, but likely not at the 2009 levels.
The residential real estate loan portfolio has a weighted average FICO score of
748 and a current estimated weighted loan to value ratio of 59%. Included in residential
real estate is a purchased portfolio, which is made up of prime loans individually
re-underwritten by the Company to our underwriting criteria, and includes adjustable-rate
and 10 and 15 year fixed-rate residential real estate loans with property locations
throughout the United States with no significant exposure in any particular state.
At December 31, 2009 the Company’s purchased portfolio had an outstanding balance
of approximately $498.7 million with the largest concentration in our footprint
of Connecticut and Massachusetts at 18.7%, followed by California and New York,
which each make up approximately 13.5%. NewAlliance plans on resuming purchases
when loan pools are available that meet its criteria.
Commercial real estate
loans increased $12.4 million and commercial business loans decreased $47.7 million
from December 31, 2008. In general, loan growth has slowed due to current economic
conditions. Originations, especially during the first half of 2009, were dominated
by financing requests from current customers and less from new customers. This was
due, in part, to fewer opportunities that met our underwriting and credit quality
standards. More opportunities are emerging in the form of refinances away from larger
national banks as they have been internally focused or are targeting an up market
customer base. This has led mid-sized businesses to look to regional community banks
for relationship banking and personalized lending services.
The commercial construction
portfolio of $132.4 million includes approximately $29.3 million of loans to commercial
borrowers for residential housing development, $11.5 million of which are for condominium
projects. The decrease in commercial construction of $11.2 million is due to a decrease
in residential housing development loans through a negotiated settlement, paydowns
and further charge-offs on nonperforming condominium projects, partly offset by
originations of commercial construction to permanent loans.
Although the Company’s commercial portfolios have declined, our long term strategy continues to
be that of building a larger percentage of the Company’s assets in commercial
loans including real estate and other business loans. In the fourth quarter of 2009,
the Company formed an asset-based lending business. Asset-based lending expands
the Bank’s business lending offerings to include revolving lines of credit
and term loans secured by accounts receivable, inventory, and other assets. An asset-based
loan is collateralized with a customer’s balance sheet assets, which are considered
the primary source of loan repayment. This type of financing is particularly attractive
to start-up and growth companies, as well as those in restructuring, turn-around,
or other financially distressed situations that result in the inability to secure
traditional commercial lending. We remain an active commercial lender and will continue
promoting strong business development efforts to obtain new business banking relationships,
while maintaining strong credit quality and profitability. We believe that our status
as a healthy regional community bank focused on relationship banking bodes well
for us to retain customers and to be a source for new businesses.
Home equity loans
and lines of credit decreased $8.8 million from December 31, 2008 to December 31,
2009. The Company continues to offer competitive pricing and is committed to growing
this loan segment while maintaining credit quality. However, as a result of the
interest rate environment during 2009, consumer demand shifted to residential mortgages
and away from home equity products, attributing to the year over year decline in
the portfolio. The weighted average FICO score and current estimated weighted combined
loan to value ratio for home equity loans and lines of credit is 748 and 65%, respectively.
Lending has been from organic originations in the Company’s market area, none
of which is subprime.
51
Selected Loan Maturities
The following table shows the contractual maturity of the Company’s construction and commercial business loan portfolios at December 31, 2009.
Table 9: Contractual Maturities and Interest Rate Sensitivity of Selected Loan Categories
| Real Estate | Commercial | ||||||||||
| (In thousands) | Construction | Business | Total | ||||||||
| Amounts due | |||||||||||
One year or less |
$ | 118,447 | $ | 159,377 | $ | 277,824 | |||||
Over one year through five years |
27,712 | 152,626 | 180,338 | ||||||||
Over five years |
- | 99,208 | 99,208 | ||||||||
Total |
$ | 146,159 | $ | 411,211 | $ | 557,370 | |||||
| Interest rate terms on amounts due after one year | |||||||||||
Fixed |
$ | 1,072 | $ | 145,137 | $ | 146,209 | |||||
Adjustable |
26,640 | 106,697 | 133,337 | ||||||||
Total |
$ | 27,712 | $ | 251,834 | $ | 279,546 | |||||
Higher-Risk Loans
The loan portfolio segments that we consider to have the highest risk are
construction loans to commercial developers for residential development and a small
segment of our residential real estate loans, $11.5 million of which are for condominium
projects. The Company has a carrying value of $29.3 million of commercial construction
loans for residential development. All of these loans are collateralized and carry
a reserve allocation of approximately $3.8 million. This segment has total delinquencies
of $2.5 million, all of which are in the over 90 day category.
Within the residential
portfolio, management uses two main early warning techniques to more closely monitor
credit deterioration. The Company uses a matrix to identify where the concentration
of outstanding loans fall in the risk continuum. This matrix is constructed using
estimated current loan-to-value ranges (current balance LTV adjusted for estimated
appreciation or depreciation in the appraised value) and the latest available FICO
score ranges (rescored quarterly). The Company considers loans with an estimated
current loan-to-value ratio above 80% and a FICO score less than 620 to be higher-risk.
Once identified, the higher-risk loans are then reviewed by the Special Assets department
to determine what, if any, action should be taken to mitigate possible loss exposure.
At December 31, 2009, higher-risk loans comprised approximately $41.0 million, or
1.7% of the residential real estate portfolio. The Company also tracks loans that
have a FICO score that has declined 20 points or more and are below 660. As of December
31, 2009 loans meeting this criteria represent approximately $60.0 million, or 2.5%
of the residential portfolio.
The estimated current LTV is determined using several
methods including the Case-Schiller composite home price index, the National Association
of Realtors quarterly report on MSA-level house price averages, and an automated
valuation random sampling across vintages and regions. Updated appraisals are generally
obtained at 90 days past due or at any point management determines that full repayment
of the loan is unlikely.
Asset Quality
Loans are
placed on nonaccrual if collection of principal or interest in full is in doubt,
if the loan has been restructured, or if any payment of principal or interest is
past due 90 days or more. A loan may be returned to accrual status if it has demonstrated
sustained contractual performance or if all principal and interest amounts contractually
due are reasonably assured of repayment within a reasonable period.
As displayed
in Table 10, nonperforming assets at December 31, 2009 increased to $54.2 million
compared to $40.4 million at December 31, 2008. The increase is primarily due to
loans secured by residential one-to-four family loans and commercial business loans,
partially offset by a decline in commercial real estate and commercial construction
loans.
The increase in nonperforming residential loans of $18.5 million was due
to current economic conditions including factors such as the rise in unemployment
rates reaching a twenty-six year high and the continued softness in the real estate
market. The residential nonperforming category totaled $31.1 million, representing
1.30% of the total residential portfolio, just over half of which have property
locations in Connecticut and Massachusetts. The Company routinely updates FICO scores
and LTV ratios and continues to
52
originate loans with superior credit characteristics.
Through continued heightened account monitoring, collections and workout efforts,
the Bank is committed to mortgage solution programs to assist homeowners to remain
in their homes. As has been its practice historically, the Company does not originate
subprime loans. There are approximately $3.3 million in restructured loans which
have been modified from their original contractual terms and are included in nonperforming
residential loans.
In the course of resolving nonperforming loans, the Bank may
choose to restructure the contractual terms of certain real estate loans. Contractual
terms may be modified to fit the ability of the borrower to repay in line with their
current financial status which may be a reduction in interest rate to market rate
or below, a change in the term, movement of the past due amounts to the back end
of the loan or refinance. Loans are placed on nonaccrual status upon being restructured,
even if they were not previously. The Bank’s policy to restore a loan to performing
status includes the receipt of regular payments, generally for period of six months.
The increase in nonperforming commercial business loans was primarily due to
the general deterioration of economic conditions that have led to the inability
of some businesses to properly service their debt.
The decline in nonperforming
commercial real estate and commercial construction loans primarily relates to charge-offs
recorded against a number of loans, note sales and pay-downs, the majority of which
were condominium projects within the residential housing development segment. As
of December 31, 2009, the construction to permanent segment of commercial construction
loans had no delinquencies or nonaccruals.
Activity in the housing sector has
increased over recent months and household spending appears to be expanding but
remains constrained by ongoing job losses, sluggish income growth, lower housing
wealth, and tight credit. If unfavorable economic and real estate market conditions
persist or deteriorate further, there will be added stress on our loan portfolios.
The Company believes, however, that its historical practice of prudent underwriting,
the relatively modest size of its residential construction portfolio and strong
average FICO scores combined with low weighted average loan to value ratios associated
with its residential portfolio are significant advantages in keeping asset quality
manageable. Nonperforming loans as a percent of total loans outstanding at December
31, 2009 were 1.06%, compared to 0.77% at December 31, 2008.
Table 10: Nonperforming Assets
| At December 31, | |||||||||||||||||||||
| (Dollars in thousands) | 2009 | 2008 | 2007 | 2006 | 2005 | ||||||||||||||||
| Nonperforming loans (1) | |||||||||||||||||||||
Real estate loans |
|||||||||||||||||||||
Residential (one- to four- family) |
$ | 31,140 | $ | 12,634 | $ | 4,837 | $ | 1,716 | $ | 1,808 | |||||||||||
Commercial real estate |
6,136 | 8,201 | 3,414 | 2,815 | 830 | ||||||||||||||||
Commercial construction |
2,459 | 10,234 | 2,382 | 4,091 | 2,059 | ||||||||||||||||
Total real estate loans |
39,735 | 31,069 | 10,633 | 8,622 | 4,697 | ||||||||||||||||
Commercial business |
8,497 | 5,863 | 4,912 | 3,337 | 2,446 | ||||||||||||||||
Consumer loans |
|||||||||||||||||||||
Home equity and equity lines of credit |
2,187 | 1,304 | 606 | 467 | 29 | ||||||||||||||||
Other consumer |
88 | 95 | 235 | 42 | 219 | ||||||||||||||||
Total consumer |
2,275 | 1,399 | 841 | 509 | 248 | ||||||||||||||||
| Total nonperforming loans | 50,507 | 38,331 | 16,386 | 12,468 | 7,391 | ||||||||||||||||
| Real estate owned | 3,705 | 2,023 | 897 | - | - | ||||||||||||||||
| Total nonperforming assets | $ | 54,212 | $ | 40,354 | $ | 17,283 | $ | 12,468 | $ | 7,391 | |||||||||||
| Allowance for loan losses as a percent of total loans (2) | 1.10 | % | 1.01 | % | 0.93 | % | 0.98 | % | 1.08 | % | |||||||||||
| Allowance for loan losses as a percent of nonperforming loans | 103.87 | % | 130.21 | % | 267.38 | % | 300.03 | % | 481.02 | % | |||||||||||
| Nonperforming loans as a percent of total loans (2) | 1.06 | % | 0.77 | % | 0.35 | % | 0.33 | % | 0.23 | % | |||||||||||
| Nonperforming assets as a percent of total assets | 0.64 | % | 0.49 | % | 0.21 | % | 0.17 | % | 0.11 | % | |||||||||||
| Troubled debt restructured loans included in nonaccruing loans above | $ | 3,294 | $ | - | $ | - | $ | - | $ | - | |||||||||||
| (1) | Nonperforming loans include all loans 90 days or more past due, restructured loans due to a weakening in the financial condition of the borrower and other loans for which have been identified by the Company as presenting uncertainty with respect to the collectability of principal or interest. All of the Company’s non-performing loans do not accrue interest. | |
| (2) | Total loans are stated at their principal amounts outstanding, net of deferred loan fees and costs and net unamortized premium on acquired loans. |
53
The following tables set forth delinquencies for 30–89 days and 90 days or more in the Company’s loan portfolio as of the dates indicated:
Table 11: Selected Loan Delinquencies
| At December 31, | ||||||||||||||||||||||
| 2009 | 2008 | 2007 | ||||||||||||||||||||
| 30-89 Days | 30-89 Days | 30-89 Days | ||||||||||||||||||||
| Number | Principal | Number | Principal | Number | Principal | |||||||||||||||||
| of | Balance | of | Balance | of | Balance | |||||||||||||||||
| (Dollars in thousands) | Loans | of Loans | Loans | of Loans | Loans | of Loans | ||||||||||||||||
| Real estate loans | ||||||||||||||||||||||
Residential |
76 | $ | 15,924 | 70 | $ | 12,913 | 55 | $ | 6,837 | |||||||||||||
Commercial |
5 | 1,181 | 7 | 2,993 | 11 | 2,406 | ||||||||||||||||
Commercial construction |
1 | 1,309 | - | - | - | - | ||||||||||||||||
Total real estate loans |
82 | 18,414 | 77 | 15,906 | 66 | 9,243 | ||||||||||||||||
| Commercial business | 23 | 1,167 | 32 | 3,203 | 38 | 1,448 | ||||||||||||||||
| Consumer | ||||||||||||||||||||||
Home equity |
48 | 2,679 | 49 | 2,885 | 32 | 2,160 | ||||||||||||||||
Other consumer |
94 | 460 | 61 | 489 | 92 | 578 | ||||||||||||||||
Total consumer |
142 | 3,139 | 110 | 3,374 | 124 | 2,738 | ||||||||||||||||
Total |
247 | $ | 22,720 | 219 | $ | 22,483 | 228 | $ | 13,429 | |||||||||||||
| Delinquent loans to total loans (1) | 0.48 | % | 0.45 | % | 0.28 | % | ||||||||||||||||
| At December 31, | ||||||||||||||||||||||
| 2009 | 2008 | 2007 | ||||||||||||||||||||
| 90 Days or More | 90 Days or More | 90 Days or More | ||||||||||||||||||||
| Number | Principal | Number | Principal | Number | Principal | |||||||||||||||||
| of | Balance | of | Balance | of | Balance | |||||||||||||||||
| (Dollars in thousands) | Loans | of Loans | Loans | of Loans | Loans | of Loans | ||||||||||||||||
| Real estate loans | ||||||||||||||||||||||
Residential |
168 | $ | 31,140 | 63 | $ | 12,634 | 30 | $ | 4,837 | |||||||||||||
Commercial |
17 | 6,136 | 7 | 8,201 | 9 | 3,414 | ||||||||||||||||
Commercial construction |
5 | 2,459 | 10 | 10,234 | 3 | 2,382 | ||||||||||||||||
Total real estate loans |
190 | 39,735 | 80 | 31,069 | 42 | 10,633 | ||||||||||||||||
| Commercial business | 73 | 8,497 | 46 | 5,863 | 46 | 4,912 | ||||||||||||||||
| Consumer | ||||||||||||||||||||||
Home equity |
38 | 2,187 | 22 | 1,304 | 8 | 606 | ||||||||||||||||
Other consumer |
11 | 88 | 20 | 95 | 33 | 235 | ||||||||||||||||
Total consumer |
49 | 2,275 | 42 | 1,399 | 41 | 841 | ||||||||||||||||
Total |
312 | $ | 50,507 | 168 | $ | 38,331 | 129 | $ | 16,386 | |||||||||||||
| Delinquent loans to total loans (1) | 1.06 | % | 0.77 | % | 0.35 | % | ||||||||||||||||
| (1) | The table
of delinquencies does not include guaranteed U.S. Government Certificates totaling
$3.2 million, of which $2.8 million is 30 – 89 days delinquent and $477,000
is delinquent 90 days or more and non-accruing at December 31, 2009. The delinquent
loans to total loans ratio, including these loans would be 0.54% and 1.07%, for
the 30 – 89 days and 90 days or more categories, respectively, at December 31, 2009. |
Other Real Estate Owned
The Company classifies property acquired through foreclosure or acceptance
of a deed-in-lieu of foreclosure as other real estate owned in its financial statements.
When a property is placed in other real estate owned, the excess of the loan balance
over the estimated fair market value of the collateral, based on a recent appraisal,
is charged to the allowance for loan losses. Estimated fair value usually represents
the sales price a buyer would be willing to pay on the basis of current market conditions,
including normal loan terms from other financial institutions, less the estimated
costs to sell the property. Management inspects all other real estate owned properties
periodically. Subsequent writedowns in the carrying value of other real estate owned
are charged to expense if the carrying value exceeds the estimated fair value. At
December 31, 2009, the Company had $3.7 million in other real estate owned. Due
to current market conditions the Company does expect foreclosure activity to increase
moderately in 2010.
54
Classification of Assets and
Loan Review
An internal risk rating system is used to monitor
and evaluate the credit risk inherent in the commercial, commercial real estate
and commercial construction loan portfolios. Under our internal risk rating system,
we currently identify criticized loans as “special mention,” “substandard,” “doubtful” or
“loss”. On a quarterly basis, a Criticized
Asset Committee composed of senior officers meet to review Criticized Asset Reports
on commercial, commercial real estate and commercial construction loans that are
risk rated special mention, substandard, or doubtful. The reports and the committee
focus on the current status, strategy, financial data, and appropriate risk rating
of the criticized loan. The internal risk ratings are subject to change based on
the committee’s review and approval. In addition to the internal review, semi-annually,
the Bank engages a third party to conduct a review of the commercial, commercial
real estate and commercial construction loan portfolios. The primary purpose of
the third party review is to evaluate the loan portfolio with respect to the risk
rating profiles. Differences between the third party review and the internal risk
ratings are discussed and rating classifications are adjusted accordingly.
At
December 31, 2009, loans classified as substandard (both accruing and nonaccruing)
totaled $75.5 million, and consisted of $32.1 million in commercial real estate
loans, $22.3 million in construction lines and $21.1 million in commercial loans.
Included in loans classified as substandard are $13.8 million of loans that are
considered impaired and carry a specific reserve of $1.5 million. Impaired loans
are measured based on either collateral values supported by appraisals, observed
market prices or where potential losses have been identified and reserved accordingly.
Special mention loans totaled $148.7 million, and consisted of $88.7 million of
commercial real estate loans, $16.7 million in construction lines and $43.3 million
of commercial loans. There were no loans classified as doubtful at December 31,
2009.
At December 31, 2008, loans classified as substandard (both accruing and
nonaccruing) totaled $52.7 million, and consisted of $18.8 million in commercial
real estate loans, $21.2 million in construction lines and $12.7 million in commercial
loans. Special mention loans totaled $93.4 million, and consisted of $61.6 million
of commercial real estate loans, $4.9 million in construction lines and $26.9 million
of commercial loans. There were no loans classified as doubtful at December 31,
2008.
Allowance For Loan Losses
The Board of Directors
and management of the Company are committed to the establishment and maintenance
of an adequate allowance for loan losses, determined in accordance with GAAP. Our
approach is to follow the most recent guidelines that have been provided by our
regulators. Management believes that the methodology it employs to develop, monitor
and support the allowance for loan losses is consistent with those guidelines.
While management believes that it has established adequate specific and general allowances
for probable losses on loans, there can be no assurance that the regulators, in
reviewing the Company’s loan portfolio, will not request an increase in the
allowance for losses, thereby negatively affecting the Company’s financial
condition and earnings. Moreover, actual losses may be dependent upon future events
and, as such, further additions to the allowance for loan losses may become necessary.
The allowance for loan losses is established through provisions for loan losses
based on management’s on-going evaluation of the risks inherent in the Company’s loan portfolio. Charge-offs against the allowance for loan losses are taken
on loans when it is determined that the collection of loan principal is unlikely.
Recoveries made on loans that have been charged-off are credited to the allowance
for loan losses.
55
The following table sets forth activity
in the Company’s allowance for loan losses for the periods indicated:
Table 12: Schedule of Allowance for Loan Losses
| At or For the Year Ended December 31, | ||||||||||||||||||||
| (Dollars in thousands) | 2009 | 2008 | 2007 | 2006 | 2005 | |||||||||||||||
| Balance at beginning of period | $ | 49,911 | $ | 43,813 | $ | 37,408 | $ | 35,552 | $ | 36,163 | ||||||||||
| Net allowances gained through acquisition | - | - | 3,894 | 2,224 | - | |||||||||||||||
| Provision for loan losses | 18,000 | 13,400 | 4,900 | 500 | 400 | |||||||||||||||
| Charge-offs | ||||||||||||||||||||
Residential real estate loans |
3,368 | 611 | 47 | - | - | |||||||||||||||
Commercial real estate loans |
3,101 | 926 | 840 | 345 | 12 | |||||||||||||||
Commercial construction |
3,102 | 4,213 | 285 | 64 | - | |||||||||||||||
Commercial business loans |
6,547 | 1,973 | 2,267 | 2,552 | 3,347 | |||||||||||||||
Consumer loans |
1,156 | 1,090 | 786 | 481 | 286 | |||||||||||||||
Total charge-offs |
17,274 | 8,813 | 4,225 | 3,442 | 3,645 | |||||||||||||||
| Recoveries | ||||||||||||||||||||
Residential real estate loans |
175 | 13 | 278 | 179 | 219 | |||||||||||||||
Commerical real estate loans |
560 | 275 | 353 | 46 | 271 | |||||||||||||||
Commerical construction |
- | - | 11 | 250 | - | |||||||||||||||
Commercial business loans |
859 | 1,090 | 948 | 1,975 | 1,987 | |||||||||||||||
Consumer loans |
232 | 133 | 246 | 124 | 157 | |||||||||||||||
Total recoveries |
1,826 | 1,511 | 1,836 | 2,574 | 2,634 | |||||||||||||||
| Net charge-offs | 15,448 | 7,302 | 2,389 | 868 | 1,011 | |||||||||||||||
| Balance at end of period | $ | 52,463 | $ | 49,911 | $ | 43,813 | $ | 37,408 | $ | 35,552 | ||||||||||
| Ratios | ||||||||||||||||||||
Net loan charge-offs to average loans |
0.32 | % | 0.15 | % | 0.05 | % | 0.02 | % | 0.03 | % | ||||||||||
Allowance for loan losses to total loans |
1.10 | 1.01 | 0.93 | 0.98 | 1.08 | |||||||||||||||
Allowance for loan losses to nonperforming loans |
103.87 | 130.21 | 267.38 | 300.03 | 481.02 | |||||||||||||||
Net charged-off to allowance for loan losses |
29.45 | 14.63 | 5.45 | 2.32 | 2.84 | |||||||||||||||
Total recoveries to charge-offs |
10.57 | 17.15 | 43.46 | 74.78 | 72.26 | |||||||||||||||
Deteriorating market conditions have been
affecting loan portfolios since the latter part of 2007. As displayed in Table 12,
the Company recorded net charge-offs of $15.4 million during the year ended December
31, 2009, compared to net charge-offs of $7.3 million for the year ended December
31, 2008. The majority of the charge-offs in the residential category were adjustments
based on current appraisals which continue to show the depression in home values
while persisting adverse economic and housing pressures are affecting charge-off
levels in the commercial real estate, commercial construction and commercial business
portfolios. As a result of the net charge-offs, changes in nonaccrual and delinquent
loans and adversely classified loan indicators, a provision for loan losses of $18.0
million was recorded for the year ended December 31, 2009 compared to $13.4 million
for the same period in 2008.
The Company has a loan loss allowance of $52.5 million,
or 1.10% of total loans as compared to a loan loss allowance of $49.9 million, or
1.01% of total loans at December 31, 2008. Management believes that the allowance
for loan losses is adequate and directionally consistent with asset quality and
delinquency indicators and that it represents the best estimate of probable losses
inherent in the loan portfolio. To achieve this best estimate, numerous factors
are evaluated and applied to the allowance for loan loss calculation. Management
continues to assess loss factors based on recent economic events and incorporates
that into the calculation.
The allowance for loan losses to nonperforming loans
ratio at December 31, 2009 was 103.87% compared to 130.21% at December 31, 2008.
This ratio has declined because growth in the allowance is not proportional to growth
in nonperforming loans due to 1) classification of nonperforming loans is a backward
looking indicator, often loans with credit weaknesses are identified and allocated
higher levels of reserves if appropriate before becoming nonperforming, 2) the majority
of the Company’s nonperforming loans are secured by real estate collateral
and while the entire loan is classified as nonperforming, only the amount of estimated
losses would have been captured in the allowance for loan losses, 3) the growth
in nonperforming loans this year was concentrated in residential real estate loans
in which the loss in event of default is traditionally low, 4) certain nonperforming
loans have already been partially charged-off to the expected net realizable value
and 5) a portion of the allowance is to cover losses established under FASB ASC
450,Contingencies, for performing loans. Performing loans have not grown
at the same rate as nonperforming loans. The Company employs a formal quarterly
process to assess the adequacy of the Company’s allowance for loan losses.
The process is designed to adequately capture inherent losses in the loan portfolio.
56
The following table sets forth the Company’s percent of allowance by loan category and the percent of the loans to total
loans in each of the categories listed at the dates indicated:
Table 13: Allocation
of Allowance for Loan Losses
| At December 31, | ||||||||||||||||||||||||||||||
| 2009 | 2008 | 2007 | 2006 | 2005 | ||||||||||||||||||||||||||
| Percent of | Percent of | Percent of | Percent of | Percent of | ||||||||||||||||||||||||||
| Loans in | Loans in | Loans in | Loans in | Loans in | ||||||||||||||||||||||||||
| Each | Each | Each | Each | Each | ||||||||||||||||||||||||||
| Category to | Category to | Category to | Category to | Category to | ||||||||||||||||||||||||||
| (Dollars in thousands) | Amount | Total Loans | Amount | Total Loans | Amount | Total Loans | Amount | Total Loans | Amount | Total Loans | ||||||||||||||||||||
| Residential real estate | $ | 12,566 | 50.30 | % | $ | 8,844 | 51.30 | % | $ | 7,018 | 50.55 | % | $ | 5,244 | 50.34 | % | $ | 6,177 | 50.37 | % | ||||||||||
| Commercial real estate | 14,545 | 23.10 | 12,929 | 21.71 | 9,789 | 20.03 | 8,377 | 20.56 | 6,941 | 20.47 | ||||||||||||||||||||
| Commercial construction | 6,071 | 2.80 | 5,983 | 2.89 | 6,482 | 5.24 | 3,901 | 4.57 | 2,000 | 2.99 | ||||||||||||||||||||
| Commercial business | 14,230 | 8.60 | 14,076 | 9.25 | 13,395 | 9.68 | 13,594 | 9.17 | 13,782 | 9.60 | ||||||||||||||||||||
| Consumer | 2,687 | 15.20 | 6,328 | 14.85 | 5,926 | 14.50 | 5,021 | 15.36 | 4,320 | 16.57 | ||||||||||||||||||||
| Unallocated | 2,364 | - | 1,751 | - | 1,202 | - | 1,271 | - | 2,332 | - | ||||||||||||||||||||
Total allowance for loan losses |
$ | 52,463 | 100.00 | % | $ | 49,911 | 100.00 | % | $ | 43,812 | 100.00 | % | $ | 37,408 | 100.00 | % | $ | 35,552 | 100.00 | % | ||||||||||
The allowance for loan losses and the provision
are determined based upon a detailed evaluation of the portfolio and sub-portfolios
through a process which considers numerous factors, including levels and direction
of delinquencies, nonperforming loans, risk ratings, estimated credit losses
using both internal and external portfolio reviews, current economic and market
conditions, concentrations, industry data, peer comparisons, portfolio volume
and mix, changes in underwriting, experience of staff, and historical loss rates
over the business cycle.
The Bank evaluates the allowance for loan loss requirements
through an analysis of all impaired loans in accordance with impairment guidance
within FASB ASC 310 – Receivables (FAS 114), with the balance of the portfolios,
not impaired, analyzed under the guidelines of FASB ASC 450 – Contingencies (FAS 5), using a measurement of estimated credit losses based on historical
loss rates adjusted for qualitative and environmental factors. The qualitative
and environmental factors include but are not limited to 1) estimated embedded
losses in non-performing loans and criticized loans not impaired 2) estimated losses
in high risk residential mortgages and home equity loans and lines of credit
3) increased portfolio delinquencies 4) changes in risk ratings and 5) macro
economic conditions, including unemployment, consumer confidence, and continued softness
in the real estate market.
Management follows a guiding principle that the level
of the allowance for loan losses should be directionally consistent with asset
quality indicators. In establishing an acceptable range of losses for the total portfolio,
the Bank considers a high and low range of losses and a historical net loss analysis
on individual loan portfolios. The loan loss allowance allocations as of December
31, 2009 are between these high and low ranges. Management does not expect losses
in this economic cycle to exceed the losses experienced in the early 1990’s.
The unallocated reserve increased slightly to $2.4 million, or 4.5% of the total
reserve, for inherent losses, yet unidentified due to the current state of the
economy. The 4.5% is on the high side of management’s established range of
1% to 5%, which is appropriate based on the current economic environment. The
provision and allowance for loan losses are then reviewed and approved by the
Company’s Board of Directors on a quarterly basis.
Goodwill
and Intangible Assets
At December 31, 2009, the Company had intangible
assets of $562.5 million, a decrease of $8.5 million, from $571.0 million at
December 31, 2008. The decrease is due to year-to-date amortization expense for core
deposit and customer relationship intangibles.
Identifiable intangible assets
are amortized on a straight-line or accelerated basis, over their estimated lives.
Management assesses the recoverability of intangible assets subject to amortization
whenever events or changes in circumstances indicate that their carrying value
may not be recoverable. If the carrying amount exceeds fair value an impairment
charge is recorded to income. Goodwill is not amortized, but instead is reviewed
for impairment on an annual basis and more frequently if circumstances exist that
indicate a possible reduction in the fair value of the business below its carrying
value. For purposes of goodwill impairment evaluation, the Bank is identified
as the reporting unit.
The Company engaged an independent third party to assist
with the annual test for goodwill impairment during the first quarter of 2009.
The analysis performed evaluated the fair value of the reporting unit using a combination
of four valuation methodologies including; the Public Market Peers approach,
the Comparable Transactions approach, the Control Premium approach and a Discounted
Cash Flow approach. Based on the analysis, the Company concluded an impairment
charge was not deemed necessary. Given the economic climate and the Company’s
market capitalization at the third quarter of 2009, management reviewed a number
of events that could potentially trigger the requirement to perform an interim
goodwill impairment analysis. The review consisted of an analysis of potential
triggering events, including, but not limited to: a) a significant adverse change
in legal factors or in the business climate, b)
57
an adverse action or assessment by a regulator,
c) unanticipated competition, d) cash flow or operating losses, e) long-term outlooks
for specific industries and f) market capitalization of the company below its
book value. The fact that the market capitalization of the Company was below
its book value at September 30, 2009 was outweighed by the lack of other triggering
events and management concluded that no events or circumstances occurred through
September 30, 2009 which indicated that the carrying value of the Company’s
goodwill may be impaired. Although the Company’s market capitalization was
below its book value as of December 31, 2009, management again concluded that
no events or circumstances subsequent to these evaluations through year end indicate
that the carrying value of the goodwill may not be recoverable.
Sources of Funds
Cash flows from deposits, loan and mortgage-backed
securities repayments, securities sales proceeds and maturities, borrowings and
earnings are the primary sources of the Company’s funds available for use in
its lending and investment activities and in meeting its operational needs. While
scheduled loan and securities repayments are a relatively stable source of funds,
deposit flows and loan and investment security prepayments are influenced by
prevailing interest rates and local and economic conditions and are inherently
uncertain. The borrowings primarily include FHLB advances and repurchase agreement
borrowings. See Note 11 of Notes to Consolidated Financial Statements contained
elsewhere within this Report for further borrowings information.
The Company
attempts to control the flow of funds in its deposit accounts according to its need
for funds and the cost of alternative sources of funding. A Loan and Deposit
Pricing Committee meets weekly to determine pricing and marketing initiatives. Actions
of the committee influence the flow of funds primarily by the pricing of deposits,
which is affected to a large extent by competitive factors in its market area
and asset/liability management strategies.
Deposits
The Company receives retail and commercial deposits through its main office and
86 other banking offices throughout Connecticut (75 locations) and Massachusetts
(12 locations). Customer deposits generated through the NewAlliance banking network
are the largest source of funds used to support asset growth. Deposit customers
can access their accounts in a variety of ways including branch banking, ATM’s, internet banking or telephone banking. Effective advertising, direct mail,
well-designed product offerings, customer service and competitive pricing policies
have been successful in attracting and retaining deposits. A key strategic objective
is to grow the base of checking customers by retaining existing relationships
while attracting new customers. The deposit base provides a source of funding
for the bank as well as an ongoing stream of fee revenue. The Company offers a wide
variety of deposit accounts including checking, savings and certificate of deposit
accounts that meet the needs of both the consumer and business customers.
Table 14: Deposits
| December 31, | ||||||||||
| (In thousands) | 2009 | 2008 | Change | |||||||
| Savings | $ | 1,817,787 | $ | 1,463,341 | $ | 354,446 | ||||
| Money market | 790,453 | 346,522 | 443,931 | |||||||
| NOW | 400,176 | 368,730 | 31,446 | |||||||
| Demand | 534,358 | 494,978 | 39,380 | |||||||
| Time | 1,481,446 | 1,774,259 | (292,813 | ) | ||||||
Total deposits |
$ | 5,024,220 | $ | 4,447,830 | $ | 576,390 | ||||
As displayed in Table 14, deposits increased $576.4 million compared to December 31, 2008. The Company’s strategy has been to increase core deposits and reduce rates paid on interest bearing deposits, particularly on time deposits, in order to improve the net interest margin and the interest rate spread while continuing to build core relationships. Through well-designed product offerings, the Company has been able to grow core deposits by $869.2 million, or 32.5%, particularly through the Company’s money market and savings products. The Bank has also been focused on growing core deposits by launching “Essential Checking and Essential Savings” in the beginning of the year, which encompasses an interest-bearing checking, a competitively priced savings account and a cash rewards debit card. Money market deposits have shown significant increases and have grown approximately $443.9 million from year end due to the premium money market product which offers competitive pricing with a tiered rate structure. The Company has executed several programs, including telephone and direct mail campaigns to retain valued, higher-balance deposit accounts through the cross-sell strategy of offering our “best” banking product – Premium Alliance Checking and its companion accounts – Premium Savings and Premium Money Market. As a result, the Company was able to attract both retail and business customers throughout 2009. Also positively impacting money market deposit balances was the transfer of approximately $50.0 million of the Bank’s Trust customer funds, awaiting investment or distribution, from institutional money market funds and into a money market account within the Bank. Partially offsetting the growth in core deposits was a decrease in time deposit accounts of approximately $292.8 million, as the Company repriced maturing CD’s at reduced rates causing retention of time deposits to drop. However, the Company was able to retain some of the time deposit balances through the free savings and premium money market products that offer competitive interest rates.
58
The Company had $478.1 million in time deposits
of $100,000 or more outstanding as of December 31, 2009, maturing as follows:
Table 15: Time Deposit Maturities of $100,000 or more
| Weighted | ||||||
| average | ||||||
| (Dollars in thousands) | Amount | rate | ||||
| Three months or less | $ | 178,712 | 2.76 | % | ||
| Over three months through six months | 46,060 | 1.79 | ||||
| Over six months through twelve months | 114,643 | 1.51 | ||||
| Over twelve months | 138,699 | 2.85 | ||||
Total time deposits 100,000 or more |
$ | 478,114 | 2.39 | % | ||
Borrowings
NewAlliance uses various types of short-term and long-term borrowings to meet funding
needs. While customer deposits remain the primary source of funding loan originations,
management uses short-term and long-term borrowings as a supplementary funding source
for loan growth and liquidity needs when the cost of these funds are favorable compared
to alternative funding, including deposits.
The Company is a member of the FHLB
Boston regional bank which is part of the FHLB. Members are required to retain capital
stock in the FHLB Boston and borrowings are collateralized by certain home mortgages
and securities of the U.S. Government and its agencies. The Company’s borrowing
capacity at the FHLB Boston is determined by the amount of FHLB Boston capital stock
owned by the Company and the amount of loan and investment assets pledged to the
FHLB Boston by the Company as collateral.
The following table summarizes the
Company’s recorded borrowings at December 31, 2009.
Table 16: Borrowings
| December 31, | |||||||||||
| (In thousands) | 2009 | 2008 | Change | ||||||||
| FHLB advances (1) | $ | 1,755,533 | $ | 2,190,914 | $ | (435,381 | ) | ||||
| Repurchase agreements | 112,095 | 159,530 | (47,435 | ) | |||||||
| Mortgage loans payable | 1,165 | 1,317 | (152 | ) | |||||||
| Junior subordinated debentures issued to affiliated trusts (2) | 21,135 | 24,735 | (3,600 | ) | |||||||
Total borrowings |
$ | 1,889,928 | $ | 2,376,496 | $ | (486,568 | ) | ||||
| (1) | Includes fair value adjustments on acquired borrowings, in accordance with purchase accounting standards of $3.1 million and $5.8 million at December 31, 2009 and December 31, 2008, respectively. |
| (2) | Includes fair value adjustments on acquired borrowings, in accordance with purchase accounting standards of $0 and $100,000 at December 31, 2009 and December 31, 2008, respectively. The trusts were organized to facilitate the issuance of “trust preferred” securities. The Company acquired these subsidiaries when it acquired Alliance Bancorp of New England, Inc. and Westbank Corporation, Inc. The affiliated trusts are wholly-owned subsidiaries of the Company and the payments of these securities are irrevocably and unconditionally guaranteed by the Company. |
The acquisition fair value adjustments (premiums)
are being amortized as an adjustment to interest expense on borrowings over their
remaining term using the level yield method.
Table 16 above summarizes the Company’s recorded borrowings of $1.89 billion at December 31, 2009, a decrease of
$486.6 million from the balance recorded at December 31, 2008, mainly in FHLB advances.
The decrease in FHLB advances was primarily due to principal pay-downs and maturing
advances, partially offset by new advances at reduced rates. Due to the growth in
core deposits, the Company has substantially reduced its originated borrowings with
the FHLB in 2009. As a result, the Company was able to lessen its reliance on borrowings
from the FHLB by utilizing excess customer deposits to originate loans, invest in
securities and meet other
59
liquidity needs, while managing interest
rate risk. At December 31, 2009, all of the Company’s outstanding FHLB advances
were at fixed rates ranging from 1.51% to 8.17%.
The decrease of $47.4 million
in repurchase agreements is primarily due to a decline in commercial customer repurchase
agreements which fluctuate based on the operating needs of the customers and due
to the low levels of market interest rates, some customer balances shifted to demand
deposit and savings products.
Stockholders’ Equity
Total stockholders’ equity equaled $1.43 billion at December 31, 2009,
an increase of $53.7 million compared to $1.38 billion at December 31, 2008. The
increase was primarily due to year to date earnings of $46.4 million and an increase
in the fair market value of available for sale investment securities of $28.5 million,
net of tax and an increase of $7.5 million to recognize the year-over-year change
in the funded position of the Company’s pension plans. The increase in equity
was partially offset by $28.1 million for the payment of cash dividends declared
on our common stock during the year ended December 31, 2009. For information regarding
our compliance with applicable capital requirements, see “Liquidity and Capital
Position” below.
Dividends declared for the year to date period ended December
31, 2009 were $0.28 per share compared to $0.275 per share for the same period last
year. On January 26, 2010, the Company declared a $0.07 per share cash dividend
payable on February 18, 2010 to shareholders of record on February 8, 2010. This
was the Company’s 23rd consecutive quarterly dividend payment. Book value
per share amounted to $13.53 and $12.90 at December 31, 2009 and December 31, 2008,
respectively, and tangible book value amounted to $8.23 and $7.57 at the same dates,
respectively.
Liquidity and Capital Resources
Liquidity is the ability to meet current and future short-term financial obligations.
The Company further defines liquidity as the ability to respond to the needs of
depositors and borrowers as well as maintaining the flexibility to take advantage
of investment opportunities. The Company’s primary sources of funds consist
of deposit inflows, loan repayments and sales, maturities, paydowns and sales of
investment and mortgage-backed securities, borrowings from the FHLB and repurchase
agreements.
The Company’s most liquid assets are cash and due from banks,
short-term investments and debt securities. The levels of these assets are dependent
on the Company’s operating, financing, lending and investment activities during
any given period. At December 31, 2009, cash and due from banks, short-term investments
and debt securities maturing within one year amounted to $328.5 million, or 3.9%
of total assets.
The Company manages liquidity by determining its cash position
daily. The Investment Department compiles reports detailing the Company’s cash
activity and cash balances occurring at its various correspondents and through its
various funding sources. The Investment Department then settles all correspondent
and bank accounts by either investing excess funds or borrowing to cover the projected
shortfall.
Factors affecting liquidity include loan origination volumes, loan
prepayment rates, maturity structure of existing loans, core deposit growth levels,
time deposit maturity structure and retention, investment portfolio cash flows,
the market value of investment securities that can be used to collateralize FHLB
advances and repurchase agreements. The liquidity position is influenced by general
interest rate levels, economic conditions and competition. For example, as interest
rates decline, payments of principal from the loan and mortgage-backed securities
portfolio accelerate, as borrowers are more willing to prepay. Additionally, the
market value of the securities portfolio generally increases as rates decline, thereby
increasing the amount of collateral available for funding purposes.
The Company
has used borrowings from the FHLB Boston to fund loan growth while managing interest
rate risk and liquidity; however, during 2009 the Company was able to reduce its
reliance on the FHLB due to the growth in core deposits. At December 31, 2009, total
borrowings from the FHLB amounted to $1.75 billion, exclusive of $3.1 million in
purchase accounting adjustments, and the Company had the immediate capacity to increase
that total to $2.04 billion. Additional borrowing capacity of approximately $1.49
billion would be readily available by pledging eligible investment securities as
collateral. Depending on market conditions and the Company’s liquidity and
gap position, the Company may continue to borrow from the FHLB or initiate borrowings
through the repurchase agreement market. At December 31, 2009 the Company’s
repurchase agreement lines of credit with three large broker dealers totaled $225.0
million, $200.0 million of which was available on that date. Agreement terms vary
based on the collateral submitted.
NewAlliance’s main source of liquidity
at the parent company level is dividends from NewAlliance Bank. The main uses of
liquidity are payments of dividends to common stockholders, repurchase of NewAlliance’s common stock, the payment of principal and interest to holders of trust preferred
securities, and help fund acquisitions. There are certain restrictions on the payment
of dividends.
60
See Note 16 of Notes to Consolidated Financial
Statements contained elsewhere within this report for further information on dividend
restrictions.
At December 31, 2009, the Company had commitments to originate
loans, unused outstanding lines of credit and standby letters of credit totaling
$802.5 million. Commitments generally have fixed expiration dates or other termination
clauses, therefore, total commitment amounts do not necessarily represent future
cash requirements. Management anticipates that it will have sufficient funds available
to meet its current loan commitments and contractual obligations. Time deposits
maturing within one year from December 31, 2008 amount to $1.06 billion. FHLB advances
maturing within one year from December 31, 2009 amount to $520.0 million and interest
payments of approximately $73.9 million are payable in 2010.
Management believes
that the cash and due from banks, short term investments and debt securities maturing
within one year, coupled with the borrowing line at the FHLB and the available repurchase
agreement lines at selected broker dealers, provide for sufficient liquidity to
meet its operating needs. If unforeseen market conditions or counterparty risk placed
limitations on our ability to borrow from either the FHLB or the repurchase market,
the Company would be able to utilize the FRB’s discount window to obtain funds.
In October 2009, the Company filed a shelf registration with the SEC, which facilitates
increased flexibility to seize market opportunities as they present themselves.
The following tables present information indicating various obligations and commitments
of the Company as of December 31, 2009 and the respective maturity dates. Commitments
to extend credit are agreements to lend to a customer as long as there is no violation
of any terms or covenants established in the contract and generally have fixed expiration
dates or other termination clauses.
Table 17: Contractual Obligations
| Over one year | Over three years | ||||||||||||||
| through three | through five | ||||||||||||||
| (In thousands) | Total | One year or less | years | years | Over Five Years | ||||||||||
| FHLB advances (1) | $ | 1,752,412 | $ | 519,964 | $ | 641,802 | $ | 330,486 | $ | 260,160 | |||||
| Repurchase agreements | 112,095 | 87,095 | - | 25,000 | - | ||||||||||
| Mortgage loans payable | 1,165 | - | - | 1,165 | - | ||||||||||
| Junior subordinated debentures issued to affiliated trusts | 21,135 | - | - | - | - | ||||||||||
| Operating leases (2) | 18,507 | 3,710 | 5,125 | 3,432 | 6,240 | ||||||||||
| Tax reserves and interest (3) | 478 | ||||||||||||||
Total contractual obligations |
$ | 1,905,792 | $ | 610,769 | $ | 646,927 | $ | 360,083 | $ | 287,535 | |||||
| (1) | Secured under a blanket security agreement on qualifying assets, principally mortgage loans. |
| (2) | Represents non-cancelable operating leases for offices. |
| (3) | Represents unrecognized tax benefits with associated interest for which payment dates are undeterminable. |
Table 18: Other Commitments
| Over one year | Over three | ||||||||||||||||
| One year or | through three | years through | Over five | ||||||||||||||
| (In thousands) | Total | less | years | five years | years | ||||||||||||
| Loan origination commitments (1) | $ | 146,369 | $ | 146,369 | $ | - | $ | - | $ | - | |||||||
| Unadvanced portion of construction loans (2) | 40,700 | 13,575 | 27,125 | - | - | ||||||||||||
| Standby letters of credit | 6,587 | 4,526 | 313 | 1,152 | 596 | ||||||||||||
| Unadvanced portion of lines of credit (3) | 608,854 | 172,360 | 73,707 | 60,986 | 301,801 | ||||||||||||
Total commitments |
$ | 802,510 | $ | 336,830 | $ | 101,145 | $ | 62,138 | $ | 302,397 | |||||||
| (1) | Commitments for loans are extended to customers for up to 180 days after which they expire. |
| (2) | Unadvanced portions of construction loans are available to be drawn on at any time by the borrower for up to 2 years. |
| (3) | Unadvanced portions of home equity loans are available to be drawn on at any time by the borrower for up to 9.5 years. Commercial lines of credit are available to be drawn on at any time by the borrower for up to 1 or 2 years. |
Applicable regulations require the Company and the Bank to satisfy certain minimum capital requirements. At December 31, 2009, the Company and the Bank were in full compliance with all applicable capital requirements and met the FDIC requirements for a well
61
capitalized institution. See Note 16 of
Notes to Consolidated Financial Statements contained in Item 8 of this report, and
the section titled Regulation and Supervision in Item 1, concerning capital requirements.
Off-Balance Sheet Arrangements
In the normal course
of operations, NewAlliance engages in a variety of financial transactions that,
in accordance with U.S. GAAP, are not recorded in the financial statements, or are
recorded in amounts that differ from the notional amounts. These transactions involve,
to varying degrees, elements of credit, interest rate and liquidity risk. Such transactions
are used for general corporate purposes or for customer needs. Corporate purpose
transactions are used to help manage credit, interest rate and liquidity risk or
to optimize capital. Customer transactions are used to manage customers’ request
for funding.
For the year ended December 31, 2009, NewAlliance did not engage
in any off-balance sheet transactions that would have a material effect on its consolidated
financial condition.
Item 7A. Quantitative and Qualitative Disclosures About
Market Risk
Management Of Market And Interest Rate Risk
General
Market risk is the exposure to losses resulting from changes
in interest rates, foreign currency exchange rates, commodity prices and equity
prices. The Company has no foreign currency or commodity price risk. Credit risk
related to investment securities is mitigated as the majority are government agency
securities. The chief market risk factor affecting financial condition and operating
results is interest rate risk. Interest rate risk is the exposure of current and
future earnings and capital arising from adverse movements in interest rates and
spreads. This risk is managed by periodic evaluation of the interest rate risk inherent
in certain balance sheet accounts, determination of the level of risk considered
appropriate given the Company’s capital and liquidity requirements, business
strategy, performance objectives and operating environment and maintenance of such
risks within guidelines approved by the Board of Directors. Through such management,
the Company seeks to reduce the vulnerability of its net earnings to changes in
interest rates. The Asset/Liability Committee, comprised of numerous senior executives,
is responsible for managing interest rate risk. On a quarterly basis, the Board
of Directors reviews the Company’s gap position and interest rate sensitivity
exposure described below and Asset/Liability Committee minutes detailing the Company’s activities and strategies, the effect of those strategies on the Company’s operating results, interest rate risk position and the effect changes in
interest rates would have on the Company’s net interest income. The extent
of movement of interest rates is an uncertainty that could have a negative impact
on earnings.
The principal strategies used to manage interest rate risk include
(i) emphasizing the origination, purchase and retention of adjustable rate loans,
and the origination and purchase of loans with maturities matched with those of
the deposits and borrowings funding the loans, (ii) investing in debt securities
with relatively short maturities and/or average lives and (iii) classifying a significant
portion of its investment portfolio as available for sale so as to provide sufficient
flexibility in liquidity management. By its strategy of limiting the Bank’s
risk to rising interest rates, the Bank is also limiting the benefit of falling
interest rates.
The Company employs two approaches to interest rate risk measurement;
gap analysis and income simulation analysis.
Gap Analysis
The matching of assets and
liabilities may be analyzed by examining the extent to which such assets and liabilities
are “interest rate sensitive” and by monitoring a bank’s interest
rate sensitivity “gap.” An asset or liability is deemed to be interest
rate sensitive within a specific time period if it will mature or reprice within
that time period. The “interest rate sensitivity gap” is defined as the
difference between the amount of interest-earning assets maturing or repricing within
a specific time period and the amount of interest-bearing liabilities maturing or
repricing within that same time period. At December 31, 2009, the Company’s
cumulative one-year interest rate gap (which is the difference between the amount
of interest-earning assets maturing or repricing within one year and interest-bearing
liabilities maturing or repricing within one year), was positive $91.5 million,
or positive 1.08% of total assets. The Bank’s approved policy limit is plus
or minus 20%. A gap is considered positive when the amount of interest rate sensitive
assets exceeds the amount of interest rate sensitive liabilities. A gap is considered
negative when the amount of interest rate sensitive liabilities exceeds the amount
of interest rate sensitive assets. During a period of rising interest rates, a negative
gap would tend to adversely affect net interest income while a positive gap would
tend to result in an increase in net interest income. Conversely, during a period
of falling interest rates, a negative gap would tend to result in an increase in
net interest income while a positive gap would tend to adversely affect net interest
income.
The following table sets forth the Company’s cumulative maturity distribution
of interest-earning assets and interest-bearing liabilities at December 31, 2009,
interest rate sensitivity gap, cumulative interest rate sensitivity gap, cumulative
interest rate sensitivity gap ratio, and cumulative interest-earning assets as a
percentage of cumulative interest-bearing liabilities ratio. This table indicates
the time periods in which interest-earning assets and interest-bearing liabilities
will mature or may reprice in accordance with their contractual terms. Assumptions
are made on the rate of prepayment of principal on loans and investment securities
and on the
62
sensitivity of accounts with indeterminate
maturity dates. However, this table does not necessarily indicate the impact of
general interest rate movements on the Company’s net interest yield because
the repricing of various categories of assets and liabilities is discretionary and
is subject to competitive and other pressures. Additionally, certain assets, such
as adjustable rate loans, have features that restrict changes in interest rates
both on a short-term basis and over the life of the asset. Further, in the event
of changes in interest rates, prepayment and early withdrawal levels would likely
deviate significantly from those assumed in the gap analysis, so that when interest
rates rise, the gap becomes more negative, and when interest rates fall, the gap
becomes more positive. As a result, various assets and liabilities indicated as
repricing within the same time period may, in fact, reprice at different times and
at different rate levels. It should also be noted that this table reflects certain
assumptions regarding the categorization of assets and liabilities and represents
a one-day position; in fact, variations occur daily as management adjusts interest
rate sensitivity throughout the year.
Interest Rate Sensitivity Gap
| December 31, 2009 | ||||||||||||||||||||||||
| 1 - 3 | 4 - 6 | 7 - 12 | 1 - 5 | |||||||||||||||||||||
| (Dollars in thousands) | Months | Months | Months | Years | 5+ Years | Total | ||||||||||||||||||
| Interest-earning assets | ||||||||||||||||||||||||
Investment securities |
$ | 324,323 | $ | 264,981 | $ | 375,203 | $ | 1,216,918 | $ | 387,196 | $ | 2,568,621 | ||||||||||||
Loans |
951,581 | 300,043 | 602,997 | 2,273,119 | 598,457 | 4,726,197 | ||||||||||||||||||
Federal Home Loan Bank stock |
120,821 | - | - | - | - | 120,821 | ||||||||||||||||||
Short-term investments |
50,000 | - | - | - | - | 50,000 | ||||||||||||||||||
Total interest-earning assets |
1,446,725 | 565,024 | 978,200 | 3,490,037 | 985,653 | 7,465,639 | ||||||||||||||||||
| Interest-bearing liabilities | ||||||||||||||||||||||||
Savings deposits |
31,833 | 308,305 | 269,880 | 1,207,769 | - | 1,817,787 | ||||||||||||||||||
NOW deposits |
- | 45,440 | 37,698 | 317,038 | - | 400,176 | ||||||||||||||||||
Money market deposits |
89,677 | 165,659 | 125,968 | 409,149 | - | 790,453 | ||||||||||||||||||
Time deposits |
535,340 | 182,921 | 361,158 | 402,027 | - | 1,481,446 | ||||||||||||||||||
FHLB advances and other borrowings |
266,415 | 208,769 | 269,420 | 960,567 | 184,757 | 1,889,928 | ||||||||||||||||||
Total interest-bearing liabilities |
923,265 | 911,094 | 1,064,124 | 3,296,550 | 184,757 | 6,379,790 | ||||||||||||||||||
| Interest rate sensitivity gap | $ | 523,460 | $ | (346,070 | ) | $ | (85,924 | ) | $ | 193,487 | $ | 800,896 | $ | 1,085,849 | ||||||||||
| Cumulative interest rate sensitivity gap | $ | 523,460 | $ | 177,390 | $ | 91,466 | $ | 284,953 | $ | 1,085,849 | ||||||||||||||
Cumulative interest rate sensitivity gap ratio |
6.2 | % | 2.1 | % | 1.1 | % | 3.4 | % | 12.9 | % | ||||||||||||||
Cumulative interest-earning assets as a percentage of cumulative interest-bearing liabilities |
156.7 | % | 109.7 | % | 103.2 | % | 104.6 | % | 117.0 | % | ||||||||||||||
Income Simulation Analysis
Income simulation analysis considers the
maturity and repricing characteristics of assets and liabilities, as well as the
relative sensitivities of these balance sheet components over a range of interest
rate scenarios. Tested scenarios include instantaneous rate shocks, rate ramps over
a six-month or one-year period, static rates, non-parallel shifts in the yield curve
and a forward rate scenario. These simulation analysis are used to measure the exposure
of net interest income to changes in interest rates over a specified time horizon,
usually a three-year period. Simulation analysis involves projecting a future balance
sheet structure and interest income and expense under the various rate scenarios.
The Company’s internal guidelines on interest rate risk specify that for a
range of interest rate scenarios, the estimated net interest margin over the next
12 months should decline by less than 12% as compared to the forecasted net interest
margin in the base case scenario. However, in practice, interest rate risk is managed
well within these 12% guidelines.
For the base case rate scenario the yield curve
as of December 31, 2009 was utilized. This yield curve was utilized due to continued
uncertainty regarding the strength of the recovering economy as well as due to the
comments from various FRB officials that interest rates would likely remain flat
for an extended period. As of December 31, 2009, the Company’s estimated exposure
as a percentage of estimated net interest income for the next twelve-month period
as compared to the forecasted net interest income in the base case scenario are
as follows:
| Percentage change in | |||
| estimated net interest income | |||
| over twelve months | |||
| 100 basis point upward shock in interest rates | 2.24 | % | |
| 25 basis point downward shock in interest rates | (1.48 | ) % | |
63
As of December 31, 2009, a downward rate
shock of 25 basis points was a realistic representation of the risk of falling rates
as the FRB has reduced the overnight lending rate target to a range between 0.00%
and 0.25%. For an increase in rates, an upward rate shock of 100 basis points is
also a relevant representation of potential risk given the recent beginnings of
an economic rebound due to the past reductions in the federal funds rate, the benefits
of the government stimulus package and the expansion of the FRB’s balance sheet.
Based on the scenarios above, net interest income would increase slightly in
the 12-month period after an upward movement in rates, and would decrease slightly
after a downward movement in rates. Computation of prospective effects of hypothetical
interest rate changes are based on a number of assumptions including the level of
market interest rates, the degree to which non-maturity deposits react to changes
in market rates, the expected prepayment rates on loans and investments, the degree
to which early withdrawals occur on time deposits and other deposit flows. As a
result, these computations should not be relied upon as indicative of actual results.
Further, the computations do not reflect any actions that management may undertake
in response to changes in interest rates.
The Company’s management, including
our Chief Executive Officer and Chief Financial Officer, has evaluated the effectiveness
of our disclosure controls and procedures (as defined in Rule 13a-15(e) or Rule
15d-15(e) under the Exchange Act) as of December 31, 2009. Based upon that evaluation,
the Chief Executive Officer and Chief Financial Officer concluded that our disclosure
controls and procedures are effective.
Disclosure controls and procedures are
our controls and other procedures that are designed to ensure that the information
required to be disclosed by us in our reports filed or submitted under the Securities
Exchange Act of 1934 (the “Exchange Act”) is recorded, processed, summarized
and reported within the time periods specified in the Securities and Exchange Commission’s rules and forms. Disclosure controls and procedures include, without limitation,
controls and procedures designed to ensure that information required to be disclosed
by us in our reports filed under the Exchange Act is accumulated and communicated
to our management, including the principal executive officer and principal financial
officer, as appropriate to allow timely decisions regarding required disclosure
for the year ending December 31, 2009.
In addition, based on that evaluation,
no change in the Company’s internal control over financial reporting occurred
during the fourth quarter ended December 31, 2009 that has materially affected,
or is reasonably likely to materially affect, the Company’s internal control
over financial reporting.
The Company’s independent registered public accounting
firm has issued a report on the effectiveness of the Company’s internal control
over financial reporting as of December 31, 2009. The report, which expresses an
unqualified opinion on the effective operation of the Company’s internal control
over financial reporting as of December 31, 2009, is included on page 68 of this
Form 10-K.
| Item 9A(T). | Controls and Procedures | |
| Not applicable | ||
| Item 9B. | Other Information | |
| None | ||
64
PART III
PART IV
| Item 15. | Exhibits and Financial Statement Schedules |
| (a)(1) | Financial Statements |
The following Consolidated Financial Statements of NewAlliance Bancshares and subsidiaries are filed as part of this document under Item 8:
| - | Management’s Report on Internal Control over Financial Reporting | ||
| - | Report of Independent Registered Public Accounting Firm | ||
| - | Consolidated Balance Sheets as of December 31, 2009 and 2008 | ||
| - | Consolidated Statements of Income for the Years Ended December 31, 2009, 2008 and 2007 | ||
| - | Consolidated Statements of Changes in Stockholders’ Equity for the Years Ended December 31, 2009, 2008 and 2007 | ||
| - | Consolidated Statements of Cash Flows for the Years Ended December 31, 2009, 2008 and 2007 | ||
| - | Notes to Consolidated Financial Statements |
| (a)(2) | Financial Statement Schedules |
Financial Statement Schedules have been omitted because they are not applicable or the required information is shown in the Consolidated Financial Statements or notes thereto.
65
| Index to Consolidated Financial Statements | Page | ||
| Management’s Report on Internal Control Over Financial Reporting | 67 | ||
| Report of Independent Registered Public Accounting Firm | 68 | ||
| Consolidated Financial Statements | |||
Consolidated Balance Sheets as of December 31, 2009 and 2008 |
69 | ||
Consolidated Statements of Income for the Years Ended December 31, 2009, 2008 and 2007 |
70 | ||
Consolidated Statements of Changes in Stockholders’ Equity for the Years Ended December 31, 2009, 2008 and 2007 |
71 | ||
Consolidated Statements of Cash Flows for the Years Ended December 31, 2009, 2008 and 2007 |
72 | ||
Notes to Consolidated Financial Statements |
73 | ||
66
Management’s Report on Internal
Control Over Financial Reporting
NewAlliance Bancshares, Inc.
The management
of NewAlliance Bancshares, Inc. (the “Company”) is responsible for establishing
and maintaining adequate internal control over financial reporting. The Company’s internal control over financial reporting is a process designed to provide
reasonable assurance regarding the reliability of financial reporting and the preparation
of financial statements for external purposes in accordance with generally accepted
accounting principles in the United States of America.
The Company’s internal
control over financial reporting includes those policies and procedures that (i)
pertain to the maintenance of records that, in reasonable detail, accurately and
fairly reflect the transactions and dispositions of the assets of the company; (ii)
provide reasonable assurance that transactions are recorded as necessary to permit
preparation of financial statements in accordance with accounting principles generally
accepted in the United States of America, and that receipts and expenditures of
the company are being made only in accordance with authorizations of management
and directors of the company; and (iii) provide reasonable assurance regarding prevention
or timely detection of unauthorized acquisition, use, or disposition of the Company’s assets that could have a material effect on the financial statements.
Because of its inherent limitations, internal control over financial reporting may
not prevent or detect misstatements. Also, projections of any evaluation of effectiveness
to future periods are subject to the risk that controls may become inadequate because
of changes in conditions, or that the degree of compliance with the policies or
procedures may deteriorate.
Management assessed the effectiveness of the Company’s internal control over financial reporting as of December 31, 2009, based
on the framework set forth by the Committee of Sponsoring Organizations of the Treadway
Commission (“COSO”) in Internal Control – Integrated Framework. Based on that assessment, management concluded that, as of December 31, 2009,
the Company’s internal control over financial reporting is effective based
on the criteria established in Internal Control – Integrated Framework.
The effectiveness of the Company’s internal control over financial reporting
as of December 31, 2009, has been audited by PricewaterhouseCoopers, LLP, an independent
registered public accounting firm, as stated in their report appearing on page 68,
which expresses an unqualified opinion on the effectiveness of the Company’s
internal control over financial reporting as of December 31, 2009.
 |
 |
| Peyton R. Patterson | Glenn I. MacInnes |
| Chairman of the Board, President and | Executive Vice President and Chief |
| Chief Executive Officer | Financial Officer |
67
Report of Independent Registered Public
Accounting Firm
To the Board of Directors and Stockholders of NewAlliance
Bancshares, Inc.
In our opinion, the accompanying consolidated balance sheets
and the related consolidated statements of income, consolidated statements of changes
in stockholders’ equity and consolidated statements of cash flows present fairly,
in all material respects, the financial position of NewAlliance Bancshares, Inc.
and its subsidiaries at December 31, 2009 and 2008, and the results of their operations
and their cash flows for each of the three years in the period ended December 31,
2009 in conformity with accounting principles generally accepted in the United States
of America. Also in our opinion, the Company maintained, in all material respects,
effective internal control over financial reporting as of December 31, 2009, based
on criteria established in Internal Control - Integrated Framework issued
by the Committee of Sponsoring Organizations of the Treadway Commission (COSO).
The Company’s management is responsible for these financial statements, for
maintaining effective internal control over financial reporting and for its assessment
of the effectiveness of internal control over financial reporting, included in the
accompanying Management’s Report on Internal Control over Financial Reporting.
Our responsibility is to express opinions on these financial statements and on the
Company’s internal control over financial reporting based on our integrated
audits. We conducted our audits in accordance with the standards of the Public Company
Accounting Oversight Board (United States). Those standards require that we plan
and perform the audits to obtain reasonable assurance about whether the financial
statements are free of material misstatement and whether effective internal control
over financial reporting was maintained in all material respects. Our audits of
the financial statements included examining, on a test basis, evidence supporting
the amounts and disclosures in the financial statements, assessing the accounting
principles used and significant estimates made by management, and evaluating the
overall financial statement presentation. Our audit of internal control over financial
reporting included obtaining an understanding of internal control over financial
reporting, assessing the risk that a material weakness exists, and testing and evaluating
the design and operating effectiveness of internal control based on the assessed
risk. Our audits also included performing such other procedures as we considered
necessary in the circumstances. We believe that our audits provide a reasonable
basis for our opinions.
As discussed in Note 2 to the consolidated financial
statements, the Company changed the manner in which it accounts for their uncertain
tax positions in 2007 and split-dollar life insurance arrangements and defined benefit
and other postretirement plans in 2008 upon the adoption of new accounting pronouncements.
A company’s internal control over financial reporting is a process designed
to provide reasonable assurance regarding the reliability of financial reporting
and the preparation of financial statements for external purposes in accordance
with generally accepted accounting principles. Management’s assessment and
our audit of NewAlliance Bancshares, Inc.’s internal control over financial
reporting also included controls over the preparation of financial statements in
accordance with the instructions to the Consolidated Financial Statements for Bank
Holding Companies (Form FR Y-9C) to comply with the reporting requirements of Section
112 of the Federal Deposit Insurance Corporation Improvement Act (FDICIA). A company’s internal control over financial reporting includes those policies and procedures
that (i) pertain to the maintenance of records that, in reasonable detail, accurately
and fairly reflect the transactions and dispositions of the assets of the company;
(ii) provide reasonable assurance that transactions are recorded as necessary to
permit preparation of financial statements in accordance with generally accepted
accounting principles, and that receipts and expenditures of the company are being
made only in accordance with authorizations of management and directors of the company;
and (iii) provide reasonable assurance regarding prevention or timely detection
of unauthorized acquisition, use, or disposition of the company’s assets that
could have a material effect on the financial statements.
Because of its inherent
limitations, internal control over financial reporting may not prevent or detect
misstatements. Also, projections of any evaluation of effectiveness to future periods
are subject to the risk that controls may become inadequate because of changes in
conditions, or that the degree of compliance with the policies or procedures may
deteriorate.
 |
| PricewaterhouseCoopers LLP Hartford, Connecticut February 26, 2010 |
68
NewAlliance Bancshares, Inc.
Consolidated
Balance Sheets
| December 31, | December 31, | ||||||||
| (In thousands, except per share data) | 2009 | 2008 | |||||||
| Assets | |||||||||
Cash and due from banks |
$ | 96,927 | $ | 98,131 | |||||
Short term investments |
50,000 | 55,000 | |||||||
Cash and cash equivalents |
146,927 | 153,131 | |||||||
| Investment securities available for sale, at fair value (note 5) | 2,327,855 | 1,928,562 | |||||||
| Investment securities held to maturity (note 5) | 240,766 | 309,782 | |||||||
| Loans held for sale (includes $12,908 measured at fair value at December 31, 2009) | 14,659 | 5,361 | |||||||
| Loans, net (note 6) | 4,709,582 | 4,912,874 | |||||||
| Federal Home Loan Bank of Boston stock | 120,821 | 120,821 | |||||||
| Premises and equipment, net (note 7) | 57,083 | 59,419 | |||||||
| Cash surrender value of bank owned life insurance | 140,153 | 136,868 | |||||||
| Goodwill (note 8) | 527,167 | 527,167 | |||||||
| Identifiable intangible assets (note 8) | 35,359 | 43,860 | |||||||
| Other assets (note 9) | 113,941 | 101,673 | |||||||
Total assets |
$ | 8,434,313 | $ | 8,299,518 | |||||
| Liabilities | |||||||||
Deposits (note 10) |
|||||||||
Non-interest bearing |
$ | 534,358 | $ | 494,978 | |||||
Savings, interest-bearing checking and money market |
3,008,416 | 2,178,593 | |||||||
Time |
1,481,446 | 1,774,259 | |||||||
Total deposits |
5,024,220 | 4,447,830 | |||||||
Borrowings (note 11) |
1,889,928 | 2,376,496 | |||||||
Other liabilities |
85,212 | 93,976 | |||||||
Total liabilities |
6,999,360 | 6,918,302 | |||||||
Commitments and contingencies (note 15) |
|||||||||
| Stockholders’ Equity | |||||||||
Preferred stock, $0.01 par value; authorized 38,000 shares; none issued |
- | - | |||||||
Common stock, $0.01 par value; authorized 190,000 shares; issued 121,486 shares at December 31, 2009 and 2008 |
1,215 | 1,215 | |||||||
Additional paid-in capital |
1,245,489 | 1,245,679 | |||||||
Unallocated common stock held by ESOP |
(88,721 | ) | (92,380 | ) | |||||
Unearned restricted stock compensation |
(12,389 | ) | (18,474 | ) | |||||
Treasury stock, at cost (15,435 shares at December 31, 2009 and 14,427 shares at December 31, 2008) |
(211,582 | ) | (200,428 | ) | |||||
Retained earnings |
486,974 | 467,580 | |||||||
Accumulated other comprehensive income (loss) (note 17) |
13,967 | (21,976 | ) | ||||||
Total stockholders’ equity |
1,434,953 | 1,381,216 | |||||||
Total liabilities and stockholders’ equity |
$ | 8,434,313 | $ | 8,299,518 | |||||
See accompanying notes to consolidated financial statements.
69
NewAlliance Bancshares, Inc.
Consolidated Statements of Income
| Year Ended December 31, | ||||||||||||||
| (In thousands, except per share data) | 2009 | 2008 | 2007 | |||||||||||
| Interest and dividend income | ||||||||||||||
Residential real estate loans |
$ | 131,119 | $ | 138,005 | $ | 127,794 | ||||||||
Commercial real estate loans |
70,735 | 74,159 | 74,963 | |||||||||||
Commercial business loans |
22,019 | 27,819 | 33,964 | |||||||||||
Consumer loans |
34,207 | 38,984 | 43,802 | |||||||||||
Investment securities |
113,332 | 114,471 | 112,808 | |||||||||||
Federal funds sold and other short-term investments |
387 | 1,209 | 3,172 | |||||||||||
Federal Home Loan Bank of Boston stock |
- | 4,526 | 6,777 | |||||||||||
Total interest and dividend income |
371,799 | 399,173 | 403,280 | |||||||||||
| Interest expense | ||||||||||||||
Deposits |
80,681 | 104,672 | 130,933 | |||||||||||
Borrowings |
87,911 | 104,385 | 97,310 | |||||||||||
Total interest expense |
168,592 | 209,057 | 228,243 | |||||||||||
Net interest income before provision for loan losses |
203,207 | 190,116 | 175,037 | |||||||||||
Provision for loan losses |
18,000 | 13,400 | 4,900 | |||||||||||
Net interest income after provision for loan losses |
185,207 | 176,716 | 170,137 | |||||||||||
| Non-interest income | ||||||||||||||
Depositor service charges |
27,351 | 27,180 | 27,941 | |||||||||||
Loan and servicing income |
819 | 968 | 2,002 | |||||||||||
Trust fees |
5,790 | 6,351 | 6,783 | |||||||||||
Investment management, brokerage & insurance fees |
6,723 | 7,893 | 6,811 | |||||||||||
Bank owned life insurance |
3,548 | 4,937 | 6,375 | |||||||||||
Other-than-temporary impairment losses on securities |
(4,263 | ) | (2,681 | ) | (850 | ) | ||||||||
Less: Portion of loss recognized in other comprehensive income |
2,866 | - | - | |||||||||||
Net impairment loss on securities recognized in earnings |
(1,397 | ) | (2,681 | ) | (850 | ) | ||||||||
Net gain (loss) on securities |
7,314 | 4,524 | (26,692 | ) | ||||||||||
Net securities gain (loss) |
5,917 | 1,843 | (27,542 | ) | ||||||||||
Mortgage origination activity and loan sale income |
5,586 | 1,551 | 1,489 | |||||||||||
Other |
3,512 | 5,173 | 7,306 | |||||||||||
Total non-interest income |
59,246 | 55,896 | 31,165 | |||||||||||
| Non-interest expense | ||||||||||||||
Salaries and employee benefits (notes 12 & 13) |
89,646 | 91,687 | 84,513 | |||||||||||
Occupancy |
18,202 | 18,091 | 17,338 | |||||||||||
Furniture and fixtures |
5,808 | 6,550 | 6,874 | |||||||||||
Outside services |
20,098 | 19,314 | 17,142 | |||||||||||
Advertising, public relations, and sponsorships |
5,664 | 6,152 | 7,667 | |||||||||||
Amortization of identifiable intangible assets |
8,501 | 9,456 | 11,682 | |||||||||||
Merger related charges |
84 | 185 | 2,523 | |||||||||||
FDIC insurance premiums |
10,479 | 721 | 549 | |||||||||||
Other |
13,731 | 14,413 | 14,158 | |||||||||||
Total non-interest expense |
172,213 | 166,569 | 162,446 | |||||||||||
Income before income taxes |
72,240 | 66,043 | 38,856 | |||||||||||
| Income tax provision (note 14) | 25,797 | 20,747 | 15,063 | |||||||||||
Net income |
$ | 46,443 | $ | 45,296 | $ | 23,793 | ||||||||
Basic earnings per share (note 18) |
$ | 0.47 | $ | 0.45 | $ | 0.23 | ||||||||
Diluted earnings per share (note 18) |
0.47 | 0.45 | 0.23 | |||||||||||
Weighted-average shares outstanding (note 18) |
||||||||||||||
Basic |
99,163 | 99,587 | 103,146 | |||||||||||
Diluted |
99,176 | 99,707 | 103,582 | |||||||||||
Dividends per share |
$ | 0.28 | $ | 0.275 | $ | 0.255 | ||||||||
See accompanying notes to consolidated financial statements.
70
NewAlliance Bancshares, Inc.
Consolidated
Statements of Changes in Stockholders’ Equity
| Unallocated | Accumulated | ||||||||||||||||||||||||||||||||||
| Common | Par Value | Additional | Common | Other | Total | ||||||||||||||||||||||||||||||
| For the Years Ended December 31, 2007, 2008 and 2009 | Shares | Common | Paid-in | Stock Held | Unearned | Treasury | Retained | Comprehensive | Stockholders’ | ||||||||||||||||||||||||||
| (In thousands, except per share data) | Outstanding | Stock | Capital | by ESOP | Compensation | Stock | Earnings | Income (Loss) | Equity | ||||||||||||||||||||||||||
| Balance December 31, 2006 | 109,554 | $ | 1,175 | $ | 1,178,314 | $ | (99,697 | ) | $ | (32,987 | ) | $ | (114,605 | ) | $ | 455,649 | $ | (25,544 | ) | $ | 1,362,305 | ||||||||||||||
| Common stock issued for acquisition | 4,009 | 40 | 58,899 | 58,939 | |||||||||||||||||||||||||||||||
| Dividends declared ($0.255 per share) | (26,999 | ) | (26,999 | ) | |||||||||||||||||||||||||||||||
| Allocation of ESOP shares, net of tax | 11 | 3,658 | 3,669 | ||||||||||||||||||||||||||||||||
| Treasury shares acquired (note 16) | (4,714 | ) | (63,796 | ) | (63,796 | ) | |||||||||||||||||||||||||||||
| Exercise of stock options | 3 | 42 | 42 | ||||||||||||||||||||||||||||||||
| Restricted stock expense | 7,521 | 7,521 | |||||||||||||||||||||||||||||||||
| Stock option expense | 4,455 | 4,455 | |||||||||||||||||||||||||||||||||
| Book under tax benefit of stock-based compensation | 470 | 470 | |||||||||||||||||||||||||||||||||
| Adoption of income tax guidance related to accounting for | |||||||||||||||||||||||||||||||||||
uncertainties, net of tax (note 14) |
(714 | ) | (714 | ) | |||||||||||||||||||||||||||||||
| Other, net | (91 | ) | (91 | ) | |||||||||||||||||||||||||||||||
Comprehensive income: |
|||||||||||||||||||||||||||||||||||
Net income |
23,793 | 23,793 | |||||||||||||||||||||||||||||||||
| Other comprehensive income, net of tax (note 17) | 37,513 | 37,513 | |||||||||||||||||||||||||||||||||
Total comprehensive income |
61,306 | ||||||||||||||||||||||||||||||||||
| Balance December 31, 2007 | 108,852 | $ | 1,215 | $ | 1,242,100 | $ | (96,039 | ) | $ | (25,466 | ) | $ | (178,401 | ) | $ | 451,729 | $ | 11,969 | $ | 1,407,107 | |||||||||||||||
| Dividends declared ($0.275 per share) | (27,859 | ) | (27,859 | ) | |||||||||||||||||||||||||||||||
| Allocation of ESOP shares, net of tax | (260 | ) | 3,659 | 3,399 | |||||||||||||||||||||||||||||||
| Treasury shares acquired (note 16) | (1,793 | ) | (22,027 | ) | (22,027 | ) | |||||||||||||||||||||||||||||
| Restricted stock expense | 6,992 | 6,992 | |||||||||||||||||||||||||||||||||
| Stock option expense | 4,247 | 4,247 | |||||||||||||||||||||||||||||||||
| Book (over) tax benefit of stock-based compensation | (408 | ) | (408 | ) | |||||||||||||||||||||||||||||||
| Adoption of new split dollar life insurance accounting | |||||||||||||||||||||||||||||||||||
pronouncement, net of tax (note 2) |
(1,062 | ) | (1,062 | ) | |||||||||||||||||||||||||||||||
Adjustment to apply retirement benefits guidance for the changing pension plan measurement date, net of tax (notes 2 and 12) |
(524 | ) | 5 | (519 | ) | ||||||||||||||||||||||||||||||
Comprehensive income: |
|||||||||||||||||||||||||||||||||||
Net income |
45,296 | 45,296 | |||||||||||||||||||||||||||||||||
Other comprehensive loss, net of tax (note 17) |
(33,950 | ) | (33,950 | ) | |||||||||||||||||||||||||||||||
Total comprehensive income |
11,346 | ||||||||||||||||||||||||||||||||||
| Balance December 31, 2008 | 107,059 | $ | 1,215 | $ | 1,245,679 | $ | (92,380 | ) | $ | (18,474 | ) | $ | (200,428 | ) | $ | 467,580 | $ | (21,976 | ) | $ | 1,381,216 | ||||||||||||||
| Dividends declared ($0.280 per share) | (28,099 | ) | (28,099 | ) | |||||||||||||||||||||||||||||||
| Allocation of ESOP shares, net of tax | (463 | ) | 3,659 | 3,196 | |||||||||||||||||||||||||||||||
| Treasury shares acquired (note 16) | (1,008 | ) | (11,154 | ) | (11,154 | ) | |||||||||||||||||||||||||||||
| Restricted stock expense | 6,085 | 6,085 | |||||||||||||||||||||||||||||||||
| Stock option expense | 357 | 357 | |||||||||||||||||||||||||||||||||
| Book (over) tax benefit of stock-based compensation | (84 | ) | (84 | ) | |||||||||||||||||||||||||||||||
| Cumulative effect of new OTTI accounting guidance, | 1,050 | (1,050 | ) | - | |||||||||||||||||||||||||||||||
net of $0.6 million tax effect (note 5) |
|||||||||||||||||||||||||||||||||||
Comprehensive income: |
|||||||||||||||||||||||||||||||||||
Net income |
46,443 | 46,443 | |||||||||||||||||||||||||||||||||
Other comprehensive income, net of tax (note 17) |
36,993 | 36,993 | |||||||||||||||||||||||||||||||||
Total comprehensive income |
83,436 | ||||||||||||||||||||||||||||||||||
| Balance December 31, 2009 | 106,051 | $ | 1,215 | $ | 1,245,489 | $ | (88,721 | ) | $ | (12,389 | ) | $ | (211,582 | ) | $ | 486,974 | $ | 13,967 | $ | 1,434,953 | |||||||||||||||
See accompanying notes to consolidated financial statements.
71
NewAlliance Bancshares, Inc.
Consolidated Statements of Cash Flows
| Year Ended December 31, | ||||||||||||
| (In thousands) | 2009 | 2008 | 2007 | |||||||||
| Cash flows from operating activities | ||||||||||||
| Net income | $ | 46,443 | $ | 45,296 | $ | 23,793 | ||||||
| Adjustments to reconcile net income to net cash provided by operating activities: | ||||||||||||
Provision for loan losses |
18,000 | 13,400 | 4,900 | |||||||||
Loss on sale of other real estate owned |
182 | 61 | - | |||||||||
Restricted stock compensation expense |
6,085 | 6,992 | 7,521 | |||||||||
Stock option compensation expense |
357 | 4,247 | 4,455 | |||||||||
ESOP expense |
3,196 | 3,399 | 3,669 | |||||||||
Amortization of identifiable intangible assets |
8,501 | 9,456 | 11,682 | |||||||||
Net amortization/accretion of fair market adjustments from net assets acquired |
(2,873 | ) | (4,185 | ) | (6,697 | ) | ||||||
Net amortization/accretion of investment securities |
6,138 | (1,506 | ) | (1,294 | ) | |||||||
Change in deferred income taxes |
(3,588 | ) | 549 | (955 | ) | |||||||
Depreciation and amortization |
6,388 | 6,926 | 7,090 | |||||||||
Net (gain) loss on sale of securities |
(7,314 | ) | (4,524 | ) | 26,692 | |||||||
Impairment losses on securities |
1,397 | 2,681 | 850 | |||||||||
Mortgage origination activity and loan sale income |
(5,586 | ) | (1,551 | ) | (1,489 | ) | ||||||
Proceeds from sales of loans held for sale |
483,364 | 93,580 | 68,953 | |||||||||
Loans originated for sale |
(487,076 | ) | (97,865 | ) | (70,243 | ) | ||||||
Loss (gain) on sale of premises and equipment |
11 | 1 | (154 | ) | ||||||||
Loss (gain) on limited partnerships |
575 | 30 | (1,988 | ) | ||||||||
Increase in cash surrender value of bank owned life insurance |
(3,548 | ) | (4,937 | ) | (6,375 | ) | ||||||
(Increase) decrease in other assets |
(22,143 | ) | (13,639 | ) | 72,883 | |||||||
Increase (decrease) in other liabilities |
2,801 | 7,971 | (20,271 | ) | ||||||||
Net cash provided by operating activities |
51,310 | 66,382 | 123,022 | |||||||||
| Cash flows from investing activities | ||||||||||||
Purchase of Federal Home Loan Bank Stock |
- | (7,060 | ) | (12,752 | ) | |||||||
Purchase of securities available for sale |
(1,146,873 | ) | (708,638 | ) | (1,299,469 | ) | ||||||
Purchase of securities held to maturity |
(22,931 | ) | (83,139 | ) | (39,267 | ) | ||||||
Proceeds from maturity, sales, calls and principal reductions of |
||||||||||||
securities available for sale |
787,404 | 856,113 | 1,348,482 | |||||||||
Proceeds from maturity, calls and principal reductions of |
||||||||||||
securities held to maturity |
92,618 | 64,647 | 57,299 | |||||||||
Proceeds from sales of fixed assests |
32 | 659 | 404 | |||||||||
Net decrease (increase) in loans held for investment |
179,546 | (241,810 | ) | (460,920 | ) | |||||||
Net cash acquired in acquisition |
- | - | 124,163 | |||||||||
Proceeds from sales of other real estate owned |
3,059 | 1,239 | - | |||||||||
Proceeds from bank owned life insurance |
263 | 127 | - | |||||||||
Purchase of premises and equipment |
(4,012 | ) | (4,987 | ) | (5,844 | ) | ||||||
Net cash used in investing activities |
(110,894 | ) | (122,849 | ) | (287,904 | ) | ||||||
| Cash flows from financing activities | ||||||||||||
Net increase (decrease) in customer deposit balances |
576,510 | 74,051 | (156,686 | ) | ||||||||
Net decrease in short-term borrowings |
(72,434 | ) | (7,615 | ) | (26,881 | ) | ||||||
Proceeds from long-term borrowings |
172,000 | 538,000 | 1,069,800 | |||||||||
Repayments of long-term borrowings |
(583,359 | ) | (505,423 | ) | (626,214 | ) | ||||||
Shares issued for stock option exercise |
- | - | 42 | |||||||||
Book (over)/under tax benefit of stock-based compensation |
(84 | ) | (408 | ) | 470 | |||||||
Acquisition of treasury shares |
(11,154 | ) | (22,027 | ) | (63,796 | ) | ||||||
Dividends declared |
(28,099 | ) | (27,859 | ) | (26,999 | ) | ||||||
Net cash provided by financing activities |
53,380 | 48,719 | 169,736 | |||||||||
Net (decrease) increase in cash and cash equivalents |
(6,204 | ) | (7,748 | ) | 4,854 | |||||||
Cash and cash equivalents, beginning of period |
153,131 | 160,879 | 156,025 | |||||||||
Cash and cash equivalents, end of period |
$ | 146,927 | $ | 153,131 | $ | 160,879 | ||||||
| Supplemental information | ||||||||||||
Cash paid for |
||||||||||||
Interest on deposits and borrowings |
$ | 171,180 | $ | 211,092 | $ | 226,150 | ||||||
Income taxes paid, net |
28,299 | 24,885 | 9,102 | |||||||||
Noncash transactions |
||||||||||||
Loans transferred to other real estate owned |
5,641 | 3,082 | 897 | |||||||||
Net noncash liabilities acquired |
- | - | 142,014 | |||||||||
Value of shares issued for acquisitions |
- | - | 58,939 | |||||||||
See accompanying notes to consolidated financial statements.
72
Notes to Consolidated Financial Statements
| 1. | Summary of Significant Accounting Policies |
Financial Statement Presentation
The consolidated financial statements of NewAlliance Bancshares, Inc. (the “Company”) have been prepared in conformity with accounting principles generally accepted
in the United States of America. In the opinion of management, all adjustments (consisting
of normal recurring accruals) considered necessary for a fair presentation have
been included. All significant intercompany transactions and balances have been
eliminated in consolidation. Amounts in prior period financial statements are reclassified
whenever necessary to conform to the current year presentation.
The preparation of the consolidated financial statements requires management to make estimates and assumptions that affect the reported amounts of assets, liabilities, revenues and expenses and the disclosure of contingent assets and liabilities. Actual results could differ from those estimates.
Material estimates that are particularly susceptible to significant near-term change relate to the determination of the allowance for loan losses, the obligation and expense for pension and other postretirement benefits, and estimates used to evaluate asset impairment including investment securities, income tax contingencies and deferred tax assets and liabilities and the recoverability of goodwill and other intangible assets.
As of February 26, 2010, the date in which the financial statements were issued, management has determined that no subsequent events have occurred following the balance sheet date of December 31, 2009, which require recognition or disclosure in the financial statements.
Cash and Cash Equivalents
For
purposes of reporting cash flows, cash and cash equivalents include cash on hand
and due from banks and short-term investments with original maturities of three
months or less. At December 31, 2009, included in the balance of cash and due from
banks were cash on hand of $96.9 million, which includes required reserves in the
form of deposits with the Federal Reserve Bank (“FRB”) of approximastely
$23.7 million. Short-term investments included money market funds of $50.0 million
at December 31, 2009.
Investment Securities
Marketable
equity and debt securities are classified as either trading, available for sale,
or held to maturity (applies only to debt securities). Management determines the
appropriate classifications of securities at the time of purchase. At December 31,
2009 and 2008, the Company had no debt or equity securities classified as trading.
Held to maturity securities are debt securities for which the Company has the ability
and intent to hold until maturity. All other securities not included in held to
maturity are classified as available for sale. Held to maturity securities are recorded
at amortized cost, adjusted for the amortization or accretion of premiums or discounts.
Available for sale securities are recorded at fair value. Unrealized gains and losses,
net of the related tax effect, on available for sale securities are excluded from
earnings and are reported in accumulated other comprehensive income, a separate
component of equity, until realized. Further information relating to the fair value
of securities can be found within Note 3 of the Notes to Consolidated Financial
Statements.
Premiums and discounts on debt securities are amortized or accreted into interest income over the term of the securities using the level yield method. In accordance with Financial Acounting Standards Board (“FASB”) Accounting Standards Codification (“FASB ASC”) 320 – Debt and Equity Securities, a decline in market value of a debt security below amortized cost that is deemed other than temporary is charged to earnings for the credit related other than temporary impairment (“OTTI”) resulting in the establishment of a new cost basis for the security, while the non-credit related OTTI is recognized in other comprehensive income (“OCI”) if there is no intent to sell or will not be required to sell the security. If an equity security is deemed other-than-temporarily impaired, the full impairment is considered to be credit-related and a charge to earnings would be recorded. Gains and losses on sales of securities are recognized at the time of sale on a specific identification basis.
Federal Home Loan Bank of Boston stock
As a member of the Federal Home Loan Bank of Boston, (“FHLB Boston”),
the Bank is required to hold a certain amount of FHLB Boston stock. This stock is
considered to be a non-marketable equity security reported at cost. The level of
stock purchases is determined by the Bank’s advances outstanding and the amount
of residential mortgage assets on the Bank’s balance sheet. The shares can
only be purchased and sold between the FHLB Boston and the Company at a par value
of $100 per share.
Loans Held for Sale
The Company
currently sells the majority of originated fixed rate residential real estate loans
with terms of 15 years and over. Mortgage loans held for sale are carried at fair
value. Fair value is estimated using quoted loan market prices provided by government-sponsored
entities of Federal National Mortgage Association (“FNMA”) and Federal
Home Loan Mortgage Corporation (“FHLMC”).
73
NewAlliance Bancshares, Inc.
Notes to Consolidated Financial Statements
Further information regarding the fair value measurement of mortgage loans held for sale can be found in Note 3 of the Notes to Consolidated Financial Statements. Residential loans are sold by the Company without recourse. The Company currently sells these loans servicing released.
The Company is also involved in the Small Business Administration (“SBA”) loan secondary market. The Company currently sells the guaranteed portion of SBA loans that meet certain criteria and retains the unguaranteed portion and the right to service the sold portion of the loan in its portfolio. Such loans are included in loans held for sale on the balance sheet upon origination. SBA loans held for sale are valued at the lower of cost (less principal payments received and net of deferred fees and costs) or estimated fair value. Fair value is estimated using quoted market prices from a secondary market broker. All other loan originations are classified as loans not held for resale.
Loans Receivable
Loans are stated
at their principal amounts outstanding, net of deferred loan fees and costs and
fair value adjustments for loans acquired.
Interest on loans is credited to income as earned based on the rate applied to principal amounts outstanding. Loans are placed on nonaccrual status when timely collection of principal or interest in accordance with contractual terms is in question. The Company’s policy is to discontinue the accrual of interest when principal or interest payments become 90 days delinquent or sooner if management concludes that circumstances indicate borrowers may be unable to meet contractual principal or interest payments. If ultimately collected, such interest is credited to income when received. Loans are removed from nonaccrual status when they become current as to principal and interest and when, in the opinion of management concern no longer exists as to the collectability of principal and interest.
Certain direct loan origination fees and costs and fair value adjustments to acquired loans are recognized over the lives of the related loans as an adjustment of interest using the level yield method. When loans are prepaid, sold or participated out, the unamortized portion is recognized as income or expense at that time.
Allowance for Loan Losses
The
adequacy of the allowance for loan losses is regularly evaluated by management.
Factors considered in evaluating the adequacy of the allowance include previous
loss experience, current economic conditions and their effect on borrowers, the
performance of individual loans in relation to contract terms, and other pertinent
factors. The provision for loan losses charged to expense is based upon management’s judgment of the amount necessary to maintain the allowance at a level adequate
to absorb probable losses inherent in the loan portfolio. Loan losses are charged
against the allowance when management believes the collectability of the principal
balance outstanding is unlikely.
In determining the adequacy of the allowance for loan losses, management reviews overall portfolio quality through an evaluation of individual performing and impaired loans, the risk characteristics of the loan portfolios, an analysis of current levels and trends in charge offs, delinquency and nonperforming loan data, and the credit risk profile of each component of the portfolio, among other factors. While management uses the best available information to recognize losses on loans, future additions to the allowance for loan losses may be necessary based on changes in economic conditions. In addition, various regulatory agencies, as an integral part of their examination process, periodically review the Bank’s allowance for loan losses. Such agencies may require the Bank to recognize additions to the allowance based on their judgments about information available to them at the time of their examinations.
The allowance for loan losses consists of a formula allowance, based on a variety of factors including historical loss experience for various loan portfolio classifications, and a specific valuation allowance for loans identified as impaired. The allowance is an estimate, and ultimate losses may vary from management’s estimate. Changes in the estimate are recorded in the results of operations in the period in which they become known, along with provisions for estimated losses incurred during that period.
A loan is considered to be impaired when it is probable that the Company will be unable to collect all amounts due according to the contractual terms of the loan agreement. Impaired loans, as defined, may be measured based on the present value of expected future cash flows discounted at the loan’s original effective interest rate, at the loan’s observable market price or the fair value of the collateral if the loan is collateral dependent. When the measurement of the impaired loan is less than the recorded investment in the loan, the impairment is recorded through a valuation allowance. Further information relating to impaired loans for which there is an allowance for loan loss allocation can be found in Note 3 of the Notes to Consolidated Financial Statement.
Loan Servicing Rights
The Company
capitalizes servicing rights for loans sold based on the relative fair value which
is allocated between the servicing rights and the loans (without servicing rights).
74
NewAlliance Bancshares, Inc.
Notes to Consolidated Financial Statements
The cost basis of loan servicing rights is amortized on a level yield basis over the period of estimated net servicing revenue and such amortization is included in the consolidated statement of income as a reduction of loan servicing fee income. Servicing rights are evaluated for impairment by comparing their aggregate carrying amount to their fair value. The fair value of loan servicing rights is estimated using a present value cash flow model. The most important assumptions used in the valuation model are the anticipated rate of loan prepayments and discount rates. All assumptions are based on standards used by market participants. An independent appraisal of the fair value of the Company’s loan servicing rights is obtained as necessary, but at least annually and is used by management to evaluate the reasonableness of the fair value estimates. For interim quarters, management analyzes the current variables and assesses the need for an independent appraisal. Impairment is recognized as an adjustment to loan and servicing income.
Premises and Equipment
Premises
and equipment are carried at cost less accumulated depreciation and amortization.
Depreciation and amortization are computed on the straight-line method using the
estimated lives of the assets. Estimated lives are 5 to 40 years for building and
improvements and 3 to 10 years for furniture, fixtures and equipment. Amortization
of leasehold improvements is calculated on a straight-line basis over the terms
of the related leases or the life of the asset, whichever is shorter. The cost of
maintenance and repairs is charged to expense as incurred, whereas significant renovations
are capitalized.
Bank Owned Life Insurance
Bank
owned life insurance (“BOLI”) represents life insurance on certain employees
who have consented to allow the Bank to be the beneficiary of those policies. BOLI
is recorded as an asset at cash surrender value. Increases in the cash value of
the policies, as well as insurance proceeds received, are recorded in other non-interest
income and are not subject to income tax. Management reviews the financial strength
of the insurance carriers on a quarterly basis and BOLI with any individual carrier
is limited to 15% of capital plus reserves.
Goodwill and Identifiable Intangible
Assets
The assets (including identifiable intangible assets) and liabilities
acquired in a business combination are recorded at fair value at the date of acquisition.
Goodwill is recognized for the excess of the acquisition cost over the fair values
of the net assets acquired and is not subsequently amortized. Identifiable intangible
assets are subsequently amortized on a straight-line or accelerated basis, over
their estimated lives. Management assesses the recoverability of goodwill at least
on an annual basis and all intangible assets whenever events or changes in circumstances
indicate that their carrying value may not be recoverable. If carrying amount exceeds
fair value an impairment charge is recorded to income.
Income Taxes
The Company files
a consolidated federal tax return and various combined and separate Company state
tax returns. The Company uses the asset and liability method of accounting for income
taxes. Under this method, deferred tax assets and liabilities are established for
the temporary differences between the financial reporting basis and the tax basis
of the Company’s assets and liabilities. Deferred tax assets are also recognized
for available tax carryforwards. Deferred tax assets and liabilities are measured
using enacted tax rates expected to be in effect when temporary differences and
carryforwards are realized or settled.
The deferred tax asset is subject to reduction by a valuation allowance in certain circumstances. This valuation allowance is recognized if, based on an analysis of available evidence, management determines that it is more likely than not that some portion or all of the deferred tax asset will not be realized. The valuation allowance is subject to ongoing adjustment based on changes in circumstances that affect management’s judgment about the realization of the deferred tax asset. Adjustments to increase or decrease the valuation allowance are charged or credited, respectively, to income tax expense or in certain limited circumstances to equity.
Income tax expense includes the amount of taxes payable for the current year, and the deferred tax benefit or expense for the period. The effect on deferred tax assets and liabilities of a change in tax rates is recognized in income tax expense in the period that includes the enactment date.
The Company is required to make a determination of an inventory of tax positions (federal and state) for which the sustainability of the position, based upon the technical merits, is uncertain. The Company regularly evaluates all tax positions taken and the likelihood of those positions being sustained. If management is highly confident that the position will be allowed and there is a greater than 50% likelihood that the full amount of the tax position will be ultimately realized, the company recognizes the full benefit associated with the tax position. Additionally, interest and penalties related to uncertain tax positions are included as a component of income tax expense.
75
NewAlliance Bancshares, Inc.
Notes to Consolidated Financial Statements
Trust Assets
The Bank had approximately
$1.03 billion and $854.2 million of assets under management at December 31, 2009
and 2008, respectively, in a fiduciary or agency capacity for customers. These assets
are not included in the accompanying consolidated financial statements since they
are not owned by the Bank. Trust income primarily consists of management fees based
on the assets under management.
Pension and Other Postretirement Benefit
Plans
The Company has a noncontributory pension plan covering substantially
all employees who meet certain age and length of service requirements and who were
employed by the Company prior to January 1, 2008. Pension costs related to this
plan are based upon actuarial computations of current and future benefits for employees
based on years of service and the employee’s highest career earnings over a
five-year consecutive period. Costs are charged to non-interest expense and are
funded in accordance with requirements of the Employee Retirement Income Security
Act and the Pension Protection Act of 2006. Contributions are intended to provide
not only for benefits attributed to service to date, but also for those expected
to be earned in the future.
In addition to the qualified plan, the Company has supplemental retirement plans for certain key officers. These plans, which are nonqualified, were designed to offset the impact of changes in the pension plan that limit benefits for highly compensated employees under qualified pension plans.
The Company also accrues costs related to postretirement healthcare and life insurance benefits, which recognizes costs over the employee’s period of active employment.
The discount rate is set for the retirement plans by reference to high quality long-term fixed income instrument yields. The discount rates were determined by applying the estimated cash flows of the Company’s retirement plans to the Citigroup Pension Liability Yield Curve. The Moody’s Aa long-term corporate bond index was also reviewed as a benchmark. The expected long-term rate of return on the assets held in our defined pension plan is based on market and economic conditions, the Plan’s asset allocation and other factors.
Based on our review of rates at December 31, 2009, separate discount rates were chosen for each type of benefit plan for the measurement of benefit obligations to better represent the actual plans. Discount rates as of December 31, 2009 were 5.85% for the defined benefit plan, 5.50% for the postretirement plan and 5.75% for the supplemental executive retirement benefit plan. As of December 31, 2008, the discount rates were 6.10% for the defined benefit plan, 6.25% for the postretirement plan and 6.35% for the supplemental executive retirement benefit plan. The expected long-term rate of return on the pension plan assets was 7.75% for both December 31, 2009 and 2008.
On December 31, 2008, the Company changed its measurement date to December 31 from September 30 upon adoption of the measurement date provisions in FASB ASC 715 Compensation – Retirement Benefits. Changes in the fair value of plan assets and the benefit obligation are recognized, net of tax, as an adjustment to other comprehensive income.
Stock-Based Compensation
The Company
accounts for stock option and restricted stock awards in accordance with FASB ASC
718 – Compensation – Stock Compensation. Pursuant to this guidance, the
fair value of stock option and restricted stock awards, measured at grant date,
is amortized to compensation expense on a straight-line basis over the vesting period.
Merger Related Charges
The Company
accounts for acquisitions in accordance with FASB ASC 805, Business Combinations. Costs that do not meet the conditions for inclusion in the allocation of acquisition
cost, costs for contemplated acquisitions and recurring costs related to prior acquisitions
are expensed as incurred and are reported as Merger Related Charges. These
charges consist primarily of consulting, legal, system conversion, printing and
advertising costs associated with acquired companies, acquisition targets and potential
acquisition targets. For acquisitions completed after January 1, 2009, pursuant
to new business combination accounting guidance, merger-related charges will also
include acquisition related transaction and restructuring costs which were previously
capitalized as part of the cost of the acquisition.
Related Party Transactions
Directors
and executive officers of the Company and its subsidiaries and their associates
have been customers of and have had transactions with the Company, and management
expects that such persons will continue to have such transactions in the future.
See Note 6 of the Notes to Consolidated Financial Statements for further information
with respect to loans to related parties.
76
NewAlliance Bancshares, Inc.
Notes to Consolidated Financial Statements
Comprehensive Income
The purpose
of reporting comprehensive income is to report a measure of all changes in an entity
that result from recognized transactions and other economic events of the period
other than transactions with owners in their capacity as owners. Comprehensive income
includes net income and certain changes in capital that are not recognized in the
statement of income (such as changes in net unrealized gains and losses on securities
available for sale). The Company has reported comprehensive income for the years
ended December 31, 2009, 2008 and 2007 in the Consolidated Statement of Changes
in Stockholders’ Equity. The components of comprehensive income are presented
in Note 17 of the Notes to Consolidated Financial Statements.
Segment Reporting
The Company’s only business segment is Community Banking. During the years ended 2009,
2008 and 2007 this segment represented all the revenues and income of the consolidated
group and therefore, is the only reported segment as defined by FASB ASC 820, Segment Reporting.
Earnings Per Share
Basic earnings
per share (“EPS”) excludes dilution and is calculated by dividing net
income available to common stockholders by the weighted-average number of shares
of common stock outstanding during the period. Diluted EPS is computed in a manner
similar to that of basic EPS except that the weighted-average number of common shares
outstanding is increased to include the number of incremental common shares (computed
using the treasury stock method) that would have been outstanding if all potentially
dilutive common shares (such as stock options and unvested restricted stock) were
issued during the period. Unallocated common shares held by the Employee Stock Ownership
Plan (“ESOP”) are not included in the weighted-average number of common
shares outstanding for either basic or diluted earnings per share calculations.
Earnings per share for the years ended December 31, 2009, 2008 and 2007, can be found in Note 18 of the Notes to Consolidated Financial Statements.
| 2. | Changes in Accounting Principles and Effects of New Accounting Pronouncements |
Accounting Standards Codification (Topic 105)
In June 2009, the Financial Accounting Standards Board (“FASB”) issued Statement of Financial Accounting Standards (“SFAS”) No. 168, “The FASB Accounting Standards CodificationTM and the Hierarchy of Generally Accepted Accounting Principles – a replacement of FASB Statement No. 162” (“SFAS No. 168”). The objective of SFAS No. 168 is to replace SFAS No. 162, “The Hierarchy of Generally Accepted Accounting Principles” and to establish the FASB Accounting Standards CodificationTM (“Codification” or “FASB ASC”) as the source of authoritative accounting principles recognized by the FASB to be applied by nongovernmental entities in the preparation of financial statements in conformity with U.S. generally accepted accounting principles (“GAAP”). The Codification supersedes all previous level (a) through (d) GAAP, aside from non-codified FASB statements and guidance issued by the Securities and Exchange Commission (“SEC”). The Codification did not change GAAP, but rather reorganized it into approximately 90 accounting topics within a consistent structure to simplify user access. Contents in each of these accounting topics are further organized by subtopic, section and paragraph. The Codification allows for the continued application of superseded accounting standards for transactions that have an ongoing effect in an entity’s financial statements. Although the Codification does not include the superseded guidance, it shall be considered grandfathered and remain authoritative for those transactions after the effective date of this statement. The Codification was effective for financial statements issued for reporting periods that end after September 15, 2009. SFAS No. 168 was the final standard issued by the FASB in that form. Changes to the Codification are in the form of Accounting Standards Updates issued by the FASB. An Accounting Standards Update is not authoritative; rather, it is a document that communicates the specific amendments that change the Codification and provides background information about the guidance, including the basis for conclusions on changes made to the Codification. The adoption of SFAS No. 168 and the Codification did not have a material impact on the Company’s consolidated financial statements but changed the referencing system for accounting standards from the legacy GAAP citations to codification topic numbers.
In June 2009, the FASB issued FASB Accounting Standards Update (“ASU”) No. 2009-01, Topic 105, Generally Accepted Accounting Principles. This ASU amends the Codification for the issuance of SFAS No. 168 in its entirety, including the accounting standards update instructions contained in Appendix B of the statement. SFAS No. 168 is summarized above.
Fair Value Measurement and Disclosure (Topic 820)
In September 2009, the FASB issued ASU No. 2009-12, Topic 820, Investments in Certain Entities That Calculate Net Asset Value per Share (or Its Equivalent), to provide guidance on measuring the fair value of certain alternative investments. This ASU amends FASB ASC 820, Fair Value Measurements and Disclosures, and offers investors a practical expedient for measuring the fair value of
77
NewAlliance Bancshares, Inc.
Notes to Consolidated Financial Statements
investments in certain entities that calculate net asset value per share. As there currently is diversity in practice, this guidance addresses the issue of how to estimate the fair value of various investments in entities, including hedge funds, private equity funds, venture capital funds, offshore fund vehicles, funds of funds and real estate funds. The ASU also requires enhanced disclosures about the nature and risks of investments within its scope that are measured at fair value on a recurring or nonrecurring basis. The guidance is effective for the first reporting period (including interim periods) ending after December 15, 2009, although early adoption was permitted. The Company adopted this guidance as of December 31, 2009 and it did not have a material impact on the Company’s consolidated financial statements.
In August 2009, the FASB issued ASU No. 2009-05, Fair Value Measurements and Disclosures – Measuring Liabilities at Fair Value. This update provides clarification on measuring liabilities at fair value when a quoted price in an active market is not available. In such circumstances, the ASU specifies that a valuation technique should be applied that uses either the quote for the liability when traded as an asset, the quoted prices for similar liabilities or similar liabilities when traded as assets, or another valuation technique consistent with existing fair value measurement guidance. The guidance also states that when estimating the fair value of a liability, a reporting entity is not required to include a separate input or adjustments to other inputs relating to the existence of a restriction that prevents the transfer of the liability. The guidance is effective for the first reporting period beginning after the date of issuance. Management adopted this guidance in the fourth quarter 2009 and it did not have a material impact on the Company’s consolidated financial statements.
In April 2009, the FASB issued new guidance on Determining Fair Value When the Volume and Level of Activity for the Asset or Liability Have Significantly Decreased and Identifying Transactions That Are Not Orderly (FASB ASC 820-10). This guidance provides additional clarification for estimating fair value, in accordance with the fair value measurements and disclosures guidance, when the volume and level of activity for the asset or liability have significantly decreased and also includes guidance on identifying circumstances that indicate a transaction is not orderly for fair value measurements. This guidance was effective for interim and annual periods ending after June 15, 2009, with early adoption permitted for periods ending after March 15, 2009. The Company did not elect early application and the adoption of this guidance did not have a material impact on the Company’s consolidated financial statements.
In February 2008, the FASB issued guidance related to Fair Value Measurements and Disclosures (FASB ASC 820-10), which delayed the January 1, 2008 effective date for all nonfinancial assets and nonfinancial liabilities, to fiscal years beginning after November 15, 2008, and interim periods within those fiscal years. The adoption of this guidance did not have a material effect on the Company’s consolidated financial statements.
Investments – Debt and Equity Securities (Topic 320)
In April 2009, the FASB issued new guidance on the Recognition and Presentation of Other-Than-Temporary Impairments (FASB ASC 320-10), which amends FASB ASC 320, Investments – Debt and Equity Securities, to make the other-than-temporary impairment (“OTTI”) guidance more operational and to improve the presentation of other-than-temporary impairments in the financial statements. This guidance replaced the existing requirement that the entity’s management assert it has both the intent and ability to hold an impaired debt security until recovery with a requirement that management assert it does not have the intent to sell the security, and it is more likely than not it will not have to sell the security before recovery of its cost basis. When an other-than-temporary impairment exists under this stated assertion, the amount of impairment related to the credit loss component would be recognized in earnings while the remaining amount would be recognized in other comprehensive income. This guidance provides increased disclosure about the credit and noncredit components of impaired debt securities that are not expected to be sold and also requires increased and more frequent disclosures regarding expected cash flows, credit losses, and an aging of securities with unrealized losses. Although this amendment does not result in a change in the carrying amount of debt securities, it does require that the portion of an other-than-temporary impairment not related to a credit loss for a held-to-maturity security be recognized in a new category of other comprehensive income and be amortized over the remaining life of the debt security as an increase in the carrying value of the security. This new guidance does not amend existing recognition and measurement guidance for other-than-temporary impairments of equity securities. This guidance was effective for interim and annual periods ending after June 15, 2009, with early adoption permitted for periods ending after March 15, 2009. The Company did not elect early application and the adoption resulted in a $1.0 million cumulative effect adjustment, net of taxes, to increase retained earnings and decrease accumulated other comprehensive income as of April 1, 2009 for the non-credit component of debt securities for which an other-than-temporary impairment was previously recognized. Refer to Note 5 of the Notes to Consolidated Financial Statements for further information on the Company’s adoption of this guidance.
78
NewAlliance Bancshares, Inc.
Notes to Consolidated Financial Statements
Financial Instruments (Topic 825)
In April 2009, the FASB issued new guidance regarding Interim Disclosures about Fair Value of Financial Instruments ( FASB ASC 825-10). FASB ASC 825-10-50 requires disclosures about fair value of financial instruments, whether or not measured on the balance sheet at fair value, in interim financial statements as well as in annual financial statements. Prior to this guidance, fair values for these assets and liabilities were only disclosed annually. This guidance applies to all financial instruments within the scope of FASB ASC 825, Financial Instruments, and requires all entities to disclose the method(s) and significant assumptions used to estimate the fair value. This guidance was effective for interim periods ending after June 15, 2009, with early adoption permitted for periods ending after March 15, 2009. The adoption of this guidance did not have a material impact on the Company’s consolidated financial statements.
Transfers of Financial Assets (Topic 860)
In December 2009, the FASB issued ASU No. 2009-16 codifying the new guidance issued in June 2009 regarding the Transfer of Financial Assets. This guidance requires entities to provide more information about sales of securitized financial assets and similar transactions, particularly if the seller retains some risk in the assets. The guidance eliminates the concept of a qualifying special-purpose entity, changes the requirements for the derecognition of financial assets, and enhances the disclosure requirements for sellers of the assets. This guidance will be effective for the fiscal year beginning after November 15, 2009. The adoption of ASU No. 2009-16 on January 1, 2010 did not have a material impact on the financial statements.
Consolidation (Topic 810)
In December 2009, the FASB issued ASU No. 2009-17 codifying the new guidance issued in June 2009 regarding Consolidations. The guidance requires an enterprise to perform an analysis to determine whether the enterprise’s variable interest or interests give it a controlling financial interest in a variable interest entity (which would result in the enterprise being deemed the primary beneficiary of that entity and, therefore, obligated to consolidate the variable interest entity in its financial statements); to require ongoing reassessments of whether an enterprise is the primary beneficiary of a variable interest entity; to revise guidance for determining whether an entity is a variable interest entity; and to require enhanced disclosures that will provide more transparent information about an enterprise’s involvement with a variable interest entity. The guidance is effective for interim periods as of the beginning of the first annual reporting period beginning after November 15, 2009. The adoption of ASU No. 2009-17 on January 1, 2010 did not have a material impact on the financial statements.
Subsequent Events (Topic 855)
In May 2009, the FASB issued new guidance on Subsequent Events, FASB ASC 855-10, which establishes general standards of accounting for and disclosures of events that occur after the balance sheet date but before the financial statements are issued or are available to be issued. In particular, the guidance sets forth (1) the period after the balance sheet date during which management of a reporting entity will evaluate events or transactions that may occur for potential recognition or disclosure in the financial statements; (2) the circumstances under which an entity will recognize events or transactions occurring after the balance sheet date in its financial statements; and (3) the disclosures that an entity will make about events or transactions that occurred after the balance sheet date. The adoption of this guidance did not have a material impact on the Company’s consolidated financial statements.
Compensation – Retirement Benefits (Topic 715)
In December 2008, the FASB revised the disclosure guidance for Postretirement Benefit Plan Assets (FASB ASC 715-20). This guidance provides for additional disclosures about plan assets of a defined benefit pension or other postretirement plan. Pursuant to the guidance, the added disclosures include: (1) how investment allocation decisions are made by management, (2) major categories of plan assets, and (3) significant concentrations of risk. Additionally, this requires an employer to disclose information about the valuation of plan assets similar to that required under FASB ASC 820, Fair Value Measurements and Disclosures. Those disclosures include: (1) the level within the fair value hierarchy in which fair value measurements of plan assets fall, (2) information about the inputs and valuation techniques used to measure the fair value of plan assets, and (3) a reconciliation of the beginning and ending balances of plan assets valued using significant unobservable inputs. The new disclosures are required to be included in financial statements for fiscal years ending after December 15, 2009. This guidance did not have a material impact on the Company’s consolidated financial statements. Refer to Note 12 of the Notes to Consolidated Financial Statements for further information.
79
NewAlliance Bancshares, Inc.
Notes to Consolidated Financial Statements
Derivatives and Hedging (Topic 815)
In March 2008, the FASB issued disclosure guidance pertaining to Derivatives and Hedging (FASB ASC 815-10). This guidance changes the disclosure requirements regarding derivative instruments and hedging activities and specifically requires (i) qualitative disclosures about objectives and strategies for using derivatives, (ii) quantitative disclosures about fair value amounts of, and gains and losses on, derivative instruments, and (iii) disclosures about credit risk-related contingent features in derivative agreements. The new guidance was effective for financial statements issued for fiscal years beginning after November 15, 2008, with early application encouraged. The adoption did not have a material impact on the Company’s consolidated financial statements.
Intangibles – Goodwill and Other (Topic 350)
In April 2008, the FASB issued guidance about the Determination of the Useful Life of Intangible Assets (FASB ASC 350-30) which amends the factors that should be considered in developing renewal or extension assumptions used to determine the useful life of a recognized intangible asset under FASB ASC 350, Intangibles – Goodwill and Other. The intent of this new guidance is to improve the consistency between the useful life of a recognized intangible asset under FASB ASC 350 and the period of expected cash flows used to measure the fair value of the asset under FASB ASC 805, Business Combinations. This guidance was effective for financial statements issued for fiscal years beginning after December 15, 2008. The adoption did not have a material impact on the Company’s consolidated financial statements.
Business Combinations (Topic 805)
In December 2007, the FASB issued revised guidance for Business Combinations. The revised Business Combination guidance (FASB ASC 805) retains the fundamental requirements that the acquisition method of accounting be used for all business combinations and for an acquirer to be identified for each business combination. The revised guidance requires, among other things, that acquisition-related transaction and restructuring costs will be expensed rather than treated as part of the cost of the acquisition; the acquiring entity in a business combination to recognize all the assets acquired and liabilities assumed in the transaction; establishes the acquisition-date fair value as the measurement objective for all assets acquired and liabilities assumed; and requires the acquirer to provide certain disclosures that will allow users of the financial statements to understand the nature and financial effect of the business combination. This guidance became effective on January 1, 2009 and the adoption of this guidance applies to any future business combinations. When a business combination occurs, it is expected to have a significant effect on NewAlliance’s consolidated financial statements.
| 3. | Fair Value Measurements |
Fair value estimates are made as of a specific point in time based on the characteristics of the financial instruments and relevant market information. In accordance with FASB ASC 820, the fair value estimates are measured within the fair value hierarchy. The hierarchy gives the highest priority to unadjusted quoted prices in active markets for identical assets or liabilities (level 1 measurements) and the lowest priority to unobservable inputs (level 3 measurements). The three levels of the fair value hierarchy under FASB ASC 820 are described below:
Basis of Fair Value Measurement
| Level 1 | Unadjusted quoted prices in active markets that are accessible at the measurement date for identical, unrestricted assets or liabilities; | |
| Level 2 | Quoted prices in markets that are not active, or inputs that are observable either directly or indirectly, for substantially the full term of the asset or liability; | |
| Level 3 | Prices or valuation techniques that require inputs that are both significant to the fair value measurement and unobservable (i.e., supported by little or no market activity). |
When available, quoted market prices are used. In other cases, fair values are based on estimates using present value or other valuation techniques. These techniques involve uncertainties and are significantly affected by the assumptions used and judgments made regarding risk characteristics of various financial instruments, discount rates, estimates of future cash flows, future expected loss experience and other factors. Changes in assumptions could significantly affect these estimates. Derived fair value estimates cannot be substantiated by comparison to independent markets and, in certain cases, could not be realized in an immediate sale of the instrument.
80
NewAlliance
Bancshares, Inc.
Notes to Consolidated Financial Statements
Fair value
estimates are based on existing financial instruments without attempting to estimate
the value of anticipated future business and the value of assets and liabilities
that are not financial instruments. Accordingly, the aggregate fair value amounts
presented do not purport to represent the underlying market value of the Company. |
||
| Fair Value Option | ||
FASB ASC 825-10
allows for the irrevocable option to elect fair value accounting for the initial
and subsequent measurement for certain financial assets and liabilities on a contract-by-contract
basis that may otherwise not be required to be measured at fair value under other
accounting standards. The Company elected the fair value option as of January 1,
2009 for its portfolio of mortgage loans held for sale pursuant to forward loan
sale commitments originated after January 1, 2009 in order to reduce certain timing
differences and better match changes in fair values of the loans with changes in
the value of the derivative forward loan sale contracts used to economically hedge
them. As a result of the surge of refinances resulting from the drop in mortgage
rates within the industry, the balance of loans held for sale and derivative contracts
relating to those loans have increased significantly. The fair value option election
relating to mortgage loans held for sale did not result in a transition adjustment
to retained earnings and instead changes in the fair value have an impact on earnings
as a component of noninterest income. |
||
As of December
31, 2009, mortgage loans held for sale pursuant to forward loan sale commitments
had a fair value of $12.9 million, which includes a negative fair value adjustment
of $222,000. No mortgage loans held for sale were 90 days or more past due as of
December 31, 2009. |
||
| Assets and Liabilities Measured at Fair Value on a Recurring Basis | ||
The following
tables detail the financial instruments carried at fair value on a recurring basis
as of December 31, 2009 and 2008 and indicates the fair value hierarchy of the valuation
techniques utilized by the Company to determine the fair value: |
| December 31, 2009 | ||||||||||||||||||
| Quoted Prices in | ||||||||||||||||||
| Active Markets | Significant | |||||||||||||||||
| for Identical | Significant | Unobservable | ||||||||||||||||
| Assets | Observable Inputs | Inputs | ||||||||||||||||
| (In thousands) | Total | (Level 1) | (Level 2) | (Level 3) | ||||||||||||||
| Securities Available for Sale | ||||||||||||||||||
Marketable equity securities |
$ | 8,783 | $ | 1,283 | $ | 7,500 | $ | - | ||||||||||
Bonds and obligations |
222,078 | 196,060 | 26,018 | - | ||||||||||||||
Auction rate certificates |
24,795 | - | - | 24,795 | ||||||||||||||
Trust preferred equity securities |
33,296 | - | 27,924 | 5,372 | ||||||||||||||
Residential mortgage-backed securities |
2,038,903 | - | 2,038,903 | |||||||||||||||
| Total Securities Available for Sale | $ | 2,327,855 | $ | 197,343 | $ | 2,100,345 | $ | 30,167 | ||||||||||
| Mortgage Loans Held for Sale | 12,908 | - | 12,908 | - | ||||||||||||||
| Mortgage loan derivative assets | 495 | - | 495 | - | ||||||||||||||
| Mortgage loan derivative liabilities | (75 | ) | - | (75 | ) | - | ||||||||||||
| December 31, 2008 | ||||||||||||||||||
| Quoted Prices in | ||||||||||||||||||
| Active Markets | Significant | |||||||||||||||||
| for Identical | Significant | Unobservable | ||||||||||||||||
| Assets | Observable Inputs | Inputs | ||||||||||||||||
| (In thousands) | Total | (Level 1) | (Level 2) | (Level 3) | ||||||||||||||
| Securities Available for Sale | ||||||||||||||||||
Marketable equity securities |
$ | 19,134 | $ | 1,134 | $ | 18,000 | $ | - | ||||||||||
Bonds and obligations |
257,341 | 228,669 | 28,672 | - | ||||||||||||||
Auction rate certificates |
23,479 | - | - | 23,479 | ||||||||||||||
Trust preferred equity securities |
31,265 | - | 28,118 | 3,147 | ||||||||||||||
Residential mortgage-backed securities |
1,597,343 | - | 1,597,343 | - | ||||||||||||||
| Total Securities Available for Sale | $ | 1,928,562 | $ | 229,803 | $ | 1,672,133 | $ | 26,626 | ||||||||||
81
NewAlliance
Bancshares, Inc.
Notes to Consolidated Financial Statements
The following
table presents additional information about assets measured at fair value on a recurring
basis for which the Company utilized Level 3 inputs to determine fair value: |
| Securities Available for Sale | ||||||||||
| For the year ended December 31, | ||||||||||
| (In thousands) | 2009 | 2008 | ||||||||
| Balance at beginning of period | $ | 26,626 | $ | - | ||||||
| Transfer into Level 3 | 3,026 | 32,813 | ||||||||
| Total gains (losses) - (realized/unrealized): | ||||||||||
Included in earnings |
- | - | ||||||||
Included in other comprehensive income |
1,049 | (6,187 | ) | |||||||
| Purchases, issuances, and settlements | - | - | ||||||||
| Discount accretion | 15 | - | ||||||||
| Principal payments | (549 | ) | - | |||||||
| Balance at end of period | $ | 30,167 | $ | 26,626 | ||||||
The following
is a description of the valuation methodologies used for instruments measured at
fair value. |
||
Securities
Available for Sale: Included in the available for sale category are both debt
and equity securities. The Company utilizes Interactive Data Corp., a third-party,
nationally-recognized pricing service (“IDC”) to estimate fair value measurements
for 98.7% of this portfolio. The pricing service evaluates each asset class based
on relevant market information considering observable data that may include dealer
quotes, reported trades, market spreads, cash flows, the U.S. Treasury yield curve,
the LIBOR swap yield curve, trade execution data, market prepayment speeds, credit
information and the bond’s terms and conditions, among other things, but these
prices are not binding quotes. The fair value prices on all investment securities
are reviewed for reasonableness by management through an extensive process. This
review process was implemented to determine any unusual market price fluctuations
and the analysis includes changes in the LIBOR / swap curve, the treasury curve,
mortgage rates and credit spreads as well as a review of the securities inventory
list which details issuer name, coupon and maturity date. The review resulted in
no adjustments to the IDC pricing as of December 31, 2009. Also, management assessed
the valuation techniques used by IDC based on a review of their pricing methodology
to ensure proper hierarchy classifications. The Company’s available for sale
debt securities include auction rate certificates, a pooled trust preferred security
and an individual named trust preferred security which were valued through means
other than quoted market prices due to the Company’s conclusion that the market
for the securities was not active. The fair value for these securities are based
on Level 3 inputs in accordance with FASB ASC 820. |
||
| The major categories of securities available for sale are: | ||||
| • | Marketable
Equity Securities: Included within this category are exchange-traded securities,
including common and preferred equity securities, measured at fair value based on
quoted prices for identical securities in active markets and therefore meet the
Level 1 criteria. Also included are auction rate preferred securities rated AAA,
which are priced at par and are classified as Level 2 of the valuation hierarchy. |
|||
| • | Bonds and
obligations: Included within this category are highly liquid government obligations
and government agency obligations that are measured at fair value based on quoted
prices for identical securities in active markets and therefore are classified within
Level 1 of the fair value hierarchy. Also included in this category are municipal
obligations, corporate obligations and a mortgage mutual fund where the fair values
are estimated by using pricing models (i.e. matrix pricing) with observable market
inputs including recent transactions and/or benchmark yields or quoted prices of
securities with similar characteristics and are therefore classified within Level
2 of the valuation hierarchy. |
|||
| • | Auction
Rate Certificates: The Company owns auction rate certificates which are pools
of government guaranteed student loans issued by state student loan departments.
Due to the lack of liquidity in the auction rate market, the Company obtained a
price from the market maker that factored in credit risk and liquidity premiums
to determine a current fair value market price. The auction rate certificates fall
into the classification of Level 3 within the fair value hierarchy. These securities
were not priced by the pricing service. |
|||
| • | Trust preferred
equity securities: Included in this category are two pooled trust preferred
securities and “individual name” trust preferred securities of financial
companies. One of the pooled trust preferred securities of $2.4 million and an individual
name trust preferred security of $3.0 million are not priced by IDC, both of which
are classified within |
|||
82
NewAlliance
Bancshares, Inc.
Notes to Consolidated Financial Statements
Level 3 of
the valuation hierarchy. The remaining securities are at Level 2 and are priced
by IDC based upon matrix pricing factoring in observable benchmark yields and issuer
spreads. The Company calculates the fair value of the Level 3 pooled trust preferred
security based on a cash flow methodology that uses the Bloomberg AA rated bank
yield curve to discount the current expected cash flows. In order to derive the
fair value of the individual name security, the Company uses the Bloomberg A rated
yield curve to discount the current expected cash flows. Additionally, the low level
of the three month LIBOR rate, the general widening of credit spreads compared to
when these securities were purchased and the reduced level of liquidity in the fixed
income markets, were all factors in the determination of the current fair value
market price. |
||||
Mortgage-Backed
Securities: The Company owns residential mortgage-backed securities. As there
are no quoted market prices available, the fair values of mortgage backed securities
are based upon matrix pricing factoring in observable benchmark yields and issuer
spreads and are therefore classified within Level 2 of the valuation hierarchy. |
||||
Mortgage
Loans Held for Sale: Fair values were estimated utilizing quoted prices for
similar assets in active markets. Any change in the valuation of mortgage loans
held for sale is based upon the change in market interest rates between closing
the loan and the measurement date. As the loans are sold in the secondary market,
the market prices are obtained from Freddie Mac and represent a delivery price which
reflects the underlying price Freddie Mac would pay the Company for an immediate
sale on these mortgages. |
||
Derivatives: Derivative instruments related to loans held for sale are carried at fair value.
Fair value is determined through quotes obtained from actively traded mortgage markets.
Any change in fair value for rate lock commitments to the borrower is based upon
the change in market interest rates between making the rate lock commitment and
the measurement date and, for forward loan sale commitments to the investor, is
based upon the change in market interest rates from entering into the forward loan
sales contract and the measurement date. Both the rate lock commitments to the borrowers
and the forward loan sale commitments to investors are undesignated derivatives
pursuant to the requirements of FASB ASC 815-10, however, the Company has not designated
them as hedging instruments. Accordingly, they are marked to fair value through
earnings. |
||
At December
31, 2009, the effects of fair value measurements for interest rate lock commitment
derivatives and forward loan sale commitments were as follows (mortgage loans held
for sale are shown for informational purposes only): |
| December 31, 2009 | |||||||||
| Notional or | |||||||||
| Principal | Fair Value | ||||||||
| (In thousands) | Amount | Adjustment | |||||||
| Rate Lock Commitments | $ | 20,896 | $ | (75 | ) | ||||
| Forward Sales Commitments | 29,978 | 495 | |||||||
| Mortgage Loans Held for Sale | 13,130 | (222 | ) | ||||||
The Company
sells the majority of its fixed rate mortgage loans with original terms of 15 years
or more on a servicing released basis and receives a servicing released premium
upon sale. The servicing value has been included in the pricing of the rate lock
commitments and loans held for sale. The Company estimates a fallout rate of approximately
13% based upon historical averages in determining the fair value of rate lock commitments.
Although the use of historical averages is based upon unobservable data, the Company
believes that this input is insignificant to the valuation and, therefore, has concluded
that the fair value measurements meet the Level 2 criteria. The collection of upfront
fees from the borrower is the driver of the Company’s low fallout rate. If
this practice were to change, the fallout rate would most likely increase and the
Company would reassess the significance of the fallout rate on the fair value measurement. |
||
Prior to January
1, 2009, the mortgage loans held for sale and the derivatives associated with those
loans had balances of notional amounts and fair value adjustments that did not have
a material impact on the financial statements. |
||
| Assets and Liabilities Measured at Fair Value on a Nonrecurring Basis | ||
The following
tables detail the financial instruments carried at fair value on a nonrecurring
basis as of December 31, 2009 and December 31, 2008 and indicate the fair value
hierarchy of the valuation techniques utilized by the Company to determine the fair
value: |
||
83
NewAlliance
Bancshares, Inc.
Notes to Consolidated Financial Statements
| December 31, 2009 | |||||||||||||||
| Quoted Prices in | |||||||||||||||
| Active Markets | Significant | ||||||||||||||
| for Identical | Significant | Unobservable | |||||||||||||
| Assets | Observable Inputs | Inputs | |||||||||||||
| (In thousands) | Total | (Level 1) | (Level 2) | (Level 3) | |||||||||||
| Loan Servicing Rights | $ | 2,063 | $ | - | $ | - | $ | 2,063 | |||||||
| Other Real Estate Owned | 3,705 | - | - | 3,705 | |||||||||||
| Impaired Loans | 16,733 | - | - | 16,733 | |||||||||||
| December 31, 2008 | |||||||||||||||
| Quoted Prices in | |||||||||||||||
| Active Markets | Significant | ||||||||||||||
| for Identical | Significant | Unobservable | |||||||||||||
| Assets | Observable Inputs | Inputs | |||||||||||||
| (In thousands) | Total | (Level 1) | (Level 2) | (Level 3) | |||||||||||
| Loan Servicing Rights | $ | 3,001 | $ | - | $ | - | $ | 3,001 | |||||||
| Impaired Loans | 8,284 | - | - | 8,284 | |||||||||||
The following
is a description of the valuation methodologies used for instruments measured at
fair value. |
||
Loan Servicing
Rights: A loan servicing right asset represents the amount by which the present
value of the estimated future net cash flows to be received from servicing loans
are expected to more than adequately compensate the Company for performing the servicing.
The fair value of servicing rights is estimated using a present value cash flow
model. The most important assumptions used in the valuation model are the anticipated
rate of the loan prepayments and discount rates. Adjustments are only recorded when
the discounted cash flows derived from the valuation model are less than the carrying
value of the asset. As such, measurement at fair value is on a nonrecurring basis.
Although some assumptions in determining fair value are based on standards used
by market participants, some are based on unobservable inputs and therefore are
classified in Level 3 of the valuation hierarchy. |
||
Other Real
Estate Owned: The Company classifies property acquired through foreclosure or
acceptance of deed-in-lieu of foreclosure as other real estate owned in its financial
statements. Upon foreclosure, the property securing the loan is written down to
fair value. The writedown is based upon differences between the appraised value
and the book value. Appraisals are based upon observable market data such as comparable
sale within the real estate market, however assumptions made in determining comparability
are unobservable and therefore these assets are classified as Level 3 within the
valuation hierarchy. |
||
Impaired
Loans: Impaired loans are measured based on the present value of expected future
cash flows discounted at the loan’s original effective interest rate, at the
loan’s observable market price or the fair value of the collateral if the loan
is collateral dependent. Consequently, measurement at fair value is on a nonrecurring
basis. These loans are written down through a valuation allowance within the Bank’s total loan loss reserve allowance. The fair value of these assets are classified
within Level 3 of the valuation hierarchy and are estimated based on collateral
values supported by appraisals. |
||
| Disclosures about Fair Value of Financial Instruments | ||
The following
methods and assumptions were used by management to estimate the fair value of each
class of financial instruments for which it is practicable to estimate that value. |
||
Cash and
cash equivalents: Carrying value is assumed to represent fair value for cash
and due from banks and short-term investments, which have original maturities of
90 days or less. |
||
| Investment securities: Refer to the above discussion on securities. | ||
Federal
Home Loan Bank of Boston stock: FHLB Boston stock is a non-marketable equity
security which is assumed to have a fair value equal to its carrying value due to
the fact that it can only be redeemed back to the FHLB Boston at par value. |
||
Loans held
for sale: The fair value of residential mortgage loans held for sale is estimated
using quoted market prices provided by government-sponsored entities as described
above. The fair value of SBA loans is estimated using quoted market prices from
a secondary market broker. |
84
NewAlliance
Bancshares, Inc.
Notes to Consolidated Financial Statements
Accrued
income receivable: Carrying value is assumed to represent fair value. |
||
Loans: The fair value of the net loan portfolio is determined by discounting the estimated
future cash flows using the prevailing interest rates and appropriate credit and
prepayment risk adjustments as of period-end at which similar loans would be made
to borrowers with similar credit ratings and for the same remaining maturities.
The fair value of nonperforming loans is estimated using the Bank’s prior credit
experience. |
||
| Derivative Assets: Refer to the above discussion on derivatives. | ||
Deposits: The fair value of demand, non-interest bearing checking, savings and certain
money market deposits is determined as the amount payable on demand at the reporting
date. The fair value of time deposits is estimated by discounting the estimated
future cash flows using rates offered for deposits of similar remaining maturities
as of period-end. |
||
Borrowed
Funds: The fair value of borrowed funds is estimated by discounting the future
cash flows using market rates for similar borrowings. |
||
Derivative
Liabilities: Refer to the above discussion on derivatives. |
||
The following
are the carrying amounts and estimated fair values of the Company’s financial
assets and liabilities as of the periods presented: |
||
| December 31, 2009 | December 31, 2008 | |||||||||||||||
| Carrying | Estimated | Carrying | Estimated | |||||||||||||
| (In thousands) | Amounts | Fair Value | Amounts | Fair Value | ||||||||||||
| Financial Assets | ||||||||||||||||
Cash and due from banks |
$ | 96,927 | $ | 96,927 | $ | 98,131 | $ | 98,131 | ||||||||
Short-term investments |
50,000 | 50,000 | 55,000 | 55,000 | ||||||||||||
Investment securities |
2,568,621 | 2,580,186 | 2,238,344 | 2,247,324 | ||||||||||||
Loans held for sale |
14,659 | 14,659 | 5,361 | 5,361 | ||||||||||||
Loans, net |
4,709,582 | 4,779,888 | 4,912,874 | 5,001,061 | ||||||||||||
Federal Home Loan Bank of Boston stock |
120,821 | 120,821 | 120,821 | 120,821 | ||||||||||||
Accrued income receivable |
33,078 | 33,078 | 35,285 | 35,285 | ||||||||||||
Derivative assets |
495 | 495 | - | - | ||||||||||||
| Financial Liabilities | ||||||||||||||||
Interest and non-interest bearing checking, savings and money market accounts |
$ | 3,542,774 | $ | 3,542,774 | $ | 2,673,571 | $ | 2,673,571 | ||||||||
Time deposits |
1,481,446 | 1,498,126 | 1,774,259 | 1,805,950 | ||||||||||||
Borrowed funds |
1,889,928 | 1,919,918 | 2,376,496 | 2,413,763 | ||||||||||||
Derivative liabilities |
75 | 75 | - | - | ||||||||||||
| 4. Derivative Financial Instruments | ||
The Company
accounts for derivatives in accordance with FASB ASC 815, Derivatives and Hedging, which requires that all derivative instruments be recorded on the consolidated
balance sheets at their fair values. The Company does not enter into derivative
transactions for speculative purposes, does not have any derivatives designated
as hedging instruments, nor is party to a master netting agreement as of December
31, 2009. |
||
Loan Commitments
and Forward Loan Sale Commitments: The Company enters into interest rate lock
commitments with borrowers, to finance residential mortgage loans. Primarily to
mitigate the interest rate risk on these commitments, the Company also enters into
“mandatory” and “best effort” forward loan sale delivery commitments
with investors. The interest rate lock commitments and the forward loan delivery
commitments meet the definition of a derivative, however, the Company has not designated
them as hedging instruments. Upon closing the loan, the loan commitment expires
and the Company records a loan held for sale subject to the same forward loan sale
commitment. Prior to January 1, 2009, the Company accounted for loans held for sale
at the lower or cost or fair value in accordance with accounting guidance for certain
mortgage banking activities. Fluctuations in the fair value of loan commitments,
loans held for sale, and forward loan sale commitments generally move in opposite
directions, and the net impact of the changes in these valuations on net income
is generally inconsequential to the financial statements. |
85
NewAlliance
Bancshares, Inc.
Notes to Consolidated Financial Statements
| The decrease in mortgage rates at the end of 2008 through December 31, 2009 has resulted in a large increase in mortgage loan refinances and hence, the Company’s committed loans and forward loan sale commitments have significantly increased. The Company has elected the fair value option for loans held for sale originated after January 1, 2009 and therefore, those loans held for sale will be recorded in the consolidated balance sheets at fair value with any gains and losses recorded in earnings. See Footnote 3, Fair Value Measurements, for additional information. | ||
| The following table summarizes the Company’s derivative positions at and for the year ended December 31, 2009: | ||
| Notional or | |||||||||
| Principal | Fair Value | ||||||||
| (In thousands) | Amount | Adjustment (1) | |||||||
| Interest Rate Lock Commitments | $ | 20,896 | $ | (75 | ) | ||||
| Forward Sales Commitments | 29,978 | 495 | |||||||
| (1) An immaterial portion of these amounts was attributable to changes in instrument-specific credit risk. | ||
| The following two tables present the fair values of the Company’s derivative instruments and their effect on the Statement of Income: | ||
| Fair Values of Derivative Instruments |
| Asset Derivatives | Liability Derivatives | |||||||||||||
| December 31, 2009 | ||||||||||||||
| Balance Sheet | Balance Sheet | |||||||||||||
| (In thousands) | Location | Fair Value | Location | Fair Value | ||||||||||
Derivatives not designated as hedging instruments Interest rate contracts |
Other Assets | $ | 495 | Other Liabilities | $ | 75 | ||||||||
Total derivatives not designated as hedging instruments |
$ | 495 | $ | 75 | ||||||||||
| Effect of Derivative Instruments on the Statement of Income | |||||||
| For the Year Ended | |||||||
| December 31, 2009 | |||||||
| Location of Gain or (Loss) | Amount of Gain or | ||||||
| Recognized in Income on | (Loss) Recognized in | ||||||
| (In thousands) | Derivatives | Income on Derivatives | |||||
Derivatives not designated as hedging instruments |
|||||||
Interest rate contracts |
Non-interest income | $ | 420 | ||||
Total derivatives not designated as hedging instruments |
$ | 420 | |||||
86
NewAlliance
Bancshares, Inc.
Notes to Consolidated Financial Statements
| 5. Investment Securities | ||
The amortized
cost, gross unrealized gains, gross unrealized losses and estimated fair values
of investment securities at December 31, 2009 and 2008 are as follows: |
| December 31, 2009 | December 31, 2008 | |||||||||||||||||||||||||||
| Gross | Gross | Gross | Gross | |||||||||||||||||||||||||
| Amortized | unrealized | unrealized | Fair | Amortized | unrealized | unrealized | Fair | |||||||||||||||||||||
| (In thousands) | cost | gains | losses | value | cost | gains | losses | value | ||||||||||||||||||||
| Available for sale | ||||||||||||||||||||||||||||
U.S. Treasury obligations |
$ | 597 | $ | - | $ | - | $ | 597 | $ | 596 | $ | 1 | $ | - | $ | 597 | ||||||||||||
U.S. Government sponsored enterprise obligations |
198,692 | 1,621 | (583 | ) | 199,730 | 228,844 | 4,586 | (81 | ) | 233,349 | ||||||||||||||||||
Corporate obligations |
8,139 | 378 | - | 8,517 | 8,178 | - | (232 | ) | 7,946 | |||||||||||||||||||
Other bonds and obligations |
14,625 | 127 | (1,518 | ) | 13,234 | 17,654 | 128 | (2,333 | ) | 15,449 | ||||||||||||||||||
Auction rate certificates |
27,550 | - | (2,755 | ) | 24,795 | 28,000 | - | (4,521 | ) | 23,479 | ||||||||||||||||||
Marketable equity securities |
8,567 | 216 | - | 8,783 | 19,039 | 103 | (8 | ) | 19,134 | |||||||||||||||||||
Trust preferred equity securities |
48,754 | - | (15,458 | ) | 33,296 | 47,708 | - | (16,443 | ) | 31,265 | ||||||||||||||||||
Private label residential mortgage-backed securities |
23,871 | - | (3,015 | ) | 20,856 | 33,027 | - | (7,891 | ) | 25,136 | ||||||||||||||||||
Residential mortgage-backed securities |
1,951,297 | 68,393 | (1,643 | ) | 2,018,047 | 1,543,403 | 30,019 | (1,215 | ) | 1,572,207 | ||||||||||||||||||
Total available for sale |
2,282,092 | 70,735 | (24,972 | ) | 2,327,855 | 1,926,449 | 34,837 | (32,724 | ) | 1,928,562 | ||||||||||||||||||
| Held to maturity | ||||||||||||||||||||||||||||
Residential mortgage-backed securities |
230,596 | 11,360 | - | 241,956 | 299,222 | 8,832 | (38 | ) | 308,016 | |||||||||||||||||||
Other bonds |
10,170 | 243 | (38 | ) | 10,375 | 10,560 | 186 | - | 10,746 | |||||||||||||||||||
Total held to maturity |
240,766 | 11,603 | (38 | ) | 252,331 | 309,782 | 9,018 | (38 | ) | 318,762 | ||||||||||||||||||
Total securities |
$ | 2,522,858 | $ | 82,338 | $ | (25,010 | ) | $ | 2,580,186 | $ | 2,236,231 | $ | 43,855 | $ | (32,762 | ) | $ | 2,247,324 | ||||||||||
The securities portfolio is reviewed on a monthly basis for the presence of other-than-temporary
impairment (“OTTI”). During the second quarter of 2009 new OTTI guidance
issued by the FASB was adopted for debt securities that requires credit related
OTTI be recognized in earnings while non-credit related OTTI be recognized in other
comprehensive income (“OCI”) if there is no intent to sell or will not
be required to sell the security. If an equity security is deemed other-than-temporarily
impaired, the full impairment is considered to be credit-related and a charge to
earnings would be recorded. The new guidance also required that previously recorded
impairment charges which did not relate to a credit loss should be reclassified
from retained earnings to accumulated other comprehensive income (“AOCI”).
Therefore, during the quarter ended June 30, 2009, the Company reclassified the
non-credit related portion of a previously recorded OTTI loss. Also, during 2009
the Company recorded OTTI losses on two securities in accordance with this FASB
guidance, as described below. |
||||
| • | A credit related
OTTI loss in the amount of $816,000 was recorded against the Company’s position
in an adjustable rate mortgage mutual fund that holds positions in non-agency mortgage-backed
securities. During the second quarter of 2009, the fund experienced its first realized
loss on a mortgage investment and management determined that the dollar amount of
securities carrying a rating of CCC or lower had increased since the March 31, 2009
quarter-end. This decrease in the credit quality of the securities coupled with
the loss recognized by the fund, resulted in management’s determination that
the fund was other-than-temporarily impaired. The non-credit related OTTI was $1.9
million, or $1.2 million, net of tax, and was recognized in OCI and a credit impairment of $626,000 was recorded.
The credit-related impairment was determined by applying the midpoint of the estimated
default rates of CCC, CC and C rated securities to the investments in the portfolio
and adjusting the par value downward by these estimated losses. A white paper written
by one of the rating agencies outlining estimated default ranges on residential
private mortgage-backed securities based upon credit rating was utilized by the
Company for its analysis. In December 2009, an additional credit impairment was
recorded in the amount of $190,000 which was determined using the same methodology
and the previously recorded non-credit impairment was reduced by $190,000, or $122,000, net of tax, as the
market value of the security increased since June 2009. As of December 31, 2009,
the fund has a current book value of $8.1 million. There is no intent to sell nor
is it more likely than not that the Company will be required to sell these securities. |
|||
| • | A credit related
OTTI loss in the amount of $581,000 was recorded on a pooled trust preferred security
in December 2009 based on cash flow analyses. The Company received nine cash flow
scenarios from the underwriter which were utilized by management to analyze this
security for potential OTTI. The nine scenarios covered various default rates, recovery
rates and prepayment options over different time periods. Two of the nine cash flow
analyses indicated impairment over the life of the security. The driver of the indicated
impairment was the recovery rate, which was modeled at 0% in these two cash flow
scenarios. As the severity of the estimated loss in these two cash flow scenarios
doubled since the prior OTTI analysis in the third quarter of 2009 and due to the
fact that the past history of the security indicates that there have not been any
recoveries to date from securities that have defaulted, the Company recorded a |
|||
87
NewAlliance
Bancshares, Inc.
Notes to Consolidated Financial Statements
credit-related
impairment charge. The credit impairment represents the average loss of the two
negative cash flow analyses. The non-credit related impairment of $1.2 million, or $748,000, net of tax, was
recognized in OCI. After the write-down, the cost basis of the security was $1.4
million at December 31, 2009. There is no intent to sell nor is it more likely than
not that the Company will be required to sell this security. |
||||
During 2008, one of the “individual name” trust preferred securities was
deemed to be other-than-temporarily impaired and a charge of $1.6 million was recorded
in the third quarter. Upon the adoption of the OTTI guidance discussed above, the
Company recorded a cumulative effect adjustment that increased retained earnings
and decreased AOCI by $1.6 million, or $1.0 million, net of tax. |
||||
The following tables present the fair value of investments with continuous unrealized
losses for less than one year and those that have been in a continuous loss position
for more than one year as of December 31, 2009 and December 31, 2008. Of the securities
summarized, 28 issues have unrealized losses for less than twelve months and 44
have unrealized losses for twelve months or more at December 31, 2009. This compares
to a total of 145 issues that had an unrealized loss at December 31, 2008, of which
142 were in a continuous loss position for less than one year and three had unrealized
losses for more than one year. |
||||
| December 31, 2009 | |||||||||||||||||||||
| Less Than One Year | More Than One Year | Total | |||||||||||||||||||
| Fair | Unrealized | Fair | Unrealized | Fair | Unrealized | ||||||||||||||||
| (In thousands) | value | losses | value | losses | value | losses | |||||||||||||||
| U. S. Government sponsored enterprise obligations | $ | 83,108 | $ | 542 | $ | 3,774 | $ | 41 | $ | 86,882 | $ | 583 | |||||||||
| Corporate obligations | - | - | - | - | - | - | |||||||||||||||
| Other bonds and obligations | 7,500 | 1,556 | - | - | 7,500 | 1,556 | |||||||||||||||
| Auction rate certificates | - | - | 24,795 | 2,755 | 24,795 | 2,755 | |||||||||||||||
| Marketable equity securities | - | - | - | - | - | - | |||||||||||||||
| Trust preferred equity securities | 249 | 1,160 | 33,047 | 14,298 | 33,296 | 15,458 | |||||||||||||||
| Private label residential mortgage-backed securities | - | - | 20,856 | 3,015 | 20,856 | 3,015 | |||||||||||||||
| Residential mortgage-backed securities | 246,600 | 1,643 | - | - | 246,600 | 1,643 | |||||||||||||||
Total securities with unrealized losses |
$ | 337,457 | $ | 4,901 | $ | 82,472 | $ | 20,109 | $ | 419,929 | $ | 25,010 | |||||||||
| December 31, 2008 | |||||||||||||||||||||
| Less Than One Year | More Than One Year | Total | |||||||||||||||||||
| Fair | Unrealized | Fair | Unrealized | Fair | Unrealized | ||||||||||||||||
| (In thousands) | value | losses | value | losses | value | losses | |||||||||||||||
| U. S. Government sponsored enterprise obligations | $ | 5,278 | $ | 81 | $ | - | $ | - | $ | 5,278 | $ | 81 | |||||||||
| Corporate obligations | 7,945 | 232 | - | - | 7,945 | 232 | |||||||||||||||
| Other bonds and obligations | 6,659 | 2,333 | - | - | 6,659 | 2,333 | |||||||||||||||
| Auction rate certificates | 23,479 | 4,521 | - | - | 23,479 | 4,521 | |||||||||||||||
| Marketable equity securities | 520 | 8 | - | - | 520 | 8 | |||||||||||||||
| Trust preferred equity securities | 25,031 | 11,311 | 6,234 | 5,132 | 31,265 | 16,443 | |||||||||||||||
| Private label residential mortgage-backed securities | 25,136 | 7,891 | - | - | 25,136 | 7,891 | |||||||||||||||
| Residential mortgage-backed securities | 148,432 | 1,253 | - | - | 148,432 | 1,253 | |||||||||||||||
Total securities with unrealized losses |
$ | 242,480 | $ | 27,630 | $ | 6,234 | $ | 5,132 | $ | 248,714 | $ | 32,762 | |||||||||
Management
believes that no individual unrealized loss as of December 31, 2009 represents a
credit-related other-than-temporary impairment, based on its detailed monthly review
of the securities portfolio. Among other things, the other-than-temporary impairment
review of the investment securities portfolio focuses on the combined factors of
percentage and length of time by which an issue is below book value as well as consideration
of issuer specific (present value of cash flows expected to be collected, issuer
rating changes and trends, credit worthiness and review of underlying collateral),
broad market details and the Company’s intent to sell the security or if it
is more likely than not that the Company will be required to sell the debt security
before recovering its cost. The Company also considers whether the depreciation
is due to interest rates or credit risk. The following paragraphs outline the Company’s position related to unrealized losses in its investment securities portfolio
at December 31, 2009. |
||
The unrealized
loss on mortgage-backed securities issued by private institutions is primarily concentrated
in one BBB rated private-label mortgage-backed security which is substantially
paid down, well seasoned and of an earlier vintage that has not been significantly
affected by high delinquency levels or vulnerable to lower collateral coverage as
seen in later issued pools. Widening in non-agency mortgage spreads since the date
purchased is the primary factor for the unrealized losses reported on private label
mortgage-backed securities. None of the securities are backed by subprime mortgage
loans and none have suffered losses. One of the private issue securities was downgraded
to BBB during the third quarter of 2009 and the remaining securities are single
A rated |
88
NewAlliance
Bancshares, Inc.
Notes to Consolidated Financial Statements
through AAA
rated. The unrealized losses reported on mortgage-backed securities relate to securities
issued by FNMA and FHLMC due to changes in market interest rates since the date
purchased. All mortgage-backed securities are still paying principal and interest
and are expected to continue to pay their contractual cash flows. The Company does
not have any commercial mortgage-backed securities. Management’s review of
the above factors and issuer specific data concluded that the private-label and
agency mortgage- backed securities are not other-than-temporarily impaired. |
||
The unrealized
losses on other bonds and obligations primarily relates to the non-credit related
OTTI loss on a position in an adjustable rate mortgage mutual fund that holds positions
in non-agency mortgage-backed securities that are facing negative mark to market
pressures due to widening spreads in non-agency mortgage products. Although the
fund has experienced declines in credit ratings since the beginning of the year,
it was not due to customer redemptions or forced selling of the investments. The
fund recorded its first loss which factored into management’s determination
that the fund was other-than-temporarily impaired. The investment carries a market
value to book value ratio of 81.21%, a weighted average underlying investment credit
rating of A+ and it continues to pay normal monthly dividends. There is no intent
to sell nor is it more likely than not that the Company will be required to sell
these securities. |
||
The unrealized
losses on auction rate certificates relate to certificates issued by an investment
banking firm and are pools of government-guaranteed student loans that are issued
by state student loan departments. In the first half of 2008, the auction process
for auction rate certificates began to freeze resulting from the problems in the
credit markets. These securities are currently rated AAA and are still paying their
contractual cash flows and are expected to continue to pay their contractual cash
flows. Management has concluded that no other-than-temporary impairment exists as
of December 31, 2009. In 2008, the underwriter entered into a settlement agreement
with several state regulatory agencies, whereby they have agreed to repurchase these
certificates from both their retail and institutional customers at par. The institutional
buy-back of these securities is scheduled on or around June 30, 2010. |
||
Trust preferred
securities are comprised of two pooled trust preferreds with an amortized cost of $6.1
million, one of which is rated BB and the other is rated BBB-. The remaining $42.6
million are comprised of twelve “individual names” issues with the following
ratings: $6.0 million rated A to A-, $14.5 million rated BBB+ and $22.1 million rated
BB to BB+. Except for the BB rated pooled trust preferred security the unrealized
losses reported for trust preferred equity securities relate to the financial and
liquidity stresses in the fixed income markets. Although the ratings on some issues
have been reduced since December 31, 2008, all are currently paying the contractual
principal and interest payments. A detailed review of the two pooled trust preferreds
and the “individual names” trust preferred equity securities was completed.
This review included an analysis of collateral reports, cash flows, stress default
levels and financial ratios of the underlying issuers. As discussed above, a credit
related OTTI loss of $581,000 was recorded through earnings during the year ended
December 31, 2009 on one of the pooled trust preferred. |
||
The Company
has no intent to sell nor is it more likely than not that the Company will be required
to sell any of the securities contained in the table for a period of time necessary
to recover the unrealized losses, which may be until maturity. |
||
The following
table presents the changes in the credit loss component of the amortized cost of
debt securities available for sale that have been written down for other-than-temporary
impairment loss and recognized in earnings. The credit loss component represents
the difference between the present value of expected future cash flows and the amortized
cost basis of the security prior to considering credit losses. |
| Twelve Months Ended | ||||||
| December 31, | ||||||
| (In thousands) | 2009 | |||||
| Balance, beginning of period | $ | - | ||||
| Additions: | ||||||
Initital credit impairments which were not previously recognized |
||||||
as a component of earnings |
1,207 | |||||
Subsequent credit impairments |
190 | |||||
| Reductions: | ||||||
Securities sold |
- | |||||
| Balance, end of period | $ | 1,397 | ||||
As of December
31, 2009, the amortized cost and fair values of debt securities and short-term obligations,
by contractual maturity, are shown below. Expected maturities may differ from contracted
maturities because issuers may have the right to call or prepay obligations with
or without call or prepayment penalties. |
89
NewAlliance
Bancshares, Inc.
Notes to Consolidated Financial Statements
| Available for Sale | Held to Maturity | ||||||||||||||
| (In thousands) | Amortized cost | Fair value | Amortized cost | Fair value | |||||||||||
| December 31, 2009 | |||||||||||||||
Due in one year or less |
$ | 74,141 | $ | 71,898 | $ | 1,780 | $ | 1,808 | |||||||
Due after one year through five years |
107,208 | 108,457 | 6,840 | 6,999 | |||||||||||
Due after five years through ten years |
57,542 | 57,357 | 550 | 568 | |||||||||||
Due after ten years |
59,466 | 42,457 | 1,000 | 1,000 | |||||||||||
Mortgage-backed securities |
1,975,168 | 2,038,903 | 230,596 | 241,956 | |||||||||||
Total debt securities |
$ | 2,273,525 | $ | 2,319,072 | $ | 240,766 | $ | 252,331 | |||||||
Securities
with a fair value of approximately $673.8 million and $1.12 billion at December 31,
2009 and 2008, respectively, were pledged to secure public deposits, repurchase
agreements and FHLB borrowings. |
||
Proceeds from
sales of available for sale securities for the years ending December 31, 2009, 2008
and 2007 were $169.5 million, $286.3 million and $842.3 million, respectively. The
following is a summary of realized gains and losses on sales of securities available
for sale during the periods presented: |
| Debt Securities | Equity Securities | ||||||||||||||||||||||||
| Year Ended December 31, | Year Ended December 31, | ||||||||||||||||||||||||
| (In thousands) | 2009 | 2008 | 2007 | 2009 | 2008 | 2007 | |||||||||||||||||||
| Realized gains | $ | 7,367 | $ | 5,814 | $ | 2,142 | $ | - | $ | 27 | $ | 841 | |||||||||||||
| Realized losses | (53 | ) | (20 | ) | (29,241 | ) | - | (1,297 | ) | (434 | ) | ||||||||||||||
| 6. Loans | ||
| The composition of the Company’s loan portfolio was as follows: |
| December 31, | ||||||||||
| (In thousands) | 2009 | 2008 | ||||||||
| Residential real estate | $ | 2,382,514 | $ | 2,524,638 | ||||||
| Commercial real estate | 1,100,880 | 1,077,200 | ||||||||
| Construction | ||||||||||
Residential |
13,789 | 21,380 | ||||||||
Commercial |
132,370 | 143,610 | ||||||||
| Commercial business | 411,211 | 458,952 | ||||||||
| Consumer | ||||||||||
Home equity and equity lines of credit |
705,673 | 714,444 | ||||||||
Other |
15,608 | 22,561 | ||||||||
Total consumer |
721,281 | 737,005 | ||||||||
Total loans |
4,762,045 | 4,962,785 | ||||||||
Allowance for loan losses |
(52,463 | ) | (49,911 | ) | ||||||
Total loans, net |
$ | 4,709,582 | $ | 4,912,874 | ||||||
As of December
31, 2009 and 2008, the Company’s residential real estate loan, home equity
and equity line of credit portfolios are entirely collateralized by one- to four-family
homes and condominiums, the majority of which are located in Connecticut and Massachusetts.
The commercial real estate loan and commercial construction portfolios are collateralized
primarily by multi-family, commercial and industrial properties located predominantly
in Connecticut and Massachusetts. A variety of different assets, including accounts
receivable, inventory and property, plant and equipment, collateralized the majority
of commercial business loans. The Company does not originate or directly invest
in subprime loans. |
90
NewAlliance Bancshares, Inc.
Notes to Consolidated Financial Statements
Allowance for Loan Losses
The
following table provides a summary of activity in the allowance for loan losses
for the periods presented:
| Year Ended December 31, | |||||||||||||
| (In thousands) | 2009 | 2008 | 2007 | ||||||||||
| Balance at beginning of period | $ | 49,911 | $ | 43,813 | $ | 37,408 | |||||||
| Net allowance gained through acquisition | - | - | 3,894 | ||||||||||
| Provisions charged to operations | 18,000 | 13,400 | 4,900 | ||||||||||
| Charge-offs | |||||||||||||
Residential real estate loans |
3,368 | 611 | 47 | ||||||||||
Commercial real estate loans |
3,101 | 926 | 840 | ||||||||||
Commercial construction loans |
3,102 | 4,213 | 285 | ||||||||||
Commercial business loans |
6,547 | 1,973 | 2,267 | ||||||||||
Consumer loans |
1,156 | 1,090 | 786 | ||||||||||
Total charge-offs |
17,274 | 8,813 | 4,225 | ||||||||||
| Recoveries | |||||||||||||
Residential real estate loans |
175 | 13 | 278 | ||||||||||
Commercial real estate loans |
560 | 275 | 353 | ||||||||||
Commercial construction loans |
- | - | 11 | ||||||||||
Commercial business loans |
859 | 1,090 | 948 | ||||||||||
Consumer loans |
232 | 133 | 246 | ||||||||||
Total recoveries |
1,826 | 1,511 | 1,836 | ||||||||||
| Net charge-offs | 15,448 | 7,302 | 2,389 | ||||||||||
| Balance at end of period | $ | 52,463 | $ | 49,911 | $ | 43,813 | |||||||
Loan Servicing Rights
The components of loan servicing rights are as follows:
| Year Ended December 31, | |||||||||||||
| (In thousands) | 2009 | 2008 | 2007 | ||||||||||
| Loan servicing rights | |||||||||||||
Balance at beginning of year |
$ | 3,001 | $ | 3,776 | $ | 3,063 | |||||||
Additions |
295 | 392 | 1,582 | ||||||||||
Amortization |
(711 | ) | (767 | ) | (869 | ) | |||||||
Impairment adjustment |
(522 | ) | (400 | ) | - | ||||||||
Balance at end of period |
$ | 2,063 | $ | 3,001 | $ | 3,776 | |||||||
The fair value of the capitalized loan servicing rights is approximately $550,000 greater than its carrying value at December 31, 2009 and approximated its carrying value at December 31, 2008. The Company services residential real estate mortgage loans that it has sold without recourse to third parties. Although the Company continues to have a portfolio of serviced residential real estate loans, NewAlliance began selling the majority of residential real estate loans in the secondary market on a servicing released basis in 2007. The Company is also involved in the SBA loan secondary market. The Company currently sells the guaranteed portion of SBA loans that meet certain criteria while retaining the servicing rights. The aggregate of all loans serviced for others approximates $319.6 million and $376.3 million as of December 31, 2009 and 2008, respectively.
Related
Party Loans
As of December 31, 2009 and 2008, outstanding loans to related
parties totaled approximately $91,000 and $93,000, respectively. Related parties
include directors and executive officers of the Company and its subsidiaries and
their respective affiliates in which they have a controlling interest, immediate
family members and owners of 10% or more of the Company’s stock. For the years
ended December 31, 2009 and 2008, all related party loans were performing.
91
NewAlliance Bancshares, Inc.
Notes to Consolidated Financial Statements
Nonperforming Assets
Nonperforming
assets include loans for which the Company does not accrue interest (nonaccrual
loans), loans 90 days past due and still accruing interest, restructured loans due
to a weakening in the financial condition of the borrower and other real estate
owned. There were no accruing loans included in the Company’s nonperforming
assets as of December 31, 2009 and 2008. As of December 31, 2009 and 2008, nonperforming
assets were:
| December 31, | ||||||||
| (In thousands) | 2009 | 2008 | ||||||
| Nonaccrual loans | $ | 50,507 | $ | 38,331 | ||||
| Other real estate owned | 3,705 | 2,023 | ||||||
Total nonperforming assets |
$ | 54,212 | $ | 40,354 | ||||
| Troubled debt restructured loans included in nonaccrual loans above | 3,294 | - | ||||||
For the years ended December 31, 2009, 2008 and 2007, had interest been accrued at contractual rates on nonaccrual and restructured loans, such income would have approximated $2.8 million, $1.6 million and $1.1 million, respectively. As of December 31, 2009, 2008 and 2007, no significant additional funds were committed to customers whose loans have been restructured or were nonperforming.
Impaired Loans
As of December 31, 2009 and 2008, the recorded investment
in loans considered to be impaired was $47.2 million and $22.9 million, respectively.
As of December 31, 2009 and 2008, all loans considered impaired by the Company had
a reserve allocation which totaled $3.6 million and $3.1 million, respectively.
The average recorded investment in impaired loans for the years ended December 31,
2009, 2008 and 2007 was $47.6 million, $17.3 million and $10.5 million, respectively.
The recognition of interest income on impaired loans includes an individual assessment
of each loan. When payments on impaired loans are received, interest income is recorded
on a cash basis or is applied to principal based on an individual assessment of
each loan. Interest income recognized on impaired loans was approximately $569,000,
$786,000 and $656,000 for the years ended December 31, 2009, 2008 and 2007, respectively.
As of December 31, 2009, there were no commitments to lend additional funds for
loans considered impaired.
7. Premises and Equipment
As of December 31, 2009 and 2008, premises and equipment consisted of:
| December 31, | ||||||||
| (In thousands) | 2009 | 2008 | ||||||
| Land and land improvements | $ | 7,165 | $ | 7,165 | ||||
| Buildings | 73,265 | 72,010 | ||||||
| Furniture and equipment | 51,920 | 52,861 | ||||||
| Leasehold improvements | 14,791 | 13,930 | ||||||
| 147,141 | 145,966 | |||||||
| Less accumulated depreciation and amortization | (90,058 | ) | (86,547 | ) | ||||
| Premises and equipment, net | $ | 57,083 | $ | 59,419 | ||||
Total depreciation and amortization expenses amounted to $6.3 million, $6.8 million and $7.0 million for the years ended December 31, 2009, 2008 and 2007, respectively.
92
NewAlliance Bancshares, Inc.
Notes to Consolidated Financial Statements
8. Goodwill and Identifiable Intangible Assets
The changes in the carrying amount of goodwill and identifiable intangible assets for the years ended December 31, 2009 and 2008 are summarized as follows:
| Total | ||||||||||||
| Core Deposits | Identifiable | |||||||||||
| and Customer | Intangible | |||||||||||
| (In thousands) | Goodwill | Relationship | Assets | |||||||||
| Balance, December 31, 2007 | $ | 531,191 | $ | 53,316 | $ | 53,316 | ||||||
| Other | (4,024 | ) | ||||||||||
| Amortization expense | - | (9,456 | ) | (9,456 | ) | |||||||
| Balance, December 31, 2008 | $ | 527,167 | $ | 43,860 | $ | 43,860 | ||||||
| Amortization expense | - | (8,501 | ) | (8,501 | ) | |||||||
| Balance, December 31, 2009 | $ | - | $ | 35,359 | $ | 35,359 | ||||||
| Estimated amortization expense for the year ending: | ||||||||||||
2010 |
7,811 | 7,811 | ||||||||||
2011 |
7,556 | 7,556 | ||||||||||
2012 |
7,556 | 7,556 | ||||||||||
2013 |
7,461 | 7,461 | ||||||||||
2014 |
3,617 | 3,617 | ||||||||||
Thereafter |
1,358 | 1,358 | ||||||||||
The reduction of $4.0 million in goodwill in 2008, shown above as other, was primarily due to a reduction of unrecognized tax benefits for tax positions taken in prior years based on the settlement of an IRS examination.
There were no impairments recorded for goodwill and identifiable intangible assets since inception.
The components of identifiable intangible assets are core deposit and customer relationships and had the following balances at December 31, 2009:
| Original | Balance | |||||||||||
| Recorded | Cumulative | December 31, | ||||||||||
| (In thousands) | Amount | Amortization | 2009 | |||||||||
Core deposit and customer relationships |
$ | 86,908 | $ | 51,549 | $ | 35,359 | ||||||
9. Other Assets
Components of other assets are as follows:
| December 31, | ||||||||
| (In thousands) | 2009 | 2008 | ||||||
| Deferred tax asset, net | $ | 14,078 | $ | 30,339 | ||||
| Accrued interest receivable | 33,078 | 35,285 | ||||||
| Investments in limited partnerships and other investments | 8,003 | 9,171 | ||||||
| Receivables arising from securities transactions | 14,165 | 9,892 | ||||||
| Prepaid FDIC assessments | 26,001 | 128 | ||||||
| All other | 18,616 | 16,858 | ||||||
Total other assets |
$ | 113,941 | $ | 101,673 | ||||
93
NewAlliance Bancshares, Inc.
Notes to Consolidated Financial Statements
10. Deposits
A summary of deposits
by account type is as follows:
| December 31, | ||||||||
| (In thousands) | 2009 | 2008 | ||||||
| Savings | $ | 1,817,787 | $ | 1,463,341 | ||||
| Money market | 790,453 | 346,522 | ||||||
| NOW | 400,176 | 368,730 | ||||||
| Demand | 534,358 | 494,978 | ||||||
| Time | 1,481,446 | 1,774,259 | ||||||
Total deposits |
$ | 5,024,220 | $ | 4,447,830 | ||||
A summary of time deposits by remaining period to maturity is as follows:
| December 31, | ||||||||
| (In thousands) | 2009 | 2008 | ||||||
| Within three months | $ | 520,129 | $ | 327,834 | ||||
| After three months, but within one year | 541,770 | 896,527 | ||||||
| After one year, but within three years | 322,081 | 436,263 | ||||||
| After three years | 97,466 | 113,635 | ||||||
Total time deposits |
$ | 1,481,446 | $ | 1,774,259 | ||||
As of December 31, 2009 and 2008 time deposits in denominations of $100,000 or more were approximately $478.1 and $563.0 million, respectively. Interest expense paid on these deposits was approximately $14.2 million, $19.9 million and $32.4 million for the years ended December 31, 2009, 2008 and 2007, respectively.
11. Borrowings
The following is a summary of the Company’s borrowed funds:
| December 31, | Weighted | December 31, | Weighted | |||||||||||
| (In thousands) | 2009 | Average Rate | 2008 | Average Rate | ||||||||||
| FHLB advances (1) | $ | 1,755,533 | 4.15 | % | $ | 2,190,914 | 4.30 | % | ||||||
| Repurchase agreements | 112,095 | 2.55 | 159,530 | 1.65 | ||||||||||
| Mortgage loans payable | 1,165 | 4.66 | 1,317 | 4.93 | ||||||||||
| Junior subordinated debentures issued to affiliated trusts (2) | 21,135 | 3.88 | 24,735 | 5.57 | ||||||||||
Total borrowings |
$ | 1,889,928 | 4.05 | % | $ | 2,376,496 | 4.14 | % | ||||||
| (1) | Includes fair value adjustments on acquired borrowings, in accordance with purchase accounting standards of $3.1 million and $5.8 million at December 31, 2009 and December 31, 2008, respectively. | |
| (2) | Includes fair value adjustments on acquired borrowings, in accordance with purchase accounting standards of of $0 and $100,000 at December 31, 2009 and December 31, 2008, respectively. The trusts were organized to facilitate the issuance of “trust preferred” securities. The Company acquired these subsidiaries when it acquired Alliance Bancorp of New England, Inc. and Westbank Corporation, Inc. The affiliated trusts are wholly-owned subsidiaries of the Company and the payments of these securities are irrevocably and unconditionally guaranteed by the Company. |
The acquisition fair value adjustments (premiums) are being amortized as an adjustment to interest expense on borrowings over their remaining term using the level yield method.
94
NewAlliance Bancshares, Inc.
Notes to Consolidated Financial Statements
The following schedule presents the contractual maturities of the Company’s borrowings as of December 31, 2009:
| (In thousands) | 2010 | 2011 | 2012 | 2013 | 2014 | 2015 + | Total | |||||||||||||||||||||
| FHLB advances (1) | $ | 519,964 | $ | 417,982 | $ | 223,820 | $ | 192,271 | $ | 138,215 | $ | 260,160 | $ | 1,752,412 | ||||||||||||||
| Repurchase agreements | 87,095 | - | 25,000 | - | - | - | 112,095 | |||||||||||||||||||||
| Mortgage loans payable | - | - | - | 1,165 | - | - | 1,165 | |||||||||||||||||||||
| Junior subordinated debentures issued to affiliated trusts | - | - | - | - | - | 21,135 | 21,135 | |||||||||||||||||||||
| Total borrowings | $ | 607,059 | $ | 417,982 | $ | 248,820 | $ | 193,436 | $ | 138,215 | $ | 281,295 | $ | 1,886,807 | ||||||||||||||
| (1) | Balances are contractual maturities and exclude $3.1 million in fair value adjustments on acquired balances. |
FHLB advances are secured by the Company’s investment in FHLB Boston stock, a blanket security agreement and other eligible investment securities. This agreement requires the Bank to maintain as collateral certain qualifying assets, principally mortgage loans. Investment securities currently maintained as collateral are all U.S. Agency hybrid adjustable rate mortgage-backed securities. At December 31, 2009 and 2008, the Bank was in compliance with the FHLB collateral requirements. At December 31, 2009, the Company could borrow immediately an additional $267.4 million from the FHLB, inclusive of a line of credit of approximately $20.0 million. Additional borrowing capacity of approximately $1.49 billion would be readily available by pledging additional eligible securities as collateral. At December 31, 2009, all of the Company’s $1.75 billion outstanding FHLB advances were at fixed rates ranging from 1.51% to 8.17%. The weighted average rate for all FHLB advances at December 31, 2009 was 4.22%. The Company also has borrowing capacity at the FRB’s discount window, which was approximately $89.3 million as of December 31, 2009, all of which was available on that date. Repurchase agreements with commercial or municipal customers or dealer/brokers are secured by the Company’s investment in specific issues of agency mortgage-backed securities and agency obligations in the amount of $40.6 million and $113.2 million, respectively, as of December 31, 2009. Repurchase agreement lines of credit totaled $225.0 million at December 31, 2009, with $200.0 million available.
12. Pension and Other Postretirement
Benefit Plans
Defined Benefit and Other Postretirement Plans
The Company provides various defined benefit and other postretirement benefit plans (postretirement health and life insurance benefits) to substantially all employees hired prior to January 1, 2008. The Company also has supplemental retirement plans (the “Supplemental Plans”) that provide benefits for certain key executive officers. Benefits under the supplemental plans are based on a predetermined formula and are reduced by other benefits. The liability arising from these plans is being accrued over the participants’ remaining periods of service so that at the expected retirement dates, the present value of the annual payments will have been expensed.
The following table sets forth changes in the benefit obligation, changes in Plan assets and the funded status of the Plans for the periods ended December 31, 2009 and 2008. The table also provides a reconciliation of the Plan’s funded status and the amounts recognized in the Company’s consolidated balance sheets. On December 31, 2006, the Company adopted the recognition provisions FASB ASC 715 Compensation - Retirement Benefits, which requires employers to recognize the overfunded or underfunded positions of defined benefit postretirement plans, including pension plans on their balance sheets, and on December 31, 2008 the Company adopted the measurement date provision.
95
| NewAlliance Bancshares, Inc. |
| Notes to
Consolidated Financial Statements |
| Supplemental | |||||||||||||||||||||||||||||||
| Executive | Other Postretirement | ||||||||||||||||||||||||||||||
| Qualified Pensions | Retirement Plans | Benefits | |||||||||||||||||||||||||||||
| (In thousands) | 2009 | 2008 | 2009 | 2008 | 2009 | 2008 | |||||||||||||||||||||||||
Change in benefit obligation |
|||||||||||||||||||||||||||||||
Projected benefit obligation at beginning of year |
$ | 96,108 | $ | 89,264 | $ | 12,628 | $ | 11,560 | $ | 5,965 | $ | 6,278 | |||||||||||||||||||
Service cost |
3,235 | 3,150 | 440 | 538 | 219 | 196 | |||||||||||||||||||||||||
Interest cost |
5,721 | 5,451 | 772 | 707 | 357 | 372 | |||||||||||||||||||||||||
Plan participant contributions |
- | - | - | - | 320 | 277 | |||||||||||||||||||||||||
Plan amendments |
- | - | - | - | - | - | |||||||||||||||||||||||||
Actuarial loss (gain) |
2,559 | 1,637 | 2,201 | 209 | (210 | ) | (624 | ) | |||||||||||||||||||||||
Benefits paid |
(4,594 | ) | (5,544 | ) | (3,694 | ) | (697 | ) | (615 | ) | (676 | ) | |||||||||||||||||||
Adjustment for change in measurement date |
- | 2,150 | - | 311 | - | 142 | |||||||||||||||||||||||||
Projected benefit obligation at end of year |
103,029 | 96,108 | 12,347 | 12,628 | 6,036 | 5,965 | |||||||||||||||||||||||||
| Change in plan assets | |||||||||||||||||||||||||||||||
Fair value of plan assets at beginning of year |
76,935 | 103,444 | - | - | - | - | |||||||||||||||||||||||||
Actual return on plan assets |
20,181 | (29,763 | ) | - | - | - | - | ||||||||||||||||||||||||
Employer contributions |
- | 7,000 | 3,694 | 697 | 295 | 399 | |||||||||||||||||||||||||
Plan participant contributions |
- | - | (3,694 | ) | (697 | ) | 320 | 277 | |||||||||||||||||||||||
Benefits paid and administrative expenses |
(4,594 | ) | (5,544 | ) | (615 | ) | (676 | ) | |||||||||||||||||||||||
Adjustment for change in measurement date |
- | 1,798 | - | - | - | - | |||||||||||||||||||||||||
Fair value of plan assets at end of year |
92,522 | 76,935 | - | - | - | - | |||||||||||||||||||||||||
Funded status at measurement date and net amount recognized in Company’s consolidated balance sheets |
$ | (10,507 | ) | $ | (19,173 | ) | $ | (12,347 | ) | $ | (12,628 | ) | $ | (6,036 | ) | $ | (5,965 | ) | |||||||||||||
Accumulated benefit obligation |
$ | 94,880 | $ | 88,717 | $ | (9,860 | ) | $ | (9,754 | ) | $ | (6,036 | ) | $ | (5,965 | ) | |||||||||||||||
The following
table presents the amounts recognized in accumulated other comprehensive income
that have not yet been recognized as components of net periodic benefit cost as
of December 31, 2009 and 2008. |
| Supplemental Executive | Other Postretirement | ||||||||||||||||||||||||||||||
| Qualified Pension | Retirement Plans | Benefits | |||||||||||||||||||||||||||||
| (In thousands) | 2009 | 2008 | 2009 | 2008 | 2009 | 2008 | |||||||||||||||||||||||||
| Transition obligation | $ | - | $ | - | $ | - | $ | - | $ | 33 | $ | 66 | |||||||||||||||||||
| Prior service cost | 308 | 342 | 33 | 38 | - | - | |||||||||||||||||||||||||
| Actuarial loss (gain) | 15,471 | 22,871 | 12 | (26 | ) | (758 | ) | (733 | ) | ||||||||||||||||||||||
Unrecognized components of net periodic benefit cost in accumulated other comprehensive income, net of tax |
$ | 15,779 | $ | 23,213 | $ | 45 | $ | 12 | $ | (725 | ) | $ | (667 | ) | |||||||||||||||||
96
| NewAlliance Bancshares, Inc. |
| Notes to
Consolidated Financial Statements |
The components of net periodic pension cost for the periods indicated were as follows (in thousands):
| Year Ended December 31, | ||||||||||||||||
| Qualified pension | 2009 | 2008 | 2007 | |||||||||||||
| Service cost - benefits earned during the period | $ | 3,235 | $ | 3,150 | $ | 3,236 | ||||||||||
| Interest cost on projected benefit obligation | 5,721 | 5,451 | 5,031 | |||||||||||||
| Expected return on plan assets | (6,965 | ) | (7,191 | ) | (7,143 | ) | ||||||||||
| Amortization and deferral | 53 | 51 | 51 | |||||||||||||
| Recognized net loss | 816 | - | 317 | |||||||||||||
Net periodic pension cost |
$ | 2,860 | $ | 1,461 | $ | 1,492 | ||||||||||
| Supplemental retirement plans | ||||||||||||||||
| Service cost - benefits earned during the period | $ | 440 | $ | 538 | $ | 500 | ||||||||||
| Interest cost on projected benefit obligation | 772 | 706 | 636 | |||||||||||||
| Amortization and deferral | 7 | 7 | 7 | |||||||||||||
| Recognized net loss (gain) | 2,143 | 213 | (282 | ) | ||||||||||||
Net periodic benefit cost |
$ | 3,362 | $ | 1,464 | $ | 861 | ||||||||||
| Other postretirement benefits | ||||||||||||||||
| Service cost - benefits earned during the period | $ | 219 | $ | 196 | $ | 198 | ||||||||||
| Interest cost on projected benefit obligation | 357 | 372 | 351 | |||||||||||||
| Amortization and deferral | 52 | 52 | 52 | |||||||||||||
| Recognized net gain | (172 | ) | (80 | ) | (23 | ) | ||||||||||
Net periodic benefit cost |
$ | 456 | $ | 540 | $ | 578 | ||||||||||
The estimated amounts that will be amortized from accumulated other comprehensive income into net periodic benefit cost over the next fiscal year are as follows:
| Supplemental | Other | |||||||||||||||
| Qualified | Executive | Postretirement | ||||||||||||||
| (In thousands) | Pension | Retirement Plans | Benefits | |||||||||||||
| Transition obligation | $ | - | $ | - | $ | 52 | ||||||||||
| Prior service cost | 54 | 7 | - | |||||||||||||
| Actuarial loss (gain) | 1,296 | - | (160 | ) | ||||||||||||
The following benefit payments, which reflect expected future service, as appropriate, are expected to be paid.
| Other | |||||||||||||
| Qualified | Nonqualified | Postretirement | |||||||||||
| (In thousands) | Pensions | Pensions | Benefits | ||||||||||
| 2010 | 4,962 | 702 | 413 | ||||||||||
| 2011 | 5,103 | 720 | 381 | ||||||||||
| 2012 | 5,329 | 1,262 | 376 | ||||||||||
| 2013 | 5,667 | 1,583 | 254 | ||||||||||
| 2014 | 5,984 | 975 | 425 | ||||||||||
| 2015 - 2019 | 35,677 | 7,397 | 2,569 | ||||||||||
97
| NewAlliance Bancshares, Inc. |
| Notes to
Consolidated Financial Statements |
Significant actuarial assumptions used to determine the actuarial present value of the projected obligation were as follows:
| Supplemental Executive | Other Postretirement | ||||||||||||||||||||||||
| Qualified Pension | Retirement Plans | Benefits | |||||||||||||||||||||||
| 2009 | 2008 | 2009 | 2008 | 2009 | 2008 | ||||||||||||||||||||
| Discount rate | 5.85 | % | 6.10 | % | 5.75 | % | 6.35 | % | 5.50 | % | 6.25 | % | |||||||||||||
| Rate of compensation increase | 3.50 | 3.50 | 3.50 | 3.50 | n/a | n/a | |||||||||||||||||||
Significant actuarial assumptions used to determine the net periodic benefit cost were as follows:
| Supplemental Executive | Other Postretirement | ||||||||||||||||||||||||
| Qualified Pension | Retirement Plans | Benefits | |||||||||||||||||||||||
| 2009 | 2008 | 2009 | 2008 | 2009 | 2008 | ||||||||||||||||||||
| Discount rate | 6.10 | % | 6.25 | % | 5.75 | % | 6.25 | % | 6.25 | % | 6.25 | % | |||||||||||||
| Expected return on plan assets | 7.75 | 8.00 | n/a | n/a | n/a | n/a | |||||||||||||||||||
| Rate of compensation increase | 3.50 | 4.00 | 3.50 | 4.00 | n/a | n/a | |||||||||||||||||||
Assumed health care cost trend rates at December 31,
| 2009 | 2008 | ||||||||
| Health care cost trend rate assumed for next year | 10.00 | % | 9.50 | % | |||||
| Rate that the cost trend rate gradually declines to | 5.00 | 5.00 | |||||||
| Year that the rate reaches the rate it is assumed to remain at | 2019 | 2017 | |||||||
| Effect of one percentage change in assumed health care cost trend rates in 2009 |
| 1% Increase | 1% Decrease | ||||||||
| Effect on total service and interest components | $ | 39,371 | $ | (34,171 | ) | ||||
| Effect on postretirement benefit obligation | 325,038 | (286,475 | ) | ||||||
Investment Strategy and Asset Allocations
Plan assets are to be managed within an
ERISA framework so as to provide the greatest probability that the following long-term
objectives for the qualified pension plan are met in a prudent manner.
| • | Ensure that
there is an adequate level of assets to support benefit obligations to participants
and retirees over the life of the Plan, taking into consideration the nature and
duration of Plan liabilities. |
|
| • | Maintain liquidity
in Plan assets sufficient to cover ongoing benefit payments. |
|
| • | Manage volatility
of investment results in order to achieve long-term Plan objectives and to minimize
level and volatility of pension expenses. |
|
It is recognized that the attainment of
these objectives is, for any given time period, largely dictated by the returns
available from the capital markets in which Plan assets are invested.
The asset
allocation of Plan assets reflects the Company’s long-term return expectations
and risk tolerance in meeting the financial objectives of the Plan. Plan assets
should be adequately diversified by asset class, sector and industry to reduce the
downside risk to total Plan results over short-term time periods, while providing
opportunities for long-term appreciation.
98
| NewAlliance Bancshares, Inc. |
| Notes to
Consolidated Financial Statements |
The following table summarizes the Plan’s weighted-average asset allocation for the periods indicated and the Plan’s long-term asset allocation structure.
| Actual percentage of fair value | |||||||||||||
| Allocation | |||||||||||||
| Asset Class | 2009 | 2008 | Range | ||||||||||
| Equity securities | 70.3 | % | 52.6 | % | 49 - 78 | % | |||||||
| Debt securities | 27.1 | 35.2 | 25 - 40 | ||||||||||
| Cash | 2.6 | 12.2 | 0 - 5 | ||||||||||
Cash held by a particular manager will be
viewed as belonging to the asset class in which the manager primarily invests. It
is expected that individual managers over time will exceed the median return of
the appropriate manager universe composed of professionally managed institutional
funds in the same asset class and style.
Rebalancing and Investment of
New Contributions
These asset allocation ranges are guidelines and deviations
may occur periodically as a result of market movements. In order to balance the
benefits of rebalancing with associated transaction costs, assets will be rebalanced
if they are outside the range noted above based on quarter-end market values. In
addition, the Compensation Committee reserves the right to rebalance at any time
it deems necessary and prudent. New contributions to the Plan assets will be invested
in a manner that rebalances the Plan assets to the greatest extent possible. The
high percent value in the cash asset class in 2008 was due to a $7.0 million contribution
made to the Plan on December 30, 2008. Asset allocations were then rebalanced in
January 2009.
Plan Contributions
The Company plans to contribute
$702,000 to the SERP and $206,000 to its other postretirement plan in 2010. The
Company does not expect to contribute to the defined benefit pension plan in 2010.
A SERP payment of approximately $2.7 million is expected to be paid in the third
quarter for an executive who retired in January 2010.
Plan Assets
In December 2008, the FASB revised the disclosure guidance for retirement benefits.
This guidance provides for additional disclosures about plan assets of a defined
benefit pension or other postretirement plan. Pursuant to the guidance, the added
disclosures include: (1) how investment allocation decisions are made by management,
(2) major categories of plan assets, and (3) significant concentrations of risk.
Additionally, this requires an employer to disclose information about the valuation
of plan assets similar to that required under FASB ASC 820, Fair Value Measurements
and Disclosures. Those disclosures include: (1) the level within the fair value
hierarchy in which fair value measurements of plan assets fall, (2) information
about the inputs and valuation techniques used to measure the fair value of plan
assets, and (3) a reconciliation of the beginning and ending balances of plan assets
valued using significant unobservable inputs.
Fair value estimates are made
as of a specific point in time based on the characteristics of the financial instruments
and relevant market information. In accordance with FASB ASC 820, the fair value
estimates are measured within the fair value hierarchy. The hierarchy gives the
highest priority to unadjusted quoted prices in active markets for identical assets
or liabilities (level 1 measurements) and the lowest priority to unobservable inputs
(level 3 measurements).
99
| NewAlliance Bancshares, Inc. |
| Notes to
Consolidated Financial Statements |
The fair value of the Company’s pension plan assets at December 31, 2009 by asset category are listed in the table below.
| Quoted Prices | ||||||||||||||||||||
| in Active | Significant | Significant | ||||||||||||||||||
| Markets for | Observable | Unobservable | ||||||||||||||||||
| Identical Assets | Inputs | Inputs | ||||||||||||||||||
| (In thousands) | Total | (Level 1) | (Level 2) | (Level 3) | ||||||||||||||||
| Cash and Cash equivalents | $ | 2,436 | $ | 2,436 | $ | - | $ | - | ||||||||||||
| Equity Securities | ||||||||||||||||||||
U.S. Companies |
21,760 | 21,760 | - | - | ||||||||||||||||
International Companies |
1,842 | 1,842 | - | - | ||||||||||||||||
| Mutual Funds | ||||||||||||||||||||
Equity Mutual Funds |
24,635 | 24,635 | - | - | ||||||||||||||||
Fixed Income Mututal Funds |
9,373 | - | 9,373 | - | ||||||||||||||||
| Interests in Collective Trusts | ||||||||||||||||||||
Equity Investments |
16,789 | - | 16,789 | - | ||||||||||||||||
Fixed Income Investments |
962 | - | 962 | - | ||||||||||||||||
Real estate Investments |
230 | - | 230 | - | ||||||||||||||||
| US Government and State Agency Obligations | 3,057 | 2,005 | 1,052 | - | ||||||||||||||||
| Corporate Bonds | 10,503 | - | 10,503 | - | ||||||||||||||||
| Annuities | 935 | - | 935 | - | ||||||||||||||||
Total Investments |
$ | 92,522 | $ | 52,678 | $ | 39,844 | $ | - | ||||||||||||
| Level 1 - | Unadjusted
quoted prices in active markets that are accessible at the measurement date for
identical, unrestricted assets or liabilities; |
|
| Level 2 - | Quoted prices
in markets that are not active, or inputs that are observable either directly or
indirectly, for substantially the full term of the asset or liability; |
|
| Level 3 - | Prices or
valuation techniques that require inputs that are both significant to the fair value
measurement and unobservable (i.e., supported by little or no market activity). |
Cash and Cash equivalents: Carrying
value is assumed to represent fair value for cash and short-term investments.
Equity Securities: Included in this category are exchange-traded common
and preferred shares invested in the retail, energy, financial, health care, industrial,
technology, materials and utility sectors. The fair value of the securities are
based on quoted market prices of identical securities in active markets and therefore
are classified as Level 1 in the fair value hierarchy.
Equity Mutual Funds: Fair value of the fund is based upon the fair value of the underlying equity
securities. The fair value of the underlying equity securities are based on quoted
market prices of identical securities in active markets and therefore are classified
as Level 1 in the fair value hierarchy.
Fixed Income Mutual Funds: Fair value of the fund is based upon the fair value of the underlying debt securities.
The fair value of the underlying debt securities are based on quoted market prices
of similar securities or estimated using pricing models (i.e. matrix pricing) using
observable market inputs and therefore are classified as Level 2 in the fair value
hierarchy.
Interest in Collective Trusts: This category includes investments
in equity, fixed income and real estate funds by a collective trust. The fair value
of investments in collective trust funds are measured as the fair value of the ownership
interest in the fund, which may not always be the fair value of the underlying net
assets of the collective investment trust. The net asset value per unit of a collective
investment trust is a primary input into the valuation of ownership interest in
a collective investment trust. In addition, consideration is given to specific rights
or obligations that pertain to the investments. Based on the observability of prices
or inputs used to value the underlying portfolio instruments, investments in collective
trusts are classified as Level 2 of the fair value hierarchy.
U.S. Government
and State Agency Obligations: Included in this category are government and municipal
obligations. The U.S. government obligations are measured at fair value based on
quoted prices for identical securities in active markets are classified as Level
1 of the fair value hierarchy. The municipal obligations are measured at fair value
based on pricing models using benchmark yields and spreads and therefore are classified
Level 2 in the fair value hierarchy.
Corporate Obligations: Included in this
category are investments in corporate bonds where the fair values are estimated
by using pricing models (i.e. matrix pricing) with observable market inputs including
recent transactions and/or benchmark yields or quoted prices of securities with
similar characteristics and are therefore classified within Level 2 of the valuation
hierarchy.
100
| NewAlliance Bancshares, Inc. |
| Notes to
Consolidated Financial Statements |
Annuities: This category consists
of a guaranteed deposit account issued by Prudential Retirement Insurance and Annuity
Company. Classification within the fair value hierarchy is based on the fair value
of the underlying investments of the annuity which are primarily comprised of publicly
traded and privately placed debt securities, corporate obligations, mortgage backed
securities, money market accounts, and equity securities. The fair value of these
underlying securities are based on quoted prices in an active market, pricing models,
or quoted prices of securities with similar characteristics. The portion of the
portfolio with fair values based on pricing models is approximately 95%, comprised
of fixed income debt securities and mortgage backed securities. The remaining portion
of the portfolio primarily uses quotable market prices for identical securities
(i.e. Level 1). As the primary inputs in deriving fair value of the investments
in the portfolio are Level 2 inputs, the fair value of the annuity has been classified
as Level 2 in the fair value hierarchy.
Savings and Profit Sharing Plans
The NewAlliance Bank 401(k) Savings Plan (the “Savings Plan”) is
a tax qualified defined contribution plan with a qualified cash or deferred arrangement
under Section 401(k) of the Internal Revenue Code. The Savings Plan currently provides
participants with savings and retirement benefits based on employee deferrals of
compensation and a matching feature provided through the Company’s ESOP.
There have been no voluntary cash contributions made by the Bank to the Savings
Plan maintained for employees meeting certain eligibility requirements for the years
ended December 31, 2009, 2008 and 2007.
In connection with the conversion
of the Bank to a state-chartered stock bank, the Company established an ESOP to
provide substantially all employees of the Company the opportunity to also become
stockholders. The ESOP borrowed $109.7 million of a $112.0 million line of credit
from the Company and used the funds to purchase 7,454,562 shares of common stock
in the open market subsequent to the subscription offering. The loan will be repaid
principally from the Company’s discretionary contributions to the ESOP over
a remaining period of 24 years. The unallocated ESOP shares are pledged as collateral
on the loan.
At December 31, 2009, the loan had an outstanding balance of
$97.5 million and an interest rate of 4.0%. The Company accounts for its ESOP in
accordance with FASB ASC 718-40, Compensation – Stock Compensation.
Under this guidance, unearned ESOP shares are not considered outstanding for purposes
of computing earnings per share and are shown as a reduction of stockholders’
equity as unearned compensation. The Company will recognize compensation cost equal
to the fair value of the ESOP shares during the periods in which they are committed
to be released. To the extent that the fair value of the Company’s ESOP shares
differs from the cost of such shares, this differential will be credited to equity.
The Company will receive a tax deduction equal to the cost of the shares released.
As the loan is internally leveraged, the loan receivable from the ESOP to the Company
is not reported as an asset nor is the debt of the ESOP shown as a liability in
the Company’s financial statements. Dividends on unallocated shares are used
to pay the ESOP debt. The ESOP compensation expense for the years ended December
31, 2009, 2008, and 2007 was approximately $2.9 million, $3.2 million and $3.7 million,
respectively. The amount of loan repayments made by the ESOP is used to reduce the
unallocated common stock held by the ESOP.
The ESOP shares as of December
31, 2009 were as follows:
| Shares released for allocation | 1,411,845 | |||
| Unreleased shares | 6,042,717 | |||
Total ESOP shares |
7,454,562 | |||
| Market value of unreleased shares at December 31, 2009 (in thousands) | $ | 72,573 | ||
In April of 2004, the Company also established a supplemental profit sharing plan and a supplemental ESOP (the “Supplemental Savings Plans”) that provide benefits for certain key executive officers, which are unfunded. Compensation expense related to the Supplemental Savings Plans was $147,000, $9,000 and $178,000 for the years ended December 31, 2009, 2008, and 2007, respectively.
101
| NewAlliance Bancshares, Inc. |
| Notes to
Consolidated Financial Statements |
13. Stock-Based Compensation
The Company provides compensation benefits to employees and non-employee directors
under its 2005 Long-Term Compensation Plan (the “LTCP”) which was approved
by shareholders. The Company accounts for stock-based compensation using the fair
value recognition provisions of FASB ASC 718, Compensation - Stock Compensation. Pursuant to this guidance, the fair value of stock option and restricted stock
awards, measured at grant date, is amortized to compensation expense on a straight-line
basis over the vesting period or over the requisite service period for awards expected
to vest.
The LTCP allows for the issuance of up to 11.4 million Options or
Stock Appreciation Rights and up to 4.6 million Stock Awards or Performance Awards.
During the year ended December 31, 2009, a mix of stock options, restricted stock
and performance-based restricted shares were awarded to employees.
Option
Awards
Options awarded to date are for a term of ten years and total approximately
9.6 million shares. Substantially all of these options were awarded on the original
award date of June 17, 2005 and these 2005 option awards had the following vesting
schedule: 40% vested at year-end 2005 and 20% vested at year-end 2006, 2007 and
2008, respectively. Subsequent awards have vesting periods of either three or four
years. The Company assumed a 4.1% average forfeiture rate on options granted subsequent
to June 17, 2005 as the majority of the options were awarded to senior level management.
Compensation expense recorded on options for the years ended December 31, 2009,
2008 and 2007 was $357,000, $4.2 million and $4.5 million, respectively, or after
tax expense of approximately $230,000, $2.8 million and $2.9 million, respectively.
Under the terms of the LTCP, additional awards are likely to be granted, which will
increase the amount of expense in future periods.
Options to purchase 473,109
shares, 124,656 shares, and 125,704 shares were granted to employees during the
years ended December 31, 2009, 2008, and 2007, respectively. Using the Black-Scholes
option pricing model, the weighted-average grant date fair value was $2.31, $2.21,
and $2.72 per share for the options which were granted in 2009, 2008, and 2007,
respectively. The weighted-average related assumptions for these periods are presented
in the following table.
| 2009 | 2008 | 2007 | ||||||||||
| Risk-free interest rate | 2.64 | % | 2.83 | % | 4.41 | % | ||||||
| Expected dividend yield | 2.20 | % | 2.06 | % | 1.62 | % | ||||||
| Expected volatility | 19.43 | % | 16.78 | % | 19.59 | % | ||||||
| Expected life (years) | 6.24 | 6.22 | 4.69 | |||||||||
| • | The risk-free
interest rate was determined using the U.S. Treasury yield curve in effect at the
time of the grant. |
|
| • | The dividend
yield is calculated on the current dividend and strike price at the time of the
grant. |
|
| • | The expected
volatility assumption is based on the Company’s stock price history, which
for 2009 and 2008 was 60 months and 48 months, respectively. For 2007, historical
data of recently converted thrifts was used for expected volatility assumptions. |
|
| • | The expected
life for options granted during the years ended December 31, 2009, 2008, and 2007
was determined by applying the simplified method as allowed by current accounting
guidance. |
|
A summary of option activity as of December 31, 2009 and changes during the period ended is presented below:
| Weighted- | ||||||||||||||||||||
| Weighted- | Average | Aggregate | ||||||||||||||||||
| Average | Remaining | Intrinsic | ||||||||||||||||||
| Exercise | Contractual | Value | ||||||||||||||||||
| Shares | Price | Term | ($000) | |||||||||||||||||
| Options outstanding at beginning of year | 8,422,666 | $ | 14.40 | |||||||||||||||||
| Granted | 473,109 | 12.76 | ||||||||||||||||||
| Exercised | - | - | ||||||||||||||||||
| Forfeited/cancelled | (3,561 | ) | 13.88 | |||||||||||||||||
| Expired | (1,007,413 | ) | 14.39 | |||||||||||||||||
| Options outstanding at December 31, 2009 | 7,884,801 | $ | 14.30 | 5.79 | $ | - | ||||||||||||||
| Options exercisable at December 31, 2009 | 7,253,647 | $ | 14.40 | 5.50 | $ | - | ||||||||||||||
102
| NewAlliance Bancshares, Inc. |
| Notes to
Consolidated Financial Statements |
The following table summarizes the nonvested options during the year ended December 31, 2009.
| Weighted-average | ||||||||||
| Grant-Date | ||||||||||
| Shares | Fair Value | |||||||||
| Nonvested at January 1, 2009 | 247,494 | $ | 2.60 | |||||||
| Granted | 473,109 | 2.31 | ||||||||
| Vested | (85,888 | ) | 2.66 | |||||||
| Forfeited / Cancelled | (3,561 | ) | 2.26 | |||||||
| Nonvested at December 31, 2009 | 631,154 | $ | 2.38 | |||||||
The total fair value of options that vested
in 2009, 2008 and 2007 was $229,000, $4.3 million and $4.5 million, respectively.
Restricted Stock and Performance-Based Restricted Stock Awards
To date, approximately 3.8 million shares of restricted stock have been awarded under
the LTCP. The majority of these shares were awarded in 2005 and these 2005 awards
have a vesting schedule of 15% per year for six years and 10% in the seventh year.
Subsequent awards have vesting schedules of three years, four years, or cliff vest
after three years. During the year ended December 31, 2009, in addition to restricted
stock awards, the Company also granted performance-based restricted awards. The
vesting for these newly issued performance-based awards is conditional upon fulfillment
of a market condition and on meeting a service period. Of the 222,854 shares of
restricted stock awarded during the year ended December 31, 2009, 65,149 shares
were performance-based.
Performance-based restricted stock shares were awarded
to executive management and other key members of senior management. The actual number
of performance shares to be earned will be based on performance criteria over a
three-year performance period beginning May 29, 2009 and ending May 31, 2012. Performance
shares vest based on total shareholder return (“TSR”) (defined as share
price appreciation from the beginning of the performance period to the end of the
performance period, plus the total dividends paid on the common stock during the
period) for the group of banks and thrifts listed on the SNL Thrift Index versus
the Company’s TSR (the “TSR Percentage”). The performance shares,
if earned, will vest on May 31, 2012. A simulation model was used to provide a grant
date fair value for the performance-based shares. Expense for the performance-based
awards is recognized based on the probability of attaining the performance targets
and over the service period similar to the recognition of the expense associated
with the other restricted stock awards that only have a service condition.
Total restricted stock compensation expense for the year ended December 31, 2009,
2008 and 2007 was approximately $6.1 million, $7.0 million and $7.5 million, respectively,
or after-tax expense of approximately $4.8 million, $4.5 million and $4.9 million,
respectively. The Company anticipates that it will record expense of approximately
$6.1 million, $5.3 million, $421,000 in calendar years 2010 through 2012, respectively.
Under the terms of the LTCP, additional awards are likely to be granted, which will
increase the amount of expense recognized in future periods.
The following
table summarizes the nonvested restricted stock and performance-based restricted
stock awards during the year ended December 31, 2009.
| Weighted-average | ||||||||||
| Grant-Date | ||||||||||
| Shares | Fair Value | |||||||||
| Nonvested at January 1, 2009 | 1,656,933 | $ | 14.33 | |||||||
| Granted | 222,854 | 14.58 | ||||||||
| Vested | (487,975 | ) | 14.35 | |||||||
| Forfeited / Cancelled | (166,749 | ) | 14.33 | |||||||
| Nonvested at December 31, 2009 | 1,225,063 | $ | 14.37 | |||||||
103
| NewAlliance Bancshares, Inc. |
| Notes to
Consolidated Financial Statements |
14. Income Taxes
The components
of income tax expense are summarized as follows:
| Year Ended December 31, | ||||||||||||||||
| (In thousands) | 2009 | 2008 | 2007 | |||||||||||||
| Current tax expense | ||||||||||||||||
Federal |
$ | 28,691 | $ | 20,116 | $ | 15,952 | ||||||||||
State |
694 | 82 | 66 | |||||||||||||
Total current |
29,385 | 20,198 | 16,018 | |||||||||||||
| Deferred tax (benefit) expense net of valuation reserve | ||||||||||||||||
Federal |
(3,337 | ) | 826 | (955 | ) | |||||||||||
State |
(251 | ) | (277 | ) | - | |||||||||||
Total deferred |
(3,588 | ) | 549 | (955 | ) | |||||||||||
Total income tax expense |
$ | 25,797 | $ | 20,747 | $ | 15,063 | ||||||||||
For the years ended December 31, 2009, 2008 and 2007, the provision for income taxes differs from the amount computed by applying the statutory Federal income tax rate of 35% to pre-tax income for the following reasons:
| Year Ended December 31, | ||||||||||||||||
| (In thousands) | 2009 | 2008 | 2007 | |||||||||||||
| Provision for income taxes at statutory rate | $ | 25,284 | $ | 23,115 | $ | 13,600 | ||||||||||
| Increase (decrease) in taxes resulting from: | ||||||||||||||||
State income tax expense |
451 | 53 | 43 | |||||||||||||
Dividends received deduction |
(79 | ) | (336 | ) | (461 | ) | ||||||||||
Bank-owned life insurance |
(1,288 | ) | (1,770 | ) | (2,231 | ) | ||||||||||
Low income housing and other tax credits |
(22 | ) | (25 | ) | (150 | ) | ||||||||||
Excess compensation - 162(m) |
1,130 | 507 | 382 | |||||||||||||
Valuation allowance adjustment, charitable contribution |
(51 | ) | - | 3,600 | ||||||||||||
Valuation allowance adjustment, capital loss |
204 | 139 | - | |||||||||||||
Tax exempt obligations |
- | - | (137 | ) | ||||||||||||
Interest related to tax reserve |
23 | (956 | ) | 267 | ||||||||||||
Tax reserves |
(30 | ) | 120 | - | ||||||||||||
Rate change due to change in Massachusetts legislation |
- | (277 | ) | - | ||||||||||||
Other, net |
175 | 177 | 150 | |||||||||||||
Provision for income taxes |
$ | 25,797 | $ | 20,747 | $ | 15,063 | ||||||||||
104
| NewAlliance Bancshares, Inc. |
| Notes to
Consolidated Financial Statements |
The tax effects of temporary differences and tax carryforwards that give rise to deferred tax assets and liabilities are presented below:
| December 31, | ||||||||||
| (In thousands) | 2009 | 2008 | ||||||||
| Deferred tax assets | ||||||||||
Bad debts |
$ | 21,339 | $ | 20,413 | ||||||
Pension and postretirement benefits |
20,520 | 20,905 | ||||||||
Borrowings |
5,741 | 6,862 | ||||||||
Noncompete agreements |
2,932 | 3,270 | ||||||||
Charitable contribution carryover |
80 | 12,812 | ||||||||
Capital loss carryover |
1,172 | 940 | ||||||||
State net operating loss carryover |
17,146 | 14,943 | ||||||||
Restricted stock |
7,001 | 7,661 | ||||||||
Loans |
358 | 316 | ||||||||
Other, net |
3,071 | 1,524 | ||||||||
Total gross deferred tax assets |
79,360 | 89,646 | ||||||||
Less valuation allowance |
(21,594 | ) | (30,695 | ) | ||||||
Total deferred tax assets, net of valuation allowance |
57,766 | 58,951 | ||||||||
| Deferred tax liabilities | ||||||||||
Core deposit intangible |
14,278 | 17,706 | ||||||||
Unrealized gain on available for sale securities |
18,479 | 1,079 | ||||||||
Premises and equipment, principally due to difference in depreciation |
1,422 | 1,957 | ||||||||
Limited partnerships |
4,951 | 5,342 | ||||||||
Certificate of deposits |
20 | 68 | ||||||||
Investments |
2,604 | 486 | ||||||||
Other |
1,934 | 1,974 | ||||||||
Total gross deferred tax liabilities |
43,688 | 28,612 | ||||||||
| Net deferred tax asset | $ | 14,078 | $ | 30,339 | ||||||
Management believes it is more likely than
not that the reversal of deferred tax liabilities and results of future operations
will generate sufficient taxable income to realize the deferred tax assets, net
of the valuation allowance.
The allocation of deferred tax benefit involving
items charged to income, items charged directly to stockholders’ equity and
items charged to goodwill are as follows:
| Year Ended December 31, | ||||||||||||||||||||||||||||||
| 2009 | 2008 | 2007 | ||||||||||||||||||||||||||||
| (In thousands) | Federal | State | Federal | State | Federal | State | ||||||||||||||||||||||||
| Deferred tax expense (benefit) allocated to: | ||||||||||||||||||||||||||||||
Stockholders’ equity, tax effect of unrealized gains (losses) on marketable equity securities |
$ | 15,165 | $ | - | $ | (4,139 | ) | $ | - | $ | 16,334 | $ | - | |||||||||||||||||
Stockholders’ equity, tax impact of change in minimum pension liability and new split dollar life insurance accounting pronouncement |
4,106 | - | (14,263 | ) | - | 4,158 | - | |||||||||||||||||||||||
Goodwill |
- | - | (1,206 | ) | - | (2,145 | ) | - | ||||||||||||||||||||||
Stockholders’ equity, tax effect of cumulative effect of adoption of new OTTI accounting pronouncement |
578 | - | - | - | - | - | ||||||||||||||||||||||||
Reclass to current tax receivable |
- | - | (1,247 | ) | - | - | - | |||||||||||||||||||||||
Income |
(3,588 | ) | - | 549 | - | (955 | ) | - | ||||||||||||||||||||||
Total deferred tax expense (benefit) |
$ | 16,261 | $ | - | $ | (20,306 | ) | $ | - | $ | 17,392 | $ | - | |||||||||||||||||
The Company has no federal net operating loss carryforwards at December 31, 2009. The Company has state net operating loss carryforwards at December 31, 2009 of $351.7 million which expire between 2020 and 2029. As of December 31, 2009 and 2008, the Company had a valuation allowance of $20.1 million against its state deferred tax asset, including the state net operating loss carryforwards, in connection with the creation of a Connecticut passive investment company pursuant to legislation enacted in 1998.
105
| NewAlliance Bancshares, Inc. |
| Notes to
Consolidated Financial Statements |
Under this legislation, Connecticut passive
investment companies are not subject to the Connecticut Corporate Business Tax and
dividends paid by the passive investment company to the Company are exempt from
the Connecticut Corporate Business Tax.
The Company has no alternative minimum
tax credit carryforwards at December 31, 2009.
At December 31, 2009, the
Company has charitable contribution carryforwards of $198,000, of which $73,000
will expire in 2010, and $125,000 will expire in 2011. The charitable contribution
carryforward resulting from the 2004 charitable contribution of 4,000,000 shares
of the Company’s stock and $40,000 of cash to the NewAlliance Foundation expired
in 2009. The utilization of charitable contributions for any tax year is limited
to 10% of taxable income without regard to charitable contributions, net operating
losses, and dividend received deductions. A corporation is permitted to carry over
to the five succeeding tax years contributions that exceeded the 10% limitation,
but deductions in those years are also subject to the maximum limitation. At December
31, 2009 the Company had no valuation allowance against charitable contributions
expected to expire in the next two years. At December 31, 2008, the Company had
a valuation allowance of $9.0 million against charitable contributions that expired
in 2009 unused. Actual charitable contributions that expired in 2009 unused were
$25.3 million for which a valuation allowance of $8.9 million was established.
The Company has capital loss carryforwards of $2.9 million and $2.3 million at
December 31, 2009 and 2008, respectively. $1.9 million of the carryforward was generated
by Westbank Corporation, Inc. (“Westbank”) and expires at the end of 2011.
The remainder of carryforwards will primarily expire in 2013 and 2014. Capital losses
can only be used to offset capital gains. Excess losses over gains can be carried
back three years or carried forward five years. As of December 31, 2009 and December
31, 2008, there is an $1.5 million and a $1.6 million valuation allowance, respectively,
for the tax effect of capital loss carryforwards associated with realized and unrealized
capital losses on capital assets, of which $462,000 and $794,000, respectively,
was recorded as an adjustment to other comprehensive income.
A deferred tax
liability has not been recorded for the tax reserve for bad debts of approximately
$50.2 million that arose in tax years beginning before December 31, 1987 (the “base
year amount”). A deferred tax liability is not recognized for the base year
amount unless it becomes apparent that those temporary differences will reverse
into taxable income in the foreseeable future. The base year amount will only be
recognized into taxable income if the Bank ceases to be a bank or if the Bank makes
distributions of property to a shareholder with respect to its stock that is in
excess of the Bank’s earnings and profits accumulated in taxable years beginning
after December 31, 1951. No deferred tax liability has been established as these
two events are not expected to occur in the foreseeable future.
The Company
accounts for uncertainty in income taxes in accordance with FASB ASC 740-10. A reconciliation
of the beginning and ending amount of unrecognized tax benefits is as follows:
| December 31, | ||||||||||
| (In thousands) | 2009 | 2008 | ||||||||
| Balance, beginning of period | $ | 421 | $ | 4,436 | ||||||
Additions for tax positions of prior years |
- | - | ||||||||
Additions for tax positions from business combinations |
- | - | ||||||||
Additions for tax positions of current year |
- | 160 | ||||||||
Reductions for tax positions of prior year |
(21 | ) | (4,175 | ) | ||||||
Balance, end of period |
$ | 400 | $ | 421 | ||||||
Included in the balance at December 31,
2009 are $400,000 of tax positions for which the ultimate deductibility is highly
uncertain and for which the disallowance of the tax position would primarily affect
the annual effective tax rate. The Company recognizes interest and penalties accrued
related to unrecognized tax benefits as a component of income tax expense. As of
December 31, 2009, the Company has accrued approximately $78,000 in interest and
penalties.
Included in the balance at December 31, 2008, are $421,000 of
tax positions for which the ultimate deductibility was highly uncertain and for
which the disallowance of the tax position would primarily affect the annual effective
tax rate. As of December 31, 2008, the Company had accrued approximately $65,000
in interest and penalties.
The Company anticipates that $140,000 of the balance
of unrecognized tax benefits as of December 31, 2009 will reverse in the next 12
months due to statute of limitation expirations.
106
| NewAlliance Bancshares, Inc. |
| Notes to
Consolidated Financial Statements |
The Company is generally no longer subject
to federal, state or local income tax examinations by tax authorities for the years
before 2005. In the third quarter of 2008, the IRS commenced an examination of the
2006 and 2007 tax years for Westbank. In the second quarter of 2009, the IRS commenced
an examination of the 2006 and 2007 tax years for the Company. As of December 31,
2009, the IRS has not proposed any significant adjustments to Westbank’s or
the Company’s 2006 and 2007 tax returns.
15. Commitments and Contingencies
Cash and Due from Banks Withdrawal and Usage Restrictions
The Company
is required to maintain reserves against its transaction accounts and non-personal
time deposits. As of December 31, 2009 and 2008, the Company was required to have
deposits at the FRB Boston of approximately $23.7 million and $26.6 million, respectively,
to meet these requirements.
Leases
The Company leases certain of
its premises and equipment under lease agreements, which expire at various dates
through July 31, 2029. The Company has the option to renew certain of the leases
at fair rental values. Rental expense was approximately $4.4 million, $4.4 million
and $4.3 million for the years ended December 31, 2009, 2008 and 2007, respectively.
Future minimum payments, by fiscal year in the aggregate, under non-cancelable
operating leases with initial or remaining terms of one year or more consisted of
the following:
| (In thousands) | Amount | |||||
| 2010 | $ | 3,710 | ||||
| 2011 | 2,818 | |||||
| 2012 | 2,307 | |||||
| 2013 | 1,911 | |||||
| 2014 | 1,521 | |||||
| thereafter | 6,240 | |||||
Total |
$ | 18,507 | ||||
Commitments to Extend Credit
The Company is party to financial instruments with off-balance sheet risk in the
normal course of business to meet the financing needs of its customers. These financial
instruments consist primarily of commitments to extend credit and standby letters
of credit. Commitments to extend credit are agreements to lend to customers as long
as there is no violation of any condition established in the contract. Commitments
generally have fixed expiration dates or other termination clauses that may require
payment of a fee. Since many of the commitments could expire without being drawn
upon, the total commitment amounts do not necessarily represent future cash requirements.
These commitments consist principally of unused commercial and consumer lines of
credit. Standby letters of credit generally are conditional commitments issued by
the Company to guarantee the performance of a customer to a third party. The credit
risks associated with commitments to extend credit and standby letters of credit
are essentially the same as those involved with extending loans to customers and
are subject to normal credit policies. Collateral may be obtained based on management’s assessment of the customer’s creditworthiness.
The table below summarizes
the Company’s commitments and contingencies discussed above.
| December 31, | ||||||||||
| (In thousands) | 2009 | 2008 | ||||||||
| Loan origination commitments | $ | 146,369 | $ | 108,948 | ||||||
| Unadvanced portion of construction loans | 40,700 | 82,525 | ||||||||
| Standby letters of credit | 6,587 | 7,908 | ||||||||
| Unadvanced portion of lines of credit | 608,854 | 608,043 | ||||||||
Total commitments |
$ | 802,510 | $ | 807,424 | ||||||
Other Commitments
As of December
31, 2009 and 2008, the Company was contractually committed under limited partnership
agreements to make additional partnership investments of approximately $1.5 and
$1.8 million, respectively, which constitutes our maximum potential obligation to
these partnerships. The Company is obligated to make additional investments in response
to formal written requests, rather than a funding schedule. Funding requests are
submitted when the partnerships plan to make additional investments.
107
| NewAlliance Bancshares, Inc. |
| Notes to
Consolidated Financial Statements |
Legal Proceedings
We are not involved
in any pending legal proceedings other than routine legal proceedings occurring
in the ordinary course of business. We believe that those routine proceedings involve,
in the aggregate, amounts which are immaterial to the financial condition and results
of operations of the Company.
16. Stockholders’ Equity
At December 31, 2009, stockholders’ equity amounted to $1.43 billion, or 17.0%
of total assets, compared to $1.38 billion or 16.6% of total assets at December
31, 2008. The Company paid cash dividends of $0.28 and $0.275 per share on common
stock during the years ended December 31, 2009 and 2008, respectively.
Dividends
The Company and the Bank are subject to dividend restrictions imposed
by various regulators. Connecticut banking laws limit the amount of annual dividends
that the Bank may pay to the Company to an amount that approximates the Bank’s
net income retained for the current year plus net income retained for the two previous
years. In addition, the Bank may not declare or pay dividends on, and the Company
may not repurchase any of its shares of its common stock if the effect thereof would
cause stockholders’ equity to be reduced below applicable regulatory capital
maintenance requirements or if such declaration, payment or repurchase would otherwise
violate regulatory requirements.
Treasury Shares
Share Repurchase Plan
On January 31, 2006, the Company’s Board of Directors authorized a
repurchase plan of up to an additional 10.0 million shares or approximately 10%
of the then outstanding Company common stock. Under this plan the Company has repurchased
7,696,187 shares of common stock at a weighted average price of $12.95 per share
as of December 31, 2009. There is no set expiration date for this repurchase plan.
Other
Upon vesting of shares of restricted stock, plan participants may
choose to have the Company withhold a number of shares necessary to satisfy tax
withholding requirements. The withheld shares are classified as treasury shares
by the Company. For the year ended December 31, 2009, 111,418 shares were returned
to the Company for this purpose.
Liquidation Account
As part of
the conversion to a stock bank on April 1, 2004, the Bank established a liquidation
account for the benefit of account holders in an amount equal to the Bank’s
capital of $403.8 million as of September 30, 2003. The liquidation account will
be maintained for a period of ten years after the conversion for the benefit of
those deposit account holders who qualified as eligible account holders at the time
of the conversion and who have continued to maintain their eligible deposit balances
with the Bank following the conversion. The liquidation account, which totaled $106.4
million at December 31, 2009, is reduced annually by an amount equal to the decrease
in eligible deposit balances, notwithstanding any subsequent increases in the account.
In the unlikely event of the complete liquidation of the Bank, each eligible deposit
account holder will be entitled to receive his/her proportionate interest in the
liquidation account, after the payment of all creditors’ claims, but before
distributions to the Company as the sole stockholder of the Bank. The Bank may not
declare or pay a dividend on its capital stock if its effect would be to reduce
the regulatory capital of the Bank below the amount required for the liquidation
account.
Regulatory Capital
The Company and the Bank are subject
to various regulatory capital requirements administered by the federal banking agencies.
Failure to meet minimum capital requirements can initiate certain mandatory, and
possibly additional discretionary actions by regulators that, if undertaken, could
have a direct material effect on the Company’s Consolidated Financial Statements.
The regulations require the Bank to meet specific capital adequacy guidelines that
involve quantitative measures of the Bank’s assets, liabilities and certain
off-balance sheet items as calculated under regulatory accounting practices. The
Bank’s capital amounts and classification are also subject to qualitative judgments
by the banking regulators about components, risk weightings and other factors.
Quantitative measures established by regulation to ensure capital adequacy require
the Bank to maintain minimum amounts and ratios (set forth in the table below) of
Total capital and Tier 1 capital to risk weighted assets and of Tier 1 capital to
average assets. As of December 31, 2009 and December 31, 2008 the Company and the
Bank met all capital adequacy requirements to which it was subject.
As of
December 31, 2009, the most recent notification from the Federal Deposit Insurance
Corporation categorized the Bank as well capitalized under the regulatory framework
for prompt corrective action. To be categorized as well capitalized, the Bank must
maintain minimum Total risk-based, Tier 1 risk-based and Tier 1 leverage ratios
as set forth in the following table. Management
108
| NewAlliance Bancshares, Inc. |
| Notes to
Consolidated Financial Statements |
believes that there are no events or conditions, which have occurred subsequent to the notification that would change the Bank’s capital category. The following is a summary of the Company’s and the Bank’s actual capital amounts and ratios as of December 31, 2009 and 2008, compared to the required amounts and ratios for minimum capital adequacy and for classification as a well capitalized institution:
| To Be Well | |||||||||||||||||||||||||||
| For Capital | Capitalized Under | ||||||||||||||||||||||||||
| Adequacy | Prompt Corrective | ||||||||||||||||||||||||||
| Actual | Purposes | Action Provisions | |||||||||||||||||||||||||
| (Dollars in thousands) | Amount | Ratio | Amount | Ratio | Amount | Ratio | |||||||||||||||||||||
| NewAlliance Bank | |||||||||||||||||||||||||||
December 31, 2009 |
|||||||||||||||||||||||||||
Tier 1 Capital (to Average Assets) |
$ | 734,951 | 9.3 | % | $ | 317,623 | 4.0 | % | $ | 397,029 | 5.0 | % | |||||||||||||||
Tier 1 Capital (to Risk Weighted Assets) |
734,951 | 16.7 | 176,043 | 4.0 | 264,064 | 6.0 | |||||||||||||||||||||
Total Capital (to Risk Weighted Assets) |
787,510 | 17.9 | 352,085 | 8.0 | 440,107 | 10.0 | |||||||||||||||||||||
December 31, 2008 |
|||||||||||||||||||||||||||
Tier 1 Capital (to Average Assets) |
$ | 735,144 | 9.5 | % | $ | 308,308 | 4.0 | % | $ | 385,385 | 5.0 | % | |||||||||||||||
Tier 1 Capital (to Risk Weighted Assets) |
735,144 | 16.2 | 181,978 | 4.0 | 272,967 | 6.0 | |||||||||||||||||||||
Total Capital (to Risk Weighted Assets) |
785,055 | 17.3 | 363,955 | 8.0 | 454,944 | 10.0 | |||||||||||||||||||||
| NewAlliance Bancshares, Inc. | |||||||||||||||||||||||||||
December 31, 2009 |
|||||||||||||||||||||||||||
Tier 1 Capital (to Average Assets) |
$ | 878,553 | 11.1 | % | $ | 318,072 | 4.0 | % | $ | 397,590 | 5.0 | % | |||||||||||||||
Tier 1 Capital (to Risk Weighted Assets) |
878,553 | 19.9 | 176,422 | 4.0 | 264,633 | 6.0 | |||||||||||||||||||||
Total Capital (to Risk Weighted Assets) |
931,113 | 21.1 | 352,844 | 8.0 | 441,055 | 10.0 | |||||||||||||||||||||
December 31, 2008 |
|||||||||||||||||||||||||||
Tier 1 Capital (to Average Assets) |
$ | 853,628 | 11.1 | % | $ | 308,873 | 4.0 | % | $ | 386,091 | 5.0 | % | |||||||||||||||
Tier 1 Capital (to Risk Weighted Assets) |
853,628 | 18.7 | 182,537 | 4.0 | 273,806 | 6.0 | |||||||||||||||||||||
Total Capital (to Risk Weighted Assets) |
903,539 | 19.8 | 365,075 | 8.0 | 456,343 | 10.0 | |||||||||||||||||||||
17. Other Comprehensive Income (Loss)
The following table summarizes the components of comprehensive income
and other comprehensive income (loss) and the related tax effects for the years
ended December 31, 2009, 2008 and 2007.
| Year Ended December 31, | ||||||||||||||||
| (In thousands) | 2009 | 2008 | 2007 | |||||||||||||
| Net income | $ | 46,443 | $ | 45,296 | $ | 23,793 | ||||||||||
| Other comprehensive income (loss), before tax | ||||||||||||||||
Unrealized (losses) gains on securities: |
||||||||||||||||
Unrealized holding (losses) gains arising during the period |
54,058 | (11,911 | ) | 18,752 | ||||||||||||
Reclassification adjustment for (gains) losses included in net income |
(5,917 | ) | (1,843 | ) | 27,542 | |||||||||||
Non-credit unrealized loss on other-than-temporarily impaired debt securities |
(2,866 | ) | - | - | ||||||||||||
Unrecognized pension and post retirement gains (losses) |
11,572 | (37,731 | ) | 11,620 | ||||||||||||
| Other comprehensive income (loss), before tax | 56,847 | (51,485 | ) | 57,914 | ||||||||||||
| Income tax (expense) benefit, net of valuation allowance (1) | (19,854 | ) | 17,535 | (20,401 | ) | |||||||||||
| Other comprehensive income (loss), net of tax | 36,993 | (33,950 | ) | 37,513 | ||||||||||||
| Comprehensive income | $ | 83,436 | $ | 11,346 | $ | 61,306 | ||||||||||
| (1) | Deferred income
tax for the years ended December 31, 2009, 2008 and 2007 related to securities gains
and losses was an expense of $16.1 million, a benefit of $4.8 million and an expense
of $16.2 million, respectively. Included in deferred income taxes related to securities
gains and losses was a change in the valuation allowance of $332,000, $663,000 and $131,000
for the years ended December 31, 2009, 2008 and 2007, respectively, for the tax
effects of unrealized capital losses on equity securities. Deferred income tax related
to unrecognized pension gains and losses for the years ended December 31, 2009,
2008 and 2007 was an expense of $4.1 million, a benefit of $13.4 million and an expense
of $4.1 million, respectively. |
109
| NewAlliance Bancshares, Inc. |
| Notes to
Consolidated Financial Statements |
18. Earnings Per Share
The
following is an analysis of the Company’s basic and diluted EPS for the periods
presented:
| Year Ended December 31, | |||||||||||||||
| (In thousands, except per share data) | 2009 | 2008 | 2007 | ||||||||||||
| Net income | $ | 46,443 | $ | 45,296 | $ | 23,793 | |||||||||
| Average common shares outstanding for basic EPS | 99,163 | 99,587 | 103,146 | ||||||||||||
| Dilutive effect of stock options and unvested stock awards (1) | 13 | 120 | 436 | ||||||||||||
| Average common and common-equivalent shares for dilutive EPS | 99,176 | 99,707 | 103,582 | ||||||||||||
| Net income per common share: | |||||||||||||||
Basic |
$ | 0.47 | $ | 0.45 | $ | 0.23 | |||||||||
Diluted |
0.47 | 0.45 | 0.23 | ||||||||||||
| (1) | Not included
in the computation of diluted earnings per share because the options’ exercise
prices were greater than the average market price of the common shares during the
period were options to purchase 7,253,647, 8,339,450 and 114,465 shares of common
stock that were outstanding at December 31, 2009, 2008 and 2007, respectively. |
110
| NewAlliance Bancshares, Inc. |
| Notes to
Consolidated Financial Statements |
19. Selected Quarterly Consolidated Information
(unaudited)
The following tables present quarterly financial information
of the Company for 2009 and 2008, respectively:
| Three Months Ended | |||||||||||||||||||||
| December 31, | September 30, | June 30, | March 31, | ||||||||||||||||||
| (In thousands, except per share data) | 2009 | 2009 | 2009 | 2009 | |||||||||||||||||
| Interest and dividend income | $ | 90,694 | $ | 92,268 | $ | 94,082 | $ | 94,755 | |||||||||||||
| Interest expense | 37,169 | 40,506 | 44,155 | 46,762 | |||||||||||||||||
| Net interest income before provision for loan losses | 53,525 | 51,762 | 49,927 | 47,993 | |||||||||||||||||
| Provision for loan losses | 3,467 | 5,433 | 5,000 | 4,100 | |||||||||||||||||
| Net interest income after provision for loan losses | 50,058 | 46,329 | 44,927 | 43,893 | |||||||||||||||||
| Non-interest income | 13,243 | 16,449 | 15,291 | 14,263 | |||||||||||||||||
| Non-interest expense | 45,185 | 42,242 | 44,405 | 40,381 | |||||||||||||||||
| Income before taxes | 18,116 | 20,536 | 15,813 | 17,775 | |||||||||||||||||
| Income tax provision | 5,991 | 7,916 | 5,705 | 6,185 | |||||||||||||||||
| Net income | $ | 12,125 | $ | 12,620 | $ | 10,108 | $ | 11,590 | |||||||||||||
| Basic and diluted earnings per share | $ | 0.12 | $ | 0.13 | $ | 0.10 | $ | 0.12 | |||||||||||||
| Three Months Ended | |||||||||||||||||||||
| December 31, | September 30, | June 30, | March 31, | ||||||||||||||||||
| (In thousands, except per share data) | 2008 | 2008 | 2008 | 2008 | |||||||||||||||||
| Interest and dividend income | $ | 98,737 | $ | 99,042 | $ | 99,180 | $ | 102,214 | |||||||||||||
| Interest expense | 50,934 | 50,983 | 50,932 | 56,208 | |||||||||||||||||
| Net interest income before provision for loan losses | 47,803 | 48,059 | 48,248 | 46,006 | |||||||||||||||||
| Provision for loan losses | 3,800 | 4,200 | 3,700 | 1,700 | |||||||||||||||||
| Net interest income after provision for loan losses | 44,003 | 43,859 | 44,548 | 44,306 | |||||||||||||||||
| Non-interest income | 12,306 | 13,405 | 14,519 | 15,666 | |||||||||||||||||
| Non-interest expense | 41,643 | 41,371 | 41,317 | 42,237 | |||||||||||||||||
| Income before taxes | 14,666 | 15,893 | 17,750 | 17,735 | |||||||||||||||||
| Income tax provision | 5,022 | 4,957 | 5,968 | 4,801 | |||||||||||||||||
| Net income | $ | 9,644 | $ | 10,936 | $ | 11,782 | $ | 12,934 | |||||||||||||
| Basic and diluted earnings per share | $ | 0.10 | $ | 0.11 | $ | 0.12 | $ | 0.13 | |||||||||||||
111
| NewAlliance Bancshares, Inc. |
| Notes to
Consolidated Financial Statements |
20. Parent Company Statements
The following represents the Parent Company’s balance sheets as of December
31, 2009 and 2008, and statements of income and cash flows for the years ended December
31, 2009, 2008 and 2007.
Balance Sheet
| December 31, | |||||||||||
| (In thousands) | 2009 | 2008 | |||||||||
| Assets | |||||||||||
Interest earning and other bank deposits |
$ | 136,589 | $ | 106,390 | |||||||
Investment in subsidiaries |
1,312,486 | 1,287,367 | |||||||||
Other assets |
8,851 | 13,356 | |||||||||
Total assets |
$ | 1,457,926 | $ | 1,407,113 | |||||||
| Liabilities and shareholders’ equity | |||||||||||
Accrued interest and other liabilities |
$ | 1,838 | $ | 411 | |||||||
Borrowings |
21,135 | 25,486 | |||||||||
Shareholders’ equity |
1,434,953 | 1,381,216 | |||||||||
Total liabilities and shareholders’ equity |
$ | 1,457,926 | $ | 1,407,113 | |||||||
Income Statement
| Year Ended December 31, | ||||||||||||||||
| (In thousands) | 2009 | 2008 | 2007 | |||||||||||||
| Revenues | ||||||||||||||||
Interest on investments |
$ | 2,141 | $ | 1,765 | $ | 2,285 | ||||||||||
Other income |
108 | 86 | 536 | |||||||||||||
Total revenue |
2,249 | 1,851 | 2,821 | |||||||||||||
| Expenses | ||||||||||||||||
Interest on long term notes and debentures |
1,232 | 1,692 | 1,869 | |||||||||||||
Other expenses |
11,550 | 15,513 | 16,104 | |||||||||||||
Total expenses |
12,782 | 17,205 | 17,973 | |||||||||||||
| Loss before tax benefit and equity in undistributed net income of subsidiaries | (10,533 | ) | (15,354 | ) | (15,152 | ) | ||||||||||
| Income tax benefit | (3,686 | ) | (5,374 | ) | (5,735 | ) | ||||||||||
| Loss before equity in undistributed net income of subsidiaries | (6,847 | ) | (9,980 | ) | (9,417 | ) | ||||||||||
| Equity in undistributed net income of subsidiaries | 53,290 | 55,276 | 33,210 | |||||||||||||
| Net income | $ | 46,443 | $ | 45,296 | $ | 23,793 | ||||||||||
112
| NewAlliance Bancshares, Inc. |
| Notes to
Consolidated Financial Statements |
Statement of Cash Flows
| Year Ended December 31, | ||||||||||||||||
| (In thousands) | 2009 | 2008 | 2007 | |||||||||||||
| Cash flows from operating activities | ||||||||||||||||
| Net income | $ | 46,443 | $ | 45,296 | $ | 23,793 | ||||||||||
| Adjustments to reconcile net income to net cash provided by operating activities | ||||||||||||||||
Undistributed income of NewAlliance Bank |
(53,290 | ) | (55,276 | ) | (33,210 | ) | ||||||||||
ESOP expense |
3,196 | 3,399 | 3,669 | |||||||||||||
Restricted stock compensation expense |
6,085 | 6,992 | 7,521 | |||||||||||||
Stock option compensation expense |
357 | 4,247 | 4,455 | |||||||||||||
Deferred tax benefit |
3,731 | 1,895 | 3,155 | |||||||||||||
Net change in other assets and other liabilities |
1,351 | 12,526 | 53,582 | |||||||||||||
Net cash provided by operating activities |
7,873 | 19,079 | 62,965 | |||||||||||||
| Cash flows from investing activities | ||||||||||||||||
Proceeds from maturity, sales, calls and principal reductions of securities available for sale |
- | - | 118 | |||||||||||||
Net investment in bank subsidiary |
65,163 | 23,259 | 16,053 | |||||||||||||
Net cash provided by investing activities |
65,163 | 23,259 | 16,171 | |||||||||||||
| Cash flows from financing activities | ||||||||||||||||
Repayment of borrowings |
(3,500 | ) | - | - | ||||||||||||
Shares issued for stock option exercises |
- | - | 42 | |||||||||||||
Book (over) under tax benefit of stock-based compensation |
(84 | ) | (408 | ) | 470 | |||||||||||
Acquisition of treasury shares |
(11,154 | ) | (22,027 | ) | (63,796 | ) | ||||||||||
Dividends paid |
(28,099 | ) | (27,859 | ) | (26,999 | ) | ||||||||||
Net cash used by financing activities |
(42,837 | ) | (50,294 | ) | (90,283 | ) | ||||||||||
Net increase (decrease) in cash and cash equivalents |
30,199 | (7,956 | ) | (11,147 | ) | |||||||||||
Cash and cash equivalents, beginning of period |
106,390 | 114,346 | 125,493 | |||||||||||||
Cash and cash equivalents, end of period |
$ | 136,589 | $ | 106,390 | $ | 114,346 | ||||||||||
| Supplemental information | ||||||||||||||||
Cash paid for interest |
$ | 1,248 | $ | 1,700 | $ | 1,869 | ||||||||||
113
(c) Exhibits Required by Securities and Exchange Commission Regulation S-K
| Exhibit | ||
| Number | ||
| 3.1 | Amended and
Restated Certificate of Incorporation of NewAlliance Bancshares, Inc. Incorporated
herein by reference is Exhibit 3.1 filed with the Company’s Quarterly Report
on Form 10-Q, filed August 13, 2004. |
|
| 3.2 | Amended and
Restated Bylaws of NewAlliance Bancshares, Inc. Incorporated herein by reference
is Exhibit 3.2 filed with the Company’s Current Report on Form 8-K, filed November
2, 2007. |
|
| 4.1 | See Exhibit
3.1, Amended and Restated Certificate of Incorporation and Exhibit 3.2, Bylaws of
NewAlliance Bancshares, Inc. |
|
| 10.1 | (Intentionally
omitted.) |
|
| 10.2 | Amended and
Restated NewAlliance Bank Supplemental Executive Retirement Plan. Incorporated herein
by reference is Exhibit 10.2 filed with the Company’s Quarterly Report on Form
10-Q, filed November 7, 2008. |
|
| 10.3 | NewAlliance
Amended and Restated Employee Stock Ownership Plan Supplemental Executive Retirement
Plan. Incorporated herein by reference is Exhibit 10.3 filed with the Company’s
Quarterly Report on Form 10-Q, filed November 7, 2008. |
|
| 10.4 | The NewAlliance
Bank Amended and Restated 401(k) Supplemental Executive Retirement Plan. Incorporated
herein by reference is Exhibit 10.4 filed with the Company’s Quarterly Report
on Form 10-Q, filed November 7, 2008. |
|
| 10.5 | NewAlliance
Bank Executive Incentive Plan approved by shareholders on April 17, 2008, as amended.
Incorporated herein by reference is Exhibit 10.5 filed with the Company’s Quarterly
Report on Form 10-Q, filed August 7, 2009. |
|
| 10.6 | Employee Change
of Control Severance Plan. Incorporated by reference is Exhibit 10.6 filed with
the Company’s Quarterly Report on Form 10-Q, filed November 8, 2007. |
|
| 10.7.1 | Amended and
Restated Employment Agreement among NewAlliance Bancshares, Inc., NewAlliance Bank
and Peyton R. Patterson, effective December 15, 2009 (filed herewith). |
|
| 10.7.2 | Intentionally
omitted. |
|
| 10.7.3 | Amended and
Restated Employment Agreement among NewAlliance Bancshares, Inc., NewAlliance Bank
and Gail E.D. Brathwaite, effective December 15, 2009 (filed herewith). |
|
| 10.7.4 | Intentionally
omitted. |
|
| 10.7.5 | June 2009
Amendment to Amended and Restated Employment Agreement between NewAlliance Bank
and Diane L. Wishnafski, effective June 23, 2009. Incorporated herein by reference
is Exhibit 10.7.5.1 filed with the Company’s Current Report on Form 8-K, filed
June 23, 2009. |
|
| 10.7.6 | (Intentionally
omitted) |
|
| 10.7.7 | (Intentionally
omitted) |
|
| 10.7.8 | Amended and
Restated Employment Agreement between NewAlliance Bank and Donald T. Chaffee, effective
December 15, 2009 (filed herewith). |
|
| 10.7.9 | Amended and
Restated Employment Agreement between NewAlliance Bank and Paul A. McCraven, effective December 15, 2009 (filed herewith). |
|
| 10.7.10 | Amended and
Restated Employment Agreement between NewAlliance Bank and Koon-Ping Chan, effective
December 15, 2009 (filed herewith). |
|
| 10.7.11 | Amended and
Restated Employment Agreement between NewAlliance Bank and Mark Gibson, effective December 15, 2009 (filed herewith). |
|
| 10.7.12 | Amended and
Restated Employment Agreement among NewAlliance Bank, NewAlliance Bancshares, Inc. and Cecil Eugene
Kirby, Jr., effective December 15, 2009 (filed herewith). |
|
| 10.7.13 | Employment
Agreement among NewAlliance Bank, NewAlliance Bancshares, Inc. and Glenn I. MacInnes,
dated as of October 12, 2009. Incorporated herein by reference is Exhibit 10.7.13
filed with the Company’s Current Report on Form 8-K, filed October 14, 2009. |
|
| 10.8.1 | Form of Stock
Option Agreement for conversion awards (for outside directors). Incorporated herein by reference is Exhibit
10.8.1 filed with the Company’s Quarterly Report on Form 10-Q, filed August
9, 2005. |
|
| 10.8.2 | Form of Stock
Option Agreement for conversion awards (for employees, including senior officers). Incorporated herein
by reference is Exhibit 10.8.2 filed with the Company’s Quarterly Report on
Form 10-Q, filed August 9, 2005. |
|
| 10.9.1 | Form of Restricted
Stock Award Agreement for conversion awards (for outside directors). Incorporated herein by reference
is Exhibit 10.9.1 filed with the Company’s Quarterly Report on Form 10-Q, filed
August 9, 2005. |
|
114
| 10.9.2 | Form of Restricted
Stock Award Agreement for conversion awards (for employees, including senior officers). Incorporated herein
by reference is Exhibit 10.9.2 filed with the Company’s Quarterly Report on
Form 10-Q, filed August 9, 2005. |
|
| 10.10 | NewAlliance
Bancshares, Inc. 2005 Long-Term Compensation Plan. Incorporated herein by reference
is Exhibit 4.3 filed with the Company’s Registration Statement on Form S-8,
filed November 4, 2005. |
|
| 10.11 | (Intentionally
omitted) |
|
| 10.12 | Form of Indemnification
Agreement for Directors and Certain Executive Officers. Incorporated herein by reference
is Exhibit 10.12 filed with the Company’s Annual Report on Form 10-K, filed
March 1, 2007. |
|
| 10.13 | General Severance
Plan. Incorporated herein by reference is Exhibit 10.13 filed with the Company’s
Annual Report on Form 10-K, filed February 27, 2009. |
|
| 10.14 | Form of Performance
Share Award Agreement (for senior officers) (2009 awards). Incorporated herein by
reference is Exhibit 10.14 filed with the Company Current Report on Form 8-K, filed
June 1, 2009. |
|
| 10.15 | Form of Restricted
Stock Award Agreement (for senior officers) (2009 awards). Incorporated herein by
reference is Exhibit 10.15 filed with the Company Current Report on Form 8-K, filed
June 1, 2009. |
|
| 10.16 | Form of Stock
Option Award Agreement (for senior officers) (2009 awards). Incorporated herein
by reference is Exhibit 10.16 filed with the Company Current Report on Form 8-K,
filed June 1, 2009. |
|
| 10.17 | Form of Stock
Option Agreement for annual awards (for outside directors) (filed herewith). |
|
| 10.18 | Form of Restriced Stock
Agreement for annual awards (for outside directors) (filed herewith). |
|
| 14 | Code of Ethics
for Senior Financial Officers. Incorporated herein by reference is Exhibit 14 filed
with the Company’s Annual Report on Form 10-KT, filed March 30, 2004. |
|
| 21 | Subsidiaries
of NewAlliance Bancshares, Inc. and NewAlliance Bank. Incorporated herein by reference
is Exhibit 21 filed with the Company’s Annual Report on Form 10-K, filed March
1, 2007. |
|
| 23.1 | Consent of
PricewaterhouseCoopers LLP (filed herewith). |
|
| 31.1 | Certification
of Peyton R. Patterson pursuant to the requirements of Section 13 or 15(d) of the
Securities Exchange Act of 1934 (filed herewith). |
|
| 31.2 | Certification
of Glenn I. MacInnes pursuant to the requirements of Section 13 or 15(d) of the
Securities Exchange Act of 1934 (filed herewith). |
|
| 32.1 | Certification
of Peyton R. Patterson pursuant to 18 U.S.C. Section 1350, as Adopted Pursuant to
Section 906 of the Sarbanes-Oxley Act of 2002 (filed herewith). |
|
| 32.2 | Certification
of Glenn I. MacInnes pursuant to 18 U.S.C. Section 1350, as Adopted Pursuant to
Section 906 of the Sarbanes-Oxley Act of 2002 (filed herewith). |
115
Pursuant to the requirements of Section 13 or 15(d) of the Securities Exchange Act of 1934, the registrant has duly caused this report to be signed on its behalf by the undersigned, thereunto duly authorized.
| NewAlliance Bancshares, Inc. | ||||
| By: | /s/ Peyton R. Patterson | February 23, 2010 | ||
| Peyton R. Patterson | ||||
| Chairman of the Board, President and Chief Executive Officer | ||||
Pursuant to the requirements of the Securities Exchange Act of 1934, this report has been signed below by the following persons on behalf of the registrant and in the capacities and on the dates indicated.
| Name | Title | Date | ||
| /s/ Peyton R. Patterson | Chairman of the Board, President and | February 23, 2010 | ||
| Peyton R. Patterson | Chief Executive Officer | |||
| (principal executive officer) | ||||
| /s/ Glenn I. MacInnes | Executive Vice President and Chief Financial | February 23, 2010 | ||
| Glenn I. MacInnes | Officer | |||
| (principal financial officer) | ||||
| /s/ Mark F. Doyle | Senior Vice President and Chief Accounting | February 23, 2010 | ||
| Mark F. Doyle | Officer | |||
| (principal accounting officer) | ||||
| /s/ Douglas K. Anderson | Director | February 23, 2010 | ||
| Douglas K. Anderson | ||||
| /s/ Roxanne J. Coady | Director | February 23, 2010 | ||
| Roxanne J. Coady | ||||
| /s/ Sheila B. Flanagan | Director | February 23, 2010 | ||
| Sheila B. Flanagan | ||||
| /s/ Carlton L. Highsmith | Director | February 23, 2010 | ||
| Carlton L. Highsmith | ||||
| /s/ Robert J. Lyons, Jr. | Director | February 23, 2010 | ||
| Robert J. Lyons, Jr. | ||||
| /s/ Eric A. Marziali | Director | February 23, 2010 | ||
| Eric A. Marziali | ||||
| /s/ Julia M. McNamara | Director | February 23, 2010 | ||
| Julia M. McNamara | ||||
| /s/ Gerald B. Rosenberg | Director | February 23, 2010 | ||
| Gerald B. Rosenberg | ||||
| /s/ Joseph H. Rossi | Director | February 23, 2010 | ||
| Joseph H. Rossi | ||||
| /s/ Nathaniel D. Woodson | Director | February 23, 2010 | ||
| Nathaniel D. Woodson | ||||
| /s/ Joseph A. Zaccagnino | Director | February 23, 2010 | ||
| Joseph A. Zaccagnino |
116