Attached files
Table of Contents
UNITED STATES
SECURITIES AND EXCHANGE COMMISSION
Washington, D.C. 20549
FORM 10-K
| x | ANNUAL REPORT PURSUANT TO SECTION 13 OR 15(d) OF THE SECURITIES EXCHANGE ACT OF 1934 |
For the fiscal year ended December 31, 2009
or
| ¨ | TRANSITION REPORT PURSUANT TO SECTION 13 OR 15(d) OF THE SECURITIES EXCHANGE ACT OF 1934 |
For the transition period from to
Mirant Americas Generation, LLC
(Exact Name of Registrant as Specified in Its Charter)
Commission File Number: 333-63240
51-0390520 (I.R.S. Employer Identification No.)
Mirant North America, LLC
(Exact Name of Registrant as Specified in Its Charter)
Commission File Number: 333-134722
20-4514609 (I.R.S. Employer Identification No.)
Mirant Mid-Atlantic, LLC
(Exact Name of Registrant as Specified in Its Charter)
Commission File Number: 333-61668
58-2574140 (I.R.S. Employer Identification No.)
Delaware
(State or Other Jurisdiction of Incorporation or Organization of All Registrants)
1155 Perimeter Center West,
Suite 100, Atlanta, Georgia 30338
(Address of Principal Executive Offices, Including Zip Code, of All Registrants)
(678) 579-5000
(Registrant’s telephone number, including area code)
None
Securities registered pursuant to Section 12(b) of the Act
None
Securities registered pursuant to Section 12(g) of the Act
Indicate by check mark if the registrant is a well-known seasoned issuer, as defined by Rule 405 of the Securities Act.
| Mirant Americas Generation, LLC | ¨ Yes x No | |
| Mirant North America, LLC | ¨ Yes x No | |
| Mirant Mid-Atlantic, LLC | ¨ Yes x No |
Indicate by check mark if the registrant is not required to file reports pursuant to Section 13 or Section 15(d) of the Act.
| Mirant Americas Generation, LLC | x Yes ¨ No | |
| Mirant North America, LLC | x Yes ¨ No | |
| Mirant Mid-Atlantic, LLC | x Yes ¨ No |
Indicate by check mark whether the registrant (1) has filed all reports required to be filed by Section 13 or 15(d) of the Securities Exchange Act of 1934 during the preceding 12 months (or for such shorter period that the registrant was required to file such reports), and (2) has been subject to such filing requirements for the past 90 days.
| Mirant Americas Generation, LLC | x Yes ¨ No | |
| Mirant North America, LLC | x Yes ¨ No | |
| Mirant Mid-Atlantic, LLC | x Yes ¨ No |
Table of Contents
Indicate by check mark whether the registrant has submitted electronically and posted on its corporate Web site, if any, every Interactive Data File required to be submitted and posted pursuant to Rule 405 of Regulation S-T (§232.405 of this chapter) during the preceding 12 months (or for such shorter period that the registrant was required to submit and post such files).
| Mirant Americas Generation, LLC | ¨ Yes ¨ No | |
| Mirant North America, LLC | ¨ Yes ¨ No | |
| Mirant Mid-Atlantic, LLC | ¨ Yes ¨ No |
Indicate by check mark if disclosure of delinquent filers pursuant to Item 405 of Regulation S-K (§229.405 of this chapter) is not contained herein, and will not be contained, to the best of the registrants’ knowledge, in definitive proxy or information statements incorporated by reference in Part III of this Form 10-K or any amendment to this Form 10-K.
| Mirant Americas Generation, LLC | x | |
| Mirant North America, LLC | x | |
| Mirant Mid-Atlantic, LLC | x |
Indicate by check mark whether the registrant is a large accelerated filer, an accelerated filer, a non-accelerated filer, or a smaller reporting company. See the definitions of “large accelerated filer,” “accelerated filer” and “smaller reporting company” in Rule 12b-2 of the Exchange Act.
| Large accelerated filer |
Accelerated filer | Non-accelerated filer | Smaller reporting company | |||||
| Mirant Americas Generation, LLC | ¨ | ¨ | x | ¨ | ||||
| Mirant North America, LLC | ¨ | ¨ | x | ¨ | ||||
| Mirant Mid-Atlantic, LLC | ¨ | ¨ | x | ¨ |
Indicate by check mark whether the registrant is a shell company (as defined in Rule 12b-2 of the Act).
| Mirant Americas Generation, LLC | ¨ Yes x No | |
| Mirant North America, LLC | ¨ Yes x No | |
| Mirant Mid-Atlantic, LLC | ¨ Yes x No |
Indicate by check mark whether the registrant has filed all documents and reports required to be filed by Section 12, 13 or 15(d) of the Securities Exchange Act of 1934 subsequent to the distribution of securities under a plan confirmed by a court.
| Mirant Americas Generation, LLC | x Yes ¨ No | |
| Mirant North America, LLC | x Yes ¨ No | |
| Mirant Mid-Atlantic, LLC | x Yes ¨ No |
All of the registrant’s outstanding membership interests are held by its parent and there are no membership interest held by nonaffiliates.
| Registrant |
Parent | |
| Mirant Americas Generation, LLC | Mirant Americas, Inc. | |
| Mirant North America, LLC | Mirant Americas Generation, LLC | |
| Mirant Mid-Atlantic, LLC | Mirant North America, LLC |
This combined Form 10-K is separately filed by Mirant Americas Generation, LLC, Mirant North America, LLC and Mirant Mid-Atlantic, LLC. Information contained in this combined Form 10-K relating to Mirant Americas Generation, LLC, Mirant North America, LLC and Mirant Mid-Atlantic, LLC is filed by such registrant on its own behalf and each registrant makes no representation as to information relating to registrants other than itself.
We have not incorporated by reference any information into this Form 10-K from any annual report to securities holders, proxy statement or prospectus filed pursuant to 424(b) or (c) of the Securities Act.
NOTE: WHEREAS MIRANT AMERICAS GENERATION, LLC, MIRANT NORTH AMERICA, LLC AND MIRANT MID-ATLANTIC, LLC MEET THE CONDITIONS SET FORTH IN GENERAL INSTRUCTION I(1)(a) AND (b) OF FORM 10-K, THIS COMBINED FORM 10-K IS BEING FILED WITH THE REDUCED DISCLOSURE FORMAT PURSUANT TO GENERAL INSTRUCTION I(2).
2
Table of Contents
3
Table of Contents
Glossary of Certain Defined Terms
Ancillary Services—Services that ensure reliability and support the transmission of electricity from generation sites to customer loads. Such services include regulation service, reserves and voltage support.
Administrative Services Agreement—Management, personnel and services agreement with Mirant Services, effective January 3, 2006.
APSA—Asset Purchase and Sale Agreement dated June 7, 2000, between Mirant and Pepco.
Bankruptcy Code—United States Bankruptcy Code.
Bankruptcy Court—United States Bankruptcy Court for the Northern District of Texas, Fort Worth Division.
Baseload Generating Units—Units that satisfy minimum baseload requirements of the system and produce electricity at an essentially constant rate and run continuously.
CAIR—Clean Air Interstate Rule.
CAISO—California Independent System Operator.
Cal PX—California Power Exchange.
CAMR—Clean Air Mercury Rule.
CCX—Chicago Climate Exchange.
CERCLA—Federal Comprehensive Environmental Response, Compensation and Liability Act of 1980.
Clean Air Act—Federal Clean Air Act.
Clean Water Act—Federal Water Pollution Control Act.
CO2—Carbon dioxide.
Companies—Mirant Americas Generation, LLC, Mirant North America, LLC, Mirant Mid-Atlantic, LLC and their subsidiaries.
CPUC—California Public Utilities Commission.
Dark Spread—The difference between the price received for electricity generated compared to the market price of the coal required to produce the electricity.
DC Circuit—The United States Court of Appeals for the District of Columbia Circuit.
DWR—California Department of Water Resources.
EBITDA—Earnings before interest, taxes, depreciation and amortization.
EOB—California Electricity Oversight Board.
EPA—United States Environmental Protection Agency.
Exchange Act—Securities Exchange Act of 1934.
FASB—Financial Accounting Standards Board.
FERC—Federal Energy Regulatory Commission.
i
Table of Contents
GAAP—United States generally accepted accounting principles.
Gross Margin—Operating revenue less cost of fuel, electricity and other products, excluding depreciation and amortization.
Hudson Valley Gas—Hudson Valley Gas Corporation.
IBEW—International Brotherhood of Electrical Workers.
InterContinental Exchange—InterContinental Exchange, Inc.
Intermediate Generating Units—Units that meet system requirements that are greater than baseload and less than peaking.
ISO—Independent System Operator.
ISO-NE—Independent System Operator-New England.
kW—Kilowatt.
LIBOR—London InterBank Offered Rate.
LTSA—Long-term service agreement.
MDE—Maryland Department of the Environment.
Mirant—Old Mirant prior to January 3, 2006, and New Mirant on or after January 3, 2006.
Mirant Americas—Mirant Americas, Inc.
Mirant Americas Energy Marketing—Mirant Americas Energy Marketing, LP.
Mirant Bowline—Mirant Bowline, LLC.
Mirant California—Mirant California, LLC.
Mirant Canal—Mirant Canal, LLC.
Mirant Chalk Point—Mirant Chalk Point, LLC.
Mirant Delta—Mirant Delta, LLC.
Mirant Energy Trading—Mirant Energy Trading, LLC.
Mirant Kendall—Mirant Kendall, LLC.
Mirant Lovett—Mirant Lovett, LLC, owner of the former Lovett generating facility, which was shut down on April 19, 2008, and has been demolished.
Mirant MD Ash Management—Mirant MD Ash Management, LLC.
Mirant New York—Mirant New York, LLC.
Mirant NY-Gen—Mirant NY-Gen, LLC sold by Mirant North America in the second quarter of 2007.
Mirant Potomac River—Mirant Potomac River, LLC.
Mirant Potrero—Mirant Potrero, LLC.
Mirant Power Purchase—Mirant Power Purchase, LLC.
ii
Table of Contents
Mirant Services—Mirant Services, LLC.
Mirant Texas—Mirant Texas, LP, which owned the Bosque generating facility, sold by Mirant North America in the second quarter of 2007.
Mirant Zeeland—Mirant Zeeland, LLC sold by Mirant North America in the second quarter of 2007.
MW—Megawatt.
MWh—Megawatt hour.
NAAQS—National ambient air quality standard.
NEPOOL—New England Power Pool.
NERC—North American Electric Reliability Council.
Net Capacity Factor—Actual production of electricity as a percentage of net dependable capacity to produce electricity.
New Mirant—Mirant Corporation on or after January 3, 2006.
NOL—Net operating loss.
NOV—Notice of violation.
NOx—Nitrogen oxides.
NPCC—Northeastern Power Coordinating Council.
NSR—New source review.
NYISO—New York Independent System Operator.
NYMEX—New York Mercantile Exchange.
Old Mirant—MC 2005, LLC, known as Mirant Corporation prior to January 3, 2006.
Orange and Rockland—Orange and Rockland Utilities, Inc.
OTC—Over-the-Counter.
Ozone Season—The period between May 1 and September 30 of each year.
Peaking Generating Units—Units used to meet demand requirements during the periods of greatest or peak load on the system.
Pepco—Potomac Electric Power Company.
PG&E—Pacific Gas & Electric Company.
PJM—PJM Interconnection, LLC.
Plan—The plan of reorganization that was approved in conjunction with Mirant’s and the Companies’ emergence from bankruptcy protection on January 3, 2006.
Power Sale, Fuel Supply and Services Agreement—Power sale, fuel supply and services agreement with Mirant Americas Energy Marketing, effective January 3, 2006. As of February 1, 2006, the agreement was transferred to Mirant Energy Trading.
iii
Table of Contents
PPA—Power purchase agreement.
PUHCA—Public Utility Holding Company Act of 2005.
Reserve Margin—Excess capacity over peak demand.
RFC—ReliabilityFirst Corporation.
RGGI—Regional Greenhouse Gas Initiative.
RMR—Reliability-must-run.
RTO—Regional Transmission Organization.
SEC—United States Securities and Exchange Commission.
Securities Act—Securities Act of 1933, as amended.
SO2—Sulfur dioxide.
Spark Spread—The difference between the price received for electricity generated compared to the market price of the natural gas required to produce the electricity.
Supplemental Plan—The Supplemental Joint Chapter 11 Plan of Reorganization for Mirant New York, Mirant Bowline and Hudson Valley Gas filed with the Bankruptcy Court on January 26, 2007 and subsequent amendments to that plan.
UWUA—Utility Workers Union of America.
VaR—Value at risk.
Virginia DEQ—Virginia Department of Environmental Quality.
WECC—Western Electric Coordinating Council.
iv
Table of Contents
CAUTIONARY STATEMENT REGARDING FORWARD-LOOKING INFORMATION
In addition to historical information, the information presented in this combined Form 10-K includes forward-looking statements within the meaning of Section 27A of the Securities Act of 1933 and Section 21E of the Securities Exchange Act of 1934. These statements involve known and unknown risks and uncertainties and relate to future events, our future financial performance or our projected business results. In some cases, one can identify forward-looking statements by terminology such as “may,” “will,” “should,” “expect,” “intend,” “seek,” “plan,” “think,” “anticipate,” “estimate,” “predict,” “target,” “potential” or “continue” or the negative of these terms or other comparable terminology.
Forward-looking statements are only predictions. Actual events or results may differ materially from any forward-looking statement as a result of various factors, which include:
| — | legislative and regulatory initiatives regarding deregulation, regulation or restructuring of the industry of generating, transmitting and distributing electricity (the “electricity industry”); changes in state, federal and other regulations affecting the electricity industry (including rate and other regulations); changes in, or changes in the application of, environmental and other laws and regulations to which we and our subsidiaries and affiliates are or could become subject; |
| — | failure of our plants to perform as expected, including outages for unscheduled maintenance or repair; |
| — | environmental regulations that restrict our ability or render it uneconomic to operate our business, including regulations related to the emission of CO2 and other greenhouse gases; |
| — | increased regulation that limits our access to adequate water supplies and landfill options needed to support power generation or that increases the costs of cooling water and handling, transporting and disposing off-site of ash and other byproducts; |
| — | changes in market conditions, including developments in the supply, demand, volume and pricing of electricity and other commodities in the energy markets, including efforts to reduce demand for electricity and to encourage the development of renewable sources of electricity, and the extent and timing of the entry of additional competition in our markets; |
| — | continued poor economic and financial market conditions, including impacts on financial institutions and other current and potential counterparties and negative impacts on liquidity in the power and fuel markets in which we hedge and transact; |
| — | increased credit standards, margin requirements, market volatility or other market conditions that could increase our obligations to post collateral beyond amounts that are expected, including additional collateral costs associated with OTC hedging activities as a result of proposed OTC regulation; |
| — | our inability to access effectively the OTC and exchange-based commodity markets or changes in commodity market conditions and liquidity, including as a result of proposed OTC regulation, which may affect our ability to engage in asset management and, for Mirant Americas Generation and Mirant North America, proprietary trading and fuel oil management activities as expected, or result in material gains or losses from open positions; |
| — | deterioration in the financial condition of Mirant Americas Generation, Mirant North America and Mirant Mid-Atlantic counterparties or Mirant Mid-Atlantic affiliates and the failure of such parties to pay amounts owed to Mirant Americas Generation, Mirant North America and Mirant Mid-Atlantic or to perform obligations or services due to Mirant Americas Generation, Mirant North America and Mirant Mid-Atlantic beyond collateral posted; |
5
Table of Contents
| — | hazards customary to the power generation industry and the possibility that we may not have adequate insurance to cover losses resulting from such hazards or the inability of our insurers to provide agreed upon coverage; |
| — | price mitigation strategies employed by ISOs or RTOs that reduce our revenue and may result in a failure to compensate our generating units adequately for all of their costs; |
| — | changes in the rules used to calculate capacity, energy and ancillary services payments; |
| — | legal and political challenges to the rules used to calculate capacity, energy and ancillary services payments; |
| — | volatility in our gross margin as a result of our accounting for derivative financial instruments used in our asset management and Mirant Americas Generation’s and Mirant North America’s proprietary trading and fuel oil management activities and volatility in our cash flow from operations resulting from working capital requirements, including collateral, to support our asset management and Mirant Americas Generation’s and Mirant North America’s proprietary trading and fuel oil management activities; |
| — | our ability to enter into intermediate and long-term contracts to sell power and to obtain adequate supply and delivery of fuel for our generating facilities, at our required specifications and on terms and prices acceptable to us; |
| — | our failure to utilize new or advancements in power generation technologies; |
| — | the inability of Mirant Americas Generation’s and Mirant North America’s operating subsidiaries to generate sufficient cash flow to support their operations; |
| — | our and our affiliates’ ability to borrow additional funds and access capital markets; |
| — | strikes, union activity or labor unrest; |
| — | our ability to obtain or develop capable leaders and our ability to retain or replace the services of key employees; |
| — | weather and other natural phenomena, including hurricanes and earthquakes; |
| — | the cost and availability of emissions allowances; |
| — | curtailment of operations and reduced prices for electricity resulting from transmission constraints; |
| — | the ability of Mirant Americas Generation and Mirant North America to execute the business plan in California, including entering into new tolling arrangements for their existing generating facilities; |
| — | our relative lack of geographic diversification in revenue sources resulting in concentrated exposure to the Mid-Atlantic market; |
| — | the ability of lenders under Mirant North America’s revolving credit facility to perform their obligations; |
| — | war, terrorist activities, cyberterrorism and inadequate cybersecurity, or the occurrence of a catastrophic loss; |
| — | our failure to provide a safe working environment for our employees and visitors thereby increasing our exposure to additional liability, loss of productive time, other costs and a damaged reputation; |
| — | Mirant Americas Generation’s and Mirant North America’s consolidated indebtedness and the possibility that Mirant Americas Generation, Mirant North America or their subsidiaries may incur additional indebtedness in the future; |
6
Table of Contents
| — | restrictions on the ability of Mirant Americas Generation’s subsidiaries to pay dividends, make distributions or otherwise transfer funds to Mirant Americas Generation, including restrictions on Mirant North America contained in its financing agreements and restrictions on Mirant Mid-Atlantic contained in its leveraged lease documents, which may affect Mirant Americas Generation’s ability to access the cash flows of those subsidiaries to make debt service and other payments; |
| — | restrictions on the ability of Mirant North America’s subsidiaries to pay dividends, make distributions or otherwise transfer funds to Mirant North America, including restrictions on Mirant Mid-Atlantic contained in its leveraged lease documents, which may affect Mirant North America’s ability to access the cash flows of those subsidiaries to make debt service and other payments; |
| — | our failure to comply with or monitor provisions of our loan agreements and debt may lead to a breach and, if not remedied, result in an event of default thereunder, which would limit access to needed capital and damage our reputation and relationships with financial institutions; and |
| — | the disposition of the pending litigation described in this combined Form 10-K. |
Many of these risks, uncertainties and assumptions are beyond our ability to control or predict. All forward-looking statements attributable to us or persons acting on our behalf are expressly qualified in their entirety by cautionary statements contained throughout this report. Because of these risks, uncertainties and assumptions, you should not place undue reliance on these forward-looking statements. Furthermore, forward-looking statements speak only as of the date they are made.
Factors that Could Affect Future Performance
We undertake no obligation to update publicly or revise any forward-looking statements to reflect events or circumstances that may arise after the date of this report.
In addition to the discussion of certain risks in Management’s Discussion and Analysis of Results of Operations and Financial Condition and the accompanying combined Notes to Mirant Americas Generation, LLC’s, Mirant North America, LLC’s and Mirant Mid-Atlantic, LLC’s consolidated financial statements, other factors that could affect the Companies’ future performance (business, results of operations or financial condition and cash flows) are set forth in Item 1A. “Risk Factors”.
Certain Terms
As used in this report, unless the context requires otherwise, “we,” “us,” “our,” and the “Companies” refer to Mirant Americas Generation, LLC, Mirant North America, LLC, Mirant Mid-Atlantic, LLC and their subsidiaries. In addition, as used in this report, unless the context requires otherwise, “Mirant Americas Generation” refers to Mirant Americas Generation, LLC and its subsidiaries, “Mirant North America” refers to Mirant North America, LLC and its subsidiaries and “Mirant Mid-Atlantic” refers to Mirant Mid-Atlantic, LLC and its subsidiaries.
7
Table of Contents
| Item 1. | Business (Mirant Americas Generation, Mirant North America and Mirant Mid-Atlantic) |
Overview
Mirant Americas Generation and Mirant North America are competitive energy companies that produce and sell electricity in the United States. Mirant Americas Generation and Mirant North America own or lease 10,076 MW of net electric generating capacity in the Mid-Atlantic and Northeast regions and in California, including 5,194 MW owned or leased by Mirant Mid-Atlantic. Mirant Americas Generation and Mirant North America also operate an integrated asset management and energy marketing organization based in Atlanta, Georgia. Mirant Americas Generation’s and Mirant North America’s customers are principally ISOs, RTOs and investor-owned utilities. Mirant Americas Generation’s and Mirant North America’s generating portfolio is diversified across fuel types, power markets and dispatch types and serves customers located near major metropolitan load centers. Mirant Americas Generation’s and Mirant North America’s total net generating capacity is approximately 30% baseload, 58% intermediate and 12% peaking. Mirant Mid-Atlantic’s generating facilities serve the PJM markets. The PJM ISO operates the largest centrally dispatched control area in the United States. Mirant Mid-Atlantic’s total net generating capacity is approximately 53% baseload, 27% intermediate and 20% peaking.
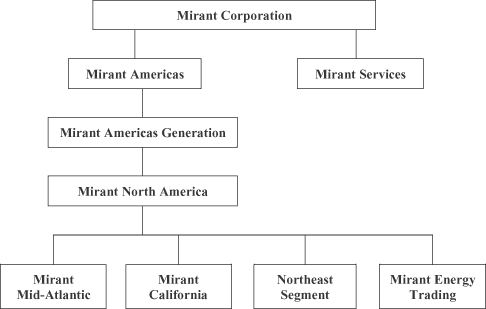
Mirant Americas Generation, Mirant North America and Mirant Mid-Atlantic are Delaware limited liability companies and indirect wholly-owned subsidiaries of Mirant Corporation. Mirant North America is a wholly-owned subsidiary of Mirant Americas Generation. Mirant Mid-Atlantic is a wholly-owned subsidiary of Mirant North America and an indirect wholly-owned subsidiary of Mirant Americas Generation. The chart below is a summary representation of the Companies’ organizational structure and is not a complete organizational chart of Mirant Corporation.
8
Table of Contents
We are focused on the operational performance of our generating facilities, generation of cash from operations and prudent growth of our business as reflected in the following:
| — | Including amounts already invested to date, we will invest $1.674 billion on emissions reduction controls to comply with the Maryland Healthy Air Act. We completed the installation of flue gas desulphurization emissions controls (“scrubbers”) at our Chalk Point, Dickerson and Morgantown coal-fired units in the fourth quarter of 2009. We previously installed selective catalytic reduction systems at the Morgantown coal-fired units and one of the Chalk Point coal-fired units and a selective auto catalytic reduction system at the other Chalk Point coal-fired unit. In addition, we installed selective non-catalytic reduction systems at the three Dickerson coal-fired units. These controls are capable of reducing emissions of SO2, NOx and mercury by approximately 98%, 90% and 80%, respectively, for three of our largest coal-fired units. |
| — | Our investments in our generating facilities also reflect our targeted maintenance program to ensure consistent long-term availability of our generating facilities. |
| — | In 2009, power and natural gas prices declined to average levels lower than 2008. Our hedging program, which reduces the impact of volatile commodity prices and enables us to achieve more predictable results, reduced our exposure to these relatively low prices and contributed $629 million to Mirant Americas Generation’s and Mirant North America’s realized gross margin for 2009 and $586 million to Mirant Mid-Atlantic’s realized gross margin for 2009. In 2009, Mirant Americas Generation and Mirant North America generated $766 million and $885 million, respectively, of net cash provided by operating activities of their continuing operations and Mirant Mid-Atlantic generated $607 million of net cash provided by operating activities. We continue to add hedges opportunistically, including to maintain a projected level of cash flows from operations for future periods that supports continued compliance with the covenants in Mirant North America’s debt and Mirant Mid-Atlantic’s lease agreements. |
| — | As we generate excess cash from our operations, we will invest it in our business, but only when we can achieve an appropriate return for our investors by doing so. We have sufficient room at our existing sites to add an additional 4,000 MW to 5,000 MW of generating capacity in the Mid-Atlantic. Mirant Americas Generation and Mirant North America have sufficient room at their existing sites for an additional 1,000 MW to 1,500 MW of generating capacity in the Northeast and an additional 2,500 MW to 3,500 MW of generating capacity in California. We continue to consider these and other investment opportunities. |
Mirant Corporation was incorporated in Delaware on September 23, 2005. Pursuant to the Plan for Mirant and certain of its subsidiaries, on January 3, 2006, New Mirant emerged from bankruptcy and acquired substantially all of the assets of Old Mirant, a corporation that was formed in Delaware on April 3, 1993, and that had been named Mirant Corporation prior to January 3, 2006.
The annual, quarterly and current reports, and any amendments to those reports, that we file with or furnish to the SEC are available free of charge on Mirant’s website at www.mirant.com as soon as reasonably practicable after they are electronically filed with or furnished to the SEC. Information contained on this website is not incorporated into this Form 10-K.
9
Table of Contents
Business Segments (Mirant Americas Generation and Mirant North America)
We have four operating segments: Mid-Atlantic, Northeast, California and Other Operations. The map below shows the location of our generating facilities, sized by capacity.
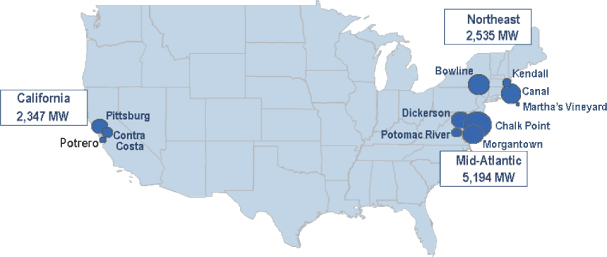
The Mid-Atlantic segment consists of four generating facilities located in Maryland and Virginia, near Washington, D.C.
The Northeast segment consists of three generating facilities located in Massachusetts and one generating facility located in New York, near New York City. For the years ended December 31, 2008 and 2007, the Northeast segment also included the Lovett generating facility, which was shut down on April 19, 2008.
The California segment consists of three generating facilities located in or near the City of San Francisco.
Other Operations includes proprietary trading and fuel oil management activities, parent company adjustments for affiliate transactions, interest on debt at Mirant Americas Generation and Mirant North America and interest income on our invested cash balances.
The table below presents our Net Capacity Factor for the year ended December 31, 2009:
| Region |
Net Capacity Factor |
||
| Mid-Atlantic |
30 | % | |
| Northeast |
10 | % | |
| California |
5 | % |
10
Table of Contents
The table below summarizes selected financial information of our continuing operations by business segment for the year ended December 31, 2009 (dollars in millions):
| Business Segment |
Revenues | % | Gross Margin |
% | Operating Income |
% | ||||||||||||||
| Mid-Atlantic |
$ | 1,778 | 77 | % | $ | 1,251 | 78 | % | $ | 348 | 57 | % | ||||||||
| Northeast |
318 | 14 | % | 175 | 11 | % | 35 | 6 | % | |||||||||||
| California |
154 | 6 | % | 122 | 8 | % | 12 | 2 | % | |||||||||||
| Other Operations |
2,000 | 87 | % | 54 | 3 | % | 34 | 5 | % | |||||||||||
| Eliminations |
(1,941 | ) | (84 | )% | (3 | ) | — | % | 184 | 30 | % | |||||||||
| Total |
$ | 2,309 | 100 | % | $ | 1,599 | 100 | % | $ | 613 | 100 | % | ||||||||
Eliminations for revenues and gross margin are primarily related to intercompany sales of emissions allowances, intercompany revenues, cost of fuel and interest on intercompany notes receivable and notes payable. Eliminations for operating income also include a $183 million impairment loss related to goodwill recorded at the Mirant Mid-Atlantic registrant on its standalone balance sheet. The goodwill does not exist at Mirant Americas Generation’s and Mirant North America’s consolidated balance sheets. As such, the goodwill impairment loss and related goodwill balance are eliminated upon consolidation at Mirant North America. For selected financial information about our business segments, see Note 10 to the consolidated financial statements contained elsewhere in this report. See Item 2. “Properties” for a complete list of our generating facilities.
Asset Management
Our commercial operations consist primarily of procuring fuel, dispatching electricity, hedging the production and sale of electricity by our generating facilities, managing fuel and providing logistical support for the operation of our facilities (for example, by procuring transportation for coal). We typically sell the electricity we produce into the wholesale market at prices in effect at the time we produce it (the “spot price”). Spot prices for electricity are volatile, as are prices for fuel and emissions allowances, and in order to reduce the risk of that volatility and achieve more predictable financial results, it is our strategy to enter into hedges—forward sales of electricity and forward purchases of fuel and emissions allowances to permit us to produce and sell the electricity—for various time periods. In addition, given the high correlation between natural gas prices and electricity prices in the markets in which we operate, we enter into forward sales of natural gas to hedge our exposure to changes in the price of electricity. We procure our hedges in OTC transactions or on exchanges where electricity, fuel and emissions allowances are broadly traded, or through specific transactions with buyers and sellers, using futures, forwards, swaps and options. We also sell capacity and ancillary services where there are markets for such products and when it is economic to do so.
We use dispatch models to assist us in making daily bidding decisions regarding the quantity and price of the power that we offer to generate from our facilities and sell into the markets. We bid the energy from our generating facilities into the day-ahead energy market and sell ancillary services through the ISO and RTO markets. We sell capacity either bilaterally or through auction processes in each ISO and RTO in which we participate. We work with the ISOs and RTOs in real time to ensure that our generating facilities are dispatched economically to meet the reliability needs of the market.
11
Table of Contents
At February 9, 2010, our aggregate hedge levels based on expected generation for each period were as follows:
Mirant Americas Generation and Mirant North America
| Aggregate Hedge Levels Based on Expected Generation | |||||||||||||||
| 2010 | 2011 | 2012 | 2013 | 2014 | |||||||||||
| Power |
92 | % | 58 | % | 57 | % | 34 | % | 29 | % | |||||
| Fuel |
72 | % | 65 | % | 34 | % | 9 | % | — | % | |||||
Mirant Mid-Atlantic
| Aggregate Hedge Levels Based on Expected Generation | |||||||||||||||
| 2010 | 2011 | 2012 | 2013 | 2014 | |||||||||||
| Power |
93 | % | 59 | % | 62 | % | 38 | % | 32 | % | |||||
| Fuel |
72 | % | 67 | % | 37 | % | 10 | % | — | % | |||||
Legislation has been proposed in Congress to increase the regulation of transactions involving OTC derivatives. The proposed legislation provides that standardized swap transactions between dealers and large market participants would have to be cleared and must be traded on an exchange or electronic platform. Although the proposed legislation provides exclusions from the clearing and certain other requirements for market participants, such as Mirant Americas Generation, Mirant North America and Mirant Mid-Atlantic, which utilize OTC derivatives to hedge commercial risks, such exclusions are the focus of debate and may not ultimately be part of any final legislation. Greater regulation of OTC derivatives could materially affect our ability to hedge economically our generation by reducing liquidity in the energy and commodity markets and, if we are required to clear such transactions on exchanges, by significantly increasing the collateral costs associated with such activities.
Power
We hedge economically a substantial portion of our Mid-Atlantic coal-fired baseload generation and certain of Mirant Americas Generation’s and Mirant North America’s Northeast gas and oil-fired generation through OTC transactions. However, we generally do not hedge our intermediate and peaking units for tenors greater than 12 months. A significant portion of our hedges are financial swap transactions between Mirant Mid-Atlantic and financial counterparties that are senior unsecured obligations of such parties and do not require either party to post cash collateral either for initial margin or for securing exposure as a result of changes in power or natural gas prices. We also enter into forward sales of natural gas to hedge our exposure to changes in the price of electricity.
Although OTC transactions make up a substantial portion of our economic hedge portfolio, at times we sell non-standard, structured products to customers.
All of Mirant Americas Generation’s and Mirant North America’s California generating facilities operate either under contracts for their capacity or RMR contracts.
Fuel
We enter into contracts of varying terms to secure appropriate quantities of fuel that meet the varying specifications of our generating facilities. For our coal-fired generating facilities, we purchase most of our coal from a small number of strategic suppliers under contracts with terms of varying lengths, some of which extend to 2013. For our oil-fired units, we typically purchase fuel from a small number of suppliers under contracts with terms of varying lengths.
12
Table of Contents
Our coal supply comes primarily from the Central Appalachian and Northern Appalachian coal regions. Most of our coal is delivered by rail, except for a portion of our coal deliveries at our Morgantown station which is received by barge at our unloading facility that became operational in the third quarter of 2008 and enables us to receive coal from international locations. In addition, we are constructing a coal blending facility at our Morgantown station that will allow for greater flexibility of our coal supply. We monitor coal supply and delivery logistics carefully and, despite occasional interruptions of scheduled deliveries, to date we have managed to avoid any significant detrimental effects on our operations. Because of the risk of disruptions in our coal supply, we typically maintain a target level of coal inventory at our coal-fired facilities. Interruptions of scheduled deliveries can result from a variety of disruptions, including coal supplier operational issues, rail system disruptions or severe weather.
Emissions
Our commercial operations manage the acquisition and use of emissions allowances for our generating facilities. Primarily as a result of the pollution control equipment we installed to comply with the requirements of the Maryland Healthy Air Act, we have significant excess SO2 and NOx emissions allowances. We will continue to maintain some SO2 and NOx emissions allowances in excess of what we need to support our expected generation in case our actual generation exceeds our current forecasts for future periods and for possible future additions of generating capacity. During the fourth quarter of 2007, we began a program to sell excess SO2 and NOx emissions allowances under certain market conditions. At December 31, 2009, the estimated fair value of Mirant Americas Generation’s and Mirant North America’s excess SO2 and NOx emissions allowances was approximately $29 million. At December 31, 2009, the estimated fair value of Mirant Mid-Atlantic’s excess SO2 and NOx emissions allowances was approximately $16 million.
In September 2008, Mirant Americas Generation’s and Mirant North America’s subsidiary and Mirant Mid-Atlantic’s affiliate, Mirant Energy Trading, joined the CCX, which is a voluntary greenhouse gas registry, reduction and trading system. As part of the agreement for membership in CCX, Mirant and its subsidiaries have committed to meet annual emissions reduction targets and, by the end of 2010, to reduce greenhouse gas emissions by 6% below the average of 1998 to 2001 levels. Mirant Americas Generation and Mirant North America expect to satisfy the reduction targets primarily through previously implemented generating unit retirements and capacity factor reductions. Mirant Mid-Atlantic was allocated a portion of the total allowances granted to Mirant Energy Trading.
Our generating facilities in Maryland and Mirant Americas Generation’s and Mirant North America’s generating facilities in Massachusetts and New York are subject to the RGGI, a multi-state cap-and-trade program to reduce CO2 emissions from units of 25 MW or greater that became effective on January 1, 2009. To comply, we are required to purchase allowances, either through periodic auctions or open market transactions, to offset our CO2 emissions. In 2009, Mirant Americas Generation and Mirant North America recognized approximately $45 million in cost of fuel, electricity and other products as a result of their compliance with the RGGI and Mirant Mid-Atlantic recognized approximately $41 million in cost of fuel, electricity and other products as a result of its compliance with the RGGI.
Mid-Atlantic Region
We own or lease four generating facilities in the Mid-Atlantic region with total net generating capacity of 5,194 MW. Our Mid-Atlantic region had a combined 2009 Net Capacity Factor of 30%. The decrease in net generating capacity from our previous total of 5,230 MW is primarily related to an increase in station service power necessary to operate the scrubbers that were installed in the fourth quarter of 2009.
13
Table of Contents
The following table presents the details of our Mid-Atlantic generating facilities:
| Facility |
Total Net Generating Capacity (MW) |
Primary Fuel Type |
Dispatch Type | Location | NERC Region | |||||
| Chalk Point |
2,401 | Natural Gas/Coal/Oil | Intermediate/ Baseload/Peaking |
Maryland | RFC | |||||
| Dickerson |
844 | Natural Gas/Coal/Oil | Baseload/Peaking | Maryland | RFC | |||||
| Morgantown |
1,467 | Coal/Oil | Baseload/Peaking | Maryland | RFC | |||||
| Potomac River |
482 | Coal | Baseload/Intermediate | Virginia | RFC | |||||
| Total Mid-Atlantic |
5,194 | |||||||||
Chalk Point is our largest generating facility. It consists of two coal-fired baseload units, two dual-fueled (oil and gas) intermediate units and two oil-fired and five dual-fueled (oil and gas) peaking units. Our next largest generating facility is Morgantown. It consists of two coal-fired baseload units and six oil-fired peaking units. The Dickerson generating facility has three coal-fired baseload units, and one oil-fired and two dual-fueled (oil and gas) peaking units. The Potomac River generating facility has three coal-fired baseload units and two coal-fired intermediate units. The capacity, energy and ancillary services from our Mid-Atlantic generating facilities are sold into the bilateral markets and into the markets administered by PJM. For a discussion of PJM, see “Regulatory Environment” below.
We produce byproducts from our coal-fired generating units, including ash and gypsum. We actively manage the current and planned disposition of each of these byproducts. All of our ash management facilities are dry landfills. Our disposal plan for ash includes having adequate capacity at our existing ash management facilities in Maryland, purchasing and permitting additional disposal sites, using third parties to handle and dispose of the ash and constructing an ash beneficiation facility to make the ash more suitable for sale to third parties for the production of concrete. Our disposal plan for gypsum includes selling it to third parties for use in the production of drywall.
Northeast Region (Mirant Americas Generation and Mirant North America)
We own four generating facilities in the Northeast region with total net generating capacity of 2,535 MW. Our Northeast region had a combined 2009 Net Capacity Factor of 10%. The Northeast region is comprised of our generating facilities located in Massachusetts and New York.
The following table presents the details of our generating facilities in the Northeast Region:
| Facility |
Total Net Generating Capacity (MW) |
Primary Fuel Type |
Dispatch Type | Location | NERC Region | |||||
| Bowline |
1,139 | Natural Gas/Oil | Intermediate/ Peaking |
New York | NPCC | |||||
| Canal |
1,126 | Natural Gas/Oil | Intermediate | Massachusetts | NPCC | |||||
| Kendall |
256 | Natural Gas/Oil | Baseload/Peaking | Massachusetts | NPCC | |||||
| Martha’s Vineyard |
14 | Diesel | Peaking | Massachusetts | NPCC | |||||
| Total Northeast Region |
2,535 | |||||||||
14
Table of Contents
The Bowline generating facility is a dual-fueled (natural gas and oil) facility comprised of two intermediate/peaking units. The capacity, energy and ancillary services from our Bowline generating facility are sold into the bilateral markets and into the markets administered by the NYISO. For a discussion of the NYISO, see “Regulatory Environment” below.
During the second quarter of 2009, the NYISO issued its annual peak load and energy forecast in its Load and Capacity Data report (the “Gold Book”). The Gold Book reports projected electricity supply and demand for the New York control area for the next ten years. The Gold Book reflected a significant decrease in future electricity demand as a result of current economic conditions and the expected future effects of demand-side management programs in New York. The reduction in future demand as a result of demand-side management programs is being driven primarily by an energy efficiency program being instituted within the State of New York that will seek to achieve a 15% reduction from 2007 energy volumes by 2015. The decrease in the projected future demand resulted in a significant decrease in our forecast of the capacity revenue our 1,139 MW Bowline generating facility will earn in future periods.
In addition to the change in forecasted capacity revenue, Mirant Bowline also received its property tax assessment during the second quarter of 2009. The assessment significantly exceeds the estimated fair value of the generating facility. We have initiated legal proceedings to challenge the assessment.
In the second quarter of 2009, we evaluated the Bowline generating facility for impairment based on our five-year forecast at the time of the impairment review, which indicated that Mirant Bowline was projected to operate at a net loss for the next several years because of the excessive level of taxation combined with the forecasted decrease in capacity revenues. The sum of the probability weighted undiscounted cash flows for the Bowline generating facility exceeded the carrying value. As a result, we did not record an impairment loss for the Bowline generating facility for the year ended December 31, 2009. See Note 3 to our consolidated financial statements contained elsewhere in this report for further information related to our impairment analysis of the Bowline generating facility.
The Canal generating facility consists of one oil-fired intermediate unit and one dual-fueled (oil and gas) intermediate unit. The Kendall generating facility consists of one combined cycle dual-fueled (oil and gas) baseload unit, two 1,300 pound steam boilers and one simple cycle oil peaking unit. The Martha’s Vineyard generating facility consists of five diesel peaking units. The capacity, energy and ancillary services from our Massachusetts generating units are sold into the NEPOOL bilateral markets and into the markets administered by the ISO-NE. For a discussion of the NEPOOL and the ISO-NE, see “Regulatory Environment” below. The Kendall generating facility, which is a co-generation facility, also has long-term agreements under which it sells steam.
The Canal generating facility is located in the lower Southeastern Massachusetts (“SEMA”) load zone in the ISO-NE control area. ISO-NE previously has determined that, at times, it is necessary for the Canal generating facility to operate to meet local reliability criteria for SEMA when it is not economic for the Canal generating facility to operate based upon prevailing market prices. When the Canal generating facility operates to meet local reliability criteria, we are compensated at the price we bid into the ISO-NE, pursuant to ISO-NE market rules, rather than at the lower market price.
During 2009, NSTAR Electric Company completed planned upgrades to the SEMA transmission system. These upgrades have reduced the need for the Canal generating facility to operate and caused a reduction in energy gross margin compared to historical levels. The final phase of these transmission upgrades was completed in the third quarter of 2009 and as a result, the capacity factor for the Canal generating facility dropped as compared to 2008. With the completion of the transmission upgrades and because of the Canal generating facility’s high fuel costs relative to other generation in the northeast market, we expect that the future revenues of the Canal generating facility will be principally capacity revenue from the ISO-NE forward capacity market.
15
Table of Contents
Pursuant to a consent decree, we discontinued operation of units 4 and 5 at our Lovett generating facility in May 2007 and April 2008, respectively. In addition, we discontinued operation of unit 3 at the Lovett generating facility in May 2007 because it was uneconomic to operate the unit. We completed the demolition of the Lovett generating facility in 2009.
California (Mirant Americas Generation and Mirant North America)
We own three generating facilities in California with total net generating capacity of 2,347 MW. Our California generating facilities had a combined 2009 Net Capacity Factor of 5%. The following table presents the details of our California generating facilities:
| Facility |
Total Net Generating Capacity (MW) |
Primary Fuel Type | Dispatch Type | Location | NERC Region | |||||
| Contra Costa |
674 | Natural Gas | Intermediate | California | WECC | |||||
| Pittsburg |
1,311 | Natural Gas | Intermediate | California | WECC | |||||
| Potrero |
362 | Natural Gas/Diesel | Intermediate/ Peaking | California | WECC | |||||
| Total California |
2,347 | |||||||||
The Contra Costa and Pittsburg generating facilities are located in Contra Costa County and the Potrero generating facility is located in the City of San Francisco. The Contra Costa generating facility consists of two gas-fired intermediate units and the Pittsburg generating facility consists of three gas-fired intermediate units. The Potrero generating facility consists of one gas-fired intermediate unit and three diesel peaking units. The capacity, energy and ancillary services from our California generating facilities are sold into the bilateral markets and into the markets administered by the CAISO. For a discussion of the CAISO, see “Regulatory Environment” below.
On July 28, 2006, we signed two tolling agreements with PG&E to provide electricity from all our natural gas-fired units in service at Contra Costa and Pittsburg. The agreements are for 100% of the capacity from these units. One tolling agreement was for 2007 and the other tolling agreement was multi-year commencing January 1, 2008. The multi-year tolling agreement has varying tenors for each unit covering from two to four years, and includes capacity of 1,985 MW for 2009, 1,303 MW for 2010 and 674 MW for 2011. In 2009, PG&E exercised an option in the multi-year tolling agreement to increase the amount of capacity under contract for 2010 from 1,303 MW to 1,985 MW. We receive monthly capacity payments with bonuses and/or penalties based on guaranteed heat rate and availability tolerances.
On September 2, 2009, Mirant Delta entered into a new agreement with PG&E for the 674 MW at Contra Costa units 6 and 7 for the period from November 2011 through April 2013. At the end of the agreement, and subject to any necessary regulatory approval, Mirant Delta has agreed to retire Contra Costa units 6 and 7, which began operations in 1964, in furtherance of state and federal policies to retire aging power plants that utilize once-through cooling technology. The new Mirant Delta agreement is subject to approval by the CPUC.
In the third quarter of 2009, Mirant Potrero executed a settlement agreement with the City of San Francisco in which it agreed to shut down the Potrero generating facility when it is no longer needed for reliability, as determined by the CAISO. That settlement agreement became effective in November 2009, following its approval by the City’s Board of Supervisors and Mayor. Mirant Potrero agreed in the settlement agreement to submit to the CAISO a notice of intent to shut down the facility as of December 31, 2010. The shutdown of the facility is affected by the expected timing of certain projects to ensure reliability of electricity
16
Table of Contents
supply for the City of San Francisco. One such project is the TransBay Cable, an underwater electric transmission cable in the San Francisco Bay that is expected to decrease the need for generating resources in the City of San Francisco, and that we expect to become operational by mid-2010 and thereby reduce the need for our Potrero unit 3 for reliability. By a letter dated January 12, 2010, the CAISO advised the City of San Francisco that the expected replacement in 2010 of two underground transmission cables, if completed successfully, would allow the CAISO not to require the continued operation of the remaining units of the Potrero generating facility, units 4, 5 and 6, for reliability purposes after 2010. The CAISO will not determine which units of the Potrero generating facility are required to operate in 2011 for reliability purposes until the fall of 2010, but Mirant Potrero expects that none of the units of the Potrero generating facility will be required to operate for reliability purposes after 2010 and that all of the units will close by the end of 2010. See Note 3 to our consolidated financial statements contained elsewhere in this report for further information related to our impairment analysis of the Potrero generating facility.
Our existing generating facilities in California depend almost entirely on payments they receive to operate in support of system reliability. The energy, capacity and ancillary services markets, as currently constituted will not support the capital expenditures necessary to repower or reconstruct our facilities to make them commercially viable in a merchant market. In order to obtain the necessary capital support for repowering or reconstructing our facilities, we will need to obtain a contract with a creditworthy buyer. Absent that, our existing generating facilities in California will be commercially viable only as long as they are necessary for reliability.
Other Operations (Mirant Americas Generation and Mirant North America)
In addition to selling the capacity and electricity we produce and buying the fuel and emissions allowances we need to produce electricity (“asset management”), we buy and sell some electricity, fuel and emissions allowances, sometimes through financial derivatives, as part of our proprietary trading and fuel oil management activities.
We engage in proprietary trading to gain information about the markets in which we operate to support our asset management and to take advantage of selected opportunities that we identify. We enter into fuel oil management activities to hedge economically the fair value of our physical fuel oil inventories and to optimize the approximately three million barrels of storage capacity that we own or lease.
Proprietary trading and fuel oil management activities together typically comprise less than 10% of our realized gross margin. All of our commercial activities are governed by a comprehensive risk management policy, which includes limits on the size of volumetric positions and VaR for our proprietary trading and fuel oil management activities. For 2009, our combined average daily VaR for these activities was approximately $2 million.
Competitive Environment
The power generating industry is capital intensive and highly competitive. Our competitors include regulated utilities, merchant energy companies, financial institutions and other companies. For a discussion of competitive factors see Item 1A. “Risk Factors.” Coal-fired generation, natural gas-fired generation and nuclear generation currently account for approximately 45%, 24% and 20%, respectively, of the electricity produced in the United States. Hydroelectric and other energy sources account for the remaining 11% of electricity produced.
Wholesale power generation is highly fragmented relative to other commodity industries. There is a wide variation in terms of the capabilities, resources, nature and identity of the companies we compete with depending on the market. Our competitive advantages include the following:
| — | Reliability of our future cash flows. We hedge economically a substantial portion of our Mid-Atlantic coal-fired baseload generation and certain of our Mid-Atlantic and Mirant Americas Generation’s and |
17
Table of Contents
| Mirant North America’s Northeast gas and oil-fired generation through OTC transactions. We hedge our output at varying levels several years in advance because the price of electricity is volatile. In addition, we enter into contracts to hedge our future needs of coal, which is our primary fuel. |
| — | Location advantages. Most of Mirant Americas Generation’s and Mirant North America’s generating facilities are located in or near metropolitan areas, including Boston, New York City, San Francisco and Washington D.C. The generating facilities located near Washington, D.C. are owned or leased by Mirant Mid-Atlantic. The supply-demand balance in these markets is becoming constrained and increasingly dependent on power imported from other regions to sustain reliability. Although transmission projects are planned in these markets to bring capacity from neighboring regions, the timing of these projects is subject to delays and uncertainty. |
| — | Room to expand at our existing sites. We have sufficient room at our existing sites to add an additional 4,000 MW to 5,000 MW of generating capacity in the Mid-Atlantic. Mirant Americas Generation and Mirant North America have sufficient room at their existing sites for an additional 1,000 MW to 1,500 MW of generating capacity in the Northeast and an additional 2,500 MW to 3,500 MW of generating capacity in California. We continue to consider these and other investment opportunities. |
The economic downturn and programs to reduce the demand for electricity have resulted in a decrease in the rate at which the long-term demand for electricity is forecasted to grow.
Given the substantial time necessary to permit and construct new power plants, the process to add generating capacity must begin years in advance of anticipated growth in demand. A number of ISOs and RTOs, including those in markets in which we operate, have implemented capacity markets as a way to encourage construction of additional generation, but it is not clear whether and when independent power producers will be sufficiently incented to build this required new generation. The costs to construct new generating facilities have been rising, and there is substantial environmental opposition to building either coal-fired or nuclear plants.
In some markets, regulators have provided long-term contracts for new generation that are not otherwise available to existing units. As a result of initiatives and incentives at both the federal and state level, significant new construction of renewable resources, including solar and wind, has occurred or is planned.
There are several proposed upgrades to the transmission systems in the markets in which we operate that could mitigate the need for existing marginal generating capacity and for additional generating capacity. To the extent that these upgrades are completed, prices for electricity and capacity could be lower than they might otherwise be.
The prices for power, coal and natural gas declined significantly during 2009 to average levels lower than during 2008. The energy gross margin from our baseload coal units was negatively affected by these price declines. The decrease in the price of natural gas contributed to a decrease in power prices, because natural gas-fired generation often sets prices in the markets in which we operate, and at times made it uneconomic for certain of our baseload coal-fired units to generate. However, we are generally economically neutral for that portion of the generation volumes that we have hedged because our realized gross margin will reflect the contractual prices of our power and fuel contracts. We continue to add hedges opportunistically, including to maintain a projected level of cash flows from operations for future periods that supports continued compliance with the covenants in Mirant North America’s debt and Mirant Mid-Atlantic’s lease agreements.
Climate change concerns have led to significant legislative and regulatory efforts at the state and federal level. The costs of compliance with such efforts could affect our ability to compete in the markets in which we operate, especially with our coal-fired generating facilities. See “Environmental Regulation” later in the section for further discussion.
18
Table of Contents
Regulatory Environment
The electricity industry is regulated extensively at the federal, state and local levels. At the federal level, the FERC has exclusive jurisdiction under the Federal Power Act over sales of electricity at wholesale and the transmission of electricity in interstate commerce. Each of our subsidiaries that owns a generating facility selling at wholesale or that markets electricity at wholesale is a “public utility” subject to the FERC’s jurisdiction under the Federal Power Act. These subsidiaries must comply with certain FERC reporting requirements and FERC-approved market rules and they are subject to FERC oversight of mergers and acquisitions, the disposition of facilities under the FERC’s jurisdiction and the issuance of securities.
The FERC has authorized our subsidiaries that are public utilities under the Federal Power Act to sell wholesale energy, capacity and certain ancillary services at market-based rates. The majority of the output of the generating facilities owned by our subsidiaries is sold pursuant to this market-based rate authorization, although certain of Mirant Americas Generation’s and Mirant North America’s facilities sell their output under cost-based RMR agreements for which separate rate authorization was granted by the FERC, as explained below. The FERC could revoke or limit our market-based rate authority if it determined that we possess insufficiently mitigated market power in a regional electricity market. Under the Natural Gas Act, Mirant Americas Generation’s and Mirant North America’s subsidiary, Mirant Energy Trading, that sells natural gas for resale is deemed by the FERC to have blanket certificate authority to undertake these sales at market-based rates.
The FERC requires that our public utility subsidiaries with market-based rate authority and our subsidiary with blanket certificate authority adhere to general rules against market manipulation as well as certain market behavior rules and codes of conduct. If any of our subsidiaries were found to have engaged in market manipulation, the FERC has the authority to impose a civil penalty of up to $1 million per day per violation. In addition to the civil penalties, if any of our subsidiaries were to engage in market manipulation or violate the market behavior rules or codes of conduct, the FERC could require a disgorgement of profits or revoke the subsidiary’s market-based rate authority or blanket certificate authority. If the FERC were to revoke market-based rate authority, our affected public utility subsidiary would have to file a cost-based rate schedule for all or some of its sales of electricity at wholesale.
In 2006, the FERC certified the NERC as the National Energy Reliability Organization. The NERC is now responsible for the development and enforcement of mandatory reliability standards for the electric power system. Each of our entities selling electricity at wholesale is responsible for complying with the reliability standards in the region in which it operates. The NERC has the ability to assess financial penalties for non-compliance with the reliability standards. In addition to complying with the NERC standards, each of our entities selling electricity at wholesale must comply with the reliability standards of the regional reliability council for the NERC region in which its sales occur.
Our facilities operate in markets administered by ISOs and RTOs. In areas where ISOs or RTOs control the regional transmission systems, market participants have access to broader geographic markets than in regions without ISOs and RTOs. ISOs and RTOs operate day-ahead and real-time energy and ancillary services markets, typically governed by FERC-approved tariffs and market rules. Some ISOs and RTOs also operate capacity markets. Changes to the applicable tariffs and market rules may be requested by the ISO or RTO, or by other interested persons, including market participants and state regulatory agencies, and such proposed changes, if approved by the FERC, could have a significant effect on our operations and financial results. Although participation in ISOs and RTOs by public utilities that own transmission has been, and is expected to continue to be, voluntary, the majority of such public utilities in Massachusetts, New York, Maryland, Virginia and California have joined the applicable ISO and RTO.
19
Table of Contents
Our subsidiaries owning generating facilities have made such filings, and received such orders, as are necessary to obtain exempt wholesale generator status under the PUHCA and the FERC’s regulations thereunder. Provided all of our subsidiaries owning generating facilities continue to be exempt wholesale generators, or are qualifying facilities under the Public Utility Regulatory Policies Act of 1978, we and our intermediate holding companies owning direct or indirect interests in those subsidiaries will remain exempt from the accounting, record retention or reporting requirements that PUHCA imposes on “holding companies.”
State and local regulatory authorities historically have overseen the distribution and sale of electricity at retail to the ultimate end user, as well as the siting, permitting and construction of generating and transmission facilities. Our existing generating facilities are subject to a variety of state and local regulations, including regulations regarding the environment, health and safety and maintenance and expansion of the facilities.
We hedge economically a substantial portion of our Mid-Atlantic coal-fired baseload generation and certain of our Mid-Atlantic and Mirant Americas Generation’s and Mirant North America’s Northeast gas and oil-fired generation through OTC transactions. A significant portion of such hedges are financial swap transactions between Mirant Mid-Atlantic and financial counterparties that are senior unsecured obligations of such parties and do not require either party to post cash collateral either for initial margin or for securing exposure as a result of changes in power or natural gas prices. Legislation has been proposed in Congress to increase the regulation of transactions involving OTC derivatives. The proposed legislation provides that standardized swap transactions between dealers and large market participants would have to be cleared and must be traded on an exchange or electronic platform. Although the proposed legislation provides exclusions from the clearing and certain other requirements for market participants, such as Mirant Americas Generation, Mirant North America and Mirant Mid-Atlantic, which utilize OTC derivatives to hedge commercial risks, such exclusions are the focus of debate and may not ultimately be part of any final legislation. Greater regulation of OTC derivatives could materially affect our ability to hedge economically our generation by reducing liquidity in the energy and commodity markets and, if we are required to clear such transactions on exchanges, by significantly increasing the collateral costs associated with such activities.
In addition to the proposed legislation, the Commodity Futures Trading Commission (“CFTC”) has proposed designation of certain electricity contracts as significant price discovery contracts (“SPDCs”), including contracts that we trade on the Intercontinental Exchange based on CAISO and PJM West Hub locational marginal pricing. SPDC designation would subject these contracts to new more stringent requirements and could set a precedent for other contracts.
In January 2010, the CFTC issued a notice of proposed rulemaking in which it proposed to adopt all-months-combined, single (non-spot) month and spot-month position limits for exchange-listed natural gas, crude oil, heating oil and gasoline futures and options contracts. We continue to monitor the rulemaking proceeding, but do not think that the limits as proposed would have a material effect on our business.
Mid-Atlantic Region. Our Mid-Atlantic generating facilities sell electricity into the markets operated by PJM. We have access to the PJM transmission system pursuant to PJM’s Open Access Transmission Tariff. PJM operates the PJM Interchange Energy Market, which is the region’s spot market for wholesale electricity, provides ancillary services for its transmission customers, performs transmission planning for the region and economically dispatches generating facilities. PJM administers day-ahead and real-time single clearing price markets and calculates electricity prices based on a locational marginal pricing model. A locational marginal pricing model determines a price for energy at each node in a particular zone taking into account the limitations and losses on transmission of electricity into the zone, resulting in a higher zonal price when less expensive energy cannot be imported from another zone. Generation owners in PJM are subject to mitigation, which limits the prices that they may receive under certain specified conditions.
20
Table of Contents
Load-serving entities within PJM are required to have adequate sources of generating capacity. Our generating facilities located in the Mid-Atlantic region that sell electricity into the PJM market participate in the reliability pricing model (the “RPM”) forward capacity market. The PJM RPM capacity auctions are designed to provide forward prices for capacity that are intended to ensure that adequate resources are in place to meet the region’s demand requirements. PJM has conducted six PJM RPM capacity auctions and we began receiving payments in June 2007 as a result of the first auction. Certain market participants have challenged the results of the RPM auctions that set capacity payments under the RPM provisions of PJM’s tariff for the twelve month periods beginning June 1, 2008, June 1, 2009 and June 1, 2010. Although the FERC has rejected those challenges, the orders entered by the FERC have been appealed. See Complaint Challenging Capacity Rates Under the RPM Provisions of PJM’s Tariff, in Note 11 to our consolidated financial statements contained elsewhere in this report for a discussion of the challenges.
The results of the PJM RPM capacity auctions for the delivery area where our generating facilities are located were as follows:
| Auction Date |
Capacity Period |
Price per MW-day | |||
| April 2007 |
June 1, 2007 to May 31, 2008 | $ | 188.54 | ||
| July 2007 |
June 1, 2008 to May 31, 2009 | $ | 210.11 | ||
| October 2007 |
June 1, 2009 to May 31, 2010 | $ | 237.33 | ||
| January 2008 |
June 1, 2010 to May 31, 2011 | $ | 174.29 | ||
| May 2008 |
June 1, 2011 to May 31, 2012 | $ | 110.00 | ||
| May 2009 |
June 1, 2012 to May 31, 2013 | $ | 133.37 | ||
Since 2008, annual auctions have been conducted to procure capacity three years prior to each delivery period. The first annual auction took place in May 2008, for the provision of capacity from June 1, 2011 to May 31, 2012. PJM continues to revise elements of the RPM provisions of its tariff, both pursuant to those provisions and on its own volition or at the request of its stakeholders. These revisions must be filed with and approved by the FERC, and we, either individually or as part of a group, are actively involved at the FERC to protect our interests.
Northeast Region (Mirant Americas Generation and Mirant North America). Our Bowline generating facility participates in a market administered by the NYISO. The NYISO provides statewide transmission service under a single tariff and interfaces with neighboring market control areas. To account for transmission congestion and losses, the NYISO calculates energy prices using a locational marginal pricing model. The NYISO also administers a spot market for energy, as well as markets for installed capacity and services that are ancillary to transmission service. The NYISO’s locational capacity market utilizes a demand curve mechanism to determine monthly capacity prices to be paid to suppliers for three capacity zones: New York City, Long Island and Rest of State. Our facility is located in the Rest of State capacity zone.
Our Canal, Kendall and Martha’s Vineyard generating facilities participate in a market administered by ISO-NE. Mirant Energy Trading is a member of NEPOOL, which is a voluntary association of electric utilities and other market participants in Connecticut, Maine, Massachusetts, New Hampshire, Rhode Island and Vermont, and which functions as an advisory organization to ISO-NE. The FERC approved ISO-NE as the RTO for the New England region, making ISO-NE responsible for market rule filings at the FERC, in addition to its responsibilities for the operation of transmission systems and for the administration and settlement of the wholesale electric energy, capacity and ancillary services markets. ISO-NE utilizes a locational marginal pricing model similar to the model used in PJM and NYISO.
On March 6, 2006, a settlement proposal was filed with the FERC among ISO-NE and multiple market participants for a forward capacity market (the “FCM”) under which annual capacity auctions would be
21
Table of Contents
conducted for supply three years in advance of provision. The settlement provided for a four-year transition period during which capacity suppliers receive a set price for their capacity commencing on December 1, 2006, with price escalators through May 31, 2010. Beginning December 1, 2006, our generating facilities began receiving capacity revenues under the FCM transition period. During the FCM transition period we received or will receive capacity revenues between $3.05 per kW- month and $4.10 per kW-month.
The results of the ISO-NE FCM annual capacity auctions were as follows:
| Auction Date |
Capacity Period |
Price per kW-month | |||
| February 2008 |
June 1, 2010 to May 31, 2011 | $ | 4.25 | ||
| December 2008 |
June 1, 2011 to May 31, 2012 | $ | 3.12 | ||
| October 2009 |
June 1, 2012 to May 31, 2013 | $ | 2.54 | ||
In March 2008, the FERC’s orders approving and implementing the FCM were affirmed by the DC Circuit; however, the DC Circuit reversed a portion of the FERC’s orders regarding the rights of a non-settling party to challenge the FCM charges through future proceedings initiated at the FERC. On January 15, 2009, the FERC issued an order on remand, directing the settling parties to revise the applicable standard of review to be consistent with the DC Circuit’s decision. The FERC’s order on remand did not change the FCM structure or the capacity payments we received under the FCM.
California (Mirant Americas Generation and Mirant North America). Our California generating facilities are located inside the CAISO’s control area. On April 1, 2009, the CAISO implemented its Market Redesign and Technology Update (“MRTU”). MRTU’s key components include locational marginal pricing of energy similar to the RTO/ISO markets in the east, a day-ahead market in addition to the existing real-time market, a more effective congestion management system and an increase in the existing bid caps. The CAISO also schedules transmission transactions and arranges for necessary ancillary services. Most sales in California are pursuant to bilateral contracts, but a significant percentage of electrical energy is sold in the day-ahead and real-time market. The CAISO does not operate a capacity market.
The CPUC has begun a proceeding to develop, together with the CAISO, a wholesale capacity market. FERC approval would be required for any such capacity market to become effective. We cannot at this time predict the outcome of the CPUC proceeding or the timing for the implementation or the structure of any wholesale capacity market in California.
Mirant Potrero is party to a PPA with PG&E that from 2006 through 2012 allows PG&E to dispatch and purchase the output of our Potrero units that have been designated RMR units, which for 2009 and 2010 includes all of the Potrero units. RMR units are designated annually by the CAISO to meet local reliability needs on the CAISO’s system. Under the PPA, through 2008, PG&E paid us charges equivalent to the rates we charged during 2004 when the units were designated as RMR units reduced by $1.4 million for each year since 2004. For 2009 through 2012, the charges for the units that are then subject to the PPA will be determined annually by the FERC pursuant to the cost-based formula rates set forth in the RMR agreement. On December 4, 2008, the FERC issued an order approving the charges for the Potrero units for 2009 and 2010. The approved PPA charges for 2010 are expected to result in approximately the same level of gross margin for Mirant Potrero as it recognized for 2009. As discussed further in Note 3 to our consolidated financial statements contained elsewhere in this report, we plan to shut down the Potrero generating facility when it is no longer needed for reliability as determined by the CAISO, which is currently anticipated to be by the end of 2010.
Environmental Regulation
Our business is subject to extensive environmental regulation by federal, state and local authorities. We must comply with applicable laws and regulations, and obtain and comply with the terms of government issued
22
Table of Contents
permits. Our costs of complying with environmental laws, regulations and permits are substantial, including significant environmental capital expenditures. See Item 7. “Management’s Discussion and Analysis of Results of Operations and Financial Condition—Capital Expenditures and Capital Resources” for additional information.
We expect that available cash, proceeds from redemption of preferred shares in Mirant Americas and future cash flows from operations will be sufficient to fund these capital expenditures.
Air Emissions Regulations
The Clean Air Act and similar state laws impose significant environmental requirements on our generating facilities. The Clean Air Act mandates a broad range of requirements concerning air emissions, operating practices and pollution control equipment. Most of Mirant Americas Generation’s and Mirant North America’s facilities are located in or near metropolitan areas, including New York City, Boston, San Francisco and Washington D.C. The facilities located near Washington D.C. are owned or leased by Mirant Mid-Atlantic. These areas are classified by the EPA as not achieving certain NAAQS (“non-attainment areas”). As a result of the classification of each of these areas as a non-attainment area, our operations generally are subject to more stringent air pollution requirements than those applicable to plants located elsewhere. The states are generally free to impose requirements that are more stringent than those imposed by the federal government. In the future, we expect increased regulation at both the federal and state levels of our air emissions. We maintain a comprehensive compliance strategy to address these continuing and new requirements. Significant air regulatory programs to which we are subject are described below.
Clean Air Interstate Rule (CAIR). In 2005, the EPA promulgated the CAIR, which established in the eastern United States SO2 and NOx cap-and-trade programs applicable directly to states and indirectly to generating facilities. The NOx cap-and-trade program has two components, an annual program and an Ozone Season program. The CAIR SO2 cap-and-trade program builds off of the existing acid rain cap-and-trade program but requires generating facilities to surrender twice as many allowances in 2010 and approximately three times as many allowances in 2015. Maryland, New York and Virginia are subject to CAIR’s SO2 and both NOx trading programs. Massachusetts is subject only to CAIR’s Ozone Season NOx trading program. These cap-and-trade programs were to be implemented in two phases, with the first phase going into effect in 2009 for NOx and 2010 for SO2 and more stringent caps going into effect in 2015. Various parties challenged the EPA’s adoption of the CAIR, and on July 11, 2008, the DC Circuit in State of North Carolina v. Environmental Protection Agency issued an opinion that would have vacated the CAIR. Various parties filed requests for rehearing with the DC Circuit and on December 23, 2008, the DC Circuit issued a second opinion in which it granted rehearing only to the extent that it remanded the case to the EPA without vacating the CAIR. Accordingly, the CAIR will remain effective until it is replaced by a rule consistent with the DC Circuit’s opinions. The four states in which we operate that are subject to CAIR (i.e., Maryland, Massachusetts, New York and Virginia) have promulgated regulations implementing the federal CAIR.
Maryland Healthy Air Act. The Maryland Healthy Air Act was enacted in April 2006 and requires reductions in SO2, NOx and mercury emissions from large coal-fired power facilities. The state law also required Maryland to join the RGGI, which is discussed below. The Maryland Healthy Air Act and the regulations adopted by MDE to implement that act impose limits for (i) emissions of NOx in 2009 with further reductions in 2012 (including sublimits during the Ozone Season) and (ii) emissions of SO2 in 2010 with further reductions in 2013. The Maryland Healthy Air Act also imposes restrictions on emissions of mercury beginning in 2010 with further reductions in 2013. The Maryland Healthy Air Act prohibits power facilities from purchasing emissions allowances to comply.
We installed scrubbers at our Chalk Point, Dickerson and Morgantown coal-fired units. In addition, we installed selective catalytic reduction systems at the Morgantown coal-fired units and one of the Chalk Point
23
Table of Contents
coal-fired units and a selective auto catalytic reduction system at the other Chalk Point coal-fired unit. We also installed selective non-catalytic reduction systems at the three Dickerson coal-fired units. These controls are capable of reducing emissions of SO2, NOx and mercury by approximately 98%, 90% and 80%, respectively, for three of our largest coal-fired units. The control equipment we have installed will allow our Maryland generating facilities to comply with (a) all of the requirements of the Maryland Healthy Air Act and (b) the first phase of the CAIR without having to purchase emissions allowances.
In 2009, we had planned outages to complete the installation of the scrubbers. During those outages, we also performed significant maintenance activities. Including amounts already invested to date, we expect that our total capital expenditures to comply with the requirements for SO2, NOx and mercury emissions under the Maryland Healthy Air Act will be approximately $1.674 billion. On July 30, 2007, Mirant Mid-Atlantic and its subsidiary, Mirant Chalk Point, entered into an agreement with Stone & Webster, Inc. for engineering, procurement and construction services relating to the installation of the scrubbers described above. The expected cost under the agreement is approximately $1.13 billion and is a part of the $1.674 billion described above. As of December 31, 2009, we have invested approximately $1.405 billion of the $1.674 billion for capital expenditures related to the Maryland Healthy Air Act.
Mercury Regulations. In 2005, the EPA issued the CAMR, which would have limited total annual mercury emissions from coal-fired power plants across the United States through a two-phased cap-and-trade program. In February 2008, the DC Circuit vacated the CAMR and the EPA’s decision not to regulate emissions of mercury from coal- and oil-fired electric utility steam generating units under section 112 of the Clean Air Act, which regulates Hazardous Air Pollutants (“HAPs”). The EPA and a group representing electricity generators sought review of the DC Circuit’s decision by the United States Supreme Court. In February 2009, the EPA filed to withdraw its petition for review, stating that it intends to promulgate alternative regulations to address mercury emissions under section 112 of the Clean Air Act, and the United States Supreme Court subsequently denied the petition for review. As a result of the DC Circuit decision, mercury emissions from coal- and oil-fired generating facilities are now subject to regulation under the section of the Clean Air Act which authorizes the EPA to develop standards for the installation of maximum achievable control technology (“MACT”) to reduce emissions of HAPs, including mercury. Although the EPA has announced that it will develop MACT standards for mercury and other HAPs, it has not yet promulgated such standards. In 2010, the EPA will be collecting emissions data, which will be used to develop such standards. Our Maryland coal-fired units already are subject to mercury limits under the Maryland Healthy Air Act, as described below. Many of our coal-fired units will emit less mercury as a result of the SO2 and NOx controls that have been installed.
NSR Enforcement Initiative. In 2001, the EPA requested information concerning some of our generating facilities in Maryland and Virginia covering a time period that pre-dates our acquisition or lease of those facilities in December 2000. We responded fully to this request. Under the APSA, Pepco is responsible for fines and penalties arising from any violation associated with operations prior to our subsidiaries’ acquisition or lease of the facilities. If a violation is determined to have occurred at any of the facilities, our subsidiary owning or leasing the facilities may be responsible for the cost of purchasing and installing emissions control equipment, the cost of which may be material. Our subsidiaries owning or leasing the Chalk Point, Dickerson and Morgantown generating facilities in Maryland have installed a variety of emissions control equipment at those facilities to comply with the Maryland Healthy Air Act, but that equipment may not include all of the pollution control equipment that could be required if a violation of the EPA’s NSR regulations is determined to have occurred at one or more of those facilities. If such a violation is determined to have occurred after our subsidiaries acquired or leased the facilities or, if occurring prior to the acquisition or lease, is determined to constitute a continuing violation, our subsidiary owning or leasing the facility at issue could also be subject to fines and penalties by the state or federal government for the period after its acquisition or lease of the facility, the cost of which may be material, although applicable bankruptcy law may bar such liability for periods prior to January 3, 2006, when the Plan became effective for us and our subsidiaries that own or lease these facilities.
24
Table of Contents
Virginia CAIR Implementation. In April 2006, Virginia enacted legislation that, among other things, granted the Virginia State Air Pollution Control Board the discretion to prohibit electric generating facilities located in a non-attainment area from purchasing SO2 and NOx allowances to achieve compliance under the EPA’s CAIR. In the fourth quarter of 2007, the Virginia State Air Pollution Control Board approved regulations that it interpreted as prohibiting the acquisition in any manner of SO2 and NOx allowances by facilities in non-attainment areas to satisfy the requirements of the CAIR as implemented by Virginia. Mirant Potomac River’s generating facility is located in a non-attainment area for ozone. Thus, this Virginia regulation effectively capped the Potomac River generating facility’s SO2 and NOx emissions at amounts equal to the allowances allocated to the facility, which constrained the facility’s operations. Mirant Potomac River challenged the legality of the regulations regarding the trading of NOx allowances in Virginia state court. On June 23, 2009, the Court of Appeals of Virginia issued an opinion concluding that the Virginia State Air Pollution Control Board exceeded its statutory authority in the Virginia regulation by prohibiting facilities in non-attainment areas from using allowances acquired by any form of transfer to satisfy the requirements of the CAIR, rather than limiting the prohibition to purchased allowances. The Virginia State Air Pollution Control Board petitioned the Virginia Supreme Court to review the decision by the Virginia Court of Appeals, and the Virginia Supreme Court denied that request on October 15, 2009. In January 2010, the Virginia DEQ informed Mirant Potomac River that in light of the decision of the Virginia Court of Appeals vacating Virginia’s rules restricting trading, the Virginia DEQ has determined that issuing a state operating permit to limit NOx emissions during the Ozone Season is warranted.
New York Consent Decree (Mirant Americas Generation and Mirant North America). In 2000, the State of New York issued an NOV to the previous owner of our Lovett generating facility alleging NSR violations associated with the operation of that facility prior to its acquisition by us. To resolve the issues raised by the State of New York, on June 11, 2003, Mirant New York, Mirant Lovett and the State of New York entered into a consent decree (the “2003 Consent Decree”). Under the 2003 Consent Decree, Mirant Lovett had three options: (1) install emissions controls on Lovett’s two coal-fired units (units 4 and 5); (2) shut down unit 4 and convert unit 5 to natural gas; or (3) shut down unit 4 in 2008 and unit 5 in 2007. We concluded that the installation of the required emissions controls was uneconomic. We also concluded that operating unit 5 on natural gas was uneconomic.
On May 10, 2007, Mirant Lovett entered into an amendment to the 2003 Consent Decree with the State of New York that switched the deadlines for shutting down units 4 and 5 so that the deadline for compliance by unit 5 was extended until April 30, 2008, and the deadline for unit 4 was shortened. We discontinued operation of unit 4 as of May 7, 2007. In addition, we discontinued operation of unit 3 because it was uneconomic to run the unit. We shut down unit 5 on April 19, 2008, and completed the demolition of the Lovett generating facility in 2009.
Regulation of Greenhouse Gases, including the RGGI. Concern over climate change has led to significant legislative and regulatory efforts at the state and federal level to limit greenhouse gas emissions. One such effort is the RGGI, a multi-state initiative in the Mid-Atlantic and Northeast outlining a cap-and-trade program to reduce CO2 emissions from electric generating units with capacity of 25 MW or greater. The RGGI program calls for signatory states, which include Maryland, Massachusetts and New York, to stabilize CO2 emissions to an established baseline from 2009 through 2014, followed by a 2.5% reduction each year from 2015 through 2018. Each of these three states has promulgated regulations implementing the RGGI. Complying with the RGGI could have a material adverse effect upon our operations and our operating costs, depending upon the availability and cost of emissions allowances and the extent to which such costs may be offset by higher market prices to recover increases in operating costs caused by the RGGI.
During 2009, Mirant Americas Generation and Mirant North America produced approximately 14.6 million tons of CO2 at their Maryland, Massachusetts and New York generating facilities for a total cost of
25
Table of Contents
$45 million under the RGGI, including 13.2 million tons of CO2 (for a total cost of $41 million) at Mirant Mid-Atlantic’s Maryland generating facilities. In 2010, Mirant Americas Generation and Mirant North America expect to produce approximately 16.5 million tons of CO2 at their Maryland, Massachusetts and New York generating facilities, including approximately 15.8 million tons at Mirant Mid-Atlantic’s Maryland generating facilities. The RGGI regulations require those facilities to obtain allowances to emit CO2 beginning in 2009. Annual allowances generally were not granted to existing sources of such emissions. Instead, allowances have been made available for such facilities by purchase through periodic auctions conducted quarterly or through subsequent purchase from a party that holds allowances sold through a quarterly auction process. The Maryland regulations implementing the RGGI, which were amended on May 8, 2009, also provide that if the allowance clearing price reaches or exceeds $7 per ton of CO2 in the auctions of allowances that occur during 2009 to 2011 for the current year’s allowances, Maryland will withhold the remainder of that year’s allowances from sale in any future auction during that calendar year and make those allowances available by direct sale to generators in Maryland. In this scenario, between 0 and 50% of Maryland’s allowances allocated for sale in that year may be made available for purchase by such generators. Any such allowances made available for each generator to purchase at $7 per ton will be in proportion to each generator’s annual average heat input during specified historical periods as compared to the total average input for all affected Maryland generators in existence at that time. In none of the auctions held to date has the price reached $7 per ton.
The sixth auction of allowances by the RGGI states was held on December 2, 2009. The clearing price for the approximately 29 million allowances sold in the auction allocated for use beginning in 2009 was $2.05 per ton. Allowances allocated for use beginning in 2012 were also made available, and approximately 1.6 million of the 2.2 million allowances available at the auction were sold at a price of $1.86 per ton. The allowances sold in this auction can be used for compliance in any of the RGGI states. Further auctions will occur quarterly through the end of the first compliance period in 2011, with the next auction scheduled for March 10, 2010.
In California, emissions of greenhouse gases are governed by California’s Global Warming Solutions Act (“AB 32”), which requires that statewide greenhouse gas emissions be reduced to 1990 levels by 2020. In December 2008, the California Air Resources Board (“CARB”) approved a Scoping Plan for implementing AB 32. The Scoping Plan requires that the CARB adopt a cap-and-trade regulation by January 2011 and that the cap and trade program begin in 2012. The CARB’s schedule for developing regulations to implement AB 32 is being coordinated with the schedule of the Western Climate Initiative (“WCI”) for development of a regional cap-and-trade program for greenhouse gas emissions. Through the WCI, California is working with other western states and Canadian provinces to coordinate and implement a regional cap-and-trade program. AB 32, and any plans, rules and programs approved to implement AB 32, could have a material adverse effect on how Mirant Americas Generation and Mirant North America operate their California generating facilities and the costs of operating the facilities.
In August 2008, Massachusetts adopted its Global Warming Solutions Act (the “Climate Protection Act”), which establishes a program to reduce greenhouse gas emissions significantly over the next 40 years. Under the Climate Protection Act, the Commonwealth of Massachusetts Department of Environmental Protection (“MADEP”) has established a reporting and verification system for statewide greenhouse gas emissions, including emissions from generating facilities producing all electricity consumed in Massachusetts, and determined the state’s greenhouse gas emissions level from 1990. The Massachusetts Executive Office of Energy and Environmental Affairs (“MAEEA”) is to establish statewide greenhouse gas emissions limits effective beginning in 2020 that will reduce such emissions from the 1990 levels by a range of 10% to 25% beginning in 2020, with the reduction increasing to 80% below 1990 levels by 2050. In setting these limits, the MAEEA is to consider the potential costs and benefits of various reduction measures, including emissions limits for electric generating facilities, and may consider the use of market-based compliance mechanisms. A violation of the emissions limits established under the Climate Protection Act may result in a civil penalty of up
26
Table of Contents
to $25,000 per day. Implementation of the Climate Protection Act could have a material adverse effect on how Mirant Americas Generation and Mirant North America operate their Massachusetts generating facilities and the costs of operating those facilities.
In April 2009, the Maryland General Assembly passed the Greenhouse Gas Reduction Act of 2009 (the “Maryland Act”), which became effective in October 2009. The Maryland Act requires a reduction in greenhouse gas emissions in Maryland by 25% from 2006 levels by 2020. However, this provision of the Maryland Act is only in effect through 2016 unless a subsequent statutory enactment extends its effective period. The Maryland Act requires the MDE to develop a proposed implementation plan to achieve these reductions by the end of 2011 and to adopt a final plan by the end of 2012.
In light of the United States Supreme Court ruling in Massachusetts v. EPA that greenhouse gases fit within the Clean Air Act’s definition of “air pollutant,” the EPA has proposed and promulgated regulations regarding the emission of greenhouse gases. In September 2009, the EPA (a) promulgated a rule that requires owners of facilities in many sectors of the economy, including power generation, to report annually to the EPA the quantity and source of greenhouse gas emissions released from those facilities and (b) proposed a rule to regulate greenhouse gases from vehicles beginning in model year 2012. In December 2009, under a portion of the Clean Air Act that regulates vehicles, the EPA determined that elevated concentrations of greenhouse gases in the atmosphere endanger the public’s health and welfare through their contribution to climate change (“Endangerment Finding”). Neither the Endangerment Finding nor the rule requiring reporting seeks to restrict the emission of CO2 from power plants. However, the EPA has stated that it intends to finalize the rule regulating greenhouse gases from vehicles in the spring of 2010, which the EPA views will cause greenhouse gases to become “regulated pollutants.” If so, additional requirements under the Clean Air Act may apply or may come to apply to stationary sources such as power plants. The effect of any such additional requirements is not clear at this time.
Various bills have been proposed in Congress to govern CO2 emissions from generating facilities. Current proposals include a cap-and-trade system that would require us to purchase allowances for some or all of the CO2 emitted by our generating facilities. Although we expect that market prices for electricity would increase following such legislation and would allow us to recover a portion of the cost of these allowances, we cannot predict with any certainty the actual increases in costs such legislation could impose upon us or our ability to recover such cost increases through higher market rates for electricity, and such legislation could have a material adverse effect on our consolidated statements of operations, financial position and cash flows. It is possible that Congress will take action to regulate greenhouse gas emissions within the next several years. The form and timing of any final legislation will be influenced by political and economic factors and is uncertain at this time. During 2009, Mirant Americas Generation and Mirant North America produced approximately 16.1 million tons of CO2 at their generating facilities, including approximately 14 million tons at Mirant Mid-Atlantic’s generating facilities. Mirant Americas Generation and Mirant North America expect to produce approximately 18.4 million total tons of CO2 at their generating facilities in 2010, including approximately 17.3 million total tons at Mirant Mid-Atlantic’s generating facilities in 2010.
Water Regulations
We are required under the Clean Water Act to comply with intake and discharge requirements, requirements for technological controls and operating practices. To discharge water, we generally need permits required by the Clean Water Act. Such permits typically are subject to review every five years. As with air quality regulations, federal and state water regulations are expected to impose additional and more stringent requirements or limitations in the future. This is particularly the case for regulatory requirements governing cooling water intake structures, which are subject to regulation under section 316(b) of the Clean Water Act (the “316 (b) regulations”). A 2007 decision by the United States Court of Appeals for the Second Circuit (the
27
Table of Contents
“Second Circuit”) in Riverkeeper Inc. et al v. EPA, in which the court remanded to the EPA for reconsideration numerous provisions of the EPA’s section 316(b) regulations for existing power plants, has created substantial uncertainty about exactly what technologies or other measures will be needed to satisfy section 316(b) requirements in the future and when any new requirements will be imposed. Following that ruling by the Second Circuit, the EPA in 2007 suspended its 316(b) regulations for existing power plants. Various parties sought review of the Second Circuit’s decision by the United States Supreme Court, and it granted those requests with respect to whether the EPA could permissibly weigh costs versus benefits in determining what requirements to impose. On April 1, 2009, the Supreme Court reversed the Second Circuit, ruling that the EPA had permissibly relied on cost-benefit analysis in setting standards for cooling water intake structures for existing power plants and authorizing site-specific variances. The Supreme Court’s ruling did not alter other aspects of the Second Circuit’s decision. Significant uncertainty remains regarding the effect of the Supreme Court’s decision on the EPA’s 316(b) regulations for existing power plants and what technologies or other measures will be needed to satisfy section 316(b) regulations.
Endangered Species Acts (Mirant Americas Generation and Mirant North America). Mirant Delta’s use of water from the Sacramento-San Joaquin Delta at its Contra Costa and Pittsburg generating facilities potentially affects certain fish species protected under the federal Endangered Species Act and the California Endangered Species Act. Mirant Delta therefore must maintain authorization under both statutes to engage in operations that could result in a take of (i.e., cause harm to) fish of the protected species. In January and February 2006, Mirant Delta received correspondence from the United States Fish and Wildlife Service and the Army Corps of Engineers expressing the view that the federal Endangered Species Act take authorization for the Contra Costa and Pittsburg generating facilities was no longer in effect as a result of changed circumstances. Mirant Delta disagreed with the agencies’ characterization of its take authorization as no longer being in effect. In late October 2007, Mirant Delta received correspondence from the United States Fish and Wildlife Service, the National Marine Fisheries Service and the Army Corps of Engineers clarifying that Mirant Delta continued to be authorized to take four species of fish protected under the federal Endangered Species Act. The agencies have initiated a process that will review the environmental effects of Mirant Delta’s water usage, including effects on the protected species of fish. That process could lead to changes in the manner in which Mirant Delta can use river water for the operation of the Contra Costa and Pittsburg generating facilities. As discussed further in Note 3 to our consolidated financial statements contained elsewhere in this report, we plan to shut down the Contra Costa generating facility in April 2013.
By letter dated September 27, 2007, the Coalition for a Sustainable Delta, four water districts, and an individual (the “Delta Noticing Parties”) provided notice to Mirant and Mirant Delta of their intent to file suit alleging that Mirant Delta has violated, and continues to violate, the federal Endangered Species Act through the operation of its Contra Costa and Pittsburg generating facilities. The Delta Noticing Parties contend that the facilities use of water drawn from the Sacramento-San Joaquin Delta for cooling purposes results in harm to four species of fish listed as endangered species. The Delta Noticing Parties assert that Mirant Delta’s authorizations to take (i.e., cause harm to) those species, a biological opinion and incidental take statement issued by the National Marine Fisheries Service on October 17, 2002, for three of the fish species and a biological opinion and incidental take statement issued by the United States Fish and Wildlife Service on November 4, 2002, for the fourth fish species, have been violated by Mirant Delta and no longer apply to permit the effects on the four fish species caused by the operation of the Contra Costa and Pittsburg generating facilities. As discussed further in Note 3 to our consolidated financial statements contained elsewhere in this report, we plan to shut down the Contra Costa generating facility in April 2013. Following receipt of these letters, in late October 2007, Mirant Delta received correspondence from the United States Fish and Wildlife Service, the National Marine Fisheries Service and the United States Army Corps of Engineers (the “Corps”) clarifying that Mirant Delta continued to be authorized to take the four species of fish protected under the federal Endangered Species Act. The agencies have initiated a process that will review the environmental effects of Mirant Delta’s water usage, including effects on the protected species of fish. That process could lead
28
Table of Contents
to changes in the manner in which Mirant Delta can use river water for the operation of the Contra Costa and Pittsburg generating facilities. In a subsequent letter, the Coalition for a Sustainable Delta also alleged violations of the National Environmental Policy Act and the California Endangered Species Act associated with the operation of Mirant Delta’s generating facilities. On May 14, 2009, the Coalition for a Sustainable Delta, Kern County Water Agency and an individual sent a new notice of intent to sue to the Corps alleging that the Corps had violated the federal Endangered Species Act by issuing permits related to the operation of Mirant Delta’s Contra Costa and Pittsburg generating facilities without ensuring that conservation measures would be implemented to minimize and mitigate the harm to the four endangered fish species and their habitat allegedly resulting from such operation. Mirant Delta disputes the allegations made by the Delta Noticing Parties and those made in the May 14, 2009 notice.
On February 11, 2010, Mirant Delta entered into a settlement agreement with the Delta Noticing Parties, the parties to the May 14, 2009 notice of intent to sue, and the Corps. The settlement agreement provides for the Delta Noticing Parties and the parties to the May 14, 2009 notice of intent to sue to withdraw the two notices of intent to sue and to release all claims described in those notices. The settlement agreement obligates Mirant Delta to seek approval from the Corps, the United States Fish and Wildlife Service, and the National Marine Fisheries Service to amend its plan currently in effect for monitoring entrainment and impingement of aquatic species caused by the operation of its generating facilities to increase monitoring during periods the facilities are operating. If that amendment or an alternative acceptable to all the parties has not been approved by August 11, 2010, then the withdrawal of the notices of intent to sue and the release of claims included in the settlement agreement become void. The settlement agreement requires the Corps to use its best efforts to conclude ongoing consultations with the United States Fish and Wildlife Service and the National Marine Fisheries Service regarding the environmental effects of Mirant Delta’s water usage in a timely manner and allows the Delta Noticing Parties and the parties to the May 14, 2009 notice of intent to sue to issue new notices of intent to sue if such consultations are not completed by October 31, 2011.
In November 2009, Mirant Delta signed a second amendment to a Memorandum of Agreement with the California Department of Fish and Game. The amendment requires Mirant Delta to prepare a planning and feasibility study for potential habitat restoration projects and extends by 16 months to March 1, 2011, the deadline for submitting an application for a new permit authorizing Mirant Delta to take the protected fish species affected by the operation of its facilities. The amendment extends Mirant Delta’s existing authorization for take of fish species protected under the California Endangered Species Act until the California Department of Fish and Game completes its consideration of the application for the new permit.
Potrero National Pollution Discharge Elimination System Permit (Mirant Americas Generation and Mirant North America). On June 8, 2006, Bayview-Hunters Point Community Advocates and Communities for a Better Environment filed a petition challenging the issuance of the National Pollution Discharge Elimination System (“NPDES”) permit for our Potrero generating facility. On February 8, 2007, Bayview-Hunters Point Community Advocates and Communities for a Better Environment filed another petition with a request to amend their initial petition. On March 21, 2007, the California State Water Resources Control Board notified the parties that petitioners requested that as of March 19, 2007, the two petitions be moved from active status to abeyance. Those petitions currently remain in abeyance. Additionally, on June 15, 2007, Bayview-Hunters Point Community Advocates and Communities for a Better Environment and San Francisco Baykeeper filed a third petition requesting that the NPDES permits for Potrero and Mirant Delta’s Pittsburg generating facility be reopened. The State Water Resources Control Board denied that petition on November 27, 2007. As discussed further in Note 3 to our consolidated financial statements contained elsewhere in this report, we plan to shut down the Potrero generating facility when it is no longer needed for reliability as determined by the CAISO, which is currently anticipated to be by the end of 2010.
29
Table of Contents
Kendall NPDES and Surface Water Discharge Permit (Mirant Americas Generation and Mirant North America). On September 26, 2006, the EPA issued to Mirant Kendall an NPDES renewal permit for the Kendall generating facility. The same permit was concurrently issued by the MADEP as a state Surface Water Discharge Permit (“SWD Permit”), and was accompanied by MADEP’s earlier issued water quality certificate under section 401 of the Clean Water Act. The new permits impose new temperature limits at various points in the Charles River, an extensive temperature, water quality and biological monitoring program and a requirement to develop and install a barrier net system to reduce fish impingement and entrainment. The provisions regulating the thermal discharge could cause substantial curtailments of the operations of the Kendall generating facility. Mirant Kendall has appealed the permits in three proceedings: (1) appeal of the NPDES permit to the EPA’s Environmental Appeals Board; (2) appeal of the SWD Permit to the MADEP; and (3) appeal of the water quality certification to the MADEP. The effect of the permits has been stayed pending the outcome of these appeals. The two appeals to the MADEP have been stayed pending the outcome of the appeal to the Environmental Appeals Board. On September 28, 2007, the Environmental Appeals Board stayed the appeal proceedings in order for the EPA to address the sections of the permit that are affected by the EPA’s suspension of the 316(b) regulations as a result of the 2007 decision by the Second Circuit in Riverkeeper, Inc. et al. v. EPA discussed above. Subsequent orders by the Environmental Appeals Board have extended that stay until June 3, 2010. On March 6, 2008, the EPA and the MADEP issued a draft permit modification to address the 316(b) provisions of the permit that would require modifications to the intake structure for the Kendall generating facility to add fine and coarse mesh barrier exclusion technologies and to install a mechanism to sweep organisms away from the intake structure through an induced water flow. On May 1, 2008, Mirant Kendall submitted comments on the draft permit modification objecting to the new requirements. On December 19, 2008, the EPA and the MADEP issued final permit modifications to address the 316(b) regulations. Those final permit modifications did not substantially modify the requirements proposed in the draft modifications, and on February 2, 2009 Mirant Kendall filed an appeal of those modifications. While the appeals are pending, the effect of any contested permit provisions is stayed and the Kendall generating facility will continue to operate under its current NPDES permit. We are unable to predict the outcome of these proceedings.
Canal NPDES and SWD Permit (Mirant Americas Generation and Mirant North America). On August 1, 2008, the EPA issued to Mirant Canal an NPDES renewal permit for the Canal generating facility. The same permit was concurrently issued by MADEP as a state SWD Permit, and was accompanied by MADEP’s earlier water quality certificate under section 401 of the Clean Water Act. The new permit imposes a requirement on Mirant Canal to install closed cycle cooling or an alternative technology that will reduce the entrainment of marine organisms by the Canal generating facility to levels equivalent to what would be achieved by closed cycle cooling. Mirant Canal appealed the NPDES permit to the EPA’s Environmental Appeals Board and appealed the surface water discharge and the water quality certificate to the MADEP. On December 4, 2008, the EPA requested a stay to the appeal proceedings and withdrew provisions related to the closed cycle cooling requirements. The EPA has re-noticed these provisions as draft conditions for additional public comment. Mirant Canal filed comments on January 29, 2009, stating that installing closed cycle cooling at the Canal generating facility was not justified and that without some cost-recovery mechanism the cost would make continued operation of the facility uneconomic. While the appeals of the renewal permit are pending, the effect of any contested permit provisions is stayed and the Canal generating facility will continue to operate under its current NPDES permit. We are unable to predict the outcome of this proceeding.
NPDES and State Pollutant Discharge Elimination System Permit Renewals. In addition to the proceedings described above in Kendall NPDES and Surface Water Discharge Permit and Canal NPDES and SWD Permit related to the renewal of the NPDES permit for the Kendall and Canal generating facilities, proceedings are currently pending for renewal of the NPDES permits for the three ash sites in Maryland owned by Mirant MD Ash Management, the Potomac River generating facility owned by Mirant Potomac River, the
30
Table of Contents
Contra Costa and Pittsburg generating facilities owned by Mirant Delta and the Potrero generating facility owned by Mirant Potrero. A proceeding is also pending for renewal of the State Pollutant Discharge Elimination System (“SPDES”) permit for the Bowline generating facility owned by Mirant Bowline.
In general, the EPA and the state agencies responsible for implementing the provisions of the Clean Water Act applicable to the intake of water and discharge of effluent by electric generating facilities have been making the requirements imposed upon such facilities more stringent over time. For example, with respect to the Potrero generating facility, the California Regional Water Quality Control Board has previously stated its intent not to renew the facility’s NPDES permit unless Mirant Potrero can demonstrate that the operation of the facility does not adversely affect the San Francisco Bay. With respect to each of these permit renewal proceedings, the permit renewal proceeding could take years to resolve and the agency or agencies involved could impose requirements upon the Mirant Americas Generation, Mirant North America and Mirant Mid-Atlantic entity owning the facility that require significant capital expenditures, limit the times at which the facility can operate, or increase operations and maintenance costs materially.
Byproducts, Wastes, Hazardous Materials and Contamination
Our facilities are subject to laws and regulations governing waste management. The federal Resource Conservation and Recovery Act of 1976 (and many analogous state laws) contains comprehensive requirements for the handling of solid and hazardous wastes. The generation of electricity produces non-hazardous and hazardous materials, and we incur substantial costs to store and dispose of waste materials. The EPA and the states in which we operate coal-fired units may develop new regulations that impose additional requirements on facilities that store or dispose of materials remaining after the combustion of fossil fuels, including types of coal ash. If so, we may be required to change the current waste management practices at some facilities and incur additional costs.
Additionally, CERCLA, also known as the Superfund law, establishes a federal framework for dealing with the cleanup of contaminated sites. Many states have enacted similar state superfund statutes as well as other laws imposing obligations to investigate and clean up contamination. Mirant Americas Generation’s and Mirant North America’s Contra Costa, Pittsburg and Potrero generating facilities have areas of soil and groundwater contamination subject to CERCLA and the California Health and Safety Code. In 1998, prior to Mirant Americas Generation’s and Mirant North America’s acquisition of those facilities from PG&E, consultants for PG&E conducted soil and groundwater investigations at those facilities which revealed contamination. The consultants conducting the investigation estimated the aggregate cleanup costs at those facilities could be as much as $60 million. Pursuant to the terms of the Purchase and Sale Agreement with PG&E, PG&E has responsibility for the containment or capping of all soil and groundwater contamination and the disposition of up to 60,000 cubic yards of contaminated soil from the Potrero generating facility and the remediation of any groundwater or solid contamination identified by PG&E’s consultants in 1998 at the Contra Costa and Pittsburg generating facilities, before those facilities were purchased in 1999 by Mirant Americas Generation’s and Mirant North America’s subsidiaries. Pursuant to Mirant Americas Generation’s and Mirant North America’s requests, PG&E has disposed of 807 cubic yards of contaminated soil from the Potrero generating facility. Mirant Americas Generation and Mirant North America are not aware of soil or groundwater conditions at their Contra Costa, Pittsburg and Potrero generating facilities for which they expect remediation costs to be material that are not the responsibility of other parties.
In 2008, Mirant Americas Generation and Mirant North America closed and then demolished the Lovett generating facility in New York. Pursuant to an agreement with the NYDEC, in 2009 Mirant Americas Generation and Mirant North America assessed the environmental condition of the property. Mirant Americas Generation and Mirant North America do not yet know what, if any, remediation will be required for the Lovett property.
31
Table of Contents
Employees
Mirant Services, a direct subsidiary of Mirant, provides our personnel pursuant to services agreements. At February 19, 2010, approximately 1,326 Mirant Services employees worked at our facilities, of which approximately 830 worked at Mirant Mid-Atlantic facilities. The following details the employees subject to collective bargaining agreements:
| Union |
Location | Number of Employees Covered |
Contract Expiration Date | |||
| Mid-Atlantic Region |
||||||
| IBEW Local 1900 |
Maryland and Virginia | 548 | 6/1/2010 | |||
| Northeast Region |
||||||
| IBEW Local 5031 |
New York | 47 | 4/30/2013 | |||
| UWUA Local 369 |
Cambridge, Massachusetts | 32 | 2/28/2013 | |||
| UWUA Local 3692 |
Sandwich, Massachusetts | 49 | 6/1/2011 | |||
| California |
||||||
| IBEW Local 1245 |
California | 122 | 10/31/2013 | |||
| Total Mirant Americas Generation and Mirant North America |
798 | |||||
| 1 | Mirant Americas Generation’s and Mirant North America’s New York employees continue to work without disruption under the terms imposed by Mirant effective January 28, 2009, after reaching an impasse in negotiations with the union. |
| 2 | In June 2009, the UWUA Local 480 representing the Canal generating facility employees in Sandwich, Massachusetts, merged with the UWUA Local 369. The UWUA Local 369 also represents Mirant Americas Generation’s and Mirant North America’s Kendall generating facility employees in a separate bargaining unit and each facility is covered by its own collective bargaining agreement. |
To mitigate and reduce the risk of disruption during labor negotiations, we engage in contingency planning for operation of our generating facilities to the extent possible during an adverse collective action by one or more of our unions.
32
Table of Contents
| Item 1A. | Risk Factors (Mirant Americas Generation, Mirant North America and Mirant Mid-Atlantic) |
The following are factors that could affect our future performance:
Risks Related to the Operation of our Business
Our revenues are unpredictable because most of our generating facilities operate without long-term power sales agreements, and our revenues and results of operations depend on market and competitive forces that are beyond our control.
We sell capacity, energy and ancillary services from our generating facilities into competitive power markets on a short-term fixed price basis or through power sales agreements. Since mid-2007, our revenues from selling capacity have become a significant part of our overall revenues. Except for Mirant Americas Generation’s and Mirant North America’s Potrero generating facility, we are not guaranteed recovery of costs or any return on capital investments through mandated rates. The market for wholesale electric energy and energy services reflects various market conditions beyond our control, including the balance of supply and demand, our competitors’ marginal and long run costs of production, and the effect of market regulation. The price for which we can sell our output may fluctuate on a day-to-day basis and our ability to transact may be affected by the overall liquidity in the markets in which we operate. The markets in which we compete remain subject to one or more forms of regulation that limit our ability to raise prices during periods of shortage to the degree that would occur in a fully deregulated market and may thereby limit our ability to recover costs and an adequate return on our investment. Our revenues and results of operations are influenced by factors that are beyond our control, including:
| — | the failure of market regulators to develop and maintain efficient mechanisms to compensate merchant generators for the value of providing capacity needed to meet demand; |
| — | actions by regulators, ISOs, RTOs and other bodies that may artificially modify supply and demand levels and prevent capacity and energy prices from rising to the level necessary for recovery of our costs, our investment and an adequate return on our investment; |
| — | legal and political challenges to the rules used to calculate capacity payments in the markets in which we operate; |
| — | the ability of wholesale purchasers of power to make timely payment for energy or capacity, which may be adversely affected by factors such as retail rate caps, refusals by regulators to allow utilities to recover fully their wholesale power costs and investments through rates, catastrophic losses and losses from investments by utilities in unregulated businesses; |
| — | increases in prevailing market prices for fuel oil, coal, natural gas and emissions allowances that may not be reflected in prices we receive for sales of energy; |
| — | increases in electricity supply as a result of actions of our current competitors or new market entrants, including the development of new generating facilities or alternative energy sources that may be able to produce electricity less expensively than our generating facilities and improvements in transmission that allow additional supply to reach our markets; |
| — | increases in credit standards, margin requirements, market volatility or other market conditions that could increase our obligations to post collateral beyond amounts that are expected, including additional collateral costs associated with OTC hedging activities as a result of proposed OTC regulation; |
| — | decreases in energy consumption resulting from demand-side management programs such as automated demand response, which may alter the amount and timing of consumer energy use; |
| — | the competitive advantages of certain competitors, including continued operation of older power plants in strategic locations after recovery of historic capital costs from ratepayers; |
33
Table of Contents
| — | existing or future regulation of our markets by the FERC, ISOs and RTOs, including any price limitations and other mechanisms to address some of the price volatility or illiquidity in these markets or the physical stability of the system; |
| — | regulatory policies of state agencies that affect the willingness of our customers to enter into long-term contracts generally, and contracts for capacity in particular; |
| — | changes in the rate of growth in electricity usage as a result of such factors as national and regional economic conditions and implementation of conservation programs; |
| — | seasonal variations in energy and natural gas prices, and capacity payments; and |
| — | seasonal fluctuations in weather, in particular abnormal weather conditions. |
In addition, unlike most other commodities, electric energy can only be stored on a very limited basis and generally must be produced at the time of use. As a result, the wholesale power markets are subject to substantial price fluctuations over relatively short periods of time and can be unpredictable.
Because of the current market design in California, our existing generating facilities may have a limited life unless we make significant capital expenditures to increase their commercial and environmental performance (Mirant Americas Generation and Mirant North America).
Our existing generating facilities in California depend almost entirely on payments in support of system reliability. The energy market, as currently constituted, will not justify the capital expenditures necessary to repower or reconstruct our facilities to make them commercially viable in a merchant market. If a commercially reasonable capacity market were to be instituted by the CAISO or we could obtain a contract with a creditworthy buyer, it is possible that we could justify investing the necessary capital to repower or reconstruct our facilities. Absent that, our existing generating facilities will be commercially viable only as long as they are necessary for reliability. As discussed further in Note 3 to our consolidated financial statements contained elsewhere in this report, we plan to shut down the Contra Costa generating facility in April 2013 and the Potrero generating facility when it is no longer needed for reliability as determined by the CAISO, which is currently anticipated to be by the end of 2010.
We are exposed to the risk of fuel and fuel transportation cost increases and volatility and interruption in fuel supply because our generating facilities generally do not have long-term agreements for the supply of natural gas, coal and oil.
Although we attempt to purchase fuel based on our expected fuel requirements, we still face the risks of supply interruptions and fuel price volatility. Our cost of fuel may not reflect changes in energy and fuel prices in part because we must pre-purchase inventories of coal and oil for reliability and dispatch requirements, and thus the price of fuel may have been determined at an earlier date than the price of energy generated from it. The price we can obtain from the sale of energy may not rise at the same rate, or may not rise at all, to match a rise in fuel costs. This may have a material adverse effect on our financial performance. The volatility of fuel prices could adversely affect our financial results and operations.
We enter into contracts of varying terms to secure appropriate quantities of fuel that meet the varying specifications of our generating facilities. For our coal-fired generating facilities, we purchase most of our coal from a small number of strategic suppliers under contracts with terms of varying lengths, some of which extend to 2013. We have non-performance risk associated with our long-term coal agreements. There is risk that our coal suppliers may not provide the contractual quantities on the dates specified within the agreements or the deliveries may be carried over to future periods. If our coal suppliers do not perform in accordance with the agreements, we may have to procure coal in the market to meet our needs, or power in the market to meet our obligations. In addition, a number of the coal suppliers do not currently have an investment grade credit rating
34
Table of Contents
and, accordingly, we may have limited recourse to collect damages in the event of default by a supplier. We seek to mitigate this risk through diversification of coal suppliers and through guarantees. Despite this, there can be no assurance that these efforts will be successful in mitigating credit risk from coal suppliers. Non-performance or default risk by our coal suppliers could have a material adverse effect on our future results of operations, financial condition and cash flows.
For our oil-fired generating facilities, we typically purchase fuel from a limited number of suppliers under contracts with terms of varying lengths. If our oil suppliers do not perform in accordance with the agreements, we may have to procure oil in the market to meet our needs, or power in the market to meet our obligations.
Operation of our generating facilities involves risks that may have a material adverse effect on our cash flows and results of operations.
The operation of our generating facilities involves various operating risks, including, but not limited to:
| — | the output and efficiency levels at which those generating facilities perform; |
| — | interruptions in fuel supply and quality of available fuel; |
| — | disruptions in the delivery of electricity; |
| — | adverse zoning; |
| — | breakdowns or equipment failures (whether a result of age or otherwise); |
| — | violations of our permit requirements or changes in the terms of or revocation of permits; |
| — | releases of pollutants and hazardous substances to air, soil, surface water or groundwater; |
| — | ability to transport and dispose of coal ash at reasonable prices; |
| — | shortages of equipment or spare parts; |
| — | labor disputes; |
| — | operator errors; |
| — | curtailment of operations because of transmission constraints; |
| — | failures in the electricity transmission system which may cause large energy blackouts; |
| — | implementation of unproven technologies in connection with environmental improvements; and |
| — | catastrophic events such as fires, explosions, floods, earthquakes, hurricanes or other similar occurrences. |
A decrease in, or the elimination of, the revenues generated by our facilities or an increase in the costs of operating such facilities could materially affect our cash flows and results of operations, including cash flows available to us to make payments on our debt or our other obligations.
Our operating results are subject to quarterly and seasonal fluctuations.
Our operating results have fluctuated in the past and are likely to continue to do so in the future as a result of a number of factors, including seasonal variations in demand and fuel prices.
Our generating facilities are located in a few geographic markets, resulting in concentrated exposure to the Mid-Atlantic market.
Mirant Americas Generation’s and Mirant North America’s generating facilities are located in California, Massachusetts and New York and, through Mirant Mid-Atlantic, Maryland and Virginia. In 2009, 2008 and
35
Table of Contents
2007, we earned a significant portion of our operating revenue and gross margin from the PJM market, where our Mid-Atlantic generating facilities are located. Having our generating facilities in a few geographic markets results in our concentrated exposure to those markets, especially PJM.
We compete to sell energy, capacity and ancillary services in the wholesale power markets against some competitors that enjoy competitive advantages, including the ability to recover fixed costs through rate-base mechanisms and a lower cost of capital.
Regulated utilities in the wholesale markets generally enjoy a lower cost of capital than we do and often are able to recover fixed costs through regulated retail rates, including, in many cases, the costs of generation, allowing them to build, buy and upgrade generating facilities without relying exclusively on market clearing prices to recover their investments. The competitive advantages of such participants could adversely affect our ability to compete effectively and could have an adverse effect on the revenues generated by our facilities.
The expected decommissioning and/or site remediation obligations of certain of our generating facilities may negatively affect our cash flows.
Some of our generating facilities and related properties are subject to decommissioning and/or site remediation obligations that may require material expenditures. Furthermore, laws and regulations may change to impose material additional decommissioning and remediation obligations on us in the future. If we are required to make material expenditures to decommission or remediate one or more of our facilities, such obligations will affect our cash flows and may adversely affect our ability to make payments on our obligations.
Changes in technology may significantly affect our generating business by making our generating facilities less competitive.
We generate electricity using fossil fuels at large central facilities. This method results in economies of scale and lower costs than newer technologies such as fuel cells, microturbines, windmills and photovoltaic solar cells. It is possible that advances in those technologies will reduce their costs to levels that are equal to or below that of most central station electricity production, which could have a material adverse effect on our results of operations.
Terrorist attacks, future wars or risk of war may adversely affect our results of operations, our ability to raise capital or our future growth.
As power generators, we face heightened risk of an act of terrorism, either a direct act against one of our generating facilities or an inability to operate as a result of systemic damage resulting from an act against the transmission and distribution infrastructure that is used to transport our power. Further, we rely on information technology networks and systems to operate our generating facilities, engage in asset management activities, and process, transmit and store electronic information. Security breaches of this information technology infrastructure, including cyber-attacks and cyber terrorism, could lead to system disruptions, generating facility shutdowns or unauthorized disclosure of confidential information. If such an attack or security breach were to occur, our business, results of operations and financial condition could be materially adversely affected. In addition, such an attack could affect our ability to service our indebtedness, our ability to raise capital and our future growth opportunities.
Our operations are subject to hazards customary to the power generating industry. We may not have adequate insurance to cover all of these hazards.
Our operations are subject to many hazards associated with the power generating industry, which may expose us to significant liabilities for which we may not have adequate insurance coverage. Power generation involves hazardous activities, including acquiring, transporting and unloading fuel, operating large pieces of rotating equipment and delivering electricity to transmission and distribution systems. In addition to natural
36
Table of Contents
risks, such as earthquake, flood, storm surge, lightning, hurricane and wind, hazards, such as fire, explosion, collapse and machinery failure, are inherent risks in our operations. These hazards can cause significant injury to personnel or loss of life, severe damage to and destruction of property, plant and equipment, contamination of, or damage to, the environment and suspension of operations. The occurrence of any one of these events may result in our being named as a defendant in lawsuits asserting claims for substantial damages, environmental cleanup costs, personal injury and fines and/or penalties. We maintain an amount of insurance protection that we consider adequate, but we cannot assure that our insurance will be sufficient or effective under all circumstances and against all hazards or liabilities to which we may be subject. A successful claim for which we are not fully insured could have a material adverse effect on our financial results and our financial condition.
We are currently involved in significant litigation that, if decided adversely to us, could materially adversely affect our results of operations and profitability.
We are currently involved in various litigation matters which are described in more detail in this Form 10-K. We intend to defend vigorously against those claims that we are unable to settle, but the results of this litigation cannot be determined. Adverse outcomes for us in this litigation could require significant expenditures by us and could have a material adverse effect on our results of operations and profitability.
Risks Related to Economic and Financial Capital Market Conditions
Maintaining sufficient liquidity in our business for maintenance and operating expenditures, capital expenditures and collateral is crucial in order to mitigate the risk of future financial distress to us. Accordingly, Mirant North America maintains a revolving credit facility to manage its expected liquidity needs and contingencies. If the lenders under such facility were unable to perform, it could have a material adverse affect on Mirant Americas Generation’s and Mirant North America’s results of operations. As a result, Mirant Americas Generation and Mirant North America are exposed to systemic risk of the financial markets and institutions and the risk of non-performance of the individual lenders under Mirant North America’s revolving credit facility.
Maintaining sufficient liquidity in our business for maintenance and operating expenditures, capital expenditures and collateral is crucial in order to mitigate the risk of future financial distress to us. Accordingly, Mirant North America maintains a revolving credit facility to manage its expected liquidity needs and contingencies as described in more detail in this Form 10-K. If the lenders under such facility were unable to perform it could have a material adverse affect on Mirant Americas Generation’s and Mirant North America’s results of operations. For example, in October 2008, Lehman Commercial Paper, Inc., a subsidiary of Lehman Brothers Holdings, Inc. and a lender under the senior secured revolving credit facility of Mirant North America filed for bankruptcy. As a result of the Lehman Commercial Paper, Inc. bankruptcy, the total availability under Mirant North America’s senior secured revolving credit facility has effectively decreased from $800 million to $755 million. The $755 million includes the $50 million commitment under such facility by CIT Capital USA Inc., whose corporate parent, CIT Group Inc., filed for and emerged from bankruptcy reorganization on November 1, 2009 and December 10, 2009, respectively. Although Mirant Americas Generation and Mirant North America do not expect that the Lehman Commercial Paper, Inc. and CIT Group bankruptcies will have a material adverse effect on them, a credit crisis could negatively affect availability under the Mirant North America senior secured revolving credit facility if other lenders under such facility are forced to file for bankruptcy or are otherwise unable to perform their obligations. Absent significant non-performance of lenders under the existing Mirant North America senior secured revolving credit facility, we think that we have sufficient liquidity for future operations (including potential working capital requirements) and capital expenditures as discussed in Item 7. “Management’s Discussion and Analysis of Results of Operations and Financial Condition—Liquidity and Capital Resources.” However, in the event of significant non-performance of lenders under the existing Mirant North America senior secured revolving credit facility, or in the event that financial institutions are unwilling or unable to renew Mirant North America’s existing revolving credit facility or enter into new revolving credit facilities, our ability to hedge our assets or Mirant Americas Generation’s and Mirant North America’s ability to engage in proprietary trading could be impaired.
37
Table of Contents
Global financial institutions have been active participants in the energy and commodity markets and we hedge economically a substantial portion of our Mid-Atlantic coal-fired baseload generation with such parties. As such financial institutions consolidate and operate under more restrictive capital constraints and regulations in response to the recent financial crisis, there could be less liquidity in the energy and commodity markets, which could have a negative effect on our ability to hedge and transact with creditworthy counterparties.
In recent years, global financial institutions have been active participants in the energy and commodity markets. We hedge economically a substantial portion of our Mid-Atlantic coal-fired baseload generation through OTC transactions. A significant portion of our hedges are financial swap transactions between Mirant Mid-Atlantic and financial counterparties that are senior unsecured obligations of such parties and do not require either party to post cash collateral, either for initial margin or for securing exposure as a result of changes in power or natural gas prices. As such financial institutions consolidate and operate under more restrictive capital constraints and regulations in response to the recent financial crisis, there could be less liquidity in the energy and commodity markets, which could have a negative effect on our ability to hedge and transact with creditworthy counterparties.
Greater regulation of energy contracts, including the regulation of OTC derivatives, could materially affect our ability to hedge economically our generation by reducing liquidity in the energy and commodity markets and, if we are required to clear such transactions on exchanges, by significantly increasing the collateral costs associated with such activities.
In response to the global financial crisis, legislation has been proposed in Congress to increase the regulation of transactions involving OTC derivatives. The proposed legislation provides that standardized swap transactions between dealers and large market participants would have to be cleared and must be traded on an exchange or electronic platform. Although the proposed legislation provides exclusions from the clearing and certain other requirements for market participants, such as Mirant Americas Generation, Mirant North America and Mirant Mid-Atlantic, which utilize OTC derivatives to hedge commercial risks, such exclusions are the focus of debate and may not ultimately be part of any final legislation.
In addition to the proposed legislation, the CFTC has proposed designation of certain electricity contracts as significant price discovery contracts (“SPDCs”), including contracts that we trade on the Intercontinental Exchange based on CAISO and PJM West Hub locational marginal pricing. SPDC designation would subject these contracts to new more stringent requirements and could set a precedent for other contracts.
Further, the CFTC issued a notice of proposed rulemaking in which it proposed to adopt all-months-combined, single (non-spot) month and spot-month position limits for exchange-listed natural gas, crude oil, heating oil and gasoline futures and options contracts. We continue to monitor the rulemaking proceeding, but do not think that the limits as proposed would have a material effect on our business.
While we do not expect the current proposals in Congress and at the CFTC to have a material adverse effect on our business, a continuation of the trend of greater regulation of energy contracts, including more restrictive regulation of OTC derivative contracts, could materially affect our ability to hedge economically our generation by reducing liquidity in the energy and commodity markets and, if we are required to clear such transactions on exchanges, by significantly increasing the collateral costs associated with such activities.
We are exposed to credit risk resulting from a loss that may occur from the failure of a counterparty to perform according to the terms of a contractual arrangement with us, particularly in connection with our non-collateralized power hedges entered into by Mirant Mid-Atlantic with financial institutions.
We are exposed to credit risk resulting from the possibility that a loss may occur from the failure of a counterparty to perform according to the terms of a contractual arrangement with us, particularly in connection with our non-collateralized power hedges entered into by Mirant Mid-Atlantic with our major trading partners,
38
Table of Contents
which represent 65% of the net notional position for Mirant Americas Generation and Mirant North America and 67% of the net notional position for Mirant Mid-Atlantic at December 31, 2009. Such hedges are senior unsecured obligations of Mirant Mid-Atlantic and the counterparties, and do not require either party to post cash collateral for initial margin or for securing exposure as a result of changes in power or natural gas prices. Deterioration in the financial condition of our counterparties and any resulting failure to pay amounts owed to us or to perform obligations or services owed to us beyond collateral posted could have a negative effect on our business and financial condition.
Changes in commodity prices may negatively affect our financial results by increasing the cost of producing power or lowering the price at which we are able to sell our power.
Our generating business is subject to changes in power prices and fuel costs, and these commodity prices are influenced by many factors outside our control, including weather, market liquidity, transmission and transportation inefficiencies, availability of competitively priced alternative energy sources, demand for energy commodities, production of natural gas, coal and crude oil, natural disasters, wars, embargoes and other catastrophic events, and federal, state and environmental regulation and legislation. In addition, significant fluctuations in the price of natural gas may cause significant fluctuations in the price of electricity. Significant fluctuations in commodity prices may affect our financial results and financial position by increasing the cost of producing power and decreasing the amounts we receive from the sale of power.
Our use of derivative financial instruments in our asset management activities will not fully protect us from fluctuations in commodity prices and our risk management policy cannot eliminate the risks associated with these activities.
We engage in asset management activities related to sales of electricity and purchases of fuel. The income and losses from these activities are recorded as operating revenues and fuel costs. We may use forward contracts and other derivative financial instruments to manage market risk and exposure to volatility in prices of electricity, coal, natural gas, emissions and oil. We cannot provide assurance that these strategies will be successful in managing our price risks, or that they will not result in net losses to us as a result of future volatility in electricity, fuel and emissions markets. Actual power prices and fuel costs may differ from our expectations.
Our asset management activities include natural gas derivative financial instruments that we use to hedge power prices for our baseload generation. The effectiveness of these hedges is dependent upon the correlation between power and natural gas prices in the markets where we operate. If those prices are not sufficiently correlated, our financial results and financial position could be adversely affected.
Additionally, we expect to have an open position in the market, within our established guidelines, resulting from the management of our portfolio. To the extent open positions exist, fluctuating commodity prices can affect our financial results and financial position, either favorably or unfavorably. Furthermore, the risk management procedures we have in place may not always be followed or may not always work as planned. However, we have designed a system of internal controls to prevent and/or detect unauthorized hedging and related activities, including our risk management policy. If any of our employees were able to engage in unauthorized hedging and related activities, it could result in significant penalties and financial losses. As a result of these and other factors, we cannot predict the outcome that risk management decisions may have on our business, operating results or financial position. Although management devotes considerable attention to these issues, their outcome is uncertain.
Our asset management, proprietary trading and fuel oil management activities may increase the volatility of our quarterly and annual financial results.
We engage in asset management activities to hedge economically our exposure to market risk with respect to: (1) electricity sales from our generating facilities; (2) fuel used by those facilities; and (3) emissions
39
Table of Contents
allowances. We generally attempt to balance our fixed-price purchases and sales commitments in terms of contract volumes and the timing of performance and delivery obligations through the use of financial and physical derivative financial instruments. Mirant Americas Generation and Mirant North America also use derivative financial instruments with respect to their limited proprietary trading and fuel oil management activities, through which they attempt to achieve incremental returns by transacting where they have specific market expertise. Derivatives from our asset management and Mirant Americas Generation’s and Mirant North America’s proprietary trading and fuel oil management activities are recorded on the balance sheets at fair value pursuant to the accounting guidance for derivative financial instruments. None of our derivatives recorded at fair value is designated as a hedge under this guidance and changes in their fair values currently are recognized in earnings as unrealized gains or losses. As a result, our financial results—including gross margin, operating income and balance sheet ratios—will, at times, be volatile and subject to fluctuations in value primarily because of changes in forward electricity and fuel prices. For a more detailed discussion of the accounting treatment of our asset management and Mirant Americas Generation’s and Mirant North America’s proprietary trading and fuel oil management activities see Note 2 to our consolidated financial statements contained elsewhere in this report.
Risks Related to Governmental Regulation and Laws
Our business and activities are subject to extensive environmental requirements and could be adversely affected by such requirements, including future changes to them.
Our business is subject to extensive environmental regulations promulgated by federal, state and local authorities, which, among other things, restrict the discharge of pollutants into the air, water and soil, and also govern the use of water from adjacent waterways. Such laws and regulations frequently require us to obtain permits and remain in continuous compliance with the conditions established by those permits. To comply with these legal requirements and the terms of our permits, we must spend significant sums on environmental monitoring, pollution control equipment and emissions allowances. If we were to fail to comply with these requirements, we could be subject to civil or criminal liability, injunctive relief and the imposition of liens or fines. We may be required to shut down facilities (including ash sites) if we are unable to comply with the requirements, or if we determine the expenditures required to comply are uneconomic.
From time to time, we may not be able to obtain necessary environmental regulatory approvals. Such approvals could be delayed or subject to onerous conditions. If there is a delay in obtaining environmental regulatory approval or if onerous conditions are imposed, the operation of our generating facilities or ash sites or the sale of electricity to third parties could be prevented or become subject to additional costs. Such delays or onerous conditions could have a material adverse effect on our financial performance and condition. In addition, environmental laws, particularly with respect to air emissions, disposal of ash, wastewater discharge and cooling water systems, are generally becoming more stringent, which may require us to make additional facility upgrades or restrict our operations.
Increased public concern and growing political pressure related to global warming have resulted in significant increases in the regulation of greenhouse gases, including CO2, at the state level. Future local, state and federal regulation of greenhouse gases is likely to create substantial environmental costs for us in the form of taxes or purchases of emissions allowances and/or new equipment. Many of the states where we own generating facilities, including California, Maryland, Massachusetts and New York, have recently committed, or expressed an intent to commit, to mandatory reductions in statewide CO2 emissions through a regional cap-and-trade program. Maryland, Massachusetts and New York have already joined the RGGI, which required all allowances to be purchased initially through an auction process, the first of which took place in September 2008. Auctions, such as those mandated by the RGGI, may decrease the amount of available allowances and substantially increase emissions allowance prices. With respect to federal CO2 legislation, the United States House of Representatives passed a bill that would establish a cap-and-trade program for CO2 across multiple
40
Table of Contents
sectors, including the electric generating sector. In the House bill, the electric industry is granted a portion of allowances needed to comply with the program. The remaining allowances needed would have to be purchased through an auction process. The EPA has also begun the process of regulating greenhouse gases by finding that greenhouse gases emitted from vehicles endanger public health and welfare. Because our generating facilities emit CO2, regulations seeking to reduce emissions of CO2 and similar future laws may significantly increase our operating costs.
Certain environmental laws, including CERCLA and comparable state laws, impose strict and, in many circumstances, joint and several liability for costs of remediating contamination. Some of our facilities have areas with known soil and/or groundwater contamination. Releases of hazardous substances at our generating facilities, or at locations where we dispose of (or in the past disposed of) hazardous substances and other waste, could require us to spend significant sums to remediate contamination, regardless of whether we caused such contamination. The discovery of significant contamination at our generating facilities, at disposal sites we currently use or have used, or at other locations for which we may be liable, or the failure or inability of parties contractually responsible to us for contamination to respond when claims or obligations regarding such contamination arise, could have a material adverse effect on our financial performance and condition.
Our coal-fired generating units produce certain byproducts that involve extensive handling and disposal costs and are subject to government regulation. Changes in these regulations, or their administration, by legislatures, state and federal regulatory agencies, or other bodies may affect the costs of handling and disposing of these byproducts. Such costs, in turn, may negatively affect our results of operations and financial condition.
As a result of the coal combustion process, we produce significant quantities of ash at our coal-fired generating units that must be disposed of at sites permitted to handle ash. For most of our ash, we use our own ash management facilities, which are all dry landfills, in the Mid-Atlantic region to dispose of the ash; however, we expect that certain of these sites may reach full capacity in the next few years. As a result, we have developed a plan related to the disposition of ash, including developing new ash management facilities and preparing our ash for beneficial uses, but the costs associated with the plan could be material. The costs associated with purchasing new land and permitting the land to allow for ash disposal could be material, and the amount of time needed to permit the land could extend beyond the expected timeline. Additionally, costs associated with third-party ash handling and disposal are material and could have an adverse effect on our financial performance and condition.
We also produce gypsum as a byproduct of the SO2 scrubbing process at our coal-fired generating facilities, which is sold to third parties for use in drywall production. Should our ability to sell such gypsum to third parties be restricted as a result of the lack of demand or otherwise, our gypsum disposal costs could rise materially.
The EPA is reviewing whether byproducts such as ash and gypsum should be classified as a hazardous waste. If these byproducts were to be classified as a hazardous waste, the cost of disposing of these byproducts would increase materially and limit our ability to recycle them for beneficial use.
Our business is subject to complex government regulations. Changes in these regulations, or their administration, by legislatures, state and federal regulatory agencies, or other bodies may affect the costs of operating our generating facilities or our ability to operate our facilities. Such costs, in turn, may negatively affect our results of operations and financial condition.
We are subject to regulation by the FERC regarding the rates, terms and conditions of wholesale sales of electric capacity, energy and ancillary services and other matters, including mergers and acquisitions, the disposition of facilities under the FERC’s jurisdiction and the issuance of securities, as well as by state agencies
41
Table of Contents
regarding physical aspects of our generating facilities. The majority of our generation is sold at market prices under market-based rate authority granted by the FERC. If certain conditions are not met, the FERC has the authority to withhold or rescind market-based rate authority and require sales to be made based on cost-of-service rates. A loss of our market-based rate authority could have a materially negative impact on our generating business.
Even when market-based rate authority has been granted, the FERC may impose various forms of market mitigation measures, including price caps and operating restrictions, when it determines that potential market power might exist and that the public interest requires such potential market power to be mitigated. In addition to direct regulation by the FERC, most of our facilities are subject to rules and terms of participation imposed and administered by various ISOs and RTOs. Although these entities are themselves ultimately regulated by the FERC, they can impose rules, restrictions and terms of service that are quasi-regulatory in nature and can have a material adverse impact on our business. For example, ISOs and RTOs may impose bidding and scheduling rules, both to curb the potential exercise of market power and to ensure market functions. Such actions may materially affect our ability to sell and the price we receive for our energy, capacity and ancillary services.
To conduct our business, we must obtain and periodically renew licenses, permits and approvals for our facilities. These licenses, permits and approvals can be in addition to any required environmental permits. No assurance can be provided that we will be able to obtain and comply with all necessary licenses, permits and approvals for these facilities. If we cannot comply with all applicable regulations, our business, results of operations and financial condition could be adversely affected.
We cannot predict whether the federal or state legislatures will adopt legislation relating to the restructuring of the energy industry. There are proposals in many jurisdictions that would either roll back or advance the movement toward competitive markets for the supply of electricity, at both the wholesale and retail levels. In addition, any future legislation favoring large, vertically integrated utilities and a concentration of ownership of such utilities could affect our ability to compete successfully, and our business and results of operations could be adversely affected.
Risks Related to Level of Indebtedness
Our consolidated indebtedness and our obligations under the Mirant Mid-Atlantic leveraged leases could adversely affect our ability to raise additional capital to fund our operations, limit our ability to react to changes in the economy or our industry and prevent us from meeting or refinancing our obligations.
As of December 31, 2009, Mirant Americas Generation’s consolidated indebtedness was $2.630 billion, Mirant North America’s consolidated indebtedness was $1.248 billion and Mirant Mid-Atlantic’s consolidated debt was $25 million. In addition, the present value of lease payments under the Mirant Mid-Atlantic leveraged leases was approximately $1.0 billion (assuming a 10% discount rate) and the termination value of the Mirant Mid-Atlantic leveraged leases was $1.4 billion. Our leverage and obligations under the leveraged leases could have important consequences, including the following: (1) it may limit our ability to obtain additional debt or equity financing for working capital, capital expenditures, debt service requirements, acquisitions and general corporate or other purposes; (2) a substantial portion of our cash flows from operations must be dedicated to the payment of rent and principal and interest on our indebtedness and will not be available for other purposes, including our operations, capital expenditures and future business opportunities; (3) the debt service requirements of our indebtedness could make it difficult for us to satisfy or refinance our financial obligations; (4) certain of our borrowings, including borrowings under Mirant North America’s senior secured credit facilities, are at variable rates of interest, exposing Mirant Americas Generation and Mirant North America to the risk of increased interest rates; (5) it may limit our ability to adjust to changing market conditions and place us at a competitive disadvantage compared with our competitors that have less debt and are not burdened by
42
Table of Contents
such obligations and restrictions; and (6) we may be more vulnerable in a downturn in general economic conditions or in our business and we may be unable to carry out capital expenditures that are important to our long-term growth or necessary to comply with environmental regulations.
Mirant Americas Generation and Mirant North America are holding companies and we may not have access to sufficient cash to meet our obligations if our subsidiaries, in particular, Mirant Mid-Atlantic, are unable to make distributions.
Mirant Americas Generation and Mirant North America are holding companies and, as a result, are dependent upon dividends, distributions and other payments from our operating subsidiaries to generate the funds necessary to meet our obligations. The ability of certain of our subsidiaries to pay dividends and distributions is restricted under the terms of their debt or other agreements. In particular, a significant portion of cash from our operations is generated by the power generating facilities of Mirant Mid-Atlantic. Under the Mirant Mid-Atlantic leveraged leases, Mirant Mid-Atlantic is subject to a covenant that restricts its right to make distributions to its immediate parent, Mirant North America. In turn, Mirant North America is subject to covenants that restrict its ability to make distributions to Mirant Americas Generation. The ability of Mirant North America and Mirant Mid-Atlantic to satisfy the criteria set forth in their respective covenants in the future could be impaired by factors which negatively affect their financial performance, including interruptions in operations or curtailments of operations to comply with environmental restrictions, significant capital and other expenditures, and adverse conditions in the power and fuel markets. Further, the Mirant North America senior notes and senior secured credit facilities include financial covenants that exclude from the calculation the financial results of any subsidiary that is unable to make distributions or dividends at the time of such calculation. Thus, the inability of Mirant Mid-Atlantic to make distributions to Mirant North America under the leveraged lease transaction would have a material adverse effect on the calculation of the financial covenants under the senior notes and senior secured credit facilities of Mirant North America, including the leverage and interest coverage maintenance covenants under its senior credit facility.
The obligations of Mirant Americas Generation and Mirant North America, including our respective indebtedness, are effectively subordinated to the obligations or indebtedness of our respective subsidiaries, including the Mirant Mid-Atlantic leveraged leases. See Item 7. “Management’s Discussion and Analysis—Liquidity and Capital Resources” for a discussion of restrictions on the ability of Mirant North America to make distributions to Mirant Americas Generation.
We may be unable to generate sufficient liquidity to service our debt and to post required amounts of cash collateral necessary to hedge market risk effectively (Mirant Americas Generation and Mirant North America).
Our ability to pay principal and interest on our debt depends on our future operating performance. If our cash flows and capital resources are insufficient to allow us to make scheduled payments on our debt, we may have to reduce or delay capital expenditures, sell assets, seek additional capital, restructure or refinance. There can be no assurance that the terms of our debt will allow these alternative measures, that the financial markets will be available to us on acceptable terms or that such measures would satisfy our scheduled debt service obligations.
We seek to manage the risks associated with the volatility in the price at which we sell power produced by our generating facilities and in the prices of fuel, emissions allowances and other inputs required to produce such power by entering into hedging transactions. These asset management activities may require us to post collateral either in the form of cash or letters of credit. As of December 31, 2009, we had approximately $83 million of posted cash collateral and $199 million of letters of credit outstanding primarily to support our asset management activities, debt service and rent reserve requirements and other commercial arrangements. See
43
Table of Contents
Note 7 to our consolidated financial statements contained elsewhere in this report for further information on our posted cash collateral and letters of credit. Although we seek to structure transactions in a way that reduces our potential liquidity needs for collateral, we may be unable to execute our hedging strategy successfully if we are unable to post the amount of collateral required to enter into and support hedging contracts.
We are an active participant in energy exchange and clearing markets. These markets require a per contract initial margin to be posted, regardless of the credit quality of the participant. The initial margins are determined by the exchanges through the use of proprietary models that rely on a variety of inputs and factors, including market conditions. We have limited notice of any changes to the margin rates. Consequently, we are exposed to changes in the per unit margin rates required by the exchanges and could be required to post additional collateral on short notice.
| Item 1B. | Unresolved Staff Comments (Mirant Americas Generation, Mirant North America and Mirant Mid-Atlantic) |
None.
44
Table of Contents
| Item 2. | Properties (Mirant Americas Generation, Mirant North America and Mirant Mid-Atlantic) |
The properties below were owned or leased as of December 31, 2009. Our leasehold or ownership interest is 100% for each property.
| Generating Facilities |
Location | Holding |
Dispatch Type |
Primary Fuel |
Total MW1 |
2009 Net Capacity Factor |
|||||||
| Mid-Atlantic Region: |
|||||||||||||
| Chalk Point |
Maryland | Own | Intermediate/Baseload/Peaking | Natural Gas/Coal/Oil | 2,401 | 20 | % | ||||||
| Dickerson2 |
Maryland | Own/Lease | Baseload/Peaking | Natural Gas/Coal/Oil | 844 | 31 | % | ||||||
| Morgantown2 |
Maryland | Own/Lease | Baseload/Peaking | Coal/Oil | 1,467 | 51 | % | ||||||
| Potomac River |
Virginia | Own | Intermediate/Baseload | Coal | 482 | 15 | % | ||||||
| Total Mid-Atlantic |
5,194 | 30 | % | ||||||||||
| Northeast Region: |
|||||||||||||
| Bowline |
New York | Own | Intermediate/Peaking | Natural Gas/Oil | 1,139 | 1 | % | ||||||
| Canal |
Massachusetts | Own | Intermediate | Natural Gas/Oil | 1,126 | 6 | % | ||||||
| Kendall |
Massachusetts | Own | Baseload/Peaking | Natural Gas/Oil | 256 | 65 | % | ||||||
| Martha’s Vineyard |
Massachusetts | Own | Peaking | Diesel | 14 | 1 | % | ||||||
| Total Northeast |
2,535 | 10 | % | ||||||||||
| California: |
|||||||||||||
| Contra Costa |
California | Own | Intermediate | Natural Gas | 674 | 3 | % | ||||||
| Pittsburg |
California | Own | Intermediate | Natural Gas | 1,311 | 2 | % | ||||||
| Potrero |
California | Own | Intermediate/Peaking | Natural Gas/Diesel | 362 | 20 | % | ||||||
| Total California |
2,347 | 5 | % | ||||||||||
| Total Mirant Americas Generation and Mirant North America Operations |
10,076 | 19 | % | ||||||||||
| 1 | Total MW amounts reflect nominal net summer capacity. The decrease in net generating capacity in the Mid-Atlantic region from its previous total of 5,230 MW is primarily related to an increase in station service power necessary to operate the scrubbers that were installed in the fourth quarter of 2009. |
| 2 | We own 307 MW and 248 MW, respectively, at the Dickerson and Morgantown generating facilities. |
We also own or lease oil and gas pipelines that serve our generating facilities.
| Item 3. | Legal Proceedings (Mirant Americas Generation, Mirant North America and Mirant Mid-Atlantic) |
See Note 11 to our consolidated financial statements contained elsewhere in this report for discussion of the material legal proceedings to which we are a party.
| Item 4. | Submission of Matters to a Vote of Security Holders (Mirant Americas Generation, Mirant North America and Mirant Mid-Atlantic) |
None.
45
Table of Contents
| Item 5. | Market for Registrant’s Common Equity, Related Stockholder Matters and Issuer Purchases of Equity Securities (Mirant Americas Generation, Mirant North America and Mirant Mid-Atlantic) |
Mirant Americas Generation, Mirant North America and Mirant Mid-Atlantic are indirect wholly-owned subsidiaries of Mirant. Our membership interests are not publicly traded. All of Mirant Americas Generation’s membership interests are held by its parent, Mirant Americas. For the years ended December 31, 2009 and 2008, Mirant Americas Generation made cash distributions to Mirant Americas of $115 million and $297 million, respectively. See Item 7. “Management’s Discussion and Analysis—Liquidity and Capital Resources” for additional information. All of Mirant North America’s membership interests are held by its parent, Mirant Americas Generation. For the years ended December 31, 2009 and 2008, Mirant North America made cash distributions to Mirant Americas Generation of $235 million and $414 million, respectively. All of Mirant Mid-Atlantic’s membership interests are held by its parent, Mirant North America. For the years ended December 31, 2009 and 2008, Mirant Mid-Atlantic made cash distributions to Mirant North America of $125 million and $325 million, respectively. We have no equity compensation plans under which we issue our membership interests.
46
Table of Contents
| Item 6. | Selected Financial Data (Mirant Americas Generation, Mirant North America and Mirant Mid-Atlantic) |
The following discussion should be read in conjunction with our consolidated financial statements and the notes thereto, which are included elsewhere in this Form 10-K. The following tables present our selected consolidated financial information, which is derived from our consolidated financial statements.
Mirant Americas Generation
| Years Ended December 31, | |||||||||||||||||
| 2009 | 2008 | 2007 | 2006 | 2005 | |||||||||||||
| (in millions) | |||||||||||||||||
| Statements of Operations Data: |
|||||||||||||||||
| Operating revenues |
$ | 2,309 | $ | 3,188 | $ | 2,041 | $ | 3,257 | $ | 2,941 | |||||||
| Income (loss) from continuing operations |
476 | 1,198 | (68 | ) | 1,197 | (755 | ) | ||||||||||
| Income (loss) from discontinued operations |
— | — | 8 | 3 | (9 | ) | |||||||||||
| Net income (loss) |
$ | 476 | $ | 1,198 | $ | (60 | ) | $ | 1,200 | $ | (779 | ) | |||||
Our Statement of Operations Data for each year reflects the volatility caused by unrealized gains and losses related to derivative financial instruments used to hedge economically electricity and fuel. Changes in the fair value and settlements of derivative financial instruments used to hedge economically electricity are reflected in operating revenue and changes in the fair value and settlements of derivative financial instruments used to hedge economically fuel are reflected in cost of fuel, electricity and other products in the accompanying consolidated statements of operations. Changes in the fair value and settlements of derivative financial instruments for proprietary trading and fuel oil management activities are recorded on a net basis as operating revenue in the accompanying consolidated statements of operations. See Note 2 to our consolidated financial statements contained elsewhere in this report for additional information.
| Years Ended December 31, | ||||||||||||||||||
| 2009 | 2008 | 2007 | 2006 | 2005 | ||||||||||||||
| (in millions) | ||||||||||||||||||
| Unrealized gains (losses) included in operating revenues |
$ | (2 | ) | $ | 840 | $ | (652 | ) | $ | 711 | $ | (94 | ) | |||||
| Unrealized losses (gains) included in cost of fuel, electricity and other products |
(49 | ) |
|
54 |
(28 | ) | 102 | (71 | ) | |||||||||
| Total |
$ | 47 | $ | 786 | $ | (624 | ) | $ | 609 | $ | (23 | ) | ||||||
For the year ended December 31, 2009, income from continuing operations reflects impairment losses of $221 million related to our Potomac River generating facility and intangible assets related to our Potrero and Contra Costa generating facilities. For the year ended December 31, 2007, income from continuing operations reflects an impairment loss of $175 million related to our Lovett generating facility. See Note 3 to our consolidated financial statements contained elsewhere in this report for further information on these impairments. For the year ended December 31, 2006, income from continuing operations reflects an impairment loss of $120 million related to suspended construction at our Bowline generating facility and a $244 million gain from a New York property tax settlement.
Our Statement of Operations Data for the year ended December 31, 2005, reflects the effects of accounting for the Plan confirmed on December 9, 2005. During our bankruptcy proceedings, our consolidated financial statements were prepared in accordance with the accounting guidance for financial reporting by entities in reorganization under the bankruptcy code.
47
Table of Contents
The consolidated Balance Sheet Data as of December 31, 2006 and 2005 segregates pre-petition liabilities subject to compromise from those liabilities that were not subject to compromise.
| At December 31, | |||||||||||||||
| 2009 | 2008 | 2007 | 2006 | 2005 | |||||||||||
| (in millions) | |||||||||||||||
| Balance Sheet Data: |
|||||||||||||||
| Total assets |
$ | 7,517 | $ | 8,552 | $ | 5,936 | $ | 7,177 | $ | 8,324 | |||||
| Total long-term debt |
2,630 | 2,675 | 3,093 | 3,272 | 2,582 | ||||||||||
| Liabilities subject to compromise |
— | — | — | 34 | 34 | ||||||||||
| Member’s equity |
$ | 2,829 | $ | 2,384 | $ | 1,169 | $ | 1,644 | $ | 703 | |||||
In 2005, we recorded the effects of the Plan. As a result, liabilities subject to compromise at December 31, 2005 and 2006, only reflect the liabilities of our New York entities that remained in bankruptcy at that time. Total assets for all periods reflect our election in 2008 to discontinue the net presentation of assets subject to master netting agreements upon adoption of the accounting guidance for offsetting amounts related to certain contracts.
Mirant North America
| Years Ended December 31, | ||||||||||||||||
| 2009 | 2008 | 2007 | 2006 | 2005 | ||||||||||||
| (in millions) | ||||||||||||||||
| Statements of Operations Data: |
||||||||||||||||
| Operating revenues |
$ | 2,309 | $ | 3,188 | $ | 2,041 | $ | 3,257 | $ | 2,941 | ||||||
| Income (loss) from continuing operations |
597 | 1,337 | 82 | 1,345 | (755 | ) | ||||||||||
| Income (loss) from discontinued operations |
— | — | 8 | 3 | (9 | ) | ||||||||||
| Net income (loss) |
$ | 597 | $ | 1,337 | $ | 90 | $ | 1,348 | $ | (779 | ) | |||||
Our Statement of Operations Data for each year reflects the volatility caused by unrealized gains and losses related to derivative financial instruments used to hedge economically electricity and fuel. Changes in the fair value and settlements of derivative financial instruments used to hedge economically electricity are reflected in operating revenue and changes in the fair value and settlements of derivative financial instruments used to hedge economically fuel are reflected in cost of fuel, electricity and other products in the accompanying consolidated statements of operations. Changes in the fair value and settlements of derivative financial instruments for proprietary trading and fuel oil management activities are recorded on a net basis as operating revenue in the accompanying consolidated statements of operations. See Note 2 to our consolidated financial statements contained elsewhere in this report for additional information.
| Years Ended December 31, | ||||||||||||||||||
| 2009 | 2008 | 2007 | 2006 | 2005 | ||||||||||||||
| (in millions) | ||||||||||||||||||
| Unrealized gains (losses) included in operating revenues |
$ | (2 | ) | $ | 840 | $ | (652 | ) | $ | 711 | $ | (94 | ) | |||||
| Unrealized losses (gains) included in cost of fuel, electricity and other products |
(49 | ) | 54 | (28 | ) | 102 | (71 | ) | ||||||||||
| Total |
$ | 47 | $ | 786 | $ | (624 | ) | $ | 609 | $ | (23 | ) | ||||||
For the year ended December 31, 2009, income from continuing operations reflects impairment losses of $221 million related to our Potomac River generating facility and intangible assets related to our Potrero and Contra Costa generating facilities. For the year ended December 31, 2007, income from continuing operations reflects an impairment loss of $175 million related to our Lovett generating facility. See Note 3 to our
48
Table of Contents
consolidated financial statements contained elsewhere in this report for further information on these impairments. For the year ended December 31, 2006, income from continuing operations reflects an impairment loss of $118 million related to suspended construction at our Bowline generating facility and a $244 million gain from a New York property tax settlement.
Our Statement of Operations Data for the year ended December 31, 2005, reflects the effects of accounting for the Plan confirmed on December 9, 2005. During our bankruptcy proceedings, our consolidated financial statements were prepared in accordance with the accounting guidance for financial reporting by entities in reorganization under the bankruptcy code.
The consolidated Balance Sheet Data as of December 31, 2006 and 2005 segregates pre-petition liabilities subject to compromise from those liabilities that were not subject to compromise.
| At December 31, | |||||||||||||||
| 2009 | 2008 | 2007 | 2006 | 2005 | |||||||||||
| (in millions) | |||||||||||||||
| Balance Sheet Data: |
|||||||||||||||
| Total assets |
$ | 7,610 | $ | 8,645 | $ | 6,023 | $ | 7,292 | $ | 8,512 | |||||
| Total long-term debt |
1,248 | 1,293 | 1,435 | 1,576 | 886 | ||||||||||
| Liabilities subject to compromise |
— | — | — | 58 | 58 | ||||||||||
| Member’s equity |
$ | 4,329 | $ | 3,883 | $ | 2,928 | $ | 3,464 | $ | 4,293 | |||||
In 2005, we recorded the effects of the Plan. As a result, liabilities subject to compromise at December 31, 2005 and 2006, only reflect the liabilities of our New York entities that remained in bankruptcy at that time. Total assets for all periods reflect our election in 2008 to discontinue the net presentation of assets subject to master netting agreements upon adoption of the accounting guidance for offsetting amounts related to certain contracts.
Mirant Mid-Atlantic
| Years Ended December 31, | |||||||||||||||
| 2009 | 2008 | 2007 | 2006 | 2005 | |||||||||||
| (in millions) | |||||||||||||||
| Statements of Operations Data: |
|||||||||||||||
| Operating revenues |
$ | 1,778 | $ | 2,279 | $ | 1,133 | $ | 1,901 | $ | 1,197 | |||||
| Net income |
$ | 344 | $ | 1,217 | $ | 169 | $ | 922 | $ | 7 | |||||
Our Statement of Operations Data for each year reflects the volatility caused by unrealized gains and losses related to derivative financial instruments used to hedge economically electricity and fuel. Changes in the fair value and settlements of derivative financial instruments used to hedge economically electricity are reflected in operating revenue and changes in the fair value and settlements of derivative financial instruments used to hedge economically fuel are reflected in cost of fuel, electricity and other products in the accompanying consolidated statements of operations. See Note 2 to our consolidated financial statements contained elsewhere in this report for additional information.
| Years Ended December 31, | ||||||||||||||||||
| 2009 | 2008 | 2007 | 2006 | 2005 | ||||||||||||||
| (in millions) | ||||||||||||||||||
| Unrealized gains (losses) included in operating revenues |
$ | 136 | $ | 685 | $ | (474 | ) | $ | 519 | $ | (148 | ) | ||||||
| Unrealized losses (gains) included in cost of fuel, electricity and other products |
(8 | ) | 9 | 5 | 35 | (51 | ) | |||||||||||
| Total |
$ | 144 | $ | 676 | $ | (479 | ) | $ | 484 | $ | (97 | ) | ||||||
49
Table of Contents
For the year ended December 31, 2009, income from continuing operations reflects impairment losses of $385 million related to our Potomac River generating facility and goodwill recorded at the Mirant Mid-Atlantic registrant on its standalone balance sheet. The goodwill does not exist at Mirant Americas Generation’s and Mirant North America’s consolidated balance sheets. As such, the goodwill impairment loss and related goodwill balance are eliminated upon consolidation at Mirant North America. See Note 3 to our consolidated financial statements contained elsewhere in this report for further information on these impairments.
Our Statement of Operations Data for the year ended December 31, 2005, reflects the effects of accounting for the Plan confirmed on December 9, 2005. During our bankruptcy proceedings, our consolidated financial statements were prepared in accordance with the accounting guidance for financial reporting by entities in reorganization under the bankruptcy code.
| At December 31, | |||||||||||||||
| 2009 | 2008 | 2007 | 2006 | 2005 | |||||||||||
| (in millions) | |||||||||||||||
| Balance Sheet Data: |
|||||||||||||||
| Total assets |
$ | 5,807 | $ | 5,620 | $ | 4,008 | $ | 3,947 | $ | 3,838 | |||||
| Total long-term debt |
25 | 28 | 30 | 34 | 36 | ||||||||||
| Member’s equity |
$ | 4,886 | $ | 4,583 | $ | 3,407 | $ | 3,292 | $ | 3,062 | |||||
Total assets for all periods reflect our election in 2008 to discontinue the net presentation of assets subject to master netting agreements upon adoption of the accounting guidance for offsetting amounts related to certain contracts.
50
Table of Contents
| Item 7. | Management’s Discussion and Analysis of Results of Operations and Financial Condition |
This section is intended to provide the reader with information that will assist in understanding Mirant Americas Generation’s financial statements, the changes in those financial statements from year to year and the primary factors contributing to those changes. The following discussion should be read in conjunction with Mirant Americas Generation’s consolidated financial statements and the notes accompanying those financial statements.
Overview
Mirant Americas Generation, an indirect wholly-owned subsidiary of Mirant, is a competitive energy company that produces and sells electricity in the United States. Mirant Americas Generation owns or leases 10,076 MW of net electric generating capacity in the Mid-Atlantic and Northeast regions and in California. Mirant Americas Generation also operates an integrated asset management and energy marketing organization based in Atlanta, Georgia.
Hedging Activities
We hedge economically a substantial portion of our Mid-Atlantic coal-fired baseload generation and certain of our Mid-Atlantic and Northeast gas and oil-fired generation through OTC transactions. However, we generally do not hedge our intermediate and peaking units for tenors greater than 12 months. A significant portion of our hedges are financial swap transactions between Mirant Mid-Atlantic and financial counterparties that are senior unsecured obligations of such parties and do not require either party to post cash collateral either for initial margin or for securing exposure as a result of changes in power or natural gas prices. At February 9, 2010, our aggregate hedge levels based on expected generation for each period were as follows:
| Aggregate Hedge Levels Based on Expected Generation | |||||||||||||||
| 2010 | 2011 | 2012 | 2013 | 2014 | |||||||||||
| Power |
92 | % | 58 | % | 57 | % | 34 | % | 29 | % | |||||
| Fuel |
72 | % | 65 | % | 34 | % | 9 | % | — | % | |||||
Legislation has been proposed in Congress to increase the regulation of transactions involving OTC derivatives. The proposed legislation provides that standardized swap transactions between dealers and large market participants would have to be cleared and must be traded on an exchange or electronic platform. Although the proposed legislation provides exclusions from the clearing and certain other requirements for market participants, such as Mirant Americas Generation, which utilize OTC derivatives to hedge commercial risks, such exclusions are the focus of debate and may not ultimately be part of any final legislation. Greater regulation of OTC derivatives could materially affect our ability to hedge economically our generation by reducing liquidity in the energy and commodity markets and, if we are required to clear such transactions on exchanges, by significantly increasing the collateral costs associated with such activities.
Capital Expenditures and Capital Resources
For the year ended December 31, 2009, we invested $598 million for capital expenditures, excluding capitalized interest, of which $408 million related to compliance with the Maryland Healthy Air Act. As of December 31, 2009, we have invested approximately $1.405 billion for capital expenditures related to compliance with the Maryland Healthy Air Act. We completed the installation of the remaining pollution control equipment related to compliance with the Maryland Healthy Air Act in the fourth quarter of 2009. However, provisions in our construction contracts provide that certain payments be made after final completion of the project. Including amounts already invested to date, we expect to invest total capital expenditures of $1.674 billion to comply with the Maryland Healthy Air Act.
51
Table of Contents
For the year ended December 31, 2009, our capitalized interest was approximately $72 million. We expect to recognize higher interest expense in the future because our capitalized interest will be reduced significantly as a result of our completion of the installation of the pollution equipment to comply with the Maryland Healthy Air Act.
The following table details the expected timing of payments for our estimated capital expenditures, excluding capitalized interest, for 2010 and 2011 (in millions):
| 2010 | 2011 | |||||
| Maryland Healthy Air Act |
$ | 269 | $ | — | ||
| Other environmental |
22 | 28 | ||||
| Maintenance |
104 | 49 | ||||
| Other construction |
21 | 42 | ||||
| Other |
7 | 2 | ||||
| Total |
$ | 423 | $ | 121 | ||
We expect that available cash, proceeds from redemption of preferred shares in Mirant Americas and future cash flows from operations will be sufficient to fund these capital expenditures.
Scrubber Operating Expenses
Our capital expenditures related to compliance with the Maryland Healthy Air Act include the installation of scrubbers in the fourth quarter of 2009 at our Chalk Point, Dickerson and Morgantown coal-fired units. We expect to recognize additional variable costs associated with operating the scrubbers. Examples of these costs include limestone, water and chemicals used during the removal of SO2 emissions, and also include handling and marketing related to the recyclable gypsum byproduct created during the scrubbing process. The gypsum is sold to third parties for use in drywall production. In addition, we will recognize approximately $60 million of higher annual depreciation expense because the scrubbers were placed in service in December 2009, and we began depreciating the capitalized costs associated with them over the shorter of their expected life or the remaining lease term for the leased Dickerson and Morgantown generating units.
Commodity Prices
The prices for power, coal and natural gas declined significantly during 2009 to average levels lower than during 2008. The energy gross margin from our baseload coal units was negatively affected by these price declines. The decrease in the price of natural gas contributed to a decrease in power prices, because natural gas-fired generation often sets prices in the markets in which we operate, and at times made it uneconomic for certain of our baseload coal-fired units to generate. However, we are generally economically neutral for that portion of the generation volumes that we have hedged because our realized gross margin will reflect the contractual prices of our power and fuel contracts. We continue to add hedges opportunistically, including to maintain a projected level of cash flows from operations for future periods that supports continued compliance with the covenants in Mirant North America’s debt and Mirant Mid-Atlantic’s lease agreements.
Granted Emissions Allowances
As a result of the capital expenditures we are incurring to comply with the requirements of the Maryland Healthy Air Act, we expect to have excess SO2 and NOx emissions allowances in future periods. We plan to continue to maintain some SO2 and NOx emissions allowances above those needed for our current expected generation in case our actual generation exceeds our current forecasts for future periods and for possible future additions of generating capacity. At December 31, 2009, the estimated fair value of our anticipated excess SO2 and NOx emissions allowances was approximately $29 million.
52
Table of Contents
Contra Costa Toll Extension
On September 2, 2009, Mirant Delta entered into a new agreement with PG&E for the 674 MW at Contra Costa units 6 and 7 for the period from November 2011 through April 2013. At the end of the agreement, and subject to any necessary regulatory approval, Mirant Delta has agreed to retire Contra Costa units 6 and 7, which began operations in 1964, in furtherance of state and federal policies to retire aging power plants that utilize once-through cooling technology. The new Mirant Delta agreement is subject to approval by the CPUC.
Results of Operations
The following discussion of our performance is organized by reportable segment, which is consistent with the way we manage our business.
In the tables below, the Mid-Atlantic region includes our Chalk Point, Dickerson, Morgantown and Potomac River generating facilities. The Northeast region includes our Bowline, Canal, Kendall and Martha’s Vineyard generating facilities. For the years ended December 31, 2008 and 2007, the Northeast region also included the Lovett generating facility, which was shut down on April 19, 2008. The California region includes our Contra Costa, Pittsburg and Potrero generating facilities. Other Operations includes proprietary trading and fuel oil management activities. Other Operations also includes interest expense on debt at Mirant Americas Generation and Mirant North America and interest income on our invested cash balances.
53
Table of Contents
Year Ended December 31, 2009 versus Year Ended December 31, 2008
Consolidated Financial Performance
We reported net income of $476 million and $1.198 billion for the years ended December 31, 2009 and 2008, respectively. The change in net income is detailed as follows (in millions):
| Years Ended December 31, | Increase/ (Decrease) |
|||||||||||
| 2009 | 2008 | |||||||||||
| Realized gross margin |
$ | 1,552 | $ | 1,343 | $ | 209 | ||||||
| Unrealized gross margin |
47 | 786 | (739 | ) | ||||||||
| Total gross margin |
1,599 | 2,129 | (530 | ) | ||||||||
| Operating Expenses: |
||||||||||||
| Operations and maintenance—nonaffiliate |
355 | 372 | (17 | ) | ||||||||
| Operations and maintenance—affiliate |
290 | 285 | 5 | |||||||||
| Depreciation and amortization |
142 | 136 | 6 | |||||||||
| Impairment losses |
221 | — | 221 | |||||||||
| Gain on sales of assets, net |
(22 | ) | (38 | ) | 16 | |||||||
| Total operating expenses, net |
986 | 755 | 231 | |||||||||
| Operating income |
613 | 1,374 | (761 | ) | ||||||||
| Total other expense, net |
137 | 176 | (39 | ) | ||||||||
| Net income |
$ | 476 | $ | 1,198 | $ | (722 | ) | |||||
The following discussion includes non-GAAP financial measures because we present our consolidated financial performance in terms of gross margin. Gross margin is our operating revenue less cost of fuel, electricity and other products, and excludes depreciation and amortization. We present gross margin, excluding depreciation and amortization, and realized gross margin separately from unrealized gross margin in order to be consistent with how we manage our business. Realized gross margin and unrealized gross margin are both non-GAAP financial measures. Realized gross margin represents our gross margin less unrealized gains and losses on derivative financial instruments for the periods presented. Conversely, unrealized gross margin is our unrealized gains and losses on derivative financial instruments for the periods presented. Management generally evaluates our operating results excluding the impact of unrealized gains and losses. None of our derivative financial instruments recorded at fair value is designated as a hedge and changes in their fair values are recognized currently in income as unrealized gains or losses. As a result, our financial results are, at times, volatile and subject to fluctuations in value primarily because of changes in forward electricity and fuel prices. Adjusting our gross margin to exclude unrealized gains and losses provides a measure of performance that eliminates the volatility created by significant shifts in market values between periods. However, our realized and unrealized gross margin may not be comparable to similarly titled non-GAAP financial measures used by other companies. We encourage our investors to review our consolidated financial statements and other publicly filed reports in their entirety and not to rely on a single financial measure.
For the year ended December 31, 2009, our realized gross margin increase of $209 million was principally a result of the following:
| — | an increase of $422 million in realized value of hedges. In 2009, realized value of hedges was $629 million, which reflects the amount by which the settlement value of power contracts exceeded market prices for power, partially offset by the amount by which contract prices for fuel exceeded market prices for fuel. In 2008, realized value of hedges was $207 million, which reflects the amount by which market prices for fuel exceeded contract prices for fuel, partially offset by the amount by which market prices for power exceeded the settlement value of power contracts; and |
54
Table of Contents
| — | an increase of $13 million in contracted and capacity primarily related to higher capacity prices in 2009; partially offset by |
| — | a decrease of $226 million in energy, primarily as a result of a decrease in power prices, an increase in the cost of emissions allowances, including $45 million to comply with the RGGI in 2009, and lower generation volumes. The lower generation volumes were a result of lower demand and decreases in natural gas prices, which at times made it uneconomic for certain of our coal-fired units to generate. The decreases in energy gross margin were partially offset by a decrease in the price of fuel. |
Our unrealized gross margin for both periods reflects the following:
| — | unrealized gains of $47 million in 2009, which included a $686 million net increase in the value of hedge and trading contracts for future periods primarily related to decreases in forward power and natural gas prices, partially offset by unrealized losses of $639 million from power and fuel contracts that settled during the period for which net unrealized gains had been recorded in prior periods; and |
| — | unrealized gains of $786 million in 2008, which included a $460 million net increase in the value of hedge contracts for future periods primarily related to decreases in forward power and natural gas prices and unrealized gains of $326 million from power and fuel contracts that settled during the period for which net unrealized losses had been recorded in prior periods. |
Operating Expense
Our operating expense increase of $231 million was primarily a result of the following:
| — | an increase of $221 million of impairment losses related to our Potomac River generating facility and intangible assets related to our Potrero and Contra Costa generating facilities during 2009. See Note 3 to our consolidated financial statements contained elsewhere in this report for additional information related to our impairments; and |
| — | a decrease of $16 million in gain on sales of assets, net in 2009; partially offset by |
| — | a decrease of $12 million in operations and maintenance expense. The decrease in operations and maintenance expense was primarily a result of the shutdown of the Lovett generating facility in April 2008 and a decrease in maintenance costs associated with planned outages at our Mid-Atlantic generating facilities during 2009 compared to 2008. |
Other Expense, Net
Other expense, net decreased $39 million for the year ended December 31, 2009, and reflects lower interest expense as a result of lower outstanding debt and higher interest capitalized on projects under construction, partially offset by lower interest income as a result of lower interest rates on invested cash and lower average cash balances in 2009 compared to the same period in 2008.
55
Table of Contents
Gross Margin Overview
The following tables detail realized and unrealized gross margin for the years ended December 31, 2009 and 2008, by operating segments (in millions):
| Year Ended December 31, 2009 | |||||||||||||||||||||
| Mid- Atlantic |
Northeast | California | Other Operations |
Eliminations | Total | ||||||||||||||||
| Energy |
$ | 170 | $ | 23 | $ | — | $ | 167 | $ | (3 | ) | $ | 357 | ||||||||
| Contracted and capacity |
351 | 93 | 122 | — | — | 566 | |||||||||||||||
| Realized value of hedges |
586 | 43 | — | — | — | 629 | |||||||||||||||
| Total realized gross margin |
1,107 | 159 | 122 | 167 | (3 | ) | 1,552 | ||||||||||||||
| Unrealized gross margin |
144 | 16 | — | (113 | ) | — | 47 | ||||||||||||||
| Total gross margin |
$ | 1,251 | $ | 175 | $ | 122 | $ | 54 | $ | (3 | ) | $ | 1,599 | ||||||||
| Year Ended December 31, 2008 | |||||||||||||||||||||
| Mid- Atlantic |
Northeast | California | Other Operations |
Eliminations | Total | ||||||||||||||||
| Energy |
$ | 517 | $ | 73 | $ | 4 | $ | (17 | ) | $ | 6 | $ | 583 | ||||||||
| Contracted and capacity |
340 | 90 | 123 | — | — | 553 | |||||||||||||||
| Realized value of hedges |
181 | 26 | — | — | — | 207 | |||||||||||||||
| Total realized gross margin |
1,038 | 189 | 127 | (17 | ) | 6 | 1,343 | ||||||||||||||
| Unrealized gross margin |
676 | (10 | ) | — | 120 | — | 786 | ||||||||||||||
| Total gross margin |
$ | 1,714 | $ | 179 | $ | 127 | $ | 103 | $ | 6 | $ | 2,129 | |||||||||
Energy represents gross margin from the generation of electricity, fuel sales and purchases at market prices, fuel handling, steam sales and our proprietary trading and fuel oil management activities.
Contracted and capacity represents gross margin received from capacity sold in ISO and RTO administered capacity markets, through RMR contracts, through tolling agreements and from ancillary services.
Realized value of hedges represents the actual margin upon the settlement of our power and fuel hedging contracts and the difference between market prices and contract costs for coal that we purchased under long-term agreements. Power hedging contracts include sales of both power and natural gas used to hedge power prices as well as hedges to capture the incremental value related to the geographic location of our physical assets.
Unrealized gross margin represents the net unrealized gain or loss on our derivative contracts, including the reversal of unrealized gains and losses recognized in prior periods and changes in value for future periods.
Operating Statistics
The following table summarizes Net Capacity Factor by region for the years ended December 31, 2009 and 2008:
| Years Ended December 31, | Increase/ (Decrease) |
||||||||
| 2009 | 2008 | ||||||||
| Mid-Atlantic |
30 | % | 33 | % | (3 | )% | |||
| Northeast |
10 | % | 13 | % | (3 | )% | |||
| California |
5 | % | 4 | % | 1 | % | |||
| Total |
19 | % | 21 | % | (2 | )% | |||
56
Table of Contents
The following table summarizes power generation volumes by region for the years ended December 31, 2009 and 2008 (in gigawatt hours):
| Years Ended December 31, |
Increase/ (Decrease) |
Increase/ (Decrease) |
||||||||
| 2009 | 2008 | |||||||||
| Mid-Atlantic: |
||||||||||
| Baseload |
13,500 | 14,350 | (850 | ) | (6 | )% | ||||
| Intermediate |
363 | 489 | (126 | ) | (26 | )% | ||||
| Peaking |
92 | 160 | (68 | ) | (43 | )% | ||||
| Total Mid-Atlantic |
13,955 | 14,999 | (1,044 | ) | (7 | )% | ||||
| Northeast: |
||||||||||
| Baseload |
1,425 | 1,131 | 294 | 26 | % | |||||
| Intermediate |
673 | 1,919 | (1,246 | ) | (65 | )% | ||||
| Peaking |
3 | 5 | (2 | ) | (40 | )% | ||||
| Total Northeast |
2,101 | 3,055 | (954 | ) | (31 | )% | ||||
| California: |
||||||||||
| Intermediate |
1,050 | 868 | 182 | 21 | % | |||||
| Peaking |
4 | 21 | (17 | ) | (81 | )% | ||||
| Total California |
1,054 | 889 | 165 | 19 | % | |||||
| Total |
17,110 | 18,943 | (1,833 | ) | (10 | )% | ||||
The total decrease in power generation volumes for the year ended December 31, 2009, as compared to the year ended December 31, 2008, is primarily the result of the following:
Mid-Atlantic. A decrease in our Mid-Atlantic baseload generation as a result of a decrease in demand in 2009 compared to 2008 and a decrease in natural gas prices, which at times made it uneconomic for certain of our coal-fired units to generate.
Northeast. A decrease in our Northeast intermediate generation as a result of transmission upgrades in 2009, which reduced the demand for certain of our intermediate units, partially offset by an increase in our Northeast baseload generation as a result of an increase in market spark spreads.
California. All of our California generating facilities operate under tolling agreements or are subject to RMR arrangements. Our natural gas-fired units in service at Contra Costa and Pittsburg operate under tolling agreements with PG&E for 100% of the capacity from these units and our Potrero units are subject to RMR arrangements. Therefore, changes in power generation volumes from those generating facilities, which can be caused by weather, planned outages or other factors, generally do not affect our gross margin.
57
Table of Contents
Mid-Atlantic
Our Mid-Atlantic segment includes four generating facilities with total net generating capacity of 5,194 MW.
The following table summarizes the results of operations of our Mid-Atlantic segment (in millions):
| Years Ended December 31, | Increase/ (Decrease) |
|||||||||||
| 2009 | 2008 | |||||||||||
| Gross Margin: |
||||||||||||
| Energy |
$ | 170 | $ | 517 | $ | (347 | ) | |||||
| Contracted and capacity |
351 | 340 | 11 | |||||||||
| Realized value of hedges |
586 | 181 | 405 | |||||||||
| Total realized gross margin |
1,107 | 1,038 | 69 | |||||||||
| Unrealized gross margin |
144 | 676 | (532 | ) | ||||||||
| Total gross margin |
1,251 | 1,714 | (463 | ) | ||||||||
| Operating Expenses: |
||||||||||||
| Operations and maintenance |
434 | 412 | 22 | |||||||||
| Depreciation and amortization |
98 | 92 | 6 | |||||||||
| Impairment losses |
385 | — | 385 | |||||||||
| Gain on sales of assets, net |
(14 | ) | (8 | ) | (6 | ) | ||||||
| Total operating expenses, net |
903 | 496 | 407 | |||||||||
| Operating income |
348 | 1,218 | (870 | ) | ||||||||
| Total other expense, net |
4 | 1 | 3 | |||||||||
| Net income |
$ | 344 | $ | 1,217 | $ | (873 | ) | |||||
Gross Margin
The increase of $69 million in realized gross margin was principally a result of the following:
| — | an increase of $405 million in realized value of hedges. In 2009, realized value of hedges was $586 million, which reflects the amount by which the settlement value of power contracts exceeded market prices for power, partially offset by the amount by which contract prices for coal that we purchased under long-term agreements exceeded market prices for coal. In 2008, realized value of hedges was $181 million, which reflects the amount by which market prices for coal exceeded contract prices for coal that we purchased under long-term agreements, partially offset by the amount by which market prices for power exceeded the settlement value of power contracts; and |
| — | an increase of $11 million in contracted and capacity primarily related to higher capacity prices in 2009; partially offset by |
| — | a decrease of $347 million in energy, primarily as a result of a decrease in power prices, an increase in the cost of emissions allowances, including $41 million to comply with the RGGI in 2009, and lower generation volumes. The lower generation volumes were a result of lower demand and decreases in natural gas prices, which at times made it uneconomic for certain of our coal-fired units to generate. These decreases were partially offset by a decrease in the price of coal. |
Our unrealized gross margin for both periods reflects the following:
| — | unrealized gains of $144 million in 2009, which included a $633 million net increase in the value of hedge contracts for future periods primarily related to decreases in forward power and natural gas prices, partially offset by unrealized losses of $489 million from power and fuel contracts that settled during the period for which net unrealized gains had been recorded in prior periods; and |
58
Table of Contents
| — | unrealized gains of $676 million in 2008, which included a $399 million net increase in the value of hedge contracts for future periods primarily related to decreases in forward power and natural gas prices and unrealized gains of $277 million from power and fuel contracts that settled during the period for which net unrealized losses had been recorded in prior periods. |
Operating Expenses
The increase of $407 million in operating expenses was primarily a result of the following:
| — | an increase of $385 million in impairment losses recognized in the fourth quarter of 2009, including $202 million related to our Potomac River generating facility and $183 million related to goodwill recorded at the Mirant Mid-Atlantic registrant on its standalone balance sheet . The goodwill does not exist at Mirant Americas Generation’s and Mirant North America’s consolidated balance sheets. As such, the goodwill impairment loss and related goodwill balance are eliminated upon consolidation at Mirant North America. See Note 3 to our consolidated financial statements contained elsewhere in this report for additional information related to our impairment of the Potomac River generating facility and Mirant Mid-Atlantic’s impairment of its goodwill; |
| — | an increase of $22 million in operations and maintenance expense primarily as a result of higher labor costs related to increased staffing levels in preparation for the operation of our scrubbers and an increase in Maryland property taxes, offset in part by a decrease in maintenance costs associated with a decrease in planned outages; and |
| — | an increase of $6 million in depreciation and amortization expense primarily related to pollution control equipment for NOx emissions that was placed in service in 2008 as part of our compliance with the Maryland Healthy Air Act; partially offset by |
| — | an increase of $6 million in gain on sales of assets primarily related to emissions allowances sold to third parties. |
Northeast
Our Northeast segment is comprised of our three generating facilities located in Massachusetts and one generating facility located in New York with total net generating capacity of 2,535 MW.
The following table summarizes the results of operations of our Northeast segment (in millions):
| Years Ended December 31, | Increase/ (Decrease) |
|||||||||||
| 2009 | 2008 | |||||||||||
| Gross Margin: |
||||||||||||
| Energy |
$ | 23 | $ | 73 | $ | (50 | ) | |||||
| Contracted and capacity |
93 | 90 | 3 | |||||||||
| Realized value of hedges |
43 | 26 | 17 | |||||||||
| Total realized gross margin |
159 | 189 | (30 | ) | ||||||||
| Unrealized gross margin |
16 | (10 | ) | 26 | ||||||||
| Total gross margin |
175 | 179 | (4 | ) | ||||||||
| Operating Expenses: |
||||||||||||
| Operations and maintenance |
126 | 167 | (41 | ) | ||||||||
| Depreciation and amortization |
18 | 19 | (1 | ) | ||||||||
| Gain on sales of assets, net |
(4 | ) | (30 | ) | 26 | |||||||
| Total operating expenses, net |
140 | 156 | (16 | ) | ||||||||
| Operating income |
35 | 23 | 12 | |||||||||
| Total other income, net |
— | (1 | ) | 1 | ||||||||
| Net income |
$ | 35 | $ | 24 | $ | 11 | ||||||
59
Table of Contents
Gross Margin
The decrease of $30 million in realized gross margin was principally a result of the following:
| — | a decrease of $50 million in energy, primarily as a result of a 31% decrease in generation volumes because of transmission upgrades which reduced the need for the Canal generating facility to operate, a decrease in power prices, an increase in the cost of emissions allowances, including $4 million to comply with the RGGI in 2009 and the shutdown of the Lovett generating facility in 2008 offset in part by lower fuel costs; partially offset by |
| — | an increase of $17 million in realized value of hedges. In 2009, realized value of hedges was $43 million, which reflects the amount by which the settlement value of power contracts exceeded market prices for power, partially offset by the amount by which contract prices for fuel exceeded market prices for fuel. In 2008, realized value of hedges was $26 million, which reflects the amount by which market prices for fuel exceeded contract prices for fuel and the amount by which the settlement value of power contracts exceeded market prices for power. |
Our unrealized gross margin for both periods reflects the following:
| — | unrealized gains of $16 million in 2009, which included a $65 million net increase in the value of hedge contracts for future periods primarily related to decreases in forward power and fuel prices, partially offset by unrealized losses of $49 million from power and fuel contracts that settled during the period for which net unrealized gains had been recorded in prior periods; and |
| — | unrealized losses of $10 million in 2008, which included unrealized losses of $6 million from power and fuel contracts that settled during the period for which net unrealized gains had been recorded in prior periods and a $4 million net decrease in the value of hedge contracts for future periods primarily related to increases in forward power and fuel prices. |
Operating Expenses
The decrease of $16 million in operating expenses included a decrease of $41 million in operations and maintenance expense primarily related to the shutdown of the Lovett generating facility in April 2008 and lower maintenance expense as a result of planned outages at the Canal generating facility in 2008, partially offset by a decrease of $26 million in gain on sales of assets primarily related to emissions allowances sold to third parties.
60
Table of Contents
California
Our California segment consists of the Contra Costa, Pittsburg and Potrero generating facilities with total net generating capacity of 2,347 MW.
The following table summarizes the results of operations of our California segment (in millions):
| Years Ended December 31, | Increase/ (Decrease) |
||||||||||
| 2009 | 2008 | ||||||||||
| Gross Margin: |
|||||||||||
| Energy |
$ | — | $ | 4 | $ | (4 | ) | ||||
| Contracted and capacity |
122 | 123 | (1 | ) | |||||||
| Total realized gross margin |
122 | 127 | (5 | ) | |||||||
| Unrealized gross margin |
— | — | — | ||||||||
| Total gross margin |
122 | 127 | (5 | ) | |||||||
| Operating Expenses: |
|||||||||||
| Operations and maintenance |
74 | 68 | 6 | ||||||||
| Depreciation and amortization |
22 | 23 | (1 | ) | |||||||
| Impairment losses |
14 | — | 14 | ||||||||
| Gain on sales of assets, net |
— | (7 | ) | 7 | |||||||
| Total operating expenses, net |
110 | 84 | 26 | ||||||||
| Operating income |
12 | 43 | (31 | ) | |||||||
| Total other expense, net |
2 | 1 | 1 | ||||||||
| Net income |
$ | 10 | $ | 42 | $ | (32 | ) | ||||
Operating Expenses
The increase of $26 million in operating expenses was principally a result of the following:
| — | an impairment loss of $14 million on intangible assets related to our Potrero and Contra Costa generating facilities during 2009. See Note 3 to our consolidated financial statements contained elsewhere in this report for additional information related to our impairment reviews; and |
| — | a decrease of $7 million in gain on sales of assets primarily related to emissions allowances sold to third parties. |
61
Table of Contents
Other Operations
Other Operations includes proprietary trading and fuel oil management activities, interest expense on debt at Mirant Americas Generation and Mirant North America and interest income on our invested cash balances.
The following table summarizes the results of operations of our Other Operations segment (in millions):
| Years Ended December 31, | Increase/ (Decrease) |
|||||||||||
| 2009 | 2008 | |||||||||||
| Gross Margin: |
||||||||||||
| Energy |
$ | 167 | $ | (17 | ) | $ | 184 | |||||
| Total realized gross margin |
167 | (17 | ) | 184 | ||||||||
| Unrealized gross margin |
(113 | ) | 120 | (233 | ) | |||||||
| Total gross margin |
54 | 103 | (49 | ) | ||||||||
| Operating Expenses: |
||||||||||||
| Operations and maintenance |
11 | 10 | 1 | |||||||||
| Depreciation and amortization |
4 | 2 | 2 | |||||||||
| Impairment losses |
5 | — | 5 | |||||||||
| Gain on sales of assets, net |
— | (1 | ) | 1 | ||||||||
| Total operating expenses, net |
20 | 11 | 9 | |||||||||
| Operating income |
34 | 92 | (58 | ) | ||||||||
| Total other expense, net |
131 | 175 | (44 | ) | ||||||||
| Net loss |
$ | (97 | ) | $ | (83 | ) | $ | (14 | ) | |||
Gross Margin
The increase of $184 million in realized gross margin was a result of a $112 million increase in gross margin from our fuel oil management activities and a $72 million increase in gross margin from proprietary trading activities. The increase in gross margin from our fuel oil management activities includes a $25 million gain from the sale of excess fuel oil in 2009 and a $37 million lower of cost or market fuel oil inventory adjustment recognized in the fourth quarter of 2008. The increase in gross margin from proprietary trading activities was a result of higher realized value associated with power positions in 2009 as compared to 2008.
Our unrealized gross margin for both periods reflects the following:
| — | unrealized losses of $113 million in 2009, which included unrealized losses of $101 million from power and fuel contracts that settled during the period for which net unrealized gains had been recorded in prior periods and a $12 million net decrease in the value of contracts for future periods; and |
| — | unrealized gains of $120 million in 2008, which included a $65 million net increase in the value of contracts for future periods and unrealized gains of $55 million from power and fuel contracts that settled during the period for which net unrealized losses had been recorded in prior periods. |
Operating Expenses
The increase of $9 million in operating expenses was primarily the result of a $5 million increase in impairment losses recognized in the fourth quarter of 2009 for capitalized interest recorded at Mirant North America related to the Potomac River generating facility.
62
Table of Contents
Other Expense, Net
The decrease of $44 million in other expense, net was principally the result of the following:
| — | a decrease of $53 million in interest expense primarily as a result of lower outstanding debt and higher interest capitalized on projects under construction; partially offset by |
| — | a decrease of $12 million in interest income primarily related to lower interest rates on invested cash and lower average cash balances. |
63
Table of Contents
Year Ended December 31, 2008 versus Year Ended December 31, 2007
Consolidated Financial Performance
We reported net income of $1.198 billion for the year ended December 31, 2008, and a net loss of $60 million for the year ended December 31, 2007. The change in net income (loss) is detailed as follows (in millions):
| Years Ended December 31, | ||||||||||||
| 2008 | 2007 | Increase/ (Decrease) |
||||||||||
| Realized gross margin |
$ | 1,343 | $ | 1,626 | $ | (283 | ) | |||||
| Unrealized gross margin |
786 | (624 | ) | 1,410 | ||||||||
| Total gross margin |
2,129 | 1,002 | 1,127 | |||||||||
| Operating Expenses: |
||||||||||||
| Operations and maintenance—nonaffiliate |
372 | 353 | 19 | |||||||||
| Operations and maintenance—affiliate |
285 | 276 | 9 | |||||||||
| Depreciation and amortization |
136 | 120 | 16 | |||||||||
| Impairment losses |
— | 175 | (175 | ) | ||||||||
| Gain on sales of assets, net |
(38 | ) | (39 | ) | 1 | |||||||
| Total operating expenses, net |
755 | 885 | (130 | ) | ||||||||
| Operating income |
1,374 | 117 | 1,257 | |||||||||
| Total other expense, net |
||||||||||||
| Nonaffiliate |
176 | 186 | (10 | ) | ||||||||
| Affiliate |
— | 1 | (1 | ) | ||||||||
| Income (loss) from continuing operations before reorganization items, net |
1,198 | (70 | ) | 1,268 | ||||||||
| Reorganization items, net |
— | (2 | ) | 2 | ||||||||
| Income (loss) from continuing operations |
1,198 | (68 | ) | 1,266 | ||||||||
| Income from discontinued operations |
— | 8 | (8 | ) | ||||||||
| Net income (loss) |
$ | 1,198 | $ | (60 | ) | $ | 1,258 | |||||
The following discussion includes non-GAAP financial measures because we present our consolidated financial performance in terms of gross margin. Gross margin is our operating revenue less cost of fuel, electricity and other products, and excludes depreciation and amortization. We present gross margin, excluding depreciation and amortization, and realized gross margin separately from unrealized gross margin in order to be consistent with how we manage our business. Realized gross margin and unrealized gross margin are both non-GAAP financial measures. Realized gross margin represents our gross margin less unrealized gains and losses on derivative financial instruments for the periods presented. Conversely, unrealized gross margin is our unrealized gains and losses on derivative financial instruments for the periods presented. Management generally evaluates our operating results excluding the impact of unrealized gains and losses. None of our derivative financial instruments recorded at fair value is designated as a hedge and changes in their fair values are recognized currently in income as unrealized gains or losses. As a result, our financial results are, at times, volatile and subject to fluctuations in value primarily because of changes in forward electricity and fuel prices. Adjusting our gross margin to exclude unrealized gains and losses provides a measure of performance that eliminates the volatility created by significant shifts in market values between periods. However, our realized and unrealized gross margin may not be comparable to similarly titled non-GAAP financial measures used by other companies. We encourage our investors to review our consolidated financial statements and other publicly filed reports in their entirety and not to rely on a single financial measure.
64
Table of Contents
For the year ended December 31, 2008, our realized gross margin decrease of $283 million was principally a result of the following:
| — | a decrease in energy of $361 million as a result of an increase in fuel prices, lower generation volumes and a decrease in the contribution of proprietary trading and fuel oil management activities, partially offset by an increase in power prices and a decrease in the cost of emissions allowances; and |
| — | a decrease of $60 million in realized value of hedges. In 2008, realized value of hedges was $207 million, which reflects the amount by which market prices for fuel exceeded contract prices for fuel, partially offset by the amount by which market prices for power exceeded the settlement value of power contracts. In 2007, realized value of hedges was $267 million, which reflects the amount by which the settlement value of power contracts exceeded the market prices for power and the amount by which market prices for fuel exceeded contract prices for fuel; partially offset by |
| — | an increase of $138 million in contracted and capacity primarily related to a full year of PJM RPM capacity payments in 2008 in the Mid-Atlantic. |
Our unrealized gross margin for both periods reflects the following:
| — | unrealized gains of $786 million in 2008, which included a $460 million net increase in the value of hedge contracts for future periods primarily related to decreases in forward power and natural gas prices and unrealized gains of $326 million from power and fuel contracts that settled during the period for which net unrealized losses had been recorded in prior periods; and |
| — | unrealized losses of $624 million in 2007, which included unrealized losses of $442 million from power and fuel contracts that settled during the period for which net unrealized gains had been recorded in prior periods and a $182 million net decrease in the value of hedge contracts for future periods primarily related to increases in forward power and natural gas prices. |
Our operating expense decrease of $130 million was primarily a result of the following:
| — | a decrease of $175 million as a result of the impairment loss on our Lovett generating facility recognized in the second quarter of 2007. See Note 3 to our consolidated financial statements contained elsewhere in this report for additional information related to this impairment; partially offset by |
| — | an increase of $28 million in operations and maintenance which included a $29 million increase related to the timing of our planned outages, an increase in labor and chemical costs related to our pollution control equipment for NOx emissions that was placed in service in 2008 as part of our compliance with the Maryland Healthy Air Act, partially offset by a decrease of $12 million primarily as a result of the shutdown of the Lovett facility in 2008; and |
| — | an increase of $16 million in depreciation and amortization expense primarily related to pollution control equipment for NOx emissions placed in service as part of our compliance with the Maryland Healthy Air Act. |
Other expense, net decreased $11 million for the year ended December 31, 2008, and reflects lower interest expense as a result of lower outstanding debt and higher interest capitalized on projects under construction, partially offset by lower interest income primarily as a result of lower interest rates on invested cash in 2008 compared to the same period in 2007.
65
Table of Contents
Gross Margin Overview
The following tables detail realized and unrealized gross margin for the years ended December 31, 2008 and 2007, by operating segments (in millions):
| Year Ended December 31, 2008 | ||||||||||||||||||||
| Mid- Atlantic |
Northeast | California | Other Operations |
Eliminations | Total | |||||||||||||||
| Energy |
$ | 517 | $ | 73 | $ | 4 | $ | (17 | ) | $ | 6 | $ | 583 | |||||||
| Contracted and capacity |
340 | 90 | 123 | — | — | 553 | ||||||||||||||
| Realized value of hedges |
181 | 26 | — | — | — | 207 | ||||||||||||||
| Total realized gross margin |
1,038 | 189 | 127 | (17 | ) | 6 | 1,343 | |||||||||||||
| Unrealized gross margin |
676 | (10 | ) | — | 120 | — | 786 | |||||||||||||
| Total gross margin |
$ | 1,714 | $ | 179 | $ | 127 | $ | 103 | $ | 6 | $ | 2,129 | ||||||||
| Year Ended December 31, 2007 | ||||||||||||||||||||||
| Mid- Atlantic |
Northeast | California | Other Operations |
Eliminations | Total | |||||||||||||||||
| Energy |
$ | 686 | $ | 128 | $ | 3 | $ | 109 | $ | 18 | $ | 944 | ||||||||||
| Contracted and capacity |
196 | 87 | 132 | — | — | 415 | ||||||||||||||||
| Realized value of hedges |
202 | 65 | — | — | — | 267 | ||||||||||||||||
| Total realized gross margin |
1,084 | 280 | 135 | 109 | 18 | 1,626 | ||||||||||||||||
| Unrealized gross margin |
(479 | ) | (43 | ) | — | (102 | ) | — | (624 | ) | ||||||||||||
| Total gross margin |
$ | 605 | $ | 237 | $ | 135 | $ | 7 | $ | 18 | $ | 1,002 | ||||||||||
Energy represents gross margin from the generation of electricity, fuel sales and purchases at market prices, fuel handling, steam sales and our proprietary trading and fuel oil management activities.
Contracted and capacity represents gross margin received from capacity sold in ISO and RTO administered capacity markets, through RMR contracts, through tolling agreements and from ancillary services.
Realized value of hedges represents the actual margin upon the settlement of our power and fuel hedging contracts and the difference between market prices and contract costs for coal that we purchased under long-term agreements. Power hedging contracts include sales of both power and natural gas used to hedge power prices as well as hedges to capture the incremental value related to the geographic location of our physical assets.
Unrealized gross margin represents the net unrealized gain or loss on our derivative contracts, including the reversal of unrealized gains and losses recognized in prior periods and changes in value for future periods.
Operating Statistics
The following table summarizes Net Capacity Factor by region for the years ended December 31, 2008 and 2007:
| Years Ended December 31, | |||||||||
| 2008 | 2007 | Decrease | |||||||
| Mid-Atlantic |
33 | % | 37 | % | (4 | )% | |||
| Northeast |
13 | % | 22 | % | (9 | )% | |||
| California |
4 | % | 4 | % | — | % | |||
| Total |
21 | % | 25 | % | (4 | )% | |||
66
Table of Contents
The following table summarizes power generation volumes by region for the years ended December 31, 2008 and 2007 (in gigawatt hours):
| Years Ended December 31, |
Increase/ (Decrease) |
Increase/ (Decrease) |
||||||||
| 2008 | 2007 | |||||||||
| Mid-Atlantic: |
||||||||||
| Baseload |
14,350 | 15,390 | (1,040 | ) | (7 | )% | ||||
| Intermediate |
489 | 1,105 | (616 | ) | (56 | )% | ||||
| Peaking |
160 | 337 | (177 | ) | (53 | )% | ||||
| Total Mid-Atlantic |
14,999 | 16,832 | (1,833 | ) | (11 | )% | ||||
| Northeast: |
||||||||||
| Baseload |
1,131 | 2,691 | (1,560 | ) | (58 | )% | ||||
| Intermediate |
1,919 | 2,814 | (895 | ) | (32 | )% | ||||
| Peaking |
5 | 5 | — | — | % | |||||
| Total Northeast |
3,055 | 5,510 | (2,455 | ) | (45 | )% | ||||
| California: |
||||||||||
| Intermediate |
868 | 804 | 64 | 8 | % | |||||
| Peaking |
21 | 18 | 3 | 17 | % | |||||
| Total California |
889 | 822 | 67 | 8 | % | |||||
| Total |
18,943 | 23,164 | (4,221 | ) | (18 | )% | ||||
The total decrease in power generation volumes for the year ended December 31, 2008, as compared to the year ended December 31, 2007, is primarily the result of the following:
Mid-Atlantic. A decrease in Mid-Atlantic as a result of contracting dark spreads, lower demand and second quarter 2008 planned outages to allow for the installation of emissions control equipment as part of our compliance with the Maryland Healthy Air Act.
Northeast. A decrease in Northeast as a result of higher fuel prices at times making it uneconomic for certain units to generate, the shutdown of units 3 and 4 of the Lovett generating facility in April 2007 and the shutdown of unit 5 of the Lovett generating facility in April 2008.
California. All of our California generating facilities operate under tolling agreements or are subject to RMR arrangements. Our natural gas-fired units in service at Contra Costa and Pittsburg operate under tolling agreements with PG&E for 100% of the capacity from these units and our Potrero units are subject to RMR arrangements. Therefore, changes in power generation volumes from those generating facilities, which can be caused by weather, planned outages or other factors, generally do not affect our gross margin.
67
Table of Contents
Mid-Atlantic
Our Mid-Atlantic segment includes four generating facilities with total net generating capacity of 5,194 MW.
The following table summarizes the results of operations of our Mid-Atlantic segment (in millions):
| Years Ended December 31, | Increase/ (Decrease) |
|||||||||||
| 2008 | 2007 | |||||||||||
| Gross Margin: |
||||||||||||
| Energy |
$ | 517 | $ | 686 | $ | (169 | ) | |||||
| Contracted and capacity |
340 | 196 | 144 | |||||||||
| Realized value of hedges |
181 | 202 | (21 | ) | ||||||||
| Total realized gross margin |
1,038 | 1,084 | (46 | ) | ||||||||
| Unrealized gross margin |
676 | (479 | ) | 1,155 | ||||||||
| Total gross margin |
1,714 | 605 | 1,109 | |||||||||
| Operating Expenses: |
||||||||||||
| Operations and maintenance |
412 | 360 | 52 | |||||||||
| Depreciation and amortization |
92 | 81 | 11 | |||||||||
| Gain on sales of assets, net |
(8 | ) | — | (8 | ) | |||||||
| Total operating expenses, net |
496 | 441 | 55 | |||||||||
| Operating income |
1,218 | 164 | 1,054 | |||||||||
| Total other expense (income), net |
1 | (5 | ) | 6 | ||||||||
| Net Income |
$ | 1,217 | $ | 169 | $ | 1,048 | ||||||
Gross Margin
The decrease of $46 million in realized gross margin was principally a result of the following:
| — | a decrease of $169 million in energy, primarily as a result of a substantial increase in the price of coal, partially offset by an increase in power prices and a decrease in the cost of emissions allowances. The decrease in energy also included a $13 million lower of cost or market fuel oil inventory adjustment recognized in the fourth quarter of 2008. In addition, generation volumes decreased 11% as a result of contracting dark spreads, lower demand that resulted in less generation from our intermediate and peaking generating facilities and second quarter 2008 planned outages to allow for the installation of emissions control equipment as part of our compliance with the Maryland Healthy Air Act; |
| — | a decrease of $21 million in realized value of hedges. In 2008, realized value of hedges was $181 million, which reflects the amount by which market prices for coal exceeded contract prices for coal that we purchased under long-term agreements, partially offset by the amount by which market prices for power exceeded the settlement value of power contracts. In 2007, realized value of hedges was $202 million, which reflects the amount by which the settlement value of power contracts exceeded market prices for power and the amount by which market prices for coal exceeded the contract prices for coal that we purchased under long-term agreements; partially offset by |
| — | an increase of $144 million in contracted and capacity primarily related to higher capacity revenues for 2008 as a result of the commencement of the PJM RPM capacity market in June 2007. |
Our unrealized gross margin for both periods reflects the following:
| — | unrealized gains of $676 million in 2008, which included a $399 million net increase in the value of hedge contracts for future periods primarily related to decreases in forward power and natural gas prices and unrealized gains of $277 million from power and fuel contracts that settled during the period for which net unrealized losses had been recorded in prior periods; and |
68
Table of Contents
| — | unrealized losses of $479 million in 2007, which included unrealized losses of $270 million from power and fuel contracts that settled during the period for which net unrealized gains had been recorded in prior periods and a $209 million net decrease in the value of hedge contracts for future periods primarily related to increases in forward power prices. |
Operating Expenses
The increase of $55 million in operating expenses is primarily a result of the following:
| — | an increase of $52 million in operations and maintenance expense, which included: |
| — | an increase of $29 million related to the timing of our planned outages and an increase in labor and chemical costs related to our pollution control equipment for NOx emissions that was placed in service in 2008 as part of our compliance with the Maryland Healthy Air Act; and |
| — | $23 million in increased allocated corporate overhead costs. With the completion of several dispositions by Mirant in the second and third quarters of 2007 and the shutdown of units 3 and 4 of the Lovett generating facility in the second quarter of 2007, Mirant Mid-Atlantic received a greater allocation of Mirant’s corporate overhead costs in the year ended December 31, 2008, than in the same period in 2007. |
| — | an increase of $11 million in depreciation and amortization expense related to pollution control equipment for NOx emissions placed in service as part of our compliance with the Maryland Healthy Air Act; partially offset by |
| — | an increase of $8 million in gain on sales of assets, net primarily as a result of the sales of emissions allowances in 2008. |
Northeast
Our Northeast segment is comprised of our three generating facilities located in Massachusetts and one generating facility located in New York with total net generating capacity of 2,535 MW.
The following table summarizes the results of operations of our Northeast segment (in millions):
| Years Ended December 31, | Increase/ (Decrease) |
|||||||||||
| 2008 | 2007 | |||||||||||
| Gross Margin: |
||||||||||||
| Energy |
$ | 73 | $ | 128 | $ | (55 | ) | |||||
| Contracted and capacity |
90 | 87 | 3 | |||||||||
| Realized value of hedges |
26 | 65 | (39 | ) | ||||||||
| Total realized gross margin |
189 | 280 | (91 | ) | ||||||||
| Unrealized gross margin |
(10 | ) | (43 | ) | 33 | |||||||
| Total gross margin |
179 | 237 | (58 | ) | ||||||||
| Operating Expenses: |
||||||||||||
| Operations and maintenance |
167 | 179 | (12 | ) | ||||||||
| Depreciation and amortization |
19 | 25 | (6 | ) | ||||||||
| Impairment losses |
— | 175 | (175 | ) | ||||||||
| Gain on sales of assets, net |
(30 | ) | (49 | ) | 19 | |||||||
| Total operating expenses, net |
156 | 330 | (174 | ) | ||||||||
| Operating income (loss) |
23 | (93 | ) | 116 | ||||||||
| Total other income, net |
(1 | ) | (7 | ) | 6 | |||||||
| Income (loss) from continuing operations before reorganization items, net |
$ | 24 | $ | (86 | ) | $ | 110 | |||||
69
Table of Contents
Gross Margin
The decrease of $91 million in realized gross margin was principally a result of the following:
| — | a decrease of $55 million in energy, primarily as a result of the shutdown of the Lovett generating facility, lower generation volumes and increased fuel costs, partially offset by higher power prices; and |
| — | a decrease of $39 million in realized value of hedges. In 2008, realized value of hedges was $26 million, which reflects the amount by which market prices for fuel exceeded contract prices for fuel and the amount by which the settlement value of power contracts exceeded market prices for power. In 2007, realized value of hedges was $65 million, which reflects the amount by which the settlement value of power contracts exceeded market prices for power, partially offset by the amount by which contract prices for fuel exceeded market prices for fuel. |
Our unrealized gross margin for both periods reflects the following:
| — | unrealized losses of $10 million in 2008, which included unrealized losses of $6 million from power and fuel contracts that settled during the period for which net unrealized gains had been recorded in prior periods and a $4 million net decrease in the value of hedge contracts for future periods primarily related to increases in forward power and fuel prices; and |
| — | unrealized losses of $43 million in 2007, which included unrealized losses of $57 million from power and fuel contracts that settled during the period for which net unrealized gains had been recorded in prior periods, partially offset by a $14 million net increase in the value of hedge contracts for future periods primarily related to decreases in forward power and fuel prices. |
Operating Expenses
The decrease of $174 million in operating expenses was principally the result of the following:
| — | a decrease of $175 million as a result of the impairment loss on our Lovett generating facility recognized in the second quarter of 2007. See Note 3 to our consolidated financial statements contained elsewhere in this report for additional information related to this impairment; |
| — | a decrease of $12 million in operations and maintenance expense primarily related to the Lovett generating facility, which included a decrease of $33 million in operating costs, partially offset by $17 million of shutdown costs at the Lovett generating facility incurred in 2008. See Note 3 to our consolidated financial statements contained elsewhere in this report for additional information related to the shutdown of the Lovett generating facility; and |
| — | a decrease of $19 million in gain on sales of assets. In 2008, subsidiaries in our Northeast segment recognized a gain of $30 million, of which $24 million related to emissions allowances sold to third parties. In 2007, subsidiaries in our Northeast segment recognized a gain of $49 million which included a $14 million gain on the sale of certain ancillary equipment included in the sale of the six United States natural gas-fired generating facilities and a $33 million gain on the sales of emissions allowances, of which $11 million related to emissions allowances sold to Mirant Mid-Atlantic that are eliminated in our consolidated statement of operations. |
70
Table of Contents
California
Our California segment consists of the Contra Costa, Pittsburg and Potrero generating facilities with total net generating capacity of 2,347 MW.
The following table summarizes the results of operations of our California segment (in millions):
| Years Ended December 31, | Increase/ (Decrease) |
|||||||||||
| 2008 | 2007 | |||||||||||
| Gross Margin: |
||||||||||||
| Energy |
$ | 4 | $ | 3 | $ | 1 | ||||||
| Contracted and capacity |
123 | 132 | (9 | ) | ||||||||
| Total realized gross margin |
127 | 135 | (8 | ) | ||||||||
| Unrealized gross margin |
— | — | — | |||||||||
| Total gross margin |
127 | 135 | (8 | ) | ||||||||
| Operating Expenses: |
||||||||||||
| Operations and maintenance |
68 | 74 | (6 | ) | ||||||||
| Depreciation and amortization |
23 | 13 | 10 | |||||||||
| Gain on sales of assets, net |
(7 | ) | (2 | ) | (5 | ) | ||||||
| Total operating expenses, net |
84 | 85 | (1 | ) | ||||||||
| Operating income |
43 | 50 | (7 | ) | ||||||||
| Total other expense (income), net |
1 | (5 | ) | 6 | ||||||||
| Net Income |
$ | 42 | $ | 55 | $ | (13 | ) | |||||
Gross Margin
The decrease of $9 million in contracted and capacity included a $3 million lower of cost or market fuel oil inventory adjustment recognized in the fourth quarter of 2008 and extended outages at unit 3 of the Potrero generating facility in the first quarter of 2008.
Operating Expenses
The decrease in operating expenses was principally the result of lower maintenance expenses and an increase in gains on sales of assets, net primarily as a result of the sales of emissions allowances in 2008, partially offset by higher depreciation expense in 2008.
71
Table of Contents
Other Operations
Other Operations includes proprietary trading and fuel oil management activities, interest expense on debt at Mirant Americas Generation and Mirant North America and interest income on our invested cash balances.
The following table summarizes the results of operations of our Other Operations segment (in millions):
| Years Ended December 31, | Increase/ (Decrease) |
|||||||||||
| 2008 | 2007 | |||||||||||
| Gross Margin: |
||||||||||||
| Energy |
$ | (17 | ) | $ | 109 | $ | (126 | ) | ||||
| Total realized gross margin |
(17 | ) | 109 | (126 | ) | |||||||
| Unrealized gross margin |
120 | (102 | ) | 222 | ||||||||
| Total gross margin |
103 | 7 | 96 | |||||||||
| Operating Expenses: |
||||||||||||
| Operations and maintenance |
10 | 16 | (6 | ) | ||||||||
| Depreciation and amortization |
2 | 1 | 1 | |||||||||
| Loss (gain) on sales of assets, net |
(1 | ) | 1 | (2 | ) | |||||||
| Total operating expenses, net |
11 | 18 | (7 | ) | ||||||||
| Operating income (loss) |
92 | (11 | ) | 103 | ||||||||
| Total other expense, net |
175 | 204 | (29 | ) | ||||||||
| Net Loss |
$ | (83 | ) | $ | (215 | ) | $ | 132 | ||||
Gross Margin
The decrease of $126 million in realized gross margin was comprised of a $83 million decrease from fuel oil management activities, a $37 million lower of cost or market fuel oil inventory adjustment recognized in the fourth quarter of 2008 and a $6 million decrease from proprietary trading activities. The significant decrease in the contribution from fuel oil management activities primarily relates to the timing of the settlement of contracts used to hedge the fair value of fuel oil inventory compared to the timing of the use or sale of the fuel oil.
Our unrealized gross margin for both periods reflects the following:
| — | unrealized gains of $120 million in 2008, which included a $65 million net increase in the value of contracts for future periods and unrealized gains of $55 million from power and fuel contracts that settled during the period for which net unrealized losses had been recorded in prior periods; and |
| — | unrealized losses of $102 million in 2007, which included unrealized losses of $115 million from power and fuel contracts that settled during the period for which unrealized gains had been recorded in prior periods, partially offset by a $13 million net increase in the value of contracts for future periods. |
Operating Expenses
Operating expenses decreased $7 million primarily as a result of a decrease in operations and maintenance expense, primarily resulting from a reduction in overhead costs included in Other Operations in 2007 but allocated across our operating segments in 2008.
72
Table of Contents
Other Expense, Net
Other expense, net decreased $29 million primarily as a result of the following:
| — | a decrease of $71 million in interest expense related to lower debt outstanding and higher interest capitalized on construction projects in 2008; partially offset by |
| — | a decrease of $38 million in interest income primarily related to lower average cash balances and lower interest rates on invested cash. |
Other Significant Consolidated Statements of Operations Comparison
Discontinued Operations
There were no discontinued operations in 2008. For the year ended December 31, 2007, income from discontinued operations was $8 million and included the results of operations of Mirant Zeeland, Mirant Texas and Mirant NY-Gen. See Note 8 to our consolidated financial statements contained elsewhere in this report for additional information related to the dispositions and discontinued operations.
73
Table of Contents
Financial Condition
Liquidity and Capital Resources
We expect that we will have sufficient liquidity for our future operations and capital expenditures, and to service our debt obligations. We regularly monitor our ability to finance the needs of our operating, investing and financing activities. See Note 4 to our consolidated financial statements contained elsewhere in this report for additional discussion of our debt.
Sources of Funds and Capital Structure
The principal sources of our liquidity are expected to be: (1) existing cash on hand and cash flows from the operations of our subsidiaries; (2) letters of credit issued or borrowings made under Mirant North America’s senior secured revolving credit facility; (3) letters of credit issued under Mirant North America’s senior secured term loan; (4) capital contributions received upon redemptions of preferred shares in Mirant Americas; and (5) at its discretion, additional capital contributions from Mirant Corporation.
The table below sets forth total cash, cash equivalents and availability under credit facilities of Mirant Americas Generation and its subsidiaries (in millions):
| At December 31, | ||||||
| 2009 | 2008 | |||||
| Cash and Cash Equivalents: |
||||||
| Mirant Americas Generation |
$ | 1 | $ | — | ||
| Mirant North America |
278 | 229 | ||||
| Mirant Mid-Atlantic |
125 | 125 | ||||
| Total cash and cash equivalents |
404 | 354 | ||||
| Available under credit facilities |
680 | 583 | ||||
| Total cash, cash equivalents and credit facilities availability |
$ | 1,084 | $ | 937 | ||
We consider all short-term investments with an original maturity of three months or less to be cash equivalents. At December 31, 2009 and 2008, except for amounts held in bank accounts to cover upcoming payables, all of our cash and cash equivalents were invested in AAA-rated United States Treasury money market funds.
Available under credit facilities at December 31, 2009 and 2008, reflects a $45 million effective reduction as a result of the bankruptcy filing of Lehman Commercial Paper, Inc., a lender under the Mirant North America senior secured revolving credit facility, but includes the $50 million commitment under such facility by CIT Capital USA Inc., whose corporate parent, CIT Group Inc., filed for and emerged from bankruptcy reorganization on November 1, 2009 and December 10, 2009, respectively. See Item 1A. “Risk Factors” for a description of risks related to the lenders under our credit facility.
74
Table of Contents
Mirant Americas Generation is a holding company. The chart below is a summary representation of our capital structure and is not a complete organizational chart.
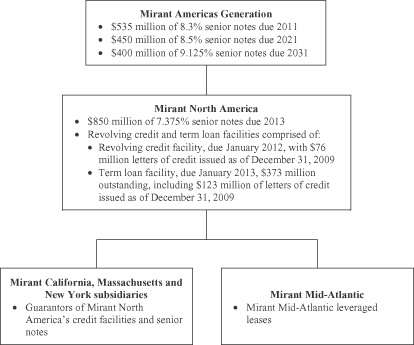
Except for existing cash on hand and, in the case of Mirant North America, borrowings and letters of credit under its credit facilities, Mirant Americas Generation and Mirant North America as holding companies are dependent for liquidity on the distributions and dividends of their subsidiaries, capital contributions received upon redemptions of preferred shares in Mirant Americas and, at its discretion, additional capital contributions from Mirant Corporation.
A significant portion of cash from our operations is generated by the power generating facilities of Mirant Mid-Atlantic. Under the Mirant Mid-Atlantic leveraged leases, Mirant Mid-Atlantic is subject to a covenant that restricts its right to make distributions to Mirant North America. Mirant Mid-Atlantic’s ability to satisfy the criteria set by that covenant in the future could be impaired by factors which negatively affect its financial performance, including interruptions in operations or curtailments of operations to comply with environmental restrictions, significant capital and other expenditures and adverse conditions in the power and fuel markets.
Our subsidiary, Mirant North America, is an intermediate holding company that is the parent of our operating subsidiaries, including Mirant Mid-Atlantic. Mirant North America incurred certain indebtedness pursuant to its senior notes and senior secured credit facilities secured by the assets of Mirant North America and its subsidiaries (other than Mirant Mid-Atlantic and Mirant Energy Trading). The indebtedness of Mirant North America includes certain covenants typical in such notes and credit facilities, including restrictions on dividends, distributions and other restricted payments. Further, the notes and senior secured credit facilities include financial covenants that exclude from the calculation the financial results of any subsidiary that is unable to make distributions or dividends at the time of such calculation. Thus, the inability of Mirant Mid-Atlantic to make distributions to Mirant North America under the leveraged lease transaction would have a
75
Table of Contents
material adverse effect on the calculation of the financial covenants under the senior notes and senior secured credit facilities of Mirant North America, including the leverage and interest coverage maintenance covenants under its senior credit facility.
Our ability to pay our obligations is dependent on the receipt of dividends from Mirant North America, redemptions of the Mirant Americas preferred shares, capital contributions, at its discretion, from Mirant and our ability to refinance all or a portion of those obligations as they become due.
Maintaining sufficient liquidity in our business is crucial in order to mitigate the risk of future financial distress to us. Accordingly, we plan on a prospective basis for the expected liquidity requirements of our business considering the factors listed below:
| — | expected expenditures with respect to maintenance activities and capital improvements, and related outages; |
| — | expected collateral postings in support of our business; |
| — | effects of market price volatility on the amount of collateral postings for economic hedge transactions and risk management transactions; |
| — | effects of market price volatility on fuel pre-payment requirements; |
| — | seasonal and intra-month working capital requirements; |
| — | the development of new generating facilities; and |
| — | debt service obligations. |
Our operating cash flows may be affected by, among other things: (1) demand for electricity; (2) the difference between the cost of fuel used to generate electricity and the market value of the electricity generated; (3) commodity prices (including prices for electricity, emissions allowances, natural gas, coal and oil); (4) the cost of operations and maintenance expenses in the ordinary course; (5) planned and unplanned outages; (6) terms with trade creditors; and (7) cash requirements for capital expenditures relating to certain facilities (including those necessary to comply with environmental regulations).
As noted above, the ability of Mirant North America and its subsidiary Mirant Mid-Atlantic to make distributions and pay dividends is restricted under the terms of Mirant North America’s debt agreements and Mirant Mid-Atlantic’s leveraged lease documentation, respectively. At December 31, 2009, Mirant North America had distributed to us all available cash that was permitted to be distributed under the terms of its debt agreements, leaving $403 million at Mirant North America and its subsidiaries. Of this amount, $125 million was held by Mirant Mid-Atlantic which, as of December 31, 2009, met the tests under the leveraged lease documentation permitting it to make distributions to Mirant North America. Although Mirant North America is in compliance with its financial covenants at December 31, 2009, it is restricted from making distributions by the free cash flow requirements under the restricted payment test of its senior credit facility. The primary factor lowering the free cash flow calculation for Mirant North America is the significant capital expenditure program of Mirant Mid-Atlantic to install emissions controls at its Chalk Point, Dickerson and Morgantown coal-fired units to comply with the Maryland Healthy Air Act. When the capital expenditures no longer affect the calculation of its free cash flow, Mirant North America is expected to be able again to make distributions. We do not expect the liquidity effect of the restriction on distributions under the Mirant North America senior credit facility to be material given that the majority of our liquidity needs arise from the activities of Mirant North America and its subsidiaries, the restriction does not limit Mirant North America from making distributions to us to fund interest payments on our senior notes and Mirant Corporation has significant unrestricted cash and cash equivalents available, at its discretion, to make capital contributions to us and our subsidiaries.
76
Table of Contents
Except for permitted distributions to cover interest payable on Mirant Americas Generation’s senior notes, as of December 31, 2009, the $4.329 billion of net assets of Mirant North America and its subsidiaries were restricted as defined under Rule 4-08(e)(3)(ii) of Regulation S-X.
Uses of Funds
Our requirements for liquidity and capital resources, other than for the day-to-day operation of our generating facilities, are significantly influenced by the following activities: (1) capital expenditures; (2) debt service and payments under the Mirant Mid-Atlantic leveraged leases; and (3) collateral required for our asset management and proprietary trading and fuel oil management activities.
Capital Expenditures. Our capital expenditures, excluding capitalized interest, for the year ended December 31, 2009, were $598 million. Our estimated capital expenditures, excluding capitalized interest, for 2010 and 2011 are $423 million and $121 million, respectively. See Item 1. “Business” for further discussion of our capital expenditures.
Debt Service. At December 31, 2009, we had $2.630 billion of long-term debt with expected interest payments of approximately $195 million for 2010. See Note 4 to our consolidated financial statements contained elsewhere in this report for additional information.
Under the terms of its senior secured term facility, Mirant North America is required to use 50% of its free cash flow for each fiscal year (less amounts paid to us for the purpose of paying interest on our senior notes) to pay down its senior secured term loan, in addition to its scheduled amortization of $5 million per year. The percentage of free cash flow that Mirant North America is required to use to pay down its senior secured term loan may be reduced to 25% upon the achievement of a net debt to EBITDA ratio of less than 2:1. At December 31, 2009, Mirant North America’s net debt to EBITDA ratio was less than 2:1. As such, it was required to use 25% of its free cash flow to pay down its senior secured term loan. We estimate this prepayment, which will be made during the first quarter of 2010, to be $66 million.
Mirant Mid-Atlantic Operating Leases. Mirant Mid-Atlantic leases the Dickerson and Morgantown baseload units and associated property through 2029 and 2034, respectively. Mirant Mid-Atlantic has an option to extend the leases. Any extensions of the respective leases would be for less than 75% of the economic useful life of the facility, as measured from the beginning of the original lease term through the end of the proposed remaining lease term. We are accounting for these leases as operating leases. Although there is variability in the scheduled payment amounts over the lease term, we recognize rent expense for these leases on a straight-line basis in accordance with the applicable accounting literature. Rent expense under the Mirant Mid-Atlantic leases was $96 million for each of the years ended December 31, 2009, 2008 and 2007. The scheduled payment amounts for the Mirant Mid-Atlantic leases are $140 million and $134 million for 2010 and 2011, respectively. As of December 31, 2009, the total notional minimum lease payments for the remaining term of the leases aggregated approximately $1.9 billion and the aggregate termination value for the leases was approximately $1.4 billion and generally decreases over time. In addition, Mirant Mid-Atlantic is required to post rent reserves in an aggregate amount equal to the greater of the next six months rent, 50% of the next 12 months rent or $75 million.
Cash Collateral and Letters of Credit. In order to sell power and purchase fuel in the forward markets and perform other energy trading and marketing activities, we often are required to provide credit support to our counterparties or make deposits with brokers. In addition, we often are required to provide cash collateral or letters of credit to access the transmission grid, to participate in power pools, to fund debt service and rent reserves and for other operating activities. Credit support includes cash collateral, letters of credit, surety bonds and financial guarantees. In the event that we default, the counterparty can draw on a letter of credit or apply
77
Table of Contents
cash collateral held to satisfy the existing amounts outstanding under an open contract. As of December 31, 2009, we had approximately $83 million of posted cash collateral and $199 million of letters of credit outstanding primarily to support our asset management activities, trading activities, debt service and rent reserve requirements and other commercial arrangements. Our liquidity requirements are highly dependent on the level of our hedging activities, forward prices for energy, emissions allowances and fuel, commodity market volatility and credit terms with third parties. See Note 7 to our consolidated financial statements contained elsewhere in this report for additional information.
The following table summarizes cash collateral posted with counterparties and brokers, letters of credit issued and surety bonds provided (in millions):
| At December 31, | ||||||
| 2009 | 2008 | |||||
| Cash collateral posted—energy trading and marketing |
$ | 41 | $ | 67 | ||
| Cash collateral posted—other operating activities |
42 | 43 | ||||
| Letters of credit—energy trading and marketing |
51 | 76 | ||||
| Letters of credit—debt service and rent reserves |
101 | 101 | ||||
| Letters of credit—other operating activities |
47 | 117 | ||||
| Surety bonds |
1 | 25 | ||||
| Total |
$ | 283 | $ | 429 | ||
Debt Obligations, Off-Balance Sheet Arrangements and Contractual Obligations
Our debt obligations, off-balance sheet arrangements and contractual obligations as of December 31, 2009, are as follows (in millions):
| Debt Obligations, Off-Balance Sheet Arrangements and Contractual Obligations by Year | |||||||||||||||||||||
| Total | 2010 | 2011 | 2012 | 2013 | 2014 | >5 Years | |||||||||||||||
| Long-term debt |
$ | 4,216 | $ | 269 | $ | 712 | $ | 162 | $ | 1,286 | $ | 80 | $ | 1,707 | |||||||
| Mirant Mid-Atlantic operating leases |
1,870 | 140 | 134 | 132 | 138 | 131 | 1,195 | ||||||||||||||
| Other operating leases |
113 | 13 | 12 | 11 | 11 | 11 | 55 | ||||||||||||||
| Fuel commitments |
939 | 348 | 336 | 206 | 49 | — | — | ||||||||||||||
| Maryland Healthy Air Act |
269 | 269 | — | — | — | — | — | ||||||||||||||
| Other |
194 | 109 | 15 | 13 | 9 | 7 | 41 | ||||||||||||||
| Total payments |
$ | 7,601 | $ | 1,148 | $ | 1,209 | $ | 524 | $ | 1,493 | $ | 229 | $ | 2,998 | |||||||
Our contractual obligations table does not include our derivative obligations reported at fair value, which are discussed in Note 2 to our consolidated financial statements contained elsewhere in this report and our asset retirement obligations which are discussed in Note 3 to our consolidated financial statements contained elsewhere in this report.
Long-term debt includes the current portion of long-term debt and long-term debt on our consolidated balance sheets, which are discussed in Note 4 to our consolidated financial statements contained elsewhere in this report. Long-term debt also includes estimated interest on debt. Interest on our variable interest debt is based on the United States Dollar LIBOR curve as of December 31, 2009.
Mirant Mid-Atlantic operating leases relate to our minimum lease payments associated with our off-balance sheet leases of the Dickerson and Morgantown baseload units. In addition, we have commitments under other operating leases with various terms and expiration dates.
78
Table of Contents
Fuel commitments primarily relate to long-term coal agreements and related transportation agreements.
Maryland Healthy Air Act commitments reflect the remaining expected payments for capital expenditures to comply with the limitations for SO2, NOx and mercury emissions under the Maryland Healthy Air Act. We completed the installation of the remaining pollution control equipment related to compliance with the Maryland Healthy Air Act in the fourth quarter of 2009. However, provisions in our construction contracts provide that certain payments be made after final completion of the project.
Other primarily represents the open purchase orders less invoices received related to general procurement of products and services purchased in the ordinary course of business. These include construction, maintenance and labor activities at our generating facilities. Other also includes our LTSA associated with the maintenance of a turbine at our Kendall generating facility, limestone supply and transportation agreements and miscellaneous noncurrent liabilities.
Cash Flows
Year Ended December 31, 2009 versus Year Ended December 31, 2008
The changes in our cash flows are detailed as follows (in millions):
| Years Ended December 31, | ||||||||||||
| 2009 | 2008 | Increase/ (Decrease) |
||||||||||
| Cash and cash equivalents, beginning of year |
$ | 354 | $ | 698 | $ | (344 | ) | |||||
| Net cash provided by operating activities: |
||||||||||||
| Continuing operations |
766 | 760 | 6 | |||||||||
| Discontinued operations |
— | 1 | (1 | ) | ||||||||
| Net cash provided by (used in) investing activities: |
||||||||||||
| Continuing operations |
(640 | ) | (714 | ) | 74 | |||||||
| Discontinued operations |
— | 18 | (18 | ) | ||||||||
| Net cash used in financing activities |
(76 | ) | (409 | ) | 333 | |||||||
| Cash and cash equivalents, end of year |
$ | 404 | $ | 354 | $ | 50 | ||||||
Continuing Operations
Operating Activities. Our cash provided by operating activities is affected by seasonality, changes in energy prices and fluctuations in our working capital requirements. Net cash provided by operating activities from continuing operations increased $6 million for the year ended December 31, 2009, compared to the same period in 2008, primarily as a result of the following:
| — | Realized gross margin. An increase in cash provided of $176 million in 2009, compared to the same period in 2008, excluding a decrease in non-cash lower of cost or market fuel inventory adjustments of $33 million. See Results of Operations for additional discussion of our performance in 2009 compared to the same period in 2008; |
| — | Interest expense, net. A decrease in cash used of $37 million for interest expense, net reflecting lower interest expense from lower outstanding debt and higher capitalized interest partially offset by lower interest income primarily as a result of lower interest rates on invested cash; and |
| — | Net accounts receivable and payable. A decrease in cash used of $15 million primarily related to a decrease in our net accounts receivable and payable as a result of a decrease in power prices in 2009 compared to the same period in 2008. In addition, the implementation in June 2009 of weekly settlements with PJM (in lieu of monthly settlements) has reduced the amount of outstanding receivables for the PJM market. |
79
Table of Contents
The decreases in cash used in and increases in cash provided by operating activities were partially offset by the following:
| — | Funds on deposit. A decrease in cash provided of $83 million. In 2009, we had net cash collateral returned to us of $26 million, primarily as a result of decreases in forward energy prices. In 2008, we had net cash collateral returned to us of $109 million primarily related to the cash collateral account to support issuance of letters of credit under the Mirant North America senior secured term loan; |
| — | Inventories. An increase in cash used of $82 million as a result of higher inventory levels of coal and fuel oil, partially offset by lower market prices in 2009 as compared to 2008; |
| — | Accounts payable, collateral. An increase in cash used of $24 million as a result of $8 million returned to counterparties in 2009 as compared to $16 million received from counterparties in 2008; |
| — | Prepaid rent. An increase in cash used of $22 million because the scheduled rent payments for our Mirant Mid-Atlantic leveraged leases were higher for 2009 than 2008; and |
| — | Other operating assets and liabilities. An increase in cash used of $11 million related to changes in other operating assets and liabilities. |
Investing Activities. Net cash used in investing activities from continuing operations decreased by $74 million for the year ended December 31, 2009, compared to the same period in 2008. This difference was primarily a result of the following:
| — | Capital expenditures. A decrease in cash used of $74 million, partially offset by an increase of $20 million for capitalized interest, primarily related to our environmental capital expenditures for our Maryland generating facilities related to our compliance with the Maryland Healthy Air Act; and |
| — | Restricted deposit payments and other. A decrease in cash used of $35 million primarily as a result of $34 million placed in an escrow account in September 2008, to satisfy the conditions of Mirant Potomac River’s agreement with the City of Alexandria, Virginia. See Note 12 to our consolidated financial statements contained elsewhere in this report for additional information on Mirant Potomac River’s agreement with the City of Alexandria, Virginia; partially offset by |
| — | Proceeds from the sales of assets. A decrease in cash provided of $15 million primarily related to sales of emissions allowances to third parties. |
Financing Activities. Net cash used in financing activities decreased by $333 million for the year ended December 31, 2009, compared to the same period in 2008. This difference was primarily a result of the following:
| — | Repayment of long-term debt—nonaffiliate. A decrease in cash used of $374 million for repayments and repurchases of long-term debt, including $276 million for the 2008 purchase and retirement of Mirant Americas Generation senior notes due in 2011; |
| — | Distribution to member. A decrease in cash used of $182 million as a result of distributions of $115 million to our member in 2009, as compared to $297 million in 2008; |
| — | Redemption of preferred stock. An increase in cash provided of $53 million as result of the redemption of Series A preferred stock held by Mirant Mid-Atlantic. See Note 6 to our consolidated financial statements contained elsewhere in this report for additional information; |
| — | Repayment of debt—affiliate. A decrease in cash used of $6 million as a result of repayments in 2008; partially offset by |
| — | Capital contributions. A decrease in cash provided of $282 million as a result of contributions from Mirant Americas primarily for the purchase of our bonds in 2008. We received no contributions in 2009. |
80
Table of Contents
Discontinued Operations
Operating Activities. In 2008, net cash provided by operating activities from discontinued operations was a result of final working capital adjustments related to the 2007 dispositions of the Zeeland and Bosque natural gas-fired generating facilities and Mirant NY-Gen.
Investing Activities. In 2008, net cash provided by investing activities from discontinued operations was $18 million, of which $16 million related to insurance recoveries for repairs of the Swinging Bridge facility of Mirant NY-Gen.
Year Ended December 31, 2008 versus Year Ended December 31, 2007
The changes in our cash flows are detailed as follows (in millions):
| Years Ended December 31, | ||||||||||||
| 2008 | 2007 | Increase/ (Decrease) |
||||||||||
| Cash and cash equivalents, beginning of year |
$ | 698 | $ | 753 | $ | (55 | ) | |||||
| Net cash provided by (used in) operating activities: |
||||||||||||
| Continuing operations |
760 | 652 | 108 | |||||||||
| Discontinued operations |
1 | (19 | ) | 20 | ||||||||
| Net cash provided by (used in) investing activities: |
||||||||||||
| Continuing operations |
(714 | ) | (529 | ) | (185 | ) | ||||||
| Discontinued operations |
18 | 503 | (485 | ) | ||||||||
| Net cash used in financing activities |
(409 | ) | (662 | ) | 253 | |||||||
| Cash and cash equivalents, end of year |
$ | 354 | $ | 698 | $ | (344 | ) | |||||
Continuing Operations
Operating Activities. Our cash provided by operating activities is affected by seasonality, changes in energy prices and fluctuations in our working capital requirements. Net cash provided by operating activities from continuing operations increased $108 million for the year ended December 31, 2008, compared to the same period in 2007, primarily as a result of the following:
| — | Funds on deposit. A decrease in cash used of $178 million because of changes in funds on deposit. In 2008, we had net cash collateral returned to us of $109 million, primarily related to the cash collateral account to support issuance of letters of credit under the Mirant North America senior secured term loan. In 2007, we posted an additional $70 million of cash collateral; |
| — | Inventories. A decrease in cash used of $124 million for inventories primarily as a result of the reduction of fuel inventory levels; |
| — | Net accounts receivable and payable. A decrease in cash used of $24 million related to a $47 million net increase in collateral that we received from counterparties and changes in net accounts receivable and accounts payable. The decrease in cash used was reduced by a net refund of $48 million related to a New York property tax settlement in 2007 and accrued liabilities and other changes in working capital in 2008 compared to 2007; |
| — | Settlement of claims payable. A decrease in cash used of $20 million resulting from a reduction in the settlement of bankruptcy related claims and expenses. In 2007, we paid $17 million in claims payable for the New York entities and $3 million related to other Mirant Americas Generation claims; and |
| — | Interest expense, net. A decrease in cash used of $15 million for interest expense, net reflecting lower interest expense from lower outstanding debt and higher capitalized interest partially offset by lower interest income as a result of lower interest rates on invested cash. |
81
Table of Contents
The decreases in cash used by operating activities were partially offset by the following:
| — | Realized gross margin. A decrease in realized gross margin of $225 million in 2008, compared to the same period in 2007, excluding the non-cash change in lower of cost or market inventory adjustments of $58 million, of which $54 million was recognized in the fourth quarter of 2008. See Results of Operations for additional discussion of our performance in 2008 compared to the same period in 2007; and |
| — | Operating expense. An increase in cash used of $28 million resulting from an increase in operations and maintenance expenses. See Results of Operations for additional discussion. |
Investing Activities. Net cash used in investing activities from continuing operations increased by $185 million for the year ended December 31, 2008, compared to the same period in 2007. This difference was primarily a result of the following:
| — | Capital expenditures. An increase in cash used of $139 million for capital expenditures (including capitalized interest of $20 million) for projects under construction primarily related to our environmental capital expenditures for our Maryland generating facilities; |
| — | Restricted deposit payments and other. An increase in cash used of $37 million primarily related to $34 million placed in an escrow account in September 2008, to satisfy the conditions of Mirant Potomac River’s agreement with the City of Alexandria, Virginia; and |
| — | Proceeds from the sales of assets. A decrease of $9 million in proceeds from the sales of assets in 2008 as compared to 2007. In 2008, we received $40 million of proceeds from the sale of assets, primarily from the sale of emissions allowances. In 2007, we received $49 million of proceeds from the sale of assets, which included approximately $22 million from the sale of ancillary equipment included in the sale of the Zeeland and Bosque natural gas-fired facilities. |
Financing Activities. Net cash used in financing activities decreased by $253 million for the year ended December 31, 2008, compared to the same period in 2007. This difference was primarily a result of the following:
| — | Repayments and purchases of long-term debt—nonaffiliate. An increase in cash used of $240 million primarily as a result of the retirement of Mirant Americas Generation senior notes due in 2011 of $276 million in 2008 and $39 million in 2007; |
| — | Repayment of debt—affiliate. An increase in cash used of $13 million as a result of a $6 million repayment of note payable-affiliate in 2008, as compared to a $7 million issuance of note payable-affiliate in 2007; partially offset by |
| — | Distribution to member. A decrease in cash used of $237 million as a result of distributions of $297 million to our member in 2008, as compared to $534 million in 2007; |
| — | Capital contributions. An increase in cash provided of $243 million in capital contributions from Mirant Americas, primarily for the purchase of Mirant Americas Generation senior notes due in 2011; and |
| — | Redemption of preferred stock. An increase in cash provided of $26 million as a result of the redemption of Series A preferred stock held by Mirant Mid-Atlantic. See Note 6 to our consolidated financial statements contained elsewhere in this report for additional information related to the redemption of preferred shares. |
82
Table of Contents
Discontinued Operations
Operating Activities. In 2008, net cash provided by operating activities from discontinued operations was a result of final working capital adjustments related to the 2007 dispositions. In 2007, net cash provided by operating activities from discontinued operations included cash flows from the Zeeland and Bosque natural gas-fired generating facilities and Mirant NY-Gen.
Investing Activities. Net cash provided by investing activities from discontinued operations was $18 million for the year ended December 31, 2008, compared to $503 million in 2007. In 2008, we received $16 million related to insurance recoveries for repairs of the Swinging Bridge facility of Mirant NY-Gen. In 2007, the net cash provided was primarily related to the proceeds from the sale of the Zeeland and Bosque generating facilities in the second quarter of 2007.
83
Table of Contents
| Item 7. | Management’s Discussion and Analysis of Results of Operations and Financial Condition |
This section is intended to provide the reader with information that will assist in understanding Mirant North America’s financial statements, the changes in those financial statements from year to year and the primary factors contributing to those changes. The following discussion should be read in conjunction with Mirant North America’s consolidated financial statements and the notes accompanying those financial statements.
Overview
Mirant North America, an indirect wholly-owned subsidiary of Mirant and a direct subsidiary of Mirant Americas Generation, is a competitive energy company that produces and sells electricity in the United States. Mirant North America owns or leases 10,076 MW of net electric generating capacity in the Mid-Atlantic and Northeast regions and in California. Mirant North America also operates an integrated asset management and energy marketing organization based in Atlanta, Georgia.
Hedging Activities
Refer to “Hedging Activities” above for Mirant Americas Generation.
Capital Expenditures and Capital Resources
Refer to “Capital Expenditures and Capital Resources” above for Mirant Americas Generation.
Scrubber Operating Expenses
Refer to “Scrubber Operating Expenses” above for Mirant Americas Generation.
Commodity Prices
Refer to “Commodity Prices” above for Mirant Americas Generation.
Granted Emissions Allowances
Refer to “Granted Emissions Allowances” above for Mirant Americas Generation.
Contra Costa Toll Extension
Refer to “Contra Costa Toll Extension” above for Mirant Americas Generation.
Results of Operations
The following discussion of our performance is organized by reportable segment, which is consistent with the way we manage our business.
The Mid-Atlantic region includes our Chalk Point, Dickerson, Morgantown, and Potomac River generating facilities. The Northeast region includes our Bowline, Canal, Kendall and Martha’s Vineyard generating facilities. For the years ended December 31, 2008 and 2007, the Northeast region also included the Lovett generating facility, which was shut down on April 19, 2008. The California region includes our Contra Costa, Pittsburg and Potrero generating facilities. Other Operations includes proprietary trading and fuel oil management activities, interest expense on our debt and interest income on our invested cash balances.
84
Table of Contents
Year Ended December 31, 2009 versus Year Ended December 31, 2008
Consolidated Financial Performance
We reported net income of $597 million and $1.337 billion for the years ended December 31, 2009 and 2008, respectively. The change in net income is detailed as follows (in millions):
| Years Ended December 31, | ||||||||||||
| 2009 | 2008 | Increase/ (Decrease) |
||||||||||
| Realized gross margin |
$ | 1,552 | $ | 1,343 | $ | 209 | ||||||
| Unrealized gross margin |
47 | 786 | (739 | ) | ||||||||
| Total gross margin |
1,599 | 2,129 | (530 | ) | ||||||||
| Operating Expenses: |
||||||||||||
| Operations and maintenance—nonaffiliate |
355 | 372 | (17 | ) | ||||||||
| Operations and maintenance—affiliate |
290 | 285 | 5 | |||||||||
| Depreciation and amortization |
142 | 136 | 6 | |||||||||
| Impairment losses |
221 | — | 221 | |||||||||
| Gain on sales of assets, net |
(22 | ) | (38 | ) | 16 | |||||||
| Total operating expenses, net |
986 | 755 | 231 | |||||||||
| Operating income |
613 | 1,374 | (761 | ) | ||||||||
| Total other expense (income), net |
||||||||||||
| Nonaffiliate |
16 | 39 | (23 | ) | ||||||||
| Affiliate |
— | (2 | ) | 2 | ||||||||
| Net income |
$ | 597 | $ | 1,337 | $ | (740 | ) | |||||
The following discussion includes non-GAAP financial measures because we present our consolidated financial performance in terms of gross margin. Gross margin is our operating revenue less cost of fuel, electricity and other products, and excludes depreciation and amortization. We present gross margin, excluding depreciation and amortization, and realized gross margin separately from unrealized gross margin in order to be consistent with how we manage our business. Realized gross margin and unrealized gross margin are both non-GAAP financial measures. Realized gross margin represents our gross margin less unrealized gains and losses on derivative financial instruments for the periods presented. Conversely, unrealized gross margin is our unrealized gains and losses on derivative financial instruments for the periods presented. Management generally evaluates our operating results excluding the impact of unrealized gains and losses. None of our derivative financial instruments recorded at fair value is designated as a hedge and changes in their fair values are recognized currently in income as unrealized gains or losses. As a result, our financial results are, at times, volatile and subject to fluctuations in value primarily because of changes in forward electricity and fuel prices. Adjusting our gross margin to exclude unrealized gains and losses provides a measure of performance that eliminates the volatility created by significant shifts in market values between periods. However, our realized and unrealized gross margin may not be comparable to similarly titled non-GAAP financial measures used by other companies. We encourage our investors to review our consolidated financial statements and other publicly filed reports in their entirety and not to rely on a single financial measure.
Refer to “Consolidated Financial Performance—Mirant Americas Generation” above for realized and unrealized gross margin and operating expenses, additional related details and variance explanations.
Other expense, net decreased $21 million for the year ended December 31, 2009, and reflects lower interest expense as a result of lower outstanding debt and higher interest capitalized on projects under construction, partially offset by lower interest income as a result of lower interest rates on invested cash and lower average cash balances in 2009 compared to the same period in 2008.
85
Table of Contents
Gross Margin Overview
Refer to “Gross Margin Overview” in “Results of Operations—Mirant Americas Generation” above for realized and unrealized gross margin by operating segments, additional related details and variance explanations.
Operating Statistics
Refer to “Operating Statistics” in “Results of Operations—Mirant Americas Generation” above for Net Capacity Factor and power generation volumes by region.
Mid-Atlantic
Refer to “Mid-Atlantic” in “Results of Operations—Mirant Americas Generation” above for our Mid-Atlantic segment summary.
Northeast
Refer to “Northeast” in “Results of Operations—Mirant Americas Generation” above for our Northeast segment summary.
California
Refer to “California” in “Results of Operations—Mirant Americas Generation” above for our California segment summary.
Other Operations
Other Operations includes proprietary trading and fuel oil management activities, interest expense on our debt and interest income on our invested cash balances.
The following table summarizes the results of operations of our Other Operations segment (in millions):
| Years Ended December 31, | Increase/ (Decrease) |
|||||||||||
| 2009 | 2008 | |||||||||||
| Gross Margin: |
||||||||||||
| Energy |
$ | 167 | $ | (17 | ) | $ | 184 | |||||
| Total realized gross margin |
167 | (17 | ) | 184 | ||||||||
| Unrealized gross margin |
(113 | ) | 120 | (233 | ) | |||||||
| Total gross margin |
54 | 103 | (49 | ) | ||||||||
| Operating Expenses: |
||||||||||||
| Operations and maintenance |
11 | 10 | 1 | |||||||||
| Depreciation and amortization |
4 | 2 | 2 | |||||||||
| Impairment losses |
5 | — | 5 | |||||||||
| Gain on sales of assets, net |
— | (1 | ) | 1 | ||||||||
| Total operating expenses, net |
20 | 11 | 9 | |||||||||
| Operating income |
34 | 92 | (58 | ) | ||||||||
| Total other expense, net |
10 | 36 | (26 | ) | ||||||||
| Net Income |
$ | 24 | $ | 56 | $ | (32 | ) | |||||
86
Table of Contents
Gross Margin
Refer to “Other Operations” in “Results of Operations—Mirant Americas Generation” above for our gross margin variance explanations.
Operating Expenses
Refer to “Other Operations” in “Results of Operations—Mirant Americas Generation” above for our other expenses variance explanations.
Other Expense, Net
The decrease of $26 million in other expense, net was principally the result of the following:
| — | a decrease of $38 million in interest expense primarily as a result of lower outstanding debt and higher interest capitalized on projects under construction; partially offset by |
| — | a decrease of $12 million in interest income primarily related to lower interest rates on invested cash. |
87
Table of Contents
Year Ended December 31, 2008 versus Year Ended December 31, 2007
Consolidated Financial Performance
We reported net income of $1.337 billion and $90 million for the years ended December 31, 2008 and 2007, respectively. The change in net income is detailed as follows (in millions):
| Years Ended December 31, | ||||||||||||
| 2008 | 2007 | Increase/ (Decrease) |
||||||||||
| Realized gross margin |
$ | 1,343 | $ | 1,626 | $ | (283 | ) | |||||
| Unrealized gross margin |
786 | (624 | ) | 1,410 | ||||||||
| Total gross margin |
2,129 | 1,002 | 1,127 | |||||||||
| Operating Expenses: |
||||||||||||
| Operations and maintenance—nonaffiliate |
372 | 353 | 19 | |||||||||
| Operations and maintenance—affiliate |
285 | 276 | 9 | |||||||||
| Depreciation and amortization |
136 | 120 | 16 | |||||||||
| Impairment losses |
— | 175 | (175 | ) | ||||||||
| Gain on sales of assets, net |
(38 | ) | (39 | ) | 1 | |||||||
| Total operating expenses, net |
755 | 885 | (130 | ) | ||||||||
| Operating income |
1,374 | 117 | 1,257 | |||||||||
| Total other expense (income), net |
||||||||||||
| Nonaffiliate |
39 | 41 | (2 | ) | ||||||||
| Affiliate |
(2 | ) | (4 | ) | 2 | |||||||
| Income from continuing operations before reorganization items, net |
1,337 | 80 | 1,257 | |||||||||
| Reorganization items, net |
— | (2 | ) | 2 | ||||||||
| Income from continuing operations |
1,337 | 82 | 1,255 | |||||||||
| Income from discontinued operations |
— | 8 | (8 | ) | ||||||||
| Net income |
$ | 1,337 | $ | 90 | $ | 1,247 | ||||||
The following discussion includes non-GAAP financial measures because we present our consolidated financial performance in terms of gross margin. Gross margin is our operating revenue less cost of fuel, electricity and other products, and excludes depreciation and amortization. We present gross margin, excluding depreciation and amortization, and realized gross margin separately from unrealized gross margin in order to be consistent with how we manage our business. Realized gross margin and unrealized gross margin are both non-GAAP financial measures. Realized gross margin represents our gross margin less unrealized gains and losses on derivative financial instruments for the periods presented. Conversely, unrealized gross margin is our unrealized gains and losses on derivative financial instruments for the periods presented. Management generally evaluates our operating results excluding the impact of unrealized gains and losses. None of our derivative financial instruments recorded at fair value is designated as a hedge and changes in their fair values are recognized currently in income as unrealized gains or losses. As a result, our financial results are, at times, volatile and subject to fluctuations in value primarily because of changes in forward electricity and fuel prices. Adjusting our gross margin to exclude unrealized gains and losses provides a measure of performance that eliminates the volatility created by significant shifts in market values between periods. However, our realized and unrealized gross margin may not be comparable to similarly titled non-GAAP financial measures used by other companies. We encourage our investors to review our consolidated financial statements and other publicly filed reports in their entirety and not to rely on a single financial measure.
88
Table of Contents
Refer to “Consolidated Financial Performance—Mirant Americas Generation” above for realized and unrealized gross margin and operating expenses, additional related details and variance explanations.
Gross Margin Overview
Refer to “Gross Margin Overview” in “Results of Operations—Mirant Americas Generation” above for realized and unrealized gross margin by operating region, additional related details and variance explanations.
Operating Statistics
Refer to “Operating Statistics” in “Results of Operations—Mirant Americas Generation” above for Net Capacity Factor and power generation volumes by region.
Mid-Atlantic
Refer to “Mid-Atlantic” in “Results of Operations—Mirant Americas Generation” above for our Mid-Atlantic segment summary.
Northeast
Refer to “Northeast” in “Results of Operations—Mirant Americas Generation” above for our Northeast segment summary.
California
Refer to “California” in “Results of Operations—Mirant Americas Generation” above for our California segment summary.
Other Operations
Other Operations includes proprietary trading and fuel oil management activities, interest expense on our debt and interest income on our invested cash balances.
The following table summarizes the results of operations of our Other Operations segment (in millions):
| Years Ended December 31, | Increase/ (Decrease) |
|||||||||||
| 2008 | 2007 | |||||||||||
| Gross Margin: |
||||||||||||
| Energy |
$ | (17 | ) | $ | 109 | $ | (126 | ) | ||||
| Total realized gross margin |
(17 | ) | 109 | (126 | ) | |||||||
| Unrealized gross margin |
120 | (102 | ) | 222 | ||||||||
| Total gross margin |
103 | 7 | 96 | |||||||||
| Operating Expenses: |
||||||||||||
| Operations and maintenance |
10 | 16 | (6 | ) | ||||||||
| Depreciation and amortization |
2 | 1 | 1 | |||||||||
| Loss (gain) on sales of assets, net |
(1 | ) | 1 | (2 | ) | |||||||
| Total operating expenses, net |
11 | 18 | (7 | ) | ||||||||
| Operating income (loss) |
92 | (11 | ) | 103 | ||||||||
| Total other expense, net |
36 | 54 | (18 | ) | ||||||||
| Net income (loss) |
$ | 56 | $ | (65 | ) | $ | 121 | |||||
89
Table of Contents
Gross Margin
Refer to “Other Operations” in “Results of Operations—Mirant Americas Generation” above for our gross margin variance explanations.
Operating Expenses
Refer to “Other Operations” in “Results of Operations—Mirant Americas Generation” above for our operating expenses variance explanations.
Other Expense, Net
The decrease of $18 million in other expense, net was principally the result of the following:
| — | a decrease of $56 million in interest expense primarily as a result of lower outstanding debt and higher interest capitalized on projects under construction; partially offset by |
| — | a decrease of $38 million in interest income primarily related to lower interest rates on invested cash and lower average cash balances. |
Other Significant Consolidated Statements of Operations Comparison
Discontinued Operations
Refer to “Discontinued Operations” in “Results of Operations—Mirant Americas Generation” above for our discontinued operations summary.
90
Table of Contents
Financial Condition
Liquidity and Capital Resources
We expect that we will have sufficient liquidity for our future operations and capital expenditures, and to service our debt obligations. We regularly monitor our ability to finance the needs of our operating, investing and financing activities. See Note 4 to our consolidated financial statements contained elsewhere in this report for additional discussion of our debt.
Sources of Funds and Capital Structure
The principal sources of our liquidity are expected to be: (1) existing cash on hand and cash flows from the operations of our subsidiaries; (2) letters of credit issued or borrowings made under our senior secured revolving credit facility; (3) letters of credit issued under our senior secured term loan; (4) capital contributions received upon redemptions of preferred shares in Mirant Americas; and (5) at its discretion, additional capital contributions from Mirant Corporation.
The table below sets forth total cash, cash equivalents and availability under credit facilities of Mirant North America and its subsidiaries (in millions):
| At December 31, | ||||||
| 2009 | 2008 | |||||
| Cash and Cash Equivalents: |
||||||
| Mirant North America |
$ | 278 | $ | 229 | ||
| Mirant Mid-Atlantic |
125 | 125 | ||||
| Total cash and cash equivalents |
403 | 354 | ||||
| Available under credit facilities |
680 | 583 | ||||
| Total cash, cash equivalents and credit facilities availability |
$ | 1,083 | $ | 937 | ||
We consider all short-term investments with an original maturity of three months or less to be cash equivalents. At December 31, 2009 and 2008, except for amounts held in bank accounts to cover upcoming payables, all of our cash and cash equivalents were invested in AAA-rated United States Treasury money market funds.
Available under credit facilities at December 31, 2009 and 2008, reflects a $45 million effective reduction as a result of the bankruptcy filing of Lehman Commercial Paper, Inc., a lender under our senior secured revolving credit facility, but includes the $50 million commitment under such facility by CIT Capital USA Inc., whose corporate parent, CIT Group Inc., filed for and emerged from bankruptcy reorganization on November 1, 2009 and December 10, 2009, respectively. See Item 1A. “Risk Factors” for a description of risks related to the lenders under our credit facility.
91
Table of Contents
Mirant North America is a holding company. The chart below is a summary representation of our capital structure and is not a complete organizational chart.
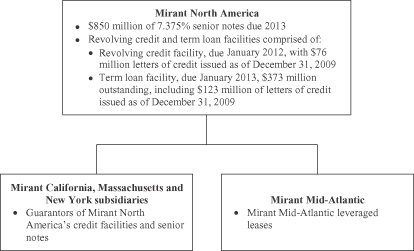
Except for existing cash on hand and borrowings and letters of credit under our credit facilities, as a holding company we are dependent for liquidity on the distributions and dividends of our subsidiaries, capital contributions received upon redemptions of preferred shares in Mirant Americas and, at its discretion, additional capital contributions from Mirant Corporation.
A significant portion of cash from our operations is generated by the power generating facilities of Mirant Mid-Atlantic. Under the Mirant Mid-Atlantic leveraged leases, Mirant Mid-Atlantic is subject to a covenant that restricts its right to make distributions to us. Mirant Mid-Atlantic’s ability to satisfy the criteria set by that covenant in the future could be impaired by factors which negatively affect its financial performance, including interruptions in operations or curtailments of operations to comply with environmental restrictions, significant capital and other expenditures and adverse conditions in the power and fuel markets.
We have incurred certain indebtedness pursuant to our senior notes and senior secured credit facilities secured by our assets and the assets of our subsidiaries (other than Mirant Mid-Atlantic and Mirant Energy Trading). Our indebtedness includes certain covenants typical in such notes and credit facilities, including restrictions on dividends, distributions and other restricted payments. Further, the notes and senior secured credit facilities include financial covenants that exclude from the calculation the financial results of any subsidiary that is unable to make distributions or dividends at the time of such calculation. Thus, the inability of Mirant Mid-Atlantic to make distributions to us under the leveraged lease transaction would have a material adverse effect on the calculation of the financial covenants under our senior notes and senior secured credit facilities, including the leverage and interest coverage maintenance covenants under our senior credit facility.
Our ability to pay our obligations is dependent on the receipt of dividends from Mirant Mid-Atlantic, redemptions of the Mirant Americas preferred shares, capital contributions, at its discretion, from Mirant and our ability to refinance all or a portion of those obligations as they become due.
92
Table of Contents
Maintaining sufficient liquidity in our business is crucial in order to mitigate the risk of future financial distress to us. Accordingly, we plan on a prospective basis for the expected liquidity requirements of our business considering the factors listed below:
| — | expected expenditures with respect to maintenance activities and capital improvements, and related outages; |
| — | expected collateral posted in support of our business; |
| — | effects of market price volatility on the amount of collateral postings for economic hedge transactions and risk management transactions; |
| — | effects of market price volatility on fuel pre-payment requirements; |
| — | seasonal and intra-month working capital requirements; |
| — | the development of new generating facilities; and |
| — | debt service obligations. |
Our operating cash flows may be affected by, among other things: (1) demand for electricity; (2) the difference between the cost of fuel used to generate electricity and the market value of the electricity generated; (3) commodity prices (including prices for electricity, emissions allowances, natural gas, coal and oil); (4) the cost of operations and maintenance expenses in the ordinary course; (5) planned and unplanned outages; (6) terms with trade creditors; and (7) cash requirements for capital expenditures relating to certain facilities (including those necessary to comply with environmental regulations).
As noted above, our ability and the ability of our subsidiary, Mirant Mid-Atlantic, to make distributions and pay dividends is restricted under the terms of our debt agreements and Mirant Mid-Atlantic’s leveraged lease documentation, respectively. At December 31, 2009, we had distributed to our parent, Mirant Americas Generation, all available cash that was permitted to be distributed under the terms of our debt agreements, leaving $403 million with us and our subsidiaries. Of this amount, $125 million was held by Mirant Mid-Atlantic which, as of December 31, 2009, met the tests under the leveraged lease documentation permitting it to make distributions to us. Although we are in compliance with our financial covenants at December 31, 2009, we are restricted from making distributions by the free cash flow requirements under the restricted payment test of our senior credit facility. The primary factor lowering our free cash flow calculation is the significant capital expenditure program of Mirant Mid-Atlantic to install emissions controls at its Chalk Point, Dickerson and Morgantown coal-fired units to comply with the Maryland Healthy Air Act. When the capital expenditures no longer affect the calculation of our free cash flow, we expect to be able again to make distributions.
As of December 31, 2009, approximately $4.761 billion of net assets of Mirant Mid-Atlantic and its subsidiaries are considered restricted for purposes of Rule 4-08(e)(3)(ii) of Regulation S-X, which amount excludes $125 million of cash held by Mirant Mid-Atlantic and does not consider any ability of Mirant Mid-Atlantic to monetize non-cash assets and distribute such amounts.
Uses of Funds
Our requirements for liquidity and capital resources, other than for the day-to-day operation of our generating facilities, are significantly influenced by the following activities: (1) capital expenditures; (2) debt service and payments under the Mirant Mid-Atlantic leveraged leases; and (3) collateral required for our asset management and proprietary trading and fuel oil management activities.
93
Table of Contents
Capital Expenditures. Our capital expenditures, excluding capitalized interest, for the year ended December 31, 2009, were $598 million. Our estimated capital expenditures, excluding capitalized interest, for 2010 and 2011 are $423 million and $121 million, respectively. See Item 1. “Business” for further discussion of our capital expenditures.
Debt Service. At December 31, 2009, we had $1.248 billion of long-term debt with expected interest payments of approximately $76 million for 2010. See Note 4 to our consolidated financial statements contained elsewhere in this report for additional information.
Under the terms of our senior secured term facility, we are required to use 50% of our free cash flow for each fiscal year (less amounts paid to Mirant Americas Generation for the purpose of paying interest on its senior notes) to pay down our senior secured term loan, in addition to our scheduled amortization of $5 million per year. The percentage of free cash flow that we are required to use to pay down our senior secured term loan may be reduced to 25% upon our achievement of a net debt to EBITDA ratio of less than 2:1. At December 31, 2009, our net debt to EBITDA ratio was less than 2:1. As such, we were required to use 25% of our free cash flow to pay down our senior secured term loan. We estimate this prepayment, which will be made during the first quarter of 2010, to be $66 million.
Mirant Mid-Atlantic Operating Leases. Mirant Mid-Atlantic leases the Dickerson and Morgantown baseload units and associated property through 2029 and 2034, respectively. Mirant Mid-Atlantic has an option to extend the leases. Any extensions of the respective leases would be for less than 75% of the economic useful life of the facility, as measured from the beginning of the original lease term through the end of the proposed remaining lease term. We are accounting for these leases as operating leases. Although there is variability in the scheduled payment amounts over the lease term, we recognize rent expense for these leases on a straight-line basis in accordance with the applicable accounting literature. Rent expense under the Mirant Mid-Atlantic leases was $96 million for each of the years ended December 31, 2009, 2008 and 2007. The scheduled payment amounts for the Mirant Mid-Atlantic leases are $140 million and $134 million for 2010 and 2011, respectively. As of December 31, 2009, the total notional minimum lease payments for the remaining term of the leases aggregated approximately $1.9 billion and the aggregate termination value for the leases was approximately $1.4 billion and generally decreases over time. In addition, Mirant Mid-Atlantic is required to post rent reserves in an aggregate amount equal to the greater of the next six months rent, 50% of the next 12 months rent or $75 million.
Cash Collateral and Letters of Credit. In order to sell power and purchase fuel in the forward markets and perform other energy trading and marketing activities, we often are required to provide credit support to our counterparties or make deposits with brokers. In addition, we often are required to provide cash collateral or letters of credit to access the transmission grid, to participate in power pools, to fund debt service and rent reserves and for other operating activities. Credit support includes cash collateral, letters of credit, surety bonds and financial guarantees. In the event that we default, the counterparty can draw on a letter of credit or apply cash collateral held to satisfy the existing amounts outstanding under an open contract. As of December 31, 2009, we had approximately $83 million of posted cash collateral and $199 million of letters of credit outstanding primarily to support our asset management activities, trading activities, debt service and rent reserve requirements and other commercial arrangements. Our liquidity requirements are highly dependent on the level of our hedging activities, forward prices for energy, emissions allowances and fuel, commodity market volatility and credit terms with third parties. See Note 7 to our consolidated financial statements contained elsewhere in this report for additional information.
94
Table of Contents
The following table summarizes cash collateral posted with counterparties and brokers, letters of credit issued and surety bonds provided (in millions):
| At December 31, | ||||||
| 2009 | 2008 | |||||
| Cash collateral posted—energy trading and marketing |
$ | 41 | $ | 67 | ||
| Cash collateral posted—other operating activities |
42 | 43 | ||||
| Letters of credit—energy trading and marketing |
51 | 76 | ||||
| Letters of credit—debt service and rent reserves |
101 | 101 | ||||
| Letters of credit—other operating activities |
47 | 117 | ||||
| Surety bonds |
1 | 25 | ||||
| Total |
$ | 283 | $ | 429 | ||
Debt Obligations, Off-Balance Sheet Arrangements and Contractual Obligations
Our debt obligations, off-balance sheet arrangements and contractual obligations as of December 31, 2009, are as follows (in millions):
| Debt Obligations, Off-Balance Sheet Arrangements and Contractual Obligations by Year | |||||||||||||||||||||
| Total | 2010 | 2011 | 2012 | 2013 | 2014 | >5 Years | |||||||||||||||
| Long-term debt |
$ | 1,547 | $ | 150 | $ | 88 | $ | 88 | $ | 1,211 | $ | 5 | $ | 5 | |||||||
| Mirant Mid-Atlantic operating leases |
1,870 | 140 | 134 | 132 | 138 | 131 | 1,195 | ||||||||||||||
| Other operating leases |
113 | 13 | 12 | 11 | 11 | 11 | 55 | ||||||||||||||
| Fuel commitments |
939 | 348 | 336 | 206 | 49 | — | — | ||||||||||||||
| Maryland Healthy Air Act |
269 | 269 | — | — | — | — | — | ||||||||||||||
| Other |
194 | 109 | 15 | 13 | 9 | 7 | 41 | ||||||||||||||
| Total payments |
$ | 4,932 | $ | 1,029 | $ | 585 | $ | 450 | $ | 1,418 | $ | 154 | $ | 1,296 | |||||||
Our contractual obligations table does not include our derivative obligations reported at fair value, which are discussed in Note 2 to our consolidated financial statements contained elsewhere in this report and our asset retirement obligations which are discussed in Note 3 to our consolidated financial statements contained elsewhere in this report.
Long-term debt includes the current portion of long-term debt and long-term debt on our consolidated balance sheets, which are discussed in Note 4 to our consolidated financial statements contained elsewhere in this report. Long-term debt also includes estimated interest on debt. Interest on our variable interest debt is based on the United States Dollar LIBOR curve as of December 31, 2009.
Mirant Mid-Atlantic operating leases relate to our minimum lease payments associated with our off-balance sheet leases of the Dickerson and Morgantown baseload units. In addition, we have commitments under other operating leases with various terms and expiration dates.
Fuel commitments primarily relate to long-term coal agreements and related transportation agreements.
Maryland Healthy Air Act commitments reflect the remaining expected payments for capital expenditures to comply with the limitations for SO2, NOx and mercury emissions under the Maryland Healthy Air Act. We completed the installation of the remaining pollution control equipment related to compliance with the Maryland Healthy Air Act in the fourth quarter of 2009. However, provisions in our construction contracts provide that certain payments be made after final completion of the project.
95
Table of Contents
Other primarily represents the open purchase orders less invoices received related to general procurement of products and services purchased in the ordinary course of business. These include construction, maintenance and labor activities at our generating facilities. Other also includes our LTSA associated with the maintenance of a turbine at our Kendall generating facility, limestone supply and transportation agreements and miscellaneous noncurrent liabilities.
Cash Flows
Year Ended December 31, 2009 versus Year Ended December 31, 2008
The changes in our cash flows are detailed as follows (in millions):
| Years Ended December 31, | ||||||||||||
| 2009 | 2008 | Increase/ (Decrease) |
||||||||||
| Cash and cash equivalents, beginning of year |
$ | 354 | $ | 697 | $ | (343 | ) | |||||
| Net cash provided by operating activities: |
||||||||||||
| Continuing operations |
885 | 898 | (13 | ) | ||||||||
| Discontinued operations |
— | 1 | (1 | ) | ||||||||
| Net cash provided by (used in) investing activities: |
||||||||||||
| Continuing operations |
(640 | ) | (714 | ) | 74 | |||||||
| Discontinued operations |
— | 18 | (18 | ) | ||||||||
| Net cash used in financing activities |
(196 | ) | (546 | ) | 350 | |||||||
| Cash and cash equivalents, end of year |
$ | 403 | $ | 354 | $ | 49 | ||||||
Continuing Operations
Operating Activities. Our cash provided by operating activities is affected by seasonality, changes in energy prices and fluctuations in our working capital requirements. Net cash provided by operating activities from continuing operations decreased $13 million for the year ended December 31, 2009, compared to the same period in 2008, primarily as a result of the following:
| — | Funds on deposit. A decrease in cash provided of $83 million. In 2009, we had net cash collateral returned to us of $26 million, primarily as a result of decreases in forward energy prices. In 2008, we had net cash collateral returned to us of $109 million primarily related to the cash collateral account to support issuance of letters of credit under the Mirant North America senior secured term loan; |
| — | Inventories. An increase in cash used of $82 million as a result of higher inventory levels of coal and fuel oil, partially offset by lower market prices in 2009 as compared to 2008; |
| — | Accounts payable, collateral. An increase in cash used of $24 million as a result of $8 million returned to counterparties in 2009 as compared to $16 million received from counterparties in 2008; and |
| — | Prepaid rent. An increase in cash used of $22 million because the scheduled rent payments for our Mirant Mid-Atlantic leveraged leases were higher for 2009 than 2008. |
The increases in cash used in and decreases in cash provided by operating activities were partially offset by the following:
| — | Realized gross margin. An increase in cash provided of $176 million in 2009, compared to the same period in 2008, excluding an increase in non-cash lower of cost or market fuel inventory adjustments of $33 million. See Results of Operations for additional discussion of our performance in 2009 compared to the same period in 2008; |
96
Table of Contents
| — | Interest expense, net. A decrease in cash used of $21 million for interest expense, net reflecting lower interest expense from lower outstanding debt and higher capitalized interest partially offset by lower interest income primarily as a result of lower interest rates on invested cash; and |
| — | Other operating assets and liabilities. A decrease in cash used of $1 million related to changes in other operating assets and liabilities. |
Investing Activities. Net cash used in investing activities from continuing operations decreased by $74 million for the year ended December 31, 2009, compared to the same period in 2008. This difference was primarily a result of the following:
| — | Capital expenditures. A decrease in cash used of $74 million, partially offset by an increase of $20 million for capitalized interest, primarily related to our environmental capital expenditures for our Maryland generating facilities related to our compliance with the Maryland Healthy Air Act; and |
| — | Restricted deposit payments and other. A decrease in cash used of $35 million primarily as a result of $34 million placed in an escrow account in September 2008, to satisfy the conditions of Mirant Potomac River’s agreement with the City of Alexandria, Virginia. See Note 12 to our consolidated financial statements contained elsewhere in this report for additional information on Mirant Potomac River’s agreement with the City of Alexandria, Virginia; partially offset by |
| — | Proceeds from the sales of assets. A decrease in cash provided of $15 million primarily related to sales of emissions allowances to third parties. |
Financing Activities. Net cash used in financing activities decreased by $350 million for the year ended December 31, 2009, compared to the same period in 2008. This difference was primarily a result of the following:
| — | Distribution to member. A decrease in cash used of $179 million as a result of distributions of $235 million in 2009, as compared to $414 million in 2008; |
| — | Repayment of long-term debt—nonaffiliate. A decrease in cash used of $97 million for long-term debt repayments; |
| — | Redemption of preferred stock. An increase in cash provided of $53 million as result of the redemption of Series A preferred stock held by Mirant Mid-Atlantic. See Note 6 to our consolidated financial statements contained elsewhere in this report for additional information; and |
| — | Repayment of debt—affiliate. A decrease in cash used of $20 million as a result of repayments in 2008. |
Discontinued Operations
Operating Activities. In 2008, net cash provided by operating activities from discontinued operations was a result of final working capital adjustments related to the 2007 dispositions of the Zeeland and Bosque natural gas-fired facilities and Mirant NY-Gen.
Investing Activities. In 2008, net cash provided by investing activities from discontinued operations was $18 million, of which $16 million related to insurance recoveries for repairs of the Swinging Bridge facility of Mirant NY-Gen.
97
Table of Contents
Year Ended December 31, 2008 versus Year Ended December 31, 2007
The changes in our cash flows are detailed as follows (in millions):
| Years Ended December 31, | ||||||||||||
| 2008 | 2007 | Increase/ (Decrease) |
||||||||||
| Cash and cash equivalents, beginning of year |
$ | 697 | $ | 753 | $ | (56 | ) | |||||
| Net cash provided by (used in) operating activities: |
||||||||||||
| Continuing operations |
898 | 833 | 65 | |||||||||
| Discontinued operations |
1 | (19 | ) | 20 | ||||||||
| Net cash provided by (used in) investing activities: |
||||||||||||
| Continuing operations |
(714 | ) | (529 | ) | (185 | ) | ||||||
| Discontinued operations |
18 | 503 | (485 | ) | ||||||||
| Net cash used in financing activities |
(546 | ) | (844 | ) | 298 | |||||||
| Cash and cash equivalents, end of year |
$ | 354 | $ | 697 | $ | (343 | ) | |||||
Continuing Operations
Operating Activities. Our cash provided by operating activities is affected by seasonality, changes in energy prices and fluctuations in our working capital requirements. Net cash provided by operating activities from continuing operations increased $65 million for the year ended December 31, 2008, compared to the same period in 2007, primarily as a result of the following:
| — | Funds on deposit. A decrease in cash used of $178 million because of changes in funds on deposit. In 2008, we had net cash collateral returned to us of $109 million, primarily related to the cash collateral account to support issuance of letters of credit under the Mirant North America senior secured term loan. In 2007, we posted an additional $70 million of cash collateral; |
| — | Inventories. A decrease in cash used of $124 million for inventories primarily as a result of the reduction of fuel inventory levels; and |
| — | Net accounts receivable and payable. A decrease in cash used of $16 million related to a $47 million net increase in collateral that we received from counterparties and changes in net accounts receivable and accounts payable. The decrease in cash used was reduced by a net refund of $48 million related to a New York property tax settlement in 2007 and accrued liabilities and other changes in working capital in 2008 compared to 2007. |
The decreases in cash used by operating activities were partially offset by the following:
| — | Realized gross margin. A decrease in realized gross margin of $225 million in 2008, compared to the same period in 2007, excluding the non-cash change in lower of cost or market inventory adjustments of $58 million, of which $54 million was recognized in the fourth quarter of 2008. See Results of Operations for additional discussion of our performance in 2008 compared to the same period in 2007; and |
| — | Operating expense. An increase in cash used of $28 million resulting from an increase in operations and maintenance expenses. See Results of Operations for additional discussion. |
Investing Activities. Net cash used in investing activities from continuing operations increased by $185 million for the year ended December 31, 2008, compared to the same period in 2007. This difference was primarily a result of the following:
| — | Capital expenditures. An increase in cash used of $139 million for capital expenditures (including capitalized interest of $20 million) for projects under construction primarily related to our environmental capital expenditures for our Maryland generating facilities; |
98
Table of Contents
| — | Restricted deposit payments and other. An increase in cash used of $37 million primarily related to $34 million placed in an escrow account in September 2008, to satisfy the conditions of Mirant Potomac River’s agreement with the City of Alexandria, Virginia; and |
| — | Proceeds from the sales of assets. A decrease of $9 million in proceeds from the sales of assets in 2008 as compared to 2007. In 2008, we received $40 million of proceeds from the sale of assets, primarily from the sale of emissions allowances. In 2007, we received $49 million of proceeds from the sale of assets, which included approximately $22 million from the sale of ancillary equipment included in the sale of the Zeeland and Bosque natural gas-fired facilities. |
Financing Activities. Net cash used in financing activities decreased by $298 million for the year ended December 31, 2008, compared to the same period in 2007. This difference was primarily a result of the following:
| — | Distribution to member. A decrease in cash used of $281 million as a result of distributions of $414 million to our member in 2008, as compared to $695 million in 2007; |
| — | Redemption of preferred stock. An increase in cash provided of $26 million as a result of the redemption of Series A preferred stock held by Mirant Mid-Atlantic. See Note 6 to our consolidated financial statements contained elsewhere in this report for additional information related to the redemption of preferred shares; |
| — | Settlement of member’s obligations pursuant to the Plan. A decrease in cash used of $20 million as a result of the 2007 settlements of member’s obligations primarily related to the New York entities emergence under the plan of reorganization; partially offset by |
| — | Repayment of debt—affiliate. An increase in cash used of $27 million as a result of a $20 million repayment of note payable-affiliate in 2008, as compared to a $7 million issuance of note payable-affiliate in 2007. |
Discontinued Operations
Operating Activities. In 2008, net cash provided by operating activities from discontinued operations was a result of final working capital adjustments related to the 2007 dispositions. In 2007, net cash provided by operating activities from discontinued operations included cash flows from the Zeeland and Bosque natural gas-fired facilities and Mirant NY-Gen.
Investing Activities. Net cash provided by investing activities from discontinued operations was $18 million for the year ended December 31, 2008, compared to $503 million in 2007. In 2008, we received $16 million related to insurance recoveries for repairs of the Swinging Bridge facility of Mirant NY-Gen. In 2007, the net cash provided was primarily related to the proceeds from the sale of the Zeeland and Bosque facilities in the second quarter of 2007.
99
Table of Contents
| Item 7. | Management’s Discussion and Analysis of Results of Operations and Financial Condition |
| C. | Mirant Mid-Atlantic |
This section is intended to provide the reader with information that will assist in understanding Mirant Mid-Atlantic’s financial statements, the changes in those financial statements from year to year and the primary factors contributing to those changes. The following discussion should be read in conjunction with Mirant Mid-Atlantic’s consolidated financial statements and the notes accompanying those financial statements.
Overview
Mirant Mid-Atlantic, an indirect wholly-owned subsidiary of Mirant and Mirant Americas Generation and a direct subsidiary of Mirant North America, is a competitive energy company that produces and sells electricity in the United States. Mirant Mid-Atlantic owns or leases 5,194 MW of net electric generating capacity in the Mid-Atlantic region.
Hedging Activities
We use derivative financial instruments, such as commodity forwards, futures, options and swaps, to manage our exposure to fluctuations in electric energy and fuel commodity prices. In addition, we hedge economically a substantial portion of our coal-fired baseload generation through OTC transactions. However, we generally do not hedge our intermediate and peaking units for tenors greater than 12 months. While some of our hedges are executed through our affiliate, Mirant Energy Trading, a significant portion of our hedges are financial swap transactions with counterparties that are senior unsecured obligations of such parties and do not require either party to post cash collateral either for initial margin or for securing exposure as a result of changes in power or natural gas prices. At February 9, 2010, our aggregate hedge levels based on expected generation for each period were as follows:
| Aggregate Hedge Levels Based on Expected Generation | |||||||||||||||
| 2009 | 2010 | 2011 | 2012 | 2013 | |||||||||||
| Power |
93 | % | 59 | % | 62 | % | 38 | % | 32 | % | |||||
| Fuel |
72 | % | 67 | % | 37 | % | 10 | % | — | % | |||||
Legislation has been proposed in Congress to increase the regulation of transactions involving OTC derivatives. The proposed legislation provides that standardized swap transactions between dealers and large market participants would have to be cleared and must be traded on an exchange or electronic platform. Although the proposed legislation provides exclusions from the clearing and certain other requirements for market participants, such as Mirant Mid-Atlantic, which utilize OTC derivatives to hedge commercial risks, such exclusions are the focus of debate and may not ultimately be part of any final legislation. Greater regulation of OTC derivatives could materially affect our ability to hedge economically our generation by reducing liquidity in the energy and commodity markets and, if we are required to clear such transactions on exchanges, by significantly increasing the collateral costs associated with such activities.
Capital Expenditures and Capital Resources
For the year ended December 31, 2009, we invested $578 million for capital expenditures, of which $408 million related to compliance with the Maryland Healthy Air Act. As of December 31, 2009, we have invested approximately $1.405 billion for capital expenditures related to compliance with the Maryland Healthy Air Act. We completed the installation of the remaining pollution control equipment related to compliance with the Maryland Healthy Air Act in the fourth quarter of 2009. However, provisions in our construction contracts provide that certain payments be made after final completion of the project. Including amounts already invested to date, we expect to invest total capital expenditures of $1.674 billion to comply with the Maryland Healthy Air Act.
100
Table of Contents
The following table details the expected timing of payments for our estimated capital expenditures for 2010 and 2011 (in millions):
| 2010 | 2011 | |||||
| Maryland Healthy Air Act |
$ | 269 | $ | — | ||
| Other environmental |
20 | 26 | ||||
| Maintenance |
89 | 40 | ||||
| Other construction |
21 | 41 | ||||
| Other |
5 | 1 | ||||
| Total |
$ | 404 | $ | 108 | ||
We expect that available cash, proceeds from redemption of preferred shares in Mirant Americas and future cash flows from operations will be sufficient to fund these capital expenditures.
Scrubber Operating Expenses
Refer to “Scrubber Operating Expenses” above for Mirant Americas Generation.
Commodity Prices
Refer to “Commodity Prices” above for Mirant Americas Generation.
Granted Emissions Allowances
As a result of the capital expenditures we are incurring to comply with the requirements of the Maryland Healthy Air Act, we expect to have excess SO2 and NOx emissions allowances in future periods. We plan to continue to maintain some SO2 and NOx emissions allowances above those needed for our current expected generation in case our actual generation exceeds our current forecasts for future periods and for possible future additions of generating capacity. At December 31, 2009, the estimated fair value of our anticipated excess SO2 and NOx emissions allowances was approximately $16 million.
101
Table of Contents
Results of Operations
Year Ended December 31, 2009 versus Year Ended December 31, 2008
Consolidated Financial Performance
We reported net income of $344 million and $1.217 billion for the years ended December 31, 2009 and 2008, respectively. The change in net income is detailed as follows (in millions):
| Years Ended December 31, | ||||||||||||
| 2009 | 2008 | Increase/ (Decrease) |
||||||||||
| Realized gross margin |
$ | 1,107 | $ | 1,038 | $ | 69 | ||||||
| Unrealized gross margin |
144 | 676 | (532 | ) | ||||||||
| Total gross margin |
1,251 | 1,714 | (463 | ) | ||||||||
| Operating Expenses: |
||||||||||||
| Operations and maintenance—nonaffiliate |
245 | 239 | 6 | |||||||||
| Operations and maintenance—affiliate |
189 | 173 | 16 | |||||||||
| Depreciation and amortization |
98 | 92 | 6 | |||||||||
| Impairment losses |
385 | — | 385 | |||||||||
| Gain on sales of assets, net |
(14 | ) | (8 | ) | (6 | ) | ||||||
| Total operating expenses, net |
903 | 496 | 407 | |||||||||
| Operating income |
348 | 1,218 | (870 | ) | ||||||||
| Total other expense, net |
4 | 1 | 3 | |||||||||
| Net income |
$ | 344 | $ | 1,217 | $ | (873 | ) | |||||
The following discussion includes non-GAAP financial measures because we present our consolidated financial performance in terms of gross margin. Gross margin is our operating revenue less cost of fuel, electricity and other products, and excludes depreciation and amortization. We present gross margin, excluding depreciation and amortization, and realized gross margin separately from unrealized gross margin in order to be consistent with how we manage our business. Realized gross margin and unrealized gross margin are both non-GAAP financial measures. Realized gross margin represents our gross margin less unrealized gains and losses on derivative financial instruments for the periods presented. Conversely, unrealized gross margin is our unrealized gains and losses on derivative financial instruments for the periods presented. Management generally evaluates our operating results excluding the impact of unrealized gains and losses. None of our derivative financial instruments recorded at fair value is designated as a hedge and changes in their fair values are recognized currently in income as unrealized gains or losses. As a result, our financial results are, at times, volatile and subject to fluctuations in value primarily because of changes in forward electricity and fuel prices. Adjusting our gross margin to exclude unrealized gains and losses provides a measure of performance that eliminates the volatility created by significant shifts in market values between periods. However, our realized and unrealized gross margin may not be comparable to similarly titled non-GAAP financial measures used by other companies. We encourage our investors to review our consolidated financial statements and other publicly filed reports in their entirety and not to rely on a single financial measure.
Refer to “Mid-Atlantic” in “Results of Operations—Mirant Americas Generation” above for our realized and unrealized gross margin and operating expenses, additional related details and variance explanations.
102
Table of Contents
Operating Statistics
Our Net Capacity Factor was 30% for the year ended December 31, 2009, compared to 33% for the same period in 2008. Our power generation volume for the year ended December 31, 2009 (in gigawatt hours) was 13,955 compared to 14,999 for the same period in 2008. See “Operating Statistics” in “Results of Operations—Mirant Americas Generation” above for additional details on Net Capacity Factor and power generation volumes.
Gross Margin
Refer to “Mid-Atlantic” in “Results of Operations—Mirant Americas Generation” above for our realized and unrealized gross margin, additional related details and variance explanations.
Operating Expenses
Refer to “Mid-Atlantic” in “Results of Operations—Mirant Americas Generation” above for our operating expenses variance explanations.
103
Table of Contents
Year Ended December 31, 2008 versus Year Ended December 31, 2007
Consolidated Financial Performance
We reported net income of $1.217 billion and $169 million for the years ended December 31, 2008 and 2007, respectively. The change in net income is detailed as follows (in millions):
| Years Ended December 31, | ||||||||||||
| 2008 | 2007 | Increase/ (Decrease) |
||||||||||
| Realized gross margin |
$ | 1,038 | $ | 1,084 | $ | (46 | ) | |||||
| Unrealized gross margin |
676 | (479 | ) | 1,155 | ||||||||
| Total gross margin |
1,714 | 605 | 1,109 | |||||||||
| Operating Expenses: |
||||||||||||
| Operations and maintenance—nonaffiliate |
239 | 216 | 23 | |||||||||
| Operations and maintenance—affiliate |
173 | 144 | 29 | |||||||||
| Depreciation and amortization |
92 | 81 | 11 | |||||||||
| Gain on sales of assets, net |
(8 | ) | — | (8 | ) | |||||||
| Total operating expenses, net |
496 | 441 | 55 | |||||||||
| Operating income |
1,218 | 164 | 1,054 | |||||||||
| Total other expense (income), net |
1 | (5 | ) | 6 | ||||||||
| Net income |
$ | 1,217 | $ | 169 | $ | 1,048 | ||||||
The following discussion includes non-GAAP financial measures because we present our consolidated financial performance in terms of gross margin. Gross margin is our operating revenue less cost of fuel, electricity and other products, and excludes depreciation and amortization. We present gross margin, excluding depreciation and amortization, and realized gross margin separately from unrealized gross margin in order to be consistent with how we manage our business. Realized gross margin and unrealized gross margin are both non-GAAP financial measures. Realized gross margin represents our gross margin less unrealized gains and losses on derivative financial instruments for the periods presented. Conversely, unrealized gross margin is our unrealized gains and losses on derivative financial instruments for the periods presented. Management generally evaluates our operating results excluding the impact of unrealized gains and losses. None of our derivative financial instruments recorded at fair value is designated as a hedge and changes in their fair values are recognized currently in income as unrealized gains or losses. As a result, our financial results are, at times, volatile and subject to fluctuations in value primarily because of changes in forward electricity and fuel prices. Adjusting our gross margin to exclude unrealized gains and losses provides a measure of performance that eliminates the volatility created by significant shifts in market values between periods. However, our realized and unrealized gross margin may not be comparable to similarly titled non-GAAP financial measures used by other companies. We encourage our investors to review our consolidated financial statements and other publicly filed reports in their entirety and not to rely on a single financial measure.
Refer to “Mid-Atlantic” in “Results of Operations—Mirant Americas Generation” above for our realized and unrealized gross margin and operating expenses, additional related details and variance explanations.
Operating Statistics
Our Net Capacity Factor for the year ended December 31, 2008, was 33% compared to 37% for the same period in 2007. Our power generation volumes for the year ended December 31, 2008 (in gigawatt hours) was 14,999 compared to 16,832 for the same period in 2007. See “Operating Statistics” in “Results of Operations—Mirant Americas Generation” above for additional details on Net Capacity Factor and power generation volumes.
104
Table of Contents
Gross Margin
Refer to “Mid-Atlantic” in “Results of Operations—Mirant Americas Generation” above for our realized and unrealized gross margin, additional related details and variance explanations.
Operating Expenses
Refer to “Mid-Atlantic” in “Results of Operations—Mirant Americas Generation” above for our operating expenses variance explanations.
105
Table of Contents
Financial Condition
Liquidity and Capital Resources
We expect that we will have sufficient liquidity for our future operations and capital expenditures. We regularly monitor our ability to finance the needs of our operating, investing and financing activities.
Sources of Funds
The principal sources of our liquidity are expected to be: (1) existing cash on hand and cash flows from our operations and the operations of our subsidiaries; (2) redemptions of preferred shares in Mirant Americas; (3) at its discretion, capital contributions or advances from Mirant North America or letters of credit under its senior credit facilities; and (4) at its discretion, capital contributions from Mirant Corporation.
At December 31, 2009, we had $125 million of cash, which amount was available under the leveraged leases for distribution to Mirant North America.
We consider all short-term investments with an original maturity of three months or less to be cash equivalents. At December 31, 2009 and 2008, except for amounts held in bank accounts to cover upcoming payables, all of our cash and cash equivalents were invested in AAA-rated United States Treasury money market funds.
Our operating cash flows may be affected by, among other things: (1) demand for electricity; (2) the difference between the cost of fuel used to generate electricity and the market value of the electricity generated; (3) commodity prices (including prices for electricity, emissions allowances, natural gas, coal and oil); (4) the cost of operations and maintenance expenses in the ordinary course; (5) planned and unplanned outages; (6) terms with trade creditors; and (7) cash requirements for capital expenditures relating to certain facilities (including those necessary to comply with environmental regulations).
Under the leveraged leases, we are subject to a covenant that restricts our right to make distributions. Our ability to satisfy the criteria set by that covenant in the future could be impaired by factors which negatively affect the performance of our power generating facilities, including interruptions in operations or curtailment of operations to comply with environmental restrictions.
Uses of Funds
Our requirements for liquidity and capital resources, other than for the day-to-day operation of our generating facilities, are significantly influenced by capital expenditures and payments under our leveraged leases.
Capital Expenditures. Our capital expenditures for the year ended December 31, 2009, were $578 million. Our estimated capital expenditures for 2010 and 2011 are $404 million and $108 million, respectively. See Item 1. “Business” for further discussion of our capital expenditures.
Operating Leases. We lease the Dickerson and Morgantown baseload units and associated property through 2029 and 2034, respectively, and have an option to extend the leases. Any extensions of the respective leases would be for less than 75% of the economic useful life of the facility, as measured from the beginning of the original lease term through the end of the proposed remaining lease term. We are accounting for these leases as operating leases. Although there is variability in the scheduled payment amounts over the lease term, we recognize rent expense for these leases on a straight-line basis in accordance with the applicable accounting literature. Rent expense under our leases was $96 million for each of the years ended December 31, 2009, 2008 and 2007. The scheduled payment amounts for our leases are $140 million and $134 million for 2010 and 2011,
106
Table of Contents
respectively. As of December 31, 2009, the total notional minimum lease payments for the remaining term of the leases aggregated approximately $1.9 billion and the aggregate termination value for the leases was approximately $1.4 billion and generally decreases over time. In addition, we are required to post rent reserves in an aggregate amount equal to the greater of the next six months rent, 50% of the next 12 months rent or $75 million.
Debt Obligations, Off-Balance Sheet Arrangements and Contractual Obligations
Our debt obligations, off-balance sheet arrangements and contractual obligations as of December 31, 2009, are as follows (in millions):
| Debt Obligations, Off-Balance Sheet Arrangements and Contractual Obligations by Year | |||||||||||||||||||||
| Total | 2010 | 2011 | 2012 | 2013 | 2014 | >5 Years | |||||||||||||||
| Long-term debt |
$ | 32 | $ | 6 | $ | 6 | $ | 5 | $ | 5 | $ | 5 | $ | 5 | |||||||
| Generating units operating leases |
1,870 | 140 | 134 | 132 | 138 | 131 | 1,195 | ||||||||||||||
| Other operating leases |
111 | 13 | 12 | 11 | 11 | 10 | 54 | ||||||||||||||
| Fuel commitments |
939 | 348 | 336 | 206 | 49 | — | — | ||||||||||||||
| Maryland Healthy Air Act |
269 | 269 | — | — | — | — | — | ||||||||||||||
| Other |
119 | 71 | 13 | 12 | 8 | 6 | 9 | ||||||||||||||
| Total payments |
$ | 3,340 | $ | 847 | $ | 501 | $ | 366 | $ | 211 | $ | 152 | $ | 1,263 | |||||||
Our contractual obligations table does not include our derivative obligations reported at fair value, which are discussed in Note 2 to our consolidated financial statements contained elsewhere in this report and our asset retirement obligations which are discussed in Note 3 to our consolidated financial statements contained elsewhere in this report.
Long-term debt consists of a capital lease by Mirant Chalk Point and is reflected in the current portion of long-term debt and long-term debt on our consolidated balance sheets, which are discussed in Note 4 to our consolidated financial statements contained elsewhere in this report. Long-term debt also includes estimated interest on the capital lease.
Generating units operating leases relate to our minimum lease payments associated with our off-balance sheet leases of the Dickerson and Morgantown baseload units. In addition, we have commitments under other operating leases with various terms and expiration dates.
Fuel commitments primarily relate to long-term coal agreements and related transportation agreements, entered into on our behalf by our affiliate, Mirant Energy Trading.
Maryland Healthy Air Act commitments reflect the remaining expected payments for capital expenditures to comply with the limitations for SO2, NOx and mercury emissions under the Maryland Healthy Air Act. We completed the installation of the remaining pollution control equipment related to compliance with the Maryland Healthy Air Act in the fourth quarter of 2009. However, provisions in our construction contracts provide that certain payments be made after final completion of the project.
Other primarily represents the open purchase orders less invoices received related to general procurement of products and services purchased in the ordinary course of business. These include construction, maintenance and labor activities at our generating facilities. Other also includes limestone supply and transportation agreements, entered into on our behalf by our affiliate, Mirant Energy Trading.
107
Table of Contents
Cash Flows
Year Ended December 31, 2009 versus Year Ended December 31, 2008
The changes in our cash flows are detailed as follows (in millions):
| Years Ended December 31, | ||||||||||||
| 2009 | 2008 | Increase/ (Decrease) |
||||||||||
| Cash and cash equivalents, beginning of year |
$ | 125 | $ | 242 | $ | (117 | ) | |||||
| Net cash provided by operating activities |
607 | 597 | 10 | |||||||||
| Net cash used in investing activities |
(563 | ) | (667 | ) | 104 | |||||||
| Net cash used in financing activities |
(44 | ) | (47 | ) | 3 | |||||||
| Cash and cash equivalents, end of year |
$ | 125 | $ | 125 | $ | — | ||||||
Operating Activities. Our cash provided by operating activities is affected by seasonality, changes in energy prices and fluctuations in our working capital requirements. Net cash provided by operating activities increased $10 million for the year ended December 31, 2009, compared to the same period in 2008, primarily as a result of the following:
| — | Realized gross margin. An increase in cash provided of $84 million in 2009, compared to the same period in 2008, excluding an increase in non-cash lower of cost or market fuel inventory adjustments of $15 million. See “Results of Operations” for additional discussion of our performance in 2009 compared to the same period in 2008; partially offset by |
| — | Other operating assets and liabilities. An increase in cash used of $30 million related to changes in other operating assets and liabilities, of which approximately $19 million related to the timing of property tax payments in 2009 compared to 2008 and approximately $10 million related to option premiums received in 2008 compared to 2009; |
| — | Prepaid rent. An increase in cash used of $22 million because the scheduled rent payments for our leveraged leases were higher for 2009 than 2008; and |
| — | Operating expense. An increase in cash used related to higher operations and maintenance expense of $22 million. See “Results of Operations” for additional discussion of our performance in 2009 compared to the same period in 2008. |
Investing Activities. Net cash used in investing activities decreased by $104 million for the year ended December 31, 2009, compared to the same period in 2008. This difference was primarily a result of the following:
| — | Capital expenditures. A decrease in cash used of $63 million primarily related to our environmental capital expenditures for our Maryland generating facilities related to our compliance with the Maryland Healthy Air Act; |
| — | Restricted deposit payments and other. A decrease in cash used of $35 million primarily as a result of $34 million placed in an escrow account in September 2008, to satisfy the conditions of Mirant Potomac River’s agreement with the City of Alexandria, Virginia. See Note 12 to our consolidated financial statements contained elsewhere in this report for additional information on Mirant Potomac River’s agreement with the City of Alexandria, Virginia; and |
| — | Proceeds from the sales of assets. An increase in cash provided of $6 million related to sales of emissions allowances primarily to third parties. |
108
Table of Contents
Financing Activities. Net cash used in financing activities decreased by $3 million for the year ended December 31, 2009, compared to the same period in 2008. This difference was primarily a result of the following:
| — | Distribution to member. A decrease in cash used of $200 million as a result of distributions of $125 million in 2009, as compared to $325 million in 2008; |
| — | Redemption of preferred stock. An increase in cash provided of $53 million as result of the redemption of Series A preferred stock of Mirant Americas. See Note 6 to our consolidated financial statements contained elsewhere in this report for additional information; partially offset by |
| — | Capital contributions. A decrease in cash provided of $250 million as a result of contributions received from Mirant North America in 2008. We received no contributions in 2009. |
Year Ended December 31, 2008 versus Year Ended December 31, 2007
The changes in our cash flows are detailed as follows (in millions):
| Years Ended December 31, | ||||||||||||
| 2008 | 2007 | Increase/ (Decrease) |
||||||||||
| Cash and cash equivalents, beginning of year |
$ | 242 | $ | 75 | $ | 167 | ||||||
| Net cash provided by operating activities |
597 | 750 | (153 | ) | ||||||||
| Net cash used in investing activities |
(667 | ) | (526 | ) | (141 | ) | ||||||
| Net cash used in financing activities |
(47 | ) | (57 | ) | 10 | |||||||
| Cash and cash equivalents, end of year |
$ | 125 | $ | 242 | $ | (117 | ) | |||||
Operating Activities. Our cash provided by operating activities is affected by seasonality, changes in energy prices and fluctuations in our working capital requirements. Net cash provided by operating activities decreased $153 million for the year ended December 31, 2008, compared to the same period in 2007, primarily as a result of the following:
| — | Operating expense. An increase in cash used of $52 million related to an increase in operations and maintenance expenses. See “Results of Operations” for additional discussion; |
| — | Realized gross margin. A decrease in realized gross margin of $36 million in 2008, compared to the same period in 2007, excluding the non-cash change in lower of cost or market inventory adjustments of $10 million, of which $13 million was recognized in the fourth quarter of 2008. See “Results of Operations” for additional discussion of our performance in 2008 compared to the same period in 2007; |
| — | Inventories. An increase in cash used of $29 million as a result of changes in our materials and supplies and fuel stock inventories; and |
| — | Net accounts receivable and payable. An increase in cash used of $36 million related to changes in net accounts receivable, accounts payable and accrued liabilities and other changes in working capital in 2008 compared to 2007, primarily as a result of increases in power prices in 2008. |
Investing Activities. Net cash used in investing activities increased by $141 million for the year ended December 31, 2008, compared to the same period in 2007. This difference was primarily a result of the following:
| — | Capital expenditures. An increase in cash used of $110 million in capital expenditures in 2008 as compared to 2007, primarily because of our environmental capital expenditures for our Maryland generating facilities; |
109
Table of Contents
| — | Restricted deposit payments and other. An increase in cash used of $37 million primarily related to $34 million placed in an escrow account in September 2008, to satisfy the conditions of Mirant Potomac River’s agreement with the City of Alexandria, Virginia; partially offset by |
| — | Proceeds from the sales of assets. An increase of $6 million in proceeds from the sales of assets in 2008 as compared to 2007, primarily related to sale of excess emissions allowances. |
Financing Activities. Net cash used in financing activities decreased by $10 million for the year ended December 31, 2008, compared to the same period in 2007. This difference was primarily a result of the following:
| — | Distribution to member. A decrease in cash used of $9 million as a result of distributions of $325 million to our member in 2008, as compared to $334 million in 2007; |
| — | Redemption of preferred stock. An increase in cash provided of $26 million as a result of the redemption of Series A preferred stock issued by Mirant Americas. See Note 6 to our consolidated financial statements contained elsewhere in this report for additional information related to the redemption of preferred shares; partially offset by |
| — | Capital contributions. A decrease in cash provided of $24 million as a result of capital contributions. In 2008, we received capital contributions of $250 million compared to $274 million in 2007. |
110
Table of Contents
Critical Accounting Estimates (Mirant Americas Generation, Mirant North America and Mirant Mid-Atlantic)
The accounting policies described below are considered critical to obtaining an understanding of our consolidated financial statements because their application requires significant estimates and judgments by management in preparing our consolidated financial statements. Management’s estimates and judgments are inherently uncertain and may differ significantly from actual results achieved. Management considers an accounting estimate to be critical if the following conditions apply:
| — | the estimate requires significant assumptions; and |
| — | changes in the estimate could have a material effect on our consolidated results of operations or financial condition; or |
| — | if different estimates that could have been selected had been used, there could be a material effect on our consolidated results of operations or financial condition. |
We have discussed the selection and application of these accounting estimates with the Audit Committee of the Board of Directors and our independent auditors. It is management’s view that the current assumptions and other considerations used to estimate amounts reflected in our consolidated financial statements are appropriate. However, actual results can differ significantly from those estimates under different assumptions and conditions. The sections below contain information about our most critical accounting estimates, as well as the effects of hypothetical changes in the material assumptions used to develop the estimates.
Revenue Recognition and Accounting for Energy Trading and Marketing Activities
Nature of Estimates Required. We utilize two comprehensive accounting models, an accrual model and a fair value model, in reporting our results of operations and financial position. We determine the appropriate model for our operations based on applicable accounting standards.
The accrual model is used to account for our revenues from the sale of energy, capacity and ancillary services. We recognize revenue when it has been earned and collection is probable as a result of electricity delivered or capacity available to customers pursuant to contractual commitments that specify volume, price and delivery requirements. Sales of energy are based on economic dispatch, or they may be ‘as-ordered’ by an ISO or RTO, based on member participation agreements, but without an underlying contractual commitment. ISO and RTO revenues and revenues for sales of energy based on economic dispatch are recorded on the basis of MWh delivered, at the relevant day-ahead or real-time prices.
The fair value model is used to measure fair value on a recurring basis for derivative energy contracts that are used to manage our exposure to commodity price risk or that are used in Mirant Americas Generation’s and Mirant North America’s proprietary trading and fuel oil management activities. We use a variety of derivative financial instruments, such as futures, forwards, swaps and option contracts, in the management of our business. Such derivative financial instruments have varying terms and durations, or tenors, which range from a few days to a number of years, depending on the instrument.
Derivative financial instruments are reflected in our consolidated financial statements at fair value, with changes in fair value recognized currently in income unless they qualify for a scope exception pursuant to the accounting guidance. Management considers fair value techniques and valuation adjustments related to credit and liquidity to be critical accounting estimates. These estimates are considered significant because they are highly susceptible to change from period to period and are dependent on many subjective factors. The fair value of derivative financial instruments is included in derivative contract assets and liabilities in our consolidated balance sheets. Transactions that are not accounted for using the fair value model under the accounting
111
Table of Contents
guidance for derivative financial instruments are either not derivatives or qualify for a scope exception and are accounted for under accrual accounting. We recognize immediately in income inception gains and losses for transactions at other than the bid price or ask price.
Key Assumptions and Approach Used. Determining the fair value of our derivatives is based largely on observable quoted prices from exchanges and independent brokers in active markets. We think that these prices represent the best available information for valuation purposes. For most delivery locations and tenors where we have positions, we receive multiple independent broker price quotes. In accordance with the exit price objective under the fair value measurements accounting guidance, the fair value of our derivative contract assets and liabilities is determined based on the net underlying position of the recorded derivative contract assets and liabilities using bid prices for our assets and ask prices for liabilities. If no active market exists, we estimate the fair value of certain derivative financial instruments using price extrapolation, interpolation and other quantitative methods. We have not identified any distressed market conditions that would alter our valuation techniques at December 31, 2009. Fair value estimates involve uncertainties and matters of significant judgment. Our techniques for fair value estimation include assumptions for market prices, correlation and volatility. The degree of estimation increases for longer duration contracts, contracts with multiple pricing features, option contracts and off-hub delivery points. Note 2 to our consolidated financial statements contained elsewhere in this report explains the fair value hierarchy. Mirant Americas Generation’s and Mirant North America’s assets and liabilities classified as Level 3 in the fair value hierarchy represent approximately 2% of their total assets and less than 1% of their total liabilities measured at fair value at December 31, 2009. Mirant Mid-Atlantic’s assets classified as Level 3 in the fair value hierarchy represented approximately 1% of its total assets, and its liabilities measured at fair value classified as Level 3 were inconsequential.
The fair value of derivative contract assets and liabilities in our consolidated balance sheets is also affected by our assumptions as to time value, credit risk and non-performance risk. The nominal value of the contracts is discounted using a forward interest rate curve based on LIBOR. In addition, the fair value of our derivative contract assets is reduced to reflect the estimated default risk of counterparties on their contractual obligations to us. The default risk of our counterparties for a significant portion of our overall net position is measured based on published spreads on credit default swaps. The fair value of our derivative contract liabilities is reduced to reflect our estimated risk of default on our contractual obligations to counterparties and is measured based on published default rates of our debt. The credit risk reflected in the fair value of our derivative contract assets and the non-performance risk reflected in the fair value of our derivative contract liabilities are calculated with consideration of our master netting agreements with counterparties and our exposure is reduced by cash collateral posted to us against these obligations.
Effect if Different Assumptions Used. The amounts recorded as revenue or cost of fuel, electricity and other products change as estimates are revised to reflect actual results and changes in market conditions or other factors, many of which are beyond our control. Because we use derivative financial instruments and have not elected cash flow or fair value hedge accounting, certain components of our financial statements, including gross margin, operating income and balance sheet ratios, are at times volatile and subject to fluctuations in value primarily as a result of changes in forward energy and fuel prices. Significant negative changes in fair value could require us to post additional collateral either in the form of cash or letters of credit. Because the fair value measurements of our material assets and liabilities are based on observable market information, there is not a significant range of values around the fair value estimate. For our derivative financial instruments that are measured at fair value using quantitative pricing models, a significant change in estimate could affect our results of operations and cash flows at the time contracts are ultimately settled. The estimated fair value of Mirant Americas Generation’s and Mirant North America’s derivative contract assets and liabilities was a net asset of $702 million at December 31, 2009. A 10% change in electricity and fuel prices would result in approximately a $270 million change in the fair value of their net asset at December 31, 2009. The estimated fair value of Mirant Mid-Atlantic’s derivative contract assets and liabilities was a net asset of $670 million at
112
Table of Contents
December 31, 2009. A 10% change in electricity and fuel prices would result in approximately a $261 million change in the fair value of its net asset at December 31, 2009. See Item 7A. “Quantitative and Qualitative Disclosures About Market Risk” for further sensitivities in our assumptions used to calculate fair value. See Note 2 to our consolidated financial statements contained elsewhere in this report for further information on derivative financial instruments related to energy trading and marketing activities.
Income Taxes
Mirant Americas Generation and Mirant North America
We and most of our subsidiaries are limited liability companies that are treated as branches of Mirant Americas for income tax purposes. As a result, Mirant Americas and Mirant have direct liability for the majority of the federal and state income taxes relating to our operations. Some of our subsidiaries exist as regarded corporate entities for income tax purposes. They are Hudson Valley Gas, Mirant Kendall and Mirant Special Procurement, Inc. For the subsidiaries that continue to exist as corporate regarded entities, we allocate current and deferred income taxes to each corporate regarded entity as if such entity were a single taxpayer utilizing the asset and liability method to account for income taxes. To the extent we provide tax expense or benefit, any related tax payable or receivable to Mirant is reclassified to equity in the same period since we do not have a tax sharing agreement with Mirant.
Deferred tax assets and liabilities are recognized for the regarded corporate entities for the future tax consequences attributable to differences between the financial statement carrying amounts of existing assets and liabilities and their respective tax bases and operating loss and tax credit carry forwards. When necessary, deferred tax assets are reduced by a valuation allowance to reflect the amount that is estimated to be recoverable. In assessing the recoverability of our deferred tax assets, we consider whether it is likely that some portion or all of the deferred tax assets will be realized. Deferred tax assets and liabilities are measured using enacted tax rates expected to apply to taxable income in the years in which those temporary differences are expected to be recovered or settled. The effect on deferred tax assets and liabilities of a change in tax rates is recognized in income in the period that includes the enactment date.
The determination of a valuation allowance requires significant judgment as to the generation of taxable income during future periods for which temporary differences are expected to be deductible. In making this determination, management considers all available positive and negative evidence affecting specific deferred tax assets, including our past and anticipated future performance, the reversal of deferred tax liabilities and the implementation of tax planning strategies.
As a result of changes in Mirant’s stock ownership, including Mirant’s repurchases of shares of common stock since July 11, 2006, and the exercise of a significant number of warrants for Mirant’s common stock during 2008, Mirant experienced an “ownership change” within the meaning of Internal Revenue Code §382 as amended, in the third quarter of 2008. Our annual limitation on the amount of taxable income that can be offset by our then existing NOLs has been redetermined as of the date of that ownership change. We do not expect that the ability to offset any future taxable income with existing NOLs under the redetermined annual limitation will be significantly different from our ability to do so under the annual limitation prior to the ownership change that occurred in the third quarter of 2008. However, if Mirant experiences another ownership change after December 31, 2009, at or near its recent stock price levels, the redetermined annual limitation for Mirant Americas Generation and Mirant North America could be lower and could result in the recognition of additional current tax expense in future periods.
Additionally, we have not recognized any tax benefits relating to tax uncertainties arising in the ordinary course of business that are less than or subject to the measurement threshold of the more-likely-than-not
113
Table of Contents
standard prescribed under the accounting guidance for accounting for uncertainty of income taxes. These unrecognized tax benefits may be either a tax liability or an adjustment to our NOLs based on the specific facts of each tax uncertainty. We periodically assess our tax uncertainties based on the latest information available. The amount of the unrecognized tax benefit requires management to make significant assumptions about the expected outcomes of certain tax positions included in our filed or yet to be filed tax returns.
Mirant Mid-Atlantic
We and our subsidiaries are limited liability companies that are treated as branches of Mirant Americas for income tax purposes. As such, Mirant Americas and Mirant have direct liability for the majority of the federal and state income taxes relating to our operations.
Long-Lived Assets
Estimated Useful Lives
Nature of Estimates Required. The estimated useful lives of our long-lived assets are used to compute depreciation expense, determine the carrying value of asset retirement obligations and estimate expected future cash flows attributable to an asset for the purposes of impairment testing. Estimated useful lives are based, in part, on the assumption that we provide an appropriate level of capital expenditures while the assets are still in operation. Without these continued capital expenditures, the useful lives of these assets could decrease significantly.
Key Assumptions and Approach Used. Estimated useful lives are the mechanism by which we allocate the cost of long-lived assets over the asset’s service period. We perform depreciation studies periodically to update changes in estimated useful lives. The actual useful life of an asset could be affected by changes in estimated or actual commodity prices, environmental regulations, various legal factors, competitive forces and our liquidity and ability to sustain required maintenance expenditures and satisfy asset retirement obligations. We use composite depreciation for groups of similar assets and establish an average useful life for each group of related assets. In accordance with the accounting guidance related to evaluating long-lived assets for impairment, we cease depreciation on long-lived assets classified as held for sale. Also, we may revise the remaining useful life of an asset held and used subject to impairment testing. See Note 3 to our consolidated financial statements contained elsewhere in this report for additional information related to our property, plant and equipment.
Effect if Different Assumptions Used. The determination of estimated useful lives is dependent on subjective factors such as expected market conditions, commodity prices and anticipated capital expenditures. Since composite depreciation rates are used, the actual useful life of a particular asset may differ materially from the useful life estimated for the related group of assets. A 10% increase in the weighted average useful lives of Mirant Americas Generation’s and Mirant North America’s facilities would result in a $20 million decrease in annual depreciation expense. A 10% increase in the weighted average useful lives of Mirant Mid-Atlantic’s facilities would result in a $15 million decrease in its annual depreciation expense. A 10% decrease in the weighted average useful lives of Mirant Americas Generation’s and Mirant North America’s facilities would result in a $17 million increase in their annual depreciation expense. A 10% decrease in the weighted average useful lives of Mirant Mid-Atlantic’s facilities would result in an $18 million increase in its annual depreciation expense. In the event the useful lives of significant assets were found to be shorter than originally estimated, depreciation expense may increase, liabilities recognized for future asset retirement obligations may be insufficient and impairments in the carrying value of tangible and intangible assets may result.
114
Table of Contents
Asset Retirement Obligations
Nature of Estimates Required. We account for asset retirement obligations under the accounting guidance for asset retirement obligations and conditional asset retirements. This guidance requires an entity to recognize the fair value of a liability for conditional and unconditional asset retirement obligations in the period in which they are incurred. Retirement obligations associated with long-lived assets included within the scope of the accounting guidance are those obligations for which a requirement exists under enacted laws, statutes and written or oral contracts, including obligations arising under the doctrine of promissory estoppel. Asset retirement obligations are estimated using the estimated current cost to satisfy the retirement obligation, increased for inflation through the expected period of retirement and discounted back to present value at our credit-adjusted risk free rate. Mirant Americas Generation and Mirant North America have identified certain asset retirement obligations within their power generating operations and have a noncurrent liability of $43 million recorded as of December 31, 2009. Mirant Mid-Atlantic has identified certain retirement obligations with its power generating operations and has a noncurrent liability of $13 million recorded as of December 31, 2009. These asset retirement obligations are primarily related to asbestos abatement at some of our generating facilities, the removal of oil storage tanks, equipment on leased property and environmental obligations related to the closing of ash disposal sites.
Key Assumptions and Approach Used. The fair value of liabilities associated with the initial recognition of asset retirement obligations is estimated by applying a present value calculation to current engineering cost estimates of satisfying the obligations. Significant inputs to the present value calculation include current cost estimates, estimated asset retirement dates and appropriate discount rates. Where appropriate, multiple cost and/or retirement scenarios have been probability weighted.
Effect if Different Assumptions Used. We update liabilities associated with asset retirement obligations as significant assumptions change or as relevant new information becomes available. A 1% increase in Mirant Americas Generation’s and Mirant North America’s rate of inflation would result in an approximate $5 million increase to the asset retirement obligation recorded on their consolidated balance sheets as of December 31, 2009, and a 1% increase or decrease in their discount rate would result in an approximate $4 million change. A 1% increase in Mirant Mid-Atlantic’s rate of inflation would result in an approximate $2 million increase to the asset retirement obligation recorded on its consolidated balance sheet as of December 31, 2009, and a 1% increase or decrease in its discount rate would result in an approximate $2 million change.
Goodwill (Mirant Mid-Atlantic)
Nature of Estimates Required. We evaluate our goodwill for impairment at least annually and periodically if indicators of impairment are present in accordance with the accounting guidance related to goodwill and other intangible assets. The results of our impairment testing may be affected by a significant adverse change in the extent or manner in which a reporting unit’s assets are being used, a significant adverse change in legal factors or in the business climate that could affect the value of a reporting unit, as well as other economic or operational analyses. If the carrying amount of the reporting unit is not recoverable, an impairment charge is recorded. The amount of the impairment charge, if impairment exists, is calculated as the difference between the fair value of the reporting unit goodwill and its carrying value. For this test, our business constitutes a single reporting unit. We perform our annual assessment of goodwill at October 31 and whenever contrary evidence exists as to the recoverability of goodwill.
Key Assumptions and Approach Used. The accounting estimates related to determining the fair value of goodwill require management to make assumptions about cost of capital, future revenues, operating costs, capital expenditures and forward commodity prices over the life of the assets as well as evaluating observable market data. Our assumptions about future revenues, costs and forward prices require significant judgment because such factors have fluctuated in the past and will continue to do so in the future.
115
Table of Contents
We performed our annual test for goodwill impairment effective October 31, 2009. The test was based upon our most recent business plan and market data from independent sources. We utilized multiple valuation approaches in arriving at a fair value of our reporting unit for purposes of the test, including an income approach involving discounted cash flows and a market approach involving trading multiples of peer companies. We placed greater weighting on the market approach in the current year as compared to the prior year based on the adoption of accounting guidance related to fair value measurements in 2009. No weighting was placed on the transaction method in the current year because there have been no comparable recent transactions, specifically no transactions for baseload coal-fired generating facilities in the PJM market. In addition to the market approaches listed above, we also performed a reconciliation of the fair value of the Mid-Atlantic reporting unit to the market capitalization of Mirant Corporation, adjusted for a control premium, as a reasonableness check for the other approaches. The reconciliation resulted in a value that was consistent with the other approaches. We assigned a 50% weighting to the income approach and a 50% weighting to the market approach to determine the fair value of the reporting unit. However, a change in the relative weightings between the income and market approach would have an immaterial effect on the outcome of the goodwill impairment analysis. The annual evaluation of goodwill indicated that the carrying value of the reporting unit exceeded the fair value, requiring the second step of the goodwill analysis to be performed.
Based on the results of the step one goodwill impairment analysis, we tested our long-lived assets for impairment under the accounting guidance related to impairment of long-lived assets. The long-lived assets must be first tested for impairment before completion of the step two test for goodwill. As a result of the impairment of long-lived assets assessment, we determined that the Potomac River generating facility was impaired, as the carrying value exceeded the undiscounted cash flows. We recorded an impairment loss of $202 million on our consolidated statement of operations to reduce the carrying value of the Potomac River generating facility to its estimated fair value. We determined that none of our other long-lived assets was impaired at October 31, 2009. See Note 3 to our consolidated financial statements contained elsewhere in this report for additional information related to our property, plant and equipment.
We then performed the second step of the goodwill impairment test, which requires an allocation of the fair value as the purchase price in a hypothetical acquisition of the reporting unit. The fair value of the reporting unit was compared to the fair value of the tangible and intangible assets and the remaining value was the implied goodwill. As a result of this analysis, we recorded an impairment loss of $183 million on our consolidated statement of operations to reduce the carrying value of goodwill to its implied fair value.
Our assessment of goodwill included assumptions about the following:
| — | electricity, fuel and emissions prices; |
| — | capacity payments under the RPM provisions of PJM’s tariff; |
| — | costs of CO2 allowances under a potential federal cap-and-trade program; |
| — | timing of announced transmission projects; |
| — | timing and extent of generating capacity additions and retirements; and |
| — | future capital expenditure requirements for the generating facility. |
Our assumptions related to future electricity and fuel prices were based on observable market prices to the extent available and long-term prices derived from proprietary fundamental market modeling. Our long-term capacity prices are based on the assumption that the PJM RPM capacity market would continue consistent with the current structure, with expected increases in revenue as a result of declines in reserve margins for periods beyond those for which auctions have already been completed. We also assumed that a federal CO2 cap-and-trade program would be instituted later this decade. There are several transmission projects currently planned in the Mid-Atlantic region, including the Trans-Allegheny Interstate Line (“TrAIL”), Mid-Atlantic
116
Table of Contents
Power Pathway transmission line (“MAPP”) and the Potomac-Appalachian transmission line (“PATH”). Our assumptions regarding the timing of these projects were based on the current status of permitting and construction of each project. Our assumptions regarding electricity demand are based on forecasts from PJM and assumptions for generating capacity additions and retirements consider publicly-announced projects, including renewable sources of electricity and additions of nuclear capacity. In addition, the assumptions exclude general corporate overhead allocations, but include overhead allocations from Mirant Energy Trading under the assumption that a market participant would utilize a trading company to manage the procurement of fuel and the sale of electricity.
Our estimates of future cash flows did not include contracts entered into to hedge economically the expected generation of our generating facilities. The cash flows related to these contracts were excluded because they were not directly attributable to our generating facilities.
The following chart details our assumptions used in the goodwill impairment analysis:
| October 2009 | October 2008 | |||||
| Income Approach Assumptions: |
||||||
| EBITDA multiple for terminal value calculation1 |
8.0 | 7.0 | ||||
| Market Approach Assumptions: |
||||||
| EBITDA multiple for public company approach2 |
6.5 | 7.2 | ||||
| Valuation Approach Weightings3: |
||||||
| Income approach |
50 | % | 60 | % | ||
| Market approach |
50 | % | 40 | % |
| 1 | Changed primarily as a result of market factors affecting peer companies. |
| 2 | Changed primarily as a result of changes in trading multiples of peer companies’ common stock. |
| 3 | Changed primarily as a result of increased focus on market-based approaches. |
Effect if Different Assumptions Used. Our estimates and assumptions used in the goodwill analysis are subject to a high degree of uncertainty, and changes in these assumptions could affect the amount of the impairment loss or result in additional future impairment losses. A decrease in projected electricity prices or an increase in coal prices would decrease the future cash flows of our generating facilities, thus increasing the amount of the impairment loss recognized. Additionally, changes to the structure of the PJM RPM capacity market could negatively affect the future capacity prices we expect our facilities to earn. Our assumptions include the development of a potential federal cap-and-trade program for CO2 emissions. If we are not compensated for the costs of complying with a federal CO2 program through allocated CO2 allowances, increased electricity and capacity prices or decreased coal prices, our cash flows would be negatively affected. If the planned transmission projects are completed earlier than we assumed, this could negatively affect the cash flows of the facilities as there would be a decrease in the demand for electricity generated by our facilities. In addition, changes to our assumptions regarding generating capacity additions and retirements in the PJM region could affect the cash flows, depending on the timing and extent of additions and retirements. Our assumptions include only those capital expenditures needed to keep the generating facilities operational through their estimated remaining useful lives. However, changes in laws or regulations could require us to invest additional capital beyond amounts budgeted to keep the generating facilities operational.
Asset Impairments
Nature of Estimates Required. We evaluate our long-lived assets, including intangible assets, for impairment in accordance with applicable accounting guidance. The amount of an impairment charge is calculated as the excess of the asset’s carrying value over its fair value, which generally represents the discounted expected future cash flows attributable to the asset, or in the case of an asset we expect to sell, as its fair value less costs to sell.
117
Table of Contents
The accounting guidance related to impairments of long-lived assets requires management to recognize an impairment charge if the sum of the undiscounted expected future cash flows from a long-lived asset or definite-lived intangible asset is less than the carrying value of that asset. We evaluate our long-lived assets (property, plant and equipment) and definite-lived intangible assets for impairment whenever indicators of impairment exist or when we commit to sell the asset. These evaluations of long-lived assets and definite-lived intangible assets may result from significant decreases in the market price of an asset, a significant adverse change in the extent or manner in which an asset is being used or in its physical condition, a significant adverse change in legal factors or in the business climate that could affect the value of an asset, as well as other economic or operational analyses. If the carrying amount is not recoverable, an impairment charge is recorded.
The continued decline in natural gas prices has caused power prices to continue to decline over the past year, thereby reducing the energy gross margin earned by our generating facilities. Additionally, the current economic recession and various demand-response programs have resulted in a decrease in the forecasted gross margin of our generating facilities. On an ongoing basis, we evaluate our long-lived assets for indications of impairment; however, given the remaining useful lives for many of our generating facilities, the total undiscounted cash flows for these generating facilities are more significantly affected by the long-term view of supply and demand than by the short term fluctuations in energy prices and demand. As such, we typically do not consider short term decreases in either energy prices or demand to cause an impairment evaluation.
Key Assumptions and Approach Used. The impairment evaluation is a two-step process, the first of which involves comparing the undiscounted cash flows to the carrying value of the asset. If the carrying value exceeds the undiscounted cash flows, the fair value of the asset must be calculated on a discounted basis. The fair value of an asset is the price that would be received from a sale of the asset in an orderly transaction between market participants at the measurement date. Quoted market prices in active markets are the best evidence of fair value and are used as the basis for the measurement, when available. In the absence of quoted prices for identical or similar assets, fair value is estimated using various internal and external valuation methods. These methods include discounted cash flow analyses and reviewing available information on comparable transactions. The determination of fair value requires management to apply judgment in estimating future capacity and energy prices, environmental and maintenance expenditures and other cash flows. Our estimates of the fair value of the assets include significant assumptions about the timing of future cash flows, remaining useful lives and the selection of a discount rate that represents the estimated weighted average cost of capital consistent with the risk inherent in future cash flows.
Year Ended December 31, 2009
Mirant Bowline—In the second quarter of 2009, Mirant Americas Generation and Mirant North America evaluated their 1,139 MW Bowline generating facility for impairment based on the five-year forecast at the time, which indicated that Mirant Bowline would operate at a net loss for the next several years. Mirant Americas Generation’s and Mirant North America’s estimates of the asset’s undiscounted future cash flows for purposes of their impairment analysis required significant judgments related to future property tax assessments of the asset. Mirant Americas Generation’s and Mirant North America’s estimates also included assumptions related to the future capacity and energy revenues their Bowline generating facility is projected to earn. Additionally, Mirant Americas Generation and Mirant North America assumed they would monetize excess emissions allowances by selling them. The sum of the probability weighted undiscounted cash flows through the facility’s estimated remaining useful life exceeded the carrying value as of June 30, 2009. There were no additional events in the third or fourth quarter of 2009 that required Mirant Americas Generation and Mirant North America to update their previous impairment analysis. As a result, Mirant Americas Generation and Mirant North America did not record an impairment charge for the year ended December 31, 2009. Mirant Americas Generation and Mirant North America continue to monitor developments related to market prices for capacity and energy, supply and demand forecasts from the NYISO and the status of legal proceedings related
118
Table of Contents
to property taxes to determine if further impairment analyses in future periods are required. The carrying value of the Bowline generating facility represented approximately 4% of Mirant Americas Generation’s and Mirant North America’s total property, plant and equipment, net at December 31, 2009. See Note 3 to the consolidated financial statements contained elsewhere in this report for further information related to Mirant Americas Generation’s and Mirant North America’s impairment analysis of the Bowline generating facility.
Mirant Potrero—In the third quarter of 2009, Mirant Potrero executed a settlement agreement with the City of San Francisco in which it agreed to shut down the Potrero generating facility when it is no longer needed for reliability, as determined by the CAISO. That settlement agreement became effective in November 2009, following its approval by the City’s Board of Supervisors and Mayor. Mirant Potrero agreed in the settlement agreement to submit to the CAISO a notice of intent to shut down the facility as of December 31, 2010. The CAISO will make the final determination on when each of the units at the Potrero generating facility is no longer needed for reliability and may be shut down. As a result of the settlement agreement, Mirant Americas Generation and Mirant North America evaluated their 362 MW Potrero generating facility for impairment during the third quarter. Mirant Americas Generation and Mirant North America developed multiple scenarios for the future expected operations of the Potrero generating facility based on the settlement agreement and the expected timing of certain projects to ensure reliability of electricity supply for the City of San Francisco. One such project is the TransBay Cable, an underwater electric transmission cable in the San Francisco Bay that is expected to decrease the need for generating resources in the City of San Francisco, and that we expect to become operational by mid-2010 and thereby reduce the need for Mirant Americas Generation’s and Mirant North America’s Potrero unit 3 for reliability. Mirant Americas Generation’s and Mirant North America’s cash flows included assumptions about the future operating costs of the Potrero generating facility as well as the corresponding revenues to be received under its RMR agreement. Mirant Americas Generation and Mirant North America also obtained multiple appraisals to value the land. The sum of the probability weighted undiscounted cash flows for the Potrero generating facility exceeded the carrying value as of September 30, 2009. As a result, Mirant Americas Generation and Mirant North America did not record an impairment charge for the tangible assets at the Potrero generating facility.
In January 2010, the CAISO advised the City of San Francisco that the expected replacement in 2010 of two underground transmission cables, if completed successfully, would allow the CAISO not to require the continued operation of the remaining units of the Potrero generating facility, units 4, 5 and 6, for reliability purposes after 2010. The CAISO will not determine which units of the Potrero generating facility are required to operate in 2011 for reliability purposes until the fall of 2010, but Mirant Potrero expects that none of the units of the Potrero generating facility will be required to operate for reliability purposes after 2010 and that all of the units will close by the end of 2010. As a result, Mirant Americas Generation and Mirant North America reviewed their previous impairment for the tangible assets at the Potrero generating facility. The development related to the expected shutdown of units 4, 5 and 6 by the end of 2010 does not result in an impairment charge. The carrying value of the Potrero generating facility represented less than 1% of Mirant Americas Generation’s and Mirant North America’s total property, plant and equipment, net at December 31, 2009.
The asset group for Mirant Potrero included intangible assets recorded at Mirant California related to trading rights and development rights. As a result of certain terms included in the settlement agreement, Mirant Americas Generation and Mirant North America separately evaluated the trading and development rights associated with the Potrero generating facility for impairment and determined that both of these intangible assets were fully impaired as of September 30, 2009. Accordingly, Mirant Americas Generation and Mirant North America recognized an impairment loss of $9 million on their consolidated statements of operations to write off the carrying value of the intangible assets related to the Potrero generating facility. See Note 3 to Mirant Americas Generation’s and Mirant North America’s consolidated financial statements contained elsewhere in this report for further information related to Mirant Americas Generation’s and Mirant North America’s impairment analysis of the Potrero generating facility and related intangible assets.
119
Table of Contents
Mirant Delta—On September 2, 2009, Mirant Delta entered into a new agreement with PG&E for the 674 MW at Contra Costa units 6 and 7 for the period from November 2011 through April 2013. At the end of the agreement, and subject to any necessary regulatory approval, Mirant Delta has agreed to retire Contra Costa units 6 and 7, which began operations in 1964, in furtherance of state and federal policies to retire aging power plants that utilize once-through cooling technology. The new Mirant Delta agreement is subject to approval by the CPUC. Mirant Americas Generation and Mirant North America evaluated the trading rights related to Mirant Delta’s Contra Costa generating facility for impairment during the third quarter of 2009 as a result of the retirement provisions in the new tolling agreement. Because the Contra Costa generating facility is under contract with PG&E through the expected shutdown date, Mirant Americas Generation and Mirant North America determined the intangible asset was fully impaired as of September 30, 2009. Mirant Americas Generation and Mirant North America recorded an impairment loss of $5 million on their consolidated statements of operations to write off the carrying value of the trading rights related to the Contra Costa generating facility.
Mirant Canal—Mirant Americas Generation’s and Mirant North America’s 1,126 MW Canal generating facility is located in the lower SEMA load zone in the ISO-NE control area. ISO-NE previously has determined that, at times, it is necessary for the Canal generating facility to operate to meet local reliability criteria for SEMA when it is not economic for the Canal generating facility to operate based upon prevailing market prices. When the Canal generating facility operates to meet local reliability criteria, Mirant Americas Generation and Mirant North America are compensated at the price they bid into the ISO-NE, pursuant to ISO-NE market rules, rather than at the lower market price.
During 2009, NSTAR Electric Company completed planned upgrades to the SEMA transmission system. These upgrades are expected to reduce the need for the Canal generating facility to operate and caused a reduction in energy gross margin compared to historical levels. The final phase of these transmission upgrades was completed in the third quarter of 2009. With the completion of the transmission upgrades, Mirant Americas Generation and Mirant North America expect that the future revenues of the Canal generating facility will be principally capacity revenue from ISO-NE forward capacity market. Mirant Americas Generation’s and Mirant North America’s current projections indicate that the undiscounted cash flows exceed the carrying value of the facility at December 31, 2009. As a result, Mirant Americas Generation and Mirant North America did not record an impairment charge because of the transmission upgrades. Mirant Americas Generation and Mirant North America continue to monitor developments related to their Canal generating facility, including the NPDES and SWD Permit. See Item 1. “Business—Environmental Regulation” for further information related to the NPDES and SWD Permit for the Canal generating facility. The carrying value of the Canal generating facility represented approximately 5% of Mirant Americas Generation’s and Mirant North America’s total property, plant and equipment, net at December 31, 2009.
Mirant Mid-Atlantic—As described above, we have goodwill recorded at the Mirant Mid-Atlantic registrant on its standalone balance sheet, which is eliminated upon consolidation at Mirant North America. In accordance with accounting guidance for goodwill and other intangible assets, we are required to test the goodwill balance at Mirant Mid-Atlantic at least annually. In conducting step one of the goodwill impairment analysis for Mirant Mid-Atlantic, we noted that the carrying value of its assets exceeded the calculated fair value of Mirant Mid-Atlantic, indicating that step two of the goodwill impairment analysis was required. Based on the results of the step one goodwill impairment analysis, we tested Mirant Mid-Atlantic’s long-lived assets for impairment under the accounting guidance related to impairment of long-lived assets before completion of the step two test for goodwill. During 2009, the continued decline in average natural gas prices caused power prices to decline in the Mid-Atlantic region. Additionally, the current economic recession and various demand-response programs have resulted in a decrease in the forecasted gross margin of the Mid-Atlantic generating facilities.
120
Table of Contents
Upon completion of our assessment, which was based on the accounting guidance related to the impairment of long-lived assets, we determined that the Potomac River generating facility was impaired, as the carrying value exceeded the undiscounted cash flows. Mirant Americas Generation and Mirant North America recorded an impairment loss of $207 million on their consolidated statements of operations, including $5 million of capitalized interest recorded at Mirant North America related to the Potomac River facility, to reduce the carrying value of the Potomac River generating facility to its estimated fair value. Mirant Mid-Atlantic recorded an impairment loss of $202 million on its consolidated statement of operations. In performing our impairment assessment, we noted that the undiscounted cash flows for other Mid-Atlantic generating facilities also decreased significantly from the prior year. We determined that none of Mirant Mid-Atlantic’s long-lived assets other than the Potomac River generating facility was impaired at October 31, 2009. There were no significant changes in market prices between October 31, 2009 and December 31, 2009 that required us to update our impairment analysis. However, if changes in market prices cause a further decline in the projected gross margin of our generating facilities, we could recognize additional impairment losses in future periods.
Our assumptions for Mirant Potomac River were consistent with those used in the goodwill impairment analysis of Mirant Mid-Atlantic described above. In addition to the assumptions utilized for the other Mid-Atlantic facilities, the Companies also incorporated assumptions specific to Mirant Potomac River. For example, the capital expenditures for Mirant Potomac River included the remaining $33 million it committed to spend to reduce particulate emissions as part of the agreement with the City of Alexandria, Virginia. In addition, Mirant Potomac River is not subject to the RGGI for CO2 emissions. The remaining depreciable life of Mirant Potomac River was adjusted to December 31, 2020, based on the results of the impairment analysis, which indicated that the facility began to go cash flow negative after that point.
Our estimates of future cash flows did not include contracts entered into to hedge economically the expected generation of the Mid-Atlantic generating facilities. The cash flows related to these contracts were excluded because they were not directly attributable to the Potomac River generating facility.
Year Ended December 31, 2008
Mirant Mid-Atlantic—We performed the goodwill assessment for Mirant Mid-Atlantic at October 31, 2008, which, by policy, is our annual testing date. In conducting step one of the goodwill impairment analysis for Mirant Mid-Atlantic, we noted that the carrying value of its assets exceeded the calculated fair value of Mirant Mid-Atlantic, indicating that step two of the goodwill impairment analysis was required. Based on the results of the step one goodwill impairment analysis, we tested Mirant Mid-Atlantic’s long-lived assets for impairment under the accounting guidance related to impairment of long-lived assets before completion of the step two test for goodwill. Upon completion of our assessment, which was based on the accounting guidance related to the impairment of long-lived assets, we determined that no further analysis of the long-lived assets was needed as of December 31, 2008, as the undiscounted cash flows exceeded the carrying value for all asset groups reviewed by a significant amount for each asset group tested since the useful lives of the assets extend up to an additional 30 years. For additional information on the assumptions and results of the analysis see discussion below.
Assumptions and Results
Based on the accounting guidance related to the impairment of long-lived assets, our assessment of the Mirant Mid-Atlantic generating facilities in the fourth quarter of 2008 included assumptions about future electricity and fuel prices, future capacity payments under the RPM provisions of PJM’s tariff, the future costs of carbon under a potential federal cap-and-trade program and future capital expenditure requirements. Our assumptions related to future electricity and fuel prices were based on observable market prices to the extent available and long-term prices derived from proprietary fundamental market modeling. We assumed a decline in the long–term price of coal from market prices observable as of the valuation date. Our long-term capacity prices are based on the assumption that the PJM RPM capacity market would continue consistent with the
121
Table of Contents
current structure, with expected increases in revenue as a result of declines in reserve margins for periods beyond those for which auctions have already been completed. We also assumed that a federal CO2 cap-and-trade program would be instituted later this decade. Capital expenditures include those costs necessary to complete the installation of pollution control equipment to comply with the limitations for SO2, NOx and mercury emissions under the Maryland Healthy Air Act and expenditures to maintain the operational performance of the generating facilities throughout their estimated useful lives.
For purposes of impairment testing, a long-lived asset or assets must be grouped at the lowest level of independent identifiable cash flows. Each generating facility was determined to be its own group. The leasehold improvements for each leased generating facility were determined to be their own group for impairment testing purposes.
Year Ended December 31, 2007
Mirant Lovett—As a result of entering into an amendment to the 2003 Consent Decree that switched the deadlines for shutting down units 4 and 5 and an agreement with the Town of Stony Point that set the 2007 and 2008 assessed value for property tax purposes for the Lovett generating facility, Mirant Americas Generation and Mirant North America tested in the second quarter of 2007, the recoverability of the Lovett generating facility under the accounting guidance related to the impairment of long-lived assets. See Item 1. “Business” for additional information on the 2003 Consent Decree. Mirant Americas Generation’s and Mirant North America’s estimate of cash flows related to their impairment analysis of the Lovett generating facility involved considering scenarios for the future expected operation of the Lovett generating facility. The most likely scenario considered was the shutdown of unit 5 by April 30, 2008, according to the amended 2003 Consent Decree. Mirant Americas Generation and Mirant North America also considered a scenario that assumed operations, utilizing coal as the primary fuel source, through 2012 to allow the Lovett generating facility to continue to contribute to the reliability of the electric system of the State of New York. As a result of the analysis, Mirant Americas Generation and Mirant North America recorded an impairment of long-lived assets of $175 million in the second quarter of 2007 to reduce the carrying value of the Lovett generating facility to its estimated fair value.
Effect if Different Assumptions Used. The estimates and assumptions used to determine whether an impairment exists are subject to a high degree of uncertainty. The estimated fair value of an asset would change if different estimates and assumptions were used in Mirant Americas Generation’s and Mirant North America’s applied valuation techniques, including estimated undiscounted cash flows, discount rates and remaining useful lives for assets held and used. If actual results are not consistent with the assumptions used in estimating future cash flows and asset fair values, we may be exposed to additional losses that could be material to our results of operations.
See Note 3 to our consolidated financial statements contained elsewhere in this report for additional information on impairments.
Loss Contingencies
Nature of Estimates Required. We record loss contingencies when it is probable that a liability has been incurred and the amount can be reasonably estimated. We consider loss contingency estimates to be critical accounting estimates because they entail significant judgment regarding probabilities and ranges of exposure, and the ultimate outcome of the proceedings is unknown and could have a material adverse effect on our results of operations, financial condition and cash flows. We currently have loss contingencies related to litigation, environmental matters, tax matters and others.
122
Table of Contents
Key Assumptions and Approach Used. The determination of a loss contingency requires significant judgment as to the expected outcome of each contingency in future periods. In making the determination as to potential losses and probability of loss, we consider all available positive and negative evidence including the expected outcome of potential litigation. We record our best estimate of a loss, or the low end of our range if no estimate is better than another estimate within a range of estimates, when the loss is considered probable. As additional information becomes available, we reassess the potential liability related to the contingency and revise our estimates. In our evaluation of legal matters, management holds discussions with applicable legal counsel and relies on analysis of case law and legal precedents.
Effect if Different Assumptions Used. Revisions in our estimates of potential liabilities could materially affect our results of operations and the ultimate resolution may be materially different from the estimates that we make.
See Note 11 to our consolidated financial statements contained elsewhere in this report for additional information on our loss contingencies.
Litigation
We are currently involved in certain legal proceedings. We estimate the range of liability through discussions with applicable legal counsel and analysis of case law and legal precedents. We record our best estimate of a loss, or the low end of our range if no estimate is better than another estimate within a range of estimates, when the loss is considered probable and can be reasonably estimated. As additional information becomes available, we reassess the potential liability related to our pending litigation and revise our estimates. Revisions in our estimates of the potential liability could materially affect our results of operations and the ultimate resolution may be materially different from the estimates that we make.
See Note 11 to our consolidated financial statements contained elsewhere in this report for further information related to our legal proceedings.
Recently Adopted Accounting Guidance
See Note 1 to our consolidated financial statements contained elsewhere in this report for further information related to our recently adopted accounting guidance.
123
Table of Contents
| Item 7A. | Quantitative and Qualitative Disclosures About Market Risk (Mirant Americas Generation, Mirant North America and Mirant Mid-Atlantic) |
Fair Value Measurements
We are exposed to market risk, primarily associated with commodity prices. We also consider risks associated with interest rates and credit when valuing our derivative financial instruments.
Mirant Americas Generation and Mirant North America
The estimated net fair value of our derivative contract assets and liabilities was a net asset of $702 million and $655 million at December 31, 2009 and 2008, respectively. The following tables provide a summary of the factors affecting the change in fair value of the derivative contract asset and liability accounts for the years ended December 31, 2009 and 2008, respectively (in millions):
| Commodity Contracts | ||||||||||||
| Asset Management |
Trading Activities |
Total | ||||||||||
| Fair value of portfolio of assets and liabilities at January 1, 2009 |
$ | 549 | $ | 106 | $ | 655 | ||||||
| Gains (losses) recognized in the period, net: |
||||||||||||
| New contracts and other changes in fair value 1 |
20 | (150 | ) | (130 | ) | |||||||
| Roll off of previous values2 |
(539 | ) | (100 | ) | (639 | ) | ||||||
| Purchases, issuances and settlements3 |
671 | 145 | 816 | |||||||||
| Fair value of portfolio of assets and liabilities at December 31, 2009 |
$ | 701 | $ | 1 | $ | 702 | ||||||
| Commodity Contracts | ||||||||||||
| Asset Management |
Trading Activities |
Total | ||||||||||
| Fair value of portfolio of assets and liabilities at January 1, 20084 |
$ | (133 | ) | $ | 4 | $ | (129 | ) | ||||
| Gains (losses) recognized in the period, net: |
||||||||||||
| New contracts and other changes in fair value1 |
497 | 86 | 583 | |||||||||
| Roll off of previous values2 |
271 | 55 | 326 | |||||||||
| Purchases, issuances and settlements3 |
(86 | ) | (39 | ) | (125 | ) | ||||||
| Fair value of portfolio of assets and liabilities at December 31, 2008 |
$ | 549 | $ | 106 | $ | 655 | ||||||
| 1 | The fair value, as of the end of each quarterly reporting period, of contracts entered into during each quarterly reporting period and the gains or losses attributable to contracts that existed as of the beginning of each quarterly reporting period and were still held at the end of each quarterly reporting period. |
| 2 | The fair value, as of the beginning of each quarterly reporting period, of contracts that settled during each quarterly reporting period. |
| 3 | Denotes cash settlements during each quarterly reporting period of contracts that existed at the beginning of each quarterly reporting period. |
| 4 | Reflects our portfolio of derivative contract assets and liabilities at December 31, 2007, adjusted for a day one net gain of $1 million recognized upon adoption of the fair value measurements accounting guidance on January 1, 2008. |
124
Table of Contents
Mirant Mid-Atlantic
The estimated net fair value of our derivative contract assets and liabilities was a net asset of $670 million and $526 million at December 31, 2009 and 2008, respectively. The following tables provide a summary of the factors affecting the change in fair value of the derivative contract asset and liability accounts for the year ended December 31, 2009 and 2008, respectively (in millions):
| Asset Management |
||||
| Fair value of portfolio of assets and liabilities at January 1, 2009 |
$ | 526 | ||
| Gains (losses) recognized in the period, net: |
||||
| New contracts and other changes in fair value1 |
(15 | ) | ||
| Roll off of previous values2 |
(489 | ) | ||
| Purchases, issuances and settlements3 |
648 | |||
| Fair value of portfolio of assets and liabilities at December 31, 2009 |
$ | 670 | ||
| Asset Management |
||||
| Fair value of portfolio of assets and liabilities at January 1, 20084 |
$ | (150 | ) | |
| Gains (losses) recognized in the period, net: |
||||
| New contracts and other changes in fair value1 |
493 | |||
| Roll off of previous values2 |
277 | |||
| Purchases, issuances and settlements3 |
(94 | ) | ||
| Fair value of portfolio of assets and liabilities at December 31, 2008 |
$ | 526 | ||
| 1 | The fair value, as of the end of each quarterly reporting period, of contracts entered into during each quarterly reporting period and the gains or losses attributable to contracts that existed as of the beginning of each quarterly reporting period and were still held at the end of each quarterly reporting period. |
| 2 | The fair value, as of the beginning of each quarterly reporting period, of contracts that settled during each quarterly reporting period. |
| 3 | Denotes cash settlements during each quarterly reporting period of contracts that existed at the beginning of each quarterly reporting period. |
| 4 | Reflects our portfolio of derivative contract assets and liabilities at December 31, 2007, adjusted for a day one net gain of $3 million recognized upon adoption of the fair value measurements accounting guidance on January 1, 2008. |
The tables above do not include long-term coal agreements that are not required to be recorded at fair value under the accounting guidance for derivative financial instruments. See “Long-Term Coal Agreement Risk” for further discussion later in this section.
We did not elect the fair value option for any financial instruments under the accounting guidance. However, we do transact using derivative financial instruments which are required to be recorded at fair value in our consolidated balance sheets under the accounting guidance related to derivative financial instruments.
Commodity Price Risk
In connection with our business of generating electricity, we are exposed to energy commodity price risk associated with the acquisition of fuel and emissions allowances needed to generate electricity, the price of electricity produced and sold and the fair value of our fuel inventories. A portion of our fuel requirements is purchased in the spot market and a portion of the electricity we produce is sold in the spot market. In addition, the open positions in Mirant Americas Generation’s and Mirant North America’s proprietary trading and fuel oil management activities expose them to risks associated with changes in energy commodity prices.
125
Table of Contents
As a result, our financial performance varies depending on changes in the prices of energy and energy-related commodities. See Item 7. “Critical Accounting Estimates” for a discussion of the accounting treatment for asset management, proprietary trading and fuel oil management activities.
The financial performance of our business of generating electricity is influenced by the difference between the variable cost of converting a fuel, such as natural gas, coal or oil, into electricity, and the variable revenue we receive from the sale of that electricity. The difference between the cost of a specific fuel used to generate one MWh of electricity and the market value of the electricity generated is commonly referred to as the “conversion spread.” Absent the effects of our derivative contract activities, the operating margins that we realize are equal to the difference between the aggregate conversion spread and the cost of operating the facilities that produce the electricity sold.
Conversion spreads are dependent on a variety of factors that influence the cost of fuel and the sales price of the electricity generated over the longer term, including conversion spreads of other generating facilities in the regions in which we operate, facility outages, weather and general economic conditions. As a result of these influences, the cost of fuel and electricity prices do not always change in the same magnitude or direction, which results in conversion spreads for a particular generating facility widening or narrowing (or becoming negative) over any given period.
Through our asset management activities, we enter into a variety of exchange-traded and OTC energy and energy-related derivative financial instruments, such as forward contracts, futures contracts, option contracts and financial swap agreements, to manage our exposure to commodity price risks and changes in conversion spreads. These contracts have varying terms and durations which range from a few days to years, depending on the instrument. Mirant Americas Generation’s and Mirant North America’s proprietary trading activities also utilize similar contracts in markets where we have a physical presence to attempt to generate incremental gross margin. Mirant Americas Generation’s and Mirant North America’s fuel oil management activities use derivative financial instruments to hedge economically the fair value of physical fuel oil inventories and to optimize the approximately three million barrels of storage capacity that they own or lease.
Derivative energy contracts that are required to be reflected at fair value are presented as derivative contract assets and liabilities in the accompanying consolidated balance sheets. The net changes in their fair market values are recognized in income in the period of change. The determination of fair value considers various factors, including closing exchange or OTC market price quotations, time value, credit quality, liquidity and volatility factors underlying options. See Item 7. “Critical Accounting Estimates” for the accounting treatment of asset management, proprietary trading and fuel oil management activities.
Counterparty Credit Risk
The valuation of our derivative contract assets is affected by the default risk of the counterparties with which we transact. Mirant Americas Generation and Mirant North America recognized a reserve, which is reflected as a reduction of their derivative contract assets, related to counterparty credit risk of $13 million and $52 million at December 31, 2009 and 2008, respectively. Mirant Mid-Atlantic recognized a reserve, which is reflected as a reduction of its derivative contract assets, related to counterparty credit risk of $13 million and $51 million at December 31, 2009 and 2008, respectively.
In accordance with the fair value measurements accounting guidance, we calculate the credit reserve through consideration of observable market inputs, when available. Our non-collateralized power hedges entered into by Mirant Mid-Atlantic with our major trading partners, which represent 65% of the net notional position for Mirant Americas Generation and Mirant North America and 67% of the net notional position for Mirant Mid-Atlantic at December 31, 2009, are senior unsecured obligations of Mirant Mid-Atlantic and the
126
Table of Contents
counterparties, and do not require either party to post cash collateral for initial margin or for securing exposure as a result of changes in power or natural gas prices. We calculate the credit reserve for our non-collateralized power hedges entered into by Mirant Mid-Atlantic using published spreads on credit default swaps for our counterparties applied to our current exposure and potential loss exposure from the financial commitments in our risk management portfolio. Potential loss exposure is calculated as our current exposure plus a calculated VaR over the remaining life of the contracts. We applied a similar approach to calculate the fair value of our coal contracts that are not included in derivative contract assets and liabilities in the consolidated balance sheets and which also do not require either party to post cash collateral for initial margin or for securing exposure as a result of changes in coal prices. We do not, however, transact in credit default swaps or any other credit derivative. An increase of 10% in the spread of credit default swaps of our major trading partners for our non-collateralized power hedges entered into by Mirant Mid-Atlantic would result in an increase of $1 million in the credit reserve of Mirant Americas Generation, Mirant North America and Mirant Mid-Atlantic as of December 31, 2009. An increase of 10% in the spread of credit default swaps of our coal suppliers would result in an increase of less than $1 million in the credit reserve for Mirant Americas Generation, Mirant North America and Mirant Mid-Atlantic related to long-term coal agreements that are not included in derivative contract assets and liabilities in the accompanying consolidated balance sheets as of December 31, 2009.
We have historically calculated the credit reserve for the remainder of our portfolio considering our current exposure, net of the effect of credit enhancements, and potential loss exposure from the financial commitments in our risk management portfolio, and applied historical default probabilities using current credit ratings of our counterparties. In the fourth quarter of 2009, we changed our methodology to calculate the credit reserve for the remainder of our portfolio to also use published spreads, where available, or proxies based upon published spreads, on credit default swaps for our counterparties applied to our current exposure and potential loss exposure from the financial commitments in our risk management portfolio. The change in credit reserve methodology did not have a material effect on the fair value of our derivative contract assets and liabilities for the remainder of the portfolio since the default risk is generally offset by cash collateral or other credit enhancements. An increase in counterparty credit risk could affect the ability of our counterparties to deliver on their obligations to us. As a result, we may require our counterparties to post additional collateral or provide other credit enhancements. An increase of 10% in the spread of credit default swaps of our trading partners for the remainder of our portfolio would result in an immaterial increase in our credit reserve as of December 31, 2009.
Once we have delivered a physical commodity or agreed to financial settlement terms, we are subject to collection risk. Collection risk is similar to credit risk and collection risk is accounted for when we establish our provision for uncollectible accounts. We manage this risk using the same techniques and processes used in credit risk discussed above.
We also monitor counterparty credit concentration risk on both an individual basis and a group counterparty basis. See Note 2 to our consolidated financial statements contained elsewhere in this report for further discussion of our counterparty credit concentration risk.
Mirant Americas Generation, Mirant North America and Mirant Mid-Atlantic Credit Risk
In valuing our derivative contract liabilities, we apply a valuation adjustment for our non-performance, which is based on the probability of our default. Historically, we determined this non-performance adjustment value by multiplying our liability exposure, including outstanding balances for realized transactions, unrealized transactions and the effect of credit enhancements, by the one year probability of our default based on our current credit ratings. The one year probability of default rate considers the tenor of our portfolio and the correlation of default between counterparties within our industry. In the fourth quarter of 2009, we changed our methodology to incorporate published spreads on our credit default swaps, where available, or proxies based
127
Table of Contents
upon published spreads. An increase of 10% in the spread of the credit default swap rate of the Companies would have an immaterial effect on Mirant Americas Generation’s, Mirant North America’s and Mirant Mid-Atlantic’s consolidated statement of operations as of December 31, 2009.
Broker Quotes
In determining the fair value of our derivative contract assets and liabilities, we use third-party market pricing where available. We consider active markets to be those in which transactions for the asset or liability occur in sufficient frequency and volume to provide pricing information on an ongoing basis. Note 2 to our consolidated financial statements contained elsewhere in this report explains the fair value hierarchy. Our transactions in Level 1 of the fair value hierarchy primarily consist of natural gas and crude oil futures traded on the NYMEX and swaps cleared against NYMEX prices. For these transactions, we use the unadjusted published settled prices on the valuation date. Our transactions in Level 2 of the fair value hierarchy primarily include non-exchange-traded derivatives such as OTC forwards, swaps and options. We value these transactions using quotes from independent brokers or other widely-accepted valuation methodologies. Transactions are classified in Level 2 if substantially all (greater than 90%) of the fair value can be corroborated using observable market inputs such as transactable broker quotes. In accordance with the exit price objective under the fair value measurements accounting guidance, the fair value of our derivative contract assets and liabilities is determined based on the net underlying position of the recorded derivative contract assets and liabilities using bid prices for our assets and ask prices for liabilities. The quotes that we obtain from brokers are non-binding in nature, but are from brokers that typically transact in the market being quoted and are based on their knowledge of market transactions on the valuation date. We typically obtain multiple broker quotes on the valuation date for each delivery location that extend for the tenor of our underlying contracts. The number of quotes that we can obtain depends on the relative liquidity of the delivery location on the valuation date. If multiple broker quotes are received for a contract, we use an average of the quoted bid or ask prices. If only one broker quote is received for a delivery location and it cannot be validated through other external sources, we will assign the quote to a lower level within the fair value hierarchy. In some instances, we may combine broker quotes for a liquid delivery hub with broker quotes for the price spread between the liquid delivery hub and the delivery location under the contract. We also may apply interpolation techniques to value monthly strips if broker quotes are only available on a seasonal or annual basis. We perform validation procedures on the broker quotes at least on a monthly basis. The validation procedures include reviewing the quotes for accuracy and comparing them to our internal price curves. In certain instances, we may discard a broker quote if it is a clear outlier and multiple other quotes are obtained. At December 31, 2009, we obtained broker quotes for 100% of our delivery locations classified in Level 2 of the fair value hierarchy.
Inactive markets are considered to be those markets with few transactions, noncurrent pricing or prices that vary over time or among market makers. Our transactions in Level 3 of the fair value hierarchy may involve transactions whereby observable market data, such as broker quotes, are not available for substantially all of the tenor of the contract or we are only able to obtain indicative broker quotes that cannot be corroborated by observable market data. In such cases, we may apply valuation techniques such as extrapolation to determine fair value. Proprietary models may also be used to determine the fair value of certain of our derivative contract assets and liabilities that may be structured or otherwise tailored. The degree of estimation increases for longer duration contracts, contracts with multiple pricing features, option contracts and off-hub delivery points. Our techniques for fair value estimation include assumptions for market prices, correlation and volatility. At December 31, 2009, Mirant Americas Generation’s and Mirant North America’s assets and liabilities classified as Level 3 in the fair value hierarchy represented approximately 2% of their total assets and less than 1% of their total liabilities measured at fair value. At December 31, 2009, Mirant Mid-Atlantic’s assets classified as Level 3 in the fair value hierarchy represented approximately 1% of its total assets, and its liabilities measured at fair value classified as Level 3 were inconsequential. See Note 2 to our consolidated financial statements contained elsewhere in this report for further explanation of the fair value hierarchy.
128
Table of Contents
Value at Risk
Our risk management policy limits our trading to certain products and contains limits and restrictions related to our asset management, proprietary trading and fuel oil management activities.
We manage the price risk associated with asset management activities through a variety of methods. Our risk management policy requires that asset management activities are restricted to only those activities that are risk-reducing. We ensure compliance with this restriction at the transactional level by testing each individual transaction executed relative to the overall asset position.
We also use VaR to measure the market price risk of our energy asset portfolio as a result of potential changes in market prices. VaR is a statistical model that provides an estimate of potential loss. We calculate VaR based on the parametric variance/covariance approach, utilizing a 95% confidence interval and a one-day holding period on a rolling 24-month forward looking period. Additionally, we estimate correlation based on historical commodity price changes. Volatilities are based on a combination of historical price changes and implied market rates.
VaR is calculated quarterly on an asset management portfolio comprised of mark-to-market and non mark-to-market energy assets and liabilities, including generating facilities and bilateral physical and financial transactions. Asset management VaR levels are substantially reduced as a result of our decision to hedge actively in the forward markets the commodity price risk related to the expected generation and fuel usage of our generating facilities. See Item 1. “Commercial Operations” for discussion of our hedging strategies.
Mirant Americas Generation and Mirant North America
The following table summarizes year-end, average, high and low VaR for our asset management portfolio (in millions):
| For the Years Ended December 31, | ||||||
| Asset Management VaR | 2009 | 2008 | ||||
| Year-end |
$ | 11 | $ | 14 | ||
| Average |
$ | 12 | $ | 18 | ||
| High |
$ | 13 | $ | 21 | ||
| Low |
$ | 11 | $ | 14 | ||
Mirant Americas Generation and Mirant North America calculate VaR daily on portfolios consisting of mark-to-market and non mark-to-market bilateral physical and financial transactions related to our proprietary trading activities and fuel oil management operations.
The following table summarizes year-end, average, high and low VaR for our proprietary trading and fuel oil management operations (in millions):
| For the Years Ended December 31, | ||||||
| Proprietary Trading and Fuel Oil Management VaR | 2009 | 2008 | ||||
| Year-end |
$ | 2 | $ | 1 | ||
| Average |
$ | 2 | $ | 2 | ||
| High |
$ | 4 | $ | 4 | ||
| Low |
$ | 1 | $ | 1 | ||
129
Table of Contents
Mirant Mid-Atlantic
The following table summarizes year-end, average, high and low VaR for our asset management portfolio (in millions):
| For the Years Ended December 31, | ||||||
| Asset Management VaR | 2009 | 2008 | ||||
| Year-end |
$ | 10 | $ | 11 | ||
| Average |
$ | 11 | $ | 15 | ||
| High |
$ | 12 | $ | 18 | ||
| Low |
$ | 10 | $ | 11 | ||
The asset management VaR declined for the year ended December 31, 2009, as compared to 2008, primarily as a result of lower commodity price volatility estimates caused by lower commodity price levels.
Because of inherent limitations of statistical measures such as VaR and the seasonality of changes in market prices, the VaR calculation may not reflect the full extent of our commodity price risk exposure on our cash flows and liquidity. Additionally, actual changes in the fair value of mark-to-market energy assets and liabilities could differ from the calculated VaR, and such changes could have a material effect on our financial results.
Interest Rate Risk
Fair Value Measurement
We are also subject to interest rate risk when determining the fair value of our derivative contract assets and liabilities. The nominal value of our derivative contract assets and liabilities is also discounted to account for time value using a LIBOR forward interest rate curve based on the tenor of our transactions. An increase of 100 basis points in the average LIBOR rate would result in a decrease of $2 million to Mirant Americas Generation and Mirant North America’s derivative contract assets and a decrease of $1 million to Mirant Americas Generation and Mirant North America’s derivative contract liabilities at December 31, 2009. An increase of 100 basis points in the average LIBOR rate would result in a decrease of $2 million to Mirant Mid-Atlantic’s derivative contract assets and a decrease of $1 million to Mirant Mid-Atlantic’s derivative contract liabilities at December 31, 2009.
Debt (Mirant Americas Generation and Mirant North America)
Our debt that is subject to variable interest rates consists of the Mirant North America senior secured term loan and senior secured revolving credit facility. If both were fully drawn, the amount subject to variable interest rates would be approximately $1.1 billion and a 1% per annum increase in the average market rate would result in an increase in our annual interest expense of approximately $11 million.
Long-Term Coal Agreement Risk
Our coal supply comes primarily from the Central Appalachian and Northern Appalachian coal regions. Mirant Americas Generation and Mirant North America enter into contracts of varying tenors on behalf of Mirant Mid-Atlantic to secure appropriate quantities of fuel that meet the varying specifications of Mirant Mid-Atlantic’s generating facilities. For coal-fired generating facilities, we purchase most of our coal from a small number of strategic suppliers under contracts with terms of varying lengths, some of which extend to 2013. Most of our coal contracts are not required to be recorded at fair value under the accounting guidance for derivative financial instruments. As such, these contracts are not included in derivative contract assets and liabilities in the accompanying consolidated balance sheets. As of December 31, 2009, the estimated net fair value of these long-term coal agreements was approximately $(177) million.
In addition, we have non-performance risk associated with our long-term coal agreements. There is risk that our coal suppliers may not provide the contractual quantities on the dates specified within the agreements
130
Table of Contents
or the deliveries may be carried over to future periods. If our coal suppliers do not perform in accordance with the agreements, we may have to procure coal in the market to meet our needs, or power in the market to meet our obligations. In addition, a number of the coal suppliers do not currently have an investment grade credit rating and, accordingly, we may have limited recourse to collect damages in the event of default by a supplier. We seek to mitigate this risk through diversification of coal suppliers and through guarantees. Despite this, there can be no assurance that these efforts will be successful in mitigating credit risk from coal suppliers. Non-performance or default risk by our coal suppliers could have a material adverse effect on our future results of operations, financial condition and cash flows. See Note 2 to our consolidated financial statements contained elsewhere in this report for further explanation of these agreements and our credit concentration tables.
| Item 8. | Financial Statements and Supplementary Data (Mirant Americas Generation, Mirant North America and Mirant Mid-Atlantic) |
The financial statements and schedules are listed in Part IV, Item 15 of this Form 10-K.
| Item 9. | Changes in and Disagreements With Accountants on Accounting and Financial Disclosure (Mirant Americas Generation, Mirant North America and Mirant Mid-Atlantic) |
None.
| Item 9A(T). | Controls and Procedures (Mirant Americas Generation, Mirant North America and Mirant Mid-Atlantic) |
Effectiveness of Disclosure Controls and Procedures
As required by Exchange Act Rule 13a-15(b), our management, including our Principal Executive Officer and our Principal Financial Officer, conducted an assessment of the effectiveness of our disclosure controls and procedures (as defined by Rules 13a-15(e) and 15d-15(e) under the Exchange Act), as of December 31, 2009. Based upon this assessment, our management concluded that, as of December 31, 2009, these disclosure controls and procedures were effective.
Management’s Report on Internal Control over Financial Reporting
Our management is responsible for establishing and maintaining adequate internal control over financial reporting (as defined by Rules 13a-15(f) under the Exchange Act). The Companies’ internal control framework and processes have been designed to provide reasonable assurance regarding the reliability of financial reporting and the preparation of financial statements for external purposes in accordance with United States generally accepted accounting principles. Internal control over financial reporting includes those processes and procedures that:
| — | pertain to the maintenance of records that, in reasonable detail, accurately and fairly reflect the transactions and dispositions of the assets of the Companies; |
| — | provide reasonable assurance that transactions are recorded properly to allow for the preparation of financial statements, in accordance with generally accepted accounting principles, and that receipts and expenditures of the Companies are being made only in accordance with authorizations of management and directors of the Companies (or persons performing the equivalent functions); |
| — | provide reasonable assurance regarding prevention or timely detection of unauthorized acquisition, use, or disposition of the Companies’ assets that could have a material effect on the consolidated financial statements; and |
| — | provide reasonable assurance as to the detection of fraud. |
Under the supervision and with the participation of our management, including our Principal Executive Officer and our Principal Financial Officer, we carried out an assessment of the effectiveness of our internal control over financial reporting as of December 31, 2009. In conducting our assessment, management utilized
131
Table of Contents
the criteria set forth by the Committee of Sponsoring Organizations of the Treadway Commission in Internal Control—Integrated Framework. Based on this assessment, management concluded that our internal control over financial reporting was effective as of December 31, 2009.
This annual report does not include attestation reports of the Companies’ independent registered public accounting firm regarding internal control over financial reporting. Management’s report was not subject to attestation by the Companies’ independent registered public accounting firm pursuant to temporary rules of the Securities and Exchange Commission that permit the Companies to provide only management’s reports in this annual report.
Changes in Internal Control over Financial Reporting
There have been no changes in the Companies’ internal control over financial reporting that have occurred during the quarter ended December 31, 2009, that have materially affected or are reasonably likely to materially affect the Companies’ internal control over financial reporting.
| Item 9B. | Other Information (Mirant Americas Generation, Mirant North America and Mirant Mid-Atlantic) |
None.
132
Table of Contents
| Item 10. | Directors, Executive Officers and Corporate Governance (Mirant Americas Generation, Mirant North America and Mirant Mid-Atlantic) |
The table below sets forth information on each member of the Board of Managers of the Companies as of December 31, 2009. Each member of the Board of Managers is also an executive officer of Mirant Corporation.
| Name |
Age | Position | ||
| Edward R. Muller |
57 | President and Chief Executive Officer (since 2009) and Board Manager (since 2006) of Mirant Americas Generation, Mirant North America and Mirant Mid-Atlantic. Director, Chairman, President and Chief Executive Officer of Mirant Corporation since September 2005. Former President and Chief Executive Officer (1993-2000) of Edison Mission Energy, a California-based independent power producer. Mr. Muller is also a director of Transocean Ltd. and was formerly a director of GlobalSantaFe Corporation prior to its merger with Transocean Ltd. | ||
| J. William Holden III |
49 | Senior Vice President, Chief Financial Officer and Board Manager of Mirant Americas Generation, Mirant North America and Mirant Mid-Atlantic since 2009. Senior Vice President and Chief Financial Officer (since 2009), Senior Vice President and Treasurer (2002-2009), Chief Financial Officer, Mirant Europe (2001-2002), Vice President and Treasurer (1999-2001), Vice President of operations and business development for South America (1996-1999) and Vice President of business development for Asia-Pacific region (1994-1995) of Mirant Corporation. Mr. Holden held various positions at Southern Company from 1985 to 1994 including Director of Corporate Finance. | ||
| Julia A. Houston |
39 | Senior Vice President, General Counsel and Board Manager of Mirant Americas Generation, Mirant North America and Mirant Mid-Atlantic since 2009. Senior Vice President, General Counsel, Chief Compliance Officer and Corporate Secretary (since 2009), Senior Vice President, Deputy General Counsel and Corporate Secretary (2008-2009), Vice President, Assistant General Counsel and Corporate Secretary (2006-2008), Associate General Counsel (2005-2006), and Senior Attorney (2004-2005) of Mirant Corporation. Ms. Houston previously practiced as a securities and finance attorney at Delta Air Lines, Inc. and as an associate at King & Spalding LLP, an international law firm, in the corporate practice group. | ||
133
Table of Contents
The table below sets forth information on the principal executive officer, principal financial officer and principal accounting officer of Mirant Americas Generation, Mirant North America and Mirant Mid-Atlantic as of December 31, 2009. These officers are also officers of Mirant. Policy-making functions for Mirant Americas Generation, Mirant North America and Mirant Mid-Atlantic are performed by the Board of Managers of Mirant Americas Generation, Mirant North America and Mirant Mid-Atlantic and the other executive officers of Mirant Corporation. Information on the executive officers of Mirant Corporation will be provided in the Mirant definitive Proxy Statement for its 2010 Annual Meeting of Stockholders.
| Name |
Age | Position | ||
| Edward R. Muller |
57 | President and Chief Executive Officer (since 2009) and Board Manager (since 2006) of Mirant Americas Generation, Mirant North America and Mirant Mid-Atlantic. Director, Chairman, President and Chief Executive Officer of Mirant Corporation since September 2005. Former President and Chief Executive Officer (1993-2000) of Edison Mission Energy, a California-based independent power producer. Mr. Muller is also a director of Transocean Ltd. and was formerly a director of GlobalSantaFe Corporation prior to its merger with Transocean Ltd. | ||
| J. William Holden III |
49 | Senior Vice President, Chief Financial Officer and Board Manager of Mirant Americas Generation, Mirant North America and Mirant Mid-Atlantic since 2009. Senior Vice President and Chief Financial Officer (since 2009), Senior Vice President and Treasurer (2002-2009), Chief Financial Officer, Mirant Europe (2001-2002), Vice President and Treasurer (1999-2001), Vice President of operations and business development for South America (1996-1999) and Vice President of business development for Asia-Pacific region (1994-1995) of Mirant Corporation. Mr. Holden held various positions at Southern Company from 1985 to 1994 including Director of Corporate Finance. | ||
| Angela M. Nagy |
36 | Vice President, Controller and Principal Accounting Officer of Mirant Americas Generation, Mirant North America and Mirant Mid-Atlantic since 2009. Vice President, Controller and Principal Accounting Officer (since 2009), Vice President and Assistant Controller (2005-2009), Director, Corporate Accounting and Reporting (2003-2005) and Director, External Reporting (2003) of Mirant Corporation. Ms. Nagy held various positions at Mirant’s subsidiaries from 2000 to 2003. Before joining Mirant, Ms. Nagy worked as a Manager in the assurance practice of Arthur Andersen. | ||
134
Table of Contents
The principal executive officer, principal financial officer and principal accounting officer of Mirant Americas Generation, LLC, Mirant North America, LLC and Mirant Mid-Atlantic, LLC were elected to serve until their successors are elected and have qualified or until their removal, resignation, death or disqualification.
Audit Committee and Audit Committee Financial Expert
We do not have a separately designated standing Audit Committee. Because Mirant Americas Generation Mirant North America and Mirant Mid-Atlantic are indirect wholly-owned subsidiaries of Mirant Corporation, the Board of Managers does not have independent members and therefore has not separately designated a member as a financial expert.
Section 16(a) Beneficial Ownership Reporting Compliance
The Companies do not have equity securities registered pursuant to Section 12 of the Exchange Act and therefore do not have officers with Section 16 reporting obligations.
Code of Ethics for Senior Financial Officers
Mirant has a Code of Ethics and Business Conduct that applies to all Mirant officers, employees, subsidiaries and the Mirant Board of Directors. In addition, Mirant has adopted a Code of Conduct for Senior Financial Officers applicable to Mirant’s senior financial officers that also applies to the senior financial officers of Mirant Americas Generation, Mirant North America and Mirant Mid-Atlantic. A copy of each code is posted on Mirant’s website at www.mirant.com. We intend to post any amendments and waivers to the Code of Ethics for senior financial officers on this website.
Shareholder Nominees to Board of Directors
Mirant Americas Generation will not adopt procedures by which shareholders may recommend manager candidates because it is a wholly-owned subsidiary of Mirant Americas. Mirant North America will not adopt procedures by which shareholders may recommend manager candidates because it is a wholly-owned subsidiary of Mirant Americas Generation. Mirant Mid-Atlantic will not adopt procedures by which shareholders may recommend manager candidates because it is a wholly-owned subsidiary of Mirant North America.
| Item 11. | Executive Compensation (Mirant Americas Generation, Mirant North America and Mirant Mid-Atlantic) |
The officers of Mirant Americas Generation, Mirant North America and Mirant Mid-Atlantic are also officers of Mirant. The officers are not compensated separately in their positions with the Companies, and none of the officers has a contract or agreement in his capacity as an officer of the Companies. Policy-making functions for the Companies are performed by the Board of Managers of the Companies and the other executive officers of Mirant. Information on compensation for the executive officers of Mirant will be provided in the Mirant definitive Proxy Statement for its 2010 Annual Meeting of Stockholders.
All of the equity of Mirant Americas Generation is held by its direct parent, Mirant Americas, Inc. All of the equity of Mirant North America is held by its direct parent, Mirant Americas Generation, LLC. All of the equity of Mirant Mid Atlantic is held by its direct parent, Mirant North America, LLC. Therefore, the equity of the Companies is not publicly traded and there is no basis to compare the price performance of our equity to the price performance of an index or peer group.
135
Table of Contents
| Item 12. | Security Ownership of Certain Beneficial Owners and Management and Related Stockholder Matters (Mirant Americas Generation, Mirant North America and Mirant Mid-Atlantic) |
Mirant Americas Generation is a wholly-owned subsidiary of Mirant Americas; therefore, none of its managers or officers holds any equity interests in Mirant Americas Generation. Mirant North America is a wholly-owned subsidiary of Mirant Americas Generation; therefore, none of its managers or officers holds any equity interest in Mirant North America. Mirant Mid-Atlantic is a wholly-owned subsidiary of Mirant North America; therefore, none of its managers or officers hold any equity interest in Mirant North America.
| Item 13. | Certain Relationships and Related Transactions and Director Independence (Mirant Americas Generation, Mirant North America and Mirant Mid-Atlantic) |
Review and Approval of Related Person Transactions
The Companies are indirect wholly-owned subsidiaries of Mirant. Mirant’s Nominating and Governance Committee is responsible for reviewing and approving any related party transactions by Mirant, including transactions taken at the subsidiary level. Mirant’s legal department has adopted policies and procedures to assess transactions and relationships between Mirant and/or its subsidiaries and any related parties to determine if they have a direct or indirect material interest in the transaction. All related party transactions must be approved by the Nominating and Governance Committee.
Related Person Transactions
There were no reportable transactions between the Companies and related parties in 2009.
| Item 14. | Principal Accountant Fees and Services (Mirant Americas Generation, Mirant North America and Mirant Mid-Atlantic) |
KPMG LLP conducts an integrated audit of Mirant Corporation and its subsidiaries. As such, Mirant Americas Generation, Mirant North America and Mirant Mid-Atlantic do not separately arrange for audit services. A significant portion of the fees for professional audit services and other services rendered by KPMG LLP were allocated to the Companies through the Administrative Services Agreement with Mirant Services as described in Note 6—Related Party Arrangements and Transactions. The following table presents fees for professional audit services and other services rendered by KPMG LLP (in thousands) for Mirant Corporation, Mirant Americas Generation, Mirant North America and Mirant Mid-Atlantic:
| 2009 | 2008 | |||||
| Audit Fees1 |
$ | 5,504 | $ | 5,854 | ||
| Audit-Related Fees2 |
— | 573 | ||||
| Tax Fees |
— | — | ||||
| All Other Fees3 |
251 | — | ||||
| Total |
$ | 5,755 | $ | 6,427 | ||
| 1 | Audit fees and expenses represent fees billed and expected to be billed for professional services rendered in connection with (a) audits and reviews of the 2009 and 2008 Mirant Corporation consolidated financial statements in accordance with standards of the Public Company Accounting Oversight Board; (b) audits of various Mirant subsidiary financial statements required by statute or regulation; and (c) consultations on accounting matters reflected in the financial statements. |
| 2 | Audit-related fees represent fees billed for professional services rendered in connection with (a) audits of Mirant’s employee benefit plans; (b) document production in connection with legal subpoenas related to various Mirant litigation matters; and (c) for 2008, Mirant’s response to an SEC comment letter related to Mirant and Mirant North America’s 2007 Annual Reports on Form 10-K. |
| 3 | All other fees include services related to an International Financial Reporting Standards (IFRS) readiness assessment. |
136
Table of Contents
| Item 15. | Exhibits and Financial Statement Schedules (Mirant Americas Generation, Mirant North America and Mirant Mid-Atlantic) |
| (a) 1. Financial | Statements |
| F-1 | ||
| Mirant Americas Generation, LLC |
||
| F-4 | ||
| F-5 | ||
| F-6 | ||
| F-7 | ||
| Mirant North America, LLC |
||
| F-8 | ||
| F-9 | ||
| F-10 | ||
| F-11 | ||
| Mirant Mid-Atlantic, LLC |
||
| F-12 | ||
| F-13 | ||
| F-14 | ||
| F-15 | ||
| F-16 |
| 2. Financial | Statement Schedules |
| F-92 | ||
| Mirant Americas Generation, LLC |
||
| F-95 | ||
| F-96 | ||
| F-97 | ||
| Mirant North America, LLC |
||
| F-98 | ||
| F-99 | ||
| F-100 | ||
| Schedule I—Notes to Registrants’ Condensed Financial Statements (Parent) |
F-101 | |
| F-102 |
3. Exhibits
| Exhibits |
||
| F-103 | ||
| F-105 | ||
| F-107 |
137
Table of Contents
Report of Independent Registered Public Accounting Firm
The Member
Mirant Americas Generation, LLC:
We have audited the accompanying consolidated balance sheets of Mirant Americas Generation, LLC (a wholly-owned indirect subsidiary of Mirant Corporation) and subsidiaries (the “Company”) as of December 31, 2009 and 2008, and the related consolidated statements of operations, equity, and cash flows for each of the years in the three-year period ended December 31, 2009. These consolidated financial statements are the responsibility of the Company’s management. Our responsibility is to express an opinion on these consolidated financial statements based on our audits.
We conducted our audits in accordance with the standards of the Public Company Accounting Oversight Board (United States). Those standards require that we plan and perform the audit to obtain reasonable assurance about whether the financial statements are free of material misstatement. An audit includes examining, on a test basis, evidence supporting the amounts and disclosures in the financial statements. An audit also includes assessing the accounting principles used and significant estimates made by management, as well as evaluating the overall financial statement presentation. We believe that our audits provide a reasonable basis for our opinion.
In our opinion, the consolidated financial statements referred to above present fairly, in all material respects, the financial position of Mirant Americas Generation, LLC and subsidiaries as of December 31, 2009 and 2008, and the results of their operations and their cash flows for each of the years in the three-year period ended December 31, 2009, in conformity with U.S. generally accepted accounting principles.
As discussed in Note 1 to the consolidated financial statements, the Company adopted accounting guidance related to the recognition and disclosure provisions for fair value measurements for financial instruments and nonfinancial assets and liabilities recognized or disclosed at fair value in the financial statements on a recurring basis, in 2008. In 2009, the Company adopted accounting guidance that extended these aforementioned recognition and disclosure provisions to nonfinancial assets and liabilities measured at fair value on a nonrecurring basis.
/s/ KPMG LLP
Atlanta, Georgia
February 26, 2010
F-1
Table of Contents
Report of Independent Registered Public Accounting Firm
The Member
Mirant North America, LLC:
We have audited the accompanying consolidated balance sheets of Mirant North America, LLC (a wholly-owned indirect subsidiary of Mirant Corporation) and subsidiaries (the “Company”) as of December 31, 2009 and 2008, and the related consolidated statements of operations, equity, and cash flows for each of the years in the three-year period ended December 31, 2009. These consolidated financial statements are the responsibility of the Company’s management. Our responsibility is to express an opinion on these consolidated financial statements based on our audits.
We conducted our audits in accordance with the standards of the Public Company Accounting Oversight Board (United States). Those standards require that we plan and perform the audit to obtain reasonable assurance about whether the financial statements are free of material misstatement. An audit includes examining, on a test basis, evidence supporting the amounts and disclosures in the financial statements. An audit also includes assessing the accounting principles used and significant estimates made by management, as well as evaluating the overall financial statement presentation. We believe that our audits provide a reasonable basis for our opinion.
In our opinion, the consolidated financial statements referred to above present fairly, in all material respects, the financial position of Mirant North America, LLC and subsidiaries as of December 31, 2009 and 2008, and the results of their operations and their cash flows for each of the years in the three-year period ended December 31, 2009, in conformity with U.S. generally accepted accounting principles.
As discussed in Note 1 to the consolidated financial statements, the Company adopted accounting guidance related to the recognition and disclosure provisions for fair value measurements for financial instruments and nonfinancial assets and liabilities recognized or disclosed at fair value in the financial statements on a recurring basis, in 2008. In 2009, the Company adopted accounting guidance that extended these aforementioned recognition and disclosure provisions to nonfinancial assets and liabilities measured at fair value on a nonrecurring basis.
/s/ KPMG LLP
Atlanta, Georgia
February 26, 2010
F-2
Table of Contents
Report of Independent Registered Public Accounting Firm
The Member
Mirant Mid-Atlantic, LLC:
We have audited the accompanying consolidated balance sheets of Mirant Mid-Atlantic, LLC (a wholly-owned indirect subsidiary of Mirant Corporation) and subsidiaries (the “Company”) as of December 31, 2009 and 2008, and the related consolidated statements of operations, equity, and cash flows for each of the years in the three-year period ended December 31, 2009. These consolidated financial statements are the responsibility of the Company’s management. Our responsibility is to express an opinion on these consolidated financial statements based on our audits.
We conducted our audits in accordance with the standards of the Public Company Accounting Oversight Board (United States). Those standards require that we plan and perform the audit to obtain reasonable assurance about whether the financial statements are free of material misstatement. An audit includes examining, on a test basis, evidence supporting the amounts and disclosures in the financial statements. An audit also includes assessing the accounting principles used and significant estimates made by management, as well as evaluating the overall financial statement presentation. We believe that our audits provide a reasonable basis for our opinion.
In our opinion, the consolidated financial statements referred to above present fairly, in all material respects, the financial position of Mirant Mid-Atlantic, LLC and subsidiaries as of December 31, 2009 and 2008, and the results of their operations and their cash flows for each of the years in the three-year period ended December 31, 2009, in conformity with U.S. generally accepted accounting principles.
As discussed in Note 1 to the consolidated financial statements, the Company adopted accounting guidance related to the recognition and disclosure provisions for fair value measurements for financial instruments and nonfinancial assets and liabilities recognized or disclosed at fair value in the financial statements on a recurring basis, in 2008. In 2009, the Company adopted accounting guidance that extended these aforementioned recognition and disclosure provisions to nonfinancial assets and liabilities measured at fair value on a nonrecurring basis.
/s/ KPMG LLP
Atlanta, Georgia
February 26, 2010
F-3
Table of Contents
MIRANT AMERICAS GENERATION, LLC AND SUBSIDIARIES
(Wholly-Owned Indirect Subsidiary of Mirant Corporation)
CONSOLIDATED STATEMENTS OF OPERATIONS
| For the Years ended December 31, | ||||||||||||
| 2009 | 2008 | 2007 | ||||||||||
| (in millions) | ||||||||||||
| Operating revenues—nonaffiliate (including unrealized gains (losses) of $(2) million, $840 million and $(666) million, respectively) |
$ | 2,309 | $ | 3,188 | $ | 1,990 | ||||||
| Operating revenues—affiliate (including unrealized gains of $0, $0 and $14 million, respectively) |
— | — | 51 | |||||||||
| Total operating revenues |
2,309 | 3,188 | 2,041 | |||||||||
| Cost of fuel, electricity and other products—nonaffiliate (including unrealized (gains) losses of $(49) million, $54 million and $(28) million, respectively) |
701 | 1,053 | 988 | |||||||||
| Cost of fuel, electricity and other products—affiliate (including unrealized (gains) losses of $0, $0 and $0, respectively) |
9 | 6 | 51 | |||||||||
| Total cost of fuel, electricity and other products |
710 | 1,059 | 1,039 | |||||||||
| Gross Margin (excluding depreciation and amortization) |
1,599 | 2,129 | 1,002 | |||||||||
| Operating Expenses: |
||||||||||||
| Operations and maintenance—nonaffiliate |
355 | 372 | 353 | |||||||||
| Operations and maintenance—affiliate |
290 | 285 | 276 | |||||||||
| Depreciation and amortization |
142 | 136 | 120 | |||||||||
| Impairment losses |
221 | — | 175 | |||||||||
| Gain on sales of assets, net |
(22 | ) | (38 | ) | (39 | ) | ||||||
| Total operating expenses, net |
986 | 755 | 885 | |||||||||
| Operating Income |
613 | 1,374 | 117 | |||||||||
| Other Expense (Income), net: |
||||||||||||
| Interest expense—nonaffiliate |
137 | 189 | 245 | |||||||||
| Interest expense—affiliate |
— | — | 1 | |||||||||
| Interest income—nonaffiliate |
(1 | ) | (16 | ) | (58 | ) | ||||||
| Other, net |
1 | 3 | (1 | ) | ||||||||
| Total other expense, net |
137 | 176 | 187 | |||||||||
| Income (Loss) From Continuing Operations Before Reorganization Items |
476 | 1,198 | (70 | ) | ||||||||
| Reorganization items, net |
— | — | (2 | ) | ||||||||
| Income (Loss) From Continuing Operations |
476 | 1,198 | (68 | ) | ||||||||
| Income From Discontinued Operations, net |
— | — | 8 | |||||||||
| Net Income (Loss) |
$ | 476 | $ | 1,198 | $ | (60 | ) | |||||
The accompanying combined notes are an integral part of these consolidated financial statements
F-4
Table of Contents
MIRANT AMERICAS GENERATION, LLC AND SUBSIDIARIES
(Wholly-Owned Indirect Subsidiary of Mirant Corporation)
CONSOLIDATED BALANCE SHEETS
| At December 31, | ||||||||
| 2009 | 2008 | |||||||
| (in millions) | ||||||||
| ASSETS |
||||||||
| Current Assets: |
||||||||
| Cash and cash equivalents |
$ | 404 | $ | 354 | ||||
| Funds on deposit |
180 | 196 | ||||||
| Receivables—nonaffiliate, less allowance for uncollectibles of $0 and $2 for 2009 and 2008, respectively |
401 | 742 | ||||||
| Receivables—affiliate |
— | 1 | ||||||
| Derivative contract assets |
1,416 | 2,582 | ||||||
| Inventories |
241 | 238 | ||||||
| Prepaid rent and other payments |
134 | 120 | ||||||
| Total current assets |
2,776 | 4,233 | ||||||
| Property, Plant and Equipment, net |
3,606 | 3,192 | ||||||
| Noncurrent Assets: |
||||||||
| Intangible assets, net |
171 | 195 | ||||||
| Derivative contract assets |
599 | 585 | ||||||
| Prepaid rent |
304 | 258 | ||||||
| Debt issuance costs, net |
29 | 38 | ||||||
| Other |
32 | 51 | ||||||
| Total noncurrent assets |
1,135 | 1,127 | ||||||
| Total Assets |
$ | 7,517 | $ | 8,552 | ||||
| LIABILITIES AND MEMBER’S EQUITY |
||||||||
| Current Liabilities: |
||||||||
| Current portion of long-term debt |
$ | 74 | $ | 45 | ||||
| Accounts payable and accrued liabilities |
646 | 813 | ||||||
| Payable to affiliate |
42 | 34 | ||||||
| Derivative contract liabilities |
1,150 | 2,268 | ||||||
| Other |
8 | 22 | ||||||
| Total current liabilities |
1,920 | 3,182 | ||||||
| Noncurrent Liabilities: |
||||||||
| Long-term debt, net of current portion |
2,556 | 2,630 | ||||||
| Derivative contract liabilities |
163 | 244 | ||||||
| Other |
49 | 112 | ||||||
| Total noncurrent liabilities |
2,768 | 2,986 | ||||||
| Commitments and Contingencies |
||||||||
| Member’s Equity: |
||||||||
| Member’s interest |
3,109 | 2,729 | ||||||
| Preferred stock in affiliate |
(280 | ) | (345 | ) | ||||
| Total member’s equity |
2,829 | 2,384 | ||||||
| Total Liabilities and Member’s Equity |
$ | 7,517 | $ | 8,552 | ||||
The accompanying combined notes are an integral part of these consolidated financial statements
F-5
Table of Contents
MIRANT AMERICAS GENERATION, LLC AND SUBSIDIARIES
(Wholly-Owned Indirect Subsidiary of Mirant Corporation)
CONSOLIDATED STATEMENTS OF EQUITY
| Member’s Interest |
Preferred Stock in Affiliate |
Total Member’s Equity |
||||||||||
| (in millions) | ||||||||||||
| Balance, December 31, 2006 |
$ | 1,983 | $ | (339 | ) | $ | 1,644 | |||||
| Net loss |
(60 | ) | — | (60 | ) | |||||||
| Amortization of discount on preferred stock in affiliate |
21 | (21 | ) | — | ||||||||
| Redemption of preferred stock in affiliate |
— | 5 | 5 | |||||||||
| Distributions to member |
(534 | ) | — | (534 | ) | |||||||
| Capital contributions pursuant to the Plan |
2 | — | 2 | |||||||||
| Adoption of accounting guidance related to accounting for uncertainty in income taxes |
51 | — | 51 | |||||||||
| Effect of the Supplemental Plan |
22 | — | 22 | |||||||||
| Capital contributions |
39 | — | 39 | |||||||||
| Balance, December 31, 2007 |
1,524 | (355 | ) | 1,169 | ||||||||
| Net income |
1,198 | — | 1,198 | |||||||||
| Amortization of discount on preferred stock in affiliate |
21 | (21 | ) | — | ||||||||
| Redemption of preferred stock in affiliate |
— | 31 | 31 | |||||||||
| Distributions to member |
(297 | ) | — | (297 | ) | |||||||
| Capital contributions |
282 | — | 282 | |||||||||
| Adoption of accounting guidance related to fair value measurement |
1 | — | 1 | |||||||||
| Balance, December 31, 2008 |
2,729 | (345 | ) | 2,384 | ||||||||
| Net income |
476 | — | 476 | |||||||||
| Amortization of discount on preferred stock in affiliate |
19 | (19 | ) | — | ||||||||
| Redemption of preferred stock in affiliate |
— | 84 | 84 | |||||||||
| Distribution to member |
(115 | ) | — | (115 | ) | |||||||
| Balance, December 31, 2009 |
$ | 3,109 | $ | (280 | ) | $ | 2,829 | |||||
The accompanying combined notes are an integral part of these consolidated financial statements
F-6
Table of Contents
MIRANT AMERICAS GENERATION, LLC AND SUBSIDIARIES
(Wholly-Owned Indirect Subsidiary of Mirant Corporation)
CONSOLIDATED STATEMENTS OF CASH FLOWS
| For the Years Ended December 31, | ||||||||||||
| 2009 | 2008 | 2007 | ||||||||||
| (in millions) | ||||||||||||
| Cash Flows from Operating Activities: |
||||||||||||
| Net income (loss) |
$ | 476 | $ | 1,198 | $ | (60 | ) | |||||
| Income from discontinued operations, net |
— | — | 8 | |||||||||
| Income (loss) from continuing operations |
476 | 1,198 | (68 | ) | ||||||||
| Adjustments to reconcile net income (loss) and changes in other operating assets and liabilities from continuing operations to net cash provided by operating activities: |
||||||||||||
| Depreciation and amortization |
152 | 146 | 130 | |||||||||
| Impairment losses |
221 | — | 175 | |||||||||
| Gain on sales of assets, net |
(22 | ) | (38 | ) | (39 | ) | ||||||
| Unrealized losses (gains) on derivative contracts, net |
(47 | ) | (786 | ) | 624 | |||||||
| Lower of cost or market inventory adjustments |
32 | 65 | 7 | |||||||||
| Other, net |
— | 9 | (1 | ) | ||||||||
| Changes in operating assets and liabilities: |
||||||||||||
| Nonaffiliate accounts receivable, net |
342 | (218 | ) | 170 | ||||||||
| Funds on deposit |
26 | 109 | (69 | ) | ||||||||
| Prepaid rent |
(46 | ) | (24 | ) | (16 | ) | ||||||
| Inventories |
(35 | ) | 47 | (77 | ) | |||||||
| Other assets |
(10 | ) | 7 | 4 | ||||||||
| Accounts payable and accrued liabilities |
(326 | ) | 249 | (147 | ) | |||||||
| Settlement of claims payable |
— | — | (20 | ) | ||||||||
| Payable to affiliate |
8 | 1 | (16 | ) | ||||||||
| Taxes accrued-nonaffiliate |
(7 | ) | 2 | (16 | ) | |||||||
| Other liabilities |
2 | (7 | ) | 11 | ||||||||
| Total adjustments |
290 | (438 | ) | 720 | ||||||||
| Net cash provided by operating activities of continuing operations |
766 | 760 | 652 | |||||||||
| Net cash provided by (used in) operating activities of discontinued operations |
— | 1 | (19 | ) | ||||||||
| Net cash provided by operating activities |
766 | 761 | 633 | |||||||||
| Cash Flows from Investing Activities: |
||||||||||||
| Capital expenditures |
(666 | ) | (720 | ) | (581 | ) | ||||||
| Proceeds from the sales of assets |
25 | 40 | 49 | |||||||||
| Restricted deposit payments and other |
1 | (34 | ) | 3 | ||||||||
| Net cash used in investing activities of continuing operations |
(640 | ) | (714 | ) | (529 | ) | ||||||
| Net cash provided by investing activities of discontinued operations |
— | 18 | 503 | |||||||||
| Net cash used in investing activities |
(640 | ) | (696 | ) | (26 | ) | ||||||
| Cash Flows from Financing Activities: |
||||||||||||
| Redemption of preferred stock in affiliate |
84 | 31 | 5 | |||||||||
| Repayments and purchases of long-term debt—nonaffiliate |
(45 | ) | (419 | ) | (179 | ) | ||||||
| Issuance (repayment) of note payable—affiliate, net |
— | (6 | ) | 7 | ||||||||
| Capital contributions |
— | 282 | 39 | |||||||||
| Distributions to member |
(115 | ) | (297 | ) | (534 | ) | ||||||
| Net cash used in financing activities |
(76 | ) | (409 | ) | (662 | ) | ||||||
| Net Increase (Decrease) in Cash and Cash Equivalents |
50 | (344 | ) | (55 | ) | |||||||
| Cash and Cash Equivalents, beginning of year |
354 | 698 | 750 | |||||||||
| Plus: Cash and Cash Equivalents in Assets Held for Sale, beginning of year |
— | — | 3 | |||||||||
| Cash and Cash Equivalents, end of year |
$ | 404 | $ | 354 | $ | 698 | ||||||
| Supplemental Cash Flow Disclosures: |
||||||||||||
| Cash paid for interest, net of amounts capitalized |
$ | 124 | $ | 175 | $ | 264 | ||||||
| Cash paid for claims and professional fees from bankruptcy |
$ | — | $ | — | $ | 22 | ||||||
| Financing Activity: |
||||||||||||
| Effect of the Supplemental Plan—non-cash |
$ | — | $ | — | $ | 22 | ||||||
| Capital contributions pursuant to the Plan—non-cash |
$ | — | $ | — | $ | 2 | ||||||
The accompanying combined notes are an integral part of these consolidated financial statements
F-7
Table of Contents
MIRANT NORTH AMERICA, LLC AND SUBSIDIARIES
(Wholly-Owned Indirect Subsidiary of Mirant Corporation)
CONSOLIDATED STATEMENTS OF OPERATIONS
| For the Years ended December 31, | ||||||||||||
| 2009 | 2008 | 2007 | ||||||||||
| (in millions) | ||||||||||||
| Operating revenues—nonaffiliate (including unrealized gains (losses) of $(2) million, $840 million and $(666) million, respectively) |
$ | 2,309 | $ | 3,188 | $ | 1,990 | ||||||
| Operating revenues—affiliate (including unrealized gains of $0, $0 and $14 million, respectively) |
— | — | 51 | |||||||||
| Total operating revenues |
2,309 | 3,188 | 2,041 | |||||||||
| Cost of fuel, electricity and other products—nonaffiliate (including unrealized (gains) losses of $(49) million, $54 million and $(28) million, respectively) |
701 | 1,053 | 988 | |||||||||
| Cost of fuel, electricity and other products—affiliate (including unrealized (gains) losses of $0, $0 and $0, respectively) |
9 | 6 | 51 | |||||||||
| Total cost of fuel, electricity and other products |
710 | 1,059 | 1,039 | |||||||||
| Gross Margin (excluding depreciation and amortization) |
1,599 | 2,129 | 1,002 | |||||||||
| Operating Expenses: |
||||||||||||
| Operations and maintenance—nonaffiliate |
355 | 372 | 353 | |||||||||
| Operations and maintenance—affiliate |
290 | 285 | 276 | |||||||||
| Depreciation and amortization |
142 | 136 | 120 | |||||||||
| Impairment losses |
221 | — | 175 | |||||||||
| Gain on sales of assets, net |
(22 | ) | (38 | ) | (39 | ) | ||||||
| Total operating expenses, net |
986 | 755 | 885 | |||||||||
| Operating Income |
613 | 1,374 | 117 | |||||||||
| Other Expense (Income), net: |
||||||||||||
| Interest expense—nonaffiliate |
17 | 54 | 99 | |||||||||
| Interest expense—affiliate |
— | — | 1 | |||||||||
| Interest income—nonaffiliate |
(2 | ) | (16 | ) | (58 | ) | ||||||
| Interest income—affiliate |
— | (2 | ) | (5 | ) | |||||||
| Other, net |
1 | 1 | — | |||||||||
| Total other expense, net |
16 | 37 | 37 | |||||||||
| Income From Continuing Operations Before Reorganization Items |
597 | 1,337 | 80 | |||||||||
| Reorganization items, net |
— | — | (2 | ) | ||||||||
| Income From Continuing Operations |
597 | 1,337 | 82 | |||||||||
| Income From Discontinued Operations, net |
— | — | 8 | |||||||||
| Net Income |
$ | 597 | $ | 1,337 | $ | 90 | ||||||
The accompanying combined notes are an integral part of these consolidated financial statements
F-8
Table of Contents
MIRANT NORTH AMERICA, LLC AND SUBSIDIARIES
(Wholly-Owned Indirect Subsidiary of Mirant Corporation)
CONSOLIDATED BALANCE SHEETS
| At December 31, | ||||||||
| 2009 | 2008 | |||||||
| (in millions) | ||||||||
| ASSETS |
||||||||
| Current Assets: |
||||||||
| Cash and cash equivalents |
$ | 403 | $ | 354 | ||||
| Funds on deposit |
180 | 196 | ||||||
| Receivables—nonaffiliate, less allowance for uncollectibles of $0 and $2 for 2009 and 2008, respectively |
401 | 742 | ||||||
| Receivables—affiliate |
9 | 10 | ||||||
| Notes receivables—affiliate |
93 | 93 | ||||||
| Derivative contract assets |
1,416 | 2,582 | ||||||
| Inventories |
241 | 238 | ||||||
| Prepaid rent and other payments |
134 | 120 | ||||||
| Total current assets |
2,877 | 4,335 | ||||||
| Property, Plant and Equipment, net |
3,604 | 3,189 | ||||||
| Noncurrent Assets: |
||||||||
| Intangible assets, net |
171 | 195 | ||||||
| Derivative contract assets |
599 | 585 | ||||||
| Prepaid rent |
304 | 258 | ||||||
| Debt issuance costs, net |
23 | 32 | ||||||
| Other |
32 | 51 | ||||||
| Total noncurrent assets |
1,129 | 1,121 | ||||||
| Total Assets |
$ | 7,610 | $ | 8,645 | ||||
| LIABILITIES AND MEMBER’S EQUITY |
||||||||
| Current Liabilities: |
||||||||
| Current portion of long-term debt |
$ | 74 | $ | 45 | ||||
| Accounts payable and accrued liabilities |
621 | 789 | ||||||
| Payable to affiliate |
42 | 34 | ||||||
| Derivative contract liabilities |
1,150 | 2,268 | ||||||
| Other |
8 | 22 | ||||||
| Total current liabilities |
1,895 | 3,158 | ||||||
| Noncurrent Liabilities: |
||||||||
| Long-term debt, net of current portion |
1,174 | 1,248 | ||||||
| Derivative contract liabilities |
163 | 244 | ||||||
| Other |
49 | 112 | ||||||
| Total noncurrent liabilities |
1,386 | 1,604 | ||||||
| Commitments and Contingencies |
||||||||
| Member’s Equity: |
||||||||
| Member’s interest |
4,467 | 4,094 | ||||||
| Preferred stock in affiliate |
(138 | ) | (211 | ) | ||||
| Total member’s equity |
4,329 | 3,883 | ||||||
| Total Liabilities and Member’s Equity |
$ | 7,610 | $ | 8,645 | ||||
The accompanying combined notes are an integral part of these consolidated financial statements
F-9
Table of Contents
MIRANT NORTH AMERICA, LLC AND SUBSIDIARIES
(Wholly-Owned Indirect Subsidiary of Mirant Corporation)
CONSOLIDATED STATEMENTS OF EQUITY
| Member’s Interest |
Preferred Stock in Affiliate |
Total Member’s Equity |
||||||||||
| (in millions) | ||||||||||||
| Balance, December 31, 2006 |
$ | 3,685 | $ | (221 | ) | $ | 3,464 | |||||
| Net income |
90 | — | 90 | |||||||||
| Amortization of discount on preferred stock in affiliate |
13 | (13 | ) | — | ||||||||
| Redemption of preferred stock in affiliate |
— | 5 | 5 | |||||||||
| Distributions to member |
(695 | ) | — | (695 | ) | |||||||
| Settlement of member’s obligation pursuant to the Plan |
(20 | ) | — | (20 | ) | |||||||
| Capital contributions pursuant to the Plan |
19 | — | 19 | |||||||||
| Adoption of accounting guidance related to accounting for uncertainty in income taxes |
51 | — | 51 | |||||||||
| Effect of the Supplemental Plan |
14 | — | 14 | |||||||||
| Balance, December 31, 2007 |
3,157 | (229 | ) | 2,928 | ||||||||
| Net income |
1,337 | — | 1,337 | |||||||||
| Amortization of discount on preferred stock in affiliate |
13 | (13 | ) | — | ||||||||
| Redemption of preferred stock in affiliate |
— | 31 | 31 | |||||||||
| Distributions to member |
(414 | ) | — | (414 | ) | |||||||
| Adoption of accounting guidance related to fair value measurement |
1 | — | 1 | |||||||||
| Balance, December 31, 2008 |
4,094 | (211 | ) | 3,883 | ||||||||
| Net income |
597 | — | 597 | |||||||||
| Amortization of discount on preferred stock in affiliate |
11 | (11 | ) | — | ||||||||
| Redemption of preferred stock in affiliate |
— | 84 | 84 | |||||||||
| Distribution to member |
(235 | ) | — | (235 | ) | |||||||
| Balance, December 31, 2009 |
$ | 4,467 | $ | (138 | ) | $ | 4,329 | |||||
The accompanying combined notes are an integral part of these consolidated financial statements
F-10
Table of Contents
MIRANT NORTH AMERICA, LLC AND SUBSIDIARIES
(Wholly-Owned Indirect Subsidiary of Mirant Corporation)
CONSOLIDATED STATEMENTS OF CASH FLOWS
| For the Years Ended December 31, |
||||||||||||
| 2009 | 2008 | 2007 | ||||||||||
| (in millions) | ||||||||||||
| Cash Flows from Operating Activities: |
||||||||||||
| Net income |
$ | 597 | $ | 1,337 | $ | 90 | ||||||
| Income from discontinued operations, net |
— | — | 8 | |||||||||
| Income from continuing operations |
597 | 1,337 | 82 | |||||||||
| Adjustments to reconcile net income and changes in other operating assets and liabilities from continuing operations to net cash provided by operating activities: |
||||||||||||
| Depreciation and amortization |
150 | 144 | 128 | |||||||||
| Impairment losses |
221 | — | 175 | |||||||||
| Gain on sales of assets, net |
(22 | ) | (38 | ) | (39 | ) | ||||||
| Unrealized losses (gains) on derivative contracts, net |
(47 | ) | (786 | ) | 624 | |||||||
| Lower of cost or market inventory adjustments |
32 | 65 | 7 | |||||||||
| Other, net |
— | 8 | (1 | ) | ||||||||
| Changes in operating assets and liabilities: |
||||||||||||
| Nonaffiliate accounts receivable, net |
342 | (218 | ) | 170 | ||||||||
| Affiliate accounts receivable, net |
— | (2 | ) | (3 | ) | |||||||
| Funds on deposit |
26 | 109 | (69 | ) | ||||||||
| Prepaid rent |
(46 | ) | (24 | ) | (16 | ) | ||||||
| Inventories |
(35 | ) | 47 | (77 | ) | |||||||
| Other assets |
(10 | ) | 7 | 3 | ||||||||
| Accounts payable and accrued liabilities |
(326 | ) | 253 | (146 | ) | |||||||
| Payable to affiliate |
8 | 1 | — | |||||||||
| Taxes accrued-nonaffiliate |
(7 | ) | 2 | (16 | ) | |||||||
| Other liabilities |
2 | (7 | ) | 11 | ||||||||
| Total adjustments |
288 | (439 | ) | 751 | ||||||||
| Net cash provided by operating activities of continuing operations |
885 | 898 | 833 | |||||||||
| Net cash provided by (used in) operating activities of discontinued operations |
— | 1 | (19 | ) | ||||||||
| Net cash provided by operating activities |
885 | 899 | 814 | |||||||||
| Cash Flows from Investing Activities: |
||||||||||||
| Capital expenditures |
(666 | ) | (720 | ) | (581 | ) | ||||||
| Proceeds from the sales of assets |
25 | 40 | 49 | |||||||||
| Restricted deposit payments and other |
1 | (34 | ) | 3 | ||||||||
| Net cash used in investing activities of continuing operations |
(640 | ) | (714 | ) | (529 | ) | ||||||
| Net cash provided by investing activities of discontinued operations |
— | 18 | 503 | |||||||||
| Net cash used in investing activities |
(640 | ) | (696 | ) | (26 | ) | ||||||
| Cash Flows from Financing Activities: |
||||||||||||
| Redemption of preferred stock in affiliate |
84 | 31 | 5 | |||||||||
| Repayments of long-term debt—nonaffiliate |
(45 | ) | (142 | ) | (141 | ) | ||||||
| Issuance (repayment) of note payable—affiliate, net |
— | (20 | ) | 7 | ||||||||
| Distributions to member |
(235 | ) | (414 | ) | (695 | ) | ||||||
| Settlement of member’s obligations pursuant to the Plan |
— | — | (20 | ) | ||||||||
| Other |
— | (1 | ) | — | ||||||||
| Net cash used in financing activities |
(196 | ) | (546 | ) | (844 | ) | ||||||
| Net Increase (Decrease) in Cash and Cash Equivalents |
49 | (343 | ) | (56 | ) | |||||||
| Cash and Cash Equivalents, beginning of year |
354 | 697 | 750 | |||||||||
| Plus: Cash and Cash Equivalents in Assets Held for Sale, beginning of year |
— | — | 3 | |||||||||
| Cash and Cash Equivalents, end of year |
$ | 403 | $ | 354 | $ | 697 | ||||||
| Supplemental Cash Flow Disclosures: |
||||||||||||
| Cash paid for interest, net of amounts capitalized |
$ | 5 | $ | 38 | $ | 120 | ||||||
| Financing Activity: |
||||||||||||
| Effect of the Supplemental Plan—non-cash |
$ | — | $ | — | $ | 14 | ||||||
| Capital contributions pursuant to the Plan—non-cash |
$ | — | $ | — | $ | 19 | ||||||
The accompanying combined notes are an integral part of these consolidated financial statements
F-11
Table of Contents
MIRANT MID-ATLANTIC, LLC AND SUBSIDIARIES
(Wholly-Owned Indirect Subsidiary of Mirant Corporation)
CONSOLIDATED STATEMENTS OF OPERATIONS
| For the Years ended December 31, | ||||||||||||
| 2009 | 2008 | 2007 | ||||||||||
| (in millions) | ||||||||||||
| Operating revenues—nonaffiliate (including unrealized gains (losses) of $137 million, $525 million and $(315) million, respectively) |
$ | 401 | $ | 492 | $ | (236 | ) | |||||
| Operating revenues—affiliate (including unrealized gains (losses) of $(1) million, $160 million and $(159) million, respectively) |
1,377 | 1,787 | 1,369 | |||||||||
| Total operating revenues |
1,778 | 2,279 | 1,133 | |||||||||
| Cost of fuel, electricity and other products—nonaffiliate (including unrealized (gains) losses of $0, $0 and $0, respectively) |
17 | 20 | 170 | |||||||||
| Cost of fuel, electricity and other products—affiliate (including unrealized (gains) losses of $(8) million, $9 million and $5 million, respectively) |
510 | 545 | 358 | |||||||||
| Total cost of fuel, electricity and other products ) |
527 | 565 | 528 | |||||||||
| Gross Margin (excluding depreciation and amortization) |
1,251 | 1,714 | 605 | |||||||||
| Operating Expenses: |
||||||||||||
| Operations and maintenance—nonaffiliate |
245 | 239 | 216 | |||||||||
| Operations and maintenance—affiliate |
189 | 173 | 144 | |||||||||
| Depreciation and amortization |
98 | 92 | 81 | |||||||||
| Impairment losses |
385 | — | — | |||||||||
| Gain on sales of assets, net |
(14 | ) | (8 | ) | — | |||||||
| Total operating expenses, net |
903 | 496 | 441 | |||||||||
| Operating Income |
348 | 1,218 | 164 | |||||||||
| Other Expense (Income), net: |
||||||||||||
| Interest expense |
3 | 3 | 3 | |||||||||
| Interest income |
— | (3 | ) | (8 | ) | |||||||
| Other, net |
1 | 1 | — | |||||||||
| Total other expense (income), net |
4 | 1 | (5 | ) | ||||||||
| Net Income |
$ | 344 | $ | 1,217 | $ | 169 | ||||||
The accompanying combined notes are an integral part of these consolidated financial statements
F-12
Table of Contents
MIRANT MID-ATLANTIC, LLC AND SUBSIDIARIES
(Wholly-Owned Indirect Subsidiary of Mirant Corporation)
CONSOLIDATED BALANCE SHEETS
| At December 31, | ||||||||
| 2009 | 2008 | |||||||
| (in millions) | ||||||||
| ASSETS |
||||||||
| Current Assets: |
||||||||
| Cash and cash equivalents |
$ | 125 | $ | 125 | ||||
| Funds on deposit |
14 | 3 | ||||||
| Receivables—nonaffiliate |
27 | 16 | ||||||
| Receivables—affiliate |
187 | 211 | ||||||
| Derivative contract assets—nonaffiliate |
155 | 87 | ||||||
| Derivative contract assets—affiliate |
464 | 603 | ||||||
| Inventories |
117 | 129 | ||||||
| Prepaid rent |
96 | 96 | ||||||
| Other |
18 | 9 | ||||||
| Total current assets |
1,203 | 1,279 | ||||||
| Property, Plant and Equipment, net |
3,000 | 2,622 | ||||||
| Noncurrent Assets: |
||||||||
| Goodwill, net |
616 | 799 | ||||||
| Other intangible assets, net |
138 | 144 | ||||||
| Derivative contract assets—nonaffiliate |
399 | 314 | ||||||
| Derivative contract assets—affiliate |
127 | 172 | ||||||
| Prepaid rent |
304 | 258 | ||||||
| Other |
20 | 32 | ||||||
| Total noncurrent assets |
1,604 | 1,719 | ||||||
| Total Assets |
$ | 5,807 | $ | 5,620 | ||||
| LIABILITIES AND MEMBER’S EQUITY |
||||||||
| Current Liabilities: |
||||||||
| Current portion of long-term debt |
$ | 4 | $ | 3 | ||||
| Accounts payable and accrued liabilities |
168 | 118 | ||||||
| Payable to affiliate |
123 | 143 | ||||||
| Derivative contract liabilities—nonaffiliate |
4 | — | ||||||
| Derivative contract liabilities—affiliate |
374 | 485 | ||||||
| Current portion of contract retention liability |
112 | 1 | ||||||
| Other |
2 | 20 | ||||||
| Total current liabilities |
787 | 770 | ||||||
| Noncurrent Liabilities: |
||||||||
| Long-term debt, net of current portion |
21 | 25 | ||||||
| Derivative contract liabilities—nonaffiliate |
13 | 1 | ||||||
| Derivative contract liabilities—affiliate |
84 | 164 | ||||||
| Contract retention liability, net of current portion |
— | 64 | ||||||
| Other |
16 | 13 | ||||||
| Total noncurrent liabilities |
134 | 267 | ||||||
| Commitments and Contingencies |
||||||||
| Member’s Equity: |
||||||||
| Member’s interest |
5,024 | 4,794 | ||||||
| Preferred stock in affiliate |
(138 | ) | (211 | ) | ||||
| Total member’s equity |
4,886 | 4,583 | ||||||
| Total Liabilities and Member’s Equity |
$ | 5,807 | $ | 5,620 | ||||
The accompanying combined notes are an integral part of these consolidated financial statements
F-13
Table of Contents
MIRANT MID-ATLANTIC, LLC AND SUBSIDIARIES
(Wholly-Owned Indirect Subsidiary of Mirant Corporation)
CONSOLIDATED STATEMENTS OF EQUITY
| Member’s Interest |
Preferred Stock in Affiliate |
Total Member’s Equity |
||||||||||
| (in millions) | ||||||||||||
| Balance, December 31, 2006 |
$ | 3,513 | $ | (221 | ) | $ | 3,292 | |||||
| Net income |
169 | — | 169 | |||||||||
| Amortization of discount on preferred stock in affiliate |
13 | (13 | ) | — | ||||||||
| Redemption of preferred stock in affiliate |
— | 5 | 5 | |||||||||
| Distributions to member |
(334 | ) | — | (334 | ) | |||||||
| Capital contributions |
274 | — | 274 | |||||||||
| Adoption of accounting guidance related to accounting for uncertainty in income taxes |
1 | — | 1 | |||||||||
| Balance, December 31, 2007 |
3,636 | (229 | ) | 3,407 | ||||||||
| Net income |
1,217 | — | 1,217 | |||||||||
| Amortization of discount on preferred stock in affiliate |
13 | (13 | ) | — | ||||||||
| Redemption of preferred stock in affiliate |
— | 31 | 31 | |||||||||
| Distributions to member |
(325 | ) | — | (325 | ) | |||||||
| Capital contributions |
250 | — | 250 | |||||||||
| Adoption of accounting guidance related to fair value measurement |
3 | — | 3 | |||||||||
| Balance, December 31, 2008 |
4,794 | (211 | ) | 4,583 | ||||||||
| Net income |
344 | — | 344 | |||||||||
| Amortization of discount on preferred stock in affiliate |
11 | (11 | ) | — | ||||||||
| Redemption of preferred stock in affiliate |
— | 84 | 84 | |||||||||
| Distribution to member |
(125 | ) | — | (125 | ) | |||||||
| Balance, December 31, 2009 |
$ | 5,024 | $ | (138 | ) | $ | 4,886 | |||||
The accompanying combined notes are an integral part of these consolidated financial statements
F-14
Table of Contents
MIRANT MID-ATLANTIC, LLC AND SUBSIDIARIES
(Wholly-Owned Indirect Subsidiary of Mirant Corporation)
CONSOLIDATED STATEMENTS OF CASH FLOWS
| For the Years Ended December 31, | ||||||||||||
| 2009 | 2008 | 2007 | ||||||||||
| (in millions) | ||||||||||||
| Cash Flows from Operating Activities: |
||||||||||||
| Net income |
$ | 344 | $ | 1,217 | $ | 169 | ||||||
| Adjustments to reconcile net income and changes in other operating assets and liabilities to net cash provided by operating activities: |
||||||||||||
| Depreciation and amortization |
98 | 92 | 81 | |||||||||
| Impairment losses |
385 | — | — | |||||||||
| Gain on sales of assets, net |
(14 | ) | (8 | ) | — | |||||||
| Unrealized losses (gains) on derivative contracts, net |
(144 | ) | (676 | ) | 479 | |||||||
| Lower of cost or market inventory adjustments |
29 | 14 | 4 | |||||||||
| Changes in other operating assets and liabilities: |
||||||||||||
| Nonaffiliate accounts receivable, net |
(11 | ) | (7 | ) | (9 | ) | ||||||
| Affiliate accounts receivable, net |
24 | (69 | ) | 117 | ||||||||
| Funds on deposit |
— | 2 | — | |||||||||
| Prepaid rent |
(46 | ) | (24 | ) | (16 | ) | ||||||
| Inventories |
(17 | ) | (23 | ) | 6 | |||||||
| Other assets |
(9 | ) | 1 | 8 | ||||||||
| Accounts payable and accrued liabilities |
— | (1 | ) | 8 | ||||||||
| Payable to affiliate |
(19 | ) | 66 | (107 | ) | |||||||
| Taxes accrued-nonaffiliate |
(7 | ) | 2 | 8 | ||||||||
| Other liabilities |
(6 | ) | 11 | 2 | ||||||||
| Total adjustments |
263 | (620 | ) | 581 | ||||||||
| Net cash provided by operating activities |
607 | 597 | 750 | |||||||||
| Cash Flows from Investing Activities: |
||||||||||||
| Capital expenditures |
(578 | ) | (641 | ) | (531 | ) | ||||||
| Proceeds from the sales of assets |
14 | 8 | 2 | |||||||||
| Restricted deposit payments and other |
1 | (34 | ) | 3 | ||||||||
| Net cash used in investing activities |
(563 | ) | (667 | ) | (526 | ) | ||||||
| Cash Flows from Financing Activities: |
||||||||||||
| Redemption of preferred stock in affiliate |
84 | 31 | 5 | |||||||||
| Repayment of long-term debt—nonaffiliate |
(3 | ) | (2 | ) | (3 | ) | ||||||
| Capital contributions |
— | 250 | 274 | |||||||||
| Distributions to member |
(125 | ) | (325 | ) | (334 | ) | ||||||
| Other |
— | (1 | ) | 1 | ||||||||
| Net cash used in financing activities |
(44 | ) | (47 | ) | (57 | ) | ||||||
| Net Increase (Decrease) in Cash and Cash Equivalents |
— | (117 | ) | 167 | ||||||||
| Cash and Cash Equivalents, beginning of year |
125 | 242 | 75 | |||||||||
| Cash and Cash Equivalents, end of year |
$ | 125 | $ | 125 | $ | 242 | ||||||
| Supplemental Cash Flow Disclosures: |
||||||||||||
| Cash paid for interest |
$ | 2 | $ | 2 | $ | 3 | ||||||
The accompanying combined notes are an integral part of these consolidated financial statements
F-15
Table of Contents
MIRANT AMERICAS GENERATION, LLC AND SUBSIDIARIES
MIRANT NORTH AMERICA, LLC AND SUBSIDIARIES
MIRANT MID-ATLANTIC, LLC AND SUBSIDIARIES
COMBINED NOTES TO CONSOLIDATED FINANCIAL STATEMENTS December 31, 2009, 2008 and 2007
| 1. | Description of Business and Accounting and Reporting Policies (Mirant Americas Generation, Mirant North America and Mirant Mid-Atlantic) |
Mirant Americas Generation and Mirant North America are competitive energy companies that produce and sell electricity in the United States. Mirant Americas Generation and Mirant North America own or lease 10,076 MW of net electric generating capacity in the Mid-Atlantic and Northeast regions and in California. Mirant Americas Generation and Mirant North America also operate an integrated asset management and energy marketing organization based in Atlanta, Georgia.
Mirant Mid-Atlantic operates and owns or leases 5,194 MW of net electric generating capacity in the Washington, D.C. area. Mirant Mid-Atlantic’s electric generating capacity is part of the 10,076 MW of net electric generating capacity of Mirant Americas Generation and Mirant North America. Mirant Mid-Atlantic’s generating facilities serve the PJM markets. The PJM ISO operates the largest centrally dispatched control area in the United States.
Mirant Americas Generation, Mirant North America and Mirant Mid-Atlantic are Delaware limited liability companies and indirect wholly-owned subsidiaries of Mirant Corporation. Mirant North America is a wholly-owned subsidiary of Mirant Americas Generation. Mirant Mid-Atlantic is a wholly-owned subsidiary of Mirant North America and an indirect wholly-owned subsidiary of Mirant Americas Generation. The chart below is a summary representation of the Companies’ organizational structure and is not a complete organizational chart of Mirant Corporation.
F-16
Table of Contents
Mirant Corporation was incorporated in Delaware on September 23, 2005. Pursuant to the Plan for Mirant and certain of its subsidiaries, on January 3, 2006, New Mirant emerged from bankruptcy and acquired substantially all of the assets of Old Mirant, a corporation that was formed in Delaware on April 3, 1993, and that had been named Mirant Corporation prior to January 3, 2006.
In the third quarter of 2006, Mirant commenced separate auction processes to sell six United States natural gas-fired facilities including the Zeeland and Bosque facilities owned indirectly by Mirant North America. On May 1, 2007, Mirant North America completed the sale of the Zeeland and Bosque natural gas-fired facilities. In addition, on May 7, 2007, Mirant North America completed the sale of Mirant NY-Gen, an indirect wholly-owned subsidiary. In accordance with Mirant North America’s debt covenants, approximately $524 million of the proceeds from the sale of the Zeeland and Bosque facilities were reinvested in the business of Mirant North America. See Note 8 for additional information regarding the accounting for these businesses and facilities as discontinued operations.
Mirant Americas Generation, Mirant North America and Mirant Mid-Atlantic have a number of service agreements for labor and administrative services with Mirant Services. See Note 6 for further discussion of arrangements with these related parties.
Basis of Presentation
The accompanying consolidated financial statements of the Companies have been prepared in accordance with GAAP.
The accompanying consolidated financial statements include the accounts of the Companies and their wholly-owned subsidiaries and have been prepared from records maintained by the Companies and their subsidiaries. All significant intercompany accounts and transactions within consolidated entities have been eliminated in consolidation.
In accordance with the accounting guidance related to discontinued operations, the results of operations of Mirant Americas Generation’s and Mirant North America’s facilities that have been disposed of and have met the criteria for such classification, have been reclassified to discontinued operations. Certain prior period amounts have been reclassified to conform to the current year financial statement presentation.
Use of Estimates
The preparation of consolidated financial statements in conformity with GAAP requires management to make various estimates and assumptions that affect the reported amounts of assets and liabilities, disclosures of contingent assets and liabilities at the date of the consolidated financial statements and the reported amounts of revenues and expenses during the period. Actual results could differ from those estimates. The Companies’ significant estimates include:
| — | determining the fair value of certain derivative contracts; |
| — | estimating future taxable income in evaluating their deferred tax asset valuation allowance; |
| — | estimating the useful lives of long-lived assets; |
| — | determining the value of asset retirement obligations; |
| — | estimating future cash flows in determining impairments of long-lived assets, goodwill and definite-lived intangible assets; and |
| — | estimating losses to be recorded for contingent liabilities. |
F-17
Table of Contents
The Companies evaluate events that occur after their balance sheet date but before their financial statements are issued for potential recognition or disclosure. Based on their evaluations, as of the time of filing this Form 10-K with the SEC on February 26, 2010, the Companies determined that there were no material subsequent events for recognition or disclosure other than those disclosed herein.
Revenue Recognition
Mirant Americas Generation and Mirant North America
Mirant Americas Generation and Mirant North America recognize revenue from the sale of energy when earned and collection is probable. Some sales of energy are based on economic dispatch, or ‘as-ordered’ by an ISO or RTO, based on member participation agreements, but without an underlying contractual commitment. ISO and RTO revenues and revenues from sales of energy based on economic-dispatch are recorded on the basis of MWh delivered, at the relevant day-ahead or real-time prices. In accordance with accounting guidance related to derivative contracts held for trading purposes and contracts involved in energy trading and risk management activities, physical transactions, or revenues from the sale of generated electricity to ISOs and RTOs, are recorded on a gross basis in the consolidated statements of operations. Financial transactions, or the buying and selling of energy for trading purposes, are recorded on a net basis in the consolidated statements of operations. When a long-term electric power agreement conveys to the buyer of the electric power the right to use the generating capacity of Mirant Americas Generation’s and Mirant North America’s facility, that agreement is evaluated to determine if it is a lease of the generating facility rather than a sale of electric power. Operating lease revenue for Mirant Americas Generation’s and Mirant North America’s generating facilities is normally recorded as capacity revenue and included in operating revenues in the consolidated statements of operations. Capacity revenue also consists of revenue received from providing ancillary services and revenue received from an ISO or RTO based on auction results or negotiated contract prices for making installed generation capacity available to meet system reliability requirements.
Mirant Mid-Atlantic
Mirant Mid-Atlantic recognizes revenue from the sale of energy when earned and collection is probable. Mirant Mid-Atlantic recognizes affiliate and nonaffiliate revenue when electric power is delivered to an affiliate or to a customer pursuant to contractual commitments that specify volume, price and delivery requirements. Some affiliate sales of energy are based on economic dispatch or ‘as-ordered’ by PJM, based on member participation agreements, but without an underlying contractual commitment. ISO and RTO revenues and revenues from sales of energy based on economic dispatch are recorded on the basis of MWh delivered, at the relevant day-ahead or real-time prices. Mirant Mid-Atlantic also recognizes affiliate revenue when ancillary services have been performed and collection of such revenue is probable. Capacity revenue consists of revenue received from providing ancillary services and revenue received from an ISO or RTO based on auction results or negotiated contract prices for making installed generation capacity available to meet system reliability requirements.
Cost of Fuel, Electricity and Other Products
Cost of fuel, electricity and other products on the Companies’ consolidated statements of operations include the costs of goods produced and sold through the combustion process, including the costs associated with handling and disposal of ash, and services rendered during a reporting period. Cost of fuel, electricity and other products also includes purchased emissions allowances for CO2, SO2 and NOx and the settlements of and changes in fair value of derivative financial instruments used to hedge fuel economically. Additionally, cost of fuel, electricity and other products includes lower of cost or market inventory adjustments and gains recognized on the sale of inventory. Cost of fuel, electricity and other products excludes depreciation and amortization. Gross margin is total operating revenues less cost of fuel, electricity and other products.
F-18
Table of Contents
Derivative Financial Instruments
Derivative financial instruments are recorded in the accompanying consolidated balance sheets at fair value as either derivative contract assets or liabilities—affiliate or derivative contract assets or liabilities—nonaffiliate, and changes in fair value are recognized currently in earnings, unless the Companies elect to apply fair value or cash flow hedge accounting based on meeting specific criteria in the accounting guidance for derivative financial instruments. For the years ended December 31, 2009, 2008 and 2007, the Companies did not have any derivative financial instruments that they had designated as fair value or cash flow hedges for accounting purposes. Mirant Americas Generation’s and Mirant North America’s derivative financial instruments are categorized based on the business objective the instrument is expected to achieve: asset management or proprietary trading and fuel oil management. Mirant Mid-Atlantic’s derivative financial instruments are all for asset management. All derivative financial instruments are recorded at fair value, except for certain transactions that qualify for the normal purchases or normal sales exclusion under the accounting guidance for derivative financial instruments and, therefore, qualify for the use of accrual accounting.
As the Companies’ derivative financial instruments have not been designated as hedges for accounting purposes, changes in such instruments’ fair values are recognized immediately in earnings. For asset management activities, changes in fair value and settlement of derivative financial instruments used to hedge electricity economically are reflected in operating revenue—affiliate and nonaffiliate and changes in fair value and settlement of derivative financial instruments used to hedge fuel economically are reflected in cost of fuel, electricity and other products—affiliate and nonaffiliate in the accompanying consolidated statements of operations. Changes in the fair value and settlements of derivative financial instruments for Mirant Americas Generation’s and Mirant North America’s proprietary trading and fuel oil management activities are recorded on a net basis as operating revenue—nonaffiliate in the accompanying consolidated statements of operations.
Concentration of Revenues
In 2009, 2008 and 2007, Mirant Americas Generation, Mirant North America and Mirant Mid-Atlantic earned a significant portion of their operating revenue and gross margin from the PJM market, where the Mirant Mid-Atlantic generating facilities are located. Mirant Mid-Atlantic’s revenues and gross margin as a percentage of Mirant Americas Generation’s and Mirant North America’s total revenues and gross margin from continuing operations are as follows:
| Years Ended December 31, | |||||||||
| 2009 | 2008 | 2007 | |||||||
| Operating revenues |
77 | % | 72 | % | 56 | % | |||
| Gross margin |
78 | % | 81 | % | 60 | % | |||
Coal Supplier Concentration Risk
The Companies procure most of their coal from a small number of strategic suppliers. In order to mitigate the risk of non-performance, the Companies manage their concentration levels to individual suppliers and mines. At December 31, 2009, two of the Companies’ coal suppliers together represented approximately 53% of the Companies’ expected coal purchases for 2010.
Concentration of Labor Subject to Collective Bargaining Agreements
Under the Companies’ services agreement with Mirant Services, a direct subsidiary of Mirant, Mirant Services provides the Companies’ personnel. At December 31, 2009 approximately 1,320 Mirant Services employees worked at Mirant Americas Generation and Mirant North America facilities, of which approximately 824 worked at Mirant Mid-Atlantic facilities. At December 31, 2009, approximately 61% of Mirant Americas Generation’s and Mirant North America’s total employees are subject to collective bargaining agreements and approximately 66% of Mirant Mid-Atlantic’s total employees are subject to collective bargaining agreements and are represented by IBEW Local 1900.
F-19
Table of Contents
Cash and Cash Equivalents
The Companies consider all short-term investments with an original maturity of three months or less to be cash equivalents. At December 31, 2009, except for amounts held in bank accounts to cover current payables, all of the Companies’ cash and cash equivalents were invested in AAA-rated United States Treasury money market funds.
Restricted Cash
Mirant Americas Generation and Mirant North America
Restricted cash is included in current and noncurrent assets as funds on deposit and other noncurrent assets in the accompanying consolidated balance sheets. At December 31, 2009, current and noncurrent funds on deposit were $180 million and $27 million, respectively. At December 31, 2008, current and noncurrent funds on deposit were $196 million and $38 million, respectively. Restricted cash includes deposits with brokers and cash collateral posted with third parties to support Mirant Americas Generation’s and Mirant North America’s commodity positions as well as $124 million and $122 million deposits as of December 31, 2009 and 2008, respectively, by Mirant North America posted under its senior secured term loan to support the issuance of letters of credit.
Mirant Mid-Atlantic
Restricted cash is included in current and noncurrent assets as funds on deposit and other noncurrent assets in the accompanying consolidated balance sheets. At December 31, 2009, current and noncurrent funds on deposit were $14 million and $20 million, respectively. At December 31, 2008, current and noncurrent funds on deposit were $3 million and $31 million, respectively. Restricted cash includes cash collateral posted with third parties to support certain of Mirant Mid-Atlantic’s capital expenditure programs and Mirant Potomac River’s agreement with the City of Alexandria.
Inventories
Inventories consist primarily of fuel oil, coal, materials and supplies, and purchased emissions allowances. Inventory is generally stated at the lower of cost or market value. The inventory is expensed on a weighted average cost basis as it is used. Fuel inventory is removed from the inventory account as it is used in the generation of electricity. Materials and supplies are removed from the inventory account when they are used for repairs, maintenance or capital projects. Purchased emissions allowances are removed from inventory and charged to cost of fuel, electricity and other products in the Companies’ accompanying consolidated statements of operations as they are utilized for emissions volumes.
Inventories were comprised of the following (in millions):
Mirant Americas Generation and Mirant North America
| At December 31, | ||||||
| 2009 | 2008 | |||||
| Fuel inventory: |
||||||
| Fuel oil |
$ | 99 | $ | 113 | ||
| Coal |
52 | 43 | ||||
| Other |
1 | 1 | ||||
| Materials and supplies |
66 | 63 | ||||
| Purchased emissions allowances |
23 | 18 | ||||
| Total inventories |
$ | 241 | $ | 238 | ||
F-20
Table of Contents
Mirant Mid-Atlantic
| At December 31, | ||||||
| 2009 | 2008 | |||||
| Fuel inventory: |
||||||
| Fuel oil |
$ | 20 | $ | 25 | ||
| Coal |
52 | 43 | ||||
| Other |
1 | 1 | ||||
| Materials and supplies |
43 | 41 | ||||
| Purchased emissions allowances |
1 | 19 | ||||
| Total inventories |
$ | 117 | $ | 129 | ||
Granted Emissions Allowances
Included in property, plant and equipment are: (1) emissions allowances granted by the EPA that were projected to be required to offset physical emissions; and (2) emissions allowances granted by the EPA that were projected to be in excess of those required to offset physical emissions related to generating facilities owned by the Companies. These emissions allowances were recorded at fair value at the date of the acquisition of the facility and are depreciated on a straight-line basis over the estimated useful life of the respective generating facility and are charged to depreciation and amortization expense in the accompanying consolidated statements of operations.
Included in other intangible assets are emissions allowances related to the Dickerson and Morgantown baseload units leased by the Companies. Emissions allowances related to leased units are recorded at fair value at the commencement of the lease. These emissions allowances are amortized on a straight-line basis over the term of the lease for leased units, and are charged to depreciation and amortization expense in the accompanying consolidated statements of operations.
As a result of the capital expenditures the Companies have incurred to comply with the requirements of the Maryland Healthy Air Act, the Companies expect to have significant excess SO2 and NOx emissions allowances in future periods. The Companies plan to continue to maintain some SO2 and NOx emissions allowances in excess of expected generation in case their actual generation exceeds their current forecasts for future periods and for possible future additions of generating capacity.
Property, Plant and Equipment
Property, plant and equipment are recorded at cost, which includes materials, labor, associated payroll-related and overhead costs and the cost of financing construction. The cost of routine maintenance and repairs, such as inspections and corrosion removal, and the replacement of minor items of property are charged to expense as incurred. Certain expenditures incurred during a major maintenance outage of a generating facility are capitalized, including the replacement of major component parts and labor and overhead incurred to install the parts. Depreciation of the recorded cost of depreciable property, plant and equipment is determined using primarily composite rates. Leasehold improvements are depreciated over the shorter of the expected life of the related equipment or the lease term. Upon the retirement or sale of property, plant and equipment, the cost of such assets and the related accumulated depreciation are removed from the consolidated balance sheets. No gain or loss is recognized for ordinary retirements in the normal course of business since the composite depreciation rates used by the Companies take into account the effect of interim retirements.
Capitalization of Interest Cost (Mirant Americas Generation and Mirant North America)
Mirant Americas Generation and Mirant North America capitalize interest on projects during their construction period. Mirant Americas Generation and Mirant North America determine which debt instruments
F-21
Table of Contents
represent a reasonable measure of the cost of financing construction in terms of interest costs incurred that otherwise could have been avoided. These debt instruments and associated interest costs are included in the calculation of the weighted average interest rate used for determining the capitalization rate. Once a project is placed in service, capitalized interest, as a component of the total cost of the construction, is amortized over the estimated useful life of the asset constructed.
For the years ended December 31, 2009, 2008 and 2007, Mirant Americas Generation and Mirant North America incurred the following interest costs on debt to nonaffiliates (in millions):
Mirant Americas Generation
| Years Ended December 31, | ||||||||||||
| 2009 | 2008 | 2007 | ||||||||||
| Total interest costs |
$ | 209 | $ | 237 | $ | 270 | ||||||
| Capitalized and included in property, plant and equipment, net |
(72 | ) | (48 | ) | (25 | ) | ||||||
| Interest expense—nonaffiliate |
$ | 137 | $ | 189 | $ | 245 | ||||||
The amounts of capitalized interest above include interest accrued. For the years ended December 31, 2009, 2008 and 2007, cash paid for interest was $192 million, $223 million and $292 million, respectively, of which $68 million, $48 million and $28 million, respectively, were capitalized.
Mirant North America
| Years Ended December 31, | ||||||||||||
| 2009 | 2008 | 2007 | ||||||||||
| Total interest costs |
$ | 89 | $ | 102 | $ | 124 | ||||||
| Capitalized and included in property, plant and equipment, net |
(72 | ) | (48 | ) | (25 | ) | ||||||
| Interest expense—nonaffiliate |
$ | 17 | $ | 54 | $ | 99 | ||||||
The amounts of capitalized interest above include interest accrued. For the years ended December 31, 2009, 2008 and 2007, cash paid for interest was $73 million, $86 million and $148 million, respectively, of which $68 million, $48 million and $28 million, respectively, were capitalized.
Development Costs
The Companies capitalize project development costs for generating facilities once it is probable that the project will be completed. These costs include professional fees, permits and other third party costs directly associated with the development of a new project. The capitalized costs are depreciated over the life of the asset or charged to operating expense if the completion of the project is no longer probable. Project development costs are expensed when incurred until the probable threshold is met.
Operating Leases
The Companies lease various assets under non-cancelable leasing arrangements, including generating facilities, office space and other equipment. The rent expense associated with leases that qualify as operating leases is recognized on a straight-line basis over the lease term within operations and maintenance expense—nonaffiliate in the consolidated statements of operations. The Companies’ most significant operating leases are Mirant Mid-Atlantic’s leases of the Dickerson and Morgantown baseload units, which expire in 2029 and 2034, respectively. Mirant Mid-Atlantic has an option to extend these leases. Any extensions of the respective leases
F-22
Table of Contents
would be for less than 75% of the economic useful life of the facility, as measured from the beginning of the original lease term through the end of the proposed remaining lease term. As of December 31, 2009, the total notional minimum lease payments for the remaining terms of the leases of the Dickerson and Morgantown baseload units aggregated approximately $1.9 billion. The capital expenditures associated with the leased units of Dickerson and Morgantown are included as leasehold improvements in property, plant and equipment on the accompanying consolidated balance sheets. Payments made under the terms of the lease agreement in excess of the amount of lease expense recognized are recorded as prepaid rent in the accompanying consolidated balance sheets. Prepaid rent attributable to periods beyond one year is included in noncurrent assets.
Intangible Assets
Intangible assets relate primarily to trading rights, development rights and emissions allowances. Intangible assets with definite useful lives are amortized on a straight-line basis to their estimated residual values over their respective useful lives ranging up to 40 years.
Goodwill (Mirant Mid-Atlantic)
Goodwill represents the excess of costs over the fair value of assets of businesses acquired. Goodwill acquired in a purchase business combination is not amortized, but instead tested for impairment at least annually. A goodwill impairment occurs when the fair value of a reporting unit is less than its carrying value including goodwill. The amount of the impairment charge, if an impairment exists, is calculated as the difference between the implied fair value of the reporting unit goodwill and its carrying value. Mirant Mid-Atlantic performs an annual assessment of goodwill at October 31 and whenever contrary evidence exists as to the recoverability of goodwill. The fair value of the reporting unit is calculated using income and market approaches and underlying assumptions based on the best information available. See Note 3 for further discussion.
Debt Issuance Costs (Mirant Americas Generation and Mirant North America)
Debt issuance costs are capitalized and amortized as interest expense on a basis that approximates the effective interest method over the term of the related debt. At December 31, 2009 and 2008, the unamortized balance of debt issuance costs was approximately $29 million and $38 million, respectively, for Mirant Americas Generation and was approximately $23 million and $32 million, respectively, for Mirant North America.
Income Taxes and Deferred Tax Asset Valuation Allowance
Mirant Americas Generation and Mirant North America
Mirant Americas Generation and Mirant North America and most of their subsidiaries are limited liability companies that are treated as branches of Mirant Americas for income tax purposes. As a result, Mirant Americas and Mirant have direct liability for the majority of the federal and state income taxes relating to Mirant Americas Generation’s and Mirant North America’s operations. Some of Mirant Americas Generation’s and Mirant North America’s subsidiaries continue to exist as regarded corporate entities for income tax purposes. They are Hudson Valley Gas, Mirant Kendall and Mirant Special Procurement, Inc. For the subsidiaries that continue to exist as corporate regarded entities, Mirant Americas Generation and Mirant North America allocate current and deferred income taxes to each corporate regarded entity as if such entity were a single taxpayer utilizing the asset and liability method to account for income taxes. To the extent Mirant Americas Generation and Mirant North America provide tax expense or benefit, any related tax payable or receivable to Mirant is reclassified to equity in the same period since Mirant Americas Generation and Mirant North America do not have a tax sharing agreement with Mirant.
F-23
Table of Contents
Deferred tax assets and liabilities are recognized for the regarded corporate entities for the future tax consequences attributable to differences between the financial statement carrying amounts of existing assets and liabilities and their respective tax bases and operating loss and tax credit carry forwards. When necessary, deferred tax assets are reduced by a valuation allowance to reflect the amount that is estimated to be recoverable. In assessing the recoverability of the deferred tax assets, Mirant Americas Generation and Mirant North America consider whether it is likely that some portion or all of the deferred tax assets will be realized. Deferred tax assets and liabilities are measured using enacted tax rates expected to apply to taxable income in the years in which those temporary differences are expected to be recovered or settled. The effect on deferred tax assets and liabilities of a change in tax rates is recognized in income in the period that includes the enactment date.
The determination of a valuation allowance requires significant judgment as to the generation of taxable income during future periods for which temporary differences are expected to be deductible. In making this determination, Mirant Americas Generation and Mirant North America consider all available positive and negative evidence affecting specific deferred tax assets, including their past and anticipated future performance, the reversal of deferred tax liabilities and the implementation of tax planning strategies.
Additionally, Mirant Americas Generation and Mirant North America have not recognized any tax benefits relating to tax uncertainties arising in the ordinary course of business that are less than or subject to the measurement threshold of the more-likely-than-not standard prescribed under the accounting guidance for accounting for uncertainty of income taxes. These unrecognized tax benefits may be either a tax liability or an adjustment to their NOLs based on the specific facts of each tax uncertainty. Mirant Americas Generation and Mirant North America periodically assess their tax uncertainties based on the latest information available. The amount of the unrecognized tax benefit requires management to make significant assumptions about the expected outcomes of certain tax positions included in their filed or yet to be filed tax returns.
Mirant Mid-Atlantic
Mirant Mid Atlantic and its subsidiaries are limited liability companies that are treated as branches of Mirant Americas for income tax purposes. As such, Mirant Americas and Mirant have direct liability for the majority of the federal and state income taxes relating to its operations.
Impairment of Long-Lived Assets
The Companies evaluate long-lived assets, such as property, plant and equipment and purchased intangible assets subject to amortization, for impairment whenever events or changes in circumstances indicate that the carrying amount of the asset may not be recoverable. Such evaluations are performed in accordance with the accounting guidance related to evaluating long-lived assets for impairment. Recoverability of assets to be held and used is measured by a comparison of the carrying amount of an asset to the estimated undiscounted future cash flows expected to be generated by the asset. If the carrying amount of an asset exceeds its estimated undiscounted future cash flows, an impairment charge is recognized as the amount by which the carrying amount of the asset exceeds its fair value. See Note 3 for further discussion.
Fair Value of Financial Instruments
The accounting guidance related to the disclosure about fair value of financial instruments requires the disclosure of the fair value of all financial instruments that are not otherwise recorded at fair value in the financial statements. At December 31, 2009 and 2008, financial instruments recorded at contractual amounts that approximate fair value include cash and cash equivalents, funds on deposit, receivables from affiliate and nonaffiliate, notes receivable—affiliate, accounts payable and accrued liabilities, payable to affiliate and notes payable—affiliate. The fair values of such items are not materially sensitive to shifts in market interest rates because of the short term to maturity of these instruments. The fair value of the Companies’ long-term debt is estimated using quoted market prices when available.
F-24
Table of Contents
Recently Adopted Accounting Guidance
In December 2007, the FASB issued revised guidance related to accounting for business combinations. This guidance requires an acquirer of a business to recognize the assets acquired, the liabilities assumed and any noncontrolling interest in the acquiree at their acquisition-date fair values. The guidance also requires disclosure of information necessary for investors and other users to evaluate and understand the nature and financial effect of the business combination. Additionally, the guidance requires that acquisition-related costs be expensed as incurred. The provisions of this guidance became effective for acquisitions completed on or after January 1, 2009; however, the income tax considerations included in the guidance were effective as of that date for all acquisitions, regardless of the acquisition date. The Companies adopted this accounting guidance on January 1, 2009, and the adoption had no effect on the Companies’ consolidated statements of operations, financial position or cash flows.
On February 12, 2008, the FASB issued guidance related to fair value measurements, which deferred the effective date of fair value measurements for one year for certain nonfinancial assets and liabilities, with the exception of those nonfinancial assets and liabilities that are recognized or disclosed on a recurring basis (at least annually). The Companies’ non-recurring nonfinancial assets and liabilities that could be measured at fair value in the Companies’ consolidated financial statements include long-lived asset impairments and the initial recognition of asset retirement obligations. The Companies adopted the guidance related to fair value measurements for non-recurring nonfinancial assets and liabilities on January 1, 2009, and the adoption had no effect on the Companies’ consolidated statements of operations, financial position or cash flows. The Companies incorporated the recognition and disclosure provisions related to fair value measurements for non-recurring nonfinancial assets and liabilities when applicable. See Note 3 for these disclosures.
On March 19, 2008, the FASB issued guidance that enhances the required disclosures for derivative instruments. The Companies utilize derivative financial instruments to manage their exposure to commodity price risks and for Mirant Americas Generation’s and Mirant North America’s proprietary trading and fuel oil management activities. The Companies adopted this guidance on January 1, 2009. See Note 2 for these disclosures.
On April 9, 2009, the FASB issued guidance that requires disclosures about the fair value of financial instruments that are not otherwise recorded at fair value in the interim financial statements. These fair value disclosures were effective for interim periods ending after June 15, 2009. The Companies adopted this accounting guidance for their disclosures of the fair value of financial instruments for the quarter ended June 30, 2009, and the adoption had no effect on the Companies’ consolidated statements of operations, financial position or cash flows. See “Fair Value of Other Financial Instruments” in Note 2 for these disclosures.
On April 9, 2009, the FASB issued guidance which provides additional direction on determining whether a market for a financial asset is not active and a transaction is not distressed for fair value measurements. Under distressed market conditions, the Companies need to weigh all available evidence in determining whether a transaction occurred in an orderly market. This guidance requires additional judgment by the Companies when determining the fair value of derivative contracts in the current economic environment. The Companies adopted this accounting guidance for their fair value measurements for the quarter ended June 30, 2009, and the adoption did not have a material effect on the Companies’ consolidated statements of operations, financial position or cash flows.
On May 28, 2009, the FASB issued guidance which requires the Companies to disclose the date through which they have evaluated subsequent events and whether that date represents the date the financial statements were issued or were available to be issued. This guidance defines two types of subsequent events; recognized
F-25
Table of Contents
and non-recognized events, with recognized events reflecting conditions that existed as of the balance sheet date. Subsequent event disclosure is effective for interim periods ending after June 15, 2009. The Companies adopted the subsequent event disclosure requirements for the quarter ended June 30, 2009, and the adoption had no effect on the Companies’ consolidated statements of operations, financial position or cash flows.
On July 1, 2009, the FASB issued guidance which codified all authoritative nongovernmental GAAP into a single source. This guidance is effective for interim and annual periods ending after September 15, 2009. The codified guidance supersedes all existing accounting standards, but does not change the contents of those standards. The Companies adopted this accounting guidance for the quarter ended September 30, 2009, and the Companies changed their references to accounting literature to conform to the codified source of authoritative nongovernmental GAAP.
On August 27, 2009, the FASB issued updated guidance for measuring the fair value of liabilities. The guidance clarifies that a quoted price for the identical liability in an active market is the best evidence of fair value for that liability, and in the absence of a quoted market price, the liability may be measured at fair value at the amount that the Companies would receive as proceeds if they were to issue that liability at the measurement date. The Companies adopted this accounting guidance for their fair value measurements of liabilities for the quarter ended September 30, 2009, and the adoption did not have a material effect on the Companies’ consolidated statements of operations, financial position or cash flows.
New Accounting Guidance Not Yet Adopted at December 31, 2009
On January 21, 2010, the FASB issued guidance that enhances the disclosures for fair value measurements. The guidance requires the Companies to separately disclose the amount of significant transfers in or out of Level 1 and Level 2 of the fair value hierarchy and the reasons for the significant transfers. The Companies will present these disclosures in their Form 10-Q for the quarter ended March 31, 2010.
Additionally, the guidance requires a reconciliation for Level 3 fair value measurements, including presenting separately the amount of purchases, issuances and settlements on a gross basis. The Companies currently discloses the amount of purchases, issuances and settlements on a net basis within their roll forward of Level 3 fair value measurements in Note 2. These disclosure requirements are effective for fiscal years beginning after December 15, 2010. The Companies will present these disclosures in their Form 10-Q for the quarter ended March 31, 2011.
| 2. | Financial Instruments (Mirant Americas Generation, Mirant North America and Mirant Mid-Atlantic) |
Derivative Financial Instruments
In connection with the business of generating electricity, the Companies are exposed to energy commodity price risk associated with the acquisition of fuel and emissions allowances needed to generate electricity, the price of electricity produced and sold, and the fair value of fuel inventories. In addition, the open positions in Mirant Americas Generation’s and Mirant North America’s trading activities, comprised of proprietary trading and fuel oil management activities, expose them to risks associated with changes in energy commodity prices. The Companies, through their asset management activities, enter into a variety of exchange-traded and OTC energy and energy-related derivative financial instruments, such as forward contracts, futures contracts, option contracts and financial swap agreements to manage exposure to commodity price risks. These contracts have varying terms and durations, which range from a few days to years, depending on the instrument. Mirant Americas Generation’s and Mirant North America’s proprietary trading activities also utilize similar derivative contracts in markets where they have a physical presence to attempt to generate incremental gross margin. Mirant Americas Generation’s and Mirant North America’s fuel oil management activities use derivative financial instruments to hedge economically the fair value of their physical fuel oil inventories and to optimize the approximately three million barrels of storage capacity that they own or lease.
F-26
Table of Contents
Changes in the fair value and settlements of derivative financial instruments used to hedge electricity economically are reflected in operating revenue, and changes in the fair value and settlements of derivative financial instruments used to hedge fuel economically are reflected in cost of fuel, electricity and other products in the accompanying consolidated statements of operations. Most of Mirant Americas Generation’s and Mirant North America’s long-term coal agreements entered into on behalf of Mirant Mid-Atlantic are not required to be recorded at fair value because of Mirant Americas Generation’s and Mirant North America’s election of normal purchases treatment under the accounting guidance for derivative financial instruments. As such, these contracts are not included in derivative contract assets and liabilities in the accompanying consolidated balance sheets and are not included in the tables below. Changes in the fair value and settlements of Mirant Americas Generation’s and Mirant North America’s derivative contracts for trading activities, comprised of proprietary trading and fuel oil management, are recorded on a net basis as operating revenue in the accompanying consolidated statements of operations. As of December 31, 2009, the Companies do not have any derivative financial instruments for which hedge accounting has been elected.
The Companies also consider risks associated with interest rates, counterparty credit and Mirant Americas Generation’s, Mirant North America’s and Mirant Mid-Atlantic’s own non-performance risk when valuing their derivative financial instruments. The nominal value of the derivative contract assets and liabilities is discounted to account for time value using a LIBOR forward interest rate curve based on the tenor of the Companies’ transactions being valued.
Mirant Americas Generation and Mirant North America
The following table presents the fair value of derivative financial instruments related to commodity price risk (in millions):
| Fair Value at December 31, | ||||||||||
| Commodity Derivative Contracts |
Balance Sheet Location |
2009 | 2008 | |||||||
| Asset management |
Derivative contract assets | $ | 1,204 | $ | 1,285 | |||||
| Trading activities |
Derivative contract assets | 811 | 1,882 | |||||||
| Total derivative contract assets |
2,015 | 3,167 | ||||||||
| Asset management |
Derivative contract liabilities | (503 | ) | (736 | ) | |||||
| Trading activities |
Derivative contract liabilities | (810 | ) | (1,776 | ) | |||||
| Total derivative contract liabilities |
(1,313 | ) | (2,512 | ) | ||||||
| Asset management, net |
701 | 549 | ||||||||
| Trading activities, net |
1 | 106 | ||||||||
| Total derivative contracts, net |
$ | 702 | $ | 655 | ||||||
The following tables present the net gains (losses) for derivative financial instruments recognized in income in the consolidated statements of operations (in millions):
| Commodity Derivative Contracts |
Location of Net Gains (Losses) Recognized in Income |
Amount of Net Gains (Losses) Recognized in Income for the Year Ended December 31, 2009 |
||||||||||||
| Realized | Unrealized | Total | ||||||||||||
| Asset management |
Operating revenues | $ | 745 | $ | 111 | $ | 856 | |||||||
| Trading activities |
Operating revenues | 145 | (113 | ) | 32 | |||||||||
| Asset management |
Cost of fuel, electricity and other products | (74 | ) | 49 | (25 | ) | ||||||||
| Total |
$ | 816 | $ | 47 | $ | 863 | ||||||||
F-27
Table of Contents
| Commodity Derivative Contracts |
Location of Net Gains (Losses) Recognized in Income |
Amount of Net Gains (Losses) Recognized in Income for the Year Ended December 31, 2008 |
||||||||||||
| Realized | Unrealized | Total | ||||||||||||
| Asset management |
Operating revenues | $ | (92 | ) | $ | 720 | $ | 628 | ||||||
| Trading activities |
Operating revenues | (39 | ) | 120 | 81 | |||||||||
| Asset management |
Cost of fuel, electricity and other products | 6 | (54 | ) | (48 | ) | ||||||||
| Total |
$ | (125 | ) | $ | 786 | $ | 661 | |||||||
The following table presents the notional quantity on long (short) positions for derivative financial instruments on a gross and net basis at December 31, 2009 (in equivalent MWh):
| Notional Quantity | |||||||||
| Derivative Contract Assets |
Derivative Contract Liabilities |
Net Derivative Contracts |
|||||||
| (in millions) | |||||||||
| Commodity Type: |
|||||||||
| Power1 |
(82 | ) | 38 | (44 | ) | ||||
| Natural gas |
(32 | ) | 32 | — | |||||
| Fuel oil |
3 | (4 | ) | (1 | ) | ||||
| Coal |
1 | (1 | ) | — | |||||
| Total |
(110 | ) | 65 | (45 | ) | ||||
| 1 | Includes MWh equivalent of natural gas transactions used to hedge power economically. |
Mirant Mid-Atlantic
The following table presents the fair value of derivative financial instruments related to commodity price risk (in millions):
| Commodity Derivative Contracts |
Balance Sheet Location |
Fair Value at December 31, |
||||||||
| 2009 | 2008 | |||||||||
| Asset management—nonaffiliate |
Derivative contract assets—nonaffiliate | $ | 554 | $ | 401 | |||||
| Asset management—affiliate |
Derivative contract assets—affiliate | 591 | 775 | |||||||
| Total derivative contract assets |
1,145 | 1,176 | ||||||||
| Asset management—nonaffiliate |
Derivative contract liabilities—nonaffiliate | (17 | ) | (1 | ) | |||||
| Asset management—affiliate |
Derivative contract liabilities—affiliate | (458 | ) | (649 | ) | |||||
| Total derivative contract liabilities |
(475 | ) | (650 | ) | ||||||
| Asset management—nonaffiliate, net |
537 | 400 | ||||||||
| Asset management—affiliate, net |
133 | 126 | ||||||||
| Total derivative contracts, net |
$ | 670 | $ | 526 | ||||||
F-28
Table of Contents
The following tables present the net gains (losses) for derivative financial instruments recognized in income in the consolidated statements of operations (in millions):
| Commodity Derivative Contracts |
Location of Net Gains Recognized in Income |
Amount of Net
Gains Recognized in Income for the Year Ended December 31, 2009 | |||||||||
| Realized | Unrealized | Total | |||||||||
| Asset management |
Operating revenues | $ | 644 | $ | 136 | $ | 780 | ||||
| Asset management |
Cost of fuel, electricity and other products | 4 | 8 | 12 | |||||||
| Total |
$ | 648 | $ | 144 | $ | 792 | |||||
| Commodity Derivative Contracts |
Location
of |
Amount of Net Gains (Losses) Recognized in Income for the Year Ended December 31, 2008 |
||||||||||||
| Realized | Unrealized | Total | ||||||||||||
| Asset management |
Operating revenues | $ | (102 | ) | $ | 685 | $ | 583 | ||||||
| Asset management |
Cost of fuel, electricity and other products | 8 | (9 | ) | (1 | ) | ||||||||
| Total |
$ | (94 | ) | $ | 676 | $ | 582 | |||||||
The following table presents the notional quantity on long (short) positions for derivative financial instruments on a gross and net basis at December 31, 2009 (in equivalent MWh):
| Notional Quantity | ||||||||
| Derivative Contract Assets |
Derivative Contract Liabilities |
Net Derivative Contracts |
||||||
| (in millions) | ||||||||
| Commodity Type: |
||||||||
| Power1 |
(79 | ) | 34 | (45 | ) | |||
| Coal |
1 | — | 1 | |||||
| Total |
(78 | ) | 34 | (44 | ) | |||
| 1 | Includes MWh equivalent of natural gas transactions used to hedge power. |
Fair Value Hierarchy
Based on the observability of the inputs used in the valuation techniques for fair value measurement, the Companies are required to classify recorded fair value measurements according to the fair value hierarchy. The fair value hierarchy ranks the quality and reliability of the information used to determine fair values. The hierarchy gives the highest priority to unadjusted quoted prices in active markets for identical assets or liabilities (Level 1 measurement) and the lowest priority to unobservable inputs (Level 3 measurement). The fair value measurement inputs the Companies use vary from readily observable prices for exchange-traded instruments to price curves that cannot be validated through external pricing sources. The Companies’ financial assets and liabilities carried at fair value in the consolidated financial statements are classified in three categories based on the inputs used.
In certain cases, the inputs used to measure fair value may fall into different levels of the fair value hierarchy. In such cases, the level in the fair value hierarchy within which the fair value measurement in its entirety falls must be determined based on the lowest level input that is significant to the fair value
F-29
Table of Contents
measurement. The Companies’ assessment of the significance of a particular input to the fair value measurement in its entirety requires judgment and consideration of factors specific to the asset or liability.
The following tables set forth by level within the fair value hierarchy the Companies’ financial assets and liabilities that were accounted for at fair value on a recurring basis as of December 31, 2009, by category and tenor, respectively. At December 31, 2009, the Companies’ only financial assets and liabilities measured at fair value on a recurring basis are derivative financial instruments.
Mirant Americas Generation and Mirant North America
The following table presents financial assets and liabilities accounted for at fair value on a recurring basis as of December 31, 2009, on a gross and net basis by category (in millions):
| Quoted Prices in Active Markets for Identical Assets (Level 1) |
Significant Other Observable Inputs (Level 2) |
Significant Other Unobservable Inputs (Level 3) |
Total | |||||||||||||
| Assets: |
||||||||||||||||
| Commodity contracts—asset management |
$ | 13 | $ | 1,170 | $ | 21 | $ | 1,204 | ||||||||
| Commodity contracts—trading activities |
374 | 415 | 22 | 811 | ||||||||||||
| Total derivative contract assets |
387 | 1,585 | 43 | 2,015 | ||||||||||||
| Liabilities: |
||||||||||||||||
| Commodity contracts—asset management |
(25 | ) | (476 | ) | (2 | ) | (503 | ) | ||||||||
| Commodity contracts—trading activities |
(368 | ) | (433 | ) | (9 | ) | (810 | ) | ||||||||
| Total derivative contract liabilities |
(393 | ) | (909 | ) | (11 | ) | (1,313 | ) | ||||||||
| Net: |
||||||||||||||||
| Commodity contracts—asset management, net |
(12 | ) | 694 | 19 | 701 | |||||||||||
| Commodity contracts—trading activities, net |
6 | (18 | ) | 13 | 1 | |||||||||||
| Total derivative contract assets and liabilities, net |
$ | (6 | ) | $ | 676 | $ | 32 | $ | 702 | |||||||
The following table presents financial assets and liabilities accounted for at fair value on a recurring basis as of December 31, 2008, on a gross and net basis by category (in millions):
| Quoted Prices in Active Markets for Identical Assets (Level 1) |
Significant Other Observable Inputs (Level 2) |
Significant Other Unobservable Inputs (Level 3) |
Total | |||||||||||||
| Assets: |
||||||||||||||||
| Commodity contracts—asset management |
$ | 5 | $ | 1,256 | $ | 24 | $ | 1,285 | ||||||||
| Commodity contracts—trading activities |
540 | 1,319 | 23 | 1,882 | ||||||||||||
| Total derivative contract assets |
545 | 2,575 | 47 | 3,167 | ||||||||||||
| Liabilities: |
||||||||||||||||
| Commodity contracts—asset management |
(22 | ) | (714 | ) | — | (736 | ) | |||||||||
| Commodity contracts—trading activities |
(539 | ) | (1,236 | ) | (1 | ) | (1,776 | ) | ||||||||
| Total derivative contract liabilities |
(561 | ) | (1,950 | ) | (1 | ) | (2,512 | ) | ||||||||
| Net: |
||||||||||||||||
| Commodity contracts—asset management, net |
(17 | ) | 542 | 24 | 549 | |||||||||||
| Commodity contracts—trading activities, net |
1 | 83 | 22 | 106 | ||||||||||||
| Total derivative contract assets and liabilities, net |
$ | (16 | ) | $ | 625 | $ | 46 | $ | 655 | |||||||
F-30
Table of Contents
The following table presents financial assets and liabilities, net accounted for at fair value on a recurring basis as of December 31, 2009, by tenor (in millions):
| Commodity Contracts | ||||||||||
| Asset Management |
Trading Activities |
Total | ||||||||
| 2010 |
$ | 266 | $ | — | $ | 266 | ||||
| 2011 |
107 | 4 | 111 | |||||||
| 2012 |
89 | (3 | ) | 86 | ||||||
| 2013 |
117 | — | 117 | |||||||
| 2014 |
122 | — | 122 | |||||||
| Thereafter |
— | — | — | |||||||
| Total |
$ | 701 | $ | 1 | $ | 702 | ||||
The volumetric weighted average maturity, or weighted average tenor, of the asset management derivative contract portfolio at December 31, 2009 and 2008, was approximately 22 months and 23 months, respectively. The volumetric weighted average maturity, or weighted average tenor, of the trading derivative contract portfolio at December 31, 2009 and 2008, was approximately 9 months and 8 months, respectively.
Mirant Mid-Atlantic
The following table presents financial assets and liabilities accounted for at fair value on a recurring basis as of December 31, 2009, on a gross and net basis by category (in millions):
| Quoted Prices in Active Markets for Identical Assets (Level 1) |
Significant Other Observable Inputs (Level 2) |
Significant Other Unobservable Inputs (Level 3) |
Total | ||||||||||||
| Total assets |
$ | 2 | $ | 1,130 | $ | 13 | $ | 1,145 | |||||||
| Total liabilities |
(11 | ) | (464 | ) | — | (475 | ) | ||||||||
| Total |
$ | (9 | ) | $ | 666 | $ | 13 | $ | 670 | ||||||
The following table presents financial assets and liabilities accounted for at fair value on a recurring basis as of December 31, 2008, on a gross and net basis by category (in millions):
| Quoted Prices in Active Markets for Identical Assets (Level 1) |
Significant Other Observable Inputs (Level 2) |
Significant Other Unobservable Inputs (Level 3) |
Total | |||||||||||
| Total assets |
$ | 3 | $ | 1,173 | $ | — | $ | 1,176 | ||||||
| Total liabilities |
— | (650 | ) | — | (650 | ) | ||||||||
| Total |
$ | 3 | $ | 523 | $ | — | $ | 526 | ||||||
F-31
Table of Contents
The following table presents financial assets and liabilities, net accounted for at fair value on a recurring basis as of December 31, 2009, by tenor (in millions):
| Asset Management | |||
| 2010 |
$ | 241 | |
| 2011 |
101 | ||
| 2012 |
89 | ||
| 2013 |
117 | ||
| 2014 |
122 | ||
| Thereafter |
— | ||
| Total |
$ | 670 | |
The volumetric weighted average maturity, or weighted average tenor, of the derivative contract portfolio at December 31, 2009 and 2008, was approximately 23 months and 26 months, respectively.
Level 3 Disclosures
Mirant Americas Generation and Mirant North America
The following tables present a roll forward of fair values of assets and liabilities, net categorized in Level 3 for the years ended December 31, 2009 and 2008, and the amount included in income for the years ended December 31, 2009 and 2008 (in millions):
| Commodity Contracts | ||||||||||||
| Asset Management |
Trading Activities |
Total | ||||||||||
| Fair value of assets and liabilities categorized in Level 3 at January 1, 2009 |
$ | 24 | $ | 22 | $ | 46 | ||||||
| Total gains or losses (realized/unrealized): |
||||||||||||
| Included in income of existing contracts (or changes in net assets or liabilities)1 |
(58 | ) | (62 | ) | (120 | ) | ||||||
| Purchases, issuances and settlements2 |
54 | 53 | 107 | |||||||||
| Transfers in and/or out of Level 33 |
(1 | ) | — | (1 | ) | |||||||
| Fair value of assets and liabilities categorized in Level 3 at December 31, 2009 |
$ | 19 | $ | 13 | $ | 32 | ||||||
| Commodity Contracts | |||||||||||
| Asset Management |
Trading Activities |
Total | |||||||||
| Fair value of assets and liabilities categorized in Level 3 at January 1, 2008 |
$ | 12 | $ | — | $ | 12 | |||||
| Total gains or losses (realized/unrealized): |
|||||||||||
| Included in income of existing contracts (or changes in net assets or liabilities)1 |
(4 | ) | — | (4 | ) | ||||||
| Purchases, issuances and settlements2 |
16 | 5 | 21 | ||||||||
| Transfers in and/or out of Level 33 |
— | 17 | 17 | ||||||||
| Fair value of assets and liabilities categorized in Level 3 at December 31, 2008 |
$ | 24 | $ | 22 | $ | 46 | |||||
| 1 | Reflects the total gains or losses on contracts included in Level 3 at the beginning of each quarterly reporting period and at the end of each quarterly reporting period, and contracts entered into during each quarterly reporting period that remain at the end of each quarterly reporting period. |
F-32
Table of Contents
| 2 | Represents the total cash settlements of contracts during each quarterly reporting period that existed at the beginning of each quarterly reporting period. |
| 3 | Denotes the total contracts that existed at the beginning of each quarterly reporting period and were still held at the end of each quarterly reporting period that were either previously categorized as a higher level for which the inputs to the model became unobservable or assets and liabilities that were previously classified as Level 3 for which the lowest significant input became observable during each quarterly reporting period. Amounts reflect fair value as of the end of each quarterly reporting period. |
| Year Ended December 31, 2009 | |||||||||||
| Operating Revenues |
Cost of Fuel |
Total | |||||||||
| Gains (losses) included in income |
$ | (22 | ) | $ | 8 | $ | (14 | ) | |||
| Gains included in income (or changes in net assets) attributable to the change in unrealized gains or losses relating to assets still held at December 31, 2009 |
$ | 7 | $ | 7 | $ | 14 | |||||
| Year Ended December 31, 2008 | ||||||||||
| Operating Revenues |
Cost of Fuel |
Total | ||||||||
| Gains (losses) included in income |
$ | 46 | $ | (12 | ) | $ | 34 | |||
| Gains (losses) included in income (or changes in net assets) attributable to the change in unrealized gains or losses relating to assets still held at December 31, 2008 |
$ | 52 | $ | (7 | ) | $ | 45 | |||
Mirant Mid-Atlantic
The following tables present a roll forward of fair values of assets and liabilities, net categorized in Level 3 for the years ended December 31, 2009 and 2008, and the amount included in income for the years ended December 31, 2009 and 2008 (in millions):
| Asset Management |
||||
| Fair value of assets and liabilities categorized in Level 3 at January 1, 2009 |
$ | — | ||
| Total gains or losses (realized/unrealized): |
||||
| Included in income of existing contracts (or changes in net assets or liabilities) 1 |
10 | |||
| Purchases, issuances and settlements2 |
4 | |||
| Transfers in and/or out of Level 33 |
(1 | ) | ||
| Fair value of assets and liabilities categorized in Level 3 at December 31, 2009 |
$ | 13 | ||
| Asset Management |
||||
| Fair value of assets and liabilities categorized in Level 3 at January 1, 2008 |
$ | 2 | ||
| Total gains or losses (realized/unrealized): |
||||
| Included in income of existing contracts (or changes in net assets or liabilities) 1 |
(8 | ) | ||
| Purchases, issuances and settlements2 |
5 | |||
| Transfers in and/or out of Level 33 |
1 | |||
| Fair value of assets and liabilities categorized in Level 3 at December 31, 2008 |
$ | — | ||
| 1 | Reflects the total gains or losses on contracts included in Level 3 at the beginning of each quarterly reporting period and at the end of each quarterly reporting period, and contracts entered into during each quarterly reporting period that remain at the end of each quarterly reporting period. |
| 2 | Represents the total cash settlements of contracts during each quarterly reporting period that existed at the beginning of each quarterly reporting period. |
F-33
Table of Contents
| 3 | Denotes the total contracts that existed at the beginning of each quarterly reporting period and were still held at the end of each quarterly reporting period that were either previously categorized as a higher level for which the inputs to the model became unobservable or assets and liabilities that were previously classified as Level 3 for which the lowest significant input became observable during each quarterly reporting period. Amounts reflect fair value as of the end of each quarterly reporting period. |
| Year Ended December 31, 2009 | |||||||||
| Operating Revenues |
Cost of Fuel |
Total | |||||||
| Gains included in income |
$ | 6 | $ | 7 | $ | 13 | |||
| Gains included in income (or changes in net assets) attributable to the change in unrealized gains or losses relating to assets still held at December 31, 2009 |
$ | 6 | $ | 7 | $ | 13 | |||
| Year Ended December 31, 2008 | |||||||||||
| Operating Revenues |
Cost of Fuel |
Total | |||||||||
| Gains (losses) included in income |
$ | 5 | $ | (7 | ) | $ | (2 | ) | |||
| Gains (losses) included in income (or changes in net assets) attributable to the change in unrealized gains or losses relating to assets still held at December 31, 2008 |
$ | 5 | $ | (7 | ) | $ | (2 | ) | |||
Counterparty Credit Concentration Risk
The Companies are exposed to the default risk of the counterparties with which they transact. The Companies manage their credit risk by entering into master netting agreements and requiring counterparties to post cash collateral or other credit enhancements based on the net exposure and the credit standing of the counterparty. The Companies also have non-collateralized power hedges entered into by Mirant Mid-Atlantic. These transactions are senior unsecured obligations of Mirant Mid-Atlantic and the counterparties and do not require either party to post cash collateral for initial margin or for securing exposure as a result of changes in power or natural gas prices. The Companies’ credit reserve on their derivative contract assets was $13 million and $52 million for Mirant Americas Generation and Mirant North America at December 31, 2009 and 2008, respectively, and $13 million and $51 million for Mirant Mid-Atlantic at December 31, 2009 and 2008, respectively.
At December 31, 2009 and 2008, approximately $12 million and $20 million, respectively, of cash collateral posted to Mirant Americas Generation and Mirant North America by counterparties under master netting agreements were included in accounts payable and accrued liabilities on Mirant Americas Generation’s and Mirant North America’s consolidated balance sheets.
F-34
Table of Contents
The Companies also monitor counterparty credit concentration risk on both an individual basis and a group counterparty basis. The following tables highlight the credit quality and the balance sheet settlement exposures related to these activities as of December 31, 2009 and 2008 (dollars in millions):
Mirant Americas Generation and Mirant North America
| At December 31, 2009 | |||||||||||||||
| Credit Rating Equivalent |
Gross Exposure Before Collateral1 |
Net Exposure Before Collateral2 |
Collateral3 | Exposure Net of Collateral |
% of Net Exposure |
||||||||||
| Clearing and Exchange |
$ | 790 | $ | 96 | $ | 96 | $ | — | — | ||||||
| Investment Grade: |
|||||||||||||||
| Financial institutions |
997 | 646 | 12 | 634 | 81 | % | |||||||||
| Energy companies |
497 | 125 | 13 | 112 | 14 | % | |||||||||
| Other |
— | — | — | — | — | ||||||||||
| Non-investment Grade: |
|||||||||||||||
| Financial institutions |
— | — | — | — | — | ||||||||||
| Energy companies |
— | — | — | — | — | ||||||||||
| Other |
— | — | — | — | — | ||||||||||
| No External Ratings: |
|||||||||||||||
| Internally-rated investment grade |
34 | 27 | — | 27 | 4 | % | |||||||||
| Internally-rated non-investment grade |
8 | 8 | — | 8 | 1 | % | |||||||||
| Not internally rated |
— | — | — | — | — | ||||||||||
| Total |
$ | 2,326 | $ | 902 | $ | 121 | $ | 781 | 100 | % | |||||
| At December 31, 2008 | |||||||||||||||
| Credit Rating Equivalent |
Gross Exposure Before Collateral1 |
Net Exposure Before Collateral2 |
Collateral3 | Exposure Net of Collateral |
% of Net Exposure |
||||||||||
| Clearing and Exchange |
$ | 1,428 | $ | 107 | $ | 107 | $ | — | — | ||||||
| Investment Grade: |
|||||||||||||||
| Financial institutions |
1,219 | 553 | 20 | 533 | 72 | % | |||||||||
| Energy companies |
1,060 | 232 | 73 | 159 | 22 | % | |||||||||
| Other |
— | — | — | — | — | ||||||||||
| Non-investment Grade: |
|||||||||||||||
| Financial institutions |
— | — | — | — | — | ||||||||||
| Energy companies |
— | — | — | — | — | ||||||||||
| Other |
— | — | — | — | — | ||||||||||
| No External Ratings: |
|||||||||||||||
| Internally-rated investment grade |
41 | 41 | — | 41 | 6 | % | |||||||||
| Internally-rated non-investment grade |
4 | 4 | — | 4 | — | ||||||||||
| Not internally rated |
— | — | — | — | — | ||||||||||
| Total |
$ | 3,752 | $ | 937 | $ | 200 | $ | 737 | 100 | % | |||||
| 1 | Gross exposure before collateral represents credit exposure, including realized and unrealized transactions, before applying the terms of master netting agreements with counterparties and netting of transactions with clearing brokers and exchanges. The table excludes amounts related to contracts classified as normal purchases/normal sales and non-derivative contractual commitments that are not recorded at fair value in the consolidated balance sheets, except for any related accounts receivable. Such contractual commitments contain credit and economic risk if a counterparty does not perform. Non-performance could have a material adverse effect on the future results of operations, financial condition and cash flows. |
F-35
Table of Contents
| 2 | Net exposure before collateral represents the credit exposure, including both realized and unrealized transactions, after applying the terms of master netting agreements. |
| 3 | Collateral includes cash and letters of credit received from counterparties. |
Mirant Mid-Atlantic
| At December 31, 2009 | |||||||||||||||
| Credit Rating Equivalent |
Gross Exposure Before Collateral1,4 |
Net Exposure Before Collateral2 |
Collateral3 | Exposure Net of Collateral |
% of Net Exposure |
||||||||||
| Clearing and Exchange |
$ | — | $ | — | $ | — | $ | — | — | ||||||
| Investment Grade: |
|||||||||||||||
| Financial institutions |
595 | 578 | — | 578 | 99 | % | |||||||||
| Energy companies |
— | — | — | — | — | ||||||||||
| Other |
— | — | — | — | — | ||||||||||
| Non-investment Grade: |
|||||||||||||||
| Financial institutions |
— | — | — | — | — | ||||||||||
| Energy companies |
— | — | — | — | — | ||||||||||
| Other |
— | — | — | — | — | ||||||||||
| No External Ratings: |
|||||||||||||||
| Internally-rated investment grade |
— | — | — | — | — | ||||||||||
| Internally-rated non-investment grade |
8 | 8 | — | 8 | 1 | % | |||||||||
| Not internally rated |
— | — | — | — | — | ||||||||||
| Total |
$ | 603 | $ | 586 | $ | — | $ | 586 | 100 | % | |||||
| At December 31, 2008 | |||||||||||||||
| Credit Rating Equivalent |
Gross Exposure Before Collateral1,4 |
Net Exposure Before Collateral2 |
Collateral3 | Exposure Net of Collateral |
% of Net Exposure |
||||||||||
| Clearing and Exchange |
$ | — | $ | — | $ | — | $ | — | — | ||||||
| Investment Grade: |
|||||||||||||||
| Financial institutions |
477 | 477 | — | 477 | 100 | % | |||||||||
| Energy companies |
— | — | — | — | — | ||||||||||
| Other |
— | — | — | — | — | ||||||||||
| Non-investment Grade: |
|||||||||||||||
| Financial institutions |
— | — | — | — | — | ||||||||||
| Energy companies |
— | — | — | — | — | ||||||||||
| Other |
— | — | — | — | — | ||||||||||
| No External Ratings: |
|||||||||||||||
| Internally-rated investment grade |
— | — | — | — | — | ||||||||||
| Internally-rated non-investment grade |
2 | 2 | — | 2 | — | ||||||||||
| Not internally rated |
— | — | — | — | — | ||||||||||
| Total |
$ | 479 | $ | 479 | $ | — | $ | 479 | 100 | % | |||||
| 1 | Gross exposure before collateral represents credit exposure, including realized and unrealized transactions, before applying the terms of master netting agreements with counterparties and netting of transactions with clearing brokers and exchanges. The table excludes amounts related to contracts classified as normal purchases/normal sales and non-derivative contractual commitments that are not recorded at fair value in the consolidated balance sheets, except for any related accounts receivable. Such contractual commitments contain credit and economic risk if a counterparty does not perform. Non-performance could have a material adverse effect on the future results of operations, financial condition and cash flows. |
F-36
Table of Contents
| 2 | Net exposure before collateral represents the credit exposure, including both realized and unrealized transactions, after applying the terms of master netting agreements. |
| 3 | Collateral includes cash and letters of credit received from counterparties. |
| 4 | Amounts do not include exposures with affiliates or exposures incurred by Mirant Mid-Atlantic in connection with transactions entered into with external counterparties by affiliates on its behalf, with the exception of coal purchases. |
Mirant Americas Generation and Mirant North America had aggregate credit exposure to three investment grade counterparties that each represented an exposure of more than 10% of total credit exposure, net of collateral and that totaled $495 million and $491 million at December 31, 2009 and 2008, respectively. Such credit exposure included Mirant Mid-Atlantic’s aggregate credit exposure to three investment grade counterparties at December 31, 2009, and credit exposure to two investment grade counterparties at December 31, 2008, that each represented an exposure of more than 10% of total credit exposure, net of collateral and that totaled $481 million and $378 million at December 31, 2009 and 2008, respectively.
Mirant Americas Generation, Mirant North America and Mirant Mid-Atlantic Credit Risk
The Companies’ standard industry contracts contain credit-risk-related contingent features such as ratings-related thresholds whereby the Companies would be required to post additional cash collateral or letters of credit as a result of a credit event, including a downgrade. Additionally, some of the Companies’ contracts contain adequate assurance language, which is generally subjective in nature, but would most likely require the Companies to post additional cash collateral or letters of credit as a result of a credit event, including a downgrade. However, as a result of the Companies’ current credit ratings, the Companies are typically required to post collateral in the normal course of business to offset completely their net liability positions, after applying the terms of master netting agreements. At December 31, 2009, the fair value of Mirant Americas Generation’s and Mirant North America’s financial instruments with credit-risk-related contingent features in a net liability position were approximately $33 million for which Mirant Americas Generation and Mirant North America posted collateral, including cash and letters of credit, of $32 million to offset substantially the position. At December 31, 2009, Mirant Mid-Atlantic did not have any financial instruments with credit-risk-related contingent features in a net liability position.
In addition, at December 31, 2009 and 2008, Mirant Americas Generation and Mirant North America had approximately $25 million and $1 million, respectively, of cash collateral posted with counterparties under master netting agreements that was included in funds on deposit on the consolidated balance sheets.
Fair Values of Other Financial Instruments (Mirant Americas Generation and Mirant North America)
Other financial instruments recorded at fair value include cash and interest-bearing cash equivalents. The following methods are used by Mirant Americas Generation and Mirant North America to estimate the fair value of financial instruments that are not otherwise carried at fair value on the accompanying consolidated balance sheets:
Notes and Other Receivables. The fair value of Mirant Americas Generation’s and Mirant North America’s notes receivable are estimated using interest rates they would receive currently for similar types of arrangements.
Long- and Short-Term Debt. The fair value of Mirant Americas Generation’s and Mirant North America’s long- and short-term debt is estimated using quoted market prices, when available.
F-37
Table of Contents
The carrying amounts and fair values of Mirant Americas Generation’s and Mirant North America’s financial instruments are as follows (in millions):
Mirant Americas Generation
| At December 31, | ||||||||||||
| 2009 | 2008 | |||||||||||
| Carrying Amount |
Fair Value | Carrying Amount |
Fair Value | |||||||||
| Liabilities: |
||||||||||||
| Long- and short-term debt |
$ | 2,630 | $ | 2,558 | $ | 2,675 | $ | 2,344 | ||||
Mirant North America
| At December 31, | ||||||||||||
| 2009 | 2008 | |||||||||||
| Carrying Amount |
Fair Value | Carrying Amount |
Fair Value | |||||||||
| Assets: |
||||||||||||
| Notes and other receivables |
$ | 93 | $ | 93 | $ | 93 | $ | 93 | ||||
| Liabilities: |
||||||||||||
| Long- and short-term debt |
$ | 1,248 | $ | 1,223 | $ | 1,293 | $ | 1,203 | ||||
| 3. | Long-Lived Assets (Mirant Americas Generation, Mirant North America and Mirant Mid-Atlantic) |
Property, Plant and Equipment, net
Property, plant and equipment, net consisted of the following (dollars in millions):
Mirant Americas Generation
| At December 31, | Depreciable Lives (years) | |||||||||
| 2009 | 2008 | |||||||||
| Production |
$ | 2,688 | $ | 2,411 | 13 to 54 | |||||
| Leasehold improvements on leased generating facilities |
1,329 | 405 | 5 to 34 | |||||||
| Construction work in progress |
216 | 996 | — | |||||||
| Other |
130 | 122 | 2 to 12 | |||||||
| Less: accumulated depreciation, amortization and provision for impairment |
(757 | ) | (742 | ) | ||||||
| Total property, plant and equipment, net |
$ | 3,606 | $ | 3,192 | ||||||
Mirant North America
| At December 31, | Depreciable Lives (years) | |||||||||
| 2009 | 2008 | |||||||||
| Production |
$ | 2,685 | $ | 2,408 | 13 to 54 | |||||
| Leasehold improvements on leased generating facilities |
1,329 | 405 | 5 to 34 | |||||||
| Construction work in progress |
216 | 996 | — | |||||||
| Other |
130 | 122 | 2 to 12 | |||||||
| Less: accumulated depreciation, amortization and provision for impairment |
(756 | ) | (742 | ) | ||||||
| Total property, plant and equipment, net |
$ | 3,604 | $ | 3,189 | ||||||
F-38
Table of Contents
Depreciation of the recorded cost of property, plant and equipment is recognized on a straight-line basis over the estimated useful lives of the assets. Acquired emissions allowances related to owned facilities are included in production assets above, and are depreciated on a straight-line basis over the average life of the related generating facilities. Depreciation expense was approximately $134 million, $128 million and $112 million for the years ended December 31, 2009, 2008 and 2007, respectively.
Mirant Mid-Atlantic
| At December 31, | Depreciable Lives | |||||||||
| 2009 | 2008 | |||||||||
| Production |
$ | 1,871 | $ | 1,717 | 13 to 54 | |||||
| Leasehold improvements on leased generating facilities |
1,329 | 405 | 5 to 34 | |||||||
| Construction work in progress |
203 | 933 | — | |||||||
| Other |
50 | 45 | 2 to 10 | |||||||
| Less: accumulated depreciation |
(453 | ) | (478 | ) | ||||||
| Total property, plant and equipment, net |
$ | 3,000 | $ | 2,622 | ||||||
Depreciation of the recorded cost of property, plant and equipment is recognized on a straight-line basis over the estimated useful lives of the assets. Acquired emissions allowances related to owned facilities are included in production assets above, and are depreciated on a straight-line basis over the average life of the related generating facilities. Mirant Mid-Atlantic received emissions allowances as part of the acquisition of the Pepco assets for both SO2 and NOx emissions and the right to receive future granted emissions allowances. Depreciation expense was approximately $92 million, $86 million and $75 million for the years ended December 31, 2009, 2008 and 2007, respectively.
Goodwill, net (Mirant Mid-Atlantic)
Mirant Mid-Atlantic evaluates its goodwill for impairment at least annually and periodically if indicators of impairment are present in accordance with the accounting guidance related to goodwill and other intangible assets. The results of Mirant Mid-Atlantic’s impairment testing may be affected by a significant adverse change in the extent or manner in which a reporting unit’s assets are being used, a significant adverse change in legal factors or in the business climate that could affect the value of a reporting unit, as well as other economic or operational analyses. If the carrying amount of the reporting unit is not recoverable, an impairment charge is recorded. The amount of the impairment charge, if impairment exists, is calculated as the difference between the fair value of the reporting unit goodwill and its carrying value. For this test, Mirant Mid-Atlantic’s business constitutes a single reporting unit. Mirant Mid-Atlantic performs its annual assessment of goodwill at October 31 and whenever contrary evidence exists as to the recoverability of goodwill.
Mirant Mid-Atlantic performed its annual test for goodwill impairment effective October 31, 2009, based upon Mirant Mid-Atlantic’s most recent business plan and market data from independent sources. Mirant Mid-Atlantic utilized multiple valuation approaches in arriving at a fair value of Mirant Mid-Atlantic’s reporting unit for purposes of the test, including an income approach involving discounted cash flows and a market approach involving trading multiples of peer companies. Mirant Mid-Atlantic placed greater weighting on the market approach in the current year as compared to the prior year based on the adoption of accounting guidance related to fair value measurements in 2009. No weighting was placed on the transaction method in the current year because there have been no comparable recent transactions, specifically no transactions for baseload coal-fired generating facilities in the PJM market. In addition to the market approaches listed above, Mirant Mid-Atlantic also performed a reconciliation of the fair value of the Mid-Atlantic reporting unit to the market capitalization of Mirant Corporation, adjusted for a control premium, as a reasonableness check for the
F-39
Table of Contents
other approaches. The reconciliation resulted in a value that was consistent with the other approaches. Mirant Mid-Atlantic assigned a 50% weighting to the income approach and a 50% weighting to the market approach to determine the fair value of the reporting unit. However, a change in the relative weightings between the income and market approach would have an immaterial effect on the outcome of the goodwill impairment analysis. The annual evaluation of goodwill indicated that the carrying value of the reporting unit exceeded the fair value, requiring the second step of the goodwill analysis to be performed.
Mirant Mid-Atlantic then performed the second step of the goodwill impairment test, which requires an allocation of the fair value as the purchase price in a hypothetical acquisition of the reporting unit. The fair value of the reporting unit was compared to the fair value of the tangible and intangible assets and the remaining value was the implied goodwill. As a result of this analysis, Mirant Mid-Atlantic recorded an impairment loss of $183 million on its consolidated statement of operations to reduce the carrying value of goodwill to its implied fair value.
Mirant Mid-Atlantic’s assessment of goodwill included assumptions about the following:
| — | electricity, fuel and emissions prices; |
| — | capacity payments under the RPM provisions of PJM’s tariff; |
| — | costs of CO2 allowances and a potential federal cap-and-trade program; |
| — | timing of announced transmission projects; |
| — | timing and extent of generating capacity additions and retirements; and |
| — | future capital expenditure requirements for the generating facility. |
Mirant Mid-Atlantic’s assumptions related to future electricity and fuel prices were based on observable market prices to the extent available and long-term prices derived from proprietary fundamental market modeling. Mirant Mid-Atlantic’s long-term capacity prices are based on the assumption that the PJM RPM capacity market would continue consistent with the current structure, with expected increases in revenue as a result of declines in reserve margins for periods beyond those for which auctions have already been completed. Mirant Mid-Atlantic also assumed that a federal CO2 cap-and-trade program would be instituted later this decade. There are several transmission projects currently planned in the Mid-Atlantic region, including the Trans-Allegheny Interstate Line (“TrAIL”), Mid-Atlantic Power Pathway transmission line (“MAPP”) and the Potomac-Appalachian transmission line (“PATH”). Mirant Mid-Atlantic’s assumptions regarding the timing of these projects were based on the current status of permitting and construction of each project. Mirant Mid-Atlantic’s assumptions regarding electricity demand are based on forecasts from PJM and assumptions for generating capacity additions and retirements consider publicly-announced projects, including renewable sources of electricity and additions of nuclear capacity. In addition, the assumptions exclude general corporate overhead allocations, but include overhead allocations from Mirant Energy Trading under the assumption that a market participant would utilize a trading company to manage the procurement of fuel and the sale of electricity.
Mirant Mid-Atlantic’s estimates of future cash flows did not include contracts entered into to hedge economically the expected generation of Mid-Atlantic generating facilities. The cash flows related to these contracts were excluded because they were not directly attributable to the generating facilities.
The above estimates and assumptions used in the goodwill analysis are subject to a high degree of uncertainty, and changes in these assumptions could affect the amount of the impairment loss or result in additional future impairment losses. A decrease in projected electricity prices or an increase in coal prices would decrease the future cash flows of Mirant Mid-Atlantic’s generating facilities, thus increasing the amount
F-40
Table of Contents
of the impairment loss recognized. Additionally, changes to the structure of the PJM RPM capacity market could negatively affect the future capacity prices Mirant Mid-Atlantic expects its facilities to earn. Mirant Mid-Atlantic’s assumptions include the development of a federal cap-and-trade program for CO2 emissions. If Mirant Mid-Atlantic is not compensated for the costs of complying with a federal CO2 program through increased electricity and capacity prices or decreased coal prices, Mirant Mid-Atlantic’s cash flows would be negatively affected. If the planned transmission projects are completed earlier than Mirant Mid-Atlantic assumed, this could negatively affect the cash flows of the facilities as there would be a decrease in the demand for electricity generated by Mirant Mid-Atlantic’s facilities. In addition, changes to Mirant Mid-Atlantic’s assumptions regarding generating capacity additions and retirements in the PJM region could affect the cash flows, depending on the timing and extent of additions and retirements. Mirant Mid-Atlantic’s assumptions include only those capital expenditures needed to keep the generating facilities operational through their estimated remaining useful lives. However, changes in laws or regulations could require Mirant Mid-Atlantic to invest additional capital beyond amounts budgeted to keep the generating facilities operational.
Intangible Assets, net
Trading rights are intangible assets recognized in connection with asset purchases that represent Mirant Americas Generation’s and Mirant North America’s ability to generate additional cash flows by incorporating Mirant Americas Generation’s and Mirant North America’s trading activities with the acquired generating facilities. See below for information on the impairment of the trading rights related to the Potrero and Contra Costa generating facilities.
Development rights represent the right to expand capacity at certain acquired generating facilities. The existing infrastructure, including storage facilities, transmission interconnections and fuel delivery systems and contractual rights acquired by the Companies, provide the opportunity to expand or repower certain generating facilities. See below for information on the impairment of the development rights related to the Potrero generating facility.
Emissions allowances represent allowances granted for the leasehold baseload units at the Dickerson and Morgantown generating facilities.
Mirant Americas Generation and Mirant North America
Following is a summary of intangible assets (dollars in millions):
| Weighted Average Amortization Lives |
At December 31, 2009 | At December 31, 2008 | ||||||||||||||
| Gross Carrying Amount |
Accumulated Amortization |
Gross Carrying Amount |
Accumulated Amortization |
|||||||||||||
| Trading rights |
26 years | $ | 15 | $ | (4 | ) | $ | 27 | $ | (6 | ) | |||||
| Development rights |
39 years | 54 | (12 | ) | 62 | (12 | ) | |||||||||
| Emissions allowances |
31 years | 149 | (39 | ) | 150 | (34 | ) | |||||||||
| Other intangibles |
30 years | 12 | (4 | ) | 12 | (4 | ) | |||||||||
| Total intangible assets |
$ | 230 | $ | (59 | ) | $ | 251 | $ | (56 | ) | ||||||
Amortization expense was approximately $8 million for the years ended December 31, 2009, 2008 and 2007, respectively. Assuming no future acquisitions, dispositions or impairments of intangible assets, amortization expense is estimated to be approximately $8 million for each of the next five years.
F-41
Table of Contents
Mirant Mid-Atlantic
Following is a summary of intangible assets (dollars in millions):
| Weighted Average Amortization Lives |
At December 31, 2009 | At December 31, 2008 | ||||||||||||||
| Gross Carrying Amount |
Accumulated Amortization |
Gross Carrying Amount |
Accumulated Amortization |
|||||||||||||
| Development rights |
40 years | $ | 47 | $ | (11 | ) | $ | 47 | $ | (9 | ) | |||||
| Emissions allowances |
32 years | 131 | (37 | ) | 131 | (33 | ) | |||||||||
| Other intangibles |
30 years | 12 | (4 | ) | 12 | (4 | ) | |||||||||
| Total intangible assets |
$ | 190 | $ | (52 | ) | $ | 190 | $ | (46 | ) | ||||||
All of Mirant Mid-Atlantic’s intangible assets are subject to amortization and are being amortized on a straight-line basis over their estimated useful lives.
Amortization expense was approximately $6 million for the years ended December 31, 2009, 2008 and 2007, respectively. Assuming no future acquisitions, dispositions or impairments of intangible assets, amortization expense is estimated to be approximately $6 million for each of the next five years.
Impairments on Assets Held and Used
Year Ended December 31, 2009
Bowline Generating Facility (Mirant Americas Generation and Mirant North America)
Background
During the second quarter of 2009, the NYISO issued its annual peak load and energy forecast in its Load and Capacity Data report (the “Gold Book”). The Gold Book reports projected supply and demand for the New York control area for the next ten years. The Gold Book reflected a significant decrease in future demand as a result of current economic conditions and the expected future effects of demand-side management programs in New York. The reduction in future demand as a result of demand-side management programs is being driven primarily by an energy efficiency program being instituted within the State of New York that will seek to achieve a 15% reduction from 2007 energy volumes by 2015. The decrease in the projected future demand resulted in a decrease in Mirant Americas Generation’s and Mirant North America’s forecast of the capacity revenue that their 1,139 MW Bowline generating facility will earn in future periods.
In addition to the change in the forecasted capacity revenue, Mirant Bowline also received its property tax assessment during the second quarter of 2009. The assessment significantly exceeds the estimated fair value of the generating facility.
In the second quarter of 2009, Mirant Americas Generation and Mirant North America evaluated the Bowline generating facility for impairment based on Mirant Americas Generation’s and Mirant North America’s five-year forecast at the time of the impairment review, which indicated that Mirant Bowline was projected to operate at a net loss for the next several years because of the excessive level of taxation combined with the forecasted decrease in capacity revenues.
Asset Grouping
For purposes of impairment testing, a long-lived asset or assets must be grouped at the lowest level of identifiable cash flows. Mirant Americas Generation and Mirant North America included their Hudson Valley Gas subsidiary in the impairment analysis as the sole function of the pipeline operated by Hudson Valley Gas is to supply gas to the Bowline generating facility.
F-42
Table of Contents
Assumptions and Results
Mirant Americas Generation and Mirant North America developed estimates related to the future costs of the facility, including future property tax payments. Additionally, Mirant Americas Generation and Mirant North America developed capacity and energy revenue forecasts based on supply and demand assumptions from the NYISO’s Gold Book and proprietary fundamental modeling. Mirant Americas Generation and Mirant North America also assumed they would monetize excess emissions allowances by selling them. The cash flows for the Bowline generating facility were projected through its estimated remaining useful life of 2027. The sum of the probability weighted undiscounted cash flows for the Bowline generating facility exceeded the carrying value as of June 30, 2009. There were no additional events in the third or fourth quarter of 2009 that required Mirant Americas Generation and Mirant North America to update their previous impairment analysis. As a result, Mirant Americas Generation and Mirant North America did not record an impairment charge for the year ended December 31, 2009. The carrying value of the Bowline generating facility represented approximately 4% of Mirant Americas Generation’s and Mirant North America’s total property, plant and equipment, net at December 31, 2009.
Potrero Generating Facility (Mirant Americas Generation and Mirant North America)
Background
In the third quarter of 2009, Mirant Potrero executed a settlement agreement with the City of San Francisco in which it agreed to shut down the Potrero generating facility when it is no longer needed for reliability, as determined by the CAISO. That settlement agreement became effective in November 2009, following its approval by the City’s Board of Supervisors and Mayor. There are several projects underway in the San Francisco area to increase reliability for the region that once completed are expected to reduce and possibly eliminate the need for the Potrero generating facility to operate for reliability reasons. Mirant Potrero agreed in the settlement agreement to submit to the CAISO a notice of intent to shut down the facility as of December 31, 2010. The CAISO will make the final determination on when each of the units at the Potrero generating facility is no longer needed for reliability and may be shut down. As a result of the settlement agreement, Mirant Americas Generation and Mirant North America evaluated the Potrero generating facility for impairment during the third quarter. See Note 12 for further discussion of the settlement agreement with the City of San Francisco.
Asset Grouping
For purposes of impairment testing, a long-lived asset or assets must be grouped at the lowest level of identifiable cash flows. All of the units at Mirant Potrero are viewed as a single asset group. Additionally, the asset group includes intangible assets recorded at Mirant California for trading and development rights related to Mirant Potrero.
Assumptions and Results
Mirant Americas Generation and Mirant North America evaluated the Potrero generating facility for impairment during the third quarter of 2009. Mirant Americas Generation’s and Mirant North America’s assessment of Mirant Potrero under the accounting guidance related to the impairment of a long-lived asset involved developing scenarios for the future expected operations of the Potrero generating facility. One such scenario assumed the complete shutdown of the Potrero generating facility in December 2010 in accordance with the timeline proposed in the settlement agreement. Mirant Americas Generation and Mirant North America also considered additional scenarios that assumed the CAISO would not allow complete shutdown of the facility in December 2010 as expected reliability projects in the City of San Francisco were not completed.
Mirant Americas Generation and Mirant North America determined that the tangible assets for the Potrero generating facility were not impaired because the weighted average sum of the undiscounted cash flows exceeded the carrying value of the tangible assets in the third quarter of 2009.
F-43
Table of Contents
In January 2010, the CAISO advised the City of San Francisco that the expected replacement in 2010 of two underground transmission cables, if completed successfully, would allow the CAISO not to require the continued operation of the remaining units of the Potrero generating facility, units 4, 5 and 6, for reliability purposes after 2010. The CAISO will not determine which units of the Potrero generating facility are required to operate in 2011 for reliability purposes until the fall of 2010, but Mirant Potrero expects that none of the units of the Potrero generating facility will be required to operate for reliability purposes after 2010 and that all of the units will close by the end of 2010. As a result, Mirant Americas Generation and Mirant North America reviewed their previous impairment for the tangible assets at the Potrero generating facility. The development related to the expected shutdown of units 4, 5 and 6 by the end of 2010 does not result in an impairment charge. The carrying value of the Potrero generating facility represented less than 1% of Mirant Americas Generation’s and Mirant North America’s total property, plant and equipment, net at December 31, 2009.
As a result of certain terms included in the settlement agreement, Mirant Americas Generation and Mirant North America separately evaluated the trading and development rights associated with the Potrero generating facility for impairment and determined that both of these intangible assets were fully impaired as of September 30, 2009. Accordingly, Mirant Americas Generation and Mirant North America recognized an impairment loss of $9 million on the consolidated statements of operations to write off the carrying value of the intangible assets related to the Potrero generating facility. This impairment loss is included in the results of Mirant Americas Generation’s and Mirant North America’s California segment for the year ended December 31, 2009.
Contra Costa Generating Facility (Mirant Americas Generation and Mirant North America)
Background
On September 2, 2009, Mirant Delta entered into a new agreement with PG&E for the 674 MW at Contra Costa units 6 and 7 for the period from November 2011 through April 2013. At the end of the agreement, and subject to any necessary regulatory approval, Mirant Delta has agreed to retire Contra Costa units 6 and 7, which began operations in 1964, in furtherance of state and federal policies to retire aging power plants that utilize once-through cooling technology. The agreement to retire these units did not significantly affect the remaining useful life of the Contra Costa generating facility. The new Mirant Delta agreement is subject to approval by the CPUC.
Assumptions and Results
Mirant Americas Generation and Mirant North America evaluated the intangible asset of trading rights related to their Contra Costa generating facility for impairment during the third quarter of 2009 as a result of the shutdown provisions in the extension of the tolling agreement. Because the Contra Costa generating facility is under contract with PG&E through its expected shutdown date of April 2013, Mirant Americas Generation and Mirant North America determined the intangible asset was fully impaired as of September 30, 2009. Mirant Americas Generation and Mirant North America recorded an impairment loss of $5 million on the consolidated statements of operations to write off the carrying value of the trading rights related to the Contra Costa generating facility. This impairment loss is included in the results of Mirant Americas Generation’s and Mirant North America’s California segment for the year ended December 31, 2009.
Mid-Atlantic Generating Facilities
Background
As described above, the Companies have goodwill recorded at their Mirant Mid-Atlantic registrant on its standalone balance sheet, which is eliminated upon consolidation at Mirant North America. In accordance with accounting guidance for goodwill and other intangible assets, the Companies are required to test the goodwill
F-44
Table of Contents
balance at Mirant Mid-Atlantic at least annually. In conducting step one of the goodwill impairment analysis for Mirant Mid-Atlantic, the Companies noted that the carrying value of its assets exceeded the calculated fair value of Mirant Mid-Atlantic, indicating that step two of the goodwill impairment analysis was required. Based on the results of the step one goodwill impairment analysis, the Companies tested Mirant Mid-Atlantic’s long-lived assets for impairment under the accounting guidance related to impairment of long-lived assets before completion of the step two test for goodwill. During 2009, the continued decline in average natural gas prices caused power prices to decline in the Mid-Atlantic region. Additionally, the current economic recession and various demand-response programs have resulted in a decrease in the forecasted gross margin of the Mid-Atlantic generating facilities. This has caused the undiscounted cash flows of the Mid-Atlantic’s generating facilities to decrease significantly from the prior year.
Upon completion of the Companies assessment, which was based on the accounting guidance related to the impairment of long-lived assets, the Companies determined that the Potomac River generating facility was impaired, as the carrying value exceeded the undiscounted cash flows. Mirant Americas Generation and Mirant North America recorded an impairment loss of $207 million on their consolidated statement of operations, including $5 million of capitalized interest recorded at Mirant North America related to the Potomac River facility, to reduce the carrying value of the Potomac River facility to its estimated fair value. Mirant Mid-Atlantic recorded an impairment loss of $202 million on its consolidated statement of operations to reduce the carrying value of the Potomac River facility to its estimated fair value. The carrying value of the Potomac River generating facility prior to the impairment was approximately $244 million. The Companies determined that none of Mirant Mid-Atlantic’s long-lived assets other than the Potomac River generating facility was impaired at October 31, 2009.
Asset Grouping
For purposes of impairment testing, a long-lived asset or assets must be grouped at the lowest level of identifiable cash flows. Each of the Mid-Atlantic generating facilities is viewed as an individual asset group. The asset groups also include construction work-in-process, capitalized interest recorded at Mirant North America related to the generating facilities and related intangible assets, including emissions allowances.
Assumptions and Results
The assumptions for Mirant Potomac River were consistent with those used in the goodwill impairment analysis of Mirant Mid-Atlantic described above. In addition to the assumptions utilized for the other Mid-Atlantic facilities, the Companies also incorporated assumptions specific to Mirant Potomac River. For example, the capital expenditures for Mirant Potomac River included the remaining $33 million it committed to spend to reduce particulate emissions as part of the agreement with the City of Alexandria, Virginia. In addition, Mirant Potomac River is not subject to the RGGI for CO2 emissions. The remaining depreciable life of Mirant Potomac River was adjusted to December 31, 2020, based on the results of the impairment analysis, which indicated that the facility began to go cash flow negative after that point.
F-45
Table of Contents
The following tables set forth by level within the fair value hierarchy the Companies’ assets, Mirant Americas Generation’s and Mirant North America’s intangible assets and Mirant Mid-Atlantic’s goodwill that were accounted for at fair value on a non-recurring basis. All of the Companies’ assets, Mirant Americas Generation’s and Mirant North America’s intangible assets and Mirant Mid-Atlantic’s goodwill that were measured at fair value as a result of an impairment during the current period were categorized in Level 3 as of December 31, 2009 (in millions):
Mirant Americas Generation and Mirant North America
| Fair Value at December 31, 2009 | Loss Included in Earnings | ||||||||||||||
| Quoted Prices in Active Markets for Identical Assets (Level 1) |
Significant Other Observable Inputs (Level 2) |
Significant Other Unobservable Inputs (Level 3) |
Total | ||||||||||||
| Potomac River generating facility |
$ | — | $ | — | $ | 37 | $ | 37 | $ | 207 | |||||
| Potrero intangible assets |
— | — | — | — | 9 | ||||||||||
| Contra Costa intangible assets |
— | — | — | — | 5 | ||||||||||
| Total |
$ | — | $ | — | $ | 37 | $ | 37 | $ | 221 | |||||
Mirant Mid-Atlantic
| Fair Value at December 31, 2009 | Loss Included in Earnings | ||||||||||||||
| Quoted Prices in Active Markets for Identical Assets (Level 1) |
Significant Other Observable Inputs (Level 2) |
Significant Other Unobservable Inputs (Level 3) |
Total | ||||||||||||
| Potomac River generating facility |
$ | — | $ | — | $ | 37 | $ | 37 | $ | 202 | |||||
| Mirant Mid-Atlantic goodwill1 |
— | — | 616 | 616 | 183 | ||||||||||
| Total |
$ | — | $ | — | $ | 653 | $ | 653 | $ | 385 | |||||
| 1 | Goodwill is recorded at Mirant Mid-Atlantic on its standalone balance sheet. The goodwill doe s not exist at Mirant Americas Generation’s and Mirant North America’s balance sheets. As such, the goodwill impairment loss and related goodwill balance are eliminated upon consolidation at Mirant North America. |
Year Ended December 31, 2007
Lovett Generating Facility (Mirant Americas Generation and Mirant North America)
Background
In accordance with the accounting guidance related to the impairment of long-lived assets, an asset classified as held and used shall be tested for recoverability whenever events or changes in circumstances indicate that the carrying amount of the asset may not be recoverable. An asset impairment charge must be recognized if the sum of the undiscounted expected future cash flows from a long-lived asset is less than the carrying value of that asset. The amount of any impairment charge is calculated as the excess of the carrying value of the asset over its fair value. Fair value is estimated based on the discounted future cash flows from that asset or determined by other valuation techniques.
In 2000, the State of New York issued an NOV to the previous owner of Mirant Americas Generation’s and Mirant North America’s Lovett generating facility alleging NSR violations associated with the operation of
F-46
Table of Contents
that facility prior to its acquisition by Mirant Americas Generation and Mirant North America. On June 11, 2003, Mirant New York, Mirant Lovett and the State of New York entered into a consent decree (the “2003 Consent Decree”). The 2003 Consent Decree was approved by the Bankruptcy Court on October 15, 2003. Under the 2003 Consent Decree, Mirant Lovett had three options: (1) install emissions controls on the Lovett generating facility’s two coal-fired units (units 4 and 5); (2) shut down unit 4 and convert unit 5 to natural gas; or (3) shut down unit 5 in 2007 and unit 4 in 2008. Mirant Americas Generation and Mirant North America concluded that the installation of the required emissions controls was uneconomic. Mirant Americas Generation and Mirant North America also concluded that operating unit 5 on natural gas was uneconomic.
On October 19, 2006, Mirant Lovett notified the New York Public Service Commission, the NYISO, Orange and Rockland and certain other affected transmission and distribution companies in New York of its intent to discontinue operation of units 3 and 5 of the Lovett generating facility in April 2007.
On May 10, 2007, Mirant Lovett entered into an amendment to the 2003 Consent Decree with the State of New York that switched the deadlines for shutting down units 4 and 5 so that the deadline for compliance by unit 5 was extended until April 30, 2008, and the deadline for unit 4 was shortened. Mirant Americas Generation and Mirant North America discontinued operation of unit 4 as of May 7, 2007. In addition, Mirant Americas Generation and Mirant North America discontinued operation of unit 3 because it was uneconomic to run the unit.
Assumptions and Results
In the second quarter of 2007, Mirant Americas Generation and Mirant North America performed an impairment analysis of the Lovett generating facility and, as a result of this analysis, recorded an impairment loss of $175 million to reduce the carrying value of the Lovett generating facility to its estimated fair value. The carrying value of the Lovett generating facility prior to the impairment was approximately $185 million. The remaining depreciable life for the Lovett generating facility was also adjusted to April 30, 2008, based on the high likelihood of a shutdown of unit 5 on that date.
On October 20, 2007, Mirant Lovett submitted notices of its intent to discontinue operations of unit 5 of the Lovett generating facility as of midnight on April 19, 2008, to the New York Public Service Commission, the NYISO, Orange and Rockland and several other potentially affected transmission and distribution companies in New York. Mirant Americas Generation and Mirant North America ceased operation of unit 5 on April 19, 2008, and completed the demolition of the Lovett generating facility in 2009.
Asset Retirement Obligations
Upon initial recognition of a liability for an asset retirement obligation or a conditional asset retirement obligation, an entity shall capitalize an asset retirement cost by increasing the carrying amount of the related long-lived asset by the same amount as the liability. Over time, the liability is accreted to its present value each period and the capitalized cost is depreciated over the useful life of the related asset. Retirement obligations associated with long-lived assets included within the scope of accounting guidance are those for which a legal obligation exists under enacted laws, statutes and written or oral contracts, including obligations arising under the doctrine of promissory estoppel.
The Companies identified certain asset retirement obligations within their power generating facilities. These asset retirement obligations are primarily related to asbestos abatement in facilities on owned or leased property and other environmental obligations related to fuel storage facilities, wastewater treatment facilities, ash disposal sites and pipelines.
F-47
Table of Contents
Asbestos abatement is the most significant type of asset retirement obligation identified for recognition in connection with the Companies’ policy related to accounting for conditional asset retirements. The EPA has regulations in place governing the removal of asbestos. Because of the nature of asbestos, it can be difficult to ascertain the extent of contamination in older facilities unless substantial renovation or demolition takes place. Therefore, the Companies incorporated certain assumptions based on the relative age and size of their facilities to estimate the current cost for asbestos abatement. The actual abatement cost could differ from the estimates used to measure the asset retirement obligation. As a result, these amounts will be subject to revision when actual abatement activities are undertaken.
The following tables set forth the balances of the asset retirement obligations as of January 1, 2008, and the additions and accretion of the asset retirement obligations. The asset retirement obligations are included in other noncurrent liabilities in the consolidated balance sheets (in millions):
Mirant Americas Generation and Mirant North America
| For the Years Ended December 31, |
|||||||
| 2009 | 2008 | ||||||
| Beginning balance January 1 |
$ | 40 | $ | 44 | |||
| Liabilities settled during the period |
— | (9 | ) | ||||
| Accretion expense |
3 | 3 | |||||
| Revisions in estimated cash flows |
— | 2 | |||||
| Ending balance December 31 |
$ | 43 | $ | 40 | |||
Mirant Mid-Atlantic
| For the Years Ended December 31, |
|||||||
| 2009 | 2008 | ||||||
| Beginning balance January 1 |
$ | 12 | $ | 14 | |||
| Liabilities settled during the period |
— | (2 | ) | ||||
| Accretion expense |
1 | 1 | |||||
| Revisions in estimated cash flows |
— | (1 | ) | ||||
| Ending balance December 31 |
$ | 13 | $ | 12 | |||
F-48
Table of Contents
| 4. | Long-Term Debt (Mirant Americas Generation, Mirant North America and Mirant Mid-Atlantic) |
Long-term debt was as follows (dollars in millions):
| At December 31, | Interest Rate | Secured/ Unsecured | ||||||||||
| 2009 | 2008 | |||||||||||
| Long-term debt: |
||||||||||||
| Mirant Mid-Atlantic: |
||||||||||||
| Mirant Chalk Point capital lease, due 2010 to 2015 |
$ | 25 | $ | 28 | 8.19% | — | ||||||
| Less: current portion of long-term debt |
(4 | ) | (3 | ) | ||||||||
| Total Mirant Mid-Atlantic long-term debt, net of current portion |
21 | 25 | ||||||||||
| Mirant North America: |
||||||||||||
| Senior secured term loan, due 2010 to 2013 |
373 | 415 | LIBOR + 1.75%1 | Secured | ||||||||
| Senior notes, due December 2013. |
850 | 850 | 7.375% | Unsecured | ||||||||
| Less: current portion of senior secured term loan |
(70 | ) | (42 | ) | ||||||||
| Total Mirant North America long-term debt, net of current portion |
1,174 | 1,248 | ||||||||||
| Mirant Americas Generation: |
||||||||||||
| Senior notes: |
||||||||||||
| Due May 2011 |
535 | 535 | 8.30% | Unsecured | ||||||||
| Due October 2021 |
450 | 450 | 8.50% | Unsecured | ||||||||
| Due May 2031 |
400 | 400 | 9.125% | Unsecured | ||||||||
| Unamortized debt premiums (discounts), net |
(3 | ) | (3 | ) | ||||||||
| Total Mirant Americas Generation long-term debt, net of current portion |
$ | 2,556 | $ | 2,630 | ||||||||
| 1 | The weighted average interest rate at December 31, 2009 and 2008 was 2.130% and 4.763%, respectively. |
Mirant Americas Generation Senior Notes
The senior notes are senior unsecured obligations of Mirant Americas Generation having no recourse to any subsidiary or affiliate of Mirant Americas Generation. For the year ended December 31, 2008, Mirant Americas Generation purchased and retired $276 million of senior notes due in 2011.
Mirant North America Senior Secured Credit Facilities
Mirant North America, a wholly-owned subsidiary of Mirant Americas Generation, entered into senior secured credit facilities in January 2006, which are comprised of a senior secured term loan due January 2013 and a senior secured revolving credit facility due January 2012. The senior secured term loan had an initial principal balance of $700 million, which has amortized to $373 million as of December 31, 2009. At the closing, $200 million drawn under the senior secured term loan was deposited into a cash collateral account to support the issuance of up to $200 million of letters of credit. During 2008, Mirant North America transferred to the senior secured revolving credit facility approximately $78 million of letters of credit previously supported by the cash collateral account and withdrew approximately $78 million from the cash collateral account, thereby reducing the cash collateral account to approximately $122 million. At December 31, 2009, the cash collateral balance was approximately $124 million as a result of interest earned on the invested cash balances. At December 31, 2009, there were approximately $76 million of letters of credit outstanding under the senior secured revolving credit facility and $123 million of letters of credit outstanding under the senior secured term loan cash collateral account. At December 31, 2009, $679 million was available under the senior secured revolving credit facility and $0.6 million was available under the senior secured term loan for cash
F-49
Table of Contents
draws or for the issuance of letters of credit. Although the senior secured revolving credit facility has lender commitments of $800 million, availability thereunder reflects a $45 million effective reduction as a result of the bankruptcy filing of Lehman Commercial Paper, Inc., a lender under the facility and includes the $50 million commitment under such facility by CIT Capital USA Inc., whose corporate parent, CIT Group Inc., filed for and emerged from bankruptcy reorganization on November 1, 2009 and December 10, 2009, respectively.
In addition to quarterly principal installments, which are currently $1.2 million, Mirant North America is required to make annual principal prepayments under the senior secured term loan equal to a specified percentage of its excess free cash flow, which is based on adjusted EBITDA less capital expenditures and as further defined in the loan agreement. On March 19, 2009, Mirant North America made a mandatory principal prepayment of approximately $37 million on the term loan. At December 31, 2009, the current estimate of the mandatory principal prepayment of the term loan in March 2010 is approximately $66 million. This amount has been reclassified from long-term debt to current portion of long-term debt at December 31, 2009.
The senior secured credit facilities are senior secured obligations of Mirant North America. In addition, certain subsidiaries of Mirant North America (not including Mirant Mid-Atlantic or Mirant Energy Trading) have jointly and severally guaranteed, as senior secured obligations, the senior secured credit facilities. The senior secured credit facilities have no recourse to any other Mirant entities.
Mirant North America Senior Notes
In December 2005, Mirant North America issued senior notes in an aggregate principal amount of $850 million that bear interest at 7.375% and mature on December 31, 2013. The original senior notes were issued in a private placement and were not registered with the SEC. The proceeds of the original senior notes offering initially were placed in escrow pending the emergence of Mirant North America from bankruptcy. The proceeds were released from escrow in connection with Mirant North America’s emergence from bankruptcy and the closing of the senior secured credit facilities.
In connection with the issuance of the original senior notes, Mirant North America entered into a registration rights agreement under which it agreed to complete an exchange offer for the original senior notes. On June 29, 2006, Mirant North America completed its registration under the Securities Act of $850 million of the senior notes and initiated the exchange offer. The exchange offer was completed on August 4, 2006, with $849.965 million of the outstanding original senior notes being tendered for the senior notes. The terms of the senior notes are identical in all material respects to the terms of the original senior notes, except that the senior notes are registered under the Securities Act and generally are not subject to transfer restrictions or registration rights.
Interest on the notes is payable on each June 30 and December 31. The senior notes due in 2013 are senior unsecured obligations of Mirant North America. In addition, certain subsidiaries of Mirant North America (not including Mirant Mid-Atlantic or Mirant Energy Trading) have jointly and severally guaranteed, as senior unsecured obligations, the senior notes. The Mirant North America senior notes have no recourse to any other Mirant entities, including Mirant Americas Generation. At any time on or after December 31, 2009, Mirant North America may redeem the notes at specified redemption prices, together with accrued and unpaid interest, if any, to the date of redemption. Under the terms of the notes, the occurrence of a change of control will be a triggering event requiring Mirant North America to offer to purchase all or a portion of the notes at a price equal to 101% of their principal amount, together with accrued and unpaid interest, if any, to the date of purchase. In addition, certain asset dispositions or casualty events will be triggering events which may require Mirant North America to use the proceeds from those asset dispositions or casualty events to make an offer to purchase the notes at 100% of their principal amount, together with accrued and unpaid interest, if any, to the date of purchase if such proceeds are not otherwise used, or committed to be used, within certain time periods, to repay senior secured indebtedness, to repay indebtedness under the senior secured credit facilities (with a corresponding reduction in commitments) or to invest in capital assets related to its business.
F-50
Table of Contents
Capital Leases
Long-term debt includes a capital lease by Mirant Chalk Point. At December 31, 2009 and 2008, the current portion of the long-term debt under this capital lease was $4 million and $3 million, respectively. The amount outstanding under the capital lease at December 31, 2009, which matures in 2015, is $25 million with an 8.19% annual interest rate. This lease is for an 84 MW peaking electric power generating facility. Depreciation expense related to this lease was approximately $2 million for the years ended December 31, 2009, 2008 and 2007. The annual principal payments under this lease are approximately $3 million in 2010, $4 million in 2011, 2012 and 2013, $5 million in 2014 and $5 million thereafter. The gross amount of assets under the capital lease, recorded in property, plant and equipment, net, was $24 million at December 31, 2009 and 2008. The related accumulated depreciation was $15 million and $13 million at December 31, 2009 and 2008, respectively.
Debt Maturities
Mirant Americas Generation
At December 31, 2009, the annual scheduled maturities of debt during the next five years and thereafter were as follows (in millions):
| 2010 |
$ | 74 | |
| 2011 |
543 | ||
| 2012 |
9 | ||
| 2013 |
1,147 | ||
| 2014 |
5 | ||
| Thereafter |
852 | ||
| Total |
$ | 2,630 | |
Mirant North America
At December 31, 2009, the annual scheduled maturities of debt during the next five years and thereafter were as follows (in millions):
| 2010 |
$ | 74 | |
| 2011 |
8 | ||
| 2012 |
9 | ||
| 2013 |
1,147 | ||
| 2014 |
5 | ||
| Thereafter |
5 | ||
| Total |
$ | 1,248 | |
With the exception of 2010, the annual scheduled maturities above do not include estimates of Mirant North America’s required principal prepayments of its senior secured term loan based on its excess free cash flow.
Sources of Funds and Capital Structure
The principal sources of liquidity for the future operations and capital expenditures of the Companies are expected to be: (1) existing cash on hand and cash flows from their operations and the operations of their subsidiaries; (2) letters of credit issued or borrowings made under Mirant North America’s senior secured revolving credit facility; (3) letters of credit issued under Mirant North America’s senior secured term loan;
F-51
Table of Contents
(4) proceeds from the redemption of preferred shares issued by Mirant Americas to Mirant Mid-Atlantic and Mirant Americas Generation to fund capital expenditures at Mirant Mid-Atlantic and support the refinancing of Mirant Americas Generation’s senior notes due in 2011; and (5) at its discretion, capital contributions from Mirant Corporation.
Mirant Americas Generation and Mirant North America are holding companies and, as a result, they are dependent upon dividends, distributions and other payments from their respective subsidiaries to generate the funds necessary to meet their obligations. The ability of certain of Mirant Americas Generation’s and Mirant North America’s subsidiaries to pay dividends and make distributions is restricted under the terms of their debt or other agreements. In particular, a substantial portion of the cash from Mirant Americas Generation’s and Mirant North America’s operations is generated by Mirant Mid-Atlantic. The Mirant Mid-Atlantic leveraged leases contain a number of covenants, including a “look back” and “look forward” restricted payments tests. Under its leveraged leases, Mirant Mid-Atlantic is not permitted to make any dividends, distributions and other restricted payments unless: (1) it satisfies the fixed charge coverage ratio for the most recently ended period of four fiscal quarters; (2) it is projected to satisfy the fixed charge coverage ratio for each of the two following periods of four fiscal quarters, commencing with the fiscal quarter in which such payment is proposed to be made; and (3) no significant lease default or event of default has occurred and is continuing. In the event of a default under the leveraged leases or if the restricted payment tests are not satisfied, Mirant Mid-Atlantic would not be able to distribute cash. Based on the Companies’ calculation of the fixed charge coverage ratios under the leveraged leases as of December 31, 2009, Mirant Mid-Atlantic meets the required ratio for restricted payments, both on a historical and projected basis.
Mirant North America is an intermediate holding company that is a subsidiary of, and the source of distributions to, Mirant Americas Generation. Mirant Americas Generation primarily relies on distributions from Mirant North America to fund the debt service on its $1.385 billion of senior notes. Mirant North America incurred certain indebtedness pursuant to its senior notes and senior secured credit facilities secured by the assets of Mirant North America and its subsidiaries (other than Mirant Mid-Atlantic and its subsidiaries and Mirant Energy Trading). The indebtedness of Mirant North America includes certain covenants typical in such notes and credit facilities, including restrictions on dividends, distributions and other restricted payments. Further, the notes and senior secured credit facilities include financial covenants that will exclude from the calculation the financial results of any subsidiary that is unable to make distributions or pay dividends at the time of such calculation. Thus, the inability of Mirant Mid-Atlantic to make distributions to Mirant North America under the leveraged lease transaction would have a material adverse effect on the calculation of the financial covenants under the senior notes and senior secured credit facilities of Mirant North America, including the leverage and interest coverage maintenance covenants under its senior credit facility.
The ability of Mirant Americas Generation to pay its obligations is dependent on the receipt of dividends from Mirant North America, redemptions of the Mirant Americas preferred shares, capital contributions, at its discretion, from Mirant and its ability to refinance all or a portion of those obligations as they become due.
As described above, Mirant North America and Mirant Mid-Atlantic have restrictions on their ability to pay dividends or make intercompany loans and advances under their financing arrangements or other third party agreements. At December 31, 2009, Mirant North America had distributed to its parent, Mirant Americas Generation, all available cash that was permitted to be distributed under the terms of its debt agreements, leaving $403 million at Mirant North America and its subsidiaries. Of this amount, $125 million was held by Mirant Mid-Atlantic which, as of December 31, 2009, met the tests under the leveraged lease documentation permitting it to make distributions to Mirant North America. Although Mirant North America is in compliance with its financial covenants at December 31, 2009, it is restricted from making distributions by the free cash flow requirements under the restricted payment test of its senior credit facility. The primary factor lowering the free cash flow calculation in the restricted payment test for Mirant North America is the significant capital
F-52
Table of Contents
expenditure program of Mirant Mid-Atlantic to install emissions controls at its Chalk Point, Dickerson and Morgantown coal-fired units to comply with the Maryland Healthy Air Act. When the capital expenditures no longer affect the calculation of its free cash flow, Mirant North America is expected to be able again to make distributions. Mirant Americas Generation does not expect the liquidity effect of the restriction on distributions under the Mirant North America senior credit facility to be material given that the majority of its liquidity needs arise from the activities of Mirant North America and its subsidiaries, the restriction does not limit Mirant North America from making distributions to Mirant Americas Generation to fund interest payments on Mirant Americas Generation’s senior notes and Mirant Corporation has significant unrestricted cash and cash equivalents available, at its discretion, to make capital contributions to Mirant Americas Generation and its subsidiaries.
Except for permitted distributions to cover interest payable on Mirant Americas Generation’s senior notes, as of December 31, 2009, the $4.329 billion of net assets of Mirant North America and its subsidiaries were restricted as defined under Rule 4-08(e)(3)(ii) of Regulation S-X. In addition, as of December 31, 2009, approximately $4.761 billion of net assets of Mirant Mid-Atlantic and its subsidiaries are considered restricted for purposes of Rule 4-08(e)(3)(ii) of Regulation S-X, which amount excludes $125 million of cash held by Mirant Mid-Atlantic and does not consider any ability of Mirant Mid-Atlantic to monetize non-cash assets and distribute such amounts.
| 5. | Income Taxes (Mirant Americas Generation, Mirant North America and Mirant Mid-Atlantic) |
Income Tax Disclosures (Mirant Americas Generation and Mirant North America)
Mirant Americas Generation and Mirant North America and most of their subsidiaries are limited liability companies that are treated as branches of Mirant Americas for income tax purposes. As a result, Mirant Americas and Mirant have direct liability for the majority of the federal and state income taxes relating to Mirant Americas Generation’s and Mirant North America’s operations. Some of Mirant Americas Generation’s and Mirant North America’s subsidiaries continue to exist as regarded corporate entities for income tax purposes. They are Hudson Valley Gas, Mirant Kendall and Mirant Special Procurement, Inc. For these subsidiaries that continue to exist as corporate regarded entities, Mirant Americas Generation and Mirant North America allocate current and deferred income taxes to each corporate regarded entity as if such entity were a single taxpayer utilizing the asset and liability method to account for income taxes. To the extent Mirant Americas Generation and Mirant North America provide tax expense or benefit, any related tax payable or receivable to Mirant is reclassified to equity in the same period since we do not have a tax sharing agreement with Mirant.
Details of Mirant Americas Generation’s and Mirant North America’s income tax provision are as follows (in millions):
| Years Ended December 31, | |||||||||
| 2009 | 2008 | 2007 | |||||||
| Current provision: |
|||||||||
| Federal |
$ | — | $ | — | $ | — | |||
| State |
— | — | — | ||||||
| Provision for income taxes |
$ | — | $ | — | $ | — | |||
F-53
Table of Contents
A reconciliation of Mirant Americas Generation’s expected federal statutory income tax provision (benefit) to the effective income tax provision adjusted for permanent and other items for the years ended December 31, 2009, 2008 and 2007, is as follows (in millions):
| Years Ended December 31, | ||||||||||||
| 2009 | 2008 | 2007 | ||||||||||
| United States federal statutory income tax provision (benefit) |
$ | 167 | $ | 419 | $ | (24 | ) | |||||
| State and local income taxes, net of federal income taxes |
1 | 2 | — | |||||||||
| LLC income not subject to federal taxation |
(166 | ) | (420 | ) | 25 | |||||||
| Change in deferred tax asset valuation allowance |
(2 | ) | (1 | ) | (65 | ) | ||||||
| Conversion of Mirant New York Inc. to disregarded entity |
— | — | 54 | |||||||||
| Provision to return adjustments |
— | — | 10 | |||||||||
| Tax provision |
$ | — | $ | — | $ | — | ||||||
A reconciliation of Mirant North America’s expected federal statutory income tax provision to the effective income tax provision adjusted for permanent and other items for the years ending December 31, 2009, 2008 and 2007, is as follows (in millions):
| Years Ended December 31, | ||||||||||||
| 2009 | 2008 | 2007 | ||||||||||
| United States federal statutory income tax provision |
$ | 209 | $ | 468 | $ | 29 | ||||||
| State and local income taxes, net of federal income taxes |
1 | 2 | — | |||||||||
| LLC income not subject to federal taxation |
(208 | ) | (469 | ) | (28 | ) | ||||||
| Change in deferred tax asset valuation allowance |
(2 | ) | (1 | ) | (65 | ) | ||||||
| Conversion of Mirant New York Inc. to disregarded entity |
— | — | 54 | |||||||||
| Provision to return adjustments |
— | — | 10 | |||||||||
| Tax provision |
$ | — | $ | — | $ | — | ||||||
The tax effects of Mirant Americas Generation’s and Mirant North America’s temporary differences between the carrying amounts of assets and liabilities in the consolidated financial statements and their respective tax bases which give rise to deferred tax assets and liabilities for continuing operations are as follows (in millions):
| December 31, | ||||||||
| 2009 | 2008 | |||||||
| Deferred Tax Assets: |
||||||||
| Property and intangible assets |
$ | 65 | $ | 69 | ||||
| Loss carry forwards |
41 | 38 | ||||||
| Subtotal |
106 | 107 | ||||||
| Valuation allowance |
(105 | ) | (107 | ) | ||||
| Net deferred tax assets |
1 | — | ||||||
| Deferred Tax Liabilities: |
||||||||
| Energy marketing and derivative contracts |
(1 | ) | — | |||||
| Net deferred tax liabilities |
(1 | ) | — | |||||
| Net deferred taxes |
$ | — | $ | — | ||||
F-54
Table of Contents
As a result of changes in Mirant’s stock ownership, including Mirant’s repurchases of shares of its common stock since July 11, 2006, and the exercise of a significant number of warrants for Mirant common stock during 2008, in the third quarter of 2008, Mirant experienced an “ownership change” within the meaning of Internal Revenue Code Section (“§”) 382 of the Internal Revenue Code of 1986, as amended. The Companies’ annual limitation on the amount of taxable income that can be offset by their then existing NOLs have been redetermined as of the date of the ownership change. The Companies do not expect that the ability to offset any future taxable income with existing NOLs under the redetermined annual limitation will be significantly different from Mirant’s ability to do so under the annual limitation prior to the ownership change that occurred in the third quarter of 2008.
At December 31, 2009, Mirant Americas Generation and Mirant North America had $104 million of NOL carry forwards for federal income tax purposes expiring from 2023 to 2029 and $89 million of NOL carry forwards for state income tax purposes with various expiration dates (based on the application of apportionment factors and other state tax limitations). These NOL carry forwards are available to offset future federal and state income taxes.
The guidance related to accounting for income taxes requires that a valuation allowance be established when it is more-likely-than-not that all or a portion of a deferred tax asset will not be realized. The ultimate realization of deferred tax assets is dependent upon the generation of future taxable income during the periods in which those temporary differences are deductible. In making this determination, management considers all available positive and negative evidence affecting specific deferred tax assets, including Mirant Americas Generation’s and Mirant North America’s past and anticipated future performance, the reversal of deferred tax liabilities and the implementation of tax planning strategies.
Objective positive evidence is necessary to support a conclusion that a valuation allowance is not needed for all or a portion of deferred tax assets when significant negative evidence exists. The Companies evaluate this position quarterly and make their judgment based on the facts and circumstances at that time. Mirant Americas Generation and Mirant North America continue to maintain their valuation allowance against their net deferred tax assets.
As of December 31, 2009, Mirant Americas Generation’s and Mirant North America’s deferred tax assets reduced by the valuation allowance are completely offset by their deferred tax liabilities. In 2009, 2008 and 2007, Mirant Americas Generation and Mirant North America recognized changes in their valuation allowance of $(2) million, $(1) million and $(65) million, respectively, related to their net deferred tax assets.
Tax Uncertainties
The Companies adopted the provisions of the accounting guidance related to accounting for uncertainty in income taxes on January 1, 2007. Prior to adoption of this guidance, The Companies recognized contingent liabilities related to tax uncertainties when it was probable that a loss had occurred and the loss or range of loss could be reasonably estimated. The recognition of contingent losses for tax uncertainties requires management to make significant assumptions about the expected outcomes of certain tax contingencies. Under the accounting guidance, the Companies must reflect in their income tax provision the full benefit of all positions that will be taken in the their income tax returns, except to the extent that such positions are uncertain and fall below the recognition requirements. In the event the Companies determine that a tax position meets the uncertainty criteria, an additional liability or an adjustment to their NOLs, determined under the measurement criteria, will result. The Companies periodically reassess the tax positions in their tax returns for open years based on the latest information available and determine whether any portion of the tax benefits reflected should be treated as unrecognized.
F-55
Table of Contents
The unrecognized tax benefits included the review of tax positions relating to open tax years beginning in 1999 and continuing to the present. The Companies’ major tax jurisdictions are the United States at the federal level and multiple state jurisdictions. For United States federal income taxes, all tax years subsequent to 2005 remain open, and for state income taxes the earliest open year is 1999 for Mirant Americas Generation and Mirant North America and 2002 for Mirant Mid-Atlantic. However, both the federal and state NOL carry forwards from any closed year are subject to examination until the year that such NOL carry forwards are utilized and that year is closed for audit. The Companies do not currently have any unrecognized tax benefits and do not anticipate any significant changes in their unrecognized tax benefits over the next 12 months. The Companies’ tax provision continues to include an immaterial amount related to the accrual for any penalties and interest subsequent to its adoption of the accounting guidance related to accounting for uncertainty in income taxes.
Pro Forma Income Tax Disclosures
Mirant Americas Generation
Mirant Americas Generation is not subject to income taxes except for those subsidiaries of Mirant Americas Generation that are separate taxpayers. Mirant Americas and Mirant are otherwise directly responsible for income taxes related to Mirant America Generation’s operations.
The following reflects a pro forma disclosure of the income tax provision that would be reported if Mirant Americas Generation were to be allocated income taxes attributable to its operations. Pro forma income tax provision attributable to income before tax would consist of the following (in millions):
| Years Ended December 31, | |||||||||
| 2009 | 2008 | 2007 | |||||||
| Current provision: |
|||||||||
| Federal |
$ | 10 | $ | 2 | $ | 15 | |||
| State |
5 | 2 | — | ||||||
| Provision for income taxes |
$ | 15 | $ | 4 | $ | 15 | |||
The following table presents the pro forma reconciliation of Mirant America Generation’s federal statutory income tax provision (benefit) for continuing operations adjusted for reorganization items to the pro forma effective tax provision (in millions):
| Years Ended December 31, | ||||||||||||
| 2009 | 2008 | 2007 | ||||||||||
| United States federal statutory income tax provision (benefit) |
$ | 167 | $ | 419 | $ | (24 | ) | |||||
| State and local income taxes, net of federal income taxes |
26 | 63 | (19 | ) | ||||||||
| Impact of discontinued operations |
— | — | 3 | |||||||||
| Change in deferred tax asset valuation allowance |
(167 | ) | (479 | ) | 56 | |||||||
| Effect of Internal Revenue Code Section §382(1)(6) and §382(1)(5) |
— | (1 | ) | (18 | ) | |||||||
| Effect of implementing accounting guidance related to accounting for uncertainty in income taxes |
— | — | 35 | |||||||||
| Provision to return adjustments |
— | — | 30 | |||||||||
| Excess tax deductions related to bankruptcy transactions |
(3 | ) | — | (52 | ) | |||||||
| Other, net |
(8 | ) | 2 | 4 | ||||||||
| Tax provision |
$ | 15 | $ | 4 | $ | 15 | ||||||
F-56
Table of Contents
The tax effects of temporary differences between the carrying amounts of assets and liabilities in the consolidated balance sheets and their respective tax bases which give rise to the pro forma deferred tax assets and liabilities would be as follows (in millions):
| December 31, | ||||||||
| 2009 | 2008 | |||||||
| Deferred Tax Assets: |
||||||||
| Reserves |
$ | 10 | $ | 8 | ||||
| Loss carry forwards |
359 | 578 | ||||||
| Property and intangible assets |
83 | 34 | ||||||
| Other, net |
54 | 51 | ||||||
| Subtotal |
506 | 671 | ||||||
| Valuation allowance |
(198 | ) | (365 | ) | ||||
| Net deferred tax assets |
308 | 306 | ||||||
| Deferred Tax Liabilities: |
||||||||
| Derivative contract assets and liabilities |
(281 | ) | (266 | ) | ||||
| Other, net |
(27 | ) | (40 | ) | ||||
| Net deferred tax liabilities |
(308 | ) | (306 | ) | ||||
| Net deferred taxes |
$ | — | $ | — | ||||
As a result of changes in Mirant’s stock ownership, including Mirant’s repurchases of shares of its common stock since July 11, 2006, and the exercise of a significant number of warrants for Mirant common stock during 2008, in the third quarter of 2008, Mirant experienced an “ownership change” within the meaning of Internal Revenue Code Section (“§”) 382 of the Internal Revenue Code of 1986, as amended. Mirant Americas Generation’s pro forma annual limitation on the amount of pro forma taxable income that can be offset by its then existing pro forma NOLs has been redetermined as of the date of the ownership change. Mirant Americas Generation does not expect that its ability to offset any future pro forma taxable income with existing pro forma NOLs under the redetermined annual limitation will be significantly different from its ability to do so under the pro forma annual limitation prior to the ownership change that occurred in the third quarter of 2008. However, if Mirant experiences another ownership change after December 31, 2009, at or near Mirant’s recent stock price levels, the redetermined pro forma annual limitation for Mirant Americas Generation could be lower and could result in the recognition of additional pro forma current tax expense in future periods.
As of December 31, 2009, a portion of Mirant Americas Generation’s pro forma NOLs (approximately $83 million) is attributable to excess tax deductions primarily related to bankruptcy transactions. The recognition of pro forma tax benefit of these excess tax deductions, either through realization or reduction of the pro forma valuation allowance, would be an increase to pro forma member’s interest. These pro forma NOLs will be the last utilized for financial reporting purposes.
Mirant Americas Generation has not provided a pro forma deferred tax liability with respect to its investment in the Mirant Americas Preferred Stock discussed in Note 6 since the underlying transaction is disregarded for income tax purposes.
Mirant North America
Mirant North America is not subject to income taxes except for those subsidiaries of Mirant North America that are separate taxpayers. Mirant Americas and Mirant are otherwise directly responsible for income taxes related to Mirant North America’s operations.
F-57
Table of Contents
The following reflects a pro forma disclosure of the income tax provision that would be reported if Mirant North America were to be allocated income taxes attributable to its operations. Pro forma income tax provision (benefit) attributable to income before tax would consist of the following (in millions):
| Years Ended December 31, | ||||||||||
| 2009 | 2008 | 2007 | ||||||||
| Current provision: |
||||||||||
| Federal |
$ | 236 | $ | 40 | $ | 18 | ||||
| State |
6 | 3 | — | |||||||
| Deferred provision (benefit): |
||||||||||
| Federal |
(49 | ) | 254 | 20 | ||||||
| State |
22 | — | — | |||||||
| Provision for income taxes |
$ | 215 | $ | 297 | $ | 38 | ||||
The following table presents the pro forma reconciliation of Mirant North America’s federal statutory income tax provision for continuing operations adjusted for reorganization items to the pro forma effective tax provision (in millions):
| Years Ended December 31, | ||||||||||||
| 2009 | 2008 | 2007 | ||||||||||
| United States federal statutory income tax provision |
$ | 209 | $ | 468 | $ | 29 | ||||||
| State and local income taxes, net of federal income taxes |
28 | 71 | 1 | |||||||||
| Impact of discontinued operations |
— | — | 3 | |||||||||
| Change in deferred tax asset valuation allowance |
(15 | ) | (285 | ) | (37 | ) | ||||||
| Effect of Internal Revenue Code Section §382(1)(6) and §382(1)(5) |
— | (1 | ) | (9 | ) | |||||||
| Effect of implementing accounting guidance related to accounting for uncertainty in income taxes |
— | — | 35 | |||||||||
| Provision to return adjustments |
— | — | 36 | |||||||||
| Excess tax deductions related to bankruptcy transactions |
— | 42 | (26 | ) | ||||||||
| Other, net |
(7 | ) | 2 | 6 | ||||||||
| Tax provision |
$ | 215 | $ | 297 | $ | 38 | ||||||
F-58
Table of Contents
The tax effects of temporary differences between the carrying amounts of assets and liabilities in the consolidated balance sheets and their respective tax bases which give rise to the pro forma deferred tax assets and liabilities would be as follows (in millions):
| December 31, | ||||||||
| 2009 | 2008 | |||||||
| Deferred Tax Assets: |
||||||||
| Reserves |
$ | 10 | $ | 8 | ||||
| Loss carry forwards |
23 | 54 | ||||||
| Property and intangible assets |
72 | 22 | ||||||
| Other, net |
28 | 35 | ||||||
| Subtotal |
133 | 119 | ||||||
| Valuation allowance |
(9 | ) | (24 | ) | ||||
| Net deferred tax assets |
124 | 95 | ||||||
| Deferred Tax Liabilities: |
||||||||
| Derivative contract assets and liabilities |
(281 | ) | (267 | ) | ||||
| Other, net |
(28 | ) | (40 | ) | ||||
| Net deferred tax liabilities |
(309 | ) | (307 | ) | ||||
| Net deferred taxes |
$ | (185 | ) | $ | (212 | ) | ||
As a result of changes in Mirant’s stock ownership, including Mirant’s repurchases of shares of its common stock since July 11, 2006, and the exercise of a significant number of warrants for Mirant common stock during 2008, in the third quarter of 2008, Mirant experienced an “ownership change” within the meaning of Internal Revenue Code Section (“§”) 382 of the Internal Revenue Code of 1986, as amended. Mirant North America’s pro forma annual limitation on the amount of pro forma taxable income that can be offset by its then existing pro forma NOLs has been redetermined as of the date of the ownership change. In 2008, Mirant North America was able to utilize all of its federal pro forma NOLs. Mirant North America does not expect that its ability to offset any future pro forma state taxable income with existing pro forma NOLs under the redetermined annual limitation will be significantly different from its ability to do so under the pro forma annual limitation prior to the ownership change that occurred in the third quarter of 2008. However, if Mirant experiences another ownership change after December 31, 2009, at or near Mirant’s recent stock price levels, the redetermined pro forma annual limitation for Mirant North America could be lower and could result in the recognition of additional pro forma current state tax expense in future periods.
As of December 31, 2009, a portion of Mirant North America’s pro forma state NOLs (approximately $9 million) is attributable to excess tax deductions primarily related to bankruptcy transactions. The recognition of pro forma tax benefit of these excess tax deductions, either through realization or reduction of the pro forma valuation allowance, would be an increase to pro forma member’s interest. These pro forma state NOLs will be the last utilized for financial reporting purposes.
Mirant North America has not provided a pro forma deferred tax liability with respect to its investment in the Mirant Americas Preferred Stock discussed in Note 6, since the underlying transaction is disregarded for income tax purposes.
Mirant Mid-Atlantic
Mirant Mid-Atlantic and its subsidiaries are limited liability companies and are not subject to United States federal or state income taxes. As such, Mirant Mid-Atlantic is treated as though it was a branch or
F-59
Table of Contents
division of Mirant Americas Generation’s parent, Mirant Americas, for income tax purposes, and not as a separate taxpayer. Mirant Americas and Mirant are directly responsible for income taxes related to Mirant Mid-Atlantic’s operations.
The following reflects a pro forma disclosure of the income tax provision that would be reported if Mirant Mid-Atlantic were to be allocated income taxes attributable to its operations. Pro forma income tax provision (benefit) attributable to income before tax would consist of the following (in millions):
| Years Ended December 31, | |||||||||||
| 2009 | 2008 | 2007 | |||||||||
| Current provision: |
|||||||||||
| Federal |
$ | 182 | $ | 173 | $ | 216 | |||||
| State |
40 | 41 | 43 | ||||||||
| Deferred provision (benefit): |
|||||||||||
| Federal |
(9 | ) | 219 | (148 | ) | ||||||
| State |
(7 | ) | 52 | (15 | ) | ||||||
| Total income taxes provision |
$ | 206 | $ | 485 | $ | 96 | |||||
The following table presents the pro forma reconciliation of Mirant Mid-Atlantic’s federal statutory income tax provision for continuing operations adjusted for reorganization items to the pro forma effective tax provision (in millions):
| Years Ended December 31, | ||||||||||
| 2009 | 2008 | 2007 | ||||||||
| United States federal statutory income tax provision |
$ | 121 | $ | 426 | $ | 59 | ||||
| State and local income taxes, net |
21 | 61 | 18 | |||||||
| Effect of Internal Revenue Code Section §382(1)(6) |
— | (3 | ) | 18 | ||||||
| Reorganization item |
— | — | 1 | |||||||
| Impairment of non-deductible goodwill |
64 | — | — | |||||||
| Other |
— | 1 | — | |||||||
| Tax provision |
$ | 206 | $ | 485 | $ | 96 | ||||
The tax effects of temporary differences between the carrying amounts of assets and liabilities in the consolidated balance sheets and their respective tax bases which give rise to the pro forma deferred tax assets and liabilities would be as follows (in millions):
| December 31, | ||||||||
| 2009 | 2008 | |||||||
| Deferred Tax Assets: |
||||||||
| Other, net |
$ | 5 | $ | 4 | ||||
| Net deferred tax assets |
5 | 4 | ||||||
| Deferred Tax Liabilities: |
||||||||
| Property and intangible assets |
(142 | ) | (212 | ) | ||||
| Energy marketing and derivative contracts |
(265 | ) | (210 | ) | ||||
| Other, net |
(15 | ) | (15 | ) | ||||
| Net deferred tax liabilities |
(422 | ) | (437 | ) | ||||
| Net deferred taxes |
$ | (417 | ) | $ | (433 | ) | ||
F-60
Table of Contents
Mirant Mid-Atlantic has not provided a pro forma deferred tax liability with respect to its investment in the Mirant Americas Preferred Stock discussed in Note 6 since the underlying transaction is disregarded for income tax purposes.
Pro Forma Tax Uncertainties
The pro forma unrecognized tax benefit for all of the Companies is an insignificant amount and would not materially affect the Companies’ pro forma effective tax rate if it were recognized. The Companies’ pro forma tax provisions include an immaterial amount related to the accrual for any penalties and interest subsequent to their adoption of the accounting guidance related to accounting for uncertainty in income taxes.
| 6. | Related Party Arrangements and Transactions (Mirant Americas Generation, Mirant North America and Mirant Mid-Atlantic) |
Administrative Services Agreement with Mirant Services
Mirant Services provides the Companies with various management, personnel and other services as set forth in the Administrative Services Agreement. The Companies reimburse Mirant Services for amounts equal to Mirant Services’ costs of providing such services.
The total costs incurred by the Companies under the Administrative Services Agreement with Mirant Services have been included in the Companies’ accompanying consolidated statements of operations as follows (in millions):
Mirant Americas Generation and Mirant North America
| Years Ended December 31, | |||||||||
| 2009 | 2008 | 2007 | |||||||
| Cost of fuel, electricity and other products—affiliate |
$ | 9 | $ | 6 | $ | 8 | |||
| Operations and maintenance expense—affiliate |
155 | 147 | 152 | ||||||
| Total |
$ | 164 | $ | 153 | $ | 160 | |||
Mirant Mid-Atlantic
| Years Ended December 31, | |||||||||
| 2009 | 2008 | 2007 | |||||||
| Cost of fuel, electricity and other products—affiliate |
$ | 8 | $ | 7 | $ | 6 | |||
| Operations and maintenance expense—affiliate |
84 | 78 | 70 | ||||||
| Total |
$ | 92 | $ | 85 | $ | 76 | |||
Services and Risk Management Agreements with Affiliates (Mirant Americas Generation and Mirant North America)
Historically, Mirant Americas Generation and Mirant North America provided energy marketing and fuel procurement services through Mirant Energy Trading to the following affiliates: Mirant Las Vegas, Mirant Sugar Creek, Shady Hills, West Georgia and Mirant Wichita Falls. Mirant Wichita Falls was sold by Mirant in the second quarter of 2006. On May 1, 2007, Mirant completed the sale of the other four affiliates. For the year ended December 31, 2007, the total energy marketing costs were $47 million. For the year ended December 31, 2007, Mirant Americas Generation and Mirant North America recorded a reduction to operations and maintenance expense of approximately $1 million related to these services and risk management agreements.
F-61
Table of Contents
Mirant Americas Generation and Mirant North America did not recognize a reduction to operations and maintenance expense associated with providing services to these affiliates subsequent to the completion of the sales in 2007.
Power Sales and Fuel Supply Arrangement with Mirant Energy Trading (Mirant Mid-Atlantic)
Mirant Mid-Atlantic operates under a Power Sale, Fuel Supply and Services Agreement with Mirant Energy Trading. Amounts due to Mirant Energy Trading for fuel purchases and due from Mirant Energy Trading for power and capacity sales are recorded as a payable to affiliate or accounts receivable—affiliate in Mirant Mid-Atlantic’s accompanying consolidated balance sheets.
Under the Power Sale, Fuel Supply and Services Agreement, Mirant Energy Trading resells Mirant Mid-Atlantic’s energy products in the PJM spot and forward markets, and to other third parties. Mirant Mid-Atlantic is paid the amount received by Mirant Energy Trading for such capacity and energy. Mirant Mid-Atlantic has counterparty credit risk in the event that Mirant Energy Trading is unable to collect amounts owed from third parties for the resale of Mirant Mid-Atlantic’s energy products.
Services Provided by Mirant Energy Trading (Mirant Mid-Atlantic)
Mirant Mid-Atlantic receives services from Mirant Energy Trading which include the bidding and dispatch of the generating units, fuel procurement and the execution of contracts, including economic hedges, to reduce price risk. Amounts due to and from Mirant Energy Trading under the Power Sale, Fuel Supply and Services Agreement are recorded as a net payable to affiliate or accounts receivable—affiliate, as appropriate. Substantially all energy marketing overhead expenses are allocated to Mirant’s operating subsidiaries. During the years ended December 31, 2009, 2008 and 2007, Mirant Mid-Atlantic incurred approximately $14 million, $15 million and $24 million, respectively, in costs under these agreements. These costs are included in operations and maintenance expense—affiliate in Mirant Mid-Atlantic’s accompanying consolidated statements of operations.
Administration Arrangements with Mirant Services
Substantially all of Mirant’s corporate overhead costs are allocated to Mirant’s operating subsidiaries. For the years ended December 31, 2009, 2008 and 2007, the Companies incurred the following in costs under these arrangements, which are included in operations and maintenance expense—affiliate in the Companies’ accompanying consolidated statements of operations (in millions):
| Years Ended December 31, | |||||||||
| 2009 | 2008 | 2007 | |||||||
| Mirant Americas Generation |
$ | 135 | $ | 138 | $ | 125 | |||
| Mirant North America |
$ | 135 | $ | 138 | $ | 125 | |||
| Mirant Mid-Atlantic |
$ | 91 | $ | 80 | $ | 50 | |||
The Companies’ allocation of Mirant’s overhead costs have increased as a result of the disposition of Mirant’s Philippine and Caribbean businesses and six United States natural gas-fired facilities in the second and third quarters of 2007.
Notes Payable to Affiliate (Mirant Americas Generation)
During the pendency of the Chapter 11 proceedings, Mirant Americas Generation and certain of its subsidiaries and Mirant and certain of its subsidiaries (excluding Mirant Americas Generation and its subsidiaries) participated in separate intercompany cash management programs whereby cash balances at the respective participating subsidiaries were transferred to central concentration accounts to fund working capital
F-62
Table of Contents
and other needs of the respective participants. Mirant Americas Generation had no current notes payable to affiliate at December 31, 2009 and 2008. Interest expense—affiliate was $0 for the years ended December 31, 2009 and 2008, and $1 million for the year ended December 31, 2007.
Notes Receivable from Affiliate and Notes Payable to Affiliate (Mirant North America)
During the pendency of the Chapter 11 proceedings, Mirant Americas Generation and certain of its subsidiaries and Mirant and certain of its subsidiaries (excluding Mirant Americas Generation and its subsidiaries) participated in separate intercompany cash management programs whereby cash balances at Mirant and the respective participating subsidiaries were transferred to central concentration accounts to fund working capital and other needs of the respective participants. At both December 31, 2009 and 2008, Mirant North America had current notes receivable from Mirant Americas Generation of $93 million related to its pre-emergence intercompany cash management program. For the years ended December 31, 2009, 2008 and 2007, Mirant North America earned $0, $2 million and $5 million, respectively, of interest income related to the notes receivable, which is recorded in interest income—affiliate in Mirant North America’s accompanying consolidated statements of operations. Mirant North America had no current notes payable to affiliate at December 31, 2009 and 2008. Interest expense—affiliate was $0 for the years ended December 31, 2009 and 2008, and $1 million for the year ended December 31, 2007.
Purchased Emissions Allowances (Mirant Mid-Atlantic)
In the first quarter of 2009, Mirant Energy Trading began maintaining the inventory of certain purchased emissions allowances on behalf of Mirant Mid-Atlantic. The emissions allowances are sold by Mirant Energy Trading to Mirant Mid-Atlantic as they are needed for operations. Mirant Mid-Atlantic purchases emissions allowances from Mirant Energy Trading at Mirant Energy Trading’s original cost to purchase the allowances. For allowances that have been purchased by Mirant Energy Trading from a Mirant affiliate, the price paid by Mirant Energy Trading is determined by market indices. At December 31, 2009 and 2008, Mirant Mid-Atlantic had $0 and $19 million, respectively, of emissions allowances recorded in inventories in Mirant Mid-Atlantic’s accompanying condensed consolidated balance sheets.
Emissions allowances purchased from Mirant Energy Trading that were utilized in the years ended December 31, 2009, 2008 and 2007, were $45 million, $8 million and $35 million, respectively, and are recorded in cost of fuel, electricity and other products—affiliate in Mirant Mid-Atlantic’s accompanying consolidated statements of operations. Amounts expensed as a result of writing down emissions allowances to the lower of cost or market were $2 million and $3 million, respectively, for the years ended December 31, 2008 and 2007, and were recorded in cost of fuel, electricity and other products—affiliate in Mirant Mid-Atlantic’s accompanying unaudited condensed consolidated statements of operations.
Preferred Shares in Mirant Americas
Series A (Mirant Americas Generation, Mirant North America and Mirant Mid-Atlantic)
Pursuant to the Plan, Mirant Americas was required to make capital contributions to Mirant Mid-Atlantic for the purpose of funding future environmental capital expenditures. These capital contributions were made in the form of mandatorily redeemable Series A preferred shares, and are reflected as preferred stock in affiliate in the accompanying consolidated balance sheets at December 31, 2009 and 2008. In 2009 and 2008, Mirant Americas was required to and did redeem $84 million and $31 million, respectively, in preferred stock held by Mirant Mid-Atlantic.
F-63
Table of Contents
The Series A preferred shares have a scheduled redemption date at a specified redemption amount as follows (in millions):
| 2010 |
$ | 95 | |
| 2011 |
50 | ||
| $ | 145 | ||
Mirant Mid-Atlantic has the right to put the Series A preferred shares to Mirant at an amount equal to the specified redemption amount in the event that Mirant Americas fails to redeem the Series A preferred shares on a scheduled redemption date.
The Series A preferred shares are recorded at a fair value of $138 million and $211 million as a component of equity in the Companies’ consolidated balance sheets at December 31, 2009 and 2008, respectively. The fair value was determined using a discounted cash flow method based on the specified redemption amounts using a 6.21% discount rate. For the years ended December 31, 2009 and 2008, the Companies recorded $11 million and $13 million, respectively, in preferred stock in affiliate and member’s interest in the consolidated balance sheets related to the amortization of the discount on the preferred stock in Mirant Americas.
Series B (Mirant Americas Generation)
In December 2005, Mirant Americas issued mandatorily redeemable Series B preferred shares to Mirant Americas Generation for the purpose of supporting the refinancing of $850 million of Mirant Americas Generation senior notes due in 2011. The Series B preferred shares have a mandatory redemption date of April 1, 2011, for the liquidation preference amount of $150 million. At any time after June 30, 2010, Mirant Americas Generation has the right to put the Series B preferred shares to Mirant at the liquidation preference amount.
The Series B preferred shares are recorded at a fair value of $142 million and $134 million as a component of equity in Mirant Americas Generation’s consolidated balance sheets at December 31, 2009 and 2008, respectively. The fair value was determined using a discounted cash flow method based on the expected redemption date and the liquidation preference amount using a 6.21% discount rate. For the years ended December 31, 2009 and 2008, Mirant Americas Generation recorded $8 million in preferred stock in affiliate and member’s interest in the consolidated balance sheets related to the amortization of the discount on the preferred stock in Mirant Americas.
| 7. | Commitments and Contingencies (Mirant Americas Generation, Mirant North America and Mirant Mid-Atlantic) |
The Companies have made firm commitments to buy materials and services in connection with their ongoing operations and have provided cash collateral or financial guarantees relative to some of their investments.
F-64
Table of Contents
Commitments
In addition to debt and other obligations in the consolidated balance sheets, the Companies have the following annual commitments under various agreements at December 31, 2009, related to their operations (in millions):
Mirant Americas Generation and Mirant North America
| Off-Balance Sheet Arrangements and Contractual Obligations by Year | |||||||||||||||||||||
| Total | 2010 | 2011 | 2012 | 2013 | 2014 | >5 Years | |||||||||||||||
| Mirant Mid-Atlantic operating leases |
$ | 1,870 | $ | 140 | $ | 134 | $ | 132 | $ | 138 | $ | 131 | $ | 1,195 | |||||||
| Other operating leases |
113 | 13 | 12 | 11 | 11 | 11 | 55 | ||||||||||||||
| Fuel commitments |
939 | 348 | 336 | 206 | 49 | — | — | ||||||||||||||
| Maryland Healthy Air Act |
269 | 269 | — | — | — | — | — | ||||||||||||||
| Other |
194 | 109 | 15 | 13 | 9 | 7 | 41 | ||||||||||||||
| Total payments |
$ | 3,385 | $ | 879 | $ | 497 | $ | 362 | $ | 207 | $ | 149 | $ | 1,291 | |||||||
Mirant Mid-Atlantic
| Off-Balance Sheet Arrangements and Contractual Obligations by Year | |||||||||||||||||||||
| Total | 2010 | 2011 | 2012 | 2013 | 2014 | >5 Years | |||||||||||||||
| Generating units operating leases |
$ | 1,870 | $ | 140 | $ | 134 | $ | 132 | $ | 138 | $ | 131 | $ | 1,195 | |||||||
| Other operating leases |
111 | 13 | 12 | 11 | 11 | 10 | 54 | ||||||||||||||
| Fuel commitments |
939 | 348 | 336 | 206 | 49 | — | — | ||||||||||||||
| Maryland Healthy Air Act |
269 | 269 | — | — | — | — | — | ||||||||||||||
| Other |
119 | 71 | 13 | 12 | 8 | 6 | 9 | ||||||||||||||
| Total payments |
$ | 3,308 | $ | 841 | $ | 495 | $ | 361 | $ | 206 | $ | 147 | $ | 1,258 | |||||||
The Companies’ contractual obligations tables do not include the derivative obligations reported at fair value, which are discussed in Note 2 and the asset retirement obligations which are discussed in Note 3.
Operating Leases
Mirant Mid-Atlantic leases the Dickerson and Morgantown baseload units and associated property through 2029 and 2034, respectively. Mirant Mid-Atlantic has an option to extend the leases. Any extensions of the respective leases would be for less than 75% of the economic useful life of the facility, as measured from the beginning of the original lease term through the end of the proposed remaining lease term. The Companies are accounting for these leases as operating leases and recognize rent expense on a straight-line basis. Rent expense totaled $96 million for the years ended December 31, 2009, 2008 and 2007, and is included in operations and maintenance expense in the accompanying consolidated statements of operations. As of December 31, 2009 and 2008, the Companies have paid approximately $400 million and $354 million, respectively, of lease payments in excess of rent expense recognized, which is recorded in prepaid rent and prepaid expenses on the consolidated balance sheets. Of these amounts, $96 million is included in prepaid expenses on the Companies’ consolidated balance sheets as of December 31, 2009 and 2008.
As of December 31, 2009, the total notional minimum lease payments for the remaining terms of the leases aggregated approximately $1.9 billion and the aggregate termination value for the leases was approximately
F-65
Table of Contents
$1.4 billion, which generally decreases over time. Mirant Mid-Atlantic leases the Dickerson and the Morgantown baseload units from third party owner lessors. These owner lessors each own the undivided interests in these baseload generating facilities. The subsidiaries of the institutional investors who hold the membership interests in the owner lessors are called owner participants. Equity funding by the owner participants plus transaction expenses paid by the owner participants totaled $299 million. The issuance and sale of pass through certificates raised the remaining $1.2 billion needed for the owner lessors to acquire the undivided interests.
The pass through certificates are not direct obligations of Mirant Mid-Atlantic. Each pass through certificate represents a fractional undivided interest in one of three pass through trusts formed pursuant to three separate pass through trust agreements between Mirant Mid-Atlantic and United States Bank National Association (as successor in interest to State Street Bank and Trust Company of Connecticut, National Association), as pass through trustee. The property of the pass through trusts consists of lessor notes. The lessor notes issued by an owner lessor are secured by that owner lessor’s undivided interest in the lease facilities and its rights under the related lease and other financing documents.
The Companies have commitments under other operating leases with various terms and expiration dates.
Fuel Commitments
Fuel commitments primarily relate to long-term coal agreements and related transportation agreements, entered into by Mirant Energy Trading for Mirant Mid-Atlantic.
Maryland Healthy Air Act
Maryland Healthy Air Act commitments reflect the remaining expected payments for capital expenditures to comply with the limitations for SO2, NOx and mercury emissions under the Maryland Healthy Air Act. The Companies completed the installation of the remaining pollution control equipment related to compliance with the Maryland Healthy Air Act in the fourth quarter of 2009. However, provisions in the Companies’ construction contracts provide that certain payments be made after final completion of the project.
Other
Other primarily represents the open purchase orders less invoices received related to general procurement of products and services purchased in the ordinary course of business. These include construction, maintenance and labor activities at the Companies’ generating facilities. Other also includes limestone supply and transportation agreements, entered into by Mirant Energy Trading for Mirant Mid-Atlantic and the LTSA associated with the maintenance of a turbine at Mirant Americas Generation’s and Mirant North America’s Kendall facility.
Cash Collateral
In order to sell power and purchase fuel in the forward markets and perform other energy trading and marketing activities, Mirant Americas Generation and Mirant North America often are required to provide trade credit support to their counterparties or make deposits with brokers. In addition, Mirant Americas Generation and Mirant North America often are required to provide cash collateral for access to the transmission grid to participate in power pools and for other operating activities, including $33 million of cash collateral posted by Mirant Mid-Atlantic as part of its agreement with the City of Alexandria. In the event of default by the Companies, the counterparty can apply cash collateral held to satisfy the existing amounts outstanding under an open contract.
F-66
Table of Contents
The following is a summary of cash collateral posted with counterparties (in millions):
| At December 31, | ||||||
| 2009 | 2008 | |||||
| Cash collateral posted—energy trading and marketing |
$ | 41 | $ | 67 | ||
| Cash collateral posted—other operating activities |
42 | 43 | ||||
| Total |
$ | 83 | $ | 110 | ||
Guarantees (Mirant Americas Generation and Mirant North America)
Mirant generally conducts its business through various intermediate holding companies, including Mirant Americas Generation and Mirant North America, and various operating subsidiaries which enter into contracts as a routine part of their business activities. In certain instances, the contractual obligations of such subsidiaries are guaranteed by, or otherwise supported by, Mirant or another of its subsidiaries, including by letters of credit issued under the credit facilities of Mirant North America.
In addition, Mirant Americas Generation and its subsidiaries and Mirant North America and its subsidiaries enter into various contracts that include indemnification and guarantee provisions. Examples of these contracts include financing and lease arrangements, purchase and sale agreements, commodity purchase and sale agreements, construction agreements and agreements with vendors. Although the primary obligation of Mirant Americas Generation, Mirant North America or a subsidiary under such contracts is to pay money or render performance, such contracts may include obligations to indemnify the counterparty for damages arising from the breach thereof and, in certain instances, other existing or potential liabilities. In many cases Mirant Americas Generation’s and Mirant North America’s maximum potential liability cannot be estimated because some of the underlying agreements contain no limits on potential liability.
Upon issuance or modification of a guarantee, Mirant Americas Generation and Mirant North America determine if the obligation is subject to initial recognition and measurement of a liability and/or disclosure of the nature and terms of the guarantee. Generally, guarantees of the performance of a third party are subject to the recognition and measurement, as well as the disclosure provisions, of the accounting guidance related to guarantees. Such guarantees must initially be recorded at fair value, as determined in accordance with the accounting guidance. Mirant Americas Generation and Mirant North America did not have any guarantees at December 31, 2009, that met the recognition requirements of the accounting guidance.
Alternatively, guarantees between and on behalf of entities under common control are subject only to the disclosure provisions of the accounting guidance related to guarantors’ accounting and disclosure requirements for guarantees. Mirant Americas Generation and Mirant North America must disclose information as to the term of the guarantee and the maximum potential amount of future gross payments (undiscounted) under the guarantee, even if the likelihood of a claim is remote.
Letters of Credit and Surety Bonds
As of December 31, 2009, Mirant North America and certain of its subsidiaries were contingently obligated for $199 million under letters of credit issued under its senior credit facilities, which includes $123 million of letters of credit issued pursuant to its senior secured term loan and $76 million of letters of credit issued pursuant to its revolving credit facility. Most of these letters of credit are issued in support of the obligations of Mirant North America and its subsidiaries to perform under commodity agreements, financing or lease agreements or other commercial arrangements. In the event of default by Mirant North America, the counterparty can draw on a letter of credit to satisfy the existing amounts outstanding under an open contract. A majority of these letters of credit expire within one year of issuance, and it is typical for them to be renewed on similar terms.
F-67
Table of Contents
At December 31, 2009, Mirant Americas Generation and Mirant North America had obligations under surety bonds of $1 million. At December 31, 2008, Mirant Americas Generation and Mirant North America had obligations under surety bonds that were posted as credit support for the RGGI auction that was held in December 2008. These surety bonds were posted by Mirant Energy Trading and expired in January 2009.
Following is a summary of letters of credit issued and surety bonds provided (in millions):
| At December 31, | ||||||
| 2009 | 2008 | |||||
| Letters of credit—energy trading and marketing |
$ | 51 | $ | 76 | ||
| Letters of credit—debt service and rent reserves |
101 | 101 | ||||
| Letters of credit—other operating activities |
47 | 117 | ||||
| Surety bonds |
1 | 25 | ||||
| Total |
$ | 200 | $ | 319 | ||
Purchase and Sale Guarantees and Indemnifications
In connection with the purchase or sale of an asset or a business by a subsidiary, Mirant North America is typically required to provide certain assurances to the counterparties for the performance of the obligations of such a subsidiary under the purchase or sale agreements. Such assurances may take the form of a guarantee issued by Mirant North America or a subsidiary on behalf of the obligor subsidiary. The scope of such guarantees would typically include any indemnity obligations owed to such counterparty. Although the terms thereof vary in the scope, exclusions, thresholds and applicable limits, the indemnity obligations of a seller typically include liabilities incurred as a result of a breach of a purchase and sale agreement, including the seller’s representations or warranties, unpaid and unreserved tax liabilities and specified retained liabilities, if any. These obligations generally have a term of 12 months from the closing date and are intended to protect the buyer against breaches of the agreement or risks that are difficult to predict or estimate at the time of the transaction. In most cases, the contract limits the liability of the seller. As of December 31, 2009, Mirant North America and its subsidiaries’ did not have any contingent obligation for such assurances.
Commercial Purchase and Sales Arrangements
In connection with the purchase and sale of fuel, emissions allowances and energy to and from third parties with respect to the operation of its subsidiaries’ generating facilities, Mirant North America may be required to guarantee a portion of the obligations of certain of its subsidiaries. These obligations may include liquidated damages payments or other unscheduled payments. The majority of the current guarantees are set to expire before the end of 2010, although the obligations of the issuer will remain in effect until all the liabilities created under the guarantee have been satisfied or no longer exist. As of December 31, 2009, Mirant North America and its subsidiaries were contingently obligated for a total of $104 million under such arrangements. Mirant North America does not expect that it will be required to make any material payments under these guarantees.
Other Guarantees and Indemnifications
As of December 31, 2009, Mirant North America has issued $62 million of guarantees of obligations that its subsidiaries may incur in connection with construction agreements, equipment leases, settlement agreements and on-going litigation. Mirant North America does not expect that it will be required to make any material payments under these guarantees. In addition, Mirant Corporation has issued $25 million of guarantees for the benefit of Mirant North America’s subsidiaries. Neither Mirant Corporation nor Mirant North America expect that it will be required to make any material payments under these guarantees.
F-68
Table of Contents
Mirant Americas Generation and Mirant North America, through their subsidiaries, participate in several power pools with RTOs. The rules of these RTOs require that each participant indemnify the pool for defaults by other members. Usually, the amount indemnified is based upon the activity of the participant relative to the total activity of the pool and the amount of the default. Consequently, the amount of such indemnification by Mirant Americas Generation’s and Mirant North America’s subsidiaries cannot be quantified.
On a routine basis in the ordinary course of business, Mirant North America and its subsidiaries indemnify financing parties and consultants or other vendors who provide services. Mirant North America does not expect that it or any of the subsidiaries will be required to make any material payments under these indemnity provisions.
Because some of the guarantees and indemnities Mirant North America issues to third parties do not limit the amount or duration of its obligations to perform under them, there exists a risk that Mirant North America may have obligations in excess of the amounts described above. For those guarantees and indemnities that do not limit the liability exposure, Mirant Americas Generation and Mirant North America may not be able to estimate their potential liability until a claim is made for payment or performance, because of the contingent nature of these contracts.
| 8. | Dispositions (Mirant Americas Generation and Mirant North America) |
Overview
In the third quarter of 2006, Mirant commenced auction processes to sell six of its United States natural gas-fired generating facilities, including the Zeeland (903 MW) and Bosque (546 MW) facilities.
The sale of the Zeeland and Bosque natural gas-fired generating facilities was completed on May 1, 2007, and as a result, Mirant Americas Generation and Mirant North America recognized a cumulative loss of $8 million related to the sale. The net proceeds to Mirant North America after transaction costs were $524 million.
Mirant Americas Generation and Mirant North America completed the sale of Mirant NY-Gen on May 7, 2007, and recognized a gain of $8 million related to the sale. The proceeds related to the sale were immaterial as a result of the transfer of the net liabilities of Mirant NY-Gen.
Discontinued Operations
Mirant Americas Generation and Mirant North America have reclassified amounts for prior periods in the consolidated financial statements to report separately, as discontinued operations, the revenues and expenses of components of the Companies that were sold in 2007.
There were no discontinued operations for the years ended December 31, 2009 and 2008. For the year ended December 31, 2007, income from discontinued operations included the results of operations of the Zeeland and Bosque natural gas-fired generating facilities and Mirant NY-Gen through their respective dates of sale.
As part of the sale of Mirant NY-Gen, Mirant retained the rights to future insurance recoveries related to repairs of the dam at the Swinging Bridge facility. In the fourth quarter of 2007, Mirant Americas Generation and Mirant North America reached an insurance settlement and recognized a gain of $10 million, which is included in income from discontinued operations.
F-69
Table of Contents
A summary of the operating results for these discontinued operations for the year ended December 31, 2007 is as follows (in millions):
| December 31, 2007 | |||
| Operating revenues |
$ | 10 | |
| Operating expenses, net |
1 | ||
| Operating income |
9 | ||
| Other expense, net |
1 | ||
| Net income |
$ | 8 | |
| 9. | Bankruptcy Related Disclosures (Mirant Americas Generation and Mirant North America) |
Mirant’s Plan was confirmed by the Bankruptcy Court on December 9, 2005, and Mirant, Mirant Americas Generation and Mirant North America emerged from bankruptcy on January 3, 2006. For financial statement presentation purposes, Mirant, Mirant Americas Generation and Mirant North America recorded the effects of the Plan at December 31, 2005.
Mirant Americas Generation and Mirant North America had no reorganization items, net for the years ended December 31, 2009 and 2008. For the year ended December 31, 2007, reorganization items, net represents gains that were recorded in the financial statements as a result of the bankruptcy proceedings.
Mirant Americas Generation
At December 31, 2009 and 2008, amounts related to allowed claims, estimated unresolved claims and professional fees associated with the bankruptcy that are to be settled in cash were $1 million and $2 million, respectively, and these amounts were recorded in accounts payable and accrued liabilities on the accompanying consolidated balance sheets. These amounts do not include unresolved claims that will be settled in common stock or the stock portion of claims that are expected to be settled with cash and stock. For the years ended December 31, 2009, 2008 and 2007, Mirant Americas Generation paid approximately $0 million, $0 million and $22 million, respectively, in cash related to claims and professional fees from bankruptcy.
F-70
Table of Contents
| 10. | Segment Reporting (Mirant Americas Generation and Mirant North America) |
Mirant Americas Generation and Mirant North America have four operating segments: Mid-Atlantic, Northeast, California and Other Operations. The Mid-Atlantic segment consists of four generating facilities located in Maryland and Virginia with total net generating capacity of 5,194 MW. The Northeast segment consists of three generating facilities located in Massachusetts and one generating facility located in New York with total net generating capacity of 2,535 MW. For the years ended December 31, 2008 and 2007, the Northeast segment also included the Lovett generating facility, which was shut down on April 19, 2008. The California segment consists of three generating facilities located in or near the City of San Francisco, with total net generating capacity of 2,347 MW. Other Operations includes proprietary trading and fuel oil management activities, parent company adjustments for affiliate transactions, interest expense on debt at Mirant Americas Generation and Mirant North America and interest income on the invested cash balances of Mirant Americas Generation and Mirant North America. In the following tables, eliminations are primarily related to intercompany sales of emissions allowances, intercompany revenues, intercompany cost of fuel and interest on intercompany notes receivable and notes payable.
Mirant Americas Generation Operating Segments
| Mid-Atlantic | Northeast | California | Other Operations |
Eliminations | Total | |||||||||||||||||||
| (in millions) | ||||||||||||||||||||||||
| 2009: |
||||||||||||||||||||||||
| Operating revenues—nonaffiliate1 |
$ | 401 | $ | 15 | $ | 109 | $ | 1,787 | $ | (3 | ) | $ | 2,309 | |||||||||||
| Operating revenues—affiliate2 |
1,377 | 303 | 45 | 213 | (1,938 | ) | — | |||||||||||||||||
| Total operating revenues |
1,778 | 318 | 154 | 2,000 | (1,941 | ) | 2,309 | |||||||||||||||||
| Cost of fuel, electricity and other products—nonaffiliate3 |
17 | (1 | ) | (1 | ) | 686 | — | 701 | ||||||||||||||||
| Cost of fuel, electricity and other products—affiliate4 |
510 | 144 | 33 | 1,260 | (1,938 | ) | 9 | |||||||||||||||||
| Total cost of fuel, electricity and other products |
527 | 143 | 32 | 1,946 | (1,938 | ) | 710 | |||||||||||||||||
| Gross margin |
1,251 | 175 | 122 | 54 | (3 | ) | 1,599 | |||||||||||||||||
| Operating Expenses: |
||||||||||||||||||||||||
| Operations and maintenance—nonaffiliate |
245 | 73 | 34 | 3 | — | 355 | ||||||||||||||||||
| Operations and maintenance—affiliate |
189 | 53 | 40 | 8 | — | 290 | ||||||||||||||||||
| Depreciation and amortization |
98 | 18 | 22 | 4 | — | 142 | ||||||||||||||||||
| Impairment losses5 |
385 | — | 14 | 5 | (183 | ) | 221 | |||||||||||||||||
| Gain on sales of assets, net |
(14 | ) | (4 | ) | — | — | (4 | ) | (22 | ) | ||||||||||||||
| Total operating expenses (income), net |
903 | 140 | 110 | 20 | (187 | ) | 986 | |||||||||||||||||
| Operating income |
348 | 35 | 12 | 34 | 184 | 613 | ||||||||||||||||||
| Total other expense, net |
4 | — | 2 | 131 | — | 137 | ||||||||||||||||||
| Net income (loss) |
$ | 344 | $ | 35 | $ | 10 | $ | (97 | ) | $ | 184 | $ | 476 | |||||||||||
| Total assets |
$ | 5,807 | $ | 616 | $ | 139 | $ | 3,189 | $ | (2,234 | ) | $ | 7,517 | |||||||||||
| Capital expenditures |
$ | 578 | $ | 16 | $ | 2 | $ | 70 | $ | — | $ | 666 | ||||||||||||
| 1 | Includes unrealized gains of $137 million for Mid-Atlantic and unrealized losses of $139 million for Other Operations. |
| 2 | Includes unrealized gains of $26 million for Other Operations and unrealized losses of $1 million and $25 million for Mid-Atlantic and Northeast, respectively. |
| 3 | Includes unrealized gains of $49 million for Other Operations. |
| 4 | Includes unrealized losses of $49 million for Other Operations and unrealized gains of $8 million and $41 million for Mid-Atlantic and Northeast, respectively. |
F-71
Table of Contents
| 5 | Includes $183 million impairment loss of goodwill recorded at Mirant Mid-Atlantic on its standalone balance sheet. The goodwill does not exist at Mirant Americas Generation’s consolidated balance sheet. As such, the goodwill impairment loss and related goodwill balance are eliminated upon consolidation at Mirant North America. |
Mirant Americas Generation Operating Segments
| Mid-Atlantic | Northeast | California | Other Operations |
Eliminations | Total | |||||||||||||||||||
| (in millions) | ||||||||||||||||||||||||
| 2008: |
||||||||||||||||||||||||
| Operating revenues—nonaffiliate1 |
$ | 492 | $ | 20 | $ | 133 | $ | 2,539 | $ | 4 | $ | 3,188 | ||||||||||||
| Operating revenues—affiliate2 |
1,787 | 597 | 53 | 8 | (2,445 | ) | — | |||||||||||||||||
| Total operating revenues |
2,279 | 617 | 186 | 2,547 | (2,441 | ) | 3,188 | |||||||||||||||||
| Cost of fuel, electricity and other products—nonaffiliate3 |
20 | 15 | — | 1,020 | (2 | ) | 1,053 | |||||||||||||||||
| Cost of fuel, electricity and other products—affiliate4 |
545 | 423 | 59 | 1,424 | (2,445 | ) | 6 | |||||||||||||||||
| Total cost of fuel, electricity and other products |
565 | 438 | 59 | 2,444 | (2,447 | ) | 1,059 | |||||||||||||||||
| Gross margin |
1,714 | 179 | 127 | 103 | 6 | 2,129 | ||||||||||||||||||
| Operating Expenses: |
||||||||||||||||||||||||
| Operations and maintenance—nonaffiliate |
239 | 103 | 30 | — | — | 372 | ||||||||||||||||||
| Operations and maintenance—affiliate |
173 | 64 | 38 | 10 | — | 285 | ||||||||||||||||||
| Depreciation and amortization |
92 | 19 | 23 | 2 | — | 136 | ||||||||||||||||||
| Loss (gain) on sales of assets, net |
(8 | ) | (30 | ) | (7 | ) | (1 | ) | 8 | (38 | ) | |||||||||||||
| Total operating expenses, net |
496 | 156 | 84 | 11 | 8 | 755 | ||||||||||||||||||
| Operating income (loss) |
1,218 | 23 | 43 | 92 | (2 | ) | 1,374 | |||||||||||||||||
| Total other expense (income), net |
1 | (1 | ) | 1 | 175 | — | 176 | |||||||||||||||||
| Net income (loss) |
$ | 1,217 | $ | 24 | $ | 42 | $ | (83 | ) | $ | (2 | ) | $ | 1,198 | ||||||||||
| Total assets |
$ | 5,620 | $ | 722 | $ | 181 | $ | 5,083 | $ | (3,054 | ) | $ | 8,552 | |||||||||||
| Capital expenditures |
$ | 641 | $ | 25 | $ | 6 | $ | 48 | $ | — | $ | 720 | ||||||||||||
| 1 | Includes unrealized gains of $525 million and $315 million for Mid-Atlantic and Other Operations, respectively. |
| 2 | Includes unrealized gains of $160 million and $35 million for Mid-Atlantic and Northeast, respectively, and unrealized losses of $195 million for Other Operations. |
| 3 | Includes unrealized losses of $54 million for Other Operations. |
| 4 | Includes unrealized losses of $9 million and $45 million for Mid-Atlantic and Northeast, respectively, and unrealized gains of $54 million for Other Operations. |
F-72
Table of Contents
Mirant Americas Generation Operating Segments
| Mid-Atlantic | Northeast | California | Other Operations |
Eliminations | Total | |||||||||||||||||||
| (in millions) | ||||||||||||||||||||||||
| 2007: |
||||||||||||||||||||||||
| Operating revenues—nonaffiliate1 |
$ | (236 | ) | $ | 16 | $ | 143 | $ | 2,067 | $ | — | $ | 1,990 | |||||||||||
| Operating revenues—affiliate2 |
1,369 | 648 | 34 | 590 | (2,590 | ) | 51 | |||||||||||||||||
| Total operating revenues |
1,133 | 664 | 177 | 2,657 | (2,590 | ) | 2,041 | |||||||||||||||||
| Cost of fuel, electricity and other products—nonaffiliate3 |
170 | 54 | — | 782 | (18 | ) | 988 | |||||||||||||||||
| Cost of fuel, electricity and other products—affiliate4 |
358 | 373 | 42 | 1,868 | (2,590 | ) | 51 | |||||||||||||||||
| Total cost of fuel, electricity and other products |
528 | 427 | 42 | 2,650 | (2,608 | ) | 1,039 | |||||||||||||||||
| Gross margin |
605 | 237 | 135 | 7 | 18 | 1,002 | ||||||||||||||||||
| Operating Expenses: |
||||||||||||||||||||||||
| Operations and maintenance—nonaffiliate |
216 | 103 | 34 | — | — | 353 | ||||||||||||||||||
| Operations and maintenance—affiliate |
144 | 76 | 40 | 16 | — | 276 | ||||||||||||||||||
| Depreciation and amortization |
81 | 25 | 13 | 1 | — | 120 | ||||||||||||||||||
| Impairment losses |
— | 175 | — | — | — | 175 | ||||||||||||||||||
| Loss (gain) on sales of assets, net |
— | (49 | ) | (2 | ) | 1 | 11 | (39 | ) | |||||||||||||||
| Total operating expenses, net |
441 | 330 | 85 | 18 | 11 | 885 | ||||||||||||||||||
| Operating income (loss) |
164 | (93 | ) | 50 | (11 | ) | 7 | 117 | ||||||||||||||||
| Total other expense (income), net |
(5 | ) | (7 | ) | (5 | ) | 204 | — | 187 | |||||||||||||||
| Income (loss) from continuing operations before reorganization items |
169 | (86 | ) | 55 | (215 | ) | 7 | (70 | ) | |||||||||||||||
| Reorganization items, net |
— | (2 | ) | — | — | — | (2 | ) | ||||||||||||||||
| Income (loss) from continuing operations |
$ | 169 | $ | (84 | ) | $ | 55 | $ | (215 | ) | $ | 7 | $ | (68 | ) | |||||||||
| Total assets |
$ | 4,008 | $ | 696 | $ | 195 | $ | 2,696 | $ | (1,659 | ) | $ | 5,936 | |||||||||||
| Capital expenditures |
$ | 531 | $ | 17 | $ | 3 | $ | 30 | $ | — | $ | 581 | ||||||||||||
| 1 | Includes unrealized losses of $315 million and $351 million for Mid-Atlantic and Other Operations, respectively. |
| 2 | Includes unrealized gains of $249 million for Other Operations and unrealized losses of $159 million and $76 million for Mid-Atlantic and Northeast, respectively. |
| 3 | Includes unrealized gains of $28 million for Other Operations. |
| 4 | Includes unrealized losses of $5 million and $28 million for Mid-Atlantic and Other Operations, respectively, and unrealized gains of $33 million for Northeast. |
Mirant Americas Generation Geographic Areas
| Property, Plant and Equipment and Other Intangible Assets | |||||||||||||||||||
| Mid-Atlantic | Northeast | California | Other Operations |
Eliminations | Total | ||||||||||||||
| (in millions) | |||||||||||||||||||
| At December 31, 2009 |
$ | 3,754 | $ | 385 | $ | 102 | $ | 152 | $ | (616 | ) | $ | 3,777 | ||||||
| At December 31, 2008 |
$ | 3,565 | $ | 396 | $ | 138 | $ | 87 | $ | (799 | ) | $ | 3,387 | ||||||
F-73
Table of Contents
Mirant North America Operating Segments
| Mid-Atlantic | Northeast | California | Other Operations |
Eliminations | Total | ||||||||||||||||||
| (in millions) | |||||||||||||||||||||||
| 2009: |
|||||||||||||||||||||||
| Operating revenues—nonaffiliate1 |
$ | 401 | $ | 15 | $ | 109 | $ | 1,787 | $ | (3 | ) | $ | 2,309 | ||||||||||
| Operating revenues—affiliate2 |
1,377 | 303 | 45 | 213 | (1,938 | ) | — | ||||||||||||||||
| Total operating revenues |
1,778 | 318 | 154 | 2,000 | (1,941 | ) | 2,309 | ||||||||||||||||
| Cost of fuel, electricity and other products—nonaffiliate3 |
17 | (1 | ) | (1 | ) | 686 | — | 701 | |||||||||||||||
| Cost of fuel, electricity and other products—affiliate4 |
510 | 144 | 33 | 1,260 | (1,938 | ) | 9 | ||||||||||||||||
| Total cost of fuel, electricity and other products |
527 | 143 | 32 | 1,946 | (1,938 | ) | 710 | ||||||||||||||||
| Gross margin |
1,251 | 175 | 122 | 54 | (3 | ) | 1,599 | ||||||||||||||||
| Operating Expenses: |
|||||||||||||||||||||||
| Operations and maintenance—nonaffiliate |
245 | 73 | 34 | 3 | — | 355 | |||||||||||||||||
| Operations and maintenance—affiliate |
189 | 53 | 40 | 8 | — | 290 | |||||||||||||||||
| Depreciation and amortization |
98 | 18 | 22 | 4 | — | 142 | |||||||||||||||||
| Impairment losses5 |
385 | — | 14 | 5 | (183 | ) | 221 | ||||||||||||||||
| Gain on sales of assets, net |
(14 | ) | (4 | ) | — | — | (4 | ) | (22 | ) | |||||||||||||
| Total operating expenses (income), net |
903 | 140 | 110 | 20 | (187 | ) | 986 | ||||||||||||||||
| Operating income |
348 | 35 | 12 | 34 | 184 | 613 | |||||||||||||||||
| Total other expense, net |
4 | — | 2 | 10 | — | 16 | |||||||||||||||||
| Net income |
$ | 344 | $ | 35 | $ | 10 | $ | 24 | $ | 184 | $ | 597 | |||||||||||
| Total assets |
$ | 5,807 | $ | 616 | $ | 139 | $ | 3,181 | $ | (2,133 | ) | $ | 7,610 | ||||||||||
| Capital expenditures |
$ | 578 | $ | 16 | $ | 2 | $ | 70 | $ | — | $ | 666 | |||||||||||
| 1 | Includes unrealized gains of $137 million for Mid-Atlantic and unrealized losses of $139 million for Other Operations. |
| 2 | Includes unrealized gains of $26 million for Other Operations and unrealized losses of $1 million and $25 million for Mid-Atlantic and Northeast, respectively. |
| 3 | Includes unrealized gains of $49 million for Other Operations. |
| 4 | Includes unrealized losses of $49 million for Other Operations and unrealized gains of $8 million and $41 million for Mid-Atlantic and Northeast, respectively. |
| 5 | Includes $183 million impairment loss of goodwill recorded at Mirant Mid-Atlantic on its standalone balance sheet. The goodwill does not exist at Mirant North America’s consolidated balance sheet. As such, the goodwill impairment loss is eliminated upon consolidation. |
F-74
Table of Contents
Mirant North America Operating Segments
| Mid-Atlantic | Northeast | California | Other Operations |
Eliminations | Total | |||||||||||||||||||
| (in millions) | ||||||||||||||||||||||||
| 2008: |
||||||||||||||||||||||||
| Operating revenues—nonaffiliate1 |
$ | 492 | $ | 20 | $ | 133 | $ | 2,539 | $ | 4 | $ | 3,188 | ||||||||||||
| Operating revenues—affiliate2 |
1,787 | 597 | 53 | 8 | (2,445 | ) | — | |||||||||||||||||
| Total operating revenues |
2,279 | 617 | 186 | 2,547 | (2,441 | ) | 3,188 | |||||||||||||||||
| Cost of fuel, electricity and other products—nonaffiliate3 |
20 | 15 | — | 1,020 | (2 | ) | 1,053 | |||||||||||||||||
| Cost of fuel, electricity and other products—affiliate4 |
545 | 423 | 59 | 1,424 | (2,445 | ) | 6 | |||||||||||||||||
| Total cost of fuel, electricity and other products |
565 | 438 | 59 | 2,444 | (2,447 | ) | 1,059 | |||||||||||||||||
| Gross margin |
1,714 | 179 | 127 | 103 | 6 | 2,129 | ||||||||||||||||||
| Operating Expenses: |
||||||||||||||||||||||||
| Operations and maintenance—nonaffiliate |
239 | 103 | 30 | — | — | 372 | ||||||||||||||||||
| Operations and maintenance—affiliate |
173 | 64 | 38 | 10 | — | 285 | ||||||||||||||||||
| Depreciation and amortization |
92 | 19 | 23 | 2 | — | 136 | ||||||||||||||||||
| Loss (gain) on sales of assets, net |
(8 | ) | (30 | ) | (7 | ) | (1 | ) | 8 | (38 | ) | |||||||||||||
| Total operating expenses, net |
496 | 156 | 84 | 11 | 8 | 755 | ||||||||||||||||||
| Operating income (loss) |
1,218 | 23 | 43 | 92 | (2 | ) | 1,374 | |||||||||||||||||
| Total other expense (income), net |
1 | (1 | ) | 1 | 36 | — | 37 | |||||||||||||||||
| Net income (loss) |
$ | 1,217 | $ | 24 | $ | 42 | $ | 56 | $ | (2 | ) | $ | 1,337 | |||||||||||
| Total assets |
$ | 5,620 | $ | 722 | $ | 181 | $ | 5,074 | $ | (2,952 | ) | $ | 8,645 | |||||||||||
| Capital expenditures |
$ | 641 | $ | 25 | $ | 6 | $ | 48 | $ | — | $ | 720 | ||||||||||||
| 1 | Includes unrealized gains of $525 million and $315 million for Mid-Atlantic and Other Operations, respectively. |
| 2 | Includes unrealized gains of $160 million and $35 million for Mid-Atlantic and Northeast, respectively, and unrealized losses of $195 million for Other Operations. |
| 3 | Includes unrealized losses of $54 million for Other Operations. |
| 4 | Includes unrealized losses of $9 million and $45 million for Mid-Atlantic and Northeast, respectively, and unrealized gains of $54 million for Other Operations. |
F-75
Table of Contents
Mirant North America Operating Segments
| Mid-Atlantic | Northeast | California | Other Operations |
Eliminations | Total | |||||||||||||||||||
| (in millions) | ||||||||||||||||||||||||
| 2007: |
||||||||||||||||||||||||
| Operating revenues—nonaffiliate1 |
$ | (236 | ) | $ | 16 | $ | 143 | $ | 2,067 | $ | — | $ | 1,990 | |||||||||||
| Operating revenues—affiliate2 |
1,369 | 648 | 34 | 590 | (2,590 | ) | 51 | |||||||||||||||||
| Total operating revenues |
1,133 | 664 | 177 | 2,657 | (2,590 | ) | 2,041 | |||||||||||||||||
| Cost of fuel, electricity and other products—nonaffiliate3 |
170 | 54 | — | 782 | (18 | ) | 988 | |||||||||||||||||
| Cost of fuel, electricity and other products—affiliate4 |
358 | 373 | 42 | 1,868 | (2,590 | ) | 51 | |||||||||||||||||
| Total cost of fuel, electricity and other products |
528 | 427 | 42 | 2,650 | (2,608 | ) | 1,039 | |||||||||||||||||
| Gross margin |
605 | 237 | 135 | 7 | 18 | 1,002 | ||||||||||||||||||
| Operating Expenses: |
||||||||||||||||||||||||
| Operations and maintenance—nonaffiliate |
216 | 103 | 34 | — | — | 353 | ||||||||||||||||||
| Operations and maintenance—affiliate |
144 | 76 | 40 | 16 | — | 276 | ||||||||||||||||||
| Depreciation and amortization |
81 | 25 | 13 | 1 | — | 120 | ||||||||||||||||||
| Impairment losses |
— | 175 | — | — | — | 175 | ||||||||||||||||||
| Loss (gain) on sales of assets, net |
— | (49 | ) | (2 | ) | 1 | 11 | (39 | ) | |||||||||||||||
| Total operating expenses, net |
441 | 330 | 85 | 18 | 11 | 885 | ||||||||||||||||||
| Operating income (loss) |
164 | (93 | ) | 50 | (11 | ) | 7 | 117 | ||||||||||||||||
| Total other expense (income), net |
(5 | ) | (7 | ) | (5 | ) | 54 | — | 37 | |||||||||||||||
| Income (loss) from continuing operations before reorganization items |
169 | (86 | ) | 55 | (65 | ) | 7 | 80 | ||||||||||||||||
| Reorganization items, net |
— | (2 | ) | — | — | — | (2 | ) | ||||||||||||||||
| Income (loss) from continuing operations |
$ | 169 | $ | (84 | ) | $ | 55 | $ | (65 | ) | $ | 7 | $ | 82 | ||||||||||
| Total assets |
$ | 4,008 | $ | 696 | $ | 195 | $ | 2,669 | $ | (1,545 | ) | $ | 6,023 | |||||||||||
| Capital expenditures |
$ | 531 | $ | 17 | $ | 3 | $ | 30 | $ | — | $ | 581 | ||||||||||||
| 1 | Includes unrealized losses of $315 million and $351 million for Mid-Atlantic and Other Operations, respectively. |
| 2 | Includes unrealized gains of $249 million for Other Operations and unrealized losses of $159 million and $76 million for Mid-Atlantic and Northeast, respectively. |
| 3 | Includes unrealized gains of $28 million for Other Operations. |
| 4 | Includes unrealized losses of $5 million and $28 million for Mid-Atlantic and Other Operations, respectively, and unrealized gains of $33 million for Northeast. |
Mirant North America Geographic Areas
| Property, Plant and Equipment and Other Intangible Assets | |||||||||||||||||||
| Mid-Atlantic | Northeast | California | Other Operations |
Eliminations | Total | ||||||||||||||
| (in millions) | |||||||||||||||||||
| At December 31, 2009 |
$ | 3,754 | $ | 385 | $ | 102 | $ | 150 | $ | (616 | ) | $ | 3,775 | ||||||
| At December 31, 2008 |
$ | 3,565 | $ | 396 | $ | 138 | $ | 84 | $ | (799 | ) | $ | 3,384 | ||||||
F-76
Table of Contents
| 11. | Litigation and Other Contingencies (Mirant Americas Generation, Mirant North America and Mirant Mid-Atlantic) |
The Companies are involved in a number of significant legal proceedings. In certain cases, plaintiffs seek to recover large and sometimes unspecified damages, and some matters may be unresolved for several years. The Companies cannot currently determine the outcome of the proceedings described below or the ultimate amount of potential losses and therefore have not made any provision for such matters unless specifically noted below. Pursuant to guidance related to accounting for contingencies, management provides for estimated losses to the extent information becomes available indicating that losses are probable and that the amounts are reasonably estimable. Additional losses could have a material adverse effect on the Companies’ results of operations, financial position or cash flows.
Environmental Matters
Brandywine Fly Ash Facility. By letter dated November 19, 2009, the Defenders of Wildlife, Sierra Club, Patuxent Riverkeeper and Chesapeake Climate Action Network (the “Brandywine Noticing Parties”) notified Mirant, Mirant Mid-Atlantic and Mirant MD Ash Management, LLC of their intent to file suit for violations of the Clean Water Act and Maryland’s Water Pollution Control Law alleged to have occurred at the Brandywine Fly Ash Facility owned by Mirant MD Ash Management in Prince George’s County, Maryland. They contend that the operation of the Brandywine facility has resulted in unpermitted discharges of certain pollutants, including aluminum, arsenic, cadmium, copper, lead, mercury, selenium and zinc, through three outfalls and through seepage to the ground water from the disposal cells at the facility. They also assert that the discharges cause violations of certain of Maryland’s water quality criteria. Finally, the Brandywine Noticing Parties contend that Mirant MD Ash Management failed to perform certain monitoring and sampling or to file certain reports required under its existing National Pollutant Discharge Elimination System (“NPDES”) permit for the Brandywine Fly Ash Facility. The notice states that the Brandywine Noticing Parties will request the court to enjoin further violations, to impose civil penalties under the Clean Water Act of up to $37,500 per day per violation for the period after January 4, 2006, and to award them attorney’s fees. By letter dated January 15, 2010, the MDE advised Mirant Mid-Atlantic and Mirant MD Ash Management of its intent to file suit for violations of the Clean Water Act and Maryland’s Water Pollution Control Law based upon factual allegations similar to those asserted by the Brandywine Noticing Parties. Mirant MD Ash Management disputes the allegations of violations of the Clean Water Act and Maryland’s Water Pollution Control Law made by the Brandywine Noticing Parties in the November 19, 2009, letter and by MDE in its letter of January 15, 2010.
EPA Information Request. In January 2001, the EPA issued a request for information to Mirant concerning the implications under the EPA’s NSR regulations promulgated under the Clean Air Act of past repair and maintenance activities at the Potomac River generating facility in Virginia and the Chalk Point, Dickerson and Morgantown generating facilities in Maryland. The requested information concerned the period of operations that predates the ownership and lease of those facilities by Mirant Potomac River, Mirant Chalk Point and Mirant Mid-Atlantic. Mirant responded fully to this request. Under the APSA, Pepco is responsible for fines and penalties arising from any violation of the NSR regulations associated with operations prior to the acquisition or lease of the facilities by Mirant Potomac River, Mirant Chalk Point and Mirant Mid-Atlantic. If a violation is determined to have occurred at any of the facilities, Mirant Potomac River, Mirant Chalk Point and Mirant Mid-Atlantic, as the owner or lessee of the facility, may be responsible for the cost of purchasing and installing emissions control equipment, the cost of which may be material. Mirant Chalk Point and Mirant Mid-Atlantic have installed a variety of emissions control equipment on the Chalk Point, Dickerson and Morgantown generating facilities in Maryland to comply with the Maryland Healthy Air Act, but that equipment may not include all of the emissions control equipment that could be required if a violation of the EPA’s NSR regulations is determined to have occurred at one or more of those facilities. If such a violation is determined to have occurred after the acquisition or lease of the facilities by Mirant Potomac River, Mirant
F-77
Table of Contents
Chalk Point and Mirant Mid-Atlantic or, if occurring prior to the acquisition or lease, is determined to constitute a continuing violation, Mirant Potomac River, Mirant Chalk Point or Mirant Mid-Atlantic could also be subject to fines and penalties by the state or federal government for the period after its acquisition or lease of the facility at issue, the cost of which may be material, although applicable bankruptcy law may bar such liability for periods prior to January 3, 2006, when the Plan became effective for Mirant Potomac River, Mirant Chalk Point and Mirant Mid-Atlantic.
Faulkner Fly Ash Facility. By letter dated April 2, 2008, the Environmental Integrity Project and the Potomac Riverkeeper notified Mirant, the Companies and various of the Companies’ subsidiaries that they and certain individuals intended to file suit alleging that violations of the Clean Water Act were occurring at the Faulkner Fly Ash Facility owned by Mirant MD Ash Management. The April 2, 2008, letter alleged that the Faulkner facility discharged certain pollutants at levels that exceed Maryland’s water quality criteria, that it discharged certain pollutants without obtaining an appropriate NPDES permit, and that Mirant MD Ash Management failed to perform monthly monitoring required under an applicable NPDES permit. The letter indicated that the organizations intended to file suit to enjoin the violations alleged, to obtain civil penalties for past violations occurring after January 3, 2006, and to recover attorneys’ fees. Mirant MD Ash Management disputes the allegations of violations of the Clean Water Act made by the two organizations in the April 2, 2008, letter.
In May 2008, the MDE filed a complaint in the Circuit Court for Charles County, Maryland, against Mirant MD Ash Management and Mirant Mid-Atlantic. The complaint alleges violations of Maryland’s water pollution laws similar to those asserted in the April 2, 2008, letter from the Environmental Integrity Project and the Potomac Riverkeeper. The MDE complaint requests that the court (1) prohibit continuation of the alleged unpermitted discharges, (2) require Mirant MD Ash Management and Mirant Mid-Atlantic to cease from disposing of any further coal combustion byproducts at the Faulkner Fly Ash Facility and close and cap the existing disposal cells within one year and (3) assess civil penalties of up to $10,000 per day for each violation. The discharges that are the subject of the MDE’s complaint result from a leachate treatment system installed by Mirant MD Ash Management in accordance with a December 18, 2000 Complaint and Consent Order (the “December 2000 Consent Order”) entered by the Maryland Secretary of the Environment, Water Management Administration pursuant to an agreement between the MDE and Pepco, the previous owner of the Faulkner Fly Ash Facility. Mirant MD Ash Management and Mirant Mid-Atlantic on July 23, 2008, filed a motion seeking dismissal of the MDE complaint, arguing that the discharges are permitted by the December 2000 Consent Order. In September 2009, the court denied a motion by Environmental Integrity Project seeking to intervene as a party to the suit, and the Environmental Integrity Project has appealed that ruling.
Suit Regarding Chalk Point Emissions. On June 25, 2009, the Chesapeake Climate Action Network and four individuals filed a complaint against Mirant Mid-Atlantic and Mirant Chalk Point in the United States District Court for the District of Maryland. The plaintiffs allege that Mirant Chalk Point has violated the Clean Air Act and Maryland environmental regulations by failing to install controls to limit emissions of particulate matter on unit 3 and unit 4 of the Chalk Point generating facility, which at times burn residual fuel oil. The plaintiffs seek to enjoin the alleged violations, to obtain civil penalties of up to $32,500 per day for past noncompliance and to recover attorneys’ fees. Mirant Mid-Atlantic and Mirant Chalk Point dispute the plaintiffs’ allegations of violations of the Clean Air Act and Maryland environmental regulations. On October 13, 2009, Mirant Mid-Atlantic and Mirant Chalk Point filed a motion seeking dismissal of the complaint on the grounds that it was barred (1) under principles of res judicata by the dismissal with prejudice in January 2007 of similar claims filed by environmental advocacy organizations asserting that emissions from Chalk Point units 3 and 4 violated the Clean Air Act and (2) by actions taken by the MDE currently and over a number of years to ensure compliance by Chalk Point units 3 and 4 with regulations under the Clean Air Act and Maryland law limiting emissions of particulate matter.
F-78
Table of Contents
Mirant Mid-Atlantic and Mirant Chalk Point 2008 Consent Decree. In March 2008, Mirant Mid-Atlantic, Mirant Chalk Point and the MDE entered into a consent decree that provided stipulated penalties for various future violations of Maryland regulations related to emissions from the Chalk Point, Dickerson and Morgantown generating facilities. That consent decree provided in part that if emissions from the stacks for Morgantown units 1 and 2, the common stack for Chalk Point units 1 and 2, or the common stack for Dickerson units 1, 2 and 3 failed to achieve compliance with certain opacity limits in the period July 1, 2009 through December 31, 2009, a stipulated penalty would apply of $1,000 per day for each violation. In February 2010, the MDE notified Mirant Mid-Atlantic that it was seeking payment of a stipulated penalty of $134,000 for failures to comply with these opacity limits during the third quarter of 2009. Mirant Mid-Atlantic and Mirant Chalk Point expect that a stipulated penalty of a lesser amount will also be owed for the fourth quarter of 2009.
Riverkeeper Suit Against Mirant Lovett (Mirant Americas Generation and Mirant North America). On March 11, 2005, Riverkeeper, Inc. filed suit against Mirant Lovett in the United States District Court for the Southern District of New York under the Clean Water Act. The suit alleges that Mirant Lovett failed to implement a marine life exclusion system at its former Lovett generating facility and to perform monitoring for the exclusion of certain aquatic organisms from the facility’s cooling water intake structures in violation of Mirant Lovett’s water discharge permit issued by the State of New York. The plaintiff requested the court to impose civil penalties of $32,500 per day of violation and to award the plaintiff attorneys’ fees. Mirant Lovett’s view is that it complied with the terms of its water discharge permit, as amended by a Consent Order entered June 29, 2004. Mirant Lovett filed a motion seeking dismissal of the suit on the grounds that it complied with the terms of its water discharge permit, the closure of the Lovett generating facility in April 2008 moots the plaintiff’s request for injunctive relief, and the discharge in bankruptcy received by Mirant Lovett in 2007 bars any claim for penalties. On December 15, 2009, the district court granted in part and denied in part Mirant Lovett’s motion to dismiss. The court dismissed the plaintiff’s claims for injunctive relief and for penalties for any period prior to Mirant Lovett’s emergence from bankruptcy on October 2, 2007. It allowed to go forward claims alleging that Mirant Lovett violated its water discharge permit by not implementing the marine life exclusion system between the later of February 23, 2008 or when ice conditions on the Hudson River allowed for the system’s safe deployment and April 19, 2008, when the Lovett generating facility ceased operation, concluding that the June 29, 2004 Consent Order did not have the effect of modifying the water discharge permit.
Notices of Intent to Sue for Alleged Violations of the Endangered Species Act (Mirant Americas Generation and Mirant North America). By letter dated September 27, 2007, the Coalition for a Sustainable Delta, four water districts, and an individual (the “Delta Noticing Parties”) provided notice to Mirant and Mirant Delta of their intent to file suit alleging that Mirant Delta has violated, and continues to violate, the federal Endangered Species Act through the operation of its Contra Costa and Pittsburg generating facilities. The Delta Noticing Parties contend that the facilities’ use of water drawn from the Sacramento-San Joaquin Delta for cooling purposes results in harm to four species of fish listed as endangered species. The Delta Noticing Parties assert that Mirant Delta’s authorizations to take (i.e., cause harm to) those species, a biological opinion and incidental take statement issued by the National Marine Fisheries Service on October 17, 2002, for three of the fish species and a biological opinion and incidental take statement issued by the United States Fish and Wildlife Service on November 4, 2002, for the fourth fish species, have been violated by Mirant Delta and no longer apply to permit the effects on the four fish species caused by the operation of the Contra Costa and Pittsburg generating facilities. Following receipt of these letters, in late October 2007, Mirant Delta received correspondence from the United States Fish and Wildlife Service, the National Marine Fisheries Service and the United States Army Corps of Engineers (the “Corps”) clarifying that Mirant Delta continued to be authorized to take the four species of fish protected under the federal Endangered Species Act. The agencies have initiated a process that will review the environmental effects of Mirant Delta’s water usage, including effects on the protected species of fish. That process could lead to changes in the manner in which Mirant Delta can use river
F-79
Table of Contents
water for the operation of the Contra Costa and Pittsburg generating facilities. In a subsequent letter, the Coalition for a Sustainable Delta also alleged violations of the National Environmental Policy Act and the California Endangered Species Act associated with the operation of Mirant Delta’s generating facilities. On May 14, 2009, the Coalition for a Sustainable Delta, Kern County Water Agency and an individual sent a new notice of intent to sue to the Corps alleging that the Corps had violated the federal Endangered Species Act by issuing permits related to the operation of Mirant Delta’s Contra Costa and Pittsburg generating facilities without ensuring that conservation measures would be implemented to minimize and mitigate the harm to the four endangered fish species and their habitat allegedly resulting from such operation. Mirant Delta disputes the allegations made by the Delta Noticing Parties and those made in the May 14, 2009 notice.
On February 11, 2010, Mirant Delta entered into a settlement agreement with the Delta Noticing Parties, the parties to the May 14, 2009 notice of intent to sue, and the Corps. The settlement agreement provides for the Delta Noticing Parties and the parties to the May 14, 2009 notice of intent to sue to withdraw the two notices of intent to sue and to release all claims described in those notices. The settlement agreement obligates Mirant Delta to seek approval from the Corps, the United States Fish and Wildlife Service, and the National Marine Fisheries Service to amend its plan currently in effect for monitoring entrainment and impingement of aquatic species caused by the operation of its generating facilities to increase monitoring during periods the facilities are operating. If that amendment or an alternative acceptable to all the parties has not been approved by August 11, 2010, then the withdrawal of the notices of intent to sue and the release of claims included in the settlement agreement become void. The settlement agreement requires the Corps to use its best efforts to conclude ongoing consultations with the United States Fish and Wildlife Service and the National Marine Fisheries Service regarding the environmental effects of Mirant Delta’s water usage in a timely manner and allows the Delta Noticing Parties and the parties to the May 14, 2009 notice of intent to sue to issue new notices of intent to sue if such consultations are not completed by October 31, 2011.
Chapter 11 Proceedings
On July 14, 2003, and various dates thereafter, the Mirant Debtors, including the Companies and their subsidiaries, filed voluntary petitions for relief under Chapter 11 of the Bankruptcy Code in the Bankruptcy Court. Mirant, the Companies and most of the Mirant Debtors emerged from bankruptcy on January 3, 2006, when the Plan became effective. The remaining Mirant Debtors (Mirant New York, Mirant Bowline, Mirant Lovett, Mirant NY-Gen and Hudson Valley Gas) emerged from bankruptcy on various dates in 2007. As of December 31, 2009, approximately 837,000 of the shares of Mirant common stock to be distributed under the Plan had not yet been distributed and have been reserved for distribution with respect to claims disputed by the Mirant Debtors that have not been resolved. Under the terms of the Plan, upon the resolution of such a disputed claim, the claimant will receive the same pro rata distributions of Mirant common stock, cash, or both common stock and cash as previously allowed claims, regardless of the price at which Mirant common stock is trading at the time the claim is resolved.
To the extent the aggregate amount of the payouts determined to be due with respect to disputed claims ultimately exceeds the amount of the funded claim reserve, Mirant would have to issue additional shares of common stock to address the shortfall, which would dilute existing Mirant stockholders, and Mirant and Mirant Americas Generation would have to pay additional cash amounts as necessary under the terms of the Plan to satisfy such pre-petition claims.
California and Western Power Markets (Mirant Americas Generation and Mirant North America)
FERC Refund Proceedings Arising Out of California Energy Crisis. High prices experienced in California and western wholesale electricity markets in 2000 and 2001 caused various purchasers of electricity in those markets to initiate proceedings seeking refunds. Several of those proceedings remain pending either before the
F-80
Table of Contents
FERC or on appeal to the United States Court of Appeals for the Ninth Circuit (the “Ninth Circuit”). The proceedings that remain pending include proceedings (1) ordered by the FERC on July 25, 2001, (the “FERC Refund Proceedings”) to determine the amount of any refunds and amounts owed for sales made by market participants, including Mirant Americas Energy Marketing, in the CAISO or the Cal PX markets from October 2, 2000, through June 20, 2001 (the “Refund Period”), (2) ordered by the FERC to determine whether there had been unjust and unreasonable charges for spot market bilateral sales in the Pacific Northwest from December 25, 2000, through June 20, 2001 (the “Pacific Northwest Proceeding”), and (3) arising from a complaint filed in 2002 by the California Attorney General that sought refunds for transactions conducted in markets administered by the CAISO and the Cal PX outside the Refund Period set by the FERC and for transactions between the DWR and various owners of generation and power marketers, including Mirant Americas Energy Marketing and subsidiaries of Mirant Americas Generation and Mirant North America. Various parties appealed the FERC orders related to these proceedings to the Ninth Circuit seeking review of a number of issues, including changing the Refund Period to include periods prior to October 2, 2000, and expanding the sales of electricity subject to potential refund to include bilateral sales made to the DWR and other parties. Although various of these appeals remain pending, the Ninth Circuit ruled in orders issued on August 2, 2006, and September 9, 2004, that the FERC should consider further whether to grant relief for sales of electricity made in the CAISO and Cal PX markets prior to October 2, 2000, at rates found to be unjust, and, in the proceeding initiated by the California Attorney General, what remedies, including potential refunds, are appropriate where entities, including Mirant Americas Energy Marketing, purportedly did not comply with certain filing requirements for transactions conducted under market-based rate tariffs.
On January 14, 2005, Mirant and certain of its subsidiaries, including Mirant Americas Generation and Mirant North America (the “Mirant Settling Parties”) entered into a Settlement and Release of Claims Agreement (the “California Settlement”) with PG&E, Southern California Edison Company, San Diego Gas and Electric Company, the CPUC, the DWR, the EOB and the Attorney General of the State of California (collectively, the “California Parties”). The California Settlement was approved by the FERC on April 13, 2005, and became effective on April 15, 2005, upon its approval by the Bankruptcy Court. The California Settlement resulted in the release of most of Mirant Americas Energy Marketing’s potential liability (1) in the FERC Refund Proceedings for sales made in the CAISO or the Cal PX markets, (2) in the Pacific Northwest Proceeding, and (3) in any proceedings at the FERC resulting from the complaint filed in 2002 by the California Attorney General. Based on the California Settlement, on April 15, 2008, the FERC dismissed Mirant Americas Energy Marketing and the other subsidiaries of Mirant Americas Generation and Mirant North America from the proceeding initiated by the complaint filed in 2002 by the California Attorney General.
Under the California Settlement, the California Parties and those other market participants who have opted into the settlement have released the Mirant Settling Parties, including Mirant Americas Energy Marketing, from any liability for refunds related to sales of electricity and natural gas in the western markets from January 1, 1998, through July 14, 2003. Also, the California Parties have assumed the obligation of Mirant Americas Energy Marketing to pay any refunds determined by the FERC to be owed by Mirant Americas Energy Marketing to other parties that do not opt into the settlement for transactions in the CAISO and Cal PX markets during the Refund Period, with the liability of the California Parties for such refund obligation limited to the amount of certain receivables assigned by Mirant Americas Energy Marketing to the California Parties under the California Settlement. The settlement did not relieve Mirant Americas Energy Marketing of liability for any refunds that the FERC determines it to owe (1) to participants in the Cal PX and CAISO markets that did not opt into the settlement for periods outside the Refund Period and (2) to participants in bilateral transactions with Mirant Americas Energy Marketing that did not opt into the settlement.
Resolution of the refund proceedings that remain pending before the FERC or that currently are on appeal to the Ninth Circuit could ultimately result in the FERC concluding that the prices received by Mirant Americas
F-81
Table of Contents
Energy Marketing in some transactions occurring in 2000 and 2001 should be reduced. Mirant Americas Generation’s and Mirant North America’s view is that the bulk of any obligations of Mirant Americas Energy Marketing to make refunds as a result of sales completed prior to July 14, 2003, in the CAISO or Cal PX markets or in bilateral transactions either have been addressed by the California Settlement or have been resolved as part of Mirant Americas Energy Marketing’s bankruptcy proceedings. To the extent that Mirant Americas Energy Marketing’s potential refund liability arises from contracts that were transferred to Mirant Energy Trading as part of the transfer of the trading and marketing business under the Plan, Mirant Energy Trading may have exposure to any refund liability related to transactions under those contracts.
Complaint Challenging Capacity Rates Under the RPM Provisions of PJM’s Tariff
On May 30, 2008, a variety of parties, including the state public utility commissions of Maryland, Pennsylvania, New Jersey and Delaware, ratepayer advocates, certain electric cooperatives, various groups representing industrial electricity users, and federal agencies (the “RPM Buyers”), filed a complaint with the FERC asserting that capacity auctions held to determine capacity payments under the reliability pricing model (“RPM”) provisions of PJM’s tariff had produced rates that were unjust and unreasonable. PJM conducted the capacity auctions that are the subject of the complaint to set the capacity payments in effect under the RPM provisions of its tariff for twelve month periods beginning June 1, 2008, June 1, 2009, and June 1, 2010. The RPM Buyers allege that (i) the times between when the auctions were held and the periods that the resulting capacity rates would be in effect were too short to allow competition from new resources in the auctions, (ii) the administrative process established under the RPM provisions of PJM’s tariff was inadequate to restrain the exercise of market power by the withholding of capacity to increase prices, and (iii) the locational pricing established under the RPM provisions of PJM’s tariff created opportunities for sellers to raise prices while serving no legitimate function. The RPM Buyers asked the FERC to reduce significantly the capacity rates established by the capacity auctions and to set June 1, 2008, as the date beginning on which any rates found by the FERC to be excessive would be subject to refund. If the FERC were to reduce the capacity payments set through the capacity auctions to the rates proposed by the RPM Buyers, the capacity revenue the Companies have received or expect to receive for the period June 1, 2008 through May 31, 2011, would be reduced by approximately $600 million. On September 19, 2008, the FERC issued an order dismissing the complaint. The FERC found that no party had violated the RPM provisions of PJM’s tariff and that the prices determined during the auctions were in accordance with the tariff’s provisions. The RPM Buyers filed a request for rehearing, which the FERC denied on June 18, 2009. Certain of the RPM Buyers have appealed the orders entered by the FERC to the United States Court of Appeals for the Fourth Circuit. That appeal has been transferred to the United States Court of Appeal for the District of Columbia Circuit.
Other Legal Matters
The Companies are involved in various other claims and legal actions arising in the ordinary course of business. In the opinion of management, the ultimate disposition of these matters will not have a material adverse effect on the Companies’ results of operations, financial position or cash flows.
| 12. | Settlements and Other Charges (Mirant Americas Generation, Mirant North America and Mirant Mid-Atlantic) |
Pepco Litigation
In 2000, Mirant purchased power generating facilities and other assets from Pepco, including certain PPAs between Pepco and third parties. Under the terms of the APSA, Mirant and Pepco entered into the Back-to-Back Agreement with respect to certain PPAs, including Pepco’s long-term PPA with Panda-Brandywine, LP, under which (1) Pepco agreed to resell to Mirant all capacity, energy, ancillary services and other benefits to which it was entitled under those agreements and (2) Mirant agreed to pay Pepco each month
F-82
Table of Contents
all amounts due from Pepco to the sellers under those agreements for the immediately preceding month associated with such capacity, energy, ancillary services and other benefits. The Back-to-Back Agreement, which did not expire until 2021, obligated Mirant to purchase power from Pepco at prices that typically were higher than the market prices for power.
Mirant assigned its rights and obligations under the Back-to-Back Agreement to Mirant Americas Energy Marketing. In the Chapter 11 cases of the Mirant Debtors, Pepco asserted that an assignment and assumption agreement dated December 19, 2000 (the “Assignment and Assumption Agreement”), that included as parties Pepco, Mirant Mid-Atlantic and various of the Companies’ subsidiaries, caused Mirant Mid-Atlantic and the Companies’ subsidiaries that were parties to the agreement to be jointly and severally liable to Pepco for various obligations, including the obligations under the Back-to-Back Agreement. The Mirant Debtors sought to reject the APSA, the Back-to-Back Agreement, and the Assignment and Assumption Agreement. Under the Plan, the obligations of the Mirant Debtors under the APSA (including any other agreements executed pursuant to the terms of the APSA and found by a final court order to be part of the APSA), the Back-to-Back Agreement, and the Assignment and Assumption Agreement were performed after January 3, 2006, by Mirant Power Purchase, whose performance was guaranteed by Mirant, pending resolution of the rejection motions.
On May 30, 2006, Mirant and various of its subsidiaries, including Mirant Mid-Atlantic and subsidiaries of the Companies (collectively the “Mirant Settling Parties”) entered into the Settlement Agreement (the “Pepco Settlement Agreement”) with Pepco and various of its affiliates (collectively the “Pepco Settling Parties”).
The Pepco Settlement Agreement could not become effective until it had been approved by the Bankruptcy Court and that approval order had become a final order no longer subject to appeal. The Bankruptcy Court entered an order approving the Pepco Settlement Agreement on August 9, 2006. That order was appealed, but the appeal was dismissed by agreement of the parties in August 2007, and the Pepco Settlement Agreement became effective August 10, 2007. The Pepco Settlement Agreement fully resolved the contract rejection motions that remained pending in the bankruptcy proceedings, as well as other matters disputed between Pepco and Mirant and its subsidiaries. Under the Pepco Settlement Agreement, Mirant Power Purchase assumed the remaining obligations under the APSA, and Mirant has guaranteed its performance. The Back-to-Back Agreement was rejected and terminated effective as of May 31, 2006, and the Assignment and Assumption Agreement was also rejected.
With respect to the other agreements executed as part of the closing of the APSA (the “Ancillary Agreements”) and other agreements between Pepco and subsidiaries of Mirant, including Mirant Mid-Atlantic and subsidiaries of the Companies, the Mirant subsidiary that is a party to each agreement has assumed the agreement and Mirant has guaranteed that subsidiary’s performance. Mirant Power Purchase’s obligations under the APSA do not include any obligations related to the Ancillary Agreements. The Pepco Settlement Agreement provides that a future breach of the APSA or any Ancillary Agreement by a party to such agreement will not entitle the non-defaulting party to terminate, suspend performance under, or exercise any other right or remedy under or with respect to any of the remainder of such agreements. The Pepco Settlement Agreement granted Pepco a claim against Old Mirant in Old Mirant’s bankruptcy proceedings that was to result in Pepco receiving common stock of Mirant and cash having a value, after liquidation of the stock by Pepco, equal to $520 million. Shortly after the Pepco Settlement Agreement became effective, Mirant distributed approximately 14 million shares of Mirant common stock from the shares reserved for disputed claims under the Plan to Pepco to satisfy its claim. The Mirant shares in the share reserve, including the shares distributed to Pepco, have been treated as issued and outstanding since Mirant emerged from bankruptcy. Pepco’s liquidation of those shares resulted in net proceeds of approximately $522 million and Pepco paid Mirant the amount in excess of $520 million.
F-83
Table of Contents
New York Tax Proceedings (Mirant Americas Generation and Mirant North America)
Mirant New York, Mirant Bowline, Mirant Lovett and Hudson Valley Gas (collectively the “New York Companies”) were the petitioners in various proceedings (the “Tax Certiorari Proceedings”) brought in the New York state court challenging the assessed values determined by local taxing authorities for the Bowline and Lovett generating facilities and a natural gas pipeline (the “HVG Property”) owned by Hudson Valley Gas. Mirant Bowline had challenged the assessed value of the Bowline generating facility and the resulting local tax assessments for tax years 1995 through 2006. Mirant Bowline succeeded to rights held by Orange and Rockland for the tax years prior to its acquisition of the Bowline generating facility in 1999 under its agreement with Orange and Rockland for the purchase of that facility. Mirant Lovett had challenged the assessed value of the Lovett generating facility for each of the years 2000 through 2006. Hudson Valley Gas had challenged the assessed value of the HVG Property for each of the years 2004 through 2006. As of December 31, 2006, Mirant Bowline and Mirant Lovett had not paid property taxes on the Bowline and Lovett generating facilities that fell due in the period from September 30, 2003, through December 31, 2006, in order to preserve their respective rights to offset the overpayments of taxes made in earlier years against the sums payable on account of current taxes. Hudson Valley Gas had not paid property taxes that fell due in the period from September 30, 2004, through December 31, 2006.
On December 13, 2006, Mirant and the New York Companies entered into a settlement agreement (the “Tax Settlement Agreement”) with the Town of Haverstraw (“Haverstraw”), the Town of Stony Point (“Stony Point”), the Haverstraw-Stony Point Central School District (the “School District”), the County of Rockland (the “County”), the Village of Haverstraw (“Haverstraw Village”) and the Village of West Haverstraw (“West Haverstraw Village” and collectively with Haverstraw, Stony Point, the School District, the County and Haverstraw Village, the “Tax Jurisdictions”). The Tax Settlement Agreement was approved by the Bankruptcy Court on December 14, 2006, and resolved all pending disputes regarding real property taxes between the New York Companies and the Tax Jurisdictions. Under the agreement, the New York Companies received total refunds of $163 million from the Tax Jurisdictions and paid unpaid but accrued taxes to the Tax Jurisdictions of $115 million, resulting in the New York Companies receiving a net cash payment in the amount of $48 million. The refunds and unpaid taxes were paid in February 2007. The $163 million of total refunds received by the New York Companies was recognized as a gain in the financial statements in the fourth quarter of 2006. In addition, the New York Companies had previously accrued a liability based upon the unpaid taxes as billed by the Tax Jurisdictions. As a result of the reductions of the unpaid taxes that occurred pursuant to the terms of the Tax Settlement Agreement, the New York Companies also recognized in the fourth quarter of 2006 a reduction of operating expenses of approximately $23 million related to 2006 and a gain of approximately $71 million related to prior periods.
California Settlement (Mirant Americas Generation and Mirant North America)
The California Settlement described in Note 11 in California and Western Power Markets—FERC Refund Proceedings Arising Out of California Energy Crisis included a provision that either (1) the partially constructed Contra Costa 8 project, which was a planned 530 MW combined cycle generating facility, and related equipment (collectively, the “CC8 Assets”) were to be transferred to PG&E or (2) PG&E would receive additional alternative consideration of $70 million (the “CC8 Alternative Consideration”). To fund the CC8 Alternative Consideration, PG&E received an allowed, unsecured claim in the bankruptcy proceedings against Mirant Delta that resulted in a distribution to PG&E of cash and Mirant common stock with an aggregate value of approximately $70 million. PG&E was required to liquidate the common stock received as part of that distribution and place the net resulting amount plus any cash received into an escrow account.
The California Settlement provided that if the transfer of the CC8 Assets to PG&E did not occur on or before June 30, 2008, then the CC8 Alternative Consideration was to be paid to PG&E and the Mirant Settling
F-84
Table of Contents
Parties would retain the CC8 Assets. If PG&E closed on its acquisition of the CC8 Assets, the funds in the escrow account were to be paid to Mirant Delta. The transfer of the CC8 Assets to PG&E was completed on November 28, 2006, and the $70 million escrow account was paid to Mirant Delta. Mirant Americas Generation and Mirant North America recognized in the fourth quarter of 2006 a gain of $27 million for the amount by which the escrow account exceeded the carrying amount of the CC8 Assets. The gain was included in other income in Mirant Americas Generation’s and Mirant North America’s consolidated statements of operations.
Potomac River Settlement
In July 2008, the City of Alexandria, Virginia (in which the Potomac River generating facility is located) and Mirant Potomac River entered into an agreement containing certain terms that were included in a proposed comprehensive state operating permit for the Potomac River generating facility issued by the Virginia DEQ that month. Under that agreement, Mirant Potomac River committed to spend $34 million over several years to reduce particulate emissions. The $34 million was placed in escrow and included in funds on deposit and other noncurrent assets in the accompanying consolidated balance sheets. At December 31, 2009, the balance in the escrow account was approximately $33 million and is included in the Companies’ estimated capital expenditures. On July 30, 2008, the Virginia State Air Pollution Control Board approved the comprehensive permit with terms consistent with the agreement between Mirant Potomac and the City of Alexandria, and the Virginia DEQ issued the permit on July 31, 2008.
Prior to the issuance of the comprehensive state operating permit in July 2008, the Potomac River generating facility operated under a state operating permit issued June 1, 2007, that significantly restricted the facility’s operations by imposing stringent limits on its SO2 emissions and constraining unit operations so that no more than three of the facility’s five units could operate at one time. In compliance with the comprehensive permit, in 2008 Mirant Potomac River merged the stacks for units 3, 4 and 5 into one stack at the Potomac River generating facility and, in January 2009, Mirant Potomac River merged the stacks for units 1 and 2 into one stack. With the completion of the stack mergers, the permit issued in July 2008 does not constrain operations of the Potomac River generating facility below historical operations and allows operation of all five units at one time. In January 2010, the Virginia DEQ informed Mirant Potomac River that in light of the decision of the Virginia Court of Appeals vacating Virginia’s rules restricting trading in CAIR allowances, the Virginia DEQ has determined that issuing a state operating permit to limit NOx emissions during the Ozone Season is warranted.
Mirant Potrero Settlement Agreement with City of San Francisco (Mirant Americas Generation and Mirant North America)
Mirant Potrero and the City and County of San Francisco, California have entered into a Settlement Agreement (the “Potrero Settlement”) dated August 13, 2009. The Potrero Settlement became effective in November 2009 upon its approval by the City’s Board of Supervisors and Mayor. The Potrero Settlement addresses certain disputes that had arisen between the City of San Francisco and Mirant Potrero related to the Potrero generating facility. Among other things, the Potrero Settlement obligates Mirant Potrero to close permanently each of the remaining units of the Potrero generating facility at the end of the year in which the CAISO determines that such unit is no longer needed to maintain the reliable operation of the transmission system. The agreement also bars Mirant Potrero from building any additional generating facilities on the site of the Potrero generating facility. Mirant Potrero expects that the completion of the TransBay Cable project, which is an underwater electric transmission cable in the San Francisco Bay that is expected to become operational by mid-2010, will decrease the need for generating resources in the City of San Francisco. As a result, Mirant Potrero expects the CAISO to determine in 2010 that unit 3 of the Potrero generating facility is no longer needed for reliability purposes and that unit 3 will close by the end of 2010. By letter dated January 12, 2010, the CAISO advised the City of San Francisco that the expected replacement in 2010 of two underground transmission cables,
F-85
Table of Contents
if completed successfully, would allow the CAISO not to require the continued operation of the remaining units of the Potrero generating facility, units 4, 5 and 6, for reliability purposes after 2010. The CAISO will not determine which units of the Potrero generating facility are required to operate in 2011 for reliability purposes until the fall of 2010, but Mirant Potrero expects that none of the units of the Potrero generating facility will be required to operate for reliability purposes after 2010 and that all of the units will close by the end of 2010.
| 13. | Guarantor/Non-Guarantor Condensed Consolidating Financial Information (Mirant North America) |
Mirant North America’s revolving and term loan credit facilities and 7.375% senior notes are jointly and severally and fully and unconditionally guaranteed on a senior secured basis and senior unsecured basis, respectively, by certain subsidiaries of Mirant North America (all of which are wholly-owned). The accompanying condensed consolidating financial information has been prepared and presented pursuant to the Securities and Exchange Commission Regulation S-X Rule 3-10, “Financial Statements of Guarantors and Issuers of Guaranteed Securities Registered or being Registered.” This information is not intended to present the financial position, results of operations and cash flows of the individual companies or groups of companies in accordance with GAAP.
The condensed consolidating statement of operations for the year ended December 31, 2007, has been adjusted to include the equity earnings of subsidiaries to conform to the parent financial statements presentation which are included in Item 15. “Financial Statement Schedules.”
The condensed statements of cash flows for the years ended December 31, 2008 and 2007, have been revised to reflect the reclassification of capital contributions to subsidiaries from financing activities to investing activities. The amounts revised were approximately $250 million and $276 million for the years ended December 31, 2008 and 2007, respectively. The effect of these revisions was not considered to be material to the previously issued financial statements. The reclassification had no effect on Mirant North America’s cash and cash equivalents, net income or stockholders’ equity.
The following sets forth condensed consolidating financial statements of the guarantor and non-guarantor subsidiaries:
MIRANT NORTH AMERICA
GUARANTOR/NON-GUARANTOR
CONDENSED CONSOLIDATING STATEMENTS OF OPERATIONS
Year Ended December 31, 2009
(in millions)
| Parent | Guarantor | Non- Guarantor |
Eliminations | Consolidated | ||||||||||||||||
| Operating revenues |
$ | (3 | ) | $ | 473 | $ | 2,377 | $ | (538 | ) | $ | 2,309 | ||||||||
| Cost of fuel, electricity and other products |
— | 175 | 1,073 | (538 | ) | 710 | ||||||||||||||
| Gross margin |
(3 | ) | 298 | 1,304 | — | 1,599 | ||||||||||||||
| Operating Expenses: |
||||||||||||||||||||
| Operations and maintenance |
— | 201 | 444 | — | 645 | |||||||||||||||
| Depreciation and amortization |
— | 40 | 99 | 3 | 142 | |||||||||||||||
| Impairment loss |
(178 | ) | 14 | 385 | — | 221 | ||||||||||||||
| Gain on sales of assets, net |
(4 | ) | (5 | ) | (13 | ) | — | (22 | ) | |||||||||||
| Total operating expenses (income), net |
(182 | ) | 250 | 915 | 3 | 986 | ||||||||||||||
| Operating income (loss) |
179 | 48 | 389 | (3 | ) | 613 | ||||||||||||||
| Equity earnings of subsidiaries |
(501 | ) | — | — | 501 | — | ||||||||||||||
| Other expense (income), net |
83 | 3 | 3 | (73 | ) | 16 | ||||||||||||||
| Net income (loss) |
$ | 597 | $ | 45 | $ | 386 | $ | (431 | ) | $ | 597 | |||||||||
F-86
Table of Contents
MIRANT NORTH AMERICA
GUARANTOR/NON-GUARANTOR
CONDENSED CONSOLIDATING STATEMENTS OF OPERATIONS
Year Ended December 31, 2008
(in millions)
| Parent | Guarantor | Non- Guarantor |
Eliminations | Consolidated | ||||||||||||||||
| Operating revenues |
$ | 4 | $ | 802 | $ | 3,140 | $ | (758 | ) | $ | 3,188 | |||||||||
| Cost of fuel, electricity and other products |
(3 | ) | 496 | 1,324 | (758 | ) | 1,059 | |||||||||||||
| Gross margin |
7 | 306 | 1,816 | — | 2,129 | |||||||||||||||
| Operating Expenses: |
||||||||||||||||||||
| Operations and maintenance |
— | 235 | 422 | — | 657 | |||||||||||||||
| Depreciation and amortization |
— | 42 | 92 | 2 | 136 | |||||||||||||||
| Loss (gain) on sales of assets, net |
7 | (37 | ) | (8 | ) | — | (38 | ) | ||||||||||||
| Total operating expenses, net |
7 | 240 | 506 | 2 | 755 | |||||||||||||||
| Operating income (loss) |
— | 66 | 1,310 | (2 | ) | 1,374 | ||||||||||||||
| Equity earnings of subsidiaries |
(1,426 | ) | — | — | 1,426 | — | ||||||||||||||
| Other expense (income), net |
89 | — | (3 | ) | (49 | ) | 37 | |||||||||||||
| Net income (loss) |
$ | 1,337 | $ | 66 | $ | 1,313 | $ | (1,379 | ) | $ | 1,337 | |||||||||
MIRANT NORTH AMERICA
GUARANTOR/NON-GUARANTOR
CONDENSED CONSOLIDATING STATEMENTS OF OPERATIONS
Year Ended December 31, 2007
(in millions)
| Parent | Guarantor | Non- Guarantor |
Eliminations | Consolidated | ||||||||||||||||
| Operating revenues |
$ | — | $ | 841 | $ | 2,161 | $ | (961 | ) | $ | 2,041 | |||||||||
| Cost of fuel, electricity and other products |
(18 | ) | 469 | 1,549 | (961 | ) | 1,039 | |||||||||||||
| Gross margin |
18 | 372 | 612 | — | 1,002 | |||||||||||||||
| Operating Expenses: |
||||||||||||||||||||
| Operations and maintenance |
1 | 255 | 373 | — | 629 | |||||||||||||||
| Depreciation and amortization |
— | 39 | 81 | — | 120 | |||||||||||||||
| Impairment loss |
— | 175 | — | — | 175 | |||||||||||||||
| Loss (gain) on sales of assets, net |
11 | (51 | ) | 1 | — | (39 | ) | |||||||||||||
| Total operating expenses, net |
12 | 418 | 455 | — | 885 | |||||||||||||||
| Operating income (loss) |
6 | (46 | ) | 157 | — | 117 | ||||||||||||||
| Equity earnings of subsidiaries |
(183 | ) | 5 | — | 178 | — | ||||||||||||||
| Other expense (income), net |
102 | (13 | ) | (28 | ) | (24 | ) | 37 | ||||||||||||
| Reorganization items, net |
— | (2 | ) | — | — | (2 | ) | |||||||||||||
| Income (loss) from continuing operations |
87 | (36 | ) | 185 | (154 | ) | 82 | |||||||||||||
| Income (loss) from discontinued operations |
3 | 10 | (5 | ) | — | 8 | ||||||||||||||
| Net income (loss) |
$ | 90 | $ | (26 | ) | $ | 180 | $ | (154 | ) | $ | 90 | ||||||||
F-87
Table of Contents
MIRANT NORTH AMERICA
GUARANTOR/NON-GUARANTOR
CONDENSED CONSOLIDATING BALANCE SHEETS
At December 31, 2009
(in millions)
| Parent | Guarantor | Non- Guarantor |
Eliminations | Consolidated | |||||||||||||
| ASSETS |
|||||||||||||||||
| Current Assets: |
|||||||||||||||||
| Cash and cash equivalents |
$ | 78 | $ | — | $ | 325 | $ | — | $ | 403 | |||||||
| Funds on deposit |
124 | — | 56 | — | 180 | ||||||||||||
| Receivables—nonaffiliate |
— | 8 | 393 | — | 401 | ||||||||||||
| Receivables—affiliate |
— | 53 | 23 | (67 | ) | 9 | |||||||||||
| Notes receivable—affiliate |
25 | 105 | — | (37 | ) | 93 | |||||||||||
| Derivative contract assets—nonaffiliate |
— | — | 1,416 | — | 1,416 | ||||||||||||
| Derivative contract assets—affiliate |
— | 45 | 26 | (71 | ) | — | |||||||||||
| Inventories |
— | 31 | 210 | — | 241 | ||||||||||||
| Prepaid rent and other payments |
— | 12 | 122 | — | 134 | ||||||||||||
| Total current assets |
227 | 254 | 2,571 | (175 | ) | 2,877 | |||||||||||
| Property, Plant and Equipment, net |
— | 454 | 3,005 | 145 | 3,604 | ||||||||||||
| Noncurrent Assets: |
|||||||||||||||||
| Goodwill, net |
(616 | ) | — | 616 | — | — | |||||||||||
| Intangible assets, net |
— | 33 | 138 | — | 171 | ||||||||||||
| Derivative contract assets—nonaffiliate |
— | — | 599 | — | 599 | ||||||||||||
| Derivative contract assets—affiliate |
— | 7 | 2 | (9 | ) | — | |||||||||||
| Prepaid rent |
— | — | 304 | — | 304 | ||||||||||||
| Debt issuance costs, net |
23 | — | — | — | 23 | ||||||||||||
| Investments in subsidiaries |
5,933 | — | — | (5,933 | ) | — | |||||||||||
| Other |
— | 12 | 20 | — | 32 | ||||||||||||
| Total noncurrent assets |
5,340 | 52 | 1,679 | (5,942 | ) | 1,129 | |||||||||||
| Total Assets |
$ | 5,567 | $ | 760 | $ | 7,255 | $ | (5,972 | ) | $ | 7,610 | ||||||
| LIABILITIES AND MEMBER’S EQUITY |
|||||||||||||||||
| Current Liabilities: |
|||||||||||||||||
| Current portion of long-term debt |
$ | 70 | $ | — | $ | 4 | $ | — | $ | 74 | |||||||
| Notes payable—affiliate |
14 | 23 | — | (37 | ) | — | |||||||||||
| Accounts payable and accrued liabilities |
1 | 22 | 598 | — | 621 | ||||||||||||
| Payable to affiliate |
— | 35 | 74 | (67 | ) | 42 | |||||||||||
| Derivative contract liabilities—nonaffiliate |
— | — | 1,150 | — | 1,150 | ||||||||||||
| Derivative contract liabilities—affiliate |
— | 26 | 45 | (71 | ) | — | |||||||||||
| Other |
— | 5 | 3 | — | 8 | ||||||||||||
| Total current liabilities |
85 | 111 | 1,874 | (175 | ) | 1,895 | |||||||||||
| Noncurrent Liabilities: |
|||||||||||||||||
| Long-term debt, net of current portion |
1,153 | — | 21 | — | 1,174 | ||||||||||||
| Derivative contract liabilities—nonaffiliate |
— | — | 163 | — | 163 | ||||||||||||
| Derivative contract liabilities—affiliate |
— | 2 | 7 | (9 | ) | — | |||||||||||
| Other |
— | 32 | 17 | — | 49 | ||||||||||||
| Total noncurrent liabilities |
1,153 | 34 | 208 | (9 | ) | 1,386 | |||||||||||
| Commitments and Contingencies |
|||||||||||||||||
| Member’s Equity |
4,329 | 615 | 5,173 | (5,788 | ) | 4,329 | |||||||||||
| Total Liabilities and Member’s Equity |
$ | 5,567 | $ | 760 | $ | 7,255 | $ | (5,972 | ) | $ | 7,610 | ||||||
F-88
Table of Contents
MIRANT NORTH AMERICA
GUARANTOR/NON-GUARANTOR
CONDENSED CONSOLIDATING BALANCE SHEETS
At December 31, 2008
(in millions)
| Parent | Guarantor | Non- Guarantor |
Eliminations | Consolidated | |||||||||||||
| ASSETS |
|||||||||||||||||
| Current Assets: |
|||||||||||||||||
| Cash and cash equivalents |
$ | 101 | $ | — | $ | 253 | $ | — | $ | 354 | |||||||
| Funds on deposit |
123 | — | 73 | — | 196 | ||||||||||||
| Receivables—nonaffiliate |
— | 4 | 738 | — | 742 | ||||||||||||
| Receivables—affiliate |
— | 111 | 76 | (177 | ) | 10 | |||||||||||
| Notes receivable—affiliate |
10 | 109 | — | (26 | ) | 93 | |||||||||||
| Derivative contract assets—nonaffiliate |
— | — | 2,582 | — | 2,582 | ||||||||||||
| Derivative contract assets—affiliate |
— | 92 | 86 | (178 | ) | — | |||||||||||
| Inventories |
(2 | ) | 30 | 210 | — | 238 | |||||||||||
| Prepaid rent and other payments |
— | 13 | 107 | — | 120 | ||||||||||||
| Total current assets |
232 | 359 | 4,125 | (381 | ) | 4,335 | |||||||||||
| Property, Plant and Equipment, net |
— | 483 | 2,626 | 80 | 3,189 | ||||||||||||
| Noncurrent Assets: |
|||||||||||||||||
| Goodwill, net |
(799 | ) | — | 799 | — | — | |||||||||||
| Intangible assets, net |
— | 51 | 144 | — | 195 | ||||||||||||
| Derivative contract assets—nonaffiliate |
— | — | 585 | — | 585 | ||||||||||||
| Derivative contract assets—affiliate |
— | 2 | — | (2 | ) | — | |||||||||||
| Prepaid rent |
— | — | 258 | — | 258 | ||||||||||||
| Debt issuance costs, net |
32 | — | — | — | 32 | ||||||||||||
| Investments in subsidiaries |
5,700 | — | — | (5,700 | ) | — | |||||||||||
| Other |
— | 19 | 32 | — | 51 | ||||||||||||
| Total noncurrent assets |
4,933 | 72 | 1,818 | (5,702 | ) | 1,121 | |||||||||||
| Total Assets |
$ | 5,165 | $ | 914 | $ | 8,569 | $ | (6,003 | ) | $ | 8,645 | ||||||
| LIABILITIES AND MEMBER’S EQUITY |
|||||||||||||||||
| Current Liabilities: |
|||||||||||||||||
| Current portion of long-term debt |
$ | 42 | $ | — | $ | 3 | $ | — | $ | 45 | |||||||
| Notes payable—affiliate |
17 | 9 | — | (26 | ) | — | |||||||||||
| Accounts payable and accrued liabilities |
— | 24 | 765 | — | 789 | ||||||||||||
| Payable to affiliate |
— | 85 | 126 | (177 | ) | 34 | |||||||||||
| Derivative contract liabilities—nonaffiliate |
— | — | 2,268 | — | 2,268 | ||||||||||||
| Derivative contract liabilities—affiliate |
— | 86 | 92 | (178 | ) | — | |||||||||||
| Other |
— | 13 | 9 | — | 22 | ||||||||||||
| Total current liabilities |
59 | 217 | 3,263 | (381 | ) | 3,158 | |||||||||||
| Noncurrent Liabilities: |
|||||||||||||||||
| Long-term debt, net of current portion |
1,223 | — | 25 | — | 1,248 | ||||||||||||
| Derivative contract liabilities—nonaffiliate |
— | — | 244 | — | 244 | ||||||||||||
| Derivative contract liabilities—affiliate |
— | — | 2 | (2 | ) | — | |||||||||||
| Other |
— | 30 | 82 | — | 112 | ||||||||||||
| Total noncurrent liabilities |
1,223 | 30 | 353 | (2 | ) | 1,604 | |||||||||||
| Commitments and Contingencies |
|||||||||||||||||
| Member’s Equity |
3,883 | 667 | 4,953 | (5,620 | ) | 3,883 | |||||||||||
| Total Liabilities and Member’s Equity |
$ | 5,165 | $ | 914 | $ | 8,569 | $ | (6,003 | ) | $ | 8,645 | ||||||
F-89
Table of Contents
MIRANT NORTH AMERICA
GUARANTOR/NON-GUARANTOR
CONDENSED CONSOLIDATING STATEMENT OF CASH FLOWS
Year Ended December 31, 2009
(in millions)
| Parent | Guarantor | Non- Guarantor |
Eliminations | Consolidated | ||||||||||||||||
| Cash Flows provided by (used in): |
||||||||||||||||||||
| Operating activities |
$ | 241 | $ | 81 | $ | 806 | $ | (243 | ) | $ | 885 | |||||||||
| Investing activities |
(94 | ) | (109 | ) | (565 | ) | 128 | (640 | ) | |||||||||||
| Financing activities |
(170 | ) | 28 | (169 | ) | 115 | (196 | ) | ||||||||||||
| Net increase (decrease) in cash and cash equivalents |
(23 | ) | — | 72 | — | 49 | ||||||||||||||
| Cash and cash equivalents, beginning of year |
101 | — | 253 | — | 354 | |||||||||||||||
| Cash and cash equivalents, end of year |
$ | 78 | $ | — | $ | 325 | $ | — | $ | 403 | ||||||||||
MIRANT NORTH AMERICA
GUARANTOR/NON-GUARANTOR
CONDENSED CONSOLIDATING STATEMENT OF CASH FLOWS
Year Ended December 31, 2008
(in millions)
| Parent | Guarantor | Non- Guarantor |
Eliminations | Consolidated | ||||||||||||||||
| Cash Flows provided by (used in): |
||||||||||||||||||||
| Operating activities |
$ | 586 | $ | 130 | $ | 702 | $ | (519 | ) | $ | 899 | |||||||||
| Investing activities |
(316 | ) | (144 | ) | (649 | ) | 413 | (696 | ) | |||||||||||
| Financing activities |
(393 | ) | 14 | (273 | ) | 106 | (546 | ) | ||||||||||||
| Net decrease in cash and cash equivalents |
(123 | ) | — | (220 | ) | — | (343 | ) | ||||||||||||
| Cash and cash equivalents, beginning of year |
224 | — | 473 | — | 697 | |||||||||||||||
| Cash and cash equivalents, end of year |
$ | 101 | $ | — | $ | 253 | $ | — | $ | 354 | ||||||||||
F-90
Table of Contents
MIRANT NORTH AMERICA
GUARANTOR/NON-GUARANTOR
CONDENSED CONSOLIDATING STATEMENT OF CASH FLOWS
Year Ended December 31, 2007
(in millions)
| Parent | Guarantor | Non- Guarantor |
Eliminations | Consolidated | ||||||||||||||||
| Cash Flows provided by (used in): |
||||||||||||||||||||
| Operating activities |
$ | 338 | $ | 221 | $ | 727 | $ | (472 | ) | $ | 814 | |||||||||
| Investing activities |
167 | (306 | ) | (528 | ) | 641 | (26 | ) | ||||||||||||
| Financing activities |
(512 | ) | (13 | ) | (150 | ) | (169 | ) | (844 | ) | ||||||||||
| Net increase (decrease) in cash and cash equivalents |
(7 | ) | (98 | ) | 49 | — | (56 | ) | ||||||||||||
| Cash and cash equivalents, beginning of year |
231 | 98 | 421 | — | 750 | |||||||||||||||
| Plus: Cash and Cash Equivalents in Assets Held for Sale, beginning of year |
— | — | 3 | — | 3 | |||||||||||||||
| Cash and cash equivalents, end of year |
$ | 224 | $ | — | $ | 473 | $ | — | $ | 697 | ||||||||||
F-91
Table of Contents
Report of Independent Registered Public Accounting Firm
The Member
Mirant Americas Generation, LLC:
We have audited and reported separately herein on the consolidated financial statements of Mirant Americas Generation, LLC (a wholly-owned indirect subsidiary of Mirant Corporation) and subsidiaries (the “Company”) as of December 31, 2009 and 2008, and the related consolidated statements of operations, equity and cash flows for each of the years in the three-year period ended December 31, 2009. In connection with our audits of the aforementioned consolidated financial statements, we also audited the related financial statement schedules as listed within Item 15. These financial statement schedules are the responsibility of the Company’s management. Our responsibility is to express an opinion on these financial statement schedules based on our audits.
In our opinion, such financial statement schedules, when considered in relation to the basic consolidated financial statements taken as a whole, present fairly, in all material respects, the information set forth therein.
As discussed in Note 1 to the consolidated financial statements, the Company adopted accounting guidance related to the recognition and disclosure provisions for fair value measurements for financial instruments and nonfinancial assets and liabilities recognized or disclosed at fair value in the financial statements on a recurring basis, in 2008. In 2009, the Company adopted accounting guidance that extended these aforementioned recognition and disclosure provisions to nonfinancial assets and liabilities measured at fair value on a nonrecurring basis.
/s/ KPMG LLP
Atlanta, Georgia
February 26, 2010
F-92
Table of Contents
Report of Independent Registered Public Accounting Firm
The Member
Mirant North America, LLC:
We have audited and reported separately herein on the consolidated financial statements of Mirant North America, LLC (a wholly-owned indirect subsidiary of Mirant Corporation) and subsidiaries (the “Company”) as of December 31, 2009 and 2008, and the related consolidated statements of operations, equity and cash flows for each of the years in the three-year period ended December 31, 2009. In connection with our audits of the aforementioned consolidated financial statements, we also audited the related financial statement schedules as listed within Item 15. These financial statement schedules are the responsibility of the Company’s management. Our responsibility is to express an opinion on these financial statement schedules based on our audits.
In our opinion, such financial statement schedules, when considered in relation to the basic consolidated financial statements taken as a whole, present fairly, in all material respects, the information set forth therein.
As discussed in Note 1 to the consolidated financial statements, the Company adopted accounting guidance related to the recognition and disclosure provisions for fair value measurements for financial instruments and nonfinancial assets and liabilities recognized or disclosed at fair value in the financial statements on a recurring basis, in 2008. In 2009, the Company adopted accounting guidance that extended these aforementioned recognition and disclosure provisions to nonfinancial assets and liabilities measured at fair value on a nonrecurring basis.
/s/ KPMG LLP
Atlanta, Georgia
February 26, 2010
F-93
Table of Contents
Report of Independent Registered Public Accounting Firm
The Member
Mirant Mid-Atlantic, LLC:
We have audited and reported separately herein on the consolidated financial statements of Mirant Mid-Atlantic, LLC (a wholly-owned indirect subsidiary of Mirant Corporation) and subsidiaries (the “Company”) as of December 31, 2009 and 2008, and the related consolidated statements of operations, equity and cash flows for each of the years in the three-year period ended December 31, 2009. In connection with our audits of the aforementioned consolidated financial statements, we also audited the related financial statement schedule as listed within Item 15. This financial statement schedule is the responsibility of the Company’s management. Our responsibility is to express an opinion on this financial statement schedule based on our audits.
In our opinion, this financial statement schedule, when considered in relation to the basic consolidated financial statements taken as a whole, presents fairly, in all material respects, the information set forth therein.
As discussed in Note 1 to the consolidated financial statements, the Company adopted accounting guidance related to the recognition and disclosure provisions for fair value measurements for financial instruments and nonfinancial assets and liabilities recognized or disclosed at fair value in the financial statements on a recurring basis, in 2008. In 2009, the Company adopted accounting guidance that extended these aforementioned recognition and disclosure provisions to nonfinancial assets and liabilities measured at fair value on a nonrecurring basis.
/s/ KPMG LLP
Atlanta, Georgia
February 26, 2010
F-94
Table of Contents
MIRANT AMERICAS GENERATION, LLC (PARENT)
CONDENSED FINANCIAL INFORMATION OF REGISTRANT
CONDENSED STATEMENTS OF OPERATIONS
| For the Years Ended December 31, | ||||||||||||
| 2009 | 2008 | 2007 | ||||||||||
| (in millions) | ||||||||||||
| Operating income |
$ | — | $ | — | $ | — | ||||||
| Other Expense (Income), net: |
||||||||||||
| Equity earnings of subsidiary |
(597 | ) | (1,337 | ) | (90 | ) | ||||||
| Interest expense-nonaffiliate |
121 | 134 | 147 | |||||||||
| Interest expense-affiliate |
— | 2 | 5 | |||||||||
| Interest income-affiliate |
— | — | (1 | ) | ||||||||
| Other, net |
— | 3 | (1 | ) | ||||||||
| Total other expense (income), net |
(476 | ) | (1,198 | ) | 60 | |||||||
| Net income (loss) |
$ | 476 | $ | 1,198 | $ | (60 | ) | |||||
The accompanying combined notes are an integral part of these consolidated financial information.
F-95
Table of Contents
MIRANT AMERICAS GENERATION, LLC (PARENT)
CONDENSED FINANCIAL INFORMATION OF REGISTRANT
CONDENSED BALANCE SHEETS
| At December 31, | ||||||||
| 2009 | 2008 | |||||||
| (in millions) | ||||||||
| ASSETS |
||||||||
| Current Assets: |
||||||||
| Cash and cash equivalents |
$ | 1 | $ | — | ||||
| Notes receivables-affiliate |
— | — | ||||||
| Total current assets |
1 | — | ||||||
| Noncurrent Assets: |
||||||||
| Investments in subsidiary |
4,331 | 3,885 | ||||||
| Debt issuance costs, net |
6 | 7 | ||||||
| Total noncurrent assets |
4,337 | 3,892 | ||||||
| Total Assets |
$ | 4,338 | $ | 3,892 | ||||
| LIABILITIES AND MEMBER’S EQUITY |
||||||||
| Current Liabilities: |
||||||||
| Accounts payable and accrued liabilities |
$ | 25 | $ | 24 | ||||
| Payable to affiliates |
102 | 102 | ||||||
| Total current liabilities |
127 | 126 | ||||||
| Noncurrent Liabilities: |
||||||||
| Long-term debt |
1,382 | 1,382 | ||||||
| Total noncurrent liabilities |
1,382 | 1,382 | ||||||
| Commitments and Contingencies |
||||||||
| Member’s Equity: |
||||||||
| Member’s interest |
3,109 | 2,729 | ||||||
| Preferred stock in affiliate |
(280 | ) | (345 | ) | ||||
| Total member’s equity |
2,829 | 2,384 | ||||||
| Total Liabilities and Member’s Equity |
$ | 4,338 | $ | 3,892 | ||||
The accompanying combined notes are an integral part of the registrant’s condensed financial information.
F-96
Table of Contents
MIRANT AMERICAS GENERATION, LLC (PARENT)
CONDENSED FINANCIAL INFORMATION OF REGISTRANT
CONDENSED STATEMENTS OF CASH FLOWS
| For the Years Ended December 31, |
||||||||||||
| 2009 | 2008 | 2007 | ||||||||||
| (in millions) | ||||||||||||
| Cash Flows from Operating Activities: |
||||||||||||
| Net income (loss) |
$ | 476 | $ | 1,198 | $ | (60 | ) | |||||
| Adjustments to reconcile net income (loss) to net cash provided by operating activities: |
||||||||||||
| Equity earnings of subsidiary |
(597 | ) | (1,337 | ) | (90 | ) | ||||||
| Cash dividends received from subsidiary |
235 | 414 | 715 | |||||||||
| Other, net |
2 | 1 | (30 | ) | ||||||||
| Total adjustments |
(360 | ) | (922 | ) | 595 | |||||||
| Net cash provided by operating activities |
116 | 276 | 535 | |||||||||
| Cash Flows from Investing Activities: |
||||||||||||
| Repayment of notes receivables-affiliate |
— | 14 | — | |||||||||
| Net cash provided by investing activities |
— | 14 | — | |||||||||
| Cash Flows from Financing Activities: |
||||||||||||
| Purchases of long-term debt—nonaffiliate |
— | (276 | ) | (39 | ) | |||||||
| Capital contributions from member |
— | 282 | 39 | |||||||||
| Distributions to member |
(115 | ) | (297 | ) | (534 | ) | ||||||
| Net cash used in financing activities |
(115 | ) | (291 | ) | (534 | ) | ||||||
| Net Increase (Decrease) in Cash and Cash Equivalents |
1 | (1 | ) | 1 | ||||||||
| Cash and Cash Equivalents, beginning of year |
— | 1 | — | |||||||||
| Cash and Cash Equivalents, end of year |
$ | 1 | $ | — | $ | 1 | ||||||
The accompanying combined notes are an integral part of the registrant’s condensed financial information.
F-97
Table of Contents
MIRANT NORTH AMERICA, LLC (PARENT)
CONDENSED FINANCIAL INFORMATION OF REGISTRANT
CONDENSED STATEMENTS OF OPERATIONS
| For the Years Ended December 31, | ||||||||||||
| 2009 | 2008 | 2007 | ||||||||||
| (in millions) | ||||||||||||
| Operating income |
$ | 179 | $ | — | $ | 6 | ||||||
| Other Expense (Income), net: |
||||||||||||
| Equity earnings of subsidiaries |
(501 | ) | (1,426 | ) | (183 | ) | ||||||
| Interest expense-nonaffiliate |
84 | 97 | 116 | |||||||||
| Interest expense-affiliate |
— | 1 | 18 | |||||||||
| Interest income-nonaffiliate |
(1 | ) | (8 | ) | (31 | ) | ||||||
| Interest income-affiliate |
— | (1 | ) | (1 | ) | |||||||
| Total other income, net |
(418 | ) | (1,337 | ) | (81 | ) | ||||||
| Income from continuing operations |
597 | 1,337 | 87 | |||||||||
| Income from discontinued operations, net |
— | — | 3 | |||||||||
| Net income |
$ | 597 | $ | 1,337 | $ | 90 | ||||||
The accompanying combined notes are an integral part of the registrant’s condensed financial information.
F-98
Table of Contents
MIRANT NORTH AMERICA, LLC (PARENT)
CONDENSED FINANCIAL INFORMATION OF REGISTRANT
CONDENSED BALANCE SHEETS
| At December 31, | ||||||||
| 2009 | 2008 | |||||||
| (in millions) | ||||||||
| ASSETS |
||||||||
| Current Assets: |
||||||||
| Cash and cash equivalents |
$ | 78 | $ | 101 | ||||
| Funds on deposit |
124 | 123 | ||||||
| Other |
25 | 8 | ||||||
| Total current assets |
227 | 232 | ||||||
| Noncurrent Assets: |
||||||||
| Goodwill, net of accumulated amortization |
(616 | ) | (799 | ) | ||||
| Investments in subsidiaries |
5,933 | 5,700 | ||||||
| Debt issuance costs, net |
23 | 32 | ||||||
| Total noncurrent assets |
5,340 | 4,933 | ||||||
| Total Assets |
$ | 5,567 | $ | 5,165 | ||||
| LIABILITIES AND MEMBER’S EQUITY |
||||||||
| Current Liabilities: |
||||||||
| Current portion of long-term debt |
$ | 70 | $ | 42 | ||||
| Payable to affiliate |
14 | 17 | ||||||
| Other |
1 | — | ||||||
| Total current liabilities |
85 | 59 | ||||||
| Noncurrent Liabilities: |
||||||||
| Long-term debt |
1,153 | 1,223 | ||||||
| Total noncurrent liabilities |
1,153 | 1,223 | ||||||
| Commitments and Contingencies |
||||||||
| Member’s Equity: |
||||||||
| Member’s interest |
4,467 | 4,094 | ||||||
| Preferred stock in affiliate |
(138 | ) | (211 | ) | ||||
| Total member’s equity |
4,329 | 3,883 | ||||||
| Total Liabilities and Member’s Equity |
$ | 5,567 | $ | 5,165 | ||||
The accompanying combined notes are an integral part of the registrant’s condensed financial information.
F-99
Table of Contents
MIRANT NORTH AMERICA, LLC (PARENT)
CONDENSED FINANCIAL INFORMATION OF REGISTRANT
CONDENSED STATEMENTS OF CASH FLOWS
| For the Years Ended December 31, |
||||||||||||
| 2009 | 2008 | 2007 | ||||||||||
| (in millions) | ||||||||||||
| Cash Flows from Operating Activities: |
||||||||||||
| Net income |
$ | 597 | $ | 1,337 | $ | 90 | ||||||
| Income from discontinued operations |
— | — | 3 | |||||||||
| Income from continuing operations |
597 | 1,337 | 87 | |||||||||
| Adjustments to reconcile net income from continuing operations to net cash provided by operating activities: |
||||||||||||
| Equity earnings of subsidiaries |
(501 | ) | (1,426 | ) | (183 | ) | ||||||
| Cash dividends received from subsidiaries |
250 | 550 | 434 | |||||||||
| Other, net |
(105 | ) | 125 | — | ||||||||
| Total adjustments |
(356 | ) | (751 | ) | 251 | |||||||
| Net cash provided by operating activities |
241 | 586 | 338 | |||||||||
| Cash Flows from Investing Activities: |
||||||||||||
| Capitalized interest |
(68 | ) | (48 | ) | (28 | ) | ||||||
| Repayments (issuance) of notes receivable-affiliate |
(28 | ) | (28 | ) | (20 | ) | ||||||
| Capital contributions to subsidiaries |
— | (250 | ) | (276 | ) | |||||||
| Other, net |
2 | 10 | (12 | ) | ||||||||
| Net cash used in investing activities of continuing operations |
(94 | ) | (316 | ) | (336 | ) | ||||||
| Net cash provided by investing activities of discontinued operations |
— | — | 503 | |||||||||
| Net cash provided by (used in) investing activities |
(94 | ) | (316 | ) | 167 | |||||||
| Cash Flows from Financing Activities: |
||||||||||||
| Repayments of long-term debt—nonaffiliate |
(42 | ) | (140 | ) | (138 | ) | ||||||
| Proceeds from issuance of debt—affiliate |
107 | 161 | 341 | |||||||||
| Settlement of member’s obligations pursuant to the Plan |
— | — | (20 | ) | ||||||||
| Distributions to member |
(235 | ) | (414 | ) | (695 | ) | ||||||
| Net cash used in financing activities |
(170 | ) | (393 | ) | (512 | ) | ||||||
| Net Decrease in Cash and Cash Equivalents |
(23 | ) | (123 | ) | (7 | ) | ||||||
| Cash and Cash Equivalents, beginning of year |
101 | 224 | 231 | |||||||||
| Cash and Cash Equivalents, end of year |
$ | 78 | $ | 101 | $ | 224 | ||||||
The accompanying combined notes are an integral part of the registrant’s condensed financial information.
F-100
Table of Contents
MIRANT AMERICAS GENERATION, LLC (PARENT)
MIRANT NORTH AMERICA, LLC (PARENT)
CONDENSED FINANCIAL INFORMATION OF REGISTRANT
NOTES TO REGISTRANTS’ CONDENSED FINANCIAL STATEMENTS
| 1. | Background and Basis of Presentation |
The condensed parent companies financial statements have been prepared in accordance with Rule 12-04, Schedule I of Regulation S-X, as the restricted net assets of Mirant Americas Generation, LLC’s and Mirant North America, LLC’s subsidiaries exceed 25 percent of the consolidated net assets of Mirant Americas Generation, LLC’s and Mirant North America, LLC’s. These statements should be read in conjunction with the consolidated statements and notes thereto of Mirant Americas Generation and Mirant North America.
Mirant Americas Generation, LLC and Mirant North America, LLC are Delaware limited liability companies and indirect wholly-owned subsidiaries of Mirant Corporation. Mirant North America, LLC is a wholly-owned subsidiary of Mirant Americas Generation, LLC.
Equity earnings of subsidiaries consists of earnings of direct subsidiaries of Mirant Americas Generation, LLC (parent) and Mirant North America, LLC (parent), which includes earnings of subsidiaries whose operations were classified as discontinued operations in the consolidated financial statements of Mirant Americas Generation, LLC and Mirant North America, LLC.
Income from discontinued operations, net includes discontinued operations activity for only Mirant North America, LLC (parent), which is primarily related to adjustments to the carrying value of the parent’s investments in subsidiaries classified as held for sale.
Mirant North America condensed statements of cash flows for the years ended December 31, 2008 and 2007, have been revised to reflect the reclassification of capital contributions to subsidiaries from financing activities to investing activities. The amounts revised were approximately $250 million and $276 million for the years ended December 31, 2008 and 2007, respectively. The effect of these revisions was not considered to be material to the previously issued financial statements. The reclassification had no effect on Mirant North America’s cash and cash equivalents, net income or stockholders’ equity.
In addition, certain prior period amounts have been reclassified to conform to the current period financial statement presentation.
| 2. | Commitments and Contingencies |
As of December 31, 2009, Mirant Americas Generation, LLC (parent) did not have any guarantees and Mirant North America, LLC (parent) had $366 million of guarantees which are included in Note 7—Commitments and Contingencies—Guarantees.
See Note 11 for a detailed discussion of Mirant Americas Generation, LLC’s and Mirant North America, LLC’s contingencies.
F-101
Table of Contents
VALUATION AND QUALIFYING ACCOUNTS
Mirant Americas Generation and Mirant North America
| At December 31, 2009, 2008 and 2007 | |||||||||||||||||
| Description |
Balance at Beginning of Period |
Additions | Deductions1 | Balance at End of Period | |||||||||||||
| Charged to Income |
Charged to Other Accounts |
||||||||||||||||
| (in millions) | |||||||||||||||||
| Provision for uncollectible accounts (current) |
|||||||||||||||||
| 2009 |
$ | 12 | $ | 9 | $ | — | $ | (18 | ) | $ | 3 | ||||||
| 2008 |
8 | 5 | — | (1 | ) | 12 | |||||||||||
| 2007 |
10 | (1 | ) | — | (1 | ) | 8 | ||||||||||
| Provision for uncollectible accounts (noncurrent) |
|||||||||||||||||
| 2009 |
$ | 42 | $ | 13 | $ | — | $ | (44 | ) | $ | 11 | ||||||
| 2008 |
1 | 41 | — | — | 42 | ||||||||||||
| 2007 |
1 | — | — | — | 1 | ||||||||||||
Schedule II
Mirant Mid-Atlantic
| At December 31, 2009, 2008 and 2007 | |||||||||||||||||
| Description |
Balance at Beginning of Period |
Additions | Deductions1 | Balance at End of Period | |||||||||||||
| Charged to Income |
Charged to Other Accounts |
||||||||||||||||
| (in millions) | |||||||||||||||||
| Provision for uncollectible accounts (current) |
|||||||||||||||||
| 2009 |
$ | 9 | $ | 8 | $ | — | $ | (15 | ) | $ | 2 | ||||||
| 2008 |
2 | 7 | — | — | 9 | ||||||||||||
| 2007 |
4 | (2 | ) | — | — | 2 | |||||||||||
| Provision for uncollectible accounts (noncurrent) |
|||||||||||||||||
| 2009 |
$ | 42 | $ | 13 | $ | — | $ | (44 | ) | $ | 11 | ||||||
| 2008 |
1 | 42 | — | (1 | ) | 42 | |||||||||||
| 2007 |
1 | — | — | — | 1 | ||||||||||||
| 1 | Deductions in 2009 consist primarily of reversals of credit reserves for derivative contract assets. Deductions in 2008 and 2007 consist primarily of reductions in or write-offs of allowances for uncollectible accounts and notes receivable. |
F-102
Table of Contents
| 3. | Exhibit Index |
Mirant Americas Generation
| Exhibit No. |
Exhibit Name | |
| 1.1 | Purchase Agreement, dated as of October 2, 2001, among Mirant Americas Generation, Inc. (the “Company”) and Salomon Smith Barney Inc., Banc of America Securities LLC, Blaylock & Partners, L.P., Scotia Capital (USA) Inc., TD Securities (USA) Inc. and Tokyo-Mitsubishi International plc as “Initial Purchasers” (Incorporated herein by reference to Exhibit 1.1 to Registrant’s Registration Statement on Form S-4/A Amendment No. 1, Registration No. 333-85124) | |
| 2.1 | Purchase and Sale Agreement, dated as of January 15, 2007, by and between Mirant Americas, Inc. and LS Power (Incorporated herein by reference to Exhibit 2.1 to Registrant’s Current Report on Form 8-K filed January 18, 2007) | |
| 3.1 | Certificate of Formation for Mirant Americas Generation, LLC, filed with the Delaware Secretary of State on November 1, 2001 (Incorporated herein by reference to Exhibit 3.1 to Registrant’s Form 10-Q filed November 9, 2001) | |
| 3.2 | Amended and Restated Limited Liability Company Agreement for Mirant Americas Generation, LLC dated January 3, 2006 (Incorporated herein by reference to Exhibit 3.2 to Registrant’s Form 10-Q filed November 13, 2006) | |
| 4.1 | Indenture between the Company and Bankers Trust Company, as Trustee, relating to the Notes (Incorporated herein by reference to Exhibit 4.1 to Registrant’s Registration Statement on Form S-4, Registration No. 333-63240) | |
| 4.2 | First Supplemental Indenture (Incorporated herein by reference to Exhibit 4.2 to Registrant’s Registration Statement on Form S-4, Registration No. 333-63240) | |
| 4.3 | Second Supplemental Indenture (Incorporated herein by reference to Exhibit 4.3 to Registrant’s Registration Statement on Form S-4, Registration No. 333-63240) | |
| 4.4 | Third Supplemental Indenture (Incorporated herein by reference to Exhibit 4.4 to Registrant’s Registration Statement on Form S-4, Registration No. 333-63240) | |
| 4.5 | Form of Notes (included in Exhibits 4.2, 4.3, and 4.4) (Incorporated herein by reference to Exhibit 4.5 to Registrant’s Registration Statement on Form S-4, Registration No. 333-63240) | |
| 4.6 | Registration Rights Agreement, dated as of October 9, 2001, among the Company and the Initial Purchasers (Incorporated herein by reference to Exhibit 4.8 to Registrant’s Registration Statement on Form S-4/A Amendment No. 1, Registration No. 333-85124) | |
| 4.7 | Fourth Supplemental Indenture (Incorporated herein by reference to Exhibit 4.5 to Registrant’s Registration Statement on Form S-4/A Amendment No. 1, Registration No. 333-85124) | |
| 4.8 | Fifth Supplemental Indenture (Incorporated herein by reference to Exhibit 4.6 to Registrant’s Registration Statement on Form S-4/A Amendment No. 1, Registration No. 333-85124) | |
| 4.9 | Form of Sixth Supplemental Indenture (Incorporated herein by reference to Exhibit 4.6 to the Mirant Corporation Form 10-K filed February 27, 2009) | |
| 4.10 | Form of Seventh Supplemental Indenture (Incorporated herein by reference to Exhibit 4.1 to Registrant’s Form 10-Q filed May 14, 2007) | |
F-103
Table of Contents
| 4.11 | Form of Senior Note Indenture between Mirant North America, LLC, Mirant North America Escrow, LLC, MNA Finance Corp. and Law Debenture Trust Company of New York, as Trustee (Incorporated herein by reference to Exhibit 4.2 to the Mirant Corporation 10-K filed March 14, 2006) | |
| 10.1† | Engineering, Procurement and Construction Agreement dated as of July 30, 2007, by and between Mirant Mid-Atlantic, LLC, Mirant Chalk Point, LLC and Stone and Webster, Inc. (Incorporated herein by reference to Exhibit 10.1 to Registrant’s Form 10-Q filed November 6, 2009) | |
| 10.2 | Membership Interest Purchase and Sale Agreement, dated as of January 31, 2007, by and between Mirant New York, Inc. and Alliance Energy Renewables, LLC (Incorporated herein by reference to Exhibit 10.1 to Registrant’s Form 10-Q filed May 14, 2007) | |
| 10.3 | California Settlement Agreement dated January 13, 2005 (Incorporated herein by reference to Exhibit 10.39 to the Mirant Corporation Form 10-K filed March 14, 2005) | |
| 10.4 | Mirant North America, LLC—Credit Agreement with Deutsche Bank Securities Inc., Goldman Sachs Credit Partners L.P., and JPMorgan Chase Bank, N.A. (Incorporated herein by reference to Exhibit 10.2 to Registrant’s Form 10-Q filed November 6, 2009) | |
| 10.5 | Administrative Services Agreement dated as of January 3, 2006 between Mirant Americas Generation, LLC and Mirant Services, LLC (Incorporated herein by reference to Exhibit 10.5 to Registrant’s Form 10-K filed March 31, 2006) | |
| 10.6 | Power Sale, Fuel Supply and Services Agreement dated as of January 3, 2006 among Mirant Americas Energy Marketing, LP, Mirant Bowline, LLC, Mirant Lovett, LLC, and Mirant NY-Gen, LLC (Incorporated herein by reference to Exhibit 10.6 to Registrant’s Form 10-K filed March 31, 2006) | |
| 10.7 | Power Sale, Fuel Supply and Services Agreement dated as of January 3, 2006 among Mirant Americas Energy Marketing, LP, Mirant Canal, LLC, and Mirant Kendall, LLC (Incorporated herein by reference to Exhibit 10.7 to Registrant’s Form 10-K filed March 31, 2006) | |
| 10.8 | Power Sale, Fuel Supply and Services Agreement dated as of January 3, 2006 between Mirant Americas Energy Marketing, LP and Mirant Chalk Point, LLC (Incorporated herein by reference to Exhibit 10.8 to Registrant’s Form 10-K filed March 31, 2006) | |
| 10.9 | Power Sale, Fuel Supply and Services Agreement dated as of January 3, 2006 between Mirant Americas Energy Marketing, LP and Mirant Mid-Atlantic, LLC (Incorporated herein by reference to Exhibit 10.9 to Registrant’s Form 10-K filed March 31, 2006) | |
| 10.10 | Power Sale, Fuel Supply and Services Agreement dated January 3, 2006 between Mirant Americas Energy Marketing, LP and Mirant Potomac River, LLC (Incorporated herein by reference to Exhibit 10.10 to Registrant’s Form 10-K filed March 31, 2006) | |
| 10.11 | Power Sale, Fuel Supply and Services Agreement dated January 3, 2006 among Mirant Americas Energy Marketing, LP, Mirant Delta, LLC, and Mirant Potrero, LLC (Incorporated herein by reference to Exhibit 10.12 to Registrant’s Form 10-K filed March 31, 2006) | |
| 10.12 | Power Sale, Fuel Supply and Services Agreement dated January 3, 2006 among Mirant Americas Energy Marketing, LP and Mirant Zeeland, LLC (Incorporated herein by reference to Exhibit 10.13 to Registrant’s Form 10-K filed March 31, 2006) | |
| 10.13 | 2005 Omnibus Incentive Compensation Plan (Incorporated herein by reference to Exhibit 10.1 to the Mirant Corporation Form 8-K filed January 3, 2006) | |
F-104
Table of Contents
| 12.1 | Statement regarding ratio of earnings to fixed charges (Incorporated herein by reference to Exhibit 12.1 to Registrant’s Registration Statement on Form S-4/A Amendment No. 1, Registration No.333-85124) | |
| 21.1* | Subsidiaries of Mirant Americas Generation, LLC | |
| 31.1A1* | Certification of the Chief Executive Officer Pursuant to Section 302 of the Sarbanes-Oxley Act of 2002 (Rule 13a-14(a)) | |
| 31.2A4* | Certification of the Chief Financial Officer Pursuant to Section 302 of the Sarbanes-Oxley Act of 2002 (Rule 13a-14(a)) | |
| 32.1A1* | Certification of the Chief Executive Officer Pursuant to 18 U.S.C. Section 1350, as adopted pursuant to Section 906 of the Sarbanes-Oxley Act of 2002 (Rule 13a-14(b)) | |
| 32.2A4* | Certification of the Chief Financial Officer Pursuant to 18 U.S.C. Section 1350, as adopted pursuant to Section 906 of the Sarbanes-Oxley Act of 2002 (Rule 13a-14(b)) | |
| * | Asterisk indicates exhibits filed herewith. |
| † | The Registrant has requested confidential treatment for certain portions of this Exhibit pursuant to Rule 24b-2 under the Securities Exchange Act of 1934, as amended. |
| Exhibit No. |
Exhibit Name | |
| 2.1 | Purchase and Sale Agreement, dated as of January 15, 2007, by and between Mirant Americas, Inc. and LS Power (Incorporated herein by reference to Exhibit 2.1 to Registrant’s Form 8-K filed January 18, 2007) | |
| 3.1 | Certificate of Formation of Mirant North America, LLC (Incorporated herein by reference to Exhibit 3.1 to Registrant’s Form S-4 filed June 5, 2006) | |
| 3.2 | Limited Liability Company Agreement of Mirant North America, LLC (Incorporated herein by reference to Exhibit 3.2 to Registrant’s Form S-4 filed June 5, 2006) | |
| 3.3 | Certificate of Incorporation of MNA Finance Corp. (Incorporated herein by reference to Exhibit 3.3 to Registrant’s Form S-4 filed June 5, 2006) | |
| 3.4 | Bylaws of MNA Finance Corp. (Incorporated herein by reference to Exhibit 3.4 to Registrant’s Form S-4 filed June 5, 2006) | |
| 4.1 | Form of Senior Note Indenture between Mirant North America, LLC, Mirant North America Escrow, LLC, MNA Finance Corp. and Law Debenture Trust Company of New York, as Trustee (Incorporated herein by reference to Exhibit 4.2 to the Mirant Corporation 10-K filed March 14, 2006) | |
| 10.1† | Engineering, Procurement and Construction Agreement dated as of July 30, 2007, by and between Mirant Mid-Atlantic, LLC, Mirant Chalk Point, LLC and Stone and Webster, Inc. (Incorporated herein by reference to Exhibit 10.1 to Registrant’s Form 10-Q filed November 6, 2009) | |
| 10.2 | Settlement Agreement and Release dated as of May 30, 2006 by and among the Mirant Settling Parties and the Pepco Settling Parties (Incorporated herein by reference to Exhibit 10.1 to the Mirant Corporation Form 8-K filed May 31, 2006) | |
F-105
Table of Contents
| 10.3 | Power Sale, Fuel Supply and Services Agreement dated as of January 3, 2006 among Mirant Americas Energy Marketing, LP, Mirant Bowline, LLC, Mirant Lovett, LLC, and Mirant NY-Gen, LLC (Incorporated herein by reference to Exhibit 10.6 to the Mirant Americans Generation Form 10-K filed March 31, 2006) | ||
| 10.4 | Power Sale, Fuel Supply and Services Agreement dated as of January 3, 2006 among Mirant Americas Energy Marketing, LP, Mirant Canal, LLC, and Mirant Kendall, LLC (Incorporated herein by reference to Exhibit 10.7 to the Mirant Americas Generation Form 10-K filed March 31, 2006) | ||
| 10.5 | Power Sale, Fuel Supply and Services Agreement dated as of January 3, 2006 between Mirant Americas Energy Marketing, LP and Mirant Chalk Point, LLC (Incorporated herein by reference to Exhibit 10.8 to the Mirant Americas Generation Form 10-K filed March 31, 2006) | ||
| 10.6 | Power Sale, Fuel Supply and Services Agreement dated as of January 3, 2006 between Mirant Americas Energy Marketing, LP and Mirant Mid-Atlantic, LLC (Incorporated herein by reference to Exhibit 10.9 to the Mirant Americas Generation Form 10-K filed March 31, 2006) | ||
| 10.7 | Power Sale, Fuel Supply and Services Agreement dated January 3, 2006 between Mirant Americas Energy Marketing, LP and Mirant Potomac River, LLC (Incorporated herein by reference to Exhibit 10.10 to the Mirant Americas Generation Form 10-K filed March 31, 2006) | ||
| 10.8 | Power Sale, Fuel Supply and Services Agreement dated January 3, 2006 among Mirant Americas Energy Marketing, LP, Mirant Delta, LLC, and Mirant Potrero, LLC (Incorporated herein by reference to Exhibit 10.12 to the Mirant Americas Generation Form 10-K filed March 31, 2006) | ||
| 10.9 | Power Sale, Fuel Supply and Services Agreement dated January 3, 2006 among Mirant Americas Energy Marketing, LP and Mirant Zeeland, LLC (Incorporated herein by reference to Exhibit 10.13 to the Mirant Americas Generation Form 10-K filed March 31, 2006) | ||
| 10.10 | Mirant North America, LLC – Credit Agreement with Deutsche Bank Securities Inc., Goldman Sachs Credit Partners L.P., and JPMorgan Chase Bank, N.A. (Incorporated herein by reference to Exhibit 10.2 to Registrant’s Form 10-Q filed November 6, 2009) | ||
| 21.1* | Subsidiaries of Mirant North America, LLC | ||
| 31.1A2 | * | Certification of the Chief Executive Officer Pursuant to 15 U.S.C. Section 7241, as adopted pursuant to Section 302 of the Sarbanes-Oxley Act of 2002 (Rule 13a-14(a)) | |
| 31.2A5 | * | Certification of the Chief Financial Officer Pursuant to 15 U.S.C. Section 7241, as adopted pursuant to Section 302 of the Sarbanes-Oxley Act of 2002 (Rule 13a-14(a)) | |
| 32.1A2 | * | Certification of the Chief Executive Officer Pursuant to 18 U.S.C. Section 1350, as adopted pursuant to Section 906 of the Sarbanes-Oxley Act of 2002 (Rule 13a-14(b)) | |
| 32.2A5 | * | Certification of the Chief Financial Officer Pursuant to 18 U.S.C. Section 1350, as adopted pursuant to Section 906 of the Sarbanes-Oxley Act of 2002 (Rule 13a-14(b)) | |
| * | Asterisk indicates exhibits filed herewith. |
| † | The Registrant has requested confidential treatment for certain portions of this Exhibit pursuant to Rule 24b-2 under the Securities Exchange Act of 1934, as amended. |
F-106
Table of Contents
| Exhibit No. |
Exhibit Name | ||
| 3.1 | Certificate of Formation of Southern Energy Mid-Atlantic, LLC (Incorporated herein by reference to Exhibit 3.1 to Registrant’s Form S-4 in Registration No. 333-61668) | ||
| 3.2 | Amended and Restated Limited Liability Company Agreement of Mirant Mid-Atlantic LLC, dated as of January 3, 2006 (Incorporated herein by reference to Exhibit 3.2 to Registrant’s Form 10-Q filed November 13, 2006) | ||
| 4.1 | Form of 8.625% Series A Pass Through Certificate (Incorporated herein by reference to Exhibit 4.1 to Registrant’s Form S-4 in Registration No. 333-61668) | ||
| 4.2 | Form of 9.125% Series B Pass Through Certificate (Incorporated herein by reference to Exhibit 4.2 to Registrant’s Form S-4 in Registration No. 333-61668) | ||
| 4.3 | Form of 10.060% Series C Pass Through Certificate (Incorporated herein by reference to Exhibit 4.3 to Registrant’s Form S-4 in Registration No. 333-61668) | ||
| 4.4 | (a) | Pass Through Trust Agreement A between Southern Energy Mid-Atlantic, LLC and State Street Bank and Trust Company of Connecticut, National Association, as Pass Through Trustee, dated as of December 18, 2000 (Incorporated herein by reference to Exhibit 4.4a to Registrant’s Form S-4 in Registration No. 333-61668) | |
| 4.4 | (b) | Schedule identifying substantially identical agreements to Pass Through Trust Agreement constituting Exhibit 4.4(a) hereto (Incorporated herein by reference to Exhibit 4.4b to Registrant’s Form S-4 in Registration No. 333-61668) | |
| 4.5 | (a) | Participation Agreement (Dickerson L1) among Southern Energy Mid-Atlantic, LLC, as Lessee, Dickerson OL1 LLC, as Owner Lessor, Wilmington Trust Company, as Owner Manager, SEMA OP3, as Owner Participant and State Street Bank and Trust Company of Connecticut, National Association, as Lease Indenture Trustee and as Pass Through Trustee, dated as of December 18, 2000 (Incorporated herein by reference to Exhibit 4.5a to Registrant’s Form S-4 in Registration No. 333-61668) | |
| 4.5 | (b) | Schedule identifying substantially identical agreements to Participation Agreement constituting Exhibit 4.5(a) hereto (Incorporated herein by reference to Exhibit 4.5b to Registrant’s Form S-4 in Registration No. 333-61668) | |
| 4.6 | (a) | Participation Agreement (Morgantown L1) among Southern Energy Mid-Atlantic, LLC, as Lessee, Morgantown OL1 LLC, as Owner Lessor, Wilmington Trust Company, as Owner Manager, SEMA OP1, as Owner Participant and State Street Bank and Trust Company of Connecticut, National Association, as Lease Indenture Trustee and as Pass Through Trustee, dated as of December 18, 2000 (Incorporated herein by reference to Exhibit 4.6a to Registrant’s Form S-4 in Registration No. 333-61668) | |
| 4.6 | (b) | Schedule identifying substantially identical agreements to Participation Agreement constituting Exhibit 4.6(a) hereto (Incorporated herein by reference to Exhibit 4.6b to Registrant’s Form S-4 in Registration No. 333-61668) | |
| 4.7 | (a) | Facility Lease Agreement (Dickerson L1) between Southern Energy Mid-Atlantic, LLC, as Lessee, and Dickerson OL1 LLC, as Owner Lessor, dated as of December 19, 2000 (Incorporated herein by reference to Exhibit 4.7a to Registrant’s Form S-4 in Registration No. 333-61668) | |
F-107
Table of Contents
| 4.7(b) | Schedule identifying substantially identical agreements to Facility Lease Agreement constituting Exhibit 4.7(a) hereto (Incorporated herein by reference to Exhibit 4.7b to Registrant’s Form S-4 in Registration No. 333-61668) | |
| 4.8(a) | Facility Lease Agreement (Morgantown L1) between Southern Energy Mid-Atlantic, LLC, as Lessee, and Morgantown OL1 LLC, as Owner Lessor, dated as of December 19, 2000 (Incorporated herein by reference to Exhibit 4.8a to Registrant’s Form S-4 in Registration No. 333-61668) | |
| 4.8(b) | Schedule identifying substantially identical agreements to Facility Lease Agreement constituting Exhibit 4.8(a) hereto (Incorporated herein by reference to Exhibit 4.8b to Registrant’s Form S-4 in Registration No. 333-61668) | |
| 4.9(a) | Indenture of Trust, Mortgage and Security Agreement (Dickerson L1) between Dickerson OL1 LLC, as Lessor, and State Street Bank and Trust Company of Connecticut, National Association, as Lease Indenture Trustee, dated as of December 19, 2000 (Incorporated herein by reference to Exhibit 4.9a to Registrant’s Form S-4 in Registration No. 333-61668) | |
| 4.9(b) | Schedule identifying substantially identical agreements to Indenture of Trust, Mortgage and Security Agreement constituting Exhibit 4.9(a) hereto (Incorporated herein by reference to Exhibit 4.9b to Registrant’s Form S-4 in Registration No. 333-61668) | |
| 4.10(a) | Indenture of Trust, Mortgage and Security Agreement (Morgantown L1) between Morgantown OL1 LLC, as Lessor, and State Street Bank and Trust Company of Connecticut, National Association, as Lease Indenture Trustee, dated as of December 19, 2000 (Incorporated herein by reference to Exhibit 4.10a to Registrant’s Form S-4 in Registration No. 333-61668) | |
| 4.10(b) | Schedule identifying substantially identical agreements to Indenture of Trust, Mortgage and Security Agreement constituting Exhibit 4.10(a) hereto (Incorporated herein by reference to Exhibit 4.10b to Registrant’s Form S-4 in Registration No. 333-61668) | |
| 4.11(a) | Series A Lessor Note for Dickerson OL1 LLC (Incorporated herein by reference to Exhibit 4.11a to Registrant’s Form S-4 in Registration No. 333-61668) | |
| 4.11(b) | Schedule identifying substantially identical notes to Lessor Notes Constituting Exhibit 4.11(a) (Incorporated herein by reference to Exhibit 4.11b to Registrant’s Form S-4 in Registration No. 333-61668) | |
| 4.12(a) | Series A Lessor Note for Morgantown OL1 LLC (Incorporated herein by reference to Exhibit 4.12a to Registrant’s Form S-4 in Registration No. 333-61668) | |
| 4.12(b) | Schedule identifying substantially identical notes to Lessor Notes Constituting Exhibit 4.12(a) (Incorporated herein by reference to Exhibit 4.12b to Registrant’s Form S-4 in Registration No. 333-61668) | |
| 4.13(a) | Series B Lessor Note for Dickerson OL1 LLC (Incorporated herein by reference to Exhibit 4.13a to Registrant’s Form S-4 in Registration No. 333-61668) | |
| 4.13(b) | Schedule identifying substantially identical notes to Lessor Notes Constituting Exhibit 4.13(a) (Incorporated herein by reference to Exhibit 4.13b to Registrant’s Form S-4 in Registration No. 333-61668) | |
| 4.14(a) | Series B Lessor Note for Morgantown OL1 LLC (Incorporated herein by reference to Exhibit 4.14a to Registrant’s Form S-4 in Registration No. 333-61668) | |
| 4.14(b) | Schedule identifying substantially identical notes to Lessor Notes Constituting Exhibit 4.14(a) (Incorporated herein by reference to Exhibit 4.14b to Registrant’s Form S-4 in Registration No. 333-61668 as Exhibit 4.14b) | |
F-108
Table of Contents
| 4.15(a) | Series C Lessor Note for Morgantown OL1 LLC (Incorporated herein by reference to Exhibit 4.15a to Registrant’s Form S-4 in Registration No. 333-61668) | |
| 4.15(b) | Schedule identifying substantially identical notes to Lessor Notes Constituting Exhibit 4.15(a) (Incorporated herein by reference to Exhibit 4.15b to Registrant’s Form S-4 in Registration No. 333-61668) | |
| 4.16 | Registration Rights Agreement, between Southern Energy Mid-Atlantic, LLC and Credit Suisse First Boston, acting for itself on behalf of the Purchasers, dated as of December 18, 2000 (Incorporated herein by reference to Exhibit 4.16 to Registrant’s Form S-4 in Registration No. 333-61668) | |
| 4.17(a) | Supplemental Pass Through Trust Agreement A between Mirant Mid-Atlantic, LLC, and State Street Bank and Trust Company of Connecticut, National Association, as Pass Through Trustee, dated as of June 29, 2001 (Incorporated herein by reference to Exhibit 4.17a to Registrant’s Form S-4/A Amendment No. 1 in Registration No. 333-61668) | |
| 4.17(b) | Schedule identifying substantially identical to Supplemental Pass Through Trust Agreement constituting Exhibit 4.17(a) hereto (Incorporated herein by reference to Exhibit 4.17b to Registrant’s Form S-4/A Amendment No. 1 in Registration No. 333-61668) | |
| 10.1† | Engineering, Procurement and Construction Agreement dated as of July 30, 2007, by and between the Company, Mirant Chalk Point, LLC and Stone and Webster, Inc. (Incorporated herein by reference to Exhibit 10.1 to Registrant’s Form 10-Q filed November 6, 2009) | |
| 10.2 | Power Sale, Fuel Supply and Services Agreement dated as of January 3, 2006 between Mirant Mid-Atlantic, LLC and Mirant Americas Energy Services, LP (Incorporated herein by reference to Exhibit 10.17 to Registrant’s Form 10-K filed March 3, 2006) | |
| 10.3 | Power Sale, Fuel Supply and Services Agreement dated as of January 3, 2006 between Mirant Americas Energy Marketing, LP and Mirant Chalk Point, LLC (Incorporated herein by reference to Exhibit 10.18 to Registrant’s Form 10-K filed March 3, 2006) | |
| 10.4 | Power Sale, Fuel Supply and Services Agreement dated January 3, 2006 between Mirant Americas Energy Marketing, LP and Mirant Potomac River, LLC (Incorporated herein by reference to Exhibit 10.19 to Registrant’s Form 10-K filed March 3, 2006) | |
| 10.5 | Administrative Services Agreement dated as of January 3, 2006 between Mirant Mid-Atlantic, LLC and Mirant Services, LLC (Incorporated herein by reference to Exhibit 10.20 to Registrant’s Form 10-K filed March 3, 2006) | |
| 10.6(a) | Asset Purchase and Sale Agreement between Potomac Electric Power Company and Southern Energy, Inc. (currently known as Mirant Corporation) dated as of June 7, 2000 (Incorporated herein by reference to Exhibit 10.1a to Registrant’s Form S-4 in Registration No. 333-61668) | |
| 10.6(b) | Amendment No. 1 to Asset Purchase and Sale agreement between Potomac Electric Power Company and Southern Energy, Inc. dated as of September 18, 2000 (Incorporated herein by reference to Exhibit 10.1b to Registrant’s Form S-4 in Registration No. 333-61668) | |
| 10.6(c) | Amendment No. 2 to Asset Purchase and Sale Agreement between Potomac Electric Power Company and Southern Energy, Inc. dated as of December 19, 2000 (Incorporated herein by reference to Exhibit 10.1c to Registrant’s Form S-4 in Registration No. 333-61668) | |
| 10.7(a) | Interconnection Agreement (Dickerson) between Potomac Electric Power Company and Southern Energy Mid-Atlantic, LLC dated as of December 19, 2000 (Incorporated herein by reference to Exhibit 10.2a to Registrant’s Form S-4 in Registration No. 333-61668) | |
| 10.7(b) | Schedule identifying substantially identical agreements to Interconnection Agreement constituting Exhibit 10.7(a) hereto (Incorporated herein by reference to Exhibit 10.2b to Registrant’s Form S-4 in Registration No. 333-61668) | |
F-109
Table of Contents
| 10.8(a) | Easement, License and Attachment Agreement (Dickerson) between Potomac Electric Power Company, Southern Energy Mid-Atlantic, LLC and Southern Energy MD Ash Management, LLC (currently known as Mirant MD Ash Management, LLC) dated as of December 19, 2000 (Incorporated herein by reference to Exhibit 10.3a to Registrant’s Form S-4 in Registration No. 333-61668) | |
| 10.8(b) | Schedule identifying substantially identical agreements to Easement, License and Attachment Agreement constituting Exhibit 10.8(a) hereto (Incorporated herein by reference to Exhibit 10.3b to Registrant’s Form S-4 in Registration No. 333-61668) | |
| 10.9(a) | Bill of Sale (Dickerson, Morgantown, Production Service Center and Railroad Spur) between Potomac Electric Power Company and Southern Energy Mid-Atlantic, LLC dated as of December 19, 2000 (Incorporated herein by reference to Exhibit 10.4a to Registrant’s Form S-4 in Registration No. 333-61668) | |
| 10.9(b) | Schedule identifying substantially identical documents to Bill of Sale constituting Exhibit 10.9(a) hereto (Incorporated herein by reference to Exhibit 10.4b to Registrant’s Form S-4 in Registration No. 333-61668) | |
| 10.10(a) | Facility Site Lease Agreement (Dickerson L1) between Southern Energy Mid-Atlantic, LLC, Dickerson OL1 LLC and Southern Energy MD Ash Management, LLC dated as of December 19, 2000 (Incorporated herein by reference to Exhibit 10.5a to Registrant’s Form S-4 in Registration No. 333-61668) | |
| 10.10(b) | Schedule identifying substantially identical agreements to Facility Site Lease Agreement constituting Exhibit 10.10(a) hereto (Incorporated herein by reference to Exhibit 10.5b to Registrant’s Form S-4 in Registration No. 333-61668) | |
| 10.11(a) | Facility Site Lease Agreement (Morgantown L1) between Southern Energy Mid-Atlantic, LLC, Morgantown OL1 LLC and Southern Energy MD Ash Management, LLC dated as of December 19, 2000 (Incorporated herein by reference to Exhibit 10.6a to Registrant’s Form S-4 in Registration No. 333-61668) | |
| 10.11(b) | Schedule identifying substantially identical agreements to Facility Site Lease Agreement constituting Exhibit 10.11(a) hereto (Incorporated herein by reference to Exhibit 10.6b to Registrant’s Form S-4 in Registration No. 333-61668) | |
| 10.12(a) | Facility Site Sublease Agreement (Dickerson L1) between Southern Energy Mid-Atlantic, LLC, Dickerson OL1 LLC dated as of December 19, 2000 (Incorporated herein by reference to Exhibit 10.7a to Registrant’s Form S-4 in Registration No. 333-61668) | |
| 10.12(b) | Schedule identifying substantially identical agreements to Facility Site Sublease Agreement constituting Exhibit 10.12(a) hereto (Incorporated herein by reference to Exhibit 10.7b to Registrant’s Form S-4 in Registration No. 333-61668) | |
| 10.13(a) | Facility Site Sublease Agreement (Morgantown L1) between Southern Energy Mid-Atlantic, LLC, Morgantown OL1 LLC dated as of December 19, 2000 (Incorporated herein by reference to Exhibit 10.8a to Registrant’s Form S-4 in Registration No. 333-61668) | |
| 10.13(b) | Schedule identifying substantially identical agreements to Facility Site Sublease Agreement constituting Exhibit 10.13(a) hereto (Incorporated herein by reference to Exhibit 10.8b to Registrant’s Form S-4 in Registration No. 333-61668) | |
| 10.14 | Capital Contribution Agreement between Southern Energy, Inc. and Southern Energy Mid-Atlantic, LLC dated as of December 19, 2000 (Incorporated herein by reference to Exhibit 10.12 to Registrant’s Form S-4 in Registration No. 333-61668) | |
F-110
Table of Contents
| 10.15 | Promissory Note between Southern Energy Mid-Atlantic, LLC and Southern Energy Peaker, LLC in the original principal amount of $71,110,000 dated as of December 19, 2000 (Incorporated herein by reference to Exhibit 10.13 to Registrant’s Form S-4 in Registration No. 333-61668) | ||
| 10.16 | Promissory Note between Southern Energy Mid-Atlantic, LLC and Southern Energy Potomac River, LLC in the original principal amount of $152,165,000 dated as of December 19, 2000 (Incorporated herein by reference to Exhibit 10.14 to Registrant’s Form S-4 in Registration No. 333-61668) | ||
| 10.17 | (a) | Shared Facilities Agreement (Dickerson) between Southern Energy Mid-Atlantic, LLC, Dickerson OL1 LLC, Dickerson OL2 LLC, Dickerson OL3 LLC, and Dickerson OL4 LLC, dated as of December 18, 2000 (Incorporated herein by reference to Exhibit 10.15a to Registrant’s Form S-4 in Registration No. 333-61668) | |
| 10.17 | (b) | Shared Facilities Agreement (Morgantown) between Southern Energy Mid-Atlantic, LLC, Morgantown OL1 LLC, Morgantown OL2 LLC, Morgantown OL3 LLC, Morgantown OL4 LLC, Morgantown OL5 LLC, Morgantown OL6 LLC, and Morgantown OL7 LLC, dated as of December 18, 2000 (Incorporated herein by reference to Exhibit 10.15b to Registrant’s Form S-4 in Registration No. 333-61668) | |
| 10.18 | (a) | Assignment and Assumption Agreement (Dickerson) between Southern Energy Mid-Atlantic, LLC, Dickerson OL1 LLC, Dickerson OL2 LLC, Dickerson OL3 LLC, and Dickerson OL4 LLC, dated as of December 19, 2000 (Incorporated herein by reference to Exhibit 10.16a to Registrant’s Form S-4 in Registration No. 333-61668) | |
| 10.18 | (b) | Assignment and Assumption Agreement (Morgantown) between Southern Energy Mid-Atlantic, LLC, Morgantown OL1 LLC, Morgantown OL2 LLC, Morgantown OL3 LLC, Morgantown OL4 LLC, Morgantown OL5 LLC, Morgantown OL6 LLC, and Morgantown OL7 LLC, dated as of December 19, 2000 (Incorporated herein by reference to Exhibit 10.16b to Registrant’s Form S-4 in Registration No. 333-61668) | |
| 10.19 | (a) | Ownership and Operation Agreement (Dickerson) between Southern Energy Mid-Atlantic, LLC, Dickerson OL1 LLC, Dickerson OL2 LLC, Dickerson OL3 LLC, and Dickerson OL4 LLC, dated as of December 18, 2000 (Incorporated herein by reference to Exhibit 10.17a to Registrant’s Form S-4 in Registration No. 333-61668) | |
| 10.19 | (b) | Ownership and Operation Agreement (Morgantown) between Southern Energy Mid-Atlantic, LLC, Morgantown OL1 LLC, Morgantown OL2 LLC, Morgantown OL3 LLC, Morgantown OL4 LLC, Morgantown OL5 LLC, Morgantown OL6 LLC, and Morgantown OL7 LLC, dated as of December 18, 2000 (Incorporated herein by reference to Exhibit 10.17b to Registrant’s Form S-4 in Registration No. 333-61668) | |
| 10.20 | (a) | Guaranty Agreement (Dickerson L1) between Southern Energy, Inc. and Dickerson OL1 LLC dated as of December 19, 2000 (Incorporated herein by reference to Exhibit 10.21a to Registrant’s Form S-4 in Registration No. 333-61668) | |
| 10.20 | (b) | Schedule identifying substantially identical agreements to Guaranty Agreement constituting Exhibit 10.20(a) hereto (Incorporated herein by reference to Exhibit 10.21b to Registrant’s Form S-4 in Registration No. 333-61668) | |
| 10.21 | (a) | Guaranty Agreement (Morgantown L1) between Southern Energy, Inc. and Morgantown OL1 LLC dated as of December 19, 2000 (Incorporated herein by reference to Exhibit 10.22a to Registrant’s Form S-4 in Registration No. 333-61668) | |
| 10.21 | (b) | Schedule identifying substantially identical agreements to Guaranty Agreement constituting Exhibit 10.21(a) hereto (Incorporated herein by reference to Exhibit 10.22b to Registrant’s Form S-4 in Registration No. 333-61668) | |
F-111
Table of Contents
| 10.22 | Mirant North America, LLC—Credit Agreement with Deutsche Bank Securities Inc., Goldman Sachs Credit Partners L.P., and JPMorgan Chase Bank, N.A. (Incorporated herein by reference to Exhibit 10.2 to Registrant’s Form 10-Q filed November 6, 2009) | |
| 21.1* | Subsidiaries of Mirant Mid-Atlantic, LLC | |
| 31.1A3* | Certification of the Chief Executive Officer Pursuant to Section 302 of the Sarbanes-Oxley Act of 2002 (Rule 13a-14(a)) | |
| 31.2A6* | Certification of the Chief Financial Officer Pursuant to Section 302 of the Sarbanes-Oxley Act of 2002 (Rule 13a-14(a)) | |
| 32.1A3* | Certification of the Chief Executive Officer Pursuant to 18 U.S.C. Section 1350, as adopted pursuant to Section 906 of the Sarbanes-Oxley Act of 2002 (Rule 13a-14(b)) | |
| 32.2A6* | Certification of the Chief Financial Officer Pursuant to 18 U.S.C. Section 1350, as adopted pursuant to Section 906 of the Sarbanes-Oxley Act of 2002 (Rule 13a-14(b)) | |
| * | Asterisk indicates exhibits filed herewith. |
| † | The Registrant has requested confidential treatment for certain portions of this Exhibit pursuant to Rule 24b-2 under the Securities Exchange Act of 1934, as amended. |
F-112
Table of Contents
SIGNATURES
Pursuant to the requirements of Section 13 or 15(d) the Securities Exchange Act of 1934, the registrant has duly caused this report to be signed on its behalf by the undersigned thereunto duly authorized.
| Mirant Americas Generation, LLC | ||||||
| Date: February 26, 2010 | By: | /s/ EDWARD R. MULLER | ||||
| Edward R. Muller | ||||||
| President and Chief Executive Officer | ||||||
| (Principal Executive Officer) | ||||||
MIRANT AMERICAS GENERATION, LLC
Pursuant to the requirements of the Securities Exchange Act of 1934, this report has been signed below by the following persons on behalf of the registrant and in the capacities and on the dates indicated.
| Signatures |
Title | |
| /s/ EDWARD R. MULLER Edward R. Muller |
President and Chief Executive Officer and Manager of Mirant Americas Generation, LLC (Principal Executive Officer) | |
| Date: February 26, 2010 |
||
| /s/ J. WILLIAM HOLDEN III J. William Holden III |
Senior Vice President and Chief Financial Officer and Manager of Mirant Americas Generation, LLC (Principal Financial Officer) | |
| Date: February 26, 2010 |
||
| /s/ ANGELA M. NAGY Angela M. Nagy |
Vice President, Controller and Principal Accounting Officer of Mirant Americas Generation, LLC (Principal Accounting Officer) | |
| Date: February 26, 2010 |
||
| /s/ JULIA A. HOUSTON Julia A. Houston |
Manager of Mirant Americas Generation, LLC | |
| Date: February 26, 2010 |
||
Table of Contents
SIGNATURES
Pursuant to the requirements of Section 13 or 15(d) the Securities Exchange Act of 1934, the registrant has duly caused this report to be signed on its behalf by the undersigned thereunto duly authorized.
| Mirant North America, LLC | ||||||
| Date: February 26, 2010 | By: | /s/ EDWARD R. MULLER | ||||
| Edward R. Muller | ||||||
| President and Chief Executive Officer | ||||||
| (Principal Executive Officer) | ||||||
MIRANT NORTH AMERICA, LLC
Pursuant to the requirements of the Securities Exchange Act of 1934, this report has been signed below by the following persons on behalf of the registrant and in the capacities and on the dates indicated.
| Signatures |
Title | |
| /s/ EDWARD R. MULLER Edward R. Muller |
President and Chief Executive Officer and Manager of Mirant North America, LLC (Principal Executive Officer) | |
| Date: February 26, 2010 |
||
| /s/ J. WILLIAM HOLDEN III J. William Holden III |
Senior Vice President and Chief Financial Officer and Manager of Mirant North America, LLC (Principal Financial Officer) | |
| Date: February 26, 2010 |
||
| /s/ ANGELA M. NAGY Angela M. Nagy |
Vice President, Controller and Principal Accounting Officer of Mirant North America, LLC (Principal Accounting Officer) | |
| Date: February 26, 2010 |
||
| /s/ JULIA A. HOUSTON Julia A. Houston |
Manager of Mirant North America, LLC | |
| Date: February 26, 2010 |
||
Table of Contents
SIGNATURES
Pursuant to the requirements of Section 13 or 15(d) the Securities Exchange Act of 1934, the registrant has duly caused this report to be signed on its behalf by the undersigned thereunto duly authorized.
| Mirant Mid-Atlantic, LLC | ||||||
| Date: February 26, 2010 | By: | /s/ EDWARD R. MULLER | ||||
| Edward R. Muller | ||||||
| President and Chief Executive Officer | ||||||
| (Principal Executive Officer) | ||||||
MIRANT MID-ATLANTIC, LLC
Pursuant to the requirements of the Securities Exchange Act of 1934, this report has been signed below by the following persons on behalf of the registrant and in the capacities and on the dates indicated.
| Signatures |
Title | |
| /s/ EDWARD R. MULLER Edward R. Muller |
President and Chief Executive Officer and Manager of Mirant Mid-Atlantic, LLC (Principal Executive Officer) | |
| Date: February 26, 2010 |
||
| /s/ J. WILLIAM HOLDEN III J. William Holden III |
Senior Vice President and Chief Financial Officer and Manager of Mirant Mid-Atlantic, LLC (Principal Financial Officer) | |
| Date: February 26, 2010 |
||
| /s/ ANGELA M. NAGY Angela M. Nagy |
Vice President, Controller and Principal Accounting Officer of Mirant Mid-Atlantic, LLC (Principal Accounting Officer) | |
| Date: February 26, 2010 |
||
| /s/ JULIA A. HOUSTON Julia A. Houston |
Manager of Mirant Mid-Atlantic, LLC | |
| Date: February 26, 2010 |
||
Table of Contents
Supplemental Information to be Furnished with Reports Filed Pursuant
to Section 15(d) of the Act by Registrants Which Have Not Registered
Securities Pursuant to Section 12 of the Act
No annual report or proxy materials has been sent to securities holders and no such report or proxy material is to be furnished to securities holders subsequent to the filing of the annual report on this Form 10-K.