Attached files
Table of Contents
As filed with the Securities and Exchange Commission on February 26, 2010
Registration No. 333-144942
UNITED STATES
SECURITIES AND EXCHANGE COMMISSION
Washington, D.C. 20549
AMENDMENT NO. 4
TO
FORM S-1
REGISTRATION STATEMENT
UNDER
THE SECURITIES ACT OF 1933
INTCOMEX, INC.
(Exact name of Registrant as specified in its charter)
| Delaware | 5045 | 65-0893400 | ||
| (State or other jurisdiction of incorporation or organization) |
(Primary Standard Industrial Classification Code Number) |
(I.R.S. Employer Identification Number) |
Intcomex, Inc.
3505 NW 107th Avenue
Miami, Florida 33178 (305) 477-6230
(Address including zip code, telephone number, including area code, of Registrant’s Principal Executive Offices)
Michael Shalom
Intcomex, Inc.
3505 NW 107th Avenue
Miami, Florida 33178
(305) 477-6230
(Name, address including zip code, telephone number, including area code, of agent for service)
Copies To:
| Jeffrey D. Karpf, Esq. Cleary Gottlieb Steen & Hamilton LLP One Liberty Plaza New York, New York 10006 Telephone: (212) 225-2000 Telecopy: (212) 225-3999 |
Matthew D. Bloch, Esq. Erika L. Weinberg, Esq. Weil, Gotshal & Manges LLP 767 Fifth Avenue New York, New York 10153 Telephone: (212) 310-8000 Telecopy: (212) 310-8007 |
Approximate date of commencement of proposed sale to the public: As soon as practicable after the effective date hereof.
If any of the securities being registered on this form are to be offered on a delayed or continuous basis pursuant to Rule 415 under the Securities Act, check the following box. ¨
If this form is filed to register additional securities for an offering pursuant to Rule 462(b) under the Securities Act, check the following box and list the Securities Act registration statement number of the earlier effective registration statement for the same offering. ¨
If this form is a post-effective amendment filed pursuant to Rule 462(c) under the Securities Act, check the following box and list the Securities Act registration statement number of the earlier effective registration statement for the same offering. ¨
If this form is a post-effective amendment filed pursuant to Rule 462(d) under the Securities Act, check the following box and list the Securities Act registration statement number of the earlier effective registration statement for the same offering. ¨
Indicate by check mark whether the registrant is a large accelerated filer, an accelerated filer, a non-accelerated filer, or a smaller reporting company. See the definitions of “large accelerated filer,” “accelerated filer” and “smaller reporting company” in Rule 12b-2 of the Exchange Act.
| Large accelerated filer | ¨ | Accelerated filer | ¨ | |||
| Non-accelerated filer | x (Do not check if a smaller reporting company) | Smaller reporting company | ¨ |
The Registrant hereby amends this Registration Statement on such date or dates as may be necessary to delay its effective date until the Registrant shall file a further amendment which specifically states that this Registration Statement shall thereafter become effective in accordance with Section 8(a) of the Securities Act of 1933 or until the Registration Statement shall become effective on such date as the Commission, acting pursuant to said Section 8(a), may determine.
Table of Contents
The information in this prospectus is not complete and may be changed. We may not sell these securities until the registration statement filed with the Securities and Exchange Commission is effective. This prospectus is not an offer to sell these securities and it is not soliciting an offer to buy these securities in any state where the offer or sale is not permitted.
SUBJECT TO COMPLETION, DATED FEBRUARY 26, 2010.
P R O S P E C T U S

Shares
Intcomex, Inc.
Common Stock
$ per share
This is the initial public offering of our common stock. We are selling shares of our common stock. We currently expect the initial public offering price to be between $ and $ per share.
We have granted the underwriters an option to purchase up to shares of common stock to cover over-allotments.
We have applied to have the common stock listed on the Nasdaq Global Market under the symbol “ICMX.”
An affiliate of Citigroup Global Markets Inc., one of the underwriters in this offering, is one of our principal stockholders Citigroup Venture Capital International, or CVC International. CVC International currently owns approximately % of our common stock on a fully diluted basis and will own approximately % of our common stock upon the completion of this offering (assuming the underwriters’ over-allotment option is not exercised). As a result of CVC International’s current ownership interest in us, this offering is being conducted in accordance with the applicable provisions of the Financial Industry Regulatory Authority, or the FINRA rules. These rules require, among other things, that the initial public offering price of the common stock be no higher than that recommended by a “qualified independent underwriter” (as such term is defined by the rules). UBS Securities LLC is assuming the responsibilities of acting as the qualified independent underwriter in this offering.
Investing in our common stock involves risks. See “Risk Factors” beginning on page 12.
Neither the Securities and Exchange Commission nor any state securities commission has approved or disapproved of these securities or determined if this prospectus is truthful or complete. Any representation to the contrary is a criminal offense.
| Per Share | Total | |||||
| Public offering price |
$ | $ | ||||
| Underwriting discount |
$ | $ | ||||
| Proceeds to Intcomex, Inc. (before expenses) |
$ | $ | ||||
The underwriters expect to deliver the shares to purchasers on or about , 2010 through the book-entry facilities of the Depository Trust Company.
Joint Book-Running Managers
| Citi | UBS Investment Bank | |
Co-Managers
| Raymond James | Thomas Weisel Partners LLC | |
, 2010
Table of Contents
You should rely only on the information contained in this prospectus. We have not, and the underwriters are not, authorized anyone to provide you with different information. If anyone provides you with different or inconsistent information, you should not rely on it. We are not making an offer to sell these securities in any jurisdiction where the offer or sale is not permitted. You should not assume that the information contained in this prospectus is accurate as of any date other than the date on the front of this prospectus.
| Page | ||
| 1 | ||
| 12 | ||
| 30 | ||
| 31 | ||
| 32 | ||
| 33 | ||
| 35 | ||
| 36 | ||
| Management’s Discussion and Analysis of Financial Condition and Results of Operations |
38 | |
| 62 | ||
| 82 | ||
| 88 | ||
| 100 | ||
| 103 | ||
| 105 | ||
| 109 | ||
| Certain United States Tax Consequences to Non-United States Holders |
112 | |
| 115 | ||
| 117 | ||
| 123 | ||
| 123 | ||
| 123 | ||
| 123 | ||
| 123 | ||
| F-1 | ||
Until , 2010 (25 days after the date of this prospectus), all dealers that buy, sell or trade our common stock, whether or not participating in this offering, may be required to deliver a prospectus. This is in addition to the dealers’ obligation to deliver a prospectus when acting as underwriters and with respect to their unsold allotments or subscriptions.
i
Table of Contents
This summary highlights selected information contained elsewhere in this prospectus. It does not contain all of the information that may be important to you. You should read the following summary together with the more detailed information regarding our company, the common stock offered and our audited and unaudited consolidated financial statements, including the notes to those statements, appearing elsewhere in this prospectus, before making an investment decision. Except as the context otherwise requires, all references in this prospectus to “Intcomex, “ “we, “ “us, “ “our,” “our company” and similar terms refer to Intcomex, Inc. together with our consolidated subsidiaries and our predecessor companies.
Our Company
We believe we are the largest pure play value-added distributor of IT products focused solely on serving Latin America and the Caribbean. We distribute computer components, peripherals, software, computer systems, accessories, networking products and digital consumer electronics to more than 50,000 customers in 40 countries. We offer single source purchasing to our customers by providing an in-stock selection of more than 6,100 products from over 173 vendors, including the world’s leading IT product manufacturers. From our headquarters and main distribution center in Miami, or our Miami Operations, we support a network of 22 sales and distribution operations in 12 Latin American and the Caribbean countries and a sales office in Brazil, or our In-country Operations.
Over the last 20 years, we have built an IT products distribution network in Latin America and the Caribbean that we believe is unmatched by any of our competitors in terms of the number of countries served through an in-country presence. We have achieved our regional market leadership position by offering our customers a wide and readily available product selection and excellent pre- and post-sale customer service, while providing our vendors with a multi-country distribution channel for their products. We believe our broad regional presence makes us more attractive to our vendors and customers, thereby enhancing our revenue growth and operating margins, and our geographic diversification reduces our operating risks.
We believe we have the broadest in-country presence of any distributor of IT products to Latin America and the Caribbean, in terms of the number of countries served through an in-country presence. From our headquarters and main distribution center in Miami, we support a network of in-country sales and distribution operations in 12 countries in Latin America and the Caribbean and a sales office in Brazil. As a result of our unique distribution platform, we have realized consistent organic revenue growth and strong operating margins. From 2001 to 2009, our revenue grew from $324.1 million to $917.2 million, representing a compound annual growth rate, or CAGR, of 13.9%, and our operating income grew from $11.2 million to $20.3 million, representing a CAGR of 7.7%. We believe these growth rates and our operating margins are higher than those of our public company competitors.
We serve the Latin American and Caribbean IT products markets using a dual distribution model:
| • | As a Miami-based wholesale aggregator, we sell primarily to: |
| - | third-party distributors, resellers and retailers of IT products based in countries in Latin America and the Caribbean where we do not have a local presence; |
| - | third-party distributors, resellers and retailers of IT products based in countries in Latin America and the Caribbean where we have a local presence but whose volumes are large enough to enable them to efficiently acquire products directly from U.S.-based wholesale aggregators; |
| - | other Miami-based exporters of IT products to Latin America and the Caribbean; and |
| - | our In-country Operations. |
1
Table of Contents
For the year ended December 31, 2009, revenue and operating income from our Miami operations (net of $230.4 million of revenue derived from sales to our In-country Operations) were $234.9 million and $3.1 million, representing 25.6% and 15.1% of our consolidated revenue and operating income, respectively. For the year ended December 31, 2008, revenue and operating income (loss) from our Miami Operations (net of $253.4 million of revenue derived from sales to our In-country Operations) were $277.2 million and $15.1 million.
| • | As an in-country distributor in 12 countries, we currently sell to over 48,000 local reseller and retailer customers, including value- added resellers (companies that sell, install and support IT products and personal computers, which we refer to as PCs), systems builders (companies that specialize in building complete computer systems by combining components from different vendors), smaller distributors and retailers. |
For the year ended December 31, 2009, revenue and operating income from our In-country Operations were $682.2 million and $17.2 million, representing 74.4% and 84.9% of our consolidated revenue and operating income, respectively. For the year ended December 31, 2008, revenue and operating income from our In-country Operations were $794.3 million and $9.9 million, respectively.
Our Strengths
We have capitalized on our strengths to achieve a leadership position in the markets we serve. Our strengths include:
Pure play IT products distributor with leading positions in a large and growing market. We believe we are the largest pure play value-added distributor of IT products focused solely on Latin America and the Caribbean. We believe we hold the number one or number two market share position in each of the 12 countries in which we have an in-country distribution presence, except for Mexico and Colombia. We believe that we are well positioned in these markets to capitalize on the significant growth prospects driven by increasing PC and Internet penetration rates, increasing demand for notebook and netbook computers and an increasing market for PCs priced below $500. According to IDC, spending on IT products (including hardware, packaged software and services) in Latin America and the Caribbean is projected to grow from $51.9 billion in 2007 to $74.3 billion in 2013, growing at an average of 6.2% per year. This is more than twice as fast as the expected growth rate in IT spending in the United States over the same period and contrasts with a decline in IT spending in Latin America and the Caribbean from 2000 to 2006. Growth in these markets is expected to be driven primarily by increasing PC and Internet penetration rates as well as increasing demand for notebook and netbook computers. According to Pyramid Research, the Latin American and Caribbean PC penetration rate reached 24.7% in 2009 and is predicted to rise to 37.1% in 2013, which is still well below the U.S. and Canadian penetration rate of 95.5% in 2009. We expect that the higher growth in the market for PCs priced below $500 will drive a significant portion of this increase. We believe that we are well positioned in this market segment, which, according to Gartner, is expected to grow an average of 25.9% per year from 2009 to 2013. In addition, the rapid adoption of the Internet by Latin American and Caribbean consumers continues to fuel purchases of PCs. The number of Internet users is predicted by Pyramid Research to grow an average of 16.8% per year from 2009 to 2013, representing an increase in penetration rates from 29.1% to 51.8% over this period. Further, we expect to benefit from the accelerating growth in the notebook computers segment. Gartner expects notebook computer shipments to grow from 10.3 million units in 2009 to 24.5 million units in 2013, representing an average growth rate of 24.1% per year.
Unique business model creates industry-leading margins with significant barriers to entry. We operate both as a Miami-based wholesale aggregator and as an in-country distributor located in 12 countries throughout Latin America and the Caribbean. Our participation at two levels of the distribution chain (Miami and in-country), coupled with our extensive geographic footprint, creates a market presence that we believe is
2
Table of Contents
unmatched by any of our competitors and enables us to generate industry-leading margins among our public company competitors. Our dual distribution approach links a diversified set of vendors, primarily located in the United States and Asia, to a fragmented number of customers spread throughout Latin America and the Caribbean, and delivers value to both ends of the supply chain. To our vendors, we provide access to markets and customers that would be costly and inefficient for them to reach directly. For our reseller customers, we provide a cost- and time-effective source for product supply. Typically, resellers’ small order sizes prevent them from establishing direct relationships with major IT product vendors, and resellers’ limited in-stock inventory creates a need for aggregators and distributors that can provide rapid delivery of a wide variety of products. We provide resellers with broad and timely product availability, multivendor single source purchasing, technical support and local warranty service. Consequently, we are a critical component of the supply chain between most of the leading manufacturers of IT products in the United States and Asia and resellers in Latin America and the Caribbean. Over the last 20 years, we have built a broad distribution infrastructure throughout our region and gained important business experience and relationships in each of our markets. We believe that the significant time and investment required to establish an efficient regional distribution infrastructure and the valuable services we provide to both our vendors and customers create significant barriers to entry in each of our markets.
Strong revenue growth and sustainable industry-leading profitability. From our founding in 1988 to the present, we have experienced consistent sales growth. From 2001 to 2009, we achieved a CAGR in revenue of 13.9%. During this period, we also maintained consistently strong operating profitability, with a CAGR in operating income of 7.7%. In 2009, we achieved an operating income margin of 2.3%, compared to the operating margins for the most recent fiscal year of 1.1% and 1.2% of our two largest competitors, Ingram Micro and Tech Data, respectively (excluding any goodwill impairment or restructuring charges). Our unique business model, our broad geographic footprint and our focus on higher-margin components, peripherals and software have been the main contributors to our strong margins. We believe these strong margins have helped us achieve what we believe to be an industry-leading return among our public company competitors on invested capital, or ROIC, which we define as net after-tax operating profit divided by average shareholders’ equity and net debt. We have consistently achieved an ROIC in the low to mid teens, except for recent years effected by the economic crisis (7.5% in 2008 and 9.9% in 2009, excluding goodwill impairment, write-off of IPO costs and restructuring charges). Our strong ROICs have also been driven by our focus on minimizing our cash conversion cycle with centralized purchasing, efficient managing of in-country inventory levels, establishing strict customer credit policies and carefully monitoring on-going inventory and demand. Our cash conversion cycle (measuring the number of days to convert trade accounts receivable and inventory, net of accounts payable, into cash) was 30.2 days as of December 31, 2009.
Highly diverse business across multiple geographies and customers. We believe we have the broadest in-country presence of any distributor of IT products to Latin America and the Caribbean, in terms of the number of countries served through an in-country presence. We distribute products to more than 50,000 customers in 40 countries. The diversification of our geographic presence and customer base contributes to our consistent organic revenue growth and reduces our dependence on any single country or customer. We believe our diverse geographic presence will allow us to maintain a strong pace of organic growth in our target markets, driven by attractive market share expansion opportunities as well as strong underlying market growth characteristics. We can also use our deep knowledge of local markets to assess local market conditions and adjust our market focus as necessary. Moreover, the regional expertise we have gained in our multiple local markets can be applied and transferred when we expand our distribution platform into new geographies. In 2009, no country contributed more than 10% of our revenue, except Chile (23.4%). We have also established a strong brand and a reputation for providing excellent customer service that we believe builds customer loyalty and leads to recurring revenue. In addition, we offer customers a one-stop shop for purchasing a broad selection of products, which enables us to maintain a large and diverse group of customers and attract and maintain new customers. In 2009, no single customer represented more than 2.0% of our revenue on a consolidated basis.
3
Table of Contents
Strong vendor relationships and broad portfolio of products. We distribute and market more than 6,100 products from over 173 vendors, enabling us to offer a wide variety of products, satisfy customer requirements for product availability and meet end-user demand for multi-vendor and multi-product IT configurations. The large number of resellers and retailers in the region, their relatively small size, and their geographic fragmentation make it cost effective for vendors to rely on wholesale distributors like us that can deliver a broad regional distribution channel, rather than distributing directly to numerous fragmented resellers and retailers. We provide vendors with extensive regional coverage, larger order sizes, simplified logistics, lower distribution costs than if they dealt with each of our affiliates independently, quality pre- and post-sale marketing and technical support. We also eliminate the need for our vendors to handle issues such as local duty and tax arrangements, customer credit analysis and management of numerous small accounts. Consequently, we have established long-standing relationships with most of the leading manufacturers of IT products in the United States and Asia, who we believe value our ability to provide reliable and efficient access to the numerous and growing markets across Latin America and the Caribbean. In 2009, no single vendor’s products generated more than 19.1% of our revenue.
Experienced management team with significant equity ownership. Each of our two co-founders, who today are our Chief Executive Officer and Chairman, has more than 20 years of industry experience in Latin America and the Caribbean. Our senior managers have an average tenure of over 9 years with us and each has had substantial experience working in the region. In addition, the turnover rate among our senior managers has been low. Prior to this offering, our senior managers beneficially owned approximately 27.5% of our capital stock on a fully diluted basis and will own approximately % of our capital stock following the offering. As a result of their substantial equity interest, we believe that our management has significant incentive to continue to increase our revenue and margins.
Our Strategy
We intend to achieve future growth and profitability through the following strategies:
| • | Continue to strengthen our market leadership and customer relationships through superior customer services including differentiating ourselves from competitors by emphasizing customer care and long-term customer development. |
| • | Grow and strengthen our diverse customer base by leveraging our large selection of products and our comprehensive offering of value-added services, including product training and support, credit and financing and reverse logistics (i.e., handling returns to manufacturers of defective or unwanted parts and products). |
| • | Enhance our margins by maintaining close control over our operating expenses and realizing increased economies of scale in product purchasing and working capital management. |
| • | Build upon our comprehensive in-stock selection of more than 6,100 IT products by expanding our existing product categories to include additional products or vendors and by adding new product categories or subcategories for which there is growing consumer demand. |
| • | Grow our business through extensions of our existing capabilities (including further product diversification and targeting of new markets), increasing our customer base (by distributing products directly to retailers, including small non-traditional retailers), and expanding our product offering of private label and our own branded products. |
| • | Target selective acquisitions that we believe will expand our business into new markets or improve our distribution capabilities, while growing revenues and enhancing margins. |
4
Table of Contents
Citigroup Venture Capital International
In August 2004, Citigroup Venture Capital International, or CVC International, acquired a controlling interest in us through its investment vehicle Co-Investment LLC VII (Intcomex). CVC International is a unit of Citigroup Inc. engaged in private equity investments in emerging markets. Following this offering, CVC International will own approximately % of our common stock on a fully diluted basis (approximately % if the underwriters’ overallotment option is exercised in full).
Our Corporate History and Other Information
Anthony Shalom and Michael Shalom founded our company as a small software retailer in South Florida in 1988. We were reincorporated in Delaware on August 13, 2004 in connection with the investment by CVC International. Our principal executive offices are located at 3505 NW 107th Avenue, Miami, Florida 33178. Our telephone number is (305) 477-6230. Our website is available at www.intcomex.com.
5
Table of Contents
Selected Risk Factors
We face risks in operating our business, including risks that may prevent us from achieving our business objectives or that may hurt our business, financial condition and operating results. You should consider these risks before investing in our company.
Some of the important risks to our business and of this offering include the following:
| • | Global economic downturn. Global financial markets have recently experienced an extreme economic downturn and severe disruption, including, among other things, volatility in securities prices, severely diminished liquidity and credit availability, and rating downgrades of certain investments. If this downturn were to return or worsen, there could be severely negative implications to our business that may exacerbate many other risks described below. |
| • | Highly competitive environment. The IT products distribution industry in Latin America and the Caribbean is highly competitive and very fragmented. In certain markets, we compete against large multinational public companies that are significantly better capitalized than we are and potentially have greater bargaining power with vendors than we do. In all of our in-country markets, we also compete against a substantial number of locally-based distributors, many of which have a lower cost structure than we do. We refer to Ingram Micro, Tech Data, Bell Microproducts and SYNNEX in this prospectus as our public company competitors. |
| • | Dependence on IT and telecommunications systems and maintenance of company-wide reporting system. We are dependent on a variety of IT and telecommunications systems, including systems for managing our inventories, accounts receivable, accounts payable, order processing, shipping and accounting. We are in the process of continuing to install Sentai, our company-wide ERP, management and financial reporting system and our experience with this new platform is limited. |
| • | Dependence on IT products market in Latin America and the Caribbean. Historically, the strength of our business has been driven in large part by the growth of the IT products market in Latin America and the Caribbean. If the IT products market does not grow as quickly and in the manner we expect for any reason, including as a result of economic, political, social or legal developments in Latin America and the Caribbean, we may not be able to grow our business as expected. |
| • | Fluctuations in foreign currency exchange rates. A significant portion of our revenues from in-country operations is invoiced in currencies other than the U.S. dollar, and a significant amount of our in-country operating expenses are denominated in currencies other than U.S. dollars. In markets where we invoice in local currency, the appreciation of a local currency will reduce our gross profit and gross margins in U.S. dollar terms. In markets where books and records are prepared in currencies other than the U.S. dollar, the appreciation of a local currency will increase our operating expenses and decrease our operating margins in U.S. dollar terms. Large and sustained devaluations of local currencies can make many of our products more expensive in local currencies. This could result in our customers having difficulty paying those invoices and, in turn, result in decreases in revenue. Moreover, such devaluations may adversely impact demand for our products because our customers may be unable to afford them. |
| • | Challenge of establishing and maintaining sufficient management and financial reporting systems and internal and disclosure controls and hiring, retaining and training sufficient accounting and finance personnel. We rely on a variety of management and financial reporting systems and internal and disclosure controls to enable management to capitalize on business opportunities, identify unfavorable developments and risks at an early stage and to prepare accurate and timely financial information for our investors. As our business has grown rapidly in recent years and expanded into new |
6
Table of Contents
| geographic markets, the challenge of establishing and maintaining sufficient systems and controls and hiring, retaining and training sufficient accounting and finance personnel has intensified. |
| • | Restrictions in our debt agreements. The revolving credit facility agreement between our wholly-owned subsidiary Software Brokers of America, Inc., or SBA, and Comerica Bank as well as the indenture governing our 13 ¼% Second Priority Senior Secured Notes due 2014, which we refer to as the 13 ¼% Senior Notes, impose significant operating and financial restrictions on us and SBA. |
| • | Credit exposure from customers. We extend credit for a significant portion of sales to our customers. We are subject to the risk that our customers fail to pay or delay payment for the products they purchase from us, resulting in longer payment cycles, increased collection costs, defaults exceeding our expectations and an adverse impact on the cost or availability of financing. |
| • | Receiving adequate trade credit. Our business is working capital intensive and our vendors historically have been an important source of funding our business growth through the provision of trade credit. We expect to continue to rely on trade credit from our vendors to provide a significant amount of our working capital. If our vendors fail to provide us with sufficient trade credit, including larger amounts of trade credit, in a timely manner as our business grows, we may have to rely on other sources of financing, which may not be readily available or, if available, may not be on terms acceptable or favorable to us. |
| • | Dependence on a relatively small number of vendors. A significant portion of our revenue is derived from products manufactured by a relatively small number of vendors. Due to intense competition in the IT products distribution industry, our key vendors can choose to work with other distributors and, pursuant to standard terms in our vendor agreements, may terminate their relationships with us on short notice. |
| • | Concentration of stock ownership. After this offering, our executive officers, directors and principal stockholders will continue to be able to exercise control over all matters requiring stockholder approval, including the election of directors, amendment of our amended and restated certificate of incorporation and approval of significant corporate transactions and will have significant control over our management and policies. Their interests may not be aligned with your interests as a holder of our common stock. |
For a more detailed discussion of the these and other significant risks associated with our business, our industry and investing in our common stock, you should read the section entitled “Risk Factors” beginning on page 12 of this prospectus.
7
Table of Contents
| Common stock offered by us |
shares |
| Common stock to be outstanding immediately after this offering |
shares |
| Option to purchase additional shares of common stock |
We have granted to the underwriters an option, exercisable for 30 days from the date of this prospectus, to purchase up to additional shares of common stock at the public offering price less the underwriting discount. The underwriters may exercise the option solely for the purpose of covering over-allotments, if any, in connection with this offering. To the extent the option is exercised, each underwriter must purchase a number of additional shares approximately proportionate to that underwriter’s initial purchase commitment. |
| Use of proceeds |
We intend to use a portion of the proceeds of this offering to repurchase a significant portion of the 13 1/4% Senior Notes. |
We intend to use the remainder of our proceeds from this offering for fees and expenses in connection with this offering and general corporate purposes. Pending application of the net proceeds as described above, we intend to invest the net proceeds in short-term investment grade securities.
| Dividends |
We do not anticipate paying any cash dividends in the foreseeable future. |
| Proposed Nasdaq Global Market symbol |
“ICMX.” |
8
Table of Contents
| Risk factors |
Investing in our shares involves a high degree of risk. See “Risk Factors” beginning on page 12 of this prospectus for a discussion of factors you should carefully consider before deciding to invest in our common stock. |
Except as otherwise noted, all information in this prospectus:
| • | assumes that the underwriters do not exercise their option to purchase up to additional shares from us; |
| • | assumes the exchange by the holders of the 29,357 shares of our Class B common stock, non-voting for 29,357 shares of our voting common stock prior to or simultaneously with the completion of this offering; |
| • | assumes that the initial offering price is per share, the midpoint of the range set forth on the cover of this prospectus; |
| • | assumes our receipt of net proceeds of from the offering and the application of the proceeds as described under “Use of Proceeds;” |
| • | reflects a for one split of our common stock prior to or simultaneously with the completion of this offering; |
| • | excludes 1,280 shares of common stock issuable upon exercise of outstanding stock options granted prior to this offering to certain of our officers and directors with a weighted average exercise price of $1,077 per share, 853 of which were vested as of December 31, 2009. The options were antidilutive as of December 31, 2009 as the fair value of the options was below the exercise price of the options; and |
| • | excludes restricted stock grants of 306 shares of common stock granted to certain independent, non-employee directors. |
9
Table of Contents
Summary Historical Consolidated Financial and Other Data
The following table presents summary historical consolidated financial and other data as of and for the years ended December 31, 2007, 2008 and 2009. We derived the statement of operations and other data set forth below for the years ended December 31, 2007, 2008 and 2009 and the balance sheet data as of December 31, 2008 and 2009 from our audited consolidated financial statements (together with the notes thereto) that are included elsewhere in this prospectus. We derived the balance sheet and other data as of December 31, 2007 from our audited consolidated financial statements with respect to such date and period not included in this prospectus. You should read the following summary information in conjunction with “Selected Financial Information and Other Data,” “Management’s Discussion and Analysis of Financial Condition and Results of Operations” and our audited consolidated financial statements (together with the notes thereto) that are included elsewhere in this prospectus.
| Year Ended December 31, | ||||||||||||
| 2009 | 2008 | 2007 | ||||||||||
| (in thousands, except per share data and number of shares) |
||||||||||||
| Statement of Operations Data: |
||||||||||||
| Revenue |
$ | 917,168 | $ | 1,071,551 | $ | 1,038,368 | ||||||
| Cost of revenue |
825,587 | 970,955 | 937,286 | |||||||||
| Gross profit |
91,581 | 100,596 | 101,082 | |||||||||
| Operating expenses |
71,256 | 105,723 | 73,314 | |||||||||
| Operating income |
20,325 | (5,127 | ) | 27,768 | ||||||||
| Other (income) expense |
||||||||||||
| Interest expense |
17,495 | 17,431 | 17,763 | |||||||||
| Interest income |
(514 | ) | (941 | ) | (730 | ) | ||||||
| Other (income) expense, net |
(3,563 | ) | |
(3,427 |
) |
(292 | ) | |||||
| Foreign exchange (gain) loss |
(3,130 | ) | 15,533 | (2,401 | ) | |||||||
| Total other (income) expense |
10,288 | 28,596 | 14,340 | |||||||||
| Income before taxes |
10,037 | (33,723 | ) | 13,428 | ||||||||
| Income tax provision (benefit) |
2,844 | 1,595 | 867 | |||||||||
| Net income |
$ | 7,193 | $ | (35,318 | ) | $ | 12,561 | |||||
| Net income per common share (basic and diluted) |
$ | 69.94 | $ | (345.63 | ) | $ | 122.93 | |||||
| Weighted average number of shares used in per share calculation (basic and diluted)(3) |
102,852 | (2) | 102,182 | 102,182 | ||||||||
| As of December 31, | |||||||||
| 2009 | 2008 | 2007 | |||||||
| (in thousands) | |||||||||
| Balance Sheet Data: |
|||||||||
| Cash and cash equivalents |
$ | 27,234 | $ | 22,344 | $ | 29,399 | |||
| Working capital(1) |
110,693 | 75,726 | 101,629 | ||||||
| Total assets |
308,101 | 284,068 | 363,008 | ||||||
| Long-term debt (including capital leases) |
114,982 | 105,865 | 117,224 | ||||||
| Total debt |
129,711 | 136,906 | 143,590 | ||||||
| Total shareholders’ equity |
42,734 | 14,550 | 54,101 | ||||||
| Other Data: |
|||||||||
| Cash dividends per common share |
$ | 0.00 | $ | 0.00 | $ | 0.00 | |||
10
Table of Contents
| (1) | Working capital is defined as current assets less current liabilities. |
| (2) | Weighted average number of common shares, voting and Class B common stock, non-voting used in the per share calculation for the year ended December 31, 2009 reflects the issuance of 27,175 shares of Class B common shares, non-voting to certain of our existing shareholders and their affiliates concurrently with the redemption and cancellation of our 11 3/4% Second Priority Senior Secured Notes due 2011, or our 11 3/4% Senior Notes, and the closing of the 13 1/4% Senior Notes offering on December 22, 2009. |
| (3) | Weighted average number of common shares, voting and Class B common stock, non-voting used in the per share calculation for each year reflects the issuance of 2,182 shares of Class B common stock, non-voting to the sellers of Centel in connection with the re-acquisition of Centel on June 23, 2005. |
11
Table of Contents
Any investment in our common stock involves a high degree of risk. You should carefully consider the material risks described below together with all of the other information included in this prospectus before making an investment decision. If any of the following risks actually occurs, our business, results of operations or financial condition would likely suffer. In such an event, the trading price of our common stock could decline and you could lose all or part of your investment.
Risks Relating To Our Business
The recent global economic downturn and the disruptions in the credit markets could become increasingly worse, may improve in the near future, and could cause a severe disruption in our operations and adversely affect our business and results of operations.
Global financial markets have recently experienced an extreme economic downturn and severe disruption, including, among other things, volatility in securities prices, severely diminished liquidity and credit availability, and rating downgrades of certain investments. If this downturn were to return or worsen, there could be severely negative implications to our business that may exacerbate many other risks described below.
The recent global economic downturn and the associated credit crisis could return resulting in a negative impact on financial institutions and the global financial system, which would, in turn, have a negative impact on us and our creditors. Credit insurers could drop coverage on our customers and increase premiums, deductibles and co-insurance levels on our remaining or prospective coverage. Our suppliers have tightened trade credit already, and could do so further, which could negatively impact our liquidity. We may not be able to borrow additional funds under our existing credit facilities if participating banks become insolvent or their liquidity is limited or impaired. The subsequent tightening of credit in financial markets could also result in a decrease in the demand for IT products. A global recession could adversely affect our vendors’ and customers’ ability to obtain financing for operations and result in continued severe job losses and lower consumer confidence. Certain markets could experience deflation, which would negatively impact our average selling price and revenue.
If the recent downturn in the global economy returns, it may also further intensify competition, regionally and internationally, which may negatively affect our margins. The impact may be in the form of reduced prices, lower sales or reduced sales growth, loss of market share, lower gross margins, loss of vendor rebates, extended payment terms with customers, increased bad debt risks, shorter payment terms with vendors, increased capital investment and interest costs, increased inventory losses related to obsolescence and/or excess quantities, all of which could adversely affect our results of operations and financial condition. Our vendors and customers may become insolvent and file for bankruptcy, which also would negatively impact our results of operations.
Our business requires significant levels of capital to finance accounts receivable and inventory that is not financed by trade creditors. We believe that our existing sources of liquidity, including cash resources and cash provided by operating activities, supplemented as necessary with funds available under our credit arrangements, will provide sufficient resources to meet our present and future working capital and cash requirements for at least the next 12 months. However, the capital and credit markets have been experiencing unprecedented levels of volatility and disruption. Such market conditions may affect our ability to access the capital markets or the capital we require may not be available on terms acceptable to us, or at all, due to inability of our finance partners to meet their commitments to us. We are unable to predict the likely duration and severity of disruptions to financial markets and adverse economic conditions in the U.S. and other countries and the impact these events may have on our operations and the industry in general.
12
Table of Contents
We operate in a highly competitive environment and, as a result, we may not be able to compete effectively or maintain or increase our sales, market share or margins, particularly if a prolonged global economic downturn persists.
The IT products distribution industry in Latin America and the Caribbean is highly competitive. The factors on which IT distributors compete include:
| • | price; |
| • | availability and quality of products and services; |
| • | terms and conditions of sale; |
| • | availability of credit and payment terms; |
| • | timeliness of delivery; |
| • | flexibility in tailoring specific solutions to customers’ needs; |
| • | effectiveness of marketing and sales programs; |
| • | availability of technical and product information; and |
| • | availability and effectiveness of warranty programs |
The IT products distribution industry in Latin America and the Caribbean is very fragmented. In certain markets, we compete against large multinational public companies (including Ingram Micro, Tech Data, SYNNEX and Bell Microproducts) that are significantly better capitalized than we are and potentially have greater bargaining power with vendors than we do. In addition, our main competitor in Mexico, Ingram Micro, has a significantly larger market share than we do in that country. In all of our in-country markets, we also compete against a substantial number of locally based distributors, many of which have a lower cost structure than we do, in some cases because they operate in the gray market and the local “informal” economy. Due to intense competition in our industry, we may not be able to compete effectively against our existing competitors or new entrants to the industry, or maintain or increase our sales, market share or margins.
In addition, overcapacity in our industry and price reductions by our competitors may result in a reduction of our prices and thereby a reduction of our gross margins. We may also, as a result, lose market share, need to offer customers more credit or extended payment terms or need to reduce our prices in order to remain competitive, and any of these measures may result in an increase in our required capital, financing costs, and bad debt expense in the future.
We are dependent on a variety of IT and telecommunications systems and are subject to additional risks, as we are in the process of continuing to implement our company-wide reporting system, and any disruptions in our existing systems or delays in implementing our new system could adversely impact our ability to effectively manage our business and prepare accurate and timely financial information.
We are dependent on a variety of IT and telecommunications systems, including systems for managing our inventories, accounts receivable, accounts payable, order processing, shipping and accounting. In addition, our ability to price products appropriately and the success of our expansion plans depend to a significant degree upon our IT and telecommunications systems. We are in the process of continuing to install Sentai, our company-wide ERP, management and financial reporting system. Sentai is a scalable IT system that enables simultaneous decentralized decision-making by our employees involved in sales and purchasing while permitting control of daily operating functions by our senior management. We are also using the Sentai logistics and inventory management system in order to better adapt to higher shipping volumes. The ERP system has been implemented in our Miami Operations and 11 of our 12 In-country Operations. We completed the implementation of our core ERP system in Chile and some portions of Mexico in 2009 and expect to complete the remaining areas of Mexico in early 2010.
13
Table of Contents
Our experience with this new platform is limited and each new installation requires the training of our local employees. In addition, new installations may require further modifications in order to handle the different accounting requirements in each of the countries in which we operate. Any delay in installation or temporary or long-term failure of these systems, once installed, could adversely impact our ability to effectively manage our business and prepare accurate and timely financial information. Also, our failure to adapt and upgrade our systems to keep pace with our future development and expansion could hurt our results of operations.
If the IT products market in Latin America and the Caribbean does not grow as we expect, we may not be able to maintain or increase our present growth rate and our results of operations and financial condition could be affected.
Historically, the growth of our business has been driven in large part by the growth of the IT products market in Latin America and the Caribbean. In particular, we have benefited from rapid growth in PC and Internet penetration rates. We expect that our future growth will also depend in large part on further growth in the IT market including growth in PC and Internet penetration rates and increasing demand for notebook computers, netbooks, mobile and ultra portable drives. If the IT products market does not grow as quickly and in the manner we expect for any reason, including as a result of economic, political, social or legal developments in Latin America and the Caribbean, we may not be able to maintain or grow our business as expected which could have an impact on our results of operations and financial condition.
Economic, political, social or legal developments in Latin America and the Caribbean could hurt our results of operations and financial condition.
Historically, sales to Latin America and the Caribbean have accounted for almost all of our consolidated revenues. As a result, our financial results are particularly sensitive to the performance of the economies of countries in Latin America and the Caribbean. If local, regional or worldwide developments adversely affect the economies of any of the countries in which we do business, our results of operations and financial condition could be hurt. Our results are also impacted by political and social developments in the countries in which we conduct business and changes in the laws and regulations affecting our business in those regions. Changes in local laws and regulations could, among other things, make it more difficult for us to sell our products in the affected countries, restrict or prevent our receipt of cash from our customers, result in longer payment cycles, impair our collection of accounts receivable and make it more difficult for us to repatriate capital and dividends from our foreign subsidiaries to the ultimate U.S. parent company.
The economic, political, social and legal risks we are subject to in Latin America and the Caribbean include but are not limited to:
| • | deteriorating economic, political or social conditions; |
| • | additional tariffs, import and export controls or other trade barriers that restrict our ability to sell products into countries in Latin America and the Caribbean; |
| • | changes in local tax regimes, including the imposition of significantly increased withholding or other taxes or an increase in value added tax (“VAT”) or sales tax on products we sell; |
| • | changes in laws and other regulatory requirements governing foreign capital transfers and the repatriation of capital and dividends; |
| • | increases in costs for complying with a variety of different local laws, trade customs and practices; |
| • | delays in shipping and delivering products to us or customers across borders for any reason, including more complex and time-consuming customs procedures; and |
| • | fluctuations of local currencies. |
14
Table of Contents
Any adverse economic, political, social or legal developments in the countries in which we do business could harm our results of operations and financial condition.
Fluctuations in foreign currency exchange rates could reduce our gross profit and gross margins and increase our operating expenses in U.S. dollar terms.
We periodically engage in foreign currency forward contracts when available and when doing so is not cost prohibitive. In periods when we do not, foreign currency fluctuations may adversely affect our results of operations, including our gross margins and operating margins.
A significant portion of our revenues from our In-country Operations is invoiced in currencies other than the U.S. dollar, and a significant amount of our in-country operating expenses are denominated in currencies other than U.S. dollars. In markets where we invoice in local currency, including Argentina, Chile, Colombia, Costa Rica, Guatemala, Jamaica, Mexico, Peru and Uruguay, the appreciation of a local currency could have a marginal impact on our gross profit and gross margins in U.S. dollar terms. In markets where our books and records are prepared in currencies other than the U.S. dollar, the appreciation of the local currency will increase our operating expenses and decrease our operating margins in U.S. dollar terms.
Large and sustained devaluations of local currencies, like those that occurred in Brazil in 2000 and Argentina in 2001, can make many of our products more expensive in local currencies. This could result in our customers having difficulty paying those invoices and, in turn, result in decreases in revenue. Moreover, such devaluations may adversely impact demand for our products because our customers may be unable to afford them. For example, during 2009, our foreign exchange gain amounted to $3.1 million primarily due to the appreciation of the Chilean, Colombian and Uruguayan Pesos. The Chilean Peso strengthened by 19.9%, to 519 pesos per U.S. dollar as of December 31, 2009, from 648 pesos per U.S. dollar as of December 31, 2008. The Colombian Peso strengthened by 8.3%, to 2,065 pesos per U.S. dollar as of December 31, 2009, from 2,252 pesos per U.S. dollar as of December 31, 2008. The Uruguayan Peso also strengthened by 19.8%, to 20 pesos per U.S. dollar as of December 31, 2009, from 25 pesos per U.S. dollar as of December 31, 2008. For a more detailed discussion of the effect of foreign currency fluctuations on our results of operations, see “Management’s Discussion and Analysis of Financial Condition and Results of Operations—Quantitative and Qualitative Disclosures About Market Risk—Foreign exchange risk.”
We are exposed to market risk and credit exposure and loss as we engage in foreign currency exchange forward contracts to hedge foreign currency denominated payables for inventory purchases, in a currency other than the currency in which the products are sold.
We are exposed to fluctuations in foreign exchange rates and reduce our exposure to the fluctuations by sometimes using derivative financial instruments, particularly foreign currency forward contracts. We use these contracts to hedge foreign currency denominated payables for inventory purchases in the normal course of business, in a currency other than the currency in which the products are sold. Derivative financial instruments potentially subject our Company to risk. Volatile foreign currency exchange rates increase our risk related to products purchased in a currency other than the currency in which the products are sold in the normal course of business. We did not have any foreign currency forward contracts outstanding as of December 31, 2009. Our foreign currency forward contract with a notional amount of $11.8 million as of December 31, 2008, had a fair value of ($31,000).
We are exposed to market risk related to volatility in foreign currency exchange rates, including devaluation and revaluation of local currencies. The market risk related to the forward contracts is offset by changes in the valuation of the underlying foreign currencies being hedged. We are also exposed to credit loss in the event of nonperformance by our counterparties to foreign exchange forward contracts and we may not be able to adequately mitigate all foreign currency related risks. We manage our exposure to fluctuations in the value of currencies and interest rates using foreign currency forward contracts with creditworthy financial institution
15
Table of Contents
counterparties. We monitor our exposures and the creditworthiness of our financial institution counterparties. Credit exposure for derivative financial instruments is limited to the amounts, if any, by which the counterparties’ obligations under the contracts exceed our obligations to the counterparties. We manage the potential risk of credit loss through careful evaluation of counterparty credit standing, selection of counterparties from a limited group of financial institutions and other contract provisions.
We maintain a policy to protect against fluctuation in currency exchange rates, which may result in a loss. We do not use derivative financial instruments for trading or speculative purposes. The realization of any or all of these risks could have a significant adverse effect on our financial results and statement of operations.
Our management and financial reporting systems, internal and disclosure controls and finance and accounting personnel may not be sufficient to meet our management and reporting needs.
We rely on a variety of management and financial reporting systems and internal and disclosure controls to provide management with accurate and timely information about our business and operations. This information is important because it enables management to capitalize on business opportunities and identify unfavorable developments and risks at an early stage. We also rely on these management and financial reporting systems and internal and disclosure controls to enable us to prepare accurate and timely financial information for our investors.
The challenge of establishing and maintaining sufficient systems and controls and hiring, training and retaining sufficient accounting and finance personnel has intensified as our business has grown rapidly in recent years and expanded into new geographic markets. As a result, we have identified the need to expand our finance and accounting staff and enhance internal controls at both the corporate and in-country levels and enhance the training of in-country management personnel regarding internal controls and management reporting to meet our current needs. This process is ongoing. For example, although we expect Sentai, our company-wide ERP, management and financial reporting system, to enhance the control of daily operating functions by our senior management, Sentai has yet to be fully implemented in Mexico, the last operation not entirely on Sentai. The ERP system has been implemented in our Miami Operations and 11 of our 12 In-country Operations. We completed the implementation of our core ERP system in Chile and some portions of Mexico in 2009 and expect to complete the remaining areas of Mexico in early 2010.
As of the end of 2009, we determined the need to make certain enhancements to access controls within our IT systems to limit unauthorized access and user functionality in our financial reporting systems and ensure proper segregation of duties. We intend to develop additional controls that ensure authorized personnel have access only to the areas of our financial reporting systems necessary to effectively perform their particular job functions.
In 2008, we hired a new director of internal audit, vice president of human resources, a director of finance for our subsidiary in El Salvador and controllers for each of our subsidiaries in Jamaica and Mexico. In 2009, we hired a new director of finance for each of our subsidiaries in Guatemala, Chile and Colombia. In addition, we are continuously seeking to add personnel to our finance and accounting staff, institute new controls and enhance existing controls at our consolidated and subsidiary operating levels.
Although we believe our current management and financial reporting systems, internal and disclosure controls and finance and accounting personnel are sufficient to enable us to effectively manage our business, identify unfavorable developments and risks at an early stage and produce financial information in an accurate and timely manner, we cannot be sure this will be the case. For example, management identified a material weakness in one of our foreign operations control environment during 2008, which included the following: (i) a failure to perform proper management oversight of the local operations and monitor and test controls to detect the override of established controls and policies; (ii) failure to institute all elements of an effective program to detect and prevent personnel (considered to be employees performing functions under a services agreement in the
16
Table of Contents
ordinary course of business us under the laws of the jurisdiction in which the foreign entity operates) from improperly claiming tax withholding exemptions as non-employees; and (iii) failure to establish and maintain an effective control environment surrounding the payroll process and the disbursement process, including the failure to verify the existence of complete and accurate procedures to support a three-way matching process comparing the original purchase order, invoice and receipt records of the purchased products to support the approval and payment for services rendered or products purchased. This material weakness resulted in increased payroll tax and VAT in the amount estimated to be approximately $0.4 million in the second quarter of 2008.
Although management undertook corrective actions to remediate the failed controls surrounding the foreign operating entity’s purchase and receipt of products, such actions may prove to be ineffective or inadequate and may expose us to risk of misstatements in our financial statements. In such circumstances, investors and other users of our financial statement may lose confidence in the reliability of our financial information, and we could fail to comply with certain covenants in our debt agreements.
No matter how well designed and operated, a control system can provide only reasonable, not absolute, assurance that its objectives are met. Its inherent limitations include the realities that judgments in decision-making can be faulty and failures can occur due to simple mistakes. Moreover, controls can be circumvented by the acts of an individual, collusion of two or a group of people or by management’s decision to override the existing controls.
We believe that we need to continue to expand our finance and accounting staff, enhance internal controls at both the corporate and in-country levels and enhance the training of in-country management personnel regarding internal controls and management reporting to meet our future needs, as a result of our anticipated or future growth. We cannot be sure that we will be able to take all necessary actions in a timely manner to keep pace with our anticipated growth.
Although we believe our controls were effective as of yearend, if we fail to maintain sufficient management and financial reporting systems and internal and disclosure controls, hire, retain and train sufficient accounting and finance personnel, and enhance the training of in-country management personnel regarding internal controls and management reporting, our ability to prepare accurate and timely financial information could be impaired, hinder our growth and have a material adverse effect on our current or future business, results of operations and financial condition.
We could experience difficulties in staffing and managing our foreign operations, which could result in reduced revenues and difficulties in realizing our growth strategy.
We have many sales and distribution centers in multiple countries, which require us to attract managers of our business in each of those locations. In establishing and developing many of our in-country sales and distribution operations, we have relied in large part on the local market knowledge and entrepreneurial skills of a limited number of local managers in those markets. We have no employment agreements with any of our in-country managers. The loss of the services of any of these managers could adversely impact our results of operations in the market in which the manager is located. Further, it may prove difficult to find and attract new talent, including accounting and finance personnel, in our existing markets or any new markets we enter in Latin America and the Caribbean who possess the expertise required to successfully manage and operate our in-country sales and distribution operations. In 2009, we hired a new general manager and a director of finance for our operations in Colombia, each of whom we believe has the appropriate knowledge and management skills to oversee our operations. If we fail to recruit highly qualified candidates, we may experience greater difficulty realizing our growth strategy, which could hurt our results of operations.
17
Table of Contents
If we lose the services of our key executive officers, we may not succeed in implementing our business strategy.
We are currently managed by certain key executive officers, including one of our founders, Michael Shalom. These individuals have extensive experience and knowledge of our industry and the many local markets in which we operate. They also have been integral in establishing and expanding some of our most significant customer relationships and building our unique distribution platform. The loss of the services of these key executive officers could adversely affect our ability to implement our business strategy, and new members of management may not be able to successfully replace them. With the exception of an employment agreement with our Chief Financial Officer, which has expired and is under renegotiation, we have no employment agreements with any of our key executive officers.
We are exposed to increased costs associated with complying with the Sarbanes-Oxley Act of 2002 (the “Sarbanes-Oxley Act”) and other corporate governance and disclosure standards. Compliance efforts could divert management time from revenue-generating activities to compliance activities. Failures to comply could cause reputational harm and additional costs to remedy shortcomings.
The Sarbanes-Oxley Act and the rules promulgated by the SEC require us to adopt various corporate governance practices and implement various internal controls. Our efforts to comply with evolving laws, regulations and standards applicable to public companies have resulted in, and are likely to continue to result in, increased expenses and a diversion of management time from revenue-generating activities to compliance activities.
In particular, Section 404 of the Sarbanes-Oxley Act (“Section 404”) requires our management to annually review and evaluate our internal controls over financial reporting and attest to the effectiveness of these controls, beginning with our fiscal year ended December 31, 2007. The Sarbanes-Oxley Act requires our independent registered public accounting firm to attest to the effectiveness of internal control over financial reporting, beginning with our fiscal year ended December 31, 2010. To date, our ongoing efforts to comply with Section 404 have required the commitment of significant financial and managerial resources. In the event that our Chief Executive Officer, Chief Financial Officer or independent registered public accounting firm determines that our controls over financial reporting are not effective as required by Section 404 at any time in the future, investor perceptions of us and our reputation may be adversely affected and we may incur significant additional costs to remedy shortcomings in our internal controls.
We may be required to recognize further impairments of our goodwill, identifiable intangible assets or other long-lived assets or to establish further valuation allowances against our deferred income tax assets, which could adversely affect our results of operations or financial condition.
In the fourth quarter of 2008, consistent with the severe decline in the global capital markets, we experienced a similar decline in the market value of our goodwill and other intangible assets. As a result, our fair value of goodwill was significantly lower than book value. We perform our impairment test of our goodwill and other intangible assets on an annual basis. As a result of this evaluation, we recognized a charge of $18.8 million against the carrying value of our goodwill for the year ended December 31, 2008. This non-cash charge materially impacted our equity and results of operations in 2008, but did not impact our ongoing business operations, liquidity or cash flow. We did not recognize a charge against the carrying value of our goodwill, identifiable intangible assets or other long-lived assets as of December 31, 2009.
As part of our 2009 impairment analysis of our goodwill, we noted that our operations in Centel reflected a fair value that exceeded its carrying value by approximately 3.4%. The fair value was determined using management’s conservative projections, giving the recent severe economic contraction in Mexico’s gross domestic product, or GDP, and our independent valuation experts’ estimate of fair value. As of December 31, 2009, we have $2.9 million of goodwill attributable to our operations in Mexico, which represents approximately
18
Table of Contents
11.2% of Centel’s carrying value and less than 1.0% of our total assets. An extended period of economic contraction could result in a further impairment to the carrying value of the goodwill attributable to our operations in Mexico.
Deferred income tax represents the tax effect of the differences between the book and tax bases of assets and liabilities. Deferred tax assets, which also include net operating loss carryforwards for entities that have generated or continue to generate operating losses, are assessed periodically by management to determine if their future benefit will be fully realized. Factors in management’s determination include the performance of the business and the feasibility of ongoing tax planning strategies. If available information indicates that it is more likely than not that the deferred income tax asset will not be realized then a valuation allowance must be established with a corresponding charge to net (loss) income. Such charges could have a material adverse effect on our results of operations or financial condition. As a result of our evaluation, we established a valuation allowance against the carrying value of our long-term deferred tax assets of $6.4 million and $4.8 million, respectively, as of December 31, 2009 and 2008.
Our future results of operations may be impacted by a prolonged weakness in the global economic environment that may result in a further impairment of any existing goodwill or goodwill recorded in the future and/or other long-lived assets or further valuation allowances on our deferred tax assets, which could adversely affect our results of operations or financial condition.
The indenture governing our 13 1/4% Senior Notes and the credit agreement governing Software Brokers of America, Inc. (“SBA”)’s Senior Secured Revolving Credit Facility imposes significant operating and financial restrictions on our Company and our subsidiaries, which may prevent us from capitalizing on business opportunities.
The indenture governing our 13 1/4% Senior Notes imposes significant operating and financial restrictions on us. These restrictive covenants limit our ability, among other things to:
| • | incur additional indebtedness or enter into sale and leaseback obligations; |
| • | pay certain dividends or make certain distributions on our capital stock or repurchase our capital stock; |
| • | make certain investments or other restricted payments; |
| • | place restrictions on the ability of subsidiaries to pay dividends or make other payments to us; |
| • | engage in transactions with shareholders or affiliates; |
| • | sell certain assets or merge with or into other companies; |
| • | guarantee indebtedness; and |
| • | create liens. |
The Senior Secured Revolving Credit Facility limits SBA’s ability, among other things, to:
| • | incur additional indebtedness; |
| • | make certain capital expenditures; |
| • | guarantee certain obligations, other than SBA’s guarantee of our 13 1/4% Senior Notes; |
| • | create or allow liens on certain assets, other than liens securing our 13 1/4% Senior Notes; |
| • | make investments, loans or advances; |
| • | pay dividends, make distributions and undertake stock and other equity interest buybacks; |
| • | make certain acquisitions; |
19
Table of Contents
| • | engage in mergers, consolidations or sales of assets; |
| • | use the proceeds of the revolving credit facility for certain purposes; |
| • | enter into transactions with affiliates on non-arm’s length transactions; |
| • | make certain payments on subordinated indebtedness; and |
| • | acquire or sell subsidiaries. |
The Senior Secured Revolving Credit Facility financial covenants require the following of SBA and the Company:
| • | maintain a consolidated total leverage ratio of not greater than 5.50 to 1.00 commencing with the quarter ending March 31, 2010 and each quarter thereafter with the quarter ending December 31, 2010, 5.00 to 1.00 for the quarters ending March 31, 2011 and June 30, 2011, 4.50 to 1.00 for the quarters ending September 30, 2011 and December 31, 2011, 4.00 to 1.00 for the quarters ending March 31, 2011 and each quarter ending thereafter; |
| • | maintain a consolidated fixed charge coverage ratio of not less than 1.00 to 1.00 commencing March 31, 2010, on a year-to-date basis through December 31, 2010, and on a rolling four-quarter basis thereafter; and |
| • | maintain consolidated net income of not less than $0 commencing with the quarter ending December 31, 2009, not less than ($500,000) for the quarter ending March 31, 2010, $0 for each of the quarters ended March 31, 2010 and each quarter thereafter with the quarter ending December 31, 2010, not less than ($500,000) for the quarter ending March 31, 2011, $0 for each of the quarters ended March 31, 2011 and each quarter thereafter with the quarter ending December 31, 2011, not less than ($500,000 for the quarter ending March 31, 2012, $0 for each of the quarters ended March 31, 2012 and each quarter thereafter. |
Our and SBA’s failure to comply with the restrictive covenants could result in an event of default, which, if not cured or waived, could result in either of us having to repay our respective borrowings before their respective due dates. If we or SBA is forced to refinance these borrowings on less favorable terms, our results of operations or financial condition could be harmed. In addition, if we are in default under any of our existing or future debt facilities, we also will not be able to borrow additional amounts under those facilities to the extent they would otherwise be available and may not be able to repay our existing indebtedness.
Our substantial debt could limit the cash flow available for our operations, which could adversely affect our business.
We have and will continue to have a substantial amount of debt, which requires significant interest and principal payments. As of December 31, 2009, we had $129.7 million of total debt outstanding (consisting of $113.3 million outstanding under our $120.0 million 13 1/4% Senior Notes, net of discount, $9.2 million outstanding under our Senior Secured Revolving Credit Facility, $6.2 million of outstanding debt of our foreign subsidiaries and $1.0 million of capital leases of SBA). Subject to the limits contained in the indenture governing our 13 1/4% Senior Notes and our other debt instruments, we may be able to incur additional debt from time to time to finance working capital, capital expenditures, investments or acquisitions, or for other purposes. If we incur additional debt, the risks related to our high level of debt could intensify. Specifically, our high level of debt could have important consequences to the holders of our common stock, including the following:
| • | limiting our ability to obtain additional financing to fund future working capital, capital expenditures, acquisitions or other general corporate requirements; |
| • | requiring a substantial portion of our cash flows to be dedicated to debt service payments instead of other purposes; |
20
Table of Contents
| • | increasing our vulnerability to general adverse economic and industry conditions; |
| • | limiting our flexibility in planning for and reacting to changes in the industry in which we compete; |
| • | placing us at a disadvantage compared to other, less leveraged competitors; and |
| • | increasing our cost of borrowing. |
We may not be able to maintain compliance with our current debt covenants or any additional covenants in the future and our failure to do so could adversely impact our liquidity.
The credit agreement governing the Senior Secured Revolving Credit Facility and the indenture governing our outstanding 13 1/4% Senior Notes contain restrictive covenants and financial covenants. Our and SBA’s failure to comply with the restrictive covenants could result in an event of default, which, if not cured or waived, could result in either of us having to repay our respective borrowings before their respective due dates. If we or SBA is forced to refinance these borrowings on less favorable terms, our results of operations or financial condition could be harmed. In addition, if we are in default under any of our existing or future debt facilities, we also will not be able to borrow additional amounts under those facilities to the extent they would otherwise be available.
On March 20, 2009, SBA obtained a waiver to the Revolving Credit Facility from Comerica Bank for our senior debt to tangible effective net worth ratio, minimum tangible effective net worth and net income as of December 31, 2008. SBA also obtained an amendment to the facility for the definitions of the borrowing base, revolving credit note and SBA’s permitted investments. During 2008, SBA obtained waivers to the facility for the minimum tangible effective net worth and senior debt to tangible effective net worth ratio as a result of the default of its minimum tangible effective net worth and senior debt to tangible effective net worth ratio. SBA also obtained an amendment to the facility decreasing the minimum tangible effective net worth and requiring SBA to maintain a senior debt to tangible effective net worth ratio and a tangible effective net worth. Also during 2008, SBA obtained an amendment for the definition of the tangible effective net worth. For a detailed discussion of the waivers and amendments to SBA’s Revolving Credit Facility with Comerica Bank, see “Management’s Discussion and Analysis of Financial Condition and Results of Operations.”
We may not be able to continue to maintain compliance with our current covenants or any additional covenants in the future and, if we fail to do so, we may not be able to obtain waivers from the lenders or amend any such covenants on acceptable terms or at all. If we fail to obtain such waivers or a replacement facility, we may not have resources sufficient at our parent company level or otherwise to meet our anticipated debt service requirements, capital expenditures and working capital needs. The recent global economic downturn and the subsequent tightening in the credit markets further heighten the risk that we may not be able to obtain replacement or alternative sources of financing.
We have significant credit exposure to our customers. If we are unable to effectively manage our accounts receivable, it could result in longer payment cycles, increased collection costs and defaults exceeding our expectations and adversely impact the cost or availability of our financing.
We extend credit for a significant portion of sales to our customers. Any negative trends in our customer’s businesses as well as their inability to obtain financing for operations could increase the risk that we may be unable to collect on receivables on a timely basis, or at all. If our customers fail to pay or delay payment for the products they purchase from us, it could result in longer payment cycles, increased collection costs, defaults exceeding our expectations and an adverse impact on the cost or availability of financing. If there is a substantial deterioration in the collectability of our receivables, we may not be able to obtain credit insurance at reasonable rates and credit insurers may drop coverage on our customers and increase premiums, deductibles and co-insurance levels on our remaining or prospective coverage. If we are unable to collect under existing credit insurance policies, or fail to take other actions to adequately mitigate such credit risk, our earnings, cash flows
21
Table of Contents
and our ability to utilize receivable-based financing could deteriorate. These risks may be exacerbated by a variety of factors, including adverse economic conditions, solvency issues experienced by our customers as a result of an economic downturn or a decrease in IT spending by end-users, decreases in demand for our products and negative trends in the businesses of our customers.
We have a number of credit facilities under which the amount we are able to borrow is based on the value and quality of our accounts receivable. The value and quality of our accounts receivable is affected by several factors, including:
| • | the collectability of our accounts receivable; |
| • | general and regional industry and economic conditions; and |
| • | our and our customers’ financial condition and creditworthiness. |
Any reduction in our borrowing capacity under these credit facilities could adversely affect our ability to finance our working capital and other needs.
Although we obtain credit insurance against the failure to pay or delay in payment for our products by some of the customers of our Miami Operations, our results of operations and liquidity could be hurt by a loss for which we do not have insurance or that is subject to an exclusion or that exceeds our applicable policy limits. In addition, increasing insurance premiums could adversely affect our results of operations. Moreover, failure to obtain credit insurance may have a negative impact on the amount of borrowing capacity available to our Miami based operations under SBA’s Senior Secured Revolving Credit Facility.
If we are unable to obtain sufficient trade credit from our vendors or other sources in a timely manner and on reasonable terms, our results of operations could be adversely affected and our growth inhibited.
Our business is working capital intensive and our vendors historically have been an important source of funding for our business growth through the extension of trade credit. We expect to continue to rely on trade credit from our vendors to provide a significant amount of our working capital. If our vendors fail to provide us with sufficient trade credit, including larger amounts of trade credit, in a timely manner as our business grows, we may have to rely on other sources of financing, which may not be readily available or, if available, may not be on terms acceptable or favorable to us. Given the recent economic downturn, many of our vendors reduced the level of available trade credit extended to us as a result of our vendors’ view of our liquidity at the time. The continuing economic troubles and the tightening in the credit markets further heightens the risk that we may not be able to obtain such trade credit or alternative sources of financing, or that to the extent we can obtain it, the terms are unfavorable. If we are unable to obtain sufficient trade credit from our vendors or other sources in a timely manner, our results of operations could be adversely affected and our growth inhibited.
In addition, our ability to pay for products is largely dependent on our principal vendors providing us with payment terms that facilitate the efficient use of our capital. The payment terms we receive from our vendors are based on several factors, including (i) our recent operating results, financial position (including our level of indebtedness) and cash flows; (ii) our payment history with the vendor; (iii) the vendor’s credit granting policies (including any contractual restrictions to which it is subject), our creditworthiness (as determined by various entities) and general industry conditions; (iv) prevailing interest rates; and (v) the vendors’ ability to obtain credit insurance in respect of amounts that we owe. Adverse changes in any of these factors, many of which are not within our control, could increase the costs to us of financing our inventory and may limit or eliminate our ability to obtain vendor financing and hurt our results of operations and financial condition.
22
Table of Contents
Our expansion into new markets may present additional risks, which may limit our success in those markets and could hurt our results of operations.
We currently have in-country sales and distribution operations in 12 Latin American and Caribbean countries and a sales office in Brazil. We expect to enter into new geographic markets both within the countries where we already conduct operations and in new countries where we have no prior operating or distribution presence. In new markets, we will face challenges such as customers’ lack of awareness of our brand, difficulties in hiring personnel and our unfamiliarity with local markets. New markets may also have different competitive conditions from our existing markets and may generate lower margins. Any failure on our part to recognize or effectively respond to these differences may limit the success of our operations in those markets, and could hurt our results of operations.
We depend on a relatively small number of vendors for products that make up a significant portion of our revenue and the loss of a relationship with any of our key vendors may hurt our results of operations.
A significant portion of our revenue is derived from products manufactured by a relatively small number of vendors. For the years ended December 31, 2009, 2008 and 2007, our top 10 vendors manufactured products that accounted for 66.1%, 65.0% and 65.5%, respectively, of our total revenue and the products of our top vendor accounted for 19.1%, 17.4% and 16.7%, respectively, of our total revenue. We expect that we will continue to obtain most of our products from a relatively small number of vendors and that the portion of our revenue that we obtain from such vendors may continue to increase in the future. Due to intense competition in the IT products distribution industry, our key vendors can choose to work with other distributors and, pursuant to standard terms in our vendor agreements, may terminate their relationships with us on short notice. The loss of a relationship with any of our key vendors may hurt our results of operations.
In addition, a prolonged global economic downturn may lead to the consolidation of certain vendors with other vendors, contract assemblers or distributors. The increased size, operating and financial resources of such consolidated vendors could allow them to sell more products directly to customers and reduce the number of authorized distributors with which they conduct business. Such direct sales by vendors and/or the loss of a relationship with any of our key vendors could hurt our results of operations.
Our vendors generally can unilaterally change the terms of our distribution agreements for future orders and if they adversely change the terms, our results of operations could be hurt.
The distribution agreements provided by our vendors are generally “at will” agreements that have finite lives. Generally, each vendor has the ability to unilaterally change the terms and conditions of its distribution agreements for future orders, including a reduction in the level of purchase discounts, rebates and marketing programs available to us. If we are unable to pass the impact of these changes through to our reseller and retailer customers (usually through increased prices), our results of operations could be hurt.
We are dependent on vendors to maintain adequate inventory levels and oversupplies may adversely affect our margins and product shortages may adversely affect our revenues and costs.
We depend on our vendors to maintain adequate inventory. Our inventory levels may vary from period to period, due primarily to the anticipated and actual sales levels and our purchasing levels. The IT industry occasionally experiences an oversupply of IT products, which vendors then sell on the market at reduced prices. If oversupplies occur, our results of operations could be adversely affected. The IT industry is also characterized by periods of severe product shortages due to vendors’ difficulties in projecting demand for certain products distributed by us. When such product shortages occur, we typically receive an allocation of products from the vendor. Our vendors may not be able to maintain an adequate supply of products to fulfill all of our customer orders on a timely basis and the costs of these products to us may increase. Any supply shortages or delays (some
23
Table of Contents
or all of which are beyond our control) could cause us to be unable to service customers on a timely basis. If the decline in sales or increased costs due to product shortages is not offset by higher prices, this could hurt our results of operations.
We are subject to the risk that our inventory values may decline, which could adversely affect our results of operations.
The IT products distribution industry is subject to rapid technological change, new and enhanced product specification requirements and evolving industry standards. These factors may cause a substantial decline in the value of our inventory or may render all or substantial portions of our inventory obsolete. Changes in customs or security procedures in the countries through which our inventory is shipped, as well as other logistical difficulties that slow the movement of our products to our customers, can also exacerbate the impact of these factors. While some of our vendors offer us limited protection against the decline in value of our inventory due to technological change or new product developments in the form of credit or partial refunds, these protective policies are largely subject to the discretion of our vendors and change from time to time. In addition, we distribute private label products for which price protection and rights of return are not customarily contractually available, and for which we bear increased risks. In any event, the protective terms of our vendor agreements may not adequately cover declines in our inventory value and these vendors may discontinue providing these terms at any time in the future. Any decline in the value of our inventory not offset by vendor credits or refunds could adversely affect our results of operations.
If our vendors fail to respond quickly to technological changes and innovations and our product offerings fail to satisfy consumers’ tastes or respond to changes in consumer preferences, our revenues may decline and our competitors may gain additional market share.
Our ability to stay competitive in the IT products distribution industry and increase our customer base depends on our ability to offer, on a continuous basis, a selection of appealing products that reflect our customers’ preferences. To be successful, our product offerings must be broad in scope, competitively priced, well-made, innovative and attractive to a wide range of consumers whose preferences may change regularly. This depends in large part on the ability of our key vendors to respond quickly to technological changes and innovations and to manufacture new products that meet the new and changing demands of our customers and requires on the part of vendors a continuous investment of resources to develop and manufacture new products. If our key vendors fail to respond on a timely basis to the rapid technological changes that have been characteristic of the IT products industry, fail to provide new products that are desired by consumers or otherwise fail to compete effectively against other IT products manufacturers, the products that we offer may be less desirable to consumers and we could suffer a significant decline in our revenue. The ability and willingness of our vendors to develop new products depends on factors beyond our control. If our product offerings fail to satisfy consumers’ tastes or respond to changes in consumer preferences, our revenues may decline and our competitors may gain additional market share.
Direct sourcing by our customers could result in our customers reducing their purchases from us, which would hurt our results of operations.
We occupy a position in the middle of the IT products distribution chain in Latin America and the Caribbean, between IT product vendors and locally-based distributors, resellers and retailers. Further industry consolidation, increased competition, technological changes and other developments, including improvements in regional infrastructure, may cause our vendors to bypass us and sell directly to our customers. As a result, our distributor, reseller and retailer customers and our vendors may increase the level of direct business they do with each other, which could reduce their purchases from us and hurt our results of operations.
24
Table of Contents
We may suffer from theft of inventory, which could result in losses and increases in security and insurance costs.
We store significant quantities of inventory at warehouses in Miami and throughout Latin America and the Caribbean. We and our third party shippers have experienced inventory theft at, or in transit to or from, certain facilities in several of our locations at various times in the past. In the future, we may be subject to significant inventory losses due to theft from our warehouses, hijacking of trucks carrying our inventory or other forms of theft. The implementation of security measures beyond those we already utilize, which include the establishment of alarm systems in our warehouses, GPS tracking systems on delivery vehicles and armed escorts for shipment of our products, in each case in certain of our locations, would increase our operating costs.
Any losses of inventory could exceed the limits of, or be subject to an exclusion from, coverage under our insurance policies. In addition, claims filed by us under our insurance policies could lead to increases in the insurance premiums payable by us or the termination of coverage under the relevant policy. As a result, losses of inventory, whether or not insured, could adversely affect our results of operations.
We rely on third-party shippers and carriers whose operations are outside our control, and any failure by them to deliver products to our customers in a timely manner may damage our reputation and could cause us to lose customers.
We rely on arrangements with third-party shippers and carriers such as independent shipping companies for timely delivery of our products to our in-country sales and distribution operations and third-party distributors, resellers and retailers. As a result, we are subject to carrier disruptions and increased costs due to factors that are beyond our control, including labor strikes, inclement weather and increased fuel costs. If the services of any of these third parties become unsatisfactory, we may experience delays in meeting our customers’ product demands and we may not be able to find a suitable replacement on a timely basis or on commercially reasonable terms. Any failure to deliver products to our customers in a timely manner may damage our reputation and could cause us to lose customers.
We may not realize the expected benefits from any future acquisitions, thereby adversely impacting our growth.
As part of our strategy, we may pursue acquisitions in the future. Our success in realizing the expected benefits from any business acquisitions depends on a number of factors, including retaining or hiring local management personnel to run our operations in new countries, successfully integrating the operations, IT systems, customers, vendors and partner relationships of the acquired companies and devoting sufficient capital and management attention to the newly acquired companies in light of other operational needs. Our efforts to implement our strategy could be affected by a number of factors beyond our control, such as increased competition and general economic conditions in the countries where the newly acquired companies operate. Any failure to effectively implement our strategy could adversely impact our growth.
We anticipate that we may need to raise additional financing to grow our business but it may not be available on terms acceptable to us, if at all.
We expect our operating expenditures and working capital needs will increase over the next several years as our sales volume increases and we expand our geographic presence and product portfolio. We currently believe that our cash on hand, anticipated cash provided by operations, available and anticipated trade credit and borrowings under SBA’s Senior Secured Revolving Credit Facility and our in-country lines of credit, will provide sufficient resources to meet our anticipated debt service requirements, capital expenditures and working capital needs for the next 12 months. However, if our results of operations are not as favorable as we anticipate (including as a result of increased competition), our funding requirements are greater than we expect (including
25
Table of Contents
as a result of growth in our business) or our liquidity sources are not at anticipated levels (including levels of available trade credit), our resources may not be sufficient and we may have to raise additional capital to support our business.
In addition, we may not be able to accurately predict future operating results or changes in our industry which may change these needs. In the event that such additional financing is necessary, we may seek to raise such funds through public or private equity or debt financing or other means. We may not be able to obtain additional financing when we need it, or we may not be able to raise financing on terms acceptable to us. The tightening in the credit markets heightens this risk. In addition, we may not be able to borrow additional funds under our existing credit facilities if participating banks become insolvent or their liquidity is limited or impaired. In the event that adequate funds are not available in a timely manner, our business and results of operations may be harmed.
We are exposed to the risk of natural disasters, war and terrorism that could disrupt our business and result in increased operating costs and capital expenditures.
Our Miami headquarters, some of our sales and distribution centers and certain of our vendors and customers are located in areas prone to natural disasters such as floods, hurricanes, tornadoes or earthquakes. In addition, demand for our services is concentrated in major metropolitan areas. Adverse weather conditions, major electrical or telecommunications failures or other events in these major metropolitan areas may disrupt our business and may adversely affect our ability to distribute products. Our exposure to these risks may be heightened because we do not have a comprehensive disaster recovery system or disaster recovery plan. Our failure to have such a system or plan in place could hurt our results of operations and financial condition.
We operate in multiple geographic markets, several of which may be susceptible to acts of war and terrorism. Security measures and customs inspection procedures have been implemented in a number of jurisdictions in response to the threat of terrorism. These procedures have made the import and export of goods, including to and from our Miami headquarters, more time-consuming and expensive. Such measures have added complexity to our logistical operations and may extend our inventory cycle. Our business may be harmed if our ability to distribute products is further impacted by any such events. In addition, more stringent processes for the issuance of visas and the admission of non-U.S. persons to the U.S. may make travel to our headquarters in Miami by representatives of some vendors and customers more difficult. These developments may also hurt our relationships with these vendors and customers.
The combination of the factors described above could diminish the attractiveness of Miami as a leading business center for Latin America and the Caribbean in general, and as the central hub for the Latin American and Caribbean IT products distribution industry in particular. In the event of the emergence of one or more other hubs serving Latin America and the Caribbean that are more favorable to IT distributors, competitors operating in those locations could have an advantage over us. The relocation of all or a part of our main warehouse and logistics center in Miami to any such new hubs could materially increase our operating costs or capital expenditures.
In addition, because of concerns arising from large damage awards and incidents of terrorism, it has become increasingly difficult for us to obtain adequate terrorism insurance coverage at reasonable premiums, which has increased our costs.
Changes in accounting rules could adversely affect our business and results of operations.
Our consolidated financial statements are prepared in accordance with accounting principles generally accepted in the U.S. (“U.S. GAAP”). The U.S. government has authorized various policy-making bodies to interpret these principles and create appropriate accounting standards. Changes in these interpretations and standards, which may occur from time to time, may result in additional non-cash charges and/or changes in presentation or disclosure, which in turn could have a significant adverse effect on our results of operations.
26
Table of Contents
Risks Relating to Our Common Stock and This Offering
Concentration of ownership among our existing executive officers, directors and principal stockholders may prevent new investors from influencing significant corporate decisions, and the interests of our principal stockholder may not be aligned with yours.
Upon consummation of this offering, our executive officers, directors and principal stockholders will own, in the aggregate, approximately % of our outstanding common stock on a fully diluted basis. As a result, these stockholders will be able to exercise control over all matters requiring stockholder approval, including the election of directors, amendment of our amended and restated certificate of incorporation and approval of significant corporate transactions and will have significant control over our management and policies. The directors elected and appointed by these stockholders will be able to make decisions affecting our capital structure, including decisions to issue additional capital stock, implement stock repurchase programs and incur indebtedness. The interests of these stockholders may not be aligned with your interests as a holder of our common stock.
This control by our executive officers, directors and principal stockholders may have the effect of deterring hostile takeovers, delaying or preventing changes in control or changes in management, or limiting the ability of our other stockholders to approve transactions that they may deem to be in their best interests.
Furthermore, upon the consummation of this offering, CVC International will remain a significant stockholder with % of our outstanding common stock on a fully diluted basis. As a significant stockholder, CVC International will be able to exert significant influence on major decisions requiring stockholder approval, including the election of our board of directors, the selection of our management team, the determination of our corporate and management policies and certain other decisions relating to fundamental corporate actions. CVC International’s interests may not be aligned with your interests as a holder of our common stock.
No public market for our common stock currently exists, and we cannot assure you that an active, liquid trading market will develop or be sustained following this offering.
Prior to this offering, there has been no public market for our common stock. An active, liquid trading market for our common stock may not develop or be sustained following this offering. As a result, you may not be able to sell your shares of our common stock quickly or at the market price. The initial public offering price of our common stock will be determined by negotiations between us and the underwriters based upon a number of factors and may not be indicative of prices that will prevail following the consummation of this offering. The market price of our common stock may decline below the initial public offering price, and you may not be able to resell your shares of our common stock at or above the initial offering price and may suffer a loss on your investment.
The price of our common stock may fluctuate significantly, and it may trade at prices below the initial public offering price.
The market price of our common stock after this offering is likely to fluctuate significantly from time to time in response to factors including:
| • | investors’ perceptions of our prospects and the prospects of the IT distribution industry; |
| • | investors’ perceptions of the geographic markets in which we operate; |
| • | differences between our actual financial and operating results and those expected by investors and analysts; |
| • | changes in analysts’ recommendations or projections; |
| • | fluctuations in quarterly operating results; |
27
Table of Contents
| • | announcements by us or our competitors of significant acquisitions, divestitures, strategic partnerships, joint ventures or capital commitments; |
| • | changes or trends in our industry; |
| • | changes in the economic performance or market valuations of other IT distribution companies in general; |
| • | changes in relationships with vendors; |
| • | potential litigation; |
| • | additions or departures of key personnel; |
| • | changes in general economic conditions; and |
| • | broad market fluctuations. |
These factors may adversely affect the market price of our common stock, in many cases regardless of our actual operating performance. As a result, our common stock may trade at prices significantly below the initial public offering price.
Citigroup Global Markets Inc. may have a conflict of interest with respect to this offering.
Prior to the completion of this offering, CVC International, an affiliate of Citi, owned more than 10% of our outstanding common stock and therefore Citi is presumed to have a “conflict of interest” with us under FINRA Rule 5110. Accordingly, Citi’s interest may go beyond receiving customary underwriting discounts and commissions. In particular, there may be a conflict of interest between Citi’s own interests as underwriter (including in negotiating the initial public offering price) and the interests of its affiliate CVC International (as a principal shareholder). Because of the conflict of interest under FINRA Rule 5110, this offering is being conducted in accordance with the applicable provisions of that rule and Rule 2720. FINRA Rule 5110 and Rule 2720 require that the initial public offering price of the common stock be no higher than that recommended by a “qualified independent underwriter” (as such term is defined by FINRA Rule 5110), that also participates in the preparation of the registration statement and prospectus and conducts due diligence. Accordingly, UBS Securities LLC (“UBS”) is assuming the responsibilities of acting as the qualified independent underwriter in this offering. The initial public offering price of the common stock will be no higher than the price recommended by UBS. Although the qualified independent underwriter has participated in the preparation of the registration statement and prospectus, conducted due diligence and made a recommendation with respect to the initial offering price, we cannot assure you that this will adequately address any potential conflicts of interest related to Citi and CVC International. We have agreed to indemnify UBS for acting as qualified independent underwriter against certain liabilities, including liabilities under the Securities Act, and to contribute to payments that UBS may be required to make for these liabilities.
28
Table of Contents
Future sales of our common stock, or the perception that such sales may occur, could cause our stock price to fall.
Upon consummation of this offering, we expect that shares of our common stock will be outstanding, assuming no exercise of outstanding options, and shares if the underwriters’ over-allotment option is exercised in full. All of the shares sold in this offering will be freely transferable without restriction or further registration under the Securities Act, except for any shares purchased by our affiliates. Of the remaining shares outstanding, following expiration of the 180-day lock-up agreement described below, shares may be sold at any time without restriction and shares will be restricted securities within the meaning of Rule 144 under the Securities Act, but will be freely transferable subject to the applicable volume, manner of sale, holding period and other limitations of Rule 144 or under other exemptions from registration. Sales of substantial amounts of our common stock in the public market after the consummation of this offering, or the perception that such sales may occur, could adversely affect the market price of our common stock and could materially impair our future ability to raise capital through offerings of our common stock. See “Shares Eligible for Future Sale” for a more detailed description of the restrictions on selling shares of our common stock after this offering.
We, our officers and directors and our other existing stockholders and option holders have agreed, subject to limited exceptions, that for a period of 180 days from the date of this prospectus, each will not, without the prior written consent of Citi and UBS, dispose of or hedge any shares of our common stock or any securities convertible or exchangeable for our common stock. Citi and UBS in their sole discretion may release any of the securities subject to these lock-up agreements at any time without notice.
Purchasers in this offering will experience immediate and substantial dilution.
Prior investors have paid substantially less per share than the price in this offering. The initial public offering price is substantially higher than the net tangible book value per share of the outstanding common stock immediately after this offering. As a result, investors purchasing our common stock in this offering will incur immediate dilution of $ per share. For more information regarding effects of dilution, see the section entitled “Dilution” appearing elsewhere in this prospectus. The exercise of outstanding options and future equity issuances at prices below the initial public offering price would result in further dilution to purchasers in this offering.
We do not expect to pay any dividends for the foreseeable future.
We currently intend to retain future earnings to fund on-going operations and finance the growth and development of our business and, therefore, do not anticipate declaring or paying cash dividends on our common stock for the foreseeable future. Accordingly, investors must be prepared to rely on sales of their common stock after price appreciation to earn an investment return, and we cannot assure you that the price of our common stock will increase. Investors seeking cash dividends should not purchase our common stock. Any determination to pay dividends in the future will be made at the discretion of our board of directors and will depend on our results of operations, financial conditions, contractual restrictions, restrictions imposed by applicable law and other factors our board deems relevant.
29
Table of Contents
DISCLOSURE REGARDING FORWARD-LOOKING STATEMENTS
This prospectus contains forward-looking statements that are based on our current expectations, beliefs, estimates, forecasts, projections and management assumptions about our company, our future performance, our liquidity and the IT products distribution industry. Such forward-looking statements include statements regarding expected financial results and other planned events, including but not limited to, anticipated liquidity and liquidity needs, indebtedness and capital expenditures. Words such as “anticipate,” “assume,” “believe,” “estimate,” “expect,” “intend,” “plan,” “seek,” “project,” “target,” “goal” and variations of such words and similar expressions are intended to identify such forward-looking statements. . In addition, any statements that refer to projections of our future financial performance, our anticipated growth and trends in our businesses, and other characterizations of future events or circumstances including but not limited to, management’s expectations for competition, revenues, margin, expenses and other operating results; capital expenditures; liquidity; capital requirements, acquisitions and exchange rate fluctuations, each of which involves numerous risks and uncertainties are forward-looking statements. These forward-looking statements involve a number of risks and uncertainties that could cause actual results to differ materially from those suggested by the forward-looking statements. Forward-looking statements should, therefore, be considered in light of various factors, including those set forth in this prospectus under “Risk Factors” and elsewhere in this prospectus.
These risks and uncertainties include, but are not limited to, the following:
| • | the effects of the global economic downturn on the markets in which we operate or plan to operate, which may lead to a decline in our business and our results of operations; |
| • | an increase in competition in the markets in which we operate or plan to operate; |
| • | difficulties in maintaining and enhancing internal controls and management and financial reporting systems; |
| • | adverse changes in general, regional and country-specific economic and political conditions in Latin America and the Caribbean; |
| • | fluctuations of other currencies relative to the U.S. dollar; |
| • | difficulties in staffing and managing our foreign operations; |
| • | departures of our key executive officers; |
| • | increases in credit exposure to our customers; |
| • | adverse changes in our relationships with vendors and customers; or |
| • | declines in our inventory values. |
This list of factors that may affect future performance and the accuracy of forward-looking statements is illustrative but not exhaustive. In addition, new risks and uncertainties may arise from time to time. Accordingly, all forward-looking statements should be evaluated with an understanding of their inherent uncertainty. We caution you not to place undue reliance on these forward-looking statements, which speak only as of the date they were made. We do not undertake any obligation to publicly release any revisions to these forward-looking statements to reflect events or circumstances after the date of this prospectus. All forward-looking statements attributable to us or persons acting on our behalf are expressly qualified in their entirety by this cautionary statement.
30
Table of Contents
We estimate that our net proceeds from the sale of the shares of common stock offered by us will be approximately $ million, after deducting the underwriting discount and estimated offering expenses payable by us of approximately $ million. This assumes an initial public offering price of $ per share, which is the midpoint of the price range set forth on the front cover of this prospectus.
Because one of our principal stockholders, an affiliate of Citi, currently owns approximately % of our common stock on a fully diluted basis, this offering is being conducted in accordance with the applicable provisions of the FINRA Rules. These rules require, among other things, that the initial public offering price of the common stock be no higher than that recommended by a “qualified independent underwriter” (as such term is defined by the rules). UBS Securities LLC is assuming the responsibilities of acting as the qualified independent underwriter in this offering. See “Risk Factors—Risks Relating to Our Common Stock and This Offering—Citigroup Global Markets Inc. may have a conflict of interest with respect to this offering.” and “Underwriting.”
We intend to use a portion of the proceeds of this offering to repurchase a significant portion of the 13 1/4% Senior Notes. For addition information on these notes, see “Management’s Discussion and Analysis of Financial Condition and Results of Operations—”Description of Certain Indebtedness—13 1/4% Second Priority Senior Notes due 2014.”
We intend to use the remainder of our proceeds from this offering for fees and expenses in connection with this offering and general corporate purposes. Pending application of the net proceeds as described above, we intend to invest the net proceeds in short-term investment grade securities.
31
Table of Contents
The following table sets forth our cash and cash equivalents and our capitalization as of December 31, 2009. Our capitalization is presented:
| • | on an actual basis and |
| • | on an as adjusted basis to give effect to: |
| - | the sale by us of shares of our common stock, assuming that the initial public offering price is $ per share, the midpoint of the range set forth on the cover of this prospectus; |
| - | the intended application of the net proceeds of this offering as described in “Use of Proceeds,” as if the offering and the application of net proceeds of this offering had occurred on December 31, 2009; |
| - | the exchange by the holders of the 29,357 shares of our Class B common stock, non-voting for 29,357 shares of our voting common stock prior to or simultaneously with the completion of this offering; |
| - | the for one split of our common stock held by our existing stockholders prior to or simultaneously with the completion of this offering; |
| - | the grant to certain of our officers and directors in February 2007 of stock options to purchase a total of 1,280 shares of our common stock; and |
| - | the restricted stock grants of 306 shares of common stock granted to certain non-employee directors. |
This presentation should be read in conjunction with “Use of Proceeds,” “Management’s Discussion and Analysis of Financial Condition and Results of Operations” and our audited consolidated financial statements and related notes that are included elsewhere in this prospectus.
| As of December 31, 2009 | |||||||
| Actual | As Adjusted | ||||||
| (in thousands, except share data) | |||||||
| Cash and cash equivalents |
$ | 27,234 | $ | ||||
| Short-term debt |
|||||||
| Lines of credit |
14,729 | ||||||
| Current maturities of long-term debt |
557 | ||||||
| Long-term debt |
|||||||
| Capital leases and other |
1,079 | ||||||
| 13 1/4% Second Priority Senior Secured Notes due 2014(1) |
113,346 | ||||||
| Total Debt |
$ | 129,711 | $ | ||||
| Shareholders’ Equity |
|||||||
| Common stock, voting, $0.01 par value, 140,000 shares authorized, 100,000 issued and outstanding; shares authorized, issued and outstanding, pro forma |
1 | ||||||
| Common stock, non-voting, $0.01 par value, 60,000 shares authorized, 29,357 issued and outstanding; shares authorized, issued and outstanding |
— | ||||||
| Additional paid-in-capital |
41,388 | ||||||
| Retained earnings |
5,153 | ||||||
| Accumulated other comprehensive income |
(3,808 | ) | |||||
| Total shareholders’ equity |
$ | 42,734 | $ | ||||
| Total capitalization |
$ | 184,393 | $ | ||||
| (1) | Net of discount. |
32
Table of Contents
If you invest in our common stock, your ownership interest will be diluted to the extent of the difference between the initial public offering price per share and the pro forma net tangible book value per share immediately after this offering. Net tangible book value per share represents the amount of total tangible assets less total liabilities divided by the number of shares of our common stock outstanding. As of December 31, 2009, our net tangible book value was approximately $ , or $ per share of common stock. Dilution in the pro forma net tangible book value per share represents the difference between the amount per share paid by purchasers of common stock in this offering and the pro forma net tangible book value per share of common stock immediately after the consummation of this offering.
After giving effect to the sale of the shares of common stock at an assumed initial public offering price of $ per share (the midpoint of the range set forth on the cover of this prospectus) in this offering and after deducting underwriting discounts and commissions and estimated offering expenses payable by us and giving effect to the intended use of proceeds, our pro forma net tangible book value as of December 31, 2009 would have been approximately $ million, or $ per share of common stock. This represents an immediate increase in net tangible book value of $ per share to our existing stockholders and an immediate dilution of $ per share to new investors purchasing shares of common stock in this offering at the assumed initial offering price.
The following table illustrates this dilution on a per share basis:
| Assumed initial public offering price per share |
$ | $ | ||||
| Net tangible book value per share as of December 31, 2009 |
||||||
| Increase in net tangible book value per share attributable to this offering |
||||||
| Pro forma net tangible book value per share after this offering |
||||||
| Dilution per share to new investors |
$ | $ | ||||
A $1.00 increase (decrease) in the assumed initial public offering price of $ per share would increase (decrease) our net tangible book value by $ million, our pro forma net tangible book value per share after this offering by $ million and the dilution per share to new investors by $ , assuming the number of shares offered by us, as set forth on the cover page of this prospectus, remains the same and after deducting the estimated underwriting discounts and commissions and estimated offering expenses payable by us.
The following table summarizes, on a pro forma basis, as of December 31, 2009 the number of shares of our common stock purchased from us, the total consideration paid to us, and the average price per share paid to us by our existing stockholders and to be paid by new investors purchasing shares of our common stock in this offering. The table assumes an initial public offering price of $ per share, as specified above, and deducts underwriting discounts and commissions and estimated offering expenses payable by us:
| Shares Purchased | Total Consideration | Average Price Per Share | ||||||||||||
| Number |
Percentage | Amount | Percentage | |||||||||||
| Existing stockholders |
% | $ | % | $ | ||||||||||
| New investors |
% | $ | % | $ | ||||||||||
| Total |
100.0 | % | $ | 100.0 | % | $ | ||||||||
If the underwriters exercise their over-allotment option in full, the number of shares of common stock held by new investors will increase to approximately shares, or approximately % of the total number of shares of our common stock to be outstanding after this offering, our existing stockholders would own
33
Table of Contents
approximately % of the total number of shares of our common stock to be outstanding after this offering, the pro forma net tangible book value per share of common stock would be approximately $ and the dilution in pro forma net tangible book value per share of common stock to new investors would be $ .
The number of shares of common stock outstanding excludes 1,280 shares of common stock issuable upon exercise of outstanding stock options granted to certain of our officers and directors with a weighted average exercise price of $1,077 per share, none of which were vested as of December 31, 2009. If these outstanding options are exercised, new investors will experience further dilution. The number of shares of common stock outstanding also excludes restricted stock grants of 306 shares of common stock that we will grant to two independent directors at the initial public offering price at the pricing of this offering.
34
Table of Contents
We currently intend to retain future earnings to fund ongoing operations and finance the growth and development of our business, and do not anticipate declaring or paying cash dividends on our common stock for the foreseeable future. We did not pay any cash dividends in the years ended December 31, 2009, 2008 and 2007.
Any determination to pay dividends in the future will be made at the discretion of our board of directors and will depend on our results of operations, financial condition, contractual restrictions, restrictions imposed by applicable law and other factors our board deems relevant. The terms of certain of our and SBA’s outstanding indebtedness substantially restrict the ability of either company to pay dividends. For more information about these restrictions, see “Description of Certain Indebtedness.” In addition, because we are a holding company, our ability to pay dividends depends on our receipt of cash dividends from our subsidiaries.
35
Table of Contents
SELECTED CONSOLIDATED FINANCIAL DATA
The following table presents selected consolidated financial information and other data as of and for the years ended December 31, 2009, 2008, 2007, 2006 and 2005 and includes the results of operations of our acquisitions that have been combined with our results of operations beginning on their acquisition dates. We derived the statement of operations and other data set forth below for the years ended December 31, 2009, 2008 and 2007, and the balance sheet data as of December 31, 2009 and 2008 from our audited consolidated financial statements (together with the notes thereto) included elsewhere in this prospectus. We derived the selected financial information and other data for the years ended December 31, 2006 and 2005, and as of December 31, 2007, 2006 and 2005 from our audited consolidated financial statements with respect to such date and periods not included in this prospectus. You should read the following selected information in conjunction with “Management’s Discussion and Analysis of Financial Condition and Results of Operations” and our audited consolidated financial statements (together with the notes thereto) that are included elsewhere in this prospectus.
| As of or For the Years Ended December 31, | ||||||||||||||||||||
| 2009 | 2008 | 2007 | 2006 | 2005 (1) | ||||||||||||||||
| (Dollars in thousands, except per share and other data) | ||||||||||||||||||||
| Statement of Operations Data: |
||||||||||||||||||||
| Revenue |
$ | 917,168 | $ | 1,071,551 | $ | 1,038,368 | $ | 889,779 | $ | 716,440 | ||||||||||
| Cost of revenue |
825,587 | 970,955 | 937,286 | 797,665 | 642,737 | |||||||||||||||
| Gross profit |
91,581 | 100,596 | 101,082 | 92,114 | 73,703 | |||||||||||||||
| Operating expenses(2) |
71,256 | 105,723 | 73,314 | 57,537 | 43,343 | |||||||||||||||
| Operating income (loss) |
20,325 | (5,127 | ) | 27,768 | 34,577 | 30,360 | ||||||||||||||
| Other expense |
||||||||||||||||||||
| Interest expense |
17,495 | 17,431 | 17,763 | 16,233 | 16,805 | |||||||||||||||
| Interest income |
(514 | ) | (941 | ) | (730 | ) | (876 | ) | (456 | ) | ||||||||||
| Other (income) expense |
(3,563 | ) | (3,427 | ) | (292 | ) | 164 | 600 | ||||||||||||
| Foreign exchange (gain) loss, net |
(3,130 | ) | 15,533 | (2,401 | ) | 1,099 | (1,407 | ) | ||||||||||||
| Total other expense (income), net |
10,288 | 28,596 | 14,340 | 16,620 | 15,542 | |||||||||||||||
| Income (loss) before provision for income taxes |
10,037 | (33,723 | ) | 13,428 | 17,957 | 14,818 | ||||||||||||||
| Provision for income taxes |
2,844 | 1,595 | 867 | 4,894 | 2,755 | |||||||||||||||
| Net income (loss) |
$ | 7,193 | $ | (35,318 | ) | $ | 12,561 | $ | 13,063 | $ | 12,063 | |||||||||
| Net income (loss) per weighted average share of common stock, voting and Class B common stock, non-voting: |
||||||||||||||||||||
| Basic |
$ | 69.94 | $ | (345.63 | ) | $ | 122.93 | $ | 127.84 | $ | 119.28 | |||||||||
| Diluted |
$ | 69.94 | $ | (345.63 | ) | $ | 122.93 | $ | 127.84 | $ | 119.28 | |||||||||
| Weighted average number of common shares, voting and Class B common stock, non-voting used in per share calculation(3): |
||||||||||||||||||||
| Basic |
102,852 | (4) | 102,182 | 102,182 | 102,182 | 101,133 | ||||||||||||||
| Diluted |
102,852 | (4) | 102,182 | 102,182 | 102,182 | 101,133 | ||||||||||||||
| Balance Sheet Data: |
||||||||||||||||||||
| Cash and cash equivalents |
$ | 27,234 | $ | 22,344 | $ | 29,399 | $ | 20,574 | $ | 12,995 | ||||||||||
| Working capital(5) |
110,693 | 75,726 | 101,629 | 98,222 | 92,846 | |||||||||||||||
| Total assets |
308,101 | 284,068 | 363,008 | 292,575 | 248,311 | |||||||||||||||
| Long-term debt (including current maturities and capital leases) |
114,982 | 105,865 | 117,224 | 120,209 | 119,628 | |||||||||||||||
| Total debt |
129,711 | 136,906 | 143,590 | 137,862 | 125,041 | |||||||||||||||
| Total shareholders’ equity |
42,734 | 14,550 | 54,101 | 38,337 | 25,567 | |||||||||||||||
| Other Data: |
||||||||||||||||||||
| Ratio of earnings to fixed charges(6) |
$ | 1.5x | ($16,292 | ) | 1.7x | 2.1x | 1.9x | |||||||||||||
| Cash dividends per common share |
$ | — | $ | — | $ | — | $ | — | $ | 197.76 | (7) | |||||||||
36
Table of Contents
| (1) | The financial and other data includes the financial information for Centel commencing on the date of our re-acquisition of all interests in Centel on June 23, 2005, for the year ended December 31, 2005. |
| (2) | Operating expenses includes the charge for the impairment of goodwill of $18,777 for the year ended December 31, 2008. |
| (3) | Weighted average number of common shares, voting and Class B common stock, non-voting used in the per share calculation for each year reflects the issuance of 2,182 shares of Class B common stock, non-voting to the sellers of Centel in connection with the re-acquisition of Centel on June 23, 2005. |
| (4) | Weighted average number of common shares, voting and Class B common stock, non-voting used in the per share calculation for the year ended December 31, 2009 reflects the issuance of 27,175 shares of Class B common stock, non-voting to certain of our Company’s existing shareholders and their affiliates, concurrently with the redemption and cancellation of our 11 3/4% Senior Notes and the closing of the 13 1/4% Senior Notes offering on December 22, 2009. |
| (5) | Working capital is defined as current assets less current liabilities. |
| (6) | For purposes of calculating the ratio of earnings to fixed charges: (i) earnings is defined as income before income taxes plus fixed charges; and (ii) fixed charges is defined as interest expense (including capitalized interest and amortization of debt issuance costs) and the portion of operating rental expense which management believes would be representative of the interest component of rental expense. A ratio of less than one-to-one coverage requires the disclosure of the dollar amount of the deficiency. |
| (7) | We paid a one-time cash dividend of $20,000, or $197.76 per share, of the proceeds of our 11 3/4% Senior Notes offering in August 2005, to all of our existing shareholders of record as of August 25, 2005, based upon the 102,182 shares outstanding. |
37
Table of Contents
MANAGEMENT’S DISCUSSION AND ANALYSIS OF
FINANCIAL CONDITION AND RESULTS OF OPERATIONS
You should read the following discussion and analysis of our financial condition and results of operations together with our audited consolidated financial statements (including the notes thereto) and the other financial information appearing elsewhere in this prospectus. In addition, this discussion contains forward-looking statements regarding expected operating results, liquidity, capital requirements and other matters, each of which involves numerous risks and uncertainties including, but not limited to, those described in the “Forward Looking Statements” and “Risk Factors” sections of this prospectus. Our results may differ materially from those contained in any forward-looking statements.
Overview
We believe we are the largest pure play value-added distributor of IT products focused solely on serving Latin America and the Caribbean. We distribute computer components, peripherals, software, computer systems, accessories, networking products and digital consumer electronics to more than 50,000 customers in 40 countries. We offer single source purchasing to our customers by providing an in-stock selection of more than 6,100 products from over 173 vendors, including the world’s leading IT product manufacturers. From our headquarters and main distribution center in Miami, we support a network of 22 sales and distribution operations in 12 Latin American and the Caribbean countries and a sales office in Brazil.
Our results for the year ended December 31, 2009, reflect a decline in revenue across most of our product lines and our customer markets, as compared to the corresponding periods in 2008. Revenue decreased $154.4 million, or 14.4% to $917.2 million for the year ended December 31, 2009, as compared to $1,071.6 million for the year ended December 31, 2008. The recent global economic downturn which began in late 2008 and continued through much of 2009 was the main driver of the decline in our revenues. Gross profit decreased $9.0 million, or 9.0%, to $91.6 million for the year ended December 31, 2009, from $100.6 million for the year ended December 31, 2008. The reduction in gross profit was the result of the lower sales volumes and average sale prices for many of our products.
Total operating expenses decreased 32.6% for the year ended December 31, 2009, as compared to the year ended December 31, 2008, driven primarily by the goodwill impairment charge of $18.8 million, higher salaries and payroll-related expenses of $5.1 million, and, to a lesser extent, other one-time non-cash charges including the $2.0 million write-off associated with our initial public offering (“IPO”) efforts and the $1.5 million restructuring charges related to several of our In-country Operations in 2008. Net income was $7.2 million for the year ended December 31, 2009, as compared to net loss of $35.3 million for the year ended December 31, 2008. While the recent global economic downturn and the disruptions in the credit markets have caused a slowdown in our revenue growth, we did experience an increase in our net income due to improved gross margins coupled with lower operating expenses. Also contributing to the improvement in net income were foreign exchange gains due to the effects of the strengthening of foreign currencies relative to the U.S. dollar, particularly the Chilean Peso and the Colombian Peso, and gains from the repurchase of our debt at prices significantly below face value.
Factors Affecting Our Results of Operations
The following events and developments have in the past, or are expected in the future to have a significant impact on our financial condition and results of operations:
| • | Impact of price competition, vendor terms and conditions, and the recent downturn in the global economy on margin. Historically, our gross profit margins have been impacted by price competition, changes to vendor terms and conditions, including but not limited to, reductions in product rebates and incentives, our ability to return inventory to manufacturers, and time periods during which vendors provide price protection. We expect these competitive pricing pressures and modifications to vendor |
38
Table of Contents
| terms and conditions to continue into the foreseeable future. The recent downturn in the global economy has also increasingly become a factor impacting our gross profit margins. We expect a softening in demand for IT products in Latin America and the Caribbean due to the recent global economic downturn. |
| • | Shift in revenue to In-country Operations. One of our growth strategies is to expand the geographic presence of our In-country Operations into areas in which we believe we can achieve higher gross margins than our Miami Operations. Miami gross margins are generally lower than gross margins from our In-country Operations because the Miami export market is more competitive due to the high concentration of other Miami-based IT distributors who compete for the export business of resellers and retailers located in Latin America or the Caribbean. In addition, these resellers and retailers generally have larger average order quantities than customers of our In-country Operations segment, and as a result, benefit from lower average prices. Revenue from our In-country Operations grew by an average of 18.0% annually between 2001 and 2009, as compared to growth in revenue from our Miami Operations of an average of 6.5% annually over the same period. Revenue from our In-country Operations accounted for 74.4%, 74.1% and 72.2% of consolidated revenue for the years ended December 31, 2009, 2008 and 2007, respectively. |
| • | Exposure to fluctuations in foreign currency. A significant portion of the revenues from our In-country Operations is invoiced in currencies other than the U.S. dollar and a significant amount of the operating expenses from our In-country Operations are denominated in currencies other than U.S. dollar. In markets where we invoice in local currency, including Argentina, Chile, Colombia, Costa Rica, Guatemala, Jamaica, Mexico, Peru and Uruguay, the appreciation of a local currency could have a marginal impact on our gross profit and gross margins in U.S. dollar terms. In markets where our books and records are prepared in currencies other than the U.S. dollar, the appreciation of the local currency will increase our operating expenses and decrease our operating margins in U.S. dollar terms. In our consolidated statements of operations, a foreign exchange (gain) loss of ($3.1) million, $15.5 million and ($2.4) million was included for the years ended December 31, 2009, 2008 and 2007, respectively. We periodically engage in foreign currency forward contracts when available and when doing so is not cost prohibitive. In periods when we do not, foreign currency fluctuations may adversely affect our results of operations, including our gross margins and operating margins. |
| • | Trade credit. All of our key vendors and many of our other vendors provide us with trade credit. Historically, trade credit has been an important source of liquidity to finance our growth. Although our overall available trade credit has increased significantly over time, from time to time the trade credit available from certain vendors has not kept pace with the growth of our business with them. Given the recent economic downturn, many of our vendors reduced the level of available trade credit extended to us as a result of our vendors’ view of our liquidity at the time. |
When we purchase goods from these vendors, we need to increase our use of available cash or borrowings under our credit facility (in each case to the extent available) to pay the purchase price upon delivery of the products, which adversely affects our liquidity and can adversely affect our results of operations and opportunities for growth. We purchase credit insurance from Euler Hermes ACI to support trade credit lines extended to our customers which has been restricted recently due to the recent global economic downturn and the disruptions in the credit markets. Given the recent economic downturn, credit insurers have tightened the requirements for extending credit insurance coverage thereby limiting our capacity to extend trade credit to our customers and the growth of our business throughout the region.
| • | Increased levels of indebtedness. In connection with the investment by CVC International in our Company in August 2004 and our re-acquisition of Centel in August 2005, we borrowed under our former senior secured credit facility with Wells Fargo Foothill and Morgan Stanley and issued subordinated seller notes to the sellers, which increased our leverage and our interest expense. |
39
Table of Contents
On December 8, 2009, we commenced a cash tender offer for $96.9 million aggregate principal amount of 11 3/4% Senior Notes outstanding. We financed the tender offer with the net cash proceeds of $120.0 million aggregate principal amount of the 13 1/4% Senior Notes that were sold in a private placement transaction which closed on December 22, 2009. We used the proceeds from the sale of the 13 1/4% Senior Notes to repay our borrowings under, and renew our existing senior secured credit facility, repurchase, redeem or otherwise discharge our 11 3/4% Senior Notes and the balance for general corporate purposes. For the years ended December 31, 2009, 2008 and 2007, interest expense was $17.5 million, $17.4 million and $17.8 million, respectively.
| • | Goodwill impairment. Goodwill represents the excess of the purchase price over the fair value of the net assets. We perform our impairment test of our goodwill and other intangible assets on an annual basis. The goodwill impairment charge represents the extent to which the carrying values exceeded the fair value attributable to our goodwill. Fair values are determined based upon market conditions and the income approach which utilizes cash flow projections and other factors. The decline in value of our goodwill is consistent with the overall market decline as a result of the recent global economic environment and financial market dislocation. Our future results of operations may be impacted by the prolonged weakness in the current economic environment, which may result in a further impairment of any existing goodwill or goodwill and/or other long-lived assets recorded in the future. |
As part of our 2009 impairment analysis of goodwill, we noted that our operations in Centel reflected a fair value that exceeded its carrying value by approximately 3.4%. The fair value was determined using management’s projections giving the recent economic contraction in Mexico’s GDP and our independent valuation experts’ estimate of fair value. As of December 31, 2009, we have $2.9 million of goodwill attributable to our operations in Mexico, which represents approximately 11.2% of Centel’s carrying value and less than 1.0% of our total assets. An extended period of economic contraction could result in a further impairment to the carrying value of the goodwill attributable to our operations in Mexico.
For the year ended December 31, 2008, consistent with the severe decline in the global capital markets, our annual goodwill and identifiable intangible asset impairment test resulted in a substantial decline in the value attributable to our goodwill. In the fourth quarter of 2008, we recorded a goodwill impairment charge of $18.8 million to our $32.3 million goodwill. This non-cash charge materially impacted our equity and results of operations in 2008, but did not impact our ongoing business operations, liquidity or cash flow. We did not record an impairment charge for goodwill and identifiable intangible assets for the years ended December 31, 2009 and 2007.
Goodwill impairment charge was recorded in the amount of $11.5 million related to our Miami Operations and $7.3 million related to our In-country Operations, particularly $4.1 million in Mexico, $1.3 million in Guatemala, $1.2 million in Jamaica, $0.5 million in El Salvador and $0.2 million in Argentina. This non-cash charge materially impacted our equity and results of operations in 2008, but did not impact our ongoing business operations, liquidity or cash flow.
| • | Deferred tax assets. Deferred income tax represents the tax effect of the differences between the book and tax bases of assets and liabilities. Deferred tax assets, which also include net operating loss (“NOL”) carryforwards for entities that have generated or continue to generate operating losses, are assessed periodically by management to determine if their future benefit will be fully realized. If it is more likely than not that the deferred income tax asset will not be realized, then a valuation allowance must be established with a corresponding charge to net (loss) income. Such charges could have a material adverse effect on our results of operations or financial condition. As a result of our evaluation, we established an additional $1.6 million and $4.8 million valuation allowance against the carrying value of our long-term deferred tax assets as of December 31, 2009 and 2008, respectively. |
As of December 31, 2009, our U.S. and state of Florida NOLs resulted in $13.3 million of deferred tax assets, which will begin to expire in 2026. As of December 31, 2009, Intcomex Argentina, S.R.L. (“Intcomex Argentina”) had $4.0 million in NOLs resulting in $1.4 million of deferred tax assets,
40
Table of Contents
which will begin to expire in 2011. As of December 31, 2009, Centel had $1.0 million in NOLs resulting in $0.3 million of deferred tax assets, which will expire in 2018 and Intcomex Colombia LTDA (“Intcomex Colombia”) had $0.8 million in NOLs resulting in $0.3 million of deferred tax assets related to a NOL carryforward.
We analyzed the available evidence related to the realization of the deferred tax assets, considered the current negative economic environment and determined it is now more likely than not that we will not recognize a portion of our deferred tax assets associated with the NOL carryforwards. Factors in management’s determination include the performance of the business and the feasibility of ongoing tax planning strategies. As of December 31, 2009, we recorded a valuation allowance of $4.5 million in the U.S. against the NOLs, as management does not believe that it will realize the full benefit of these NOLs. As of December 31, 2008, we recorded a valuation allowance of $2.7 million in the U.S., $1.5 million in Argentina, $0.3 million in Colombia and $0.3 million in Mexico against the respective NOLs, as management does not believe that it will realize the full benefit of these NOLs. Our future results of operations may be impacted by the prolonged weakness in the current economic environment, which may result in further valuation allowances on our deferred tax assets and adversely affect our results of operations or financial condition.
| • | Write-Off of IPO Expenses. For the year ended December 31, 2008, we wrote off $2.0 million related to the pending IPO transaction to take our Company public. The costs were recorded as an increase in operating expenses in the consolidated statement of operations, as they were one-time charges that were not indicative of operations in the normal course of business and relate to a non-recurring transaction that would normally be netted against IPO proceeds. For the year ended December 31, 2009, we did not write off any costs related to this pending transaction. |
| • | Restructuring Charges. In 2008, we implemented restructuring and rebalancing actions designed to improve our efficiencies and profitability, strengthen our operations and reduce our costs in several of our locations. The restructuring included involuntary workforce reductions and employee benefits and other costs incurred in connection with vacating leased facilities. Restructuring charges for the years ended December 31, 2009 and 2008 were $0.6 million incurred in 2009 and $1.5 million in the fourth quarter of 2008, respectively. The charges were recorded in our statements of operations as an increase to our operating expenses. There were no restructuring charges incurred by us during the year ended December 31, 2007. |
Critical Accounting Policies and Estimates
Our consolidated financial statements have been prepared in conformity with U.S. GAAP. The preparation of these financial statements requires management to make estimates and assumptions that affect the reported amounts of assets and liabilities and the disclosure of contingent assets and liabilities at the date of the financial statements and the reported amounts of revenue and expenses during the reporting period. On an ongoing basis, we evaluate our estimates and judgments related to assets, liabilities, contingent assets and liabilities, revenue and expenses. Our estimates are based on our historical experience and a variety of other assumptions that we believe to be reasonable under the circumstances, the results of which form the basis for making our estimates about the carrying values of assets and liabilities that are not readily apparent from other sources. Although we believe our estimates, judgments and assumptions are appropriate and reasonable based upon available information, these assessments are subject to various other factors. Actual results may differ from these estimates under different assumptions and conditions.
We believe the following critical accounting policies are affected by our significant judgments and estimates used in the preparation of our consolidated financial statements.
Revenue Recognition. Revenue is recognized when persuasive evidence of an arrangement exists, the sales price is fixed or determinable, collection of the related receivable is reasonably assured and delivery has
41
Table of Contents
occurred. Delivery to customers has occurred at the point of shipment, provided that title and risk of loss have transferred and no significant obligations remain. We allow our customers to return defective products for exchange or credit within 30 days of delivery based on the warranty of the OEM. An exception is infrequently made for long-standing customers with current accounts, on a case-by-case basis and upon approval by management. A return is recorded in the period of the return because, based on past experience, these returns are infrequent and immaterial.
Our revenues are reported net of any sales, gross receipts or value added taxes. Shipping and handling costs billed to customers are included in revenue and related expenses are included in the cost of revenue.
We extend a warranty for products to customers with the same terms as the OEM’s warranty to us. All product-related warranty costs incurred by us are reimbursed by the OEMs.
Accounts Receivable. We provide allowances for doubtful accounts on our accounts receivable for estimated losses resulting from our customers’ inability to make required payments due to changes in our customers’ financial condition or other unanticipated events, which could result in charges for additional allowances exceeding our expectations. These estimates require judgment and are influenced by factors including, but not limited to the following: the large number of customers and their dispersion across wide geographic areas; the fact that no single customer accounted for 2.0% or more of our revenue; the continual credit evaluation of our customers’ financial condition; the aging of our customers’ receivables, individually and in the aggregate; the value and adequacy of credit insurance coverage; the value and adequacy of collateral received from our customers (in certain circumstances); our historical loss experience; and, increases in credit risk due to an economic downturn resulting in our customers’ inability to obtain capital. Uncollectible accounts are written-off against the allowance on an annual basis.
Vendor Programs. We receive funds from vendors for price protection, product rebates, marketing and promotions and competitive programs, which are recorded as adjustments to product costs or selling, general and administrative expenses according to the nature of the program. Some of these programs may extend over one or more quarterly reporting periods. We recognize rebates or other vendor incentives as earned based on sales of qualifying products or as services are provided in accordance with the terms of the related program. We provide reserves for receivables on vendor programs for estimated losses resulting from vendors’ inability to pay or rejections of claims by vendors. These reserves require judgment and are based upon aging and management’s estimate of collectability.
Inventories. Our inventory levels are based on our projections of future demand and market conditions. Any unanticipated decline in demand or technological changes could cause us to have excess or obsolete inventories. On an ongoing basis, we review for estimated excess or obsolete inventories and make provisions for our inventories to reflect their estimated net realizable value based upon our forecasts of future demand and market conditions. These forecasts require judgment as to future demand and market conditions. If actual market conditions are less favorable than our forecasts, additional inventory obsolescence provisions may be required. Our estimates are influenced by the following considerations: the availability of protection from loss in value of inventory under certain vendor agreements, the extent of our right to return to vendors a percentage of our purchases, the aging of inventories, variability of demand due to an economic downturn and other factors, and the frequency of product improvements and technological changes. Rebates earned on products sold are recognized when the product is shipped to a third party customer and are recorded as a reduction to cost of revenue.
Goodwill, Identifiable Intangible and Other Long-Lived Assets. We review goodwill at least annually for potential impairment or between annual tests if an event occurs or circumstances change that would more likely than not reduce the fair value of a reporting unit below its carrying amount. Our annual impairment review requires extensive use of accounting judgment and financial estimates, including projections about our business, our financial performance and the performance of the market and overall economy. Application of alternative
42
Table of Contents
assumptions and definitions could produce significantly different results. Because of the significance of the judgments and estimates used in the processes, it is likely that materially different amounts could result if different assumptions were made or if the underlying circumstances were changed.
Our goodwill represents the excess of the purchase price over the fair value of the net assets of acquired businesses. Potential impairment exists if the fair value of a reporting unit to which goodwill has been allocated is less than the carrying value of the reporting unit. The amount of an impairment loss is recognized as the amount by which the carrying value of the goodwill exceeds its implied value.
Future changes in the estimates used to conduct the impairment review, including revenue projections, market values and changes in the discount rate used could cause the analysis to indicate that our goodwill is impaired in subsequent periods and result in a write-off of a portion or all of the goodwill. The discount rate used is based on our capital structure and, if required, an additional premium on the reporting unit based upon its geographic market and operating environment. The assumptions used in estimating revenue projections are consistent with internal planning.
Our intangible assets are presented at cost, net of accumulated amortization. Intangible assets are amortized on a straight line basis over their estimated useful lives and assessed for impairment. We recognize an impairment of long-lived assets if the net book value of such assets exceeds the estimated future undiscounted cash flows attributable to such assets. If the carrying value of a long-lived asset is considered impaired, a loss is recognized based on the amount by which the carrying value exceeds the fair value of the long-lived asset for assets to be held and used, or the amount by which the carrying value exceeds the fair value less cost to dispose for assets to be disposed. Fair value is determined using the anticipated cash flows discounted at a rate commensurate with the risk involved. We test intangible assets for recoverability whenever events or changes in circumstances indicate that their carrying amount may not be recoverable.
In addition, we review other long-lived assets, principally property, plant and equipment, for impairment whenever events or changes in circumstances indicate that the carrying amount of an asset may not be recoverable. If the carrying amount of an asset exceeds the asset’s fair value, we measure and record an impairment loss for the excess. We assess an asset’s fair value by determining the expected future undiscounted cash flows of the asset. There are numerous uncertainties and inherent risks in conducting business, such as general economic conditions, actions of competitors, ability to manage growth, actions of regulatory authorities, pending investigations or litigation, customer demand and risk relating to international operations. Adverse effects from these or other risks may result in adjustments to the carrying value of our other long-lived assets.
There are numerous uncertainties and inherent risks in conducting business, such as but not limited to general economic conditions, actions of competitors, ability to manage growth, actions of regulatory authorities, pending investigations and/or litigation, customer demand and risk relating to international operations. Adverse effects from these risks may result in adjustments to the carrying value of the Company’s assets and liabilities in the future including, but not necessarily limited to, goodwill.
Income taxes. We account for the effects of income taxes resulting from activities during the current and preceding years. Deferred tax assets and liabilities are recognized for the future tax consequences attributable to temporary differences between the financial statement carrying amounts of assets and liabilities and their respective tax bases as measured by the enacted tax rates which will be in effect when these differences reverse. The effect on deferred tax assets and liabilities of a change in tax rates is recognized in the results of operations in the period that includes the enactment date under the law. Valuation allowances are established when necessary to reduce deferred tax assets to the amount expected to be realized, unless it is more likely than not that such assets will be realized.
We are subject to income and other related taxes in areas in which we operate. When recording income tax expense, certain estimates are required by management due to timing and the impact of future events on when
43
Table of Contents
income tax expenses and benefits are recognized by us. We periodically evaluate our net operating losses and other carryforwards to determine whether gross deferred tax assets and related valuation allowances should be adjusted for future realization in our consolidated financial statements.
Highly certain tax positions are determined based upon the likelihood of the positions sustained upon examination by the taxing authorities. The benefit of a tax position is recognized in the financial statements in the period during which management believes it is more likely than not that the position will be sustained.
In the event of a distribution of the earnings of certain international subsidiaries, we would be subject to withholding taxes payable on those distributions to the relevant foreign taxing authorities. Since we currently intend to reinvest undistributed earnings of these international subsidiaries indefinitely, we have made no provision for income taxes that might be payable upon the remittance of these earnings. We have also not determined the amount of tax liability associated with an unplanned distribution of these permanently reinvested earnings. In the event that in the future we consider that there is a reasonable likelihood of the distribution of the earnings of these international subsidiaries (for example, if we intend to use those distributions to meet our liquidity needs), we will be required to make a provision for the estimated resulting tax liability, which will be subject to the evaluations and judgments of uncertainties described above.
We conduct business globally and, as a result, one or more of our subsidiaries file income tax returns in U.S. federal, state and foreign jurisdictions. In the normal course of business, we are subject to examination by taxing authorities in the countries in which we operate. We are currently under ongoing tax examinations in several countries. While such examinations are subject to inherent uncertainties, we do not currently anticipate that any such examination would have a material adverse impact on our audited consolidated financial statements.
Commitments and Contingencies. We accrue for contingent obligations when the obligation is probable and the amount is reasonably estimable. As facts concerning contingencies become known, we reassess our position and make appropriate adjustments to the financial statements. Estimates that require judgment and are particularly sensitive to future changes include those related to taxes, legal matters, the imposition of international governmental monetary, fiscal or other controls, changes in the interpretation and enforcement of international laws (in particular related to items such as duty and taxation), and the impact of local economic conditions and practices, which are all subject to change as events evolve and as additional information becomes available.
As part of our normal course of business, we are involved in certain claims, regulatory and tax matters. In the opinion of our management, the final disposition of such matters will not have a material adverse impact on our results of operations and financial condition.
Recently Issued and Adopted Accounting Guidance
Recently Issued Accounting Guidance
In October 2009, the Financial Accounting Standards Board (“FASB”) issued Accounting Standards Update (“ASU”) 2009-13, Multiple-Deliverable Revenue Arrangements (“ASU 2009-13”). The new standard modifies the fair value requirements of ASC 605-25, Revenue Recognition-Multiple Element Arrangements by allowing the use of the “best estimate of a selling price” in addition to Vendor Specific Objective Evidence, or VSOE, and Third Party Evidence, or TPE, for determining the selling price of a deliverable. ASU 2009-13 changes the requirements for establishing separate units of accounting in a multiple element arrangement and requires the allocation of arrangement consideration to each deliverable to be based on the relative selling price. ASU 2009-13 is effective for revenue arrangements entered into or materially modified in fiscal years beginning on or after June 15, 2010. We are currently evaluating the effect ASU 2009-13 may have on our audited consolidated financial statements.
44
Table of Contents
Recently Adopted Accounting Guidance
In August 2009, the FASB issued ASU 2009-05, Fair Value Measurements and Disclosures (Topic 820)-Measuring Liabilities at Fair Value (“ASU 2009-05”). ASU 2009-05 clarifies how entities should estimate the fair value of liabilities under the FASB Accounting Standards Codification (“ASC”) 820, Fair Value Measurements and Disclosures (formerly SFAS No. 157, Fair Value Measurements). ASU 2009-05 improves the consistency of the application of ASC 820 and reduces potential ambiguity in financial reporting when measuring the fair value of liabilities. The FASB issued ASU 2009-05 as a result of expressed concern that there may be a lack of observable market information to measure the fair value of a liability. This standard is effective for interim and annual periods beginning after August 28, 2009, which did not have a material impact on our audited consolidated financial statements.
In June 2009, the FASB issued ASC 810, Consolidation, (formerly SFAS No. 167, Amendments to FASB Interpretation No. 46(R)) regarding the consolidation of variable interest entities. ASC 810 is intended to improve financial reporting by providing additional guidance to companies involved with variable interest entities and by requiring additional disclosures about a company’s involvement in variable interest entities. This standard is effective for interim and annual periods beginning after November 15, 2009, which did not have a material impact on our audited consolidated financial statements.
In June 2009, the FASB issued ASC 860, Transfers and Servicing (formerly SFAS No. 166, Accounting for Transfers of Financial Assets). ASC 860 requires more information about transfers of financial assets and where companies have continuing exposure to the risk related to transferred financial assets. ASC 860 eliminates the concept of a qualifying special purpose entity, changes the requirements for derecognizing financial assets and requires additional disclosure. This standard is effective for fiscal years beginning after November 15, 2009, which did not have a material impact on our audited consolidated financial statements.
In June 2009, the FASB issued ASC 105, Generally Accepted Accounting Principles (formerly SFAS No. 168, The “FASB Accounting Standards Codification”TM and the Hierarchy of Generally Accepted Accounting Principles – a replacement of FASB Statement No. 162) (“ASC 105”). ASC 105 establishes the FASB ASC as the single source of authoritative nongovernmental U.S. GAAP, except for SEC rules and interpretive releases, which are sources of authoritative U.S. GAAP for SEC registrants. The standard is effective for interim and annual periods ending after September 15, 2009. We adopted the provisions of the standard on September 30, 2009, which did not have a material impact on our audited consolidated financial statements.
In May 2009, the FASB issued ASC 855, Subsequent Events (formerly SFAS No. 165, Subsequent Events) (“ASC 855”). ASC 855 establishes general accounting standards and disclosure of events that occur after the balance sheet date but before financial statements are issued or are available to be issued. ASC 855 sets forth the period after the balance sheet date during which management of a reporting entity should evaluate events or transactions that may occur for potential recognition or disclosure in the financial statements, the circumstances under which an entity should recognize events or transactions occurring after the balance sheet date in our financial statements, and the disclosures that an entity should make about events or transactions that occurred after the balance sheet date. ASC 855 is effective for fiscal years and interim periods ended after June 15, 2009. We adopted the provisions of the standard, which had no effect on our audited consolidated financial statements and subsequent events through the date of this filing.
In April 2009, the FASB issued ASC 825, Financial Instruments (formerly Financial Staff Position (“FSP”) No. 107-1 and Accounting Principles Board (“APB”) 28-1 (FSP No. 107-1 and APB 28-1), Interim Disclosures about Fair Value of Financial Instruments) (“ASC 825”). ASC 825 requires disclosures of fair value for any financial instruments not currently reflected at fair value on the balance sheet for all interim periods. ASC 825 enhances consistency in financial reporting by increasing the frequency of fair value disclosures and is effective for interim and annual periods ending after June 15, 2009, and is to be applied prospectively. We adopted the provisions of the standard, which did not have an effect on our audited consolidated financial statements.
45
Table of Contents
In April 2009, the FASB issued transition guidance ASC 820-10-65-4 Fair Value Measurements and Disclosures—Overall—Transition Guidance, the provisions of which have been incorporated in ASC 820-10-50-2 Fair Value Measurements and Disclosures—Overall—Disclosures (“ASC 820”). ASC 820-10-50-2 requires disclosures about fair value of financial instruments for interim reporting periods and annual financial statements of publicly traded companies. This guidance is effective for interim and annual periods ending after June 15, 2009. We adopted the provisions of the standard and included its effect on our audited consolidated financial statements.
In March 2008, the FASB issued ASC 815, Derivatives and Hedging (formerly SFAS No. 161, Disclosures about Derivative Instruments and Hedging Activities, an amendment of FASB Statement No. 133) (“ASC 815”). ASC815 requires enhanced disclosures about an entity’s derivative and hedging activities including how and why an entity uses, how an entity accounts for derivative instruments; and related hedged items and how derivative instruments and related hedged items affect an entity’s financial position, financial performance and cash flows. ASC 805 is effective beginning January 1, 2009. We adopted the provisions of the standard and included its effect on our audited consolidated financial statements.
In February 2008, the FASB issued ASC 820, Fair Value Measurements and Disclosures (formerly FSP Financial Accounting Standard (“FAS”) No. 157-2, Effective Date of FASB Statement No. 157) which delayed the effective date for nonfinancial assets and nonfinancial liabilities until January 1, 2009. We adopted the provisions of the standard as of January 1, 2009, which did not have an effect on our audited consolidated financial statements.
In December 2007, the FASB issued ASC 805, Business Combinations (“ASC 805”), (formerly SFAS 141 (revised 2007), Business Combinations). ASC 805 expands the definition of a business and a business combination; requires the acquirer to recognize the assets acquired, liabilities assumed and noncontrolling interests (including goodwill), measured at fair value at the acquisition date; requires acquisition-related expenses and restructuring costs to be recognized separately from the business combination; and requires in-process research and development to be capitalized at fair value as an indefinite-lived intangible asset. ASC 805 is effective for financial statements issued for fiscal years beginning after December 15, 2008. We adopted the provisions of the standard, which did not have an effect on our audited consolidated financial statements. However, if the Company enters into material business combinations in the future, a transaction may significantly impact the Company’s audited consolidated financial statements.
Results of Operations
We report our business in two operating segments, based upon the geographic location of where we originate the sale: Miami and In-country. Miami segment includes revenue from our Miami, Florida headquarters, including sales from Miami to our in-country sales and distribution centers and sales directly to resellers, retailers and distributors that are located in countries in which we have in-country sales and distribution operations or in which we do not have any in-country operations. In-country segment includes revenue from our in-country sales and distribution centers, which have been aggregated because of their similar economic characteristics. Most of our vendor rebates, incentives and allowances are reflected in the results of our Miami segment. When we consolidate our results, we eliminate revenue and cost of revenue attributable to inter-segment sales, and the financial results of our Miami segment discussed below reflect these eliminations.
46
Table of Contents
Comparison of the year ended December 31, 2009 versus the year ended December 31, 2008 and of the year ended December 31, 2008 versus the year ended December 31, 2007
The following table sets forth selected financial data (in thousands) and percentages of revenue for the periods presented:
| Year Ended December 31, 2009 |
Year Ended December 31, 2008 |
Year Ended December 31, 2007 |
|||||||||||||||||
| Amount | Percentage of Revenue |
Amount | Percentage of Revenue |
Amount | Percentage of Revenue |
||||||||||||||
| Revenue |
$ | 917,168 | 100.0 | % | $ | 1,071,551 | 100.0 | % | $ | 1,038,368 | 100.0 | % | |||||||
| Cost of revenue |
825,587 | 90.0 | % | 970,955 | 90.6 | % | 937,286 | 90.3 | % | ||||||||||
| Gross profit |
91,581 | 10.0 | % | 100,596 | 9.4 | % | 101,082 | 9.7 | % | ||||||||||
| Selling, general and administrative expenses |
66,973 | 7.3 | % | 83,038 | 7.7 | % | 69,834 | 6.7 | % | ||||||||||
| Goodwill impairment charge |
— | — | 18,777 | 1.8 | % | — | — | ||||||||||||
| Depreciation and amortization |
4,283 | 0.5 | % | 3,908 | 0.4 | % | 3,480 | 0.3 | % | ||||||||||
| Total operating expenses |
71,256 | 7.8 | % | 105,723 | 9.9 | % | 73,314 | 7.1 | % | ||||||||||
| Operating income (loss) |
20,325 | 2.2 | % | (5,127 | ) | (0.5 | )% | 27,768 | 2.7 | % | |||||||||
| Other expense, net |
10,288 | 1.1 | % | 28,596 | 2.7 | % | 14,340 | 1.4 | % | ||||||||||
| Income (loss) before provision for income taxes |
10,037 | 1.1 | % | (33,723 | ) | (3.2 | )% | 13,428 | 1.3 | % | |||||||||
| Provision for income taxes |
2,844 | 0.3 | % | 1,595 | 0.1 | % | 867 | 0.1 | % | ||||||||||
| Net income (loss) |
$ | 7,193 | 0.8 | % | $ | (35,318 | ) | (3.3 | )% | $ | 12,561 | 1.2 | % | ||||||
Revenue. Revenue decreased $154.4 million, or 14.4%, to $917.2 million for the year ended December 31, 2009, from $1,071.6 million for the year ended December 31, 2008. Our revenue was impacted by the recent severe recession, decline in the global capital markets and the unprecedented levels of volatility and disruption of the capital and credit markets resulting in reduced demand for our products. The decline resulted in an overall decrease in the sales of our core products, such as monitors of $42.8 million, CPUs of $30.6 million, printers of $20.4 million, software of $12.2 million, basic “white-box” systems of $11.2 million, memory products of $6.0 million and hard drives of $5.7 million in our Miami Operations and In-country Operations, particularly in Argentina, Colombia, El Salvador, Mexico, Panama, Peru and Uruguay. We experienced a 7.0% decline in unit shipments across our core product lines for the year ended December 31, 2009, as compared to the year ended December 31, 2008, due to the declining demand for IT products, coupled with a 7.8% decline in average sales prices across the same core products. Revenue derived from our In-country Operations decreased $112.1 million, or 14.1%, to $682.2 million for the year ended December 31, 2009, from $794.3 million for the year ended December 31, 2008. Revenue derived from our In-country Operations accounted for 74.4% of our total revenue for the year ended December 31, 2009, as compared to 74.1% of our total revenue for the year ended December 31, 2008. The decline in revenue from our In-country Operations was mainly due to the overall decrease in sales in Argentina, Colombia, Ecuador, Jamaica, Mexico, Panama, Peru and Uruguay, and to a lesser extent, in Guatemala and El Salvador, and the decreased sales volume and price of monitors, printers and basic “white-box” systems, the decrease in sales volume of CPUs and the decrease in price of notebook computers and software. Revenue derived from our Miami Operations decreased $42.3 million, or 15.2%, to $234.9 million for the year ended December 31, 2009 (net of $230.4 million of revenue derived from sales to our In-country Operations) from $277.2 million for the year ended December 31, 2008 (net of $253.4 million of revenue derived from sales to our In-country Operations). The decline in revenue derived from our Miami Operations reflected the decrease in sales volume of memory products, CPUs and monitors, the decrease in sales volume and price of notebook computers, slightly offset by the increase in sales volume and price of hard disk drives and the increase in price of CPUs.
47
Table of Contents
Revenue increased $33.2 million, or 3.2%, to $1,071.6 million for the year ended December 31, 2008, from $1,038.4 million for the year ended December 31, 2007. Revenue growth, although diminished relative to prior years, was largely attributable to the continued increase in demand for our IT products throughout Latin America and the Caribbean, particularly in Chile, Colombia, Ecuador, Peru and Uruguay. In particular, the growth in revenue was driven primarily by the increased sales of notebook computers of $62.8 million, basic “white-box” systems of $14.1 million and monitors of $9.9 million, partially offset by the reduced sales of CPU devices of $17.4 million, hard disk drives of $17.3 million and motherboards of $7.2 million. The increase in revenue was partially tempered by a decline in the average selling price of memory products, notebook computers and motherboards and the recent global economic downturn. The diminished growth in our revenues resulted from the global economic downturn, the disruptions in the credit markets and the overall softening in demand for IT products. We experienced a 16.1% growth in unit shipments across our core product lines for the year ended December 31, 2008, partially offset by a 7.9% decline in average sales prices across the same core products. In-country revenue increased $45.0 million, or 6.0%, to $794.3 million for the year ended December 31, 2008, from $749.3 million for the year ended December 31, 2007. In-country revenue accounted for 74.1% of our total revenue for the year ended December 31, 2008, as compared to 72.2% of our total revenue for the year ended December 31, 2007. The increase in sales from our In-country Operations reflected the increased sales of basic “white-box” systems, notebook computers, monitors and printers, partially offset by the decreased sales of CPUs, motherboards and software. Miami revenue decreased $11.8 million, or 4.1%, to $277.2 million for the year ended December 31, 2008 (net of $253.4 million of revenue derived from sales to our In-country Operations) from $289.1 million for the year ended December 31, 2007 (net of $288.2 million of revenue derived from sales to our In-country Operations). The decline in sales derived from our Miami Operations reflected the decreased sales of hard disk drives, CPUs and motherboards, partially offset by the increased sales of notebook computers and printers and higher margin products including memory products and software. The decline in sales derived from our Miami Operations also reflects the effect of the global economic downturn on sales and the softening in demand for IT products in certain countries in Latin America and the Caribbean.
Gross profit. Gross profit decreased $9.0 million, or 9.0%, to $91.6 million for the year ended December 31, 2009, from $100.6 million for the year ended December 31, 2008. The decrease was primarily driven by lower sales volume in our Miami Operations and In-country Operations. Gross profit from our In-country Operations decreased $8.0 million, or 11.1%, to $64.0 million for the year ended December 31, 2009, from $72.0 million for the year ended December 31, 2008. The decrease in gross profit from our In-country Operations was driven by the decreased sales volumes of monitors. CPUs, printers, software and basic “white-box” systems primarily in Argentina, Chile, Colombia, Mexico, Peru and Uruguay. Gross profit from our In-country Operations accounted for 69.8% of our consolidated gross profit for the year ended December 31, 2009, as compared to 71.6% of our consolidated gross profit for the year ended December 31, 2008. Gross profit from our Miami Operations decreased $1.0 million, or 3.5%, to $27.6 million for the year ended December 31, 2009, as compared to $28.6 million for the year ended December 31, 2008. The decrease in Miami’s gross profit was largely the result of lower sales volumes of CPUs, memory products and monitors, the decline in sales volume and price of notebook computers, slightly offset by an increase in sales volume and price of hard disk drives and the increase in price of CPUs. As a percentage of revenue, gross margin increased to 10.0% for the year ended December 31, 2009, as compared to 9.4% for the year ended December 31, 2008, due to the increased mix of higher margin products and the reduced dependency on high volume, low margin products.
Gross profit decreased $0.5 million, or 0.5%, to $100.6 million for the year ended December 31, 2008, from $101.1 million for the year ended December 31, 2007. The decrease was primarily driven by higher cost of revenue and lower sales volume in our Miami Operations. In-country gross profit increased $3.7 million, or 5.4%, to $72.0 million for year ended December 31, 2008, from $68.3 million for year ended December 31, 2007. The increase in in-country gross profit was primarily attributable to the increased sales volumes in Chile, Colombia, Ecuador, Peru and Uruguay, specifically related to sales of notebook computers, basic “white-box” systems and monitors, despite the decline in the average selling price of notebook computers, memory products and motherboards and the adverse negative fluctuation in the Chilean Peso. In-country gross profit accounted for 71.6% of our consolidated gross profit for the year ended December 31, 2008, as compared to 67.5% of our
48
Table of Contents
consolidated gross profit for the year ended December 31, 2007. Miami gross profit decreased $4.2 million to $28.6 million for the year ended December 31, 2008, as compared to $32.8 million for the year ended December 31, 2007. The decline in Miami’s gross profit was largely the result of the increase in the cost of products, and to a lesser extent, the decline in sales of hard drives, CPUs and motherboards. As a percentage of revenue, overall gross margin declined slightly to 9.4% for the year ended December 31, 2008, as compared to 9.7% for the year ended December 31, 2007. This decline was due to a more competitive pricing environment in Miami, the softening of demand for IT products in certain countries in Latin America and the Caribbean and the overall weakness in the economic environments in which we operate.
Operating expenses. Total operating expenses decreased $34.5 million, or 32.6%, to $71.3 million for the year ended December 31, 2009, from $105.7 million for the year ended December 31, 2008. As a percentage of revenue, operating expenses decreased to 7.8% of revenue for the year ended December 31, 2009, as compared to 9.9% of revenue for the year ended December 31, 2008. The decrease in operating expenses resulted from our restructuring actions implemented in the fourth quarter of 2008 and the first and second quarters of 2009, which were designed to improve our efficiencies and profitability, primarily in Miami, Argentina, Chile, Colombia, Mexico and Panama. The decrease was driven in part by reduced salaries and payroll-related expenses of $5.1 million, office, warehouse, building and occupancy expenses of $1.6 million, professional fees of $1.8 million and bad debt expense of $0.3 million for the year ended December 31, 2009. As a percentage of total operating expenses (excluding the one-time restructuring charge of $0.6 million incurred during the year ended December 31, 2009 and excluding the one-time goodwill impairment charge of $18.8 million, IPO write-off charge of $2.0 million and restructuring charge of $1.5 million incurred for the year ended December 31, 2008) salaries and payroll-related expenses increased to 52.2% of total operating expenses for the year ended December 31, 2009, as compared to 49.3% for the year ended December 31, 2008. Operating expenses from our In-country Operations decreased $15.0 million, or 24.3%, to $46.7 million for the year ended December 31, 2009, as compared to $61.7 million for the year ended December 31, 2008, due to the lower salaries and payroll-related expenses, professional fees, commission expense, office and warehouse expenses, particularly in Argentina, Chile, Colombia and Mexico, and to a lesser extent Costa Rica, Peru and Uruguay, and the absence of the $1.5 million associated with our restructuring charges in several of our In-country Operations. The decrease in commission expenses resulted from the lower sales volumes. Operating expenses from our Miami Operations decreased $19.5 million, or 44.3%, to $24.5 million for the year ended December 31, 2009, as compared to $44.0 million for the year ended December 31, 2008, due to the absence of the $11.5 million goodwill impairment charge and $2.0 million write-off associated with our IPO efforts, the reduced level of salaries and payroll-related expenses, professional fees, office, warehouse, building and occupancy expenses.
Total operating expenses increased $32.4 million, or 44.2%, to $105.7 million for the year ended December 31, 2008, from $73.3 million for the year ended December 31, 2007. As a percentage of revenue, operating expenses increased to 9.9% of revenue for the year ended December 31, 2008, as compared to 7.1% of revenue for the year ended December 31, 2007. The increase in operating expenses was driven primarily by the goodwill impairment charge of $18.8 million recorded for the year ended December 31, 2008, representing the extent to which the carrying values exceeded the fair value attributable to our goodwill. The decline in value of our goodwill is consistent with the overall market decline as a result of the global economic environment and financial market dislocation. The increase in operating expenses was also driven in part by higher salaries and payroll-related expenses, which increased by $7.1 million, or 20.0%, to $42.6 million for the year ended December 31, 2008, from $35.5 million for the year ended December 31, 2007. In addition, the increase in operating expense was due to the write-off of $2.0 million associated with our IPO efforts and $1.5 million associated with our restructuring charges in several of our In-country Operations. In-country operating expenses increased $14.7 million, or 31.3%, to $61.7 million for the year ended December 31, 2008, as compared to $47.0 million for the year ended December 31, 2007. In-country operating expenses increased due to the $7.2 million goodwill impairment charge, $5.0 million in higher salaries and payroll-related expenses related to the growth of our operations in Argentina, Chile and Colombia, increased office and warehouse expenses in Costa Rica and Peru and marketing costs related to our retail product offerings in Chile. Salaries and payroll-related expenses in our In-country Operations increased to 67.5% of total in-country operating expenses for the year ended
49
Table of Contents
December 31, 2008, as compared to 48.5% for the year ended December 31, 2007. Miami operating expenses increased $17.7 million, or 67.2%, to $44.0 million for the year ended December 31, 2008, as compared to $26.3 million for the year ended December 31, 2007, primarily due to the $11.5 million goodwill impairment charge and, to a lesser extent, an increase in salaries and payroll-related expenses, professional fees and bad debt expense.
Operating income (loss). Operating income increased $25.5 million to operating income of $20.3 million for the year ended December 31, 2009, from operating loss of $5.1 million for the year ended December 31, 2008. The increase was primarily driven by a reduction in operating expenses, partially offset by lower sales volumes. Operating income from our In-country Operations increased $7.3 million to $17.2 million for the year ended December 31, 2009, from $9.9 million for the year ended December 31, 2008, primarily from the reduced level of salaries and payroll-related expenses, professional fees, office, warehouse, building and occupancy expenses, partially offset by the lower sales volumes. Operating income (loss) from our Miami Operations increased $18.2 million to $3.1 million for the year ended December 31, 2009, from a loss of $15.1 million for the year ended December 31, 2008. The increase in operating income from our Miami Operations resulted primarily from the reduction in operating expenses.
Operating income (loss) decreased $32.9 million, resulting in an operating loss of $5.1 million for the year ended December 31, 2008, from operating income of $27.8 million for the year ended December 31, 2007. The decrease was driven primarily by the significant increase in operating expenses, of which $18.8 million relates to the goodwill impairment charge. In-country operating income decreased $11.3 million, or 48.5% to $10.0 million for the year ended December 31, 2008, from $21.3 million for the year ended December 31, 2007, due mainly to the increase in operating expenses discussed previously. Miami operating income decreased $21.6 million, resulting in an operating loss of $15.1 million for the year ended December 31, 2008, from operating income of $6.5 million for the year ended December 31, 2007, due mainly to the decline in gross profit combined with higher operating expenses.
Other expense, net. Other expense, net decreased $18.3 million, or 64.0%, to $10.3 million for the year ended December 31, 2009, from $28.6 million for the year ended December 31, 2008. The decrease was primarily attributable to the foreign currency exchange gains during the period, due to the appreciation of the Chilean, Colombian and Uruguayan Pesos. The foreign exchange (gain) loss increased by $18.7 million to a gain of $3.1 million for the year ended December 31, 2009, from a loss of $15.5 million for the year ended December 31, 2008. The Chilean Peso strengthened by 19.9%, to 519 pesos per U.S. dollar as of December 31, 2009, from 648 pesos per U.S. dollar as of December 31, 2008. The Colombian Peso strengthened by 8.3%, to 2,065 pesos per U.S. dollar as of December 31, 2009, from 2,252 pesos per U.S. dollar as of December 31, 2008. The Uruguayan Peso also strengthened by 19.8%, to 20 pesos per U.S. dollar as of December 31, 2009, from 25 pesos per U.S. dollar as of December 31, 2008. Other expense, net also decreased due to the $4.4 million gain from the repurchase, in arm’s length transactions, of $7.1 million of our 11 3/4% Senior Notes at substantial discounts to their face amount during 2009.
Other expense, net increased $14.3 million, to $28.6 million for the year ended December 31, 2008, from $14.3 million for the year ended December 31, 2007. The increase was primarily attributable to the significant foreign exchange loss incurred during the year ended December 31, 2008, primarily due to the fluctuations in the Chilean, Uruguayan and Colombian Peso. The foreign exchange loss increased $17.9 million to a loss of $15.5 million for the year ended December 31, 2008, from a gain of ($2.4) million for the year ended December 31, 2007, primarily due to the severe devaluation of the Chilean and Colombian Peso. The Chilean Peso weakened by 30.2%, to 648.0 pesos per U.S. dollar as of December 31, 2008, from 497.7 as of December 31, 2007. The Colombian Peso weakened by 10.2%, to 2,251.7 pesos per U.S. dollar as of December 31, 2008, from 2,044.2 as of December 31, 2007. The Uruguayan Peso also weakened by 13.3%, to 24.87 pesos per U.S. dollar as of December 31, 2008, from 21.94 as of December 31, 2007. The increase in other expense, net was partially offset by a $3.5 million gain from the repurchases of our 11 3/ 4% Senior Notes at substantial discounts to their face amount. Our November 2008 advance purchase of $5.0 million at 49.00 of face value plus accrued interest, in
50
Table of Contents
arm’s length transactions in connection with our mandatory August 15, 2009 sinking fund redemption requirement and in December 2008 of $1.0 million of our 11 3/4% Senior Notes at 37.00 of face value plus accrued interest, resulted in the gain.
Provision for income taxes. Provision for income taxes increased $1.2 million, to $2.8 million for the year ended December 31, 2009, from $1.6 million for the year ended December 31, 2008. The increase was due to provisioning of realization reserves against U.S. NOLs beginning in the fourth quarter of 2008 and taxes due as sub-part F income for certain of our foreign operations. Our effective tax rate was 28% for the year ended December 31, 2009, as compared to 5% for the year ended December 31, 2008, resulting primarily from the taxable gains on the repurchase of our 11 3/4% Senior Notes, and the taxable earnings in several of our In-country Operations, as compared to the year ended December 31, 2008.
The provision for income taxes increased by $0.7 million, or 84.0%, to $1.6 million for the year ended December 31, 2008, from $0.9 million for the year ended December 31, 2007. The increase was primarily due to the $4.2 million valuation allowance recorded during the year ended December 31, 2008. Our effective tax rate for the year ended December 31, 2008, was 5%, as compared to 7% for the year ended December 31, 2007, resulting primarily from foreign exchange losses in our local in-country jurisdictions, particularly in Chile and, to a lesser extent, Colombia. In addition, the goodwill impairment charge we recorded for the year ended December 31, 2008 is not tax deductible. As of December 31, 2008, we recorded a valuation allowance of $2.4 million in the U.S., $1.5 million in Argentina and $0.3 million in Mexico against the respective NOLs, as management does not believe that it will realize the full benefit of these NOLs.
Net income (loss). Net income (loss) increased $42.5 million, to net income of $7.2 million for the year ended December 31, 2009, as compared to a net loss of $35.3 million for the year ended December 31, 2008. The increase resulted from the foreign currency exchange gains due to the effects of the strengthening valuations against the U.S. dollar, particularly the Chilean, Colombian and Uruguayan Pesos. In addition, the increase was attributable to the decline in operating expenses related to our In-country Operations and the favorable gains in other income from the repurchase of $7.1 million of our 11 3/4% Senior Notes at substantial discounts to their face amount.
Net (loss) income decreased $47.9 million, to a net loss of $35.3 million for the year ended December 31, 2008, as compared to net income of $12.6 million for the year ended December 31, 2007. The decline in net income was impacted by the diminished growth in our revenues, which resulted from the recent global economic downturn and the disruptions in the credit markets. The decrease in our net (loss) income is also a result of the impairment our goodwill and the significant loss in foreign exchange due to the effects of the weakening of foreign currencies relative to the U.S. dollar, particularly the Chilean Peso and the Colombian Peso.
Liquidity and Capital Resources
The IT products distribution business is working-capital intensive. Historically, we have financed our working capital needs through a combination of cash generated from operations, trade credit from manufacturers, borrowings under revolving bank lines of credit (including issuance of letters of credit), asset-based financing arrangements that we have established in certain Latin American markets and the issuance of our 13 1/4% Senior Notes.
Our working capital increased by $35.0 million, or 46.2%, to $110.7 million at December 31, 2009, as compared to $75.7 million at December 31, 2008. This increase was due primarily to increased trade accounts receivable and inventories, partly offset by an increase in trade accounts payable. Our cash and cash equivalents at December 31, 2009 amounted to $27.2 million, as compared to $22.3 million at December 31, 2008. The increase was primarily attributable to the increase in trade accounts payable, offset by the repurchase of $7.1 million of our 11 3/4% Senior Notes at substantial discounts to their face amount, the redemption and cancellation of the remaining 11 3/4% Senior Notes and the concurrent closing of the 13 1/4% Senior Notes offering and the
51
Table of Contents
decrease in our lines of credit borrowings during the year ended December 31, 2009. We believe the improvement in working capital will benefit our Company in our ability to fund our working capital and capital expenditure requirements for the foreseeable future.
Changes in Financial Condition
The following table summarizes our cash flows for the periods presented:
| For the Years Ended December 31, | ||||||||||||
| 2009 | 2008 | 2007 | ||||||||||
| (Dollars in thousands) | ||||||||||||
| Cash flows (used in) provided by operating activities |
$ | (4,357 | ) | $ | 4,873 | $ | 6,534 | |||||
| Cash flows used in investing activities |
(2,417 | ) | (6,646 | ) | (6,201 | ) | ||||||
| Cash flows provided by (used in) financing activities |
11,270 | (3,214 | ) | 8,517 | ||||||||
| Effect of foreign currency exchange rate changes on cash and cash equivalents |
394 | (2,068 | ) | (25 | ) | |||||||
| Net increase (decrease) in cash and cash equivalents |
$ | 4,890 | $ | (7,055 | ) | $ | 8,825 | |||||
Cash flows (used in) provided by operating activities. Our cash flows from operating activities resulted in cash used in operations of $4.4 million for the year ended December 31, 2009, as compared to a generation of $4.9 million for the year ended December 31, 2008. The requirement was primarily driven by the increase in accounts receivables due to higher sales in the fourth quarter 2009, as compared to 2008, and the early payment of accrued interest on the 11 3/4% Senior Notes on December 22, 2009.
Our cash flows from operating activities resulted in a generation of $4.9 million for the year ended December 31, 2008, as compared to a generation of $6.5 million for year ended December 31, 2007. The decline was driven by lower trade accounts receivable and inventories as a result of management’s actions to reduce inventory levels and collect trade accounts receivables, offset by reduced levels of accounts payable due to accelerated vendor payments.
Cash flows used in investing activities. Our cash flows from investing activities resulted in a requirement of $2.4 million for the year ended December 31, 2009, as compared to a requirement of $6.6 million for the year ended December 31, 2008. The improvement was due primarily to the absence of capital expenditures associated with the new facilities in Peru and, to a lesser extent, Costa Rica and less ERP system integration expenditures due to the near completion of this effort.
Our cash flows from investing activities resulted in a requirement of $6.6 million for the year ended December 31, 2008, as compared to a requirement of $6.2 million for the year ended December 31, 2007. The additional requirement was primarily driven by capital expenditures associated with the new facilities in Costa Rica and Peru.
Cash flows provided by (used in) financing activities. Our cash flows from financing activities resulted in a generation of $11.3 million for the year ended December 31, 2009, as compared to requirement of $3.2 million for the year ended December 31, 2008. The improvement was driven by higher net borrowings of our new 13 1/4% Senior Notes in December 2009, offset by the redemption and cancellation of our prior 11 3/4% Senior Notes and paydown of our revolving credit facility with Comerica Bank.
Our cash flows from financing activities resulted in a requirement of $3.2 million for the year ended December 31, 2008, as compared to a generation of $8.5 million for the year ended December 31, 2007. The additional requirement was driven by the prepayment of our long-term debt in satisfaction of our $5.0 million August 15, 2009 sinking fund requirement and other 11 3/4% Senior Notes repurchases.
52
Table of Contents
Working Capital Management
The successful management of our working capital needs is a key driver of our growth and cash flow generation. The following table sets forth certain information about the largest components of our working capital: our trade accounts receivable, inventories and accounts payable:
| As of December 31, | ||||||||||||
| 2009 | 2008 | 2007 | ||||||||||
| (Dollars in thousands) | ||||||||||||
| Balance sheet data: |
||||||||||||
| Trade accounts receivable, net of allowance |
$ | 100,238 | $ | 91,085 | $ | 116,744 | ||||||
| Inventories |
95,185 | 90,858 | 116,961 | |||||||||
| Accounts payable |
117,216 | 108,754 | 141,911 | |||||||||
| (Data in days) | ||||||||||||
| Other data: |
||||||||||||
| Trade accounts receivable days(1) |
39.9 | 31.0 | 41.0 | |||||||||
| Inventory days(2) |
42.1 | 34.2 | 45.5 | |||||||||
| Accounts payable days(3) |
(51.8 | ) | (40.9 | ) | (55.3 | ) | ||||||
| Cash conversion cycle days(4) |
30.2 | 24.3 | 31.2 | |||||||||
| (1) | Trade accounts receivable days is defined as our consolidated trade accounts receivable (net of allowance for doubtful accounts) as of the last day of the year divided by our consolidated revenue for such period times 365 days. Our consolidated trade accounts receivable for our In-country Operations include value added tax at a rate of between 5% and 27% (depending on the country). The exclusion of such value added tax would result in lower trade accounts receivable days. |
| (2) | Inventory days is defined as our consolidated inventory as of the last day of the year divided by our consolidated cost of goods sold for such period times 365 days. |
| (3) | Accounts payable days is defined as our consolidated accounts payable as of the last day of the year divided by our consolidated cost of goods sold for such period times 365 days. |
| (4) | Cash conversion cycle is defined as our trade accounts receivable days plus inventory days less accounts payable days. |
Cash conversion cycle days. One measurement we use to monitor working capital is the cash conversion cycle, which measures the number of days to convert trade accounts receivable and inventory, net of accounts payable, into cash. Our cash conversion cycle increased to 30.2 days as of December 31, 2009, from 24.3 days as of December 31, 2008. This deterioration was primarily driven by the increase in our accounts receivable and inventory days. Trade accounts receivable days increased to 39.9 days as of December 31, 2009, from 31.0 days as of December 31, 2008, resulting from retailers in Chile and Ecuador taking longer to pay and extended term special projects in Guatemala. Inventory days increased to 42.1 days as of December 31, 2009, as compared to 34.2 days as of December 31, 2008, due to growth in inventory levels to meet recovering demand in the Region. Accounts payable days increased to 51.8 days as of December 31, 2009, from 40.9 days as of December 31, 2008, as management continued to align vendor payments to collection activity.
Our cash conversion cycle improved to 24.3 days as of December 31, 2008 from 31.2 days as of December 31, 2007. This improvement was primarily driven by the significant reduction in trade accounts receivable and inventory days, partially offset by a decrease in accounts payable days. Trade accounts receivable days decreased to 31.0 days as of December 31, 2008, from 41.0 days as of December 31, 2007, due primarily to improved collections in Miami’s export business. Inventory days decreased to 34.2 days as of December 31, 2008, from 45.5 days as of December 31, 2007, due to lower levels of inventory and inventory-in-transit as a result of our improved inventory management efforts. Accounts payable days decreased to 40.9 days as of December 31, 2008, from 55.3 days as of December 31, 2007, as management took special care to remain current on trade accounts payable with key suppliers.
53
Table of Contents
Trade accounts receivable. We principally sell products to a large base of third-party distributors, resellers and retailers throughout Latin America and the Caribbean and to other Miami-based exporters of IT products to Latin America and the Caribbean. Credit risk on trade receivables is diversified over several geographic areas and a large number of customers. No one customer accounted for more than 2.0% of sales as of the years ended December 31, 2009, 2008 and 2007. We provide trade credit to our customers in the normal course of business. The collection of a substantial portion of our receivables is susceptible to changes in Latin America and Caribbean economies and political climates. We monitor our exposure for credit losses and maintain allowances for anticipated losses after giving consideration to delinquency data, historical loss experience, and economic conditions impacting our industry. The financial condition of our customers and the related allowance for doubtful accounts is continually reviewed by management.
We believe the recent global economic downturn and the associated credit crisis had a negative impact on us and our creditors. The global recession has adversely affected our vendors’ and customers’ ability to obtain financing for operations. The subsequent tightening of credit in financial markets has affected our suppliers, who have already tightened trade credit, and, in turn, we have tightened trade credit to our customers.
Prior to extending credit to a customer, we analyze the customer’s financial history and obtain personal guarantees, where appropriate. Our Miami Operations and In-country Operations in Chile use credit insurance and make provisions for estimated credit losses. Our other In-country Operations make provisions for estimated credit losses but generally do not use credit insurance. Our Miami Operations has a credit insurance policy covering trade sales to non-affiliated buyers with Euler Hermes ACI. The policy’s aggregate limit is $20.0 million with an aggregate deductible of $1.5 million; the policy expires on August 31, 2010. In addition, 10% or 20% buyer coinsurance provisions and sub-limits in coverage on a per-buyer and per-country basis apply. The policy also covers certain large, local companies in Argentina, Costa Rica, El Salvador, Guatemala, Jamaica and Peru. Our In-country operations in Chile insures certain customer accounts with Coface Chile, S.A. credit insurance company; the policy expires on October 31, 2010.
Our large customer base and our credit policies allow us to limit and diversify our exposure to credit risk on our trade accounts receivable.
Inventory. We seek to minimize our inventory levels and inventory obsolescence rates through frequent product shipments, close and ongoing monitoring of inventory levels and customer demand patterns, optimal use of carriers and shippers and the negotiation of clauses in some vendor supply agreements protecting against loss of value of inventory in certain circumstances. The Miami distribution center ships products to each of our In-country Operations approximately twice per week by air and once per week by sea. These frequent shipments result in efficient inventory management and increased inventory turnover. We do not have long-term contracts with logistics providers, except in Mexico and Chile. Where we do not have long-term contracts, we seek to obtain the best rates and fastest delivery times on a shipment-by-shipment basis. Our Miami Operations also coordinates direct shipments to third-party customers and each of our In-country Operations from vendors in Asia.
Accounts payable. We seek to maximize our accounts payable days through centralized purchasing and management of our vendor back-end rebates, promotions and incentives. This centralization of the purchasing function allows our In-country Operations to focus their attention on more country-specific issues such as sales, local marketing, credit control and collections. The centralization of purchasing also allows our Miami Operations to control the records and receipts of all vendor back-end rebates, promotions and incentives to ensure their collection and to adjust pricing of products according to such incentives.
Capital Expenditures and Investments
Capital expenditures decreased to $2.5 million for the year ended December 31, 2009, as compared to $6.1 million for the year ended December 31, 2008. The decrease was primarily driven by absence of capital expenditures related to the new facilities in Costa Rica and Peru and the ERP system implementation costs.
54
Table of Contents
Capital expenditures decreased to $6.1 million for the year ended December 31, 2008, as compared to $6.8 million for the year ended December 31, 2007. The decrease was primarily driven by absence of capital expenditures related to the opening of our headquarters facility in Miami, Florida and the purchase of additional warehouse space in Chile in 2007, partially offset by capital expenditures associated with the new facilities in Costa Rica and Peru.
Capital expenditures increased to $6.8 million for the year ended December 31, 2007, as compared to $4.8 million for the year ended December 31, 2006. The increase was primarily driven by our common ERP, management and financial reporting system upgrades allowing for enhanced capability in managing our geographically disperse operations. In addition, the increase was primarily driven by capital expenditures of $1.6 million related to the new headquarters facility in Miami, Florida. In addition, the increase was also driven by capital expenditures of $0.7 million related to the additional warehouse space in Lima, Peru.
Our future capital requirements will depend on many factors, including the timing and amount of our revenues and our investment decisions, which will affect our ability to generate additional cash. We believe that our existing cash and cash equivalents will be sufficient to meet our anticipated cash requirements for working capital and capital expenditures for the foreseeable future. Thereafter, if cash generated from operations and financing activities is insufficient to satisfy our working capital requirements, we may seek additional funding through bank borrowings or other means. There can be no assurance that we will be able to raise any such capital on terms acceptable to us or at all. The recent global economic downturn and the subsequent tightening of the credit markets further heightens the risk that we may not be able to borrow additional funds under our existing credit facilities if participating banks become insolvent or their liquidity is impaired or that our ability to obtain alternative sources of financing will be limited. We anticipate that capital expenditures will be approximately $3.0 million per year over the next few years, as we have no further facility expansion needs and have completed a substantial portion of our ERP system implementation and integration. We have the option to purchase the warehouse and office facility located in Mexico City, Mexico, which we currently lease, prior to December 31, 2011, the option termination date. If we exercise this option, our capital expenditures will increase by $3.0 million in the year of exercise.
Capital Resources
We currently believe that our cash on hand, anticipated cash provided by operations, available and anticipated trade credit and borrowings under our existing credit facility and lines of credit, will provide sufficient resources to meet our anticipated debt service requirements, capital expenditures and working capital needs for the next 12 months. If our results of operations are not as favorable as we anticipate (including as a result of increased competition), our funding requirements are greater than we expect (including as a result of growth in our business), or our liquidity sources are not at anticipated levels (including levels of available trade credit), our resources may not be sufficient and we may have to raise additional financing or capital to support our business. In addition, we may not be able to accurately predict future operating results or changes in our industry that may change these needs. We continually assess our capital needs and may seek additional financing as needed to fund working capital requirements, capital expenditures and potential acquisitions. We cannot assure you that we will be able to generate anticipated levels of cash from operations or to obtain additional debt or equity financing in a timely manner, if at all, or on terms that are acceptable to us. Our inability to generate sufficient cash or obtain financing could hurt our results of operations and financial condition and prevent us from growing our business as anticipated.
We have lines of credit, short-term overdraft and credit facilities with various financial institutions in the countries in which we conducts business. Many of the In-country Operations also have limited credit facilities. These credit facilities fall into the following categories: asset-based financing facilities, letters of credit and performance bond facilities, and unsecured revolving credit facilities and lines of credit. The lines of credit are available sources of short-term liquidity for us.
55
Table of Contents
As of December 31, 2009 and 2008, the total amounts available under the credit facilities were $17.1 million and $14.4 million, respectively, and the total amounts outstanding were $14.7 million and $31.0 million, respectively, of which $9.2 million and $23.6 million, respectively related to our Miami Operations credit facility and $5.5 million and $7.4 million, respectively related to our In-country Operations credit facilities. The decline in the outstanding balance is primarily attributed to the decreased borrowing by SBA resulting from the new three-year revolving credit facility that replaced SBA’s existing revolving credit facility on December 22, 2009. The change is also attributed to a reduction in the borrowing requirements related to our operations in Peru and Uruguay, slightly offset by the increased borrowing by our subsidiaries to meet local working capital requirements, particularly borrowings related to our operations in Ecuador, Guatemala, Panama and Costa Rica.
SBA – Senior Secured Revolving Credit Facility
On December 22, 2009, SBA closed the Senior Secured Revolving Credit Facility with Comerica Bank pursuant to SBA and Comerica Bank’s commitment letter dated October 23, 2009 to replace the existing revolving credit facility with a new three-year revolving credit facility. The replacement was contingent upon our refinancing of our 11 3/4% Senior Notes and other conditions, all of which have been met.
The aggregate size of the facility is $20.0 million (with a possible increase of an additional $10.0 million) and it matures in January 2013. Under the Senior Secured Revolving Credit Facility, at SBA’s option, amounts due will bear interest at the daily adjustable LIBOR rate (at no time less than 2.0%) plus 3.5%, unless in the event of a default when interest will accrue at a rate equal to 3.0% per annum above the otherwise applicable rate. In addition, SBA will pay an administrative fee of $30,000 per annum and a facility fee equal to 0.50% of the aggregate amount of the revolving credit commitment, payable quarterly in arrears. Additional customary fees will be payable upon the issuance of letters of credit.
The Senior Secured Revolving Credit Facility contains a number of covenants that, among other things, restrict SBA’s ability to (i) incur additional indebtedness; (ii) make certain capital expenditures; (iii) guarantee certain obligations; (iv) create or allow liens on certain assets; (v) make investments, loans or advances; (vi) pay dividends, make distributions or undertake stock and other equity interest buybacks; (vii) make certain acquisitions; (viii) engage in mergers, consolidations or sales of assets; (ix) use the proceeds of the revolving credit facility for certain purposes; (x) enter into transactions with affiliates in non-arms’ length transactions; (xi) make certain payments on subordinated indebtedness; and (xii) acquire or sell subsidiaries. The Senior Secured Revolving Credit Facility also requires SBA to maintain certain ratios of debt, income, net worth and other restrictive financial covenants.
Borrowings under the new Senior Secured Revolving Credit Facility are secured on a first priority basis with all the assets of SBA. Amounts borrowed under the facility could be repaid and re-borrowed at any time during the term of the facility. Borrowing capacity is established monthly based on certain parameters established under the facility. Advances under the facility were provided based on 85.0% of eligible domestic and foreign accounts receivable plus 60.0% of eligible domestic inventory, less any credit facility reserves. The credit facility contained certain financial and non-financial covenants, including but not limited to, maintenance of a minimum level of tangible effective net worth, as defined and annual limitations on capital expenditures.
SBA – Revolving Credit Facility
SBA had a revolving credit facility with Comerica Bank (the “Revolving Credit Facility”) with a maturity date of January 1, 2010. As of December 31, 2008, SBA had $30.0 million available under the Revolving Credit Facility, including $1.4 million of letter of credit commitments, and a capital expenditures limit of $1.0 million. Borrowings against the Revolving Credit Facility had interest at the Eurodollar rate plus 3.5% due monthly and were secured on a first priority basis with all the assets of SBA. The Revolving Credit Facility contained certain financial and non-financial covenants, including but not limited to, maintenance of a defined minimum level of tangible effective net worth and annual limitations on capital expenditures. Borrowing capacity was determined
56
Table of Contents
monthly based on certain parameters established under the facility and amounts borrowed under the facility were required to be repaid and re-borrowed at any time during the term of the facility. Advances under the Revolving Credit Facility were provided based on 85.0% of eligible domestic accounts receivable and 85.0% of eligible foreign accounts receivable plus 60.0% of eligible domestic inventory, less any credit facility reserves.
On March 20, 2009, SBA obtained a waiver to the Revolving Credit Facility from Comerica Bank for its senior debt to tangible effective net worth ratio, minimum tangible effective net worth and net income as of December 31, 2008. SBA also obtained an amendment for the definitions of the borrowing base, revolving credit note and SBA’s permitted investments. The amendment allowed SBA to issue commercial letters of credit and standby letters of credit, not to exceed $2.0 million at any one time outstanding. Borrowings against the facility bore interest at the daily adjustable LIBOR rate (at no time less than 2.0%) plus the applicable margin of 4.0%. SBA was required to provide accounts payable aging, insurance and borrowing base certificates on a bi-weekly basis, and maintain monthly stated levels of EBITDA. SBA and its guarantor were required to maintain quarterly stated levels of net income, effective March 31, 2009 to December 31, 2009.
On November 13, 2008, SBA obtained a waiver to the Revolving Credit Facility for the minimum tangible effective net worth and senior debt to tangible effective net worth ratio under the facility with Comerica Bank, as a result of SBA’s default of its minimum tangible effective net worth and senior debt to tangible effective net worth ratio as of September 30, 2008. SBA also obtained an amendment to the Revolving Credit Facility increasing the cap of the inventory borrowing base from $12.5 million to $14.0 million, amending the borrowing rate to the Eurodollar rate plus 3.5% and the maturity date to January 1, 2010, and requiring increased financial reporting disclosures made to Comerica Bank on a continual basis.
On August 14, 2008, SBA obtained a waiver to the Revolving Credit Facility for the minimum tangible effective net worth and senior debt to tangible effective net worth ratio under the facility with Comerica Bank as a result of SBA’s default of its minimum tangible effective net worth and senior debt to tangible effective net worth ratio as of June 30, 2008. Under the facility SBA was required to maintain a minimum tangible effective net worth of $25.0 million and a senior debt to tangible effective net worth ratio of not more than 6.0 to 1.0.
On May 14, 2008, SBA obtained a waiver to the Revolving Credit Facility with Comerica Bank for the minimum tangible effective net worth and the senior debt to tangible effective net worth ratio as of March 31, 2008. SBA also obtained an amendment to the facility decreasing the minimum tangible effective net worth of $25.0 million to $20.0 million, effective for the quarters ended September 30, 2008 and March 31, 2009, requiring SBA to maintain a senior debt to tangible effective net worth ratio of not more than 2.5 to 1.0, and requiring SBA to maintain a minimum tangible effective net worth of $25.0 million for the quarters ended June 30, 2008, December 31, 2008, June 30, 2009, and for each quarter end thereafter. The amendment required SBA’s senior debt to tangible effective net worth ratio to be not more than 5.0 to 1.0, effective as of December 31, 2008, and December 31 of each year thereafter. The amendment increased SBA’s senior debt to tangible effective net worth ratio to not more than 6.0 to 1.0, effective as of June 30, 2008, September 30, 2008, March 31, 2009, and June 30, September 30 and March 31 of each year thereafter. Under the amendment, borrowings against the facility bore interest at the U.S. prime lending rate (5.00% at June 30, 2008) or Eurodollar rate plus 2.4%.
On March 28, 2008, SBA obtained an amendment to the Revolving Credit Facility with Comerica Bank for the definition of the tangible effective net worth and to increase the senior debt to tangible effective net worth ratio to not more than 3.5 to 1.0, effective for the quarters ended March 31, 2008 and June 30, 2008, and not more than 3.0 to 1.0 thereafter. In addition, SBA obtained a waiver to the facility for the senior debt to tangible effective net worth ratio as of December 31, 2007.
Intcomex, Inc. – 13 1/4% Senior Notes
On December 22, 2009, we completed a private offering to eligible purchasers (the “13 1/4% Senior Notes Offering”) of $120.0 million aggregate principal amount of our 13 1/4% Senior Notes due December 15, 2014
57
Table of Contents
with an interest rate of 13.25% per year, payable semi-annually on June 15 and December 15 of each year, commencing on June 15, 2010. The 13 1/4% Senior Notes were offered at an initial offering price of 94.43% of par, or an effective yield to maturity of approximately 14.875%.
We used the net proceeds from the 13 1/4% Senior Notes Offering to, among other things, repay outstanding borrowings under our Senior Secured Revolving Credit Facility, fund the repurchase, redemption or other discharge of our 11 3/4% Senior Notes, for which it conducted a tender offer, and for general corporate purposes. The 13 1/4% Senior Notes are guaranteed by all of our existing and future domestic restricted subsidiaries that guarantee our obligations under the Senior Secured Revolving Credit Facility.
In connection with the 13 1/4% Senior Notes Offering, our Company and certain of our subsidiaries that guaranteed our obligations (the “Guarantors”) under the indenture governing the 11 3/4% Senior Notes (the “113/4% Senior Notes Indenture”) entered into an indenture (the “13 1/4% Senior Notes Indenture”) with The Bank of New York Mellon Trust Company, N.A., (the “Trustee”). Our obligations under the 13 1/4% Senior Notes and the Guarantors’ obligations under the guarantees will be secured on a second priority basis by a lien on 100% of the capital stock of certain of ours and each Guarantor’s directly owned domestic restricted subsidiaries; 65% of the capital stock of ours and each Guarantor’s directly owned foreign restricted subsidiaries; and substantially all the assets of SBA, to the extent that those assets secure our new Senior Secured Revolving Credit Facility with Comerica Bank, subject to certain exceptions.
Subject to certain requirements, we are required to redeem $5.0 million aggregate principal amount of the 13 1/4% Senior Notes on December 15 of each of the years 2011 and 2012 and $10.0 million aggregate principal amount of the 13 1/4% Senior Notes on December 15, 2013 at a redemption price equal to 100% of the aggregate principal amount of the 13 1/4% Senior Notes to be redeemed, plus accrued and unpaid interest to the redemption date subject to certain requirements. We may redeem the 13 1/4% Senior Notes, in whole or in part, at any time prior to December 15, 2012 at a price equal to 100% of the aggregate principal amount of the 13 1/4% Senior Notes plus a “make-whole” premium. At any time prior to December 15, 2012, the Company may redeem up to 35% of the aggregate principal amount of the 13 1/4% Senior Notes with the net cash proceeds of certain equity offerings and up to 10% of the original aggregate principal amount of the 13 1/4% Senior Notes (no more than once in any 12-month period). The Company will be required to redeem up to 35% of the aggregate principal amount of the 13 1/4% Senior Notes if an initial public offering occurs on or prior to December 15, 2012 at a price equal to 113.25% of the principal amount of the 13 1/4% Senior Notes.
The indenture governing our 13 1/4% Senior Notes imposes operating and financial restrictions on us. These restrictive covenants limit our ability, among other things to (i) incur additional indebtedness or enter into sale and leaseback obligations; (ii) pay certain dividends or make certain distributions on our capital stock or repurchase our capital stock; (iii) make certain investments or other restricted payments; (iv) place restrictions on the ability of subsidiaries to pay dividends or make other payments to us; (v) engage in transactions with shareholders or affiliates; (vi) sell certain assets or merge with or into other companies; (vii) guarantee indebtedness; and (vii) create liens. We may only pay a dividend if we are in compliance with all covenants and restrictions in the Indenture prior to and after payment of a dividend.
Also on December 22, 2009, in connection with the 13 1/4% Senior Notes Offering, certain of our Company’s existing shareholders and their affiliates contributed $20.0 million of new capital in exchange for 27,175 newly-issued shares of our Company’s common stock. The capital contribution consisted of the redemption and cancellation of $15.1 million face value of the 11 3/4% Senior Notes, $0.9 million of tender premium paid on the settlement of the 11 3/4% Senior Notes and additional cash of $4.0 million.
For the year ended December 31, 2009, we recorded additional paid in capital of $20.0 million related to our 13 1/4% Senior Notes and did not record any additional paid in capital for the year ended December 31, 2008. As of December 31, 2009, $113.3 million of our 13 1/4% Senior Notes remained outstanding and as of December 31, 2008, there were no 13 1/4% Senior Notes outstanding.
58
Table of Contents
Intcomex, Inc. – 11 3/4% Senior Notes
On August 25, 2005, we consummated a $120.0 million high yield notes offering in aggregate principal amount of the 11 3/4% Senior Notes. The 11 3/4% Senior Notes were sold at 99.057% of face value and carry a coupon rate of 11 3/4% and are a second priority senior secured obligation of the Company due January 15, 2011. The proceeds of the offering were used to repay existing indebtedness, pay a dividend to shareholders, and pay fees and expenses associated with the debt offering with the remaining balance to be used for general corporate purposes. The 11 3/4% Senior Notes were secured on a second priority basis with 100.0% of the common shares of Holdings and SPC-1, and 65.0% of the shares of IXLA plus a second priority lien on the assets of SBA.
On March 13, 2008, the Company repurchased $1.0 million of the 11 3/4% Senior Notes in an arm’s length transaction, at 98.25% of face value plus accrued interest. As of September 30, 2008 and December 31, 2007, $109.6 million and $114.5 million, respectively, of the 11 3 /4% Senior Notes remained outstanding.
On April 9, 2008, the Company purchased $1.0 million of its 11 3/4% Senior Notes at 96.25% of face value plus accrued interest and an additional $1.0 million on April 25, 2008, at 96.5% of face value plus accrued interest in arms’ length transactions in connection with its mandatory sinking fund redemption requirement. On June 24, 2008, the Company purchased $2.0 million of its 11 3/4% Senior Notes in arm’s length transactions at 90.00% of face value plus accrued interest in connection with its mandatory sinking fund redemption requirement.
As of December 31, 2008, $103.6 million, net of current portion, of the 11 3/4% Senior Notes remained outstanding. As of December 31, 2009 $1.4 million of the 11 3/4% Senior Notes remained outstanding and were redeemed through payment to the Trustee for settlement on January 15, 2010.
On December 22, 2009, our Company, the Trustee and the Guarantors executed a second supplemental indenture (the “11 3/4% Senior Notes Second Supplemental Indenture”) as a result of the receipt of tenders and related consents from the holders of at least two thirds in principal amount of the 11 3/4% Senior Notes, in response to the Company’s tender offer and consent solicitation. The 11 3/4% Senior Notes Second Supplemental Indenture amends the indenture governing the 11 3/4% Senior Notes to delete or make less restrictive substantially all of the restrictive covenants contained in such indenture (other than requirements to make an offer for the 11 3/4% Senior Notes in the event of certain asset sales), to delete events of default relating to covenant defaults, cross-defaults and judgments against the Company, to make conforming and related changes to the indenture and to reduce the minimum redemption notice period from 30 days to three days.
On January 15, 2010, the $1.4 million of the 11 3/4% Senior Notes not tendered in the early tender redemption period, were redeemed from the proceeds held by the Trustee, in accordance with the terms of the 11 3/4% Senior Notes Second Supplemental Indenture.
Contractual Obligations
The following table summarizes our contractual obligations and the payments due on such obligations at December 31, 2009:
| Payments Due by Period (Dollars in millions) | |||||||||||||||
| Total | Less than 1 Year |
1 – 3 Years |
3 – 5 Years |
After 5 Years | |||||||||||
| Contractual Obligations |
|||||||||||||||
| Debt obligations(1) |
$ | 136.3 | $ | 15.3 | $ | 11.0 | $ | 110.0 | $ | — | |||||
| Interest on debt obligations(2) |
75.0 | 16.0 | 31.2 | 27.8 | — | ||||||||||
| Operating lease obligations |
23.2 | 2.5 | 7.7 | 2.0 | 11.0 | ||||||||||
| Total |
$ | 234.5 | $ | 33.8 | $ | 49.9 | $ | 139.8 | $ | 11.0 | |||||
| (1) | Debt obligations include our short and long term debt principal and the $6.7 million original issue discount payment related to the issuance of our 13 1/4% Senior Notes. |
| (2) | Interest on debt obligations is calculated assuming no early prepayment or redemption. |
59
Table of Contents
Foreign exchange risk
Our principal market risk relates to foreign exchange rate sensitivity, which is the risk related to fluctuations of local currencies in our in-country markets, as compared to the U.S. dollar. We periodically engage in foreign currency forward contracts when available and when doing so is not cost prohibitive. In periods when we do not, foreign currency fluctuations may adversely affect our results of operations, including our gross and operating margins. We did not have any foreign currency forward contracts outstanding as of December 31, 2009. Our foreign currency forward contract with a notional amount of $11.8 million as of December 31, 2008, had a fair value of ($31,000).
A significant portion of our revenues from In-country Operations is invoiced in currencies other than the U.S. dollar, even though prices for IT products in our in-country markets are based on U.S. dollar amounts. For the years ended December 31, 2009 and 2008, 43.6% and 43.8% respectively, of our total revenue was invoiced in currencies other than the U.S. dollar. In addition, a significant majority of our cost of revenue is driven by the pricing of products in U.S. dollars. As a result, our gross profit and gross margins will be affected by fluctuations in foreign currency exchange rates. In addition, a significant amount of our in-country operating expenses are denominated in currencies other than the U.S. dollar. For the years ended December 31, 2009 and 2008, 52.8% and 47.0%, respectively, of our operating expenses were denominated in currencies other than the U.S. dollar. As a result, our operating expenses and operating margins will be affected by fluctuations in foreign currency exchange rates.
In most markets, including Argentina, Chile, Colombia, Costa Rica, Guatemala, Jamaica, Mexico, Peru and Uruguay, we invoice in local currency. Foreign currency fluctuations in these markets will impact our results of operations, both through foreign currency transactions and through the remeasurement of the financial statements into U.S. dollars. In the case of foreign currency transactions, inventory is initially recorded in the books and records of each of our In-country Operations in the local currency at the exchange rate in effect on the date the inventory is received. When a sale of this inventory is made by our In-country Operations, it is invoiced and recorded in the books and records in the local currency based on the U.S. dollar price converted at the exchange rate in effect on the date of sale. As a result, the appreciation of a local currency in one of these markets between the time that inventory is purchased and the time it is sold could have a marginal impact on our gross profit in U.S. dollar terms, thereby impacting our gross margins. In these cases, the settlement of the initial payable owed to a vendor (including, in many cases, our Miami Operations) results in a foreign exchange gain, which is included in foreign exchange loss (gain) in our consolidated statements of operations and which effectively offsets, in part, the reduction in gross profit. Conversely, the weakening of a local currency in one of these markets will have the opposite effect from those described above on our gross profit and gross margins.
The U.S. dollar is the functional currency in the preparation of our consolidated financial statements in each of our In-country Operations, except in Mexico where the functional currency is the Mexican Peso. In most of our In-country Operations, including Argentina, Chile, Colombia, Costa Rica, Guatemala, Jamaica, Mexico, Peru and Uruguay, our books and records are prepared in currencies other than the U.S. dollar. Remeasurement into the U.S. dollar is required for the preparation of our consolidated financial statements and will impact our results of operations. The remeasurement of our operating expenses is performed using an appropriately weighted-average exchange rate for the period. For periods where the local currency has appreciated relative to the U.S. dollar, the remeasurement increases the value of our operating expenses, thereby adversely impacting our operating margins. Conversely, the weakening of a local currency in one of these markets will have the opposite effect from those described above on operating expenses and operating margins. For example, we estimate that a one percent weakening or strengthening of the U.S. dollar against these local currencies would have increased or decreased our selling, general and administrative expenses by approximately $0.4 million, $0.3 million and $0.4 million for the years ended December 31, 2009, 2008 and 2007, respectively. The remeasurement of our monetary assets and liabilities is performed using exchange rates at the balance sheet date, with the changes being recognized in Foreign exchange (gain) loss in our consolidated statements of operations.
60
Table of Contents
In Ecuador, Panama and El Salvador, all of our transactions are conducted in U.S. dollars and all of our financial statements are prepared using the U.S. dollar, and therefore, foreign exchange fluctuations do not directly impact our results of operations.
We believe that our broad geographical scope reduces our exposure to the risk of significant and sustained currency fluctuations in any of our Latin American or Caribbean markets. In addition, a relatively small portion of the sales from our In-country Operations in Argentina, Chile, Costa Rica, Peru and Uruguay can be invoiced, at the election of certain of our customers, in U.S. dollars, thereby reducing the overall impact of fluctuations in the foreign currency exchange rates in these countries. In addition, in Chile, Peru and Guatemala, we from time to time reduce our exposure to the risk of currency devaluation by drawing on a local currency-denominated line of credit to acquire U.S. dollars.
If there are large and sustained devaluations of local currencies, like those that occurred in Brazil in 2000 and in Argentina in 2001, many of our products can become more expensive in local currencies. This could result in our customers having difficulty paying those invoices and, in turn, result in decreases in revenue. Moreover, such devaluations may adversely impact demand for our products because our customers may be unable to afford them. In these circumstances, we will usually offer a repayment plan for an affected customer, which in our experience has usually resulted in successful collection. In addition, substantially all of our Miami Operations’ foreign accounts receivable (other than accounts receivable owed by affiliates) are insured by Euler Hermes ACI. The policy’s aggregate limit is $20.0 million with an aggregate deductible of $1.5 million; the policy expires on August 31, 2010. In addition, 10% or 20% buyer coinsurance provisions apply, as well as sub-limits in coverage on a per-buyer and on a per-country basis. The policy also covers certain large, local companies in Argentina, Costa Rica, El Salvador, Guatemala, Jamaica and Peru. Our In-country Operations in Chile insures certain customer accounts with Coface Chile, S.A. credit insurance company in Chile; the policy expires on October 31, 2010.
It is our policy not to enter into foreign currency transactions for speculative purposes.
Interest rate risk
We are also exposed to market risk related to interest rate sensitivity, which is the risk that future changes in interest rates may affect our net income or our net assets. Given that a majority of our debt is a fixed rate obligation, we do not believe that we have a material exposure to interest rate fluctuations. For 2009, assuming SBA’s $20.0 million floating rate revolving credit facility with Comerica Bank was fully drawn for the entire year, a 1.0% (100 basis points) increase (or decrease) in the U.S. prime lending rate would result in $200,000 increase (or decrease) in our current expense for the year.
It is our policy not to enter into interest rate transactions for speculative purposes.
61
Table of Contents
Our Company
We believe we are the largest pure play value-added international distributor of computer information technology products, or IT products, focused solely on serving Latin America and the Caribbean (the “Regions”). We distribute computer equipment, components, peripherals, software, computer systems, accessories, networking products and digital consumer electronics to more than 50,000 customers in 40 countries. We offer single source purchasing to our customers by providing an in-stock selection of more than 6,100 products from over 173 vendors, including many of the world’s leading IT product manufacturers. For the year ended December 31, 2009, our revenues were $917 million.
Over the last 20 years, we have built an IT products distribution network in Latin America and the Caribbean that we believe is unmatched by any of our competitors in terms of the number of countries served through an in-country presence. We have achieved our regional market leadership position by offering our customers a wide and readily available product selection and excellent pre- and post-sale customer service, while providing our vendors with a multi-country distribution channel for their products. We believe our broad regional presence makes us more attractive to our vendors and customers, thereby enhancing our revenue growth and operating margins, and our geographic diversification reduces our operating risks.
We believe we have the broadest in-country presence of any distributor of IT products to Latin America and the Caribbean, in terms of the number of countries served through an in-country presence. From our headquarters and main distribution center in Miami, we support a network of in-country sales and distribution operations in 12 countries in Latin America and the Caribbean and a sales office in Brazil. As a result of our unique distribution platform, we have realized consistent organic revenue growth and strong operating margins. From 2001 to 2009, our revenue grew from $324.1 million to $917.2 million, representing a compound annual growth rate, or CAGR, of 13.9%, and our operating income grew from $11.2 million to $20.3 million, representing a CAGR of 7.7%. We believe these growth rates and our operating margins are higher than those of our public company competitors.
We serve the Latin American and Caribbean IT products markets using a dual distribution model:
| • | As a Miami-based wholesale aggregator, we sell primarily to: |
| - | third-party distributors, resellers and retailers of IT products based in countries in Latin America and the Caribbean where we do not have a local presence; |
| - | third-party distributors, resellers and retailers of IT products based in countries in Latin America and the Caribbean where we have a local presence but whose volumes are large enough to enable them to efficiently acquire products directly from U.S.- based wholesale aggregators; |
| - | other Miami-based exporters of IT products to Latin America and the Caribbean; and |
| – | our In-country Operations. |
| • | As an in-country distributor in 12 countries, we currently sell to over 48,000 local reseller and retailer customers, including value- added resellers (companies that sell, install and support IT products and PCs), systems builders (companies that specialize in building complete computer systems by combining components from different vendors), smaller distributors and retailers. |
Our History
Anthony Shalom and Michael Shalom founded our company as a small software retailer in South Florida in 1988. In 1989, we started exporting IT products from Miami to Latin America and moved our headquarters to the vicinity of the Port of Miami and the Miami International Airport in order to capitalize on the growing export
62
Table of Contents
trade of IT products to Latin America and the Caribbean. We established our first in-country sales and distribution operations in Mexico in 1990, and expanded our presence to include Panama and Chile in 1994; Peru, Guatemala and Uruguay in 1997; El Salvador, Ecuador, Costa Rica and Jamaica in 2000; Argentina in 2003; and Colombia in 2004. In 2001, we exchanged with the management of Centel our interest in Centel, our then-existing Mexican operations, for the Intcomex shares held by the management of Centel and we re-established our presence in Mexico by re-acquiring all interests in Centel in June 2005. Our growth into new markets has been largely organic, typically in partnership with talented local managers knowledgeable about the IT products distribution business in their country.
In 2001, we exchanged our interest in Centel, our then-existing Mexican operations, with Centel’s management, for all of the shares of Intcomex held by Centel’s management. In June 2005, we re-established our presence in Mexico by re-acquiring all of our interest in Centel.
In August 2004, CVC International, a unit of Citigroup Inc. engaged in private equity investments in emerging markets, acquired 52.5% of our voting equity interests. As part of that transaction, we redeemed all of the equity interests in our company held by our former non-management stockholders and some of the equity interests in our company held by our management stockholders. Following this offering, CVC International will own % of our common stock on a fully diluted basis, or approximately % if the underwriters’ over-allotment option is exercised in full, and management will own % of our common stock on a fully diluted basis, or approximately % if the underwriters’ over-allotment option is exercised in full.
In December 2009, certain of our Company’s existing shareholders and their affiliates contributed $20.0 million of new capital in exchange for newly-issued shares of our Class B common stock, non-voting. Following the capital contribution, CVC International maintained 52.5% of our voting equity interests and held 47.6% of our non-voting common stock. Anthony Shalom and Michael Shalom remain our second and third largest shareholders after CVC International, with holdings of 23.0% and 9.0%, respectively, of our voting equity interests and each holds 6.1% of our non-voting common stock.
Our Strengths
We have capitalized on our strengths to achieve a leadership position in the markets we serve. Our strengths include:
Pure play IT products distributor with leading positions in a large and growing market. We believe we are the largest pure play value-added distributor of IT products focused solely on Latin America and the Caribbean. We believe we hold the number one or number two market share position in each of the 12 countries in which we have an in-country distribution presence, except for Mexico and Colombia. We believe that we are well positioned in these markets to capitalize on the significant growth prospects driven by increasing PC and Internet penetration rates, increasing demand for notebook and netbook computers and an increasing market for PCs priced below $500. According to IDC, spending on IT products (including hardware, packaged software and services) in Latin America and the Caribbean is projected to grow from $51.9 billion in 2007 to $74.3 billion in 2013, growing at an average of 6.2% per year. This is more than twice as fast as the expected growth rate in IT spending in the United States over the same period and contrasts with a decline in IT spending in Latin America and the Caribbean from 2000 to 2006. Growth in these markets is expected to be driven primarily by increasing PC and Internet penetration rates as well as increasing demand for notebook and netbook computers. According to Pyramid Research, the Latin American and Caribbean PC penetration rate reached 24.7% in 2009 and is predicted to rise to 37.1% in 2013, which is still well below the U.S. and Canadian penetration rate of 95.5% in 2009. We expect that the higher growth in the market for PCs priced below $500 will drive a significant portion of this increase. We believe that we are well positioned in this market segment, which, according to Gartner, is expected to grow an average of 25.9% per year from 2009 to 2013. In addition, the rapid adoption of the Internet by Latin American and Caribbean consumers continues to fuel purchases of PCs. The number of Internet users is predicted by Pyramid Research to grow an average of 16.8% per year from 2009 to 2013, representing an increase in penetration rates from 29.1% to 51.8% over this period. Further, we expect to benefit from the
63
Table of Contents
accelerating growth in the notebook computers segment. Gartner expects notebook computer shipments to grow from 10.3 million units in 2009 to 24.5 million units in 2013, representing an average growth rate of 24.1% per year.
Unique business model creates industry-leading margins with significant barriers to entry. We operate both as a Miami-based wholesale aggregator and as an in-country distributor located in 12 countries throughout Latin America and the Caribbean. Our participation at two levels of the distribution chain (Miami and in-country), coupled with our extensive geographic footprint, creates a market presence that we believe is unmatched by any of our competitors and enables us to generate industry-leading margins among our public company competitors. Our dual distribution approach links a diversified set of vendors, primarily located in the United States and Asia, to a fragmented number of customers spread throughout Latin America and the Caribbean, and delivers value to both ends of the supply chain. To our vendors, we provide access to markets and customers that would be costly and inefficient for them to reach directly. For our reseller customers, we provide a cost- and time-effective source for product supply. Typically, resellers’ small order sizes prevent them from establishing direct relationships with major IT product vendors, and resellers’ limited in-stock inventory creates a need for aggregators and distributors that can provide rapid delivery of a wide variety of products. We provide resellers with broad and timely product availability, multivendor single source purchasing, technical support and local warranty service. Consequently, we are a critical component of the supply chain between most of the leading manufacturers of IT products in the United States and Asia and resellers in Latin America and the Caribbean. Over the last 20 years, we have built a broad distribution infrastructure throughout our region and gained important business experience and relationships in each of our markets. We believe that the significant time and investment required to establish an efficient regional distribution infrastructure and the valuable services we provide to both our vendors and customers create significant barriers to entry in each of our markets.
Strong revenue growth and sustainable industry-leading profitability. From our founding in 1988 to the present, we have experienced consistent sales growth. From 2001 to 2009, we achieved a CAGR in revenue of 13.9%. During this period, we also maintained consistently strong operating profitability, with a CAGR in operating income of 7.7% (excluding restructuring charges). In 2009, we achieved an operating income margin of 2.3%, compared to the operating margins of 1.1% and 1.2% of our two largest competitors, Ingram Micro and Tech Data, respectively (excluding any goodwill impairment or restructuring charges). Our unique business model, our broad geographic footprint and our focus on higher-margin components, peripherals and software have been the main contributors to our strong margins. We believe these strong margins have helped us achieve what we believe to be an industry-leading return among our public company competitors on invested capital, or ROIC, which we define as net after-tax operating profit divided by average shareholders’ equity and net debt. We have consistently achieved an ROIC in the low to mid teens, except for recent years effected by the economic crisis (7.5% in 2008 and 9.9% in 2009, excluding goodwill impairment, write-off IPO costs and restructuring charges). Our strong ROICs have also been driven by our focus on minimizing our cash conversion cycle with centralized purchasing, efficient managing of in-country inventory levels, establishing strict customer credit policies and carefully monitoring on-going inventory and demand. Our cash conversion cycle (measuring the number of days to convert trade accounts receivable and inventory, net of accounts payable, into cash) was 30.2 days as of December 31, 2009.
Highly diverse business across multiple geographies and customers. We believe we have the broadest in-country presence of any distributor of IT products to Latin America and the Caribbean, in terms of the number of countries served through an in-country presence. We distribute products to more than 50,000 customers in 40 countries. The diversification of our geographic presence and customer base contributes to our consistent organic revenue growth and reduces our dependence on any single country or customer. We believe our diverse geographic presence will allow us to maintain a strong pace of organic growth in our target markets, driven by attractive market share expansion opportunities as well as strong underlying market growth characteristics. We can also use our deep knowledge of local markets to assess local market conditions and adjust our market focus as necessary. Moreover, the regional expertise we have gained in our multiple local markets can be applied and transferred when we expand our distribution platform into new geographies. In 2009, no country contributed
64
Table of Contents
more than 10% of our revenue, except Chile (23.4%). We have also established a strong brand and a reputation for providing excellent customer service that we believe builds customer loyalty and leads to recurring revenue. In addition, we offer customers a one-stop shop for purchasing a broad selection of products, which enables us to maintain a large and diverse group of customers and attract and maintain new customers. In 2009, no single customer represented more than 2.0% of our revenue on a consolidated basis.
Strong vendor relationships and broad portfolio of products. We distribute and market more than 6,100 products from over 173 vendors, enabling us to offer a wide variety of products, satisfy customer requirements for product availability and meet end-user demand for multi-vendor and multi-product IT configurations. The large number of resellers and retailers in the region, their relatively small size, and their geographic fragmentation make it cost effective for vendors to rely on wholesale distributors like us that can deliver a broad regional distribution channel, rather than distributing directly to numerous fragmented resellers and retailers. We provide vendors with extensive regional coverage, larger order sizes, simplified logistics, lower distribution costs than if they dealt with each of our affiliates independently, quality pre- and post-sale marketing and technical support. We also eliminate the need for our vendors to handle issues such as local duty and tax arrangements, customer credit analysis and management of numerous small accounts. Consequently, we have established long-standing relationships with most of the leading manufacturers of IT products in the United States and Asia, who we believe value our ability to provide reliable and efficient access to the numerous and growing markets across Latin America and the Caribbean. In 2009, no single vendor’s products generated more than 19.1% of our revenue.
Experienced management team with significant equity ownership. Each of our two co-founders, who today are our Chief Executive Officer and Chairman, has more than 20 years of industry experience in Latin America and the Caribbean. Our senior managers have an average tenure of over 9 years with us and each has had substantial experience working in the region. In addition, the turnover rate among our senior managers has been low. Prior to this offering, our senior managers beneficially owned approximately 27.5% of our capital stock on a fully diluted basis and will own approximately % of our capital stock following the offering. As a result of their substantial equity interest, we believe that our management has significant incentive to continue to increase our revenue and margins.
Our Industry
IT products generally follow a three-tiered distribution system from the manufacturer to end-users in Latin America and the Caribbean:
| • | Wholesale aggregators, like our Miami-based operations, typically based in Miami, purchase IT products from vendors, and sell those products to other Miami-based exporters and in-country distributors. They typically maintain warehouses and sales forces in Miami and do not have substantial operations outside of Miami. For the years ended December 31, 2009 and 2008, revenue from our Miami Operations represented 25.6% and 25.9% of our consolidated revenue, respectively. |
| • | In-country distributors, like our In-country Operations, typically purchase IT products from wholesale aggregators and sell them to local resellers and retailers. The in-country distributors typically have a limited geographic focus (generally limited to one country or cities within one country), a local sales force in direct contact with their customers and local warehousing. The in-country distributors’ limited size, capital and geographic reach often prevent them from establishing and maintaining direct relationships with vendors, which are located predominantly in the United States and Asia and which focus their relationships on IT distributors with broad geographic coverage or large order sizes. In most markets most in-country distributors lack sufficient size to benefit from significant economies of scale and are not sufficiently capitalized to offer their customers a full range of products and services. We have in-country sales and distribution operations in 12 countries in Latin America and the Caribbean and a sales office in Brazil. For the years ended December 31, 2009 and 2008, revenue from our In-country Operations represented 74.4% and 74.1% of our consolidated revenue, respectively. |
65
Table of Contents
| • | Resellers typically acquire IT products from the in-country distributors and resell them to the end-user (typically individuals, small and medium businesses or governments). Resellers vary greatly in size and type, from one-person operations to large retailers. |
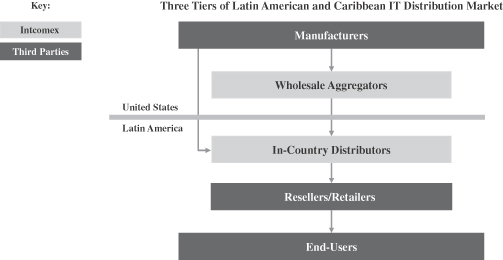
The distribution model for IT products in Latin America and the Caribbean is markedly different from that of more advanced markets where direct sales by IT vendors are common. In Latin America and the Caribbean, IT vendors rely extensively on wholesale distribution rather than direct sales. According to International Data Corporation, or IDC, a market intelligence and advisory firm in the IT and telecommunications industries, IT distributors (including local dealers, resellers, retailers and assemblers) comprised about 69% of PCs sold in Latin America and the Caribbean, while the remaining 31% were sold directly to end-users through the internet and original equipment manufacturer (“OEM”) direct sales forces in 2008.
Latin America and the Caribbean are comprised of more than 45 countries, many unique with respect to their logistical infrastructure, regulatory and legal framework, trade barriers, taxation, currency and language. This fragmentation presents challenges to IT product manufacturers seeking to establish a regional distribution, sales, logistics and service network, because such a network would have to be created separately for each country, with limited economies of scale due to the small size of most markets and barriers to entry associated with cross-border complexities. We believe that our dual distribution model, as well as our extensive geographic presence in the region, is not only unique but also valuable to our vendors and customers and difficult to replicate.
The IT products distribution industry is driven by sales to end-users. From 1998 to 2008, spending on IT products (including hardware, packaged software and services) in Latin America and the Caribbean grew at approximately 3.6% per year, from $41.3 billion to $58.7 billion. According to IDC, spending is projected to grow an average of 5.8% per year from 2009 to 2013, to $74.3 billion. While the Latin American and Caribbean population of approximately 568 million people is 86.9% larger than that of the U.S., the market in 2008 for IT products in the Region was only 11.6% of the size of the market for IT products in the U.S.
The growth in IT spending in Latin America and the Caribbean is attributed mainly to increasing PC penetration rates, rapidly increasing Internet penetration rates and increasing access to consumer credit.
66
Table of Contents
Increasing PC penetration rates
According to Pyramid Research, from 2003 to 2009, the PC penetration rate of Latin America and the Caribbean increased from 9.6% to 24.7%. Over the same period, the number of PC users in this region increased an average of 18.7% per year. Despite this growth, the PC penetration rate of Latin America and the Caribbean is low when compared to the PC penetration rates of 95.5% in the United States and Canada and 66.4% in Western Europe in 2009. The low penetration rates of Latin America and the Caribbean provide substantial potential for growth. From 2009 to 2013, the number of PC users in Latin America and the Caribbean is expected to grow an average of 12.0% per year with penetration rates rising from 24.7% to 37.1% over this period.
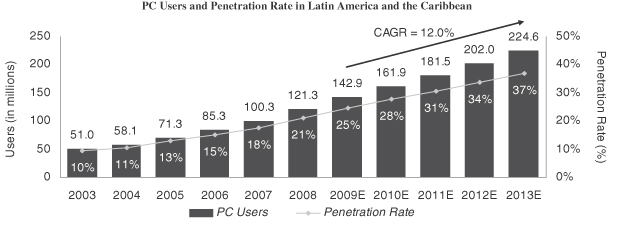
Source: Pyramid Research
Growth in PCs in Latin America and the Caribbean is expected to come from continued growth in the desktop segment of the market as well as in the notebook computer segment. According to Gartner, desk-based PC shipments in Latin America (which, as defined by Gartner, includes the Caribbean) are projected to grow from 16.0 million units in 2009 to 22.6 million units in 2013, representing a growth rate of an average of 9.1% per year. Gartner expects notebook computer shipments to grow from 10.3 million units in 2009 to 24.5 million units in 2013, representing a growth rate of an average of 24.1% per year. By 2013, Gartner estimates that desk-based PCs and notebook computers will comprise 48% and 52% of total PC shipment volume, respectively.
The growth in PC users in Latin America and the Caribbean has been driven primarily by the decreasing cost of computers, the proliferation of unbranded, or “white-box,” PCs, the growing popularity of the Internet and rising per capita incomes. According to Gartner, the average selling price of a PC in Latin America and the Caribbean fell an average of 4.8% per year from 2002 to 2008 and has continued to decrease, expanding the market for PC buyers. Due to the lower per capita income levels in Latin America and the Caribbean as compared to the United States, Canada and Western Europe, many PC buyers in this region opt to purchase a white-box PC. White-box personal computers typically have lower retail selling prices but higher margins than branded computer systems. According to Gartner, in 2008 white-box personal computers comprised about 47.2% of the Latin American and Caribbean personal computer market by shipments. From 2009 to 2013, the unit shipments of PCs priced under $500 in Latin America and the Caribbean are expected to grow at an average annual growth rate of 25.9% per year. From 2005 to 2009, per capita GDP in Latin America and the Caribbean grew at an estimated average of 9.4% per year from $4,991 to $7,156, and, according to Global Insight, is expected to increase an average of 4.3% per year from $7,156 in 2009 to $8,117 in 2012.
67
Table of Contents
Unit Shipments of PCs Priced Under $500 in Latin America and the Caribbean
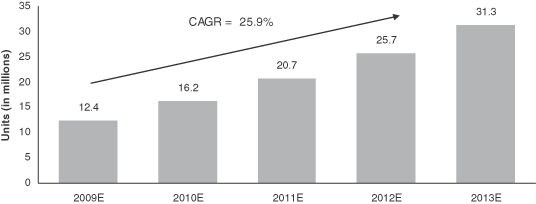
Source: Gartner. Forecast: PCs, Latin America, December 2009.
Rapidly increasing Internet penetration rates
According to Pyramid Research, from 2003 to 2009, the Internet penetration rate in Latin America and the Caribbean grew from 8.7% to 29.1%. Over the same time period, the number of Internet users in this region grew an average of 24.0% per year from 46.4 million users to 168.3 million users. Despite this growth, the Internet penetration rate is low when compared to the Internet penetration rates of 84.0% in the United States and Canada and 63.7% in Western Europe in 2009. The low Internet penetration rate in Latin America and the Caribbean provides the potential for substantial growth, which would have a positive impact on the Latin American and Caribbean IT industry as a whole. From 2009 to 2013, the number of Internet users is expected to grow an average of 16.8% per year in Latin America and the Caribbean, increasing penetration rates from 29.1% to 51.8% over this period.
68
Table of Contents
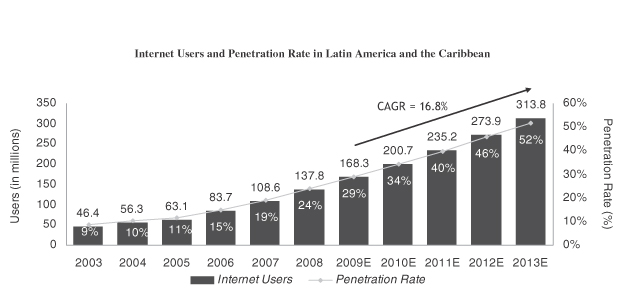
Source: Pyramid Research
Increased access to consumer credit
From 2002 to 2008, the number of financial card transactions in Latin America and the Caribbean grew from 9.5 billion to 32.9 billion, a compounded annual growth rate of 22.9%, according to Euromonitor International. Transactions from store cards play a significant role in the development of the financial cards market. Latin American consumers have limited access to bank accounts and utilize store cards as their primary method to access credit. With increased access to credit, consumers are able to purchase additional goods as stores are implementing initiatives such as installment plans with weekly payments. Growth from financial card transactions is expected to remain strong over the next four years. Euromonitor International forecasts the growth rate will be 10.3% annually from 2009 to 2013 due to improving economic conditions and the emergence of a sustainable working middle class in the region. Over the same period, the number of store card transactions in major Latin America economies such as Chile, Colombia and Argentina is also expected to grow greater than 10% annually. We believe that increased access to consumer credit will be a significant driver of growth in IT spending in Latin America.
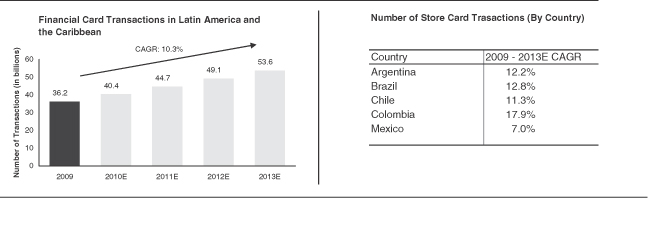
Source: Euromonitor International
Our Strategy
We intend to achieve future growth and profitability through the following strategies:
Continue to strengthen our market leadership and customer relationships through superior customer service. We differentiate ourselves from our competitors through our emphasis on customer care and long-term
69
Table of Contents
customer development. We seek to build customer loyalty not only by having wide product selection and quick delivery times, but also by offering marketing assistance, product training, new product exposure, technical support and local warranty service and by providing trade credit for approved customers. We believe that the extension of payment terms to creditworthy customers is one of our key competitive advantages versus many of our local competitors that do not have the financial resources to do so. We also seek to leverage our leading market positions to attract and maintain new customers in the highly fragmented and rapidly growing markets in which we operate.
Capitalize on our broad distribution platform to drive growth across markets. We expect to grow and strengthen our diverse customer base by leveraging our large selection of products and our comprehensive offering of value-added services, including product training and support, credit and financing, and reverse logistics. We primarily target small and medium size customers in highly fragmented markets where our broad distribution platform and economies of scale are difficult for potential competitors to replicate. We intend to increase our sales by expanding our geographic presence in countries where we already have in-country operations and by establishing new in-country operations in countries where we are not already present. Our focus on in-country operations is driven by our belief that we can achieve higher revenue growth and gross margins from our in-country operations, as compared to distributing solely from our Miami-based wholesale operations. When assessing a new market, we consider the local economic environment, local market conditions of the IT industry, the number of competitors, and the business model and methods of current market participants. We typically identify a talented local partner who has substantial prior experience within the industry as well as an in-depth knowledge of the local market. We believe these opportunities to expand within our current markets and to enter new markets will allow us to gain market share and accelerate our growth.
Focus on maximizing our operating leverage and scale efficiencies. As our revenues increase, we will seek to enhance our margins by maintaining control over our operating expenses and realizing increased economies of scale in product purchasing and working capital management. We constantly strive to reduce operating costs in our business through initiatives designed to streamline our business processes. For instance, we have established an e-commerce ordering platform in the Region and have capabilities in 9 of the 12 countries in which we compete. Our e-commerce platform enables our customers to view, select and place orders for products online, reducing the time and cost needed to take orders over the phone or at our in-country distribution facilities. In addition, in the future we believe that our e-commerce capabilities will lead to additional growth opportunities as we add additional e-commerce functionality such that customers will be able to place orders and purchase items via a link to a vendor’s website and we complete the fulfillment. We continually seek to optimize our accounts receivable, accounts payable and inventory days to manage our working capital needs. We have nearly completed the process of installing a new company-wide enterprise resource planning (“ERP”) system, management and financial consolidation system. The system has been implemented in our Miami Operations and 11 of our 12 In-Country Operations, and we expect to complete the remaining modules in Mexico in early 2010. Our scalable IT ERP system enables simultaneous decentralized decision-making by our employees in sales and purchasing while permitting control of daily operating functions by our senior management. We are also using the ERP system for logistics and inventory management in order to better manage our increasing shipping volumes. We also continue to maintain controls on credit risk by establishing standardized credit policies for our Miami Operations and our In-country Operations. Our credit policies include credit analysis, credit database checks, vendor and bank relationship checks and, where necessary, collateralization. We take actions to maintain controls on inventory obsolescence risk, including maximizing our protection under vendor programs, monitoring our inventory levels, soliciting frequent input from in-country managers about demand projections and controlling the timing of purchases. We address foreign exchange by invoicing a significant percentage of our sales in U.S. dollars. We constantly review our country, customer and vendor concentrations, with the objective of maintaining balance and diversification as a key element of our business risk management strategy. We believe that we are well-positioned to capitalize on the material growth capacity that we have in most of our existing operations without the need for significant increases in fixed costs or capital expenditures.
Leverage our vendor relationships to increase our product portfolio. We have many long standing relationships with industry-leading IT product vendors. We continually build upon our comprehensive in-stock
70
Table of Contents
selection of more than 6,100 products by expanding our offerings in the following product categories or subcategories: enterprise-class networking products (including networking products, servers, storage and software), enterprise IP telephony products (including IP, PBX systems and IP telephones), gaming and “infotainment” products (including video game systems), digital consumer electronics (including digital cameras and plasma displays) and products sold under our proprietary brands (for example, Forza Power Technologies). In addition, we believe that we are well positioned to capture increased share of the growing market for mobility products such as laptops, smart devices, and other products driven by the ongoing convergence of traditional IT products with consumer devices. Such product and category additions coupled with our long standing vendor relationships allow us to quickly introduce new products and categories to our existing customer base and to add new customer segments to our business. We intend to continue to expand our product offering to satisfy the rapidly evolving IT product requirements of our customers.
Expand our growth opportunities. In addition to our current opportunities for achieving continued growth, we also intend to grow our business through extensions of our existing capabilities, including further product diversification and targeting of new markets. We intend to apply our knowledge of local markets and our strong relationships with U.S. and Asian manufacturers to the following:
| • | Expanding our retail presence across geographies. We plan to continue to expand our retailer customer base across the region. Currently, we distribute products to retailers in countries in which we have in-country operations. In Argentina, Chile and Costa Rica we have made significant progress in penetrating retailer accounts. In 2009, sales to retailers in Argentina, Chile and Costa Rica represented 16.6% of the total revenues of each of our Argentinean, Chilean and Costa Rican subsidiaries. We believe the success of our emerging retail strategy in the region can be extended to other countries in which we do not currently have long standing retail relationships. For example, we recently launched an initiative targeting large retailers in Mexico such as Wal-mart, OfficeMax, Office Depot and Sanborns and plan to service this growing market with our current product portfolio. |
| • | Expanding our private label products. We believe our expertise in purchasing and distributing unbranded or “white-box” PC products from Asia can be applied to assembling private label computer products for new and existing customers. White-box PC products are assembled from standard, widely available components and do not bear the brand name of a major computer manufacturer or seller. Some of the private label products we currently assemble include: the TecnoFriend brand for Riberio, Sound & Music for Spectra and Mirray for Hiroka. In total, we distribute private label products for 8 different retailers in 5 countries in Latin America and the Caribbean. We plan to continue to work with Asian manufacturers and retailers to expand our business in this market. |
| • | Expanding our own branded products. We intend to continue to offer and enhance the distribution of IT products under our own brand names: KLIP (enclosures and IT accessories), FORZA (power supplies), Blue Code (PC kits), Hurricane (operating PCs) and NEXXT Solutions (networking products). We believe our current own brand strategy to enhance our own named brands has strong growth potential that we believe will increase our growth and margins. |
| • | Expanding our customer base to small non-traditional retailers. We also believe a market opportunity exists to target numerous small non-traditional retailers in Latin America and the Caribbean that currently purchase IT-related products and consumables. We plan to use our existing distribution network and product portfolio to service these new customers. |
Pursue selective acquisitions. As part of our growth strategy, we intend to selectively pursue the acquisition of companies that either complement or expand our existing business. As a result, we regularly evaluate potential acquisition opportunities, which may be material in size and scope. We intend to target selective acquisitions that we believe will expand our business into new markets or improve our distribution capabilities, while growing revenues and enhancing margins.
71
Table of Contents
Our Operations
Our Regional Presence
We operate a sales and distribution center in the U.S., 22 sales and distribution centers in Latin America and the Caribbean and a sales office in Brazil.
We believe we have the broadest geographical scope of any IT distributor in Latin America and the Caribbean, with sales and distribution centers in 12 countries — Argentina, Chile, Colombia, Costa Rica, Ecuador, El Salvador, Guatemala, Jamaica, Mexico, Panama, Peru, and Uruguay.
Revenue derived from sales to customers located in Latin America and the Caribbean accounted for almost all of our consolidated revenue for the years ended December 31, 2009 and 2008. The following chart shows our revenue for the year ended December 31, 2009 by the customers’ country of origin.
2009 Percentage of Revenue by Customers’ Country of Origin
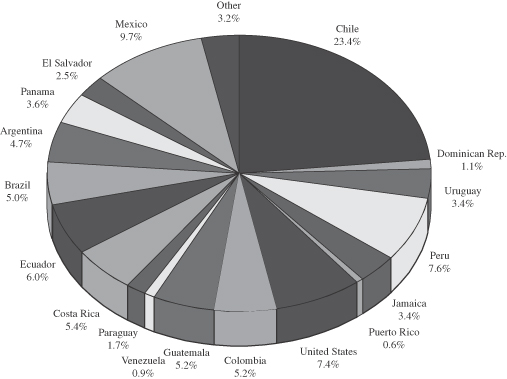
Our Miami Operations
Our Miami Operations serve as the headquarters for our entire company. Our Miami Operations handle purchases from our vendors, and a majority of the products that we acquire from vendors pass through our Miami warehouse (with the exception of products sourced from Asia, which are usually shipped directly to our In-country Operations). Our Miami Operations supply our 22 in-country sales and distribution centers and our sales office in Brazil and also sells products directly to third parties. Miami’s third-party customers include U.S., Latin American and Caribbean distributors, resellers and retailers, which in turn distribute or sell products throughout Latin America and the Caribbean.
72
Table of Contents
Our Miami purchasing department handles most of our vendor relationships and contracts. Our Miami Operations monitor our entire inventory pipeline on an ongoing basis and use information regarding the levels of inventory, in conjunction with input from the in-country managers regarding our customer demand patterns, to place orders with vendors. The centralization of our purchasing function allows the In-country Operations to focus their attention on more country-specific issues such as sales, local marketing, credit control and collection. The centralization of purchasing also allows our Miami Operations to maintain the records with regard to all vendor back-end rebates, promotions and incentives to ensure they are collected and to adjust pricing of products according to such incentives.
Our Miami distribution center ships products to each of our in-country sales and distribution operations twice a week by air and once a week by sea. These frequent shipments facilitate more efficient inventory management and increased inventory turnover. We do not have long-term contracts with logistics providers, except in Mexico and Chile. Where we do not have long-term contracts, we seek to obtain the best rates and fastest delivery times on a shipment-by-shipment basis. Our Miami Operations also coordinate direct shipments to third-party customers and In-country Operations from vendors in Asia.
We have sales and marketing staff at our Miami headquarters. See “— Customers, Sales and Marketing.” Other functions performed in our Miami headquarters include treasury and accounting, strategic planning, consolidated information systems development and maintenance and overall marketing strategy.
As of December 31, 2009, 2008 and 2007, our Miami Operations’ total assets were $126.4 million, $119.1 million and $185.6 million, respectively.
Our In-Country Operations
Each of our in-country sales and distribution operations has a focused sales force and, with the exception of our Brazil operations (which consist solely of a sales office), a substantial inventory. Our In-country Operations sell to more than 48,000 customers in the 12 countries.
Each of our In-country Operations is critical to meeting the needs of local resellers and retailers which are often small, locally owned companies that lack the size and the knowledge to buy directly from the U.S. or Asia and to handle customs processing, including taxes and duties. By selling directly to resellers and retailers from locally-based facilities, our In-country Operations provides a competitive advantage over other multinational companies that export products into those markets. We believe that we offer our customers some of the shortest product delivery times in the industry by leveraging our capabilities as a Miami-based aggregator and as an in-country distributor. Our local presence also allows us to obtain timely and accurate information with respect to each market’s growth potential and the needs of the customers in each market.
Each of our In-country Operations is responsible for the following functions: sales, human resources, local marketing, extension of credit (in compliance with our corporate credit policies), collections, inventory controls, local accounting and financial controls, shipping to customers when needed and providing local input and data from their IT systems to Miami for purchasing decisions.
As of December 31, 2009, 2008 and 2007, our In-country Operations total assets were $181.7 million, $165.0 million and $177.4 million, respectively.
Products
We offer single source purchasing to our reseller and retailer customers so they can purchase all of their IT product needs from us, including computer products, components and peripherals. We believe that our wide selection of products is a key attraction for resellers and retailers to purchase products from us. The single source
73
Table of Contents
purchasing concept is especially important for assemblers of unbranded or “white-box” PCs, who must source all the necessary components before the assembly process begins. White-box PCs typically have lower retail selling prices but higher margins than branded computer systems. According to Gartner, Inc. (“Gartner”), a provider of research and analysis on the global IT industry, in 2008 white-box personal computers comprised about 47.2% of the Latin American and Caribbean personal computer market, by shipments. We do not focus on selling branded desktop PCs other than our own Hurricane operating PCs, Blue Code PC kits and PCs we assemble under our customers’ brands.
Our in-country product lines typically include between 1,500 and 2,500 products in stock. Our catalog of products offers a broad selection that demonstrates our focus on responding to market demands, reflecting increasing demand for portable computing devices such as notebook computers and notebooks, bare-bones notebook computers designed specifically for web browsing, multimedia access and gaming, and mobile and ultra portable products. The breadth and diversity of our product lines allows us a key competitive advantage by enhancing our leadership position in the IT distribution industry and mitigating the risks inherent in our strong, competitive market. Based on our estimates, we believe that many of our local competitors have product lines of no more than 200 to 300 products in stock. The following table presents the percentage of our consolidated revenue represented by our product categories in each of the last three years:
| Year ended December 31, | |||||||||
| Category |
2009 | 2008 | 2007 | ||||||
| Components |
36.9 | % | 40.3 | % | 46.5 | % | |||
| Peripherals |
15.8 | % | 16.7 | % | 16.8 | % | |||
| Software |
6.4 | % | 6.6 | % | 6.8 | % | |||
| Computer systems |
28.0 | % | 24.2 | % | 17.4 | % | |||
| Accessories |
8.4 | % | 6.2 | % | 6.9 | % | |||
| Networking |
2.6 | % | 2.7 | % | 2.5 | % | |||
| Other products |
1.9 | % | 3.3 | % | 3.1 | % | |||
| Total |
100.0 | % | 100.0 | % | 100.0 | % | |||
Our product categories are:
| • | Components. This category consists of the components that are the basic building blocks of a PC and includes motherboards, processors, memory chips, internal hard drives, internal optical drives, cases and monitors. |
| • | Peripherals. This category consists of devices that are used in conjunction with computer systems and includes printers, power protection/backup devices, mice, scanners, external disk drives, multimedia peripherals, modems, projectors and digital cameras. |
| • | Software. This category includes operating system, security and anti-virus software. |
| • | Computer systems. This category consists of self-standing computer systems capable of functioning independently. In most of our operations, we assemble and sell PC and notebook computers under our own brands, under our customers’ brands and in unbranded cases. |
| • | Accessories. This category includes computer cables, connectors, computer and networking tools, media, media storage, keyboard and mouse accessories, speakers, computer furniture and networking accessories. |
| • | Networking. This category consists of hardware that enables two or more personal computers to communicate, and includes modems, routers, switches, hubs and wireless local area network access points, local area network (“LAN”) interface cards and wireless LAN interface cards. |
| • | Other products. This category includes digital consumer electronics and special order products. |
74
Table of Contents
Our primary focus is on components, peripherals and accessories categories, as these tend to have higher margins than the other product categories. We believe that a focus on components, peripherals and accessories, together with the vendor protection policies described below under “— Vendors,” help us reduce the risks of inventory obsolescence. We believe that our inventory obsolescence rates, at (0.1)%, 0.17% and 0.12% of revenue for the years ended December 31, 2009, 2008 and 2007, respectively, are very low by industry standards. One of our strategies is to maintain this core mix of product categories, and in particular to maintain high levels of sales in the components category, as more people in Latin America and the Caribbean become computer users.
Sales in our computer systems product category increased to 28.0% of our consolidated revenue as of December 31, 2009 from 24.2% of our consolidated revenue as of December 31, 2008. We believe this reflects increasing customer demand for portable computing devices such as notebook computers and netbooks, barebones notebook computers designed specifically for web browsing, multimedia access and gaming devices. Notebook computers and netbooks serve as a portable solution for accessing the web’s multimedia alternatives. Due to the increase in market demand for mobile and ultraportable products represented by our computer systems category, the percentage of products in our components product category declined from prior year levels.
Among our growth strategies is the expansion of our offerings in the following product categories or subcategories: enterprise-class networking products (including networking products, servers, storage and software), enterprise IP telephony products (including IP, PBX systems and IP telephones), gaming and “infotainment” products (including video game systems), digital consumer electronics (including digital cameras and plasma displays) and products sold under our proprietary brands (for example, Hurricane). We plan to expand into these product categories or subcategories gradually as demand for these products grows among our customers and end user markets, our existing vendors begin to offer these products and as we initiate relationships with new vendors offering these products.
Vendors
We have established long-term direct relationships with many of the major global manufacturers of branded computer products, including Apple, Dell, Epson, Hewlett Packard, Intel, Kingston, Microsoft, Samsung, Seagate, Toshiba and Western Digital, as well as a number of generic component vendors from the U.S. and Asia. For the years ended December 31, 2009, 2008 and 2007, our top 10 vendors manufactured products that accounted for 66.1%, 65.5% and 64.6%, respectively, of our total revenue and the products of our top vendor accounted for 19.1%, 17.5% and 16.7%, respectively, of our total revenue. We continue to believe in the strategic importance of diversifying our revenues among multiple vendors.
We have entered into written distribution agreements with many of our vendors, which typically provide for nonexclusive distribution rights for specific territories. We believe that it is not common in our industry for vendors to have exclusive relationships with distributors, and, because the market for IT products is subject to rapid change and reliant upon product innovation, we believe that our customers are better served by our ability to carry competing brands. The agreements are generally short term and subject to periodic renewal. Our vendors typically extend us payment terms of between 30 and 60 days. Vendors of branded products often offer us back-end rebates, promotions and incentives.
Like other IT distributors, we are subject to the risk that the value of our inventory will be affected adversely by vendors’ price reductions or by technological changes affecting the usefulness or desirability of the products comprising our inventory. It is the policy of many vendors of IT products to offer distributors like us, who purchase directly from them, some protection from the loss in value of inventory due to technological change or a vendor’s price reductions. Under many of these agreements, there is only a limited, specified period of time in which the distributor may return products for credit or exchange products for other products or during which price protection credits may be claimed. To maximize our protection under vendor programs and reduce our inventory risk, we take various actions, including monitoring our inventory levels, soliciting frequent input from in-country managers about demand projections and controlling the timing of purchases.
75
Table of Contents
Although we do not offer our own rebates or price protection to our customers, we provide some of the benefits of vendor-sponsored rebates. When we sell a product, we issue our customer a warranty for the product with the same terms as the vendor’s warranty to us. We track the unique serial numbers of all products passing through all of our distribution facilities. By tracking unique serial numbers, we are able to determine whether specific products presented by our customers or our In-country Operations for service or repair under warranty do in fact benefit from warranties from us. This system allows us to limit the quantity of unauthorized returns of merchandise and to provide fast and high quality return-to-manufacturer authorization service across Latin America and the Caribbean. Our expenses incurred in administering the warranties issued to our customers were $1.7 million, $1.3 million, and $1.5 million for the years ended December 31, 2009, 2008 and 2007, respectively.
Customers, Sales and Marketing
Customers
We currently sell to over 50,000 distributors, resellers and retailers in 40 countries. Although the end users of our products are mostly individuals and small and medium-sized businesses, we supply these end users through a well-established network of in-country distributors, value-added resellers, system builders and retailers, as well as through U.S.-based distributors selling into the Region. We have always emphasized customer care and long-term customer development. We seek to build customer loyalty not only by having wide product selection and quick delivery times, but also by offering customs and duties payment management, marketing assistance, product training, new product exposure, technical support and local warranty service and by providing trade credit (when the customer is approved under our credit policies). We believe that the extension of payment terms to creditworthy customers is one of our key competitive advantages. Many of our local competitors do not have the financial resources to do so and, as a result, offer products only on a cash-and-carry basis.
For the years ended December 31, 2009, 2008 and 2007, no single customer accounted for more than 2.0% of our consolidated revenue and the top 10 customers by sales volume accounted for less than 10.4%, 9.0% and 9.5%, respectively, of our consolidated revenue. Our strategy is to not rely on any single customer for a large percentage of sales, but to diversify our revenues and maximize sales from a large quantity of individual customers.
Sales
As of December 31, 2009, we maintained a sales force of 342 people in our In-country Operations and 29 employees in our Miami Operations dedicated to serving our third-party customers. Each in-country sales force is managed by a general manager and, in some cases, a sales manager, depending on the size of the operation. The general managers and sales managers are responsible for developing and maintaining relationships with new and existing customers. Our Chief Executive Officer also spends a considerable amount of time visiting customers and our In-country Operations to develop new customer accounts and solidify and improve existing relationships.
We use an incentive-based compensation structure for our sales force that varies from country to country. Generally, the compensation consists of a base salary and variable commission or bonus, based on pre-established sales and performance metrics. The commission is generally calculated as a percentage of collected gross profits and net customer additions.
Marketing
As of December 31, 2009, our marketing department consisted of five employees in Miami and 39 employees throughout Latin America and the Caribbean. The marketing department’s responsibilities include oversight of our corporate identity, preparation of marketing materials, creation and coordination of various types of media activity and development of marketing research studies and specialized reseller-focused events. In
76
Table of Contents
addition, the marketing department works with vendors to establish periodic marketing and sales programs to generate vendor brand awareness and product demand. In this regard, our marketing department acts as a liaison between our company and our vendors.
The marketing department uses marketing and business development funds available from vendors of branded IT products for various activities, including the preparation of our annual product catalog and monthly pricing books, customer training, specialized events and trade shows. Our Miami Operations administer a majority of the marketing funds and distribute them as needed to our In-country Operations.
Some of our more notable marketing events include quarterly IT educational and training seminars offered by vendors for our sales executives and channel customers in Latin America and the Caribbean in order to introduce new products and programs, present product roadmaps, launches and promotions and provide strategies aimed at enhancing selling skills.
Promotional Floordays are conducted weekly throughout the Region, in which vendors interact with and showcase products and solutions to reseller customers and sales executives and provide individualized training and test drives of the products. Our regional Intcomex Product Catalog is published semi-annually and includes over 1,500 products in 45 categories.
IntcomExpo is our annual private, regional trade show in which 15 to 30 vendors present their products. These expos are held throughout the year in several of our In-country locations.
I-Blasts and interactive email signatures are used to promote our vendor’s brand directly to our customers. When our sales executives send an email, our vendor’s banner appears under the electronic signature and our customers can access the vendor’s promotions and Intcomex’s Webstore directly by clicking on the banner.
Intcomex Marketing on Hold is a unique method of advertising that allows our vendors to promote their products to our customers on a daily basis. We play an advertisement of the vendor’s products, brand and latest releases on large screen televisions in the Region that customers can view as they await or obtain quotations. Internal communications also showcase vendors’ products on large screen televisions in the Region in the form of slideshows and short movies that run continuously between promotions. The television advertisements are a convenient format for introducing new products and programs to our customers.
Reseller training labs are seminar events designed to introduce new products, provide product and technology information and selling techniques to resellers.
Intcomex WebStore is our e-commerce store located at http://store.intcomex.com which offers our products to our resellers and customers to search products by category, subcategory, name or stock-keeping unit (or SKU), compare product specifications, review product quotations and prices and purchase products.
Credit Risk Management
We extend payment terms, generally up to 30 days, to creditworthy customers of our Miami Operations and of most of our In-country Operations, although some higher-volume customers, such as large retailers, receive longer payment terms. In other countries (most notably Mexico, where sales are primarily on a cash-and-carry basis), we establish our credit policies on a country-by-country basis depending mostly on local macroeconomic conditions, the nature of our customers and local market practices.
We have established standardized credit policies for our Miami Operations and our In-country Operations. Our credit policies include credit analysis, credit database checks, vendor and bank relationship checks and, where necessary, collateralization. In addition, substantially all of our Miami Operations’ foreign accounts receivable (other than accounts receivable owed by affiliates) are insured by Euler Hermes American Credit
77
Table of Contents
Indemnity Company (“Euler Hermes ACI”), a worldwide credit insurance company. The policy’s aggregate limit is $20.0 million with an aggregate deductible of $1.5 million; the policy expires on August 31, 2010. Under this insurance, 10% or 20% buyer coinsurance provisions and sub-limits in coverage on a per-buyer and on a per-country basis apply. The policy also covers certain large, local companies that purchase directly from our In-country Operations in Argentina, Costa Rica, El Salvador, Guatemala, Jamaica and Peru. Our In-country operations in Chile insures certain customer accounts with Coface Chile, S.A. credit insurance company; the policy expires on October 31, 2010.
We believe that our relatively low bad-debt expenses of 0.5%, 0.4% and 0.2% of net revenues for the years ended December 31, 2009, 2008 and 2007, respectively, are a result of our standardized credit policies, our close and proactive monitoring of accounts receivables and collections by our Miami and In-country Operations and the diversification of our receivables over a large number of countries and customers. We have become more cautious in extending credit to our customers due to the worsening financial and economic crisis. Most of our credit losses are with respect to customers of our Miami Operations, where we serve larger customers who in some cases are afforded credit lines in excess of $100,000. In our In-country Operations, where credit lines typically do not exceed $10,000, credit losses have been nominal.
Information Systems
In 2009, we continued the process of installing Sentai, our company-wide ERP, management and financial consolidation system. Sentai is a scalable IT ERP system that enables simultaneous decentralized decision-making by our employees included in sales and purchasing while permitting control of daily operating functions by our senior management. We are also using the Sentai logistics and inventory management system in order to better manage our increasing shipping volumes. The ERP system has been implemented in our Miami Operations and in 11 of our 12 In-country Operations. We completed the implementation of our core ERP system in Chile and some portions of Mexico in 2009 and expect to complete implementation of the remaining areas of Mexico in early 2010.
In 2008, we implemented SAP Business Planning and Consolidation (“SAP BPC”), our company-wide enterprise performance management planning, budgeting and forecasting system. SAP BPC is a comprehensive financial management system that enables complete budgeting, forecasting, consolidation and reporting functionality through a single application and user interface.
In 2008, we also started the process of implementing our e-commerce sales platform which will help maximize online revenues and reduce costs and risks associated with running our e-commerce operation. The e-commerce infrastructure includes site development and hosting, order management and merchandising, reporting and analytics, product fulfillment and multilingual customer service. Our e-commerce platform is a centralized system and critical solution to serving our Miami and in-country customers through rich functionality to deliver large volume transactions in an integrated environment. We expect to complete implementation in 2010.
Competition
The IT products distribution industry in Latin America and the Caribbean is highly competitive. The factors on which we compete include:
| • | price; |
| • | availability and quality of products and services; |
| • | terms and conditions of sale; |
| • | availability of credit and credit terms; |
| • | timeliness of delivery; |
78
Table of Contents
| • | flexibility in tailoring specific solutions to customers’ needs; |
| • | effectiveness of marketing and sales programs; |
| • | availability of technical and product information; and |
| • | availability and effectiveness of warranty programs. |
The IT products distribution industry in Latin America and the Caribbean is very fragmented and contains several public multinational companies, such as Ingram Micro (in-country operations in Brazil, Chile, Mexico, Peru and Argentina), Tech Data (in-country operations in Brazil, Chile, Uruguay and Peru), Bell Microproducts (in-country operations in Argentina, Brazil, Chile and Mexico) and SYNNEX (in-country operations in Mexico), (we refer to these companies in this prospectus as our public company competitors), and a large number of local companies that operate in a single country, such as Grupo Deltron S.A. in Peru, Airoldi Computación in Argentina and Makro Computo in Colombia. We believe we have the broadest in-country presence in Latin America and the Caribbean in terms of the number of countries served through an in-country presence.
Our principal public company competitors are Ingram Micro and Tech Data, each of which operates local distribution centers in the limited number of markets listed above. In contrast, we are able to offer our vendors an in-country distribution channel to many Latin American and Caribbean markets. Additionally, while our product offering is more focused on components for white-box personal computers, Ingram Micro and Tech Data are focused on high-end branded equipment, including servers. While these competitors are larger and better capitalized than we are, and, in the case of the Mexican market, have a significantly larger market share than we do, we believe that our multi-country, components-focused business model is better suited to Latin America and the Caribbean.
Our relatively large size provides us with certain advantages over smaller local distributors, who sometimes have a lower cost structure than we do, in part because we believe they may operate in the grey market or “informal” economy. We believe our advantages generally include more developed vendor relationships, broader product offerings, greater product availability and more extensive customer service (including credit and technical support).
Our participation at two levels of the distribution chain (Miami and in-country), coupled with our extensive geographic footprint, creates a market presence that we believe is unmatched by any of our competitors in terms of the number of countries served through an in-country presence and enables us to generate industry-leading margins among our public company competitors. Our dual distribution approach links a diversified set of vendors, primarily located in the United States and Asia, to a fragmented number of customers spread throughout Latin America and the Caribbean, and delivers value to both ends of the supply chain. To our vendors, we provide access to markets and customers that would be costly and inefficient for them to reach directly. To our customers, which are often small local resellers and retailers that lack the scale and access to buy directly from the United States and Asia, we provide broad and timely product availability, local staff, multi-vendor single source purchasing, technical support, customs management and local warranty service.
Trademarks and Domain Names
We have registered a number of trademarks and domain names for use in our business. We have registered trademarks such as “Intcomex,” “Blue Code,” “CENTEL,” “FORZA,” “Hurricane,” “KLIP,” “KLIP XTREME” and “NEXXT Solutions” in the United States and/or in various Latin American and Caribbean jurisdictions. We also have registered domain names, including intcomex.com, nexxtsolutions.com, intcomex.cl, intcomex.ec and intcomex.com.pe. We believe that our trademarks help us build name recognition in the region in which we operate.
79
Table of Contents
Personnel
As of December 31, 2009, we employed 1,413 people. Of these, 178 were in Miami, with the rest located in our In-country Operations. We do not have any collective bargaining agreements with our employees, nor are they unionized, except for our employees in Mexico and certain employees in Argentina. We believe that our relations with our employees are generally good.
We have a contract with ADP Total Source, Inc. or ADP, to provide certain professional employment services such as health insurance, other benefits and payroll services in respect of all Miami personnel. Pursuant to this contract, our Miami personnel, with certain exceptions, became employees of ADP. We lease the services of these employees from ADP, and reimburse ADP for the costs of compensation and benefits. For purposes of this prospectus, we consider employees of ADP covered by this contract to be employees of Intcomex.
Properties and Facilities
Our corporate headquarters are located in a 221,021 square foot facility in Miami, Florida. We support our operations throughout Latin America and the Caribbean from our Miami facility, which is an extensive sales and administrative office and distribution network integrating executive-level management, warehousing, RMA, purchasing, sales, marketing, human resources, credit, finance, technical support and customer service functions. Our Miami facility is located near the Port of Miami and Miami International Airport which facilitates access to the area’s air and container-cargo networks. The lease commencement date of our Miami facility was May 1, 2007.
80
Table of Contents
As of December 31, 2009, we operated a sales and distribution center in the U.S., 22 sales and distribution centers in 12 countries in Latin America and the Caribbean and a sales office in Brazil. The foreign distribution centers include our In-Country Operations office and warehouses. Some of the distribution centers include assembly lines for white-box PCs that we or our value-added reseller and retailer customers assemble locally. In total, our sales and distribution centers in our Miami Operations and our In-country Operations represent nearly 750,000 square feet of space (including 190,000 square feet of office space and 560,000 square feet of warehouse space). As of December 31, 2009, we leased substantially all of our facilities on varying terms with the exception of a portion of our sales and distribution center in Santiago, Chile and warehouse space in Lima, Peru. Further, we have an option to purchase a warehouse and office space in Mexico City, Mexico for $3.0 million, which expires on December 31, 2011. We do not anticipate any material difficulties with the renewal of any of our leases when they expire or in securing replacement facilities on commercially reasonable terms. The following table sets forth information regarding our facilities including location, use, size and ownership or lease status:
| Location |
Use |
Approximate Gross Square Feet |
Owned or Leased | |||
| Buenos Aires, Argentina |
Office /Warehouse | 27,243 | Leased | |||
| Santiago, Chile |
Office /Warehouse | 50,450 | Owned-63%; Leased-37% | |||
| Iquique, Chile |
Office /Warehouse | 7,750 | Leased | |||
| Bogotá, Colombia |
Office /Warehouse | 10,830 | Leased | |||
| Cota, Colombia |
Office /Warehouse | 23,100 | Leased | |||
| San José, Costa Rica |
Office /Warehouse | 43,056 | Leased | |||
| Quito, Ecuador |
Office /Warehouse | 28,567 | Leased | |||
| Guayaquil, Ecuador |
Office /Warehouse | 8,191 | Leased | |||
| San Salvador, El Salvador |
Office /Warehouse | 10,915 | Leased | |||
| Guatemala City, Guatemala |
Office /Warehouse | 30,774 | Leased | |||
| Kingston, Jamaica |
Office /Warehouse | 16,968 | Leased | |||
| Centro de Capacitación, Mexico |
Office /Warehouse | 1,615 | Leased | |||
| León, Mexico |
Office /Warehouse | 4,650 | Leased | |||
| Mexico City, Mexico |
Office /Warehouse | 34,757 | Leased | |||
| Monterrey, Mexico |
Office /Warehouse | 3,918 | Leased | |||
| Plaza, Mexico |
Office /Warehouse | 1,615 | Leased | |||
| Puebla, Mexico |
Office /Warehouse | 6,458 | Leased | |||
| Querétaro, Mexico |
Office /Warehouse | 3,875 | Leased | |||
| Tlalnepantla, Mexico |
Office /Warehouse | 101,009 | Leased | |||
| Veracruz, Mexico |
Office /Warehouse | 2,939 | Leased | |||
| Panama City, Panama |
Office /Warehouse | 40,505 | Leased | |||
| Lima, Peru |
Office /Warehouse | 41,893 | Owned-87%; Leased-13% | |||
| Montevideo, Uruguay |
Office /Warehouse | 25,058 | Leased | |||
| Miami, United States |
Office /Warehouse | 221,021 | Leased |
Legal Proceedings
As of December 31, 2009, the Company had no material legal proceedings pending. From time to time, we are the subject of legal proceedings arising in the ordinary course of business. We do not believe that any proceedings currently pending or threatened will have a material adverse affect on our business or results of operations.
81
Table of Contents
Directors and Executive Officers
The following table sets forth certain information regarding our directors and executive officers as of February 19, 2010.
| Name |
Age | Position | ||
| Anthony Shalom |
59 | Chairman, Director | ||
| Michael Shalom |
39 | Chief Executive Officer and President, Director | ||
| Enrique Bascur |
51 | Director | ||
| Adolfo Henriques |
56 | Director | ||
| Thomas A. Madden |
56 | Director | ||
| Juan Pablo Pallordet |
36 | Director | ||
| Andres Small |
29 | Director | ||
| Russell A. Olson |
51 | Chief Financial Officer, Treasurer and Secretary |
Our directors have qualifications, skills and experience that are consistent with our policy for selection of directors. All of our directors hold, or have held, senior executive positions or directorships in a variety of large organizations, many of which have significant international operations. In these positions, our directors have demonstrated their leadership, intellectual and analytical skills and gained deep experience necessary to provide effective advice and oversight to our Company. Our directors have the experience in the context of the needs and composition of our Board of Directors as a whole and in the best interest of our Company; the directors have the ability and willingness to devote the required time to serve on our Board of Directors.
The biographical information for our directors sets forth specific experience relevant to the director’s role in our Company.
Anthony Shalom was a founder of our Company in 1988 and has been our Chairman since 2004. Mr. Shalom was the Chief Executive Officer from 2004 until his resignation as Chief Executive Officer on February 15, 2010. Although relinquishing his official duties as Chief Executive Officer, Mr. Shalom will remain fully engaged on daily operational activities in his capacity as Chairman. Prior to the investment by CVC International in our Company, Mr. Shalom was President of Intcomex Holdings, LLC (effectively our predecessor company), serving as Chief Executive Officer and President and director.
Michael Shalom has been Chief Executive Officer of our Company since February 15, 2010. Mr. Shalom was a founder of our Company in 1988 and has been President and a director of our Company since 2004. Mr. Shalom was President of Intcomex Holdings, LLC, serving in that capacity from 2002 to present. Mr. Shalom served as Chief Executive Officer of IFX Corporation, a Latin American telecommunications service provider, from 1999 to 2004 and as Chairman of IFX Corporation from 1999 to present. Mr. Shalom is the son of Anthony Shalom.
Enrique Bascur has been a director of our Company since 2005. Mr. Bascur is currently a Managing Director at CVC International, where he has worked since 1999 specializing in investments in Latin America. Prior to 1999, Mr. Bascur managed the local equity investment unit as the Corporate Finance Head at Citigroup’s office in Santiago, Chile. Mr. Bascur serves on the boards of Sociedad Minera Sal de America S.A., a Chilean company; Dream S.A., a Chilean company in the entertainment and lodging business; Sundance Investment LLC and Block 67 LLC, a subsidiary of Sundance Investment LLC, an oil and gas company in Peru; Avantel S.A., a wireless telecommunications company in Colombia, and Citigroup International Finance Corporation, a wholly-owned subsidiary of Citigroup, Inc. Mr. Bascur holds a degree in Civil Engineering from Universidad Católica de
82
Table of Contents
Chile and an M.B.A. degree from the Wharton School of the University of Pennsylvania. Mr. Bascur has extensive management and corporate governance expertise gained through years of executive leadership positions with businesses throughout Latin America. Mr. Bascur has an educational background in financial and business management and holds an advanced degree from a highly acclaimed university. Mr. Bascur’s breadth of experience in various industries and countries allows him to provide valuable insights into the markets where we operate and different types of customers that we service. Mr. Bascur is an independent director within the meaning of the applicable laws, regulations and the listing standards of the Nasdaq Global Market (“Nasdaq”).
Adolfo Henriques was elected a director of our Company in February 2008. From 2005 to 2007, Mr. Henriques was Chairman, President and Chief Executive Officer of Florida East Coast Industries, a commercial real estate firm and regional freight railroad company, prior to its acquisition in 2007. Prior to 2005, Mr. Henriques held several senior positions in the banking industry, most recently serving as Chief Executive Officer of the South Region for Regions Bank from 1998 to 2005. Mr. Henriques is currently a member of the board of directors of Boston Private Financial Holdings, Inc. Mr. Henriques holds a B.A. in Business from St. Leo College and a Master’s Degree in Accounting from Florida International University. Mr. Henriques’ significant experience as an executive and manager of business throughout the South Florida region allows him to offer strategic insight into our operations in Florida. Mr. Henriques’ educational background in accounting and business management as well as his years of business experience, provide him with the expertise necessary to effectively serve on our Audit Committee and our Board of Directors . Mr. Henriques satisfies the independence requirements of Nasdaq and qualifies as an outside director within the meaning of Section 162(m) of the Internal Revenue Code of 1986, as amended, (“Section 162(m)” of the “Internal Revenue Code”) and non-employee directors within the meaning of Rule 16b-3 of the rules promulgated under the Securities Exchange Act of 1934, as amended, (the “Exchange Act”). Mr. Henqiques satisfies the audit committee members independence requirements of Nasdaq, the Exchange Act and the Securities and Exchange Commission (“SEC”) rules and regulations. Mr. Henriques is an independent director within the meaning of the applicable laws, regulations and the listing standards of Nasdaq.
Thomas A. Madden has been a director of our Company since December 2006. From 2001 until his retirement in 2005, Mr. Madden served as the Executive Vice President and Chief Financial Officer of Ingram Micro. From 1997 to 2001, Mr. Madden was the Senior Vice President and Chief Financial Officer of Arvinmeritor, Inc. Mr. Madden currently serves on the boards of Mindspeed Technologies, Inc., a company designing, developing and selling semiconductor networking solutions for communications applications; Champion Enterprises, Inc., a company building manufactured and modular homes; Freight Car America, Inc., manufacturer of railroad freight cars; and the City of Hope Cancer Institute. Mr. Madden holds a B.S. degree in Accounting from Indiana University of Pennsylvania and an M.B.A. degree from the University of Pittsburgh. Mr. Madden’s extensive professional experience, in particular his management and corporate governance expertise, make him qualified to serve on our Board of Directors. In addition, Mr. Madden has extensive experience in performing policy development and enforcement functions in executive positions in industry-related businesses, including having recently served as Chief Financial Officer of Ingram Micro, a member of our peer industry group. Mr. Madden has an educational background in accounting and holds an advanced degree in business management. Mr. Madden satisfies the independence requirements of Nasdaq and qualifies as an outside director within the meaning of Section 162(m) of the Internal Revenue Code and non-employee directors within the meaning of Rule 16b-3 of the rules promulgated under the Exchange Act. Mr. Madden is an independent director within the meaning of the applicable laws, regulations and the listing standards of the Nasdaq independence standards for our nominating and corporate governance committee. Mr. Madden satisfies the audit committee members independence requirements of the Nasdaq, the Exchange Act, and the SEC rules and regulations. Our Board of Directors has determined that Mr. Madden qualifies as an “audit committee financial expert” under the SEC rules and regulations.
Juan Pablo Pallordet has been a director of our Company since 2004. Mr. Pallordet is currently a Director of CVC International, where he has worked since 1999, specializing in private equity investments and divestments related to oil and gas, food and beverage, technology and media assets. Mr. Pallordet is currently a
83
Table of Contents
board member of Sundance Investment, LLC, an oil and gas company in Peru, and Avantel; S.A., a wireless telecommunications company in Colombia. Mr. Pallordet holds an advanced degree in Industrial Engineering from the Universidad de Buenos Aires. Mr. Pallordet has extensive professional experience, both in Latin America and in a related industry, and management and corporate governance expertise. Mr. Pallordet has an educational background in engineering, which contributes to the diversity of skills and education composition of our Board of Directors. Mr. Pallordet satisfies the independence requirements of the Nasdaq and qualifies as an outside director within the meaning of Section 162(m) of the Internal Revenue Code and non-employee directors within the meaning of Rule 16b-3 of the rules promulgated under the Exchange Act. Mr. Pallordet satisfies the Nasdaq independence standards for our nominating and corporate governance committee. Mr. Pallordet is an independent director within the meaning of the applicable laws, regulations and the listing standards of Nasdaq.
Andres Small has been a director of our Company since July 2007. Mr. Small is currently a private equity transactor focusing on emerging markets at CVC International, where he has worked since January 2005. Prior to joining CVC International, Mr. Small was as an investment banking analyst in J.P. Morgan Chase’s Latin American Mergers & Acquisitions Advisory Group, completing several transactions in the consumer, construction, financial, paper & packaging and telecommunications industries. Mr. Small is currently a board member of Permolex International, L.P., a company producing bio-fuel products, and Sindicatum Carbon Capital Holdings Limited, a London-based company developing green house gas abatement projects. Mr. Small holds a B.A. degree in Economics and International Relations with honors from Stanford University. Mr. Small has extensive professional experience, management and business advisory positions in businesses throughout Latin America and in sectors that comprise many of our customers. Mr. Small has an educational background in economics and international relations, which contributes to the diversity of skills and education composition of our Board of Directors. Mr. Small is an independent director within the meaning of the applicable laws, regulations and the listing standards of Nasdaq.
Russell A. Olson has been Chief Financial Officer and Treasurer of our Company since March 2005. Mr. Olson also serves as Secretary. Prior to joining our Company, Mr. Olson served as Chief Financial Officer of ATX Technologies, Inc. in Irving, Texas in 2004. From 1985 to 2004, Mr. Olson served in a variety of capacities for Verizon Communications Inc. including business analysis, strategic planning and budgets, treasury, internal audit and financial planning. From 2002 to 2004, Mr. Olson served as Executive Vice President of Finance and Chief Financial Officer for Grupo Iusacell, S.A. de C.V., a Mexican wireless subsidiary of Verizon. Mr. Olson holds a Master’s Degree in Finance from Fairfield University and a B.S. in Business Administration from the University of Arizona.
Code of Business Conduct and Ethics
We maintain a Code of Business Conduct and Ethics applicable to all directors, officers and employees, including executive officers. The Code of Business Conduct and Ethics is available without charge through the “Investor Relations, Governance Library” section of our website www.intcomex.com , by writing to the attention of: Investor Relations, c/o Intcomex, Inc., 3505 NW 107th Avenue, Miami, Florida 33178, or by emailing to ir@intcomex.com . Any waivers of the provisions of this Code of Ethics and Business Conduct for directors or executive officers may be granted only in exceptional circumstances by our Board of Directors, or an authorized committee thereof, and will be promptly disclosed to our shareholders.
Board of Directors
Board Size, Composition and Independence
Our amended and restated certificate of incorporation and by-laws provide that the size of our Board of Directors will be determined by a resolution of a majority of the Board of Directors. Directors are elected for a one-year term or until their successors are duly elected and qualified. Executive officers serve at the discretion of
84
Table of Contents
the Board of Directors. Our Board of Directors consists of seven members as of February 19, 2010. In January 2009, Carol Miltner, our former board member, resigned as a member of the Board of Directors. Ms. Miltner’s resignation did not result from a disagreement with us, or any matter with respect to our operations, policies, practices or public disclosures. Ms. Miltner received a severance payment in the amount of $75,000, and surrendered her restricted shares of common stock and stock options.
We currently are party to a shareholders agreement pursuant to which, prior to an IPO and so long as Messrs. Anthony Shalom and Michael Shalom control securities in the aggregate representing not less than 22% of our voting power, five of our directors are to be nominated by CVC International, two of our directors are to be nominated by Messrs. Anthony Shalom and Michael Shalom and two of our directors are to be independent. Each of CVC International and collectively, Messrs. Anthony and Michael Shalom is entitled to remove the independent directors at any time and replace them with other individuals who would be independent directors pursuant to the terms of the shareholder agreement.
Board Leadership Structure and Oversight
Our board leadership is designed with separate Chief Executive Officer and Chairman of the Board of Directors. Mr. Michael Shalom is our Chief Executive Officer and President, and is responsible for our day-to-day leadership. Mr. Anthony Shalom is our Chairman and provides guidance to the Chief Executive Officer. We separate the roles of Chief Executive Officer and Chairman of the Board of Directors in recognition of the differences between the two roles, and our Board of Directors believes this provides an efficient and effective leadership model for the company. The Chief Executive Officer is responsible for setting our strategic direction and the our day-to-day leadership and performance, while the Chairman of the Board of Directors provides guidance to the Chief Executive Officer and sets the agenda for meetings and presides over meetings of the Board of Directors. This structure reflects the continuing strong leadership, energy and passion brought to the Board of Directors by our founder, Mr. Anthony Shalom, and the day-to-day management direction of the Company under his son, Mr. Michael Shalom, as Chief Executive Officer and President. The Board of Directors as a whole has responsibility for risk oversight, with reviews of certain risks and exposures being delegated to the relevant committees of the Board of Directors that report on their deliberations to the Board of Directors. The oversight responsibility of the Board of Directors and its committees is supported by management reporting processes that are designed to provide visibility to the Board about the identification, assessment and management of critical risks and mitigation or management initiatives. These areas of focus include competitive, economic, operational, financial, legal, regulatory, compliance, and safety, and reputational risks. In addition to regular management presentations that highlight risks and exposures, where relevant and material, the Board of Directors and its committees have regular executive sessions with management personnel responsible for certain areas of risk and with third parties.
Committees of the Board
Our standing board committees consist of an audit committee, a nominating and corporate governance committee and a compensation committee.
Audit Committee. Our audit committee consists of Messrs. Madden (Chairperson), Henriques, Pallordet and Michael Shalom. Messrs. Madden and Henriques satisfy the audit committee members independence requirements of Nasdaq, the Exchange Act, and the SEC rules and regulations. Our Board of Directors has determined that Mr. Madden qualifies as an “audit committee financial expert” under the SEC rules and regulations. The rules of Nasdaq (the “Nasdaq Rules”) and Rule 10A-3 of the rules promulgated under the Exchange Act require that the audit committee of a listed company be comprised solely of independent directors. Mr. Pallordet is not an “independent” audit committee member under the Nasdaq independence standards for audit committee members and Rule 10A-3 of the rules promulgated under the Exchange Act because of his affiliation with CVC International, our principal shareholder. Mr. Michael Shalom is not an “independent” audit committee member under the Nasdaq independence standards for audit committee members because he is the President of the Company.
85
Table of Contents
The audit committee assists the board in monitoring the integrity of our financial statements, our independent auditors’ qualifications and independence, the performance of our internal audit function and independent auditors, and our compliance with legal and regulatory requirements. The audit committee has direct responsibility for the appointment, compensation, retention (including termination) and oversight of our independent auditors and our independent auditors report directly to the audit committee.
Nominating and Corporate Governance Committee. Our nominating and corporate governance committee consists of Messrs. Pallordet and Madden who satisfy the Nasdaq independence standards. The nominating and corporate governance committee will identify qualified individuals to become members of the Board of Directors, determine the composition of the Board of Directors and its committees and develop and recommend to the Board of Directors sound corporate governance policies and procedures. The design and operation of the director nomination program reflects the Company’s principles to recruit and retain talented board members with qualifications that support development and implementation of the Company’s strategy and the ability to act in the best interest of the Company’s shareholders.
The nominating and corporate governance committee reviews the composition of the Board of Directors and, as necessary, at its discretion, recommends to the Board of Directors when a director should be removed, replaced or added when a vacancy occurs by reason of disqualification, resignation, retirement, death, or an increase in the size of the Board of Directors. The Nominating and Corporate Governance Committee considers candidates for nomination to the Board from a number of sources, and believes it is important to have directors from various backgrounds and professions in order to ensure that the Board has a wealth of experiences to inform its decisions. The committee considers individuals for nomination to serve as members of the Board of Directors based upon their requisite skills and characteristics as well as the composition of the Board as a whole. The assessment includes the individual’s qualification as an independent board member based upon Nasdaq independence standards and the consideration of diversity, education, specialized skills and professional experience in the context of the needs of the Board of Directors and the best interest of the Company. The committee also considers the director nominees for experience in executive leadership, financial management expertise, corporate governance and policy development and enforcement. The committee reviews candidate qualifications based on industry knowledge of logistics and distribution or expertise relevant to the Company’s business, and its management and the individual’s ability and willingness to devote the required time to provide service as a member of the Board of Directors. The committee performs an evaluation of each director’s performance annually before recommending the nomination of a member of the Board of Directors for an additional term.
Compensation Committee. The compensation committee consists of Messrs. Henriques (Chairperson), Madden, Pallordet and Anthony Shalom. Messrs. Henriques, Madden and Pallordet satisfy the independence requirements of the Nasdaq and qualify as the outside directors within the meaning of Section 162(m) of the Internal Revenue Code and non-employee directors within the meaning of Rule 16b-3 of the rules promulgated under the Exchange Act. Mr. Anthony Shalom is not an “independent” compensation committee member under the Nasdaq independence standards for compensation committee members because he is the Chairman of the Company.
The primary duty of the compensation committee is to discharge the responsibilities of the Board of Directors relating to compensation practices for our executive officers and other key employees, as the committee may determine, to ensure that management’s interests are aligned with the interests of our equity holders. The compensation committee also evaluates, establishes and presents to the Board of Directors for ratification our employee benefits plans, compensation and equity-based plans and compensation of directors. The compensation committee considers, establishes and presents to the Board of Directors for ratification, the compensation and benefits of the Chief Executive Officer and the other executive officers.
86
Table of Contents
Director Independence
Our Board of Directors ensures that its determinations regarding the definition of “independent” are consistent with the Nasdaq Rules, the SEC rules and relevant securities and other laws and regulations. Consistent with these considerations, and after reviewing all relevant transactions or relationships between each director, or any of his family members, and us, our senior management and our independent auditors, our Board of Directors has affirmatively determined that six of our directors, Messrs. Bascur, Henriques, Madden, Pallordet and Small are independent directors within the meaning of the applicable laws, regulations and the listing standards of the Nasdaq. Messrs. Michael Shalom and Anthony Shalom are not “independent” directors under the Nasdaq independence standards. Messrs. Michael Shalom and Pallordet are not “independent” audit committee members under the Nasdaq independence standards for audit committee members. Mr. Anthony Shalom is not an “independent” compensation committee member under the Nasdaq independence standards for compensation committee members because he is the Chairman of the Company.
Independent, Non-Employee Directors
Adolfo Henriques
Thomas A. Madden
87
Table of Contents
Compensation Discussion and Analysis
This Compensation Discussion and Analysis (“CD&A”) focuses on our Named Executive Officers (“NEOs”). The NEOs are Messrs. Anthony Shalom, Chairman, Michael Shalom, Chief Executive Officer and President and Russell A. Olson, Chief Financial Officer, Secretary and Treasurer of the Company.
Role of Compensation Committee
The compensation committee is responsible for the review and approval of all aspects of our compensation program and makes all decisions regarding the compensation of our NEOs, other executive officers, if any, (collectively referred to herein as the “Executive Officers”) and members of the Board of Directors including the following specific responsibilities:
| • | review, modify and administer all compensation plans and programs to the Executive Officers and ensure such plans are aligned with our compensation strategies and policies and our performance goals and objectives; |
| • | annually review, evaluate and approve: |
| • | performance criteria, terms and award vehicles used in our compensation plans and arrangements of the Executive Officers; |
| • | performance of and compensation level approved and delivered to the Executive Officers; |
| • | employment, compensatory and other contractual arrangements, contracts, plans, policies and programs affecting the Executive Officers; |
| • | biannually review, evaluate and approve: |
| • | compensation arrangements for the Board of Directors; and |
| • | differentiate pay based on individual performance, assessed on objective and subjective criteria. |
The compensation committee charter is posted on our website at www.intcomex.com .
Compensation Philosophy and Objectives
The design and operation of the executive compensation program and decisions reflects our foundations of principles to recruit and retain talented leadership and implement measurable and achievable individual and Company performance targets as award vehicles in our compensation plan. Our compensation philosophy is relatively simple, reflecting the size, status as a privately-held company not traded on a public stock exchange.
Executive Compensation
The design and operation of the executive compensation program and decisions reflects our foundations of principles to recruit and retain talented leadership and implement measurable and achievable individual and Company performance targets as award vehicles in our compensation plan. The executive compensation program is intended to award a combination of quantitative and qualitative measures. The quantitative measures are based upon a weighted metrics of net income, operating income and cash conversion cycle days. The qualitative measures are based upon a series of goals to ensure business continuity and secure the future performance of the Company.
88
Table of Contents
Principle Elements of our Compensation Program
The recruitment and retention of talented leadership to manage our Company requires a competitive compensation package aligned with our pay for performance philosophy for our NEOs. The approach to our executive compensation package includes: (1) fixed compensation elements of base salary and benefits; and (2) some elements of variable compensation contingent upon our company’s performance.
Fixed Compensation. The principal elements of our fixed compensation program are not directly linked to performance targets. Fixed compensation includes base salary, benefits (e.g., health, life and disability insurance) and 401(k) deferred compensation plan. Individual variations in base salary are based on job scope, tenure, retention risk and other factors relevant to us.
Variable Compensation. The principle elements of our incentive compensation program are linked to performance metrics related to the executive’s job scope. Variable compensation includes annual bonus and long-term incentive awards. These metrics are tied to our growth, profitability and performance objectives as determined by our Board of Directors during the annual budgeting process. For a detailed discussion of our incentive compensation plans, see “—Annual Bonus” and “Long-Term Incentive Awards.”
Base Salary. We provide our NEOs with a market competitive base salary to attract and retain an appropriate caliber of talent for the position and to recognize that similar base salaries are provided at companies with whom we compete for talent. The compensation committee reviews the base salaries for the NEOs annually and determines whether changes to the base salary are required based on changes in our competitive market, individual performance, experience in the position, and other relevant factors. For the base salaries of each of our NEOs, see “—Summary NEO Compensation Table.”
Annual Bonus. We provide the opportunity for our NEOS to earn a market competitive annual cash incentive award to recognize appropriate level of measurable and achievable individual and Company performance targets as award vehicles in our compensation plan. The compensation committee reviews the NEOs annual bonuses each year and determines whether changes to the annual bonus program are required based on changes in our Company’s performance and other factors relevant to the Company.
In 2009, we offered an annual bonus to each of our NEOs based upon the achievement of certain financial (net income, operating income and cash conversion cycle) and non-financial (operational excellence initiatives) goals established by the compensation committee. For the annual bonus of each of our NEOs, see “—Summary NEO Compensation Table.”
Long-Term Incentive Awards. We offer market competitive long-term incentive awards to certain of our NEOs to motivate executives to make decisions to focus on the long-term growth of our Company, thus increasing shareholder value, to attract and retain an appropriate caliber of talent for the position and to recognize that similar long-term equity incentives are provided at companies with whom we compete for talent. The compensation committee reviews the long-term incentive awards for the NEOs annually and determines whether changes to the long-term incentive awards are required based on changes in our competitive market, individual performance, experience in the position, and other relevant factors. In 2009, we offered long-term incentive awards to our NEOs. For a discussion of Mr. Olson’s long-term incentive awards, see “—Employment Agreements; Potential Payments Upon Termination or Change of Control.”
The Board of Directors or any of its committees, as directed by the Board of Directors, administers the 2007 Founders’ Grant Stock Option Plan (“2007 Founders’ Option Plan”) for the NEOs. The 2007 Founders’ Option Plan provides for the grant of nonqualified and incentive stock options to Executive Officers, management employees and directors, as designated by the plan administrator.
Under the 2007 Founders’ Option Plan, stock options will be granted at fair market value on the date of grant and have a 10-year exercise period and a vesting period as determined by the plan administrator pursuant to
89
Table of Contents
the stock option award agreement. Upon a termination of service with us, a plan participant’s options to the extent vested remain exercisable for a period ending on the earlier of three months from termination of service (or 12 months from termination of service, in the case of death or disability) or as specified in the stock option award agreement. Any portion of the option that is unvested as of termination of service will be forfeited. The 2007 Founders’ Option Plan provides for acceleration of vesting on a change of control. “Change of control” means the occurrence of any of the following events: (i) any “person” (as such term is used in Sections 13(d) and 14(d) of the Exchange Act) becomes the “beneficial owner” (as defined in Rule 13d-3 of the rules promulgated under of the Exchange Act), directly or indirectly, of securities of the company representing more than 50.0% of the total voting power represented by the company’s then outstanding voting securities; (ii) the consummation of the sale or disposition by the company of all or substantially all of the company’s assets; or (iii) the consummation of a merger or consolidation of the company with any other corporation, other than a merger or consolidation which would result in the voting securities of the company outstanding immediately prior thereto continuing to represent (either by remaining outstanding or by being converted into voting securities of the surviving entity or its parent) at least 50.0% of the total voting power represented by the voting securities of the company or such surviving entity or its parent outstanding immediately after such merger or consolidation. The Board of Directors may, at any time, amend, alter, suspend or terminate the 2007 Founders’ Option Plan, except as such amendment, suspension or termination of the 2007 Founders’ Option Plan would impair the rights of any participant under the 2007 Founders’ Option Plan, unless otherwise agreed to by the plan participant.
A maximum of 1,700 shares of Class B common stock, non-voting may be issued under the 2007 Founders’ Option Plan, and subject to certain capital adjustment provisions, a maximum of 250 shares of common stock, subject to options, may be granted to management employees and independent, non-employee directors in a single calendar year. As of December 31, 2009, 1,540 stock options were issued, of which 1,280 were outstanding and 160 may be issued under the 2007 Founders’ Option Plan. As of December 31, 2008, 1,540 stock options were issued, of which 1,490 were outstanding and 160 may be issued under the 2007 Founders’ Option Plan. Upon exercise of the outstanding stock options granted under the 2007 Founders’ Option Plan, an aggregate of 1,280 shares of Class B common stock, non-voting are issuable with a weighted average exercise price of $1,077 per share.
Deferred Compensation Plan. During the first half of 2009, we contributed 4.0% in cash of each participating employee’s total salary, up to IRS contribution limits, to the respective employee’s 401(k) savings plan. We temporarily discontinued the contributions in July 2009 to ensure compliance with non-discriminating plan thresholds. For the deferred compensation of each of our NEOs, see “—Summary NEO Compensation Table.”
Perquisites. We do not provide any executives or employees with perquisites or a perquisite allowance.
Other Benefits. Insurance benefits for executives employ the same formulae as are applicable to all our employees.
The Decision Making Process
The compensation committee met five times during 2009 to consider the individual performance goals and objectives, our financial position and philosophy and discuss the preliminary and final compensation decisions for the NEOs. The compensation committee evaluated the performance and compensation awards based upon the executives overall contribution to our financial and operational performance.
When making the annual bonus decisions for 2009, the compensation committee considered overall Company and individual performance, competitive market position and prior year’s cash bonuses.
The compensation committee considered several factors when making its year-end compensation decisions affecting our NEOs. Our performance for the year ended December 31, 2009, was the principal
90
Table of Contents
consideration regarding the overall funding level of the annual bonus elements of the NEO’s compensation for 2009, with the primary factor of Company performance being net income and operating income and the secondary factor being cash conversion cycle (the “Annual Company Performance Bonus”). The level at which we fund our bonuses correlates to the degree to which the targets have been met, not met, or has exceeded the target. We failed to achieve our EBITDA or cash conversion cycle objectives for the year ended December 31, 2008, therefore, our NEOs were not awarded the Annual Company Performance Bonus.
In September 2009, the compensation committee approved a reduction in the NEO’s bonus pool to 50%, as a result of the revised year end net income and operating income targets.
The compensation committee considers additional performance factors related to the NEO’s progress on core strategic performance priorities across the Company. As part of the compensation decision process, the compensation committee judges each NEO on the overall performance priorities, without a set weight assigned to each of the factors, but an overall weighting for the group of priorities. The compensation committee reviews and balances these factors in the aggregate in determining individual NEO bonuses (the “Annual Individual Performance Bonus”). The Annual Individual Performance Bonus is based upon a combination of quantitative and qualitative measures. The quantitative measures account for 75% of the bonus and are based upon the achievement of a weighted metrics of net income, operating income and cash conversion. The qualitative measures account for 25% of the bonus and are based upon the achievement of goals for continuity and goals to secure the future of the Company. The specific targets for the performance priorities are not disclosed because we believe disclosure of this information would cause us competitive harm.
These targets are based on our business plan for the current fiscal year, and are intended to be challenging but achievable. Based on historical experience, management was expected to achieve between 85% to 100% of the targets for fiscal years 2009 and 2008. However, given the recent global economic crisis and its impact on us in 2008, Annual Individual Performance Bonuses were not awarded.
The individual NEO compensation decisions vary based on the Company and individual performance with consideration of the following performance priorities and key strategic initiatives: (i) continued infrastructure development and implementation of our core ERP system in In-country Operations; (ii) development of a comprehensive five year strategic planning process company-wide; (iii) identification of business growth opportunities to grow and build the business; and, (iv) achievement of effectiveness of our disclosure controls and procedures and internal controls over financial reporting in compliance with the Sarbanes-Oxley Act of 2002.
Compensation of Our Named Executive Officers
Each of the NEO’s Messrs. Anthony and Mike Shalom voluntarily enacted a temporary decrease to their 2009 annual base salaries by 15% effective July 1, 2009, to support our cost containment and reduction policy during the fiscal year. The compensation committee increased the NEO’s 2008 annual base salaries by 10% of each NEO’s respective 2008 annual base salary, effective July 1, 2008, to reflect the NEO’s increasingly broader roles including each NEO’s extensive involvement in the filing of the SEC Form S-1 Registration Statements and respective amendments and operational and financial performance achievements including the achievement of our $1 billion revenue mark during fiscal 2008.
The compensation committee established the 2009 short-term annual bonus incentive award for each NEO. The short-term annual bonus incentive target is 115% for the Chief Executive Officer, 100% for the President and 85% for the Chief Financial Officer, of their respective 2009 base salaries. The NEO is eligible to earn an actual short-term annual bonus based on the Company’s achievement of certain financial metrics and the individual NEO’s achievement of their Annual Individual Performance Bonus. The NEO qualifies to earn up to 75% of the actual short-term annual bonus based upon the achievement of financial metrics including our average cash conversion cycle of each quarter of 2009 and our year-end 2009 EBITDA based on consolidated
91
Table of Contents
U.S. GAAP financial statements. The NEO qualifies to earn up to the remaining 25% of the actual short-term annual bonus based upon the successful achievement of their Annual Individual Performance Bonus including the infrastructure development and implementation of our core ERP system in select In-country Operations, the development of a comprehensive five year strategic planning process company-wide, the identification of business growth opportunities, and the effectiveness of our disclosure controls and procedures and internal controls over financial reporting in compliance with the Sarbanes-Oxley Act of 2002.
Pay Equity. On February 15, 2009 the compensation committee approved the compensation package for Messrs. Anthony Shalom and Michael Shalom’s including a base salary component and a short-term incentive award component. The compensation committee approved the compensation package for Mr. Olson including a base salary component, an annual bonus component and a long-term incentive award component. The compensation committee included an annual bonus component in Mr. Olson’s compensation package that is appropriate for his scope of responsibilities as our Chief Financial Officer, Secretary and Treasurer to balance the compensation for his respective position among his peer NEOs. For a further discussion on the security ownership of certain beneficial owners, see “Security Ownership of Certain Beneficial Owners and Management and Related Stockholder Matters.”
Benchmarking
In 2007, the compensation committee engaged Compensia to advise the Company on the rank of our executive compensation package relative to our peer industry group. We performed a formal, detailed analysis of the compensation plans relative to our peer groups in determining the target compensation provided to the NEOs and examined the performance metrics including operating income and operating margin, pre-tax profit, return on working capital and return on invested capital and earnings per share. We reviewed the compensation paid relative to our peer industry group including: Agilysys, Arrow Electronics, Avnet, Bell Microproducts, Black Box, GTSI, Ingram Micro, Pomeroy IT Solutions, Richardson Electronics, ScanSource, SYNNEX, Tech Data.
Role of Executive Officers in Compensation Decisions
The Chief Executive Officer is a member of the compensation committee and attends and participates in the compensation committee meetings. The Chief Executive Officer recommends any NEO compensation changes to the compensation committee and the compensation committee considers and approves the compensation levels. The compensation committee sets the compensation of the Chief Executive Officer and consults with the Chief Executive Officer with respect to the compensation of the Chief Financial Officer.
Equity Grant Practices and Equity Ownership Guidelines
The compensation committee authorizes the issuance of equity grants to employees, directors and Executive Officers. The compensation committee reviews, modifies and administers all equity compensation plans, programs and ownership guidelines and ensure such plans are aligned with our compensation strategies and policies and our performance goals and objectives. We do not require executive officers to hold shares of the Company.
Compensation Recoupment Policy
The compensation committee does not maintain a policy for the recoupment of any compensation payable in the event an executive officer is terminated for cause or knowingly or intentionally satisfies performance metrics through illegal or fraudulent conduct. The compensation committee does not consider recoupment of any compensation payable unless specified in an individual employment agreement.
92
Table of Contents
Tax Deductibility Considerations
We believe that all compensation paid to our named executive officers for 2009 is accounted for as expense in the period to which it relates in accordance with U.S. GAAP and is deductible for U.S. federal income tax purposes. In no case during 2009 and 2008 was any proposed form of compensation materially revised to take into account the impact of tax or accounting treatment. The impact of the deductibility limits of Section 162(m) of the Internal Revenue Code, did not materially impact our compensation decisions for 2009 and 2008, because those provisions of the Internal Revenue Code did not apply to us in 2009 and 2008, and our compensation levels for 2009 and 2008 did not approach the $1.0 million per named executive officer level at which compensation deductions may be denied under those provisions.
Compensation Committee Interlocks and Insider Participation
On January 25, 2007, we formed our compensation committee. The compensation committee consists of Messrs. Henriques (Chairperson), Madden, Pallordet and Anthony Shalom. Messrs. Henriques, Madden and Pallordet satisfy the independence requirements of the Nasdaq and qualify as the outside directors within the meaning of Section 162(m), and non-employee directors within the meaning of Rule 16b-3 of the rules promulgated under the Exchange Act. Mr. Anthony Shalom is not an “independent” compensation committee member under the Nasdaq independence standards for compensation committee members because he is our Chairman. None of our executive officers serves as a member of the Board of Directors or compensation committee of any entity that has one or more of its executive officers serving as member of our Board of Directors or compensation committee.
Compensation Committee Report
Our compensation committee has reviewed and discussed this CD&A with our management. Based upon this review and discussion, the compensation committee recommended to the Board of Directors that the CD&A be included in this prospectus.
Compensation Committee
Adolfo Henriques (Chairperson)
Thomas A. Madden
Juan Pablo Pallordet
Anthony Shalom
93
Table of Contents
Summary NEO Compensation
The summary NEO compensation table describes the total compensation paid for the years ended December 31, 2009, 2008 and 2007 to the NEOs, serving as our Executive Officers, including the Chief Executive Officer, the President and the Chief Financial Officer, Secretary and Treasurer. The table reflects information regarding the components of total compensation for services rendered by the NEOs to the Company and its subsidiaries for the years ended December 31, 2009, 2008 and 2007.
Summary NEO Compensation Table
| Name and Principal |
Year | Salary | Bonus(3) | Grant Date Fair Value of Stock Awards |
Grant Date Fair Value of Option Awards(4) |
Non-Equity Incentive Plan Compensation |
Change in Pension Value and Nonqualified Deferred Compensation Earnings |
All Other Compensation(6) |
Total | ||||||||||||||||||
| Anthony Shalom, |
2009 | $ | 342,250 | $ | — | $ | — | $ | — | $ | — | $ | — | $ | 7,400 | $ | 349,650 | ||||||||||
| Chief Executive Officer(1) |
2008 | $ | 377,788 | $ | 67,375 | $ | — | $ | — | $ | — | $ | — | $ | 6,900 | $ | 452,063 | ||||||||||
| 2007 | $ | 367,500 | $ | — | $ | — | $ | — | $ | — | $ | — | $ | 6,750 | $ | 374,250 | |||||||||||
| Michael Shalom, |
2009 | $ | 342,250 | $ | — | $ | — | $ | — | $ | — | $ | — | $ | 7,400 | $ | 349,650 | ||||||||||
| President(2) |
2008 | $ | 349,231 | $ | 49,500 | $ | — | $ | — | $ | — | $ | — | $ | 6,900 | $ | 405,631 | ||||||||||
| 2007 | $ | 315,000 | $ | — | $ | — | $ | — | $ | — | $ | — | $ | 6,750 | $ | 321,750 | |||||||||||
| Russell A. Olson, |
2009 | $ | 280,000 | $ | — | $ | — | $ | — | $ | — | $ | — | $ | 5,600 | $ | 285,600 | ||||||||||
| Chief Financial Officer, Treasurer and Secretary |
2008 | $ | 274,548 | $ | 289,403 | $ | — | $ | — | $ | — | $ | — | $ | 6,900 | $ | 570,851 | ||||||||||
| 2007 | $ | 257,250 | $ | 115,150 | $ | — | $ | 113,142 | (5) | $ | — | $ | — | $ | 6,750 | $ | 492,292 | ||||||||||
| (1) | Anthony Shalom has been Chairman of the Company since 2004 and was the Chief Executive Officer until his resignation as Chief Executive Officer on February 15, 2010. |
| (2) | Michael Shalom has been President of the Company since 2004 and became Chief Executive Officer effective February 15, 2010. |
| (3) | Bonus payments made in 2009 and 2008 reflect bonuses earned related to achievements versus established goals in 2008 and 2007 respectively. |
| (4) | In February 2007, the Board of Directors authorized a one-time issuance of options to acquire an aggregate of 1,540 shares of Class B common stock, non-voting under the 2007 Founders’ Option Plan to certain of the Company’s management employees and independent, non-employee directors. The shares vest ratably over a three year vesting period of one-third per year and expire 10 years from the date of grant. |
| (5) | In February 2007, the Company granted options to acquire 200 of 1,540 shares of Class B common stock, non-voting to Mr. Olson. |
| (6) | Represents amounts contributed by the Company to the employee’s 401(k) account. |
94
Table of Contents
Outstanding Equity Awards at Fiscal Year End 2009
| OPTION | AWARDS | STOCK | AWARDS | ||||||||||||||||||
| Name and Principal |
Number of Securities Underlying Unexercised Options Exercisable |
Number of Securities Underlying Unexercised Options Unexercisable |
Equity Incentive Plan Awards: Number of Securities Underlying Unexercised Unearned Options |
Option Exercise Price |
Option Expiration Date |
Number of Shares of Stock that have not Vested |
Market Value of Shares of Stock that have not Vested |
Equity Incentive Plan Awards Number of Unearned Shares that have not Vested |
Equity Incentive Plan Awards Market or Payout Value of Unearned Shares that have not Vested | ||||||||||||
| Anthony Shalom, |
— | — | — | $ | — | — | — | $ | — | — | — | ||||||||||
| Chief Executive |
|||||||||||||||||||||
| Michael Shalom, |
— | — | — | $ | — | — | — | $ | — | — | — | ||||||||||
| President(2) |
|||||||||||||||||||||
| Russell A. Olson, |
133 | — | 67 | $ | 1,077 | (3) | Feb 27,2017 | — | $ | — | — | — | |||||||||
| Chief Financial |
|||||||||||||||||||||
| (1) | Anthony Shalom has been Chairman of the Company since 2004 and was the Chief Executive Officer until his resignation as Chief Executive Officer on February 15,2010 |
| (2) | Michael Shalom has been President of the Company since 2004 and became Chief Executive Officer effective February 15, 2010. |
| (3) | In February 2007, the Board of Directors authorized a one-time issuance of options to acquire an aggregate of 1,540 shares of Class B common stock, non-voting under the 2007 Founders’ Option Plan to certain of the Company’s management employees and independent, non-employee directors. The shares vest ratably over a three year vesting period of one-third per year and expire 10 years from the date of grant. |
Employment Agreements; Potential Payments Upon Termination or Change of Control
The following describes certain of our obligations on various termination situations for Mr. Olson. We have no other obligation with respect to any termination or change in control payments to any of the NEOs. We do not maintain employment agreements with Anthony or Michael Shalom. The compensation committee annually approves compensation packages for Anthony and Michael Shalom in accordance to the procedures described in “—Decision Making Process, and —Compensation of Our Named Officers.”
We had an employment agreement with Mr. Olson, our Treasurer, Chief Financial Officer and Secretary, which expired on December 31, 2007, and was replaced with an evergreen contract for one year each unless advance written notification that a replacement contract will not exist. As set forth in this employment agreement, Mr. Olson’s annual base salary is $280,000, plus an annual performance bonus of up to $140,000 for the term of the agreement based on the achievement of specified performance targets, including achieving certain levels of EBITDA, gross revenues, working capital management and project specific performance and (iii) a cumulative long-term incentive bonus of 50% of Mr. Olson’s base salary for each year based on the achievement of targeted financial performance goals and objectives, including EBITDA and working capital targets. Mr. Olson is eligible to receive employee benefits comparable to the benefits provided to our other employees.
In the event of termination of Mr. Olson’s employment by us without cause, under the agreement we were obligated to pay to Mr. Olson all bonuses on a prorated basis to the date of termination. If a sale of more than 50.1% of the voting stock of our Company resulted in a material adverse change in Mr. Olson’s duties and responsibilities not acceptable to him, we will be required to pay Mr. Olson a severance payment in an amount equal to six months of his base salary and reimburse him for certain relocation costs. If we had terminated Mr. Olson’s employment for due cause or if he resigned prior to the end of the term, he would not have been entitled to any compensation other than his base salary through the date of his termination or resignation. For
95
Table of Contents
purposes of the employment agreement, “due cause” means Mr. Olson’s willful misconduct in the discharge of his duties and responsibilities to us; his failure to carry out and execute any material directions from the President and/or Board of Directors; any act of him against us intended to enrich him, or any other party, in derogation of his duties to us; any willful or purposeful act or omission (or any act or omission taken in bad faith) having the effect of injuring our business or business relationships; his commission of a crime of moral turpitude, fraud or misrepresentation; or his breach of the his employment agreement. Following the termination of his employment, Mr. Olson will be subject to non-solicitation and other non-competition restrictions for a period of two years if Mr. Olson resigns or we terminate his employment for cause (as such term is defined in the employment agreement), or for a period of one year if we terminate Mr. Olson’s employment without cause or the employment agreement is not renewed after its expiration.
401(k) Plan
Our employees participate in a 401(k) plan to provide them with retirement benefits and with a means to save for their retirement. The 401(k) plan is intended to be a tax-qualified plan under Section 401(a) of the Internal Revenue Code.
Director Compensation
Directors who are independent, non-employee members of the Board of Directors are eligible to receive director compensation under a basic board membership compensation plan. In 2007, eligible directors were granted 160 stock options under the 2007 Founders’ Option Plan. We reimburses directors for reasonable travel expenses incurred in attending our board, committee and shareholder meetings.
In 2007, the compensation committee engaged Compensia to advise us on our role-based differentiation of compensation levels to capture and compare the non-employee director compensation package relative to our peer industry group. We reviewed the compensation paid by its peer industry group and performed a formal, detailed analysis of the non-employee director roles and compensation plans relative to our peer groups in determining the target compensation provided to the non-employee directors. Members of the peer industry group examined for comparison with us included: Agilysys, Arrow Electronics, Avnet, Bell Microproducts, Black Box, GTSI, Ingram Micro, Pomeroy IT Solutions, Richardson Electronics, ScanSource, SYNNEX, Tech Data.
In February 2008, our Board of Directors amended the board membership compensation plan. Eligible board members will receive an annual retainer consisting of a grant of 41 each of restricted shares of common stock, non-voting, with a three year cliff vesting period and a cash payment of $40,000 made ratably over four quarters (the “Director Annual Retainer”). The cash payment is for attendance of up to five board meetings per year, and an additional $1,000 for attendance in person and $500 for attendance by telephone for each meeting in excess of five board meetings. The audit committee chair will receive an annual cash retainer of $12,000 and all other committee chairs will receive an annual cash retainer of $10,000. In addition, eligible board members will receive $1,000 for attendance in person and $500 for attendance by telephone for board committee meetings. The lead independent director will receive an annual cash retainer of $12,000. In lieu of the Director Annual Retainer, a new board member will receive an equity grant of 73 restricted shares of common stock, non-voting, with a three year vesting period of one-third per year.
In November 2007, our Board of Directors authorized the issuance of 32 restricted shares of common stock, non-voting, upon completion of the IPO and, at the IPO price, to each of our director Mr. Madden and our former director Ms. Miltner. The restricted shares have a three year vesting period of one-third per year on the annual anniversary date. In January 2009, Ms. Miltner surrendered her right to the restricted shares of common stock, in accordance with the terms of her resignation agreement with us.
In February 2008 our Board of Directors authorized, and in June 2008 our shareholders approved, the issuance of 73 restricted shares of common stock, non-voting, with a three year cliff vesting period, to our
96
Table of Contents
director Mr. Henriques, as the initial equity consideration for his election to the Board of Directors and 41 each of restricted shares of common stock, non-voting, with a three year cliff vesting period to our director Mr. Madden and our former director Ms. Miltner, as their annual equity consideration for board membership. In January 2009, Ms. Miltner surrendered her right to the restricted shares of common stock, in accordance with the terms of her resignation agreement with us.
In January 2009, in accordance with the terms of her resignation agreement with us, Ms. Miltner surrendered her right to (1) the 41 restricted shares of common stock, non-voting, with a three year cliff vesting period, that were authorized by our Board of Directors in February 2008 and approved by our shareholders in June 2008; and (2) the 32 restricted shares of common stock, non-voting, with a three year vesting period of one-third per year on the annual anniversary date, that were authorized, upon completion of the IPO and at the IPO price, by our Board of Directors in November 2007.
In May 2009, our Board of Directors authorized and our shareholders approved the issuance of 96 restricted shares of Class B common stock, non-voting, with a three year cliff vesting period to each of our directors Messrs. Henriques and Madden, as their annual equity consideration for board membership, (collectively the “2009 Restricted Stock Issuance”).
In September 2009, our Board of Directors approved, subject to shareholder approval, the designation of an additional 1,000 shares of Class B common stock, non-voting, to be reserved for the grant of restricted stock to our Board of Directors.
There were 192 restricted shares of Class B common stock, non-voting, granted under the 2009 Restricted Stock Issuance and 155 restricted shares of Class B common stock, non-voting, granted under the 2008 Restricted Stock Issuances to certain independent, non-employee directors during the year ended December 31, 2009 and 2008, respectively.
Directors who are also employees of the Company or affiliated with CVC International do not receive any compensation under the board membership compensation plan. Messrs. Anthony Shalom, Michael Shalom and directors of the board affiliated with CVC International do not receive director compensation. The summary director compensation table describes the total compensation paid to our independent, non-employee directors for the year ended December 31, 2009.
Director Compensation Table For Fiscal Year 2009
| Name and Principal Position |
Year | Fees Earned or Paid in Cash |
Grant Date Fair Value of Stock Awards |
All Other Compensation |
Total | ||||||||||
| Adolfo Henriques, Director Compensation Committee Chairperson,(1) |
2009 | $ | 51,500 | $ | 50,000 | (3) | $ | — | $ | 101,500 | |||||
| Thomas A. Madden, Director Audit Committee Chairperson, Nominating & Corporate Governance Committee Member, Compensation Committee Member |
2009 | $ | 53,000 | $ | 50,000 | (3) | $ | — | $ | 103,000 | |||||
| Carol Miltner, (2) Director Audit Committee Member, Nominating & Corporate Governance Committee Chairperson, Compensation Committee Interim Chairperson |
2009 | $ | 82,000 | $ | — | $ | — | $ | 82,000 | ||||||
| (1) | Mr. Henriques was elected a member of our Board of Directors in February 2008. |
97
Table of Contents
| (2) | Ms. Miltner resigned as a member of the Board of Directors of our Company in January 2009. |
| (3) | In May 2009, the Company granted 96 restricted shares of Class B common stock, non-voting, with a three year cliff vesting period to each of our directors Messrs. Henriques and Madden, as their annual equity consideration for board membership. |
Security Ownership of Certain Beneficial Owners and Management
The following table sets forth information with respect to (i) all persons known by us to be the beneficial owners of more than 5% of our common stock; (ii) all NEOs; (iii) all directors; and (iv) all directors and Executive Officers as a group as of February 19, 2010.
| Beneficial Owner(1) |
Number of Shares |
Percentage of Total Shares |
|||
| Co-Investment LLC VII (Intcomex)(2)(3) |
66,519 | 51.5 | % | ||
| 399 Park Avenue, 14th Floor, |
|||||
| New York, NY 10022 |
|||||
| Anthony Shalom(4)(5) |
24,830 | 19.2 | % | ||
| Michael Shalom(4)(6) |
10,746 | 8.3 | % | ||
| Enrique Bascur(2)(3) |
— | — | |||
| Adolfo Henriques |
— | — | |||
| Thomas A. Madden |
— | — | |||
| Juan Pablo Pallordet(2) |
— | — | |||
| Andres Small(2) |
— | — | |||
| Russell A. Olson |
— | — | |||
| All directors and executive officers as a group |
35,576 | 27.5 | % |
| (1) | The address of each beneficial owner is c/o Intcomex, Inc., 3505 NW 107th Avenue, Miami, Florida 33178, unless otherwise indicated. |
| (2) | Co-Investment LLC VII (Intcomex) is controlled by Citigroup Inc, a publicly-traded company that has securities listed on the New York Stock Exchange. Each of Messrs. Bascur, Pallordet and Small was nominated as a director of our Company by CVC International pursuant to the terms of the shareholders agreement. Includes 13,974 Class B common stock, non-voting, held by CVCI Intcomex Bond Purchase LP, which are controlled by Citigroup Inc. |
| (3) | Mr. Bascur is a member of the CVC International divestment committee that must approve any sale of Co-Investment LLC VII (Intcomex)’s shares in our Company as well as approve any sale of CVCI Intcomex Bond Purchase LP’s shares in our Company. |
| (4) | Each of Messrs. Anthony Shalom and Michael Shalom were nominated as a director of our Company by themselves pursuant to the terms of the shareholders agreement. |
| (5) | Held by Shalom Holdings 1 LLLP. Mr. Michael Shalom has sole voting control and investment discretion over the shares held by Shalom Holdings 1 LLLP. |
| (6) | Held by Shalom Holdings 3 LLLP. Mr. Michael Shalom has sole voting control and investment discretion over the shares held by Shalom Holdings 3 LLLP. |
Equity Compensation Plan Information
Stock Options
There were no stock options granted during the years ended December 31, 2009 and 2008.
98
Table of Contents
Our equity compensation plans as of December 31, 2009, are as follows:
| Plan Category |
Number of Securities to be Issued upon Exercise of Outstanding Options, Warrants and Rights |
Weighted-Average Exercise Price of Outstanding Options, Warrants and Rights |
Number of Securities Remaining Available for Future Issuance under Equity Compensation Plans | |||||
| (in dollars) | ||||||||
| Equity compensation plans approved by security holders |
1,280 | $ | 1,077 | (1) | 160 | |||
| Equity compensation plans not approved by security holders |
— | — | — | |||||
| Total |
1,280 | $ | 1,077 | 160 | ||||
| (1) | The exercise strike price was determined at the issuance of the stock options by a study conducted by an independent expert. |
A maximum of 1,700 shares of Class B common stock, non-voting may be issued under the 2007 Founders’ Option Plan, and subject to certain capital adjustment provisions, a maximum of 250 shares of common stock, subject to options, may be granted to management employees and independent, non-employee directors in a single calendar year. As of December 31, 2009, 1,540 stock options were issued, of which 1,280 were outstanding and 160 were issuable under the 2007 Founders’ Option Plan. As of December 31, 2008, 1,540 stock options were issued, of which 1,490 were outstanding and 160 may be issued under the 2007 Founders’ Option Plan. Upon exercise of the outstanding stock options granted under the 2007 Founders’ Option Plan, an aggregate of 1,280 shares of Class B common stock, non-voting are issuable with a weighted average exercise price of $1,077 per share.
Restricted Shares of Common Stock
In February 2008, our Board of Directors authorized, and in June 2008, our shareholders approved, the issuance of 73 restricted shares of Class B common stock, non-voting, with a three year cliff vesting period to our director Mr. Henriques, as the initial equity consideration for his election to the Board of Directors and 41 restricted shares of Class B common stock, non-voting, with a three year cliff vesting period to each of our director Mr. Madden and our former director Ms. Miltner, as their annual equity consideration for board membership. In January 2009, Ms. Miltner surrendered her right to the restricted shares of Class B common stock, non-voting in accordance with the terms of her resignation agreement with us.
In May 2009, our Board of Directors authorized and our shareholders approved the issuance of 96 restricted shares of Class B common stock, non-voting, with a three year cliff vesting period to each of our directors Messrs. Henriques and Madden, as their annual equity consideration for board membership.
In September 2009, our Board of Directors approved, subject to shareholder approval, the designation of an additional 1,000 shares of Class B common stock, non-voting, to be reserved for the grant of restricted stock to our Board of Directors. Pursuant to the closing of the 13 1/4% Senior Notes sold in a private placement transaction on December 22, 2009. Certain of our existing shareholders and their affiliates contributed $20,001 of new capital in exchange for 27,175 newly-issued shares of our Class B common stock, non-voting, through a subscription agreement. The fair value of the Class B common stock, non-voting was determined by independent valuation experts as of the date the 13 1/4% Senior Notes closed.
As of December 31, 2009 and 2008, we did not offer equity compensation plans not approved by security holders under which our equity securities are authorized for issuance.
99
Table of Contents
CERTAIN RELATIONSHIPS AND RELATED PARTY TRANSACTIONS
Transactions with IFX Corporation
IFX Corporation (“IFX”) is a Latin American telecommunications service provider that provides internet access services to our Miami Operations and our in-country operations in Argentina, Chile, Colombia, Guatemala, Mexico, Panama and Uruguay. IFX is privately held by Michael Shalom and a family member. As President of our Company and Chairman of IFX, Michael Shalom is both a shareholder and officer of the Company and IFX. The Company sells IT products to and purchases internet access from IFX. During the years ended December 31, 2009, 2008 and 2007, the Company paid approximately $0.5 million, $0.6 million and $0.5 million, respectively, to IFX for their services. During the years ended December 31, 2009, 2008 and 2007, the Company sold approximately $3,700 $29,000 and $231,000, respectively, of IT products to IFX. The Company did not have an outstanding receivable balance from IFX as of December 31, 2009 and 2008. The trade receivables of IFX are guaranteed by Techno-Mundial, S.A., a former shareholder of our Company. We believe that all transactions with IFX have been made on terms that are not less favorable to us than those available in a comparable arm’s length transaction and in the ordinary course of business.
Subscription Agreement with Related Parties
On December 22, 2009, the Company issued additional an additional 27,175 Class B Common Stock, non-voting to certain existing shareholders who became party to a both a subscription agreement governing the issuance of shares as well as the fourth amended and restated shareholders agreement. In exchange for the shares, the Company received an aggregate of $15.1 million in 11 3/4% Senior Notes, $0.9 million in accrued interest and tender premium and $4.0 million in cash. Each subscriber was an “accredited investor,” as defined by Regulation D of the Securities Act of 1933 (the “Securities Act”). The offering and sale of the shares were exempt from registration under the Securities Act, applicable U.S. state securities laws and the laws of any non-U.S. jurisdictions by virtue of Section 4(2) of the Securities Act, exemptions under applicable U.S. state securities laws and exemptions under the laws of any non-U.S. jurisdictions, as defined by Rule 501(a) of Regulation D of the Securities Act.
The subscribers included Shalom Holdings 1, LLLP and Shalom Holdings 3, LLLP, which are controlled by Messrs. Michael and Anthony Shalom, respectively. Each of these companies contributed $1.3 million in 11 3/4% Senior Notes in exchange for 1,794 Class B common stock, non-voting. In addition, CVCI Intcomex Bond Purchase LP, which is controlled by CVC International, contributed $7.0 million in 11 3 /4% Senior Notes and $3.2 million in cash in exchange for 13,974 Class B common stock, non-voting.
Consulting Agreement with Related Parties
In November 2008, the Company entered into a 14-month consulting agreement in the amount of $0.5 million with two of the Company’s shareholders, who were former managers of our operation in Mexico, to provide advice and operating guidance to the new management of the Company’s Mexican operations. The expense was included in the Company’s restructuring plan provision as of December 31, 2008. As of December 31, 2009 and 2008, the amounts paid to the related parties to the agreements were $0.5 million and $0.1 million, respectively.
Mexican Facility
Harry Luchtan, our former general manager of Centel, is a co-owner of warehouse and office space located in Mexico City, Mexico which we lease for approximately $23,000 per month. The lease expires on January 1, 2011, and we have an option to purchase the facility for $3.0 million through December 31, 2011. We believe that the terms of the lease and option to purchase the facility are not less favorable to us than those available in a comparable arm’s length transaction and in the ordinary course of business.
100
Table of Contents
Shareholders Agreement
Pursuant to our fourth amended and restated shareholders agreement among us and each of our shareholders, so long as the Shaloms beneficially own securities representing not less than 22.0% of our voting power in the aggregate, CVC International may nominate five directors and the Shaloms may nominate two directors to our Board of Directors and two directors are independent. Each of CVC International and collectively, Messrs. Anthony and Michael Shalom is entitled to remove the independent directors at any time and replace them with other individuals who would be independent directors pursuant to the terms of the shareholder agreement.
The shareholders agreement also provides that we may not effect certain amendments to our certificate of incorporation or bylaws, incur certain levels of indebtedness, change our line of business or take certain other actions, without in each case obtaining the consent of the directors of our Company appointed by the Shaloms. In addition, each of our shareholders other than CVC International, whom we refer to as our minority shareholders, has granted CVC International an option to purchase all of our capital stock owned by such minority shareholder at fair value, upon the occurrence of a “termination event.” A termination event includes generally a termination of such minority shareholder’s employment (or other relationship) with our Company for cause or the termination by such minority shareholder of his or her employment (or other relationship) with our Company without good reason. Pursuant to the shareholders agreement, our shareholders have agreed to certain restrictions on the transfer of their stock in our Company, including rights of first offer, tag-along rights and drag-along rights. The shareholders agreement also provides Centel’s pre-acquisition shareholders (who received Class B common stock, non-voting stock in our Company in partial exchange for their shares in Centel) with observer rights in connection with meetings of our Board of Directors. The shareholders agreement will terminate upon the earliest to occur of (i) a date when CVC International no longer holds a majority of our voting equity securities or (ii) a date when the Shaloms hold less than 15.0% of the aggregate voting power of all outstanding equity securities.
Policy Concerning Related Person Transactions
We have adopted a formal written policy concerning related person transactions. A related person transaction is a transaction, arrangement or relationship involving us or a consolidated subsidiary (whether or not we or the subsidiary is a direct party to the transaction), on the one hand, and (i) a director, nominee for director, executive officer or other employee of us or a consolidated subsidiary, his or her immediate family members or any entity, including not-for-profit and charitable organizations, that any of them controls or in which any of them has a substantial beneficial ownership interest; or (ii) any person who is the beneficial owner of more than 5.0% of our voting securities or a member of the immediate family of such person, if at the time of the transaction, arrangement or relationship such person was known to us to be such a beneficial owner.
According to this policy, the audit committee evaluates each related person transaction for the purpose of recommending to the disinterested members of the Board of Directors whether the related person transaction is fair, reasonable and within our Company’s policy, and should be ratified and approved by the Board of Directors. At least annually, management will provide the audit committee (or at any time that we do not have an audit committee, to all of the disinterested members of the Board of Directors) with information pertaining to related person transactions. Related person transactions entered into, but not approved or ratified as required by our policy concerning related party transactions, will be subject to termination by us or the relevant subsidiary, if so directed by the audit committee (so long as one exists) or the board, taking into account factors as such body deems appropriate and relevant.
CVC International Indemnity
Pursuant to the terms of the stock purchase agreement dated as of August 27, 2004, under which CVC International acquired its controlling interest in our Company, Anthony Shalom and Michael Shalom (the
101
Table of Contents
“Shaloms”) and certain other individuals (the “Pledging Noteholders”) (all of whom are affiliated with but not including Anthony Shalom and Michael Shalom) who sold shares to CVC International in connection with the CVC International acquisition of control of the Company in 2004, entered into an indemnity agreement dated as of June 29, 2007 (the “Indemnity Agreement”). Anthony Shalom and Michael Shalom indemnified CVC International for losses sustained or incurred by CVC International arising out of or relating to breaches of representations or warranties and covenants, such as those related to tax matters.
102
Table of Contents
The following table sets forth certain information regarding beneficial ownership of our common shares (i) as of December 31, 2009 and (ii) as adjusted to reflect the sale of the common shares offered in this offering and:
| • | assumes the underwriters do not exercise their option to purchase up to additional shares from us; |
| • | assumes the exchange by the holders of the 29,357 shares of Class B common stock, non-voting for 29,357 shares of our voting common stock; |
| • | reflects a for one split of our common stock prior to or simultaneously with the completion of this offering; |
| • | excludes 1,280 shares of common stock issuable upon exercise of outstanding stock options granted prior to this offering to certain of our officers and directors with a weighted average exercise price of $1,077 per share, 853 of which were vested as of December 31, 2009; The options were anti-dilutive as of December 31, 2009 as the fair value of the options was below exercise price of the options; and |
| • | excludes restricted stock grants of 306 shares of common stock granted to certain independent, non-employee directors. |
The table sets forth stockholder information with respect to:
| • | all persons known by us to be the beneficial owners of more than 5% of our common stock; |
| • | all named executive officers; |
| • | all directors; and |
| • | all directors and executive officers as a group; |
We have based our calculation of the percentage of the beneficial ownership on shares of common stock outstanding on December 31, 2009 and shares of common stock outstanding upon the closing of this offering.
CVC International, our controlling stockholder, is an affiliate of Citigroup Global Markets Inc., one of the underwriters.
Unless otherwise indicated, each person named or included in the following table has sole voting and investment power with respect to the common shares set forth opposite the stockholder’s name and no person has pledged as security any of our shares. Shares not outstanding but deemed beneficially owned by virtue of the individual’s right to acquire them as of December 31, 2009, or within 60 days of the date hereof, are treated as outstanding when determining the percent of the class owned by such individual and when determining the percent owned by the group. We have determined beneficial ownership in accordance with the rules of the SEC. Unless otherwise indicted in the table below, the address of each beneficial owner listed in the table below is c/o Intcomex, Inc., 3505 NW 107th Avenue, Miami, Florida 33178.
103
Table of Contents
| Beneficial Owner(1) |
Shares Beneficially Owned Before This Offering |
Percentage of Total Shares Owned Before This Offering |
Number of Shares Owned Before This Offering |
Shares Beneficially Owned After This Offering |
Percentage of Total Shares Owned After This Offering | ||||||
| Co-Investment LLC VII (Intcomex)(2) 399 Park Avenue, 14th Floor New York, NY 10022 |
66,519 | 51.5 | % | ||||||||
| Anthony Shalom(3) |
24,830 | 19.2 | % | ||||||||
| Michael Shalom(4) |
10,746 | 8.3 | % |
| (1) | The address of each beneficial owner is c/o Intcomex, Inc., 3505 NW 107th Avenue, Miami, Florida 33178, unless otherwise indicated. |
| (2) | Co-Investment LLC VII (Intcomex) is controlled by Citigroup Inc, a publicly-traded company that has securities listed on the New York Stock Exchange. Includes 13, 974 Class B common stock, non-voting held by CVCI Intcomex Bond Purchase LP, which are controlled by Citigroup Inc. |
| (3) | Held by Shalom Holdings 1 LLLP. Mr. Michael Shalom has sole voting control and investment discretion over the shares held by Shalom Holdings 1 LLLP. |
| (4) | Held by Shalom Holdings 3 LLLP. Mr. Michael Shalom has sole voting control and investment discretion over the shares held by Shalom Holdings 3 LLLP. |
104
Table of Contents
General
We were incorporated in Delaware in 2004. The following description summarizes our capital stock following the amendment of our organization documents in connection with this offering and does not purport to be complete and is subject to the provisions of the second amended and restated certificate of incorporation and bylaws, forms of which are filed as exhibits to the registration statement of which this prospectus is a part. The following descriptions are qualified in their entirety by reference to our second amended and restated certificate of incorporation and our bylaws and to applicable law.
Common Stock
Our authorized capital stock consists of 200,000 shares of common stock, with a par value of $0.01 per share. Our common stock is divided into two classes consisting of 140,000 shares of common stock and 60,000 shares of Class B common stock, non-voting. Assuming the underwriters do not exercise their over-allotment option, we will have shares of common stock outstanding after the consummation of this offering. Prior to this offering, there were 17 holders of our common stock.
Holders of common stock, except for holders of Class B stock, non-voting, are entitled to one vote for each share held on all matters submitted to a vote of stockholders and do not have cumulative voting rights. Accordingly, holders of a majority of the shares of common stock entitled to vote in any election of directors may elect all of the directors standing for election. Holders of common stock are entitled to receive proportionately any dividends as may be declared by our board of directors. Upon our liquidation, dissolution or winding up, the holders of common stock are entitled to receive proportionately our net assets available after the payment of all debts and other liabilities. Holders of common stock have no preemptive, subscription, redemption or conversion rights. Our outstanding shares of common stock are, and the shares offered by us in this offering will be, when issued and paid for, validly issued, fully paid and nonassessable. The rights, preferences and privileges of holders of common stock are subject to, and may be harmed by, the rights of the holders of shares of any series of preferred stock that we may designate and issue in the future.
Pursuant to the put right agreement dated June 23, 2005, among the Company and Centel’s pre-acquisition shareholders, the Company granted to such Centel’s pre-acquisition shareholders a right to put their Class B stock, non-voting to the Company at a price equal to the closing trading price of our shares on the date of delivery of the put notice following the termination of the shareholders agreement and the consummation of this offering. The put right terminates as to each of Centel’s pre-acquisition shareholders if all of such person’s non-voting equity securities in our company are exchanged for voting equity securities. In addition, we may elect, upon exercise of the put right, instead of acquiring the equity securities, to exchange all such non-voting equity securities for voting equity securities, and upon such exchange we shall no longer have an obligation to purchase the put equity securities.
Prior to the completion of this offering, we expect to exchange the shares of Class B common stock, non-voting held by Centel’s pre-acquisition shareholders for voting common stock.
Provisions in Our Charter and Bylaws
Certificate of Incorporation
Our second amended and restated certificate of incorporation provides that:
| • | our board of directors or a duly authorized committee thereof may resolve to increase or decrease from time to time the number of shares designated as voting common stock or Class B stock, non-voting; |
105
Table of Contents
| • | the certificate of incorporation may not be amended in a way that adversely alters the terms and conditions of the Class B stock, non-voting or that otherwise materially, adversely and disproportionately affects the holders of the Class B stock, non-voting without the consent of the holders of a majority of the issued and outstanding Class B stock, non-voting; |
| • | the numbers of our directors is fixed by, or in the manner provided in, our by-laws; |
| • | our board of directors has powers without the assent or vote of the stockholders to make, alter, amend, change, add to or repeal our by-laws (subject to any rights of the stockholders set forth in Section 109 of the General Corporation Law of the State of Delaware); to fix and vary the amount to be reserved for any proper purpose; to authorize and cause to be executed mortgages and liens upon all or any part of the property of our company; to determine the use and disposition of any surplus or net profits; and to fix the times for the declaration and payment of dividends; |
| • | our directors in their discretion may submit any act for approval or ratification at any stockholders’ meeting and, in case of a majority vote in favor of such act, it will be as valid and binding upon our company and all our stockholders as though it had been approved or ratified by every stockholder, whether or not the act would otherwise have been open to legal attack because of directors’ interest or for any other reason; and |
| • | our directors are empowered to exercise all such powers and do all such acts as may be exercised or done by our company (subject to the provisions of the statues of Delaware, of the restated certificate of incorporation and to our by-laws). |
Limitation of Liability and Indemnification of Officers and Directors. Our second amended and restated certificate of incorporation limits the liability of our officers and directors as well as former officers and directors to the maximum extent permitted by Delaware law.
According to the General Corporation Law of the State of Delaware, or DGCL, corporations can eliminate a director’s personal liability for monetary damages for breach of fiduciary duty as a director, except liability for:
| • | any breach of the director’s duty of loyalty to the corporation or its stockholders; |
| • | acts of omissions not in good faith or which involve intentional misconduct or a knowing violation of law; |
| • | unlawful payments of dividends or unlawful stock repurchases or redemptions; or |
| • | any transaction from which the director derived an improper personal benefit. |
Pursuant to the DGCL, a corporation can indemnify its directors, officers, employees and agents against expenses, judgments, fines, etc. actually and reasonably incurred by them in actions, suits or proceedings threatened, pending or completed against them because of them serving or having served the corporation in their respective capacity, provided that they acted in good faith and the reasonable belief of not opposing the best interests of the company. Further, with respect to criminal actions or proceedings, they must have had no reasonable cause to believe their conduct was unlawful.
The DGCL also provides that a corporation can indemnify its directors, officers, employees and agents against expenses actually and reasonably incurred in defending against actions or suits by or in the right of the corporation to procure a judgment in its favor by the reason of the fact that they are or were serving the company in their respective capacity, if they acted in good faith and the reasonable belief of not opposing the best interests of the company, except that they will generally not be indemnified in cases where they have been adjudged to be liable to the company.
Our amended and restated certificate of incorporation also permits us to secure insurance on behalf of any officer, director, employee or other agent for any liability arising out of his or her actions in such capacity.
106
Table of Contents
Bylaws
Our bylaws provide that, while annual stockholders meetings are to be held each May, or such other time as specified by the board of directors, special meetings of the stockholders may be held when directed by the board of directors, or when requested in writing by the holders of no less than 10% of all the shares of our voting common stock. A meeting requested by stockholders will be called for a date not less than 10 and no more than 60 days after the request is made, unless the stockholders requesting the meeting designate a later date. Written notice stating the place, day and hour of the meeting and the general nature of the business to be considered, will be delivered no less than 10 nor more than 60 days before the meeting. No business other than that stated in the notice will be transacted at any such meeting without the unanimous consent of all the stockholders entitled to vote thereat.
Generally, the presence of stockholders, in person or by proxy, holding a majority of our common stock entitled to vote will constitute a quorum at all meetings of the stockholders. Any action to be taken at any annual or special meeting of stockholders may be taken without a meeting, without prior notice and without a vote, if a consent in writing, setting forth the action so taken, will be signed by the holders of outstanding shares having not less than the minimum number of votes that would be necessary to authorize or take such action at a meeting at which all shares entitled to vote thereon were present and voted, as is provided by law. Prompt notice of the taking of the corporate action without a meeting by less than the unanimous written consent will be given to those stockholders who have not consented in writing.
Unless otherwise restricted by statute or our certificate of incorporation, any director or our entire board of directors may be removed, with or without cause, by the holders of a majority of the shares then entitled to vote at an election of directors; provided, however, that, so long as our shareholders are entitled to cumulative voting, if less than the entire board is to be removed, no director may be removed without cause if the votes cast against his or her removal would be sufficient to elect him or her if then cumulatively voted at an election of our entire board of directors. In order that our company may determine the stockholders entitled to notice or to vote at any meeting of stockholders, or to express consent to corporate action in writing without a meeting, or entitled to receive payment of any dividend or other distribution or allotment of any rights, or entitled to exercise any rights in respect of any change, conversion or exchange of stock or for the purpose of any other lawful action, the board of directors may fix, in advance, a record date, which will not be more than 60 nor less than 10 days before the date of such meeting, nor more than 60 days prior to any other action.
Our bylaws provide that stockholders seeking to bring business before an annual meeting of stockholders or to nominate candidates for election as directors at an annual meeting of stockholders, must provide timely notice to us in writing or by electronic transmission. To be timely, a stockholder’s notice must be received at our principal executive offices not less than 10 days nor more than 60 days prior to the annual meeting of stockholders.
Special meetings may be called for by Stockholders of at least 10% or more of the outstanding common stock. In the case of a special meeting of stockholders called for the purpose of electing directors, notice by the stockholders, in order to be timely, must be received:
| • | not earlier than 60 days prior to the special meeting, and |
| • | not later than 10 days prior to the special meeting or the close of business on the tenth day following the day on which public disclosure of the date of the special meeting was made. |
Our bylaws also specify requirements as to the form and content of a stockholder’s notice. These provisions may preclude stockholders from bringing matters before an annual or special meeting of stockholders or from making nominations for directors at an annual or special meeting of stockholders or from making nominations for directors at an annual or special meeting of stockholders.
107
Table of Contents
In addition, our bylaws permit our board of directors or the stockholders to amend or repeal our amended and restated bylaws by majority vote.
Transfer Agent and Registrar
The transfer agent and registrar for our common stock is .
Nasdaq Global Market Listing
We have applied to have our common stock listed on the Nasdaq Global Market under the symbol “ICMX.”
108
Table of Contents
DESCRIPTION OF CERTAIN INDEBTEDNESS
This summary highlights the principal terms of the agreements and instruments governing our outstanding indebtedness.
13 1/4% Second Priority Senior Secured Notes due 2014
On December 22, 2009, we completed our 13 1/4% Senior Notes Offering to eligible purchasers of $120.0 million aggregate principal amount. Our 13 1/4% Senior Notes are due December 15, 2014 and have an interest rate of 13.25% per year, payable semi-annually on June 15 and December 15 of each year, commencing on June 15, 2010. The 13 1/4% Senior Notes were offered at an initial offering price of 94.43% of par, or an effective yield to maturity of approximately 14.875%.
We used the net proceeds from the 13 1/4% Senior Notes Offering to, among other things, repay outstanding borrowings under our Senior Secured Revolving Credit Facility, fund the repurchase, redemption or other discharge of our 11 3/4% Senior Notes, for which we conducted a tender offer, and for general corporate purposes. The 13 1/4% Senior Notes are guaranteed by all of our existing and future domestic restricted subsidiaries that guarantee our obligations under our Senior Secured Revolving Credit Facility.
In connection with the 13 1/4% Senior Notes Offering, we and our Guarantors under the 11 3/4% Senior Notes Indenture entered into the 13 1/4% Senior Notes Indenture with the Trustee. Our obligations under the 13 1/4% Senior Notes and the Guarantors’ obligations under the guarantees are secured on a second priority basis by a lien on 100% of the capital stock of certain of our and each Guarantor’s directly owned domestic restricted subsidiaries; 65% of the capital stock of our and each Guarantor’s directly owned foreign restricted subsidiaries; and substantially all the assets of SBA, to the extent that those assets secure our new Senior Secured Revolving Credit Facility with Comerica Bank, subject to certain exceptions.
Subject to certain requirements, we are required to redeem $5.0 million aggregate principal amount of the 13 1/4% Senior Notes on December 15 of each of the years 2011 and 2012 and $10.0 million aggregate principal amount of the 13 1/4% Senior Notes on December 15, 2013 at a redemption price equal to 100% of the aggregate principal amount of the 13 1/4% Senior Notes to be redeemed, plus accrued and unpaid interest to the redemption date subject to certain requirements. We may redeem the 13 1/4% Senior Notes, in whole or in part, at any time prior to December 15, 2012 at a price equal to 100% of the aggregate principal amount of the 13 1/4% Senior Notes plus a “make-whole” premium. At any time prior to December 15, 2012, we may redeem up to 35% of the aggregate principal amount of the 13 1/4% Senior Notes with the net cash proceeds of certain equity offerings and up to 10% of the original aggregate principal amount of the 13 1/4% Senior Notes (no more than once in any 12-month period). We will be required to redeem up to 35% of the aggregate principal amount of the 13 1/4% Senior Notes if an initial public offering occurs on or prior to December 15, 2012 at a price equal to 113.25% of the principal amount of the 13 1/4% Senior Notes.
The indenture governing our 13 1/4% Senior Notes imposes operating and financial restrictions on us. These restrictive covenants limit our ability, among other things to (i) incur additional indebtedness or enter into sale and leaseback obligations; (ii) pay certain dividends or make certain distributions on our capital stock or repurchase our capital stock; (iii) make certain investments or other restricted payments; (iv) place restrictions on the ability of subsidiaries to pay dividends or make other payments to us; (v) engage in transactions with shareholders or affiliates; (vi) sell certain assets or merge with or into other companies; (vii) guarantee indebtedness; and (vii) create liens. We may only pay a dividend if we are in compliance with all covenants and restrictions in the 13 1/4% Senior Notes Indenture prior to and after payment of a dividend.
Also on December 22, 2009, in connection with the 13 1/4% Senior Notes Offering, certain of our existing shareholders and their affiliates contributed $20.0 million of new capital in exchange for 27,175 newly-issued
109
Table of Contents
shares of our Company’s Class B common shares, non-voting. The capital contribution consisted of the redemption and cancellation of $15.1 million face value of the 11 3/4% Senior Notes, $0.9 million of tender premium paid on the settlement of the 11 3/4% Senior Notes and additional cash of $4.0 million.
For the year ended December 31, 2009, we recorded additional paid in capital of $20.0 million related to our 13 1/4% Senior Notes and did not record any additional paid in capital for the year ended December 31, 2008. As of December 31, 2009, $113.3 million of our 13 1/4% Senior Notes remained outstanding and as of December 31, 2008, there were no 13 1/4% Senior Notes outstanding.
Registration Rights Agreement
Pursuant to a registration rights agreement executed as part of the 13 1/4% Senior Notes Offering, we have agreed (1) to use its commercially reasonable best efforts to consummate an exchange offer and (2) if required, to have a shelf registration statement declared effective with respect to resales of the 13 1/4% Senior Notes. If we fail to satisfy its obligations under the registration rights agreement, we will be required to pay additional interest to the holders of the 13 1/4 % Senior Notes under certain circumstances.
Senior Secured Revolving Credit Facility
On December 22, 2009, SBA, which is our only operating entity in the United States, closed a senior secured revolving credit facility (the “Senior Secured Revolving Credit Facility”) with Comerica Bank, to replace the existing revolving credit facility with a new three-year facility. The aggregate size of the facility is $20.0 million (with a possible increase of an additional $10.0 million) and it matures in January 2013.
Under the Senior Secured Revolving Credit Facility, at SBA’s option, amounts due under the Senior Secured Revolving Credit Facility credit facility will bear interest at the daily adjustable LIBOR rate (at no time less than 2.0%) plus 3.5%. In addition, SBA will pay an administrative fee of $30,000 per annum and a facility fee equal to 0.50% of the aggregate amount of the revolving credit commitment, payable quarterly in arrears. Additional customary fees will be payable upon the issuance of letters of credit. Upon the occurrence of any event of default under the Senior Secured Revolving Credit Facility, interest will accrue at a rate equal to 3.0% per annum above the otherwise applicable rate. The revolving credit facility may be utilized to fund our working capital requirements. As of December 31, 2009, $9.2 million was outstanding under the Senior Secured Revolving Credit Facility.
The Senior Secured Revolving Credit Facility contains a number of covenants that, among other things, restrict SBA’s ability to (i) incur additional indebtedness; (ii) make certain capital expenditures; (iii) guarantee certain obligations; (iv) create or allow liens on certain assets; (v) make investments, loans or advances; (vi) pay dividends, make distributions or undertake stock and other equity interest buybacks; (vii) make certain acquisitions; (viii) engage in mergers, consolidations or sales of assets; (ix) use the proceeds of the revolving credit facility for certain purposes; (x) enter into transactions with affiliates in non-arms’ length transactions; (xi) make certain payments on subordinated indebtedness; and (xii) acquire or sell subsidiaries. The Senior Secured Revolving Credit Facility also requires SBA to maintain certain ratios of debt, income, net worth and other restrictive financial covenants.
Borrowings under the new Senior Secured Revolving Credit Facility are secured on a first priority basis with all the assets of SBA. Amounts borrowed under the facility could be repaid and re-borrowed at any time during the term of the facility. Borrowing capacity is established monthly based on certain parameters established under the facility. Advances under the facility were provided based on 85.0% of eligible domestic and foreign accounts receivable plus 60.0% of eligible domestic inventory, less any credit facility reserves. The credit facility contained certain financial and non-financial covenants, including but not limited to, maintenance of a minimum level of tangible effective net worth, as defined and annual limitations on capital expenditures.
110
Table of Contents
The Senior Secured Revolving Credit Facility financial covenants require the following of SBA and the Company:
| • | maintain a consolidated total leverage ratio of not greater than 5.50 to 1.00 commencing with the quarter ending March 31, 2010 and each quarter thereafter with the quarter ending December 31, 2010, 5.00 to 1.00 for the quarters ending March 31, 2011 and June 30, 2011, 4.50 to 1.00 for the quarters ending September 30, 2011 and December 31, 2011, 4.00 to 1.00 for the quarters ending March 31, 2011 and each quarter ending thereafter; |
| • | maintain a consolidated fixed charge coverage ratio of not less than 1.00 to 1.00 commencing March 31, 2010, on a year-to-date basis through December 31, 2010, and on a rolling four-quarter basis thereafter; and |
| • | maintain consolidated net income of not less than $0 commencing with the quarter ending December 31, 2009, not less than ($500,000) for the quarter ending March 31, 2010, $0 for each of the quarters ended March 31, 2010 and each quarter thereafter with the quarter ending December 31, 2010, not less than ($500,000) for the quarter ending March 31, 2011, $0 for each of the quarters ended March 31, 2011 and each quarter thereafter with the quarter ending December 31, 2011, not less than ($500,000 for the quarter ending March 31, 2012, $0 for each of the quarters ended March 31, 2012 and each quarter thereafter. |
Our and SBA’s failure to comply with the restrictive covenants could result in an event of default, which, if not cured or waived, could result in either of us having to repay our respective borrowings before their respective due dates. If we or SBA is forced to refinance these borrowings on less favorable terms, our results of operations or financial condition could be harmed. In addition, if we are in default under any of our existing or future debt facilities, we also will not be able to borrow additional amounts under those facilities to the extent they would otherwise be available and may not be able to repay our existing indebtedness.
In-country Credit Facilities
Some of our In-country Operations have outstanding credit facilities, which we use primarily to finance working capital needs. See “Management’s Discussion and Analysis of Financial Condition and Results of Operations—Liquidity and Capital Resources.”
111
Table of Contents
CERTAIN UNITED STATES TAX CONSEQUENCES TO NON-UNITED STATES HOLDERS OF COMMON STOCK
The following is a general discussion of certain United States federal income and estate tax consequences of the purchase, ownership and disposition of our common stock as of the date of this prospectus. Except where noted, this summary deals only with common stock that is held as a capital asset by a non-U.S. holder. A “non-U.S. holder” means a person (other than a partnership) that is not for United States federal income tax purposes any of the following:
| • | an individual citizen or resident of the United States including an alien individual who is a lawful permanent resident of the United States or meets the “substantial presence” test under Section 7701(b) of the Code; |
| • | a corporation (or any other entity treated as a corporation for United States federal income tax purposes) created or organized in or under the laws of the United States, any state thereof or the District of Columbia; |
| • | an estate the income of which is subject to United States federal income taxation regardless of its source; or |
| • | a trust if it (1) is subject to the primary supervision of a court within the United States and one or more United States persons have the authority to control all substantial decisions of the trust or (2) has a valid election in effect under applicable United States Treasury regulations to be treated as a United States person. |
This summary is based upon provisions of the Internal Revenue Code of 1986, as amended (the “Code”), and regulations, rulings and judicial decisions as of the date hereof. Those authorities may be changed, perhaps retroactively, so as to result in United States federal income and estate tax consequences different from those summarized below. This summary does not address all aspects of United States federal income and estate taxes and does not deal with foreign, state, local or other tax considerations that may be relevant to non-U.S. holders in light of their particular circumstances. In addition, it does not represent a detailed description of the United States federal income and estate tax consequences applicable to you if you are subject to special treatment under the United States federal income tax laws (including if you are a United States expatriate, “controlled foreign corporation,” “passive foreign investment company,” or corporation that accumulates earnings to avoid United States federal income tax). A change in law may alter significantly the tax considerations that we describe in this summary.
If a partnership holds our common stock, the tax treatment of a partner will generally depend upon the status of the partner and the activities of the partnership. If you are a partner of a partnership holding our common stock, you should consult your tax advisors.
If you are considering the purchase of our common stock, we recommend that you consult your own tax advisors concerning the particular United States federal income and estate tax consequences to you of the ownership and disposition of the common stock, as well as the consequences to you arising under the laws of any other taxing jurisdiction.
Dividends
In the event that we pay dividends, dividends paid to a non-U.S. holder of our common stock generally will be subject to withholding of United States federal income tax at a 30% rate or such lower rate as may be specified by an applicable income tax treaty. However, dividends that are effectively connected with the conduct of a trade or business by the non-U.S. holder within the United States (and, where a tax treaty applies, are attributable to a United States permanent establishment of the non-U.S. holder) are not subject to the withholding tax, provided certain certification and disclosure requirements are satisfied. Instead, such dividends are subject to
112
Table of Contents
United States federal income tax on a net income basis in the same manner as if the non-U.S. holder were a United States person as defined under the Code. A foreign corporation receiving any such effectively connected dividends may be subject to an additional “branch profits tax” imposed at a 30% rate or such lower rate as may be specified by an applicable income tax treaty.
A non-U.S. holder of our common stock that wishes to claim the benefit of an applicable treaty rate and avoid backup withholding, as discussed below, for dividends will be required to (a) complete Internal Revenue Service Form W-8BEN (or other applicable form) and certify under penalty of perjury that such holder is not a United States person as defined under the Code or (b) if our common stock is held through certain foreign intermediaries, satisfy the relevant certification requirements of applicable United States Treasury regulations. Special certification and other requirements apply to certain non-U.S. holders that are entities rather than individuals.
A non-U.S. holder of our common stock eligible for a reduced rate of United States withholding tax pursuant to an income tax treaty may obtain a refund of any excess amounts withheld by filing an appropriate claim for refund with the Internal Revenue Service.
Gain on Sale or Other Disposition of Common Stock
Any gain realized on the disposition of our common stock generally will not be subject to United States federal income tax unless:
| • | the gain is effectively connected with a trade or business of the non-U.S. holder in the United States, and, if required by an applicable income tax treaty, is attributable to a United States permanent establishment of the non-U.S. holder; or |
| • | the non-U.S. holder is an individual who is present in the United States for 183 days or more in the taxable year of disposition and certain other conditions are met. |
An individual non-U.S. holder described in the first bullet point immediately above will be subject to tax on the net gain derived from the sale under regular graduated United States federal income tax rates. An individual non-U.S. holder described in the second bullet point immediately above will be subject to a flat 30% tax on the gain derived from the sale, which may be offset by United States source capital losses, even though the individual is not considered a resident of the United States. If a non-U.S. holder that is a foreign corporation falls under the first bullet point immediately above, it generally will be subject to tax on its net gain in the same manner as if it were a United States person as defined under the Code and, in addition, may be subject to the branch profits tax imposed at a rate of 30% or at such lower rate as may be specified by an applicable income tax treaty.
Federal Estate Tax
Common stock held by an individual non-U.S. holder at the time of death and common stock held by entities the property of which is potentially includible in such an individual’s gross estate for U.S. federal estate tax purposes will be included in such holder’s gross estate for United States federal estate tax purposes, unless an applicable estate tax treaty provides otherwise.
Backup Withholding, Information Reporting and Other Reporting Requirements
We must report annually to the Internal Revenue Service and to each non-U.S. holder the amount of dividends paid to such holder and the tax withheld with respect to such dividends, regardless of whether withholding was required. Copies of the information returns reporting such dividends and withholding may also be made available to the tax authorities in the country in which the non-U.S. holder resides under the provisions of an applicable income tax treaty.
113
Table of Contents
A non-U.S. holder will be subject to backup withholding for dividends paid to such holder unless such holder certifies under penalty of perjury that it is a non-U.S. holder, and the payor does not have actual knowledge or reason to know that such holder is a United States person as defined under the Code, or such holder otherwise establishes an exemption.
Information reporting and, depending on the circumstances, backup withholding will apply to the proceeds of a sale of our common stock within the United States or conducted through certain United States-related financial intermediaries, unless the beneficial owner certifies under penalty of perjury that it is a non-U.S. holder (and the payor does not have actual knowledge or reason to know that the beneficial owner is a United States person as defined under the Code) or such owner otherwise establishes an exemption.
Any amounts withheld under the backup withholding rules may be allowed as a refund or a credit against a non-U.S. holder’s United States federal income tax liability provided the required information is furnished to the Internal Revenue Service.
Recent Legislative Developments Potentially Affecting Taxation of Notes Held By or Through Foreign Entities
Proposed legislation recently introduced in the United States Congress would generally impose a withholding tax of 30 percent on dividends paid on the common stock and the gross proceeds of a disposition of the common stock paid to a foreign financial institution, unless such institution enters into an agreement with the U.S. government to collect and provide to the U.S. tax authorities substantial information regarding U.S. account holders of such institution (which would include certain equity and debt holders of such institution, as well as certain account holders that are foreign entities with U.S. owners). The proposed legislation would also generally impose a withholding tax of 30 percent on dividends paid on the common stock and the gross proceeds of a disposition of the common stock paid to a non-financial foreign entity unless such entity provides the withholding agent with a certification identifying the direct and indirect U.S. owners of the entity. Under certain circumstances, a non-U.S. Holder of the common stock might be eligible for refunds or credits of such taxes. Investors are encouraged to consult with their own tax advisors regarding the possible implications of this proposed legislation on their investment in the common stock.
114
Table of Contents
SHARES ELIGIBLE FOR FUTURE SALE
Prior to this offering, there has been no public market for our common stock. Future sales of substantial amounts of our common stock in the public market following this offering or the possibility of these sales occurring could adversely affect prevailing market prices for our common stock or could impair our future ability to raise capital through an offering of equity securities.
Upon the consummation of this offering, we expect that shares of our common stock will be outstanding, assuming no exercise of outstanding options, and shares if the underwriters’ over-allotment option is exercised in full. All of the shares sold in this offering will be freely tradable without restriction or further registration under the Securities Act, except for any shares purchased by our affiliates, as that term is defined in Rule 144 under the Securities Act.
The shares outstanding prior to the offering are restricted shares. Restricted shares may be sold in the public market only if they are registered under the Securities Act or if they are sold pursuant to an exemption from registration, such as the exemptions provided by Rule 144 or 701 promulgated under the Securities Act.
After the expiration of the lock-up agreements described below under “Lock-up Agreements,” shares of our common stock, subject to the lock-up agreements, will be freely transferable subject to the applicable volume, manner of sale, holding period and other limitations of Rule 144 or under other exemptions from registration.
Following the completion of this offering, we intend to file a registration statement on Form S-8 to provide for immediate resale, subject to the lock-up agreements, of shares of common stock issued upon the exercise of options granted under our founders’ grant plan and to be granted in the future.
Lock-up Agreements
Our officers, directors and our other existing stockholders and option holders, who will, after the offering, collectively hold an aggregate of shares, will enter into lock-up agreements with the underwriters in connection with this offering. These lock-up agreements will provide that, with limited exceptions, for a period of 180 days from the date of this prospectus, each will not, without the prior written consent of Citi and UBS, dispose of or pledge any shares of our common stock or any securities convertible into or exchangeable for our common stock. Citi and UBS, in their sole discretion, may release any of the securities subject to these lock-up agreements at any time without notice.
Rule 144
In general, under Rule 144, beginning 90 days after the date of this prospectus, a person who is not our affiliate, has not been our affiliate for the previous three months, and who has beneficially owned shares of our common stock for at least six months may sell all such shares. An affiliate or a person who has been our affiliate within the previous 90 days, and who has beneficially owned shares of our common stock for at least six months, may sell within any three-month period a number of shares that does not exceed the greater of:
| • | one percent of the number of shares of common stock then outstanding, which will equal approximately shares immediately after this offering; and |
| • | the average weekly trading volume of the common stock on the Nasdaq Global Market during the four calendar weeks preceding the filing of a notice on Form 144 with respect to the sale. |
All sales under Rule 144 are subject to the availability of current public information about us. Sales under Rule 144 by affiliates or persons who have been affiliates within the previous 90 days are also subject to manner of sale provisions and notice requirements. Upon completion of the 180-day lock-up period approximately shares of our outstanding restricted securities will be eligible for sale under Rule 144.
115
Table of Contents
Rule 701
In general, under Rule 701 of the Securities Act, any of our employees, consultants or advisors who purchase shares from us in connection with a qualified compensatory stock plan or other written agreement is eligible to resell those shares 90 days after the effective date of this offering in reliance on Rule 144, but without compliance with the holding period contained in Rule 144, and, in the case of non-affiliates, without the availability of current public information.
Option Grants
A maximum of 1,700 shares of Class B common stock, non-voting may be issued under the 2007 Founders’ Option Plan, and subject to certain capital adjustment provisions, a maximum of 250 shares of common stock, subject to options, may be granted to management employees and independent, non-employee directors in a single calendar year. As of December 31, 2009, 1,540 stock options were issued, of which 1,280 were outstanding and 160 may be issued under the 2007 Founders’ Option Plan. As of December 31, 2008, 1,540 stock options were issued, of which 1,490 were outstanding and 160 may be issued under the 2007 Founders’ Option Plan. Upon exercise of the outstanding stock options granted under the 2007 Founders’ Option Plan, an aggregate of 1,280 shares of Class B common stock, non-voting are issuable with a weighted average exercise price of $1,077 per share.
116
Table of Contents
Citigroup Global Markets Inc. (“Citi”) and UBS Securities LLC (“UBS”) are acting as joint bookrunning managers of the offering and representatives of the underwriters named below. Subject to the terms and conditions stated in the underwriting agreement dated the date of this prospectus, each underwriter named below has severally agreed to purchase, and we have agreed to sell to that underwriter, the number of shares set forth opposite the underwriter’s name.
| Underwriter |
Number of shares | |
| Citigroup Global Markets Inc. |
||
| UBS Securities LLC |
||
| Thomas Weisel Partners LLC |
||
| Raymond James & Associates Inc. |
||
| Total |
||
The underwriting agreement provides that the obligations of the underwriters to purchase the shares included in this offering are subject to approval of legal matters by counsel and to other conditions. The underwriters are obligated to purchase all the shares (other than those covered by the over-allotment option described below) if they purchase any of the shares.
Shares sold by the underwriters to the public will initially be offered at the initial public offering price set forth on the cover of this prospectus. Any shares sold by the underwriters to securities dealers may be sold at a discount from the initial public offering price not to exceed $ per share. If all the shares are not sold at the initial offering price, the underwriters may change the offering price and the other selling terms.
If the underwriters sell more shares than the total number set forth in the table above, we have granted to the underwriters an option, exercisable for 30 days from the date of this prospectus, to purchase up to additional shares at the public offering price less the underwriting discount. The underwriters may exercise the option solely for the purpose of covering over-allotments, if any, in connection with this offering. To the extent the option is exercised, each underwriter must purchase a number of additional shares approximately proportionate to that underwriter’s initial purchase commitment. Any shares issued or sold under the option will be issued and sold on the same terms and conditions as the other shares that are the subject of this offering.
We, our officers and directors have agreed that, for a period of 180 days from the date of this prospectus, we and they will not, without the prior written consent of Citi and UBS, dispose of or hedge any shares or any securities convertible into or exchangeable for our common stock. Citi and UBS in their sole discretion may release any of the securities subject to these lock-up agreements at any time without notice. Notwithstanding the foregoing, if (i) during the last 17 days of the 180-day restricted period, we issue an earnings release or material news or a material event relating to our company occurs; or (ii) prior to the expiration of the 180-day restricted period, we announce that we will release earnings results during the 16-day period beginning on the last day of the 180-day restricted period, the restrictions described above shall continue to apply until the expiration of the 18-day period beginning on the issuance of the earnings release or the occurrence of the material news or material event.
At our request, the underwriters have reserved up to % of the shares for sale at the initial public offering price to persons who are directors, officers or employees, or who are otherwise associated with us through a directed share program. The number of shares available for sale to the general public will be reduced by the number of directed shares purchased by participants in the program. Except for certain of our officers and directors who have entered into lock-up agreements as contemplated in the immediately preceding paragraph,
117
Table of Contents
each person buying shares through the directed share program has agreed that, for a period of 25 days from the date of this prospectus, he or she will not, without the prior written consent of Citi and UBS, dispose of or hedge any shares or any securities convertible into or exchangeable for our common stock with respect to shares purchased in the program. For certain officers and directors purchasing shares through the directed share program, the lock-up agreements contemplated in the immediately preceding paragraph shall govern with respect to their purchases. Citi and UBS in their sole discretion may release any of the securities subject to these lock-up agreements at any time without notice. Any directed shares not purchased will be offered by the underwriters to the general public on the same basis as all other shares offered. We have agreed to indemnify the underwriters against certain liabilities and expenses, including liabilities under the Securities Act, in connection with the sales of the directed shares.
Prior to this offering, there has been no public market for our shares. Consequently, the initial public offering price for the shares was determined by negotiations among us and the representatives. Among the factors considered in determining the initial public offering price were our results of operations, our current financial condition, our future prospects, our markets, the economic conditions in and future prospects for the industry in which we compete, our management, and currently prevailing general conditions in the equity securities markets, including current market valuations of publicly traded companies considered comparable to our company. We cannot assure you, however, that the price at which the shares will sell in the public market after this offering will not be lower than the initial public offering price or that an active trading market in our shares will develop and continue after this offering.
We have applied to have our shares listed on the Nasdaq Global Market under the symbol “ICMX.”
The following table shows the underwriting discounts and commissions that we are to pay to the underwriters in connection with this offering. These amounts are shown assuming both no exercise and full exercise of the underwriters’ over-allotment option.
| Paid by Intcomex | ||||||
| No Exercise | Full Exercise | |||||
| Per share |
$ | $ | ||||
| Total |
$ | $ | ||||
In connection with the offering, UBS, on behalf of the underwriters, may purchase and sell shares in the open market. Purchases and sales in the open market may include short sales, purchases to cover short positions, which may include purchases pursuant to the over-allotment option, and stabilizing purchases.
| • | Short sales involve secondary market sales by the underwriters of a greater number of shares than they are required to purchase in the offering. |
| • | “Covered” short sales are sales of shares in an amount up to the number of shares represented by the underwriters’ over-allotment option. |
| • | “Naked” short sales are sales of shares in an amount in excess of the number of shares represented by the underwriters’ over-allotment option. |
| • | Covering transactions involve purchases of shares either pursuant to the over-allotment option or in the open market after the distribution has been completed in order to cover short positions. |
| • | To close a naked short position, the underwriters must purchase shares in the open market after the distribution has been completed. A naked short position is more likely to be created if the underwriters are concerned that there may be downward pressure on the price of the shares in the open market after pricing that could adversely affect investors who purchase in the offering. |
| • | To close a covered short position, the underwriters must purchase shares in the open market after the distribution has been completed or must exercise the over-allotment option. In determining the |
118
Table of Contents
| source of shares to close the covered short position, the underwriters will consider, among other things, the price of shares available for purchase in the open market as compared to the price at which they may purchase shares through the over-allotment option. |
| • | Stabilizing transactions involve bids to purchase shares so long as the stabilizing bids do not exceed a specified maximum. |
Purchases to cover short positions and stabilizing purchases, as well as other purchases by the underwriters for their own accounts, may have the effect of preventing or retarding a decline in the market price of the shares. They may also cause the price of the shares to be higher than the price that would otherwise exist in the open market in the absence of these transactions. UBS may conduct these transactions on the Nasdaq Global Market, in the over-the-counter market or otherwise. If UBS commences any of these transactions, it may discontinue them at any time.
Certain of the underwriters have performed commercial banking, investment banking and advisory services for us from time to time for which they have received customary fees and reimbursement of expenses. The underwriters may, from time to time, engage in transactions with and perform services for us in the ordinary course of their business for which they may receive customary fees and reimbursement of expenses.
We have agreed to indemnify the underwriters against certain liabilities, including liabilities under the Securities Act, or to contribute to payments the underwriters may be required to make because of any of those liabilities.
Conflict of Interest
Prior to the completion of this offering, CVC International, an affiliate of Citi, owned more than 10% of
our outstanding common stock and therefore Citi is presumed to have a “conflict of interest” with us under FINRA Rule 5110. Accordingly, Citi’s interest may go beyond receiving customary underwriting discounts and commissions. In particular, there may be a conflict of interest between Citi’s own interests as underwriter (including in negotiating the initial public offering price) and the interests of its affiliate CVC International (as a principal shareholder). Because of the conflict of interest under FINRA Rule 5110, this offering is being conducted in accordance with the applicable provisions of that rule and Rule 2720. FINRA Rule 5110 and Rule 2720 require that the initial public offering price of the common stock be no higher than that recommended by a “qualified independent underwriter” (as such term is defined by FINRA Rule 5110), that also participates in the preparation of the registration statement and prospectus and conducts due diligence. Accordingly, UBS is assuming the responsibilities of acting as the qualified independent underwriter in this offering. The initial public offering price of the common stock will be no higher than the price recommended by UBS. Although the qualified independent underwriter has participated in the preparation of the registration statement and prospectus, conducted due diligence and made a recommendation with respect to the initial offering price, we cannot assure you that this will adequately address any potential conflicts of interest related to Citi and CVC International. We have agreed to indemnify UBS for acting as qualified independent underwriter against certain liabilities, including liabilities under the Securities Act, and to contribute to payments that UBS may be required to make for these liabilities.
Notice to Prospective Investors in the European Economic Area
In relation to each member state of the European Economic Area that has implemented the Prospectus Directive (each, a relevant member state), with effect from and including the date on which the Prospectus Directive is implemented in that relevant member state (the relevant implementation date), an offer of shares described in this prospectus may not be made to the public in that relevant member state prior to the publication of a prospectus in relation to the shares that has been approved by the competent authority in that relevant member state or, where appropriate, approved in another relevant member state and notified to the competent authority in that relevant member state, all in accordance with the Prospectus Directive, except that, with effect from and including the relevant implementation date, an offer of securities may be offered to the public in that relevant member state at any time:
| • | to any legal entity that is authorized or regulated to operate in the financial markets or, if not so authorized or regulated, whose corporate purpose is solely to invest in securities; |
119
Table of Contents
| • | to any legal entity that has two or more of (1) an average of at least 250 employees during the last financial year; (2) a total balance sheet of more than €43,000,000 and (3) an annual net turnover of more than €50,000,000, as shown in its last annual or consolidated accounts; |
| • | to fewer than 100 natural or legal persons (other than qualified investors as defined below) subject to obtaining the prior consent of the representatives for any such offer; or |
| • | in any other circumstances that do not require the publication of a prospectus pursuant to Article 3 of the Prospectus Directive. |
Each purchaser of shares described in this prospectus located within a relevant member state will be deemed to have represented, acknowledged and agreed that it is a “qualified investor” within the meaning of Article 2(1)(e) of the Prospectus Directive.
For purposes of this provision, the expression an “offer to the public” in any relevant member state means the communication in any form and by any means of sufficient information on the terms of the offer and the securities to be offered so as to enable an investor to decide to purchase or subscribe the securities, as the expression may be varied in that member state by any measure implementing the Prospectus Directive in that member state, and the expression “Prospectus Directive” means Directive 2003/71/EC and includes any relevant implementing measure in each relevant member state.
The sellers of the shares have not authorized and do not authorize the making of any offer of shares through any financial intermediary on their behalf, other than offers made by the underwriters with a view to the final placement of the shares as contemplated in this prospectus. Accordingly, no purchaser of the shares, other than the underwriters, is authorized to make any further offer of the shares on behalf of the sellers or the underwriters.
Notice to Prospective Investors in the United Kingdom
This prospectus is only being distributed to, and is only directed at, persons in the United Kingdom that are qualified investors within the meaning of Article 2(1)(e) of the Prospectus Directive that are also (i) investment professionals falling within Article 19(5) of the Financial Services and Markets Act 2000 (Financial Promotion) Order 2005 (the “Order”) or (ii) high net worth entities, and other persons to whom it may lawfully be communicated, falling within Article 49(2)(a) to (d) of the Order (each such person being referred to as a “relevant person”). This prospectus and its contents are confidential and should not be distributed, published or reproduced (in whole or in part) or disclosed by recipients to any other persons in the United Kingdom. Any person in the United Kingdom that is not a relevant person should not act or rely on this document or any of its contents.
Notice to Prospective Investors in France
Neither this prospectus nor any other offering material relating to the shares described in this prospectus has been submitted to the clearance procedures of the Autorité des Marchés Financiers or of the competent authority of another member state of the European Economic Area and notified to the Autorité des Marchés Financiers. The shares have not been offered or sold and will not be offered or sold, directly or indirectly, to the public in France. Neither this prospectus nor any other offering material relating to the shares has been or will be:
| • | released, issued, distributed or caused to be released, issued or distributed to the public in France; or |
| • | used in connection with any offer for subscription or sale of the shares to the public in France. |
Such offers, sales and distributions will be made in France only:
| • | to qualified investors (investisseurs qualifiés) and/or to a restricted circle of investors (cercle restreint d’investisseurs), in each case investing for their own account, all as defined in, and in accordance with articles L.411-2, D.411-1, D.411-2, D.734-1, D.744-1, D.754-1 and D.764-1 of the French Code monétaire et financier; |
120
Table of Contents
| • | to investment services providers authorized to engage in portfolio management on behalf of third parties; or |
| • | in a transaction that, in accordance with article L.411-2-II-1°-or-2°-or 3° of the French Code monétaire et financier and article 211-2 of the General Regulations (Règlement Général) of the Autorité des Marchés Financiers, does not constitute a public offer (appel public à l’épargne). |
The shares may be resold directly or indirectly, only in compliance with articles L.411-1, L.411-2, L.412-1 and L.621-8 through L.621-8-3 of the French Code monétaire et financier.
Notice to Prospective Investors in Hong Kong
The shares may not be offered or sold in Hong Kong by means of any document other than (i) in circumstances which do not constitute an offer to the public within the meaning of the Companies Ordinance (Cap. 32, Laws of Hong Kong), or (ii) to “professional investors” within the meaning of the Securities and Futures Ordinance (Cap. 571, Laws of Hong Kong) and any rules made thereunder, or (iii) in other circumstances which do not result in the document being a “prospectus” within the meaning of the Companies Ordinance (Cap. 32, Laws of Hong Kong) and no advertisement, invitation or document relating to the shares may be issued or may be in the possession of any person for the purpose of issue (in each case whether in Hong Kong or elsewhere), which is directed at, or the contents of which are likely to be accessed or read by, the public in Hong Kong (except if permitted to do so under the laws of Hong Kong) other than with respect to shares which are or are intended to be disposed of only to persons outside Hong Kong or only to “professional investors” within the meaning of the Securities and Futures Ordinance (Cap. 571, Laws of Hong Kong) and any rules made thereunder.
Notice to Prospective Investors in Japan
The shares offered in this prospectus have not been registered under the Securities and Exchange Law of Japan. The shares have not been offered or sold and will not be offered or sold, directly or indirectly, in Japan or to or for the account of any resident of Japan, except (i) pursuant to an exemption from the registration requirements of the Securities and Exchange Law and (ii) in compliance with any other applicable requirements of Japanese law.
Notice to Prospective Investors in Singapore
This prospectus has not been registered as a prospectus with the Monetary Authority of Singapore. Accordingly, this prospectus and any other document or material in connection with the offer or sale, or invitation for subscription or purchase, of the shares may not be circulated or distributed, nor may the shares be offered or sold, or be made the subject of an invitation for subscription or purchase, whether directly or indirectly, to persons in Singapore other than (i) to an institutional investor under Section 274 of the Securities and Futures Act, Chapter 289 of Singapore (the “SFA”), (ii) to a relevant person pursuant to Section 275(1), or any person pursuant to Section 275(1A), and in accordance with the conditions specified in Section 275 of the SFA or (iii) otherwise pursuant to, and in accordance with the conditions of, any other applicable provision of the SFA, in each case subject to compliance with conditions set forth in the SFA.
Where the shares are subscribed or purchased under Section 275 of the SFA by a relevant person which is:
| • | a corporation (which is not an accredited investor (as defined in Section 4A of the SFA)) the sole business of which is to hold investments and the entire share capital of which is owned by one or more individuals, each of whom is an accredited investor; or |
| • | a trust (where the trustee is not an accredited investor) whose sole purpose is to hold investments and each beneficiary of the trust is an individual who is an accredited investor, |
121
Table of Contents
shares, debentures and units of shares and debentures of that corporation or the beneficiaries’ rights and interest (howsoever described) in that trust shall not be transferred within six months after that corporation or that trust has acquired the shares pursuant to an offer made under Section 275 of the SFA except:
| • | to an institutional investor (for corporations, under Section 274 of the SFA) or to a relevant person defined in Section 275(2) of the SFA, or to any person pursuant to an offer that is made on terms that such shares, debentures and units of shares and debentures of that corporation or such rights and interest in that trust are acquired at a consideration of not less than S$200,000 (or its equivalent in a foreign currency) for each transaction, whether such amount is to be paid for in cash or by exchange of securities or other assets, and further for corporations, in accordance with the conditions specified in Section 275 of the SFA; |
| • | where no consideration is or will be given for the transfer; or |
| • | where the transfer is by operation of law. |
122
Table of Contents
The validity of the common stock offered hereby will be passed upon for us by Cleary Gottlieb Steen & Hamilton LLP, New York, New York. Weil, Gotshal & Manges LLP, advised the underwriters in connection with the offering of the common stock.
The consolidated financial statements of Intcomex Inc. and subsidiaries as of December 31, 2009 and 2008 and for each of the years in the three-year period ended December 31, 2009 included in this prospectus and in the registration statement have been audited by BDO Seidman, LLP, an independent registered public accounting firm, to the extent and for the periods set forth in their report appearing elsewhere herein and in the registration statement, and are included in reliance upon such report given upon the authority of said firm as experts in auditing and accounting.
The audited financial statements of Centel, S.A. de C.V. as of December 31, 2007 and for the period ended December 31, 2007, not included in this Registration Statement, have been audited by PricewaterhouseCoopers, S.C. whose report thereon appears herein. Such financial statements, to the extent they have been included in the financial statements of Intcomex, Inc., have been so included in reliance on the report of such independent registered public accounting firm given on the authority of said firm as experts in auditing and accounting.
In this prospectus we rely on and refer to information and statistics regarding the IT products distribution industry, related industries and our market share or market share position in the sectors and countries in which we compete. Where possible, we obtained this information and statistics from third-party sources, such as IDC, a market intelligence and advisory firm in the IT and telecommunications industries; Pyramid Research, a market intelligence and consulting services firm in the global communications industry; Gartner, Inc., a provider of research and analysis on the global IT industry; the Global Insight, Inc., a provider of economic, financial and political analysis of various countries, regions and industries; and Euromonitor International Inc., a provider of business intelligence on industries, countries and consumers. Based on our familiarity with the market, we believe that estimates by these third party sources are reliable, but we have not independently verified the third-party information. Additionally, we have supplemented third-party information where necessary with management estimates based on information from our customers and vendors, trade and business organizations, industry publications, government records, and other contacts in markets in which we operate, our management’s knowledge and experience in the industry and the markets in which we operate, and information made publicly available by our public company competitors. Although we believe that our management estimates are reasonable, there is no information from third-party sources available to us that would confirm our management estimates.
The Gartner Report(s) described in this prospectus (the “Gartner Report(s)”) represent(s) data, research opinion or viewpoints published, as part of a syndicated subscription service, by Gartner, Inc. (“Gartner”), and are not representations of fact. Each Gartner Report speaks as of its original publication date (and not as of the date of this prospectus) and the opinions expressed in the Gartner Report(s) are subject to change without notice.
USE OF TRADEMARKS AND TRADE NAMES
We have registered a number of trademarks, such as “Intcomex,” “Blue Code,” “CENTEL,” “FORZA,” “Hurricane,” “KLIP XTREME,” “KLIP” and “NEXXT Solutions” in the United States and/or in various Latin American and Caribbean jurisdictions. This prospectus also contains trademarks and trade names of other companies. All trademarks and trade names appearing in this prospectus are the property of their respective holders.
WHERE YOU CAN FIND MORE INFORMATION
We have filed with the SEC a registration statement on Form S-1 under the Securities Act with respect to the common stock offered hereby. This prospectus does not contain all of the information set forth in the registration statement and the exhibits and schedules thereto. For further information with respect to us and the common stock offered hereby, you should refer to the registration statement and to the exhibits and schedules
123
Table of Contents
filed therewith. Statements contained in this prospectus regarding the contents of any contract or any other document that is filed as an exhibit to the registration statement are not necessarily complete, and each such statement is qualified in all respects by reference to the full text of such contract or other document filed as an exhibit to the registration statement. We also file annual, quarterly and current reports and other information with the SEC under the Securities Exchange Act of 1934, as amended. A copy of those reports and this registration statement and the exhibits and schedules thereto may be inspected without charge at the public reference room maintained by the SEC located at 100 F Street, N.E., Room 1580, Washington, DC 20549. Copies of those reports and all or any portion of the registration statements and the filings may be obtained from such offices upon payment of prescribed fees. The public may obtain information on the operation of the public reference room by calling the SEC at 1-800-SEC-0330. The SEC maintains a website at www.sec.gov that contains reports, proxy and information statements and other information regarding Registrants that file electronically with the SEC.
We file periodic reports and other information with the U.S. Securities and Exchange Commission (the “SEC”). A copy of those reports and the exhibits and schedules thereto may be inspected without charge at the public reference room maintained by the SEC located at 100 F Street, N.E., Room 1580, Washington, DC 20549. Copies of those reports and all or any portion of the registration statements and the filings may be obtained from such offices upon payment of prescribed fees. The public may obtain information on the operation of the public reference room by calling the SEC at 1-800-SEC-0330. The SEC maintains a website at www.sec.gov that contains reports, proxy and information statements and other information regarding issuers that file electronically with the SEC.
Financial and other information can also be accessed through our website at www.intcomex.com, where we make available, free of charge, copies of our Annual Report on Form 10-K, Quarterly Reports on Form 10-Q, Current Reports on Form 8-K and amendments to those reports filed or furnished, as soon as reasonably practicable after filing such material electronically or otherwise furnishing it to the SEC. Our website and the information contained therein or connected thereto are not incorporated into this prospectus.
You may obtain a copy of any of our filings, at no cost, by writing or telephoning us at:
Intcomex, Inc.
3505 NW 107th Avenue
Miami, Florida 33178
(305) 477-6230
Attn: Russell Olson
124
Table of Contents
INDEX TO CONSOLIDATED FINANCIAL STATEMENTS
F-1
Table of Contents
REPORT OF INDEPENDENT REGISTERED PUBLIC ACCOUNTING FIRM
(BDO SEIDMAN, LLP)
Board of Directors
Intcomex, Inc. and Subsidiaries
We have audited the accompanying consolidated balance sheets of Intcomex, Inc. and Subsidiaries (the “Company”) as of December 31, 2009 and 2008, and the related consolidated statements of operations, shareholders’ equity and cash flows for each of the three years in the period ended December 31, 2009. These consolidated financial statements are the responsibility of the Company’s management. Our responsibility is to express an opinion on these consolidated financial statements based upon our audits. We did not audit the financial statements of one of the foreign subsidiaries for the year ended December 31, 2007. These statements reflect total revenues of approximately $115 million for the year ended December 31, 2007. Those statements were audited by another auditor whose report has been furnished to us, and our opinion, insofar as it relates to the amounts included for such subsidiary, is based solely on the report of the other auditor.
We conducted our audits in accordance with the standards of the Public Company Accounting Oversight Board (United States). Those standards require that we plan and perform the audit to obtain reasonable assurance about whether the financial statements are free of material misstatement. The Company is not required to have, nor were we engaged to perform, an audit of its internal control over financial reporting. Our audits included consideration of internal control over financial reporting as a basis for designing audit procedures that are appropriate in the circumstances, but not for the purpose of expressing an opinion on the effectiveness of the Company’s internal control over financial reporting. Accordingly, we express no such opinion. An audit also includes examining, on a test basis, evidence supporting the amounts and disclosures in the financial statements, assessing the accounting principles used and significant estimates made by management, as well as evaluating the overall financial statement presentation. We believe that our audits and the report of the other auditor provide a reasonable basis for our opinion.
In our opinion, based on our audits and the report of another auditor, the consolidated financial statements referred to above present fairly, in all material respects, the consolidated financial position of Intcomex, Inc. and Subsidiaries at December 31, 2009 and 2008, and the results of their operations and their cash flows for each of the three years in the period ended December 31, 2009, in conformity with accounting principles generally accepted in the United States of America.
| Miami, Florida | /s/ BDO Seidman, LLP | |
| February 19, 2010 |
F-2
Table of Contents
REPORT OF INDEPENDENT REGISTERED PUBLIC ACCOUNTING FIRM
(PRICEWATERHOUSECOOPERS, S.C.)
March 28, 2008
To the Stockholders and the Board of Directors of
Centel, S.A. de C.V.:
In our opinion, the statements of operations, shareholders’ equity and of cash flows for the year ended December 31, 2007 present fairly, in all material respects, the results of operations and cash flows of Centel, S.A. de C.V for the year ended December 31, 2007, in conformity with accounting principles generally accepted in the United States of America. These financial statements are the responsibility of the Company's management. Our responsibility is to express an opinion on these financial statements based on our audit. We conducted our audit of these statements in accordance with the standards of the Public Company Accounting Oversight Board (United States). Those standards require that we plan and perform the audit to obtain reasonable assurance about whether the financial statements are free of material misstatement. An audit includes examining, on a test basis, evidence supporting the amounts and disclosures in the financial statements. An audit also includes assessing the accounting principles used and significant estimates made by management, as well as evaluating the overall financial statement presentation. We believe that our audit provides a reasonable basis for our opinion.
PricewaterhouseCoopers, S.C.
/s/ Roberto Vargas Flores
Audit Partner
F-3
Table of Contents
INTCOMEX, INC. AND SUBSIDIARIES
CONSOLIDATED BALANCE SHEETS AS OF DECEMBER 31, 2009 AND 2008
(Dollars in thousands, except per share data)
| As of December 31, | ||||||||
| 2009 | 2008 | |||||||
| Assets |
||||||||
| Current assets |
||||||||
| Cash and cash equivalents (including restricted cash of $400 at December 31, 2008) |
$ | 27,234 | $ | 22,344 | ||||
| Trade accounts receivable (net of allowance for doubtful accounts of $4,428 and $5,202 at December 31, 2009 and 2008, respectively) |
100,238 | 91,085 | ||||||
| Notes and other receivables |
20,104 | 16,535 | ||||||
| Due from related parties |
272 | 278 | ||||||
| Inventories |
95,185 | 90,858 | ||||||
| Prepaid expenses and other |
11,553 | 12,277 | ||||||
| Deferred tax assets |
2,564 | 2,602 | ||||||
| Total current assets |
257,150 | 235,979 | ||||||
| Property and equipment, net |
16,295 | 17,678 | ||||||
| Goodwill |
13,704 | 13,548 | ||||||
| Identifiable intangible assets |
1,658 | 1,938 | ||||||
| Deferred tax assets |
11,116 | 10,261 | ||||||
| Other assets |
8,178 | 4,664 | ||||||
| Total assets |
$ | 308,101 | $ | 284,068 | ||||
| Liabilities and Shareholders’ Equity |
||||||||
| Liabilities |
||||||||
| Current liabilities |
||||||||
| Lines of credit |
$ | 14,729 | $ | 31,041 | ||||
| Current maturities of long-term debt |
557 | 617 | ||||||
| Accounts payable |
117,216 | 108,754 | ||||||
| Income taxes payable |
68 | 781 | ||||||
| Deferred tax liabilities |
231 | 328 | ||||||
| Due to related parties |
75 | 49 | ||||||
| Accrued expenses and other liabilities |
13,581 | 18,683 | ||||||
| Total current liabilities |
146,457 | 160,253 | ||||||
| Long-term debt, net of current maturities |
114,425 | 105,248 | ||||||
| Other long-term liabilities |
1,702 | 1,672 | ||||||
| Deferred tax liabilities |
2,783 | 2,345 | ||||||
| Total liabilities |
265,367 | 269,518 | ||||||
| Commitments and contingencies |
— | — | ||||||
| Shareholders’ equity |
||||||||
| Common stock, voting $0.01 par value, 140,000 shares authorized, 100,000 issued and outstanding |
1 | 1 | ||||||
| Class B common stock, non-voting $0.01 par value, 60,000 shares authorized, 29,357 and 2,182 issued and outstanding as of December 31, 2009 and 2008, respectively) |
— | — | ||||||
| Additional paid in capital |
41,388 | 21,138 | ||||||
| Retained earnings (deficit) |
5,153 | (2,040 | ) | |||||
| Accumulated other comprehensive loss |
(3,808 | ) | (4,549 | ) | ||||
| Total shareholders’ equity |
42,734 | 14,550 | ||||||
| Total liabilities and shareholders’ equity |
$ | 308,101 | $ | 284,068 | ||||
The accompanying notes are an integral part of the consolidated financial statements.
F-4
Table of Contents
INTCOMEX, INC. AND SUBSIDIARIES
CONSOLIDATED STATEMENTS OF OPERATIONS FOR THE YEARS ENDED
DECEMBER 31, 2009, 2008 AND 2007
(Dollars in thousands, except per share data)
| Years Ended December 31, | ||||||||||||
| 2009 | 2008 | 2007 | ||||||||||
| Revenue |
$ | 917,168 | $ | 1,071,551 | $ | 1,038,368 | ||||||
| Cost of revenue |
825,587 | 970,955 | 937,286 | |||||||||
| Gross profit |
91,581 | 100,596 | 101,082 | |||||||||
| Operating expenses |
||||||||||||
| Selling, general and administrative |
66,973 | 83,038 | 69,834 | |||||||||
| Goodwill impairment charge |
— | 18,777 | — | |||||||||
| Depreciation and amortization |
4,283 | 3,908 | 3,480 | |||||||||
| Total operating expenses |
71,256 | 105,723 | 73,314 | |||||||||
| Operating income (loss) |
20,325 | (5,127 | ) | 27,768 | ||||||||
| Other expense (income) |
||||||||||||
| Interest expense |
17,495 | 17,431 | 17,763 | |||||||||
| Interest income |
(514 | ) | (941 | ) | (730 | ) | ||||||
| Foreign exchange (gain) loss |
(3,130 | ) | 15,533 | (2,401 | ) | |||||||
| Other (income) expense, net |
(3,563 | ) | (3,427 | ) | (292 | ) | ||||||
| Total other expense |
10,288 | 28,596 | 14,340 | |||||||||
| Income (loss) before provision for income taxes |
10,037 | (33,723 | ) | 13,428 | ||||||||
| Provision for income taxes |
2,844 | 1,595 | 867 | |||||||||
| Net income (loss) |
$ | 7,193 | $ | (35,318 | ) | $ | 12,561 | |||||
| Net income (loss) per weighted average share of common stock, voting and Class B common stock, non-voting: |
||||||||||||
| Basic |
$ | 69.94 | $ | (345.63 | ) | $ | 122.93 | |||||
| Diluted |
$ | 69.94 | $ | (345.63 | ) | $ | 122.93 | |||||
| Weighted average number of common shares, voting and Class B common stock, non-voting, used in per share calculation: |
||||||||||||
| Basic |
102,852 | 102,182 | 102,182 | |||||||||
| Diluted |
102,852 | 102,182 | 102,182 | |||||||||
The accompanying notes are an integral part of the consolidated financial statements.
F-5
Table of Contents
INTCOMEX, INC. AND SUBSIDIARIES
CONSOLIDATED STATEMENTS OF CHANGES IN SHAREHOLDERS’ EQUITY
FOR THE YEARS ENDED DECEMBER 31, 2009, 2008 AND 2007
(Dollars in thousands, except per share data)
| Years Ended December 31, 2009, 2008 and 2007 | ||||||||||||||||||||||||||
| Common Stock | ||||||||||||||||||||||||||
| Shares | Additional Paid in Capital |
Retained Earnings (Deficit) |
Accumulated Other Comprehensive Income (Loss) |
Shareholders’ Equity |
Comprehensive Income (Loss) |
|||||||||||||||||||||
| Voting | Class B Non-voting |
Par Value |
||||||||||||||||||||||||
| Balance at December 31, 2006 |
100,000 | 2,182 | $ | 1 | $ | 17,597 | $ | 20,717 | $ | 22 | $ | 38,337 | ||||||||||||||
| Indemnity settlement agreement payment in connection with Uruguay tax audit |
— | — | — | 3,029 | — | — | 3,029 | |||||||||||||||||||
| Share-based compensation expense |
— | — | — | 199 | — | — | 199 | |||||||||||||||||||
| Net income |
— | — | — | — | 12,561 | — | 12,561 | 12,561 | ||||||||||||||||||
| Foreign currency translation loss |
— | — | — | — | — | (25 | ) | (25 | ) | (25 | ) | |||||||||||||||
| Total comprehensive income |
$ | 12,536 | ||||||||||||||||||||||||
| Balance at December 31, 2007 |
100,000 | 2,182 | $ | 1 | $ | 20,825 | $ | 33,278 | $ | (3 | ) | $ | 54,101 | |||||||||||||
| Share-based compensation expense |
— | — | — | 313 | — | — | 313 | |||||||||||||||||||
| Net loss |
— | — | — | — | (35,318 | ) | — | (35,318 | ) | (35,318 | ) | |||||||||||||||
| Foreign currency translation loss |
— | — | — | — | — | (4,546 | ) | (4,546 | ) | (4,546 | ) | |||||||||||||||
| Total comprehensive loss |
$ | (39,864 | ) | |||||||||||||||||||||||
| Balance at December 31, 2008 |
100,000 | 2,182 | $ | 1 | $ | 21,138 | $ | (2,040 | ) | $ | (4,549 | ) | $ | 14,550 | ||||||||||||
| Share-based compensation expense |
— | — | — | 249 | — | — | 249 | |||||||||||||||||||
| Issuance of Class B common stock, non-voting |
— | 27,175 | — | 20,001 | — | — | 20,001 | |||||||||||||||||||
| Net income |
— | — | — | — | 7,193 | — | 7,193 | 7,193 | ||||||||||||||||||
| Foreign currency translation gain |
— | — | — | — | — | 741 | 741 | 741 | ||||||||||||||||||
| Total comprehensive income |
$ | 7,934 | ||||||||||||||||||||||||
| Balance at December 31, 2009 |
100,000 | 29,357 | $ | 1 | $ | 41,388 | $ | 5,153 | $ | (3,808 | ) | $ | 42,734 | |||||||||||||
The accompanying notes are an integral part of the consolidated financial statements.
F-6
Table of Contents
INTCOMEX, INC. AND SUBSIDIARIES
CONSOLIDATED STATEMENTS OF CASH FLOWS FOR THE YEARS ENDED
DECEMBER 31, 2009, 2008 AND 2007
(Dollars in thousands)
| Years Ended December 31, | ||||||||||||
| 2009 | 2008 | 2007 | ||||||||||
| Cash flows from operating activities: |
||||||||||||
| Net income (loss) |
$ | 7,193 | ($ | 35,318 | ) | $ | 12,561 | |||||
| Adjustments to reconcile net income (loss) to net cash (used in) provided by operating activities: |
||||||||||||
| Stock-based compensation expense |
249 | 313 | 199 | |||||||||
| Depreciation expense |
3,812 | 3,336 | 2,653 | |||||||||
| Amortization expense |
3,353 | 2,217 | 2,548 | |||||||||
| Bad debt expense |
4,214 | 4,544 | 2,041 | |||||||||
| Inventory obsolescence expense |
(886 | ) | 1,800 | 1,293 | ||||||||
| Deferred income tax benefit |
(476 | ) | (3,342 | ) | (6,008 | ) | ||||||
| Impairment charge and other non-cash items |
— | 20,824 | — | |||||||||
| Gain on extinguishment of long-term debt |
(4,411 | ) | (3,470 | ) | — | |||||||
| Loss on disposal of property and equipment and other |
(210 | ) | 5 | 42 | ||||||||
| Change in operating assets and liabilities: |
||||||||||||
| (Increase) decrease in: |
||||||||||||
| Trade accounts receivables |
(13,367 | ) | 21,115 | (29,495 | ) | |||||||
| Inventories |
(3,441 | ) | 24,303 | (23,844 | ) | |||||||
| Notes and other receivables |
(3,569 | ) | 3,169 | (1,120 | ) | |||||||
| Prepaid expenses and other |
586 | (2,734 | ) | (3,591 | ) | |||||||
| Due from related parties |
6 | 893 | (380 | ) | ||||||||
| (Decrease) increase in: |
||||||||||||
| Accounts payable |
7,573 | (33,157 | ) | 45,939 | ||||||||
| Income taxes payable |
(713 | ) | (128 | ) | (208 | ) | ||||||
| Accrued expenses and other |
(4,296 | ) | 505 | 3,950 | ||||||||
| Due to related parties |
26 | (2 | ) | (46 | ) | |||||||
| Net cash (used in) provided by operating activities |
(4,357 | ) | 4,873 | 6,534 | ||||||||
| Cash flows from investing activities: |
||||||||||||
| Purchases of property and equipment |
(2,531 | ) | (6,125 | ) | (6,757 | ) | ||||||
| Proceeds from disposition of assets |
69 | 57 | 31 | |||||||||
| Notes receivable and other |
45 | (578 | ) | 525 | ||||||||
| Net cash used in investing activities |
(2,417 | ) | (6,646 | ) | (6,201 | ) | ||||||
| Cash flows from financing activities: |
||||||||||||
| (Payments) borrowings under lines of credit, net |
(16,312 | ) | 4,675 | 8,713 | ||||||||
| Proceeds from issuance of long-term debt, net of issuance costs |
108,737 | 36 | 2,419 | |||||||||
| Payments of long-term debt |
(85,122 | ) | (7,925 | ) | (5,644 | ) | ||||||
| Proceeds from issuance of common stock |
3,967 | — | — | |||||||||
| Payments from shareholders |
— | — | 3,029 | |||||||||
| Net cash provided by (used in) by financing activities |
11,270 | (3,214 | ) | 8,517 | ||||||||
| Effect of foreign currency exchange rate changes on cash and cash equivalents |
394 | (2,068 | ) | (25 | ) | |||||||
| Net increase (decrease) in cash and cash equivalents |
4,890 | (7,055 | ) | 8,825 | ||||||||
| Cash and cash equivalents, beginning of period |
$ | 22,344 | $ | 29,399 | $ | 20,574 | ||||||
| Cash and cash equivalents, end of period |
$ | 27,234 | $ | 22,344 | $ | 29,399 | ||||||
The accompanying notes are an integral part of the consolidated financial statements.
F-7
Table of Contents
INTCOMEX, INC. AND SUBSIDIARIES
CONSOLIDATED STATEMENTS OF CASH FLOWS FOR THE YEARS ENDED
DECEMBER 31, 2009, 2008 AND 2007—(Continued)
(Dollars in thousands)
| Years Ended December 31, | |||||||||
| 2009 | 2008 | 2007 | |||||||
| Supplemental disclosure of operating cash flow information: |
|||||||||
| Cash paid for: |
|||||||||
| Interest |
$ | 20,359 | $ | 16,536 | $ | 16,089 | |||
| Income taxes |
$ | 3,456 | $ | 6,119 | $ | 7,819 | |||
| Supplemental disclosure of non-cash flow information: |
|||||||||
| Non-cash investing activities: |
|||||||||
| Issuance of Class B Common Stock, non-voting in exchange for 11 3/4% Senior Notes at face value |
$ | 16,034 | $ | — | $ | — | |||
| Non-cash financing activities: |
|||||||||
| Property and equipment acquired through financing |
$ | — | $ | 14 | $ | 2,261 | |||
The accompanying notes are an integral part of the consolidated financial statements.
F-8
Table of Contents
NOTES TO CONSOLIDATED FINANCIAL STATEMENTS
(Dollars in thousands, except per share data)
Note 1. Organization and Basis of Presentation
Nature of Operations
Intcomex, Inc. (“Intcomex”) is a United States (“U.S.”) based pure play value-added international distributor of computer information technology (“IT”) products focused solely on serving Latin America and the Caribbean (the “Region”). Intcomex distributes computer equipment, components, peripherals, software, computer systems, accessories, networking products and digital consumer electronics to more than 50,000 customers in 40 countries. Intcomex offers single source purchasing to its customers by providing an in-stock selection of more than 6,100 products from over 173 vendors, including many of the world’s leading IT product manufacturers. The Company serves the Latin American and Caribbean IT products markets using a dual distribution model as a wholesale aggregator and an in-country distributor:
| • | As a Miami-based wholesale aggregator, the Company sells primarily to: |
| • | third-party distributors, resellers and retailers of IT products based in countries in Latin America and the Caribbean where the Company does not have a local presence; |
| • | third-party distributors, resellers and retailers of IT products based in countries in Latin America and the Caribbean where the Company has a local presence but whose volumes are large enough to enable them to efficiently acquire products directly from U.S.-based wholesale aggregators; |
| • | other Miami-based exporters of IT products to Latin America and the Caribbean; and |
| • | our in-country operations. |
| • | As an in-country distributor in 12 countries, the Company sells to over 48,000 local reseller and retailer customers, including value-added resellers (companies that sell, install and support IT products and personal computers (“PCs”)), systems builders (companies that specialize in building complete computer systems by combining components from different vendors), smaller distributors and retailers. |
Organization
The accompanying consolidated financial statements include the accounts of Intcomex and its subsidiaries (collectively referred to herein as the “Company”) including the accounts of Intcomex Holdings, LLC (“Holdings”) (parent company of Software Brokers of America, Inc. (“SBA”), a Florida corporation), IXLA Holdings, Ltd. (“IXLA”)), IFC International, LLC, a Delaware limited liability company (“IFC”) and Intcomex International Holdings Cooperatief U.A., a Netherlands cooperative (“Coop”). IXLA is the Cayman Islands limited time duration holding company of 14 separate subsidiaries located in Central America, South America, and the Caribbean. IFC and Coop are the parent companies of Intcomex Holdings SPC-1, LLC (“Intcomex SPC-1 Mexico”) (parent company of Centel, S.A. de C.V. (“Centel”), a dually formed company in the U.S. and Mexico). The consolidated financial statements reflect the Company as the reporting entity for all periods presented.
The Company’s operations include sales generated from and invoiced by the Miami, Florida operations (the “Miami Operations”) and sales generated from and invoiced by all of the Latin American and Caribbean subsidiary operations. The subsidiary operations conduct business with sales and distribution centers in the following countries: Argentina, Chile, Colombia, Costa Rica, Ecuador, El Salvador, Guatemala, Jamaica, Mexico, Panama, Peru, and Uruguay and a sales office in Brazil (collectively, our “In-country Operations”).
F-9
Table of Contents
INTCOMEX, INC.
NOTES TO CONSOLIDATED FINANCIAL STATEMENTS—(Continued)
(Dollars in thousands, except per share data)
Principles of Consolidation
The accompanying consolidated financial statements have been prepared in conformity with the instructions to the Annual Report on Form 10-K and Article 10 of Regulation S-X, pursuant to the rules and regulations of the United States Securities and Exchange Commission (“SEC”). The consolidated financial statements include the accounts of Intcomex, Inc. and its subsidiaries. In management’s opinion, the consolidated financial statements reflect all material adjustments, consisting only of normal recurring adjustments, necessary to fairly state the financial position of the Company as of December 31, 2009 and 2008, its results of operations, statements of changes in shareholders’ equity and its statements of cash flows for the years ended December 31, 2009, 2008 and 2007. All significant intercompany accounts and transactions have been eliminated in consolidation. The consolidated financial statements reflect the Company as the reporting entity for all periods presented.
As of December 31, 2009, the Company had one wholly-owned subsidiary: Holdings. Holdings has three wholly owned subsidiaries: SBA, IXLA, and IFC. Holdings owns 99.99% and the Company owns 0.01% of Coop.
IXLA owns 100.0% of the following subsidiaries in their respective locations in Latin America and the Caribbean:
| • | Intcomex Argentina S.R.L., Argentina; |
| • | Intcomex S.A., Chile: |
| • | Intcomex Iquique S.A., Chile; |
| • | Intcomex del Ecuador S.A., Ecuador; |
| • | Hurricane Systems, S.A., Ecuador; |
| • | Intcomex Colombia LTDA, Colombia; |
| • | Intcomex Costa Rica Mayorista en Equipo de Cómputo, S.A., Costa Rica; |
| • | Intcomex El Salvador, S.A., El Salvador; |
| • | Intcomex de Guatemala, S.A., Guatemala; |
| • | Intcomex Jamaica Ltd., Jamaica; |
| • | Computación Monrenca Panama, S.A., Panama; |
| • | Intcomex de Las Americas, S.A., Panama; |
| • | Intcomex Peru, S.A.C., Peru; |
| • | Compañía de Servicios IMSC, S. de R.L. de C.V., Mexico. |
| • | T.G.M., S.A., Uruguay; |
| • | Pontix Trading S.A., Uruguay (inactive) |
| • | Latin CAS, S.D., El Salvador; and |
| • | Latin Service, S.A., Guatemala. |
Coop and IFC own 99.0% and 1.0%, respectively, of Intcomex SPC-I Mexico.
F-10
Table of Contents
INTCOMEX, INC.
NOTES TO CONSOLIDATED FINANCIAL STATEMENTS—(Continued)
(Dollars in thousands, except per share data)
Intcomex SPC-I Mexico has one wholly owned subsidiary: Centel, S.A. de C.V., located in México.
We operate a sales and distribution center in the U.S. (our “Miami Operations”), 22 sales and distribution centers in 12 countries in Latin America and the Caribbean—Argentina, Chile, Colombia, Costa Rica, Ecuador, El Salvador, Guatemala, Jamaica, Mexico, Panama, Peru and Uruguay and a sales office in Brazil.
Fiscal Year
The Company’s fiscal year ends on December 31 and is based on a calendar year.
Use of Accounting Estimates
We prepare our consolidated financial statements in conformity with accounting principles generally accepted in the U.S. (“U.S. GAAP”). These principles require us to make judgments, estimates and assumptions that affect the reported amounts of assets and liabilities and disclosure of contingent assets and liabilities at the date of the financial statements, the reported amounts of revenues and expenses, cash flows and the related footnote disclosures during the reporting period. On an on-going basis, we review and evaluate our estimates and assumptions, including, but not limited to, those that relate to the realizable value of accounts receivable, inventories, identifiable intangible assets, goodwill and other long-lived assets, income taxes and contingencies. Actual results could differ from these estimates.
Foreign Currency Translation and Remeasurement
The U.S. dollar is considered the functional currency in all of the Company’s foreign subsidiary operations, except in Mexico where the functional currency is the Mexican Peso. Non-monetary balance sheet amounts are translated using historical exchange rates. Other balance sheet amounts are translated at the exchange rates in effect at the balance sheet date. Statements of operations amounts, excluding those items of income and expense that relate to non-monetary balance sheet amounts, are translated at the average exchange rate for the month. Remeasurement adjustments are included in the determination of net (loss) income under the caption “Foreign exchange loss (gain).” These amounts include the effect of foreign currency remeasurement, realized foreign currency transaction gains and losses and changes in the value of foreign currency denominated accounts receivable and accounts payable. In the accompanying consolidated statements of operations, a foreign exchange (gain) loss of ($3,130), $15,533, and ($2,401) were included for the years ended December 31, 2009, 2008 and 2007, respectively.
Translation adjustments related to our Mexican subsidiary are recorded in accumulated other comprehensive (loss) income under shareholders’ equity in our consolidated balance sheets and in our consolidated statement of changes in shareholders’ equity. In the accompanying consolidated statements of changes in shareholders’ equity, foreign currency translation adjustments of $741, ($4,546) and ($25) were included for the years ended December 31, 2009, 2008 and 2007, respectively.
Cash Equivalents
The Company considers all highly liquid investments purchased with an original maturity of three months or less to be cash equivalents in accordance with FASB ASC 305-10-20, Cash and Cash Equivalents Glossary. The majority of the Company’s cash and cash equivalents is cash in banks.
F-11
Table of Contents
INTCOMEX, INC.
NOTES TO CONSOLIDATED FINANCIAL STATEMENTS—(Continued)
(Dollars in thousands, except per share data)
Accounts Receivable
The Company maintains an allowance for doubtful accounts for estimated losses resulting from the inability of its customers to make required payments due to changes in our customers’ financial condition or other unanticipated events, which could result in charges for additional allowances exceeding our expectations. These estimates require judgment and are influenced by factors including, but not limited to the following: the large number of customers and their dispersion across wide geographic areas; the fact that no single customer accounted for 2.0% or more of our revenue; the continual credit evaluation of our customers’ financial condition; the aging of our customers’ receivables, individually and in the aggregate; the value and adequacy of credit insurance coverage; the value and adequacy of collateral received from our customers (in certain circumstances); our historical loss experience; and, increases in credit risk due to an economic downturn resulting in our customers’ inability to obtain capital. Uncollectible accounts are written-off against the allowance on an annual basis.
Inventories
Inventories consist entirely of finished goods and are stated at the lower of cost or market. Cost is determined primarily on the first-in, first-out (“FIFO”) method. Due to the availability of “price protection” guarantees offered by many of our vendors on a significant portion of inventory, some of the Company’s In-country Operations use the average cost method that approximates FIFO. The Company operates in an industry characterized by the continual introduction of new products, rapid technological advances and product obsolescence. The Company continuously evaluates the salability of its inventories and utilizes incentive sales programs for slow moving items. Rebates earned on products sold are recognized when the product is shipped to a third party customer and is recorded as a reduction to cost of revenue.
Property and Equipment, Net
Property and equipment are recorded at cost and depreciated over the estimated economic lives of the assets. Depreciation is computed using the straight-line and accelerated methods based on the estimated economic lives of the related assets as follows:
| Years | ||
| Buildings and leasehold improvements |
30 – 39 | |
| Office furniture, vehicles and equipment |
5 – 7 | |
| Warehouse equipment |
5 – 7 | |
| Software |
5 |
Goodwill, Identifiable Intangible and Other Long-Lived Assets
FASB ACS 350, Intangibles-Goodwill and Other provides guidance on the annual assessment of goodwill for impairment using fair value measurement techniques. The Company reviews goodwill at least annually for potential impairment or between annual tests if an event occurs or circumstances change that would more likely than not reduce the fair value of a reporting unit below its carrying amount. Our annual impairment review requires extensive use of accounting judgment and financial estimates, including projections about our business, our financial performance and the performance of the market and overall economy. Application of alternative assumptions and definitions could produce significantly different results. Because of the significance of the judgments and estimates used in the processes, it is likely that materially different amounts could result if different assumptions were made or if the underlying circumstances were changed.
F-12
Table of Contents
INTCOMEX, INC.
NOTES TO CONSOLIDATED FINANCIAL STATEMENTS—(Continued)
(Dollars in thousands, except per share data)
Our goodwill represents the excess of the purchase price over the fair value of the net assets of acquired businesses. Potential impairment exists if the fair value of a reporting unit to which goodwill has been allocated is less than the carrying value of the reporting unit. The amount of an impairment loss is recognized as the amount by which the carrying value of the goodwill exceeds its implied value.
Future changes in the estimates used to conduct the impairment review, including revenue projections, market values and changes in the discount rate used could cause the analysis to indicate that our goodwill is impaired in subsequent periods and result in a write-off of a portion or all of the goodwill. The discount rate used is based on our capital structure and, if required, an additional premium on the reporting unit based upon its geographic market and operating environment. The assumptions used in estimating revenue projections are consistent with internal planning.
Our intangible assets are presented at cost, net of accumulated amortization. Intangible assets are amortized on a straight line basis over their estimated useful lives and assessed for impairment. The Company recognizes an impairment of long-lived assets if the net book value of such assets exceeds the estimated future undiscounted cash flows attributable to such assets. If the carrying value of a long-lived asset is considered impaired, a loss is recognized based on the amount by which the carrying value exceeds the fair value of the long-lived asset for assets to be held and used, or the amount by which the carrying value exceeds the fair value less cost to dispose for assets to be disposed. Fair value is determined using the anticipated cash flows discounted at a rate commensurate with the risk involved. The Company tests intangible assets for recoverability whenever events or changes in circumstances indicate that their carrying amount may not be recoverable.
The Company reviews long-lived assets, principally property, plant and equipment, for impairment whenever events or changes in circumstances indicate that the carrying amount of an asset may not be recoverable. If the carrying amount of an asset exceeds the asset’s fair value, we measure and record an impairment loss for the excess. We assess an asset’s fair value by determining the expected future undiscounted cash flows of the asset. There are numerous uncertainties and inherent risks in conducting business, such as general economic conditions, actions of competitors, ability to manage growth, actions of regulatory authorities, pending investigations or litigation, customer demand and risk relating to international operations. Adverse effects from these or other risks may result in adjustments to the carrying value of our other long-lived assets.
There are numerous uncertainties and inherent risks in conducting business, such as but not limited to general economic conditions, actions of competitors, ability to manage growth, actions of regulatory authorities, pending investigations and/or litigation, customer demand and risk relating to international operations. Adverse effects from these risks may result in adjustments to the carrying value of the Company’s assets and liabilities in the future including, but not necessarily limited to, goodwill.
Deferred Loan Costs
Deferred loan costs are amortized over the life of the applicable indebtedness using the straight-line method which approximates the effective interest method. Deferred loan costs, net of accumulated amortization, amounted to $6,654 and $2,586 at December 31, 2009 and 2008, respectively, and are included in Other assets in the accompanying balance sheets.
Fair Value of Financial Instruments
FASB ASC 820, Fair Value Measurements and Disclosures (“ASC 820”) establishes a framework for all fair value measurements and expands disclosures related to fair value measurement and developments. ASC 820
F-13
Table of Contents
INTCOMEX, INC.
NOTES TO CONSOLIDATED FINANCIAL STATEMENTS—(Continued)
(Dollars in thousands, except per share data)
defines fair value as the price that would be received to sell an asset or paid to transfer a liability in an orderly transaction between market participants at the measurement date. ASC 820 requires that assets and liabilities measured at fair value are classified and disclosed in one of the following three categories:
Level 1—Quoted market prices for identical assets or liabilities in active markets or observable inputs;
Level 2—Significant other observable inputs that can be corroborated by observable market data; and
Level 3—Significant unobservable inputs that cannot be corroborated by observable market data.
The carrying amounts of cash and cash equivalents, trade accounts receivable, notes and other receivables, accounts payable, accrued expenses and other approximate fair value because of the short-term nature of these items. The carrying amounts of outstanding short-term debt approximate fair value because interest rates over the term of these financial instruments approximate current market interest rates available to the Company. The current market price of outstanding long-term debt approximates fair value because the Company’s 11 3/4% Second Priority Senior Secured Notes due January 15, 2011 (the “11 3/4% Senior Notes”) were freely traded in the open market and the Company’s 13 1/4% Second Priority Senior Secured Notes due December 15, 2014 (the “13 1/4% Senior Notes”) are currently tradable under the Securities Act of 1933 Rule 144A, Private Resales of Securities to Institutions, in the open market.
The amount required to enter into similar offsetting contracts with similar remaining maturities based on quoted market prices approximates the fair value of derivative financial instruments. The Company did not have any foreign currency forward contracts outstanding as of December 31, 2009. The Company’s foreign currency forward contract with a notional amount of $11,800 as of December 31, 2008, had a fair value of ($31).
There were no changes to our valuation methodology for assets and liabilities measured at fair value during the year ended December 31, 2009.
Revenue Recognition
Revenue is recognized when there is persuasive evidence of an arrangement, the sales price is fixed or determinable, collection of the related receivable is reasonably assured and delivery has occurred. Delivery to customers has occurred at the point of shipment, provided that title and risk of loss have transferred and no significant obligations remain. We allow our customers to return defective products for exchange or credit within 30 days of delivery based on the warranty of the original equipment manufacturer (“OEM”). An exception is infrequently made for long-standing customers with current accounts, on a case-by-case basis and upon approval by management. A return is recorded in the period of the return because, based on past experience, these returns are infrequent and immaterial.
The Company’s revenues are reported net of any sales, gross receipts or value added taxes. Shipping and handling costs billed to customers are included in revenue and related costs are included in the cost of revenue.
The Company extends a warranty for products to customers with the same terms as the OEM’s warranty to the Company. All product-related warranty costs incurred by the Company are reimbursed by the OEMs.
Product Rebates, Price Protection and Vendor Program Incentives
The Company receives funds from vendors for price protection, product rebates, marketing and promotions and competitive programs, which are recorded as adjustments to product costs or selling, general and
F-14
Table of Contents
INTCOMEX, INC.
NOTES TO CONSOLIDATED FINANCIAL STATEMENTS—(Continued)
(Dollars in thousands, except per share data)
administrative expenses according to the nature of the program. Some of these programs may extend over one or more quarterly reporting periods. We recognize product rebates or other vendor program incentives when earned, based upon sales of qualifying products or as services are provided in accordance with the terms of the related program. We estimate and record reserves for receivables on vendor programs for estimated losses resulting from vendors’ inability to pay or rejections of claims by vendors on a quarterly basis. These reserves require management’s judgment and are based upon aging, historical trends and data specific to each reporting period, management’s estimate of collectability and other factors.
Write-Off of Initial Public Offering Expenses
As of December 31, 2008, the Company wrote off $2,000 related to the pending initial public offering (“IPO”) transaction to take the Company public. The costs were recorded as an increase in operating expenses in the consolidated statement of operations as they were one-time charges that were not indicative of operations in the normal course of business and relate to a non-recurring transaction that would normally be netted against IPO proceeds. The Company did not write off or incur any additional costs related to the IPO transaction for the year ended December 31, 2009.
Restructuring Activities
The provision for restructuring relates to the estimated costs of reorganizations including the costs of closure or discontinuance of lines of activities. FASB ASC 420, Exit or Disposal Cost Obligations requires that a liability be recognized for those costs only when the liability is incurred. Liabilities related to one-time employee termination benefits are recognized ratably over the future service period if those employees are required to render services to the Company, if that period exceeds 60 days or a longer legal notification period. Employee termination benefits covered by a contract or under an ongoing benefit arrangement are recognized when it is probable that the employees will be entities to the benefits and the amounts can be reasonably estimated.
The Company’s management implemented restructuring and rebalancing actions designed to improve the Company’s efficiencies and profitability, strengthen its operations and reduce its costs in several of its In-country Operations in which the Company conducts business. The restructuring includes involuntary workforce reductions and employee benefits and other costs incurred in connection with vacating leased facilities. The Company incurred restructuring charges of $585 and $1,535, respectively, in 2009 and the fourth quarter of 2008. The restructuring charges were recorded in the Company’s statement of operations as an increase to the Company’s operating expenses for the years ended December 31, 2009 and 2008. There were no restructuring charges incurred by the Company during the year ended December 31, 2007.
Income Taxes
The Company accounts for the effects of income taxes resulting from activities during the current and preceding years in accordance with FASB ASC 740, Income Taxes. Deferred tax assets and liabilities are recognized for the future tax consequences attributable to temporary differences between the financial statement carrying amounts of assets and liabilities and their respective tax bases as measured by the enacted tax rates which will be in effect when these differences reverse. The effect on deferred tax assets and liabilities of a change in tax rates is recognized in the results of operations in the period that includes the enactment date under the law. Valuation allowances are established when necessary to reduce deferred tax assets to the amount expected to be realized, unless it is more likely than not that such assets will be realized.
F-15
Table of Contents
INTCOMEX, INC.
NOTES TO CONSOLIDATED FINANCIAL STATEMENTS—(Continued)
(Dollars in thousands, except per share data)
We are subject to income and other related taxes in areas in which we operate. When recording income tax expense, certain estimates are required by management due to timing and the impact of future events on when income tax expenses and benefits are recognized by us. We periodically evaluate our net operating losses and other carryforwards to determine whether gross deferred tax assets and related valuation allowances should be adjusted for future realization in our consolidated financial statements.
Highly certain tax positions are determined based upon the likelihood of the positions sustained upon examination by the taxing authorities. The benefit of a tax position is recognized in the financial statements in the period during which management believes it is more likely than not that the position will be sustained.
In the event of a distribution of the earnings of certain international subsidiaries, we would be subject to withholding taxes payable on those distributions to the relevant foreign taxing authorities. Since we currently intend to reinvest undistributed earnings of these international subsidiaries indefinitely, we have made no provision for income taxes that might be payable upon the remittance of these earnings. We have also not determined the amount of tax liability associated with an unplanned distribution of these permanently reinvested earnings. In the event that in the future we consider that there is a reasonable likelihood of the distribution of the earnings of these international subsidiaries (for example, if we intend to use those distributions to meet our liquidity needs), we will be required to make a provision for the estimated resulting tax liability, which will be subject to the evaluations and judgments of uncertainties described above.
We conduct business globally and, as a result, one or more of our subsidiaries file income tax returns in U.S. federal, state and foreign jurisdictions. In the normal course of business, we are subject to examination by taxing authorities in the countries in which we operate. We are currently under ongoing tax examinations in several countries. While such examinations are subject to inherent uncertainties, we do not currently anticipate that any such examination would have a material adverse impact on our audited consolidated financial statements.
Computation of Net Income (Loss) per Share
The Company reports both basic and diluted net income (loss) per share. Basic net income (loss) per share excludes dilution and is computed by dividing net income (loss) by the weighted average number of common shares outstanding during the period. Diluted net income (loss) per share is computed using the weighted average number of common shares and dilutive potential common shares outstanding during the period. Dilutive potential common shares primarily reflect the potential dilution that could occur if stock options and other commitments to issue common stock were exercised using the treasury stock method.
FAS ASC 260, Earnings per Share requires that employee equity share options, non-vested shares and similar equity instruments granted by the Company are treated as potential common shares outstanding in computing diluted net income (loss) per share. Diluted shares outstanding include the dilutive effect of in-the-money options which is calculated based on the average share price for each fiscal period using the treasury stock method. Under the treasury stock method, the amount the employee must pay for exercising stock options, the amount of compensation cost for future service that the Company has not yet recognized, and the amount of tax benefits that would be recorded in additional paid in capital when the award becomes deductible are assumed to be used to repurchase shares.
The Company has two classes of common stock: voting and Class B, non-voting (collectively herein referred to as the “Common Stock”). Common stock, voting and Class B common stock, non-voting have substantially identical rights with respect to any dividends or distributions of cash or property declared on shares
F-16
Table of Contents
INTCOMEX, INC.
NOTES TO CONSOLIDATED FINANCIAL STATEMENTS—(Continued)
(Dollars in thousands, except per share data)
of common stock and rank equally as to the right to receive proceeds on liquidation or dissolution of the Company after the payment of the Company’s indebtedness. The Company uses the two-class method for calculating net income (loss) per share. Basic and diluted net income (loss) per share of Common Stock are the same.
The following table sets forth the computation of basic and diluted net income (loss) per weighted average share of Common Stock:
| For the Years Ended December 31, | ||||||||||
| 2009 | 2008 | 2007 | ||||||||
| Numerator for basic and diluted net income (loss) per share of Common Stock: |
||||||||||
| Net income (loss) |
$ | 7,193 | $ | (35,318 | ) | $ | 12,561 | |||
| Denominator: |
||||||||||
| Denominator for basic net income (loss) per share of Common Stock—weighted average shares |
102,852 | 102,182 | 102,182 | |||||||
| Effect of dilutive securities: |
||||||||||
| Stock options and unvested restricted stock(1) |
— | — | — | |||||||
| Denominator for diluted net income (loss) per common share, voting and Class B common share, non-voting—adjusted weighted average shares |
102,852 | 102,182 | 102,182 | |||||||
| Net income (loss) per share of Common Stock: |
||||||||||
| Basic |
$ | 69.94 | $ | (345.63 | ) | $ | 122.93 | |||
| Diluted |
$ | 69.94 | $ | (345.63 | ) | $ | 122.93 | |||
| (1) | The stock options were antidilutive during the years ended December 31, 2009, 2008 and 2007, as the fair value was below the exercise price. The shares of restricted common stock, non-voting were antidilutive during the year ended December 31, 2009 and 2008. There were no shares of restricted common stock, non-voting outstanding during the years ended December 31, 2007. |
Comprehensive Income (Loss)
FASB ASC 220, Comprehensive Income establishes standards for reporting and displaying comprehensive income and its components in the Company’s consolidated financial statements. Comprehensive income (loss) is the change in equity during a period from transactions and other events and circumstances from non-owner sources, comprised of net income (loss) and other comprehensive income (loss). Comprehensive income (loss) consisted of the following for the periods presented:
| For the Years Ended December 31, |
|||||||||||
| 2009 | 2008 | 2007 | |||||||||
| Comprehensive income (loss) |
|||||||||||
| Net income (loss) |
$ | 7,193 | $ | (35,318 | ) | $ | 12,561 | ||||
| Foreign currency translation adjustments |
741 | (4,546 | ) | (25 | ) | ||||||
| Total comprehensive income (loss) |
$ | 7,934 | $ | (39,864 | ) | $ | 12,536 | ||||
F-17
Table of Contents
INTCOMEX, INC.
NOTES TO CONSOLIDATED FINANCIAL STATEMENTS—(Continued)
(Dollars in thousands, except per share data)
Foreign currency translation adjustments were driven by our operations in Mexico of $741, ($4,546) and ($25), for the years ended December 31, 2009, 2008 and 2007, respectively. Accumulated other comprehensive income (loss), consisting of cumulative foreign currency gains (losses), included in shareholders’ equity totaled ($3,808), ($4,549) and ($3), as of December 31, 2009, 2008 and 2007, respectively.
Recently Issued and Adopted Accounting Guidance
Recently Issued Accounting Guidance
In October 2009, the Financial Accounting Standards Board (“FASB”) issued Accounting Standards Update (“ASU”) 2009-13, Multiple-Deliverable Revenue Arrangements (“ASU 2009-13”). The new standard modifies the fair value requirements of ASC 605-25, Revenue Recognition-Multiple Element Arrangements by allowing the use of the “best estimate of a selling price” in addition to Vendor Specific Objective Evidence, or VSOE, and Third Party Evidence, or TPE, for determining the selling price of a deliverable. ASU 2009-13 changes the requirements for establishing separate units of accounting in a multiple element arrangement and requires the allocation of arrangement consideration to each deliverable to be based on the relative selling price. ASU 2009-13 is effective for revenue arrangements entered into or materially modified in fiscal years beginning on or after June 15, 2010. The Company is currently evaluating the effect ASU 2009-13 may have on its audited consolidated financial statements.
Recently Adopted Accounting Guidance
In August 2009, the FASB issued ASU 2009-05, Fair Value Measurements and Disclosures (Topic 820)-Measuring Liabilities at Fair Value (“ASU 2009-05”). ASU 2009-05 clarifies how entities should estimate the fair value of liabilities under the FASB Accounting Standards Codification (“ASC”) 820, Fair Value Measurements and Disclosures (formerly SFAS No. 157, Fair Value Measurements). ASU 2009-05 improves the consistency of the application of ASC 820 and reduces potential ambiguity in financial reporting when measuring the fair value of liabilities. The FASB issued ASU 2009-05 as a result of expressed concern that there may be a lack of observable market information to measure the fair value of a liability. This standard is effective for interim and annual periods beginning after August 28, 2009, which did not have a material impact on our audited consolidated financial statements.
In June 2009, the FASB issued ASC 810, Consolidation, (formerly SFAS No. 167, Amendments to FASB Interpretation No. 46(R)) regarding the consolidation of variable interest entities. ASC 810 is intended to improve financial reporting by providing additional guidance to companies involved with variable interest entities and by requiring additional disclosures about a company’s involvement in variable interest entities. This standard is effective for interim and annual periods beginning after November 15, 2009, which did not have a material impact on its audited consolidated financial statements.
In June 2009, the FASB issued ASC 860, Transfers and Servicing (formerly SFAS No. 166, Accounting for Transfers of Financial Assets). ASC 860 requires more information about transfers of financial assets and where companies have continuing exposure to the risk related to transferred financial assets. ASC 860 eliminates the concept of a qualifying special purpose entity, changes the requirements for derecognizing financial assets and requires additional disclosure. This standard is effective for fiscal years beginning after November 15, 2009, which did not have a material impact on its audited consolidated financial statements.
In June 2009, the FASB issued ASC 105, Generally Accepted Accounting Principles (formerly SFAS No. 168, The “FASB Accounting Standards Codification”TM and the Hierarchy of Generally Accepted
F-18
Table of Contents
INTCOMEX, INC.
NOTES TO CONSOLIDATED FINANCIAL STATEMENTS—(Continued)
(Dollars in thousands, except per share data)
Accounting Principles—a replacement of FASB Statement No. 162) (“ASC 105”). ASC 105 establishes the FASB ASC as the single source of authoritative nongovernmental U.S. GAAP, except for SEC rules and interpretive releases, which are sources of authoritative U.S. GAAP for SEC registrants. The standard is effective for interim and annual periods ending after September 15, 2009. The Company adopted the provisions of the standard on September 30, 2009, which did not have a material impact on its audited consolidated financial statements.
In May 2009, the FASB issued ASC 855, Subsequent Events (formerly SFAS No. 165, Subsequent Events) (“ASC 855”). ASC 855 establishes general accounting standards and disclosure of events that occur after the balance sheet date but before financial statements are issued or are available to be issued. ASC 855 sets forth the period after the balance sheet date during which management of a reporting entity should evaluate events or transactions that may occur for potential recognition or disclosure in the financial statements, the circumstances under which an entity should recognize events or transactions occurring after the balance sheet date in its financial statements, and the disclosures that an entity should make about events or transactions that occurred after the balance sheet date. ASC 855 is effective for fiscal years and interim periods ended after June 15, 2009. The Company adopted the provisions of the standard, which had no effect on its audited consolidated financial statements and subsequent events through the date of this filing. The Company evaluated subsequent events from January 1, 2010 to February 19, 2010, the date the Company issued its audited consolidated financial statements.
In April 2009, the FASB issued ASC 825, Financial Instruments (formerly Financial Staff Position (“FSP”) No. 107-1 and Accounting Principles Board (“APB”) 28-1 (FSP No. 107-1 and APB 28-1), Interim Disclosures about Fair Value of Financial Instruments) (“ASC 825”). ASC 825 requires disclosures of fair value for any financial instruments not currently reflected at fair value on the balance sheet for all interim periods. ASC 825 enhances consistency in financial reporting by increasing the frequency of fair value disclosures and is effective for interim and annual periods ending after June 15, 2009, and is to be applied prospectively. The Company adopted the provisions of the standard, which did not have an effect on its audited consolidated financial statements.
In April 2009, the FASB issued transition guidance Accounting Standards Codification (“ASC”) 820-10-65-4 Fair Value Measurements and Disclosures—Overall—Transition Guidance, the provisions of which have been incorporated in ASC 820-10-50-2 Fair Value Measurements and Disclosures—Overall—Disclosures (“ASC 820”). ASC 820-10-50-2 requires disclosures about fair value of financial instruments for interim reporting periods and annual financial statements of publicly traded companies. This guidance is effective for interim and annual periods ending after June 15, 2009. The Company adopted the provisions of the standard and included its effect on its audited consolidated financial statements.
In March 2008, the FASB issued ASC 815, Derivatives and Hedging (formerly SFAS No. 161, Disclosures about Derivative Instruments and Hedging Activities, an amendment of FASB Statement No. 133) (“ASC 815”). ASC815 requires enhanced disclosures about an entity’s derivative and hedging activities including how and why an entity uses, how an entity accounts for derivative instruments; and related hedged items and how derivative instruments and related hedged items affect an entity’s financial position, financial performance and cash flows. ASC 805 is effective beginning January 1, 2009. The Company adopted the provisions of the standard and included its effect on its audited consolidated financial statements.
In February 2008, the FASB issued ASC 820, Fair Value Measurements and Disclosures (formerly FSP Financial Accounting Standard (“FAS”) No. 157-2, Effective Date of FASB Statement No. 157) which delayed the effective date for nonfinancial assets and nonfinancial liabilities until January 1, 2009. The Company adopted
F-19
Table of Contents
INTCOMEX, INC.
NOTES TO CONSOLIDATED FINANCIAL STATEMENTS—(Continued)
(Dollars in thousands, except per share data)
the provisions of the standard as of January 1, 2009, which did not have an effect on its audited consolidated financial statements.
In December 2007, the FASB issued ASC 805, Business Combinations (“ASC 805”), (formerly SFAS 141 (revised 2007), Business Combinations). ASC 805 expands the definition of a business and a business combination; requires the acquirer to recognize the assets acquired, liabilities assumed and noncontrolling interests (including goodwill), measured at fair value at the acquisition date; requires acquisition-related expenses and restructuring costs to be recognized separately from the business combination; and requires in-process research and development to be capitalized at fair value as an indefinite-lived intangible asset. ASC 805 is effective for financial statements issued for fiscal years beginning after December 15, 2008. The Company adopted the provisions of the standard, which did not have an effect on its audited consolidated financial statements. However, if the Company enters into material business combinations in the future, a transaction may significantly impact the Company’s audited consolidated financial statements.
Reclassifications
Certain reclassifications have been made to prior period balances in order to conform to the current period’s presentation. In particular, the 2008 gains from the Company’s repurchase of its 11 3/4% Senior Notes have been reclassified to operating activities from financing activities in the audited consolidated statements of cash flows.
Note 2. Business and Credit Concentrations
The Company principally sells products to a large base of resellers throughout Latin America and to agents in the U.S. for export to Latin America and the Caribbean. Credit risk on trade receivables is diversified over several geographic areas and a large number of customers. No one customer accounts for more than 2.0% of sales for the years ended December 31, 2009, 2008 and 2007. The Company provides trade credit to its customers in the normal course of business. The collection of a substantial portion of the Company’s receivables is susceptible to changes in Latin American economies and political climates. The Company monitors its exposure for credit losses and maintains allowances for anticipated losses after giving consideration to delinquency data, historical loss experience, and economic conditions impacting the industry. The financial condition of its customers and the related allowance for doubtful accounts is continually reviewed by management.
Prior to extending credit, a customer’s financial history is analyzed and, if appropriate, forms of personal guarantees are obtained. SBA uses credit insurance and makes provisions for estimated credit losses. Substantially all of our Miami Operations’ foreign accounts receivable (other than accounts receivable owed by affiliates) are insured by Euler Hermes American Credit Indemnity Company. This credit insurance policy covers trade sales to non-affiliated buyers. The policy’s aggregate limit is $20,000 with an aggregate deductible of $1,500; the policy expires on August 31, 2010. In addition, 10.0% to 20.0% buyer coinsurance provisions apply, as well as sub-limits in coverage on a per-buyer and on a per-country basis. The policy also covers certain large, local companies that purchase directly from our In-country Operations in Argentina, Costa Rica, El Salvador, Guatemala, Jamaica and Peru. Our In-country operations in Chile insures certain customer accounts with Coface Chile, S.A. credit insurance company; the policy expires on October 31, 2010.
In some countries there are risks of continuing periodic devaluations of local currencies. In these countries, no hedging mechanism exists. The Company’s risks in these countries are that such devaluations could cause economic loss and negatively impact future sales since its product costs would increase in local terms after such devaluations.
F-20
Table of Contents
INTCOMEX, INC.
NOTES TO CONSOLIDATED FINANCIAL STATEMENTS—(Continued)
(Dollars in thousands, except per share data)
The Company purchases products from various suppliers located in the U.S. and Asia. Products purchased from the Company’s top two vendors accounted for 19.1% and 6.5%, 17.4% and 7.7%, and 16.7% and 10.1%, of its total revenue for the years ended December 31, 2009, 2008 and 2007, respectively.
Note 3. Property and Equipment, Net
Property and equipment, net consisted of the following for the periods presented:
| As of December 31, | ||||||||
| 2009 | 2008 | |||||||
| Property and equipment, net |
||||||||
| Land |
$ | 735 | $ | 735 | ||||
| Building and leasehold improvements |
8,410 | 8,039 | ||||||
| Office furniture, vehicles and equipment |
11,012 | 10,672 | ||||||
| Warehouse equipment |
2,438 | 2,445 | ||||||
| Software |
8,337 | 7,104 | ||||||
| Total property and equipment |
30,932 | 28,995 | ||||||
| Less accumulated depreciation |
(14,637 | ) | (11,317 | ) | ||||
| Total property and equipment, net |
$ | 16,295 | $ | 17,678 | ||||
Property and equipment, net included approximately $2,764 and $3,528 of capitalized leases at December 31, 2009 and 2008, respectively. There was no interest expense capitalized to property and equipment during the years ended December 31, 2009, 2008 and 2007.
Note 4. Identifiable Intangible Assets, Net and Goodwill
Identifiable Intangible Assets, Net
Identifiable intangible assets, net consisted of the following for the periods presented:
| As of December 31, 2009 |
Gross Carrying Amount |
Accumulated Amortization |
Cumulative Foreign Currency Translation Effect |
Net Carrying Amount |
Useful Life (in years) | |||||||||||
| Identifiable intangible assets, net |
||||||||||||||||
| Customer relationships |
$ | 3,630 | $ | (1,662 | ) | $ | (333 | ) | $ | 1,635 | 10.0 | |||||
| Tradenames |
1,080 | (1,035 | ) | (22 | ) | 23 | 3.5 | |||||||||
| Non-compete agreements |
730 | (730 | ) | — | — | 3.0 | ||||||||||
| Patents—TGM S.A. |
5 | (5 | ) | — | — | |||||||||||
| Total identifiable intangible assets, net |
$ | 5,445 | $ | (3,432 | ) | $ | (355 | ) | $ | 1,658 | ||||||
F-21
Table of Contents
INTCOMEX, INC.
NOTES TO CONSOLIDATED FINANCIAL STATEMENTS—(Continued)
(Dollars in thousands, except per share data)
| As of December 31, 2008 |
Gross Carrying Amount |
Accumulated Amortization |
Cumulative Foreign Currency Translation Effect |
Net Carrying Amount |
Useful Life (in years) | |||||||||||
| Identifiable intangible assets, net |
||||||||||||||||
| Customer relationships |
$ | 3,630 | $ | (1,299 | ) | $ | (512 | ) | $ | 1,819 | 10.0 | |||||
| Tradenames |
1,080 | (927 | ) | (34 | ) | 119 | 3.5 | |||||||||
| Non-compete agreements |
730 | (730 | ) | — | — | 3.0 | ||||||||||
| Patents—T.G.M. S.A. |
5 | (5 | ) | — | — | |||||||||||
| Total identifiable intangible assets, net |
$ | 5,445 | $ | (2,961 | ) | $ | (546 | ) | $ | 1,938 | ||||||
On June 23, 2005, the Company acquired a 100.0% interest in Centel, a distributor of IT products and peripherals located in Mexico. In connection with the acquisition, the Company acquired $5,440 in identifiable intangible assets of Centel, including $3,630 for acquired customer relationships with a 10 year useful life, $1,080 for tradenames with a 3.5 year weighted average useful life and $730 for non-compete agreements with a three year useful life. Centel is included as a wholly-owned subsidiary in the Company’s consolidated financial statements and its results of operations in the consolidated statements of operations. For the years ended December 31, 2009, 2008 and 2007, the Company recorded amortization expense related to the intangible assets of $471, $572 and $827, respectively. There was no impairment charge for identifiable intangible assets for the years ended December 31, 2009, 2008 and 2007.
Expected future identifiable intangible asset amortization as of December 31, 2009, is as follows:
| Fiscal Years |
|||
| 2010 |
$ | 386 | |
| 2011 |
363 | ||
| 2012 |
363 | ||
| 2013 |
363 | ||
| 2014 |
183 | ||
| Thereafter |
— | ||
| $ | 1,658 | ||
Goodwill
Goodwill represents the excess of the purchase price over the fair value of the net assets. In connection with our annual impairment test, we use current market capitalization, control premiums, discounted cash flows and other factors as the best evidence of fair value and to determine if our goodwill is impaired. The 2008 impairment test resulted in a substantially lower value attributable to our goodwill. The impairment charge represents the extent to which the carrying values exceed the fair value attributable to the goodwill. Fair values were determined based upon market conditions, the income approach which utilized cash flow projections and other factors.
F-22
Table of Contents
INTCOMEX, INC.
NOTES TO CONSOLIDATED FINANCIAL STATEMENTS—(Continued)
(Dollars in thousands, except per share data)
The changes in the carrying amount of goodwill for the year ended December 31, 2009, are as follows:
| Miami Operations |
In-Country Operations |
Total | ||||||||||
| Balance as of January 1, 2009 |
||||||||||||
| Goodwill |
$ | 11,531 | $ | 20,794 | $ | 32,325 | ||||||
| Accumulated impairment losses |
(11,531 | ) | (7,246 | ) | (18,777 | ) | ||||||
| Total goodwill |
— | 13,548 | 13,548 | |||||||||
| Goodwill acquired during the year |
— | — | — | |||||||||
| Impairment losses |
— | — | — | |||||||||
| Accumulated foreign currency translation effect |
— | 156 | 156 | |||||||||
| Balance as of December 31, 2009 |
||||||||||||
| Goodwill |
$ | 11,531 | 20,950 | 32,481 | ||||||||
| Accumulated impairment losses |
(11,531 | ) | (7,246 | ) | (18,777 | ) | ||||||
| Total goodwill |
$ | — | $ | 13,704 | $ | 13,704 | ||||||
Goodwill balance was $13,704 and $13,548 as of December 31, 2009 and 2008, respectively. For the year ended December 31, 2009, the carrying amount of the goodwill increased by $156 which relates to the cumulative foreign currency translation effect of the Mexican Peso. There was no impairment charge for goodwill for the years ended December 31, 2009 and 2007. We recorded a goodwill impairment charge of $18,777 during the year ended December 31, 2008. For the year ended December 31, 2008, the carrying amount of the goodwill decreased by $20,709, of which $1,932 relates to the cumulative foreign currency translation effect of the Mexican Peso and $18,777 relates to the goodwill impairment charge. We recorded a goodwill impairment charge of $11,531 related to our Miami Operations and $7,246 related to our In-country Operations, particularly $4,086 in Mexico, $1,294 in Guatemala, $1,157 in Jamaica, $471 in El Salvador and $238 in Argentina.
Note 5. Lines of Credit
The Company has lines of credit, short-term overdraft and credit facilities with various financial institutions in the countries in which the Company conducts business. Many of the In-country Operations also have limited credit facilities. These credit facilities fall into the following categories: asset-based financing facilities, letters of credit and performance bond facilities, and unsecured revolving credit facilities and lines of credit. The lines of credit are available sources of short-term liquidity for the Company.
The outstanding balance of lines of credits consisted of the following for the periods presented:
| As of December 31, | ||||||
| 2009 | 2008 | |||||
| Lines of credit |
||||||
| SBA—Miami |
$ | 9,165 | $ | 23,643 | ||
| Intcomex Peru S.A.C. |
2,443 | 3,942 | ||||
| Intcomex de Ecuador, S.A. |
1,000 | 522 | ||||
| TGM S.A.—Uruguay |
714 | 1,617 | ||||
| Intcomex de Guatemala, S.A. |
664 | 300 | ||||
F-23
Table of Contents
INTCOMEX, INC.
NOTES TO CONSOLIDATED FINANCIAL STATEMENTS—(Continued)
(Dollars in thousands, except per share data)
| As of December 31, | ||||||
| 2009 | 2008 | |||||
| Computación Monrenca Panama, S.A. |
501 | — | ||||
| Intcomex Costa Rica Mayorista en Equipo de Cómputo, S.A. |
242 | — | ||||
| Intcomex Colombia, LTDA |
— | 1,017 | ||||
| Total lines of credit |
$ | 14,729 | $ | 31,041 | ||
As of December 31, 2009 and 2008, the total amounts available under the credit facilities were $17,055 and $14,447, respectively. The change in the outstanding balance was primarily attributed to the decreased borrowing by SBA resulting from the new three-year revolving credit facility that replaced SBA’s existing revolving credit facility on December 22, 2009. The change was also attributed to a reduction in the borrowing requirements related to our operations in Peru and Uruguay, slightly offset by the increased borrowing by our subsidiaries in Ecuador, Guatemala, Panama and Costa Rica to meet local working capital requirements.
SBA Miami—Senior Secured Revolving Credit Facility
On December 22, 2009, SBA closed a senior secured revolving credit facility (the “Senior Secured Revolving Credit Facility”) with Comerica Bank pursuant to SBA and Comerica Bank’s commitment letter dated October 23, 2009 to replace the existing revolving credit facility with a new three-year facility.
The aggregate size of the facility is $20,000 (with a possible increase of an additional $10,000) including $200 of letter of credit commitments, and a capital expenditures limit of $1,000. The facility matures in January 2013. Under the Senior Secured Revolving Credit Facility, at SBA’s option, interest is due monthly and the amounts due bear interest at the daily adjustable LIBOR rate (at no time less than 2.0%) plus 3.5%, unless in the event of a default when interest will accrue at a rate equal to 3.0% per annum above the otherwise applicable rate. In addition, SBA will pay an administrative fee of $30,000 per annum and a facility fee equal to 0.50% of the aggregate amount of the revolving credit commitment, payable quarterly in arrears. Additional customary fees will be payable upon the issuance of letters of credit.
The Senior Secured Revolving Credit Facility contains a number of covenants that, among other things, restrict SBA’s ability to (i) incur additional indebtedness; (ii) make certain capital expenditures; (iii) guarantee certain obligations; (iv) create or allow liens on certain assets; (v) make investments, loans or advances; (vi) pay dividends, make distributions or undertake stock and other equity interest buybacks; (vii) make certain acquisitions; (viii) engage in mergers, consolidations or sales of assets; (ix) use the proceeds of the revolving credit facility for certain purposes; (x) enter into transactions with affiliates in non-arms’ length transactions; (xi) make certain payments on subordinated indebtedness; and (xii) acquire or sell subsidiaries. The Senior Secured Revolving Credit Facility also requires SBA to maintain certain ratios of debt, income, net worth and other restrictive financial covenants.
Borrowings under the new Senior Secured Revolving Credit Facility are secured on a first priority basis with all the assets of SBA. Amounts borrowed under the facility could be repaid and re-borrowed at any time during the term of the facility. Borrowing capacity is established monthly based on certain parameters established under the facility. Advances under the facility were provided based on 85.0% of eligible domestic and foreign accounts receivable plus 60.0% of eligible domestic inventory, less any credit facility reserves. The credit facility contained certain financial and non-financial covenants, including but not limited to, maintenance of a minimum level of tangible effective net worth, as defined and annual limitations on capital expenditures.
F-24
Table of Contents
INTCOMEX, INC.
NOTES TO CONSOLIDATED FINANCIAL STATEMENTS—(Continued)
(Dollars in thousands, except per share data)
On August 25, 2005, SBA entered into a revolving credit facility with Comerica Bank (the “Revolving Credit Facility”) with a maturity date of January 1, 2010. As of December 31, 2008, SBA had $30,000 available under the Revolving Credit Facility, including $1,400 of letter of credit commitments, and a capital expenditures limit of $1,000. Borrowings against the Revolving Credit Facility had interest at the Eurodollar rate plus 3.5% due monthly and were secured on a first priority basis with all the assets of SBA. The Revolving Credit Facility contained certain financial and non-financial covenants, including but not limited to, maintenance of a defined minimum level of tangible effective net worth and annual limitations on capital expenditures. Borrowing capacity was determined monthly based on certain parameters established under the facility and amounts borrowed under the Revolving Credit Facility were required to be repaid and re-borrowed at any time during the term of the facility. Advances under the Revolving Credit Facility were provided based on 85.0% of eligible domestic accounts receivable and 85.0% of eligible foreign accounts receivable plus 60.0% of eligible domestic inventory, less any credit facility reserves.
On March 20, 2009, SBA obtained a waiver to the Revolving Credit Facility from Comerica Bank for its senior debt to tangible effective net worth ratio, minimum tangible effective net worth and net income as of December 31, 2008. SBA also obtained an amendment to the facility for the definitions of the borrowing base, revolving credit note and SBA’s permitted investments. The amendment allowed SBA to issue commercial letters of credit and standby letters of credit, not to exceed $2,000 at any one time outstanding. Borrowings against the Revolving Credit Facility bore interest at the daily adjustable LIBOR rate (at no time less than 2.0%) plus the applicable margin of 4.0%. SBA was required to provide accounts payable aging, insurance and borrowing base certificates on a bi-weekly basis, and maintain monthly stated levels of EBITDA. SBA and its guarantor were required to maintain quarterly stated levels of net income, effective March 31, 2009 to December 31, 2009.
As of December 31, 2009, SBA’s outstanding draws against the Senior Secured Revolving Credit Facility were $5,853 and the remaining amount available was $10,835. As of December 31, 2008, SBA’s outstanding draws against the Revolving Credit Facility were $21,476 and the remaining amount available was $4,957. As of December 31, 2009 and 2008, SBA’s outstanding checks issued in excess of bank balances were $3,312 and $2,167, respectively, and outstanding stand-by undrawn letters of credit were $19,800 and $11,150, respectively. As of December 31, 2009, the Company was in compliance with all of the covenants under the Senior Secured Revolving Credit Facility.
Intcomex Peru S.A.C.
Intcomex Peru S.A.C. (“Intcomex Peru”) has four lines of credit with two financial institutions. The lines are collateralized with a guarantee from Holdings. The lines of credit carry interest rates ranging from 3.0% to 11.0%, each of which matures in January 2011.
Intcomex de Ecuador, S.A.
Intcomex de Ecuador, S.A. (“Intcomex Ecuador”) had two lines of credit with a local financial institution. The lines of credit had interest rates of 9.3% and 9.8% and mature in March 2010.
T.G.M. S.A.
TGM S.A. – Uruguay (“Intcomex Uruguay”) has one line of credit with a local financial institution. The line of credit carries an interest rate of 8.0% and matures in June 2010.
F-25
Table of Contents
INTCOMEX, INC.
NOTES TO CONSOLIDATED FINANCIAL STATEMENTS—(Continued)
(Dollars in thousands, except per share data)
Intcomex de Guatemala, S.A.
Intcomex de Guatemala, S.A. (“Intcomex Guatemala”) has a line of credit with a local financial institution. The line of credit have interest rate of 9.0%, which matures in May 2012.
Computación Monrenca Panama, S.A.
Computación Monrenca Panama, S.A. (“Intcomex Panama”) had a line of credit with a local financial institutions carrying an interest rate ranging from 7.0% to 9.0%, which matures in June 2010.
Intcomex Costa Rica Mayorista en Equipo de Cómputo, S.A
Intcomex Costa Rica Mayorista en Equipo de Cómputo, S.A. (“Intcomex Costa Rica”) had one line of credit with a local financial institutions carrying an interest rate of LIBOR plus 7%, which matures in August 2010.
Note 6. Long-Term Debt
Long-term debt consisted of the following for the periods presented:
| As of December 31, | ||||||||
| 2009 | 2008 | |||||||
| Long-term debt, net of current portion |
||||||||
| Intcomex, Inc. – 13 1/4% Senior Notes, net of $6,684 discount |
$ | 113,346 | $ | — | ||||
| Intcomex, Inc. – 11 3/4% Senior Notes, net of $1,132 discount |
— | 103,630 | ||||||
| SBA – Capital lease |
847 | 1,135 | ||||||
| Intcomex Peru – Collateralized notes |
579 | 721 | ||||||
| Other, including various capital leases |
210 | 379 | ||||||
| Total long-term debt |
114,982 | 105,865 | ||||||
| Current maturities of long-term debt |
(557 | ) | (617 | ) | ||||
| Total long-term debt, net of current portion |
$ | 114,425 | $ | 105,248 | ||||
Annual maturities of long-term debt as of December 31, 2009 are as follows:
| Fiscal Years |
|||
| 2010 |
$ | 557 | |
| 2011 |
5,549 | ||
| 2012 |
5,413 | ||
| 2013 |
10,147 | ||
| 2014 and thereafter |
100,000 | ||
| $ | 121,666 | ||
Intcomex, Inc. – 13 1/4% Senior Notes
On December 10, 2009, the Company completed a private offering (the “13 1/4% Senior Notes Offering”) to eligible purchasers of $120,000 aggregate principal amount of its 13 1/4% Senior Notes due December 15, 2014 with an interest rate of 13.25% per year, payable semi-annually on June 15 and December 15 of each year, commencing on June 15, 2010. The 13 1/4% Senior Notes were offered at an initial offering price of 94.43% of par, or an effective yield to maturity of approximately 14.875%.
F-26
Table of Contents
INTCOMEX, INC.
NOTES TO CONSOLIDATED FINANCIAL STATEMENTS—(Continued)
(Dollars in thousands, except per share data)
The Company used the net proceeds from the 13 1/4% Senior Notes Offering to, among other things, repay borrowings under its Senior Secured Revolving Credit Facility, fund the repurchase, redemption or other discharge of its 11 3/4% Senior Notes, for which it conducted a tender offer, and for general corporate purposes. The 13 1/4% Senior Notes are guaranteed by all of the Company’s existing and future domestic restricted subsidiaries that guarantee its obligations under the Senior Secured Revolving Credit Facility.
In connection with the 13 1/4% Senior Notes Offering, the Company and certain subsidiaries of the Company that guaranteed the Company’s obligations (the “Guarantors”) entered into an indenture (the “13 1/4 % Senior Notes Indenture”) with The Bank of New York Mellon Trust Company, N.A., (the “Trustee”), relating to the issuance by the Company of $120,000 aggregate principal amount of the 13 1/4% Senior Notes due 2014. The 13 1/4% Senior Notes were sold in a private placement transaction. The Company’s obligations under the 13 1/4% Senior Notes and the Guarantors’ obligations under the guarantees will be secured on a second priority basis by a lien on 100% of the capital stock of certain of the Company’s and each Guarantor’s directly owned domestic restricted subsidiaries; 65% of the capital stock of the Company’s and each Guarantor’s directly owned foreign restricted subsidiaries; and substantially all the assets of SBA, to the extent that those assets secure the Company’s Senior Secured Revolving Credit Facility with Comerica Bank, subject to certain exceptions.
Subject to certain requirements, the Company is required to redeem $5,000 aggregate principal amount of the 13 1/4% Senior Notes on December 15 of each of the years 2011 and 2012 and $10,000 aggregate principal amount of the 13 1/4% Senior Notes on December 15, 2013 at a redemption price equal to 100% of the aggregate principal amount of the 13 1/4% Senior Notes to be redeemed, together with accrued and unpaid interest to the redemption date subject to certain requirements. The Company may redeem the 13 1/4% Senior Notes, in whole or in part, at any time prior to December 15, 2012 at a price equal to 100% of the aggregate principal amount of the 13 1/4% Senior Notes plus a “make-whole” premium. At any time prior to December 15, 2012, the Company is required to redeem up to 35% of the aggregate principal amount of the 13 1/4% Senior Notes with the net cash proceeds of certain equity offerings and up to 10% of the original aggregate principal amount of the 13 1/4% Senior Notes (but no more than once in any 12-month period) if an initial public offering occurs on or prior to December 15, 2012, at a price equal to 113.25% of the principal amount of the 13 1/4% Senior Notes.
On December 22, 2009, the Company, the Trustee and the Guarantors executed a second supplemental indenture (the “11 3/4% Senior Notes Second Supplemental Indenture”) as a result of the receipt of tenders and related consents from the holders of at least two thirds in principal amount of the 11 3/4% Senior Notes, in response to the Company’s tender offer and consent solicitation. The 11 3/4% Senior Notes Second Supplemental Indenture amends the indenture governing the 11 3/4% Senior Notes to delete or make less restrictive substantially all of the restrictive covenants contained in such indenture (other than requirements to make an offer for the 11 3/4% Senior Notes in the event of certain asset sales), to delete events of default relating to covenant defaults, cross-defaults and judgments against the Company, to make conforming and related changes to the indenture, to reduce the minimum redemption notice period from 30 days to three days.
Also on December 22, 2009, in connection with the 13 1/4% Senior Notes Offering, certain of the Company’s existing shareholders and their affiliates contributed $20,001 of new capital in exchange for newly-issued shares of the Company’s common stock. Certain of the Company’s existing shareholders and their affiliates contributed $20,001 of new capital in exchange for 27,175 newly-issued shares of our Class B Common Stock, non-voting, through a subscription agreement. The capital contribution consisted of the redemption and cancellation of $15,144 face value of the 11 3/4% Senior Notes, $890 of tender premium paid on the settlement of the 11 3/4% Senior Notes and additional cash of $3,967.
F-27
Table of Contents
INTCOMEX, INC.
NOTES TO CONSOLIDATED FINANCIAL STATEMENTS—(Continued)
(Dollars in thousands, except per share data)
For the year ended December 31, 2009, we recorded additional paid in capital of $20,001 related to the 13 1/4% Senior Notes. The Company did not record additional paid in capital related to our 13 1/4% Senior Notes for the year ended December 31, 2008. As of December 31, 2009, $113,346 of the 13 1 /4% Senior Notes remained outstanding and as of December 31, 2008, there were no 13 1/4% Senior Notes outstanding.
Intcomex, Inc. – 11 3/4% Senior Notes
On August 25, 2005, the Company consummated a high yield debt offering of $120,000 in aggregate principal amount of 11 3/4% Senior Notes, due January 15, 2011. The 11 3/4% Senior Notes were sold at 99.057 of face value and carry a coupon rate of 11 3/4% and are a second priority senior secured obligation of the Company. The 11 3/4% Senior Notes are secured with 100.0% of the common shares of Holdings and SPC-I, 65.0% of the common shares of IXLA, with a second priority lien on the assets of SBA. The proceeds of the offering were used to repay existing indebtedness, pay a dividend to shareholders, and pay fees and expenses associated with the debt offering with the remaining balance to be used for general corporate purposes. On December 14, 2006, the Company completed the exchange of 100.0% of the outstanding principal of the 11 3/4% Senior Notes for SEC registered publicly tradable notes that have substantially identical terms and conditions as the initial notes. On or after January 15, 2007, the Company was eligible to redeem a portion or all of the 11 3/4% Senior Notes.
On March 13, 2008, the Company purchased $1,000 of its 11 3/4% Senior Notes in an arm’s length transaction, at 98.25 of face value plus accrued interest in connection with its mandatory sinking fund redemption requirement. On April 9, 2008, the Company purchased $1,000 of its 11 3/4% Senior Notes at 96.25 of face value plus accrued interest and an additional $1,000 on April 25, 2008, at 96.5 of face value plus accrued interest in arms’ length transactions in connection with its mandatory sinking fund redemption requirement. On June 24, 2008, the Company purchased $2,000 of its 11 3/4% Senior Notes in an arm’s length transaction at 90.00 of face value plus accrued interest in connection with its mandatory sinking fund redemption requirement. On November 11, 2008, the Company purchased $5,000 of its 11 3/4% Senior Notes in an arm’s length transaction, at 49.00 of face value plus accrued interest, in connection with its mandatory sinking fund redemption requirement. On December 19, 2008, the Company purchased $1,000 of its 11 3/4% Senior Notes in an arm’s length transaction, at 37.00 of face value plus accrued interest.
On January 13 and 14, 2009, the Company repurchased $1,000 of its 11 3/4% Senior Notes in arm’s length transactions on each day, at 40.00 of face value plus accrued interest. On February 11 and 23, 2009, the Company repurchased $1,500 and $1,560, respectively, of its 11 3/4% Senior Notes in arm’s length transactions, at 36.00 of face value plus accrued interest. On March 26, 2009, the Company repurchased $1,025 of its 11 3/4% Senior Notes in arm’s length transactions, at 36.00 of face value plus accrued interest. On June 23, 2009, the Company repurchased $1,000 of its 11 3/4% Senior Notes in arm’s length transactions, at 40.38 of face value plus accrued interest. On July 15, 2009, the Company made a mandatory interest payment of $5,754 on its 11 3/4% Senior Notes.
On December 8, 2009, the Company commenced a cash tender offer for any and all of its $96,915 aggregate principal amount of 11 3/4% Senior Notes which expired on January 6, 2010, unless extended or earlier terminated (the “11 3/4% Senior Notes Expiration Date”), to provide holders who validly tender their 11 3/4% Senior Notes on December 21, 2009, unless extended or earlier terminated (the “11 3/4% Senior Notes Payment Deadline”), the ability to receive $1.0075 payable in cash, for each $1 principal amount of 11 3/4% Senior Notes accepted for payment, which amount included a consent payment of $0.30 per $1 principal amount and accrued and unpaid interest up to, but not including, the applicable payment date. The 11 3/4% Senior Notes tendered on or prior to the 11 3/4% Senior Notes Payment Deadline received payment on December 22, 2009. Holders who validly
F-28
Table of Contents
INTCOMEX, INC.
NOTES TO CONSOLIDATED FINANCIAL STATEMENTS—(Continued)
(Dollars in thousands, except per share data)
tendered their 11 3/4% Senior Notes after the 11 3/4% Senior Notes Payment Deadline but on or prior to the 11 3/4 % Senior Notes Expiration Date received $0.9775, payable in cash, for each $1 principal amount of 11 3/4% Senior Notes accepted for purchase and accrued and unpaid interest through the applicable payment date. The 11 3/4% Senior Notes tendered after the 11 3/4% Senior Notes Payment Deadline but before the 11 3/4% Senior Notes Expiration Date received payment promptly following the expiration of the offer. The Company financed the tender offer with the net cash proceeds of the new 13 1/4% Senior Notes Offering. The closing of the tender offer was conditioned, among other things, on the Company’s successful completion of the 13 1/4% Senior Notes Offering.
The Company recognized a gain on the redemption of its 11 3/4 % Senior Notes of $4,411 and $3,470, respectively, for the years ended December 31, 2009 and 2008, which is included in other expense (income), net in the consolidated statements of operations. As of December 31, 2008, $103,630, net of current portion, of the 11 3/4% Senior Notes remained outstanding. As of December 31, 2009 $1,400 of the 11 3/4% Senior Notes remained outstanding and were redeemed through payment to the Trustee for settlement on January 15, 2010.
On January 15, 2010, $1,400 of the 11 3/4% Senior Notes not tendered in the early tender redemption period, were redeemed from the proceeds held by the Trustee, in accordance with the terms of the 11 3/4% Senior Notes Second Supplemental Indenture.
SBA – Capital lease
On April 30, 2007, SBA entered into a lease agreement with Comerica Bank in the principal amount of $1,505 for the lease of the Miami office and warehouse equipment. Interest is due monthly at 6.84% of the total equipment costs and all outstanding amounts are due April 30, 2012. As of December 31, 2009 and 2008, $847 and $1,135, respectively, remained outstanding under the lease agreement.
The Company’s effective borrowing rate was 13.1%, 12.4% and 12.6% as of December 31, 2009, 2008 and 2007, respectively.
Note 7. Income Taxes
Income tax provision consists of the following for the periods presented:
| For the Years Ended December 31, | ||||||||||||
| 2009 | 2008 | 2007 | ||||||||||
| Income tax provision |
||||||||||||
| Current expense (benefit): |
||||||||||||
| Federal and state |
$ | 65 | $ | 81 | $ | 25 | ||||||
| Foreign |
3,255 | 4,856 | 6,850 | |||||||||
| Total current expense |
3,320 | 4,937 | 6,875 | |||||||||
| Deferred (benefit) benefit: |
||||||||||||
| Federal and state |
(65 | ) | (3,007 | ) | (4,026 | ) | ||||||
| Foreign |
(411 | ) | (335 | ) | (1,982 | ) | ||||||
| Total deferred benefit |
(476 | ) | (3,342 | ) | (6,008 | ) | ||||||
| Total income tax provision |
$ | 2,844 | $ | 1,595 | $ | 867 | ||||||
F-29
Table of Contents
INTCOMEX, INC.
NOTES TO CONSOLIDATED FINANCIAL STATEMENTS—(Continued)
(Dollars in thousands, except per share data)
A reconciliation of the statutory federal income tax rate and effective rate as a percentage of income before provision for income taxes consisted of the following for the periods presented:
| For the Years Ended December 31, | |||||||||||||||||||||
| 2009 | % | 2008 | % | 2007 | % | ||||||||||||||||
| Effective tax rate |
|||||||||||||||||||||
| (Loss) income before provision for income taxes: |
|||||||||||||||||||||
| U.S. |
$ | (9,028 | ) | $ | (25,412 | ) | $ | (10,556 | ) | ||||||||||||
| Foreign |
19,065 | (8,311 | ) | 23,984 | |||||||||||||||||
| Income (loss) before provision for income taxes |
$ | 10,037 | ($ | 33,723 | ) | $ | 13,428 | ||||||||||||||
| Tax at statutory rate |
$ | 3,413 | 34 | % | $ | (11,466 | ) | (34 | )% | $ | 4,565 | 34 | % | ||||||||
| State income taxes, net of federal income tax (benefit) provision |
(360 | ) | (4 | )% | (700 | ) | (2 | )% | (602 | ) | (4 | )% | |||||||||
| Non-deductible impairment charge |
— | — | 6,384 | 19 | % | — | — | ||||||||||||||
| Effect of tax rates on non-U.S. operations |
(2,943 | ) | (29 | )% | 3,144 | 9 | % | (3,071 | ) | (23 | )% | ||||||||||
| Effect of tax rates on subpart F income |
1,104 | 11 | % | — | — | — | — | ||||||||||||||
| Change in valuation allowance |
1,630 | 16 | % | 4,233 | 13 | % | (25 | ) | — | ||||||||||||
| Effective tax provision |
$ | 2,844 | 28 | % | $ | 1,595 | 5 | % | $ | 867 | 7 | % | |||||||||
Our effective tax rate was 28% and 5% for the years ended December 31, 2009 and 2008, respectively. The increase in the effective tax rate was primarily due to the existence of taxable earnings in several of our foreign operations and the recognition of subpart F income, offset slightly by the absence of non-taxable income in our U.S. operations.
F-30
Table of Contents
INTCOMEX, INC.
NOTES TO CONSOLIDATED FINANCIAL STATEMENTS—(Continued)
(Dollars in thousands, except per share data)
The Company’s net deferred tax assets were attributable to the following for the periods presented:
| As of December 31, | ||||||||
| 2009 | 2008 | |||||||
| Deferred tax assets |
||||||||
| Current assets: |
||||||||
| Allowance for doubtful accounts |
$ | 1,053 | $ | 960 | ||||
| Inventories |
633 | 725 | ||||||
| Accrued expenses |
738 | 621 | ||||||
| Other |
140 | 296 | ||||||
| Total current assets |
2,564 | 2,602 | ||||||
| Non-current assets: |
||||||||
| Tax goodwill |
864 | 864 | ||||||
| Net operating losses |
15,520 | 13,225 | ||||||
| Other |
1,164 | 974 | ||||||
| Valuation allowances |
(6,432 | ) | (4,802 | ) | ||||
| Total non-current assets |
11,116 | 10,261 | ||||||
| Total deferred tax assets |
$ | 13,680 | $ | 12,863 | ||||
| Deferred tax liabilities |
||||||||
| Current liabilities: |
||||||||
| Inventories |
$ | (231 | ) | $ | (328 | ) | ||
| Total current liabilities |
(231 | ) | (328 | ) | ||||
| Non-current liabilities: |
||||||||
| Fixed assets |
(1,923 | ) | (1,467 | ) | ||||
| Amortizable intangible assets |
(614 | ) | (746 | ) | ||||
| Inventories |
(246 | ) | (132 | ) | ||||
| Total non-current liabilities |
(2,783 | ) | (2,345 | ) | ||||
| Total deferred tax liabilities |
(3,014 | ) | (2,673 | ) | ||||
| Net deferred tax assets |
$ | 10,666 | $ | 10,190 | ||||
As of December 31, 2009 and 2008, the balance of SBA’s tax goodwill was $2,297 and 2,953, respectively. SBA recorded tax goodwill of approximately $9,843 in July 1998, which is being amortized for tax purposes over 15 years. SBA established $262 of deferred tax assets for foreign withholding taxes paid in El Salvador during 2005.
As of December 31, 2009, the Company’s U.S. federal and state of Florida net operating losses (“NOLs”) resulted in $13,271 of deferred tax assets, which will begin to expire in 2026. The Company analyzed the available evidence related to the realization of the deferred tax assets, considered the current downturn in the recent global economic environment and determined it is now more likely than not that the Company will not recognize a portion of its deferred tax assets associated with the NOL carryforwards. Factors in management’s determination include the performance of the business and the feasibility of ongoing tax planning strategies.
F-31
Table of Contents
INTCOMEX, INC.
NOTES TO CONSOLIDATED FINANCIAL STATEMENTS—(Continued)
(Dollars in thousands, except per share data)
As of December 31, 2009 and 2008, the Company recorded a valuation allowance of $6,432 and $4,802, respectively, against the respective NOLs, of which $4,467 and $2,723, respectively, related to the U.S. and $1,965 and $2,079, respectively, related to our In-country Operations, as management did not believe that it would fully realize their benefit at this time.
As of December 31, 2009, Intcomex Argentina S.R.L. (“Intcomex Argentina”) had $4,023 in NOLs resulting in $1,408 of deferred tax assets, which will begin to expire in 2011. The Company recorded a valuation allowance of $1,408 against this NOL, as management does not believe that it will realize its full benefit at this time.
As of December 31, 2009, Intcomex SPC-1 Mexico had $1,096 in NOLs resulting in $307 of deferred tax assets, which will expire in 2018. The Company recorded a $307 valuation allowance against this NOL, as management does not believe that it will realize its full benefit at this time.
As of December 31, 2009, Intcomex Colombia LTDA (“Intcomex Colombia”) had $830 in NOLs resulting in $275 of deferred tax assets related to a NOL carryforward. Management established a $250 valuation allowance against the deferred tax assets pending Intcomex Colombia’s further growth in taxable income. Colombia allows for an eight year carryforward on NOLs, which expires in 2013.
As of December 31, 2009, the Company did not recognize any subpart G income related to intercompany loans from its foreign affiliates. As of December 31, 2009, the Company recognized $3,248 in subpart F income, as the Company considers this a one-time event and therefore, did not provide additional tax provisions for future realization of subpart F income.
The Company’s NOLs consisted of the following for the periods presented:
| Years Ended December 31, | ||||||||||||||||||
| 2009 | 2008 | |||||||||||||||||
| Gross NOL |
NOL-Deferred Tax Asset |
Valuation Allowance |
Gross NOL |
NOL-Deferred Tax Asset |
Valuation Allowance | |||||||||||||
| U.S. federal and state |
$ | 34,723 | $ | 13,271 | $ | 4,467 | $ | 28,745 | $ | 10,881 | $ | 2,723 | ||||||
| Foreign |
||||||||||||||||||
| Intcomex Argentina , S.R.L. |
4,023 | 1,408 | 1,408 | 4,348 | 1,522 | 1,522 | ||||||||||||
| Intcomex Colombia |
830 | 275 | 250 | 830 | 275 | 250 | ||||||||||||
| Intcomex Jamaica Ltd. |
720 | 251 | — | 720 | 240 | — | ||||||||||||
| Intcomex SPC-1 Mexico |
1,096 | 307 | 307 | 1,096 | 307 | 307 | ||||||||||||
| Total foreign |
6,669 | 2,241 | 1,965 | 6,994 | 2,344 | 2,079 | ||||||||||||
| Total |
$ | 41,392 | $ | 15,512 | $ | 6,432 | $ | 35,739 | $ | 13,225 | $ | 4,802 | ||||||
The undistributed earnings in foreign subsidiaries are permanently invested abroad and will not be repatriated to the U.S. in the foreseeable future. Because they are considered to be indefinitely reinvested, no U.S. federal or state deferred income taxes have been provided on these earnings. Upon distribution of those earnings, in the form of dividends or otherwise, we would be subject to both U.S. income taxes (subject to an adjustment for foreign tax credits) and withholding taxes payable to the various foreign countries in which we operate. Because of the availability of U.S. foreign tax credits, it is not practicable to determine the U.S. foreign income tax liability that would be payable if such earnings were not reinvested indefinitely.
F-32
Table of Contents
INTCOMEX, INC.
NOTES TO CONSOLIDATED FINANCIAL STATEMENTS—(Continued)
(Dollars in thousands, except per share data)
The Company files tax returns in the U.S., the state of Florida and in various foreign jurisdictions in which the Company conducts business throughout Latin America and the Caribbean. The IRS examined the 2004 and 2005 tax returns and concluded that there was no change to the returns. Tax year 2006 remains open for examination by the IRS. Tax years 2004, 2005 and 2006 remain open for examination by the Florida Department of Revenue.
The Company is subject to periodic audits by foreign, domestic and state tax authorities. By statute, the Company’s U.S. federal returns are subject to examination by the IRS for fiscal years 2005 through 2007. We believe the Company’s accruals for tax liabilities are adequate for all open fiscal years based upon an assessment of factors, including but not limited to, historical experience and related tax law interpretations. We do not anticipate that the total amount of unrecognized tax benefits related to any particular tax position will change significantly within the next 12 months.
The Company classifies tax liabilities that are expected to be paid within the current year, if any, as current income tax liabilities and all other uncertain tax positions as non-current income tax liabilities. The Company recognizes interest and penalties related to income tax matters in income tax expense.
Note 8. Fair Value of Derivative Instruments
The Company accounts for its derivative instruments and hedging activities in accordance with FASB ASC 815, Derivatives and Hedging. The Company is exposed to certain risks related to its ongoing business operations. By using derivative instruments, the Company manages its primary risks including foreign currency price risk. The Company enters into forward contracts on various foreign currencies to manage the price risk associated with forecasted purchases of inventory used in the Company’s normal business activities. The Company provides enhanced disclosures of its derivative instruments including how and why it uses derivative instruments, how it accounts for derivative instruments and related hedged items and how derivative instruments and related hedged items affect the Company’s financial position, financial performance, and cash flows.
All derivatives are recorded in the Company’s consolidated balance sheet at fair value. The fair value of derivative financial instruments represents the amount required to enter into similar offsetting contracts with similar remaining maturities based on quoted market prices. The notional amount of forward exchange contracts is the amount of foreign currency bought or sold at maturity. The notional amount is indicative of the extent of the Company’s involvement in the various types and uses of derivative financial instruments, but not a measure of the Company’s exposure to credit or market risks through its use of derivatives.
F-33
Table of Contents
INTCOMEX, INC.
NOTES TO CONSOLIDATED FINANCIAL STATEMENTS—(Continued)
(Dollars in thousands, except per share data)
There were no derivatives designated as hedging instruments outstanding as of December 31, 2009 and 2007. As of December 31, 2008, the total notional amount of the foreign currency forward contracts was $11,800, relating to derivative instruments in two of our In-country Operations. A summary of the location and amounts of the fair value in the consolidated balance sheets and derivative losses in the statements of operations related to the Company’s derivatives designated as hedging instruments during the periods presented, consisted of the following:
Effect of Derivative Instruments on the Consolidated Balance Sheets as of December 31, 2009 and 2008:
| As of December 31, | ||||||
| 2009 | 2008 | |||||
| Fair Value(1)(2) | Fair Value(1)(2) | |||||
| Derivatives instruments: |
||||||
| Foreign currency forward |
$ | — | $ | 31 | ||
| Total |
$ | — | $ | 31 | ||
Effect of Derivative Instruments on the Consolidated Statements of Operations for the Years Ended December 31, 2009, 2008 and 2007:
| For the Years Ended December 31, | |||||||||
| 2009 | 2008 | 2007 | |||||||
| (Gain)/Loss(3) | (Gain)/Loss(3) | (Gain)/Loss(3) | |||||||
| Derivatives instruments: |
|||||||||
| Foreign currency forward |
$ | — | $ | 31 | $ | — | |||
| Total |
$ | — | $ | 31 | $ | — | |||
| (1) | – Other observable inputs (Level 2). |
| (2) | – Recorded in accounts payable in the consolidated balance sheets. |
| (3) | – Recorded in other expense (income) in the consolidated statements of operations. |
Note 9. Share-Based Compensation
The Company recognizes compensation expense for its share-based compensation plans utilizing the modified prospective method for awards issued, modified, repurchased or canceled under the provisions of FASB ASC 718, Compensation-Stock Compensation. Share-based compensation expense is based on the fair value of the award and measured at grant date, recognized as an expense in earnings over the requisite service period and is recorded in salaries, wages and benefits in the consolidated statements of operations as part of selling, general and administrative expenses.
Total compensation expense for share-based compensation arrangements charged against income were $249, $313 and $199, respectively, for the years ended December 31, 2009, 2008 and 2007. Compensation expense of $188 and $281, respectively, related to the stock options issued pursuant to the 2007 Founders’ Grant Stock Option Plan (the “2007 Founders’ Option Plan”) and $61 and $32 respectively, related to the restricted shares of Class B common stock, non-voting, issued pursuant to the 2008 Restricted Stock Issuances was charged against income during the years ended December 31, 2009 and 2008. Compensation expense of $199 related to the stock options issued pursuant to the 2007 Founders’ Option Plan for the year ended December 31, 2007.
F-34
Table of Contents
INTCOMEX, INC.
NOTES TO CONSOLIDATED FINANCIAL STATEMENTS—(Continued)
(Dollars in thousands, except per share data)
There was no compensation expense related to the restricted shares of Class B common stock, non-voting, charged against income during the year ended December 31, 2007, as there were no restricted shares issued or outstanding during the year.
As of December 31, 2009 and 2008, there were $203 and $521, respectively, of total outstanding compensation costs for unvested share-based compensation arrangements, of which $56 and $363, respectively, related to the stock options and $147 and $158, respectively, related to the restricted shares of Class B common stock, non-voting. As of December 31, 2007, there was $672 of total outstanding compensation costs for unvested share-based compensation arrangements related to the stock options. There were no outstanding compensation costs for unvested share-based compensation arrangements related to the restricted shares of Class B common stock, non-voting as of December 31, 2007, as there were no restricted shares issued or outstanding during the year. These compensation costs will be recognized over a weighted average period of 2.0 years.
Stock Options
There were no stock options granted during the years ended December 31, 2009 and 2008. As of December 31, 2009 and 2008, the number of options vested was 853 and 497, respectively. The options were antidilutive as of December 31, 2009 and 2008, as the fair value of the options was below the exercise price of the options.
A summary of the stock option activity under the 2007 Founders’ Option Plan and changes during the periods presented, consisted of the following:
| Outstanding Shares |
Weighted-Average Exercise Price per Share |
Exercisable Shares |
|||||||
| Balance at January 1, 2007 |
1,540 | $ | 1,077 | — | |||||
| Granted |
— | — | — | ||||||
| Exercised |
— | — | — | ||||||
| Forfeited or expired |
— | — | — | ||||||
| Balance at December 31, 2007 |
1,540 | $ | 1,077 | — | |||||
| Granted |
— | — | 513 | ||||||
| Exercised |
— | — | — | ||||||
| Forfeited or expired |
(50 | ) | — | (16 | ) | ||||
| Balance at December 31, 2008 |
1,490 | $ | 1,077 | 497 | |||||
| Granted |
— | — | 426 | ||||||
| Exercised |
— | — | — | ||||||
| Forfeited or expired |
(210 | ) | $ | 1,077 | (70 | ) | |||
| Balance at December 31, 2009 |
1,280 | $ | 1,077 | 853 | |||||
The fair value of the options was determined using the Black-Scholes option pricing model as of April 23, 2007, the measurement date or the date the Company received unanimous approval from shareholders for the 2007 Founders’ Option Plan. The Black-Scholes option pricing model was developed for use in estimating the fair value of traded options. This model requires the input of subjective assumptions, including expected price volatility and term. Changes in these subjective assumptions can materially affect the fair value of the estimate,
F-35
Table of Contents
INTCOMEX, INC.
NOTES TO CONSOLIDATED FINANCIAL STATEMENTS—(Continued)
(Dollars in thousands, except per share data)
and therefore, existing valuation models do not provide a precise measure of the fair value of the Company’s employee stock options. Projected data related to the expected volatility and expected life of stock options is typically based upon historical and other information. The fair value of the options granted in 2007 was estimated at the date of grant using the following assumptions:
| Expected term |
6 years | ||
| Expected volatility |
37.00 | % | |
| Dividend yield |
0.00 | % | |
| Risk-free investment rate |
4.58 | % |
The expected term of the options granted under the 2007 Founders’ Option Plan is based on the simplified method for estimating the expected life of the options, as historical data related to the expected life of the options is not available. The Company used the historical volatility of the industry sector index, as it is not practicable to estimate the expected volatility of the Company’s share price. The risk-free investment rate for periods within the contractual life of the option is based on the U.S. Treasury yield curve of the same maturity in effect at the time of grant. The Company estimates forfeitures in calculating the expense relating to stock-based compensation. At the grant date, the Company estimated the number of shares expected to vest and will subsequently adjust compensation costs for the estimated rate of forfeitures on an annual basis. The Company will use historical data to estimate option exercise and employee termination in determining the estimated forfeiture rate. The estimated forfeiture rate applied as of the option grant date was 1%.
Restricted Shares of Common Stock
In February 2008, our Board of Directors authorized, and in June 2008, our shareholders approved, the issuance of 73 restricted shares of Class B common stock, non-voting, with a three year cliff vesting period to our director Mr. Henriques, as the initial equity consideration for his election to the Board of Directors and 41 restricted shares of Class B common stock, non-voting, with a three year cliff vesting period to each of our director Mr. Madden and our former director Ms. Miltner, as their annual equity consideration for board membership, (collectively the “2008 Restricted Stock Issuances”). In January 2009, Ms. Miltner surrendered her right to the restricted shares of Class B common stock, in accordance with the terms of her resignation agreement with the Company.
In May 2009, our Board of Directors authorized and our shareholders approved the issuance of 96 restricted shares of Class B common stock, non-voting, with a three year cliff vesting period to each of our directors Messrs. Henriques and Madden, as their annual equity consideration for board membership, (collectively the “2009 Restricted Stock Issuance”).
In September 2009, our Board of Directors approved, subject to shareholder approval, the designation of an additional 1,000 shares of Class B common stock, non-voting, to be reserved for the grant of restricted stock to our Board of Directors.
During the years ended December 31, 2009 and 2008, there were 192 restricted shares of Class B common stock, non-voting, granted under the 2009 Restricted Stock Issuance and 155 restricted shares of Class B common stock, non-voting, granted under the 2008 Restricted Stock Issuances to certain independent, non-employee directors, respectively. The restricted shares of Class B common stock, non-voting were antidilutive.
F-36
Table of Contents
INTCOMEX, INC.
NOTES TO CONSOLIDATED FINANCIAL STATEMENTS—(Continued)
(Dollars in thousands, except per share data)
A summary of the unvested restricted shares of Class B common stock, non-voting award activity under the 2008 Restricted Stock Issuances and 2009 Restricted Stock Issuance and changes during periods presented consisted of the following:
| Restricted Common Stock, Non-voting (in shares) |
Fair Value per Share (in dollars) |
||||||
| Unvested Balance at January 1, 2008 |
— | — | |||||
| Granted |
155 | $ | 1,225 | (1) | |||
| Vested |
— | — | |||||
| Forfeited |
— | — | |||||
| Unvested Balance at December 31, 2008 |
155 | $ | 1,225 | ||||
| Granted |
192 | $ | 521 | (2) | |||
| Vested |
— | — | |||||
| Forfeited |
(41 | ) | $ | 1,225 | |||
| Unvested Balance at December 31, 2009 |
306 | $ | 1,040 | (3) | |||
| (1) | The fair value was estimated by the Company on the date the Company received unanimous shareholder approval of the grant. |
| (2) | The fair value was determined by independent valuation experts as of the date the Company received unanimous shareholder approval of the grant. |
| (3) | The fair value was determined using the weighted-average fair value per share to reflect the portion of the period during which shares were outstanding. |
Note 10. Commitments and Contingencies and Other
Commitments and Contingencies
The Company accrues for contingent obligations when the obligation is probable and the amount is reasonably estimable. As facts concerning contingencies become known, we reassess our position and make appropriate adjustments to the financial statements. Estimates that require judgment and are particularly sensitive to future changes include those related to taxes, legal matters, the imposition of international governmental monetary, fiscal or other controls, changes in the interpretation and enforcement of international laws (in particular related to items such as duty and taxation), and the impact of local economic conditions and practices, which are all subject to change as events evolve and as additional information becomes available.
Litigation
As part of our normal course of business, we are involved in certain claims, regulatory and tax matters. In the opinion of our management, the final disposition of such matters will not have a material adverse impact on our results of operations and financial condition.
Contingent Liability
The Company is subject to inspection by the tax authorities in the foreign jurisdictions in which the Company conducts business for various statutes of limitations under the applicable law. The respective provision
F-37
Table of Contents
INTCOMEX, INC.
NOTES TO CONSOLIDATED FINANCIAL STATEMENTS—(Continued)
(Dollars in thousands, except per share data)
for the potential payroll tax and VAT contingency is based upon the Company’s determination that a high probability exists that an unfavorable outcome is likely to be realized upon ultimate settlement with a tax authority that has full knowledge of all relevant information. The Company believes the provision for the payroll tax and VAT contingency is sufficient to cover any losses that may occur as a result of related judicial actions.
In the second quarter of 2008, the Company recorded a provision for potential payroll tax and value added tax (“VAT”) exposure related to its operations in a foreign jurisdiction in which the Company conducts business, in the amount estimated to be approximately to be $400, all of which affected the Company’s operating expenses. In addition, the Company recorded a provision of $100 for the professional audit and legal fees incurred to determine the amount of unrecognized potential payroll tax and VAT exposure. The Company is subject to VAT for products sold at the time a product is resold at an applicable VAT rate. The Company recognized certain VAT deductions that could be disallowed and believes it is subject to a tax assessment with respect to the VAT filings for the years ended December 31, 2003 through 2007. The Company is obligated to comply with withholding and social security tax rules in foreign jurisdictions where persons perform ‘fees for services’ work for the Company. The Company is obligated to remit withholding and social security taxes on behalf of these service providers for performing functions in the ordinary course of business for the Company as opposed to delivering specialized professional services in the foreign jurisdiction.
Leases
The Company leases office, warehouse facilities, and warehouse equipment under non-cancelable operating leases, including a 10-year lease for 221,021 square feet of office and warehouse space in Miami, Florida. The commencement date of the lease was May 1, 2007, with a base rent expense of $146 and an annual 3.0% escalation clause.
Rental expense was $4,225, $4,670 and $4,089, for the years ended December 31, 2009, 2008 and 2007, respectively.
Future minimum lease payments from December 31, 2009 consisted of the following:
| Fiscal Years |
|||
| 2010 |
$ | 2,473 | |
| 2011 |
4,017 | ||
| 2012 |
3,725 | ||
| 2013 |
3,283 | ||
| 2014 and thereafter |
9,659 | ||
| $ | 23,157 | ||
Note 11. Additional Paid in Capital
As of December 31, 2009 and 2008, additional paid in capital was $41,388 and $21,138, respectively.
Total compensation expense for share-based compensation arrangements charged against income were $249 and $313 for the years ended December 31, 2009 and 2008, respectively. For a detailed discussion of the share-based compensation, see “Note 9. Share-Based Compensation” in these Notes to Audited Consolidated Financial Statements.
F-38
Table of Contents
INTCOMEX, INC.
NOTES TO CONSOLIDATED FINANCIAL STATEMENTS—(Continued)
(Dollars in thousands, except per share data)
For the year ended December 31, 2009, the Company recorded additional paid in capital of $20,001 related to its shareholder subscription offering consummated on December 22, 2009. Certain of the Company’s existing shareholders and their affiliates contributed $20,001 of new capital in exchange for 27,175 newly-issued shares of our Class B Common Stock, non-voting, through a subscription agreement. The capital contribution consisted of the redemption and cancellation of $15,144 face value of the 11 3/4% Senior Notes, $890 of tender premium paid on the settlement of the 11 3/4% Senior Notes and additional cash of $3,967.
Note 12. Related Party Transactions
Due from Related Parties
IFX Corporation (“IFX”) is a Latin American telecommunications service provider that provides internet access services to our Miami Operations and our In-country Operations in Argentina, Chile, Colombia, Guatemala, Mexico, Panama and Uruguay. Michael Shalom is the chairman of IFX and both a major shareholder and officer of the Company. During the years ended December 31, 2009, 2008 and 2007, the Company paid approximately $500, $600 and $500, respectively, to IFX for their services and sold approximately $3, $30 and $200, respectively, of IT products to IFX. The Company did not have an outstanding receivable balance from IFX as of December 31, 2009 and 2008. The trade receivables of IFX are guaranteed by a former shareholder of our Company. We believe that all transactions with IFX have been made on terms that are not less favorable to us than those available in a comparable arm’s length transaction and in the ordinary course of business.
Consulting Agreement with Related Parties
In November 2008, the Company entered into a 14-month consulting agreement in the amount of $546 with two of the Company’s shareholders, who were former managers of our operation in Mexico, to provide advice and operating guidance to the new management of the Company’s Mexican operations. The expense was included in the Company’s restructuring plan provision as of December 31, 2008. As of December 31, 2009 and 2008, the amounts paid to the related parties to the agreements were $468 and $78, respectively.
Leases
The Company leases warehouse and office space in Mexico City, Mexico from two shareholders for approximately $23 per month. The lease has a 78-month term expiring January 1, 2011, and has an increase provision based upon the Indice Nacional de Precios al Consumidor, or INPC, the official inflation rate in Mexico. The Company has an option to purchase the building for $3,000, which expires on December 31, 2011.
Note 13. Restructuring Plan
Management implemented restructuring and rebalancing actions designed to improve the Company’s efficiencies and profitability, strengthen its operations and reduce its costs in several of its locations during the years ended December 31, 2009 and 2008. The restructuring included involuntary workforce reductions and employee benefits and other costs incurred in connection with vacating leased facilities. The total charges of approximately $585 and $1,535, respectively, were recorded in the Company’s statement of operations as an increase to the Company’s operating expenses for the years ended December 31, 2009 and 2008. There were no restructuring charges incurred by the Company for the year ended December 31, 2007.
F-39
Table of Contents
INTCOMEX, INC.
NOTES TO CONSOLIDATED FINANCIAL STATEMENTS—(Continued)
(Dollars in thousands, except per share data)
The total pre-tax restructuring activity for the years ended December 31, 2009 and 2008 consisted of the following:
| Workforce Reduction |
Contract Termination and Amortization(1) |
Other(2) | Total | |||||||||||||
| Balance at January 1, 2008 |
$ | — | $ | — | $ | — | $ | — | ||||||||
| Expensed |
1,480 | 29 | 26 | 1,535 | ||||||||||||
| Paid |
(851 | ) | (29 | ) | (26 | ) | (906 | ) | ||||||||
| Other adjustments |
— | — | — | — | ||||||||||||
| Balance at December 31, 2008 |
$ | 629 | $ | — | $ | — | $ | 629 | ||||||||
| Expensed |
585 | — | — | 585 | ||||||||||||
| Paid |
(1,214 | ) | — | — | (1,214 | ) | ||||||||||
| Other adjustments |
— | — | — | — | ||||||||||||
| Balance at December 31, 2009 |
$ | — | $ | — | $ | — | $ | — | ||||||||
| (1) | Includes expenses to terminate lease contracts and accelerate amortization of leasehold improvements at the respective leased locations. |
| (2) | Includes travel expenses to close divisions and other expenses to relocate inventory and fixed assets. |
In connection with the Company’s restructuring activities, the Company recorded restructuring charges for the workforce reduction expenses, lease contract termination expenses, fixed asset impairment and accelerated amortization and other related expenses for the years ended December 31, 2009 and 2008. Workforce reduction expenses consisted of termination and severance benefits for approximately 125 and 20 employees, respectively for the years ended December 31, 2009 and 2008. The noncurrent portion of the liability associated with the workforce reductions related to terminated employees who were granted annual payments to supplement their income in certain countries. Lease contract termination expenses consisted of the Company’s ongoing obligations to pay rent for vacated space, and penalties related to the contract termination over the respective lease term of the Company’s lease agreements.
Note 14. Segment Information
FASB ASC 280, Segment Reporting provides guidance on the disclosures about segments and information related to reporting units. The Company operates in a single industry segment, that being a distributor of IT products. The Company’s operating segments are based on geographic location. Geographic areas in which the Company operates include sales generated from and invoiced by the Miami, Florida operations, the Miami Operations and sales generated from and invoiced by all of the Latin American and Caribbean subsidiary operations. The subsidiary operations conduct business with sales and distribution centers in the following countries: Argentina, Chile, Colombia, Costa Rica, Ecuador, El Salvador, Guatemala, Jamaica, Mexico, Panama, Peru, and Uruguay and a sales office in Brazil, collectively, our In-country Operations. The In-country Operations have been aggregated as one segment due to similar products and economic characteristics. The Company sells and distributes one type of product line, IT products and does not provide any separately billable services. It is impracticable for the Company to report the revenues from external customers for the group of similar products within the product line because the general ledger used to prepare the Company’s financial statements does not track sales by product.
F-40
Table of Contents
INTCOMEX, INC.
NOTES TO CONSOLIDATED FINANCIAL STATEMENTS—(Continued)
(Dollars in thousands, except per share data)
Inter-segment revenue primarily represents intercompany revenue between the Miami Operations and the In-country Operations at established prices. Intercompany revenue between the related companies is eliminated in consolidation. The measure for the Company’s segment profit is operating income. Financial information by geographic operating segment is as follows for the periods presented:
| For the Years Ended December 31, | ||||||||||||
| 2009 | 2008 | 2007 | ||||||||||
| (Dollars in thousands) | ||||||||||||
| Statement of Operations Data: |
||||||||||||
| Revenue |
||||||||||||
| Miami Operations |
||||||||||||
| Revenue to unaffiliated customers(1) |
$ | 234,936 | $ | 277,187 | $ | 289,057 | ||||||
| Intersegment |
230,449 | 253,352 | 288,208 | |||||||||
| Total Miami Operations |
465,385 | 530,539 | 577,265 | |||||||||
| In-country Operations |
682,232 | 794,364 | 749,311 | |||||||||
| Eliminations of inter-segment |
(230,449 | ) | (253,352 | ) | (288,208 | ) | ||||||
| Total revenue |
$ | 917,168 | $ | 1,071,551 | $ | 1,038,368 | ||||||
| Operating income (loss) |
||||||||||||
| Miami Operations |
$ | 3,077 | $ | (15,066 | ) | $ | 6,490 | |||||
| In-country Operations |
17,248 | 9,939 | 21,278 | |||||||||
| Total operating income (loss) |
$ | 20,325 | $ | (5,127 | ) | $ | 27,768 | |||||
| As of December 31, | ||||||||||||
| 2009 | 2008 | |||||||||||
| (Dollars in thousands) | ||||||||||||
| Balance Sheet Data: |
||||||||||||
| Assets |
||||||||||||
| Miami Operations |
$ | 126,440 | $ | 119,059 | ||||||||
| In-country Operations |
181,661 | 165,009 | ||||||||||
| Total assets |
$ | 308,101 | $ | 284,068 | ||||||||
| Property & equipment, net |
||||||||||||
| Miami Operations |
$ | 7,538 | $ | 8,168 | ||||||||
| In-country Operations |
8,757 | 9,510 | ||||||||||
| Total property & equipment, net |
$ | 16,295 | $ | 17,678 | ||||||||
| Goodwill |
||||||||||||
| Miami Operations |
$ | — | $ | — | ||||||||
| In-country Operations |
13,704 | 13,548 | ||||||||||
| Total goodwill |
$ | 13,704 | $ | 13,548 | ||||||||
| (1) | For purposes of geographic disclosure, revenue is attributable to the country in which the Company’s individual business resides. |
F-41
Table of Contents
INTCOMEX, INC.
NOTES TO CONSOLIDATED FINANCIAL STATEMENTS—(Continued)
(Dollars in thousands, except per share data)
Note 15. Guarantor Condensed Consolidating Financial Statements
The 13 1/4% Senior Notes are unconditionally guaranteed on a senior secured basis by each of the Company’s existing and future domestic restricted subsidiaries (collectively, the “Subsidiary Guarantors”), but not the Company’s foreign subsidiaries (collectively, the “Non-Guarantor Subsidiaries”). The 11 3/4% Senior Notes were unconditionally guaranteed by each of the Subsidiary Guarantors, with the exception of the Non-Guarantor Subsidiaries. Each of the note guarantees covers the full amount of the 13 1/4% Senior Notes and each of the Subsidiary Guarantors is 100% owned by the Company. Pursuant to Rule 3-10(f) of Regulation S-X under the rules promulgated under the Securities Act of 1933, the Parent company has prepared condensed consolidating financial information as of December 31, 2009, 2008 and 2007 for the Parent company, the subsidiaries that are Guarantors of the Company’s obligations under the 13 1/4 % Senior Notes on a combined basis and the Non-Guarantor Subsidiaries on a combined basis.
The indentures governing the 13 1/4% Senior Notes and the security documents executed in connection therewith provide that, in the event that Rule 3-16 of Regulation S-X under the rules promulgated under the Securities Act, or any successor regulation, requires the filing of separate financial statements of any of the Company’s subsidiaries with the SEC, the capital stock pledged as collateral securing the 13 1/4% Senior Notes, the portion or, if necessary, all of such capital stock necessary to eliminate such filing requirement, will automatically be deemed released and not have been part of the collateral securing the 13 1/4% Senior Notes.
The Rule 3-16 requirement to file separate financial statements of a subsidiary is triggered if the aggregate principal amount, par value, or book value of the capital stock of the subsidiary, as carried by the registrant, or the market value of such capital stock, whichever is greatest, equals 20% or more of the principal amount of the notes. These values are calculated by using a discounted cash flow model that combines the unlevered free cash flows from our annual five-year business plan plus a terminal value based upon the final year earnings before interest, taxes, depreciation and amortization, or EBITDA of that business plan which is then multiplied by a multiple based upon comparable companies’ implied multiples, validated by third-party experts, to arrive at an enterprise value. Existing debt, net of cash on hand, is then subtracted to arrive at the estimated market value.
Supplemental financial information for Intcomex, Inc., our combined Subsidiary Guarantors and Non-Guarantor Subsidiaries is presented below.
F-42
Table of Contents
INTCOMEX, INC.
NOTES TO CONSOLIDATED FINANCIAL STATEMENTS—(Continued)
(Dollars in thousands, except per share data)
CONDENSED CONSOLIDATING BALANCE SHEET
(Dollars in thousands)
As of December 31, 2009
| INTCOMEX, INC. (PARENT) |
GUARANTORS | NON- GUARANTORS |
ELIMINATIONS | INTCOMEX INC. CONSOLIDATED | ||||||||||||
| Current assets |
||||||||||||||||
| Cash and equivalents |
$ | 2,637 | $ | 41 | $ | 24,556 | $ | — | $ | 27,234 | ||||||
| Trade accounts receivable, net |
— | 61,830 | 77,547 | (39,139 | ) | 100,238 | ||||||||||
| Inventories |
— | 26,743 | 68,442 | — | 95,185 | |||||||||||
| Other |
41,089 | 3,832 | 69,367 | (79,795 | ) | 34,493 | ||||||||||
| Total current assets |
43,726 | 92,446 | 239,912 | (118,934 | ) | 257,150 | ||||||||||
| Long-term assets |
||||||||||||||||
| Property and equipment, net |
3,994 | 3,543 | 8,758 | — | 16,295 | |||||||||||
| Investments in subsidiaries |
121,648 | 197,991 | 371 | (320,010 | ) | — | ||||||||||
| Goodwill |
— | 7,418 | 6,286 | — | 13,704 | |||||||||||
| Other |
15,010 | 42,990 | 4,906 | (41,954 | ) | 20,952 | ||||||||||
| Total assets |
$ | 184,378 | $ | 344,388 | $ | 260,233 | $ | (480,898 | ) | $ | 308,101 | |||||
| Liabilities and shareholders’ equity |
||||||||||||||||
| Current liabilities |
$ | 2,974 | $ | 142,477 | $ | 119,644 | $ | (118,638 | ) | $ | 146,457 | |||||
| Long-term debt, net of current maturities |
113,316 | 628 | 481 | — | 114,425 | |||||||||||
| Other long-term liabilities |
25,354 | 18,895 | 2,456 | (42,220 | ) | 4,485 | ||||||||||
| Total liabilities |
141,644 | 162,000 | 122,581 | (160,858 | ) | 265,367 | ||||||||||
| Total shareholders’ equity |
42,734 | 182,388 | 137,652 | (320,040 | ) | 42,734 | ||||||||||
| Total liabilities and shareholders’ equity |
$ | 184,378 | $ | 344,388 | $ | 260,233 | $ | (480,898 | ) | $ | 308,101 | |||||
F-43
Table of Contents
INTCOMEX, INC.
NOTES TO CONSOLIDATED FINANCIAL STATEMENTS—(Continued)
(Dollars in thousands, except per share data)
CONDENSED CONSOLIDATING BALANCE SHEET
(Dollars in thousands)
As of December 31, 2008
| INTCOMEX, INC. (PARENT) |
GUARANTORS | NON- GUARANTORS |
ELIMINATIONS | INTCOMEX INC. CONSOLIDATED | ||||||||||||
| Current assets |
||||||||||||||||
| Cash and equivalents |
$ | — | $ | 26 | $ | 22,318 | $ | — | $ | 22,344 | ||||||
| Trade accounts receivable, net |
— | 65,034 | 70,750 | (44,699 | ) | 91,085 | ||||||||||
| Inventories |
— | 21,763 | 69,095 | — | 90,858 | |||||||||||
| Other |
40,280 | 3,872 | 68,960 | (81,420 | ) | 31,692 | ||||||||||
| Total current assets |
40,280 | 90,695 | 231,123 | (126,119 | ) | 235,979 | ||||||||||
| Long-term assets |
||||||||||||||||
| Property and equipment, net |
3,876 | 4,292 | 9,510 | — | 17,678 | |||||||||||
| Investments in subsidiaries |
98,878 | 170,941 | — | (269,819 | ) | — | ||||||||||
| Goodwill |
— | 7,418 | 6,130 | — | 13,548 | |||||||||||
| Other |
10,916 | 40,904 | 4,972 | (39,929 | ) | 16,863 | ||||||||||
| Total assets |
$ | 153,950 | $ | 314,250 | $ | 251,735 | $ | (435,867 | ) | $ | 284,068 | |||||
| Liabilities and shareholders’ equity |
||||||||||||||||
| Current liabilities |
$ | 12,191 | $ | 143,629 | $ | 131,530 | $ | (127,097 | ) | $ | 160,253 | |||||
| Long-term debt, net of current maturities |
103,630 | 1,009 | 609 | — | 105,248 | |||||||||||
| Other long-term liabilities |
23,579 | 18,270 | 2,097 | (39,929 | ) | 4,017 | ||||||||||
| Total liabilities |
139,400 | 162,908 | 134,236 | (167,026 | ) | 269,518 | ||||||||||
| Total shareholders’ equity |
14,550 | 151,342 | 117,499 | (268,841 | ) | 14,550 | ||||||||||
| Total liabilities and shareholders’ equity |
$ | 153,950 | $ | 314,250 | $ | 251,735 | $ | (435,867 | ) | $ | 284,068 | |||||
F-44
Table of Contents
INTCOMEX, INC.
NOTES TO CONSOLIDATED FINANCIAL STATEMENTS—(Continued)
(Dollars in thousands, except per share data)
CONDENSED CONSOLIDATING STATEMENT OF OPERATIONS
(Dollars in thousands)
For the Year Ended December 31, 2009
| INTCOMEX INC. (PARENT) |
GUARANTORS | NON-GUARANTORS | ELIMINATIONS | INTCOMEX INC. CONSOLIDATED |
||||||||||||||||
| Revenue |
$ | — | $ | 465,384 | $ | 682,437 | $ | (230,653 | ) | $ | 917,168 | |||||||||
| Cost of revenue |
— | 437,750 | 618,490 | (230,653 | ) | 825,587 | ||||||||||||||
| Gross profit |
— | 27,634 | 63,947 | — | 91,581 | |||||||||||||||
| Operating expenses |
7,862 | 16,669 | 46,725 | — | 71,256 | |||||||||||||||
| Operating (loss) income |
(7,862 | ) | 10,965 | 17,222 | — | 20,325 | ||||||||||||||
| Other expense, net |
||||||||||||||||||||
| Interest expense, net |
16,980 | 1,586 | (1,585 | ) | — | 16,981 | ||||||||||||||
| Other, net |
(26,420 | ) | (25,029 | ) | (3,472 | ) | 48,228 | (6,693 | ) | |||||||||||
| Total other (income) expense |
(9,440 | ) | (23,443 | ) | (5,057 | ) | 48,228 | 10,288 | ||||||||||||
| Income (loss) before provision for income taxes |
1,578 | 34,408 | 22,279 | (48,228 | ) | 10,037 | ||||||||||||||
| (Benefit) provision for income taxes |
(5,615 | ) | 4,848 | 3,611 | — | 2,844 | ||||||||||||||
| Net income (loss) |
$ | 7,193 | $ | 29,560 | $ | 18,668 | $ | (48,228 | ) | $ | 7,193 | |||||||||
CONDENSED CONSOLIDATING STATEMENT OF OPERATIONS
(Dollars in thousands)
For the Year Ended December 31, 2008
| INTCOMEX INC. (PARENT) |
GUARANTORS | NON-GUARANTORS | ELIMINATIONS | INTCOMEX INC. CONSOLIDATED |
||||||||||||||||
| Revenue |
$ | — | $ | 530,539 | $ | 794,364 | $ | (253,352 | ) | $ | 1,071,551 | |||||||||
| Cost of revenue |
— | 501,457 | 722,850 | (253,352 | ) | 970,955 | ||||||||||||||
| Gross profit |
— | 29,082 | 71,514 | — | 100,596 | |||||||||||||||
| Operating expenses |
11,394 | 32,754 | 61,575 | — | 105,723 | |||||||||||||||
| Operating (loss) income |
(11,394 | ) | (3,672 | ) | 9,939 | — | (5,127 | ) | ||||||||||||
| Other expense, net |
||||||||||||||||||||
| Interest expense, net |
15,317 | 1,882 | (709 | ) | — | 16,490 | ||||||||||||||
| Other, net |
14,513 | 20,237 | 21,267 | (43,911 | ) | 12,106 | ||||||||||||||
| Total other expense (income) |
29,830 | 22,119 | 20,558 | (43,911 | ) | 28,596 | ||||||||||||||
| (Loss) income before provision for income taxes |
(41,224 | ) | (25,791 | ) | (10,619 | ) | 43,911 | (33,723 | ) | |||||||||||
| (Benefit) provision for income taxes |
(5,906 | ) | 3,287 | 4,214 | — | 1,595 | ||||||||||||||
| Net (loss) income |
$ | (35,318 | ) | $ | (29,078 | ) | $ | (14,833 | ) | $ | 43,911 | $ | (35,318 | ) | ||||||
F-45
Table of Contents
INTCOMEX, INC.
NOTES TO CONSOLIDATED FINANCIAL STATEMENTS—(Continued)
(Dollars in thousands, except per share data)
CONDENSED CONSOLIDATING STATEMENT OF OPERATIONS
(Dollars in thousands)
For the Year Ended December 31, 2007
| INTCOMEX INC. (PARENT) |
GUARANTORS | NON-GUARANTORS | ELIMINATIONS | INTCOMEX INC. CONSOLIDATED |
||||||||||||||||
| Revenue |
$ | — | $ | 577,265 | $ | 749,311 | $ | (288,208 | ) | $ | 1,038,368 | |||||||||
| Cost of revenue |
— | 544,531 | 681,036 | (288,281 | ) | 937,286 | ||||||||||||||
| Gross profit |
— | 32,734 | 68,275 | 73 | 101,082 | |||||||||||||||
| Operating expenses |
7,064 | 19,253 | 46,997 | — | 73,314 | |||||||||||||||
| Operating (loss) income |
(7,064 | ) | 13,481 | 21,278 | 73 | 27,768 | ||||||||||||||
| Other expense (income) |
||||||||||||||||||||
| Interest expense, net |
15,687 | 1,261 | 85 | — | 17,033 | |||||||||||||||
| Other, net |
(26,735 | ) | (26,637 | ) | (2,718 | ) | 53,397 | (2,693 | ) | |||||||||||
| Total other (income) expenses |
(11,048 | ) | (25,376 | ) | (2,633 | ) | 53,397 | 14,340 | ||||||||||||
| Income (loss) before provision for income taxes |
3,984 | 38,857 | 23,911 | (53,324 | ) | 13,428 | ||||||||||||||
| (Benefit) provision for income taxes |
(8,577 | ) | 4,576 | 4,868 | — | 867 | ||||||||||||||
| Net income (loss) |
$ | 12,561 | $ | 34,281 | $ | 19,043 | $ | (53,324 | ) | $ | 12,561 | |||||||||
F-46
Table of Contents
INTCOMEX, INC.
NOTES TO CONSOLIDATED FINANCIAL STATEMENTS—(Continued)
(Dollars in thousands, except per share data)
CONDENSED CONSOLIDATING STATEMENT OF CASH FLOWS
(Dollars in thousands)
For the Year Ended December 31, 2009
| INTCOMEX INC. (PARENT) |
GUARANTORS | NON-GUARANTORS | ELIMINATIONS | INTCOMEX INC. CONSOLIDATED |
|||||||||||||||
| Cash flows from operating activities |
$ | (24,292 | ) | $ | 15,118 | $ | 4,817 | $ | — | $ | (4,357 | ) | |||||||
| Cash flows from investing activities |
|||||||||||||||||||
| Purchases of property and equipment, net |
(1,251 | ) | (240 | ) | (1,040 | ) | — | (2,531 | ) | ||||||||||
| Other |
— | — | 114 | — | 114 | ||||||||||||||
| Cash used in investing activities |
(1,251 | ) | (240 | ) | (926 | ) | — | (2,417 | ) | ||||||||||
| Cash flows from financing activities |
|||||||||||||||||||
| Payments under lines of credit, net |
— | (14,477 | ) | (1,835 | ) | (16,312 | ) | ||||||||||||
| Borrowings under long-term debt |
108,658 | — | 79 | — | 108,737 | ||||||||||||||
| Payments of long-term debt |
(84,445 | ) | (386 | ) | (291 | ) | — | (85,122 | ) | ||||||||||
| Proceeds from issuance of long-term debt |
3,967 | — | — | — | 3,967 | ||||||||||||||
| Cash flows from financing activities |
28,180 | (14,863 | ) | (2,047 | ) | — | 11,270 | ||||||||||||
| Effects of exchange rate changes on cash |
— | — | 394 | — | 394 | ||||||||||||||
| Net increase in cash and cash equivalents |
2,637 | 15 | 2,238 | — | 4,890 | ||||||||||||||
| Cash and cash equivalents, beginning of period |
— | 26 | 22,318 | — | 22,344 | ||||||||||||||
| Cash and cash equivalents, end of period |
$ | 2,637 | $ | 41 | $ | 24,556 | $ | — | $ | 27,234 | |||||||||
F-47
Table of Contents
INTCOMEX, INC.
NOTES TO CONSOLIDATED FINANCIAL STATEMENTS—(Continued)
(Dollars in thousands, except per share data)
CONDENSED CONSOLIDATING STATEMENT OF CASH FLOWS
(Dollars in thousands)
For the Year Ended December 31, 2008
| INTCOMEX INC. (PARENT) |
GUARANTORS | NON-GUARANTORS | ELIMINATIONS | INTCOMEX INC. CONSOLIDATED |
|||||||||||||||
| Cash flows from operating activities |
$ | 9,464 | $ | (1,857 | ) | $ | (2,734 | ) | $ | — | $ | 4,873 | |||||||
| Cash flows from investing activities |
|||||||||||||||||||
| Purchases of property and equipment, net |
(2,125 | ) | (987 | ) | (3,013 | ) | — | (6,125 | ) | ||||||||||
| Other |
— | — | (521 | ) | — | (521 | ) | ||||||||||||
| Cash used in investing activities |
(2,125 | ) | (987 | ) | (3,534 | ) | — | (6,646 | ) | ||||||||||
| Cash flows from financing activities |
|||||||||||||||||||
| Borrowings under lines of credit, net |
— | 3,125 | 1,550 | 4,675 | |||||||||||||||
| Borrowings under long-term debt |
— | — | 36 | — | 36 | ||||||||||||||
| Payments of long-term debt |
(7,339 | ) | (336 | ) | (250 | ) | — | (7,925 | ) | ||||||||||
| Cash flows from financing activities |
(7,339 | ) | 2,789 | 1,336 | — | (3,214 | ) | ||||||||||||
| Effects of exchange rate changes on cash |
— | — | (2,068 | ) | — | (2,068 | ) | ||||||||||||
| Net (decrease) increase in cash and cash equivalents |
— | (55 | ) | (7,000 | ) | — | (7,055 | ) | |||||||||||
| Cash and cash equivalents, beginning of period |
— | 81 | 29,318 | — | 29,399 | ||||||||||||||
| Cash and cash equivalents, end of period |
$ | — | $ | 26 | $ | 22,318 | $ | — | $ | 22,344 | |||||||||
F-48
Table of Contents
INTCOMEX, INC.
NOTES TO CONSOLIDATED FINANCIAL STATEMENTS—(Continued)
(Dollars in thousands, except per share data)
CONDENSED CONSOLIDATING STATEMENT OF CASH FLOWS
(Dollars in thousands)
For the Year Ended December 31, 2007
| INTCOMEX INC. (PARENT) |
GUARANTORS | NON-GUARANTORS | ELIMINATIONS | INTCOMEX INC. CONSOLIDATED |
|||||||||||||||
| Cash flows from operating activities |
$ | 3,686 | $ | (2,430 | ) | $ | 5,278 | $ | — | $ | 6,534 | ||||||||
| Cash flows from investing activities |
|||||||||||||||||||
| Purchases of property and equipment, net |
(1,806 | ) | (2,751 | ) | (2,200 | ) | — | (6,757 | ) | ||||||||||
| Other |
— | — | 556 | — | 556 | ||||||||||||||
| Cash used in investing activities |
(1,806 | ) | (2,751 | ) | (1,644 | ) | — | (6,201 | ) | ||||||||||
| Cash flows from financing activities |
|||||||||||||||||||
| Borrowings under lines of credit, net |
— | 3,901 | 4,812 | 8,713 | |||||||||||||||
| Borrowings under long-term debt |
165 | 1,505 | 749 | — | 2,419 | ||||||||||||||
| Payments of long-term debt |
(5,076 | ) | (275 | ) | (293 | ) | — | (5,644 | ) | ||||||||||
| Other |
3,029 | — | — | — | 3,029 | ||||||||||||||
| Cash flows from financing activities |
(1,882 | ) | 5,131 | 5,268 | — | 8,517 | |||||||||||||
| Effects of exchange rate changes on cash |
— | — | (25 | ) | — | (25 | ) | ||||||||||||
| Net (decrease) increase in cash and cash equivalents |
(2 | ) | (50 | ) | 8,877 | — | 8,825 | ||||||||||||
| Cash and cash equivalents, beginning of period |
2 | 131 | 20,441 | — | 20,574 | ||||||||||||||
| Cash and cash equivalents, end of period |
$ | — | $ | 81 | $ | 29,318 | $ | — | $ | 29,399 | |||||||||
Note 17. Quarterly Financial Data (Unaudited)
A summary of the quarterly financial information for the years ended December 31, 2009 and 2008 consisted of the following:
| For the Three Months Ended | ||||||||||||
| (Dollars in thousands, except per share data) | ||||||||||||
| March 31, 2009 |
June 30, 2009 |
September 30, 2009 |
December 31, 2009 | |||||||||
| Revenue |
$ | 204,382 | $ | 225,568 | $ | 231,283 | $ | 255,935 | ||||
| Gross profit |
20,596 | 21,194 | 23,333 | 26,458 | ||||||||
| Operating income |
2,497 | 3,156 | 6,475 | 8,197 | ||||||||
| Income before provision for income taxes |
883 | 2,789 | 2,763 | 3,602 | ||||||||
| Net income |
$ | 13 | $ | 2,898 | $ | 1,855 | $ | 2,427 | ||||
| Net income per weighted average share of common stock, voting and Class B common stock, non-voting: |
||||||||||||
| Basic |
$ | 0.13 | $ | 28.36 | $ | 18.15 | $ | 23.30 | ||||
| Diluted |
$ | 0.13 | $ | 28.36 | $ | 18.15 | $ | 23.30 | ||||
F-49
Table of Contents
INTCOMEX, INC.
NOTES TO CONSOLIDATED FINANCIAL STATEMENTS—(Continued)
(Dollars in thousands, except per share data)
| For the Three Months Ended | |||||||||||||||
| (Dollars in thousands, except per share data) | |||||||||||||||
| March 31, 2008 |
June 30, 2008 |
September 30, 2008 |
December 31, 2008 |
||||||||||||
| Revenue |
$ | 277,459 | $ | 303,861 | $ | 273,884 | $ | 216,347 | |||||||
| Gross profit |
26,518 | 27,300 | 25,553 | 21,225 | |||||||||||
| Operating income (loss) |
7,931 | 4,992 | 4,480 | (22,530 | ) | ||||||||||
| Income (loss) before provision for income taxes |
9,425 | (6,655 | ) | (4,051 | ) | (32,442 | ) | ||||||||
| Net income (loss) |
$ | 8,824 | $ | (6,421 | ) | $ | (3,446 | ) | $ | (34,275 | ) | ||||
| Net income (loss) per weighted average share of common stock, voting and Class B common stock, non-voting: |
|||||||||||||||
| Basic |
$ | 86.36 | $ | (62.84 | ) | $ | (33.72 | ) | $ | (335.43 | ) | ||||
| Diluted |
$ | 86.36 | $ | (62.84 | ) | $ | (33.72 | ) | $ | (335.43 | ) | ||||
F-50
Table of Contents
Shares
Intcomex, Inc.
Common Stock
P R O S P E C T U S
, 2010
Joint Book-Running Managers
| Citi |
UBS Investment Bank |
| Raymond James |
Thomas Weisel Partners LLC |
Table of Contents
PART II
INFORMATION NOT REQUIRED IN PROSPECTUS
| Item 13. | Other Expenses of Issuance and Distribution. |
The following table sets forth the costs and expenses, other than underwriting discounts and commissions, payable in connection with the sale of securities being registered. Except as otherwise noted, we will pay all of these amounts. All amounts are estimates except the registration fee, the FINRA filing fee and the Nasdaq Global Market fee.
| SEC Registration fee |
$ | 3,838 | |
| FINRA filing fee |
$ | * | |
| Nasdaq Global Market fee |
$ | * | |
| Printing and engraving expenses |
$ | * | |
| Legal fees and expenses |
$ | * | |
| Accounting fees and expenses |
$ | * | |
| Blue sky fees and expenses |
$ | * | |
| Transfer agent and registrar fees |
$ | * | |
| Miscellaneous |
$ | * | |
| Total |
$ | * | |
| * | To be provided by amendment. |
| Item 14. | Indemnification of Directors and Officers. |
Subsection (a) of Section 145 The General Corporation Law of the State of Delaware, or DGCL, empowers a corporation to indemnify any person who was or is a party or is threatened to be made a party to any threatened, pending or completed action, suit or proceeding, whether civil, criminal, administrative or investigative (other than an action by or in the right of the corporation) by reason of the fact that the person is or was a director, officer, employee or agent of the corporation, or is or was serving at the request of the corporation as a director, officer, employee or agent of another corporation, partnership, joint venture, trust or other enterprise, against expenses (including attorneys’ fees), judgments, fines and amounts paid in settlement actually and reasonably incurred by the person in connection with such action, suit or proceeding if the person acted in good faith and in a manner the person reasonably believed to be in or not opposed to the best interests of the corporation, and, with respect to any criminal action or proceeding, had no reasonable cause to believe the person’s conduct was unlawful. The termination of any action, suit or proceeding by judgment, order, settlement, conviction, or upon a plea of nolo contendere or its equivalent, shall not, of itself, create a presumption that the person did not act in good faith and in a manner which the person reasonably believed to be in or not opposed to the best interest of the corporation, and, with respect to any criminal action or proceeding, had reasonable cause to believe that the person’s conduct was unlawful.
Subsection (b) of Section 145 of the DGCL empowers a corporation to indemnify any person who was or is a party or is threatened to be made a party to any threatened, pending or completed action or suit by or in right of the corporation to procure a judgment in its favor by reason of the fact that such person acted in any of the capacities set forth above, against expenses (including attorneys’ fees) actually and reasonably incurred by the person in connection with the defense or settlement of such action or suit if the person acted in good faith and in a manner the person reasonably believed to be in or not opposed to the best interests of the corporation and except that no indemnification may be made in respect of any claim, issue or matter as to which such person shall have been adjudged to be liable to the corporation unless and only to the extent that the Court of Chancery or the court in which such action or suit was brought shall determine upon application that, despite the adjudication of liability but in view of all the circumstances of the case, such person is fairly and reasonably entitled to indemnity for such expenses which the Court of Chancery or such other court shall deem proper.
II-1
Table of Contents
Subsection (d) of Section 145 of the DGCL provides that any indemnification under subsections (a) and (b) of Section 145 (unless ordered by a court) shall be made by the corporation only as authorized in the specific case upon a determination that indemnification of the present or former director, officer, employee or agent is proper in the circumstances because the person has met the applicable standard of conduct set forth in subsections (a) and (b) of Section 145. Such determination shall be made, with respect to a person who is a director or officer at the time of such determination, (1) by a majority vote of the directors who are not parties to such action, suit or proceeding, even though less than a quorum, or (2) by a committee of such directors designated by the majority vote of such directors, even though less than a quorum, or (3) if there are no such directors, or if such directors so direct, by independent legal counsel in a written opinion, or (4) by the stockholders.
Section 145 of the DGCL further provides that to the extent a present or former director or officer of a corporation has been successful on the merits or otherwise in the defense of any action, suit or proceeding referred to in subsections (a) and (b) of Section 145, or in defense of any claim, issue or matter therein, such person shall be indemnified against expenses (including attorneys’ fees) actually and reasonably incurred by such person in connection therewith and that such expenses may be paid by the corporation in advance of the final disposition of such action, suit or proceeding upon receipt of an undertaking by or on behalf of such director or officer to repay such amount if it shall ultimately be determined that such person is not entitled to be indemnified by the corporation as authorized in Section 145 of the DGCL; that any indemnification and advancement of expenses provided by, or granted pursuant to, Section 145 shall not be deemed exclusive of any other rights to which the indemnified party may be entitled; that indemnification provided by, or granted pursuant to, Section 145 shall, unless otherwise provided when authorized and ratified, continue as to a person who has ceased to be a director, officer, employee or agent and shall inure to the benefit of such person’s heirs, executors and administrators; and empowers the corporation to purchase and maintain insurance on behalf of any person who is or was a director, officer, employee or agent of the corporation or is or was serving at the request of the corporation as a director, officer, employee or agent of another corporation, partnership, joint venture, trust or other enterprise against any liability asserted against such person and incurred by such person in any such capacity, or arising out of such person’s status as such, whether or not the corporation would have the power to indemnify such person against such liabilities under Section 145. Article IX of the Company’s Certificate of Incorporation provides that the Company shall indemnify any officer or director, or any former officer or director, to the full extent permitted by Section 145 of the DGCL.
The Company also provides liability insurance for its directors and officers which provides for coverage against loss from claims made against directors and officers in their capacity as such, including, subject to certain exceptions, liabilities under the federal securities laws.
Section 102(b) (7) of the DGCL provides that a certificate of incorporation may contain a provision eliminating or limiting the personal liability of a director to the corporation or its stockholders for monetary damages for breach of fiduciary duty as a director, provided that such provision shall not eliminate or limit the liability of a director (i) for any breach of the director’s duty of loyalty to the corporation or its stockholders, (ii) for acts or omissions not in good faith or which involve intentional misconduct or a knowing violation of law, (iii) under Section 174 of the DGCL, or (iv) for any transaction from which the director derived an improper personal benefit. Article X of the Company’s Certificate of Incorporation limits the personal liability of the directors of the Company to the fullest extent permitted by Section 102(b) (7) of the DGCL.
| Item 15. | Recent Sales of Unregistered Securities. |
The following relates to sales of securities that have occurred in the last three years that have not been registered under the Securities Act:
On December 22, 2009, we completed an offering of $120 million Second Priority Senior Secured Notes due 2014, or the 13 1/4% Senior Notes.
II-2
Table of Contents
On December 22, 2009 we issued 27,175 Class B non-voting common shares in the Company to certain holders of our 11 3/4% Senior Notes in exchange for a cash contribution to the Company and/or outstanding 11 3/4% Senior Notes.
The issuance of securities described above were exempt from registration under the Securities Act of 1933 in reliance on Section 4(2) of the Securities Act of 1933 as transactions by an issuer not involving any public offering. The purchasers of the securities in these transactions represented that they were accredited investors or qualified institutional buyers and they were acquiring the securities for investment only and not with a view toward the public sale or distribution thereof. Such purchasers received written disclosures that the securities had not been registered under the Securities Act of 1933 and that any resale must be made pursuant to a registration statement or an available exemption from registration. All purchasers either received adequate access, through their relationship with the registrant, to financial statement or non-financial statement information about the registrant or had adequate access, through their relationship with the registrant, to financial statement or non-financial statement information about the registrant. The sale of these securities was made without general solicitation or advertising.
II-3
Table of Contents
| Item 16. | Exhibits and Financial Statement Schedules. |
(a) Exhibits. The following is a complete list of Exhibits filed as part of this Registration Statement.
| Exhibits |
Document | ||
| 1.1 | Form of Underwriting Agreement.(1) | ||
| 2.1 | Stock Purchase Agreement among Court Square Capital, Ltd., the sellers named therein and Intcomex, Inc., dated August 27, 2004. Incorporated by reference to Exhibit 2.1 to the registration statement on Form S-4 (File No. 333-134090) (the “S-4 Registration Statement”). | ||
| 3.1 | Second Amended and Restated Certificate of Incorporation of Intcomex, Inc. Incorporated by reference to Exhibit 3.1 to the Registration Statement on Form S-4 (File No. 333-134090) (the “S-4 Registration Statement). | ||
| 3.2 | Amendment Number 1 to the Second Amended and Restated Certificate of Incorporation of Intcomex, Inc., dated December 14, 2009, filed with our Annual Report on Form 10-K filed with the SEC on February 22, 2010. | ||
| 3.3 | Amended and Restated By-laws of Intcomex, Inc. Incorporated by reference to Exhibit 3.2 of the Quarterly Report on Form 10-Q filed with the SEC on November 14, 2007. | ||
| Instruments Defining the Rights of Security Holders, Including Indentures | |||
| 4.1 | Specimen Common Stock Certificate of Intcomex, Inc.(1) | ||
| 4.2 | Indenture, dated as of December 22, 2009, between Intcomex, Inc., Software Brokers of America, Inc., Intcomex Holdings, LLC, Intcomex Holdings SPC-I, LLC, Forza Power Technologies, LLC, Klip Xtreme, LLC, Nexxt Solutions, LLC, and the Bank of New York Mellon as Trustee. Incorporated by reference to Exhibit 4.1 of our Current Report on Form 8-K filed with the SEC on December 23, 2009. | ||
| 4.3 | (a) | Indenture, dated as of August 25, 2005, between Intcomex, Inc., the guarantors named therein, and the Bank of New York Mellon as Trustee. Incorporated by reference to Exhibit 4.1 of the S-4 Registration Statement. | |
| 4.3 | (b) | Supplemental Indenture, dated as of October 31, 2006 to the Indenture, dated as of August 25, 2005. Incorporated by reference to Exhibit 4.10 of the S-4 Registration Statement. | |
| 4.3 | (c) | Second Supplemental Indenture, dated as of December 22, 2009 to the Indenture, dated as of August 25, 2005. Incorporated by reference to Exhibit 4.4 of our Current Report on Form 8-K filed with the SEC on December 23, 2009. | |
| 4.4 | Pledge Agreement among Intcomex, Inc., Intcomex Holdings, LLC and Intcomex Holdings SPC-I, LLC, as pledgors, in favor of the Bank of New York, as trustee, dated as of August 25, 2005. Incorporated by reference to Exhibit 4.4 to the S-4 Registration Statement. | ||
| 4.5 | Security Agreement by Software Brokers of America, Inc. and the Bank of New York, as trustee, dated as of August 25, 2005. Incorporated by reference to Exhibit 4.5 to the S-4 Registration Statement. | ||
| 4.6 | Lien Subordination Agreement among Comerica Bank, the Bank of New York and Software Brokers of America, Inc., dated as of August 25, 2005. Incorporated by reference to Exhibit 4.6 to the S-4 Registration Statement. | ||
| 4.7 | Stock Pledge Agreement between Intcomex Holdings, SPC-I, LLC, as pledgor, in favor of the Bank of New York, as trustee, dated as of August 25, 2005. Incorporated by reference to Exhibit 4.7 to the S-4 Registration Statement. | ||
| 4.8 | Share Charge between Intcomex Holdings, LLC, the Bank of New York and IXLA Holdings Ltd., dated as of August 25, 2005. Incorporated by reference to Exhibit 4.8 to the S-4 Registration Statement. | ||
II-4
Table of Contents
| Exhibits |
Document | |
| 4.9 | Treasury Management Services Controlled Collateral Account Service Agreement among Comerica Bank, Software Brokers of America, Inc. and the Bank of New York, dated August 25, 2005. Incorporated by reference to Exhibit 4.9 to the S-4 Registration Statement. | |
| 4.10 | Pledge Agreement among Intcomex, Inc., Intcomex Holdings, LLC and Intcomex Holdings SPC-I, LLC, as pledgors, in favor of the Bank of New York Mellon, as trustee, dated as of December 22, 2009. Incorporated by reference to Exhibit 4.10 of our Annual Report on Form 10-K filed with the SEC on February 22, 2010. | |
| 4.11 | Limited Guaranty among Intcomex, Inc., Software Brokers of America, and Comerica Bank, dated as of December 22, 2009. Incorporated by reference to Exhibit 4.11 of our Annual Report on Form 10-K filed with the SEC on February 22, 2010. | |
| 4.12 | Subsidiary Guaranty among Forza Power Technologies, LLC, Klip Xtreme, LLC, Nexxt Solutions, LLC, Software Brokers of America, and Comerica Bank, dated as of December 22, 2009. Incorporated by reference to Exhibit 4.12 of our Annual Report on Form 10-K filed with the SEC on February 22, 2010. | |
| 4.13 | Security Agreement by Software Brokers of America, Inc., the guarantors named therein, and the Bank of New York Mellon, as trustee, dated as of December 22, 2009. Incorporated by reference to Exhibit 4.13 of our Annual Report on Form 10-K filed with the SEC on February 22, 2010. | |
| 4.14 | Lien Subordination Agreement among Comerica Bank, Software Brokers of America, Inc., Forza Power Technologies, LLC, Klip Xtreme, LLC, Nexxt Solutions, LLC, and the Bank of New York Mellon, as trustee dated as of December 22, 2009. Incorporated by reference to Exhibit 4.14 of our Annual Report on Form 10-K filed with the SEC on February 22, 2010. | |
| 4.15 | Stock Pledge Agreement between Intcomex Holdings, SPC-I, LLC, as pledgor, in favor of the Bank of New York Mellon, as trustee, dated as of December 22, 2009 Incorporated by reference to Exhibit 4.15 of our Annual Report on Form 10-K filed with the SEC on February 22, 2010. | |
| 4.16 | Share Charge between Intcomex Holdings, LLC, the Bank of New York Mellon and IXLA Holdings Ltd., dated as of December 22, 2009. Incorporated by reference to Exhibit 4.16 of our Annual Report on Form 10-K filed with the SEC on February 22, 2010. | |
| 4.17 | Treasury Management Services Controlled Collateral Account Service Agreement among Comerica Bank, Software Brokers of America, Inc. and the Bank of New York, as trustee dated December 22, 2009. Incorporated by reference to Exhibit 4.17 of our Annual Report on Form 10-K filed with the SEC on February 22, 2010. | |
| 4.18 | Trademark Security Agreement Software Brokers of America, Inc. and the Bank of New York Mellon, as trustee dated as of December 22, 2009. Incorporated by reference to Exhibit 4.18 of our Annual Report on Form 10-K filed with the SEC on February 22, 2010. | |
| 4.19 | Registration Rights Agreement, dated December 22, 2009, between Intcomex, Inc., the guarantors named therein, and Banc of America Securities LLC and Citigroup Global Markets, Inc. Incorporated by reference to Exhibit 4.3 to our Current Form 8-K filed with the SEC on December 23, 2009. | |
| Legal Opinion | ||
| 5.1 | Legal Opinion of Cleary Gottlieb Steen & Hamilton LLP.(1) | |
| Material Contracts | ||
| 10.1 | Revolving Credit Agreement between Software Brokers of America, Inc., the guarantors named therein, and Comerica Bank, dated as of December 22, 2009. Incorporated by reference to Exhibit 10.1 of our annual Report on Form 10-K filed with the SEC on February 22, 2010. | |
| 10.2 | Credit Agreement between Software Brokers of America, Inc. and Comerica Bank, dated as of August 25, 2005. Incorporated by reference to Exhibit to 10.1 to the S-4 Registration Statement. | |
II-5
Table of Contents
| Exhibits |
Document | |
| 10.3 | Amendment No. 1 to Credit Agreement, Amendment to Intcomex Subordination Agreement and Waiver Re Intcomex Subordinated Indebtedness, dated as of November 2, 2006, by and among Software Brokers of America, Inc., Comerica Bank and Intcomex, Inc. Incorporated by reference to Exhibit 10.7 of the S-4 Registration Statement. | |
| 10.4 | Amendment No. 2 to Credit Agreement, dated as of May 15, 2007, by and among Software Brokers of America, Inc. and Comerica Bank. Incorporated by reference to Exhibit 10.1 of the Current Report on Form 8-K filed with the SEC on July 18, 2007. | |
| 10.5 | Amendment No. 3 to Credit Agreement, dated as of August 17, 2007, by and among Software Brokers of America, Inc. and Comerica Bank. Incorporated by reference to Exhibit 10.1 of the Current Report on Form 8-K filed with the SEC on August 23, 2007. | |
| 10.6 | Amendment No. 4 to Credit Agreement, dated as of March 28, 2008, by and among Software Brokers of America, Inc. and Comerica Bank. Incorporated by reference to Exhibit 10.12 of the Annual Report on Form 10-K filed with the SEC on March 31, 2008. | |
| 10.7 | Amendment No. 5 to Credit Agreement, dated as of May 14, 2008, by and among Software Brokers of America, Inc. and Comerica Bank. Incorporated by reference to Exhibit 10.1 of the Quarterly Report on Form 10-Q filed with the SEC on May 14, 2008. | |
| 10.8 | Amendment No. 6 to Credit Agreement, dated as of November 13, 2008, by and among Software Brokers of America, Inc. and Comerica Bank. Incorporated by reference to Exhibit 10.1 of the Quarterly Report on Form 10-Q filed with the SEC on November 14, 2008. | |
| 10.9 | Amendment No. 7 to Credit Agreement, dated as of March 20, 2009, by and among Software Brokers of America, Inc. and Comerica Bank. Incorporated by reference to Exhibit 10.8 of the Annual Report on Form 10-K filed with the SEC on March 30, 2009. | |
| 10.10 | Fourth Amended and Restated Shareholders Agreement among the CVC Shareholders named therein, the Shalom shareholders named therein, the Centel shareholders named therein, the additional shareholders named therein, and Intcomex, Inc., dated as of December 22, 2009. Incorporated by reference to Exhibit 10.10 of our Annual Report on Form 10-K filed with the SEC on February 22, 2010. | |
| #10.11 | Employment Agreement of Russell A. Olson, dated March 9, 2005. Incorporated by reference to Exhibit 10.4 of the S-4 Registration Statement. | |
| 10.12 | Lease Agreement between Lit Industrial Limited Partnership, as landlord, and Software Brokers of America, Inc., as tenant, dated May 12, 2006. Incorporated by reference to Exhibit 10.6 of the S-4 Registration Statement. | |
| #10.13 | Founders Stock Option Grant Agreement, dated February 27, 2007. Incorporated by reference to Exhibit 10.8 of our Annual Report on Form 10-K filed with the SEC on March 30, 2007. | |
| 10.14 | Indemnity Agreement between Co-Investment LLC VII (Intcomex), Anthony Shalom and Michael Shalom, as Main Sellers, dated as of June 29, 2007. Incorporated by reference to Exhibit 10.1 of our Quarterly Report on Form 10-Q filed with the SEC on August 17, 2007. | |
| #10.15 | Restricted Stock Grant Agreement, dated as of November 14, 2007, between Intcomex, Inc. and Thomas A. Madden. Incorporated by reference to Exhibit 10.10 of our Annual Report on Form 10-K filed with the SEC on March 31, 2008 | |
| #10.16 | Restricted Stock Grant Agreement, dated as of November 14, 2007, between Intcomex, Inc. and Carol Miltner Incorporated by reference to Exhibit 10.11 of our Annual Report on Form 10-K filed with the SEC on March 31, 2008 | |
| #10.17 | Restricted Stock Grant Agreement, dated as of June 30, 2008, between Intcomex, Inc. and Thomas A. Madden. Incorporated by reference to Exhibit 10.2 of our Quarterly Report on Form 10-Q filed with the SEC on August 14, 2008. | |
II-6
Table of Contents
| Exhibits |
Document | |
| #10.18 | Restricted Stock Grant Agreement, dated as of June 30, 2008, between Intcomex, Inc. and Carol Miltner. Incorporated by reference to Exhibit 10.3 of our Quarterly Report on Form 10-Q filed with the SEC on August 14, 2008. | |
| #10.19 | Restricted Stock Grant Agreement, dated as of June 30, 2008, between Intcomex, Inc. and Adolfo Henriques. Incorporated by reference to Exhibit 10.1 of our Quarterly Report on Form 10-Q filed with the SEC on August 14, 2008. | |
| #10.20 | Resignation Letter of Carol Miltner, dated as of January 20, 2009. Incorporated by reference to Exhibit 14 to the Current Report on Form 8-K filed with the SEC on January 21, 2009. | |
| #10.21 | Form of Intcomex, Inc. Restricted Stock Grant Agreement. Incorporated by reference to Exhibit 10.1 to the Quarterly Report on Form 10-Q filed with the SEC on July 29, 2009. | |
| 10.22 | Form of 13 1/4% Second Priority Senior Secured Note due 2014. Incorporated by reference to Exhibit 4.2 to the Current Report on Form 8-K filed with the SEC on December 23, 2009. | |
| 10.23 | Registration Rights Agreement, dated as of December 22, 2009, among Intcomex, Inc., Software Brokers of America, Inc., Intcomex Holdings, LLC, Intcomex Holdings SPC-I, LLC, Forza Power Technologies, LLC, Klip Xtreme, LLC, NEXXT Solutions, LLC, Banc of America Securities LLC and Citigroup Global Markets Inc. Incorporated by reference to Exhibit 4.3 to the Current Report on Form 8-K filed with the SEC on December 23, 2009. | |
| Other Exhibits | ||
| 12.1 | Calculation of Ratio of Earnings to Fixed Charges. Incorporated by reference to our Annual Report on Form 10-K filed with the SEC on March 30, 2009. | |
| 21.1 | Subsidiaries of Intcomex, Inc. Incorporated by reference to Exhibit 21.1 of our Annual Report on Form 10-K filed with the SEC on March 30, 2009. | |
| 23.1 | Consent of Independent Registered Public Accounting Firm (BDO Seidman, LLP).(2) | |
| 23.2 | Consents of Independent Registered Public Accounting Firm PricewaterhouseCoopers, S.C.(2) | |
| 23.3 | Consent of Cleary Gottlieb Steen & Hamilton LLP. included in Exhibit 5.1.(1) | |
| 24.1 | Power of Attorney.(2) | |
| (1) | To be filed by amendment. |
| (2) | Filed herewith. |
| # | Indicates a management contract or a compensatory plan or arrangement. |
(b) Financial Statement Schedules. Schedules not listed above have been omitted because the information to be set forth therein is not material, not applicable or is shown in the financial statements or notes thereto.
II-7
Table of Contents
| Item 17. | Undertakings. |
The undersigned Registrant hereby undertakes to provide to the underwriters at the closing specified in the underwriting agreement certificates in such denominations and registered in such names as required by the underwriters to permit prompt delivery to each purchaser.
Insofar as indemnification for liabilities arising under the Securities Act of 1933 may be permitted to directors, officers and controlling persons of the Registrant pursuant to the foregoing provisions, or otherwise, the Registrant has been advised that in the opinion of the Securities and Exchange Commission such indemnification is against public policy as expressed in the Securities Act and is, therefore, unenforceable. In the event that a claim for indemnification against such liabilities (other than the payment by the Registrant of expenses incurred or paid by a director, officer, or controlling person of the Registrant in the successful defense of any action, suit or proceeding) is asserted by such director, officer or controlling person in connection with the securities being registered, the Registrant will, unless in the opinion of its counsel the matter has been settled by controlling precedent, submit to a court of appropriate jurisdiction the question whether such indemnification by it is against public policy as expressed in the Securities Act and will be governed by the final adjudication of such issue.
The undersigned Registrant hereby undertakes that:
(1) For purposes of determining any liability under the Securities Act of 1933, the information omitted from the form of prospectus filed as part of this registration statement in reliance upon Rule 430A and contained in a form of prospectus filed by the Registrant pursuant to Rule 424(b)(1) or (4) or 497(h) under the Securities Act shall be deemed to be part of this registration statement as of the time it was declared effective.
(2) For the purpose of determining any liability under the Securities Act of 1933, each post-effective amendment that contains a form of prospectus shall be deemed to be a new registration statement relating to the securities offered therein, and the offering of such securities at that time shall be deemed to be the initial bona fide offering thereof.
(3) For the purpose of determining liability of the registrant under the Securities Act of 1933 to any purchaser in the initial distribution of securities, the undersigned registrant undertakes that in a primary offering of securities of the undersigned registrant pursuant to this registration statement, regardless of the underwriting method used to sell the securities to the purchaser, if the securities are offered or sold to such purchaser by means of any of the following communications, the undersigned registrant will be a seller to the purchaser and will be considered to offer or sell such securities to such purchaser:
(i) Any preliminary prospectus or prospectus of the undersigned registrant relating to the offering required to be filed pursuant to Rule 424;
(ii) Any free writing prospectus relating to the offering prepared by or on behalf of the undersigned registrant or used or referred to by the undersigned registrant;
(iii) The portion of any other free writing prospectus relating to the offering containing material information about the undersigned registrant or its securities provided by or on behalf of the undersigned registrant; and
(iv) Any other communication that is an offer in the offering made by the undersigned registrant to the purchaser.
II-8
Table of Contents
SIGNATURES
Pursuant to the requirements of the Securities Act of 1933, the registrant has duly caused this registration statement to be signed on its behalf by the undersigned, thereunto duly authorized, in the City of Miami, State of Florida, on February 26, 2010.
| Intcomex, Inc. | ||
| By: | /s/ MICHAEL SHALOM | |
| Michael Shalom Chief Executive Officer | ||
Pursuant to the requirements of the Securities Act of 1933, as amended, this Registration Statement has been signed by the following persons in the capacities and on the dates indicated:
| Signature |
Title |
Date | ||
| /s/ ANTHONY SHALOM Anthony Shalom |
Chairman of the Board of Directors |
February 26, 2010 | ||
| /s/ MICHAEL SHALOM Michael Shalom |
Chief Executive Officer, President and Director (Principal Executive Officer) |
February 26, 2010 | ||
| /s/ RUSSELL A. OLSON Russell Olson |
Treasurer and Chief Financial Officer, Secretary (Principal Financial Officer and Principal Accounting Officer) |
February 26, 2010 | ||
| /s/ ENRIQUE BASCUR Enrique Bascur |
Director |
February 26, 2010 | ||
| * Thomas A. Madden |
Director |
February 26, 2010 | ||
| * Adolfo Henriques |
Director |
February 26, 2010 | ||
| /s/ JUAN PABLO PALLORDET Juan Pablo Pallordet |
Director |
February 26, 2010 | ||
| /s/ ANDRES SMALL Andres Small |
Director |
February 26, 2010 | ||
| By: | /s/ RUSSELL A. OLSON | |
| Russell A. Olson Attorney-in-Fact | ||
II-9
Table of Contents
EXHIBIT INDEX
| Exhibits |
Document | |
| 1.1 | Form of Underwriting Agreement.(1) | |
| 2.1 | Stock Purchase Agreement among Court Square Capital, Ltd., the sellers named therein and Intcomex, Inc., dated August 27, 2004. Incorporated by reference to Exhibit 2.1 to the registration statement on Form S-4 (File No. 333-134090) (the “S-4 Registration Statement”). | |
| 3.1 | Second Amended and Restated Certificate of Incorporation of Intcomex, Inc. Incorporated by reference to Exhibit 3.1 to the Registration Statement on Form S-4 (File No. 333-134090) (the “S-4 Registration Statement). | |
| 3.2 | Amendment Number 1 to the Second Amended and Restated Certificate of Incorporation of Intcomex, Inc., dated December 14, 2009, filed with our Annual Report on Form 10-K filed with the SEC on February 22, 2010. | |
| 3.3 | Amended and Restated By-laws of Intcomex, Inc. Incorporated by reference to Exhibit 3.2 of the Quarterly Report on Form 10-Q filed with the SEC on November 14, 2007. | |
| 4.1 | Specimen Common Stock Certificate of Intcomex, Inc.(1) | |
| 4.2 | Indenture, dated as of December 22, 2009, between Intcomex, Inc., Software Brokers of America, Inc., Intcomex Holdings, LLC, Intcomex Holdings SPC-I, LLC, Forza Power Technologies, LLC, Klip Xtreme, LLC, Nexxt Solutions, LLC, and the Bank of New York Mellon as Trustee. Incorporated by reference to Exhibit 4.1 of our Current Report on Form 8-K filed with the SEC on December 23, 2009. | |
| 4.3(a) | Indenture, dated as of August 25, 2005, between Intcomex, Inc., the guarantors named therein, and the Bank of New York Mellon as Trustee. Incorporated by reference to Exhibit 4.1 of the S-4 Registration Statement. | |
| 4.3(b) | Supplemental Indenture, dated as of October 31, 2006 to the Indenture, dated as of August 25, 2005. Incorporated by reference to Exhibit 4.10 of the S-4 Registration Statement. | |
| 4.3(c) | Second Supplemental Indenture, dated as of December 22, 2009 to the Indenture, dated as of August 25, 2005. Incorporated by reference to Exhibit 4.4 of our Current Report on Form 8-K filed with the SEC on December 23, 2009. | |
| 4.4 | Pledge Agreement among Intcomex, Inc., Intcomex Holdings, LLC and Intcomex Holdings SPC-I, LLC, as pledgors, in favor of the Bank of New York, as trustee, dated as of August 25, 2005. Incorporated by reference to Exhibit 4.4 to the S-4 Registration Statement. | |
| 4.5 | Security Agreement by Software Brokers of America, Inc. and the Bank of New York, as trustee, dated as of August 25, 2005. Incorporated by reference to Exhibit 4.5 to the S-4 Registration Statement. | |
| 4.6 | Lien Subordination Agreement among Comerica Bank, the Bank of New York and Software Brokers of America, Inc., dated as of August 25, 2005. Incorporated by reference to Exhibit 4.6 to the S-4 Registration Statement. | |
| 4.7 | Stock Pledge Agreement between Intcomex Holdings, SPC-I, LLC, as pledgor, in favor of the Bank of New York, as trustee, dated as of August 25, 2005. Incorporated by reference to Exhibit 4.7 to the S-4 Registration Statement. | |
| 4.8 | Share Charge between Intcomex Holdings, LLC, the Bank of New York and IXLA Holdings Ltd., dated as of August 25, 2005. Incorporated by reference to Exhibit 4.8 to the S-4 Registration Statement. | |
II-10
Table of Contents
| Exhibits |
Document | |
| 4.9 | Treasury Management Services Controlled Collateral Account Service Agreement among Comerica Bank, Software Brokers of America, Inc. and the Bank of New York, dated August 25, 2005. Incorporated by reference to Exhibit 4.9 to the S-4 Registration Statement. | |
| 4.10 | Pledge Agreement among Intcomex, Inc., Intcomex Holdings, LLC and Intcomex Holdings SPC-I, LLC, as pledgors, in favor of the Bank of New York Mellon, as trustee, dated as of December 22, 2009. Incorporated by reference to Exhibit 4.10 of our Annual Report on Form 10-K filed with the SEC on February 22, 2010. | |
| 4.11 | Limited Guaranty among Intcomex, Inc., Software Brokers of America, and Comerica Bank, dated as of December 22, 2009. Incorporated by reference to Exhibit 4.11 of our Annual Report on Form 10-K filed with the SEC on February 22, 2010. | |
| 4.12 | Subsidiary Guaranty among Forza Power Technologies, LLC, Klip Xtreme, LLC, Nexxt Solutions, LLC, Software Brokers of America, and Comerica Bank, dated as of December 22, 2009. Incorporated by reference to Exhibit 4.12 of our Annual Report on Form 10-K filed with the SEC on February 22, 2010. | |
| 4.13 | Security Agreement by Software Brokers of America, Inc., the guarantors named therein, and the Bank of New York Mellon, as trustee, dated as of December 22, 2009. Incorporated by reference to Exhibit 4.13 of our Annual Report on Form 10-K filed with the SEC on February 22, 2010. | |
| 4.14 | Lien Subordination Agreement among Comerica Bank, Software Brokers of America, Inc., Forza Power Technologies, LLC, Klip Xtreme, LLC, Nexxt Solutions, LLC, and the Bank of New York Mellon, as trustee dated as of December 22, 2009. Incorporated by reference to Exhibit 4.14 of our Annual Report on Form 10-K filed with the SEC on February 22, 2010. | |
| 4.15 | Stock Pledge Agreement between Intcomex Holdings, SPC-I, LLC, as pledgor, in favor of the Bank of New York Mellon, as trustee, dated as of December 22, 2009. Incorporated by reference to Exhibit 4.15 of our Annual Report on Form 10-K filed with the SEC on February 22, 2010. | |
| 4.16 | Share Charge between Intcomex Holdings, LLC, the Bank of New York Mellon and IXLA Holdings Ltd., dated as of December 22, 2009. Incorporated by reference to Exhibit 4.16 of our Annual Report on Form 10-K filed with the SEC on February 22, 2010. | |
| 4.17 | Treasury Management Services Controlled Collateral Account Service Agreement among Comerica Bank, Software Brokers of America, Inc. and the Bank of New York, as trustee dated December 22, 2009. Incorporated by reference to Exhibit 4.17 of our Annual Report on Form 10-K filed with the SEC on February 22, 2010. | |
| 4.18 | Trademark Security Agreement Software Brokers of America, Inc. and the Bank of New York Mellon, as trustee dated as of December 22, 2009. Incorporated by reference to Exhibit 4.18 of our Annual Report on Form 10-K filed with the SEC on February 22, 2010. | |
| 4.19 | Registration Rights Agreement, dated December 22, 2009, between Intcomex, Inc., the guarantors named therein, and Banc of America Securities LLC and Citigroup Global Markets, Inc. Incorporated by reference to Exhibit 4.3 to our Current Form 8-K filed with the SEC on December 23, 2009. | |
| 5.1 | Legal Opinion of Cleary Gottlieb Steen & Hamilton LLP.(1) | |
| 10.1 | Revolving Credit Agreement between Software Brokers of America, Inc., the guarantors named therein, and Comerica Bank, dated as of December 22, 2009. Incorporated by reference to Exhibit 10.1 of our annual Report on Form 10-K filed with the SEC on February 22, 2010. | |
| 10.2 | Credit Agreement between Software Brokers of America, Inc. and Comerica Bank, dated as of August 25, 2005. Incorporated by reference to Exhibit to 10.1 to the S-4 Registration Statement. | |
II-11
Table of Contents
| Exhibits |
Document | |
| 10.3 | Amendment No. 1 to Credit Agreement, Amendment to Intcomex Subordination Agreement and Waiver Re Intcomex Subordinated Indebtedness, dated as of November 2, 2006, by and among Software Brokers of America, Inc., Comerica Bank and Intcomex, Inc. Incorporated by reference to Exhibit 10.7 of the S-4 Registration Statement. | |
| 10.4 | Amendment No. 2 to Credit Agreement, dated as of May 15, 2007, by and among Software Brokers of America, Inc. and Comerica Bank. Incorporated by reference to Exhibit 10.1 of the Current Report on Form 8-K filed with the SEC on July 18, 2007. | |
| 10.5 | Amendment No. 3 to Credit Agreement, dated as of August 17, 2007, by and among Software Brokers of America, Inc. and Comerica Bank. Incorporated by reference to Exhibit 10.1 of the Current Report on Form 8-K filed with the SEC on August 23, 2007. | |
| 10.6 | Amendment No. 4 to Credit Agreement, dated as of March 28, 2008, by and among Software Brokers of America, Inc. and Comerica Bank. Incorporated by reference to Exhibit 10.12 of the Annual Report on Form 10-K filed with the SEC on March 31, 2008. | |
| 10.7 | Amendment No. 5 to Credit Agreement, dated as of May 14, 2008, by and among Software Brokers of America, Inc. and Comerica Bank. Incorporated by reference to Exhibit 10.1 of the Quarterly Report on Form 10-Q filed with the SEC on May 14, 2008. | |
| 10.8 | Amendment No. 6 to Credit Agreement, dated as of November 13, 2008, by and among Software Brokers of America, Inc. and Comerica Bank. Incorporated by reference to Exhibit 10.1 of the Quarterly Report on Form 10-Q filed with the SEC on November 14, 2008. | |
| 10.9 | Amendment No. 7 to Credit Agreement, dated as of March 20, 2009, by and among Software Brokers of America, Inc. and Comerica Bank. Incorporated by reference to Exhibit 10.8 of the Annual Report on Form 10-K filed with the SEC on March 30, 2009. | |
| 10.10 | Fourth Amended and Restated Shareholders Agreement among the CVC Shareholders named therein, the Shalom shareholders named therein, the Centel shareholders named therein, the additional shareholders named therein, and Intcomex, Inc., dated as of December 22, 2009. Incorporated by reference to Exhibit 10.10 of our Annual Report on Form 10-K filed with the SEC on February 22, 2010. | |
| 10.11 | Employment Agreement of Russell A. Olson, dated March 9, 2005. Incorporated by reference to Exhibit 10.4 of the S-4 Registration Statement. | |
| 10.12 | Lease Agreement between Lit Industrial Limited Partnership, as landlord, and Software Brokers of America, Inc., as tenant, dated May 12, 2006. Incorporated by reference to Exhibit 10.6 of the S-4 Registration Statement. | |
| 10.13 | Founders Stock Option Grant Agreement, dated February 27, 2007. Incorporated by reference to Exhibit 10.8 of our Annual Report on Form 10-K filed with the SEC on March 30, 2007. | |
| 10.14 | Indemnity Agreement between Co-Investment LLC VII (Intcomex), Anthony Shalom and Michael Shalom, as Main Sellers, dated as of June 29, 2007. Incorporated by reference to Exhibit 10.1 of our Quarterly Report on Form 10-Q filed with the SEC on August 17, 2007. | |
| 10.15 | Restricted Stock Grant Agreement, dated as of November 14, 2007, between Intcomex, Inc. and Thomas A. Madden. Incorporated by reference to Exhibit 10.10 of our Annual Report on Form 10-K filed with the SEC on March 31, 2008 | |
| 10.16 | Restricted Stock Grant Agreement, dated as of November 14, 2007, between Intcomex, Inc. and Carol Miltner. Incorporated by reference to Exhibit 10.11 of our Annual Report on Form 10-K filed with the SEC on March 31, 2008 | |
II-12
Table of Contents
| Exhibits |
Document | |
| 10.17 | Restricted Stock Grant Agreement, dated as of June 30, 2008, between Intcomex, Inc. and Thomas A. Madden. Incorporated by reference to Exhibit 10.2 of our Quarterly Report on Form 10-Q filed with the SEC on August 14, 2008. | |
| 10.18 | Restricted Stock Grant Agreement, dated as of June 30, 2008, between Intcomex, Inc. and Carol Miltner. Incorporated by reference to Exhibit 10.3 of our Quarterly Report on Form 10-Q filed with the SEC on August 14, 2008. | |
| 10.19 | Restricted Stock Grant Agreement, dated as of June 30, 2008, between Intcomex, Inc. and Adolfo Henriques. Incorporated by reference to Exhibit 10.1 of our Quarterly Report on Form 10-Q filed with the SEC on August 14, 2008. | |
| 10.20 | Resignation Letter of Carol Miltner, dated as of January 20, 2009. Incorporated by reference to Exhibit 14 to the Current Report on Form 8-K filed with the SEC on January 21, 2009. | |
| 10.21 | Form of Intcomex, Inc. Restricted Stock Grant Agreement. Incorporated by reference to Exhibit 10.1 to the Quarterly Report on Form 10-Q filed with the SEC on July 29, 2009. | |
| 10.22 | Form of 13 1/4% Second Priority Senior Secured Note due 2014. Incorporated by reference to Exhibit 4.2 to the Current Report on Form 8-K filed with the SEC on December 23, 2009. | |
| 10.23 | Registration Rights Agreement, dated as of December 22, 2009, among Intcomex, Inc., Software Brokers of America, Inc., Intcomex Holdings, LLC, Intcomex Holdings SPC-I, LLC, Forza Power Technologies, LLC, Klip Xtreme, LLC, NEXXT Solutions, LLC, Banc of America Securities LLC and Citigroup Global Markets Inc. Incorporated by reference to Exhibit 4.3 to the Current Report on Form 8-K filed with the SEC on December 23, 2009. | |
| 12.1 | Calculation of Ratio of Earnings to Fixed Charges. Incorporated by reference to our Annual Report on Form 10-K filed with the SEC on March 30, 2009 | |
| 21.1 | Subsidiaries of Intcomex, Inc. Incorporated by reference to Exhibit 21.1 of our Annual Report on Form 10-K filed with the SEC on March 30, 2009. | |
| 23.1 | Consent of Independent Registered Public Accounting Firm (BDO Seidman, LLP).(2) | |
| 23.2 | Consents of Independent Registered Public Accounting Firm PricewaterhouseCoopers, S.C.(2) | |
| 23.3 | Consent of Cleary Gottlieb Steen & Hamilton LLP. (included in Exhibit 5.1.)(1) | |
| 24.1 | Power of Attorney.(2) | |
| (1) | To be filed by amendment. |
| (2) | Filed herewith. |
II-13