Attached files
Table of Contents
SECURITIES AND EXCHANGE COMMISSION
Washington, D.C. 20549
Form 10-K
(Mark One)
| x | Annual report pursuant to Section 13 or 15(d) of the Securities Exchange Act of 1934 |
For the fiscal year ended December 31, 2009
or
| ¨ | Transition report pursuant to Section 13 or 15(d) of the Securities Exchange Act of 1934 |
For the transition period from to
Commission File Number 000-30789
ENTEGRIS, INC.
(Exact name of registrant as specified in its charter)
| Delaware | 41-1941551 | |
| (State or Other Jurisdiction of Incorporation or Organization) |
(I.R.S. Employer Identification No.) |
129 Concord Road, Billerica, Massachusetts 01821
(Address of principal executive offices and zip code)
(978) 436-6500
(Registrant’s telephone number, including area code)
Securities registered pursuant to Section 12(b) of the Act:
Title of Class
Common Stock, $0.01 Par Value
Securities registered pursuant to Section 12(g) of the Act: None
Indicate by check mark if the registrant is a well known seasoned issuer, as defined in Rule 405 of the Securities Act. ¨ Yes x No
Indicate by check mark if the registrant is not required to file reports pursuant to Section 13 or 15(d) of the Act. ¨ Yes x No
Indicate by check mark whether the registrant: (1) has filed all reports required to be filed by Section 13 or 15(d) of the Securities Exchange Act of 1934 during the preceding 12 months (or for such shorter period that the registrant was required to file such reports), and (2) has been subject to such filing requirements for the past 90 days. x Yes ¨ No
Indicate by check mark whether the registrant has submitted electronically and posted on its corporate Web site, if any, every Interactive Data File required to be submitted and posted pursuant to Rule 405 of Regulation S-T (§232.405 of this chapter) during the preceding 12 months (or for such shorter period that the registrant was required to submit and post such files). ¨ Yes ¨ No
Indicate by check mark if disclosure of delinquent filers pursuant to Item 405 of Regulation S-K (§229.405 of this chapter) is not contained herein, and will not be contained, to the best of registrant’s knowledge, in definitive proxy or information statements incorporated by reference in Part III of this Form 10-K or any amendment to this Form 10-K. ¨
Indicate by check mark whether the registrant is a large accelerated filer, an accelerated filer, a non-accelerated filer or a smaller reporting company. See the definitions of “large accelerated filer,” “accelerated filer” and “smaller reporting company” in Rule 12b-2 of the Exchange Act. (Check one):
| Large accelerated filer ¨ |
Accelerated filer x | |
| Non-accelerated filer ¨ |
Smaller reporting company ¨ | |
| (Do not check if a smaller reporting company) |
Indicate by check mark whether the registrant is a shell company (as defined in Rule 12b-2 of the Exchange Act). ¨ Yes x No
The aggregate market value of voting stock held by non-affiliates of the registrant, based on the last sale price of the Common Stock on June 30, 2009, the last business day of registrant’s most recently completed second fiscal quarter, was $303,121,285. Shares held by each officer and director of the registrant and by each person who owned 10 percent or more of the outstanding Common Shares have been excluded from this computation in that such persons may be deemed to be affiliates of the registrant. This determination of affiliate status for this purpose is not necessarily a conclusive determination for other purposes.
As of February 19, 2010, 130,729,025 shares of the registrant’s Common Stock were outstanding.
DOCUMENTS INCORPORATED BY REFERENCE
| Document |
Incorporated into Form 10-K | |
| Portions of the Definitive Proxy Statement, to be filed subsequently | Part III |
Table of Contents
Part I
| Item 1. | Business. |
THE COMPANY
Entegris is a worldwide developer, manufacturer and supplier of products and materials used in processing and manufacturing in the semiconductor and other high-technology industries. For the semiconductor industry, our products maintain the purity and integrity of critical materials used by the semiconductor and other high-technology industries. For other high-technology applications, our products and materials are used to manufacture flat panel displays, high-purity chemicals, photoresists, solar cells, gas lasers, optical and magnetic storage devices, fiber optic cables, fuel cells and critical components for aerospace, glass manufacturing and biomedical applications. We sell our products worldwide through a direct sales force and through distributors in selected regions.
The Company was incorporated in Delaware in March 2005 in connection with a strategic merger of equals transaction between Entegris, Inc., a Minnesota corporation (Entegris Minnesota), and Mykrolis Corporation, a Delaware corporation (Mykrolis). Effective August 6, 2005, Entegris Minnesota and Mykrolis were each merged into the Company with the Company as the surviving corporation to carry on the combined businesses. Unless the context otherwise requires, the terms “Entegris”, “we”, “our”, or the “Company” mean Entegris, Inc., a Delaware corporation, and its subsidiaries; the term “Mykrolis” means Mykrolis Corporation and its subsidiaries when referring to periods prior to August 6, 2005; “Entegris Minnesota” means Entegris, Inc., a Minnesota corporation and its subsidiaries other than Entegris when referring to periods prior to August 6, 2005; and the term “Merger” refers to the transactions effected on August 6, 2005 described above. On August 11, 2008 we acquired Poco Graphite (POCO), a privately held company based in Decatur, Texas. The addition of POCO both augmented our base of business in the semiconductor industry and expanded our materials science capabilities to include graphite and silicon carbide and added a consumable product line made from those materials to our portfolio of products.
We offer a diverse product portfolio that includes more than 15,000 standard and customized products that we believe provide the most comprehensive offering of products and services to maintain the purity and integrity of critical materials used by the semiconductor and other high-technology industries. Our products include both unit driven and capital expense driven products. Unit-driven and consumable products are consumed or exhausted during the manufacturing process and rely on the level of semiconductor and other manufacturing activity to drive growth. Capital expense driven products rely on the expansion of manufacturing capacity to drive growth. Our unit-driven and consumable product class includes membrane-based liquid filters and housings, metal-based gas filters, resin-based gas purifiers, wafer shippers, disk-shipping containers and test assembly and packaging products and consumable graphite and silicon carbide components used in plasma etch, ion implant and chemical vapor deposition processes in semiconductor manufacturing. Our capital expense driven products include our components, systems and subsystems that use electro-mechanical, pressure differential and related technologies, to permit semiconductor and other electronics manufacturers to monitor and control the flow and condition of process liquids used in these manufacturing processes, and our process carriers that protect the integrity of in-process wafers. Unit-driven and consumable products, including service revenue, accounted for approximately 70%, 65% and 60% of our net sales for fiscal years 2009, 2008 and 2007, respectively, and capital expense-driven products accounted for approximately 30%, 35% and 40% of our net sales for the fiscal years 2009, 2008 and 2007, respectively.
Our Internet address is www.entegris.com. On this web site, under the “Investor Relations—SEC Filings” section, we post the following filings as soon as reasonably practicable after they are electronically filed with, or furnished to, the U.S. Securities and Exchange Commission (SEC): our annual, quarterly, and current reports on Forms 10-K, 10-Q, and 8-K; our proxy statements; and any amendments to those reports or statements. All such filings are available on our web site free of charge. The SEC also maintains a web site (www.sec.gov) that contains reports, proxy and information statements, and other information regarding issuers that file electronically with the SEC. The content on our web site as referred to in this Form 10-K is not incorporated by reference into this Form 10-K unless expressly noted.
1
Table of Contents
SEMICONDUCTOR INDUSTRY BACKGROUND
Semiconductors, or integrated circuits, are the building blocks of today’s electronics and the backbone of the information age. The market for semiconductors has grown significantly over the past decade. This trend is expected to continue due to increased Internet usage and the continuing demand for applications in data processing, wireless communications, broadband infrastructure, personal computers, handheld electronic devices and other consumer electronics.
The semiconductor materials industry is comprised of a wide variety of materials and consumables that are used throughout the semiconductor production process. The extensive and complex process of turning bare silicon wafers into finished integrated circuits is dependent upon a variety of materials used repeatedly throughout the manufacturing process, such as silicon, chemicals, gases and metals. The handling and purification of these materials during the integrated circuit manufacturing process requires the use of a variety of products, such as liquid and gas filters and purifiers, fluid and gas handling components and wafer shippers and process carriers.
The manufacture of semiconductors is a highly complex process that consists of two principal segments: front-end processes and back-end processes. The front-end process begins with the delivery of raw silicon wafers from wafer manufacturers to semiconductor manufacturers and requires hundreds of highly complex and sensitive manufacturing steps, during which a variety of materials, including chemicals and gases, are applied to the silicon wafer to build the integrated circuits on the wafer surface. We offer products for each of the primary front-end process steps, which are listed below, as well as products to transport in-process wafers between each of these steps.
Deposition. Deposition refers to placing layers of insulating or conductive materials on a wafer surface in thin films that make up the circuit elements of semiconductor devices. The two main deposition processes are physical vapor deposition, where a thin film is deposited on a wafer surface in a low-pressure gas environment, and chemical vapor deposition (CVD), where a thin film is deposited on a wafer surface using a gas medium and a chemical bonding process. In addition, electro-plating technology is utilized for the deposition of low resistance conductive materials such as copper. The control of uniformity and thickness of these films through filtration and purification of the fluids and materials used during the process is critical to the performance of the semiconductor circuit and, consequently, the manufacturing yield. In addition, our graphite chamber liners and shower heads are critical expendable components used in the CVD chamber.
Chemical Mechanical Planarization (CMP). CMP flattens, or planarizes, the topography of the surface of the wafer after deposition to permit the patterning of small features on the resulting smooth surface by the photolithography process. Semiconductor manufacturers need our filtration and purification systems to maintain acceptable manufacturing yields through the chemical mechanical planarization process by filtering the liquid slurries, which are solutions containing abrasive particles in a chemical mixture, to remove oversized particles and contaminants that can cause defects on a wafer’s surface, while not affecting the functioning of the abrasive particles in the liquid slurries. In addition, manufacturers use our consumable polyvinyl alcohol (PVA) roller brushes to clean the wafer after completion of the CMP process to prepare the wafer for subsequent operations.
Photolithography. Photolithography is the process step that defines the patterns of the circuits to be built on the chip. Before photolithography, a wafer is pre-coated with photoresist, a light-sensitive film composed of ultra-high purity chemicals in liquid form. The photoresist is exposed to specific forms of radiation, such as ultraviolet light, electrons or x-rays, to form patterns that eventually become the circuitry on the chip. This process is repeated many times, using different patterns and interconnects between layers to form the complex, multi-layer circuitry on a semiconductor chip. As device geometries decrease and wafer sizes increase, it is even more critical that these photoresists are dispensed on to the chip with accurate thickness and uniformity, as well as with low levels of contamination, and that the process gases are free of micro-contamination so that manufacturers can achieve acceptable yields in the manufacturing process. Our liquid filtration and liquid dispense systems play a critical role in assuring the pure, accurate and uniform dispense of photoresists on to the wafer. In addition, our gas micro-contamination systems eliminate airborne amine contaminants that can disrupt effective photolithography processes.
2
Table of Contents
Etch and Resist Strip. Etch is the process of selectively removing precise areas of thin films that have been deposited on the surface of a wafer. The hardened photoresist protects the remaining material that makes up the circuits. During etch, specific areas of the film not covered by photoresist are removed to leave a desired circuit pattern. Similarly, resist strip is a process of removing the photoresist material from the wafer after the desired pattern has been placed on the wafer. Emerging advanced etch and resist strip applications require precisely controlled gas chemistries and flow rates in order to achieve precise etch and resist strip characteristics. Our gas filters and purifiers help assure the purity of these process gas streams, and our consumable graphite components deliver, baffle and confine these process gases during the etch process.
Ion Implant. Ion implantation provides a means for introducing impurities into the silicon crystal, typically into selected areas defined by the photolithographic process. This selective implanting of ions into defined areas creates electrically conductive areas that form the transistors of the integrated circuits. Ion implanters have the ability to implant selected elements into the silicon wafers at precise locations and depths by bombarding the silicon surface with a precisely controlled beam of electrically charged ions of specific atomic mass and energy. These ions are embedded into the silicon crystal structure, changing the electrical properties of the silicon. The precision of ion implantation techniques permits customers to achieve the necessary control of this doping process to construct up to 500 billion transistors of uniform characteristics on a 300mm wafer. Since these transistors are the starting point of all subsequent process steps, repeatability, uniformity and yield are extremely important. Our consumable graphite components as well as our proprietary low temperature plasma coating process for core components are critical elements of ion implantation equipment.
Wet Cleaning. Ultra-high purity chemicals and photoresists of precise composition are used to clean the wafers, to pattern circuit images and to remove photoresists after etch. Before processes such as photoresist coating, thin film deposition, ion implantation, diffusion and oxidation, and after processes such as ion implantation and etch, the photoresists must be stripped off, and the wafer cleaned in multiple steps of chemical processes. To maintain manufacturing yields and avoid defective products, these chemicals must be maintained at very high purity levels without the presence of foreign material such as particles, ions or organic contaminants. Our liquid filters and purifiers are used to assure the purity of these chemicals.
Our wafer and reticle carriers are high-purity “mini-environments” which carry wafers between each of the above process steps, protecting them from damage and contamination during these transport operations. Our fluid handling components assure the delivery of pure liquid chemicals to each of these process steps. Front-end wafer processing can involve hundreds of steps and take several weeks. As a result, a batch of 25 fully processed wafers, the maximum number of wafers that can be transported in one of our products, can be worth several million dollars. Since significant value is added to the wafer during each successive manufacturing step, it is essential that the wafer be handled carefully and precisely to minimize damage. Thus, in the case of wafer carriers, precise wafer positioning, highly reliable and predictable cassette interface dimensions and advanced materials are crucial. The failure to prevent damage to wafers can severely impact integrated circuit performance, render an integrated circuit inoperable or disrupt manufacturing operations. Our products enable semiconductor manufacturers to: minimize contamination (semiconductor processing is now so sensitive that ionic contamination in certain processing chemicals is measured in parts per trillion); protect semiconductor devices from electrostatic discharge and shock; avoid process interruptions; prevent damage or abrasion to wafers and materials during automated processing caused by contact with other materials or equipment; prevent damage due to abrasion or vibration of work-in-process and finished goods during transportation to and from customer and supplier facilities; and eliminate the dangers associated with handling toxic chemicals.
Once the front-end manufacturing process is completed, finished wafers are transferred to back-end manufacturers or assemblers. The back-end semiconductor manufacturing process consists of test, assembly and packaging of finished wafers into integrated circuits. Our wafer shippers, wafer and reticle carriers and integrated circuit trays facilitate the storage, transport, processing and protection of wafers through these front-end and back-end manufacturing steps.
3
Table of Contents
Semiconductor manufacturing has become increasingly complex in recent years as new technologies have been introduced to enhance device performance and as larger wafer sizes have been introduced to increase production efficiencies. This increasing complexity of semiconductor devices has resulted in a number of challenges including the need for more complex, higher-precision liquid and gas delivery, measurement, control and purification systems and subsystems in the front-end manufacturing processes and to improve time-to-market, reduce manufacturing costs, improve production quality and enhance product reliability and long-term service and support. To address these challenges, semiconductor equipment companies and device manufacturers are outsourcing the design and manufacture of liquid delivery, measurement, control and purification systems, subsystems, components, and consumables to us and to other well-established subsystem and component companies that have worldwide presence and leading technologies. The design and performance of those liquid delivery systems, subsystems, components and consumables are critical to the front-end semiconductor manufacturing process because they directly affect cost of ownership and manufacturing yields. We continually seek opportunities to work with our customers to address these challenges.
Also in response to these challenges and to achieve continued productivity gains, semiconductor manufacturers have become increasingly focused on materials management solutions that enable them to safely store, handle, process and transport critical materials throughout the manufacturing process to minimize the potential for damage or degradation to their materials and to protect their investment in processed wafers. The need for efficient and reliable materials management is particularly important as new materials are introduced and as 300 mm semiconductor wafer manufacturing becomes the more prevalent manufacturing technology. Processing 300 mm wafers, currently the largest wafer size in a manufacturing environment, is more costly and more complex because of the larger size of these wafers. In addition, new materials and circuit shrinkage create new contamination and material compatibility risks, rendering 300 mm wafers more vulnerable to damage or contamination. These trends will present new and increasingly difficult purification, dispense, shipping, transport, process and storage challenges. We seek to bring our advanced polymer manufacturing and advanced tool design capabilities to bear on these challenges to provide our customers with innovative materials integrity management solutions.
Many of the processes used to manufacture semiconductors are also used to manufacture photovoltaic cells, flat panel displays, magnetic and optical storage devices and fiberoptic cables for telecommunications, resulting in the need for similar filtration, purification, control and measurement capabilities. We seek to leverage our products and expertise in serving semiconductor applications to address these important market opportunities.
OUR BUSINESS STRATEGY
Our objective is to be a leading global provider of innovative products and solutions for purifying, protecting and transporting critical materials used in processing and manufacturing in the semiconductor and other high-technology industries. We intend to build upon our position as a worldwide developer, manufacturer and supplier of liquid delivery systems, components and consumables used by semiconductor and other electronic device manufacturers and upon our expertise in advanced specialty materials to grow our business in these and other high value-added manufacturing process markets. Our strategy includes the following key elements:
Comprehensive and Diverse Product Offerings. The semiconductor manufacturing industry is driven by rapid technological changes and intense competition. We believe that semiconductor manufacturers are seeking process control suppliers who can provide a broad range of reliable, flexible and cost-effective products, as well as the technological and application design expertise necessary to deliver effective solutions. Our comprehensive product offering enables us to meet a broad range of customer needs and provide a single source of flexible product offerings for semiconductor device and capital equipment manufacturers as they seek to consolidate their supplier relationships to a smaller select group. In addition, we believe manufacturers of semiconductor tools are looking to their suppliers for subsystems that provide more integrated functionality and seamlessly communicate with other equipment. We believe our offering of consumables and equipment, as well as our ability to integrate them, allows us to provide advanced subsystems.
4
Table of Contents
Diversified Revenue Stream. We target a diversified revenue stream by balancing our sales of wafer transport and process carriers as well as component and subsystem equipment products with sales of our unit-driven and consumable products. Our unit-driven and consumable products provide a relatively more stable and recurring source of revenue in this cyclical industry. Our capital expense-driven products, which are generally dependent upon such factors as the construction and expansion of semiconductor manufacturing facilities and the retrofitting and renovation of existing semiconductor facilities, position us to benefit from increases in capital spending that are typically more subject to the volatility of industry cycles.
Technology Leadership. With the emergence of smaller and more powerful semiconductor devices, and the deployment of new materials and processes to produce them, we believe there is a need for greater materials management within the semiconductor fabrication process. We seek to extend our technology by developing advanced products that address more stringent requirements for greater purification, protection and transport of high value-added materials and for contamination control, fluid delivery and monitoring, and system integration. We have continuously improved our products as our customers’ needs have evolved. For example, we have developed proprietary materials blends for use in our wafer handling product family that address the contamination concerns of advanced semiconductor processing below 100 nanometers; we have also developed a next-generation 300 mm front-opening unified pod utilizing those materials targeting the needs of 65 nm production; and we have expanded upon our proprietary two-stage dispense technology with integrated filtration for photoresist delivery, where the photoresist is filtered through one pump and precisely dispensed through a second pump at a different flow rate to reduce defects on wafers.
Strong Customer Base. We have established ongoing relationships with many leading original equipment manufacturers and materials suppliers in our key markets. These industry relationships have provided us with the opportunity for significant collaboration with our customers at the product design stage, which has facilitated our ability to introduce new products and applications that meet our customers’ needs. For example, we work with our key customers at the pre-design and design stages to identify and respond to their requests for current and future generations of products. We target opportunities to offer new technologies in emerging applications, such as copper plating, chemical mechanical planarization, wet-dry cleaning systems and photolithography. We believe that our large customer base will continue to be an important source of new product development ideas.
Global Presence. We have established a global infrastructure of design, manufacturing, distribution, service and support facilities to meet the needs of our customers. In addition, we may expand our global infrastructure, either through acquisition or internal development, to accommodate increased demand, or we may consolidate inefficient operations to optimize our manufacturing and other capabilities. For example, we have established sales and service offices in China in anticipation of a growing semiconductor manufacturing base in that region. As semiconductor and other electronic device manufacturers have become increasingly global, they have required that suppliers offer comprehensive local repair and customer support services. In response to this trend we transferred customer support and logistics activities to local regions in an effort to enhance our global customer contact and awareness. We maintain our customer relationships through a combination of direct sales and support personnel and selected independent sales representatives and distributors in Asia, Europe and the Middle East.
Ancillary Markets. We plan to leverage our accumulated expertise in the semiconductor industry by developing products for applications that employ similar production processes that utilize materials integrity management, high-purity fluids and integrated dispense system technologies. Our products are used in manufacturing processes outside of the semiconductor industry, including the manufacturing of flat panel displays, fuel cell components, high-purity chemicals, photoresists, solar cells, gas lasers, optical and magnetic storage devices and fiberoptic cables. We plan to continue to identify and develop products that address materials management and advanced materials processing applications where fluid management plays a critical role. We believe that by utilizing our technology to provide manufacturing solutions across multiple industries, we are able to increase the total available market for our products and reduce, to an extent, our exposure to the cyclicality of any particular market.
5
Table of Contents
Strategic Acquisitions, Partnerships and Related Transactions. We plan to pursue strategic acquisitions and business partnerships that enable us to address gaps in our product offerings, secure new customers, diversify into complementary product markets and broaden our technological capabilities and product offerings. Our acquisition of Poco Graphite in August of 2008 is an example of this strategy. Poco Graphite reinforces our presence in that industry by providing a group of new products critical to front-end semiconductor manufacturing based on a materials science that we did not previously have in our technology portfolio. Further, as the dynamics of the markets that we serve shift, we will reevaluate the ability of our existing businesses to provide value-added solutions to those markets in a manner that contributes to achieving our objectives; in the event that we conclude that a business is not able to do this, we expect to restructure or replace that business. The sale of our cleaning equipment business in 2008 is an example of this strategy. Finally, we are continuously evaluating opportunities for strategic alliances and joint development efforts with key customers and other industry leaders.
OUR SEGMENTS
We design, manufacture and market our products through three segments: (i) our contamination control solutions segment, which offers a wide range of products that purify, monitor and deliver critical liquids and gases to the semiconductor manufacturing process and similar manufacturing processes, (ii) our microenvironments segment, which offers products to preserve the integrity of wafers, reticles and electronic components at various stages of transport, processing and storage and (iii) our specialty materials segment, which offers material science solutions in the form of materials, components and services to a wide range of customers in the semiconductor industry and in adjacent and unrelated industries. Each segment has dedicated manufacturing resources, and is composed of several product-focused business units. Each product-focused business segment has its own dedicated marketing, engineering, research and development resources. There follows a detailed description of our three segments:
Contamination Control Solutions
Liquid Filtration Products. Liquid processing occurs during multiple manufacturing steps including photolithography, deposition, planarization and surface etching and cleaning. The fluids that are used include various mixtures of acids, bases, solvents, slurries and photochemicals, which in turn are used over a broad range of operating conditions, including temperatures from 5 degrees Celsius up to 180 degrees Celsius. The design and performance of our liquid filtration and purification products are critical to the semiconductor manufacturing process because they directly affect the cost of ownership and manufacturing yield. Specially designed proprietary filters remove sub-micron sized particles and bubbles from the different fluid streams that are used in the manufacturing process. Some of our filters are constructed with ultra-high molecular weight polyethylene flat sheet membranes that offer improved bubble clearance and gel removal, either of which can cause defects in the wafers if not removed. Our low hold-up volume disposable filters, with flat sheet membranes, use our Connectology ™ technology to allow filter changes in less than a minute, significantly faster than conventional filters, to reduce the amount of expensive chemicals lost each time a filter is changed and to minimize operator exposure to hazardous solvents and vapors during changeout. We also offer a line of consumable PVA roller brush products to clean the wafer following the chemical mechanical planarization process. Our unique Planarcore ™ PVA roller brush is molded on the core to allow easy installation that reduces tool downtime and a dimensionally stable product that provides consistent wafer-to-wafer cleaning performance.
Components and Systems. Chemicals spend most of their time in contact with fluid storage and management distribution systems, so it is critical for fluid storage and handling components to resist these chemicals and avoid contributing contaminants to the fluid stream. We offer chemical delivery products that allow the consistent and safe delivery of sophisticated chemicals from the chemical manufacturer to the point-of-use in the semiconductor fab. Most of these products are made from perfluoroalkoxy or PFA, a fluoropolymer resin widely used in the semiconductor industry because of its high purity and inertness to chemicals. The innovative design and reliable performance of our products and systems under the most stringent of process conditions has made us a leader in high-purity fluid transfer products and systems. Both semiconductor manufacturers and semiconductor OEMs
6
Table of Contents
use our chemical delivery products and systems. Our comprehensive product line provides our customers with a single-source provider for their chemical storage and management needs throughout the manufacturing process. Our chemical delivery products include valves, fittings, tubing, pipe, chemical containers and custom fabricated products for high-purity chemical applications.
Our proprietary photochemical filtration and dispense systems integrate our patented two-stage, filter device and valve control technologies. We believe that we offer the microelectronics industry the only dispense systems with integrated filtration capability and that our proprietary patented two-stage technology has a significant advantage over conventional single-stage technology. Our two-stage technology permits the filtering and dispense functions to operate independently so that filtering and dispensing of photochemicals can occur at different rates, reducing the differential pressure across the filter, conserving expensive photochemicals and resulting in reduced defects in wafers. As described above, we offer a line of proprietary filters specifically designed to efficiently connect with these systems. Our patented digital valve control technology improves chemical uniformity on wafers and improves ease of optimized system operation. In addition, our integrated high-precision liquid dispense systems enable uniform application of photoresists for the spin-coating process, where uniformity is measured in units of Angstroms, a tiny fraction of the thickness of a human hair.
We offer a wide variety of measurement and control products for high-purity and corrosive applications. For electronic measurement and control of liquids, we provide a complete line of pressure and flow measurement and control products as well as all-plastic capacitance sensors for leak detection, valve position, chemical level and other measurements. We also offer a complete line of sight tube-style flowmeters and mechanical gauge pressure measurement products.
Gas Filtration Products. Our Wafergard®, ChamberGard™ and Waferpure® particle and molecular filtration products purify the gas entering the process chamber in order to eliminate system and wafer problems due to particulate, atmospheric and chemical contaminants. These filters are able to retain all particles 0.003 microns and larger. Our metal filters, such as stainless steel and nickel filters, reduce outgassing and improve corrosion resistance. Our Waferpure ® and Aeronex Gatekeeper® purifiers chemically react with and absorb volatile contaminants, such as oxygen and water, to prevent contamination, and our ChamberGard ™ vent diffusers reduce particle contamination and processing cycle times. We offer a wide variety of gas purification products to meet the stringent requirements of semiconductor processing. Our Aeronex Gas Purification Systems contain dual-resin beds, providing a continuous supply of purified gas without process interruption. These gas purification systems are capable of handling higher flow rates and longer duty cycles than cartridge purifiers. Our Extraction products include filter housings and hybrid media chemical air filters which purify air entering exposure tool and process tool enclosures and remove airborne molecular contaminants.
MICROENVIRONMENTS
Our microenvironment products fall into three sub-categories, wafer handling products, wafer shipping products and data storage products.
Wafer and Reticle Handling Products. We are a global producer of wafer handling and reticle products. We offer a wide variety of products that hold and position wafers as they travel between each piece of equipment used in the automated manufacturing process. These specialized carriers provide precise wafer positioning, wafer protection and highly reliable and predictable cassette interfaces in automated fabs. Semiconductor manufacturers rely on our products to improve yields by protecting wafers from abrasion, degradation and contamination during the manufacturing process. We provide standard and customized products that meet a spectrum of industry standards and customers’ wafer handling needs including front opening unified pods, or FOUPs, wafer transport and process carriers, SMIF pods and work-in-process boxes. To meet our customers’ varying wafer processing and transport needs, we offer wafer carriers in a variety of materials and in sizes ranging from 100 mm through 300 mm.
7
Table of Contents
Wafer Shipping Products. We are a global provider of critical shipping products that preserve the integrity of raw silicon wafers as they are transported from wafer manufacturers to semiconductor manufacturers. We lead the market with our extensive, high-volume line of Ultrapak ® and Crystalpak ® products which are supplied to wafer manufacturers in a full range of sizes covering 100, 125, 150 and 200 mm wafers. We also offer a full-pitch, front-opening shipping box, or FOSB, for the transportation and automated interface of 300 mm wafers. We offer a complete shipping system, including both wafer shipping containers as well as secondary packaging that provides another level of protection for wafers.
We currently offer outsourcing programs for wafer and device transportation and protection for both wafer manufacturing and wafer handling products. Our Wafercare ® and DeviceCare SM services include product cleaning, certified re-use services for shipping products, on-site and off-site product maintenance and optimization, and end-of-life recycling for our wafer, device and disk-handling products. Re-use services can be customized depending on the customers needs to provide product cleaning, logistics, recovery, certification and supply solutions for our products.
Data Storage Products. As is the case with the semiconductor industry, the data storage market continues to face new challenges and deploy new technologies at an accelerating rate. We provide products and solutions to manage two critical sectors of this industry: magnetic disks and the read/write heads used to read and write today’s higher density disks. Because both of these hard disk drive components are instrumental in the transition to more powerful storage solutions, we offer products that carefully protect and maintain the integrity of these components during their processing, storage and shipment. Our product offerings for magnetic hard disk drives include process carriers, boxes, packages, tools and shippers for aluminum and other disk substrates. Our optical hard disk drive products include stamper cases, process carriers, boxes and glass master carriers. Our read/write head products include transport trays, carriers, handles, boxes, individual disk substrate packages and accessories.
Rapidly changing packaging strategies for semiconductor applications are creating new materials management challenges for back-end manufacturers. We offer chip and matrix trays as well as carriers for bare die handling and integrated circuits. Our materials management products are compatible with industry standards and available in a wide range of sizes with various feature sets. Our standard trays offer dimensional stability and permanent electrostatic discharge protection. Our trays also offer a number of features including custom designs to minimize die movement and contact; shelves and pedestals to minimize direct die contact, special pocket features to handle various surface finishes to eliminate die sticking; and other features for automated or manual die placement and removal. In addition, we support our product line with a full range of accessories to address specific needs such as static control, cleaning, chip washing and other related materials management requirements. To better address this market, we have established ictray.com, a website which allows new and existing customers to select from our full range of standard and custom integrated circuit trays.
ENTEGRIS SPECIALTY MATERIALS
Our specialty materials products fall into three sub-categories, Poco Graphite Products, Specialty Coating Products and Polymer Composites. These products all provide high-value materials science enabling solutions in the form of materials, components or services that provide corrosion, high temperature, wear and chemical resistance, electrical and thermal conductivity and biocompatibility to a wide range of customers both within the semiconductor industry and in adjacent and unrelated industries.
Poco Graphite Products. These products are made from specialized graphite or silicon carbide. Our Poco Graphite products sold to the semiconductor industry are used for critical components for semiconductor manufacturing equipment at various stages of the semiconductor manufacturing process including chemical vapor deposition, where our expendable graphite chamber liners and shower heads are critical components used in the CVD chamber; wet etch and clean, where our consumable graphite components deliver, baffle and confine the process gases during the etch process; and ion implant, where our consumable graphite components are
8
Table of Contents
critical elements of ion implantation equipment. In addition, our Poco Graphite high-quality graphite is used as precision consumable electrodes for electrical discharge machining, a non-contact precision thermoelectric machining process for hard and exotic metals and other materials. Poco Graphite also manufactures a number of graphite hot glass contact materials for use in the manufacture of glass containers. Finally, Poco Graphite manufactures a number of graphite consumable products for various industrial applications including bushings and thrust washers for aerospace applications, substrates for industrial print heads, components for scan heads in industrial optical applications, cathodes for fuel cells and heart valves for human implantation.
Specialty Coatings. We offer a variety of high-performance specialty coatings for critical components used in semiconductor and other high-technology manufacturing operations. These components, often in highly complex geometries, are coated by means of a low-temperature, plasma-assisted chemical vapor deposition process to provide corrosion and abrasion resistance and desired conductivity and hydrophobicity properties. We also provide complex assemblies such as electrostatic chucks for semiconductor manufacturing equipment, where our coatings prevent contamination of the process. Our coatings are also used in other high-technology applications such as aerospace optical components.
Polymer Composites. We are pursuing a number of advanced materials initiatives to produce single wall and multi-wall carbon nanotube polymer composite materials for use in various products in the semiconductor and other high technology markets.
Worldwide Applications Development and Field Support Capabilities
We provide strong technical support to our customers through local service groups and engineers consisting of field applications engineers, technical service groups, applications development groups and training capabilities. Our field applications engineers, located in the United States and approximately ten other countries, work directly with our customers on product qualification and process improvements in their facilities. In addition, in response to customer needs for local technical service and fast turnaround time, we maintain regional applications laboratories. Our applications laboratories maintain process equipment that simulate customers’ applications and industry test standards and provide product evaluation, technical support and complaint resolution for our customers.
OUR CUSTOMERS AND MARKETS
Our major semiconductor customer groups include integrated circuit device manufacturers, original equipment manufacturers that provide equipment to integrated circuit device manufacturers, gas and chemical manufacturing companies and manufacturers of high-precision electronics. Our major non-semiconductor customers for our Poco Graphite products include electrical discharge machining customers, glass container manufacturers, aerospace manufacturers and manufacturers of biomedical implantation devices.
Our most significant customers based on sales in fiscal 2009 include leading device makers such as Samsung America Inc., ST Micro, Taiwan Semiconductor Manufacturing Co. Ltd. and UMC Group, leading OEM companies such as ASML and Tokyo Electron and leading wafer grower companies such as MEMC, Siltronic AG and SUMCO Oregon Corp. We also sell our products to flat panel display original equipment manufacturers, materials suppliers and end users. The major manufacturers for flat panel displays and flat panel display equipment are concentrated in Japan, Korea and other parts of Asia.
In 2009, 2008 and 2007, net sales to our top ten customers accounted for approximately 29%, 26% and 28%, respectively, of our net sales. During those same periods no single customer accounted for more than 10% of our net sales and international net sales represented approximately 71%, 71% and 74%, respectively, of our net sales. Over 3,200 customers purchased products from us during 2009.
We may enter into supply agreements with our customers to govern the conduct of our business with our customers, including the manufacture of our products. These agreements generally have a term of one to three years, but do not
9
Table of Contents
contain any long-term purchase commitments. Instead, we work closely with our customers to develop non-binding forecasts of the future volume of orders. However, customers may cancel their orders, change production quantities from forecasted volumes or delay production for a number of reasons beyond our control.
SALES AND MARKETING
We sell our products worldwide, primarily through our direct sales force and strategic distributors located in offices in all major semiconductor markets, as well as through independent distributors elsewhere. As of December 31, 2009, our sales and marketing force consisted of approximately 430 employees worldwide. Our direct sales force is supplemented by independent sales representatives and agents.
Our semiconductor marketing efforts focus on our “push/pull” marketing strategy in order to maximize our selling opportunities. We work with original equipment manufacturers to persuade them to design tools that require our products and we create end-user “pull” demand by persuading semiconductor manufacturers to specify our products. Our industry relationships have provided us with the opportunity for significant collaboration with our customers at the product design stage, which has facilitated our ability to introduce new products and applications that meet our customers’ needs. In addition, we are constantly identifying for our customers the variety of analytical, purification and process control challenges that may be addressed by our products. Further, we adapt our products and technologies to resolve process control issues identified by our customers. Our sales representatives provide our customers with worldwide support and information about our products.
We believe that our technical support services are important to our marketing efforts. These services include assisting in defining a customer’s needs, evaluating alternative products, designing a specific system to perform the desired separation, training users and assisting customers in compliance with relevant government regulations. In addition, we maintain a network of service centers located in the United States and in key international markets to support our products.
COMPETITION
The market for our products is highly competitive. While price is an important factor, we compete primarily on the basis of the following factors:
| • historical customer relationships; |
• breadth of product line; | |
| • technical expertise; |
• breadth of geographic presence; | |
| • product quality and performance; |
• advanced manufacturing capabilities; and | |
| • total cost of ownership; |
• after-sales service. | |
| • customer service and support; |
||
We believe that we compete favorably with respect to all of the factors listed above, but we cannot assure you that we will continue to do so. We believe that our key competitive strengths include our broad product line, the low total cost of ownership of our products, our ability to provide our customers with quick order fulfillment and our technical expertise. However, our competitive position varies depending on the market segment and specific product areas within these segments. While we have longstanding relationships with a number of semiconductor and other electronic device manufacturers, we also face significant competition from companies that have longstanding relationships with other semiconductor and electronic device manufacturers and, as a result, have been able to have their products specified by those customers for use in manufacturers’ fabrication facilities. In the markets for our consumable products, we believe that our differentiated membrane and materials integrity management technologies, strong supply chain capabilities that allow us to provide our customers with quick order fulfillment, and technical expertise, which enables us to develop membranes to meet specific customer needs and assist our customers in improving the functionality of our membranes for particular applications, allow
10
Table of Contents
us to compete favorably. In these markets our competitors compete against us on the basis of price, as well as alternative membrane technology having different functionality, manufacturing capabilities and breadth of geographic presence.
The market for our products is highly fragmented, and we compete with a number of different companies. Our liquid filtration control products compete with product offerings from a wide range of companies including both large companies such as Pall Corporation as well as small Asian filter manufacturers. Our contamination control components and systems also face worldwide competition from companies such as Saint-Gobain, Parker, Gemu, Donaldson and Iwaki Co., Ltd. Our gas filtration products compete with companies such as SAES Puregas and Mott Metallurgical Corporation. Our microenvironment product lines face competition largely on a product-by-product basis. We face competition from companies such as Miraial (formerly Kakizaki), Dainichi and Shin-Etsu Polymer and from regional suppliers such as e.PAK Resources Pte. Ltd. These companies compete with us primarily in 200 mm and 300 mm applications. Our data storage and finished electronic components products compete with companies such as ITW/Camtex, Peak International and 3M and from regional suppliers. Our Poco Graphite products compete with products manufactured by companies such as Carbone Lorraine (France), Tokai Carbon (Japan) and Toyo Tanso (Japan). Some of our competitors are larger and have greater resources than we do. In some cases, our competitors are smaller than us, but well-established in specific product niches. We believe that none of our competitors competes with us across all of our product offerings and that, within the markets that we serve, we offer a broader line of products, make use of a wider range of process control technologies and address a broader range of applications than any single competitor.
ENGINEERING, RESEARCH AND DEVELOPMENT
Our aggregate engineering, research and development expenses in 2009, 2008 and 2007 were $35.0 million, $40.1 million and $39.7 million, respectively. As of December 31, 2009, we had approximately 190 employees in engineering, research and development. In addition, we have followed a practice of supplementing our internal research and development efforts by licensing technology from unaffiliated third parties and/or acquiring distribution rights with respect thereto when we believe it is in our long-term interests to do so.
To meet the global needs of our customers, we have engineering, research and development capabilities in California, Minnesota, Massachusetts, Texas, Japan, Taiwan and Malaysia. Our engineering, research and development efforts are directed toward developing and improving our technology platforms for semiconductor and advanced processing applications and identifying and developing products for new applications for which fluid management plays a critical role.
We use sophisticated methodologies to research, develop and characterize our materials and products. Our materials technology laboratory is equipped to analyze the physical, rheological, thermal, chemical and compositional nature of the polymers we use. Our materials lab includes standard and advanced polymer analysis equipment such as inductively coupled plasma mass spectrometry (ICP/MS), inductively coupled plasma atomic emission spectrometry (ICP/AES), Fourier transform infrared spectroscopy (FTIR) and automated thermal desorption gas chromatography/mass spectrometry (ATD-GC/MS). This advanced analysis equipment allows us to detect contaminants in materials that could harm the semiconductor manufacturing process to levels as low as parts per billion, and in many cases parts per trillion.
Our capabilities to test and characterize our materials and products are focused on continuously reducing risks and threats to the integrity of the critical materials that our customers use in their manufacturing processes. We expect that technology and product engineering, research and development will continue to represent an important element in our ability to develop and characterize our materials and products.
Key elements of our engineering, research and development expenditures over the past three years have included the development of new product platforms to meet the manufacturing needs for 90, 65, 45 and 32 nanometer semiconductor devices. Driven by the proliferation of new materials and chemicals in the manufacturing processes and increased needs for tighter process control for 300 mm wafers, investments were made for new
11
Table of Contents
contamination control products in the area of copper interconnects, deep ultra-violet (DUV) photolithography, and chemical and gas management technologies for advanced wafer cleans, deposition and etch equipment. Additional investments were made in the area of advanced process control, monitoring and diagnostics capabilities for future generations of semiconductor manufacturing processes. Our employees also work closely with our customers’ development personnel. These relationships help us identify and define future technical needs on which to focus our engineering, research and development efforts. In addition, we participate in Semiconductor Equipment and Materials International (SEMI), a consortium of semiconductor equipment suppliers. We also support research at academic and other institutions targeted at advances in materials science and semiconductor process development.
MANUFACTURING
Our customers rely on our products to assure the integrity of the critical materials used in their manufacturing processes by providing dimensional precision and stability, cleanliness and consistent performance. Our ability to meet our customers’ expectations, combined with our substantial investments in worldwide manufacturing capacity, position us to respond to the increasing materials integrity management demands of the microelectronics industry and other industries that require similar levels of materials integrity.
To meet our customer needs worldwide, we have established an extensive global manufacturing network with manufacturing facilities in the United States, Japan, Malaysia and South Korea. Because we work in an industry where contamination control is paramount, we maintain Class 100 to Class 10,000 cleanrooms for manufacturing and assembly. We believe that our worldwide manufacturing operations and our advanced manufacturing capabilities are important competitive advantages. Our advanced manufacturing capabilities include:
| • | Injection Molding. Our manufacturing expertise is based on our long experience with injection molding. Using molds produced from computer-aided processes, our manufacturing technicians utilize specialized injection molding equipment and operate within specific protocols and procedures established to consistently produce precision products. |
| • | Extrusion. Extrusion is accomplished through the use of heat and force from a screw to melt solid polymer pellets in a cylinder and then forcing the resulting melt through a die to produce tubing and pipe. We have established contamination-free on-line laser marking and measurement techniques to properly identify products during the extrusion process and ensure consistency in overall dimension and wall thickness. In addition, we use extrusion technology to extrude a polymer mix into flat sheet and hollow fiber membranes. |
| • | Blow Molding. Blow molding consists of the use of heat and force from a screw to melt solid polymer pellets in a cylinder and then forcing the resulting melt through a die to create a hollow tube. The molten tube is clamped in a mold and expanded with pressurized gas until it takes the shape of the mold. We utilize advanced three-layer processing to manufacture 55 gallon drums, leading to cost savings while simultaneously assuring durability, strength and purity. |
| • | Rotational Molding. Rotational molding is accomplished by the placing of a solid polymer powder in a mold, placing the mold in an oven and rotating the mold on two axes so that the melting polymer coats the entire surface of the mold. This forms a part in the shape of the mold upon cooling. We use rotational molding in manufacturing containers up to 5,000 liters. Our rotational molding expertise has provided rapid market access for our current fluoropolymer sheet lining manufacturing business. |
| • | Compression Molding. In compression molding, thermoset polymers are processed. Today, we use this manufacturing process primarily for manufacturing bipolar plates and end-plates for the fuel cell market. We use the same expertise as in injection molding to assure a consistently produced precision product. |
| • | Membrane Casting. We cast membrane by extruding a polymer into flat sheet or hollow fiber format that is passed through a chamber with controlled atmospheric conditions to control the development of voids or pores in the membrane. Once cast, the membrane is subjected to solvent extraction and annealing steps. The various properties of the membranes that we offer are developed during subsequent process steps. |
12
Table of Contents
| • | Cartridge Manufacturing. We fabricate the membrane we manufacture as well as membranes manufactured by others into finished filtration cartridges in a variety of configurations. The fabrication process involves membrane processing into pleated and other configurations around a central core and enclosing it in a framework of end caps and protective screening for use in fabricated cartridge housings. We also manufacture filter cartridges that are integrated into their own housings and incorporate our patented Connectology™ quick connect technology. |
| • | Graphite Synthesis. We have a differentiated proprietary graphite synthesis process that produces premium graphite with superior strength, uniformity and performance. This synthesis process consists of blending and forming petroleum cokes into “green” billets, baking over an extended period between 800 to 1,100°C, followed by a graphitization process at temperatures between 2,000 to 3,000°C. The graphite produced by this process is sold in bulk, machined into specific components or converted into silicon carbide through controlled exposure to silicon monoxide gas. |
| • | Machining. Machining consists of the use of computer-controlled equipment to create shapes, such as valve bodies and other specific components, out of solid polymer blocks or rods, premium graphite and silicon carbide. Our computerized machining capabilities enable speed and repeatability in volume manufacturing of our machined products, particularly products utilized in chemical delivery applications. |
| • | Assembly. We have established protocols, flow charts, work instructions and quality assurance procedures to assure proper assembly of component parts. The extensive use of robotics throughout our facilities reduces labor costs, diminishes the possibility of contamination and assures process consistency. |
| • | Tool Making. We employ tool development and tool-making staff at locations in the United States and Malaysia. Our toolmakers produce the majority of the tools we use throughout the world. |
We have made significant investments in systems and equipment to create innovative products and tool designs. Our computer-aided design (CAD) equipment allows us to develop three-dimensional electronic models of desired customer products to guide design and tool-making activities. Our CAD equipment also aids in the rapid prototyping of products.
We also use computer-automated engineering in the context of mold flow analysis. Beginning with a three-dimensional CAD model, mold flow analysis is used to visualize and simulate how our molds will fill. The mold flow analysis techniques cut the time needed to bring a new product to market because of the reduced need for sampling and development. Also, our CAD equipment can create a virtual part with specific geometries, which drives subsequent tool design, tool manufacturing, mold flow analysis and performance simulation.
In conjunction with our three-dimensional product designs, we use finite element analysis software to simulate the application of a variety of forces or pressures to observe what will happen during product use. This analysis helps us anticipate forces that affect our products under various conditions. The program also assists our product designers by measuring anticipated stresses against known material strengths and establishing proper margins of safety.
PATENTS AND OTHER INTELLECTUAL PROPERTY RIGHTS
We rely on a combination of patent, copyright, trademark and trade secret laws and license agreements to establish and protect our proprietary rights. As of January 22, 2010 our patent portfolio included 278 current U.S. patents, 551 current foreign patents, including counterparts to U.S. filings, 59 pending U.S. patent applications, 11 pending filings under the Patent Cooperation Treaty not yet nationalized and 482 pending foreign patent applications. While we believe that patents may be important for aspects of our business, we believe that our success also depends more upon close customer contact, innovation, technological expertise, responsiveness and worldwide distribution. Additionally, while our patented technology may delay or deter a competitor in offering a competing product, we do not believe that our patent portfolio functions as a barrier to entry for any of our competitors. In addition, while we license and will continue to license technology used in the manufacture and distribution of products from third parties, except as described below, these licenses are not currently related to any of our core product technology.
13
Table of Contents
We require each of our employees, including our executive officers, to enter into standard agreements pursuant to which the employee agrees to keep confidential all of our proprietary information and to assign to us all inventions made while employed by us.
The patent position of any manufacturer, including us, is subject to uncertainties and may involve complex legal and factual issues. Litigation is currently necessary and will likely be necessary in the future to enforce our patents and other intellectual property rights or to defend ourselves against claims of infringement or invalidity. The steps that we have taken in seeking patents and other intellectual property protections may prove inadequate to deter misappropriation of our technology and information. In addition, our competitors may independently develop technologies that are substantially equivalent or superior to our technology.
GOVERNMENTAL REGULATION
Our operations are subject to federal, state and local regulatory requirements relating to environmental, waste management and health and safety matters, including measures relating to the release, use, storage, treatment, transportation, discharge, disposal and remediation of contaminants, hazardous substances and wastes, as well as practices and procedures applicable to the construction and operation of our plants. There can be no assurance that we will not incur material costs and liabilities or that our past or future operations will not result in exposure to injury or claims of injury by employees or the public. Although some risk of costs and liabilities related to these matters is inherent in our business, as with many similar businesses, we believe that our business is operated in substantial compliance with applicable regulations. However, new, modified or more stringent requirements or enforcement policies could be adopted, which could adversely affect us. While we expect that capital expenditures will be necessary to assure that any new manufacturing facility is in compliance with environmental and health and safety laws, we do not expect these expenditures to be material. Otherwise, we are not presently aware of any facts or circumstances that would cause us to incur significant liabilities in the future related to environmental, health and safety law compliance.
EMPLOYEES
As of February 1, 2010, we had approximately 2,400 full-time employees, including approximately 190 in engineering, research and development and approximately 430 in sales and marketing, as well as approximately 360 temporary employees. Given the variability of business cycles in the semiconductor industry and the quick response time required by our customers, it is critical that we be able to quickly adjust the size of our production staff to maximize efficiency. Therefore, we use skilled temporary labor as required.
None of our employees are represented by a labor union or covered by a collective bargaining agreement other than statutorily mandated programs in European countries.
INFORMATION ABOUT OUR OPERATING SEGMENTS
Our financial reporting segments are Contamination Control Solutions (CCS), Microenvironments (ME), and Entegris Specialty Materials (ESM). In 2009, 2008 and 2007 approximately 71%, 71% and 74%, respectively, of our net sales were made to customers outside North America. Industry and geographic segment information is discussed in Note 21 to the Entegris, Inc. Consolidated Financial Statements (the “Financial Statements”) included in response to Item 8 below, which Note is incorporated herein by reference.
OTHER INFORMATION
On July 27, 2005, our Board of Directors adopted a shareholder rights plan (the “Rights Plan”) pursuant to which Entegris declared a dividend on August 8, 2005 to its shareholders of record on that date of one preferred share purchase right (a “Right”) for each share of Entegris common stock owned on August 8, 2005 and authorized the issuance of Rights in connection with future issuances of Entegris common stock. Each Right entitles the holder
14
Table of Contents
to purchase one-hundredth of a share of a series of preferred stock at an exercise price of $50, subject to adjustment as provided in the Rights Plan. The Rights Plan is designed to protect Entegris’ shareholders from attempts by others to acquire Entegris on terms or by using tactics that could deny all shareholders the opportunity to realize the full value of their investment. The Rights are attached to the shares of our common stock until certain triggering events specified in the Rights Agreement occur, including, unless approved by our board of directors, an acquisition by a person or group of specified levels of beneficial ownership of our common stock or a tender offer for our common stock. Upon the occurrence of any of these triggering events, the Rights authorize the holders to purchase at the then-current exercise price for the Rights that number of shares of our common stock having a market value equal to twice the exercise price. The Rights are redeemable by us for $0.01 and will expire on August 8, 2015. One of the events that would trigger the Rights is the acquisition, or commencement of a tender offer, by a person (an Acquiring Person, as defined in the shareholder rights plan), other than Entegris or any of our subsidiaries or employee benefit plans, of 15% or more of the outstanding shares of our common stock. An Acquiring Person may not exercise a Right.
Entegris’ products are made from a wide variety of raw materials that are generally available in quantity from alternate sources of supply. However, certain materials included in the Company’s products, such as certain filtration membranes used by our Contamination Solutions segment, polymer resins used by our Microenvironments segment and petroleum coke used by our Entegris Specialty Materials segment are obtained from a single source or a limited group of suppliers. Although the Company seeks to reduce dependence on these sole and limited source suppliers, the partial or complete loss of these sources could interrupt our manufacturing operations and result in an adverse effect on the Company’s results of operations. Furthermore, a significant increase in the price of one or more of these components could also adversely affect the Company’s results of operations.
OUR HISTORY
Effective August 6, 2005 Entegris, Inc., a Minnesota corporation, and Mykrolis Corporation, a Delaware corporation, completed a strategic merger of equals transaction, pursuant to which they were each merged into the Company to carry on the combined businesses. We were incorporated in Delaware in March 2005 under the name Eagle DE, Inc. as a wholly owned subsidiary of Entegris Minnesota. Effective August 6, 2005 Entegris Minnesota merged into us in a reincorporation merger of which we were the surviving corporation. Immediately following that merger, Mykrolis merged into us and our name was changed to Entegris, Inc. Our stock is traded on the NASDAQ National Market System under the symbol “ENTG”.
Entegris Minnesota was incorporated in June 1999 to effect the business combination of Fluoroware, Inc., which began operating in 1966, and EMPAK, Inc., which began operating in 1980. On July 10, 2000 Entegris Minnesota completed an initial public offering of approximately 19% of the total shares of the Company’s common stock outstanding.
Mykrolis was organized as a Delaware corporation on October 16, 2000 under the name Millipore MicroElectronics, Inc. in connection with the spin-off by Millipore Corporation of its microelectronics business unit. On March 31, 2001, Millipore effected the separation of the Mykrolis business from Millipore’s business by transferring to Mykrolis substantially all of the assets and liabilities associated with its microelectronics business. On August 9, 2001 Mykrolis completed an initial public offering of approximately 18% of the total shares of the Company’s common stock outstanding. On February 27, 2002, Millipore completed the spin-off of Mykrolis by distributing to its stockholders the 82% of the Mykrolis common stock that it held following the Mykrolis initial public offering.
15
Table of Contents
EXECUTIVE OFFICERS
The following is a list, as of December 31, 2009, of our Executive Officers. All of the Corporate Officers listed below were elected to serve until the first Directors Meeting following the 2010 Annual Stockholders Meeting. All of the Other Executive Officers Listed below were appointed to their current positions by Corporate Officers.
| Name |
Age | Office |
First Appointed To Office* | |||
| CORPORATE OFFICERS | ||||||
| Gideon Argov |
53 | President & Chief Executive Officer | 2004 | |||
| Gregory B. Graves |
49 | Executive Vice President, Chief Financial Officer & Treasurer | 2002 | |||
| Bertrand Loy |
44 | Executive Vice President & Chief Operating Officer | 2001 | |||
| Peter W. Walcott |
63 | Senior Vice President, Secretary & General Counsel | 2001 | |||
| John J. Murphy |
57 | Senior Vice President, Human Resources | 2005 | |||
| John Goodman |
49 | Senior Vice President, Chief Technology & Innovation Officer | 2005 | |||
| OTHER EXECUTIVE OFFICERS | ||||||
| Lynn L. Blake |
43 | Vice President of Finance, Chief Accounting Officer | 2007 | |||
| Todd Edlund |
47 | Vice President, General Manager, Contamination Control Solutions Division | 2007 | |||
| Gregory Morris |
52 | Vice President, Global Sales | 2008 | |||
| William Shaner |
42 | Vice President, General Manager, Microenvironments Division | 2007 | |||
| * | With either the Company or a predecessor company |
Gideon Argov has been our President and Chief Executive Officer and a director since the effectiveness of our merger with Mykrolis. He served as the Chief Executive Officer and a director of Mykrolis since November 2004. Prior to joining Mykrolis, Mr. Argov was a Special Limited Partner at Parthenon Capital, a Boston-based private equity partnership, since 2001. He served as Chairman, Chief Executive Officer and President of Kollmorgen Corporation from 1991 to 2000. From 1988 to 1991 he served as Chief Executive Officer of High Voltage Engineering Corporation. Prior to 1988, he led consulting engagement teams at Bain and Company. He is a director of Interline Brands, Inc., X-Rite Incorporated and Fundtech Corporation.
Gregory B. Graves has served as our Executive Vice President and Chief Financial Officer since July 2008. Prior to that he served as Senior Vice President and Chief Financial Officer since April 2007. Prior to April 2007, he served as Senior Vice President, Strategic Planning & Business Development since the effectiveness of the merger with Mykrolis. Mr. Graves served as the Chief Business Development Officer of Entegris Minnesota since September 2002 and from September 2003 until August 2004 he also served as Senior Vice President of Finance. Prior to joining Entegris Minnesota, Mr. Graves held positions in investment banking and corporate development, including at U.S. Bancorp Piper Jaffray from June 1998 to August 2002 and at Dain Rauscher from October 1996 to May 1998.
Bertrand Loy served as our Executive Vice President and Chief Administrative Officer from the effectiveness of the merger with Mykrolis until July 2008, when he assumed his current position as Chief Operating Officer. He served as the Vice President and Chief Financial Officer of Mykrolis from January 2001 until the Merger. Prior to that, Mr. Loy served as the Chief Information Officer of Millipore from April 1999 until December 2000. From 1995 until 1999, he served as the Division Controller for Millipore’s Laboratory Water Division. From 1989 until 1995, Mr. Loy served Sandoz Pharmaceuticals (now Novartis) in a variety of financial, audit and controller positions located in Europe, Central America and Japan.
16
Table of Contents
Peter W. Walcott has been our Senior Vice President, Secretary and General Counsel since the effectiveness of the merger with Mykrolis. He served as the Vice President, Secretary and General Counsel of Mykrolis since October 2000. Mr. Walcott served as the Assistant General Counsel of Millipore from 1981 until March 2001.
John J. Murphy joined us as our Senior Vice President, Human Resources in October of 2005. He served as the Senior Vice President Human Resources of HNTB, an engineering and architectural services firm from February 2004 until October 2005 and as Corporate Vice President, Human Resources of Cadence Design Systems, Inc. from May of 2000 through October 2003. Prior to that Mr. Murphy held senior human resources positions with L.M. Ericsson Telephone Company and with General Electric Company.
John Goodman has been our Senior Vice President, Chief Technology & Innovation Officer since the effectiveness of the merger with Mykrolis. He served as the Managing Director of the fuel cell market sector since January 2005 and prior to that as president of the fuel cell market sector since June 2002. Mr. Goodman served as Executive Vice President and Chief Technology Officer of Entegris Minnesota from 1999 to 2002. Prior to that time, Mr. Goodman held a variety of positions with Fluoroware (a predecessor to Entegris Minnesota) since 1982.
Lynn L. Blake has been our Vice President of Finance and Chief Accounting Officer since June of 2007. Prior to that time she served as Corporate Controller at MTS Systems Corporation, a global manufacturing company specializing in advanced engineering systems for mechanical testing applications, from 2002 to 2007.
Todd Edlund has been Vice President and General Manager of our Contamination Control Solutions Division since December 2007. He served as the Vice President and General Manager of our Liquid Systems Business Unit from 2005 to 2007, and prior to that as Entegris Minnesota’s Vice President of Sales for semiconductor markets from 2003 to 2005. Prior to 2003, Mr. Edlund held a variety of positions with our predecessor companies since 1995.
Gregory Morris has been Vice President, Global Sales since 2008. Prior to that time, Mr. Morris was our General Manager of Field Operations for the Americas from 2005 to 2008. Mr. Morris was President of the Entegris Minnesota Data Storage Business Unit from 2003-2005. From 1999 to 2003 Mr. Morris acted as General Manager of a wholly-owned subsidiary of Entegris Minnesota. Prior to 1999, Mr. Morris held a variety of positions with our predecessor companies since 1992.
William Shaner has been our Vice President and General Manager, Microenvironments Division since 2007. Prior to that time, Mr. Shaner was our Vice President for the Wafer Shipping Business from 2006 to 2007 and Vice President of Global Product Support for Microenvironments from 2005 to 2006. Prior to 2005, Mr. Shaner held a variety of positions with our predecessor companies since 1995, including President of the Entegris Minnesota Services Market from 2002 to 2005.
CORPORATE GOVERNANCE
At their first meeting following the Merger, on August 10, 2005, our Board of Directors adopted a code of business ethics, The Entegris Code of Business Ethics, applicable to all of our executives, directors and employees as well as a set of corporate governance guidelines. The Entegris Code of Business Ethics, the Governance Guidelines and the charters for our Audit & Finance Committee, Governance & Nominating Committee and our Management Development & Compensation Committee all appear on our website at http://www.Entegris.com under “Investor Relations – Governance”. The Governance Guidelines and committee charters are also available in print to any shareholder that requests a copy. Copies may be obtained by contacting Peter W. Walcott, our Senior Vice President, Secretary and General Counsel through our corporate headquarters.
17
Table of Contents
| Item 1A. | Risk Factors. |
Risks Relating to our Business and Industry
The semiconductor industry has historically been highly cyclical, and industry downturns reduce net sales and profits.
Our business depends on the purchasing patterns of semiconductor manufacturers, which, in turn, depend on the current and anticipated demand for semiconductors and products utilizing semiconductors. The semiconductor industry has historically been highly cyclical with periodic significant downturns, which often have resulted in significantly decreased expenditures by semiconductor manufacturers. Even moderate cyclicality can cause our operating results to fluctuate significantly from one period to the next. We experienced significant revenue deterioration due to a severe downturn in both the capital and unit-driven segments of the semiconductor industry that began during the second half of 2008. We are unable to predict the ultimate duration and severity of this downturn or the timing or extent of a recovery, if any, for the semiconductor industry.
Furthermore, in periods of reduced demand, we must continue to maintain a satisfactory level of engineering, research and development expenditures and continue to invest in our infrastructure. At the same time, we have to manage our operations to be able to respond to any significant increases in demand, if they occur. In addition, because we typically do not have significant backlog, changes in order patterns have a more immediate impact on our revenues. We expect the semiconductor industry to continue to be cyclical. During downturns our revenue is reduced, and there is likely to be an increase in pricing pressure, affecting both gross margin and net income. Such fluctuations in our results could cause our stock price to decline significantly. We believe that period-to-period comparisons of our results of operations may not be meaningful, and you should not rely upon them as indicators of our future performance.
The semiconductor industry is subject to rapid demand shifts, which are difficult to predict. As a result, our inability to meet demand in response to these rapid shifts may cause a reduction in our market share.
Our ability to increase sales of our products, particularly our capital equipment products, depends in part upon our ability to ramp up the use of our manufacturing capacity for such products in a timely manner and to mobilize our supply chain. In order to meet the demands of our customers, we may be required to ramp up our manufacturing capacity in as little as a few months. If we are unable to expand our manufacturing capacity on a timely basis or manage such expansion effectively, our customers could seek such products from other suppliers, and our market share could be reduced. Because demand shifts in the semiconductor industry are rapid and difficult to foresee, we may not be able to increase capacity quickly enough to respond to any such increase in demand.
We may not be able to accurately forecast demand for our products.
We typically operate our business on a just-in-time shipment basis with a modest level of backlog and we order supplies and plan production based on internal forecasts of demand. Due to these factors, we have, in the past, and may again in the future, fail to accurately forecast demand for our products, in terms of both volume and specific products for which there will be demand. This has led to, and may in the future lead to, delays in product shipments, disappointment of customer expectations, or, alternatively, an increased risk of excess inventory and of inventory obsolescence. If we fail to accurately forecast demand for our products, our business, financial condition and operating results could be materially and adversely affected.
Semiconductor industry up-cycles may not reach historic levels and instead may reflect a lower rate of long-term growth.
Notwithstanding the severe and prolonged downturn in the semiconductor industry and the related reduction in manufacturing operations during the period from 2001 to 2003, as well as during 2008 to 2009, there may still be excess manufacturing capacity. In addition, there may not be new high-opportunity applications to drive growth
18
Table of Contents
in the semiconductor industry, as was the case in earlier market cycles. Accordingly, the semiconductor industry may experience lower growth rates during any recovery cycle than has historically been the case and its longer-term performance may reflect this lower growth rate. We are unable to predict the duration or ultimate severity of any downturn or the growth rate of any recovery cycle that may follow.
If we are unable to maintain our technological expertise in design and manufacturing processes, we will not be able to successfully compete.
The microelectronics industry is subject to rapid technological change, changing customer requirements and frequent new product introductions. Because of this, the life cycle of our products is difficult to determine. We believe that our future success will depend upon our ability to develop and provide products that meet the changing needs of our customers, including the shrinking of integrated circuit line-widths and the use of new classes of materials, such as copper, titanium nitride and organic and inorganic dielectric materials, which are materials that have either a low or high resistance to the flow of electricity. This requires that we successfully anticipate and respond to technological changes in manufacturing processes in a cost-effective and timely manner. Any inability to develop the technical specifications for any of our new products or enhancements to our existing products or to manufacture and ship these products or enhancements in volume in a timely manner could harm our business prospects and significantly reduce our sales. In addition, if new products have reliability or quality problems, we may experience reduced orders, higher manufacturing costs, delays in acceptance and payment, additional service and warranty expense, and damage to our reputation.
Our sales are somewhat concentrated on a small number of key customers and, therefore, our net sales and profitability may materially decline if one or more of our key customers does not continue to purchase our existing and new products in significant quantities.
We depend and expect to continue to depend on a limited number of customers for a large portion of our business, and changes in several customers’ orders could have a significant impact on our operating results. Our top ten customers accounted for 29%, 26% and 28%,of our net sales in 2009, 2008 and 2007, respectively. If any one of our key customers decides to purchase significantly less from us or to terminate its relationship with us, our net sales and profitability may decline significantly. We could also lose our key customers or significant sales to our key customers because of factors beyond our control, such as a significant disruption in our customers’ businesses generally or in a specific product line. These customers may stop incorporating our products into their products with limited notice to us and suffer little or no penalty for doing so. In addition, if any of our customers merge or are acquired, we may experience lower overall sales from the merged or surviving companies. Because one of our strategies has been to develop long-term relationships with key customers in the product areas in which we focus, and because we have a long product design and development cycle for most of our products and prospective customers typically require lengthy product qualification periods prior to placing volume orders, we may be unable to replace these customers quickly or at all.
We are subject to order and shipment uncertainties and many of our costs are fixed, and, therefore, any significant changes, cancellations or deferrals of orders or shipments could cause our net sales and profitability to decline or fluctuate.
We do not usually obtain long-term purchase orders or commitments from our customers. Instead, we work closely with our customers to develop non-binding forecasts of the future volume of orders. Customers may cancel their orders, change production quantities from forecasted volumes or delay production for reasons beyond our control. Order cancellations or deferrals could cause us to hold inventory for longer than anticipated, which could reduce our profitability, restrict our ability to fund our operations and cause us to incur unanticipated reductions or delays in our revenue. Our customers often change their orders multiple times between initial order and delivery. Such changes usually relate to quantities or delivery dates, but sometimes relate to the specifications of the products we are supplying. If a customer does not pay for these products, we could incur significant charges against our income. In addition, our profitability may be affected by the generally fixed nature
19
Table of Contents
of our costs. Because a substantial portion of our costs is fixed, we may experience deterioration in gross margins when volumes decline. From time to time, we make capital investments in anticipation of future business opportunities. If we are unable to obtain the anticipated business, our revenue and profitability may decline.
Competition from existing or new companies in the microelectronics industry could cause us to experience downward pressure on prices, fewer customer orders, reduced margins, the inability to take advantage of new business opportunities and the loss of market share.
We operate in a highly competitive industry. We compete against many domestic and foreign companies that have substantially greater manufacturing, financial, research and development and marketing resources than we do. In addition, some of our competitors may have more developed relationships with our existing customers than we do, which may enable them to have their products specified for use more frequently by these customers. We also face competition from the manufacturing operations of our current and potential customers, who continually evaluate the benefits of internal manufacturing versus outsourcing. As more original equipment manufacturers dispose of their manufacturing operations and increase the outsourcing of their products to liquid and gas delivery system and other component companies, we may face increasing competitive pressures to grow our business in order to maintain our market share. If we are unable to maintain our competitive position, we could experience downward pressure on prices, fewer customer orders, reduced margins, the inability to take advantage of new business opportunities and a loss of market share. Further, we expect that existing and new competitors will improve the design of their existing products and will introduce new products with enhanced performance characteristics. The introduction of new products or more efficient production of existing products by our competitors could diminish our market share and increase pricing pressure on our products. Further, customers continue to demand lower prices, shorter delivery times and enhanced product capability. If we do not respond adequately to such pressures, we could lose customers or orders. If we are unable to compete successfully, we could experience pricing pressures, reduced gross margins and order cancellation, which could have a material adverse effect on our results of operations.
The limited market acceptance of our 300 mm shipper products as well as our other products could continue to harm our operating results.
The growing trend toward the use of 300 mm wafers has contributed to the increasing complexity of the semiconductor manufacturing process. The greater diameter of these wafers requires higher tooling costs and presents more complex handling, storage and transportation challenges. We have made substantial investments to complete a full line of 300 mm wafer shipping products, but there is no guarantee that our customers will adopt our 300 mm wafer shipping product lines as they convert existing 200 mm wafer fabrication facilities to the fabrication of 300 mm wafers or build new 300 mm wafer fabrication facilities. Sales of our shipping products for these applications has to date and could continue in the future be minimal and we might not recover our development costs.
Semiconductor and other electronic device manufacturers may direct semiconductor capital equipment manufacturers to use a specified supplier’s product in their equipment. Accordingly, our success depends in part on our ability to have semiconductor and other electronic device manufacturers specify that our products be used at their fabrication facilities. Some of our competitors may have more developed relationships with semiconductor and other electronic device manufacturers, which enable them to have their products specified for use in manufacturers’ fabrication facilities.
We may acquire other businesses, form joint ventures or divest businesses that could negatively affect our profitability, increase our debt and dilute your ownership of our company.
As part of our business strategy, we have, and we expect to continue to address gaps in our product offerings, diversify into complementary product markets or pursue additional technology and customers through acquisitions, joint ventures or other types of collaborations. We also expect to adjust our portfolio of businesses to meet our ongoing strategic objectives. As a result, we may enter markets in which we have no or limited prior experience and may encounter difficulties in divesting businesses that no longer meet our objectives.
20
Table of Contents
Competition for acquiring attractive businesses in our industry is substantial. In executing this part of our business strategy, we may experience difficulty in identifying suitable acquisition candidates or in completing selected transactions at appropriate valuations. Alternatively, we may be required to undertake multiple transactions at the same time in order to take advantage of acquisition opportunities that do arise; this could strain our ability to effectively execute and integrate these transactions. We would consider a variety of financing alternatives for each acquisition which could include borrowing additional funds, reducing our cash balances or issuing additional shares of our common stock to complete an acquisition. This could impair our liquidity and dilute your ownership of our company. Further, we may not be able to successfully integrate any acquisitions that we do make into our existing business operations and we could assume unknown or contingent liabilities or experience negative effects on our reported results of operations from dilutive results from operations and/or from future potential impairment of acquired assets including goodwill related to future acquisitions. We may experience difficulties in operating in foreign countries or over significant geographical distances and in retaining key employees or customers of an acquired business, and our management’s attention could be diverted from other business issues. We may not identify or complete these transactions in a timely manner, on a cost-effective basis or at all, and we may not realize the benefits of any acquisition or joint venture.
We may not effectively penetrate new markets.
Part of our business strategy is to leverage our expertise in our core competencies for growth new and adjacent markets, such as photovoltaic cells, flat panel displays, magnetic and optical storage devices and fiberoptic cables for telecommunications. Our ability to grow our business could be limited if we are unable to execute on this strategy.
Risks Related to Our Borrowings
Our Restated Credit Agreement contains financial covenants that we may not be able to meet.
Our amended and restated credit agreement (the “Restated Credit Agreement”) among us and Poco Graphite, Inc. (“Poco”), as borrowers, Wells Fargo Bank, National Association, as agent, and certain other banks, as lenders, contains various financial covenants that limit our capital equipment purchases to no more than $20 million in both 2010 and 2011 plus certain unused amounts from the prior period ($7.2 million for fiscal 2010); requires that we maintain a minimum level of cash in the United States; and achieve certain levels of EBITDA during the first quarter of 2010. Beginning in the second quarter of 2010, the Restated Credit Agreement requires that we maintain certain cash flow leverage and fixed charge coverage ratios. We cannot be sure that we will be able to meet these financial covenants in our Restated Credit Agreement.
The financial covenants in our Restated Credit Agreement measure our EBITDA over time. If our revenues are not sufficient, we could be required to significantly reduce operating expenses in order to comply with these financial covenants. We cannot assure you that we will be successful in generating sufficient revenues or implementing additional operating expense reductions (if needed) on a timely basis, or at all, that any actions we take would be sufficient to avoid a default under the Restated Credit Agreement, or that any additional operating expense reductions will not have a lasting material adverse impact on our results of operations or long-term business prospects. Furthermore, if management is unsuccessful in implementing sufficient additional operating expense reductions or otherwise ensuring that we are in compliance with the financial covenants in our Restated Credit Agreement, after the expiration of applicable notice or grace periods, the lenders could accelerate any amounts outstanding under the Restated Credit Agreement and exercise their other remedies. In addition, we may not be able to refinance such indebtedness through the proceeds of debt or equity issuances or otherwise, on reasonable terms, on a timely basis, or at all.
If we do not generate sufficient cash, our ability to operate may be impeded.
As of December 31, 2009 we had $69 million of cash and cash equivalents which represented a decrease of $46 million from the $115 million of cash and cash equivalents that we had as of December 31, 2008. We generated $4 million of net cash to conduct our business operations during fiscal 2009; this compares with $66 million of
21
Table of Contents
positive cash generated by our business operations during fiscal 2008. As of December 31, 2009 we had drawn $52 million under the Restated Credit Agreement. If the Company’s future financial performance fails to generate sufficient cash to meet our working capital needs, then we will have to take significant further measures to reduce net cash expenditures. If we are unable to generate sufficient cash by these means, we may be required to seek additional debt or equity financing or sell assets in order to have sufficient liquidity to meet our obligations or for our operations. We cannot assure you that we will be able to raise additional funds in a timely manner, on reasonable terms, or at all.
In addition, if we are unable to meet the financial covenants under the Restated Credit Agreement, then we will be in default and our lenders may pursue their remedies under the Restated Credit Agreement including taking control of our domestic cash receipts from the collection of our receivables as well as certain other assets. In this event, the Company’s ability to conduct business could be severely impeded as there can be no assurance that funds adequate in amount and timing would be available to meet the Company’s liquidity requirements.
We may need to raise additional capital or sell assets in order to pay off the balance on our Restated Credit Agreement when it becomes due in November 2011.
Obligations under our Restated Credit Agreement are due in November 2011. To the extent that our cash flows from operations are not adequate to pay off the balance on our Restated Credit Agreement, we will be required to raise additional debt or equity capital (including convertible securities) or sell our assets. We cannot assure you that if such additional capital or funds were necessary, they would be available on reasonable terms, on a timely basis or at all.
Our Restated Credit Agreement contains restrictions that limit our flexibility in raising capital and operating our business.
Our Restated Credit Agreement restricts our ability to raise additional capital, requires that we use the proceeds of certain permitted financings to repay amounts outstanding under our Restated Credit Agreement and provides for a reduction in our borrowing base following certain permitted financings.
The borrowing base under our Restated Credit Agreement supports up to $106.6 million in outstanding borrowings as of December 31, 2009. Our ability to borrow could be further restricted if the levels of our qualifying U.S. accounts receivable and inventories and/or the value of our property plant and equipment were to decline from current levels, including the step downs provided in the Restated Credit Agreement. Our Restated Credit Agreement also contains various covenants that limit our ability to engage in specified types of transactions including, among other things, our ability to:
| • | incur additional indebtedness; |
| • | pay dividends on, repurchase or make distributions in respect of our capital stock or make other restricted payments; |
| • | make certain investments or acquisitions; |
| • | engage in certain hedging transactions, including foreign currency exchange risk hedging transactions; |
| • | sell certain assets; |
| • | create liens; |
| • | materially change the nature and manner in which we conduct our business; |
| • | consolidate, merge, sell or otherwise dispose of all or substantially all of our assets; and |
| • | enter into certain transactions with our affiliates. |
22
Table of Contents
The limitations described above may prevent us from engaging in transactions which might otherwise be beneficial to us. Further, a breach of any of the covenants contained in our Restated Credit Agreement could result in a default under the Restated Credit Agreement. If any such default occurs, the lenders under our Restated Credit Agreement may elect, after the expiration of any applicable notice or grace periods, to declare all outstanding borrowings, together with accrued and unpaid interest and other amounts payable thereunder, to be immediately due and payable. The lenders under our Restated Credit Agreement also have the right to terminate any commitments they have to provide further borrowings. In addition, following an event of default under the Restated Credit Agreement, the lenders have the right to proceed against the collateral granted to them to secure our obligations under the Restated Credit Agreement, including receivables from the sale of our products and certain other assets, which could severely impede our ability to operate our business. If our obligations under the Restated Credit Agreement were accelerated, our assets may not be sufficient to repay our obligations in full and we cannot assure you that we would be able to refinance such debt on reasonable terms, on a timely basis or at all.
Our significant level of debt, including debt outstanding under our Restated Credit Agreement, could have important consequences for our business and any investment in our securities.
As of December 31, 2009, we had outstanding total indebtedness of $72 million. This indebtedness could have important consequences for our business and any investment in our securities, including:
| • | increasing our vulnerability to adverse economic, industry or competitive developments; |
| • | requiring a substantial portion of our cash flow from operations to be dedicated to the payment of principal and interest on our indebtedness, therefore reducing our ability to use our cash flow to fund our operations, capital expenditures and future business opportunities; |
| • | making it more difficult for us to satisfy our obligations with respect to our indebtedness; restricting us from making strategic acquisitions or causing us to make non-strategic divestitures; |
| • | exposing us to the risk of increased interest rates as our borrowings are at variable rates of interest; |
| • | limiting our ability to obtain additional financing for working capital, capital expenditures, product development, debt service requirements, acquisitions and general corporate or other purposes; and |
| • | limiting our flexibility in planning for, or reacting to, changes in our business or market conditions and placing us at a competitive disadvantage compared to our competitors who are less highly leveraged and who therefore, may be able to take advantage of opportunities that our leverage prevents us from exploiting. |
Manufacturing Risks
Our dependence on single and limited source suppliers could affect our ability to manufacture our products.
We rely on single or limited source suppliers for some plastic polymers and petroleum coke that are critical to the manufacturing of our products. At times, we have experienced a limited supply of certain polymers as well as the need to substitute polymers, resulting in delays, increased costs and the risks associated with qualifying new polymers with our customers. An industry-wide increase in demand for these polymers could affect the ability of our suppliers to provide sufficient quantities to us. If we are unable to obtain an adequate quantity of such supplies, our manufacturing operations may be interrupted.
In addition, suppliers may discontinue production of polymers specified in certain of our products, requiring us in some instances to certify an alternative with our customers. If we are unable to obtain an adequate quantity of such supplies for any reason, our manufacturing operations may be adversely affected. Obtaining alternative sources would likely result in increased costs and shipping delays, which could decrease profitability and damage our relationships with current and potential customers.
23
Table of Contents
Prices for polymers can vary widely. In the volatile oil price environment, some suppliers have added and may in the future add surcharges to the prices of the polymers we purchase. While we have long-term arrangements with certain key suppliers of polymers that fix our price for purchases up to specified quantities, if our polymer requirements exceed the quantities specified, we could be exposed to higher material costs. If the cost of polymers increases and we are unable to correspondingly increase the sales price of our products, our profit margins will decline.
Our graphite synthesis process requires petroleum coke that meets specified criteria. While there are multiple suppliers for this petroleum coke, the sources are limited and our required criteria may cause the price of this petroleum coke to increase.
Our production processes are becoming increasingly complex, and our production could be disrupted if we are unable to avoid manufacturing difficulties.
Our manufacturing processes are complex and require the use of expensive and technologically sophisticated equipment and materials. These processes are frequently modified to improve manufacturing yields and product quality. We have, on occasion, experienced manufacturing difficulties, such as temporary shortages of raw materials and occasional critical equipment breakdowns that have delayed deliveries to customers. A number of our product lines are manufactured at only one or two facilities, and any disruption could impact our sales until another facility could commence or expand production of such products.
Our manufacturing operations are subject to numerous risks, including the introduction of impurities in the manufacturing process and other manufacturing difficulties that may not be well understood for an extended period of time and that could lower manufacturing yields and make our products unmarketable; the costs and demands of managing and coordinating geographically diverse manufacturing facilities; and the disruption of production in one or more facilities as a result of a slowdown or shutdown in another facility. We could experience these or other manufacturing difficulties, which might result in a loss of customers and exposure to product liability claims.
Our membrane manufacturing operations may be disrupted if we are unable to renew our agreement with Millipore or secure a replacement manufacturing facility.
The Third Amended and Restated Membrane Manufacturing Agreement (the “Membrane Agreement”) between us and Millipore Corporation, dated October 13, 2009, provides that our lease of space in Millipore’s Bedford, Massachusetts facility and our right to use certain manufacturing equipment owned by Millipore expires on December 31, 2012. In the event that we are unable to renew the Membrane Agreement, we will have to secure and outfit a replacement membrane manufacturing plant which could require significant lead time and capital investment.
We may lose sales if we are unable to timely procure, repair or replace capital equipment necessary to manufacture many of our products.
If our existing equipment fails, or we are unable to obtain new equipment quickly enough to satisfy any increased demand for our products, we may lose sales to competitors. In particular, we do not maintain duplicate tools or equipment for most of our important products. Fixing or replacing complex tools is time consuming, and we may not be able to replace a damaged tool in time to meet customer requirements. In addition, from time to time we may upgrade or add new manufacturing equipment that may require substantial lead times to build and qualify. Delays in building and qualifying new equipment could result in a disruption of our manufacturing processes and prevent us from meeting our customers’ requirements so that they would seek other suppliers.
24
Table of Contents
We incur significant cash outlays over long-term periods in order to research, develop, manufacture and market new products that may never reach market or may have limited market acceptance.
We make significant cash expenditures to engineer, research, develop and market new products. For example, we incurred $35.0 million, $40.1 million and $39.7 million of engineering, research and development expense in 2009, 2008 and 2007, respectively. The development period for a product can be as long as five years. Following development, it may take an additional two to three years for sales of that product to reach a substantial level, if ever. We cannot be certain of the success of a new product. A product concept may never progress beyond the development stage or may only achieve limited acceptance in the marketplace. If this occurs, we do not receive a direct return on our expenditures and may not even realize any indirect benefits. Additionally, capacity expansion may be necessary in order to manufacture a new product. If sales levels do not increase to offset the additional fixed operating expenses associated with any such expansion, our profitability could decline and our prospects could be harmed.
We are subject to a variety of environmental laws that could cause us to incur significant expenses.
In addition to other regulatory requirements affecting our business, we are subject to a variety of federal, state, local and non-U.S. regulatory requirements relating to the use, disposal, clean-up of, and human exposure to, hazardous chemicals. We generate and handle materials that are considered hazardous waste under applicable law. Certain of our manufacturing operations require the discharge of substantial quantities of wastewater into publicly owned waste treatment works which require us to assure that our wastewater complies with volume and content limitations. If we fail to comply with any present or future regulations, we could be subject to future liabilities or the suspension of production. In addition, compliance with these or future laws could restrict our ability to expand our facilities or build new facilities or require us to acquire costly equipment, incur other significant expenses or modify our manufacturing processes.
We are continually evaluating our manufacturing operations within our plants in order to achieve efficiencies and gross margin improvements. If we are unable to successfully manage transfers or realignments of our manufacturing operations, our ability to deliver products to our customers could be disrupted and our business, financial condition and results of operations could be adversely affected.
In order to enhance the efficiency and cost effectiveness of our manufacturing operations, we expect to move several product lines from one of our plants to another and to consolidate manufacturing operations in certain of our plants. For example, in the fourth quarter of 2009 we completed the closure of our largest North American plant, located in Chaska, Minnesota, and the transfer of its manufacturing activities to our Kulim, Malaysia and Colorado Springs, Colorado plants. Our product lines involve technically complex manufacturing processes that require considerable expertise to operate. If we are unable to efficiently and effectively produce high quality products in relocated manufacturing processes in the destination plant, production may be disrupted and we may not be able to deliver these products to meet customer orders in a timely manner, which may cause us to lose credibility with our customers and harm our business. There can be no assurance that these or future initiatives will be successful in achieving the cost savings that we anticipate.
Loss of our key personnel could harm our business because of their experience in the microelectronics industry and their technological expertise. Similarly, our inability to attract and retain new qualified personnel could inhibit our ability to operate and grow our business successfully.
We depend on the services of our key senior executives and technological experts because of their experience in the microelectronics industry and their technical expertise. The loss of the services of one or several of our key employees or an inability to attract, train and retain qualified and skilled employees, specifically research and development and engineering personnel, could result in the loss of customers or otherwise inhibit our ability to operate and grow our business successfully. In the past and currently, during downturns in the semiconductor industry our predecessor companies have, and we have, had to impose salary reductions on senior employees and freeze or eliminate merit increases in an effort to maintain our financial position. These actions may have an adverse effect on employee loyalty and may make it more difficult for us to attract and retain key personnel.
25
Table of Contents
We face the risk of product liability claims.
The manufacture and sale of our products involve the risk of product liability claims. In addition, a failure of one of our products at a customer site could interrupt the business operations of the customer. Our existing insurance coverage limits may not be adequate to protect us from all liabilities that we might incur in connection with the manufacture and sale of our products if a successful product liability claim or series of product liability claims were brought against us.
If we are unable to protect our intellectual property rights, our business and prospects could be harmed.
Our future success and competitive position depend in part upon our ability to obtain and maintain proprietary technology used in our principal product families. We rely, in part, on patent, trade secret and trademark law to protect that technology. We routinely enter into confidentiality agreements with our employees. However, there can be no assurance that these agreements will not be breached, that we will have adequate remedies for any breach or that our confidential and proprietary information and technology will not be independently developed by or become otherwise known to third parties. We have obtained a number of patents relating to our products and have filed applications for additional patents. We cannot assure you that any of our pending patent applications will be approved, that we will develop additional proprietary technology that is patentable, that any patents owned by or issued to us will provide us with competitive advantages or that these patents will not be challenged by third parties. Patent filings by third parties, whether made before or after the date of our filings, could render our intellectual property less valuable. Competitors may misappropriate our intellectual property, and disputes as to ownership of intellectual property may arise. In addition, if we do not obtain sufficient international protection for our intellectual property, our competitiveness in international markets could be significantly impaired, which would limit our growth and future revenue. Furthermore, there can be no assurance that third parties will not design around our patents.
Protection of our intellectual property rights has and may continue to result in costly litigation.
We may from time to time be required to institute litigation in order to enforce our patents, copyrights or other intellectual property rights, to protect our trade secrets, to determine the validity and scope of the proprietary rights of others or to defend against claims of infringement. Such litigation could result in substantial costs and diversion of resources and could negatively affect our sales, profitability and prospects regardless of whether we are able to successfully enforce our rights. For example, as described in Item 3, “Legal Proceedings,” below, we are engaged in multiple patent litigations with Pall Corporation. We intend to prosecute and defend these cases vigorously and expect that these lawsuits will continue for extended periods of time and that we will incur substantial costs in pursuing them. In addition it may become necessary for us to initiate other costly patent litigation against this or other competitors in order to protect and/or perfect our intellectual property rights. We cannot predict how any existing or future litigation will be resolved or what their impact will be on us.
If we infringe on the proprietary technology of others, our business and prospects could be harmed.
Our commercial success will depend, in part, on our ability to avoid infringing or misappropriating any patents or other proprietary rights owned by third parties. If we are found to infringe or misappropriate a third party’s patent or other proprietary rights, we could be required to pay damages to such third party, alter our products or processes, obtain a license from the third party or cease activities utilizing such proprietary rights, including making or selling products utilizing such proprietary rights. If we are required to obtain a license from a third party, there can be no assurance that we will be able to do so on commercially favorable terms, if at all. For information concerning certain litigation brought by Pall Corporation against us, see “Item 3, “Legal Proceedings” below. We cannot predict how any existing or future litigation will be resolved or what their impact will be on us.
26
Table of Contents
International Risks
We conduct a significant amount of our sales activity and manufacturing efforts outside the United States, which subjects us to additional business risks and may cause our profitability to decline due to increased costs.
Sales to customers outside the United States accounted for approximately 71% of our net sales in 2009, 71% of our net sales in 2008, and 74% of our net sales in 2007. We anticipate that international sales will continue to account for a majority of our net sales. In addition, a number of our key domestic customers derive a significant portion of their revenues from sales in international markets. We also manufacture a significant portion of our products outside the United States and are dependent on international suppliers for many of our parts. We intend to continue to pursue opportunities in both sales and manufacturing internationally. Our international operations are subject to a number of risks and potential costs that could adversely affect our revenue and profitability, including:
| • | unexpected changes in regulatory requirements that could impose additional costs on our operations or limit our ability to operate our business; |
| • | greater difficulty in collecting our accounts receivable and longer payment cycles than is typical in domestic operations; |
| • | changes in labor conditions and difficulties in staffing and managing foreign operations; |
| • | expense and complexity of complying with U.S. and foreign import and export regulations; |
| • | liability for foreign taxes assessed at rates higher than those applicable to our domestic operations; and |
| • | political and economic instability. |
In the past, we have incurred costs or experienced disruptions due to the factors described above and expect to do so in the future. For example, our operations in Asia, and particularly South Korea, Taiwan and Japan, have been negatively impacted in the past as a result of regional economic instability. In addition, Taiwan and South Korea account for a growing portion of the world’s semiconductor manufacturing. There have historically been strained relations between China and Taiwan and there are continuing tensions between North Korea and South Korea and the United States. Any adverse developments in those relations could significantly disrupt the worldwide production of semiconductors, which may lead to reduced sales of our products. Furthermore, we incur additional legal compliance costs associated with our international operations and could become subject to legal penalties in foreign countries if we do not comply with local laws and regulations, which may be substantially different from those in the United States. In a number of foreign countries, some companies engage in business practices that are prohibited by U.S. law applicable to us such as the Foreign Corrupt Practices Act. Although we implement policies and procedures designed to ensure compliance with these laws, there can be no assurance that all of our employees, contractors and agents, as well as those companies to which we outsource certain of our business operations, including those based in countries where practices that violate such U.S. laws may be customary or common, will not take actions in violation of our policies. Any such violation, even if prohibited by our policies, could have an adverse effect on our business and results of operations.
We will lose sales if we are unable to obtain government authorization to export certain of our products, and we would be subject to legal and regulatory consequences if we do not comply with applicable export control laws and regulations.
Exports of certain of our products are subject to export controls imposed by the U.S. Government and administered by the U.S. Departments of State and Commerce. In certain instances, these regulations may require pre-shipment authorization from the administering department. For products subject to the Export Administration Regulations, or EAR, administered by the Department of Commerce’s Bureau of Industry and Security, or BIS, the requirement for a license is dependent on the type and end use of the product, the final destination, the identity of the end user and whether a license exception might apply. Virtually all exports of products subject to
27
Table of Contents
the International Traffic in Arms Regulations, or ITAR, administered by the Department of State’s Directorate of Defense Trade Controls, require a license. Certain of our products are subject to EAR and certain of our future products being developed with government funding, may be subject to ITAR. Products developed and manufactured in our foreign locations are subject to export controls of the applicable foreign nation.
Given the current global political climate, obtaining export licenses can be difficult and time-consuming. Failure to obtain export licenses for these shipments could significantly reduce our revenue and materially adversely affect our business, financial condition and results of operations. Compliance with U.S. Government regulations may also subject us to additional fees and costs. The absence of comparable restrictions on competitors in other countries may adversely affect our competitive position.
Our results of operations could be adversely affected by changes in taxation.
We have facilities in foreign countries and, as a result, are subject to taxation and audit by a number of taxing authorities. Tax rates vary among the jurisdictions in which we operate. Our results of operations could be affected by market opportunities or decisions we make that cause us to increase or decrease operations in one or more countries, or by changes in applicable tax rates or audits by the taxing authorities in countries in which we operate. In addition, we are subject to laws and regulations in various locations that govern the determination of which is the appropriate jurisdiction to decide when and how much profit has been earned and is subject to taxation in that jurisdiction. Changes in these laws and regulations could affect the locations where we are deemed to earn income, which could in turn affect our results of operations. We have deferred tax assets on our balance sheet. Changes in applicable tax laws and regulations could affect our ability to realize those deferred tax assets, which could also affect our results of operations. Each quarter we forecast our tax liability based on our forecast of our performance for the year. If that performance forecast changes, our forecasted tax liability may change.
Fluctuations in the value of the U.S. dollar in relation to other currencies may lead to lower net income and shareholders’ equity or may cause us to raise prices, which could result in reduced net sales.
Foreign currency exchange rate fluctuations could have an adverse effect on our net sales, results of operations and shareholders’ equity. Unfavorable foreign currency fluctuations against the U.S. dollar could require us to increase prices to foreign customers, which could result in lower net sales by us to such customers. Alternatively, if we do not adjust the prices for our products in response to unfavorable foreign currency fluctuations, our profitability could decline. In addition, sales made by our foreign subsidiaries will be denominated in the currency of the country in which these products are sold, and the currency we receive in payment for such sales could be less valuable at the time of receipt versus the time of sale as a result of foreign currency exchange rate fluctuations.
We may be subject to increased import duties as we seek to source more of the materials from which our products are made from foreign countries.
In an effort to reduce the cost of our products or to obtain the highest quality materials, we expect that our purchases of raw materials and components from foreign countries will increase. Those of our products manufactured in the United States or other countries from these materials and components may consequently be burdened by import duties imposed by the United States or those other countries, and these additional costs may be substantial and may put our products at a competitive disadvantage.
Volatility in the global economy could adversely affect results.
Financial markets in the United States, Europe and Asia have been experiencing extreme disruption in recent months, including, among other things, volatility in securities prices, severely diminished liquidity and credit availability, rating downgrades of certain investments and declining valuation of others, declines in consumer
28
Table of Contents
confidence, declines in economic growth, increases in unemployment rates, and uncertainty about economic stability. These conditions have had a significant adverse impact on our industry and financial condition and results of operations. There may be further change in the global economy, which could lead to further challenges in our business and negatively impact our financial results. The current tightening of credit in financial markets adversely affects the ability of our customers and suppliers to obtain financing for significant purchases and operations and could result in a decrease in orders and spending for our products and services. We are unable to predict the likely duration and severity of the current disruption in financial markets and adverse economic conditions and the effects they may have on our business and financial condition. If the current uncertain economic conditions continue or further deteriorate, our business and results of operations could be further materially and adversely affected.
An increased concentration of wafer manufacturing in Japan could result in lower sales of our wafer shipper products.
A large percentage of the world’s 300 mm wafer manufacturing currently takes place in Japan. Our market share in Japan is currently lower than in other regions we serve. If we are not able to successfully leverage our local manufacturing capability and increase market share in Japan, we may not be able to maintain our global market share in wafer shipper products, especially if 300 mm wafer manufacturing in Japan increases.
Terrorist attacks, such as the attacks that occurred in New York and Washington, D.C. on September 11, 2001, and other acts of violence or war may affect the markets in which we operate and hurt our profitability.
Terrorist attacks may negatively affect our operations and any security we issue. There can be no assurance that there will not be future terrorist attacks against the United States or U.S. businesses. These attacks or other armed conflicts may directly impact our physical facilities or those of our suppliers or customers. Our primary facilities include headquarters, research and development and manufacturing facilities in the United States; sales, research and development and manufacturing facilities in Japan and Malaysia; and sales and service facilities in Europe and Asia. Attacks may also disrupt the global insurance and reinsurance industries with the result that we may not be able to obtain insurance at historical terms and levels for our facilities. Furthermore, such attacks may make travel and the transportation of our supplies and products more difficult and more expensive and may ultimately affect the sales of our products in the United States and overseas. As a result of terrorism, the United States may enter into additional armed conflicts, which could have a further impact on our domestic and international sales, our supply chain, our production capacity and our ability to deliver products to our customers. The consequences of these armed conflicts and the associated instability are unpredictable, and we may not be able to foresee events that could have an adverse effect on our business and any security we issue.
Risks Related to Owning our Securities
The price of our common stock has been volatile in the past and may be volatile in the future.
The price of our common stock has been volatile in the past and may be volatile in the future. For example, in fiscal year 2009, the closing price of our stock on The NASDAQ Global Select Market (“NASDAQ”) ranged from a low of $0.52 to a high of $5.62 and in fiscal year 2008, the closing price of our stock on NASDAQ ranged from a low of $1.04 to a high of $8.76.
The trading price of our common stock is subject to significant volatility in response to various factors, some of which are beyond our control including the following: the failure to meet the published expectations of securities analysts; changes in financial estimates by securities analysts; press releases or announcements by, or changes in market values of, comparable companies; volatility in the markets for high-technology stocks, general stock market price and volume fluctuations, which are particularly common among securities of high-technology companies; stock market price and volume fluctuations attributable to inconsistent trading volume levels; the
29
Table of Contents
cyclicality of the semiconductor industry and current industry downturn; our performance; our liquidity and our ability to repay the obligations under our Restated Credit Agreement when it comes due; our ability to respond to rapid shifts in demand; our ability to compete effectively; loss of key customers or decline in order volumes for new and existing products; our high fixed costs; manufacturing difficulties; risks associated with our significant foreign operations; additions or departures of key personnel; involvement in or adverse results from litigation; and perceived dilution from stock issuances.
Furthermore, stock prices for many companies fluctuate widely for reasons that may be unrelated to their operating results. Those fluctuations and general economic, political and market conditions, such as recessions, terrorist or other military actions, or international currency fluctuations, as well as public perception of equity values of publicly traded companies may adversely affect the market price of our common stock. These market fluctuations may cause the trading price of our common stock to decrease. Future decreases in our stock price may adversely impact our ability to raise sufficient additional capital in the future, if needed.
If our common stock trades below book value and the business outlook worsens, we could be required to record material impairment losses for our long-lived assets, including property, plant and equipment and our identifiable intangibles.
In accordance with U.S. generally accepted accounting principles, we review our long-lived assets whenever events or changes in circumstances indicate that the carrying amount of such assets may not be recoverable. If the carrying amount of an asset or group of assets exceeds its undiscounted cash flows, the asset will be written down to its fair value. As a result of the company experiencing a sustained and significant decline in its stock price and a significant decline in the current and forecasted business levels during the third and fourth quarters of fiscal year 2008 and first quarter of fiscal 2009, we reviewed the value of our long-lived assets and determined that none of our long-lived assets were impaired. The determination was based on reviewing estimated undiscounted cash flows for our asset groups, all of which were greater than their carrying values. As required under U.S. generally accepted accounting principles, the long-lives asset impairment analyses occurred before the company’s goodwill impairment assessments.
The evaluation of the recoverability of long-lived assets requires us to make significant estimates and assumptions. These estimates and assumptions primarily include, but are not limited to, the identification of the asset group at the lowest level of independent cash flows and the primary asset of the group; and long-range forecasts of revenue, reflecting management’s assessment of general economic and industry conditions, operating income, depreciation and amortization and working capital requirements.
Due to the inherent uncertainty involved in making these estimates, which are made in the current economic environment and plan for a recovery, actual results could differ from those estimates. In addition, changes in the underlying assumptions would have a significant impact on the conclusion that an asset group’s carrying value is recoverable, or the determination of any impairment charge if it was determined that the asset values were indeed impaired.
Due to the decline in our market capitalization and the uncertain economic environment within the semiconductor industry, we will continue to monitor circumstances and events in future periods to determine whether additional asset impairment testing is warranted.
It is possible that in the future we may no longer be able to conclude that there is no impairment of our long-lived assets, nor can we provide assurance that material impairment charges of long-lived assets will not occur in future periods. For example, our assessment of goodwill for impairment during the second half of 2008 resulted in a determination that the carrying value of our goodwill as of August 31, 2008 (our annual impairment test date) and, due to events and circumstances, through the end of the third and fourth quarters of the year ended December 31, 2008 exceeded its fair value. During the third quarter of 2008 we wrote off $379.8 million of goodwill and at the end of the year we wrote off the remaining goodwill of $94.0 million.
30
Table of Contents
Our annual and quarterly operating results are subject to fluctuations as a result of rapid demand shifts and our modest level of backlog, and if we fail to meet the expectations of securities analysts or investors, the market price of our common stock may decrease significantly.
Our sales and profitability can vary significantly from quarter to quarter and year to year. Because our expense levels are relatively fixed in the short-term, an unanticipated decline in revenue in a particular quarter could disproportionately affect our net income in that quarter. In addition, we make a substantial portion of our shipments shortly after we receive the order, and therefore we operate with a relatively modest level of backlog. As a consequence of the just-in-time nature of shipments and the modest level of backlog, our results of operations may decline quickly and significantly in response to changes in order patterns or rapid decreases in demand for our products. We anticipate that fluctuations in operating results will continue in the future. Such fluctuations in our results could cause us to fail to meet the expectations of securities analysts or investors, which could cause the market price of our common stock to decline substantially. We believe that period-to-period comparisons of our results of operations may not be meaningful, and you should not rely upon them as indicators of our future performance.
If we fail to maintain an effective system of internal controls, we may not be able to accurately report our financial results. As a result, current and potential stockholders could lose confidence in our financial reporting, which would harm our business and the trading price of our stock.
Effective internal controls are necessary for us to provide reliable financial reports. If we cannot provide reliable financial reports, our business and operating results could be harmed. We have in the past discovered, and may in the future discover, areas of our internal controls that need improvement. For example, during each of the years 2007 and 2006, a material weakness in internal control over financial reporting was identified. Each of these material weaknesses represented a reasonable possibility that a material misstatement of our annual or interim financial statements would not have been prevented or detected. In addition, we restated our interim financial statements for the first quarter on 2008 as a result of two significant deficiencies we identified. None of the material weaknesses in 2006 or 2007 required the restatement of any of our annual financial statements.
Any failure to implement and maintain improvements in the controls over our financial reporting, or difficulties encountered in the implementation of these improvements in our controls, could cause us to fail to meet our reporting obligations. Any failure to improve our internal controls to address the identified material weaknesses could also cause investors to lose confidence in our reported financial information, which could have a negative impact on the trading price of our stock.
Changes effected by the Sarbanes-Oxley Act of 2002 and related SEC regulations have in the past and are likely to continue to increase our costs.
The Sarbanes-Oxley Act of 2002 required changes in some of our corporate governance, securities disclosure and compliance practices. In response to the requirements of that Act, the Securities and Exchange Commission and the NASDAQ have promulgated new rules and listing standards covering a variety of subjects. Compliance with these rules and listing standards has increased our legal and financial and accounting costs, and we expect these increased costs to continue indefinitely. We also expect these developments may make it more difficult and more expensive for us to obtain director and officer liability insurance in the future, and we may be forced to accept reduced coverage or incur substantially higher costs to obtain coverage. Likewise, these developments may make it more difficult for us to attract and retain qualified members of our board of directors, particularly independent directors, or qualified executive officers.
Provisions in our charter documents, Delaware law and our shareholder rights plan may delay or prevent an acquisition of us, which could decrease the value of your shares.
Our certificate of incorporation and by-laws, Delaware law and our shareholder rights plan contain provisions that could make it harder for a third party to acquire us without the consent of our board of directors. These
31
Table of Contents
provisions include limitations on actions by our stockholders by written consent. In addition, our board of directors has the right to issue preferred stock without stockholder approval, which could be used to dilute the stock ownership of a potential hostile acquirer.
Our restated certificate of incorporation makes us subject to the anti-takeover provisions of Section 203 of the Delaware General Corporation Law. In general, Section 203 prohibits publicly held Delaware corporations to which it applies from engaging in a “business combination” with an “interested stockholder” for a period of three years after the date of the transaction in which the person became an interested stockholder, unless the business combination is approved in a prescribed manner. This provision could discourage others from bidding for our shares of common stock and could, as a result, reduce the likelihood of an increase in the price of our common stock that would otherwise occur if a bidder sought to buy our common stock.
Our shareholder rights plan will permit our stockholders to purchase shares of our common stock at a 50% discount upon the occurrence of specified events, including the acquisition by anyone of 15% or more of our common stock, unless such event is approved by our board of directors. Delaware law also imposes restrictions on mergers and other business combinations between us and any holder of 15% or more of our outstanding common stock. Although we believe these provisions provide for an opportunity to receive a higher bid by requiring potential acquirers to negotiate with our board of directors, these provisions apply even if the offer may be considered beneficial by stockholders. If a change of control or change in management is delayed or prevented, the market price of our common stock could decline.
Our certificate of incorporation authorizes the issuance of shares of blank check preferred stock.
Our certificate of incorporation provides that our board of directors is authorized to issue from time to time, without further stockholder approval, up to 5,000,000 shares of preferred stock in one or more series and to fix and designate the rights, preferences, privileges and restrictions of the preferred stock, including dividend rights, conversion rights, voting rights, redemption rights and terms of redemption and liquidation preferences. Such shares of preferred stock could have preferences over our common stock with respect to dividends and liquidation rights. Our issuance of preferred stock may have the effect of delaying or preventing a change in control. Our issuance of preferred stock could decrease the amount of earnings and assets available for distribution to the holders of common stock or could adversely affect the rights and powers, including voting rights, of the holders of common stock. The issuance of preferred stock could have the effect of decreasing the market price of our common stock.
Your percentage ownership in us may be diluted by future issuances of capital stock, which could reduce your influence over matters on which stockholders vote.
Subject to applicable NASDAQ standards, our board of directors has the authority, without action or vote of our stockholders, to issue all or any part of our authorized but unissued shares. Issuances of common stock or the exercise of employee and director stock options would dilute your percentage ownership interest, which will have the effect of reducing your influence over matters on which our stockholders vote. In addition, we may issue substantial quantities of our common stock in order to effect acquisitions which would also dilute your ownership interest. If the issuances are made at prices that reflect a discount from the then current trading price of our common stock, your interest in the book value of our common stock might be diluted.
We do not intend to pay dividends or other distributions to our stockholders.
We currently do not, and do not intend to, pay cash dividends on our common stock in the foreseeable future. Furthermore, our Restated Credit Agreement contains restrictions that limit our ability to pay dividends. We expect that we will retain all available earnings generated by our operations for business operations and debt service.
| Item 1B. | Unresolved Staff Comments. |
Not Applicable.
32
Table of Contents
| Item 2. | Properties. |
Our principal executive offices are located in Billerica, Massachusetts. We also have manufacturing, design and equipment cleaning facilities in the United States, Japan, France, Taiwan, Malaysia and South Korea. Information about our principal facilities is set forth below:
| Location |
Principal Function |
Approximate Square Feet |
Leased/ | |||
| Chaska, Minnesota |
Executive Offices, Research & Manufacturing(1) (2) (3) | 370,000 | Owned(4) | |||
| Billerica, Massachusetts |
Executive Offices, Research & Manufacturing(1) | 175,000 | Leased (5) | |||
| Colorado Springs, Colorado |
Manufacturing(2) | 82,000 | Owned | |||
| Decatur, Texas |
Manufacturing(3) | 359,000 | Owned | |||
| Montpellier, France |
Cleaning Services(2) | 53,000 | Owned | |||
| Yonezawa, Japan |
Manufacturing(1) (2) | 196,000 | Owned | |||
| Kulim, Malaysia |
Manufacturing(1) (2) | 195,000 | Owned |
| (1) | Facility used by our Contamination Control Solutions Division. |
| (2) | Facility used by our Microenvironments Division. |
| (3) | Facility used by our Entegris Specialty Materials Division. |
| (4) | In the fourth quarter of 2009, we closed one of these buildings, comprising 178,000 square feet. The building is currently being marketed for sale. |
| (5) | This lease expires March 31, 2014, but is subject to two five-year renewal options. |
We lease approximately 4,200 square feet of manufacturing space in a facility located at 80 Ashby Road, Bedford, Massachusetts owned by Millipore Corporation pursuant to a Third Amended and Restated Membrane Manufacturing and Supply Agreement that expires December 31, 2012. We also lease approximately 13,000 square feet of research and development and manufacturing office space located in San Diego, California. Approximately 31,000 square feet of office, research and development and manufacturing space located in Franklin, Massachusetts was assumed pursuant to the Mykrolis acquisition of Extraction Systems, Inc. in 2005.
We also lease an aggregate of approximately 11,000 square feet of office, research and development and manufacturing space in two buildings located in Burlington, Massachusetts which we acquired in connection with our acquisition of a specialty coatings business. These leases are for a term expiring December 31, 2011.
We maintain a worldwide network of sales, service, repair and cleaning centers in the United States, Germany, France, Japan, Taiwan, Singapore, China and South Korea. Leases for our facilities expire through March 2014. We currently expect to be able to extend the terms of expiring leases or to find suitable replacement facilities on reasonable terms. In addition, one of our subsidiaries owns an approximately 23,000 square foot facility near Seoul, South Korea which is used for manufacturing, research and development by our Contamination Control Solutions Division.
We believe that our facilities are well-maintained and suitable for their respective operations. All of our facilities are generally utilized within a normal range of production volume. However, many of our facilities were utilized below our normal range of production volume during 2009 due to historically low business levels.
| Item 3. | Legal Proceedings. |
The following discussion provides information regarding certain litigation to which the Company was a party that were pending as of December 31, 2009.
As previously disclosed, on March 3, 2003 the Company’s predecessor, Mykrolis Corporation, filed a lawsuit against Pall Corporation in the United States District Court for the District of Massachusetts alleging infringement of two of the Company’s U.S. patents by certain fluid separation systems and related assemblies used in photolithography applications manufactured and sold by the defendant. The Company’s lawsuit sought a preliminary injunction preventing the defendant from the manufacture, use, sale, offer for sale or importation into
33
Table of Contents
the U.S. of any infringing product as well as damages. On April 30, 2004, the Court issued a preliminary injunction against Pall Corporation and ordered Pall to immediately stop making, using, selling, or offering to sell within the U.S., or importing into the U.S., its PhotoKleen EZD-2 Filter Assembly products or “any colorable imitation” of those products. On January 18, 2005, the Court issued an order holding Pall Corporation in contempt of court for the violation of the preliminary injunction and ordering Pall to disgorge all profits earned from the sale of its PhotoKleen EZD-2 Filter Assembly products and colorable imitations thereof from the date the preliminary injunction was issued through January 12, 2005. In addition, Pall was also ordered to reimburse Mykrolis for certain of its attorney’s fees associated with the contempt and related proceedings. The Court’s order also dissolved the preliminary injunction, effective January 12, 2005, based on certain prior art cited by Pall which it alleged raised questions as to the validity of the patents in suit. On February 17, 2005, the Company filed notice of appeal to the U.S. Circuit Court of Appeals for the Federal Circuit appealing the portion of the Court’s order that dissolved the preliminary injunction and Pall filed a notice of appeal to that court with respect to the finding of contempt and the award of attorneys’ fees. On June 13, 2007 the Court of Appeals issued an opinion dismissing Pall’s appeal for lack of jurisdiction and affirming the District Court’s order dissolving the preliminary injunction.
On April 6, 2006 the Company filed a lawsuit against Pall Corporation in the United States District Court for the District of Massachusetts alleging infringement of the Company’s newly issued U.S. patent No. 7,021,667 by certain filter assembly products used in photolithography applications that are manufactured and sold by the defendant. The Company’s lawsuit seeks a preliminary injunction preventing the defendant from the manufacture, use, sale, offer for sale or importation into the U.S. of the infringing products as well as damages. On October 23, 2006 the Company’s motion for preliminary injunction was argued before the court. On March 31, 2008 the court issued an order denying the Company’s motion for a preliminary injunction.
On August 23, 2006 the Company filed a lawsuit against Pall Corporation in the United States District Court for the District of Massachusetts alleging infringement of the Company’s newly issued U.S. patent No. 7,037,424 by certain fluid separation modules and related separation apparatus, including the product known as the EZD-3 Filter Assembly, used in photolithography applications that are manufactured and sold by the defendant. The Company’s lawsuit seeks a preliminary injunction preventing the defendant from the manufacture, use, sale, offer for sale or importation into the U.S. of the infringing products as well as damages. It is believed that the EZD-3 Filter Assembly was introduced into the market by the defendant in response to the action brought by the Company in March of 2003 as described above. On May 5, 2008, the court issued an order consolidating this case with the two cases described in the preceding paragraphs for purposes of discovery; these cases are currently in the discovery stage.
As previously disclosed, on December 16, 2005 Pall Corporation filed suit against the Company in U.S. District Court for the Eastern District of New York alleging patent infringement. Specifically, the suit alleges infringement of two of plaintiff’s patents by one of the Company’s gas filtration products and by the packaging for certain of the Company’s liquid filtration products. This lawsuit seeks damages for the alleged infringements. Both products and their predecessor products have been on the market for a number of years. The Company intends to vigorously defend this suit and believes that it will ultimately prevail. This case is currently awaiting a hearing before the court for claim construction of the patents in suit.
On May, 4, 2007 Pall Corporation filed a lawsuit against the Company in the U.S. District Court for the Eastern District of New York alleging patent infringement. Specifically, the suit alleges that certain of the Company’s point-of-use filtration products infringe a newly issued Pall patent, as well as three older Pall patents. Pall’s action, which relates only to the U.S., asserts that “on information and belief” the Company’s Impact 2 and Impact Plus point-of-use photoresist filters infringe a patent issued to Pall on March 27, 2007, as well as three older patents. In the course of discovery, Pall has alleged that additional products infringe its patents. This lawsuit seeks damages for the alleged infringements. The Company intends to vigorously defend this suit and believes that it will ultimately prevail. This case is currently in the discovery stage.
| Item 4. | Submission of Matters to a Vote of Security Holders. |
None.
34
Table of Contents
PART II
| Item 5. | Market for Entegris’ Common Stock, Related Stockholder Matters and Issuer Purchases of Equity Securities. |
Entegris’ Common Stock, $0.01 par value, trades on the NASDAQ National Market System (NMS) under the symbol “ENTG”. The following table sets forth the highest and lowest sale prices of the Company shares during fiscal 2009 and 2008. As of February 19, 2010 there were 1,380 shareholders of record.
| Fiscal 2009 | Fiscal 2008 | |||||||||||
| High | Low | High | Low | |||||||||
| First quarter |
$ | 2.55 | $ | 0.50 | $ | 8.76 | $ | 6.39 | ||||
| Second quarter |
$ | 3.43 | $ | 0.85 | $ | 8.05 | $ | 6.56 | ||||
| Third quarter |
$ | 4.56 | $ | 2.53 | $ | 7.10 | $ | 4.49 | ||||
| Fourth quarter |
$ | 5.75 | $ | 3.55 | $ | 4.94 | $ | 1.04 | ||||
The Company has never declared or paid any cash dividends on its capital stock. The Company currently intends to retain all available earnings for use in its business operations and debt service and does not anticipate paying any cash dividends in the foreseeable future. In addition, the Company’s credit agreement restricts the Company’s ability declare dividends or redeem or repurchase capital stock. On July 27, 2005 the Entegris Board of Directors declared a dividend of one common stock purchase right for each share of Entegris Common Stock outstanding to shareholders of record on August 8, 2005, payable on August 8, 2005 and authorized the issuance of Rights in connection with future issuances of Entegris common stock. For a description of the Common Stock Rights Plan see “Other Information” in Item 1 above. Each right generally entitles the holder to purchase one one-hundredth of a share of a series of preferred stock of Entegris at a price of $50.
35
Table of Contents
Comparative Stock Performance
The following graph compares the cumulative total shareholder return on the common stock of Entegris, Inc. from August 27, 2004 through December 31, 2009 with cumulative total return of (1) The NASDAQ Composite Index (NASDAQ), and (2) The Philadelphia Semiconductor Index (SOX), assuming $100 was invested at the close of trading August 27, 2004 in Entegris, Inc. common stock, the NASDAQ Composite Index and the Philadelphia Semiconductor Index and that all dividends are reinvested.
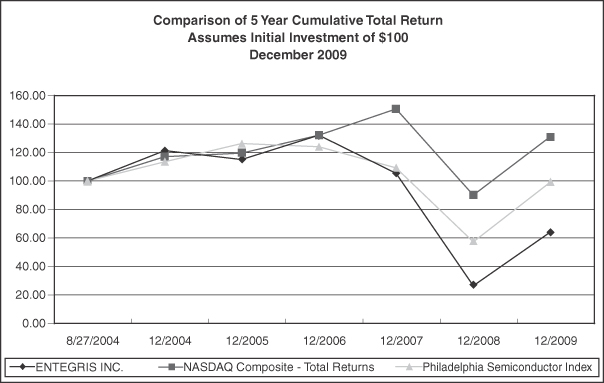
| August 27, 2004 |
December 31, 2004 |
December 31, 2005 |
December 31, 2006 |
December 31, 2007 |
December 31, 2008 |
December 31, 2009 | ||||||||
| Entegris, Inc. |
100 | 121.34 | 114.87 | 131.94 | 105.23 | 26.70 | 64.37 | |||||||
| NASDAQ |
100 | 117.05 | 119.53 | 131.95 | 150.26 | 90.21 | 131.13 | |||||||
| SOX |
100 | 113.42 | 126.13 | 123.94 | 109.06 | 57.49 | 99.35 |
Issuer Purchases of Equity Securities
None
36
Table of Contents
| Item 6. | Selected Financial Data |
The table that follows presents selected financial data for each of the last five fiscal years and four months ended December 31, 2005 from the Company’s consolidated financial statements and should be read in conjunction with the Company’s Consolidated Financial Statements and the related Notes and with “Management’s Discussion and Analysis of Financial Condition and Results of Operations” included elsewhere in this Form 10-K Report.
On December 13, 2005, the Company’s board of directors approved a change in fiscal year end from a 52-week or 53-week fiscal year period ending on the last Saturday of August to December 31, effective as of December 31, 2005.
| (In thousands, except per share amounts) |
Year ended December 31, 2009 |
Year ended December 31, 2008 |
Year ended December 31, 2007 |
Year ended December 31, 2006 |
Four months ended December 31, 2005 |
Year ended August 27, 2005 |
||||||||||||||||||
| Operating Results |
||||||||||||||||||||||||
| Net sales |
$ | 398,644 | $ | 554,699 | $ | 626,238 | $ | 672,882 | $ | 199,644 | $ | 347,345 | ||||||||||||
| Gross profit |
137,812 | 211,515 | 266,237 | 305,078 | 70,207 | 138,183 | ||||||||||||||||||
| Selling, general and administrative expenses |
117,001 | 147,531 | 163,918 | 170,702 | 71,297 | 105,281 | ||||||||||||||||||
| Engineering, research and development expenses |
35,039 | 40,086 | 39,727 | 38,074 | 13,904 | 18,188 | ||||||||||||||||||
| Amortization of intangible assets |
19,237 | 19,585 | 18,874 | 17,609 | 5,956 | 5,060 | ||||||||||||||||||
| Impairment of goodwill |
— | 473,799 | — | — | — | — | ||||||||||||||||||
| Restructuring charges |
15,463 | 10,423 | — | — | — | — | ||||||||||||||||||
| Operating (loss) profit |
(48,928 | ) | (479,909 | ) | 43,718 | 78,693 | (20,950 | ) | 9,654 | |||||||||||||||
| (Loss) income before income taxes and equity in affiliate earnings |
(59,888 | ) | (496,413 | ) | 56,619 | 89,556 | (18,572 | ) | 14,307 | |||||||||||||||
| Income (benefit) tax expense |
(2,996 | ) | 19,201 | 10,356 | 26,936 | (8,713 | ) | 1,154 | ||||||||||||||||
| (Loss) income from continuing operations |
(57,759 | ) | (515,897 | ) | 46,356 | 63,151 | (9,789 | ) | 12,906 | |||||||||||||||
| Net (loss) income attributable to Entegris, Inc. |
$ | (57,721 | ) | $ | (517,002 | ) | $ | 44,359 | $ | 63,466 | $ | (18,324 | ) | $ | 9,393 | |||||||||
| Earnings Per Share Data |
||||||||||||||||||||||||
| Diluted (loss) earnings per share—continuing operations |
$ | (0.49 | ) | $ | (4.58 | ) | $ | 0.37 | $ | 0.45 | $ | (0.07 | ) | $ | 0.16 | |||||||||
| Weighted average shares outstanding—diluted |
117,321 | 112,653 | 126,258 | 138,872 | 135,437 | 79,453 | ||||||||||||||||||
| Operating Ratios—% of net sales |
||||||||||||||||||||||||
| Gross profit |
34.6 | % | 38.1 | % | 42.5 | % | 45.3 | % | 35.2 | % | 39.8 | % | ||||||||||||
| Selling, general and administrative expenses |
29.3 | 26.6 | 26.2 | 25.4 | 35.7 | 30.3 | ||||||||||||||||||
| Engineering, research and development expenses |
8.8 | 7.2 | 6.3 | 5.7 | 7.0 | 5.2 | ||||||||||||||||||
| Amortization of intangible assets |
4.8 | 3.5 | 3.0 | 2.6 | 3.0 | 1.5 | ||||||||||||||||||
| Impairment of goodwill |
— | 85.4 | — | — | — | — | ||||||||||||||||||
| Restructuring charges |
3.9 | 1.9 | — | — | — | — | ||||||||||||||||||
| Operating (loss) profit |
(12.3 | ) | (86.5 | ) | 7.0 | 11.7 | (10.5 | ) | 2.8 | |||||||||||||||
| (Loss) income before income taxes and equity in affiliate earnings |
(15.0 | ) | (89.5 | ) | 9.0 | 13.3 | (9.3 | ) | 4.1 | |||||||||||||||
| Effective tax rate |
5.0 | (3.9 | ) | 18.3 | 30.1 | 46.9 | 8.1 | |||||||||||||||||
| Net (loss) income attributable to Entegris, Inc. |
(14.5 | ) | (93.2 | ) | 7.1 | 9.4 | (9.2 | ) | 2.7 | |||||||||||||||
37
Table of Contents
| (In thousands, except per share amounts) |
Year ended December 31, 2009 |
Year ended December 31, 2008 |
Year ended December 31, 2007 |
Year ended December 31, 2006 |
Four months ended December 31, 2005 |
Year ended August 27, 2005 | |||||||||||||||||
| Cash Flow Statement Data |
|||||||||||||||||||||||
| Depreciation and amortization |
$ | 50,127 | $ | 46,343 | $ | 43,776 | $ | 42,905 | $ | 13,754 | $ | 23,599 | |||||||||||
| Capital expenditures |
13,162 | 26,987 | 26,919 | 30,860 | 10,311 | 19,472 | |||||||||||||||||
| Net cash provided by operating activities |
4,193 | 66,260 | 132,017 | 96,076 | 22,598 | 52,323 | |||||||||||||||||
| Net cash (used in) provided by investing activities |
(9,843 | ) | (199,921 | ) | 50,800 | (17,370 | ) | (13,116 | ) | 58,807 | |||||||||||||
| Net cash (used in) provided by financing activities |
$ | (40,690 | ) | $ | 82,681 | $ | (183,061 | ) | $ | (80,037 | ) | $ | (15,432 | ) | $ | 3,066 | |||||||
| Balance Sheet and Other Data |
|||||||||||||||||||||||
| Current assets |
$ | 267,458 | $ | 313,128 | $ | 382,621 | $ | 556,321 | $ | 516,364 | $ | 546,502 | |||||||||||
| Current liabilities |
73,910 | 79,356 | 125,749 | 92,699 | 111,017 | 124,856 | |||||||||||||||||
| Working capital |
193,548 | 233,772 | 256,872 | 463,622 | 405,347 | 421,646 | |||||||||||||||||
| Current ratio |
3.62 | 3.95 | 3.04 | 6.00 | 4.65 | 4.38 | |||||||||||||||||
| Long-term debt |
52,492 | 150,516 | 20,373 | 2,995 | 3,383 | 21,800 | |||||||||||||||||
| Shareholders’ equity |
346,192 | 336,170 | 852,309 | 1,015,980 | 1,012,819 | 1,023,414 | |||||||||||||||||
| Total assets |
$ | 504,672 | $ | 597,824 | $ | 1,035,241 | $ | 1,157,618 | $ | 1,142,790 | $ | 1,185,620 | |||||||||||
| Return on average shareholders’ equity—% |
(16.9 | ) | (87.0 | ) | 4.7 | 6.3 | (1.8 | ) | 1.3 | ||||||||||||||
| Shares outstanding at end of period |
130,043 | 113,102 | 115,356 | 132,771 | 136,044 | 135,299 | |||||||||||||||||
38
Table of Contents
| Item 7. | Management’s Discussion and Analysis of Financial Condition and Results of Operations. |
You should read the following discussion and analysis of the Company’s consolidated financial condition and results of operations along with the consolidated financial statements and the accompanying notes to the consolidated financial statements included elsewhere in this document. This discussion contains forward-looking statements that involve numerous risks and uncertainties, including, but not limited to, those described in the “FACTORS AND UNCERTAINTIES THAT MAY AFFECT FUTURE RESULTS” section of this Item 7. The Company’s actual results may differ materially from those contained in any forward-looking statements.
Overview
This overview is not a complete discussion of the Company’s financial condition, changes in financial condition and results of operations; it is intended merely to facilitate an understanding of the most salient aspects of its financial condition and operating performance and to provide a context for the detailed discussion and analysis that follows and must be read in its entirety in order to fully understand the Company’s financial condition and results of operations.
Entegris, Inc. is a leading provider of products and services that purify, protect and transport the critical materials used in key technology-driven industries. Entegris derives most of its revenue from the sale of products and services to the semiconductor and related industries. The Company’s customers consist primarily of semiconductor manufacturers, semiconductor equipment and materials suppliers as well as thin film transistor-liquid crystal display (TFT-LCD) and hard disk manufacturers, which are served through direct sales efforts, as well as sales and distribution relationships, in the United States, Asia, Europe and the Middle East.
The Company offers a diverse product portfolio which includes more than 15,000 standard and customized products that it believes provide the most comprehensive offering of contamination control solutions and microenvironment products and services to the microelectronics industry. Certain of these products are unit-driven and consumable products that rely on the level of semiconductor manufacturing activity to drive growth, while others rely on expansion of manufacturing capacity to drive growth. The Company’s unit-driven and consumable products includes membrane-based liquid filters and housings, metal-based gas filters, resin-based gas purifiers, wafer shippers, disk-shipping containers and test assembly and packaging products and consumable graphite and silicon carbide components used in plasma etch, ion implant and chemical vapor deposition processes in semiconductor manufacturing. The Company’s capital expense-driven products include our components, systems and subsystems that use electro-mechanical, pressure differential and related technologies, to permit semiconductor and other electronics manufacturers to monitor and control the flow and condition of process liquids used in these manufacturing processes, and our process carriers that protect the integrity of in-process wafers.
Key operating factors Key factors, which management believes have the largest impact on the overall results of operations of Entegris, Inc., include:
| • | Level of sales Since a significant portion of the Company’s product costs (except for raw materials, purchased components and direct labor) are largely fixed in the short to medium term, an increase or decrease in sales affects gross profits and overall profitability significantly. Also, increases or decreases in sales and operating profitability affect certain costs such as incentive compensation and commissions, which are highly variable in nature. The Company’s sales are subject to effects of industry cyclicality, technological change and substantial competition, including pricing pressures and foreign currency effects. |
| • | Variable margin on sales The Company’s variable margin on sales is determined by selling prices and the costs of manufacturing and raw materials. This is also affected by a number of factors, which include the Company’s sales mix, purchase prices of raw material (especially resin and purchased components), competition, both domestic and international, direct labor costs, and the efficiency of the Company’s production operations, among others. |
39
Table of Contents
| • | Fixed cost structure Increases or decreases in sales have a large impact on profitability. There are a number of large fixed or semi-fixed cost components, which include salaries, indirect labor and benefits, facility costs, lease expense, and depreciation and amortization. It is not possible to vary these costs easily in the short term as volumes fluctuate. Thus changes in sales volumes can affect the usage and productivity of these cost components and can have a large effect on the Company’s results of operations. |
Overall Summary of Financial Results for the Year Ended December 31, 2009
The Company’s financial results for the year ended December 31, 2009 were significantly affected by the difficult global economic conditions and, more specifically, the severe downturn in both the capital and unit-driven segments of the semiconductor industry that began during the second half of the year ended December 31, 2008. On a sequential basis, revenues declined sharply from $145.8 million in the third quarter of 2008 to $112.7 million in the fourth quarter of 2008 and $59.0 million in the first quarter of 2009. An upturn in bookings and sales of the Company’s products began in the second quarter of 2009, with sales improving to $82.6 million in the second quarter, $110.7 million in the third quarter and $146.3 million in the fourth quarter of 2009.
Net sales for 2009 were $398.6 million, down 28.1%, from net sales of $554.7 million reported for 2008. The sales decline was mitigated by the full-year inclusion of sales of Poco Graphite, Inc. (POCO), which was acquired in August 2008. Excluding that factor, sales fell 32.2% in 2009 when compared to 2008.
In the Company’s view, the business and industry downturn reached a trough during the first quarter of 2009. During the second quarter, the Company began to experience a modest upturn in bookings and sales of certain of its unit-driven, consumable products, while recovery of the Company’s capital-driven product lines began in the third quarter. The Company believes the revenue downturn was primarily volume driven. Based on the information available, the Company believes it maintained market share for its products and that the effect of selling price erosion has been nominal.
Mainly reflecting the significant year-over-year sales decrease and associated lower factory utilization, the Company reported considerably lower gross profits and a reduced gross margin. The Company’s gross margin in 2009 was 34.6% versus 38.1% in 2008.
The Company had lower year-over-year selling, general and administrative (SG&A) and engineering, research and development (ER&D) costs for 2009 when compared to 2008, mainly reflecting lower salary, incentive and benefits costs resulting from headcount reductions, temporary pay reductions and furloughs.
The Company incurred restructuring charges of $15.5 million in 2009, mainly in connection with business restructuring activities related to the transfer of a portion of our Chaska, Minnesota production to Malaysia and other existing facilities, and actions taken in response to the downturn in the semiconductor industry.
As a result of aforementioned factors, the Company reported a loss from continuing operations of $57.8 million for 2009 compared to a loss of $515.9 million in 2008. The 2008 loss was substantially attributable to goodwill impairment charges of $473.8 million ($454.6 million, net of tax) as discussed in below section titled “Impairment of Goodwill”.
Because of the difficult business environment described above, the Company projected early in 2009 that it would violate the debt covenants in its then-existing revolving credit facility. Accordingly, the Company’s management, working with its banks, undertook the amendment of its revolving credit facility. In March 2009, the Company amended and restated its revolving credit facility. The restated revolving credit facility was further amended in July 2009 and August 2009 and as of December 31, 2009 supported $106.6 million in borrowings. The Company’s ability to borrow under the restated credit facility is also subject to a borrowing base, which is calculated based on the Company’s level of qualifying U.S. accounts receivable, inventories and value of property, plant and equipment.
40
Table of Contents
The restated revolving credit facility requires the Company to maintain compliance with new debt covenants and to pay higher rates of interest. Through December 31, 2009, the Company was in compliance with all applicable debt covenants.
The Company’s restated credit agreement contains financial covenants that limit its ability to make capital expenditures in excess of $20.0 million in both 2010 and 2011 plus certain unused amounts from the prior period ($7.2 million for 2010); requires that the Company maintain a minimum level of cash in the United States; and requires the Company to achieve certain levels of EBITDA performance during the first quarter of 2010. Beginning in the second quarter of 2010, the Company must maintain or exceed fixed charge coverage and cash flow leverage ratios. (Also see Note 11 to the Company’s consolidated financial statements).
In September 2009, the Company issued common stock in a registered public offering, receiving net proceeds of $56.6 million. As required by the terms of the Company’s restated credit agreement, the proceeds were used to reduce the amount outstanding under the Company’s revolving credit facility.
During 2009, the Company’s operating activities provided cash flow of $4.2 million. Cash and cash equivalents were $68.7 million at December 31, 2009 compared with $115.0 million at December 31, 2008. The decrease in cash mainly reflects the $95.0 million reduction of debt, partially offset by proceeds of the registered public offering.
Critical Accounting Policies
Management’s discussion and analysis of financial condition and results of operations are based upon the Company’s consolidated financial statements, which have been prepared in accordance with accounting principles generally accepted in the United States. The preparation of these consolidated financial statements requires the Company to make estimates, assumptions and judgments that affect the reported amounts of assets, liabilities, revenues and expenses and related disclosure of contingent assets and liabilities. At each balance sheet date, management evaluates its estimates, including, but not limited to, those related to accounts receivable, warranty and sales return obligations, inventories, long-lived assets, income taxes, business combinations and shared-based compensation. The Company bases its estimates on historical experience and on various other assumptions that are believed to be reasonable under the circumstances. Actual results may differ from these estimates under different assumptions or conditions. The critical accounting policies affected most significantly by estimates, assumptions and judgments used in the preparation of the Company’s consolidated financial statements are discussed below.
Accounts Receivable-Related Valuation Accounts The Company maintains allowances for doubtful accounts and for sales returns and allowances. Significant management judgments and estimates must be made and used in connection with establishing these valuation accounts. If management made different judgments or utilized different estimates, this could result in material differences in the amount and timing of the Company’s results of operations for any period. In addition, actual results could be different from the Company’s current estimates, possibly resulting in increased future charges to earnings.
The Company provides an allowance for doubtful accounts for all individual receivables judged to be unlikely for collection. For all other accounts receivable, the Company records an allowance for doubtful accounts based on a combination of factors. Specifically, management considers the age of receivable balances, historical bad debt write-off experience and current economic circumstances when determining its allowance for doubtful accounts. The Company’s allowance for doubtful accounts was $1.7 million and $1.3 million at December 31, 2009 and 2008, respectively.
An allowance for sales returns and allowances is established based on historical and current trends in product returns. At December 31, 2009 and 2008, the Company’s reserve for sales returns and allowances was $0.9 million and $1.9 million, respectively.
41
Table of Contents
Inventory Valuation The Company uses certain estimates and judgments to properly value inventory. In general, the Company’s inventories are recorded at the lower of cost or market value. The Company evaluates its ending inventories for obsolescence and excess quantities each quarter. This evaluation includes analyses of inventory levels, historical write-off trends, expected product lives, and sales levels by product. Inventories that are considered obsolete are written off or a full allowance is recorded. In addition, allowances are established for inventory quantities in excess of forecasted demand. Inventory allowances were $9.1 million and $8.3 million at December 31, 2009 and 2008, respectively.
The Company’s inventories include materials and products subject to technological obsolescence, which are sold in highly competitive industries. If future demand or market conditions are less favorable than current conditions or the Company’s planned outlook for improved sales levels, additional inventory write-downs or allowances may be required and would be reflected in cost of sales in the period the revision is made.
Impairment of Long-Lived Assets As of December 31, 2009, the Company had $135.4 million of net property, plant and equipment and $78.5 million of net intangible assets. The Company routinely considers whether indicators of impairment of the value of its long-lived assets, particularly its manufacturing equipment, and its intangible assets, are present. A long-lived asset (asset group) shall be tested for recoverability whenever events or changes in circumstances (triggering events) indicate that its carrying amount may not be recoverable. The following are examples of such events or changes in circumstances:
| a. | A significant decrease in the market price of a long-lived asset (asset group) |
| b. | A significant adverse change in the extent or manner in which a long-lived asset (asset group) is being used or in its physical condition |
| c. | A significant adverse change in legal factors or in the business climate that could affect the value of a long-lived asset (asset group), including an adverse action or assessment by a regulator |
| d. | An accumulation of costs significantly in excess of the amount originally expected for the acquisition or construction of a long-lived asset (asset group) |
| e. | A current-period operating or cash flow loss combined with a history of operating or cash flow losses or a projection or forecast that demonstrates continuing losses associated with the use of a long-lived asset (asset group) |
| f. | A current expectation that, more likely than not, a long-lived asset (asset group) will be sold or otherwise disposed of significantly before the end of its previously estimated useful life. |
If such indicators are present, it is determined whether the sum of the estimated undiscounted cash flows attributable to the asset group in question is less than its carrying value. If less, an impairment loss is recognized based on the excess of the carrying amount of the asset group over its respective fair value. Fair value is determined by discounting estimated future cash flows, appraisals or other methods deemed appropriate. If the asset groups determined to be impaired are to be held and used, the Company recognizes an impairment charge to the extent the fair value attributable to the asset group is less than the assets’ carrying value. The fair value of the assets then becomes the assets’ new carrying value, which is depreciated or amortized over the remaining estimated useful life of the assets.
In connection with triggering events during the third and fourth quarters of 2008 and the first quarter of 2009, the Company reviewed its long-lived assets and determined that none of its long-lived assets were impaired for its asset groups. The determination was based on reviewing estimated undiscounted cash flows for the Company’s asset groups, which were greater than their carrying values. As required under U.S. generally accepted accounting principles, the impairment analyses for the third and fourth quarters of 2008 occurred before the goodwill impairment assessments.
Long-lived assets are grouped with other assets and liabilities at the lowest level (asset groups) for which identifiable cash flows are largely independent of the cash flows of other assets and liabilities. The Company has
42
Table of Contents
four significant asset groups, identified by assessing the Company’s identifiable cash flows and the interdependence of such cash flows: Contamination Control Solutions (CCS), Micro Environments (ME), Poco Graphite (POCO) and Entegris Specialty Coatings (ESC).
The Company’s estimate of undiscounted cash flows attributable to the asset groups included only future cash flows (cash inflows less associated cash outflows) that are directly associated with and that are expected to arise as a direct result of the use and eventual disposition of the asset group. Estimates of future cash flows used to test the recoverability of a long-lived asset (asset group) incorporated the Company’s assumptions about its use of the asset group and were determined for the remaining useful life of the primary asset (the principal long-lived tangible asset being depreciated or intangible asset being amortized that is the most significant component asset from which the asset group derives its cash-flow-generating capacity) of each asset group. The key assumptions were projected revenues, gross margin expectations and operating cost estimates. Future cash flows used to test the recoverability of each asset group were made for the remaining useful life of the asset group, which itself is based on the remaining useful life of the primary asset of each group as described below. Where the primary asset is not the asset of the asset group with the longest remaining useful life, estimates of future cash flows for the group assume the sale of the group at the end of the remaining useful life of the primary asset.
The recoverability test included all cash outflows that the asset group is estimated to incur to obtain the estimated future cash inflows. Accordingly, where required, the Company reflected within the cash flows of its asset groups an allocation of corporate expenses to its asset groups, because those assets require the services provided by the Company’s shared services infrastructure (among others, finance, human resources, information technology, sales and marketing, legal) if the asset group were operated on a stand-alone basis.
Under the first quarter 2009 impairment test, all asset groups had future undiscounted cash flows in excess of their carrying values by at least 60%, except for the ME asset group, which the Company estimated had future undiscounted cash flows 27% higher than its carrying value. The carrying values of this asset group’s property, plant and equipment and intangible assets at March 28, 2009 were $42.9 million and $1.2 million, respectively. If either revenue for the Company’s asset groups decreased from the then-current forecast without offsetting decreases in costs, or if the asset group’s operating costs increased from the then-current forecast without offsetting increases in revenue, the estimated undiscounted future cash flows of the asset groups could have been less than their carrying values. This would have required an impairment loss to be recognized based on the excess of the carrying amount of the respective asset group over its fair value. As noted, fair value would be determined by discounting estimated future cash flows, appraisals or other methods deemed appropriate. Actual results of the ME asset group for the nine-month period ended December 31, 2009 were better than forecasted at the end of the first quarter.
As described above, the evaluation of the recoverability of long-lived assets requires the Company to make significant estimates and assumptions. These estimates and assumptions primarily include, but are not limited to, the identification of the asset group at the lowest level of independent cash flows and the primary asset of the group and long-range forecasts of revenue and costs, reflecting management’s assessment of general economic and industry conditions, operating income, depreciation and amortization and working capital requirements.
Due to the inherent uncertainty involved in making these estimates, particularly in the current economic environment and forecast of a recovery, actual results could differ from those estimates. In addition, changes in the underlying assumptions would have a significant impact on the conclusion that an asset group’s carrying value is recoverable, or the determination of any impairment charge if it was determined that the asset values were indeed impaired.
Based on improved economic conditions within the semiconductor industry and the absence of any other triggering events, the Company was not required to perform impairment testing for any of its asset groups for the second, third and fourth quarters of 2009. Due to the uncertain economic environment within the semiconductor industry, the Company will continue to monitor circumstances and events to determine whether additional asset
43
Table of Contents
impairment testing is warranted. It is possible that in the future the Company may no longer be able to conclude that there is no impairment of its long-lived assets, nor can the Company provide assurance that material impairment charges of long-lived assets will not occur in future periods.
Impairment of Goodwill The Company assesses the impairment of goodwill at least annually, or whenever events or changes in circumstances indicate that the carrying value may not be recoverable. The Company’s annual impairment test is performed as of August 31. Factors considered important which could trigger an impairment review, and potentially an impairment charge, include the following:
| • | significant underperformance relative to historical or projected future operating results; |
| • | significant changes in the manner of use of the acquired assets or the Company’s overall business strategy; |
| • | significant negative industry or economic trends; and |
| • | significant decline in the Company’s stock price for a sustained period, resulting in the Company’s market capitalization being below its net book value. |
In 2008, the Company tested for impairment its goodwill in connection with its annual impairment test of goodwill as of August 31, 2008, and due to events and changes in circumstances through the end of 2008, the Company had additional triggering events that indicated impairments had occurred.
Based on the results of the Company’s 2008 assessment of goodwill for impairment, it was determined that the carrying value of the Company’s net assets exceeded its estimated fair value. Accordingly, the Company performed a second step of the impairment test to determine the implied fair value of its goodwill. The Company performed the assessment of impairment of its goodwill twice during the year, once during the third quarter, when the Company wrote off $379.8 million of goodwill, and the second time at the end of the year, when the Company wrote off its remaining goodwill of $94.0 million. (See Note 2 to the consolidated financial statements.)
The Company had no goodwill recorded on its consolidated balance sheet as of December 31, 2009.
Income Taxes In the preparation of the Company’s consolidated financial statements, management is required to estimate income taxes in each of the jurisdictions in which the Company operates. This process involves estimating actual current tax expense together with assessing temporary differences resulting from differing treatment of items for tax and accounting purposes. These differences result in deferred tax assets and liabilities, which are included in the Company’s consolidated balance sheets.
The Company has significant amounts of deferred tax assets. Management reviews its deferred tax assets for recoverability on a quarterly basis and assesses the need for valuation allowances. Management considers the positive and negative evidence for the potential utilization of its deferred tax assets. When management concludes that it is not more likely than not that the Company will realize certain deferred tax assets in the future, it records a valuation allowance for the portion of deferred tax assets management concluded will not be utilized.
As a result of the recent general economic and industry declines, and their impact on the Company’s future outlook, management has reviewed its U.S. deferred tax assets and concluded that the uncertainties related to the realization of its deferred tax assets have become unfavorable. The Company had U.S. net deferred tax asset positions of $57.2 million and $42.3 million as of December 31, 2009 and 2008, respectively, which comprised temporary differences and various credit carryforwards. Management has concluded that it is not more likely than not that the Company will realize the net deferred tax assets. Accordingly, the Company maintained valuation allowances of $57.2 million and $42.1 million as of December 31, 2009 and 2008, respectively, with respect to U.S. deferred tax assets.
44
Table of Contents
The negative evidence of a cumulative three-year U.S. operating loss, the expectation for U.S. operating results in early future years and a finite carryforward period for the Company’s U.S. foreign tax credits was sufficiently significant to outweigh all identified positive evidence and tax planning strategies.
The Company had net non-U.S. deferred tax asset positions before valuation allowance of $14.9 million and $12.5 million as of December 31, 2009 and 2008, respectively. At those dates, management determined that based upon the available evidence, a valuation allowance was required against non-U.S. deferred tax assets in certain tax jurisdictions. Accordingly, the Company maintained valuation allowances of $0.4 million and $0.6 million as of December 31, 2009 and 2008, respectively, with respect to certain non-U.S. deferred tax assets. For other non-U.S. jurisdictions, principally Japan, management believes that it is more likely than not that the net deferred tax assets will be realized as management expects sufficient future earnings in those jurisdictions.
In addition, the calculation of tax liabilities involves significant judgment in estimating the impact of uncertainties in the application of complex tax laws. Resolution of these uncertainties in a manner inconsistent with management’s expectations could have a material impact on the Company’s financial condition and operating results.
Warranty Claims Accrual The Company records a liability for estimated warranty claims. The amount of the accrual is based on historical claims data by product group and other factors. Estimated claims could be materially different from actual results for a variety of reasons, including a change in product failure rates and service delivery costs incurred in correcting a product failure, manufacturing changes that could impact product quality, or as yet unrecognized defects in products sold. At December 31, 2009 and 2008, the Company’s accrual for estimated future warranty costs was $0.9 million and $1.1 million, respectively.
Business Acquisitions The Company accounts for acquired businesses using the acquisition method of accounting, which requires that the assets acquired and liabilities assumed be recorded at the date of acquisition at their respective fair values. The judgments made in determining the estimated fair value assigned to each class of assets acquired and liabilities assumed, as well as asset lives, can materially impact net income.
There are several methods that can be used to determine the fair value of assets acquired and liabilities assumed. For intangible assets, the Company normally utilizes the “income method.” This method starts with a forecast of all of the expected future net cash flows. These cash flows are then adjusted to present value by applying an appropriate discount rate that reflects the risk factors associated with the cash flow streams. Some of the more significant estimates and assumptions inherent in the income method or other methods include the projected amount and timing of future cash flows and the discount rate reflecting the risks inherent in the future cash flows.
Determining the useful life of an intangible asset also requires judgment. For example, different types of intangible assets will have different useful lives and certain assets may even be considered to have indefinite useful lives. All of these judgments and estimates can significantly impact net income.
Share-Based Compensation U.S generally accepted accounting principles require the measurement and recognition of compensation expense for all share-based payment awards made to employees and directors based on estimated fair values. The Company must estimate the value of employee stock option and restricted stock awards on the date of grant.
The fair value of restricted stock and restricted stock unit awards is valued based on the Company’s stock price on the date of grant. The fair value of stock option awards is estimated on the date of grant using an option-pricing model affected by the Company’s stock price as well as assumptions regarding a number of highly complex and subjective variables. These variables include the expected stock price volatility over the term of the awards, risk-free interest rate and dividend yield assumptions, and actual and projected employee stock option exercise behaviors and forfeitures. Because share-based compensation expense recognized in the consolidated statement of operations is based on awards ultimately expected to vest, it is recorded net of estimated forfeitures.
45
Table of Contents
Forfeitures are required to be estimated at the time of grant and revised, if necessary, in subsequent periods if actual forfeitures differ from those estimates. Forfeitures are estimated based on historical experience and current expectations.
If the above factors change, and the Company uses different assumptions in future periods, the share-based compensation expense recorded may differ significantly from what was recorded in the current period.
Certain restricted stock and restricted stock unit awards involve stock to be issued upon the achievement of performance conditions (performance shares) under the Company’s stock incentive plans. Such performance shares become available subject to time-based vesting conditions if, and to the extent that, financial performance criteria for the applicable fiscal year or multi-year period are achieved. Accordingly, the number of performance shares earned will vary based on the level of achievement of financial performance objectives for the applicable period. Until such time that the Company’s performance can ultimately be determined, each quarter the Company estimates the number of performance shares more likely than not to be earned based on an evaluation of the probability of achieving the performance objectives. Such estimates are revised, if necessary, in subsequent periods when the underlying factors change the Company’s evaluation of the probability of achieving the performance objectives. Accordingly, share-based compensation expense associated with performance shares may differ significantly from the amount recorded in the current period.
Results of Operations
Year ended December 31, 2009 compared to year ended December 31, 2008
The following table sets forth the results of operations and the relationship between various components of operations, stated as a percent of net sales, for the years ended December 31, 2009 and 2008. The Company’s historical financial data was derived from its consolidated financial statements and related notes included elsewhere in this annual report.
| (Dollars in thousands) |
2009 | 2008 | ||||||||||||
| % of net sales | % of net sales | |||||||||||||
| Net sales |
$ | 398,644 | 100.0 | % | $ | 554,699 | 100.0 | % | ||||||
| Cost of sales |
260,832 | 65.4 | 343,184 | 61.9 | ||||||||||
| Gross profit |
137,812 | 34.6 | 211,515 | 38.1 | ||||||||||
| Selling, general and administrative expenses |
117,001 | 29.3 | 147,531 | 26.6 | ||||||||||
| Engineering, research and development expenses |
35,039 | 8.8 | 40,086 | 7.2 | ||||||||||
| Amortization of intangible assets |
19,237 | 4.8 | 19,585 | 3.5 | ||||||||||
| Impairment of goodwill |
— | — | 473,799 | 85.4 | ||||||||||
| Restructuring charges |
15,463 | 3.9 | 10,423 | 1.9 | ||||||||||
| Operating loss |
(48,928 | ) | (12.3 | ) | (479,909 | ) | (86.5 | ) | ||||||
| Interest expense, net |
9,215 | 2.3 | 1,018 | 0.2 | ||||||||||
| Other expense, net |
1,745 | 0.4 | 15,486 | 2.8 | ||||||||||
| Loss before income taxes and equity in net loss of affiliates |
(59,888 | ) | (15.0 | ) | (496,413 | ) | (89.5 | ) | ||||||
| Income tax (benefit) expense |
(2,996 | ) | (0.8 | ) | 19,201 | 3.5 | ||||||||
| Equity in net loss of affiliates |
867 | 0.2 | 283 | 0.1 | ||||||||||
| Loss from continuing operations |
(57,759 | ) | (14.5 | ) | $ | (515,897 | ) | (93.0 | ) | |||||
Net sales For the year ended December 31, 2009, net sales were $398.6 million, down $156.1 million, or 28%, from sales for the year ended December 31, 2008.
The Company’s 2009 sales decline primarily reflected the continuation of the difficult global economic conditions and, more specifically, the severe downturn in both the capital and unit-driven segments of the
46
Table of Contents
semiconductor industry that began during the second half of 2008. On a sequential basis, revenues declined sharply from $145.8 million in the third quarter of 2008 to $112.7 million in the fourth quarter of 2008 and $59.0 million in the first quarter of 2009. An upturn in bookings and sales of the Company’s products began in the second quarter of 2009, with sales improving to $82.6 million in the second quarter, $110.7 million in the third quarter and $146.3 million in the fourth quarter of 2009.
In the Company’s view, the business and industry downturn reached a trough during the first quarter of 2009. During the second quarter, the Company began to experience a modest upturn in bookings and sales of certain of its unit-driven, consumable products, while recovery of the Company’s capital-driven product lines began in the third quarter. The Company believes the revenue downturn was primarily volume driven. Based on the information available, the Company believes it maintained market share for its products and that the effect of selling price erosion has been nominal.
The sales decline was mitigated by the full-year inclusion of sales of Poco Graphite, Inc. (POCO), which was acquired in August 2008. Excluding that factor, sales fell 32.2% in 2009 when compared to 2008.
The effect of fluctuations in foreign currency rates was negligible. The sales decline included an unfavorable foreign currency translation effect of $0.1 million related to the year-over-year weakening of most international currencies, most notably the Korean won, Taiwanese dollar and the Euro, versus the U.S. dollar, which were essentially offset by the relative strength of the Japanese yen against the U.S. dollar.
On a geographic basis, total sales to North America were 29%, Asia Pacific 36%, Europe 16% and Japan 19% in 2009. On a geographic basis, total sales to North America were 29%, Asia Pacific 34%, Europe 16% and Japan 21% in 2008.
Demand drivers for the Company’s business primarily consist of semiconductor fab utilization and production (unit-driven) as well as capital spending for new or upgraded semiconductor fabrication facilities (capital-driven) The Company analyzes sales of its products by these two key drivers.
Both unit-driven and capital-driven sales in 2009 decreased as compared with 2008. Sales of unit-driven products represented 70% of sales and sales of capital-driven products represented 30% of total sales in 2009. This compares to a unit-driven to capital-driven ratio of 65:35 for 2008. The year-over-year shift in relative demand toward unit-driven products reflects lower spending by semiconductor customers for capital-driven, capacity-related products such as wafer carriers and liquid systems.
Sales of unit-driven products fell 23% in 2009. Excluding sales of POCO products, sales of unit-driven products fell 29% in 2009. Unit-driven products have average lives of less than 18 months or need to be replaced based on usage levels. These products include liquid filters used in the photolithography, CMP and wet etch and clean processes, and wafer shippers used to ship raw wafers, particularly at wafer sizes of 200mm and below, as well as chip trays and data storage components used to ship 65mm and 95mm disk drives. Sales of shippers declined 29%, sales of data storage products fell by 64% and sales of filters fell by 19%.
Year-over-year sales of capital-driven products decreased 39% in 2009. Capital-driven products include wafer process carriers, gas microcontamination control systems used in the deployment of advanced photolithography processes, fluid handling systems, including dispense pumps used in the photolithography process, and integrated liquid flow controllers used in various processes around the fab. Sales of control systems declined by 35% due to lower sales of valves and flow controllers, which fell by 51%. Sales of wafer transport products such as 200mm and 300mm FOUPs fell by 60%,. Sales of gas microcontamination products also fell by 35% primarily due to decreased sales of gas filtration products.
Gross profit Gross profit for 2009 decreased by $73.7 million, to $137.8 million, a decrease of 35% from $211.5 million for 2008. The gross margin rate for 2009 was 34.6% versus 38.1% for 2008.
47
Table of Contents
The significant year-over-year sales decrease accounted for approximately 80% of the gross profit decline for 2009. The Company experienced lower factory utilization due to the sales decrease, particularly during the first half of the year. This resulted in manufacturing production falling below normal capacity. Accordingly, the Company included in cost of sales period expense of $11.0 million in the year ended December 31, 2009 in connection with its below-capacity production levels, accounting for 2.8% of the decrease in the Company’s gross margin rate.
In addition, the Company’s gross profit in 2009 was also affected by unfavorable product mix, with a greater portion of sales related to lower margin products, as well as increased overhead rates associated with reduced production levels.
In 2009, the Company recorded a $4.6 million incremental charge to cost of sales associated with the amortization of the fair market value mark-up of inventory acquired in business combinations as compared to $13.5 million in similar charges in 2008. The inventory mark-ups were recorded in connection with the POCO and Pureline Co., Ltd. (Pureline) business combinations and were charged to cost of sales over inventory turns of the acquired inventory. The net reduction in charges associated with the amortization of the fair market value mark-ups had a favorable 2.2% impact on the Company’s overall gross margin percentage.
Selling, general and administrative expenses Selling, general and administrative (SG&A) expenses of $117.0 million for 2009 decreased $30.5 million, or 21%, compared to $147.5 million in 2008. SG&A expenses, as a percent of net sales, increased to 29.3% from 26.6% a year earlier, reflecting the decrease in net sales.
The year-over-year decrease in SG&A costs includes compensation-related reductions of $12.6 million, reduced travel expense of $4.1 million and professional services expense of $7.3 million, and a favorable foreign currency translation effect of $0.5 million. SG&A expenses for the year ended 2008 included $4.1 million of severance-related costs due to personnel terminations associated with operational streamlining efforts.
Engineering, research and development expenses Engineering, research and development (ER&D) expenses decreased by $5.0 million, or 13%, to $35.0 million in 2009 compared to $40.1 million in 2008. The reduction in ER&D expense mainly reflects lower employee costs. ER&D expenses as a percent of net sales were 8.8% compared to 7.2% a year ago.
Amortization of intangible assets Amortization of intangible assets was $19.2 million in 2009 compared to $19.6 million for 2008.
Impairment of Goodwill The Company performed the assessment of impairment of its goodwill twice during 2008, once in connection with its annual impairment test of goodwill and due to events and changes in circumstances through the end of the fourth quarter of 2008 the Company had a second trigger event that indicated impairments had occurred. In addition, the Company tested for impairment of its long-lived assets.
The factors deemed by management to have collectively constituted impairment triggering events included a significant decrease in the Company’s market capitalization throughout 2008, to a level significantly below the recorded value of its consolidated net assets, and a significant decline in management’s forecasted level of business. As a result of the impairment assessments, the Company recorded impairment charges of goodwill of $473.8 million in 2008. As of December 31, 2009 and 2008, the Company had no remaining goodwill.
Restructuring charges Restructuring charges were $15.5 million in 2009 compared to $10.4 million in the year-ago period. In 2008, the Company initiated a global business restructuring of its sales and marketing function, manufacturing operations, and realignment of the global supply chain and other ancillary operational functions. The Company has incurred employee termination and other costs in connection with the business restructuring and actions taken in response to the downturn in the semiconductor industry that began during the second half of 2008. See Note 13 to the Company’s consolidated financial statements for additional detail.
48
Table of Contents
Interest expense (income), net Net interest expense was $9.2 million in 2009 compared to net interest expense of $1.0 million in 2008. The variance was due mainly to a significant increase in the Company’s average outstanding debt compared to a year ago and higher interest rates under the Company’s Restated Credit Agreement.
Other expense (income) Other expense was $1.7 million in 2009 compared to $15.5 million in 2008.
In 2009, other expense consisted mainly of foreign currency transaction losses of $1.3 million primarily related to the remeasurement of yen-denominated assets and liabilities held by the Company’s U.S. entity and an impairment loss on an equity investment of $1.0 million in the fourth quarter of 2009.
Other expense in 2008 includes impairment losses on equity investments of $11.1 million and foreign currency transaction losses of $4.4 million, also primarily related to the remeasurement of yen-denominated assets and liabilities.
Income tax expense The Company recorded an income tax benefit of $3.0 million in 2009, compared to income tax expense of $19.2 million in 2008. The effective tax rate was 5.0% in 2009 compared with a (3.9%) rate in 2008.
In 2009, the Company’s tax rate was lower than U.S. statutory rates, mainly due to the $15.1 million increase in the Company’s U.S. deferred tax asset valuation allowance. Management concluded that it is not more likely than not that the Company will realize certain deferred tax assets associated with 2009 U.S. operating losses, and thus provided an allowance for the portion of deferred tax assets management concluded will not be utilized. The Company also reduced its foreign valuation allowance by $0.2 million.
The effective tax rate for 2008 is principally attributable to two factors. The Company recorded a $473.8 million goodwill impairment charge in 2008. Most of the Company’s goodwill impairment charge is not deductible for income tax purposes. Accordingly, the Company recognized a tax benefit of only $19.2 million in connection with the impairment charge.
Also during 2008, the Company recorded a $42.7 million valuation allowance against its deferred tax assets consisting primarily of net operating loss carryovers, general business carryovers and foreign tax credit carryforwards, $0.6 million of which related to discontinued operations. The Company carried no valuation allowance against its deferred tax assets at December 31, 2007. As a result of the 2008 general economic and industry downturn, and its impact on the Company’s future outlook, management reviewed its deferred tax assets and concluded that the uncertainties related to the realization of its assets, became unfavorable. Management considered that the negative evidence of a cumulative three-year U.S. operating loss, the expectation for U.S. operating results in early future years and a finite carryforward period for the Company’s U.S. foreign tax credits was sufficiently significant to outweigh all identified positive evidence and tax planning strategies. Accordingly, management concluded that it was not more likely than not that the Company would realize certain deferred tax assets and thus provided an allowance for the portion of deferred tax assets management concluded would not be utilized.
Discontinued operations
The Company’s businesses classified as discontinued operations recorded a net loss of $1.1 million in 2008. The Company completed the sale of its cleaning equipment business, classified as a discontinued operation, for proceeds of $0.7 million in April 2008.
Net loss The Company recorded a net loss of $57.8 million, or $0.49 per share, in 2009, compared to a net loss of $517.0 million, or $4.59 per diluted share, in 2008. The Company’s loss from continuing operations for 2009 was $57.8 million, or $0.49 per share, compared to income from continuing operations of $515.9 million, or $4.58 per diluted share, in the prior year. The net loss for 2008 included a goodwill impairment charge of $473.8 million ($454.6 million, net of tax).
49
Table of Contents
Segment Analysis
Effective January 1, 2009, the Company changed its financial reporting structure reflecting organizational changes. Beginning in 2009, the Company will report its financial performance based on three reporting segments. The following is a discussion on the results of operations of these three business segments. See Note 21 “Segment Reporting” to the consolidated financial statements for additional information on the Company’s three segments.
The following table presents selected sales and segment profit (loss) data for the Company’s three segments, for the years ended December 31, 2009 and 2008.
| (In thousands) |
2009 | 2008 | ||||
| Contamination Control Solutions |
||||||
| Net sales |
$ | 241,163 | $ | 330,810 | ||
| Segment profit |
30,846 | 77,024 | ||||
| Microenvironments |
||||||
| Net sales |
$ | 111,465 | $ | 190,761 | ||
| Segment profit |
4,066 | 24,276 | ||||
| Entegris Specialty Materials |
||||||
| Net sales |
$ | 46,016 | $ | 33,128 | ||
| Segment profit |
2,925 | 9,250 | ||||
Contamination Control Solutions (CCS)
For the year ended December 31, 2009, CCS net sales decreased 27%, to $241.2 million, from $330.8 million in the comparable period last year. The changes in net sales reflect the underlying economic and semiconductor industry conditions noted above.
CCS reported a segment profit of $30.8 million for the year ended December 31, 2009 compared to a $77.0 million segment profit in the comparable period last year, a decrease of 60%.
The sharp decline in sales volume and the resulting reduction in gross profit primarily account for the year-to-year change in the segment’s operating results. Slightly offsetting the decline in gross profit, CCS operating expenses decreased 15%, mainly due to lower selling and engineering, research and development costs.
Microenvironments (ME)
For the year ended December 31, 2009, ME net sales decreased 42% to $111.5 million, from $190.8 million in the comparable period last year. The changes in net sales reflect the underlying overall economic and semiconductor industry conditions noted above.
ME reported segment income of $4.1 million for the year ended December 31, 2009 compared to a $24.3 million segment profit in the comparable period last year, a decrease of 83%.
The sharp decline in sales volume and the resulting reduction in gross profit primarily account for the year-to-year change in the segment’s operating results. Slightly offsetting the decline in gross profit, ME operating expenses decreased 20%, mainly due to lower selling and engineering, research and development costs.
Entegris Specialty Materials (ESM)
For the year ended December 31, 2009, ESM net sales increased 39%, to $46.0 million, from $33.1 million in the comparable period last year. The year ended December 31, 2009 reflected the full-year inclusion of net sales from POCO. Excluding that factor, sales fell 29% in 2009 when compared to 2008.
50
Table of Contents
ESM reported a segment profit of $2.9 million in 2009 compared to a $9.3 million segment profit in 2008, a decrease of 68%. The decline in 2009 reflected the adjusted sales decline noted above as well as significant period expense included in cost of sales in connection with the below-capacity production levels at POCO associated with manufacturing production falling below normal capacity.
Year ended December 31, 2008 compared to year ended December 31, 2007
The following table sets forth the results of operations and the relationship between various components of operations, stated as a percent of net sales, for the years ended December 31, 2008 and 2007. The Company’s historical financial data was derived from its consolidated financial statements and related notes included elsewhere in this annual report.
| (Dollars in thousands) |
2008 | 2007 | ||||||||||||
| % of net sales | % of net sales | |||||||||||||
| Net sales |
$ | 554,699 | 100.0 | % | $ | 626,238 | 100.0 | % | ||||||
| Cost of sales |
343,184 | 61.9 | 360,001 | 57.5 | ||||||||||
| Gross profit |
211,515 | 38.1 | 266,237 | 42.5 | ||||||||||
| Selling, general and administrative expenses |
147,531 | 26.6 | 163,918 | 26.2 | ||||||||||
| Engineering, research and development expenses |
40,086 | 7.2 | 39,727 | 6.3 | ||||||||||
| Amortization of intangible assets |
19,585 | 3.5 | 18,874 | 3.0 | ||||||||||
| Impairment of goodwill |
473,799 | 85.4 | — | — | ||||||||||
| Restructuring charges |
10,423 | 1.9 | — | — | ||||||||||
| Operating (loss) profit |
(479,909 | ) | (86.5 | ) | 43,718 | 7.0 | ||||||||
| Interest expense (income), net |
1,018 | 0.2 | (5,245 | ) | (0.8 | ) | ||||||||
| Other expense (income), net |
15,486 | 2.8 | (7,656 | ) | (1.2 | ) | ||||||||
| (Loss) income before income taxes and equity in earnings of affiliates |
(496,413 | ) | (89.5 | ) | 56,619 | 9.0 | ||||||||
| Income tax expense |
19,201 | 3.5 | 10,356 | 1.7 | ||||||||||
| Equity in net loss (earnings) of affiliates |
283 | 0.1 | (93 | ) | (0.0 | ) | ||||||||
| (Loss) income from continuing operations |
$ | (515,897 | ) | (93.0 | ) | $ | 46,356 | 7.4 | ||||||
Net sales For the year ended December 31, 2008, net sales were $554.7 million, down $71.5 million, or 11%, from sales for the year ended December 31, 2007. The sales decline was mitigated by the inclusion of sales of $23.3 million from POCO, which was acquired in August 2008, sales of $5.9 million related to the full-year inclusion of sales from the specialty coatings business acquired in August 2007, and a favorable foreign currency translation effect of $22.8 million. Excluding those factors, sales fell 20% in 2008 compared to 2007. The currency effect reflected the strengthening of most international currencies versus the U.S. dollar, most notably the Japanese yen and the Euro. On a geographic basis, total sales to North America were 29%, Asia Pacific 34%, Europe 16% and Japan 21% in 2008.
Demand drivers for the Company’s business primarily consist of semiconductor fab utilization and production (unit-driven) as well as capital spending for new or upgraded semiconductor fabrication facilities (capital-driven). The Company analyzes sales of its products by these two key drivers. Both unit-driven and capital-driven sales in 2008 decreased as compared with 2007. Sales of unit-driven products represented 65% of sales and sales of capital-driven products represented 35% of total sales in 2008. This compares to a unit-driven to capital-driven ratio of 60:40 for 2007, indicating a decrease in demand of capital-driven sales within the industry during 2008.
Sales of unit-driven products fell 5% in 2008. Excluding sales of POCO, sales of unit-driven products fell 11% in 2008. Unit-driven products have average lives of less than 18 months or need to be replaced based on usage levels. These products include liquid filters used in the photolithography, CMP and wet etch and clean processes,
51
Table of Contents
and wafer shippers used to ship raw wafers, particularly at wafer sizes of 150mm and below, as well as chip trays and data storage components used to ship 65mm and 95mm disk drives. Sales of shippers declined 13%, partially offset by the increase in sales of 300mm wafer shippers of 181%. In addition, sales of filtration products declined by 11%.
Year-over-year sales of capital-driven products decreased 22% in 2008. Capital-driven products include wafer process carriers, gas microcontamination control systems used in the deployment of advanced photolithography processes, fluid handling systems, including dispense pumps used in the photolithography process, and integrated liquid flow controllers used in various processes around the fab. Sales of control systems declined by 20% due to lower sales of dispense pumps, which fell by 48%. Sales of wafer transport products fell by 31%, such as 300mm FOUP products which declined by 39%. Sales of filtration products also fell by 16% primarily due to decreased sales of gas filtration products.
Gross profit Gross profit for 2008 decreased by $54.7 million, to $211.5 million, a decrease of 21% from $266.2 million for 2007. The gross margin rate for 2008 was 38.1% versus 42.5% for 2007.
The gross profit decline was primarily due to lower utilization of the Company’s production facilities compared to the prior year, as well as the fair market value write-up of inventory discussed below. Production volumes were considerably lower in 2008. Despite significant increases in the price of oil and other commodities during much of 2008, price increases for the Company’s raw materials and purchased components were relatively modest on a year-over-year basis. Charges to cost of sales associated with obsolescence and excess inventory quantities were $2.2 million lower in 2008 compared to 2007.
Gross margin in 2008 included a $13.5 million incremental charge associated with the fair market value write-up of inventory acquired in the acquisition of POCO. This incremental charge had a negative 2.4% impact on the overall gross margin for 2008. The inventory write-up was recorded as part of the purchase price allocation and is charged to cost of sales over inventory turns of the acquired inventory.
Selling, general and administrative expenses Selling, general and administrative (SG&A) expenses of $147.5 million for 2008 decreased $16.4 million, or 10%, compared to $163.9 million in 2007. SG&A expenses, as a percent of net sales, increased to 26.6% from 26.2% a year earlier.
The year-over-year decrease in SG&A costs includes reductions in commissions and incentive compensation totaling $8.2 million; share-based compensation expense and pension expense of $6.2 million, and royalty expense of $3.5 million. In addition, costs of $2.6 million were incurred by the Company in 2007 in connection with the integration and realignment activities associated with the Mykrolis merger. Partially offsetting these decreases was an increase of $4.8 million in SG&A costs reflecting the effect of foreign currency translation.
Engineering, research and development expenses Engineering, research and development (ER&D) expenses rose by $0.4 million, or 1%, to $40.1 million in 2008 compared to $39.7 million in 2007. ER&D expenses as a percent of net sales were 7.2% compared to 6.3% a year ago.
Amortization of intangible assets Amortization of intangible assets was $19.6 million in 2008 compared to $18.9 million for 2007. The increase mainly reflects the additional amortization expenses related to the intangibles of POCO that were acquired in August 2008 and the full-year amortization of the intangibles of the specialty coatings business acquired in August 2007.
Impairment of Goodwill The Company performed the assessment of impairment of its goodwill twice during 2008, once in connection with its annual impairment test of goodwill and due to events and changes in circumstances through the end of the fourth quarter of 2008, the Company had a second trigger event that indicated impairments had occurred. In addition, the Company tested for impairment of its long-lived assets.
52
Table of Contents
The factors deemed by management to have collectively constituted impairment triggering events included a significant decrease in the Company’s market capitalization throughout 2008, to a level significantly below the recorded value of its consolidated net assets, and a significant decline in management’s forecasted level of business. As a result of the impairment assessments, the Company recorded impairment charges of goodwill of $473.8 million in 2008. As of December 31, 2008, the Company had no remaining goodwill.
Restructuring charges In 2008, the Company initiated a global business restructuring of its sales and marketing function, manufacturing operations, and realignment of the global supply chain and other ancillary operational functions. Related to these cost reduction initiatives, the Company announced on November 4, 2008 that it will close the larger of its two manufacturing facilities in Chaska, Minnesota and will transfer production to its other existing facilities. Associated with these changes, the Company recorded $10.4 million in restructuring charges in 2008, consisting mainly of employee severance costs.
Interest expense (income), net Net interest expense was $1.0 million in 2008 compared to interest income of $5.2 million in 2007. The decrease reflects lower average invested balances compared to a year ago and an increase in the Company’s short-term borrowings and long-term debt in 2008.
Other expense (income) Other expense was $15.5 million in 2008 compared to other income of $7.7 million in 2007. Other expense in 2008 includes impairment losses on equity investments of $11.1 million and foreign currency transaction losses of $4.4 million. Other income in 2007 includes foreign currency transaction gains of $1.2 million and a pre-tax gain of $6.1 million on the sale of the Company’s interest in a privately held equity investment accounted for using the cost method. Proceeds from the sale totaled $6.6 million.
Income tax expense The Company recorded income tax expense of $19.2 million in 2008, compared to income tax expense of $10.4 million in 2007. The effective tax rate was (3.9)% in 2008 compared with an 18.3% rate in 2007.
The effective tax rate for 2008 is principally attributable to two factors. The Company recorded a $473.8 million goodwill impairment charge in 2008. Most of the Company’s goodwill impairment charge is not deductible for income tax purposes. Accordingly, the Company recognized a tax benefit of only $19.2 million in connection with the impairment charge.
Also during 2008, the Company recorded a $42.7 million valuation allowance against its deferred tax assets consisting primarily of net operating loss carryovers, general business carryovers and foreign tax credit carryforwards, $0.6 million of which related to discontinued operations. The Company carried no valuation allowance against its deferred tax assets at December 31, 2007. As a result of the recent general economic and industry downturn, and its impact on the Company’s future outlook, management has reviewed its deferred tax assets and concluded that the uncertainties related to the realization of certain of its assets, have become unfavorable. As per U.S. generally accepted accounting principles, management considered the positive and negative evidence for the potential utilization of its deferred tax assets. Management concluded that it is not more likely than not that the Company will realize certain deferred tax assets and thus provided an allowance for the portion of deferred tax assets management concluded will not be utilized.
The Company’s 2007 tax rate was lower than the U.S. statutory rate for a number of reasons. In the fourth quarter of 2007, the Company’s Japanese subsidiary declared a dividend of 6.8 billion yen (approximately U.S. $60 million) and also loaned 4.6 billion yen (approximately U.S. $40 million) to the Company. The resulting recharacterization of $100 million of the Japanese subsidiary’s accumulated undistributed earnings resulted in a fourth quarter tax benefit of $9.4 million, net of state income tax expense. The Company also benefited from the tax holiday in Malaysia in 2007 in the amount of $2.1 million.
53
Table of Contents
Discontinued operations
The Company’s businesses classified as discontinued operations recorded a net loss of $1.1 million in 2008. The Company completed the sale of its cleaning equipment business, classified as a discontinued operation, for proceeds of $0.7 million in April 2008.
The Company’s discontinued operations recorded a net loss of $2.0 million for 2007. These results included an operating loss of $1.4 million, a pre-tax impairment charge of $2.6 million recorded in connection with the write-down of long-lived assets to fair value less cost to sell, and a tax benefit of $0.7 million related to a reduction in the Company’s deferred tax asset valuation allowance, resulting from the utilization of a capital loss carryforward to offset a portion of the capital gain on the sale of an equity investment.
Net (loss) income The Company recorded a net loss of $517.0 million, or $4.59 per share, in 2008, compared to net income of $44.4 million, or $0.35 per diluted share, in 2007. The Company’s loss from continuing operations for 2008 was $515.9 million, or $4.58 per share, compared to income from continuing operations of $46.4 million, or $0.37 per diluted share, in the prior year.
Segment Analysis
The following table presents selected sales and segment profit data for the Company’s three segments for the years ended December 31, 2008 and 2007:
| (In thousands) |
2008 | 2007 | ||||
| Contamination Control Solutions |
||||||
| Net sales |
$ | 330,810 | $ | 382,182 | ||
| Segment profit |
77,024 | 109,725 | ||||
| Microenvironments |
||||||
| Net sales |
$ | 190,761 | $ | 235,168 | ||
| Segment profit |
24,276 | 40,804 | ||||
| Entegris Specialty Materials |
||||||
| Net sales |
$ | 33,128 | $ | 8,888 | ||
| Segment profit |
9,250 | 1,102 | ||||
Contamination Control Solutions (CCS)
For the year ended December 31, 2008, CCS net sales decreased 13% to $330.8 million from $382.2 million in 2007, reflecting the downturn in the semiconductor industry that began during the second half of 2008. The decline reflected decreased demand for liquid filtration products and chemical containers, which was driven by lower semiconductor fab utilization rate. Sales of unit-driven filtration products declined by 11%. Sales of CCS capital-driven products, such as photochemical pumps, fluid handling products, and gas purification systems also fell. Sales of control systems declined by 20% due to lower sales of dispense pumps, which fell by 48%, while sales of filtration products fell by 16%.
CCS reported a segment profit of $77.0 million in 2008 compared to a $109.7 million segment profit in 2007. The decline in sales volume and the resulting reduction in gross profit primarily account for the year-to-year change in the segment’s operating results. CCS operating expenses decreased 2%, mainly due to lower selling costs.
Microenvironments (ME)
For the year ended December 31, 2008, ME net sales decreased 19% to $190.8 million from $235.2 million in 2007, also reflecting the downturn in the semiconductor industry that began during the second half of 2008. The decline reflected decreased demand for wafer shippers used to ship raw wafers, particularly at wafer sizes of
54
Table of Contents
150mm and below, as well as in chip trays and data storage components used to ship 65mm and 95mm disk drives. Sales of shippers declined 13%, partially offset by the increase in sales of 300mm wafer shippers of 181%.
ME reported a segment profit of $24.3 million in 2008 compared to a $40.8 million segment profit in 2007. The decline in sales volume and the resulting reduction in gross profit primarily account for the year-to-year change in the segment’s operating results. ME operating expenses decreased 7%, due to lower selling costs offset partly by higher engineering, research and development costs.
Entegris Specialty Materials (ESM)
For the year ended December 31, 2008, ESM net sales increased 273% to $33.1 million from $8.9 million in 2007. The sales increase reflected the inclusion of sales of $23.3 million from POCO, which was acquired in August 2008 and sales of $5.9 million related to the full-year inclusion of sales from the specialty coatings business acquired in August 2007.
ESM reported a segment profit of $9.3 million in 2008 compared to a $1.1 million segment profit in 2007. The inclusion of POCO results and the full-year inclusion of results of the specialty coatings business accounted for the increase in segment profit.
55
Table of Contents
Quarterly Results of Operations
The following table presents selected data from the Company’s consolidated statements of operations for the eight quarters ended December 31, 2009. This unaudited information has been prepared on the same basis as the audited consolidated financial statements appearing elsewhere in this annual report. All adjustments that management considers necessary for the fair presentation of the unaudited information have been included in the quarters presented.
QUARTERLY STATEMENTS OF OPERATIONS DATA (UNAUDITED)
| 2008 | 2009 | |||||||||||||||||||||||||||||||
| (In thousands) | Q1 | Q2 | Q3 | Q4 | Q1 | Q2 | Q3 | Q4 | ||||||||||||||||||||||||
| Net sales |
$ | 148,227 | $ | 147,947 | $ | 145,789 | $ | 112,736 | $ | 59,038 | $ | 82,576 | $ | 110,706 | $ | 146,324 | ||||||||||||||||
| Gross profit |
63,988 | 59,887 | 55,398 | 32,242 | 5,018 | 23,730 | 44,777 | 64,287 | ||||||||||||||||||||||||
| Selling, general and administrative expenses |
43,322 | 37,105 | 35,373 | 31,731 | 29,721 | 25,685 | 29,175 | 32,420 | ||||||||||||||||||||||||
| Engineering, research and development expenses |
10,501 | 10,362 | 10,284 | 8,939 | 8,904 | 7,843 | 8,575 | 9,717 | ||||||||||||||||||||||||
| Amortization of intangible assets |
5,087 | 4,552 | 4,858 | 5,088 | 4,981 | 4,931 | 4,723 | 4,602 | ||||||||||||||||||||||||
| Impairment of goodwill |
— | — | 379,810 | 93,989 | — | — | — | — | ||||||||||||||||||||||||
| Restructuring charges |
— | — | 3,332 | 7,091 | 4,634 | 5,452 | 2,368 | 3,009 | ||||||||||||||||||||||||
| Operating profit (loss) |
5,078 | 7,868 | (378,259 | ) | (114,596 | ) | (43,222 | ) | (20,181 | ) | (64 | ) | 14,539 | |||||||||||||||||||
| Net income (loss) attributable to Entegris, Inc. |
2,865 | 4,933 | (393,002 | ) | (131,798 | ) | (37,745 | ) | (22,492 | ) | (7,608 | ) | 10,124 | |||||||||||||||||||
| (Percent of net sales) | Q1 | Q2 | Q3 | Q4 | Q1 | Q2 | Q3 | Q4 | ||||||||||||||||||||||||
| Net sales |
100.0 | % | 100.0 | % | 100.0 | % | 100.0 | % | 100.0 | % | 100.0 | % | 100.0 | % | 100.0 | % | ||||||||||||||||
| Gross profit |
43.2 | 40.5 | 38.0 | 28.6 | 8.5 | 28.7 | 40.4 | 43.9 | ||||||||||||||||||||||||
| Selling, general and administrative expenses |
29.2 | 25.1 | 24.3 | 28.1 | 50.3 | 31.1 | 26.4 | 22.2 | ||||||||||||||||||||||||
| Engineering, research and development expenses |
7.1 | 7.0 | 7.1 | 7.9 | 15.1 | 9.5 | 7.7 | 6.6 | ||||||||||||||||||||||||
| Amortization of intangibles |
3.4 | 3.1 | 3.3 | 4.5 | 8.4 | 6.0 | 4.3 | 3.1 | ||||||||||||||||||||||||
| Impairment of goodwill |
— | — | 260.5 | 83.4 | — | — | — | — | ||||||||||||||||||||||||
| Restructuring charges |
— | — | 2.3 | 6.3 | 7.8 | 6.6 | 2.1 | 2.1 | ||||||||||||||||||||||||
| Operating profit (loss) |
3.4 | 5.3 | (259.5 | ) | (101.6 | ) | (73.2 | ) | (24.4 | ) | (0.1 | ) | 9.9 | |||||||||||||||||||
| Net income (loss) attributable to Entegris, Inc. |
1.9 | 3.3 | (269.6 | ) | (116.9 | ) | (63.9 | ) | (27.2 | ) | (6.9 | ) | 6.9 | |||||||||||||||||||
Our quarterly results of operations have been, and will likely continue to be, subject to significant fluctuations due to a variety of factors, a number of which are beyond the Company’s control.
The Company’s financial results for the two-year period ended December 31, 2009 were significantly affected by the difficult global economic conditions and, more specifically, the severe downturn in both the capital and unit-driven segments of the semiconductor industry that began during the second half of the year ended December 31, 2008. On a sequential basis, revenues declined sharply from $145.8 million in the third quarter of 2008 to $112.7 million in the fourth quarter of 2008 and $59.0 million in the first quarter of 2009. An upturn in the Company’s sales began in the second quarter of 2009, with sales improving to $82.6 million in the second quarter, $110.7 million in the third quarter and $146.3 million in the fourth quarter of 2009.
The variability in sales was the key factor underlying the changes in the Company’s gross profit over the past eight quarters. In the third and fourth quarters of 2008, the Company’s results included goodwill impairment losses of $379.8 million and $94.0 million, respectively. The third and fourth quarter of 2008, as well as the first quarter of 2009, also included incremental charges of $5.7 million, $7.8 million and $4.1 million, respectively,
56
Table of Contents
associated with the write-up of acquired inventories to fair value. In addition, the Company incurred restructuring charges associated with the restructuring of its sales and marketing function, manufacturing operations, and realignment of its global supply chain and other ancillary operational functions during the latter half of 2008 and throughout 2009. All of these factors contributed to widely fluctuating quarterly results, including periods with significant net losses, for the Company.
Liquidity and Capital Resources
The Company has historically financed its operations and capital requirements through cash flow from operating activities, long-term loans, lease financing and borrowings under domestic and international short-term lines of credit. In fiscal 2000 and 2009, the Company raised capital via public offerings of its common stock.
Operating activities
Net cash flow provided by operating activities totaled $4.2 million for the year ended December 31, 2009. Cash flow provided by the Company’s operations, net of various non-cash charges, includes depreciation and amortization of $50.1 million, share-based compensation expense of $8.1 million, and a $4.6 million incremental charge associated with the fair market value write-up of inventory acquired in the acquisition of POCO and Pureline. The net impact of changes in operating assets and liabilities, mainly reflecting an increase in accounts receivable and a decline in inventory, also partially offset the cash provided by operations.
Working capital stood at $193.5 million at December 31, 2009, including $68.7 million in cash and cash equivalents, down from $233.8 million as of December 31, 2008, including $115.0 million in cash and cash equivalents.
Accounts receivable, net of foreign currency translation adjustments, increased by $19.2 million during 2009. This increase reflects an upturn in bookings and sales of the Company’s products. The Company’s days sales outstanding was 57 days compared to 57 days at the beginning of the year. Inventories decreased by $10.7 million from December 31, 2008, after taking into account the impact of foreign currency translation adjustments, provision for excess and obsolete inventory, and the charge for the fair value mark-up of acquired inventory. The decrease was mainly due to the effect of the Company’s worldwide efforts to reduce inventories.
Accounts payable and accrued expenses were $1.6 million lower than a year ago. This decrease mainly reflects the timing of payments compared to that of 2008. Income taxes payable and refundable income taxes increased by $0.5 million in 2009, with the Company receiving refunds net of payments of $2.8 million.
Investing activities Cash flow used in investing activities totaled $9.8 million in 2009. Expenditures for the acquisition of property and equipment totaled $13.2 million, primarily for additions related to manufacturing equipment, tooling and information systems. The Company sold a building that was classified as an asset held for sale for $2.3 million in the third quarter of 2009. The Company expects its capital expenditures in 2010 to be approximately $20 million. Under its amended credit facility, the Company is restricted from making capital expenditures in excess of $20.0 million in both 2010 an 2011 plus certain unused amounts from the prior period ($7.2 million for 2010). The Company does not anticipate that this limit on capital expenditures will have an adverse effect on the Company’s operations.
On July 31, 2009, Entegris acquired an additional 30% equity interest of Pureline Co., Ltd. (Pureline), a privately held company located in Munmak, South Korea and manufacturer of fluid handling products. The purchase price of the 30% equity interest was $4.3 million. The Company paid $1.1 million in cash and executed a note to the seller for $3.2 million, payable in three installments through April 2010.
Financing activities Cash used in financing activities totaled $40.7 million in 2009.
57
Table of Contents
The Company received proceeds of $704.7 million from new borrowings and made debt payments of $799.6 million during 2009. The Company expended $3.6 million for debt issuance costs related to the Company’s amended revolving credit agreement. These costs are classified in other assets in the Company’s consolidated financial statements and are being charged to interest expense as appropriate over the term of the agreement.
As described in Note 11 to the Company’s consolidated financial statements, the Company executed a new revolving credit agreement on March 2, 2009, which was amended on July 17, 2009 and August 11, 2009 (Restated Credit Agreement). The Restated Credit Agreement expires on November 1, 2011. The initial revolving commitment amount under the Restated Credit Agreement was $150.0 million, with $11.0 million unavailable without consent of a majority of the Company’s lenders. The revolving commitment was further subject to maintaining a borrowing base. In accordance with the terms of the Restated Credit Agreement, after the receipt of net proceeds of $56.6 million from a registered public offering on September 16, 2009, the revolving commitment decreased by 50% of the net proceeds of the offering, or $28.3 million, to $121.7 million, with $11.0 million unavailable without consent of a majority of the Company’s lenders.
The Restated Credit Agreement requires that the Company meet various financial covenants. Through December 31, 2009, the Company has been in compliance with all financial covenants required by the Restated Credit Agreement. The Restated Credit Agreement requires that the Company not exceed the negative year-to-date EBITDA amounts in 2009 and that the Company exceed the positive year-to-date EBITDA amounts at prescribed levels on a monthly basis through March 2010. Beginning in the second quarter of 2010, the foregoing minimum EBITDA covenants expire, and the Restated Credit Agreement requires that the Company maintain a cash flow leverage ratio of no more than 3.0 to 1.0 and a fixed charge coverage ratio no lower than 1.5 to 1.0. A detailed description of these financial covenants can be found in Note 11 to the Company’s consolidated financial statements.
Under the terms of the Restated Credit Agreement, the Company must also maintain a minimum of $25.0 million in domestic cash balances and is restricted from making capital expenditures in excess of $20.0 million in both 2010 an 2011 plus certain unused amounts from the prior period ($7.2 million for 2010).
Notwithstanding the terms under the Restated Credit Agreement described above, the Company also has a line of credit with four banks that provide for borrowings of currencies for the Company’s overseas subsidiaries, principally the Japanese yen and Korean won equivalent to an aggregate of approximately $16.9 million. There was $5.8 million outstanding on these lines of credit at December 31, 2009.
On June 25, 2009, the Company filed a shelf registration statement with the Securities and Exchange Commission to issue debt or equity securities at a future date. The registration statement became effective in September 2009 and on September 16, 2009 the Company received net proceeds of $56.6 million from a registered public equity offering. As noted above, the Company used the net proceeds to reduce outstanding debt.
The Company received proceeds of $1.3 million in connection with common shares issued under the Company’s employee stock purchase plans and stock option exercises.
At December 31, 2009, the Company’s shareholders’ equity stood at $346.2 million, up 3% from $336.2 million at the beginning of the year. The increase reflected the $56.6 million from the registered public offering and additional paid-in capital of $8.1 million associated with the Company’s share-based compensation expense. The increase was partially offset by the Company’s net loss of $57.8 million.
As of December 31, 2009, the Company’s sources of available funds were $68.7 million in cash and cash equivalents, of which the Company must maintain a minimum of $25.0 million domestically under the terms of the Restated Credit Agreement. The Company’s borrowing base under its Restated Credit Agreement supported $106.6 million in total availability as of December 31, 2009, with $52.4 million in borrowings and $1.5 million undrawn on letters of credit then outstanding.
58
Table of Contents
The Company believes that its cash and cash equivalents, funds available under the Restated Credit Agreement and international credit facilities and cash flow generated from operations will be sufficient to meet its working capital and investment requirements for the next twelve months. If available liquidity is not sufficient to meet the Company’s operating and debt service obligations as they come due, management will need to pursue alternative arrangements through additional equity or debt financing in order to meet the Company’s cash requirements. However, there can be no assurance that any such financing would be available on commercially acceptable terms.
New Accounting Pronouncements
Accounting Standards Codification™
In June 2009, the Financial Accounting Standards Board (FASB) issued Accounting Standards Update (ASU) No. 2009-01, Generally Accepted Accounting Principles (ASC Topic 105) which establishes the FASB Accounting Standards Codification (the Codification or ASC) as the official single source of authoritative U.S. generally accepted accounting principles (GAAP). All existing accounting standards are superseded. All other accounting guidance not included in the Codification will be considered non-authoritative. The Codification also includes all relevant Securities and Exchange Commission (SEC) guidance organized using the same topical structure in separate sections within the Codification.
Following the Codification, the Board will not issue new standards in the form of Statements, FASB Staff Positions or Emerging Issues Task Force Abstracts. Instead, it will issue Accounting Standards Updates (ASU) which will serve to update the Codification, provide background information about the guidance and provide the basis for conclusions on the changes to the Codification.
The Codification is not intended to change GAAP, but it will change the way GAAP is organized and presented. The Codification is effective for the Company’s condensed consolidated financial statements as of and for the period ended September 26, 2009 and the principal impact on the financial statements is limited to disclosures as all future references to authoritative accounting literature will be referenced in accordance with the Codification. In order to ease the transition to the Codification, the Company is providing the Codification cross-reference alongside the references to the standards issued and adopted prior to the adoption of the Codification.
In December 2007, the FASB issued SFAS No. 141 (revised 2007) Business Combinations (ASC Topic 805). This guidance retains the fundamental requirements of the original pronouncement requiring that the purchase method be used for all business combinations and defines the acquirer as the entity that obtains control of one or more businesses in the business combination, establishes the acquisition date as the date that the acquirer achieves control and requires the acquirer to recognize the assets acquired, liabilities assumed and any noncontrolling interest at their fair values as of the acquisition date. The guidance also requires that acquisition-related costs be recognized separately from the acquisition. This guidance was effective for the Company in the first quarter of 2009 and was followed by the Company in its accounting for the acquisition described in Note 3 to consolidated financial statements.
In December 2007, the FASB issued Statement No. 160, Noncontrolling Interests in Consolidated Financial Statements (ASC Topic 810). This guidance clarifies that a noncontrolling interest in a subsidiary should be reported as equity in the consolidated financial statements. Consolidated net income should include the net income for both the parent and the noncontrolling interest with disclosure of both amounts on the consolidated statement of operations. The calculation of earnings per share will continue to be based on income amounts attributable to the parent. This guidance was effective for the Company in the first quarter of 2009 and was followed by the Company in its accounting for the acquisition described in Note 3 to consolidated financial statements.
In May 2009, the FASB issued SFAS No. 165, Subsequent Events (ASC Topic 855). This guidance establishes general standards of accounting for and disclosure of events that occur after the balance sheet date but before financial statements are issued or are available to be issued. This guidance was effective for the Company in the second quarter of 2009 and its adoption did not have a material impact on the Company’s consolidated financial statements.
59
Table of Contents
In June 2009, the FASB issued SFAS No. 167, Amendments to FASB Interpretation No 46(R) (ASC Topic 810). This guidance amends certain requirements to improve financial reporting by enterprises involved with variable interest entities and to provide more relevant and reliable information to users of financial statements. This guidance is effective for the Company in 2010. The Company does not expect its adoption to have a material effect on the Company’s consolidated financial statements.
In October 2009, the FASB issued the following ASU No. 2009-13, Revenue Recognition (ASC Topic 605)—Multiple-Deliverable Revenue Arrangements, a consensus of the FASB Emerging Issues Task Force. This guidance modifies the fair value requirements of ASC subtopic 605-25 Revenue Recognition-Multiple Element Arrangements by allowing the use of the “best estimate of selling price” for determining the selling price of a deliverable. A vendor is now required to use its best estimate of the selling price when vendor specific objective evidence or third-party evidence of the selling price cannot be determined. In addition, the residual method of allocating arrangement consideration is no longer permitted. This guidance is effective for the Company in 2011. The Company is currently evaluating the impact of adopting this update on its consolidated financial statements.
Contractual Obligations
The following table summarizes the maturities of the Company’s significant financial obligations as of December 31, 2009:
| Maturity by fiscal year | |||||||||||||||||||||
| (In thousands) |
Total | 2010 | 2011 | 2012 | 2013 | 2014 | Thereafter | ||||||||||||||
| Contractual obligations related to off-balance sheet arrangements: |
|||||||||||||||||||||
| Operating leases |
$ | 18,105 | $ | 7,496 | $ | 4,011 | $ | 3,266 | $ | 2,671 | $ | 653 | $ | 8 | |||||||
| Total |
$ | 18,105 | $ | 7,496 | $ | 4,011 | $ | 3,266 | $ | 2,671 | $ | 653 | $ | 8 | |||||||
| Contractual obligations reflected in the balance sheet: |
|||||||||||||||||||||
| Long-term debt |
$ | 63,749 | $ | 11,257 | $ | 52,492 | $ | — | $ | — | $ | — | $ | — | |||||||
| Short-term borrowings |
8,039 | 8,039 | — | — | — | — | — | ||||||||||||||
| Interest payable(1) |
389 | 389 | — | — | — | — | — | ||||||||||||||
| Unrecognized tax benefits(2) |
615 | 615 | — | — | — | — | — | ||||||||||||||
| Pension obligations |
21,796 | 800 | 341 | 516 | 576 | 331 | 19,232 | ||||||||||||||
| Total |
$ | 94,588 | $ | 21,100 | $ | 52,833 | $ | 516 | $ | 576 | $ | 331 | $ | 19,232 | |||||||
| (1) | The above table does not reflect interest payments associated with the Company’s Restated Credit Agreement. The Company cannot make reasonably reliable estimates of amounts outstanding under the revolving commitment. |
| (2) | The Company had $4.3 million of total gross unrecognized tax benefits at December 31, 2009. The timing of any payments associated with these unrecognized tax benefits will depend on a number of factors. Accordingly, other than $0.6 million that is expected to be payable in 2010, the Company cannot make reasonably reliable estimates of the amount and period of potential cash settlements, if any, with taxing authorities. |
Quantitative and Qualitative Disclosure About Market Risks
Entegris’ principal financial market risks are sensitivities to interest rates and foreign currency exchange rates. The Company’s interest-bearing cash equivalents, long-term debt and short-term borrowings are subject to interest rate fluctuations. Most of the Company’s long-term debt at December 31, 2009 carries floating rates of interest. The Company’s cash equivalents are instruments with maturities of three months or less. A 100 basis point change in interest rates would potentially increase or decrease annual net income by approximately $0.4 million annually.
60
Table of Contents
The cash flows and earnings of the Company’s foreign-based operations are subject to fluctuations in foreign exchange rates. The Company occasionally uses derivative financial instruments to manage the foreign currency exchange rate risks associated with its foreign-based operations. At December 31, 2009, the Company had no outstanding forward contracts.
On February 6, 2007, the Company entered into a 10-month Japanese yen-based cross-currency interest rate swap, with aggregate notional principal amounts of 2.4 billion Japanese yen and $20 million that matured on November 30, 2007. This swap effectively hedged a portion of the Company’s net investment in its Japanese subsidiary. During the term of this transaction, the Company remitted to, and received from, its counterparty interest payments based on rates that were reset quarterly equal to three-month Japanese LIBOR and three-month U.S. LIBOR rates, respectively. The Company designated this hedging instrument as a hedge of a portion of the net investment in its Japanese subsidiary, and used the spot rate method of accounting to value changes of the hedging instrument attributable to currency rate fluctuations. Accordingly, a $2.1 million adjustment in the fair market value of the hedging instrument related to changes in the spot rate was recorded as a charge to “Foreign currency translation” within accumulated other comprehensive loss in equity in 2007 to offset changes in a portion of the yen-denominated net investment in the Company’s Japanese subsidiary and will remain there until the net investment is disposed. The Company recorded $0.7 million in net interest income in 2007 in connection with the cross-currency interest rate swap.
Impact of Inflation
The Company’s consolidated financial statements are prepared on a historical cost basis, which does not completely account for the effects of inflation. Material and labor expenses are the Company’s primary costs. The cost of its materials, including polymers and stainless steel, was modestly higher in 2009 compared to 2008. Entegris expects the cost of these materials to increase slightly in 2010. Labor costs, including taxes and fringe benefits were lower in 2009 due to the Company’s actions to align spending with lower sales volumes amidst the semiconductor industry’s downturn. Slightly higher total labor costs can be reasonably anticipated for 2010 as the Company reinstates some the temporary cost reductions put in place in the first half of 2009. The Company’s products are sold under contractual arrangements with its large customers and at current market prices to other customers. Consequently, the Company can adjust its selling prices, to the extent allowed by competition and contractual arrangements, to reflect cost increases caused by inflation. However, many of these cost increases may not be recoverable.
FACTORS AND UNCERTAINTIES THAT MAY AFFECT FUTURE RESULTS
The matters discussed in this Annual Report on Form 10-K include forward-looking statements within the meaning of the Private Securities Litigation Reform Act of 1995. These forward-looking statements include but are not limited to statements about:
| • | our strategy; |
| • | our revenues; |
| • | sufficiency of our cash resources; |
| • | product development; |
| • | our research and development and other expenses; and |
| • | our operations and legal risks. |
Discussions containing these forward-looking statements may be found throughout this report including in the items entitled “Business” (Item 1), “Risk Factors” (Item 1A),and “Management’s Discussion and Analysis of Financial Condition and Results of Operations” (Item 7), as well as any amendments thereto reflected in subsequent filings with the SEC. These statements are based on current management expectations and are subject
61
Table of Contents
to substantial risks and uncertainties which could cause actual results to differ materially from the results expressed in, or implied by, these forward-looking statements. When used herein or in such statements, the words “anticipate”, “believe”, “estimate”, “expect”, “may”, “will”, “should” or the negative thereof and similar expressions as they relate to Entegris or its management are intended to identify such forward-looking statements. We undertake no obligation to publicly release any revisions to the forward-looking statements or reflect events or circumstances after the date of this Annual Report on Form 10-K except as required by law.
| Item 7a. | Quantitative and Qualitative Disclosures about Market Risk |
The information required by this item can be found under the subcaption “Quantitative and Qualitative Disclosure About Market Risks” of “Management’s Discussion and Analysis of Financial Condition and Results of Operations” in Item 7.
| Item 8. | Financial Statements and Supplementary Data. |
The information called for by this item is set forth in the Consolidated Financial Statements covered by the Report of Independent Registered Public Accounting Firm at the end of this report.
| Item 9. | Changes in and Disagreements With Accountants on Accounting and Financial Disclosure. |
This item is not applicable.
| Item 9A. | Controls and Procedures. |
(a) EVALUATION OF DISCLOURE CONTROLS AND PROCEDURES
The Company’s management, including the Chief Executive Officer and Chief Financial Officer, has conducted an evaluation of the effectiveness of the design and operation of the Company’s disclosure controls and procedures (as defined under Rules 13a-15(e) and 15d-15(e) promulgated under the Securities Exchange Act of 1934 (the “1934 Act”)) as of December 31, 2009. Based upon that evaluation, the Chief Executive Officer and Chief Financial Officer concluded that, as of that evaluation date, the Company’s disclosure controls and procedures were effective to ensure that information required to be disclosed by the Company in the reports that it files or submits under the 1934 Act is (i) recorded, processed, summarized and reported within the time periods specified in applicable rules and forms of the Securities and Exchange Commission, and (ii) accumulated and communicated to our management, including its Chief Executive Officer and Chief Financial Officer, to allow timely decisions regarding required disclosure.
(b) MANAGEMENT’S REPORT ON INTERNAL CONTROL OVER FINANCIAL REPORTING
Management is responsible for establishing and maintaining an adequate system of internal control over financial reporting of the Company. This system of internal financial reporting controls is designed to provide reasonable assurance that assets are safeguarded and transactions are properly recorded and executed in accordance with management’s authorization. The design, monitoring and revision of the system of internal financial reporting controls involves, among other things, management’s judgments with respect to the relative cost and expected benefits of specific control measures. The effectiveness of the control system is supported by the selection, retention and training of qualified personnel and an organizational structure that provides an appropriate division of responsibility and formalized procedures. The system of internal accounting controls is periodically reviewed and modified in response to changing conditions. Designated Company employees regularly monitor the adequacy and effectiveness of internal accounting controls.
Because of its inherent limitations, a system of internal control over financial reporting can provide only reasonable assurance and may not prevent or detect misstatements. Further, because of changes in conditions, the
62
Table of Contents
effectiveness of internal controls over financial reporting may vary over time. Our system contains control-monitoring mechanisms, and actions are taken to correct deficiencies as they are identified.
Management conducted an evaluation of the effectiveness of the system of internal control over financial reporting based on the framework in Internal Control—Integrated Framework issued by the Committee of Sponsoring Organizations of the Treadway Commission (“COSO”). Based on this evaluation, management concluded that the Company’s system of internal control over financial reporting was effective as of December 31, 2009.
(c) CHANGES IN INTERNAL CONTROL OVER FINANCIAL REPORTING
There was no change in the Company’s internal control over financial reporting during the most recently completed fiscal quarter that has materially affected, or is reasonably likely to materially affect, the Company’s internal control over financial reporting.
| Item 9B. | Other Information. |
None.
63
Table of Contents
PART III
| Item 10. | Directors, Executive Officers and Corporate Governance |
The information called for by this item with respect to registrant’s directors, including information relating to the independence of certain directors, identification of the audit committee and the audit committee financial expert, and with respect to corporate governance is set forth under the caption “Election of Directors” and “Corporate Governance”, respectively, in the Company’s definitive Proxy Statement for the Entegris, Inc. Annual Meeting of Stockholders to be held on May 5, 2010, and to be filed with the Securities and Exchange Commission on or about April 2, 2010, which information is hereby incorporated herein by reference.
The information called for by this item with respect to registrant’s compliance with Section 16(a) of the Securities Exchange Act of 1934, as amended, is set forth under the caption “Section 16(a) Beneficial Ownership Reporting Compliance” in the Company’s definitive Proxy Statement for the Entegris, Inc. Annual Meeting of Stockholders to be held on May 5, 2010, and to be filed with the Securities and Exchange Commission on or about April 2, 2010, which information is hereby incorporated herein by reference.
Information called for by this item with respect to registrant’s executive officers is set forth under “Executive Officers” in Item 1 of this report.
The Company has adopted a code of ethics, the Entegris, Inc. Code of Business Ethics, which applies to all employees of the registrant, including the registrant’s Chief Executive Officer, Chief Financial Officer and Chief Accounting Officer. A copy of the Entegris, Inc. Code of Business Ethics is posted on our website at http://www.Entegris.com, under “Investor Relations – Governance”. The Entegris, Inc. Code of Business Ethics is available in print to any stockholder that requests a copy. A copy of the Entegris, Inc. Code of Business Ethics may be obtained by contacting Peter W. Walcott, the Company’s Senior Vice President & General Counsel, at the Company’s headquarters. The Company intends to comply with the requirements of Item 10 of Form 8-K with respect to any waiver of the provisions of the Entegris, Inc. Code of Business Ethics applicable to the registrant’s Chief Executive Officer, Chief Financial Officer or Chief Accounting Officer by posting notice of any such waiver at the same location on our website.
| Item 11. | Executive Compensation. |
The information called for by this item is set forth under the caption “COMPENSATION OF EXECUTIVE OFFICERS”, “MANAGEMENT DEVELOPMENT & COMPENSATION COMMITTEE” and “REPORT OF THE MANAGEMENT DEVELOPMENT & COMPENSATION COMMITTEE”, respectively, in the Company’s definitive Proxy Statement for the Entegris, Inc. Annual Meeting of Stockholders to be held on May 5, 2010, and to be filed with the Securities and Exchange Commission on or about April 2, 2010, which information is hereby incorporated herein by reference.
| Item 12. | Security Ownership of Certain Beneficial Owners and Management and Related Stockholder Matters. |
The information called for by this item is set forth under the caption “Proposal 3—Approval of Entegris, Inc. 2010 Stock Plan—Securities Authorized for Issuance Under Equity Compensation Plans” respectively, in the Company’s definitive Proxy Statement for the Entegris, Inc. Annual Meeting of Stockholders to be held on May 5, 2010, and to be filed with the Securities and Exchange Commission on or about April 2, 2010, which information is hereby incorporated herein by reference.
| Item 13. | Certain Relationships and Related Transactions, and Director Independence. |
The information called for by this item with respect to certain transactions and relationships between the registrant and directors, executive officers and five percent stockholders is set forth under the caption “MANAGEMENT AND ELECTION OF DIRECTORS-Nominees for Election as Directors” in the Company’s definitive
64
Table of Contents
Proxy Statement for the Entegris, Inc. Annual Meeting of Stockholders to be held on May 5, 2010, and to be filed with the Securities and Exchange Commission on or about April 2, 2010, which information is hereby incorporated herein by reference.
| Item 14. | Principal Accountant Fees and Services. |
The information called for by this item with respect to the fees paid to and the services performed by the registrant’s principal accountant is set forth under the caption “PROPOSAL 2: RATIFICATION OF SELECTION OF INDEPENDENT REGISTERED PUBLIC ACCOUNTING FIRM FOR 2010” in the Company’s definitive Proxy Statement for the Entegris, Inc. Annual Meeting of Stockholders to be held on May 5, 2010, and to be filed with the Securities and Exchange Commission on or about April 2, 2010, which information is hereby incorporated herein by reference.
65
Table of Contents
PART IV
| Item 15. | Exhibits, Financial Statement Schedules, and Reports on Form 8-K. |
| (a) | The following documents are filed as a part of this report: |
| 1. | Financial Statements. The Consolidated Financial Statements listed under Item 8 of this report and in the Index to Consolidated Financial Statements on page F-1 of this report that is incorporated by reference. |
| 2. | Exhibits. |
| A. | The following exhibits are incorporated by reference: |
| Reg. S-K |
Document Incorporated |
Referenced Document on file with the Commission | ||
| (2) | Agreement and Plan of Merger, dated as of March 21, 2005, by and among Entegris, Inc., Mykrolis Corporation and Eagle DE, Inc. | Included as Annex A in the joint proxy statement/prospectus included in S-4 Registration . Statement of Entegris, Inc. and Eagle DE, Inc. (No. 333-124719) | ||
| (2) | Agreement and Plan of Merger, dated as of March 21, 2005, by and between Entegris, Inc., and Eagle DE, Inc. | Included as Annex B in the joint proxy statement/prospectus included in S-4 Registration. Statement of Entegris, Inc. and Eagle DE, Inc. (No. 333-124719) | ||
| (3) | Amended and Restated Certificate of Incorporation of Entegris, Inc. | Included as Annex C-2 in the joint proxy statement/prospectus included in S-4 Registration Statement of Entegris, Inc. and Eagle DE, Inc. (No. 333-124719) | ||
| (3) | By-Laws of Entegris, Inc., as amended December 17, 2008 | Exhibit 3 to Entegris, Inc. Annual Report on Form 10-K for the fiscal year ended December 31, 2008 | ||
| (4) | Form of certificate representing shares of Common Stock, $.01 par value per share | Exhibit 4.1 to Form S-4 Registration Statement of Entegris, Inc. and Eagle DE, Inc. (No. 333-124719) | ||
| (4) | Rights Agreement dated July 26, 2005, between Entegris and Wells Fargo Bank, N.A as rights agent | Exhibit 4.1 to Entegris, Inc. (Entegris Minnesota) Current Report on Form 8-K filed with the Securities and Exchange Commission on July 29, 2005 | ||
| (10) | Entegris, Inc. Outside Directors’ Stock Option Plan* | Entegris, Inc. Registration Statement on Form S-1 (No. 333-33668) | ||
| (10) | Entegris, Inc. 2000 Employee Stock Purchase Plan | Entegris, Inc. Registration Statement on Form S-1 (No. 333-33668) | ||
| (10) | 2001 Equity Incentive Plan* | Exhibit 10.1 to Mykrolis Corporation Form S-1 Registration Statement (No. 333-57182) | ||
| (10) | Amendment No. 2 to 2001 Equity Incentive Plan* | Exhibit 10.2 to Entegris, Inc. Form 10-Q Quarterly Report for the period ended June 28, 2008 | ||
| (10) | Amended and Restated Entegris Incentive Plan* | Exhibit 10.1 to Entegris, Inc. Form 10-Q Quarterly Report for the period ended June 28, 2008 | ||
| * | A “management contract or compensatory plan” |
66
Table of Contents
| Reg. S-K |
Document Incorporated |
Referenced Document on file with the Commission | ||
| (10) | Lease Agreement, dated April 1, 2002 Between Nortel Networks HPOCS Inc. And Mykrolis Corporation, relating to Executive office, R&D and manufacturing facility located at 129 Concord Road Billerica, MA | Exhibit 10.1.3 to Mykrolis Corporation Quarterly Report on Form 10-Q, for the period ended March 31, 2002 | ||
| (10) | Amended and Restated Employment Agreement, dated as of May 4, 2005, by and between Mykrolis Corporation and Gideon Argov* | Exhibit 10.13 to Mykrolis Corporation’s Quarterly Report on Form 10-Q for the quarter ended April 2, 2005 | ||
| (10) | STAT-PRO(R) 3000 and STAT-PRO(R) 3000E Purchase and Supply Agreement between Fluoroware, Inc. and Miller Waste Mills, d/b/a RTP Company, dated April 6, 1998 | Entegris, Inc. Registration Statement on Form S-1 (No. 333-33668) | ||
| (10) | PFA Purchase and Supply Agreement by and between E.I. Du Pont De Nemours and Company and Fluoroware, Inc., dated January 7, 1999, which was made effective retroactively to November 1, 1998, and supplemented by the Assignment and Limited Amendment by and between the same parties and Entegris, Inc., dated as of September 24, 1999 | Entegris, Inc. Registration Statement on Form S-1 (No. 333-33668) | ||
| (10) | Amended and Restated Credit Agreement, dated as of March 2, 2009, among Entegris, Inc., the Banks (as defined therein) Wells Fargo Bank, NA, as Agent, Citibank, as Syndication Agent and RBS Citizens Bank, as Documentation Agent (the “Amended and Restated Credit Agreement”). | Exhibit 99.1 to Entegris, Inc. Report on Form 8-K filed March 4, 2009. | ||
| (10) | Schedules and Exhibits to the Amended and Restated Credit Agreement. | Exhibit 99.2 to Entegris, Inc. Report on Form 8-K/A filed August 12, 2009. | ||
| (10) | Amendment No. 1 to the Amended and Restated Credit Agreement, dated July 17, 2009. | Exhibit 99.1 to Entegris, Inc. Report on Form 8-K filed July 23, 2009. | ||
| (10) | Amendment No. 2 to the Amended and Restated Credit Agreement, dated August 11, 2009. | Exhibit 99.1 to Entegris, Inc. Report on Form 8-K filed August 17, 2009. | ||
| (10) | Form of Indemnification Agreement between Entegris, Inc. and each of its executive officers and Directors | Exhibit 10.30 to Entegris, Inc. Annual Report on Form 10- K for the period ended August 27, 2005 | ||
| (10) | Form of Executive Change of Control Termination Agreement between Entegris, Inc. and each of its executive officers* | Exhibit 10.31 to Entegris, Inc. Annual Report on Form 10-K for the period ended August 27, 2005 | ||
| (10) | Entegris, Inc. 401 (k) Savings and Profit Sharing Plan (2005 Restatement)* | Exhibit 10.35 to Entegris, Inc. Annual Report on Form 10-K for the period ended August 27, 2005 | ||
| * | A “management contract or compensatory plan” |
67
Table of Contents
| Reg. S-K |
Document Incorporated |
Referenced Document on file with the Commission | ||
| (10) | Form of Entegris, Inc. Restricted Stock Award Agreement* | Exhibit 10.2 to Entegris, Inc. Quarterly Report on Form 10-Q for the period ended November 27, 2005 | ||
| (10) | Entegris, Inc. - Form of 2006 Equity Incentive Award Agreement | Exhibit 10.1 to Entegris, Inc. Quarterly Report on Form 10-Q for the period ended April 1, 2006, | ||
| (10) | Translation of Loan Agreement, dated November 2, 2007, between Nihon Entegris KK and Summitomo Mitsui Banking Corporation | Exhibit 10.1 to Entegris, Inc. Annual Report on Form 10-K for the fiscal year ended December 31, 2007 | ||
| (10) | Agreement and Plan of Merger and Amendment #1 thereto by and among Entegris, Inc. Entegris Acquisition Co. LLC, Poco Graphite, Inc. and Poco Graphite Holdings LLC, dated July 13, 2008 | Exhibits 99.1 and 99.2 to Entegris, Inc. Current Report on Form 8-K, filed with the Securities and Exchange Commission on August 11, 2008 | ||
| (10) | Executive Termination Agreement, dated July 7, 2008 between Entegris, Inc. and Jean-Marc Pandraud* | Exhibit 10.2 to Entegris, Inc. Quarterly Report on Form 10-Q for the period ended September 27, 2008 | ||
| (10) | Severance Agreement, dated July 7, 2008 between Entegris, Inc. and Gregory B. Graves* | Exhibit 10.3 to Entegris, Inc. Quarterly Report on Form 10-Q for the period ended September 27, 2008 | ||
| (10) | Trust Agreement between Entegris, Inc. Fidelity Management Trust Company and Entegris Inc. 401(k) Savings and Profit Sharing Plan Trust, dated December 29, 2007. | Exhibit 10.3 to Entegris, Inc. Annual Report on Form 10-K for the fiscal year ended December 31, 2007 | ||
| (10) | Entegris, Inc. 2007 Deferred Compensation Plan* | Exhibit 10.2 to Entegris, Inc. Quarterly Report on Form 10-Q for the fiscal period ended June 30, 2007 | ||
| (10) | Entegris, Inc.—Form of 2007 Equity Incentive Award Agreement* | Exhibit 10.4 to Entegris, Inc. Annual Report on Form 10-K for the fiscal year ended December 31, 2007 | ||
| (10) | Second Amended and Restated Membrane Manufacture and Supply Agreement, dated December 19, 2008, by and between Entegris, Inc. and Millipore Corporation | Exhibit 10.1 to to Entegris, Inc. Annual Report on Form 10-K for the fiscal year ended December 31, 2008. | ||
| (10) | Amended and Restated Supplemental Executive Retirement Plan for Key Salaried Employees* | Exhibit 10.2 to to Entegris, Inc. Annual Report on Form 10-K for the fiscal year ended December 31, 2008. | ||
| (10) | Entegris, Inc.—Form of 2008 Equity Incentive Award Agreement* | Exhibit 10.3 to to Entegris, Inc. Annual Report on Form 10-K for the fiscal year ended December 31, 2008. | ||
| * | A “management contract or compensatory plan” |
68
Table of Contents
| B. | The Company hereby files as exhibits to this Annual Report on Form 10-K the following documents: |
| Reg. S-K |
Exhibit No. |
Documents Filed Herewith | ||
| (10) | 10.1 | Entegris, Inc. 2009 RSU Unit Award Agreement* | ||
| (10) | 10.2 | Entegris, Inc. 2009 Stock Option Award Agreement* | ||
| (10) | 10.3 | First Amendment to Entegris, Inc. 401(k) Savings and Profit Sharing Plan (2005 Restatement)* | ||
| (10) | 10.4 | Second Amendment to Entegris, Inc. 401(k) Savings and Profit Sharing Plan (2005 Restatement)* | ||
| (10) | 10.5 | Third Amendment to Entegris, Inc. 401(k) Savings and Profit Sharing Plan (2005 Restatement)* | ||
| (10) | 10.6 | Fourth Amendment to Entegris, Inc. 401(k) Savings and Profit Sharing Plan (2005 Restatement)* | ||
| (10) | 10.7 | Fifth Amendment to Entegris, Inc. 401(k) Savings and Profit Sharing Plan (2005 Restatement)* | ||
| (10) | 10.8 | Sixth Amendment to Entegris, Inc. 401(k) Savings and Profit Sharing Plan (2005 Restatement)* | ||
| (10) | 10.9 | Seventh Amendment to Entegris, Inc. 401(k) Savings and Profit Sharing Plan (2005 Restatement)* | ||
| (10) | 10.10 | Eighth Amendment to Entegris, Inc. 401(k) Savings and Profit Sharing Plan (2005 Restatement)* | ||
| (10) | 10.11 | Ninth Amendment to Entegris, Inc. 401(k) Savings and Profit Sharing Plan (2005 Restatement)* | ||
| (10) | 10.12 | Tenth Amendment to Entegris, Inc. 401(k) Savings and Profit Sharing Plan (2005 Restatement)* | ||
| (10) | 10.13 | Eleventh Amendment to Entegris, Inc. 401(k) Savings and Profit Sharing Plan (2005 Restatement)* | ||
| (10) | 10.14 | Twelfth Amendment to Entegris, Inc. 401(k) Savings and Profit Sharing Plan (2005 Restatement)* | ||
| (10) | 10.15 | Amendment to Amended and Restated SERP* | ||
| (10) | 10.16 | Entegris, Inc. 2010 Stock Plan* | ||
| (10) | 10.17 | Third Amended and Restated Membrane Manufacture and Supply Agreement, dated October 13, 2009 by and between Entegris, Inc. and Millipore Corporation | ||
| (21) | 21 | Subsidiaries of Entegris, Inc. | ||
| (23) | 23 | Consent of Independent Registered Public Accounting Firm | ||
| (24) | 24 | Power of Attorney by the Directors of Entegris, Inc. | ||
| (31) | 31.1 | Certification required by Rule 13a-14(a) in accordance with Section 302 of the Sarbanes-Oxley Act of 2002. | ||
| * | A “management contract or compensatory plan” |
69
Table of Contents
| Reg. S-K |
Exhibit No. |
Documents Filed Herewith | ||
| (31) | 31.2 | Certification required by Rule 13a-14(a) in accordance with Section 302 of the Sarbanes-Oxley Act of 2002. | ||
| (32) | 32.1 | Certification required by Rule 13a-14(b) and 18 U.S.C. Section 1350, as adopted pursuant to Section 906 of the Sarbanes-Oxley Act of 2002. | ||
| (32) | 32.2 | Certification required by Rule 13a-14(b) and 18 U.S.C. Section 1350, as adopted pursuant to Section 906 of the Sarbanes-Oxley Act of 2002. | ||
| * | A “management contract or compensatory plan” |
70
Table of Contents
SIGNATURES
Pursuant to the requirements of Section 13 or 15(d) of the Securities Exchange Act of 1934, the Registrant has duly caused this report to be signed on its behalf by the undersigned thereunto duly authorized.
| ENTEGRIS, INC. | ||||||
| Dated: February 25, 2010 |
By | /s/ GIDEON ARGOV | ||||
| Gideon Argov President & Chief Executive Officer | ||||||
Pursuant to the requirements of the Securities Exchange Act of 1934, this report has been signed below by the following persons on behalf of the Registrant and in the capacities and on the dates indicated.
| SIGNATURE |
TITLE |
DATE | ||
| /s/ GIDEON ARGOV Gideon Argov |
Chief Executive Officer and Director | February 25, 2010 | ||
| /s/ GREGORY B. GRAVES Gregory B. Graves |
Chief Financial Officer | February 25, 2010 | ||
| /s/ LYNN BLAKE Lynn Blake |
Chief Accounting Officer | February 25, 2010 | ||
| ROGER D. MCDANIEL* Roger D. McDaniel |
Director (Chairman of the Board) | February 25, 2010 | ||
| MICHAEL A. BRADLEY* Michael A. Bradley |
Director | February 25, 2010 | ||
| MICHAEL P.C. CARNS* Michael P.C. Carns |
Director | February 25, 2010 | ||
| DANIEL W. CHRISTMAN* Daniel W. Christman |
Director | February 25, 2010 | ||
| GARY F. KLINGL* Gary F. Klingl |
Director | February 25, 2010 | ||
| PAUL L.H. OLSON* Paul L.H. Olson |
Director | February 25, 2010 | ||
| BRIAN F. SULLIVAN* Brian F. Sullivan |
Director | February 25, 2010 | ||
| *By | /s/ PETER W. WALCOTT | |
| PETER W. WALCOTT, ATTORNEY-IN-FACT | ||
71
Table of Contents
INDEX TO FINANCIAL STATEMENTS
| F-2 | ||
| Consolidated Balance Sheets at December 31, 2009 and December 31, 2008 |
F-3 | |
| F-4 | ||
| F-5 | ||
| F-7 | ||
| F-9 | ||
F-1
Table of Contents
Report of Independent Registered Public Accounting Firm
The Board of Directors and Shareholders
Entegris, Inc.:
We have audited the accompanying consolidated balance sheets of Entegris, Inc. and subsidiaries as of December 31, 2009 and 2008, and the related consolidated statements of operations, equity and comprehensive income (loss), and cash flows for each of the years in the three-year period ended December 31, 2009. We also have audited Entegris, Inc.’s internal control over financial reporting as of December 31, 2009, based on criteria established in Internal Control—Integrated Framework issued by the Committee of Sponsoring Organizations of the Treadway Commission (COSO). Entegris, Inc.’s management is responsible for these consolidated financial statements, for maintaining effective internal control over financial reporting, and for its assessment of the effectiveness of internal control over financial reporting, included in the accompanying Item 9A.(b) Management’s Report on Internal Control Over Financial Reporting. Our responsibility is to express an opinion on these consolidated financial statements and an opinion on the Company’s internal control over financial reporting based on our audits.
We conducted our audits in accordance with the standards of the Public Company Accounting Oversight Board (United States). Those standards require that we plan and perform the audits to obtain reasonable assurance about whether the financial statements are free of material misstatement and whether effective internal control over financial reporting was maintained in all material respects. Our audits of the consolidated financial statements included examining, on a test basis, evidence supporting the amounts and disclosures in the financial statements, assessing the accounting principles used and significant estimates made by management, and evaluating the overall financial statement presentation. Our audit of internal control over financial reporting included obtaining an understanding of internal control over financial reporting, assessing the risk that a material weakness exists, and testing and evaluating the design and operating effectiveness of internal control based on the assessed risk. Our audits also included performing such other procedures as we considered necessary in the circumstances. We believe that our audits provide a reasonable basis for our opinions.
A company’s internal control over financial reporting is a process designed to provide reasonable assurance regarding the reliability of financial reporting and the preparation of financial statements for external purposes in accordance with generally accepted accounting principles. A company’s internal control over financial reporting includes those policies and procedures that (1) pertain to the maintenance of records that, in reasonable detail, accurately and fairly reflect the transactions and dispositions of the assets of the company; (2) provide reasonable assurance that transactions are recorded as necessary to permit preparation of financial statements in accordance with generally accepted accounting principles, and that receipts and expenditures of the company are being made only in accordance with authorizations of management and directors of the company; and (3) provide reasonable assurance regarding prevention or timely detection of unauthorized acquisition, use, or disposition of the company’s assets that could have a material effect on the financial statements.
Because of its inherent limitations, internal control over financial reporting may not prevent or detect misstatements. Also, projections of any evaluation of effectiveness to future periods are subject to the risk that controls may become inadequate because of changes in conditions, or that the degree of compliance with the policies or procedures may deteriorate.
In our opinion, the consolidated financial statements referred to above present fairly, in all material respects, the financial position of Entegris, Inc. and subsidiaries as of December 31, 2009 and 2008, and the results of their operations and their cash flows for each of the years in the three-year period ended December 31, 2009, in conformity with U.S. generally accepted accounting principles. Also in our opinion, Entegris, Inc. maintained, in all material respects, effective internal control over financial reporting as of December 31, 2009, based on criteria established in Internal Control—Integrated Framework issued by the Committee of Sponsoring Organizations of the Treadway Commission.
/s/ KPMG LLP
Minneapolis, Minnesota
February 25, 2010
F-2
Table of Contents
ENTEGRIS, INC. AND SUBSIDIARIES
CONSOLIDATED BALANCE SHEETS
| (In thousands, except share data) |
December 31, 2009 | December 31, 2008 | ||||||
| ASSETS |
||||||||
| Current assets: |
||||||||
| Cash and cash equivalents |
$ | 68,700 | $ | 115,033 | ||||
| Trade accounts and notes receivable, net |
91,122 | 70,535 | ||||||
| Inventories |
83,233 | 102,189 | ||||||
| Deferred tax assets, deferred tax charges and refundable income taxes |
11,085 | 14,661 | ||||||
| Assets held for sale |
5,998 | 2,450 | ||||||
| Other current assets |
7,320 | 8,260 | ||||||
| Total current assets |
267,458 | 313,128 | ||||||
| Property, plant and equipment, net |
135,431 | 159,738 | ||||||
| Other assets: |
||||||||
| Investments |
7,002 | 14,003 | ||||||
| Other intangible assets, net |
78,470 | 93,139 | ||||||
| Deferred tax assets and other noncurrent tax assets |
9,670 | 13,315 | ||||||
| Other |
6,641 | 4,501 | ||||||
| Total assets |
$ | 504,672 | $ | 597,824 | ||||
| LIABILITIES AND EQUITY |
||||||||
| Current liabilities: |
||||||||
| Current maturities of long-term debt |
$ | 11,257 | $ | 13,166 | ||||
| Short-term borrowings |
8,039 | — | ||||||
| Accounts payable |
23,553 | 21,782 | ||||||
| Accrued liabilities |
29,832 | 36,971 | ||||||
| Deferred tax liabilities and income taxes payable |
1,229 | 7,437 | ||||||
| Total current liabilities |
73,910 | 79,356 | ||||||
| Long-term debt, less current maturities |
52,492 | 150,516 | ||||||
| Pension benefit obligations and other liabilities |
22,055 | 24,559 | ||||||
| Deferred tax liabilities and other noncurrent tax liabilities |
6,558 | 7,223 | ||||||
| Commitments and contingent liabilities |
— | — | ||||||
| Equity: |
||||||||
| Preferred stock, par value $.01; 5,000,000 shares authorized; none issued and outstanding as of December 31, 2009 and 2008 |
— | — | ||||||
| Common stock, par value $.01; 400,000,000 shares authorized; issued and outstanding shares: 130,043,483 and 113,101,535 |
1,300 | 1,131 | ||||||
| Additional paid-in capital |
751,360 | 684,974 | ||||||
| Retained deficit |
(433,968 | ) | (376,247 | ) | ||||
| Accumulated other comprehensive income |
27,500 | 26,312 | ||||||
| Total Entegris, Inc. shareholders’ equity |
346,192 | 336,170 | ||||||
| Noncontrolling interest |
3,465 | — | ||||||
| Total equity |
349,657 | 336,170 | ||||||
| Total liabilities and equity |
$ | 504,672 | $ | 597,824 | ||||
See the accompanying notes to consolidated financial statements.
F-3
Table of Contents
ENTEGRIS, INC. AND SUBSIDIARIES
CONSOLIDATED STATEMENTS OF OPERATIONS
| (In thousands, except per share data) |
Year ended December 31, 2009 |
Year ended December 31, 2008 |
Year ended December 31, 2007 |
|||||||||
| Net sales |
$ | 398,644 | $ | 554,699 | $ | 626,238 | ||||||
| Cost of sales |
260,832 | 343,184 | 360,001 | |||||||||
| Gross profit |
137,812 | 211,515 | 266,237 | |||||||||
| Selling, general and administrative expenses |
117,001 | 147,531 | 163,918 | |||||||||
| Engineering, research and development expenses |
35,039 | 40,086 | 39,727 | |||||||||
| Amortization of intangible assets |
19,237 | 19,585 | 18,874 | |||||||||
| Impairment of goodwill |
— | 473,799 | — | |||||||||
| Restructuring charges |
15,463 | 10,423 | — | |||||||||
| Operating (loss) profit |
(48,928 | ) | (479,909 | ) | 43,718 | |||||||
| Interest expense (income), net |
9,215 | 1,018 | (5,245 | ) | ||||||||
| Other expense (income), net |
1,745 | 15,486 | (7,656 | ) | ||||||||
| (Loss) income before income taxes and equity in net loss (earnings) of affiliates |
(59,888 | ) | (496,413 | ) | 56,619 | |||||||
| Income tax (benefit) expense |
(2,996 | ) | 19,201 | 10,356 | ||||||||
| Equity in net loss (earnings) of affiliates |
867 | 283 | (93 | ) | ||||||||
| (Loss) income from continuing operations |
(57,759 | ) | (515,897 | ) | 46,356 | |||||||
| Loss from operations of discontinued businesses, net of taxes |
— | (1,105 | ) | (891 | ) | |||||||
| Impairment loss on assets of discontinued businesses, net of taxes |
— | — | (1,106 | ) | ||||||||
| Loss from discontinued operations, net of taxes |
— | (1,105 | ) | (1,997 | ) | |||||||
| Net (loss) income |
(57,759 | ) | (517,002 | ) | 44,359 | |||||||
| Less net loss attributable to the noncontrolling interest |
38 | — | — | |||||||||
| Net loss attributable to Entegris, Inc. |
$ | (57,721 | ) | $ | (517,002 | ) | $ | 44,359 | ||||
| Amounts attributable to Entegris, Inc. |
||||||||||||
| (Loss) income from continuing operations, net of tax |
$ | (57,721 | ) | $ | (515,897 | ) | $ | 46,356 | ||||
| Loss from discontinued operations, net of tax |
— | (1,105 | ) | (1,997 | ) | |||||||
| Net (loss) income attributable to Entegris, Inc. |
$ | (57,721 | ) | $ | (517,002 | ) | $ | 44,359 | ||||
| Basic (loss) earnings attributable to Entegris, Inc. per common share: |
||||||||||||
| Continuing operations |
$ | (0.49 | ) | $ | (4.58 | ) | $ | 0.37 | ||||
| Discontinued operations |
— | (0.01 | ) | (0.02 | ) | |||||||
| Net (loss) income |
$ | (0.49 | ) | $ | (4.59 | ) | $ | 0.36 | ||||
| Diluted (loss) earnings attributable to Entegris, Inc. per common share: |
||||||||||||
| Continuing operations |
$ | (0.49 | ) | $ | (4.58 | ) | $ | 0.37 | ||||
| Discontinued operations |
— | (0.01 | ) | (0.02 | ) | |||||||
| Net (loss) income |
$ | (0.49 | ) | $ | (4.59 | ) | $ | 0.35 | ||||
| Weighted shares outstanding |
||||||||||||
| Basic |
117,321 | 112,653 | 124,339 | |||||||||
| Diluted |
117,321 | 112,653 | 126,258 | |||||||||
See the accompanying notes to consolidated financial statements.
F-4
Table of Contents
ENTEGRIS, INC. AND SUBSIDIARIES
CONSOLIDATED STATEMENTS OF EQUITY AND COMPREHENSIVE INCOME (LOSS)
| (In thousands) |
Common shares outstanding |
Common stock |
Additional paid-in capital |
Prepaid Forward contract for Share Repurchase |
Retained earnings |
Accumulated other comprehensive income (loss) |
Noncontrolling interest |
Total | Comprehensive income (loss) |
||||||||||||||||||||||||||
| Balance at December 31, 2006 |
132,771 | $ | 1,328 | $ | 793,058 | $ | (5,000 | ) | $ | 228,936 | $ | (2,342 | ) | $ | — | $ | 1,015,980 | ||||||||||||||||||
| Adjustment upon adoption of change in accounting for income taxes |
— | — | — | — | 1,110 | — | — | 1,110 | |||||||||||||||||||||||||||
| Adjusted beginning balance |
132,771 | $ | 1,328 | $ | 793,058 | $ | (5,000 | ) | $ | 230,046 | $ | (2,342 | ) | $ | — | 1,017,090 | |||||||||||||||||||
| Shares issued under employee stock plans |
4,573 | 46 | 29,810 | — | — | — | — | 29,856 | |||||||||||||||||||||||||||
| Share-based compensation expense |
— | 10,344 | — | — | — | — | 10,344 | ||||||||||||||||||||||||||||
| Repurchase and retirement of common stock |
(21,988 | ) | (220 | ) | (131,946 | ) | 5,000 | (128,943 | ) | — | — | (256,109 | ) | ||||||||||||||||||||||
| Tax benefit associated with stock plans |
— | — | 244 | — | — | — | — | 244 | |||||||||||||||||||||||||||
| Foreign currency translation |
— | — | — | — | — | 7,383 | — | 7,383 | 7,383 | ||||||||||||||||||||||||||
| Net change in unrealized gain on marketable securities, net of tax |
— | — | — | — | — | (135 | ) | — | (135 | ) | (135 | ) | |||||||||||||||||||||||
| Minimum pension liability adjustment |
— | — | — | — | — | (723 | ) | — | (723 | ) | (723 | ) | |||||||||||||||||||||||
| Net income |
— | — | — | — | 44,359 | — | — | 44,359 | 44,359 | ||||||||||||||||||||||||||
| Total comprehensive income |
$ | 50,884 | |||||||||||||||||||||||||||||||||
| Balance at December 31, 2007 |
115,356 | $ | 1,154 | $ | 701,510 | $ | — | $ | 145,462 | $ | 4,183 | $ | — | $ | 852,309 | ||||||||||||||||||||
| Shares issued under employee stock plans |
1,717 | 17 | 3,080 | — | — | — | — | 3,097 | |||||||||||||||||||||||||||
| Share-based compensation expense |
— | 7,024 | — | — | — | — | 7,024 | ||||||||||||||||||||||||||||
| Repurchase and retirement of common stock |
(3,971 | ) | (40 | ) | (24,148 | ) | — | (4,707 | ) | — | — | (28,895 | ) | ||||||||||||||||||||||
| Tax shortfall associated with stock plans |
— | — | (2,492 | ) | — | — | — | — | (2,492 | ) | |||||||||||||||||||||||||
| Foreign currency translation |
— | — | — | — | — | 23,139 | — | 23,139 | 23,139 | ||||||||||||||||||||||||||
| Minimum pension liability adjustment |
— | — | — | — | — | (1,010 | ) | — | (1,010 | ) | (1,010 | ) | |||||||||||||||||||||||
| Net loss |
— | — | — | — | (517,002 | ) | — | — | (517,002 | ) | (517,002 | ) | |||||||||||||||||||||||
| Total comprehensive loss |
$ | (494,873 | ) | ||||||||||||||||||||||||||||||||
| Balance at December 31, 2008 |
113,102 | $ | 1,131 | $ | 684,974 | $ | — | $ | (376,247 | ) | $ | 26,312 | $ | — | $ | 336,170 | |||||||||||||||||||
| Shares issued under stock plans |
841 | 8 | 1,272 | — | — | — | — | 1,280 | |||||||||||||||||||||||||||
| Shares issued under stock offering |
16,100 | 161 | 56,477 | — | — | — | — | 56,638 | |||||||||||||||||||||||||||
| Share-based compensation expense |
— | — | 8,102 | — | — | — | — | 8,102 | |||||||||||||||||||||||||||
| Tax benefit associated with stock plans |
— | — | 535 | — | — | — | — | 535 | |||||||||||||||||||||||||||
| Recognition of noncontrolling interest upon acquisition of business |
— | — | — | — | — | — | 3,246 | 3,246 | |||||||||||||||||||||||||||
| Reclassification of foreign currency translation associated with acquisition of business |
— | — | — | — | — | 756 | — | 756 | 756 | ||||||||||||||||||||||||||
| Foreign currency translation |
— | — | — | — | — | 784 | 257 | 1,041 | 1,041 | ||||||||||||||||||||||||||
| Minimum pension liability adjustment |
— | — | — | — | — | (352 | ) | — | (352 | ) | (352 | ) | |||||||||||||||||||||||
| Net loss |
— | — | — | — | (57,721 | ) | — | (38 | ) | (57,759 | ) | (57,759 | ) | ||||||||||||||||||||||
| Total comprehensive loss |
$ | (56,314 | ) | ||||||||||||||||||||||||||||||||
| Balance at December 31, 2009 |
130,043 | $ | 1,300 | $ | 751,360 | $ | — | $ | (433,968 | ) | $ | 27,500 | $ | 3,465 | $ | 349,657 | |||||||||||||||||||
F-5
Table of Contents
ENTEGRIS, INC. AND SUBSIDIARIES
CONSOLIDATED STATEMENTS OF EQUITY AND COMPREHENSIVE INCOME (LOSS)
The accumulated balances for each component of accumulated other comprehensive income (loss) are as follows:
| (In thousands) |
Foreign currency translation |
Net unrealized gain (loss) on marketable securities |
Minimum pension liability adjustment |
Total accumulated other comprehensive income (loss) |
||||||||||||
| Balance at December 31, 2006 |
$ | (2,249 | ) | $ | 135 | $ | (228 | ) | $ | (2,342 | ) | |||||
| Foreign currency translation |
7,383 | — | — | 7,383 | ||||||||||||
| Change in unrealized gain on marketable securities, net of tax of $83 |
— | (135 | ) | — | (135 | ) | ||||||||||
| Minimum pension liability adjustment, net of tax of $522 |
— | — | (723 | ) | (723 | ) | ||||||||||
| Balance at December 31, 2007 |
$ | 5,134 | $ | — | $ | (951 | ) | $ | 4,183 | |||||||
| Foreign currency translation |
23,139 | — | — | 23,139 | ||||||||||||
| Minimum pension liability adjustment, net of tax of $648 |
— | — | (1,010 | ) | (1,010 | ) | ||||||||||
| Balance at December 31, 2008 |
$ | 28,273 | $ | — | $ | (1,961 | ) | $ | 26,312 | |||||||
| Foreign currency translation |
784 | — | — | 784 | ||||||||||||
| Minimum pension liability adjustment, net of tax of $183 |
— | — | (352 | ) | (352 | ) | ||||||||||
| Reclassification of foreign currency translation associated with acquisition of business |
756 | — | — | 756 | ||||||||||||
| Balance at December 31, 2009 |
$ | 29,813 | $ | — | $ | (2,313 | ) | $ | 27,500 | |||||||
See the accompanying notes to consolidated financial statements
F-6
Table of Contents
ENTEGRIS, INC. AND SUBSIDIARIES
CONSOLIDATED STATEMENTS OF CASH FLOWS
| (In thousands) |
Year ended December 31, 2009 |
Year ended December 31, 2008 |
Year ended December 31, 2007 |
|||||||||
| Operating activities: |
||||||||||||
| Net (loss) income |
$ | (57,759 | ) | $ | (517,002 | ) | $ | 44,359 | ||||
| Adjustments to reconcile net income (loss) to net cash provided by operating activities: |
||||||||||||
| Loss (income) from discontinued operations |
— | 1,105 | 1,997 | |||||||||
| Depreciation |
30,890 | 26,758 | 24,902 | |||||||||
| Amortization |
19,237 | 19,585 | 18,874 | |||||||||
| Stock-based compensation expense |
8,102 | 7,024 | 10,344 | |||||||||
| Impairment of property and equipment |
1,184 | 1,388 | 4,098 | |||||||||
| Impairment of goodwill |
— | 473,799 | — | |||||||||
| Impairment of intangibles |
— | — | 235 | |||||||||
| Impairment of equity investments |
1,000 | 11,698 | — | |||||||||
| Provision for doubtful accounts |
313 | 697 | (227 | ) | ||||||||
| Deferred tax valuation allowance |
16,579 | 42,093 | — | |||||||||
| Provision for deferred income taxes |
(18,258 | ) | (26,443 | ) | (20,434 | ) | ||||||
| Charge for fair value mark-up of acquired inventory sold |
4,553 | 13,519 | 836 | |||||||||
| Provision for excess and obsolete inventory |
4,871 | 4,899 | 7,130 | |||||||||
| Excess tax benefit from employee stock plans |
— | — | (244 | ) | ||||||||
| Equity in net loss (earnings) of affiliates |
867 | 283 | (93 | ) | ||||||||
| Gain on sale of property and equipment |
30 | (63 | ) | (274 | ) | |||||||
| Gain on sale of equity investments |
— | — | (6,068 | ) | ||||||||
| Amortization of debt issuance costs |
2,086 | — | — | |||||||||
| Loss recognized as a result of remeasuring to fair value the equity interest in the acquiree held by the Company before the business combination |
(205 | ) | — | — | ||||||||
| Net loss attributable to noncontrolling interest |
38 | — | — | |||||||||
| Changes in operating assets and liabilities, excluding effects of acquisitions: |
||||||||||||
| Trade accounts receivable and notes receivable |
(19,203 | ) | 53,355 | 20,054 | ||||||||
| Inventories |
10,679 | (2,977 | ) | 16,931 | ||||||||
| Accounts payable and accrued liabilities |
(1,579 | ) | (35,523 | ) | (2,935 | ) | ||||||
| Other current assets |
1,662 | 1,195 | (1,695 | ) | ||||||||
| Income taxes payable and refundable income taxes |
481 | (18,873 | ) | 14,682 | ||||||||
| Other |
(1,375 | ) | 9,743 | (455 | ) | |||||||
| Net cash provided by operating activities |
4,193 | 66,260 | 132,017 | |||||||||
| Investing activities: |
||||||||||||
| Acquisition of property and equipment |
(13,162 | ) | (26,987 | ) | (26,919 | ) | ||||||
| Acquisition of businesses, net of cash acquired |
493 | (162,852 | ) | (44,911 | ) | |||||||
| Proceeds from sales of property and equipment |
512 | 900 | 2,021 | |||||||||
| Proceeds from sale of assets held for sale |
2,314 | — | — | |||||||||
| Proceeds from sale of equity investments |
— | — | 6,568 | |||||||||
| Purchase of equity investments |
— | (10,982 | ) | (6,126 | ) | |||||||
| Purchases of short-term investments |
— | — | (269,822 | ) | ||||||||
| Proceeds from sale or maturities of short-term investments |
— | — | 390,915 | |||||||||
| Other |
— | — | (926 | ) | ||||||||
| Net cash (used in) provided by investing activities |
(9,843 | ) | (199,921 | ) | 50,800 | |||||||
| Financing activities: |
||||||||||||
| Principal payments on short-term borrowings and long-term debt |
(799,645 | ) | (64,707 | ) | (88,115 | ) | ||||||
| Proceeds from short-term borrowings and long-term debt |
704,675 | 173,811 | 131,063 | |||||||||
| Proceeds from stock offering, net of offering costs |
56,638 | — | — | |||||||||
| Repurchase and retirement of common stock |
— | (28,895 | ) | (256,109 | ) | |||||||
| Excess tax benefit from employee stock plans |
— | — | 244 | |||||||||
| Payment for debt issuance costs |
(3,638 | ) | (625 | ) | — | |||||||
| Issuance of common stock |
1,280 | 3,097 | 29,856 | |||||||||
| Net cash provided by (used in) financing activities |
(40,690 | ) | 82,681 | (183,061 | ) | |||||||
| Discontinued operations: |
||||||||||||
| Net cash (used in) provided by operating activities |
— | (1,878 | ) | 1,237 | ||||||||
| Net cash provided by investing activities |
— | 735 | — | |||||||||
| Net cash (used in) provided by discontinued operations |
— | (1,143 | ) | 1,237 | ||||||||
| Effect of exchange rate changes on cash and cash equivalents |
7 | 6,501 | 4,856 | |||||||||
| (Decrease) increase in cash and cash equivalents |
(46,333 | ) | (45,622 | ) | 5,849 | |||||||
| Cash and cash equivalents at beginning of period |
115,033 | 160,655 | 154,806 | |||||||||
| Cash and cash equivalents at end of period |
$ | 68,700 | $ | 115,033 | $ | 160,655 | ||||||
F-7
Table of Contents
Supplemental Cash Flow Information
| (In thousands) |
Year ended December 31, 2009 |
Year ended December 31, 2008 |
Year ended December 31, 2007 | |||||||
| Non-cash transactions: |
||||||||||
| Equipment purchases in accounts payable |
$ | 405 | $ | 4,737 | $ | 1,198 | ||||
| Acquisition of a business through the use of a seller’s note |
$ | 3,221 | — | — | ||||||
| Schedule of interest and income taxes paid: |
||||||||||
| Interest paid |
$ | 7,492 | $ | 4,719 | $ | 691 | ||||
| Income taxes, net of refunds received |
$ | (2,794 | ) | $ | 23,300 | $ | 3,794 | |||
See accompanying notes to consolidated financial statements.
F-8
Table of Contents
NOTES TO CONSOLIDATED FINANCIAL STATEMENTS
(1) SUMMARY OF SIGNIFICANT ACCOUNTING POLICIES
Nature of Operations and Principles of Consolidation Entegris is a leading provider of products and services that purify, protect and transport the critical materials used in key technology-driven industries, primarily the semiconductor and related industries.
The consolidated financial statements include the accounts of the Company and its majority-owned subsidiaries. Intercompany profits, transactions and balances have been eliminated in consolidation.
Use of Estimates and Risks and Uncertainties The preparation of consolidated financial statements in conformity with accounting principles generally accepted in the United States requires management to make estimates and assumptions that affect the reported amounts of assets and liabilities, particularly receivables, inventories, property, plant and equipment, and intangibles, accrued expenses and income taxes and related accounts, and disclosure of contingent assets and liabilities at the date of the consolidated financial statements and the reported amounts of revenues and expenses during the reporting period. Actual results could differ from those estimates. See Note 2 to the consolidated financial statements as to the use of estimates in connection with the Company’s review of its long-lived assets.
Concentrations of Suppliers Certain materials included in the Company’s products are obtained from a single source or a limited group of suppliers. Although the Company seeks to reduce dependence on those sole and limited source suppliers, the partial or complete loss of these sources could have at least a temporary adverse effect on the Company’s results of operations. Furthermore, a significant increase in the price of one or more of these components could adversely affect the Company’s results of operations.
Share-based Compensation The Company measures the cost of employee services received in exchange for the award of equity instruments based on the fair value of the award at the date of grant. The cost is recognized over the period during which an employee is required to provide services in exchange for the award.
Cash, Cash Equivalents and Short-term Investments Cash and cash equivalents include cash on hand and highly liquid debt securities with original maturities of three months or less, which are valued at cost which approximates fair value. Debt securities with original maturities greater than three months and remaining maturities of less than one year are classified and accounted for as available for sale and are recorded at fair value, and are classified as short-term investments.
Allowance for Doubtful Accounts An allowance for uncollectible trade receivables is estimated based on a combination of write-off history, aging analysis and any specific, known troubled accounts.
Inventories Inventories are stated at the lower of cost or market. Cost is generally determined by the first-in, first-out (FIFO) method.
Property, Plant, and Equipment Property, plant and equipment are carried at cost and are depreciated principally on the straight-line method over the estimated useful lives of the assets. When assets are retired or disposed of, the cost and related accumulated depreciation are removed from the accounts, and gains or losses are recognized in the same period. Maintenance and repairs are expensed as incurred; significant additions and improvements are capitalized. Property, plant and equipment are reviewed for impairment whenever events or changes in circumstances indicate that the carrying amount of an asset or group of asset(s) may not be recoverable based on estimated future undiscounted cash flows. The amount of impairment, if any, is measured as the difference between the net book value and the estimated fair value of the asset(s).
F-9
Table of Contents
Investments The Company’s nonmarketable investments are accounted for under either the cost or equity method of accounting, as appropriate. All equity investments are periodically reviewed to determine whether declines, if any, in fair value below cost basis are other-than-temporary. If the decline in fair value is determined to be other-than-temporary, an impairment loss is recorded and the investment written down to a new cost basis.
Fair Value of Financial Instruments The carrying value of cash equivalents, accounts receivable, accounts payable and short-term debt approximates fair value due to the short maturity of those instruments. The carrying value of long-term debt approximates fair value due to the short maturity and variable interest rates of virtually all of those instruments.
Goodwill and Other Intangible Assets Goodwill is the excess of the purchase price over the fair value of net assets of acquired businesses. When present, goodwill is not amortized, but is tested for impairment at least annually. Other amortizable intangible assets include, among other items, patents, unpatented and other developed technology and customer-based intangibles, and are amortized using the straight-line method over their respective estimated useful lives of 3 to 15 years. The Company reviews intangible assets for impairment if changes in circumstances or the occurrence of events suggest the remaining value may not be recoverable.
Derivative Financial Instruments The Company records derivatives as assets or liabilities on the balance sheet and measures such instruments at fair value. Changes in fair value of derivatives are recorded each period in current results of operations or other comprehensive income, depending on whether the derivative is designated as part of a hedge transaction.
The Company periodically enters into forward foreign currency contracts to reduce exposures relating to rate changes in certain foreign currencies. Certain exposures to credit losses related to counterparty nonperformance exist. However, the Company does not anticipate nonperformance by the counterparties since they are large, well-established financial institutions. Except as described in the following paragraph, none of these derivatives is accounted for as a hedge transaction. Accordingly, changes in the fair value of forward foreign currency contracts are recorded as a component of net income. The fair values of the Company’s derivative financial instruments are based on prices quoted by financial institutions for these instruments. The Company was a party to forward foreign currency contracts with notional amounts of $0 and $1.8 million at December 31, 2009 and 2008, respectively.
On February 6, 2007, the Company entered into a 10-month Japanese yen-based cross-currency interest rate swap, with aggregate notional principal amounts of 2.4 billion Japanese yen and $20 million that matured on November 30, 2007. This swap effectively hedged a portion of the Company’s net investment in its Japanese subsidiary. During the term of this transaction, the Company remitted to, and received from, its counterparty interest payments based on rates that were reset quarterly equal to three-month Japanese LIBOR and three-month U.S. LIBOR rates, respectively. The Company designated this hedging instrument as a hedge of a portion of the net investment in its Japanese subsidiary, and used the spot rate method of accounting to value changes of the hedging instrument attributable to currency rate fluctuations. As such, a $2.1 million adjustment in the fair market value of the hedging instrument related to changes in the spot rate was recorded as a charge to “Foreign currency translation” in equity in 2007 to offset changes in a portion of the yen-denominated net investment in the Company’s Japanese subsidiary and will remain there until the net investment is disposed. The Company recorded $0.7 million in net interest income in 2007 in connection with the cross-currency interest rate swap.
Foreign Currency Translation Assets and liabilities of foreign subsidiaries are translated from foreign currencies into U.S. dollars at period-end exchange rates, and the resulting gains and losses arising from translation of net assets located outside the U.S. are recorded as a cumulative translation adjustment, a component of accumulated other comprehensive income (loss) in the consolidated balance sheets. Income statement amounts are translated at the weighted average exchange rates for the year. Translation adjustments are not adjusted for income taxes as substantially all translation adjustments relate to permanent investments in non-U.S. subsidiaries. Gains and losses resulting from foreign currency transactions are included in other income, net in the consolidated statements of operations.
F-10
Table of Contents
Revenue Recognition/Concentration of Risk Revenue and the related cost of sales are generally recognized upon shipment of the products. Revenue for product sales is recognized upon delivery, when persuasive evidence of an arrangement exists, when title and risk of loss have been transferred to the customer, collectability is reasonably assured, and pricing is fixed or determinable. Shipping and handling fees related to sales transactions are billed to customers and are recorded as sales revenue. Shipping and handling costs incurred are recorded in cost of sales.
The Company provides for estimated returns and warranty obligations when the revenue is recorded. The Company sells its products throughout the world primarily to companies in the microelectronics industry. The Company performs continuing credit evaluations of its customers and generally does not require collateral. Letters of credit may be required from its customers in certain circumstances. The Company maintains an allowance for doubtful accounts that management believes is adequate to cover losses on trade receivables.
The Company collects various sales and value-added taxes on certain product and service sales that are accounted for on a net basis.
Income Taxes Deferred income taxes are provided in amounts sufficient to give effect to temporary differences between financial and tax reporting. The Company accounts for tax credits as reductions of income tax expense. The Company utilizes the asset and liability method for computing its deferred income taxes. Under the asset and liability method, deferred tax assets and liabilities are based on the temporary difference between the financial statement and tax basis of assets and liabilities and the enacted tax rates expected to apply to taxable income in the years in which these temporary differences are expected to be recovered or settled. The effect on deferred tax assets and liabilities of a change in tax rates is recognized in income in the period that includes the enactment date.
The Company has significant amounts of deferred tax assets. Management reviews its deferred tax assets for recoverability on a quarterly basis and assesses the need for valuation allowances. These deferred tax assets are evaluated jurisdictionally, by considering historical levels of income, future reversal of existing taxable temporary differences, taxable income in carryback years where permitted, estimates of future taxable income streams and the impact of tax planning strategies. A valuation allowance is recorded to reduce deferred tax assets when it is determined that it is more likely than not that the Company would not be able to realize all or part of its deferred tax assets based on all available evidence.
Except as indicated in Note 16 to the consolidated financial statements as relates to 2.0 billion yen (approximately $22 million), the Company intends to continue to reinvest its remaining undistributed international earnings in its international operations indefinitely; therefore, no U.S. tax expense has been recorded to cover the repatriation of such undistributed earnings.
The Company’s policy for recording interest and penalties associated with audits and unrecognized tax benefits is to record such items as a component of income before taxes. Penalties are recorded in other expense and interest to be paid or received is recorded in interest expense or interest income, respectively, in the statement of operations.
Comprehensive Income (Loss) Comprehensive income (loss) represents the change in shareholders’ equity resulting from items other than shareholder investments and distributions. The Company’s foreign currency translation adjustments, unrealized gains and losses on marketable securities and minimum pension liability adjustments are included in accumulated other comprehensive income (loss). Comprehensive income (loss) and the components of accumulated other comprehensive income (loss) are presented in the accompanying consolidated statements of equity and comprehensive income (loss).
F-11
Table of Contents
Recent Accounting Pronouncements
Accounting Standards Codification™
In June 2009, the Financial Accounting Standards Board (FASB) issued Accounting Standards Update (ASU) No. 2009-01, Generally Accepted Accounting Principles (ASC Topic 105) which establishes the FASB Accounting Standards Codification (the Codification or ASC) as the official single source of authoritative U.S. generally accepted accounting principles (GAAP). All existing accounting standards are superseded. All other accounting guidance not included in the Codification will be considered non-authoritative. The Codification also includes all relevant Securities and Exchange Commission (SEC) guidance organized using the same topical structure in separate sections within the Codification.
Following the Codification, the Board will not issue new standards in the form of Statements, FASB Staff Positions or Emerging Issues Task Force Abstracts. Instead, it will issue Accounting Standards Updates (ASU) which will serve to update the Codification, provide background information about the guidance and provide the basis for conclusions on the changes to the Codification.
The Codification is not intended to change GAAP, but it will change the way GAAP is organized and presented. The Codification is effective for the Company’s condensed consolidated financial statements as of and for the period ended September 26, 2009 and the principal impact on the financial statements is limited to disclosures as all future references to authoritative accounting literature will be referenced in accordance with the Codification. In order to ease the transition to the Codification, the Company is providing the Codification cross-reference alongside the references to the standards issued and adopted prior to the adoption of the Codification.
In December 2007, the FASB issued SFAS No. 141 (revised 2007) Business Combinations (ASC Topic 805). This guidance retains the fundamental requirements of the original pronouncement requiring that the purchase method be used for all business combinations and defines the acquirer as the entity that obtains control of one or more businesses in the business combination, establishes the acquisition date as the date that the acquirer achieves control and requires the acquirer to recognize the assets acquired, liabilities assumed and any noncontrolling interest at their fair values as of the acquisition date. The guidance also requires that acquisition-related costs be recognized separately from the acquisition. This guidance was effective for the Company in the first quarter of 2009 and was followed by the Company in its accounting for the acquisition described in Note 3 to consolidated financial statements.
In December 2007, the FASB issued Statement No. 160, Noncontrolling Interests in Consolidated Financial Statements (ASC Topic 810). This guidance clarifies that a noncontrolling interest in a subsidiary should be reported as equity in the consolidated financial statements. Consolidated net income should include the net income for both the parent and the noncontrolling interest with disclosure of both amounts on the consolidated statement of operations. The calculation of earnings per share will continue to be based on income amounts attributable to the parent. This guidance was effective for the Company in the first quarter of 2009 and was followed by the Company in its accounting for the acquisition described in Note 3 to consolidated financial statements.
In May 2009, the FASB issued SFAS No. 165, Subsequent Events (ASC Topic 855). This guidance establishes general standards of accounting for and disclosure of events that occur after the balance sheet date but before financial statements are issued or are available to be issued. This guidance was effective for the Company in the second quarter of 2009 and its adoption did not have a material impact on the Company’s consolidated financial statements.
In June 2009, the FASB issued SFAS No. 167, Amendments to FASB Interpretation No 46(R) (ASC Topic 810). This guidance amends certain requirements to improve financial reporting by enterprises involved with variable interest entities and to provide more relevant and reliable information to users of financial statements. This guidance is effective for the Company in 2010. The Company does not expect its adoption to have a material effect on the Company’s consolidated financial statements.
F-12
Table of Contents
In October 2009, the FASB issued the following ASU No. 2009-13, Revenue Recognition (ASC Topic 605)—Multiple-Deliverable Revenue Arrangements, a consensus of the FASB Emerging Issues Task Force. This guidance modifies the fair value requirements of ASC subtopic 605-25 Revenue Recognition-Multiple Element Arrangements by allowing the use of the “best estimate of selling price” for determining the selling price of a deliverable. A vendor is now required to use its best estimate of the selling price when vendor specific objective evidence or third-party evidence of the selling price cannot be determined. In addition, the residual method of allocating arrangement consideration is no longer permitted. This guidance is effective for the Company in 2011. The Company is currently evaluating the impact of adopting this update on its consolidated financial statements.
(2) IMPAIRMENT REVIEW OF GOODWILL AND LONG-LIVED ASSETS
In accordance accounting principles generally accepted in the United States, the Company tested for impairment its goodwill in connection with its annual impairment test of goodwill as of August 31, 2008, and due to events and changes in circumstances through the end of the third and fourth quarters of the year ended December 31, 2008, the Company had additional triggering events that indicated impairments had occurred. In addition, the Company tested its long-lived assets (principally property, plant and equipment and intangibles) for possible impairment.
The factors deemed by management to have collectively constituted impairment triggering events included a significant decrease in the Company’s market capitalization as of its annual impairment date, December 31, 2008 and March 28, 2009, which was significantly below the recorded value of its consolidated net assets, and a significant decline in the current and forecasted business levels. As a result of the impairment assessments, the Company recorded goodwill impairment charges of $379.8 million and $94.0 million in the third and fourth quarters, respectively, of the year ended December 31, 2008. In connection with triggering events during the third and fourth quarters of 2008 and the first quarter of 2009, the Company reviewed its long-lived assets and determined that none of its long-lived assets were impaired for its asset groups.
Goodwill
The Company assesses goodwill for impairment annually as of August 31, and when an event occurs or circumstances change that would indicate that the asset might be impaired. Goodwill is tested for impairment using a two-step process. In the first step, the fair value of each reporting unit is compared to its carrying value. For purposes of assessing impairment, the Company was a single reporting unit through December 31, 2008. If the fair value of the reporting unit exceeds the carrying value of its net assets, goodwill is considered not impaired, and no further testing is required. If the carrying value of the net assets exceeds the fair value of a reporting unit, a second step of the impairment assessment is performed in order to determine the implied fair value of a reporting unit’s goodwill. Determining the implied fair value of goodwill requires a valuation of the reporting unit’s tangible and intangible assets and liabilities in a manner similar to the allocation of purchase price in a business combination. If the carrying value of the reporting unit’s goodwill exceeds the implied fair value of its goodwill, goodwill is deemed impaired and is written down to the extent of the difference.
Throughout fiscal 2008, the Company experienced a sustained and significant decline in its stock price. As a result of the decline in stock price and a significant decline in the current and forecasted business level, the Company’s market capitalization fell significantly below the recorded value of its consolidated net assets.
Based on the results of the Company’s initial assessment of impairment of its goodwill (step 1), it was determined that the consolidated carrying value of the Company exceeded its estimated fair value. Therefore, the Company performed a second step of the impairment assessment to determine the implied fair value of goodwill. In performing the goodwill assessment, the Company used current market capitalization, discounted cash flows and other factors as the best evidence of fair value. There are inherent uncertainties and management judgment required in an analysis of goodwill impairment. The Company performed the assessment of impairment of its goodwill twice during the year, once during the third quarter, resulting in write-off of $379.8 million, and during the fourth quarter, resulting in the write-off of the Company’s remaining goodwill of $94.0 million.
F-13
Table of Contents
Long-Lived Assets
In accordance with U.S. generally accepted accounting principles, the Company reviews its long-lived assets whenever events or changes in circumstances indicate that the carrying amount of such assets may not be recoverable. If the carrying amount of an asset or group of assets exceeds its fair value, the asset will be written down to its fair value. In connection with the triggering events discussed above, during the third and fourth quarters of fiscal year 2008 and the first quarter of 2009, the Company reviewed its long-lived assets and determined that none of its long-lived assets were impaired for its asset groups. The determination was based on reviewing estimated undiscounted cash flows for the Company’s asset groups, which were greater than their carrying values. As required under U.S. generally accepted accounting principles, the impairment analysis of the Company’s long-lived assets occurred before the goodwill impairment assessment during the third and fourth quarters of fiscal year 2008.
Long-lived assets are grouped with other assets and liabilities at the lowest level (asset groups) for which identifiable cash flows are largely independent of the cash flows of other assets and liabilities. The Company has four significant asset groups, identified by assessing the Company’s identifiable cash flows and the interdependence of such cash flows: Contamination Control Solutions (CCS), Microenvironments (ME), Poco Graphite (POCO) and Entegris Specialty Coatings (ESC).
The Company’s estimate of undiscounted cash flows attributable to the asset groups included only future cash flows (cash inflows less associated cash outflows) that are directly associated with and that are expected to arise as a direct result of the use and eventual disposition of the asset group. Estimates of future cash flows used to test the recoverability of a long-lived asset (asset group) incorporated the Company’s assumptions about its use of the asset group and were determined for the remaining useful life of the primary asset (the principal long-lived tangible asset being depreciated or intangible asset being amortized that is the most significant component asset from which the asset group derives its cash-flow-generating capacity) of each asset group. The key assumptions were projected revenues, gross margin expectations and operating cost estimates. Future cash flows used to test the recoverability of each asset group were made for the remaining useful life of the asset group, which itself is based on the remaining useful life of the primary asset of each group as described below. Where the primary asset is not the asset of the asset group with the longest remaining useful life, estimates of future cash flows for the group assume the sale of the group at the end of the remaining useful life of the primary asset.
The recoverability test included all cash outflows that the asset group is estimated to incur to obtain the estimated future cash inflows. Accordingly, where required, the Company reflected within the cash flows of its asset groups an allocation of corporate expenses to its asset groups, because those assets require the services provided by the Company’s shared services infrastructure (among others, finance, human resources, information technology, sales and marketing, legal) if the asset group were operated on a stand-alone basis.
Under the first quarter 2009 impairment test, all asset groups had future undiscounted cash flows in excess of their carrying values by at least 60%, except for the ME asset group, which the Company estimated had future undiscounted cash flows 27% higher than its carrying value. The carrying values of this asset group’s property, plant and equipment and intangible assets at March 28, 2009 were $42.9 million and $1.2 million, respectively. If either revenue for the Company’s asset groups decreased from the then-current forecast without offsetting decreases in costs, or if the asset group’s operating costs increased from the then-current forecast without offsetting increases in revenue, the estimated undiscounted cash flows of the asset groups could have been less than their carrying values. This would have required an impairment loss to be recognized based on the excess of the carrying amount of the respective asset group over its fair value. As noted, fair value would be determined by discounting estimated future cash flows, appraisals or other methods deemed appropriate. Actual results of the ME asset group for the nine-month period ended December 31, 2009 were better than forecast at the end of the first quarter.
The evaluation of the recoverability of long-lived assets requires the Company to make significant estimates and assumptions. These estimates and assumptions primarily include, but are not limited to, the identification of the asset group at the lowest level of independent cash flows and the primary asset of the group; and long-range forecasts of revenue, reflecting management’s assessment of general economic and industry conditions, operating income, depreciation and amortization and working capital requirements.
F-14
Table of Contents
Due to the inherent uncertainty involved in making these estimates, particularly in the current economic environment and plan for a recovery, actual results could differ from those estimates. In addition, changes in the underlying assumptions would have a significant impact on the conclusion that an asset group’s carrying value is recoverable, or the determination of any impairment charge if it was determined that the asset values were indeed impaired.
Based on slightly improved economic conditions within the semiconductor industry and the absence of any other triggering events, the Company was not required to perform impairment testing for any of its asset groups for the second, third and fourth quarters of 2009. Due to the uncertain economic environment within the semiconductor industry, the Company will continue to monitor circumstances and events to determine whether additional asset impairment testing is warranted. It is possible that in the future the Company may no longer be able to conclude that there is no impairment of its long-lived assets, nor can the Company provide assurance that material impairment charges of long-lived assets will not occur in future periods.
(3) ACQUISITIONS AND DIVESTITURES
Acquisition of Pureline Co., Ltd.
In 2007, the Company acquired a 40% ownership interest in Pureline Co., Ltd. (Pureline), a privately held company located in Munmak, South Korea and manufacturer of fluid handling products. The Company accounted for its interest in Pureline under the equity method of accounting. Concurrent with its 2007 investment in Pureline, the Company obtained an option to purchase one-half of the remaining outstanding shares of Pureline through July 31, 2009 and the remaining outstanding shares thereafter by July 31, 2010. The exercise price of such options to purchase the additional equity interest in Pureline was set at a multiple of Pureline’s calendar 2008 and 2009 adjusted earnings.
On July 31, 2009, the Company exercised its option and acquired an additional 30% equity interest in Pureline. The exercise price of the option to purchase the additional 30% equity interest was $4.3 million. The Company paid $1.1 million in cash and executed a note to the seller for $3.2 million, payable in three installments through April 2010. The addition of Pureline augments the Company’s base of business in the semiconductor industry, particularly in the growing South Korean market.
As of the date of the acquisition, the Company owned a 70% controlling interest in Pureline. Accordingly, the transaction was accounted for under the acquisition method of accounting and the results of operations of Pureline are included in the Company’s consolidated financial statements as of and since July 31, 2009.
Pureline’s sales and operating results for five months ended December 31, 2009 were not material to the Company’s consolidated financial statements. Pro forma results are not included since this acquisition does not constitute a material business combination.
The Company remeasured its previously held equity interest in Pureline at its July 31, 2009 fair value. The July 31, 2009 fair value of the equity interest in Pureline held by the Company before the acquisition date was $4.3 million. Based on the carrying value of the Company’s equity interest in Pureline before the business combination, the Company recognized a loss of $0.2 million in earnings. In prior reporting periods, the Company recognized changes in the value of its equity interest in Pureline related to translation adjustments in other comprehensive loss. Accordingly, the $0.8 million recognized previously in other comprehensive loss was reclassified and included in the calculation of the charge to earnings.
In connection with the transaction, the Company measured and recorded the fair value of the 30% noncontrolling interest in Pureline. The fair value of the noncontrolling interest in Pureline at July 31, 2009 was $3.2 million.
The purchase price has been allocated based on the fair values of all of Pureline’s assets acquired and liabilities assumed, with the noncontrolling interest associated with the 30% minority interest recognized in the Company’s consolidated balance sheet. The final valuation of net assets is expected to be completed as soon as possible, but no later than one year from the acquisition date. The review of tax assets and liabilities is still being finalized.
F-15
Table of Contents
The following table summarizes the allocation of the purchase price to the fair values of the assets at the date of acquisition:
| (In thousands): |
||||
| Accounts receivable, inventory and other assets |
$ | 5,166 | ||
| Property, plant and equipment |
5,120 | |||
| Identifiable intangible assets |
4,210 | |||
| Total assets acquired |
14,496 | |||
| Current liabilities |
(585 | ) | ||
| Long-term liabilities |
(80 | ) | ||
| Deferred tax liabilities |
(1,544 | ) | ||
| Total liabilities assumed |
(2,209 | ) | ||
| Net assets acquired |
$ | 12,287 | ||
The identifiable intangible assets included tradenames and trademarks, patents and customer relationships with estimated useful lives ranging from 9 to 15 years. The fair value of identifiable intangible assets was determined using various valuation techniques that the Company believes that market participants would use. These methods used a forecast of expected future net cash flows and do not anticipate any revenue or cost synergies. These cash flows are then adjusted to present value by applying an appropriate discount rate that reflects the risk factors associated with the cash flow streams, some of which are more certain than others.
The valuation of the Company’s previously held equity interest, the 30% noncontrolling interest in Pureline and the identifiable intangible assets were based on the information that was available as of the acquisition date and the expectations and assumptions that have been deemed reasonable by the Company’s management.
In performing these valuations, the Company used discounted cash flows and other factors as the best evidence of fair value. The key underlying assumptions of the discounted cash flows were projected revenues, gross margin expectations and operating cost estimates. There are inherent uncertainties and management judgment required in these determinations. No assurance can be given that the underlying assumptions will occur as projected.
The net of the acquisition-date amounts of the identifiable assets acquired and the liabilities assumed exceeded the sum of the exercise price of the option to purchase the additional 30% equity interest ($4.3 million), the fair value of the equity interest in Pureline held by the Company before the acquisition date ($4.3 million) and the fair value of the noncontrolling interest in Pureline at July 31, 2009 ($3.2 million) by $0.4 million. Accordingly, the Company recognized a bargain purchase gain, classified as “Other income” in the Company’s consolidated statements of operations, of $0.4 million in 2009.
Acquisition of Poco Graphite, Inc.
On August 11, 2008, Entegris acquired Poco Graphite, Inc. (POCO). Based in Decatur, Texas, POCO is a leading provider of process-critical, graphite-based consumables and finished products used in a variety of markets, including semiconductor, EDM (electrical discharge machining), medical, opto-electronic, aerospace and specialty industrial. The intent of the acquisition was to extend the Company’s position in the semiconductor market and to add new complementary growth opportunities in other high-performance industries.
The Company paid cash consideration of $162.9 million for POCO, including transaction costs of $1.3 million. The transaction is subject to extensive escrow fund arrangements, portions of which remain in place to various dates through August 2013, totaling $24.0 million to secure certain environmental and export compliance obligations of the POCO sellers. This acquisition was accounted for under the purchase method of accounting.
F-16
Table of Contents
The Company’s consolidated financial statements for the year ended December 31, 2008 include the net assets and results of operations of POCO from August 11, 2008, the date of acquisition. Pro forma results are not presented since this acquisition did not constitute a material business combination.
The purchase price for POCO was allocated based on the fair values of assets acquired and liabilities assumed. The following table presents the allocation of purchase price.
| (In thousands) |
||||
| Book value of tangible net assets acquired |
$ | 55,354 | ||
| Remaining allocation: |
||||
| Increase inventories to fair value(a) |
16,989 | |||
| Increase property, plant and equipment to fair value(b) |
10,546 | |||
| Record identifiable intangible assets(c) |
36,400 | |||
| Decrease other net assets to fair value |
(754 | ) | ||
| Adjustments to tax-related assets and liabilities(d) |
(21,576 | ) | ||
| Goodwill(e) |
65,893 | |||
| Purchase price |
$ | 162,852 | ||
The following table summarizes the allocation of the POCO purchase price to the fair values of the assets acquired and liabilities assumed:
| (In thousands) |
||||
| Accounts receivable, inventories and other assets |
$ | 58,456 | ||
| Property, plant and equipment |
35,786 | |||
| Intangible assets |
36,400 | |||
| Goodwill |
65,893 | |||
| Total assets acquired |
196,535 | |||
| Current liabilities |
(6,839 | ) | ||
| Deferred tax liabilities |
(26,844 | ) | ||
| Total liabilities assumed |
(33,683 | ) | ||
| Net assets acquired |
$ | 162,852 | ||
| (a) | The fair value of acquired inventories was determined as follows: |
| • | Finished goods—the estimated selling price less the cost of disposal and reasonable profit for the selling effort. |
| • | Work in process—the estimated selling price of finished goods less the cost to complete, cost of disposal and reasonable profit on the selling and remaining manufacturing efforts. |
| • | Raw materials—estimated current replacement cost, which equaled POCO’s historical cost. |
The increase in inventories to record the fair values of finished goods and work in process was as follows:
| (In thousands) |
|||
| Finished goods |
$ | 5,847 | |
| Work in process |
11,142 | ||
| Total |
$ | 16,989 | |
F-17
Table of Contents
| (b) | The fair value of acquired property, plant and equipment was valued at its value-in-use. |
| (c) | The fair value of acquired identifiable intangible assets, which were valued as described below, was as follows: |
| (In thousands) |
Fair value | Useful life in years |
Weighted average life in years | ||||
| Developed technology |
$ | 18,500 | 10 | 10 | |||
| Trade names |
6,500 | 15 | 15 | ||||
| Customer relationships |
11,300 | 15 | 15 | ||||
| Noncompete covenant |
100 | 2 | 2 | ||||
| Total |
$ | 36,400 | |||||
The total weighted average life of identifiable intangible assets acquired from POCO that are subject to amortization is 12.4 years.
Developed technology represents the technical processes, intellectual property, and institutional understanding that were acquired with the POCO acquisition with respect to products, compounds and/or processes for which development had been completed.
The fair value of identifiable intangible assets was determined using the “income approach.” This method starts with a forecast of expected future net cash flows. These net cash flow projections do not anticipate any revenue or cost synergies. These cash flows are then adjusted to present value by applying an appropriate discount rate that reflects the risk factors associated with the cash flow streams, some of which are more certain than others.
The valuations were based on the information that was available as of the acquisition date and the expectations and assumptions that have been deemed reasonable by the Company’s management. No assurance can be given, however, that the underlying assumptions or events associated with such assets will occur as projected. For these reasons, among others, the actual results may vary from the projected results.
| (d) | Gives the effect of the estimated tax effects of the acquisition. |
| (e) | The goodwill recorded in connection with the acquisition was not amortized and was not deductible for tax purposes. The goodwill was analyzed for impairment and written off in 2008. See Note 2 to the consolidated financial statements. |
Acquisition of Specialty Coatings business
On August 16, 2007, the Company acquired the specialty coatings business of a privately held company located in Burlington, Massachusetts. This specialty coatings business develops and applies proprietary low-temperature, high-purity coatings to critical wafer handling components used in ion implant operations as well as to other critical components used in semiconductor manufacturing and other applications.
The purchase price was $44.9 million in cash, including transaction costs of $0.2 million and contingent consideration of $3.1 million paid to the seller as certain financial metrics related to calendar 2007 results were met. This acquisition was accounted for under the purchase method of accounting and the results of operations of this specialty coatings business are included in the Company’s consolidated financial statements since August 16, 2007. Pro forma results are not presented as this acquisition did not constitute a material business combination.
F-18
Table of Contents
The above purchase price has been allocated to the fair values of assets acquired and liabilities assumed as summarized in the table below.
| (In thousands) |
||||
| Inventory |
$ | 1,478 | ||
| Equipment |
600 | |||
| Other intangible assets |
26,500 | |||
| Goodwill |
16,633 | |||
| Total assets acquired |
$ | 45,211 | ||
| Current liabilities |
(300 | ) | ||
| Net assets acquired |
$ | 44,911 | ||
The amount allocated to acquired inventories above replacement cost was $0.8 million. Accordingly, the results of operations for the year ended December 31, 2007 include an incremental charge of $0.8 million in cost of sales.
The $26.5 million of other intangible assets included $16.1 million of customer relationships (12-year economic consumption life), $10.0 million of developed technologies (12-year economic consumption life), and $0.4 million of employment and non-competition agreements (2.4-year average economic consumption life). These intangible assets were valued at fair value as determined by the Company.
The goodwill recorded in connection with the acquisition was not amortized, but is deductible for tax purposes. The goodwill was analyzed for impairment and written off in 2008. See Note 2 to the consolidated financial statements.
Divestitures and Discontinued Operations
In June 2007, the Company announced its intent to divest its cleaning equipment business. The cleaning equipment business sold precision cleaning systems to semiconductor and hard disk drive customers for use in their manufacturing operations. In conjunction with the establishment of management’s plan to sell the cleaning equipment business, the fair value of the assets of that business were tested for impairment and, where applicable, adjusted to fair value less costs to sell. The Company sold the operating assets of the cleaning equipment business in April 2008 for proceeds of $0.7 million, essentially equal to the carrying value of the assets sold.
The consolidated financial statements have been reclassified to segregate as discontinued operations the assets and liabilities, and operating results of, the product lines divested for all periods presented. The summary of operating results from discontinued operations for the years ended December 31, 2009, 2008 and 2007 is as follows:
| (In thousands) |
2009 | 2008 | 2007 | ||||||||
| Net sales |
$ | — | $ | 4,460 | $ | 4,891 | |||||
| Loss from discontinued operations, before income taxes |
— | $ | (1,040 | ) | $ | (3,996 | ) | ||||
| Income tax (expense) benefit |
— | (65 | ) | 1,999 | |||||||
| (Loss) income from discontinued operations, net of taxes |
$ | — | $ | (1,105 | ) | $ | (1,997 | ) | |||
No interest expense was allocated to the operating results of discontinued operations.
F-19
Table of Contents
(4) ACCOUNTS RECEIVABLE
Accounts receivable and notes receivable from customers at December 31, 2009 and 2008 consist of the following:
| (In thousands) |
2009 | 2008 | ||||
| Accounts receivable |
$ | 82,938 | $ | 59,326 | ||
| Notes receivable |
9,878 | 12,521 | ||||
| 92,816 | 71,847 | |||||
| Less allowance for doubtful accounts |
1,694 | 1,312 | ||||
| $ | 91,122 | $ | 70,535 | |||
(5) INVENTORIES
Inventories at December 31, 2009 and 2008 consist of the following:
| (In thousands) |
2009 | 2008 | ||||
| Raw materials |
$ | 21,016 | $ | 24,922 | ||
| Work-in-process |
11,136 | 16,498 | ||||
| Finished goods (a) |
50,453 | 59,954 | ||||
| Supplies |
628 | 815 | ||||
| $ | 83,233 | $ | 102,189 | |||
| (a) | Includes consignment inventories held by customers for $4,121 and $4,465 at December 31, 2009 and 2008 respectively. |
(6) PROPERTY, PLANT AND EQUIPMENT
Property, plant, and equipment at December 31, 2009 and 2008 consist of the following:
| (In thousands) |
2009 | 2008 | Estimated useful lives in years | |||||
| Land |
$ | 10,729 | $ | 12,560 | ||||
| Buildings and improvements |
70,124 | 78,960 | 5-35 | |||||
| Manufacturing equipment |
132,309 | 138,527 | 5-10 | |||||
| Molds |
62,786 | 82,140 | 3-5 | |||||
| Office furniture and equipment |
55,088 | 56,078 | 3-8 | |||||
| 331,036 | 368,265 | |||||||
| Less accumulated depreciation |
195,605 | 208,527 | ||||||
| $ | 135,431 | $ | 159,738 | |||||
Depreciation expense for the years ended December 31, 2009, 2008, and 2007, was $30.9 million, $26.8 million, and $24.9 million, respectively. The Company recorded asset impairment write-offs on molds and equipment due to abandonment of approximately $1.2 million, $1.4 million, and $4.1 million for the fiscal years ended December 31, 2009, 2008 and 2007, respectively. All impairment losses are included in cost of sales.
(7) INVESTMENTS
At December 31, 2009 and 2008, the Company held equity investments totaling $7.0 million and $14.0 million, respectively. These investments all represent interests in privately held companies. Investments representing $5.3 million of the total at December 31, 2009 are accounted for under the equity method of accounting, with the remaining $1.7 million accounted for under the cost method.
F-20
Table of Contents
During 2009, the Company exercised its option and acquired an additional 30% equity interest in Pureline Co., Ltd. (Pureline), bringing its total ownership percentage in Pureline to 70%. Accordingly, the transaction was accounted for under the acquisition method of accounting and the results of operations of Pureline are included in the Company’s consolidated financial statements since July 31, 2009. (See Note 3 to the Company’s consolidated financial statements). Also in 2009, the Company determined that one of its investments was totally impaired and recorded an impairment loss of $1.0 million that was classified as other expense.
During 2008, the Company invested $11.0 million in equity investments. Also in 2008, the Company determined that four of its investments were partially or totally impaired. The Company recorded impairment losses of $11.1 million that were classified as other expense. During 2007, the Company recorded other income of $6.1 million on the sale of the Company’s interest in a privately held equity investment with a carrying value of $0.5 million accounted for using the cost method. Proceeds from the sale totaled $6.6 million.
(8) GOODWILL AND INTANGIBLE ASSETS
As of December 31, 2009 and 2008, the Company recognized no goodwill on its consolidated balance sheet. The reduction from $402.1 million balance reflected at December 31, 2007 mainly reflects the $473.8 million impairment charge recorded during the year (See Note 2 for further discussion). The impairment charge and other changes to goodwill are reflected in the table below.
The changes in the carrying amount of goodwill for the year ended 2008 are as follows:
| (In thousands) |
2008 | |||
| Beginning of period |
$ | 402,125 | ||
| Acquisition of POCO Graphite, Inc. |
65,893 | |||
| Adjustments to Mykrolis purchase price allocation |
(822 | ) | ||
| Adjustments to specialty coatings acquisition purchase price allocation |
59 | |||
| Other, including foreign currency translation |
6,544 | |||
| Impairment charge |
(473,799 | ) | ||
| End of year |
$ | — | ||
Other intangible assets, excluding goodwill, at December 31, 2009 and 2008 consist of the following:
| 2009 | |||||||||||
| (In thousands) |
Gross carrying amount |
Accumulated amortization |
Net carrying value |
Weighted average life in years | |||||||
| Patents |
$ | 19,020 | $ | 16,839 | $ | 2,181 | 9.1 | ||||
| Developed technology |
74,988 | 47,541 | 27,447 | 7.5 | |||||||
| Trademarks and trade names |
17,245 | 7,950 | 9,295 | 9.6 | |||||||
| Customer relationships |
56,862 | 17,839 | 39,023 | 11.1 | |||||||
| Employment and noncompete agreements |
1,707 | 1,607 | 100 | 4.1 | |||||||
| Other |
4,278 | 3,854 | 424 | 5.5 | |||||||
| $ | 174,100 | $ | 95,630 | $ | 78,470 | 9.0 | |||||
F-21
Table of Contents
| 2008 | |||||||||||
| (In thousands) |
Gross carrying amount |
Accumulated amortization |
Net carrying value |
Weighted average life in years | |||||||
| Patents |
$ | 17,855 | $ | 15,218 | $ | 2,637 | 9.1 | ||||
| Developed technology |
74,988 | 36,742 | 38,246 | 7.5 | |||||||
| Trademarks and trade names |
15,500 | 6,872 | 8,628 | 9.1 | |||||||
| Customer relationships |
55,400 | 12,595 | 42,805 | 11.1 | |||||||
| Employment and noncompete agreements |
3,507 | 3,215 | 292 | 4.6 | |||||||
| Other |
4,157 | 3,626 | 531 | 5.6 | |||||||
| $ | 171,407 | $ | 78,268 | $ | 93,139 | 8.9 | |||||
Amortization expense was $19.2 million, $19.6 million, $18.9 million in the fiscal years ended December 31, 2009, 2008 and 2007, respectively.
Estimated amortization expense for the fiscal years 2010 to 2014, and thereafter, is $13.3 million, $10.1 million, $9.4 million, $8.8 million, $7.7 million, and $29.2 million, respectively.
(9) ACCRUED LIABILITIES
Accrued liabilities at December 31, 2009 and 2008 consist of the following:
| (In thousands) |
2009 | 2008 | ||||
| Payroll and related benefits |
$ | 14,045 | $ | 19,601 | ||
| Employee benefits |
2,115 | 1,868 | ||||
| Taxes, other than income taxes |
2,525 | 823 | ||||
| Interest |
204 | 50 | ||||
| Warranty and related |
877 | 1,112 | ||||
| Other |
10,066 | 13,517 | ||||
| $ | 29,832 | $ | 36,971 | |||
(10) WARRANTY
The Company accrues for warranty costs based on historical trends and the expected material and labor costs to provide warranty services. The majority of products sold are generally covered by a warranty for periods ranging from 30 days to one year. The following table summarizes the activity related to the product warranty liability during the fiscal years ended December 31, 2009, 2008 and 2007:
| (In thousands) |
2009 | 2008 | 2007 | |||||||||
| Beginning of year |
$ | 1,112 | $ | 1,306 | $ | 1,824 | ||||||
| Accrual for warranties issued during the period |
1,238 | 2,221 | 1,742 | |||||||||
| Adjustment of previously recorded accruals |
(709 | ) | (878 | ) | (1,170 | ) | ||||||
| Settlements during the year |
(764 | ) | (1,537 | ) | (1,090 | ) | ||||||
| End of year |
$ | 877 | $ | 1,112 | $ | 1,306 | ||||||
F-22
Table of Contents
(11) FINANCING ARRANGEMENTS
Short-term borrowings at December 31, 2009 and 2008 consist of the following:
| (In thousands) |
2009 | 2008 | ||||
| Bank borrowings, denominated in Japanese yen with an average interest rate of 1.3% |
$ | 5,421 | $ | — | ||
| Bank borrowings, denominated in Korean won with an interest rate of 2.2% |
343 | — | ||||
| Promissory note payable, denominated in Korean won with an interest rate of 6% |
2,275 | — | ||||
| Total short-term borrowings |
$ | 8,039 | $ | — | ||
Long-term debt at December 31, 2009 and 2008 consists of the following:
| (In thousands) |
2009 | 2008 | ||||
| Revolving credit agreement with interest of Prime rate plus a Prime margin ranging from 1% to 1.5% through November 2011 |
$ | 17,406 | $ | 139,000 | ||
| Revolving credit agreement with interest of LIBOR rate plus a LIBOR margin ranging from 1% to 1.5% through November 2011 |
35,000 | — | ||||
| Bank loan denominated in Japanese yen with interest of 1.43% through November 2010 |
10,841 | 22,128 | ||||
| Stock redemption notes payable with interest of 8% through December 2010 |
416 | 835 | ||||
| Bank loan denominated in Korean won with interest of 2.15% through January 2010 |
86 | — | ||||
| Small Business Administration loans with interest ranging from 5.5% to 7.35%, fully repaid in 2009 |
— | 1,719 | ||||
| Total long-term debt |
63,749 | 163,682 | ||||
| Less current maturities of long-term debt |
11,257 | 13,166 | ||||
| Long-term debt less current maturities |
$ | 52,492 | $ | 150,516 | ||
Annual maturities of long-term debt as of December 31, 2009, are as follows:
| Fiscal year ending |
(In thousands) | ||
| 2010 |
$ | 11,257 | |
| 2011 |
52,492 | ||
| $ | 63,749 | ||
On March 2, 2009, the Company amended and restated its credit agreement (as amended from time to time, the Restated Credit Agreement) with Wells Fargo Bank, National Association, as agent, and certain other banks. The Restated Credit Agreement provided for a maximum $150.0 million revolving credit facility maturing November 1, 2011, replacing the Company’s previous $230.0 million revolving credit facility maturing February 15, 2013.
Under the terms of the Restated Credit Agreement, the initial revolving commitment amount was $150 million, with $11.0 million unavailable without the consent of a majority of lenders. The Company’s ability to borrow was further restricted by a borrowing base, which is adjusted based on the Company’s levels of qualifying domestic accounts receivable, inventories and value of its property, plant and equipment.
On July 17, 2009, the Company amended the Restated Credit Agreement with its lenders. The amendment adjusts the manner in which the Company calculates the fixed asset component of its borrowing base under the Restated Credit Agreement. The adjustment to the fixed asset component of the borrowing base includes step-downs in the Company’s fixed asset valuation as of the last day of fiscal October 2009, January 2010 and April
F-23
Table of Contents
2010 of $4.0 million, $4.0 million and $3.2 million, respectively. The step-downs in fixed asset valuation could result in the overall borrowing cap being adjusted downward over time, depending on fluctuations to the Company’s other borrowing base components. The July amendment also permitted the acquisition of Pureline Co. Ltd. as described in Note 3 above.
On August 11, 2009, the Company amended its Restated Credit Agreement with its lenders. Prior to the August 11, 2009 amendment to the Restated Credit Agreement, the Company was prohibited from issuing debt securities and was required to use 100% of the net proceeds received in any equity offering to prepay amounts outstanding under the Restated Credit Agreement. In addition, the borrowing base and, therefore, the funds available to the Company under the Agreement, would have been reduced by 100% of the net proceeds of any equity offering, but the revolving commitment amounts would not have been affected.
The August 11, 2009 amendment permits the Company to issue unsecured convertible debt securities (Qualifying Debt Offering) subject to the satisfaction of certain conditions, which include, among others, the Company’s compliance with the financial covenants contained in the Restated Credit Agreement and the receipt by the Company of at least $75.0 million in net proceeds from a Qualifying Debt Offering. The Company will be required to use 100% of the net proceeds from any Qualifying Debt Offering or equity offering to prepay amounts outstanding under the Agreement. In addition, the borrowing base was amended to provide that it will be reduced by (i) 50% of the net proceeds of any Qualifying Debt Offering or equity offering received by the Company on or before August 15, 2010 and (ii) 100% of the net proceeds of any Qualifying Debt Offering or equity offering received by the Company thereafter. The borrowing base will not be reduced by more than $65 million in total in the event of any such offering(s). In addition, the revolving commitment amounts under the Restated Credit Agreement will be reduced by 50% of the receipts of any Qualifying Debt Offering or equity offering received by the Company on or before August 15, 2010.
As described in Note 17 to the consolidated financial statements, on September 16, 2009, the Company issued 16.1 million shares of common stock for $3.80 per share in a registered public offering. The Company received net proceeds of $56.6 million after deducting underwriting fees and other offering costs of $4.5 million. All of these proceeds were applied to pay down the outstanding balance under the Restated Credit Agreement. In addition, under the terms of the Restated Credit Agreement, as per the August 11, 2009 revision, the revolving commitment decreased by 50% of the net proceeds, or $28.3 million, to $121.7 million. $11.0 million of revolving commitment can not be borrowed unless a majority of the lenders consent. The revolving commitment is further restricted by the Company’s borrowing base.
The Company had outstanding borrowings under the Restated Credit Agreement of approximately $52.4 million as of December 31, 2009, with an additional $1.5 million undrawn on outstanding letters of credit. The Company’s borrowing base supported $106.6 million in total availability as of December 31, 2009.
The full amount outstanding under the Agreement is due on November 1, 2011. While the Restated Credit Agreement allows the Company some flexibility to raise additional capital, there is no assurance that adequate additional capital would be available on reasonable terms, on a timely basis or at all.
The financial covenants in the Restated Credit Agreement replaced those in the prior credit agreement. Through December 31, 2009, the Company was in compliance with all applicable debt covenants of the Restated Credit Agreement.
The Restated Credit Agreement requires that the Company not exceed certain negative year-to-date EBITDA amounts in 2009 and in January 2010 and that the Company exceed certain positive year-to-date EBITDA amounts at prescribed levels on a monthly basis from February 2010 through March 2010. Under the Restated Credit Agreement EBITDA is calculated by adding consolidated net income attributable to Entegris, Inc., depreciation, amortization, share-based compensation expense, interest expense, income taxes, non-cash gains and losses, extraordinary gains and losses, non-recurring expenses associated with a permitted acquisition,
F-24
Table of Contents
foreign exchange expense and certain expenses related to the Restated Credit Agreement. Non-cash gains and losses include adjustments to the Company’s excess and obsolete inventory reserves and allowances for doubtful accounts, and impairment charges of long-lived assets and investments. In addition, the credit agreement allows the add-back of up to $1.0 million in restructuring charges.
The EBITDA covenant levels required by the Restated Credit Agreement are indicated in the table below. The Company’s actual year-to-date EBITDA, as defined by the Restated Credit Agreement, was $22.0 million at December 31, 2009.
| Period ending |
(In thousands) | |||
| Fiscal 2009 year-to-date EBITDA levels |
||||
| December 2009 |
(56,000 | ) | ||
| Fiscal 2010 year-to-date EBITDA levels |
||||
| January 2010 |
$ | (3,000 | ) | |
| February 2010 |
2,000 | |||
| March 2010 |
7,000 | |||
Beginning in the second quarter of 2010, the foregoing minimum EBITDA covenants expire, and the Restated Credit Agreement requires that the Company maintain a cash flow leverage ratio of no more than 3.0 to 1.0 and a fixed charge coverage ratio no lower than 1.5 to 1.0. The cash flow leverage ratio measures the sum of short-term borrowings, long-term debt and capital lease obligations divided by the most recent two fiscal quarters’ EBITDA (as defined above) multiplied by two. The fixed charge coverage ratio measures the sum of EBITDA (as defined above) and lease expense less the sum of capital expenditures and income tax payments, which figure in turn is divided by the sum of interest expense, lease expense and scheduled principal payments.
In addition to the financial metric covenants required under the Restated Credit Agreement, the Company is restricted from making capital expenditures in excess of $20.0 million in both 2010 and 2011 plus certain unused amounts from the prior period ($7.2 million for 2010). The Company must also maintain a minimum of $25.0 million in domestic cash balances under the terms of the Restated Credit Agreement.
Under the terms of the Restated Credit Agreement, the Company may elect that the loans comprising each borrowing bear interest at a rate per annum equal to either (a) the sum of 4.25% plus a base rate equal to the highest of: (i) the prime rate then in effect, (ii) the Federal Funds rate then in effect plus 1.25%, (iii) the one-month LIBOR rate then in effect plus 1.25% or (iv) 3.25%; or (b) the sum of 5.25% plus the greater of the LIBOR rate then in effect or 1.50%.
As of December 31, 2009, the weighted average interest rate on outstanding borrowings under the Restated Credit Agreement was 7.00%. In addition, the Company pays a commitment fee of 0.75% on the unborrowed commitments under the Restated Credit Agreement.
The Company’s borrowings are guaranteed by all its subsidiaries that are treated as domestic for tax purposes and secured by a first-priority security interest in all assets owned by the borrowers or such domestic guarantors, except that the collateral shall include only 65% of the voting stock owned by the borrowers or a domestic subsidiary of each subsidiary which is treated as foreign for tax purposes.
At all times the borrowers and guarantors must maintain certain minimum cash and cash equivalents. The Restated Credit Agreement also includes limitations on the amount of cash and cash equivalents of the Company and its foreign subsidiaries.
In addition, the Restated Credit Agreement includes negative covenants, subject to exceptions, restricting or limiting the Company’s ability and the ability of its subsidiaries to, among other things, sell assets; make capital expenditures; alter the business the Company conducts; engage in mergers, acquisitions and other business
F-25
Table of Contents
combinations; declare dividends or redeem or repurchase capital stock; incur, assume or permit to exist additional indebtedness or guarantees; make loans and investments; incur liens; and enter into transactions with affiliates.
The Restated Credit Agreement also contains customary provisions relating to representations and warranties, affirmative covenants and events of default, including payment defaults, breach of representations and warranties, covenant defaults, certain events of bankruptcy, certain events under ERISA, material judgments, cross defaults and changes in control. If an event of default occurs, the lenders under the Restated Credit Agreement would be entitled to take various actions, including ceasing to make further advances, accelerating the maturity of amounts outstanding under the Restated Credit Agreement and all other remedial actions permitted to be taken by a secured creditor.
During the fourth quarter of 2007, the Company executed a 3.0 billion yen ($26.7 million) unsecured term note agreement with a Japanese bank. Under the note agreement, the Company will make semi-annual payments in May and November each year of 500 million yen ($4.7 million) through November 2010, along with interest at a rate of 1.43%. Borrowings outstanding under this agreement at December 31, 2009 and December 31, 2008 were $10.8 million and $22.1 million, respectively.
The Company has entered into unsecured line of credit agreements, which expire at various dates, with three international commercial banks, which provide for aggregate borrowings of 700 million Korean won and 1.5 billion Japanese yen for its foreign subsidiaries, which is equivalent to $16.9 million as of December 31, 2009. Interest rates for these facilities are based on a factor of the banks’ reference rates. Borrowings outstanding under international line of credit agreements at December 31, 2009 and December 31, 2008, were $5.8 million and none, respectively.
(12) LEASE COMMITMENTS
As of December 31, 2009, the Company was obligated under noncancellable operating lease agreements for certain sales offices and manufacturing facilities, manufacturing equipment, vehicles, information technology equipment and warehouse space. Future minimum lease payments for noncancellable operating leases with initial or remaining terms in excess of one year are as follows:
| Fiscal year ending December 31 |
(In thousands) | ||
| 2010 |
$ | 7,496 | |
| 2011 |
4,011 | ||
| 2012 |
3,266 | ||
| 2013 |
2,671 | ||
| 2014 |
653 | ||
| Thereafter |
8 | ||
| Total minimum lease payments |
$ | 18,105 | |
Total rental expense for all equipment and building operating leases for the years ended December 31, 2009, 2008, and 2007, were $12.6 million, $12.3 million, $14.0 million, respectively. Rent expense for the year ended December 31, 2009 included $1.0 million related to lease buy-outs associated with the Company’s closure of one of its manufacturing facilities in Chaska, Minnesota (see Note 13 to the Company’s consolidated financial statements). These costs were classified as restructuring charges.
F-26
Table of Contents
(13) RESTRUCTURING COSTS
For the years ended December 31, 2009, 2008, and 2007, the accrued liabilities, provisions and payments associated with the employee severance and retention costs of the Company’s restructuring activities as described in further detail below were as follows:
| (In thousands) |
2009 | 2008 | 2007 | |||||||||
| Accrued liabilities at beginning of period |
$ | 12,696 | $ | 6,209 | $ | 6,497 | ||||||
| Provision |
5,717 | 16,597 | 7,980 | |||||||||
| Payments |
(15,792 | ) | (10,110 | ) | (8,268 | ) | ||||||
| Accrued liabilities at end of period |
$ | 2,621 | $ | 12,696 | $ | 6,209 | ||||||
Global restructuring and cost reduction initiatives
In the third quarter of 2008, the Company announced the appointment of a new Chief Operating Officer. In conjunction with this change in executive management, the Company initiated a global business restructuring of its sales and marketing functions, manufacturing operations, and realignment of its global supply chain and related ancillary operational functions. The Company has incurred employee termination and other costs in connection with this business restructuring, as well as actions taken in response to the downturn in the semiconductor industry that began during the second half of 2008.
The Company announced on November 4, 2008 that it would close the larger of its two manufacturing facilities in Chaska, Minnesota and will transfer the related production to its other existing facilities. The closure, which impacted approximately 200 positions in the Company’s worldwide workforce, was completed at the end of 2009. Associated with these changes, the Company recorded $10.4 million in the year ended December 31, 2008 related to employee severance and retention costs (generally over the employees’ required remaining term of service) that were classified as restructuring charges. In the first quarter of 2009, the Company announced workforce reductions in Asia and Japan, which affected approximately 132 positions. In the second quarter of 2009, the Company announced additional global workforce reductions, affecting approximately 100 positions. In connection with the above actions, the Company recorded charges related to employee severance costs of $4.7 million for the year ended December 31, 2009, which were classified as restructuring charges.
For the years ended December 31, 2009, 2008, and 2007, the summary of the Company’s costs associated with its global restructuring and cost reduction initiatives classified as restructuring charges in the statement of operations was as follows:
| (In thousands) |
2009 | 2008 | 2007 | |||||
| Severance and retention costs |
$ | 4,713 | $ | 10,423 | — | |||
| Costs associated with transfer of production |
6,468 | — | — | |||||
| Accelerated depreciation expense |
1,362 | — | — | |||||
| Lease buyouts and other |
2,920 | — | — | |||||
| Restructuring charges |
$ | 15,463 | $ | 10,423 | — | |||
The Company’s facility in Chaska became available for sale during the fourth quarter ended December 31, 2009 and was classified in assets held for sale at December 31, 2009 at a carrying value of $6.0 million.
Selling, general and administrative expense reductions
In March 2008, the Company terminated approximately 75 employees associated with efforts to adjust the Company’s operations to changing business conditions. In connection with this action, the Company recorded charges $4.8 million for the year ended December 31, 2008 for employee severance and retention costs (generally over the employees’ required remaining term of service) that were primarily classified as selling, general and administrative expenses.
F-27
Table of Contents
Gilroy Cleaning Service Facility
In November 2007, the Company announced that it would close its cleaning service facility in Gilroy, California and relocate certain equipment to other existing manufacturing plants located in Asia, Europe, and the United States. In connection with this action, the Company recorded charges of $0.1 million and $3.8 million for the years ended December 31, 2008 and 2007, respectively, for employee severance and retention costs (generally over the employees’ required remaining term of service) and asset impairment and accelerated depreciation expense.
Severance and retention costs, mainly classified as selling, general and administrative expense, totaled $0.1 million and $0.7 million for years ended December 31, 2008 and 2007, respectively. Other costs of $45,000 and $3.1 million related to fixed asset write-offs, classified in cost of sales, were also recorded for years ended December 31, 2008 and 2007, respectively.
The Company’s facility in Gilroy became available for sale during the first quarter ended March 29, 2008 and was classified in assets held for sale at December 31, 2008 at a carrying value of $2.5 million. During the second quarter of 2009, the Company sold the facility for $2.3 million.
Bad Rappenau Facility
In November 2005, the Company announced that during 2006 it would close its manufacturing plant located in Bad Rappenau, Germany and relocate the production of products made in that facility to other existing manufacturing plants located in the United States and Asia. In addition, the Company moved its Bad Rappenau administrative center to Dresden, Germany. In connection with these actions, the Company incurred charges of $7.5 million for employee severance and retention costs (generally over the employees’ required remaining term of service) and asset impairment and accelerated depreciation.
Severance and retention costs, mainly classified as selling, general and administrative expense, totaled $(0.2) million for the year ended December 31, 2007. Other costs of $0.4 million related to fixed asset write-offs and accelerated depreciation classified in cost of sales, were also recorded for the year ended December 31, 2007.
The Company’s facility in Bad Rappenau became available for sale during the third quarter of 2006 and was classified in assets held for sale as of December 31, 2006 at a carrying value of $2.2 million. During the second quarter of 2007, the Company sold the facility for $1.9 million.
| (14) | INTEREST (EXPENSE) INCOME, NET |
Interest (expense) income, net for the years ended December 31, 2009, 2008 and 2007 consists of the following:
| (In thousands) |
2009 | 2008 | 2007 | |||||||||
| Interest income |
$ | 225 | $ | 1,796 | $ | 7,815 | ||||||
| Interest expense |
(9,440 | ) | (2,814 | ) | (2,570 | ) | ||||||
| Interest (expense) income, net |
$ | (9,215 | ) | $ | (1,018 | ) | $ | 5,245 | ||||
Interest expense for the years ended December 31, 2009 included $2.1 million related to the amortization of capitalized debt issuance costs incurred in connection with the Company’s credit agreements.
F-28
Table of Contents
(15) OTHER (EXPENSE) INCOME, NET
Other income (expense), net for the years ended December 31, 2009, 2008 and 2007 consists of the following:
| (In thousands) |
2009 | 2008 | 2007 | ||||||||
| (Loss) gain on foreign currency remeasurement |
$ | (1,291 | ) | $ | (4,442 | ) | $ | 1,196 | |||
| Gain on sale of equity investments |
— | — | 6,068 | ||||||||
| Impairment loss on equity investments |
(1,000 | ) | (11,102 | ) | — | ||||||
| Other, net |
546 | 58 | 392 | ||||||||
| Other (expense) income, net |
$ | (1,745 | ) | $ | (15,486 | ) | $ | 7,656 | |||
The losses and gain on foreign currency remeasurement for the years ended December 31, 2009, 2008 and 2007 mainly reflect foreign currency transaction effects of the remeasurement of yen-denominated assets and liabilities held by the Company’s U.S. entity.
In December 2009, the Company determined that one of its equity investments was totally impaired and recorded an impairment loss of $1.0 million. During 2008, the Company determined that four of its equity investments were partially or totally impaired. The Company recorded impairment losses of $11.1 million. In 2007 the Company recorded a gain of $6.1 million on the sale of the Company’s interest in a privately held equity investment accounted for using the cost method. Proceeds from the sale totaled $6.6 million.
(16) INCOME TAXES
(Loss) income before income taxes for the years ended December 31, 2009, 2008 and 2007 was derived from the following sources:
| (In thousands) |
2009 | 2008 | 2007 | ||||||||
| Domestic |
$ | (43,321 | ) | $ | (511,412 | ) | $ | 2,563 | |||
| Foreign |
(16,567 | ) | 14,999 | 54,056 | |||||||
| (Loss) income before income taxes |
$ | (59,888 | ) | $ | (496,413 | ) | $ | 56,619 | |||
Income tax (benefit) expense for the years ended December 31, 2009, 2008, and 2007 is summarized as follows:
| (In thousands) |
2009 | 2008 | 2007 | |||||||||
| Current: |
||||||||||||
| Federal |
$ | (1,061 | ) | $ | (104 | ) | 6,612 | |||||
| State |
114 | (608 | ) | 3,122 | ||||||||
| Foreign |
(370 | ) | 4,263 | 21,056 | ||||||||
| (1,317 | ) | 3,551 | 30,790 | |||||||||
| Deferred (net of valuation allowance): |
||||||||||||
| Federal |
— | 11,124 | (18,974 | ) | ||||||||
| State |
— | (1,879 | ) | (72 | ) | |||||||
| Foreign |
(1,679 | ) | 6,405 | (1,388 | ) | |||||||
| (1,679 | ) | 15,650 | (20,434 | ) | ||||||||
| Income tax (benefit) expense |
$ | (2,996 | ) | $ | 19,201 | $ | 10,356 | |||||
F-29
Table of Contents
Income tax (benefit) expense differs from the expected amounts based upon the statutory federal tax rates for the years ended December 31, 2009, 2008, and 2007 as follows:
| (In thousands) |
2009 | 2008 | 2007 | |||||||||
| Expected federal income tax at statutory rate |
(20,961 | ) | (173,746 | ) | 19,817 | |||||||
| State income taxes before valuation allowance, net of federal tax effect |
(1,708 | ) | (3,128 | ) | 1,983 | |||||||
| Losses without tax benefit |
(1,240 | ) | — | — | ||||||||
| Effect of foreign source income |
4,009 | 1,416 | (2,637 | ) | ||||||||
| Goodwill impairment |
— | 147,811 | — | |||||||||
| Tax effect of foreign dividend |
(153 | ) | 3,594 | (11,175 | ) | |||||||
| Valuation allowance |
16,579 | 42,093 | — | |||||||||
| Other items, net |
478 | 1,161 | 2,368 | |||||||||
| Income tax (benefit) expense |
$ | (2,996 | ) | $ | 19,201 | $ | 10,356 | |||||
During 2009, the Company recorded a $14.9 million valuation allowance against its deferred tax assets. The Company carried a $42.7 million valuation allowance against its deferred tax assets as of December 31, 2008. The unrecognized deferred tax assets relate primarily to net operating loss carryovers, general business credit carryovers, and tax credits carryforwards.
Generally, the provisions of ASC 740, Income Taxes, require deferred tax assets to be reduced by a valuation allowance if, based on the weight of available evidence, it is more likely than not that some portion or all of the deferred tax assets will not be realized. ASC 740 requires an assessment of all available evidence, both positive and negative, to determine the amount of any required valuation allowance.
As a result of the recent general economic and industry declines, and their impact on the Company’s future outlook, management has reviewed its deferred tax assets and concluded that the uncertainties related to the realization of certain of its assets are still unfavorable. As of December 31, 2009 and 2008, the Company has a U.S. net deferred tax asset position of $57.2 million and $42.3 million, respectively, which is composed of temporary differences and various credit carryforwards. Management has considered the positive and negative evidence for the potential utilization of the net deferred tax asset based upon an application of the principles of ASC 740. Management has concluded that it is not more likely than not that the Company will realize the net deferred tax asset and thus is required to provide an allowance for a portion of the net deferred tax assets management has concluded will not be utilized. As a result, the Company recorded a deferred tax asset valuation allowance charge of $15.1 million and $42.1 million against U.S. deferred tax assets for the year ended December 31, 2009 and 2008, respectively, of which $16.8 million is included in income tax expense from continuing operations and $1.7 million included as a tax benefit in additional paid-in-capital for 2009.
As of December 31, 2009 and 2008, the Company had a net non-U.S. deferred tax asset position of $14.9 million and $12.5 million, respectively, in which management determined based upon the available evidence a valuation allowance of $0.4 million and $0.6 million as of December 31, 2009 and 2008, respectively, were required against the non-U.S. deferred tax assets. For other non-U.S. jurisdictions, management is relying upon projections of future taxable income to utilize deferred tax assets. Estimated taxable income of $42.0 million will be necessary to utilize the non-U.S. deferred tax assets, of which an estimated $32.5 million is related to Nihon Entegris KK.
As a result of commitments made by the Company related to investments in tangible property and equipment (approximately $43 million by December 31, 2010), the establishment of a research and development center in 2006 and certain employment commitments through 2010, income from certain manufacturing activities in Malaysia is exempt from tax for years up through 2015. The income tax benefits attributable to the tax status of this subsidiary are estimated to be none, none, and $2.1 million (2 cents per diluted share) for the years ended December 31, 2009, 2008, and 2007, respectively.
F-30
Table of Contents
$0.5 million and $0.2 million was added to additional paid-in capital in accordance with ASC 718 reflecting tax differences relating to employee stock option and restricted stock award transactions for the years ended December 31, 2009 and 2007, respectively. $2.5 million was charged to additional paid-in capital in accordance with ASC 718 reflecting tax differences relating to employee stock option and restricted stock award transactions for the year ended December 31, 2008.
The tax effects of temporary differences that give rise to significant portions of the deferred tax assets and deferred tax liabilities at December 31, 2009 and 2008 are as follows:
| (In thousands) |
2009 | 2008 | ||||||
| Deferred tax assets attributable to: |
||||||||
| Accounts receivable |
$ | 818 | $ | 760 | ||||
| Inventory |
3,116 | 3,305 | ||||||
| Intercompany profit |
273 | 1,896 | ||||||
| Accruals not currently deductible for tax purposes |
8,206 | 12,212 | ||||||
| Net operating loss and credit carryforwards |
44,895 | 26,742 | ||||||
| Depreciation |
1,806 | 4,501 | ||||||
| Equity compensation |
3,099 | 2,957 | ||||||
| Asset impairments |
4,397 | 4,024 | ||||||
| Other, net |
5,945 | 5,777 | ||||||
| Gross deferred tax assets |
72,555 | 62,174 | ||||||
| Valuation allowance |
(57,587 | ) | (42,676 | ) | ||||
| Total deferred tax assets |
14,968 | 19,498 | ||||||
| Deferred tax liabilities attributable to: |
||||||||
| Repatriation reserve |
— | 3,628 | ||||||
| Purchased intangible assets |
419 | 5,450 | ||||||
| Total deferred tax liabilities |
419 | 9,078 | ||||||
| Net deferred tax assets |
$ | 14,549 | $ | 10,420 | ||||
In, 2007, the Company’s Japanese subsidiary, Nihon Entegris KK (NEKK) declared and paid a dividend of 6.8 billion yen (approximately U.S. $60 million) and loaned 4.6 billion yen (approximately U.S. $40 million) to the Company. The dividend and loan were funded from available cash and lines of credit established with Japanese banks. Prior to the declaration of the dividend, the accumulated undistributed earnings of NEKK were considered to be reinvested indefinitely as allowed by the provisions of ASC 740, such that no U.S. tax effect had been provided with respect to such accumulated undistributed NEKK earnings. The dividend and loan transactions resulted in a recharacterization of $100 million of NEKK’s accumulated undistributed earnings as no longer being indefinitely reinvested, resulting in a 2007 U.S. tax benefit of approximately $9.4 million after reduction for state taxes of $1.9 million.
On December 24, 2008, NEKK loaned 2.0 billion yen (approximately U.S. $22 million) to the Company. The loan was funded from available cash and lines of credit established with Japanese banks. The loan transaction resulted in a recharacterization of $22 million of NEKK’s accumulated undistributed earnings as no longer being indefinitely reinvested.
At December 31, 2009, there were approximately $128.4 million of accumulated undistributed earnings of subsidiaries outside the United States that are considered to be reinvested indefinitely. Management has considered its future cash needs and affirms its intention to indefinitely invest such earnings overseas to be utilized for working capital purposes, expansion of existing operations, possible acquisitions and servicing local bank debt. No U.S. tax has been provided on such earnings. If they were remitted to the Company, applicable
F-31
Table of Contents
U.S. federal and foreign withholding taxes may be partially offset by available foreign tax credits. Management has concluded that it is impracticable to compute the full actual tax impact, but it has estimated that $5.4 million of withholding taxes would be incurred if the $128.4 million were distributed.
At December 31, 2009, the Company had state operating loss carryforwards of approximately $36.8 million, which begin to expire in 2011; foreign tax credit carryforwards of approximately $36.5 million, which begin to expire in 2018; alternative minimum tax credit carryforwards of approximately $0.4 million; federal research tax credit carryforwards of approximately $3.2 million, which begin to expire in 2021; and foreign operating loss carryforwards of $7.0 million, $2.1 million of which will not expire under current law and $4.9 million which begin to expire in 2014.
The Company adopted certain provisions of ASC 740 effective January 1, 2007. These provisions prescribe a recognition threshold and a measurement attribute for the financial statement recognition and measurement of a tax position taken or expected to be taken in a tax return. Benefits from tax positions should be recognized in the financial statements only when it is more likely than not that the tax positions will be sustained upon examination by the appropriate taxing authority that would have full knowledge of all relevant information. A tax position that meets the more-likely-than-not recognition threshold is measured at the largest amount of benefit that is greater than fifty percent likely of being realized upon ultimate settlement. Tax positions that previously failed to meet the more-likely-than-not recognition threshold should be recognized in the first subsequent financial reporting period in which that threshold is met. Previously recognized tax positions that no longer meet the more-likely-than-not recognition threshold should be derecognized in the first subsequent financial reporting period in which that threshold is no longer met. The provisions also provide guidance on the accounting for and disclosure of unrecognized tax benefits, interest and penalties.
Reconciliations of the beginning and ending balances of the total amounts of gross unrecognized tax benefits for the years ended December 31, 2009 and 2008 are as follows:
| (In thousands) |
2009 | 2008 | ||||||
| Gross unrecognized tax benefits at beginning of year |
$ | 5,539 | $ | 16,633 | ||||
| Increases in tax positions for prior years |
52 | 567 | ||||||
| Decreases in tax positions for prior years |
(317 | ) | (10,563 | ) | ||||
| Increases in tax positions for current year |
28 | 1,004 | ||||||
| Settlements |
(122 | ) | (297 | ) | ||||
| Lapse in statute of limitations |
(916 | ) | (1,805 | ) | ||||
| Gross unrecognized tax benefits at end of year |
$ | 4,264 | $ | 5,539 | ||||
The total amount of net unrecognized tax benefits that, if recognized, would affect the effective tax rate was $3.6 million at December 31, 2009.
The Company’s policy for recording interest and penalties associated with audits is to record such items as a component of income before taxes. Penalties are recorded in other expense or income, and interest paid or received is recorded in interest expense or interest income, respectively, in the statement of operations. For the years ended December 31, 2009 and 2008, the Company has accrued interest and penalties related to unrecognized tax benefits of $1.6 million and $1.9 million, respectively. $(0.3) million and $0.6 million of interest and penalties were recognized in the statement of operations for the years ended December 31, 2009 and 2008, respectively.
The Company files income tax returns in the U.S. and in various state, local and foreign jurisdictions. The statute of limitations related to the consolidated Federal income tax return is closed for all years up to and including 2005. With respect to foreign jurisdictions, the statute of limitations varies from country to country, with the earliest open year for the Company’s major foreign subsidiaries being 2004.
F-32
Table of Contents
Due to the potential for resolution of a foreign examination and the expiration of various statutes of limitations, it is reasonably possible that the Company’s gross unrecognized tax benefit balance may decrease within the next twelve months by approximately $1.8 million
(17) EQUITY
Equity Offering
On September 16, 2009, the Company issued 16.1 million shares of common stock for $3.80 per share in a registered public offering. The Company received net proceeds of $56.6 million after deducting underwriting fees and other offering costs of $4.5 million. As required by the terms of the Company’s revolving credit facility, the proceeds were used to reduce the amount outstanding under the Company’s revolving credit facility.
Share Repurchase Program
In May 2007, the Company’s Board of Directors authorized a self-tender offer program to acquire up to $250 million of the Company’s common stock. A modified “Dutch Auction” tender offer began on May 11, 2007 and expired on June 8, 2007, and was subject to the terms and conditions described in the offering materials mailed to the Company’s shareholders and filed with the Securities and Exchange Commission. The tender offer was completed on June 14, 2007 with the Company purchasing 21.1 million shares of its common stock at a price of $11.80 per share. The Company incurred $2.3 million in costs associated with the tender offer for a total cost of approximately $251.4 million.
In November 2007, the Company’s Board of Directors authorized a Rule 10b-5-1 trading plan to acquire up to $49.4 million of the Company’s common stock. The share buyback program, which commenced on December 1, 2007 and ended on August 1, 2008, was established in accordance with the provisions of Rule 10b5-1 and Rule 10b-18 under the Securities Exchange Act of 1934. Under the trading plan, the Company purchased 4.0 million and 0.5 million shares of its common stock in 2008 and 2007, respectively, at an average price of $7.28 and $8.99 per share in 2008 and 2007, respectively. The total cost of the purchases was $28.9 million and $4.1 million in 2008 and 2007, respectively.
Share-based Compensation Expense
The Company follows ASC 718 which requires the measurement and recognition of compensation expense for all share-based payment awards made to employees and directors including employee stock options and employee stock purchases related to the Employee Stock Purchase Plan (employee stock purchases) to be based on estimated fair values. Share-based compensation expense recorded under ASC 718 for the years ended December 31, 2009, 2008 and 2007 was $8.1 million, $7.4 million and $10.5 million, respectively.
ASC 718 requires companies to estimate the fair value of share-based payment awards on the date of grant using an option-pricing model. The value of the portion of the award that is ultimately expected to vest is recognized as expense over the requisite service periods in the Company’s consolidated statement of operations.
Share-based compensation expense is based on the value of the portion of share-based payment awards that is ultimately expected to vest during the period. Share-based compensation expense recognized in the Company’s Consolidated Statement of Operations for the years ended December 31, 2009, 2008 and 2007 includes compensation expense for share-based payment awards granted prior to, but not yet vested as of August 27, 2005 based on the grant date fair value estimated in accordance with the pro forma provisions of ASC 718.
Share-based payment awards in the form of restricted stock awards for 2.7 million shares, 0.8 million shares, and 0.9 million shares were granted to employees during the years ended December 31, 2009, 2008 and 2007, respectively. During the year ended December 31, 2009, Entegris, Inc. awarded no performance stock. Share-based payment awards in the form of stock awards subject to performance conditions for up to 0.5 million shares and 0.9 million shares were granted to certain employees during the years ended December 31, 2008 and 2007, respectively.
F-33
Table of Contents
Share-based payment awards in the form of stock option awards for 1.5 million and 0.9 million options were granted to employees during the year ended December 31, 2009 and 2008, respectively, with no stock options granted during the year ended December 31, 2007. Compensation expense is based on the grant date fair value estimated in accordance with the provisions of ASC 718.
In conjunction with the adoption of the provisions of ASC 718 the Company changed its method of attributing the value of share-based compensation to expense from the accelerated multiple-option approach to the straight-line single option method. Compensation expense for all share-based payment awards granted on or prior to August 27, 2005 is recognized using the accelerated multiple-option approach, while compensation expense for all share-based payment awards granted subsequent to August 27, 2005 is recognized using the straight-line single-option method. Because share-based compensation expense recognized in the Consolidated Statement of Operations for the years ended December 31, 2009, 2008 and 2007 is based on awards ultimately expected to vest, it has been reduced for estimated forfeitures. ASC 718 requires forfeitures to be estimated at the time of grant and revised, if necessary, in subsequent periods if actual forfeitures differ from those estimates.
Employee Stock Purchase Plan
The Company has the Entegris, Inc. Employee Stock Purchase Plan (ESPP). A total of 4.0 million common shares are reserved for issuance under the ESPP. The ESPP allows employees to elect, at six-month intervals, to contribute up to 10% of their compensation, subject to certain limitations, to purchase shares of common stock at the lower of 85% of the fair market value on the first day or last day of each six-month period. The Company treats the ESPP as a compensatory plan under ASC 718. As of December 31, 2009, 2.1 million shares had been issued under the ESPP. At December 31, 2009, 1.9 million shares remained available for issuance under the ESPP. Employees purchased 0.6 million shares, 0.3 million shares, and 0.2 million shares, at a weighted-average price of $1.90, $6.37, and $8.63. during the years ended December 31, 2009, 2008 and 2007, respectively.
Employee Stock Option Plans
As of December 31, 2009, the Company had outstanding stock awards under five stock incentive plans: the Entegris, Inc. 1999 Long-Term Incentive and Stock Option Plan (the 1999 Plan), the Entegris, Inc. Outside Directors’ Option Plan (the Directors’ Plan) and three former Mykrolis stock option plans assumed by the Company on August 10, 2005: The 2001 Equity Incentive Plan (the 2001 Plan), the 2003 Employment Inducement and Acquisition Stock Option Plan (the Employment Inducement Plan) and the 2001 Non-Employee Director Stock Option Plan (the 2001 Directors Plan). New common shares will be issued under the respective plans upon the timely exercise of outstanding stock options or vesting of restricted stock awards. The plans are described in more detail below. On December 17, 2009 the Company’s Board of Directors approved the 2010 Stock Plan, subject to the approval of the Company’s stockholders. If the stockholders approve the 2010 Stock Plan, it will replace the above existing plans for future stock awards and stock option grants.
1999 Plan: The 1999 Plan provided for the issuance of share-based awards to selected employees, directors, and other persons (including both individuals and entities) who provide services to the Company or its affiliates. Under the 1999 Plan, the Board of Directors determined the number of shares for which each option is granted, the rate at which each option is exercisable and whether restrictions were imposed on the shares subject to the awards. The term of options issued under the 1999 Plan was ten years, generally exercisable ratably in 25% increments over the 48 months following grant, with exercise prices equal to 100% of the fair market value of the Company’s common stock on the date of grant. The 1999 Plan expired under its terms in 2009, subject to the exercise, cancellation, or expiration of outstanding awards.
The Directors’ Plan and the 2001 Directors Plan: The Directors’ Plan provided for the grant to each outside director of an option to purchase 15,000 shares on the date the individual becomes a director and for the annual grant to each outside director, at the choice of the Directors’ Plan administrator (defined as the Board of Directors or a committee of the Board), of either an option to purchase 9,000 shares, or a restricted stock award of up to 3,000 shares. Options were exercisable six months subsequent to the date of grant. Under the Directors’
F-34
Table of Contents
Plan, the term of options was ten years and the exercise price for shares was not to be less than 100% of the fair market value of the common stock on the date of grant of such option. The 2001 Directors Plan provided for the grant to each newly elected eligible director of options to purchase 15,000 shares of common stock on the date of his or her first election and for the annual grant of options to purchase 10,000 shares of common stock for each subsequent year of service as a director. The exercise price of the stock options was not to be less than the fair market value of the stock at the date of grant. On May 6, 2008 the Company’s Board of Directors determined that the standard annual equity compensation paid to non-employee directors would be an aggregate of $100,000 worth of restricted stock on the date of grant, inclusive of the amounts specified in the above described plans. The Directors’ Plan expired under its terms in 2009, subject to the exercise, cancellation, or expiration of outstanding awards.
2001 Plan: The 2001 Plan provides for the issuance of share-based awards to selected employees, directors, and other persons (including both individuals and entities) who provide services to the Company or its affiliates. The 2001 Plan has a term of ten years. Under the 2001 Plan, the Board of Directors determines the term of each option, option price, number of shares for which each option is granted, whether restrictions will be imposed on the shares subject to options, and the rate at which each option is exercisable. The exercise price for incentive stock options may not be less than the fair market value per share of the underlying common stock on the date granted (110% of fair market value in the case of holders of more than 10% of the voting stock of the Company). The 2001 Plan contains an “evergreen” provision, which increases the number of shares in the pool of options available for grant annually by 1% of the number of shares of common stock outstanding on the date of the Annual Meeting of Stockholders or such lesser amount determined by the Board of Directors. Under NASDAQ rules new grants and awards under the 2001 Plan may only be made to employees and directors of the Company who were employees or directors of Mykrolis prior to the merger or who were hired by the Company subsequent to the merger.
Employment Inducement Plan: The Employment Inducement Plan is a non-shareholder approved plan that provides for the issuance of stock options and other share-based awards to newly-hired employees and to employees of companies acquired by the Company. The Employment Inducement Plan has a term of ten years. Options granted under the Employment Inducement Plan have a maximum term of ten years and an exercise price equal to the fair market value of the Company’s common stock on the date of grant. The Board of Directors determines other terms of option grants including, number of shares, restrictions and the vesting period. The number of reserved shares under the Employment Inducement Plan automatically increases annually by 0.25% of the number of shares of common stock outstanding on the date of the Annual Meeting of Stockholders unless otherwise determined by the Board of Directors.
Millipore Plan
In addition to the Company’s plans, certain employees of the Company who were employees of Mykrolis were granted stock options under a predecessor’s share-based compensation plan. The Millipore 1999 Stock Incentive Plan (the Millipore Plan) provided for the issuance of stock options and restricted stock to key employees as incentive compensation. The exercise price of a stock option was equal to the fair market value of Millipore’s common stock on the date the option was granted and its term was generally ten years and vested over four years. Options granted to the Company’s employees under the Millipore Plan in the past were converted into options to acquire Mykrolis common stock pursuant to the spin-off of Mykrolis by Millipore, and then were converted into options to acquire the Company’s common stock pursuant to the merger with Mykrolis.
F-35
Table of Contents
General Option Information
Option activity for the 1999 Plan, 2001 Plan, the Employment Inducement Plan, the 2001 Directors Plan, the Millipore plan and the Directors’ Plan for the years ended December 31, 2009, 2008 and 2007 is summarized as follows:
| 2009 | 2008 | 2007 | ||||||||||||||||
| (Shares in thousands) |
Number of shares |
Weighted average exercise price |
Number of shares |
Weighted average exercise price |
Number of shares |
Weighted average exercise price | ||||||||||||
| Options outstanding, beginning of year |
6,689 | $ | 8.30 | 8,396 | $ | 8.70 | 12,805 | $ | 8.19 | |||||||||
| Granted |
1,545 | 1.13 | 938 | 6.58 | — | — | ||||||||||||
| Exercised |
(46 | ) | 4.80 | (341 | ) | 4.21 | (3,972 | ) | 6.78 | |||||||||
| Canceled |
(1,525 | ) | 7.67 | (2,304 | ) | 9.67 | (437 | ) | 11.28 | |||||||||
| Options outstanding, end of year |
6,663 | $ | 6.80 | 6,689 | $ | 8.30 | 8,396 | $ | 8.70 | |||||||||
| Options exercisable, end of year |
4,595 | $ | 8.75 | 5,871 | $ | 8.55 | 8,228 | $ | 8.70 | |||||||||
Options outstanding for the 1999 Plan, 2001 Plan, the Employment Inducement Plan, the 2001 Directors Plan, the Millipore plan and the Directors’ Plan at December 31, 2009 are summarized as follows:
| (Shares in thousands) |
Options outstanding | Options exercisable | ||||||||||
| Range of exercise prices |
Number outstanding |
Weighted average remaining life in years |
Weighted- average exercise price |
Number exercisable |
Weighted average exercise price | |||||||
| $1.13 to $3.08 $4.61 to $7.68 |
1,615 1,908 |
6.1 years 2.8 years |
$
|
1.17 6.42 |
18 1,437 |
$
|
2.10 6.26 | |||||
| $7.69 to $9.22 |
1,390 | 2.6 years | 8.33 | 1,390 | 8.33 | |||||||
| $9.23 to $15.38 |
1,750 | 1.9 years | 11.20 | 1,750 | 11.20 | |||||||
| 6,663 | 3.3 years | 4,595 | ||||||||||
The weighted average remaining contractual term for options outstanding and exercisable for all plans at December 31, 2009 was 3.3 years and 2.2 years, respectively.
For all plans, the Company had shares available for future grants of 9.3 million shares, 11.0 million shares, and 8.9 million shares at December 31, 2009, December 31, 2008, and December 31, 2007, respectively.
For all plans, the total pretax intrinsic value of stock options exercised during the years ended December 31, 2009 and 2008 was $6 thousand and $1.1 million, respectively. The aggregate intrinsic value, which represents the total pretax intrinsic value based on the Company’s closing stock price of $5.28 at December 31, 2009, which theoretically could have been received by the option holders had all option holders exercised their options as of that date, was $6.6 million and $0.1 million for options outstanding and options exercisable, respectively. The total number of in-the-money options exercisable as of December 31, 2009 was 18 thousand.
During the years ended December 31, 2009, 2008 and 2007 certain existing stock option grants and restricted stock awards were modified in connection with the execution of various severance and separation agreements. Under the agreements, the terms of unvested and vested stock option grants were modified with no future service required by the affected individuals. Accordingly, under the measurement principles for shares-based compensation, incremental share-based compensation expense of $25 thousand, $0.4 million and $0.1 million, respectively, was recognized for the value of the modified stock option grants at the date of the agreements’ execution.
F-36
Table of Contents
During the years ended December 31, 2009, 2008 and 2007 the Company received cash from the exercise of stock options totaling $0.2 million, $1.4 million, and $28.1 million, respectively. During the years ended December 31, 2009, 2008 and 2007, the Company received cash of $1.1 million, $1.7 million, and $1.8 million, respectively, in employee contributions to the Entegris, Inc. Employee Stock Purchase Plan.
Restricted Stock Awards
Restricted stock awards are awards of common stock that are subject to restrictions on transfer and to a risk of forfeiture if the awardee terminates employment with the Company prior to the lapse of the restrictions. The value of such stock is determined using the market price on the grant date. Compensation expense is recorded over the applicable restricted stock vesting periods. Accordingly, compensation expense for restricted stock awards granted on or prior to August 27, 2005 are recorded using the accelerated multiple-option approach, while compensation expense for restricted stock awards granted subsequent to August 27, 2005 are recognized using the straight-line single-option method. A summary of the Company’s restricted stock activity for the years ended December 31, 2009, 2008 and 2007 is presented in the following table:
| (Shares in thousands) |
2009 | 2008 | 2007 | |||||||||||||||
| Number of Shares |
Weighted average grant date fair value |
Number of Shares |
Weighted average grant date fair value |
Number of shares |
Weighted average grant date fair value | |||||||||||||
| Unvested, beginning of year |
1,551 | $ | 9.06 | 1,873 | $ | 10.89 | 1,950 | $ | 10.71 | |||||||||
| Granted |
2,690 | 1.92 | 797 | 6.86 | 897 | 11.09 | ||||||||||||
| Vested |
(851 | ) | 7.32 | (773 | ) | 10.88 | (801 | ) | 10.74 | |||||||||
| Forfeited |
(127 | ) | 6.12 | (346 | ) | 9.83 | (173 | ) | 10.60 | |||||||||
| Unvested, end of year |
3,263 | $ | 3.74 | 1,551 | $ | 9.06 | 1,873 | $ | 10.89 | |||||||||
The weighted average remaining contractual term for unvested restricted shares at December 31, 2009 and 2008 was 2.4 years and 2.2 years, respectively.
As of December 31, 2009, the total compensation cost related to nonvested stock options and restricted stock awards not yet recognized was $1.2 million and $6.4 million, respectively, that is expected to be recognized over the next 2.2 years on a weighted-average basis. These amounts exclude restricted stock awards for which performance criteria have yet to be determined and, accordingly, grant dates for those awards have not been established.
During the year ended December 31, 2009, Entegris, Inc. awarded no performance stock and during the years ended December 31, 2008 and 2007, Entegris, Inc. awarded performance stock for up to 0.5 million and 0.9 million shares for each year to be issued upon the achievement of performance conditions (Performance Shares) under the Company’s stock incentive plans to certain officers and other key employees. The Performance Shares will be earned if, and to the extent that, various financial performance criteria for fiscal years 2007 through 2010 are achieved. The number of performance shares earned in a given year may vary based on the level of achievement of financial performance objectives for that year or multi-year period. If the Company’s performance fails to achieve the specified performance threshold, then the Performance Shares allocated to that financial performance criteria are forfeited. Each annual tranche will have its own service period beginning at the date (the grant date) at which the Board of Directors establishes the annual performance targets for the applicable year. Compensation expense to be recorded in connection with the Performance Shares will be based on the grant date fair value of the Company’s common stock. Awards of Performance Shares are expensed over the service period based on an evaluation of the probability of achieving the performance objectives.
For Performance Share awards granted in 2007, 50% of the shares are available to be awarded, if and to the extent that two financial performance criteria for fiscal year 2007 are achieved, while the remaining 50% of the shares are available to be awarded if and to the extent that a third financial performance criteria for the three-year
F-37
Table of Contents
period including fiscal years 2007 through 2009 is achieved. The number of performance shares earned may vary based on the level of achievement of financial performance criteria indicated. If the Company’s performance fails to achieve the specified performance threshold, then the performance shares are forfeited. Compensation expense to be recorded in connection with the 2007 Performance Shares is based on the grant date fair value of the Company’s common stock on the date the financial performance criteria were established. All shares earned in connection with the 2007 Performance Share awards are also subject to service conditions. Shares available upon attainment of the financial performance criteria for fiscal year 2007 vest annually over a four-year period, while shares available upon attainment of the financial performance criteria for the three-year period from fiscal years 2007 through 2009 will be three-quarters vested at the end of 2009, with the final 25% vesting in 2010. At December 31, 2007, the Company determined that it achieved one, but not the second, of the financial performance criteria for fiscal year 2007. Consequently, shared-based compensation expense of $0.6 million and $0.1 million was recorded in 2007 and 2009, respectively, in connection with the fiscal year 2007 financial performance criteria of the Performance Share awards granted in 2007. At December 31, 2009, the Company determined that the financial performance criteria for the three-year period including fiscal years 2007 through 2009 was not achieved and, consequently, no shared-based compensation expense has been recorded in connection with the third financial performance criteria of the Performance Share awards granted in 2007.
For Performance Share awards granted in 2008, 100% of the shares are available to be awarded if and to the extent that financial performance criteria for the three-year period including fiscal years 2008 through 2010 are achieved. The number of performance shares earned may vary based on the level of achievement of financial performance criteria indicated. If the Company’s performance fails to achieve the specified performance threshold, then the performance shares are forfeited. Compensation expense to be recorded in connection with the 2008 Performance Shares is based on the grant date fair value of the Company’s common stock on the date the financial performance criteria were established. All shares earned in connection with the 2008 Performance Share awards are also subject to service conditions. Shares available upon attainment of the financial performance criteria for the three-year period from fiscal years 2008 through 2010 will be three-quarters vested at the end of 2010, with the final 25% vesting in 2011. As of December 31, 2009, the Company expects that the financial performance criteria for the three-year period including fiscal years 2008 through 2010 will not be achieved and, consequently, no shared-based compensation expense has been recorded in connection with the Performance Share awards granted in 2008.
Valuation and Expense Information under ASC 718
The following table summarizes the allocation of share-based compensation expense related to employee stock options, restricted stock awards and grants under the employee stock purchase plan accounted for under ASC 718 for the years ended December 31, 2009, 2008 and 2007:
| (In thousands) |
2009 | 2008 | 2007 | ||||||
| Cost of sales |
$ | 704 | $ | 1,026 | $ | 1,800 | |||
| Engineering, research and development expenses |
482 | 513 | 180 | ||||||
| Selling, general and administrative expenses |
6,865 | 5,836 | 8,520 | ||||||
| Share-based compensation expense |
8,051 | 7,375 | 10,500 | ||||||
| Tax benefit |
— | 2,751 | 3,948 | ||||||
| Share-based compensation expense, net of tax |
$ | 8,051 | $ | 4,624 | $ | 6,552 | |||
Stock options
Share-based payment awards in the form of stock option awards for 1.5 million and 0.9 million options were granted to employees during the years ended December 31, 2009 and 2008, respectively with no stock option awards granted during the year ended December 31, 2007. Compensation expense is based on the grant date fair value estimated in accordance with the provisions of ASC 718. The awards vest annually over a three-year period
F-38
Table of Contents
and have a contractual term of 7 years. The Company estimates the fair value of stock options using the Black-Scholes valuation model, consistent with the provisions of ASC 718. Key inputs and assumptions used to estimate the fair value of stock options include the grant price of the award, the expected option term, volatility of the Company’s stock, the risk-free rate and the Company’s dividend yield. Estimates of fair value are not intended to predict actual future events or the value ultimately realized by employees who receive equity awards, and subsequent events are not indicative of reasonableness of the original estimates of fair value made by the Company. The weighted-average grant date exercise price of options awarded in 2009 and 2008 was $1.13 and $6.58, respectively.
The fair value of each stock option grant was estimated at the date of grant using a Black-Scholes option pricing model. The following table presents the weighted-average assumptions used in the valuation and the resulting weighted-average fair value per option granted for the years ended December 31, 2009 and 2008:
| Employee stock options: |
2009 | 2008 | ||||||
| Volatility |
53.9 | % | 37.1 | % | ||||
| Risk-free interest rate |
1.6 | % | 3.1 | % | ||||
| Dividend yield |
0 | % | 0 | % | ||||
| Expected life |
4 years | 4 years | ||||||
| Weighted average fair value per option |
$ | 0.48 | $ | 2.17 | ||||
A historical daily measurement of volatility is determined based on the expected life of the option granted. The risk-free interest rate is determined by reference to the yield on an outstanding U.S. Treasury note with a term equal to the expected life of the option granted. Expected life is determined by reference to the Company’s historical experience. The Company determines the dividend yield by dividing the expected annual dividend on the Company’s stock by the option exercise price.
Shareholder Rights Plan On July 27, 2005, the Company’s Board of Directors adopted a shareholder rights plan (the “Rights Plan”) pursuant to which Entegris declared a dividend on August 8, 2005 to its shareholders of record on that date of one preferred share purchase right (a “Right”) for each share of Entegris common stock owned on August 8, 2005 and authorized the issuance of Rights in connection with future issuances of Entegris common stock. Each Right entitles the holder to purchase one-hundredth of a share of a series of preferred stock at an exercise price of $50, subject to adjustment as provided in the Rights Plan. The Rights Plan is designed to protect Entegris’ shareholders from attempts by others to acquire Entegris on terms or by using tactics that could deny all shareholders the opportunity to realize the full value of their investment. The Rights are attached to the shares of the Company’s common stock until certain triggering events specified in the Rights Agreement occur, including, unless approved by the Company’s Board of Directors, an acquisition by a person or group of specified levels of beneficial ownership of Entegris common stock or a tender offer for Entegris common stock. Upon the occurrence of any of these triggering events, the Rights authorize the holders to purchase at the then-current exercise price for the Rights, that number of shares of the Company’s common stock having a value equal to twice the exercise price. The Rights are redeemable by the Company for $0.01 and will expire on August 8, 2015. One of the events which will trigger the Rights is the acquisition, or commencement of a tender offer, by a person (an Acquiring Person, as defined in the shareholder rights plan), other than Entegris or any of its subsidiaries or employee benefit plans, of 15% or more of the outstanding shares of the Company’s common stock. An Acquiring Person may not exercise a Right.
(18) BENEFIT PLANS
401(k) Plan The Company maintains the Entegris, Inc. 401(k) Savings and Profit Sharing Plan (the 401(k) Plan) that qualifies as a deferred salary arrangement under Section 401(k) of the Internal Revenue Code. Under the Plan, eligible employees may defer a portion of their pretax wages, up to the Internal Revenue Service annual contribution limit. Entegris matches 100% of employees’ contributions on the first 3% of eligible wages and 50% of employees’ contributions on the next 2% of eligible wages, or a maximum match of 4% of the employee’s eligible wages. During the first quarter of 2009, the Company reduced by one-half its match of employee
F-39
Table of Contents
contributions; later in the quarter the match of employee contributions was eliminated in full for the remainder of the year. The Company’s matching contribution was reinstated beginning in January 2010. In addition to the matching contribution, the Company’s Board of Directors may, at its discretion, declare a profit sharing contribution as a percentage of eligible wages based on the Company’s worldwide operating results. The employer profit sharing and matching contribution expense under the Plan was $0.4 million, $3.0 million and $5.9 million in the fiscal years ended December 31, 2009, 2008 and 2007, respectively.
Supplemental Savings and Retirement Plan The Company also maintains the Supplemental Savings and Retirement Plan (the “Supplemental Plan”). Under the Supplemental Plan, certain senior executives are allowed certain salary deferral benefits that would otherwise be lost by reason of restrictions imposed by the Internal Revenue Code limiting the amount of compensation which may be deferred under tax-qualified plans. Liabilities of $1.6 million and $2.2 million at December 31, 2009 and 2008, respectively, related to the Supplemental Plan are included in the consolidated balance sheets under the caption “Pension benefit obligations and other liabilities”. The Company recorded expense of $0.2 million in the year ended December 31, 2009, income of $0.8 million in the year ended December 31, 2008 and expense of $0.3 million in the year ended December 31, 2007 related to the Supplemental Plan.
Defined Benefit Plans The employees of the Company’s subsidiaries in Japan, Taiwan and Germany are covered in defined benefit pension plans. The Company uses a December 31 measurement date for its pension plans.
F-40
Table of Contents
The tables below set forth the Company’s estimated funded status as of December 31, 2009 and 2008:
| (In thousands) |
2009 | 2008 | ||||||
| Change in benefit obligation: |
||||||||
| Benefit obligation at beginning of period |
$ | 22,196 | $ | 17,693 | ||||
| Plan amendments |
124 | — | ||||||
| Service cost |
1,520 | 1,411 | ||||||
| Interest cost |
350 | 334 | ||||||
| Actuarial losses (gains) |
885 | (63 | ) | |||||
| Benefits paid |
(2,811 | ) | (1,210 | ) | ||||
| Curtailments |
(71 | ) | — | |||||
| Foreign exchange impact |
(397 | ) | 4,031 | |||||
| Benefit obligation at end of period |
21,796 | 22,196 | ||||||
| Change in plan assets: |
||||||||
| Fair value of plan assets at beginning of period |
4,687 | 4,442 | ||||||
| Return on plan assets |
346 | (1,286 | ) | |||||
| Employer contributions |
1,078 | 1,047 | ||||||
| Benefits paid |
(1,349 | ) | (426 | ) | ||||
| Foreign exchange impact |
(81 | ) | 910 | |||||
| Fair value of plan assets at end of period |
4,681 | 4,687 | ||||||
| Funded status: |
||||||||
| Plan assets less than benefit obligation |
(17,115 | ) | (17,509 | ) | ||||
| Net amount recognized |
$ | (17,115 | ) | $ | (17,509 | ) | ||
| Amounts recognized in the consolidated balance sheet consist of: |
||||||||
| Noncurrent liability |
$ | (17,115 | ) | $ | (17,509 | ) | ||
| Accumulated other comprehensive loss, net of taxes |
2,313 | 1,961 | ||||||
| Amounts recognized in accumulated other comprehensive loss, net of tax consist of: |
||||||||
| Net actuarial loss |
$ | 2,572 | $ | 1,990 | ||||
| Prior service cost |
1,221 | 1,268 | ||||||
| Unrecognized transition obligation |
(13 | ) | (14 | ) | ||||
| Gross amount recognized |
3,780 | 3,244 | ||||||
| Deferred income taxes |
(1,467 | ) | (1,283 | ) | ||||
| Net amount recognized |
$ | 2,313 | $ | 1,961 | ||||
Information for pension plans with an accumulated benefit obligation in excess of plan assets:
| (In thousands) |
2009 | 2008 | ||||
| Projected benefit obligation |
$ | 21,796 | $ | 22,196 | ||
| Accumulated benefit obligation |
19,060 | 20,181 | ||||
| Fair value of plan assets |
4,681 | 4,687 | ||||
F-41
Table of Contents
The components of the net periodic benefit cost for the years ended December 31, 2009, 2008 and 2007 are as follows:
| (In thousands) |
2009 | 2008 | 2007 | |||||||||
| Pension benefits: |
||||||||||||
| Service cost |
$ | 1,520 | $ | 1,411 | $ | 1,165 | ||||||
| Interest cost |
350 | 334 | 307 | |||||||||
| Expected return on plan assets |
(72 | ) | (74 | ) | (30 | ) | ||||||
| Amortization of prior service cost |
153 | 134 | 10 | |||||||||
| Amortization of net transition obligation |
(1 | ) | (1 | ) | (1 | ) | ||||||
| Recognized actuarial net loss |
222 | 66 | 114 | |||||||||
| Curtailments |
(71 | ) | — | — | ||||||||
| Net periodic pension benefit cost |
$ | 2,101 | $ | 1,870 | $ | 1,565 | ||||||
The estimated amount that will be amortized from accumulated other comprehensive income into net periodic benefit cost in 2010 is as follows:
| (In thousands) |
||||
| Transition obligation |
$ | (1 | ) | |
| Prior service cost |
(71 | ) | ||
| Net actuarial loss |
(42 | ) | ||
| $ | (114 | ) | ||
Assumptions used in determining the benefit obligation and net periodic benefit cost for the Company’s pension plans for the years ended December 31, 2009, 2008 and 2007 are presented in the following table as weighted-averages:
| 2009 | 2008 | 2007 | |||||||
| Benefit obligations: |
|||||||||
| Discount rate |
1.40 | % | 1.66 | % | 1.78 | % | |||
| Rate of compensation increase |
5.21 | % | 6.56 | % | 6.53 | % | |||
| Net periodic benefit cost: |
|||||||||
| Discount rate |
1.74 | % | 1.77 | % | 2.05 | % | |||
| Rate of compensation increase |
6.38 | % | 6.55 | % | 2.26 | % | |||
| Expected return on plan assets |
1.49 | % | 1.58 | % | 0.90 | % |
The plans’ expected return on assets as shown above is based on management’s expectations of long-term average rates of return to be achieved by the underlying investment portfolios. In establishing this assumption, management considers historical and expected returns for the asset classes in which the plans are invested, as well as current economic and capital market conditions. The discount rate primarily used by the Company is based on the Japan Government Bond index compiled by the Japan Securities Dealers Association for long-term government bonds with terms equivalent to the weighted average remaining service period of the employees in the plan.
Plan Assets
At December 31, 2009, the majority of the Company’s pension plan assets are invested in a Japanese insurance company’s investment funds which consist mainly of equity and debt securities. The remaining portion of the Company’s plan assets is deposited in Bank of Taiwan in the form of cash, where Bank of Taiwan is the assigned funding vehicle for the statutory retirement benefit.
F-42
Table of Contents
The fair value measurements of the Company’s pension plan assets at December 31, 2009, by asset category are as follows:
| (in thousands) Asset Category |
Total | Quoted Prices in Active Markets for Identical Assets (Level 1) |
Significant Observable Inputs (Level 2) |
Significant Unobservable Inputs (Level 3) | ||||||
| Japan Plan assets(a) |
$ | 4,370 | — | $ | 4,370 | — | ||||
| Taiwan Plan assets(b) |
311 | — | 311 | — | ||||||
| $ | 4,681 | — | $ | 4,681 | — | |||||
| (a) | The Company selects a pre-packaged portfolio pooled investment fund that is conservative. This fund includes investments that are both U.S. and non U.S. in nature in approximately 52% equities, 44% bonds, and 4% other investments to boost earnings in the medium and long terms while adopting a flexible hedging approach to reduce risk. |
| (b) | This category includes investments in the government of Taiwan’s pension fund. The government of Taiwan is responsible for the strategy and allocation of the investment contributions. |
Cash Flows
The Company expects to contribute $1.1 million to its defined benefit pension plans during 2010. The following benefit payments, which reflect expected future service, as appropriate, are expected to be paid:
| (In thousands) |
|||
| 2010 |
$ | 800 | |
| 2011 |
341 | ||
| 2012 |
516 | ||
| 2013 |
576 | ||
| 2014 |
331 | ||
| Years 2015-2019 |
$ | 4,381 | |
(19) FAIR VALUE MEASUREMENTS
Effective January 1, 2008, the Company adopted ASC 820, Fair Value Measurements and Disclosures, (“ASC 820”), except for non-recurring financial assets and liabilities, and nonfinancial assets and liabilities, for which ASC 820 was adopted on January 1, 2009.
ASC 820 provides a framework for measuring fair value under generally accepted accounting principles. As defined in ASC 820, fair value is the price that would be received to sell an asset or paid to transfer a liability in an orderly transaction between market participants at the measurement date (exit price). The Company utilizes market data or assumptions that the Company believes market participants would use in pricing the asset or liability, including assumptions about risk and the risks inherent in the inputs to the valuation technique. These inputs can be readily observable, market-corroborated or generally unobservable.
ASC 820 establishes a fair value hierarchy that prioritizes the inputs used to measure fair value. The three levels of the fair value hierarchy defined by ASC 820 are as follows:
| Level 1— |
Quoted prices in active markets accessible at the reporting date for identical assets and liabilities. | |
| Level 2— |
Quoted prices for similar assets or liabilities in active markets. Quoted prices for identical or similar assets and liabilities in markets that are not considered active or financial instruments for which all significant inputs are observable, either directly or indirectly. | |
| Level 3— |
Prices or valuations that require inputs that are significant to the valuation and are unobservable. | |
F-43
Table of Contents
A financial instrument’s level within the fair value hierarchy is based on the lowest level of any input that is significant to the fair value measurement.
Other than cash and cash equivalents, the Company had no assets and liabilities measured on a recurring basis at December 31, 2009.
In the fourth quarter 2009, the Company recorded an other-than-temporary impairment of $1.0 million for an equity method investment. The fair value of the investment after impairment was zero at December 31, 2009 and is classified as a Level 3 investment in the fair value hierarchy.
The fair value measurements of the assets acquired and liabilities assumed in the acquisition of Pureline as described in Note 3 to the consolidated financial statements were generally based on valuations involving significant unobservable inputs, or Level 3 in the fair value hierarchy.
Effective January 1, 2008, the Company adopted certain aspects of ASC 825, Financial Instruments, (“ASC 825”), which provides an option to elect fair value as an alternative measurement for selected financial assets, financial liabilities, unrecognized firm commitments and written loan commitments not previously recorded at fair value. Upon the adoption of ASC 825, the Company did not elect to apply the fair value provisions to any of the items set forth in ASC 825.
(20) (LOSS) EARNINGS PER SHARE (EPS)
Basic EPS is computed by dividing net (loss) income by the weighted average number of shares of common stock outstanding during each period. The following table presents a reconciliation of the share amounts used in the computation of basic and diluted earnings per share for the years ended December 31, 2009, 2008 and 2007:
| (In thousands) |
2009 | 2008 | 2007 | |||
| Basic (loss) earnings per share—Weighted common shares outstanding |
117,321 | 112,653 | 124,339 | |||
| Weighted common shares assumed upon exercise of options and vesting of restricted stock units |
— | — | 1,919 | |||
| Diluted (loss) earnings per share—Weighted common shares outstanding |
117,321 | 112,653 | 126,258 | |||
Approximately 3.6 million of the Company’s stock options were excluded from the calculation of diluted earnings per share in the fiscal year ended December 31, 2007 because the exercise prices of the stock options were greater than the average price of the Company’s common stock, and therefore their inclusion would have been antidilutive. The effect of the inclusion of stock options and unvested restricted common stock for the years ended December 31, 2009 and 2008, respectively, would have been anti-dilutive.
Unvested share-based payment awards that contain nonforfeitable rights to dividends or dividend equivalents (whether paid or unpaid) are participating securities and shall be included in the computation of EPS pursuant to the two-class method under the requirements of paragraph ASC 260-10-45-60A. This provision of ASC was effective for the Company January 1, 2009 and the adoption of this provision affected the computation of basic and diluted shares outstanding for the year ended December 2007 as follows: Basic earnings per common share from continuing operations was reduced from $0.38 to $0.37 and diluted net income per common share was reduced from $0.36 to $0.35. The years ended December 31, 2009 and 2008, respectively, were not affected given the net loss for the periods.
(21) SEGMENT INFORMATION
Effective January 1, 2009, the Company changed its financial segment reporting to reflect management and organizational changes made by the Company. Periods prior to 2009 have been restated to reflect the basis of segmentation presented below. The Company’s three reportable operating segments are business divisions that
F-44
Table of Contents
provide unique products and services. Effective January 1, 2009, each operating segment is separately managed and has separate financial information evaluated regularly by the Company’s chief operating decision maker in determining resource allocation and assessing performance.
The Company’s financial reporting segments are Contamination Control Solutions (CCS), Microenvironments (ME), and Entegris Specialty Materials (ESM).
| • | CCS: provides a wide range of products and subsystems that purify, monitor and deliver critical liquids and gases used in the semiconductor manufacturing process. |
| • | ME: provides products that protect wafers, reticles and electronic components at various stages of transport, processing and storage. |
| • | ESM: provides specialized graphite components used in semiconductor equipment and offers low-temperature, plasma-enhanced chemical vapor deposition coatings of critical components of semiconductor manufacturing equipment used in various stages of the manufacturing process. |
Summarized financial information for the Company’s reportable segments is shown in the following table:
| (In thousands) |
2009 | 2008 | 2007 | ||||||
| Net sales |
|||||||||
| CCS |
$ | 241,163 | $ | 330,810 | $ | 382,182 | |||
| ME |
111,465 | 190,761 | 235,168 | ||||||
| ESM |
46,016 | 33,128 | 8,888 | ||||||
| Total net sales |
$ | 398,644 | $ | 554,699 | $ | 626,238 | |||
Intersegment sales are not significant.
| (In thousands) |
2009 | 2008 | 2007 | ||||||
| Segment profit |
|||||||||
| CCS |
$ | 30,846 | $ | 77,024 | $ | 109,725 | |||
| ME |
4,066 | 24,276 | 40,804 | ||||||
| ESM |
2,925 | 9,250 | 1,102 | ||||||
| Total segment profit |
$ | 37,837 | $ | 110,550 | $ | 151,631 | |||
| (In thousands) |
2009 | 2008 | 2007 | ||||||
| Total assets |
|||||||||
| CCS |
$ | 194,051 | $ | 198,991 | $ | 241,768 | |||
| ME |
84,782 | 92,452 | 108,360 | ||||||
| ESM |
120,377 | 134,998 | 45,714 | ||||||
| Goodwill |
— | — | 402,125 | ||||||
| Corporate |
105,462 | 171,383 | 237,274 | ||||||
| Total assets |
$ | 504,672 | $ | 597,824 | $ | 1,035,241 | |||
F-45
Table of Contents
Corporate assets consist primarily of cash and cash equivalents, assets of discontinued operations, assets held for sale, investments,—deferred tax assets and deferred tax charges. Through December 31, 2008, the Company operated as one reportable segment; accordingly, the Company’s goodwill was not attributed to the Company’s segments.
| (In thousands) |
2009 | 2008 | 2007 | ||||||
| Depreciation and amortization |
|||||||||
| CCS |
$ | 22,325 | $ | 24,423 | $ | 25,811 | |||
| ME |
10,093 | 10,453 | 12,045 | ||||||
| ESM |
11,929 | 6,442 | 1,294 | ||||||
| Corporate |
5,780 | 5,025 | 4,626 | ||||||
| Total depreciation and amortization |
$ | 50,127 | $ | 46,343 | $ | 43,776 | |||
| (In thousands) |
2009 | 2008 | 2007 | ||||||
| Capital expenditures |
|||||||||
| CCS |
$ | 7,818 | $ | 11,737 | $ | 10,143 | |||
| ME |
3,406 | 8,545 | 10,572 | ||||||
| ESM |
459 | 1,570 | 806 | ||||||
| Corporate |
1,479 | 5,135 | 5,398 | ||||||
| Total capital expenditures |
$ | 13,162 | $ | 26,987 | $ | 26,919 | |||
Segment profit is defined as net sales less direct segment operating expenses, excluding certain unallocated expenses, consisting mainly of general and administrative costs for the Company’s human resources, finance and information technology functions, amortization of intangible assets, impairment of goodwill, charges for the fair market value write-up of acquired inventory sold and restructuring charges and before interest expense, income taxes and equity in the earnings of affiliates. The following table reconciles total segment profit to operating income:
| (In thousands) |
2009 | 2008 | 2007 | |||||||||
| Total segment profit (loss) |
$ | 37,837 | $ | 110,550 | $ | 151,631 | ||||||
| Amortization of intangibles |
(19,237 | ) | (19,585 | ) | (18,874 | ) | ||||||
| Restructuring charges |
(15,463 | ) | (10,423 | ) | — | |||||||
| Charge for fair value mark-up of acquired inventory sold |
(4,553 | ) | (13,519 | ) | (836 | ) | ||||||
| Impairment of goodwill |
— | (473,799 | ) | — | ||||||||
| Unallocated general and administrative expenses |
(47,512 | ) | (73,133 | ) | (88,203 | ) | ||||||
| Operating (loss) income |
$ | (48,928 | ) | $ | (479,909 | ) | $ | 43,718 | ||||
F-46
Table of Contents
The following table presents amortization of intangibles, restructuring charges and charges for fair value mark-up of acquired inventory sold for each of the Company’s segments for the years ended December 31, 2009, 2008 and 2007:
| (In thousands) |
2009 | 2008 | 2007 | ||||||
| Amortization of intangibles |
|||||||||
| CCS |
$ | 13,201 | $ | 15,327 | $ | 16,926 | |||
| ME |
647 | 705 | 1,050 | ||||||
| ESM |
5,389 | 3,553 | 898 | ||||||
| $ | 19,237 | $ | 19,585 | $ | 18,874 | ||||
| Restructuring charges |
|||||||||
| CCS |
$ | 2,713 | $ | 1,454 | — | ||||
| ME |
7,375 | 3,528 | — | ||||||
| ESM |
299 | — | — | ||||||
| Corporate |
5,076 | 5,441 | — | ||||||
| $ | 15,463 | $ | 10,423 | — | |||||
| Charge for fair value mark-up of acquired inventory sold |
|||||||||
| CCS |
$ | 488 | $ | — | $ | — | |||
| ESM |
4,065 | 13,519 | 836 | ||||||
| $ | 4,553 | $ | 13,519 | $ | 836 | ||||
The following table summarizes the Company’s total net sales by markets served for the years ended December 31, 2009, 2008 and 2007:
| (In thousands) |
2009 | 2008 | 2007 | ||||||
| Net sales: |
|||||||||
| Semiconductor |
$ | 282,193 | $ | 419,132 | $ | 482,083 | |||
| Data storage |
11,958 | 24,526 | 37,334 | ||||||
| Other |
104,493 | 111,041 | 106,821 | ||||||
| $ | 398,644 | $ | 554,699 | $ | 626,238 | ||||
The following tables summarize total net sales, based upon the country to which sales to external customers were made, and property, plant and equipment attributed to significant countries for the years ended December 31, 2009, 2008 and 2007:
| (In thousands) |
2009 | 2008 | 2007 | ||||||
| Net sales: |
|||||||||
| United States |
$ | 114,009 | $ | 153,098 | $ | 163,146 | |||
| Japan |
74,214 | 115,589 | 144,231 | ||||||
| Germany |
13,331 | 21,264 | 30,508 | ||||||
| Taiwan |
64,907 | 72,792 | 89,012 | ||||||
| Singapore |
16,614 | 29,603 | 34,168 | ||||||
| South Korea |
30,960 | 40,954 | 51,477 | ||||||
| Malaysia |
7,101 | 14,750 | 21,230 | ||||||
| China |
19,332 | 21,868 | 18,504 | ||||||
| Other |
58,176 | 84,781 | 73,962 | ||||||
| $ | 398,644 | $ | 554,699 | $ | 626,238 | ||||
| (In thousands) |
2009 | 2008 | 2007 | ||||||
| Property, plant and equipment: |
|||||||||
| United States |
$ | 69,652 | $ | 94,175 | $ | 63,774 | |||
| Japan |
27,817 | 30,891 | 22,481 | ||||||
| Malaysia |
26,204 | 26,247 | 27,270 | ||||||
| Other |
11,758 | 8,425 | 7,632 | ||||||
| $ | 135,431 | $ | 159,738 | $ | 121,157 | ||||
F-47
Table of Contents
In the years ended December 31, 2009, 2008 and 2007, no single nonaffiliated customer accounted for 10% or more of net sales. In the years ended December 31, 2009, 2008 and 2007, net sales to the Company’s top ten customers accounted for approximately 29%, 26% and 28%, respectively, of the Company’s net sales.
(22) COMMITMENTS AND CONTINGENT LIABILITIES
The Company is subject to various claims, legal actions, and complaints arising in the ordinary course of business. The Company believes the final outcome of these matters will not have a material adverse effect on its consolidated financial position or results of operations. The Company expenses legal costs as incurred. The following discussion provides information regarding certain litigation to which the Company was a party that were pending as of December 31, 2009.
As previously disclosed, on March 3, 2003 the Company’s predecessor, Mykrolis Corporation, filed a lawsuit against Pall Corporation in the United States District Court for the District of Massachusetts alleging infringement of two of the Company’s U.S. patents by certain fluid separation systems and related assemblies used in photolithography applications manufactured and sold by the defendant. The Company’s lawsuit sought a preliminary injunction preventing the defendant from the manufacture, use, sale, offer for sale or importation into the U.S. of any infringing product as well as damages. On April 30, 2004, the Court issued a preliminary injunction against Pall Corporation and ordered Pall to immediately stop making, using, selling, or offering to sell within the U.S., or importing into the U.S., its PhotoKleen EZD-2 Filter Assembly products or “any colorable imitation” of those products. On January 18, 2005, the Court issued an order holding Pall Corporation in contempt of court for the violation of the preliminary injunction and ordering Pall to disgorge all profits earned from the sale of its PhotoKleen EZD-2 Filter Assembly products and colorable imitations thereof from the date the preliminary injunction was issued through January 12, 2005. In addition, Pall was also ordered to reimburse Mykrolis for certain of its attorney’s fees associated with the contempt and related proceedings. The Court’s order also dissolved the preliminary injunction, effective January 12, 2005, based on certain prior art cited by Pall which it alleged raised questions as to the validity of the patents in suit. On February 17, 2005, the Company filed notice of appeal to the U.S. Circuit Court of Appeals for the Federal Circuit appealing the portion of the Court’s order that dissolved the preliminary injunction and Pall filed a notice of appeal to that court with respect to the finding of contempt and the award of attorneys’ fees. On June 13, 2007 the Court of Appeals issued an opinion dismissing Pall’s appeal for lack of jurisdiction and affirming the District Court’s order dissolving the preliminary injunction.
On April 6, 2006 the Company filed a lawsuit against Pall Corporation in the United States District Court for the District of Massachusetts alleging infringement of the Company’s newly issued U.S. patent No. 7,021,667 by certain filter assembly products used in photolithography applications that are manufactured and sold by the defendant. The Company’s lawsuit seeks a preliminary injunction preventing the defendant from the manufacture, use, sale, offer for sale or importation into the U.S. of the infringing products as well as damages. On October 23, 2006 the Company’s motion for preliminary injunction was argued before the court. On March 31, 2008 the court issued an order denying the Company’s motion for a preliminary injunction.
On August 23, 2006 the Company filed a lawsuit against Pall Corporation in the United States District Court for the District of Massachusetts alleging infringement of the Company’s newly issued U.S. patent No. 7,037,424 by certain fluid separation modules and related separation apparatus, including the product known as the EZD-3 Filter Assembly, used in photolithography applications that are manufactured and sold by the defendant. The Company’s lawsuit seeks a preliminary injunction preventing the defendant from the manufacture, use, sale, offer for sale or importation into the U.S. of the infringing products as well as damages. It is believed that the EZD-3 Filter Assembly was introduced into the market by the defendant in response to the action brought by the Company in March of 2003 as described above. On May 5, 2008, the court issued an order consolidating this case with the two cases described in the preceding paragraphs for purposes of discovery; these cases are currently in the discovery stage.
F-48
Table of Contents
As previously disclosed, on December 16, 2005 Pall Corporation filed suit against the Company in U.S. District Court for the Eastern District of New York alleging patent infringement. Specifically, the suit alleges infringement of two of plaintiff’s patents by one of the Company’s gas filtration products and by the packaging for certain of the Company’s liquid filtration products. This lawsuit seeks damages for the alleged infringements. Both products and their predecessor products have been on the market for a number of years. The Company intends to vigorously defend this suit and believes that it will ultimately prevail. This case is currently awaiting a hearing before the court for claim construction of the patents in suit.
On May, 4, 2007 Pall Corporation filed a lawsuit against the Company in the U.S. District Court for the Eastern District of New York alleging patent infringement. Specifically, the suit alleges that certain of the Company’s point-of-use filtration products infringe a newly issued Pall patent, as well as three older Pall patents. Pall’s action, which relates only to the U.S., asserts that “on information and belief” the Company’s Impact 2 and Impact Plus point-of-use photoresist filters infringe a patent issued to Pall on March 27, 2007, as well as three older patents. In the course of discovery, Pall has alleged that additional products infringe its patents. This lawsuit seeks damages for the alleged infringements. The Company intends to vigorously defend this suit and believes that it will ultimately prevail. This case is currently in the discovery stage.
(23) SUBSEQUENT EVENTS
Subsequent events have been evaluated up to and including February 25, 2010, which is the date these financial statements were issued.
(24) QUARTERLY INFORMATION-UNAUDITED
| Fiscal quarter ended | ||||||||||||||||
| (In thousands, except per share data) |
March 28, 2009 |
June 27, 2009 |
September 26, 2009 |
December 31, 2009 |
||||||||||||
| Net sales |
$ | 59,038 | $ | 82,576 | $ | 110,706 | $ | 146,324 | ||||||||
| Gross profit |
5,018 | 23,730 | 44,777 | 64,287 | ||||||||||||
| Net (loss) income attributable to Entegris, Inc. |
(37,745 | ) | (22,492 | ) | (7,608 | ) | 10,124 | |||||||||
| Basic (loss) income per share attributable to Entegris, Inc. Net (loss) income |
(0.34 | ) | (0.20 | ) | (0.07 | ) | 0.08 | |||||||||
| Diluted loss per share attributable to Entegris, Inc. Net (loss) income |
(0.34 | ) | (0.20 | ) | (0.07 | ) | 0.08 | |||||||||
| Fiscal quarter ended | ||||||||||||||||
| (In thousands, except per share data) |
March 29, 2008 |
June 28, 2008 |
September 27, 2008 |
December 31, 2008 |
||||||||||||
| Net sales |
$ | 148,227 | $ | 147,947 | $ | 145,789 | $ | 112,736 | ||||||||
| Gross profit |
63,988 | 59,887 | 55,398 | 32,242 | ||||||||||||
| Net income (loss) from continuing operations Net loss from discontinued operations |
|
3,208 (343 |
) |
|
5,525 (592 |
) |
|
(392,912 (90 |
) ) |
|
(131,718 (80 |
) ) | ||||
| Net income (loss) attributable to Entegris, Inc. |
2,865 | 4,933 | (393,002 | ) | (131,798 | ) | ||||||||||
| Basic earnings (loss) per share attributable to Entegris, Inc. |
||||||||||||||||
| Continuing operations |
0.03 | 0.05 | (3.51 | ) | (1.18 | ) | ||||||||||
| Discontinued operations |
0.00 | (0.01 | ) | (0.00 | ) | 0.00 | ||||||||||
| Net income (loss) |
0.03 | 0.04 | (3.52 | ) | (1.18 | ) | ||||||||||
| Diluted earnings (loss) per share attributable to Entegris, Inc. |
||||||||||||||||
| Continuing operations |
0.03 | 0.05 | (3.51 | ) | (1.18 | ) | ||||||||||
| Discontinued operations |
(0.00 | ) | (0.01 | ) | (0.00 | ) | 0.00 | |||||||||
| Net income (loss) |
0.02 | 0.04 | (3.52 | ) | (1.18 | ) | ||||||||||
F-49