Attached files
| file | filename |
|---|---|
| EX-21.1 - EXHIBIT 21.1 - EarthLink Holdings, LLC | a2196653zex-21_1.htm |
| EX-32.2 - EXHIBIT 32.2 - EarthLink Holdings, LLC | a2196653zex-32_2.htm |
| EX-31.1 - EXHIBIT 31.1 - EarthLink Holdings, LLC | a2196653zex-31_1.htm |
| EX-32.1 - EXHIBIT 32.1 - EarthLink Holdings, LLC | a2196653zex-32_1.htm |
| EX-23.1 - EXHIBIT 23.1 - EarthLink Holdings, LLC | a2196653zex-23_1.htm |
| EX-31.2 - EXHIBIT 31.2 - EarthLink Holdings, LLC | a2196653zex-31_2.htm |
| EX-10.29 - EXHIBIT 10.29 - EarthLink Holdings, LLC | a2196653zex-10_29.htm |
| EX-10.19 - EXHIBIT 10.19 - EarthLink Holdings, LLC | a2196653zex-10_19.htm |
| EX-10.32 - EXHIBIT 10.32 - EarthLink Holdings, LLC | a2196653zex-10_32.htm |
| EX-10.28 - EXHIBIT 10.28 - EarthLink Holdings, LLC | a2196653zex-10_28.htm |
UNITED STATES
SECURITIES AND EXCHANGE COMMISSION
Washington, D.C. 20549
FORM 10-K
ý |
ANNUAL REPORT PURSUANT TO SECTION 13 OR 15(d) OF THE SECURITIES EXCHANGE ACT OF 1934 |
|
For the fiscal year ended December 31, 2009 |
||
OR |
||
o |
TRANSITION REPORT PURSUANT TO SECTION 13 OR 15(d) OF THE SECURITIES EXCHANGE ACT OF 1934 |
|
For the transition period from to |
||
Commission File Number: 001-15605
EARTHLINK, INC.
(Exact name of registrant as specified in its charter)
| Delaware (State of incorporation) |
58-2511877 (I.R.S. Employer Identification No.) |
1375 Peachtree St., Atlanta, Georgia 30309
(Address of principal executive offices, including zip code)
(404) 815-0770
(Registrant's telephone number, including area code)
Securities registered pursuant to Section 12(b) of the Act: None
Securities registered pursuant to Section 12(g) of the Act: Common Stock, $.01 par value
Indicate by check mark if the registrant is a well-known seasoned issuer, as defined in Rule 405 of the Securities Act. Yes ý No o
Indicate by check mark if the registrant is not required to file reports pursuant to Section 13 or Section 15(d) of the Act. Yes o No ý
Indicate by check mark whether the registrant (1) has filed all reports required to be filed by Section 13 or 15(d) of the Securities Exchange Act of 1934 during the preceding 12 months (or for such shorter period that the registrant was required to file such reports), and (2) has been subject to such filing requirements for the past 90 days. Yes ý No o
Indicate by check mark whether the registrant has submitted electronically and posted on its corporate Web site, if any, every Interactive Data File required to be submitted and posted pursuant to Rule 405 of Regulation S-T (§ 232.405 of this chapter) during the preceding 12 months (or for such shorter period that the registrant was required to submit and post such files). Yes o No o
Indicate by check mark if disclosure of delinquent filers pursuant to Item 405 of Regulation of S-K is not contained herein, and will not be contained, to the best of the registrant's knowledge, in definitive proxy or information statements incorporated by reference in Part III of this Form 10-K or any amendment to this Form 10-K. o
Indicate by check mark whether the registrant is a large accelerated filer, an accelerated filer, a non-accelerated filer or a smaller reporting company. See definition of "large accelerated filer," "accelerated filer" and "smaller reporting company" in Rule 12b-2 of the of the Exchange Act (Check One):
| Large accelerated filer ý | Accelerated filer o | Non-accelerated filer o (Do not check if a smaller reporting company) |
Smaller Reporting Company o |
Indicate by check mark whether the registrant is a shell company (as defined in Rule 12b-2 of the Exchange Act). Yes No ý
The aggregate market value of the registrant's outstanding common stock held by non-affiliates of the registrant on June 30, 2009 was $784.6 million. As of January 29, 2010, 107,283,136 shares of common stock were outstanding.
Portions of the Proxy Statement to be filed with the Securities and Exchange Commission and to be used in connection with the Annual Meeting of Stockholders to be held on May 4, 2010 are incorporated by reference in Part III of this Form 10-K.
EARTHLINK, INC.
Annual Report on Form 10-K
For the Year Ended December 31, 2009
TABLE OF CONTENTS
Certain statements in this Annual Report on Form 10-K are forward-looking statements within the meaning of the Private Securities Litigation Reform Act of 1995, Section 27A of the Securities Act of 1933, and Section 21E of the Securities Exchange Act of 1934. The words "estimate," "plan," "intend," "expect," "anticipate," "believe" and similar expressions are intended to identify forward-looking statements. These forward-looking statements are found at various places throughout this report. EarthLink, Inc. disclaims any intention or obligation to update or revise any forward-looking statements, whether as a result of new information, future events or otherwise. Although EarthLink, Inc. believes that its expectations are based on reasonable assumptions, it can give no assurance that its targets and goals will be achieved. Important factors that could cause actual results to differ from estimates or projections contained in the forward-looking statements are described under "Risk Factors" in Item 1A of Part I and under "Safe Harbor Statement" in Item 7 of Part II.
Overview
EarthLink, Inc. is an Internet service provider ("ISP"), providing nationwide Internet access and related value-added services to individual and business customers. Our primary service offerings are dial-up and high-speed Internet access services and related value-added services, such as ancillary services sold as add-on features to our Internet access services, search and advertising. In addition, through our wholly-owned subsidiary, New Edge Networks ("New Edge"), we build and manage IP-based wide area networks for businesses and communications carriers.
We operate two reportable segments, Consumer Services and Business Services. Our Consumer Services segment provides Internet access and related value-added services to individual customers. These services include dial-up and high-speed Internet access and voice-over-Internet Protocol ("VoIP") services, among others. Our Business Services segment provides integrated communications services and related value-added services to businesses and communications carriers. These services include managed IP-based wide area networks, dedicated Internet access and web hosting, among others. See Note 18, "Segment Information," of the Notes to Consolidated Financial Statements in Item 8 of Part II for additional information.
We were formed in February 2000 as a result of the merger of EarthLink Network, Inc. and MindSpring Enterprises, Inc. We were incorporated in 1999 and are a Delaware corporation. Our corporate offices are located at 1375 Peachtree St., Atlanta, Georgia 30309, and our telephone number at that location is (404) 815-0770.
Business Strategy
Our business strategy is to maximize the cash flows generated by our business by focusing on customer retention, operational efficiency and opportunities for growth.
- •
- Customer Retention. We are focused on retaining our
customers. We believe focusing on the customer relationship increases loyalty and reduces churn. We also believe that satisfied customers provide cost benefits, including reduced call center support
costs and reduced bad debt expense. We continue to focus on offering our access services with high-quality customer service and technical support.
- •
- Operational Efficiency. We are focused on improving the cost structure of our business and aligning our cost structure with trends in our revenue, without impacting the quality of services we provide. We are focused on delivering our services more cost effectively by reducing and more efficiently
1
- •
- Opportunities for Growth. In response to changes in our business, we have significantly reduced our sales and marketing spending during the past two years. However, we continue to seek to add customers that generate an acceptable rate of return and increase the number of subscribers we add through alliances, partnerships and acquisitions from other ISPs. We continue to evaluate and consider potential strategic transactions that may complement our business. We are also seeking ways to create more scale within our New Edge business.
handling the number of calls to contact centers, managing cost-effective outsourcing opportunities, managing our network costs, implementing workforce reduction initiatives and streamlining our internal processes and operations.
The primary challenges we face in executing our business strategy are managing the rate of decline in our revenues, aligning costs with trends in our revenue, responding to competition, reducing churn, purchasing cost-effective network services from third-party telecommunications service providers and adding customers that generate an acceptable rate of return. The factors we believe are instrumental to the achievement of our business strategy may be subject to competitive, regulatory and other events and circumstances that are beyond our control. Further, we can provide no assurance that we will be successful in achieving any or all of the strategies identified above, that the achievement or existence of such strategies will favorably impact profitability, or that other factors will not arise that would adversely affect future profitability.
Consumer Services Segment
Service Offerings
Narrowband Access
Premium Dial-up Internet Access. Our premium dial-up, or narrowband, access is a subscription-based service that provides customers with access to the Internet and a wide variety of content, features, services, applications, tools and 24/7 customer support. Such features include antivirus and firewall protection, acceleration tools and privacy and safety tools. Revenues primarily consist of fees charged to customers for dial-up Internet access.
Value Dial-up Internet Access. We provide value-priced dial-up access services through our PeoplePCTM Online offering. Our value dial-up access is a subscription-based service that provides customers access to the Internet at comparatively lower prices. We also provide to our value-priced dial-up access customers accelerator technology that speeds up customers' page load times by compressing and simplifying web pages. Revenues primarily consist of fees charged to customers for dial-up Internet access.
Broadband Access
High-speed, or broadband, access offers a high speed, always on Internet connection that uses a modem to supply an Internet connection across an existing home phone line or cable connection. The Internet service doesn't interfere with a customer's voice service, so there is no need for a second phone line. We provide high-speed access services via DSL and cable and offer different speeds of service. Availability for these services depends on the telephone or cable service provider. Our high-speed access service includes the same features and benefits included with our premium dial-up access service, including antivirus and firewall protection, privacy and safety tools and 24/7 customer support. Broadband access revenues primarily consist of fees charged for high-speed access services.
VoIP
We provide two VoIP services. EarthLink DSL and Home Phone Service is a bundle offer that includes EarthLink high-speed Internet access and home phone service. It combines the last mile of traditional telephone copper wiring with the advanced features of VoIP by taking advantage of Digital
2
Subscriber Line Access Multiplexer, or DSLAM, technology. We offer subscription-based service under various plans that include features such as voicemail, call waiting, caller ID, call forwarding and E911 service. We currently offer this service in 12 markets in the U.S. Revenues primarily consist of fees charged to customers for VoIP service plans.
We also provide Internet-based phone service that enables our customers to make and receive phone calls with a telephone in any location where our broadband Internet access is available. We transmit these calls using VoIP technology, which converts voice signals into digital data packets for transmission over the Internet. We offer subscription-based service under various plans that include features such as voicemail, call waiting, caller ID, call forwarding and E911 service. Revenues primarily consist of fees charged to customers for VoIP service plans.
Value-Added Services
We offer services which are incremental to our Internet access services. Our value-added services portfolio includes products for protection, communication and performance, such as security products, premium email only, home networking, email storage and Internet call waiting, among others. We offer free and fee-based value-added services to both subscribers and non-subscribers.
We also generate advertising revenues by leveraging the value of our customer base and user traffic; through paid placements for searches, powered by the GoogleTM search engine; fees generated through revenue sharing arrangements with online partners whose products and services can be accessed through our web properties; commissions received from partners for the sale of partners' services to our subscribers; and sales of advertising on our various web properties.
Sales and Distribution
In response to changes in our business and industry, we have significantly reduced our sales and marketing spending during the past two years. Our marketing efforts are currently focused on retaining customers and adding customers through alliances, partnerships and acquisitions from other ISPs that generate an acceptable rate of return. We offer our products and services primarily through direct customer contact through our call centers, search engine marketing, affinity marketing partners such as AARP and Dell, resellers and marketing alliances such as Time Warner Cable.
Customer Service and Retention
We believe that quality customer service and technical support increase customer satisfaction, which reduces churn. We also believe that satisfied customers provide cost benefits, including reduced call center support costs and reduced bad debt expense. We provide high-quality customer service, invest in loyalty and retention efforts and continually monitor customer satisfaction for our services. Our customer support is available by chat, email and phone as well as through help sites and Internet guide files on our web sites. We have been recognized historically by customer service and marketing organizations for ranking high in customer satisfaction for our dial-up and high-speed Internet services.
In addition to our customer support, our free tools offer protection against email viruses, spyware, spam, pop-ups and online scams, as well as dial-up Web acceleration. We believe that providing these tools also increases customer satisfaction, which reduces churn.
Network Infrastructure
We provide subscribers with Internet access primarily through third-party telecommunications service providers. Our principal provider for narrowband services is Level 3 Communications, Inc. ("Level 3"). Our agreement with Level 3 expires in December 2010. We also have agreements with certain regional and local narrowband providers. We have agreements with AT&T Inc. ("AT&T"), Covad Communications
3
Group, Inc. ("Covad"), Qwest Corporation ("Qwest") and Verizon Communications Inc. ("Verizon") that allow us to provide DSL services. We have agreements with Time Warner Cable that allow us to provide broadband services over Time Warner Cable's and Bright House Networks' cable network in substantially all their markets and with Comcast Corporation ("Comcast") that allow us to provide broadband services over Comcast's cable network in certain Comcast markets. We rely on Covad's line-powered voice access to provide our EarthLink DSL and Home Phone Service. The following summarizes the contract expiration dates for our largest providers of broadband access:
Broadband Network Provider
|
Contract Expiration | |
|---|---|---|
Comcast Corporation |
December 2010 | |
Verizon Communications Inc. |
March 2011 | |
Covad Communications Group, Inc. |
April 2011 | |
AT&T Inc. |
May 2011 | |
Time Warner Cable/Bright House Networks |
November 2011 | |
Qwest Corporation |
November 2012 |
We maintain a leased backbone consisting of a networked loop of connections between multiple cities and our technology centers. We maintain data centers in multiple locations with redundant systems to provide service availability and connectivity.
Competition
Access and service. We operate in the Internet access services market, which is extremely competitive. We compete directly or indirectly with established online services companies, such as AOL and the Microsoft Network; national communications companies and local exchange carriers, such as AT&T, Qwest and Verizon; cable companies providing broadband access, including Charter Communications, Inc., Comcast, Cox Communications, Inc. and Time Warner Cable; local and regional ISPs; free or value-priced ISPs, such as United Online, Inc. which provides services under the brands Juno and NetZero; wireless Internet service providers; content companies, such as Google and Yahoo!; and satellite and fixed wireless service providers. Competitors for our VoIP services include established telecommunications and cable companies; ISPs; leading Internet companies; and companies that offer VoIP services as their primary business, such as Vonage. Current and prospective competitors for our access services include many large companies that have substantially greater market presence and greater financial, technical, marketing and other resources than we have. Competition in the market for access services is likely to continue increasing, and competition could cause us to decrease the pricing of our services, increase churn of our existing customers, increase operating costs or decrease the number of subscribers we are able to add.
We experience pricing pressures for certain of our consumer access services, particularly our consumer broadband services, due to competition, volume-based pricing and other factors. Some providers have reduced and may continue to reduce the retail price of their Internet access services to maintain or increase their market share, which could cause us to reduce, or prevent us from raising, our prices. We may encounter further market pressures to: migrate existing customers to lower-priced service offerings; restructure service offerings to offer more value; reduce prices; and respond to particular short-term, market-specific situations, such as special introductory pricing or new product or service offerings. Any of the above could adversely affect our revenues and profitability.
We believe the primary competitive factors in the Internet access service industry are price, speed, features, coverage area and quality of service. While we believe our Internet access services compete favorably based on some of these factors when compared to some Internet access providers, we are at a competitive disadvantage relative to some or all of these factors with respect to some of our competitors. Our dial-up Internet access services do not compete favorably with broadband services with respect to speed, and dial-up Internet access services no longer have a significant, if any, price advantage over certain
4
broadband services. Most of the largest providers of broadband services, such as cable and telecommunications companies, control their own networks and offer a wider variety of services than we offer, including voice, data and video services. Their ability to bundle services and to offer broadband services at prices below the price that we can profitably offer comparable services puts us at a competitive disadvantage.
Value-added services. The companies we compete with for Internet access services also compete with us for subscribers to value-added services, such as email storage and security products. We compete for advertising revenues with major ISPs, content providers, large web publishers, web search engine and portal companies, Internet advertising providers, content aggregation companies, social-networking web sites, and various other companies that facilitate Internet advertising. Competition in the market for value-added services may impact the rates we charge.
Business Services Segment
Service Offerings
Secure IP-Based Networks
Through New Edge, we provide IP-based networks for business customers. Customers can choose a blend of access technologies including DSL, T1 and DS3 lines, Ethernet and wireless broadband. We use Multi-Protocol Label Switching ("MPLS") technology, which enables businesses to combine a variety of applications of their choice on a single network to optimize bandwidth and provide reliable network performance. MPLS also enables class of service ("CoS") tagging of network traffic, so administrators may prioritize which of their applications should move across the network ahead of others. Customer applications run on our mix of internal and public Internet links. Revenues consist of fees charged for managed IP-based networks, installation fees, termination fees, fees for equipment and cost recovery fees billed to customers.
Through New Edge, we also provide virtual private networks ("VPN") and CPE-based VPNs. VPNs are secure networks that link multiple customer locations using Internet-based transmission capacity. Our VPN solutions also provide businesses with a cost-effective means of creating their own secure networks for their traveling workforce, telecommuters and remote offices. Revenues consist of fees charged for access technologies, installation fees, termination fees, fees for equipment and cost recovery fees billed to customers.
Internet Access
We provide high-speed and dial-up Internet access for business customers. We offer various speeds, reliable connectivity, business-class features like static IP addresses, multiple email accounts and customer service that is available 24/7. Revenues primarily consist of fees charged for Internet access, installation fees and usage fees.
Wholesale Services
Through New Edge, we provide network services to communications carriers, which bundle New Edge services with their own to provide solutions to the end customer. Revenues consist of fees charged for network services, termination fees, fees for equipment and usage fees.
Web Hosting
We lease server space and provide web hosting services that enable customers to build and maintain an effective online presence. Features include domain names, storage, mailboxes, software tools to build websites, e-commerce applications and 24/7 customer support. Revenues primarily consist of fees charged to customers for web hosting packages and domain registration fees.
5
Other Services
We offer a variety of other services that eliminate the inconvenience and complexity of managing multiple carrier relationships, technologies and geographic locations. These services enable our business customers to focus on their core business while we manage the network infrastructure. We believe our customers benefit from one seamless network, one provider and one point of contact for their total connection needs. These services include installation programs, managed network services, remote access and disaster recovery, among others.
Sales and Distribution
We sell our services to end user business customers and to wholesale customers. Our end users range from large enterprises with many locations, to small and medium-sized multi-site businesses to business customers with one site, often a home-based location. Our wholesale customers consist primarily of telecommunications carriers and network resellers. The mix of our business services customer base has shifted towards end users as a result of consolidation in the telecommunications industry. We sell services through direct channels, which include our direct sales force, telephone and web sales groups. We also sell our services indirectly via a variety of third parties such as sales agents and referral partners.
Network Infrastructure
New Edge's network is comprised of a mix of ATM and IP switches in locations across the U.S. In addition, New Edge has access under wholesale agreements to extend its footprint where it does not have a physical presence. New Edge has interconnection agreements with all major local exchange carriers to lease unbundled network elements, as well as commercial services agreements with national communications companies, competitive local exchange carriers ("CLECs"), and cable and wireless service providers to provide last mile access to its customers and connectivity onto its network.
Competition
We face significant competition in our business segment markets and we expect this competition to intensify. These markets are rapidly changing due to industry consolidation, an evolving regulatory environment and the emergence of new technologies. We compete directly or indirectly with incumbent local exchange carriers ("ILECs"), such as AT&T, Qwest and Verizon; other competitive telecommunications companies, such as Covad, Level 3, Megapath and XO Holdings; interexchange carriers, such as Sprint Nextel; wireless and satellite service providers; and cable service providers, such as Charter Communications, Inc., Comcast, Cox Communications, Inc. and Time Warner Cable. We believe the primary competitive factors in our business markets include price, availability, reliability of service, network security, variety of service offerings, quality of service and reputation of the service provider. While we believe our business services compete favorably based on some of these factors, we are at a competitive disadvantage relative to some or all of these factors with respect to some of our competitors. The market for telecommunications services, particularly local exchange services, remains dominated by the ILECs, each of which owns the majority of the local exchange network in its respective operating region of the U.S. Each ILEC has significantly more resources available to expand its penetration within the operating regions where we compete. In addition, industry consolidation has resulted in larger competitors that have greater economies of scale. Additionally, new competitors such as VoIP providers and cable companies have entered the market to compete with traditional, facilities-based telecommunications services providers. The operating results of our Business Services segment may be adversely affected by increased subscriber acquisition and retention costs necessary to attract and retain subscribers in a difficult economic environment.
We also provide web hosting services that enable customers to build and maintain an effective online presence. The web hosting market is highly fragmented, has low barriers to entry and is characterized by
6
considerable competition on price and features. We compete directly or indirectly with a number of companies, such as GoDaddy.com, Rackspace Hosting, Inc., Web.com and Yahoo!. Some of these companies have substantially greater market presence and greater financial, technical, marketing and other resources than we have. Competition could cause us to decrease the pricing of our services, increase churn of our existing customers, increase operating costs or decrease the number of subscribers we are able to add.
Regulatory Environment
Overview
The regulatory environment relating to our business continues to evolve. A number of legislative and regulatory proposals under consideration by federal, state and local governmental entities may lead to the repeal, modification or introduction of laws or regulations which do, or could, affect our business.
Internet Access Regulation
Narrowband Internet Access
The regulatory environment for narrowband Internet access services is well established. Beginning in the 1970s, the Federal Communication Commission's ("FCC's") policy has been to classify narrowband Internet access services as "information services", which are not subject to traditional telecommunications services regulation, such as licensing or pricing regulation. Under this framework, ISPs are assured access to the narrowband telecommunications transmission service of telephone carriers needed to provide narrowband Internet access information services. Any change to these rules that would apply per-minute carrier access charges to dial-up Internet access traffic could significantly impact our costs for this service.
One potential risk to our dial-up business would be a change to the rules governing how charges for ISP-bound traffic on telecommunications networks are levied. While Internet traffic is not subject to the FCC's carrier access charge regime, dial-up ISP bound traffic is regulated by the FCC. The FCC has established a uniform, nationwide rate for ISP-bound traffic, but these rules have been criticized by the courts and further judicial scrutiny is expected. Changes to the rules governing dial-up ISP bound traffic could impact our cost of providing this service.
Broadband Internet Access
The FCC classifies broadband Internet access as a single, commingled information service, whether provided over DSL by telephone companies or over cable modem by cable companies. As a result, cable companies and telephone companies that offer a broadband Internet access information service are not required by the FCC to offer unaffiliated ISPs stand-alone broadband transmission. We have entered into several commercial agreements with cable and telephone companies to offer broadband access to our customers. However, if our contracts with cable companies and telephone companies were to expire and not be replaced, our broadband Internet access customer base and revenues would be adversely affected.
Forbearance
The Communications Act of 1934, as amended, provides the FCC with the authority to not enforce, or "forbear" from enforcing, statutory requirements and regulations if certain public interest factors are satisfied. If the FCC were to forbear from enforcing regulations that have been established to enable competing broadband Internet access and VoIP, our business could be adversely affected.
In December 2007, the FCC denied a petition by Verizon that requested the FCC forbear from certain telephone facilities leasing rules in six major east coast markets, including New York and Philadelphia. In July 2008, the FCC denied a similar forbearance petition filed by Qwest seeking regulatory relief in four major west coast markets, including Seattle and Phoenix. We opposed both the Verizon and Qwest
7
forbearance petitions by arguing that such deregulation would have removed critical facilities necessary to provide competitive broadband access to consumer and business customers. Both Verizon and Qwest have appealed the FCC orders denying their respective requests.
We expect reform to the FCC's forbearance review process in the near future. The FCC has initiated a proceeding to establish strict evidentiary and filing procedures for review of forbearance petitions.
Internet Taxation
The Internet Tax Non-Discrimination Act, which is in effect through November 2014, places a moratorium on taxes on Internet access and multiple, discriminatory taxes on electronic commerce. Certain states have enacted various taxes on Internet access and electronic commerce, and selected states' taxes are being contested on a variety of bases. If these state tax laws are not successfully contested, or if future state and federal laws imposing taxes or other regulations on Internet access and electronic commerce are adopted, our cost of providing Internet access services could be increased and our business could be adversely affected.
Consumer Protection
Federal and state governments have adopted consumer protection laws and undertaken enforcement actions to address advertising and user privacy. As part of these efforts, the Federal Trade Commission ("FTC") and some state Attorney General offices have conducted investigations into the privacy practices of companies that collect information about individuals on the Internet. The FTC and various state agencies as well as individuals have investigated and asserted claims against, or instituted inquiries into, ISPs in connection with marketing, billing, customer retention, cancellation and disclosure practices.
Universal Service
While current policy exempts broadband access services from the Universal Service Fund ("USF"), the Congress and FCC may consider expanding the USF to include broadband Internet access services. This change could allow broadband service providers to receive a subsidy for deploying broadband in rural and underserved areas, but it will most likely require broadband service providers to contribute to the USF as well. If broadband Internet access providers become subject to USF contribution obligations, they would likely impose a USF surcharge on end users. Such a surcharge will raise the effective cost of our broadband services to our customers, and could affect customer satisfaction or our revenues and profitability.
Other Laws and Regulations
Our business also is subject to a variety of other U.S. laws and regulations that could subject us to liabilities, claims or other remedies, such as laws relating to bulk email or "spam," access to various types of content by minors, anti-spyware initiatives, encryption, data protection, data retention and security breaches. Compliance with these laws and regulations is complex and may require significant costs. In addition, the regulatory framework relating to Internet services is evolving and both the federal government and states from time to time pass legislation that impacts our business. It is likely that additional laws and regulations will be adopted that would affect our business.
CLEC Regulation
New Edge is a competitive local exchange carrier ("CLEC") that is licensed in most states and subject to both state and federal telecommunications regulation. CLECs, like New Edge, are dependent on certain provisions of the 1996 Telecommunications Act to procure facilities and services from ILECs that are necessary to provide their services. The business of New Edge is highly dependent on rules and rulings from the FCC, legislative actions at both the state and federal level, and rulings from the state public utility commissions. New Edge also must contribute to state and federal universal service funds. In addition, New
8
Edge makes use of the special access services and DSL services of ILECs and other CLECs in order to provide New Edge services to its customers.
VoIP Regulation
We offer voice services to our customers through a fixed line VoIP service and a nomadic-style VoIP service. The current regulatory environment for VoIP services remains unclear, as the decision whether VoIP is an "information service" or "telecommunications service" is still pending. Classifying VoIP as a telecommunications service could require the service provider to obtain a telecommunications license, comply with numerous legacy telephone regulations, and possibly subject the VoIP traffic to inter-carrier access charges, which could result in increased costs. In addition, we currently must comply with seven distinct regulatory obligations imposed by the FCC on VoIP services that interconnect with the public switched telephone network ("PSTN"): (i) access to emergency calling; (ii) compliance with Communications Assistance with Law Enforcement Act ("CALEA"); (iii) payments to the federal universal service fund on interstate revenue; (iv) compliance with rules for disability access; (v) payments for regulatory fees; (vi) compliance with customer proprietary network information ("CPNI") procedures; and (vii) compliance with number portability rules.
Proprietary Rights
Our EarthLink, PeoplePC and New Edge Networks trademarks are valuable assets to our business, and are registered trademarks in the United States. In particular, we believe the strength of the EarthLink brand among existing and potential customers is important to the success of our business. Additionally, our EarthLink, PeoplePC and New Edge Networks service marks, proprietary technologies, domain names and similar intellectual property are also important to the success of our business. Although we do have several patents, we do not consider these patents important to our business. We principally rely upon trademark law as well as contractual restrictions to establish and protect our technology and proprietary rights and information. We require employees and consultants and, when possible, suppliers and distributors to sign confidentiality agreements, and we generally control access to, and distribution of, our technologies, documentation and other proprietary information. We will continue to assess appropriate occasions for seeking trademark and other intellectual property protections for those aspects of our business and technology that we believe constitute innovations providing us with a competitive advantage. From time to time, third parties have alleged that certain of our technologies infringe on their intellectual property rights. To date, none of these claims has had an adverse effect on our ability to market and sell our services.
Employees
As of December 31, 2009, we had 623 employees, including 333 operations and customer support personnel, 178 sales and marketing personnel and 112 administrative personnel. As of December 31, 2009, our Consumer Services segment consisted of 339 employees and our Business Services segment consisted of 284 employees. None of our employees are represented by a labor union, and we have no collective bargaining agreement.
9
Available Information
We file annual reports, quarterly reports, current reports, proxy statements and other documents with the Securities and Exchange Commission (the "SEC") under the Securities Exchange Act of 1934, as amended. The public may read and copy any materials that we file with the SEC at the SEC's Public Reference Room at 100 F Street, NE, Washington, DC 20549. The public may obtain information on the operation of the Public Reference Room by calling the SEC at (202) 942-8090. Also, the SEC maintains an Internet web site that contains reports, proxy and information statements, and other information regarding issuers, including EarthLink, that file electronically with the SEC. The public can obtain any documents that we file with the SEC at http://www.sec.gov.
We also make available free of charge on or through our Internet web site (http://www.earthlink.net) our Annual Report on Form 10-K, Quarterly Reports on Form 10-Q, Current Reports on Form 8-K, and, if applicable, amendments to those reports filed or furnished pursuant to Section 13(a) of the Securities Exchange Act of 1934, as amended, as well as Section 16 reports filed on Forms 3, 4 and 5, as soon as reasonably practicable after we electronically file such material with, or furnish it to, the SEC. Our Internet web site is not meant to be incorporated by reference into this Annual Report on Form 10-K.
We also provide a copy of our Annual Report on Form 10-K via mail, at no cost, upon receipt of a written request to the following address:
Investor
Relations
EarthLink, Inc.
1375 Peachtree Street
Atlanta, GA 30309
10
The following risk factors and other information included in this Annual Report on Form 10-K should be carefully considered. The risks and uncertainties described below are not the only ones we face. Additional risks and uncertainties not presently known to us or that we currently deem immaterial also may adversely impact our business operations. If any of the following risks occur, our business, financial condition, operating results and cash flows could be materially adversely affected.
Risks Related to Our Business and Industry
The continued decline of our consumer access subscribers, combined with the change in mix of our consumer access subscriber base from narrowband to broadband, will adversely affect our results of operations.
Our consumer access revenues consist primarily of narrowband access revenues and broadband access revenues. Our narrowband subscriber base and revenues have been declining and are expected to continue to decline due to continued maturation of the market for narrowband access, increased availability and reduced pricing of broadband access services and an increase in advanced applications such as music downloads, videos, online gaming and social networking which require greater bandwidth for optimal performance. In addition, our narrowband subscriber base and revenues have been adversely impacted by the effects of our refocused strategy announced in 2007, which resulted in significantly reducing our sales and marketing efforts and focusing instead on retaining customers and adding customers that are more likely to produce an acceptable rate of return. Our broadband subscriber base and revenues have also been declining due to our refocused strategy and due to increased competition among broadband providers. We expect our consumer access subscriber base and revenues to continue to decline, which will adversely affect our profitability and results of operations. If we do not maintain our relationships with current customers or acquire new customers, our revenues will decline and our profitability will be adversely affected.
Changes in the mix of our consumer access subscriber base, from narrowband access to broadband access, have also negatively affected our consumer access profitability. Our consumer broadband access services have lower gross margins due to the higher costs associated with delivering broadband services. Our ability to provide these services profitably is dependent upon cost-effectively purchasing wholesale broadband access and managing the costs associated with delivering broadband services. While we continuously evaluate cost reduction opportunities associated with the delivery of broadband access services, our overall profitability will be adversely affected if we are unable to continue to manage and reduce costs associated with the delivery of broadband services.
We will have less ability in the future to implement cost reduction initiatives to offset our revenue declines, which will adversely affect our results of operations.
We have implemented significant cost reduction initiatives to align costs with trends in our revenues, including reducing our headcount, outsourcing certain functions, streamlining internal processes, renegotiating contacts with network service providers and consolidating or closing certain facilities. We plan to continue to implement cost reduction initiatives and to manage our business more efficiently. However, we believe that large-scale cost reduction opportunities will be more limited in the future and in some cases, we may incur upfront costs in connection with implementing certain initiatives. Although we seek to align our cost structure with trends in our revenue, we do not expect to be able to reduce our cost structure to the same extent as our revenue declines and our cost reduction initiatives might not yield the anticipated benefits. If we do not recognize the anticipated benefits of our cost reduction initiatives, or do so in a timely manner, our profitability and cash flows will decline.
We face significant competition that could reduce our profitability.
We face significant competition in the markets in which we operate and we expect this competition to intensify. The intense competition from our competitors could cause us to decrease the pricing of our
11
services, increase churn of our existing customers, increase operating costs or decrease the number of subscribers we are able to add, which would result in lower revenues and profits.
Consumer Services Segment
Access and service. We operate in the Internet access services market, which is extremely competitive. We compete directly or indirectly with established online services companies, such as AOL and the Microsoft Network; national communications companies and local exchange carriers, such as AT&T, Qwest and Verizon; cable companies providing broadband access, including Charter Communications, Inc., Comcast, Cox Communications, Inc. and Time Warner Cable; local and regional ISPs; free or value-priced ISPs, such as United Online, Inc. which provides service under the brands Juno and NetZero; wireless Internet service providers; content companies, such as Google and Yahoo!; and satellite and fixed wireless service providers. Competitors for our VoIP services include established telecommunications and cable companies; ISPs; leading Internet companies; and companies that offer VoIP services as their primary business, such as Vonage. Current and prospective competitors include many large companies that have substantially greater market presence and greater financial, technical, marketing and other resources than we have. Competition in the market for access services is likely to continue increasing, and competition could cause us to decrease the pricing of our services, increase churn of our existing customers, increase operating costs or decrease the number of subscribers we are able to add.
We experience pricing pressures for certain of our consumer access services, particularly our consumer broadband services, due to competition, volume-based pricing and other factors. Some providers have reduced and may continue to reduce the retail price of their Internet access services to maintain or increase their market share, which could cause us to reduce, or prevent us from raising, our prices. We may encounter further market pressures to: migrate existing customers to lower-priced service offerings; restructure service offerings to offer more value; reduce prices; and respond to particular short-term, market-specific situations, such as special introductory pricing or new product or service offerings. Any of the above could adversely affect our revenues and profitability.
We believe the primary competitive factors in the Internet access service industry are price, speed, features, coverage area and quality of service. While we believe our Internet access services compete favorably based on some of these factors when compared to some Internet access providers, we are at a competitive disadvantage relative to some or all of these factors with respect to some of our competitors. Our dial-up Internet access services do not compete favorably with broadband services with respect to speed, and dial-up Internet access services no longer have a significant, if any, price advantage over certain broadband services. Most of the largest providers of broadband services, such as cable and telecommunications companies, control their own networks and offer a wider variety of services than we offer, including voice, data and video services. Their ability to bundle services and to offer broadband services at prices below the price that we can profitably offer comparable services puts us at a competitive disadvantage.
Value-added services. The companies we compete with for Internet access services also compete with us for subscribers to value-added services, such as email storage and security products. We compete for advertising revenues with major ISPs, content providers, large web publishers, web search engine and portal companies, Internet advertising providers, content aggregation companies, social-networking web sites, and various other companies that facilitate Internet advertising. Competition in the market for value-added services may impact the rates we charge.
Business Services Segment
Through New Edge, we build and manage IP-based wide area networks for businesses and communications carriers. We also provide Internet access to business customers. We face significant
12
competition in these markets and we expect this competition to intensify. These markets are rapidly changing due to industry consolidation, an evolving regulatory environment and the emergence of new technologies. We compete directly or indirectly with ILECs, such as AT&T, Qwest and Verizon; other competitive telecommunications companies, such as Covad, Level 3, Megapath and XO Holdings; interexchange carriers, such as Sprint Nextel; wireless and satellite service providers; and cable service providers, such as Charter Communications, Inc., Comcast, Cox Communications, Inc. and Time Warner Cable. We believe the primary competitive factors in our business markets include price, availability, reliability of service, network security, variety of service offerings, quality of service and reputation of the service provider. While we believe our business services compete favorably based on some of these factors, we are at a competitive disadvantage relative to some or all of these factors with respect to some of our competitors. The market for telecommunications services, particularly local exchange services, remains dominated by the ILECs, each of which owns the majority of the local exchange network in its respective operating region of the U.S. Each ILEC has significantly more resources available to expand its penetration within the operating regions where we compete. In addition, industry consolidation has resulted in larger competitors that have greater economies of scale. Additionally, new competitors such as VoIP providers and cable companies have entered the market to compete with traditional, facilities-based telecommunications services providers. The operating results of our Business Services segment may be adversely affected by increased subscriber acquisition and retention costs necessary to attract and retain subscribers in a difficult economic environment.
We also provide web hosting services to enable customers to build and maintain an effective online presence. The web hosting market is highly fragmented, has low barriers to entry and is characterized by considerable competition on price and features. We compete directly or indirectly with a number of companies, such as GoDaddy.com, Rackspace Hosting, Inc., Web.com and Yahoo!. Some of these companies have substantially greater market presence and greater financial, technical, marketing and other resources than we have. Competition could cause us to decrease the pricing of our services, increase churn of our existing customers, increase operating costs or decrease the number of subscribers we are able to add, which would result in lower revenues and profits.
Adverse economic conditions may harm our business.
Unfavorable economic conditions, including recession and disruptions to the credit and financial markets, could cause customers to slow spending. Our consumer access services are discretionary and dependent upon levels of consumer spending. In addition, our business customers are particularly exposed to a weak economy. Diminished corporate spending, corporate downsizing and tightened credit have had, and may continue to have, an adverse effect on revenues and churn rates, and have resulted in, and may continue to result in, increased business customer demands for price reductions in connection with contract renewals. In addition, during challenging economic times our business customers may face issues gaining timely access to sufficient credit, which may impair the ability of our customers to pay for services they have purchased. Any of the above could cause us to increase our allowance for doubtful accounts and write-offs of accounts receivable, to impair amounts capitalized as intangible assets, or otherwise have a material adverse effect on our business, financial position, results of operations and cash flows. Finally, our cash, cash equivalents and marketable securities are subject to general credit, liquidity, market, and interest rate risks, which may be exacerbated by unfavorable economic conditions. If financial markets experience prolonged periods of decline, the value or liquidity of our cash, cash equivalents and marketable securities could decline and result in an other-than-temporary decline in fair value, which could adversely affect our financial condition and operating results.
We are also susceptible to risks associated with the potential financial instability of the vendors and third parties on which we rely to provide services or to which we outsource certain functions. The economic conditions that may affect our customers also could adversely affect vendors and third parties and lead to significant increases in prices, reduction in quality or the bankruptcy of our vendors or third
13
parties upon which we rely. Any interruption in the services provided by our vendors or by third parties could adversely affect our business, financial position, results of operations and cash flows.
We may not be able to execute our business strategy for our Business Services segment, which could adversely impact our results of operations and cash flows.
Revenues for our Business Services segment, which primarily consist of New Edge revenues, have been declining due to economic and competitive pressures. This decline in revenue impacts our ability to leverage our fixed cost network infrastructure. New Edge has a network and cost structure designed to support a larger revenue stream. We are continuing to evaluate ways to create more scale in our New Edge business, and are closely managing operating costs and expenses. However, to achieve and sustain operating profitability in our business services segment, we must generate revenue growth, align our cost structure with revenue trends and otherwise manage this business efficiently. In addition, in order to generate revenue growth, we could incur significant upfront costs to acquire new customers. There can be no assurance that we will be able to reduce our operating expenses commensurate with the revenue decline or create more scale in this business. The inability to reduce operating expenses or create scale could have an adverse impact on our business, financial condition, results of operations and cash flows.
Our commercial and alliance arrangements may not be renewed or may not generate expected benefits, which could adversely affect our results of operations.
A significant number of our new subscribers have been generated through strategic alliances, including through our marketing alliance with Time Warner Cable and Bright House Networks. Generally, our strategic alliances and marketing relationships are not exclusive and may have a short term. In addition, as our agreements expire or otherwise terminate we may be unable to renew or replace these agreements on comparable terms, or at all. Our inability to maintain our marketing relationships or establish new marketing relationships could result in delays and increased costs in adding paying subscribers and adversely affect our ability to add new customers, which could, in turn, have a material adverse effect on us. The number of customers we are able to add through these marketing relationships is dependent on the marketing efforts of our partners, and there is no commitment for these partners to provide us with new customers. A significant decrease in the number of gross subscriber additions generated through these relationships could adversely affect the size of our customer base and revenues.
Our business is dependent on the availability of third-party telecommunications service providers.
Our business depends on the capacity, affordability, reliability and security of third-party telecommunications service providers. Only a small number of providers offer the network services we require, and the majority of our telecommunications services are currently purchased from a limited number of telecommunications service providers. Our principal provider for narrowband services is Level 3. Our largest providers of broadband connectivity are AT&T, Comcast, Covad, Qwest, Time Warner Cable and Verizon. We also purchase narrowband services from certain regional and local providers. Telecommunications service providers have merged and may continue to merge, which would reduce the number of suppliers from which we could purchase telecommunications services.
We cannot be certain of renewal or non-termination of our contracts or that legislative or regulatory factors will not affect our contracts. Our results of operations could be materially adversely affected if we are unable to renew or extend contracts with our current network providers on acceptable terms, renew or extend current contracts with our network providers at all, acquire similar network capacity from other network providers, or otherwise maintain or extend our footprint. Additionally, each of our network providers sells network access to some of our competitors and could choose to grant those competitors preferential network access or pricing. Many of our network providers compete with us in the market to provide consumer Internet access. Such events may cause us to incur additional costs, pay increased rates for wholesale access services, increase the retail prices of our service offerings and/or discontinue providing
14
retail access services, any of which could adversely affect our ability to compete in the market for retail access services.
We may be unable to retain sufficient qualified personnel, and the loss of any of our key executive officers could adversely affect us.
Our business depends on the continued services of our senior management and other key personnel and our ability to effectively retain and motivate them. We have implemented various reductions in workforce over the past few years to streamline our business and improve our cost structure. We expect to continue to implement workforce and cost reduction initiatives. This may affect our ability to retain or replace key personnel, harm employee morale and productivity or disrupt our business. In addition, the reductions in workforce have resulted in less redundancy of mission critical roles. Effective succession planning is important to our long-term success. Failure to ensure effective transfer of knowledge and transitions involving key employees could hinder execution of our business strategies. Finally, the loss of any of our key executives could have a material adverse effect on us.
We may be unsuccessful in making and integrating acquisitions into our business, which could result in operating difficulties, losses and other adverse consequences.
In the past, we have acquired businesses, technologies, subscriber bases from ISPs, services, products and other assets, including our acquisition of New Edge and PeoplePC. We expect to continue to evaluate and consider potential strategic transactions that we believe may complement our business. At any given time, we may be engaged in discussions or negotiations with respect to one or more of such transactions that may be material to our financial condition and results of operations. There can be no assurance that any such discussions or negotiations will result in the consummation of any transaction.
These transactions involve significant challenges and risks including diversion of management's attention from our other businesses; the impact on employee morale and retention; the integration of new employees, business systems and technology; the need to implement controls, procedures and policies or the need to remediate significant control deficiencies that may exist at acquired companies; potential unknown liabilities; or any other unforeseen operating difficulties. These factors could adversely affect our operating results or financial condition.
We may not realize the anticipated benefits of acquisitions or we may not realize them in the time frame expected. Additionally, future acquisitions may result in the dilutive issuances of equity securities, use of our cash resources, incurrence of debt or contingent liabilities, amortization expense related to acquired definite-lived intangible assets or the potential impairment of amounts capitalized as intangible assets, including goodwill. Any of these items could have a material adverse affect on our business, financial condition, results of operations and cash flows.
If we do not continue to innovate and provide products and services that are useful to subscribers, we may not remain competitive, and our revenues and operating results could suffer.
The market for Internet and telecommunications services is characterized by changing technology, changes in customer needs and frequent new service and product introductions. Our future success will depend, in part, on our ability to use leading technologies effectively, to continue to develop our technical expertise, to enhance our existing services and to develop new services that meet changing customer needs on a timely and cost-effective basis. We may not be able to adapt quickly enough to changing technology, customer requirements and industry standards. Such changes could include acceleration of the adoption of broadband due to government funding to deploy broadband to rural areas. If we fail to use new technologies effectively, to develop our technical expertise and new services, or to enhance existing services on a timely basis, either internally or through arrangements with third parties, our product and service offerings may fail to meet customer needs which could adversely affect our revenues and profitability.
15
Our dial-up Internet access services also rely on their compatibility with other third-party systems and products, including operating systems. Incompatibility with third-party systems and products could adversely affect our ability to deliver our services or a user's ability to access our services. Our dial-up services are dependent on dial-up modems and an increasing number of computer manufacturers do not pre-load their new computers with dial-up modems, requiring the user to separately acquire a modem to access our services. There can be no assurance that, as the dial-up Internet access market declines and new technologies emerge, we will be able to continue to effectively distribute and deliver our dial-up services.
Our business may suffer if third parties used for customer service and technical support and certain billing services are unable to provide these services or terminate their relationships with us.
Our business and financial results depend, in part, on the availability and quality of our customer service and technical support and certain billing services, including collection services. We outsource a majority of our customer service and technical support functions. As a result, we maintain only a small number of internal customer service and technical support personnel. Our Consumer Services segment relies primarily on one customer service and technical support vendor. We are not currently equipped to provide the necessary range of service and support functions in the event that our service providers becomes unable or unwilling to offer these services to us. Our outsourced customer support providers utilize internationally geographically dispersed locations to provide us with customer service and technical support services, and as a result, our customer support providers may become subject to financial, economic, environmental and political risks beyond our or the providers' control, which could jeopardize their ability to deliver customer service and technical support services. We also utilize third parties for certain billing and collection services. If one or more of our service providers does not provide us with quality services, or if our relationship with any of our third party vendors terminates and we are unable to provide those services internally or identify a replacement vendor in an orderly, cost-effective and timely manner, our business, financial position, results of operations and cash flows could suffer.
Interruption or failure of our network and information systems and other technologies could impair our ability to provide our services, which could damage our reputation and harm our operating results.
We depend on network and information systems and other technologies, including those at our technology centers and those of our third party service providers. We may experience service interruptions or system failures in the future. In addition, as we consider potential outsource or network consolidation opportunities, we may experience service interruptions despite our efforts to minimize the impact to customers. Any service interruption adversely affects our ability to operate our business and could result in an immediate loss of revenues. If we experience frequent or persistent system or network failures, our reputation and brand could be permanently harmed. We may make significant capital expenditures to increase the reliability of our systems, but these capital expenditures may not achieve the results we expect. Our systems are vulnerable to damage or interruption from earthquakes and other natural disasters, terrorist attacks, floods, fires, power loss, telecommunications failures, break ins, computer denial of service attacks, computer hackings, computer viruses, worms or other attempts to harm our systems, and similar events. Some of our systems are not fully redundant, and our disaster recovery planning may not be adequate. Further, any security breaches, such as misappropriation, misuse, leakage, falsification or accidental release or loss of information maintained in our information technology systems and networks, including customer, personnel and vendor data, could damage our reputation and require us to expend significant capital and other resources to remedy any such security breach. The occurrence of any such network or information system-related events or security breaches could have a material adverse effect on our business, financial position, results of operations and cash flows.
In addition, our VoIP services, including our E911 service, depend on the proper functioning of facilities and equipment owned and operated by third parties and is, therefore, beyond our control. If our third party service providers fail to maintain these facilities properly, or fail to respond quickly to
16
problems, our customers may experience service interruptions. In addition, our E911 emergency service for our VoIP services is different in significant respects from the emergency calling services offered by traditional wireline telephone companies. Those differences may cause significant delays, or even failures, in callers' receipt of the emergency assistance they need. VoIP providers are not currently protected by legislation, so any resulting liability could be substantial. If interruptions or delays adversely affect the perceived reliability of our service, we may have difficulty attracting new customers and our brand and reputation may be negatively impacted. Any of these factors could cause us to lose revenues, incur greater expenses or cause our reputation or financial results to suffer.
Government regulations could adversely affect our business or force us to change our business practices.
The regulatory environment relating to our business continues to evolve. A number of legislative and regulatory proposals under consideration by federal, state and local governmental entities may lead to the repeal, modification or introduction of laws or regulations which do, or could, affect our business. Our results of operations could be materially adversely affected by future changes of legal and regulatory rights or obligations.
Narrowband Internet access. Currently, narrowband Internet access is classified as an "information service" and is not subject to traditional telecommunications services regulation, such as licensing or pricing regulation. Any change to these rules that would apply per-minute carrier access charges to dial-up Internet access traffic could significantly impact our costs for this service. While Internet traffic is not subject to the FCC's carrier access charge regime, dial-up ISP bound traffic is regulated by the FCC. The FCC has established a uniform, nationwide rate for ISP-bound traffic, but these rules have been criticized by the courts and further judicial scrutiny is expected. Changes to the rules governing dial-up ISP bound traffic could impact our cost of providing this service.
Broadband Internet access. Currently, broadband Internet access is classified as an "information service" and, as a result, cable companies and telephone companies that offer a broadband Internet access information service are not required by the FCC to offer unaffiliated ISPs stand-alone broadband transmission. Accordingly, if our contracts with cable companies and telephone companies were to expire and not be replaced, our broadband Internet access customer base and revenues would be adversely affected.
Forbearance. The Communications Act of 1934, as amended, provides the FCC with the authority to not enforce, or "forbear" from enforcing, statutory requirements and regulations if certain public interest factors are satisfied. If the FCC were to forbear from enforcing regulations that have been established to enable competing broadband Internet access and VoIP, our business could be adversely affected. We expect reform to the FCC's forbearance review process in the near future. The FCC has initiated a proceeding to establish strict evidentiary and filing procedures for review of forbearance petitions.
Internet taxation. The Internet Tax Non-Discrimination Act, which is in effect through November 2014, places a moratorium on taxes on Internet access and multiple, discriminatory taxes on electronic commerce. Certain states have enacted various taxes on Internet access and electronic commerce, and selected states' taxes are being contested on a variety of bases. If these state tax laws are not successfully contested, or if future state and federal laws imposing taxes or other regulations on Internet access and electronic commerce are adopted, our cost of providing Internet access services could be increased and our business could be adversely affected.
Consumer protection. Federal and state governments have adopted consumer protection laws and undertaken enforcement actions to address advertising and user privacy. As part of these efforts, the Federal Trade Commission ("FTC") and some state Attorney General offices have conducted investigations into the privacy practices of companies that collect information about individuals on the Internet. The FTC and various state agencies as well as individuals have investigated and asserted claims against, or instituted inquiries into, ISPs in connection with marketing, billing, customer retention, cancellation and disclosure practices. Our services and business practices, or changes to our services and business practices could subject us to investigation or enforcement actions if we fail to adequately comply with applicable consumer protection laws.
17
Universal Service. While current policy exempts broadband access services from the Universal Service Fund ("USF"), the Congress and FCC may consider expanding the USF to include broadband Internet access services. This change could allow broadband service providers to receive a subsidy for deploying broadband in rural and underserved areas, but it will most likely require broadband service providers to contribute to the fund as well. If broadband Internet access providers become subject to USF contribution obligations, they would likely impose a USF surcharge on end users. Such a surcharge will raise the effective cost of our broadband services to our customers, and could adversely affect customer satisfaction or our revenues and profitability.
CLEC regulation. New Edge is a CLEC that is licensed in most states and subject to both state and federal telecommunications regulation. CLECs, like New Edge, are dependent on certain provisions of the 1996 Telecommunications Act to procure facilities and services from ILECs that are necessary to provide their services. The business of New Edge is highly dependent on rules and rulings from the FCC, legislative actions at both the state and federal level, and rulings from the state public utility commissions. New Edge also must contribute to state and federal universal service funds. In addition, New Edge makes use of the special access services and DSL services of ILECs and other CLECs in order to provide New Edge services to its customers.
VoIP regulation. The current regulatory environment for VoIP services remains unclear, as the decision whether VoIP is an "information service" or "telecommunications service" is still pending. Classifying VoIP as a telecommunications service could require us to obtain a telecommunications license, comply with numerous legacy telephone regulations, and possibly subject the VoIP traffic to inter-carrier access charges, which could result in increased costs.
Other laws and regulations. Our business also is subject to a variety of other U.S. laws and regulations that could subject us to liabilities, claims or other remedies, such as laws relating to bulk email or "spam," access to various types of content by minors, anti-spyware initiatives, encryption, data protection, data retention and security breaches. Compliance with these laws and regulations is complex and may require significant costs. In addition, the regulatory framework relating to Internet services is evolving and both the federal government and states from time to time pass legislation that impacts our business. It is likely that additional laws and regulations will be adopted that would affect our business. We cannot predict the impact future laws, regulatory changes or developments may have on our business, financial condition, results of operations or cash flows. The enactment of any additional laws or regulations, increased enforcement activity of existing laws and regulations, or claims by individuals could significantly impact our costs or the manner in which we conduct business, all of which could adversely impact our results of operations and cause our business to suffer.
Privacy concerns relating to our business could damage our reputation and deter current and potential users from using our services.
Concerns about our practices with regard to the collection, use, disclosure or security of personal information or other privacy-related matters, even if unfounded, could damage our reputation and operating results. We strive to comply with all applicable data protection laws and regulations, as well as our own posted privacy policies. However, any failure or perceived failure to comply with these laws, regulations or policies may result in proceedings or actions against us by government entities or others, which could potentially have an adverse effect on our business.
In addition, as our services are web-based, we store a substantial amount of data on our servers for customers (including personal information). Any systems failure or compromise of our security that results in the release of our users' data could increase subscriber churn as well as limit our ability to attract new customers by damaging our reputation and brand. We may also need to expend significant resources to protect against security breaches.
18
We may not be able to protect our intellectual property.
We regard our EarthLink, PeoplePC and New Edge Networks trademarks as valuable assets to our business. In particular, we believe the strength of the EarthLink brand among existing and potential customers is important to the success of our business. Additionally, our EarthLink, PeoplePC and New Edge Networks service marks, proprietary technologies, domain names and similar intellectual property are also important to the success of our business. We principally rely upon trademark law as well as contractual restrictions to establish and protect our technology and proprietary rights and information. We require employees and consultants and, when possible, suppliers and distributors to sign confidentiality agreements, and we generally control access to, and distribution of, our technologies, documentation and other proprietary information. The efforts we have taken to protect our proprietary rights may not be sufficient or effective. Third parties may infringe or misappropriate our trademarks and similar proprietary rights. If we are unable to protect our proprietary rights from unauthorized use, our brand image may be harmed and our business may suffer. In addition, protecting our intellectual property and other proprietary rights is expensive and time consuming. Any increase in the unauthorized use of our intellectual property could make it more expensive to do business and consequently harm our operating results.
We may be accused of infringing upon the intellectual property rights of third parties, which is costly to defend and could limit our ability to use certain technologies in the future.
From time to time, third parties have alleged that we infringe on their intellectual property rights. We have been subject to, and expect to continue to be subject to, claims and legal proceedings regarding alleged infringement by us of the patents, trademarks and other intellectual property rights of third parties. None of these claims has had an adverse effect on our ability to market and sell and support our services. Such claims, whether or not meritorious, are time-consuming and costly to resolve, and could require expensive changes in our methods of doing business, could require us to enter into costly royalty or licensing agreements, or could require us to cease conducting certain operations. Any of these events could result in increases in operating expenses or could limit or reduce the number of our service offerings.
If we are unable to successfully defend against legal actions, we could face substantial liabilities.
We are currently a party to various legal actions, including consumer class action and patent litigation. Defending against these lawsuits may involve significant expense and diversion of management's attention and resources from other matters. Due to the inherent uncertainties of litigation, we may not prevail in these actions. In addition, our ongoing operations may subject us to litigation risks and costs in the future. Both the costs of defending lawsuits and any settlements or judgments against us could materially and adversely affect our results of operations.
Our business depends on effective business support systems, processes and personnel.
Our business relies on our data, billing and other operational and financial reporting and control systems. To effectively manage our technical support infrastructure, we will need to continue to maintain our data, billing, and other operational and financial systems, procedures and controls, which can be costly. We have experienced system failures from time to time, and any interruption in the availability of our business support systems, in particular our billing system, could result in an immediate, and possibly substantial, loss of revenues. Frequent or persistent system failures could cause customers to believe our systems are unreliable, leading them to switch to our competitors and could permanently harm our reputation.
19
As a result of our continuing review of our business, we may have to undertake further restructuring plans that would require additional charges, including incurring facility exit and restructuring charges.
Over the past few years, we implemented a corporate restructuring plan under which we significantly reduced our workforce and closed or consolidated various facilities. We also completed the divestiture of our municipal wireless broadband operations. We continue to evaluate our business, which may result in additional restructuring activities or changes in estimates to amounts previously recorded. We may choose to divest certain business operations based on our management's assessment of their strategic value to our business, further consolidate or close certain facilities or outsource certain functions. Decisions to eliminate or limit certain business operations in the future could involve the expenditure of capital, consumption of management resources, realization of losses, transition and wind-up expenses, further reduction in workforce, impairment of the value of purchased assets, facility consolidation and the elimination of revenues along with associated costs, any of which could cause our operating results to decline and may fail to yield the expected benefits. Engaging in further restructuring activities could result in additional charges and costs, including facility exit and restructuring costs, and could adversely affect our business, financial position, results of operations and cash flows.
We may be required to recognize additional impairment charges on our goodwill and intangible assets, which would adversely affect our results of operations and financial position.
We have recorded goodwill and other intangible assets in connection with our acquisitions. We perform an impairment test of our goodwill and indefinite-lived intangible assets annually during the fourth quarter of our fiscal year or when events occur or circumstances change that would more likely than not indicate that goodwill or any such assets might be impaired. We evaluate the recoverability of our definite-lived intangible assets for impairment when events occur or circumstances change that would indicate that the carrying amount of an asset may not be recoverable. Factors that may be considered a change in circumstances, indicating that the carrying value of our goodwill or intangible assets may not be recoverable, include a decline in stock price and market capitalization, reduced future cash flow estimates, and slower growth rates in our industry. We have experienced impairment charges in the past, and recognized an impairment charge of $24.1 million during the fourth quarter of 2009 related to our Business Services segment. As a result, there is no remaining carrying value related to Business Services goodwill. As we continue to assess the ongoing expected cash flows and carrying amounts of our remaining goodwill and other intangible assets, which relate primarily to our Consumer Services segment, changes in economic conditions, changes to our business strategy, changes in operating performance or other indicators of impairment could cause us to realize a significant impairment charge, negatively impacting our results of operations and financial position.
We may have exposure to greater than anticipated tax liabilities and the use of our net operating losses and certain other tax attributes could be limited in the future.
As of December 31, 2009, we had approximately $350.0 million of tax net operating losses for federal income tax purposes and approximately $178.0 million of tax net operating losses for state income tax purposes. The tax net operating losses for federal income tax purposes begin to expire in 2020 and the tax net operating losses for state income tax purposes began to expire in 2010.
Our future income taxes could be adversely affected by changes in the valuation of our deferred tax assets and liabilities or by changes in tax laws, regulations, accounting principles or interpretations thereof. Our determination of our tax liability is always subject to review by applicable tax authorities. Any adverse outcome of such a review could have a negative effect on our operating results and financial condition. In addition, the determination of our provision for income taxes and other tax liabilities requires significant judgment, and there are many transactions and calculations where the ultimate tax determination is uncertain. Although we believe our estimates are reasonable, the ultimate tax outcome may differ from the
20
amounts recorded in our financial statements and may materially affect our financial results in the period or periods for which such determination is made.
Currently, our tax net operating losses can accumulate and be used to offset any of our future taxable income. However, an "ownership change" that occurs during a "testing period" (as such terms are defined in Section 382 of the Internal Revenue Code of 1986, as amended) could place significant limitations, on an annual basis, on the use of such net operating losses to offset future taxable income we may generate. In general, future stock transactions and the timing of such transactions could cause an "ownership change" for income tax purposes. Such transactions may include our purchases under our share repurchase program, additional issuances of common stock by us (including but not limited to issuances upon future conversion of our outstanding convertible senior notes), and acquisitions or sales of shares by certain holders of our shares, including persons who have held, currently hold, or may accumulate in the future five percent or more of our outstanding stock. Many of these transactions are beyond our control. Calculations of an "ownership change" under Section 382 are complex and to some extent are dependent on information that is not publicly available. The risk of an "ownership change" occurring could increase if additional shares are repurchased, if additional persons acquire five percent or more of our outstanding common stock in the near future and/or current five percent stockholders increase their interest. Due to this risk, we monitor our purchases of additional shares of our common stock. Since an "ownership change" also could result from a change in control of our company, with subsequent annual limitations on the use of our net operating losses, this could discourage a change in control.
Risks Related to Ownership of Our Common Stock
We may change our cash return strategy.
During 2009, we began paying quarterly cash dividends on our common stock. The payment of future quarterly dividends is discretionary and is subject to determination by our Board of Directors each quarter following its review of our financial condition, results of operations, cash requirements, investment opportunities and such other factors as are deemed relevant by our Board of Directors. Changes in our business needs, including working capital and funding for acquisitions, or a change in tax laws relating to dividends, among other factors, could cause our Board of Directors to decide to reduce, or cease the payment of, dividends in the future. There can be no assurance that we will not decrease or discontinue quarterly cash dividends, and if we do, our stock price could be negatively impacted.
In addition, we could increase the amount of cash dividends paid to shareholders either through a larger quarterly dividend or a special dividend. This could negatively impact our cash flows and reduce our flexibility to engage in other strategic alternatives, such as acquisitions of other businesses. This also could negatively impact our stock price, and may adversely affect our ability to retain key employees or harm employee morale and productivity. We also could engage in a significant stock buyback which could have similar results.
Our stock price may be volatile.
The trading price of our common stock may be subject to fluctuations as we review our strategic alternatives or if we were to decide upon a particular alternative, such as a business combination transaction or a specific capital return strategy. Our stock price also may fluctuate in response to other events and factors, such as quarterly variations in results of operations; changes in financial estimates; unstable economic conditions; changes in recommendations or reduced coverage by securities analysts; the operating and stock price performance of other companies that investors may deem comparable to us; and news reports relating to trends in the markets in which we operate or general economic conditions.
In addition, the stock market in general and the market prices for Internet-related companies have experienced volatility that often has been unrelated to the operating performance of such companies. These broad market and industry fluctuations may adversely affect the price of our stock, regardless of our
21
operating performance. Additionally, volatility or a lack of positive performance in our stock price may adversely affect our ability to retain key employees, many of whom have been granted stock incentive awards.
Our indebtedness could adversely affect our financial health and limit our ability to react to changes in our industry.
As of December 31, 2009, we had $258.8 million outstanding principal amount of 3.25% Convertible Senior Notes Due 2026 (the "Notes"). Our indebtedness could have important consequences to us. For example, it could:
- •
- require us to dedicate a substantial portion of our cash flows from operations to payments on our indebtedness, thereby
reducing the availability of our cash flow to fund our business activities;
- •
- limit our ability to secure additional financing, if necessary;
- •
- increase our vulnerability to general adverse economic and industry conditions; and
- •
- limit our flexibility in planning for, or reacting to, changes in our business and the industry in which we operate.
Holders of the Notes have the right to require us to repurchase the Notes on November 15, 2011, November 15, 2016 and November 15, 2021 or upon the occurrence of a fundamental change prior to maturity. In addition, under the terms of the indenture governing the Notes, our payment of cash dividends requires an adjustment to the conversion rate for the Notes, and as a result of the adjustment, the Notes may be surrendered for conversion for a period of time between the declaration date and the record date, as defined in the indenture, for the consideration provided for in the indenture. During the year ended December 31, 2009, we began declaring dividends on our common stock, and $3.0 million of Notes were surrendered for conversion in January 2010. The number of holders who require us to repurchase the Notes could increase as we continue to declare dividends. Upon conversion of the Notes, we are required to deliver cash equal to the lesser of the aggregate principal amount of the Notes to be converted and the total conversion obligation. We may use cash, shares of common stock or a combination thereof, at our option, for the remainder, if any, of the conversion obligation. We may not have sufficient funds to make the required cash payment upon conversion or to purchase or repurchase the Notes in cash at such time or the ability to arrange necessary financing on acceptable terms. In addition, the requirement to pay the fundamental change repurchase price, including the related make whole premium, may discourage a change in control of our company.
Provisions of our second restated certificate of incorporation, amended and restated bylaws and other elements of our capital structure could limit our share price and delay a change of management.
Our second restated certificate of incorporation, amended and restated bylaws and shareholder rights plan contain provisions that could make it more difficult or even prevent a third party from acquiring us without the approval of our incumbent board of directors. These provisions, among other things:
- •
- divide the board of directors into three classes, with members of each class to be elected in staggered
three-year terms;
- •
- limit the right of stockholders to call special meetings of stockholders; and
- •
- authorize the board of directors to issue preferred stock in one or more series without any action on the part of stockholders.
These provisions could limit the price that investors might be willing to pay in the future for shares of our common stock and significantly impede the ability of the holders of our common stock to change management. In addition, we have adopted a rights plan, which has anti-takeover effects. The rights plan, if triggered, could cause substantial dilution to a person or group that attempts to acquire our common
22
stock on terms not approved by the board of directors. These provisions and agreements that inhibit or discourage takeover attempts could reduce the market value of our common stock.
Item 1B. Unresolved Staff Comments.
None.
We lease various properties in the United States with expiration dates through 2014. We use these properties for operations, data centers and executive and administrative purposes. Our corporate headquarters is in Atlanta, Georgia where we occupy approximately 98,000 square feet under a lease that will expire in 2014. We occupy 55,000 square feet in Pasadena, California for operations and corporate offices under a lease that will expire in 2014 and 53,000 square feet in Vancouver, Washington for operations and corporate offices under a lease that will expire in 2012. We also own a data center facility in Atlanta, Georgia.
We currently have facilities in excess of our needs, and have entered into or plan to enter into various sublease agreements for our unused office and technical space. We believe the facilities we are retaining are suitable and adequate for our business operations. For additional information regarding our obligations under property leases, see Note 14 in our Notes to Consolidated Financial Statements included in Item 8 of Part II of this Annual Report on Form 10-K.
We are a party to various legal proceedings that are ordinary and incidental to our business. Management does not expect that any currently pending legal proceedings will have a material adverse effect on our results of operations or financial position.
Item 4. Submission of Matters to a Vote of Security Holders.
During the quarter ended December 31, 2009, there were no matters submitted to a vote of security holders.
23
Item 5. Market for Registrant's Common Equity, Related Stockholder Matters and Issuer Purchases of Equity Securities.
Market Information
Our common stock is traded on the Nasdaq Global Market under the symbol "ELNK." The following table sets forth the high and low sale prices for our common stock for the periods indicated, as reported by the Nasdaq Global Market.
| |
EarthLink, Inc. | ||||||
|---|---|---|---|---|---|---|---|
| |
High | Low | |||||
Year Ended December 31, 2008 |
|||||||
First Quarter |
$ | 7.94 | $ | 6.23 | |||
Second Quarter |
10.16 | 7.51 | |||||
Third Quarter |
9.78 | 7.25 | |||||
Fourth Quarter |
8.41 | 5.52 | |||||
Year Ended December 31, 2009 |
|||||||
First Quarter |
$ | 7.83 | $ | 6.02 | |||
Second Quarter |
8.17 | 6.43 | |||||
Third Quarter |
8.75 | 7.30 | |||||
Fourth Quarter |
8.93 | 7.92 | |||||
Year Ending December 31, 2010 |
|||||||
First Quarter (through January 29, 2010) |
$ | 8.60 | $ | 8.09 | |||
The last reported sale price of our common stock on the Nasdaq Global Market on January 29, 2010 was $8.11 per share.
Holders
There were approximately 1,784 holders of record of our common stock on January 29, 2010.
Dividends
During 2009, we began paying quarterly cash dividends. In July 2009, our Board of Directors declared a quarterly cash dividend on our common stock of $0.14 per share to stockholders of record on September 14, 2009, which was paid in September 2009 and totaled $15.0 million. In October 2009, our Board of Directors declared a quarterly cash dividend on our common stock of $0.14 per share to stockholders of record on December 9, 2009, which was paid in December 2009 and totaled $15.0 million. In January 2010, our Board of Directors declared a quarterly cash dividend on our common stock of $0.14 per share to stockholders of record on March 12, 2010 to be paid in March 2010. We currently intend to continue to pay regular quarterly dividends on our common stock. Any decision to declare future dividends will be made at the discretion of the Board of Directors and will depend on, among other things, our results of operations, financial condition, cash requirements, investment opportunities and other factors the Board of Directors may deem relevant. Prior to 2009, we had never declared or paid cash dividends on our common stock.
24
Performance Graph
The following indexed line graph indicates our total return to stockholders from December 31, 2004 to December 31, 2009, as compared to the total return for the Nasdaq Global Market and the Morgan Stanley Internet Index for the same period. The calculations in the graph assume that $100 was invested on December 31, 2004 in our common stock and each index and also assumes dividend reinvestment.
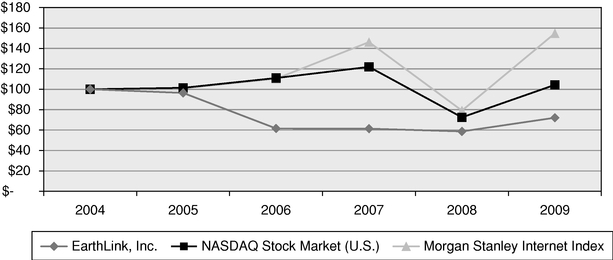
| |
December 31, 2004 |
December 31, 2005 |
December 31, 2006 |
December 31, 2007 |
December 31, 2008 |
December 31, 2009 |
|||||||||||||
|---|---|---|---|---|---|---|---|---|---|---|---|---|---|---|---|---|---|---|---|
EarthLink, Inc. |
100.0 | 96.4 | 61.6 | 61.4 | 58.7 | 74.6 | |||||||||||||
Nasdaq Global Market |
100.0 | 101.4 | 111.0 | 121.9 | 72.5 | 104.3 | |||||||||||||
Morgan Stanley Internet Index |
100.0 | 100.8 | 110.3 | 146.2 | 79.1 | 154.8 | |||||||||||||
25
Item 6. Selected Financial Data.
The following selected consolidated financial data was derived from our consolidated financial statements. The data should be read in conjunction with "Management's Discussion and Analysis of Financial Condition and Results of Operation" and the consolidated financial statements and notes thereto included elsewhere in this Annual Report on Form 10-K.
| |
Year Ended December 31, | ||||||||||||||||
|---|---|---|---|---|---|---|---|---|---|---|---|---|---|---|---|---|---|
| |
2005 | 2006 | 2007 | 2008 | 2009 | ||||||||||||
| |
(in thousands, except per share amounts) |
||||||||||||||||
Statement of operations data: |
|||||||||||||||||
Revenues |
$ | 1,290,072 | $ | 1,301,072 | $ | 1,215,994 | $ | 955,577 | $ | 723,729 | |||||||
Operating costs and expenses (1)(2) |
1,125,576 | 1,205,431 | 1,167,960 | 790,970 | 541,571 | ||||||||||||
Income from operations |
164,496 | 95,641 | 48,034 | 164,607 | 182,158 | ||||||||||||
Income (loss) from continuing operations (3) |
142,780 | 23,690 | (64,795 | ) | 187,090 | 287,118 | |||||||||||
Loss from discontinued operations (4) |
— | (19,999 | ) | (80,302 | ) | (8,506 | ) | — | |||||||||
Net income (loss) (3) |
142,780 | 3,691 | (145,097 | ) | 178,584 | 287,118 | |||||||||||
Basic net income (loss) per share |
|||||||||||||||||
Continuing operations |
$ | 1.04 | $ | 0.18 | $ | (0.53 | ) | $ | 1.71 | $ | 2.69 | ||||||
Discontinued operations |
— | (0.16 | ) | (0.66 | ) | (0.08 | ) | — | |||||||||
Basic net income (loss) per share |
$ | 1.04 | $ | 0.03 | $ | (1.19 | ) | $ | 1.63 | $ | 2.69 | ||||||
Diluted net income (loss) per share |
|||||||||||||||||
Continuing operations |
$ | 1.02 | $ | 0.18 | $ | (0.53 | ) | $ | 1.68 | $ | 2.66 | ||||||
Discontinued operations |
— | (0.15 | ) | (0.66 | ) | (0.08 | ) | — | |||||||||
Diluted net income (loss) per share |
$ | 1.02 | $ | 0.03 | $ | (1.19 | ) | $ | 1.61 | $ | 2.66 | ||||||
Cash dividends declared per common share |
$ | — | $ | — | $ | — | $ | — | $ | 0.28 | |||||||
Basic weighted average common shares outstanding |
137,080 | 128,790 | 121,633 | 109,531 | 106,909 | ||||||||||||
Diluted weighted average common shares outstanding |
139,950 | 130,583 | 121,633 | 111,051 | 108,084 | ||||||||||||
Cash flow data: |
|||||||||||||||||
Cash provided by operating activities |
$ | 188,704 | $ | 115,249 | 88,789 | 230,612 | 208,622 | ||||||||||
Cash (used in) provided by investing activities |
(65,081 | ) | (283,064 | ) | 13,936 | 107,124 | (37,121 | ) | |||||||||
Cash (used in) provided by financing activities |
(169,239 | ) | 152,890 | (87,267 | ) | (24,999 | ) | (47,070 | ) | ||||||||
26
| |
As of December 31, | |||||||||||||||
|---|---|---|---|---|---|---|---|---|---|---|---|---|---|---|---|---|
| |
2005 | 2006 | 2007 | 2008 | 2009 | |||||||||||
| |
(in thousands) |
|||||||||||||||
Balance sheet data: |
||||||||||||||||
Cash and cash equivalents |
$ | 173,294 | $ | 158,369 | $ | 173,827 | $ | 486,564 | $ | 610,995 | ||||||
Investments in marketable securities |
248,825 | 236,407 | 114,768 | 47,809 | 84,966 | |||||||||||
Cash and marketable securities |
422,119 | 394,776 | 288,595 | 534,373 | 695,961 | |||||||||||
Total assets |
749,149 |
966,298 |
729,970 |
845,866 |
1,074,618 |
|||||||||||
Long-term debt, including long-term portion of capital leases (5) |
1,067 | 198,223 | 208,472 | 219,733 | 232,248 | |||||||||||
Total liabilities |
227,285 | 448,616 | 415,452 | 359,391 | 340,594 | |||||||||||
Accumulated deficit |
(1,049,982 | ) | (1,046,293 | ) | (1,191,390 | ) | (1,016,833 | ) | (729,715 | ) | ||||||
Stockholders' equity |
521,864 | 517,682 | 314,518 | 486,475 | 734,024 | |||||||||||
- (1)
- Operating
costs and expenses for the years ended December 31, 2008 and 2009 include non-cash impairment charges of $78.7 million
and $24.1 million, respectively, related to goodwill and certain intangible assets of New Edge in our Business Services segment. We concluded the carrying value of these assets were impaired in
conjunction with our annual tests of goodwill and intangible assets deemed to have indefinite lives.
- (2)
- During
the years ended December 31, 2008 and 2009, we recorded income tax benefits in the Statement of Operations of approximately
$56.1 million and $198.8 million, respectively, from releases of our valuation allowance related to deferred tax assets. These deferred tax assets related primarily to net operating loss
carryforwards which we determined we will more likely than not be able to utilize due to the generation of sufficient taxable income in the future.
- (3)
- On
January 1, 2009, we adopted new accounting guidance related to accounting for convertible debt instruments that may be settled in cash upon
conversion. The new accounting guidance requires that the liability and equity components of convertible debt instruments that may be settled in cash upon conversion (including partial cash
settlement) be separately accounted for in a manner that reflects an issuer's non-convertible debt borrowing rate. The resulting debt discount is accreted over the period the convertible
debt is expected to be outstanding as additional non-cash interest expense. Retrospective application to all periods presented is required. The adoption of this new guidance on
January 1, 2009 affected the accounting for our Convertible Senior Notes due November 15, 2026 (the "Notes"), which were issued in November 2006. As a result of this new guidance, we
recognized additional non-cash interest expense of $1.3 million, $10.0 million, $11.0 million and $12.2 million during the years ended December 31, 2006,
2007, 2008 and 2009, respectively, and will recognize additional non-cash interest expense of $13.4 million and $12.4 million during the years ending December 31, 2010
and 2011, respectively.
- (4)
- In
November 2007, management concluded that the municipal wireless broadband operations were no longer consistent with our strategic direction and our Board
of Directors authorized management to pursue the divestiture of our municipal wireless broadband assets. As a result of that decision, we classified the municipal wireless broadband assets as held for
sale and presented the municipal wireless broadband operations as discontinued operations for all periods presented.
- (5)
- Includes the carrying amount of our Notes, which was $198.0 million, $208.3 million, $219.7 million and $232.2 million as of December 31, 2006, 2007, 2008 and 2009, respectively. During November 2006, we issued $258.8 million aggregate principal amount of Notes in a registered offering. The Notes are convertible on October 15, 2011 and upon certain events. We have the option to redeem the Notes, in whole or in part, for cash, on or after November 15, 2011, provided that we have made at least ten semi-annual interest payments. In addition, the holders may require us to purchase all or a
27
portion of their Notes on each of November 15, 2011, November 15, 2016 and November 15, 2021. During 2009, we began paying quarterly cash dividends on our common stock. This requires an adjustment to the conversion rate for the Notes and opens a conversion period for holders. As a result, the Notes were classified as a current liability in our Consolidated Balance Sheet as of December 31, 2009.
Item 7. Management's Discussion and Analysis of Financial Condition and Results of Operation.
The following discussion of our financial condition and results of operations should be read in conjunction with the consolidated financial statements and notes thereto included elsewhere in this Annual Report on Form 10-K.
Safe Harbor Statement
The Management's Discussion and Analysis and other portions of this Annual Report on Form 10-K include "forward-looking" statements (rather than historical facts) that are subject to risks and uncertainties that could cause actual results to differ materially from those described. Although we believe that the expectations expressed in these forward-looking statements are reasonable, we cannot promise that our expectations will turn out to be correct. Our actual results could be materially different from and worse than our expectations. With respect to such forward-looking statements, we seek the protections afforded by the Private Securities Litigation Reform Act of 1995. These risks include, without limitation (1) that the continued decline of our consumer access subscribers, combined with the change in mix of our consumer access subscriber base from narrowband to broadband, will adversely affect our results of operations; (2) that we will have less ability in the future to implement cost reduction initiatives to offset our revenue declines, which will adversely affect our results of operations; (3) that we face significant competition which could reduce our profitability; (4) that adverse economic conditions may harm our business; (5) that we may not be able to execute our business strategy for our Business Services segment, which could adversely impact our results of operations and cash flows; (6) that our commercial and alliance arrangements may not be renewed or may not generate expected benefits, which could adversely affect our results of operations; (7) that our business is dependent on the availability of third-party telecommunications service providers; (8) that we may be unable to retain sufficient qualified personnel, and the loss of any of our key executive officers could adversely affect us; (9) that we may be unsuccessful in making and integrating acquisitions into our business, which could result in operating difficulties, losses and other adverse consequences; (10) that if we do not continue to innovate and provide products and services that are useful to subscribers, we may not remain competitive, and our revenues and operating results could suffer; (11) that our business may suffer if third parties used for customer service and technical support and certain billing services are unable to provide these services or terminate their relationships with us; (12) that interruption or failure of our network and information systems and other technologies could impair our ability to provide our services, which could damage our reputation and harm our operating results; (13) that government regulations could adversely affect our business or force us to change our business practices; (14) that privacy concerns relating to our business could damage our reputation and deter current and potential users from using our services; (15) that we may not be able to protect our intellectual property; (16) that we may be accused of infringing upon the intellectual property rights of third parties, which is costly to defend and could limit our ability to use certain technologies in the future; (17) that if we are unable to successfully defend against legal actions we could face substantial liabilities; (18) that our business depends on effective business support systems, processes and personnel; (19) that as a result of our continuing review of our business, we may have to undertake further restructuring plans that would require additional charges, including incurring facility exit and restructuring charges; (20) that we may be required to recognize additional impairment charges on our goodwill and intangible assets, which would adversely affect our results of operations and financial position; (21) that we may have exposure to greater than anticipated tax liabilities and the use of our net operating losses and certain other tax attributes could be limited in the future; (22) that we may change our cash return
28
strategy; (23) that our stock price may be volatile; (24) that our indebtedness could adversely affect our financial health and limit our ability to react to changes in our industry; and (25) that provisions of our second restated certificate of incorporation, amended and restated bylaws and other elements of our capital structure could limit our share price and delay a change of management. These risks and uncertainties are described in greater detail in Item 1A of Part I, "Risk Factors."
Overview
EarthLink, Inc. is an Internet service provider ("ISP"), providing nationwide Internet access and related value-added services to individual and business customers. Our primary service offerings are dial-up and high-speed Internet access services and related value-added services, such as ancillary services sold as add-on features to our Internet access services, search and advertising. In addition, through our wholly-owned subsidiary, New Edge Networks ("New Edge"), we build and manage IP-based wide area networks for businesses and communications carriers.
We operate two reportable segments, Consumer Services and Business Services. Our Consumer Services segment provides Internet access and related value-added services to individual customers. These services include dial-up and high-speed Internet access and voice-over-Internet Protocol ("VoIP") services, among others. Our Business Services segment provides integrated communications services and related value-added services to businesses and communications carriers. These services include managed IP-based wide area networks, dedicated Internet access and web hosting, among others.
Business Strategy
Our business strategy is to maximize the cash flows generated by our business by focusing on customer retention, operational efficiency and opportunities for growth.
- •
- Customer Retention. We are focused on retaining our
customers. We believe focusing on the customer relationship increases loyalty and reduces churn. We also believe that satisfied customers provide cost benefits, including reduced call center support
costs and reduced bad debt expense. We continue to focus on offering our access services with high-quality customer service and technical support.
- •
- Operational Efficiency. We are focused on improving the
cost structure of our business and aligning our cost structure with trends in our revenue, without impacting the quality of services we provide. We are focused on delivering our services more cost
effectively by reducing and more efficiently handling the number of calls to contact centers, managing cost-effective outsourcing opportunities, managing our network costs, implementing
workforce reduction initiatives and streamlining our internal processes and operations.
- •
- Opportunities for Growth. In response to changes in our business, we have significantly reduced our sales and marketing spending during the past two years. However, we continue to seek to add customers that generate an acceptable rate of return and increase the number of subscribers we add through alliances, partnerships and acquisitions from other ISPs. We continue to evaluate and consider potential strategic transactions that may complement our business. We are also seeking ways to create more scale within our New Edge business.
The primary challenges we face in executing our business strategy are managing the rate of decline in our revenues, aligning costs with trends in our revenue, responding to competition, reducing churn, purchasing cost-effective network services from third-party telecommunications service providers and adding customers that generate an acceptable rate of return. The factors we believe are instrumental to the achievement of our business strategy may be subject to competitive, regulatory and other events and circumstances that are beyond our control. Further, we can provide no assurance that we will be successful in achieving any or all of the strategies identified above, that the achievement or existence of such
29
strategies will favorably impact profitability, or that other factors will not arise that would adversely affect future profitability.
In response to declining revenues, changes in our industry and changes in consumer behavior, we implemented a restructuring plan ("the 2007 Plan") to reduce operating costs and improve the efficiency of our organization. Under the 2007 Plan, we significantly reduced employees, closed or consolidated certain facilities, discontinued certain projects and reduced sales and marketing efforts. The 2007 Plan was primarily implemented during 2007 and 2008. Costs related to the 2007 Plan are included in facility exit and restructuring costs in our Consolidated Statements of Operations. Subsequent to the 2007 Plan, we implemented further workforce reduction and cost-cutting initiatives. We plan to continue to implement cost reduction initiatives and to better and more efficiently manage costs of our business. Costs related to implementing initiatives subsequent to the 2007 Plan, such as employee severance, are included in sales and marketing, operations and customer support and general and administrative expenses in our Consolidated Statements of Operations.
Revenue Sources
The primary component of our revenues is access and service revenues, which consist of narrowband access services (including traditional, fully-featured narrowband access and value-priced narrowband access); broadband access services (including high-speed access via DSL and cable; managed IP-based wide area networks; and VoIP); and web hosting services. We also earn revenues from value-added services, which include revenues from ancillary services sold as add-on features to our Internet access services, such as security products, premium email only, home networking, email storage and Internet call waiting; search revenues; and advertising revenues.
Narrowband access revenues primarily consist of fees charged to customers for dial-up Internet access. Broadband access revenues primarily consist of fees charged for high-speed access services; fees charged for managing IP-based networks; and fees charged for VoIP services. Web hosting revenues consist of fees charged for leasing server space and providing web services that enable customers to build and maintain an effective online presence. Value-added services revenues consist of fees charged for ancillary services; fees charged for paid placements for searches; delivering traffic to EarthLink's partners in the form of subscribers, page views or e-commerce transactions; advertising EarthLink partners' products and services in EarthLink's various online properties and electronic publications; and referring EarthLink customers to partners' products and services.
Trends in our Business
Consumer services. We operate in the Internet access market, which is characterized by intense competition, changing technology, changes in customer needs and new service and product introductions. Consumers continue to migrate from dial-up to broadband access service due to the faster connection and download speeds provided by broadband access, the ability to free up their phone lines and the more reliable and "always on" connection. The pricing for broadband services has been declining, making it a more viable option for consumers who continue to rely on dial-up connections for Internet access. In addition, advanced applications such as online gaming, music downloads, videos and social networking require greater bandwidth for optimal performance, which adds to the demand for broadband access. Our narrowband subscriber base and revenues have been declining and are expected to continue to decline due to the continued maturation of the market for narrowband access. Additionally, our consumer access services are discretionary and dependent upon levels of consumer spending. Unfavorable economic conditions could cause customers to slow spending in the future, which could adversely affect our revenues and churn.
In light of this continued maturation of the market for narrowband access, we refocused our business strategy to significantly reduce our sales and marketing efforts and focus instead on retaining customers
30
and adding customers that have similar characteristics as our tenured customer base and are more likely to produce an acceptable rate of return. While this change has resulted in a decline in our revenues, we expect the rate of revenue decline to decrease as our subscriber base becomes more tenured and churn rates decline. Our consumer subscriber churn rates improved from 5.2% during the year ended December 31, 2007, to 4.4% and 3.6% during the years ended December 31, 2008 and 2009, respectively.
Consistent with trends in the Internet access industry, the mix of our consumer access subscriber base has been shifting from narrowband access to broadband access customers. Consumer broadband access revenues have lower gross margins than narrowband revenues due to the costs associated with delivering broadband services. This change in mix has negatively affected our profitability and we expect this trend to continue as broadband subscribers continue to become a greater proportion of our consumer access subscriber base. However, our consumer broadband access customers also have lower churn rates than our consumer narrowband access customers. Accordingly, we expect to realize benefits from a more tenured subscriber base, such as reduced support costs and lower bad debt expense.
Business services. The markets in which we operate our business services are characterized by industry consolidation, an evolving regulatory environment, the emergence of new technologies and intense competition. We sell our services to end user business customers and to wholesale customers. Our end users range from large enterprises with many locations, to small and medium-sized multi-site businesses to business customers with one site, often a home-based location. Many of our end user customers are retail businesses. Our wholesale customers consist primarily of telecommunications carriers and network resellers. Our business has become more focused on end users as a result of consolidation in the telecommunications industry. In addition, our business customers, including retail businesses, are particularly exposed to a weak economy. We have experienced pressure on revenue and operating expenses for our business services, given the current state of the economy, including increased subscriber acquisition and retention costs necessary to attract and retain subscribers. However, we are seeking ways to grow our business services revenue while operating this segment more efficiently.
2009 Highlights
Total revenues decreased $231.8 million, or 24%, from the year ended December 31, 2008 to the year ended December 31, 2009, as our subscriber base decreased from approximately 2.8 million paying subscribers as of December 31, 2008 to approximately 2.2 million paying subscribers as of December 31, 2009. The decrease in subscribers was attributable to reduced sales and marketing activities, continued competitive pressures and continued maturation of the narrowband Internet access market. Offsetting the decline in total revenues was a $249.4 million, or 32%, decline in total operating costs and expenses. Total operating costs and expenses decreased as our overall subscriber base has decreased and become longer tenured. Our longer tenured customers require less customer service and technical support and have a lower frequency of non-payment. We also experienced benefits from workforce reduction initiatives and other cost cutting initiatives. The decrease in total operating costs and expenses during the year ended December 31, 2009 compared to the prior year period also reflects a decline in goodwill and intangible asset impairments, which decreased $54.5 million from the year ended December 31, 2008 to the year ended December 31, 2009. Net income increased $108.5 million, or 61%, from $178.6 million during the year ended December 31, 2008 to $287.1 million during the year ended December 31, 2009. The increase in net income reflects the changes noted above, as well as a $93.9 million increase in our income tax benefit, primarily due to an increase in the release of our valuation allowance related to our deferred tax assets, and an $8.5 million decrease in loss from discontinued operations, net of tax.
31
Looking Ahead
We expect total revenues to continue to decrease during 2010 as we continue to reduce our sales and marketing efforts and as the market for Internet access continues to mature. However, we expect the rate of revenue decline to decelerate as our customer base becomes longer tenured and churn rates go down. Consistent with trends in the Internet access industry, we expect the mix of our consumer access subscriber base to continue to shift from narrowband access to broadband access customers, which will negatively affect our profitability due to the higher costs associated with delivering broadband services. We also expect economic conditions to put continued pressure on revenue and churn rates for our business services, and may impact revenue and churn for our consumer services. We will continue to evaluate ways to grow revenues or create more scale for our business services. We expect cost savings in 2010 associated with our decreased sales and marketing activities, and decreased telecommunication and support costs from a lower and longer tenured customer base. We will continue to implement cost reduction initiatives. However, we believe that large-scale cost reduction opportunities will be more limited in the future. In addition, although we seek to align our cost structure with trends in our revenue, we do not expect to be able to reduce our cost structure to the same extent as our revenue declines.
Dividends
During 2009, we began paying quarterly cash dividends to shareholders. In July 2009, our Board of Directors declared a quarterly cash dividend on our common stock of $0.14 per share to stockholders of record on September 14, 2009. The dividend was paid in September 2009 and totaled $15.0 million. In October 2009, our Board of Directors declared a quarterly cash dividend on our common stock of $0.14 per share to stockholders of record on December 9, 2009. The dividend was paid in December 2009 and totaled $15.0 million. The Board of Directors also approved the payment of cash dividend amounts on each outstanding restricted stock unit to be paid at the time the restricted stock unit vests. We currently intend to continue to pay regular quarterly dividends on our common stock. Any decision to declare future dividends will be made at the discretion of the Board of Directors and will depend on, among other things, our results of operations, financial condition, cash requirements, investment opportunities and other factors the Board of Directors may deem relevant.
32
Key Operating Metrics
We utilize certain non-financial and operating measures to assess our financial performance. Terms such as churn and average revenue per user ("ARPU") are terms commonly used in our industry. The following table sets forth subscriber and operating data for the periods indicated:
| |
December 31, 2007 |
December 31, 2008 |
December 31, 2009 |
||||||||
|---|---|---|---|---|---|---|---|---|---|---|---|
Subscriber Data (a) |
|||||||||||
Consumer Services |
|||||||||||
Narrowband access subscribers |
2,624,000 | 1,747,000 | 1,225,000 | ||||||||
Broadband access subscribers |
1,059,000 | 896,000 | 804,000 | ||||||||
Total consumer services subscribers |
3,683,000 | 2,643,000 | 2,029,000 | ||||||||
Business Services |
|||||||||||
Narrowband access subscribers |
27,000 | 17,000 | 8,000 | ||||||||
Broadband access subscribers |
66,000 | 59,000 | 54,000 | ||||||||
Web hosting accounts |
100,000 | 87,000 | 75,000 | ||||||||
Total business services subscribers |
193,000 | 163,000 | 137,000 | ||||||||
Total subscribers at end of year |
3,876,000 | 2,806,000 | 2,166,000 | ||||||||
| |
Year Ended December 31, | |||||||||
|---|---|---|---|---|---|---|---|---|---|---|
| |
2007 | 2008 | 2009 | |||||||
Subscriber Activity |
||||||||||
Subscribers at beginning of year |
5,313,000 | 3,876,000 | 2,806,000 | |||||||
Gross organic subscriber additions |
1,994,000 | 666,000 | 419,000 | |||||||
Acquired subscribers |
65,000 | 8,000 | — | |||||||
Adjustment (b) |
(753,000 | ) | (15,000 | ) | (7,000 | ) | ||||
Churn |
(2,743,000 | ) | (1,729,000 | ) | (1,052,000 | ) | ||||
Subscribers at end of year |
3,876,000 | 2,806,000 | 2,166,000 | |||||||
Churn rate (c) |
5.1 | % | 4.4 | % | 3.6 | % | ||||
Consumer Services Data |
||||||||||
Average subscribers (d) |
4,321,000 | 3,130,000 | 2,310,000 | |||||||
ARPU (e) |
$ | 19.77 | $ | 20.76 | $ | 20.76 | ||||
Churn rate (c) |
5.2 | % | 4.4 | % | 3.6 | % | ||||
Business Services Data |
||||||||||
Average subscribers (d) |
207,000 | 179,000 | 149,000 | |||||||
ARPU (e) |
$ | 76.62 | $ | 81.64 | $ | 82.83 | ||||
Churn rate (c) |
2.6 | % | 2.8 | % | 2.6 | % | ||||
33
| |
December 31, 2007 |
December 31, 2008 |
December 31, 2009 |
||||||||
|---|---|---|---|---|---|---|---|---|---|---|---|
Employee Data |
|||||||||||
Consumer Services |
676 | 457 | 339 | ||||||||
Business Services |
307 | 297 | 284 | ||||||||
Total number of employees (f) |
983 | 754 | 623 | ||||||||
Operations and customer support |
499 |
396 |
333 |
||||||||
Sales and marketing |
302 | 207 | 178 | ||||||||
General and administrative |
182 | 151 | 112 | ||||||||
Total number of employees (f) |
983 | 754 | 623 | ||||||||
- (a)
- Subscriber
counts do not include nonpaying customers. Customers receiving service under promotional programs that include periods of free service at
inception are not included in subscriber counts until they become paying customers.
- (b)
- We
had a marketing relationship with Embarq, a spin-off of Sprint Nextel Corporation's ("Sprint") local communications business, under which
EarthLink was the wholesale high-speed ISP for Embarq's local residential and small business customers. In April 2007, our wholesale contract with Embarq expired. As a result, we removed
753,000 wholesale broadband EarthLink-supported Embarq subscribers from our broadband subscriber count and total subscriber count. During the year ended December 31, 2008, we removed 15,000
additional EarthLink-supported Sprint customers from our broadband subscriber counts. During the year ended December 31, 2009, we removed approximately 7,000 satellite subscribers from our
broadband subscriber count and total subscriber count as a result of our sale of these subscriber accounts.
- (c)
- Churn
rate is used to measure the rate at which subscribers discontinue service on a voluntary or involuntary basis. Churn rate is computed by dividing the
average monthly number of subscribers that discontinued service during the year by the average subscribers for the year. Churn rate for the years ended December 31, 2007, 2008 and 2009 excludes
the impact of the adjustments noted in (b) above.
- (d)
- Average
subscribers or accounts is calculated by averaging the ending monthly subscribers or accounts for the thirteen months preceding and including the
end of the year.
- (e)
- ARPU
represents the average monthly revenue per user (subscriber). ARPU is computed by dividing average monthly revenue for the year by the average number
of subscribers for the year. Average monthly revenue used to calculate ARPU includes recurring service revenue as well as nonrecurring revenues associated with equipment and other one-time
charges associated with initiating or discontinuing services.
- (f)
- Represents full-time equivalents.
34
Results of Operations
Consolidated Results of Operations
The following table sets forth statement of operations data for the years ended December 31, 2007 and 2008:
| |
Year Ended December 31, | |
|
||||||||||||||||||
|---|---|---|---|---|---|---|---|---|---|---|---|---|---|---|---|---|---|---|---|---|---|
| |
2007 | 2008 | Change Between 2007 and 2008 |
||||||||||||||||||
| |
|
% of Revenue |
|
% of Revenue |
|||||||||||||||||
| |
Amount | Amount | Amount | % | |||||||||||||||||
| |
(dollars in thousands) |
||||||||||||||||||||
Revenues |
$ | 1,215,994 | 100% | $ | 955,577 | 100% | $ | (260,417 | ) | -21% | |||||||||||
Operating costs and expenses: |
|||||||||||||||||||||
Cost of revenues |
442,697 | 36% | 360,920 | 38% | (81,777 | ) | -18% | ||||||||||||||
Sales and marketing |
291,105 | 24% | 98,212 | 10% | (192,893 | ) | -66% | ||||||||||||||
Operations and customer support |
221,443 | 18% | 136,797 | 14% | (84,646 | ) | -38% | ||||||||||||||
General and administrative |
128,412 | 11% | 93,878 | 10% | (34,534 | ) | -27% | ||||||||||||||
Amortization of intangible assets |
14,672 | 1% | 13,349 | 1% | (1,323 | ) | -9% | ||||||||||||||
Impairment of goodwill and intangible assets |
4,250 | 0% | 78,672 | 8% | 74,422 | * | |||||||||||||||
Facility exit and restructuring costs |
65,381 | 5% | 9,142 | 1% | (56,239 | ) | -86% | ||||||||||||||
Total operating costs and expenses |
1,167,960 | 96% | 790,970 | 83% | (376,990 | ) | -32% | ||||||||||||||
Income from operations |
48,034 | 4% | 164,607 | 17% | 116,573 | 243% | |||||||||||||||
Net losses of equity affiliate |
(111,295 | ) | -9% | — | 0% | 111,295 | -100% | ||||||||||||||
Gain (loss) on investments, net |
(5,585 | ) | 0% | 2,708 | 0% | 8,293 | 148% | ||||||||||||||
Interest income (expense) and other, net |
2,824 | 0% | (12,409 | ) | -1% | (15,233 | ) | 539% | |||||||||||||
Income (loss) from continuing operations before income taxes |
(66,022 | ) | -5% | 154,906 | 16% | 220,928 | 335% | ||||||||||||||
Income tax benefit |
1,227 | 0% | 32,184 | 3% | 30,957 | * | |||||||||||||||
Income (loss) from continuing operations |
(64,795 | ) | -5% | 187,090 | 20% | 251,885 | 389% | ||||||||||||||
Loss from discontinued operations, net of tax |
(80,302 | ) | -7% | (8,506 | ) | -1% | 71,796 | -89% | |||||||||||||
Net income (loss) |
$ | (145,097 | ) | -12% | $ | 178,584 | 19% | $ | 323,681 | 223% | |||||||||||
- *
- denotes percentage is not meaningful or is not calculable
35
The following table sets forth statement of operations data for the years ended December 31, 2008 and 2009:
| |
Year Ended December 31, | |
|
||||||||||||||||||
|---|---|---|---|---|---|---|---|---|---|---|---|---|---|---|---|---|---|---|---|---|---|
| |
2008 | 2009 | Change Between 2008 and 2009 |
||||||||||||||||||
| |
|
% of Revenue |
|
% of Revenue |
|||||||||||||||||
| |
Amount | Amount | Amount | % | |||||||||||||||||
| |
(dollars in thousands) |
||||||||||||||||||||
Revenues |
$ | 955,577 | 100% | $ | 723,729 | 100% | $ | (231,848 | ) | -24% | |||||||||||
Operating costs and expenses: |
|||||||||||||||||||||
Cost of revenues |
360,920 | 38% | 273,755 | 38% | (87,165 | ) | -24% | ||||||||||||||
Sales and marketing |
98,212 | 10% | 59,474 | 8% | (38,738 | ) | -39% | ||||||||||||||
Operations and customer support |
136,797 | 14% | 98,435 | 14% | (38,362 | ) | -28% | ||||||||||||||
General and administrative |
93,878 | 10% | 72,398 | 10% | (21,480 | ) | -23% | ||||||||||||||
Amortization of intangible assets |
13,349 | 1% | 7,749 | 1% | (5,600 | ) | -42% | ||||||||||||||
Impairment of goodwill and intangible assets |
78,672 | 8% | 24,145 | 3% | (54,527 | ) | -69% | ||||||||||||||
Facility exit and restructuring costs |
9,142 | 1% | 5,615 | 1% | (3,527 | ) | -39% | ||||||||||||||
Total operating costs and expenses |
790,970 | 83% | 541,571 | 75% | (249,399 | ) | -32% | ||||||||||||||
Income from operations |
164,607 | 17% | 182,158 | 25% | 17,551 | 11% | |||||||||||||||
Gain (loss) on investments, net |
2,708 | 0% | (1,321 | ) | 0% | (4,029 | ) | -149% | |||||||||||||
Interest expense and other, net |
(12,409 | ) | -1% | (19,804 | ) | -3% | (7,395 | ) | 60% | ||||||||||||
Income from continuing operations before income taxes |
154,906 | 16% | 161,033 | 22% | 6,127 | 4% | |||||||||||||||
Income tax benefit |
32,184 | 3% | 126,085 | 17% | 93,901 | 292% | |||||||||||||||
Income from continuing operations |
187,090 | 20% | 287,118 | 40% | 100,028 | 53% | |||||||||||||||
Loss from discontinued operations, net of tax |
(8,506 | ) | -1% | — | 0% | 8,506 | -100% | ||||||||||||||
Net income |
$ | 178,584 | 19% | $ | 287,118 | 40% | $ | 108,534 | 61% | ||||||||||||
Segment Results of Operations
We operate two reportable segments, Consumer Services and Business Services. We present our segment information along the same lines that our chief executive reviews our operating results in assessing performance and allocating resources. Our Consumer Services segment provides Internet access services and related value-added services to individual customers. These services include dial-up and high-speed Internet access and VoIP services, among others. Our Business Services segment provides integrated communications services and related value-added services to businesses and communications carriers. These services include managed IP-based wide area networks, dedicated Internet access and web hosting, among others.
We evaluate the performance of our operating segments based on segment income from operations. Segment income from operations includes revenues from external customers, related cost of revenues and operating expenses directly attributable to the segment, which include expenses over which segment managers have direct discretionary control, such as advertising and marketing programs, customer support expenses, operations expenses, product development expenses, certain technology and facilities expenses, billing operations and provisions for doubtful accounts. Segment income from operations excludes other income and expense items and certain expenses over which segment managers do not have discretionary control. Costs excluded from segment income from operations include various corporate expenses (consisting of certain costs such as corporate management, human resources, finance and legal), amortization of intangible assets, impairment of goodwill and intangible assets, facility exit and
36
restructuring costs and stock-based compensation expense, as they are not considered in the measurement of segment performance.
The following table set forth segment data for the years ended December 31, 2007, 2008 and 2009:
| |
Year Ended December 31, | 2008 vs. 2007 | 2009 vs. 2008 | ||||||||||||||||||||
|---|---|---|---|---|---|---|---|---|---|---|---|---|---|---|---|---|---|---|---|---|---|---|---|
| |
2007 | 2008 | 2009 | $ Change | % Change | $ Change | % Change | ||||||||||||||||
| |
(dollars in thousands) |
||||||||||||||||||||||
Consumer Services |
|||||||||||||||||||||||
Revenues |
$ | 1,025,408 | $ | 779,876 | $ | 575,412 | $ | (245,532 | ) | -24% | $ | (204,464 | ) | -26% | |||||||||
Cost of revenues |
324,465 | 259,851 | 186,570 | (64,614 | ) | -20% | (73,281 | ) | -28% | ||||||||||||||
Gross margin |
700,943 | 520,025 | 388,842 | (180,918 | ) | -26% | (131,183 | ) | -25% | ||||||||||||||
Direct segment operating expenses |
506,975 | 207,236 | 131,154 | (299,739 | ) | -59% | (76,082 | ) | -37% | ||||||||||||||
Segment operating income |
$ | 193,968 | $ | 312,789 | $ | 257,688 | $ | 118,821 | 61% | $ | (55,101 | ) | -18% | ||||||||||
Business Services |
|||||||||||||||||||||||
Revenues |
$ | 190,586 | $ | 175,701 | $ | 148,317 | $ | (14,885 | ) | -8% | $ | (27,384 | ) | -16% | |||||||||
Cost of revenues |
118,232 | 101,069 | 87,185 | (17,163 | ) | -15% | (13,884 | ) | -14% | ||||||||||||||
Gross margin |
72,354 | 74,632 | 61,132 | 2,278 | 3% | (13,500 | ) | -18% | |||||||||||||||
Direct segment operating expenses |
58,548 | 51,276 | 41,975 | (7,272 | ) | -12% | (9,301 | ) | -18% | ||||||||||||||
Segment operating income |
$ | 13,806 | $ | 23,356 | $ | 19,157 | $ | 9,550 | 69% | $ | (4,199 | ) | -18% | ||||||||||
Consolidated |
|||||||||||||||||||||||
Revenues |
$ | 1,215,994 | $ | 955,577 | $ | 723,729 | $ | (260,417 | ) | -21% | $ | (231,848 | ) | -24% | |||||||||
Cost of revenues |
442,697 | 360,920 | 273,755 | (81,777 | ) | -18% | (87,165 | ) | -24% | ||||||||||||||
Gross margin |
773,297 | 594,657 | 449,974 | (178,640 | ) | -23% | (144,683 | ) | -24% | ||||||||||||||
Direct segment operating expenses |
565,523 | 258,512 | 173,129 | (307,011 | ) | -54% | (85,383 | ) | -33% | ||||||||||||||
Segment operating income |
207,774 | 336,145 | 276,845 | 128,371 | 62% | (59,300 | ) | -18% | |||||||||||||||
Stock-based compensation expense |
19,553 | 20,133 | 13,231 | 580 | 3% | (6,902 | ) | -34% | |||||||||||||||
Amortization of intangible assets |
14,672 | 13,349 | 7,749 | (1,323 | ) | -9% | (5,600 | ) | -42% | ||||||||||||||
Impairment of goodwill and intangible assets |
4,250 | 78,672 | 24,145 | 74,422 | * | (54,527 | ) | -69% | |||||||||||||||
Facility exit and restructuring costs |
65,381 | 9,142 | 5,615 | (56,239 | ) | -86% | (3,527 | ) | -39% | ||||||||||||||
Other operating expenses |
55,884 | 50,242 | 43,947 | (5,642 | ) | -10% | (6,295 | ) | -13% | ||||||||||||||
Income from operations |
$ | 48,034 | $ | 164,607 | $ | 182,158 | $ | 116,573 | 243% | $ | 17,551 | 11% | |||||||||||
- *
- denotes percentage is not meaningful or is not calculable
37
Revenues
The following table presents revenues by groups of similar services and by segment for the years ended December 31, 2007, 2008 and 2009:
| |
Year Ended December 31, | 2008 vs. 2007 | 2009 vs. 2008 | |||||||||||||||||||||
|---|---|---|---|---|---|---|---|---|---|---|---|---|---|---|---|---|---|---|---|---|---|---|---|---|
| |
2007 | 2008 | 2009 | $ Change | % Change | $ Change | % Change | |||||||||||||||||
| |
(dollars in thousands) |
|||||||||||||||||||||||
Consumer Services |
||||||||||||||||||||||||
Access and service |
$ | 897,423 | $ | 682,135 | $ | 503,769 | $ | (215,288 | ) | -24% | $ | (178,366 | ) | -26% | ||||||||||
Value-added services |
127,985 | 97,741 | 71,643 | (30,244 | ) | -24% | (26,098 | ) | -27% | |||||||||||||||
Total revenues |
$ | 1,025,408 | $ | 779,876 | $ | 575,412 | $ | (245,532 | ) | -24% | $ | (204,464 | ) | -26% | ||||||||||
Business Services |
||||||||||||||||||||||||
Access and service |
$ | 187,709 | $ | 172,944 | $ | 146,087 | $ | (14,765 | ) | -8% | $ | (26,857 | ) | -16% | ||||||||||
Value-added services |
2,877 | 2,757 | 2,230 | (120 | ) | -4% | (527 | ) | -19% | |||||||||||||||
Total revenues |
$ | 190,586 | $ | 175,701 | $ | 148,317 | $ | (14,885 | ) | -8% | $ | (27,384 | ) | -16% | ||||||||||
Consolidated |
||||||||||||||||||||||||
Access and service |
$ | 1,085,132 | $ | 855,079 | $ | 649,856 | $ | (230,053 | ) | -21% | $ | (205,223 | ) | -24% | ||||||||||
Value-added services |
130,862 | 100,498 | 73,873 | (30,364 | ) | -23% | (26,625 | ) | -26% | |||||||||||||||
Total revenues |
$ | 1,215,994 | $ | 955,577 | $ | 723,729 | $ | (260,417 | ) | -21% | $ | (231,848 | ) | -24% | ||||||||||
Consolidated revenues
The primary component of our revenues is access and service revenues, which consist of narrowband access services (including traditional, fully-featured narrowband access and value-priced narrowband access); broadband access services (including high-speed access via DSL and cable; VoIP; and managed IP-based wide area networks); and web hosting services. We also earn revenues from value-added services, which include revenues from ancillary services sold as add-on features to our Internet access services, search and advertising. Total revenues were $1.2 billion, $1.0 billion and $0.7 billion during the years ended December 31, 2007, 2008 and 2009, respectively. The decreases over the past three years were primarily due to decreases in our Consumer Services segment, resulting from decreases in average consumer subscribers, which were approximately 4.3 million, 3.1 million and 2.3 million during the years ended December 31, 2007, 2008 and 2009, respectively. These decreases were driven by narrowband and broadband subscribers, as we reduced our sales and marketing efforts in connection with our refocused strategy and as the market for Internet access continued to mature. Also contributing to the decrease in total revenues were decreases in our Business Services segment. The decreases in business services revenue were primarily due to decreases in average business subscribers, which were approximately 207,000, 179,000 and 149,000 during the years ended December 31, 2007, 2008 and 2009, respectively. Slightly offsetting the decreases in our average business subscribers were increases in business services ARPU, which increased due to the shift in mix of our business access subscriber base from business dial-up and high-speed services to IP-based network services.
Consumer services revenues
Access and service. Consumer access and service revenues consist of narrowband access (including traditional, fully-featured narrowband access and value-priced narrowband access) and broadband access services (including high-speed access via DSL and cable and VoIP services). These revenues are derived from fees charged to customers for dial-up Internet access; fees charged for high-speed access services; fees charged for VoIP services; usage fees; shipping and handling fees; and termination fees.
Consumer access and service revenues decreased $215.3 million, or 24%, from the year ended December 31, 2007 to the year ended December 31, 2008 and decreased $178.4 million, or 26%, from the
38
year ended December 31, 2008 to the year ended December 31, 2009. The decreases in consumer access and service revenues were due to decreases in narrowband access and broadband access revenues. Narrowband access revenues decreased due to a decrease in average premium narrowband and value-priced narrowband subscribers resulting from reduced sales and marketing activities and the continued maturation of and competition in the market for narrowband Internet access. During 2008 and 2009, we significantly reduced sales and marketing efforts. We are focusing our efforts primarily on the retention of our customers and adding customers that have similar characteristics of our tenured customer base and are more likely to produce an acceptable rate of return. Average consumer narrowband subscribers were 3.0 million, 2.1 million and 1.5 million during the years ended December 31, 2007, 2008 and 2009. Our value-priced narrowband services comprised a larger proportion of this decrease, as average PeoplePC access subscribers was approximately 50%, 47% and 39% of our average consumer narrowband customer base during the years ended December 31, 2007, 2008 and 2009, respectively. Broadband access revenues decreased due to a decline in average broadband subscribers resulting from reduced sales and marketing efforts and competitive pressures. Average consumer broadband subscribers were 1.3 million, 0.9 million and 0.8 million during the years ended December 31, 2007, 2008 and 2009, respectively. Contributing to the decrease in broadband access revenues during the year ended December 31, 2008 compared to the prior year period was the removal of 753,000 Embarq subscribers effective April 2007.
Offsetting the decline in average consumer subscribers was an improvement in consumer subscriber churn rates, which were 5.2%, 4.4% and 3.6% during the years ended December 31, 2007, 2008 and 2009, respectively. We expect our consumer access and service subscriber base to continue to decrease due to decreased sales and marketing activities, competitive pressures and the continued maturation of the market for narrowband Internet access. However, as our customers become more tenured, we expect our churn rates to decline.
Value-added services revenues. Value-added services revenues consist of revenues from ancillary services sold as add-on features to our Internet access services, such as security products, premium email only, home networking, email storage and Internet call waiting; search revenues; and advertising revenues. We derive these revenues from fees charged for ancillary services; paid placements for searches; delivering traffic to our partners in the form of subscribers, page views or e-commerce transactions; advertising our partners' products and services in our various online properties and electronic publications; and referring our customers to our partners' products and services.
Value-added services revenues decreased $30.2 million, or 24%, from the year ended December 31, 2007 to the year ended December 31, 2008. This was due primarily to decreases in search advertising revenues and in partnership advertising revenues, which resulted from the decline in total average consumer subscribers, from 4.3 million during the year ended December 31, 2007 to 3.1 million during the year ended December 31, 2008. The decline in subscribers also caused sales of ancillary services to decrease.
Value-added services revenues decreased $26.1 million, or 27%, from the year ended December 31, 2008 to the year ended December 31, 2009. This was due primarily to decreases in subscribers for ancillary services, primarily security services, and in search advertising revenues. The decreases resulted from the decline in total average consumer subscribers from 3.1 million during the year ended December 31, 2008 to 2.3 million during the year ended December 31, 2009. However, partially offsetting these decreases was an increase in subscription revenue per subscriber.
Business services revenues
The primary component of business services revenues is access and service revenues, and includes New Edge access and service revenues. Business access and service revenues consist of fees charged for managed IP-based networks; fees charged for Internet access services; installation fees; termination fees; fees for equipment; usage fees; and cost recovery fees billed to customers. Business access and service
39
revenues also consist of web hosting revenues from leasing server space and providing web services to enable customers to build and maintain an effective online presence. We sell our services to end-user business customers and to wholesale customers. Our end users range from large enterprises with many locations, to small and medium-sized multi-site businesses to business customers with one site, often a home-based location. Our wholesale customers consist primarily of telecommunications carriers. Many of our end user customers are retail businesses.
Business access and service revenues decreased $14.8 million, or 8%, from the year ended December 31, 2007 to the year ended December 31, 2008. The decrease was primarily due to a decrease in average business access and service subscribers, comprised of decreases in average web hosting accounts, average New Edge customers and average business narrowband customers. Our wholesale business was also negatively impacted by consolidation in the telecommunications industry. In addition, our business customers are particularly exposed to a weak economy. Our churn rates for business services customers increased during the year ended December 31, 2008 as a result of our customers experiencing downsizing, retail store closures and other business issues resulting from the economic downturn.
Business access and service revenues decreased $26.9 million, or 16%, from the year ended December 31, 2008 to the year ended December 31, 2009. The decrease was primarily due to a decrease in New Edge revenues resulting from a decrease in average subscribers and an increase in promotions and retention incentives necessary to attract and retain subscribers in a difficult economic environment. Although our churn rates decreased during the year ended December 31, 2009 compared to the prior period, the number of new customers we were able to add was negatively impacted by economic and competitive pressures. Also contributing to the decrease in business access and service revenues were decreases in average web hosting accounts, average business broadband customers and average business narrowband customers. Business access and service ARPU increased during the year ended December 31, 2009 compared to the prior period due to the shift in mix of our business access subscriber base from business dial-up and high-speed services to IP-based network services.
Cost of revenues
Cost of revenues consist of telecommunications fees, set-up fees, the costs of equipment sold to customers for use with our services, depreciation of our network equipment and surcharges due to regulatory agencies. Our principal provider for narrowband services is Level 3 Communications, Inc. Our largest providers of broadband connectivity are AT&T Inc., Comcast Corporation, Covad Communications Group, Inc. ("Covad"), Qwest Corporation, Time Warner Cable and Verizon Communications, Inc. We also do lesser amounts of business with a wide variety of local, regional and other national providers. Cost of revenues also includes sales incentives. We offer sales incentives, such as free modems and Internet access on a trial basis, for certain products and promotions.
Total cost of revenues decreased $81.8 million, or 18%, from the year ended December 31, 2007 to the year ended December 31, 2008. This decrease was comprised of a $64.6 million decrease in consumer services cost of revenues and $17.2 million decrease in business services cost of revenue. Consumer services cost of revenues decreased primarily due to the decline in average consumer services subscribers as a result of our refocused strategy. Also contributing to the decrease was a decline in sales incentives resulting from fewer gross subscriber additions during the year ended December 31, 2008, as we reduced our customer acquisition activities. Partially offsetting this decrease was an increase in average consumer cost of revenue per subscriber due to a greater proportion of our consumer subscriber base consisting of broadband subscribers. Business services cost of revenues decreased due to a decrease in average business services subscribers and a decrease in average monthly costs per subscriber, primarily as a result of a decrease in New Edge cost of revenues due to more favorable agreements with telecommunications service providers. Total cost of revenues increased from 36% of revenues to 38% of revenues due to a greater proportion of our subscriber base consisting of broadband subscribers.
40
Total cost of revenues decreased $87.2 million, or 24%, from the year ended December 31, 2008 to the year ended December 31, 2009. This decrease was comprised of a $73.3 million decrease in consumer services cost of revenues and $13.9 million decrease in business services cost of revenue. Consumer services cost of revenues decreased primarily due to the decline in average consumer services subscribers. Also contributing was a decline in average consumer cost of revenue per subscriber resulting from contract renegotiations with network service providers and internal network cost management efforts. Business services cost of revenues decreased due to a decrease in average business services subscribers. Total cost of revenues remained constant at 38% of revenues due to our contract renegotiations and internal network cost management efforts which mitigated the effect of the change in mix of our subscriber base to broadband subscribers.
Sales and marketing
Sales and marketing expenses include advertising and promotion expenses, fees paid to distribution partners to acquire new paying subscribers and compensation and related costs (including stock-based compensation).
Sales and marketing expenses decreased $192.9 million, or 66%, from the year ended December 31, 2007 to the year ended December 31, 2008. The decrease consisted primarily of a decrease in advertising and promotions expense, personnel-related costs and outsourced labor resulting from the change in our business strategy to significantly reduce discretionary sales and marketing spend and benefits from the 2007 Plan. Sales and marketing expenses decreased from 24% of revenues during the year ended December 31, 2007 to 10% of revenues during year ended December 31, 2008, as we reduced sales and marketing efforts that resulted in adding customers that did not provide an acceptable rate of return or that had a pattern of early life churn.
Sales and marketing expenses decreased $38.7 million, or 39%, from the year ended December 31, 2008 to the year ended December 31, 2009. The decrease consisted primarily of decreases in advertising and promotions expense, personnel-related costs, outsourced labor and occupancy and related costs resulting from reduced headcount and continued cost reduction initiatives. Sales and marketing expenses decreased from 10% of revenues during the year ended December 31, 2008 to 8% of revenues during year ended December 31, 2009, as we continued to reduce sales and marketing efforts and focused our efforts primarily on the retention of customers and on marketing channels that are more likely to produce an acceptable rate of return.
Operations and customer support
Operations and customer support expenses consist of costs associated with technical support and customer service, maintenance of customer information systems, software development, network operations and compensation and related costs (including stock-based compensation).
Operations and customer support expenses decreased $84.6 million, or 38%, from the year ended December 31, 2007 to the year ended December 31, 2008. The decrease in operations and customer support expenses consisted of decreases in personnel-related costs, outsourced labor, professional fees and occupancy costs. These decreases were primarily attributable to benefits realized as a result of the 2007 Plan and a decrease in call volumes for customer service and technical support as our overall subscriber base has decreased and become longer tenured. Our longer tenured customers require less customer service and technical support. Operations and customer support expenses decreased from 18% of revenues the year ended December 31, 2007 to 14% of revenues during the year ended December 31, 2008.
Operations and customer support expenses decreased $38.4 million, or 28%, from the year ended December 31, 2008 to the year ended December 31, 2009. The decrease in operations and customer support expenses consisted of decreases in personnel-related costs, outsourced labor and occupancy and related costs. These decreases were primarily attributable to our efforts to reduce our back-office cost
41
structure, including reduced headcount and continued cost reduction initiatives, and a decrease in call volumes for customer service and technical support as our overall subscriber base has decreased and become longer tenured. In addition, we consolidated to primarily one outsourced customer service and technical support provider for our consumer services, which resulted in cost benefits. Operations and customer support expenses remained constant as a percent of revenues at 14% during the years ended December 31, 2008 and 2009.
General and administrative
General and administrative expenses consist of compensation and related costs (including stock-based compensation) associated with our finance, legal, facilities and human resources organizations; fees for professional services; payment processing; credit card fees; collections and bad debt.
General and administrative expenses decreased $34.5 million, or 27%, from the year ended December 31, 2007 to the year ended December 31, 2008. The decrease in general and administrative expenses consisted primarily of decreases in bad debt and payment processing fees, personnel-related costs, professional and legal fees, and stock-based compensation expense. Bad debt and payment processing fees decreased due to the decrease in our overall subscriber base and due to our subscriber base consisting of longer tenured customers, who have a lower frequency of non-payment. The decrease in personnel-related costs, professional and legal fees was attributable to our efforts to reduce our back-office cost structure, including benefits realized as a result of the 2007 Plan. General and administrative expenses decreased from 11% of revenues the year ended December 31, 2007 to 10% of revenues during the year ended December 31, 2008.
General and administrative expenses decreased $21.5 million, or 23%, from the year ended December 31, 2008 to the year ended December 31, 2009. The decreases in general and administrative expenses consisted primarily of decreases in bad debt and payment processing fees, personnel-related costs and legal and professional fees. Bad debt and payment processing fees decreased due to the decrease in our overall subscriber base and due to our subscriber base consisting of longer tenured customers, who have a lower frequency of non-payment. The decrease in personnel-related costs and professional and legal fees was attributable to reduced headcount and continued cost reduction initiatives. Partially offsetting these decreases were costs incurred as a result of certain legal settlements and resolution of various state and local tax issues and audits. As a result of the items noted above, general and administrative expenses remained constant as a percent of revenues at 10% during the years ended December 31, 2008 and 2009.
Amortization of intangible assets
Amortization of intangible assets represents the amortization of definite-lived intangible assets acquired in purchases of businesses and purchases of customer bases from other companies. Definite-lived intangible assets, which primarily consist of subscriber bases and customer relationships, acquired software and technology, trade names and other assets, are amortized on a straight-line basis over their estimated useful lives, which range from three to six years. Amortization of intangible assets decreased $1.3 million, or 9%, from the year ended December 31, 2007 to the year ended December 31, 2008. The decrease in amortization of intangible assets compared to the prior year period was primarily due to certain identifiable definite-lived intangible assets becoming fully amortized over the past year. Amortization of intangible assets decreased $5.6 million, or 42%, from the year ended December 31, 2008 to the year ended December 31, 2009. The decrease in amortization of intangible assets compared to the prior year period was primarily due to certain identifiable definite-lived intangible assets becoming fully amortized over the past year. In addition, we impaired certain identifiable definite-lived intangible assets during the fourth quarter of 2008, which contributed to the decrease in amortization expense.
42
Impairment of goodwill and intangible assets
During the years ended December 31, 2007, 2008 and 2009, we recorded non-cash impairment charges for goodwill and intangible assets of $4.3 million, $78.7 million and $24.1 million, respectively. We test goodwill and indefinite-lived intangible assets for impairment annually or when events or changes in circumstances indicate that the carrying amount of an asset may not be recoverable.
After completing our annual impairment test during the fourth quarter of 2008, we concluded that goodwill and certain intangible assets recorded as a result of our April 2006 acquisition of New Edge were impaired and we recorded non-cash impairment charges related to the New Edge reporting unit of $64.0 million for goodwill, $3.1 million for the indefinite-lived trade name and $11.6 million for customer relationships. The primary factor contributing to the impairment charge was the recent significant economic downturn. New Edge serves a large percentage of small and medium-sized business customers, especially retail businesses, which have been particularly affected by the recent economic downturn. Economic conditions affecting retail businesses worsened substantially during the "holiday season" in the fourth quarter of 2008. As a result, management updated its long-range financial outlook, which reflected decreased expectations of future growth rates and cash flows for New Edge. We used this updated financial outlook in conjunction with our annual impairment test.
After completing our annual impairment test during the fourth quarter of 2009, we concluded that goodwill and certain intangible assets recorded as a result of the New Edge acquisition were further impaired and recorded non-cash impairment charges related to the New Edge reporting unit of $23.9 million for goodwill and $0.2 million for the indefinite-lived trade name. As a result, there is no remaining carrying value related to New Edge goodwill. The primary factor contributing to the impairment charge was continued sales pressure in the small and medium-sized business market due to the economy, which adversely impacted our long-range financial outlook.
Goodwill. Impairment testing of goodwill is required at the reporting unit level and involves a two-step process. Although we operate two reportable segments, Consumer Services and Business Services, we have identified three reporting units for evaluating goodwill, which are Consumer Services, New Edge and Web Hosting. The Consumer Services reportable segment is one reporting unit, while the Business Services reportable segment consists of two reporting units, New Edge and Web Hosting. Each of these reporting units constitutes a business for which discrete financial information is available and segment management regularly reviews the operating results.
The first step of the impairment test involves comparing the estimated fair value of our reporting units with the reporting unit's carrying amount, including goodwill. We estimated the fair values of our reporting units primarily using the income approach valuation methodology that included the discounted cash flow method, taking into consideration the market approach and certain market multiples as a validation of the values derived using the discounted cash flow methodology. The discounted cash flows for each reporting unit were based on discrete financial forecasts developed by management for planning purposes. Cash flows beyond the discrete forecasts were estimated by using a terminal value calculation, which incorporated historical and forecasted financial trends for each identified reporting unit.
Upon completion of the first step of the impairment test during the years ended December 31, 2008 and 2009, we determined that the carrying value of our New Edge reporting unit exceeded its estimated fair value. Because indicators of impairment existed for this reporting unit, we performed the second step of the test. We determined the implied fair value of goodwill in the same manner used to recognize goodwill in a business combination. To determine the implied value of goodwill, we allocated fair values to the assets and liabilities of the New Edge reporting unit. We calculated the implied fair value of goodwill as the excess of the fair value of the New Edge reporting unit over the amounts assigned to its assets and liabilities. We determined the $64.0 million and $23.9 million impairment losses during the years ended December 31, 2008 and 2009, respectively, as the amount by which the carrying value of goodwill exceeded the implied fair value of the goodwill.
43
Indefinite-lived intangible assets. The impairment test for our indefinite-lived intangible assets, which consist of trade names, involves a comparison of the estimated fair value of the intangible asset with its carrying value. We determined the fair value of our trade names using the royalty savings method, in which the fair value of the asset was calculated based on the present value of the royalty stream that we are saving by owning the asset. Given the economic environment and other factors noted above, we decreased our estimates for revenues associated with our New Edge trade name. As a result, we recorded non-cash impairment charges related to our New Edge trade name of $3.1 million and $0.2 million during the years ended December 31, 2008 and 2009, respectively. We also recorded a non-cash impairment charge of $4.3 million during the year ended December 31, 2007 related to the analysis of our other indefinite-lived trade names.
Definite-lived intangible assets. As a result of the goodwill and indefinite-lived asset impairments in the New Edge reporting unit, we also tested this segment's definite-lived intangible assets for impairment. Because of the decrease in expected future cash from such definite-lived intangible assets, we concluded certain customer relationships were not fully recoverable and recorded a non-cash impairment charge of $11.6 million during the year ended December 31, 2008. We did not record any impairment charges for our definite-lived intangible assets during the years ended December 31, 2007 and 2009.
Facility exit and restructuring costs
Facility exit and restructuring costs consisted of the following during the years ended December 31, 2007, 2008 and 2009:
| |
Year Ended December 31, | ||||||||||
|---|---|---|---|---|---|---|---|---|---|---|---|
| |
2007 | 2008 | 2009 | ||||||||
| |
(in thousands) |
||||||||||
2007 Restructuring Plan |
|||||||||||
Severance and personnel-related costs |
$ | 30,303 | $ | 461 | $ | — | |||||
Lease termination and facilities-related costs |
12,216 | 4,808 | 5,697 | ||||||||
Non-cash asset impairments |
20,621 | 4,125 | 46 | ||||||||
Other associated costs |
1,131 | — | — | ||||||||
|
64,271 | 9,394 | 5,743 | ||||||||
Legacy Restructuring Plans |
1,110 | (252 | ) | (128 | ) | ||||||
Total facility exit and restucturing costs |
$ | 65,381 | $ | 9,142 | $ | 5,615 | |||||
2007 Restructuring Plan. In August 2007, we adopted a restructuring plan to reduce costs and improve the efficiency of our operations. The 2007 Plan was the result of a comprehensive review of operations within and across our functions and businesses. Under the 2007 Plan, we reduced our workforce by approximately 900 employees, consolidated our office facilities in Atlanta, Georgia and Pasadena, California and closed office facilities in Orlando, Florida; Knoxville, Tennessee; Harrisburg, Pennsylvania and San Francisco, California. The 2007 Plan was primarily implemented during the latter half of 2007 and during 2008. As a result of the 2007 Plan, we recorded facility exit and restructuring costs of $64.3 million, $9.4 million and $5.7 million during the years ended December 31, 2007, 2008 and 2009, respectively. The asset impairment charges primarily relate to fixed asset write-offs due to facility closings and consolidations and the termination of certain projects for which costs had been capitalized. These assets were impaired as the carrying values of the assets exceeded the expected future undiscounted cash flows to us. Since management continues to evaluate EarthLink's businesses, there have been and may continue to be supplemental provisions for new plan initiatives as well as changes in estimates to amounts previously recorded.
44
Legacy Restructuring Plans. During the years ended December 31, 2003, 2004 and 2005, we executed a series of plans to restructure and streamline our contact center operations and outsource certain internal functions (collectively referred to as "Legacy Plans"). The Legacy Plans included facility exit costs, personnel-related costs and asset disposals. We periodically evaluate and adjust our estimates for facility exit and restructuring costs based on currently-available information and record such adjustments as facility exit and restructuring costs. During the year ended December 31, 2007, we recorded $1.1 million of facility exit and restructuring costs as a result of changes in estimates for Legacy Plans. During the years ended December 31, 2008 and 2009, we recorded reductions of $0.3 million and $0.1 million, respectively, to facility exit and restructuring costs as a result of changes in estimates for Legacy Plans.
Net losses of equity affiliate
We had a joint venture with SK Telecom Co., Ltd., HELIO. HELIO was a non-facilities-based mobile virtual network operator offering mobile communications services and handsets to consumers in the U.S. We accounted for our investment in HELIO under the equity method of accounting because we were able to exert significant influence over HELIO's operating and financial policies. Accordingly, we recorded our proportionate share of HELIO's net losses. These equity method losses were offset by increases in the carrying value of our investment associated with amortizing the difference between the carrying value and fair value of non-cash assets contributed to HELIO.
Net losses of equity affiliate for the year ended December 31, 2007 of $111.3 million included our proportionate share of HELIO's net losses offset by amortization associated with recognizing the difference between the carrying value and fair value of non-cash assets contributed. During the year ended December 31, 2007, we stopped recording additional net losses of equity affiliate because the carrying value of our investment in HELIO was reduced to zero. In August 2008, Virgin Mobile USA, Inc. ("Virgin Mobile") acquired HELIO and our investment in HELIO was exchanged for limited partnership units equivalent to approximately 1.8 million shares of Virgin Mobile common stock. In November 2009, Sprint Nextel and Virgin Mobile completed a merger and we received 2.4 million shares of Sprint Nextel common stock for our Virgin Mobile common stock. As a result, we no longer have an investment in HELIO and we did not record any net losses of equity affiliate during the years ended December 31, 2008 and 2009.
Gain (loss) on investments, net
Gain (loss) on investments, net, consisted of the following during the years ended December 31, 2007, 2008 and 2009:
| |
Year Ended December 31, | |||||||||
|---|---|---|---|---|---|---|---|---|---|---|
| |
2007 | 2008 | 2009 | |||||||
| |
(in thousands) |
|||||||||
Other-than-temporary impairment losses |
$ | (7,142 | ) | $ | (3,556 | ) | $ | (9,300 | ) | |
Cash distributions from investments |
1,557 | — | 231 | |||||||
Gain from sale of Covad common stock |
— | 2,025 | — | |||||||
Gain from receipt of Virgin Mobile shares |
— | 4,352 | — | |||||||
Gain from receipt and sale of Sprint Nextel shares |
— | — | 7,641 | |||||||
Net change in fair value of auction rate securities and put right |
— | (113 | ) | 107 | ||||||
|
$ | (5,585 | ) | $ | 2,708 | $ | (1,321 | ) | ||
We had an investment in Covad consisting of 6.1 million shares of Covad common stock and $47.5 million aggregate principal amount of 12% Senior Secured Convertible Notes due 2011. During the year ended December 31, 2008, Platinum Equity, LLC acquired all outstanding shares of Covad. As a result, we received cash of $6.3 million for our 6.1 million shares of Covad common stock and recognized a gain of $2.0 million based on our cost basis of the Covad common stock.
45
During the year ended December 31, 2008, we received limited partnership units equivalent to approximately 1.8 million shares of Virgin Mobile common stock in exchange for our investment in HELIO. We recognized a gain of $4.4 million as a result of this transaction. During the year ended December 31, 2009, Sprint Nextel and Virgin Mobile completed a merger and we received 2.4 million shares of Sprint Nextel common stock for our Virgin Mobile common stock. During the year ended December 31, 2009, we sold 2.2 million of the Sprint Nextel shares for net proceeds of $8.2 million. We recorded a $7.6 million gain resulting from the receipt of Sprint Nextel shares and the subsequent sale.
As of December 31, 2008 and 2009, we held auction rate securities with a carrying value and fair value of $47.8 million and $42.9 million, respectively. These securities are variable-rate debt instruments whose underlying agreements have contractual maturities of up to 40 years, but have interest rate reset periods at pre-determined intervals, usually every 28 days. These securities are predominantly secured by student loans guaranteed by state related higher education agencies and reinsured by the U.S. Department of Education. Beginning in February 2008, auctions for these securities failed to attract sufficient buyers, resulting in us continuing to hold such securities. In October 2008, we entered into an agreement with the broker that sold us our auction rate securities that gives us the right to sell our existing auction rate securities back to the broker at par plus accrued interest, beginning on June 30, 2010 until July 2, 2012 (herein referred to as "put right"). During 2008, we recorded an other-than-temporary impairment of $9.9 million to reflect the auction rate securities at their fair value, as we no longer had the intent to hold the securities until maturity. We also elected a one-time transfer of our auction rate securities from the available-for-sale category to the trading category. We recorded the value of the put right in our Consolidated Balance Sheet with a corresponding $9.8 million gain on investments in the Consolidated Statement of Operations. We elected the fair value option for the put right to offset the fair value changes of the auction rate securities. The other-than-temporary impairment, net of the gain on the put right, was $0.1 million during the year ended December 31, 2008. During the year ended December 31, 2009, we redeemed $9.6 million of auction rate securities at par and recognized a net gain of $0.1 million resulting from the redemption and net changes in fair value of our auction rate securities and put right.
Interest income (expense) and other, net
Interest income (expense) and other, net, is primarily comprised of interest expense incurred on our Convertible Senior Notes due November 15, 2026 ("Notes"); interest earned on our cash, cash equivalents and marketable securities; and other miscellaneous income and expense items. We recognized net interest income of $2.8 million during the year ended December 31, 2007 compared to net interest expense of $12.4 million during the year ended December 31, 2008. This was primarily due to a decrease in interest earned on our cash, cash equivalents and marketable securities, despite an increase in our average cash and marketable securities balance, due to lower investment yields from deteriorating financial and credit markets. Also contributing to the decrease was the liquidation of our Covad debt investment, which was repurchased by Platinum Equity, LLC in April 2008.
Interest expense and other, net, increased $7.4 million, from $12.4 million during the year ended December 31, 2008 to $19.8 million during the year ended December 31, 2009. The increase was primarily due to a decrease in interest earned on our cash, cash equivalents and marketable securities, despite an increase in our average cash and marketable securities balance, due to lower investment yields from deteriorating financial and credit markets. Also contributing to the increase was an increase in interest expense resulting from an increase in accretion of the debt discount relating to our Notes.
Income tax (provision) benefit
We recognized an income tax benefit of $1.2 million during year ended December 31, 2007, which was primarily due to the change in the deferred tax liability related to long-lived assets. We recognized an income tax benefit of $32.2 million during year ended December 31, 2008. This consisted primarily of a benefit of $56.1 million resulting from the release of a portion of our valuation allowance against our
46
deferred tax assets, primarily related to net operating loss carryforwards. Offsetting this benefit was an income tax provision of $23.9 million recorded during the year ended December 31, 2008. The tax provision consisted of $7.0 million state income and federal and state alternative minimum tax ("AMT") amounts payable due to the net operating loss carryforward limitations associated with the AMT calculation and $16.9 million for non-cash deferred tax provisions associated with the utilization of net operating loss carryforwards which were acquired in connection with acquisitions. We recognized an income tax benefit of $126.1 million during year ended December 31, 2009. This benefit consisted primarily of a benefit of $198.8 million resulting from the release of a portion of our valuation allowance against our deferred tax assets, primarily related to net operating loss carryforwards. During the year ended December 31, 2009, we determined we will more likely than not be able to utilize these deferred tax assets due to the generation of sufficient taxable income in the immediate future. Offsetting this benefit was an income tax provision of $72.6 million, consisting of $9.3 million state income and federal and state AMT amounts payable and $63.3 million for non-cash deferred tax provisions associated with the utilization of net operating loss carryforwards.
We continue to maintain a valuation allowance of $34.1 million against our unrealized deferred tax assets, which include net operating loss carryforwards. Of this amount, $31.7 million relates to net operating losses generated by the tax benefits of certain stock compensation arrangements. The valuation allowance will be removed upon utilization of these net operating losses as an adjustment to additional paid-in-capital. The remaining $2.4 million valuation allowance is retained for net operating losses in certain jurisdictions where there is uncertainty regarding realization.
To the extent we report income in future periods, we intend to use our net operating loss carryforwards to the extent available to offset taxable income and reduce cash outflows for income taxes. Our ability to use our federal and state net operating loss carryforwards and federal and state tax credit carryforwards may be subject to restrictions attributable to equity transactions in the future resulting from changes in ownership as defined under the Internal Revenue Code.
Loss from discontinued operations, net of tax
Loss from discontinued operations, net of tax, during the years ended December 31, 2007 and 2008 reflects our municipal wireless broadband operations. In November 2007, management concluded that our municipal wireless broadband operations were no longer consistent with our strategic direction and our Board of Directors authorized management to pursue the divestiture of our municipal wireless broadband assets. The municipal wireless results of operations were previously included in our Consumer Services segment.
During the year ended December 31, 2008, we transferred our municipal wireless broadband networks to Corpus Christi, TX and Milpitas, CA in exchange for releasing us from our existing network agreements. We also transferred our municipal wireless broadband networks in the city of Philadelphia, PA to a local Philadelphia company. Additionally, we terminated our municipal wireless broadband service in New Orleans, LA and Anaheim, CA and removed our network equipment from those cities. As of December 31, 2008, the divestiture of our municipal wireless broadband assets was complete.
47
The following table presents summarized results of operations related to our discontinued operations for the years ended December 31, 2007 and 2008:
| |
Year Ended December 31, | ||||||
|---|---|---|---|---|---|---|---|
| |
2007 | 2008 | |||||
| |
(in thousands) |
||||||
Revenues |
$ | 2,097 | $ | 1,305 | |||
Operating costs and expenses |
(33,871 | ) | (4,569 | ) | |||
Impairment, facility exit and restructuring costs |
(48,528 | ) | (6,326 | ) | |||
Income tax benefit |
— | 1,084 | |||||
Loss from discontinued operations, net of tax |
$ | (80,302 | ) | $ | (8,506 | ) | |
Loss from discontinued operations, net of tax, decreased $71.8 million from the year ended December 31, 2007 to the year ended December 31, 2008. This was primarily due to a decrease in impairment and facility exit and restructuring costs, as well as a decrease in operating costs and expenses as we discontinued our municipal wireless broadband operations during 2008.
Stock-Based Compensation
We measure stock-based compensation cost for all stock awards at fair value on the date of grant and recognition of compensation over the requisite service period for awards expected to vest. The fair value of our stock options is estimated using the Black-Scholes valuation model, and the fair value of restricted stock units is determined based on the number of shares granted and the quoted price of our common stock on the date of grant. Such value is recognized as expense over the requisite service period, net of estimated forfeitures, using the straight-line attribution method. For performance-based awards, we recognize expense over the requisite service period, net of estimated forfeitures, using the accelerated attribution method when it is probable that the performance measure will be achieved. The estimate of awards that will ultimately vest requires significant judgment, and to the extent actual results or updated estimates differ from management's current estimates, such amounts will be recorded as a cumulative adjustment in the period estimates are revised. We consider many factors when estimating expected forfeitures, including types of awards, employee class and historical employee attrition rates. Actual results, and future changes in estimates, may differ substantially from our current estimates.
Stock-based compensation expense was $19.6 million, $20.1 million and $13.2 million during the years ended December 31, 2007, 2008 and 2009, respectively. Stock-based compensation expense is classified within the same operating expense line items as cash compensation paid to employees. Stock-based compensation was allocated as follows for the years ended December 31, 2007, 2008 and 2009:
| |
Year Ended December 31, | |||||||||
|---|---|---|---|---|---|---|---|---|---|---|
| |
2007 | 2008 | 2009 | |||||||
| |
(in thousands) |
|||||||||
Sales and marketing |
$ | 3,826 | $ | 5,713 | $ | 3,633 | ||||
Operations and customer support |
7,007 | 9,829 | 6,544 | |||||||
General and administrative |
8,720 | 4,591 | 3,054 | |||||||
|
$ | 19,553 | $ | 20,133 | $ | 13,231 | ||||
48
Facility Exit and Restructuring Costs
2007 Plan. We expect to incur future cash outflows for real estate obligations through 2014 related to the 2007 Plan. The following table summarizes activity for the liability balances associated with the 2007 Plan for the years ended December 31, 2007, 2008 and 2009, including changes during the year attributable to costs incurred and charged to expense and costs paid or otherwise settled:
| |
Severance and Benefits |
Facilities | Asset Impairments |
Other Costs |
Total | ||||||||||||
|---|---|---|---|---|---|---|---|---|---|---|---|---|---|---|---|---|---|
| |
(in thousands) |
||||||||||||||||
Balance as of December 31, 2006 |
$ | — | $ | — | $ | — | $ | — | $ | — | |||||||
Accruals |
30,303 | 12,216 | 20,621 | 1,131 | 64,271 | ||||||||||||
Payments |
(18,262 | ) | (480 | ) | — | (760 | ) | (19,502 | ) | ||||||||
Non-cash charges |
— | 4,388 | (20,621 | ) | (371 | ) | (16,604 | ) | |||||||||
Balance as of December 31, 2007 |
12,041 | 16,124 | — | — | 28,165 | ||||||||||||
Accruals |
461 | 4,808 | 4,125 | — | 9,394 | ||||||||||||
Payments |
(12,502 | ) | (6,174 | ) | — | — | (18,676 | ) | |||||||||
Non-cash charges |
— | 1,936 | (4,125 | ) | — | (2,189 | ) | ||||||||||
Balance as of December 31, 2008 |
— | 16,694 | — | — | 16,694 | ||||||||||||
Accruals |
— | 5,697 | 46 | — | 5,743 | ||||||||||||
Payments |
— | (5,442 | ) | — | — | (5,442 | ) | ||||||||||
Non-cash charges |
— | 489 | (46 | ) | — | 443 | |||||||||||
Balance as of December 31, 2009 |
$ | — | $ | 17,438 | $ | — | $ | — | $ | 17,438 | |||||||
Legacy Plans. As of December 31, 2009, we had a $0.5 million liability remaining for real estate commitments associated with the Legacy Plans. All other costs have been paid or otherwise settled. We expect to incur future cash outflows for real estate obligations through 2010 related to the Legacy Plans.
Liquidity and Capital Resources
The following table sets forth summarized cash flow data for the years ended December 31, 2007, 2008 and 2009:
| |
Year Ended December 31, | |||||||||
|---|---|---|---|---|---|---|---|---|---|---|
| |
2007 | 2008 | 2009 | |||||||
| |
(in thousands) |
|||||||||
Net income (loss) |
$ | (145,097 | ) | $ | 178,584 | $ | 287,118 | |||
Non-cash items |
265,252 | 112,307 | (58,711 | ) | ||||||
Changes in working capital |
(31,366 | ) | (60,279 | ) | (19,785 | ) | ||||
Net cash provided by operating activities |
$ | 88,789 | $ | 230,612 | $ | 208,622 | ||||
Net cash provided by (used in) investing activities |
$ | 13,936 | $ | 107,124 | $ | (37,121 | ) | |||
Net cash used in financing activities |
$ | (87,267 | ) | $ | (24,999 | ) | $ | (47,070 | ) | |
Operating activities
Net cash provided by operating activities increased during the year ended December 31, 2008 compared to the year ended December 31, 2007. The increase was primarily due to a decrease in costs to acquire and support new customers, a decrease in operating costs resulting from our efforts to reduce our back-office cost structure, benefits realized from the 2007 Plan and a reduction in customer support costs and bad debt expense as our overall subscriber base has decreased and become longer tenured. Net cash provided by operating activities decreased during the year ended December 31, 2009 compared to the year
49
ended December 31, 2008 primarily due to a decrease in revenues as our overall subscriber base has decreased over the past year. However, this decrease was partially offset by reduced sales and marketing spending, reduced telecommunication costs, reduced back-office support costs and reduced customer support and bad debt expense as our overall subscriber base has decreased and become longer tenured.
Non-cash items include items that are not expected to generate or require the use of cash, such as depreciation and amortization relating to our network, facilities and intangible assets, net losses of equity affiliate, deferred income taxes, stock-based compensation, non-cash disposals and impairments of fixed assets, impairments of goodwill and intangible assets, gain (loss) on investments, net, accretion of debt discount and amortization of debt issuance costs. Non-cash items decreased during the year ended December 31, 2008 compared to the prior year primarily due to a decrease in net losses of equity affiliate and an increase in non-cash income tax benefits, offset by an increase in impairment of goodwill and intangible assets. Non-cash items decreased during the year ended December 31, 2009 compared to the prior year period due to an increase in deferred income taxes, which was partially offset by decreases in depreciation expense and loss on disposals and impairments of fixed assets.
Changes in working capital requirements include changes in accounts receivable, prepaid and other assets, accounts payable, accrued and other liabilities and deferred revenue. Cash used for working capital requirements increased during 2008 compared to the prior year primarily due to payments resulting from the 2007 Plan and from the discontinuation of our municipal wireless broadband operations. Cash used for working capital requirements decreased during the year ended December 31, 2009 compared to the prior year period primarily due to reduced back office support and sales and marketing spending. Also contributing to the decrease were decreases in payments resulting from the 2007 Plan, from other workforce reductions and from the discontinuation of our municipal wireless broadband operations.
Investing activities
Our investing activities provided cash of $13.9 million during the year ended December 31, 2007. This consisted primarily of $122.0 million of sales and maturities of investments in marketable securities, net of purchases, and $1.6 million of distributions received from investments in other companies. These were partially offset by $53.5 million of capital expenditures, $30.0 million loaned to HELIO, $19.5 million of contributions to HELIO and $7.3 million to purchase subscriber bases from other ISPs.
Our investing activities provided cash of $107.1 million during the year ended December 31, 2008. This consisted primarily of $57.1 million received for our Covad investment and $56.9 million of sales and maturities of investments in marketable securities, net of purchases. In April 2008, Platinum Equity, LLC acquired all outstanding shares of Covad. As a result, we received cash of $50.8 million for the aggregate principal amount of the 12% Senior Secured Convertible Notes due 2011 held by us plus accrued interest in April 2008 and we received cash of $6.3 million for our 6.1 million shares of Covad common stock in May 2008. The decreases were offset by $5.7 million of capital expenditures and $1.2 million used to purchase subscriber bases from other ISPs.
Our investing activities used cash of $37.1 million during the year ended December 31, 2009. This consisted primarily of $32.4 million of purchases of investments in marketable securities, net of sales and maturities, and $13.1 million of capital expenditures, primarily associated with network and technology center related projects. This was offset by $8.4 million of proceeds received from investments in other companies. During the year ended December 31, 2009, we sold 2.2 million of our Sprint Nextel shares for net proceeds of $8.2 million and received $0.2 million in cash distributions from one of our investments.
Financing activities
Our financing activities used cash of $87.3 million during the year ended December 31, 2007. This consisted primarily of $94.3 million used to repurchase 14.0 million shares of our common stock and $2.0 million used to repay a note payable. Partially offsetting cash used for repurchases were proceeds from
50
the exercise of stock options of $9.5 million. Our financing activities used cash of $25.0 million during the year ended December 31, 2008. This consisted primarily of $31.9 million used to repurchase 3.8 million shares of our common stock and $2.7 million to pay off a capital lease obligation. Included in the share repurchase amount is the repurchase of approximately 2.5 million shares of common stock for approximately $22.7 million in connection with the termination of our convertible note hedge and warrant agreements. Partially offsetting cash used for repurchases were proceeds of $8.1 million from the exercise of stock options. Our financing activities used cash of $47.1 million during year ended December 31, 2009. This consisted primarily of $30.0 million for payment of dividends and $22.3 million used to repurchase 3.6 million shares of our common stock, offset by $5.3 million of proceeds from the exercise of stock options.
Future Uses of Cash and Funding Sources
Uses of cash. We expect to incur capital expenditures to maintain and upgrade our network and technology infrastructure. The actual amount of capital expenditures may fluctuate due to a number of factors which are difficult to predict and could change significantly over time. Additionally, technological advances may require us to make capital expenditures to develop or acquire new equipment or technology in order to replace aging or technologically obsolete equipment. We also expect to use cash to pay dividends on our common stock and restricted stock units. In 2009, we began paying quarterly cash dividends on our common stock. We currently intend to pay regular quarterly dividends on our common stock. Any decision to declare future dividends will be made at the discretion of the Board of Directors and will depend on, among other things, our results of operations, financial condition, cash requirements, investment opportunities and other factors the Board of Directors may deem relevant. We expect to continue to use cash to retain existing and acquire new subscribers for our services, which may include purchases of subscriber bases from other ISPs. We will also use cash to pay real estate obligations associated with facilities exited in our restructuring plans and for workforce reduction initiatives or other cost reduction initiatives. Finally, we may also use cash to invest in or acquire other companies, to pay additional dividends, to repurchase common stock, to repurchase Notes or in connection with holders' conversion of Notes. Although we continue to consider and evaluate potential investments or acquisitions, there can be no assurance that we will be able to consummate any such transaction.
Our cash requirements depend on numerous factors, including our ability to maintain our customer base, the costs required to maintain our network infrastructure, the size and types of acquisitions in which we may engage, the pricing of our access services, and the level of resources used for our sales and marketing activities, among others.
Sources of cash. Our principal sources of liquidity are our cash, cash equivalents and investments in marketable securities, as well as the cash flow we generate from our operations. During the years ended December 31, 2007, 2008 and 2009, we generated $88.8 million, $230.6 million and $208.6 million in cash from operations, respectively. As of December 31, 2009, we had $611.0 million in cash and cash equivalents. In addition, we held short-term marketable securities valued at $85.0 million. Short-term marketable securities consist of investments that have effective maturity dates of up to one year from the balance sheet date. Our cash, cash equivalents and marketable securities are subject to general credit, liquidity, market, and interest rate risks, which may be exacerbated by unfavorable economic conditions. If financial markets experience prolonged periods of decline, the value or liquidity of our cash, cash equivalents and marketable securities could decline and result in an other-than-temporary decline in fair value, which could adversely affect our financial condition.
Our short-term marketable securities as of December 31, 2009 included $42.9 million of auction rate securities. These securities are variable-rate debt instruments whose underlying agreements have contractual maturities of up to 40 years. The securities are issued by various state related higher education agencies and predominantly secured by student loans guaranteed by the agencies and reinsured by the United States Department of Education. Liquidity for these auction rate securities is typically provided by
51
an auction process that resets the applicable interest rate at pre-determined intervals, usually every 28 days. Beginning in February 2008, all of our auction rate securities failed to attract sufficient buyers, resulting in our continuing to hold such securities. In October 2008, we entered into an agreement with the broker that sold us our auction rate securities that gives us the right to sell our existing auction rate securities back to the broker at par plus accrued interest, beginning on June 30, 2010 until July 2, 2012. The agreement also grants the broker the right to buy our auction rate securities at par plus accrued interest, until July 2, 2012. Based on our remaining cash and marketable securities and operating cash flows, we do not anticipate the current lack of liquidity on these investments will affect our ability to operate our business as usual.
We expect to generate positive cash flows from operations during the year ended December 31, 2010. Our available cash and marketable securities, together with our results of operations, are expected to be sufficient to meet our operating expenses, capital requirements and investment and other obligations for the next 12 months. However, as a result of other investment activities, possible acquisition opportunities or other strategic uses of cash, we may seek additional financing in the future. We have no commitments for any additional financing and have no lines of credit or similar sources of financing. We cannot be sure that we can obtain additional financing on favorable terms, if at all, through the issuance of equity securities or the incurrence of additional debt. Additional equity financing may dilute our stockholders, and debt financing, if available, may restrict our ability to repurchase common stock or debt, declare and pay dividends and raise future capital. If we are unable to obtain additional needed financing, it may prohibit us from making acquisitions, capital expenditures and/or investments, which could materially and adversely affect our business.
Off-Balance Sheet Arrangements
As of December 31, 2009, we did not have any off-balance sheet arrangements that have or are reasonably likely to have a current or future effect on our financial condition, changes in financial condition, revenues or expenses, results of operations, liquidity, capital expenditures or capital resources that are material to investors.
Contractual Obligations and Commitments
As of December 31, 2009, we had the following contractual commitments:
| |
Year Ending December 31, | ||||||||||||
|---|---|---|---|---|---|---|---|---|---|---|---|---|---|
| |
2010 | 2011 | 2012 | 2013- 2014 |
|||||||||
| |
(in millions) |
||||||||||||
Operating leases (1) |
$ | 12.5 | $ | 10.7 | $ | 10.1 | $ | 17.5 | |||||
Purchase commitments (2) |
0.5 | — | — | — | |||||||||
Convertible senior notes (3) |
— | 258.8 | — | — | |||||||||
|
$ | 13.0 | $ | 269.5 | $ | 10.1 | $ | 17.5 | |||||
- (1)
- These
amounts represent base rent payments under noncancellable operating leases for facilities and equipment that expire in various years through 2014, as
well as an allocation for operating expenses. Not included in these amounts is expected sublease income of $2.5 million, $1.3 million, $1.3 million and $2.1 million during
the years ended December 31, 2010, 2011, 2012 and thereafter, respectively.
- (2)
- We
have commitments to purchase telecommunications services from one of our third party providers under a non-cancelable agreement.
- (3)
- During November 2006, we issued $258.8 million aggregate principal amount of Notes in a registered offering. The Notes are convertible on October 15, 2011 and upon certain events. We have the option to redeem the Notes, in whole or in part, for cash, on or after November 15, 2011, provided that we have made at least ten semi-annual interest payments. In addition, the holders may require us to purchase all or a portion of their Notes on each of November 15, 2011, November 15, 2016 and November 15, 2021.
52
Share Repurchase Program
The Board of Directors has authorized a total of $750.0 million to repurchase our common stock under our share repurchase program. As of December 31, 2009, we had utilized approximately $603.2 million pursuant to the authorizations and had $146.8 million available under the current authorization. We may repurchase our common stock from time to time in compliance with the Securities and Exchange Commission's regulations and other legal requirements, and subject to market conditions and other factors. The share repurchase program does not require us to acquire any specific number of shares and may be terminated by the Board of Directors at any time.
Income Taxes
We continue to maintain a partial valuation allowance of $34.1 million against our net deferred tax assets, consisting primarily of net operating loss carryforwards. Of this amount, $31.7 million relates to net operating losses generated by the tax benefits of certain stock compensation arrangements. The valuation allowance will be removed upon utilization of these net operating losses as an adjustment to additional paid-in-capital. The remaining $2.4 million valuation allowance is retained for net operating losses in certain jurisdictions where there is uncertainty regarding realization.
To the extent we owe income taxes in future periods, we intend to use our net operating loss carryforwards to the extent available to reduce cash outflows for income taxes. However, our ability to use our net operating loss carryforwards to offset future taxable income and future taxes, may be subject to restrictions attributable to equity transactions that result in changes in ownership as defined by Internal Revenue Code Section 382.
Related Party Transactions
As a result of our prior ownership interest in HELIO, HELIO was considered a related party. In August 2008, Virgin Mobile acquired HELIO and our equity and debt investments in HELIO were exchanged for limited partnership units of Virgin Mobile. EarthLink and HELIO had a services agreement pursuant to which we provided HELIO billing and other support services in exchange for management fees. The management fees were determined based on our costs to provide the services, and management believed such fees were reasonable. Fees for services provided to HELIO are reflected as reductions to the associated expenses incurred by us to provide such services. During the years ended December 31, 2007 and 2008, fees received for services provided to HELIO were $1.6 million and $1.0 million, respectively.
Critical Accounting Policies and Estimates
Set forth below is a discussion of the accounting policies and related estimates that we believe are the most critical to understanding our consolidated financial statements, financial condition and results of operations and which require complex management judgments, uncertainties and/or estimates. The preparation of financial statements in accordance with U.S. generally accepted accounting principles requires management to make estimates and assumptions that affect the reported amounts of assets and liabilities, the disclosure of contingent assets and liabilities, and the reported amounts of revenues and expenses during a reporting period; however, actual results could differ from those estimates. Management has discussed the development, selection and disclosure of the critical accounting policies and estimates with the Audit Committee of the Board of Directors. Information regarding our other accounting policies is included in the Notes to our Consolidated Financial Statements.
Revenue recognition
We maintain relationships with certain broadband partners in which we provide services to customers using the "last mile" element of the telecommunications providers' networks. The term "last mile" generally refers to the element of telecommunications networks that is directly connected to homes and
53
businesses. Generally, when we are the primary obligor in the transaction with the subscriber, have latitude in establishing prices, are the party determining the service specifications or have several but not all of these indicators, we record the revenue at the amount billed the subscriber. If we are not the primary obligor and/or the broadband partner has latitude in establishing prices, we record revenue associated with the related subscribers on a net basis, netting the cost of revenue associated with the service against the gross amount billed the customer and recording the net amount as revenue. The determination of whether we meet many of the attributes for gross and net revenue recognition is judgmental in nature and is based on an evaluation of the terms of each arrangement. A change in the determination of gross versus net revenue recognition would have an impact on the gross amounts of revenues and cost of revenues we recognize and the gross profit margin percentages in the period in which such determination is made and in subsequent periods; however, such a change in determination of revenue recognition would not affect net income.
Income taxes
Significant judgment is required in evaluating our uncertain tax positions and determining our provision for income taxes. We establish reserves for tax-related uncertainties based on estimates of whether, and the extent to which, additional taxes will be due. These reserves are established when we believe that certain positions might be challenged despite our belief that our tax return positions are in accordance with applicable tax laws. We adjust these reserves in light of changing facts and circumstances, such as the closing of a tax audit, new tax legislation, or the change of an estimate. To the extent that the final tax outcome of these matters is different than the amounts recorded, such differences will affect the provision for income taxes in the period in which such determination is made. The provision for income taxes includes the effect of reserve provisions and changes to reserves that are considered appropriate, as well as the related net interest and penalties.
We recognize deferred tax assets and liabilities using estimated future tax rates for the effect of temporary differences between the book and tax bases of recorded assets and liabilities, including net operating loss carryforwards. Management assesses the realizability of deferred tax assets and records a valuation allowance if it is more likely than not that all or a portion of the deferred tax assets will not be realized. We consider the probability of future taxable income and our historical profitability, among other factors, in assessing the amount of the valuation allowance. During the year ended December 31, 2009, we released $199.0 million of our valuation allowance related to our deferred tax assets. Of the valuation allowance release, $198.8 million was recorded as an income tax benefit in the Consolidated Statement of Operations and $0.2 million related to temporary differences and was recorded to accumulated other comprehensive income (loss) on the Consolidated Balance Sheet. These deferred tax assets relate primarily to net operating loss carryforwards which we determined we will more likely than not be able to utilize due to the generation of sufficient taxable income in the future. Our determination was made based on our past performance and our belief that we will generate sufficient taxable income in the future to utilize our tax assets. Significant judgment was involved in this determination, including projections of future taxable income. Changes in these estimates and assumptions could materially affect the amount or timing of the valuation allowance release.
We continue to maintain a partial valuation allowance of $34.1 million against our net deferred tax assets, consisting primarily of net operating loss carryforwards. Of this amount, $31.7 million relates to net operating losses generated by the tax benefits of certain stock compensation arrangements. The valuation allowance will be removed upon utilization of these net operating losses as an adjustment to additional paid-in-capital. The remaining $2.4 million valuation allowance is retained for net operating losses in certain jurisdictions where we do not believe it is more likely than not that the net operating losses will be realized. Adjustments could be required in the future if we estimate that the amount of deferred tax assets to be realized is more or less than the net amount we have recorded. Any decrease in the valuation
54
allowance could have the effect of increasing stockholders' equity and/or decreasing the income tax provision in the statement of operations.
Recoverability of noncurrent assets
Goodwill and indefinite-lived intangible assets
We test goodwill and indefinite-lived intangible assets for impairment at least annually. We perform an impairment test of our goodwill and indefinite-lived intangible assets annually during the fourth quarter of our fiscal year or when events and circumstances indicate the indefinite-lived intangible assets might be permanently impaired. During the fourth quarter of 2008, our annual impairment test concluded that goodwill and certain intangible assets recorded as a result of our April 2006 acquisition of New Edge were impaired and we recorded non-cash impairment charges related to the New Edge reporting unit of $64.0 million for goodwill and $3.1 million for the indefinite-lived trade name. During the fourth quarter of 2009, our annual impairment test concluded that goodwill and certain intangible assets recorded as a result of the New Edge acquisition were further impaired and we recorded non-cash impairment charges related to the New Edge reporting unit of $23.9 million for goodwill and $0.2 million for the indefinite-lived trade name. As a result, there is no remaining carrying value related to New Edge goodwill.
Application of the goodwill impairment test requires judgment, including the identification of reporting units, assigning assets and liabilities to reporting units, assigning goodwill to reporting units, and determining the fair value of each reporting unit. Significant judgments required to estimate the fair value of reporting units include estimating future cash flows, determining appropriate discount rates, growth rates and other assumptions. Changes in these estimates and assumptions could materially affect the determination of fair value for each reporting unit which could trigger impairment or impact the amount of the impairment.
Although we operate two reportable segments, we have identified three reporting units for evaluating goodwill, which are Consumer Services (which consists of our consumer product offerings including narrowband and broadband access, VoIP and value-added services), New Edge and Web Hosting. The Consumer Services reportable segment is one reporting unit, while the Business Services reportable segment consists of two reporting units, New Edge and Web Hosting. Each of these reporting units constitutes a business for which discrete financial information is available and segment management regularly reviews the operating results. Goodwill resulting from our New Edge acquisition in 2006 was allocated to the New Edge reporting unit. Goodwill resulting from all other acquisitions related to consumer products and was allocated to the Consumer Services reporting unit. No goodwill is allocated to our Web Hosting reporting unit.
Impairment testing of goodwill is required at the reporting unit level and involves a two-step process. The first step of the impairment test involves comparing the estimated fair value of our reporting units with the reporting unit's carrying amount, including goodwill. We estimate the fair values of our reporting units primarily using the income approach valuation methodology that includes the discounted cash flow method, taking into consideration the market approach and certain market multiples as a validation of the values derived using the discounted cash flow methodology. The discounted cash flows for each reporting unit are based on discrete financial forecasts developed by management for planning purposes. Cash flows beyond the discrete forecasts are estimated using a terminal value calculation, which incorporates historical and forecasted financial trends for each identified reporting unit.
If we determine that the carrying value of a reporting unit exceeds its estimated fair value, we perform a second step. The implied fair value of goodwill is determined in the same manner as utilized to recognize goodwill in a business combination. The implied fair value of goodwill is measured as the excess of the fair value of the reporting unit over the amounts assigned to its assets and liabilities. Any impairment loss is measured by the amount the carrying value of goodwill exceeded the implied fair value of the goodwill.
55
The impairment test for our indefinite-lived intangible assets, which consist of trade names, involves a comparison of the estimated fair value of the intangible asset with its carrying value. If the carrying value of the intangible asset exceeds its fair value, an impairment loss is recognized in an amount equal to that excess. We determine the fair value of our trade names using the royalty savings method, in which the fair value of the asset is calculated based on the present value of the royalty stream that we are saving by owning the asset. Significant judgments required to estimate the fair value include assumptions about royalty rates and the selection of appropriate discount rates. Changes in these estimates and assumptions could materially affect the determination of fair value for our indefinite-lived intangible assets which could impact the amount of an impairment.
Long-lived assets
For noncurrent assets such as property and equipment, definite-lived intangible assets and investments in other companies, we perform tests of impairment when certain events or changes in circumstances indicate that the carrying amount may not be recoverable. Our tests involve critical estimates reflecting management's best assumptions and estimates related to, among other factors, subscriber additions, churn, prices, marketing spending, operating costs and capital spending. Significant judgment is involved in estimating these factors, and they include inherent uncertainties. Management periodically evaluates and updates the estimates based on the conditions that influence these factors. The variability of these factors depends on a number of conditions, including uncertainty about future events, and thus our accounting estimates may change from period to period. If other assumptions and estimates had been used in the current period, the balances for noncurrent assets could have been materially impacted. Furthermore, if management uses different assumptions or if different conditions occur in future periods, future operating results could be materially impacted.
Fair value measurements
We utilize unobservable (Level 3) inputs in determining the fair value of certain assets, which included auction rate securities with a carrying value and fair value of $42.9 million as of December 31, 2009 and our put right with a carrying value and fair value of $5.2 million as of December 31, 2009.
Our auction rate securities are variable-rate debt instruments whose underlying agreements have contractual maturities of up to 40 years, but have interest rate reset periods at pre-determined intervals, usually every 28 days. These securities are predominantly secured by student loans guaranteed by state related higher education agencies and reinsured by the U.S. Department of Education. Beginning in February 2008, auctions for these securities failed to attract sufficient buyers, resulting in us continuing to hold such securities. Prior to February 2008, due to the auction process, quoted market prices were readily available, which would have qualified as Level 1. However, due to events in credit markets beginning in February 2008, these securities did not have readily determinable market values and were not liquid. The fair values of our auction rate securities as of December 31, 2008 and 2009 were estimated utilizing a discounted cash flow analysis. This analysis considered, among other items, the collateralization underlying the security investments, the creditworthiness of the counterparty, and the timing and value of expected future cash flows. These securities were also compared, when possible, to other observable market data with similar characteristics to the securities held by us. Due to the failed auctions, we classify these instruments within Level 3. We elected the fair value option for the put right to offset the fair value changes of the auction rate securities. The fair value of the put right is estimated using a discounted cash flow analysis and is classified within Level 3.
Determining the fair values of our auction rate securities and put right requires judgment. If other assumptions and estimates had been used in the current period, the fair value of our auction rate securities and put right could have been materially impacted. Furthermore, if management uses different assumptions in future periods, future operating results could be materially impacted.
56
Restructuring and facility exit costs
Over the past few years, we have closed facilities, reduced personnel and outsourced certain functions to streamline our business. Restructuring-related liabilities, including reserves for facility exit costs, include estimates for, among other things, severance payments and amounts due under lease obligations, net of estimated sublease income, if any. Key variables in determining such estimates include estimating the future operating expenses to be incurred for the facilities, anticipating the timing and amounts of sublease rental payments, tenant improvement costs and brokerage and other related costs. We accrue the estimated future costs of any lease obligation, net of estimated sublease income, as facility exit and restructuring costs in the Consolidated Statement of Operations.
If the real estate and leasing markets change or if existing subtenants experience financial difficulty, especially given the weak economy, sublease amounts could vary significantly from the amounts estimated, resulting in a material change to our recorded liability. We record any adjustments to liabilities associated with facility exit costs as facility exit and restructuring costs. We periodically evaluate and, if necessary, adjust our estimates based on currently-available information and such adjustments have periodically resulted in additional expense. Adjustments to our recorded liabilities for future lease obligations associated with vacated facilities could adversely or favorably affect future operating results.
Recently Issued Accounting Pronouncements
In September 2009, the Financial Accounting Standards Board ("FASB") issued new guidance on revenue recognition. The new guidance addresses the accounting for multiple-deliverable arrangements to enable vendors to account for products or services (deliverables) separately rather than as a combined unit and to modify the manner in which the transaction consideration is allocated across the separately identifiable deliverables and how revenue is recognized. The new guidance also significantly expands the disclosure requirements for multiple-element arrangements. The new guidance is effective prospectively for revenue arrangements entered into or materially modified in fiscal years beginning on or after June 15, 2010. We do not expect the adoption of the new guidance to have a material impact on our financial statements.
In December 2009, the FASB issued new guidance regarding variable interest entities ("VIEs"). VIEs are entities that either do not have equity investors with proportionate economic and voting rights or have equity investors that do not provide sufficient financial resources for the entity to support its activities. The new guidance requires a qualitative approach to identifying a controlling financial interest in a VIE, and requires ongoing assessment of whether an entity is a VIE and whether an interest in a VIE makes the holder the primary beneficiary of the VIE. The new guidance is effective for annual reporting periods beginning after November 15, 2009. We do not expect the adoption of this new guidance to have a material impact on its consolidated financial statements.
Adoption of Recent Accounting Pronouncements
Codification. In the third quarter of 2009, we adopted the FASB Accounting Standards Codification ("ASC"). The ASC became the single official source of authoritative U.S. generally accepted accounting principles ("GAAP") recognized by the FASB, other than guidance issued by the Securities and Exchange Commission. The adoption of the ASC did not have a material impact on our financial statements. However, the adoption of the ASC changed our references to GAAP in our consolidated financial statements.
Convertible Debt. On January 1, 2009, we adopted new accounting guidance related to accounting for convertible debt instruments that may be settled in cash upon conversion. The new accounting guidance requires that the liability and equity components of convertible debt instruments that may be settled in cash upon conversion (including partial cash settlement) be separately accounted for in a manner that reflects an issuer's non-convertible debt borrowing rate. The resulting debt discount is accreted over the
57
period the convertible debt is expected to be outstanding as additional non-cash interest expense. Retrospective application to all periods presented is required. The adoption of this new guidance on January 1, 2009 affected the accounting for our Notes, which were issued in November 2006. Upon adoption, we recorded an adjustment to increase additional paid-in capital as of the November 2006 issuance date by approximately $62.1 million. We are accreting the resulting debt discount to interest expense over the estimated five-year life of the Notes, which represents the first redemption date of November 2011. Upon adoption, we also recorded an adjustment to decrease additional paid-in capital and other long-term assets by approximately $1.8 million to reclassify debt issuance costs related to the equity component of the Notes. We recorded a pre-tax adjustment of approximately $22.3 million to accumulated deficit that represents accretion of the debt discount and decrease in amortization of debt issuance costs during the years ended December 31, 2006, 2007 and 2008, recognized additional non-cash interest expense of $12.2 million during the year ending December 31, 2009 and will recognize additional non-cash interest expense of $13.4 million and $12.4 million during the years ending December 31, 2010 and 2011, respectively, for accretion of the debt discount and decrease in amortization of debt issuance costs. As a result of the adoption of this new guidance, we reduced income from continuing operations and net income for the year ended December 31, 2009 by $12.2 million and reduced basic and diluted earnings per share by $0.11 per share. We also recorded a deferred tax liability for temporary tax differences. However, this was offset by a corresponding decrease in the valuation allowance for deferred tax assets.
The following tables present the effect of the adoption of this new guidance on our affected financial statement line items for the years ended December 31, 2007 and 2008 and as of December 31, 2008:
| |
Year Ended December 31, 2007 | Year Ended December 31, 2008 | ||||||||||||||||||
|---|---|---|---|---|---|---|---|---|---|---|---|---|---|---|---|---|---|---|---|---|
| |
As Originally Reported |
As Adjusted |
Effect of Change |
As Originally Reported |
As Adjusted |
Effect of Change |
||||||||||||||
| |
(in thousands, except per share data) |
|||||||||||||||||||
Statement of Operations: |
||||||||||||||||||||
Interest income (expense) and other, net |
$ | 12,824 | $ | 2,824 | $ | (10,000 | ) | $ | (1,381 | ) | $ | (12,409 | ) | $ | (11,028 | ) | ||||
Income (loss) from continuing operations |
(54,795 | ) | (64,795 | ) | (10,000 | ) | 198,118 | 187,090 | (11,028 | ) | ||||||||||
Net income (loss) |
(135,097 | ) | (145,097 | ) | (10,000 | ) | 189,612 | 178,584 | (11,028 | ) | ||||||||||
Basic net income (loss) per share |
||||||||||||||||||||
Continuing operations |
$ | (0.45 | ) | $ | (0.53 | ) | $ | (0.08 | ) | $ | 1.81 | $ | 1.71 | $ | (0.10 | ) | ||||
Basic net income per share |
(1.11 | ) | (1.19 | ) | (0.08 | ) | 1.73 | 1.63 | (0.10 | ) | ||||||||||
Diluted net income (loss) per share |
||||||||||||||||||||
Continuing operations |
$ | (0.45 | ) | $ | (0.53 | ) | $ | (0.08 | ) | $ | 1.78 | $ | 1.68 | $ | (0.10 | ) | ||||
Diluted net income per share |
(1.11 | ) | (1.19 | ) | (0.08 | ) | 1.71 | 1.61 | (0.10 | ) | ||||||||||
| |
As of December 31, 2008 | |||||||||
|---|---|---|---|---|---|---|---|---|---|---|
| |
As Originally Reported |
As Adjusted |
Effect of Change |
|||||||
| |
(in thousands) |
|||||||||
Balance Sheet: |
||||||||||
Other long-term assets |
$ | 5,725 | $ | 4,698 | $ | (1,027 | ) | |||
Long-term debt |
258,750 | 219,733 | (39,017 | ) | ||||||
Additional paid-in capital |
2,075,571 | 2,135,887 | 60,316 | |||||||
Accumulated deficit |
(994,507 | ) | (1,016,833 | ) | (22,326 | ) | ||||
58
Item 7a. Quantitative and Qualitative Disclosures about Market Risk.
Interest Rate Risk
The Company is exposed to interest rate risk with respect to its investments in marketable securities. A change in prevailing interest rates may cause the fair value of the Company's investments to fluctuate. For example, if the Company holds a security that was issued with a fixed interest rate at the then-prevailing rate and the prevailing interest rate later rises, the fair value of its investment may decline. To minimize this risk, the Company has historically held many investments until maturity, and as a result, the Company receives interest and principal amounts pursuant to the underlying agreements. To further mitigate risk, the Company has historically maintained its portfolio of investments in a variety of securities, including government agency notes, asset-backed debt securities (including auction rate debt securities) and commercial paper, all of which bear a minimum short-term rating of A1/P1 or a minimum long-term rating of A/A2. As of December 31, 2008 and 2009, net unrealized losses in these investments were not material. In general, money market funds are not subject to market risk because the interest paid on such funds fluctuates with the prevailing interest rate.
As of December 31, 2008, our investments in marketable securities consisted of $47.8 million of auction rate securities with a weighted average interest rate of 2.0%. As of December 31, 2009, our investments in marketable securities included $42.9 million of auction rate securities with a weighted average interest rate of 1.42%. These securities are variable-rate debt instruments whose underlying agreements have contractual maturities of up to 40 years. These securities are issued by various municipalities and state regulated higher education agencies and are predominantly secured by pools of student loans guaranteed by the agencies and reinsured by the U.S. Department of Education. Liquidity for these auction rate securities is typically provided by an auction process that resets the applicable interest rate at pre-determined intervals, usually every 28 days. In October 2008, we entered into an agreement with the broker that sold us our auction rate securities that gives us the right to sell our existing auction rate securities back to the broker at par plus accrued interest, beginning on June 30, 2010 until July 2, 2012 (herein referred to as "put right"). We elected a one-time transfer of our auction rate securities from the available-for-sale category to the trading category. We also elected the fair value option for the put right to offset the fair value changes of the auction rate securities.
We are also exposed to interest rate risk with respect to our convertible senior notes due November 15, 2026. The fair value of our convertible senior notes may be adversely impacted due to a rise in interest rates. In general, securities with longer maturities are subject to greater interest rate risk than those with shorter maturities. Our convertible senior notes bear interest at a fixed rate of 3.25% per year until November 15, 2011, and 3.50% interest per year thereafter. As of December 31, 2008 and 2009, the principal amount of our convertible senior notes was $258.8 million and the fair value was approximately $236.6 million and $279.8 million, respectively, which was based on the quoted market price.
Equity Risk
We are exposed to equity price risk as it relates to changes in the market value of our equity investments. We invest in equity instruments of public and private companies for operational and strategic purposes. These securities are subject to significant fluctuations in fair market value due to volatility of the stock market and the industries in which the companies operate. We typically do not attempt to reduce or eliminate our market exposure in these equity instruments.
59
The following table presents the carrying value and fair value of our financial instruments subject to equity risk as of December 31, 2008 and 2009:
| |
As of December 31, 2008 | As of December 31, 2009 | ||||||||||||
|---|---|---|---|---|---|---|---|---|---|---|---|---|---|---|
| |
Carrying Amount |
Estimated Fair Value |
Carrying Amount |
Estimated Fair Value |
||||||||||
| |
(dollars in thousands) |
|||||||||||||
Investments in other companies for which it is: |
||||||||||||||
Practicable to estimate fair value |
$ | 1,580 | $ | 1,580 | $ | 1,529 | $ | 1,529 | ||||||
Not practicable to estimate fair value |
9,300 | N/A | — | N/A | ||||||||||
60
Item 8. Financial Statements And Supplementary Data.
EARTHLINK, INC.
INDEX TO CONSOLIDATED FINANCIAL STATEMENTS
61
REPORT OF INDEPENDENT REGISTERED PUBLIC ACCOUNTING FIRM
The
Board of Directors and
Stockholders of EarthLink, Inc.
We have audited the accompanying consolidated balance sheets of EarthLink, Inc. as of December 31, 2008 and 2009, and the related consolidated statements of operations, stockholders' equity and comprehensive income (loss), and cash flows for each of the three years in the period ended December 31, 2009. These financial statements are the responsibility of the Company's management. Our responsibility is to express an opinion on these financial statements based on our audits.
We conducted our audits in accordance with standards of the Public Company Accounting Oversight Board (United States). Those standards require that we plan and perform the audit to obtain reasonable assurance about whether the financial statements are free of material misstatement. An audit includes examining, on a test basis, evidence supporting the amounts and disclosures in the financial statements. An audit also includes assessing the accounting principles used and significant estimates made by management, as well as evaluating the overall financial statement presentation. We believe that our audits provide a reasonable basis for our opinion.
In our opinion, the consolidated financial statements referred to above present fairly, in all material respects, the consolidated financial position of EarthLink, Inc. at December 31, 2008 and 2009, and the consolidated results of its operations and its cash flows for each of the three years in the period ended December 31, 2009, in conformity with U.S. generally accepted accounting principles.
As discussed in Note 2 to the consolidated financial statements, the Company changed its method of accounting for convertible debt instruments with the adoption of the guidance originally issued in FASB Staff Position APB 14-1, Accounting for Convertible Debt Instruments That May Be Settled in Cash upon Conversion (Including Partial Cash Settlement), (codified primarily in FASB ASC Topic 470, Debt) effective January 1, 2009.
We also have audited, in accordance with the standards of the Public Company Accounting Oversight Board (United States), EarthLink, Inc.'s internal control over financial reporting as of December 31, 2009, based on criteria established in Internal Control—Integrated Framework issued by the Committee of Sponsoring Organizations of the Treadway Commission and our report dated February 26, 2010 expressed an unqualified opinion thereon.
/s/ Ernst & Young LLP
Atlanta,
Georgia
February 26, 2010
62
REPORT OF INDEPENDENT REGISTERED PUBLIC ACCOUNTING FIRM ON INTERNAL
CONTROL OVER FINANCIAL REPORTING
The
Board of Directors and
Stockholders of EarthLink, Inc.
We have audited EarthLink, Inc.'s internal control over financial reporting as of December 31, 2009, based on criteria established in Internal Control—Integrated Framework issued by the Committee of Sponsoring Organizations of the Treadway Commission (the COSO criteria). EarthLink, Inc.'s management is responsible for maintaining effective internal control over financial reporting and for its assessment of the effectiveness of internal control over financial reporting included in the accompanying Management's Report on Internal Control Over Financial Reporting. Our responsibility is to express an opinion on the Company's internal control over financial reporting based on our audit.
We conducted our audit in accordance with the standards of the Public Company Accounting Oversight Board (United States). Those standards require that we plan and perform the audit to obtain reasonable assurance about whether effective internal control over financial reporting was maintained in all material respects. Our audit included obtaining an understanding of internal control over financial reporting, assessing the risk that a material weakness exists, testing and evaluating the design and operating effectiveness of internal control based on the assessed risk, and performing such other procedures as we considered necessary in the circumstances. We believe that our audit provides a reasonable basis for our opinion.
A company's internal control over financial reporting is a process designed to provide reasonable assurance regarding the reliability of financial reporting and the preparation of financial statements for external purposes in accordance with generally accepted accounting principles. A company's internal control over financial reporting includes those policies and procedures that (1) pertain to the maintenance of records that, in reasonable detail, accurately and fairly reflect the transactions and dispositions of the assets of the company; (2) provide reasonable assurance that transactions are recorded as necessary to permit preparation of financial statements in accordance with generally accepted accounting principles, and that receipts and expenditures of the company are being made only in accordance with authorizations of management and directors of the company; and (3) provide reasonable assurance regarding prevention or timely detection of unauthorized acquisition, use, or disposition of the company's assets that could have a material effect on the financial statements.
Because of its inherent limitations, internal control over financial reporting may not prevent or detect misstatements. Also, projections of any evaluation of effectiveness to future periods are subject to the risk that controls may become inadequate because of changes in conditions, or that the degree of compliance with the policies or procedures may deteriorate.
In our opinion, EarthLink, Inc. maintained, in all material respects, effective internal control over financial reporting as of December 31, 2009, based on the COSO criteria.
We also have audited, in accordance with the standards of the Public Company Accounting Oversight Board (United States), the consolidated balance sheets as of December 31, 2008 and 2009, and the related consolidated statements of operations, stockholders' equity and comprehensive income (loss), and cash flows for each of the three years in the period ended December 31, 2009 of EarthLink, Inc. and our report dated February 26, 2010 expressed an unqualified opinion thereon.
/s/ Ernst & Young LLP
Atlanta,
Georgia
February 26, 2010
63
EARTHLINK, INC.
CONSOLIDATED BALANCE SHEETS
(in thousands, except per share data)
| |
December 31, | ||||||||
|---|---|---|---|---|---|---|---|---|---|
| |
2008 | 2009 | |||||||
ASSETS |
|||||||||
Current assets: |
|||||||||
Cash and cash equivalents |
$ | 486,564 | $ | 610,995 | |||||
Marketable securities |
— | 84,966 | |||||||
Accounts receivable, net of allowance of $4,048 and $1,736 as of December 31, 2008 and 2009, respectively |
30,569 | 20,560 | |||||||
Prepaid expenses |
6,445 | 4,374 | |||||||
Deferred income taxes, net |
20,254 | 46,063 | |||||||
Other current assets |
15,452 | 16,423 | |||||||
Total current assets |
559,284 | 783,381 | |||||||
Long-term marketable securities |
47,809 | — | |||||||
Long-term investments |
20,708 | — | |||||||
Property and equipment, net |
37,246 | 34,267 | |||||||
Deferred income taxes, net |
43,757 | 153,132 | |||||||
Purchased intangible assets, net |
19,552 | 11,550 | |||||||
Goodwill |
112,812 | 88,920 | |||||||
Other long-term assets |
4,698 | 3,368 | |||||||
Total assets |
$ | 845,866 | $ | 1,074,618 | |||||
LIABILITIES AND STOCKHOLDERS' EQUITY |
|||||||||
Current liabilities: |
|||||||||
Accounts payable |
$ | 13,109 | $ | 6,270 | |||||
Accrued payroll and related expenses |
37,470 | 25,093 | |||||||
Other accrued liabilities |
39,415 | 34,659 | |||||||
Deferred revenue |
33,649 | 25,728 | |||||||
Convertible senior notes, net of discount of $26,502 as of December 31, 2009 |
— | 232,248 | |||||||
Total current liabilities |
123,643 | 323,998 | |||||||
Convertible senior notes, net of discount of $39,017 as of December 31, 2008 |
219,733 | — | |||||||
Other long-term liabilities |
16,015 | 16,596 | |||||||
Total liabilities |
359,391 | 340,594 | |||||||
Commitments and contingencies (See Note 14) |
|||||||||
Stockholders' equity: |
|||||||||
Convertible preferred stock, $0.01 par value, 100,000 shares authorized, 0 shares issued and outstanding as of December 31, 2008 and 2009 |
— | — | |||||||
Common stock, $0.01 par value, 300,000 shares authorized, 188,264 and 190,472 shares issued as of December 31, 2008 and 2009, respectively, and 108,516 and 107,132 shares outstanding as of December 31, 2008 and 2009, respectively |
1,883 | 1,905 | |||||||
Additional paid-in capital |
2,135,887 | 2,118,100 | |||||||
Accumulated deficit |
(1,016,833 | ) | (729,715 | ) | |||||
Treasury stock, at cost, 79,748 and 83,340 shares, |
|||||||||
respectively, as of December 31, 2008 and 2009 |
(634,420 | ) | (656,760 | ) | |||||
Accumulated other comprehensive income (loss) |
(42 | ) | 494 | ||||||
Total stockholders' equity |
486,475 | 734,024 | |||||||
Total liabilities and stockholders' equity |
$ | 845,866 | $ | 1,074,618 | |||||
The accompanying notes are an integral part of these consolidated financial statements.
64
EARTHLINK, INC.
CONSOLIDATED STATEMENTS OF OPERATIONS
| |
Year Ended December 31, | |||||||||||
|---|---|---|---|---|---|---|---|---|---|---|---|---|
| |
2007 | 2008 | 2009 | |||||||||
| |
(in thousands, except per share data) |
|||||||||||
Revenues |
$ | 1,215,994 | $ | 955,577 | $ | 723,729 | ||||||
Operating costs and expenses: |
||||||||||||
Cost of revenues |
442,697 | 360,920 | 273,755 | |||||||||
Sales and marketing |
291,105 | 98,212 | 59,474 | |||||||||
Operations and customer support |
221,443 | 136,797 | 98,435 | |||||||||
General and administrative |
128,412 | 93,878 | 72,398 | |||||||||
Amortization of intangible assets |
14,672 | 13,349 | 7,749 | |||||||||
Impairment of goodwill and intangible assets |
4,250 | 78,672 | 24,145 | |||||||||
Facility exit and restructuring costs |
65,381 | 9,142 | 5,615 | |||||||||
Total operating costs and expenses |
1,167,960 | 790,970 | 541,571 | |||||||||
Income from operations |
48,034 |
164,607 |
182,158 |
|||||||||
Net losses of equity affiliate |
(111,295 | ) | — | — | ||||||||
Gain (loss) on investments, net |
(5,585 | ) | 2,708 | (1,321 | ) | |||||||
Interest income (expense) and other, net |
2,824 | (12,409 | ) | (19,804 | ) | |||||||
Income (loss) from continuing operations before income taxes |
(66,022 | ) | 154,906 | 161,033 | ||||||||
Income tax benefit |
1,227 | 32,184 | 126,085 | |||||||||
Income (loss) from continuing operations |
(64,795 | ) | 187,090 | 287,118 | ||||||||
Loss from discontinued operations, net of tax |
(80,302 | ) | (8,506 | ) | — | |||||||
Net income (loss) |
$ | (145,097 | ) | $ | 178,584 | $ | 287,118 | |||||
Basic net income (loss) per share |
||||||||||||
Continuing operations |
$ | (0.53 | ) | $ | 1.71 | $ | 2.69 | |||||
Discontinued operations |
(0.66 | ) | (0.08 | ) | — | |||||||
Basic net income (loss) per share |
$ | (1.19 | ) | $ | 1.63 | $ | 2.69 | |||||
Basic weighted average common shares outstanding |
121,633 | 109,531 | 106,909 | |||||||||
Diluted net income (loss) per share |
||||||||||||
Continuing operations |
$ | (0.53 | ) | $ | 1.68 | $ | 2.66 | |||||
Discontinued operations |
(0.66 | ) | (0.08 | ) | — | |||||||
Diluted net income (loss) per share |
$ | (1.19 | ) | $ | 1.61 | $ | 2.66 | |||||
Diluted weighted average common shares outstanding |
121,633 | 111,051 | 108,084 | |||||||||
Dividends declared per common share |
$ | — | $ | — | $ | 0.28 | ||||||
The accompanying notes are an integral part of these consolidated financial statements.
65
CONSOLIDATED STATEMENTS OF STOCKHOLDERS' EQUITY AND COMPREHENSIVE INCOME (LOSS)
| |
|
|
|
|
|
|
|
Accumulated Other Comprehensive Income (Loss) |
|
|
|||||||||||||||||||||
|---|---|---|---|---|---|---|---|---|---|---|---|---|---|---|---|---|---|---|---|---|---|---|---|---|---|---|---|---|---|---|---|
| |
Common Stock | |
|
|
Treasury Stock | |
|
||||||||||||||||||||||||
| |
Additional Paid-in Capital |
|
Accumulated Deficit |
Total Stockholders' Equity |
Total Comprehensive Income (Loss) |
||||||||||||||||||||||||||
| |
Shares | Amount | Warrants | Shares | Amount | ||||||||||||||||||||||||||
| |
(in thousands) |
||||||||||||||||||||||||||||||
Balance as of December 31, 2006 |
184,545 | $ | 1,845 | $ | 2,076,894 | $ | 259 | $ | (1,046,293 | ) | (61,911 | ) | $ | (508,232 | ) | $ | (6,791 | ) | $ | 517,682 | |||||||||||
Issuance of common stock pursuant to exercise of stock options and vesting of restricted stock units |
1,796 | 18 | 9,707 | — | — | — | — | — | 9,725 | ||||||||||||||||||||||
Issuance of common stock for acquisition of New Edge |
49 | 1 | 379 | — | — | — | — | — | 380 | ||||||||||||||||||||||
Issuance of common stock |
100 | 1 | 724 | — | — | — | — | — | 725 | ||||||||||||||||||||||
Exercise of warrants |
— | 259 | (259 | ) | — | — | — | — | — | ||||||||||||||||||||||
Issuance of phantom share units |
— | — | 45 | — | — | — | — | — | 45 | ||||||||||||||||||||||
Stock-based compensation expense |
— | — | 19,576 | — | — | — | — | — | 19,576 | ||||||||||||||||||||||
Repurchase of common stock |
— | — | — | — | — | (14,032 | ) | (94,332 | ) | — | (94,332 | ) | |||||||||||||||||||
Reclassification adjustment for realized losses on certain investments |
— | — | — | — | — | — | — | 4,770 | 4,770 | ||||||||||||||||||||||
Unrealized holding gains on certain investments, net of tax |
— | — | — | — | — | — | — | 1,044 | 1,044 | $ | 1,044 | ||||||||||||||||||||
Net loss |
— | — | — | — | (145,097 | ) | — | — | — | (145,097 | ) | (145,097 | ) | ||||||||||||||||||
Total comprehensive loss |
$ | (144,053 | ) | ||||||||||||||||||||||||||||
Balance as of December 31, 2007 |
186,490 | 1,865 | 2,107,584 | — | (1,191,390 | ) | (75,943 | ) | (602,564 | ) | (977 | ) | 314,518 | ||||||||||||||||||
Cumulative effect of change in accounting principle |
— | — | — | — | (4,027 | ) | — | — | — | (4,027 | ) | ||||||||||||||||||||
Issuance of common stock pursuant to exercise of |
— | ||||||||||||||||||||||||||||||
stock options and vesting of restricted stock units |
1,774 | 18 | 5,728 | — | — | — | — | — | 5,746 | ||||||||||||||||||||||
Tax benefit from equity awards |
— | — | 1,017 | — | — | — | — | — | 1,017 | ||||||||||||||||||||||
Termination of convertible note hedge and warrant agreements |
— | — | 1,425 | — | — | — | — | — | 1,425 | ||||||||||||||||||||||
Stock-based compensation expense |
— | — | 20,133 | — | — | — | — | — | 20,133 | ||||||||||||||||||||||
Repurchase of common stock |
— | — | — | — | — | (3,805 | ) | (31,856 | ) | — | (31,856 | ) | |||||||||||||||||||
Reclassification adjustment for realized gains and losses on certain investments |
— | — | — | — | — | — | — | 893 | 893 | ||||||||||||||||||||||
Unrealized holding gains on certain investments, net of tax |
— | — | — | — | — | — | — | 42 | 42 | $ | 42 | ||||||||||||||||||||
Net income |
— | — | — | — | 178,584 | — | — | — | 178,584 | 178,584 | |||||||||||||||||||||
Total comprehensive income |
$ | 178,626 | |||||||||||||||||||||||||||||
Balance as of December 31, 2008 |
188,264 | 1,883 | 2,135,887 | — | (1,016,833 | ) | (79,748 | ) | (634,420 | ) | (42 | ) | 486,475 | ||||||||||||||||||
Issuance of common stock pursuant to exercise of stock options and vesting of restricted stock units |
2,208 | 22 | 5,054 | — | — | — | — | — | 5,076 | ||||||||||||||||||||||
Tax withholdings related to net share settlements of restricted stock units and stock options |
— | — | (5,450 | ) | — | — | — | — | — | (5,450 | ) | ||||||||||||||||||||
Dividends paid on shares outstanding and restricted stock units |
— | — | (30,006 | ) | — | — | — | — | — | (30,006 | ) | ||||||||||||||||||||
Dividends payable on restricted stock units |
— | — | (616 | ) | — | — | — | — | — | (616 | ) | ||||||||||||||||||||
Stock-based compensation expense |
— | — | 13,231 | — | — | — | — | — | 13,231 | ||||||||||||||||||||||
Repurchase of common stock |
— | — | — | — | — | (3,592 | ) | (22,340 | ) | — | (22,340 | ) | |||||||||||||||||||
Unrealized holding gains on certain investments, net of tax |
— | — | — | — | — | — | — | 536 | 536 | $ | 536 | ||||||||||||||||||||
Net income |
— | — | — | — | 287,118 | — | — | — | 287,118 | 287,118 | |||||||||||||||||||||
Total comprehensive income |
$ | 287,654 | |||||||||||||||||||||||||||||
Balance as of December 31, 2009 |
190,472 | $ | 1,905 | $ | 2,118,100 | $ | — | $ | (729,715 | ) | (83,340 | ) | $ | (656,760 | ) | $ | 494 | $ | 734,024 | ||||||||||||
The accompanying notes are an integral part of these consolidated financial statements.
66
EARTHLINK, INC.
CONSOLIDATED STATEMENTS OF CASH FLOWS
| |
Year Ended December 31, | ||||||||||||
|---|---|---|---|---|---|---|---|---|---|---|---|---|---|
| |
2007 | 2008 | 2009 | ||||||||||
| |
(in thousands) |
||||||||||||
Cash flows from operating activities: |
|||||||||||||
Net income (loss) |
$ | (145,097 | ) | $ | 178,584 | $ | 287,118 | ||||||
Adjustments to reconcile net income (loss) to net cash provided by operating activities: |
|||||||||||||
Depreciation and amortization |
54,169 | 36,333 | 23,962 | ||||||||||
Impairment of goodwill and intangible assets |
4,250 | 78,672 | 24,145 | ||||||||||
Net losses of equity affiliate |
111,295 | — | — | ||||||||||
Loss on disposals and impairments of assets |
60,385 | 10,078 | 345 | ||||||||||
Loss (gain) on investments in other companies, net |
5,585 | (2,708 | ) | 1,321 | |||||||||
Stock-based compensation |
19,599 | 20,133 | 13,231 | ||||||||||
Non-cash income taxes |
(1,516 | ) | (42,714 | ) | (135,359 | ) | |||||||
Accretion of debt discount and amortization of debt issuance costs |
11,485 | 12,513 | 13,644 | ||||||||||
Decrease in accounts receivable, net |
9,285 | 10,929 | 10,009 | ||||||||||
Decrease (increase) in prepaid expenses and other assets |
3,061 | (4,535 | ) | 8,193 | |||||||||
Decrease in accounts payable and accrued and other liabilities |
(35,727 | ) | (54,632 | ) | (29,839 | ) | |||||||
Decrease in deferred revenue |
(7,934 | ) | (12,041 | ) | (8,148 | ) | |||||||
Other |
(51 | ) | — | — | |||||||||
Net cash provided by operating activities |
88,789 | 230,612 | 208,622 | ||||||||||
Cash flows from investing activities: |
|||||||||||||
Purchases of property and equipment |
(53,478 | ) | (5,681 | ) | (13,119 | ) | |||||||
Purchases of subscriber bases |
(7,290 | ) | (1,232 | ) | — | ||||||||
Purchases of investments in marketable securities |
(403,432 | ) | (53,027 | ) | (56,702 | ) | |||||||
Sales and maturities of investments in marketable securities |
525,458 | 109,929 | 24,259 | ||||||||||
Investments in and net advances to/from equity affiliate |
(48,915 | ) | 65 | — | |||||||||
Proceeds received from investments in other companies |
1,557 | 57,070 | 8,441 | ||||||||||
Other investing activities |
36 | — | — | ||||||||||
Net cash provided by (used in) investing activities |
13,936 | 107,124 | (37,121 | ) | |||||||||
Cash flows from financing activities: |
|||||||||||||
Principal payments under capital lease obligations |
(372 | ) | (2,707 | ) | (36 | ) | |||||||
Proceeds from exercises of stock options |
9,462 | 8,139 | 5,312 | ||||||||||
Repurchases of common stock |
(94,332 | ) | (31,856 | ) | (22,340 | ) | |||||||
Payment of dividends |
— | — | (30,006 | ) | |||||||||
Other financing activities |
(2,025 | ) | 1,425 | — | |||||||||
Net cash used in financing activities |
(87,267 | ) | (24,999 | ) | (47,070 | ) | |||||||
Net increase in cash and cash equivalents |
15,458 |
312,737 |
124,431 |
||||||||||
Cash and cash equivalents, beginning of year |
158,369 | 173,827 | 486,564 | ||||||||||
Cash and cash equivalents, end of year |
$ | 173,827 | $ | 486,564 | $ | 610,995 | |||||||
The accompanying notes are an integral part of these consolidated financial statements.
67
EARTHLINK, INC.
NOTES TO CONSOLIDATED FINANCIAL STATEMENTS
1. Organization
EarthLink, Inc. ("EarthLink" or the "Company") is an Internet service provider ("ISP"), providing nationwide Internet access and related value-added services to individual and business customers. The Company's primary service offerings are dial-up and high-speed Internet access services and related value-added services, such as ancillary services sold as add-on features to the Company's Internet access services, search and advertising. In addition, through the Company's wholly-owned subsidiary, New Edge Networks ("New Edge"), the Company builds and manages IP-based wide area networks for businesses and communications carriers.
The Company operates two reportable segments, Consumer Services and Business Services. The Company's Consumer Services segment provides Internet access and related value-added services to individual customers. These services include dial-up and high-speed Internet access and voice-over-Internet protocol ("VoIP") services, among others. The Company's Business Services segment provides integrated communications services and related value-added services to businesses and communications carriers. These services include managed IP-based wide area networks, dedicated Internet access and web hosting, among others. For further information concerning the Company's business segments, see Note 18, "Segment Information."
2. Summary of Significant Accounting Policies
Basis of Consolidation
The consolidated financial statements include the accounts of EarthLink and all wholly-owned subsidiaries. All intercompany transactions and balances have been eliminated.
Discontinued Operations
The Company reflected its municipal wireless broadband results of operations as discontinued operations for the years ended December 31, 2007 and 2008. See Note 4, "Discontinued Operations," for further discussion.
Use of Estimates in Preparation of Financial Statements
The preparation of financial statements in conformity with U.S. generally accepted accounting principles requires management to make estimates and assumptions that affect the reported amounts of assets and liabilities, revenues and expenses, and the disclosure of contingent assets and liabilities in the consolidated financial statements and accompanying footnotes. Actual results could differ from those estimates. On an ongoing basis, the Company evaluates its estimates, including, but not limited to, those related to the allowance for doubtful accounts; the use, recoverability, and/or realizability of certain assets, including deferred tax assets; useful lives of intangible assets and property and equipment; the fair values of assets acquired and liabilities assumed in acquisitions of businesses, including acquired intangible assets; facility exit and restructuring liabilities; fair values of investments; stock-based compensation; contingent liabilities and long-lived asset impairments. The Company bases its estimates on historical experience and on various other assumptions that are believed to be reasonable.
Revenues
General. EarthLink recognizes revenue when persuasive evidence of an arrangement exists, delivery has occurred, the sales price is fixed or determinable and collectibility is reasonably assured. EarthLink's
68
EARTHLINK, INC.
NOTES TO CONSOLIDATED FINANCIAL STATEMENTS—(Continued)
customers generally pay in advance for their services, and revenue is recognized ratably over the service period. Advance payments from customers for invoiced services that have not yet been performed are recorded as deferred revenue in the Consolidated Balance Sheets.
The primary component of EarthLink's revenues is access and service revenues, which consist of narrowband access services (including traditional, fully-featured narrowband access and value-priced narrowband access); broadband access services (including high-speed access via DSL and cable; managed IP-based networks; and VoIP); and web hosting services. EarthLink also earns revenues from value-added services, which include revenues from ancillary services sold as add-on features to EarthLink's Internet access services, such as security products, premium email only, home networking, email storage and Internet call waiting; search revenues; and advertising revenues.
Narrowband access revenues consist of fees charged to customers for dial-up Internet access. Broadband access revenues consist of fees charged for high-speed, high-capacity access services including DSL and cable services; fees charged for managing IP-based networks; fees charged for VoIP services; usage fees; installation fees; termination fees; fees for equipment; and cost recovery fees billed to customers. Web hosting revenues consist of fees charged for leasing server space and providing web services to enable customers to build and maintain an effective online presence. Value-added services revenues consist of fees charged for ancillary services; fees charged for paid placements for searches; delivering traffic to EarthLink's partners in the form of subscribers, page views or e-commerce transactions; advertising EarthLink partners' products and services in EarthLink's various online properties and electronic publications; and referring EarthLink customers to partners' products and services. Advertising revenues are recorded when earned based on the per unit contractual rate and the number of units sold, number of subscriber impressions, or number of subscriber purchases or actions.
Gross versus net revenue recognition. EarthLink maintains relationships with certain broadband partners in which it provides services to customers using the "last mile" element of the telecommunication providers' networks. The term "last mile" generally refers to the element of telecommunications networks that is directly connected to homes and businesses. Generally, when EarthLink is the primary obligor in the transaction with the subscriber, has latitude in establishing prices, is the party determining the service specifications or has several but not all of these indicators, EarthLink records the revenue at the amount billed the subscriber. If EarthLink is not the primary obligor and/or the broadband partner has latitude in establishing prices, EarthLink records revenue associated with the related subscribers on a net basis, netting the cost of revenue associated with the service against the gross amount billed the customer and recording the net amount as revenue.
Cost of Revenues
Cost of revenues include telecommunications fees and network operations costs incurred to provide the Company's Internet access services; depreciation of network equipment; fees paid to content providers for information provided on the Company's online properties; the costs of equipment sold to customers for use with the Company's services; activation and deactivation fees paid to the Company's network providers for the provisioning and disconnection of services; the cost of connecting customers to the Company's networks via leased facilities; the costs of leasing components of its network facilities; costs paid to third-party providers for interconnect access and transport services; and surcharges due to regulatory agencies.
Cost of revenues also include sales incentives, which include the cost of promotional products and services provided to potential and new subscribers, including free modems and other hardware and free Internet access on a trial basis. EarthLink classifies the costs of sales incentives as cost of revenues.
69
EARTHLINK, INC.
NOTES TO CONSOLIDATED FINANCIAL STATEMENTS—(Continued)
Advertising Costs
Advertising costs include media, agency and promotion expenses to promote the Company's products and services. Advertising costs are expensed as incurred and included in sales and marketing expense. Advertising expenses were $159.6 million, $21.6 million and $13.8 million during the years ended December 31, 2007, 2008 and 2009, respectively.
Income Taxes
The Company recognizes deferred tax assets and liabilities for operating loss carryforwards, tax credit carryforwards and the estimated future tax consequences attributable to differences between the financial statement carrying amounts of existing assets and liabilities and their respective tax bases. Deferred tax assets and liabilities are measured using tax rates in effect for the year in which the temporary differences are expected to be recovered or settled. A valuation allowance is recorded to reduce the carrying amounts of net deferred tax assets if there is uncertainty regarding their realization. EarthLink considers many factors when assessing the likelihood of future realization including the Company's recent cumulative earnings experience by taxing jurisdiction, expectations of future taxable income, prudent and feasible tax planning strategies that are available, the carryforward periods available to the Company for tax reporting purposes and other relevant factors.
Earnings per Share
The Company presents a dual presentation of basic and diluted earnings per share ("EPS"). Basic EPS represents net income (loss) divided by the weighted average number of common shares outstanding during a reported period. Diluted EPS reflects the potential dilution that could occur if securities or other contracts to issue common stock, including stock options, warrants, restricted stock units, phantom share units, convertible debt and contingently issuable shares (collectively "Common Stock Equivalents"), were exercised or converted into common stock. The dilutive effect of outstanding stock options, restricted stock units and convertible debt is reflected in diluted earnings per share by application of the treasury stock method. Phantom share units and contingently issuable shares are reflected on an if-converted basis. In applying the treasury stock method for stock-based compensation arrangements, the assumed proceeds are computed as the sum of the amount the employee must pay upon exercise, the amount of compensation cost attributed to future services and not yet recognized and the amount of excess tax benefits, if any, that would be credited to additional paid-in capital assuming exercise of the options.
70
EARTHLINK, INC.
NOTES TO CONSOLIDATED FINANCIAL STATEMENTS—(Continued)
The following table sets forth the computation for basic and diluted net income per share for the years ended December 31, 2008 and 2009:
| |
Year Ended December 31, | |||||||
|---|---|---|---|---|---|---|---|---|
| |
2008 | 2009 | ||||||
| |
(in thousands, except per share data) |
|||||||
Numerator |
||||||||
Income from continuing operations |
$ | 187,090 | $ | 287,118 | ||||
Loss from discontinued operations |
(8,506 | ) | — | |||||
Net income |
$ | 178,584 | $ | 287,118 | ||||
Denominator |
||||||||
Basic weighted average common shares outstanding |
109,531 | 106,909 | ||||||
Dilutive effect of Common Stock Equivalents |
1,520 | 1,175 | ||||||
Diluted weighted average common shares outstanding |
111,051 | 108,084 | ||||||
Basic net income per share |
||||||||
Continuing operations |
$ | 1.71 | $ | 2.69 | ||||
Discontinued operations |
(0.08 | ) | — | |||||
Basic net income per share |
$ | 1.63 | $ | 2.69 | ||||
Diluted net income per share |
||||||||
Continuing operations |
$ | 1.68 | $ | 2.66 | ||||
Discontinued operations |
(0.08 | ) | — | |||||
Diluted net income per share |
$ | 1.61 | $ | 2.66 | ||||
During the years ended December 31, 2008 and 2009, approximately 8.4 million and 4.9 million, respectively, options and restricted stock units were excluded from the calculation of diluted EPS because the exercise prices plus the amount of unrecognized compensation cost attributed to future services exceeded the Company's average stock price during the respective years. Approximately 28.4 million shares and 29.4 million shares, respectively, that underlie the Company's convertible debt instruments were also excluded from the calculation of diluted EPS during the years ended December 31, 2008 and 2009 because the exercise price exceeded the Company's average stock price during the periods. These securities could be dilutive in future periods.
The Company has not included the effect of Common Stock Equivalents in the calculation of diluted EPS for the year ended December 31, 2007 because such inclusion would have an anti-dilutive effect due to the Company's net loss. As of December 31, 2007, the Company had 13.4 million options outstanding, 28.4 million warrants outstanding and 2.1 million restricted stock units and phantom share units outstanding.
71
EARTHLINK, INC.
NOTES TO CONSOLIDATED FINANCIAL STATEMENTS—(Continued)
Stock-Based Compensation
As of December 31, 2009, EarthLink had various stock-based compensation plans, which are more fully described in Note 11, "Stock-Based Compensation." The Company measures compensation cost for all stock awards at fair value on the date of grant and recognizes compensation expense over the requisite service period for awards expected to vest. The Company estimates the fair value of stock options using the Black-Scholes valuation model, and determines the fair value of restricted stock units based on the number of shares granted and the quoted price of EarthLink's common stock on the date of grant. Such value is recognized as expense over the requisite service period, net of estimated forfeitures, using the straight-line attribution method. For performance-based awards, the Company recognizes expense over the requisite service period, net of estimated forfeitures, using the accelerated attribution method when it is probable that the performance measure will be achieved. The estimate of awards that will ultimately vest requires significant judgment, and to the extent actual results or updated estimates differ from the Company's current estimates, such amounts will be recorded as a cumulative adjustment in the period estimates are revised. The Company considers many factors when estimating expected forfeitures, including types of awards, employee class and historical employee attrition rates. Actual results, and future changes in estimates, may differ substantially from the Company's current estimates.
Cash and Cash Equivalents
All highly liquid investments with original maturities of three months or less at the date of acquisition are considered cash equivalents. Cash equivalents are stated at cost, which approximates fair value. These investments primarily consist of money market funds.
Marketable Securities
All investments with original maturities greater than 90 days are classified as marketable securities. These securities primarily consist of auction rate securities and government-sponsored debt securities, all of which bear a minimum short-term rating of A1/P1 or a minimum long-term rating of A/A2. Marketable securities with effective maturities less than one year from the balance sheet date are classified as short-term marketable securities. Marketable securities with effective maturities greater than one year from the balance sheet date are classified as long-term marketable securities. The Company's auction rate securities are variable-rate debt instruments whose underlying agreements have contractual maturities of up to 40 years, but have interest rate reset periods at pre-determined intervals, usually every 28 days. These securities are predominantly secured by student loans guaranteed by state related higher education agencies and reinsured by the U.S. Department of Education. Beginning in February 2008, auctions for these securities failed to attract sufficient buyers, resulting in the Company continuing to hold such securities. In October 2008, EarthLink entered into an agreement with the broker that sold the Company its auction rate securities that gives the Company the right to sell its existing auction rate securities back to the broker at par plus accrued interest, beginning on June 30, 2010 until July 2, 2012. See Note 5, "Investments," for more information.
The Company's auction rate securities are classified as trading. Trading securities are carried at fair value, with any unrealized gains and losses included in gain (loss) on investments, net, in the Consolidated Statement of Operations. The Company's other marketable securities are classified as available for sale. Available-for-sale securities are carried at fair value, with any unrealized gains and losses, net of tax, included in accumulated other comprehensive income (loss) as a separate component of stockholders' equity and in total comprehensive income (loss). Amounts reclassified out of accumulated other comprehensive income (loss) into earnings are determined on a specific identification basis. Realized gains
72
EARTHLINK, INC.
NOTES TO CONSOLIDATED FINANCIAL STATEMENTS—(Continued)
and losses on marketable securities are included in gain (loss) on investments, net, in the Consolidated Statements of Operations and are determined on a specific identification basis.
The Company periodically evaluates whether declines in fair values of its investments below their cost are potentially other than temporary. This evaluation consists of several qualitative and quantitative factors such as the length of time and extent to which fair value has been below cost basis, the financial condition of the issuer and the Company's ability and intent to hold the investment for a period of time which may be sufficient for anticipated recovery in market value.
Allowance for Doubtful Accounts
EarthLink maintains an allowance for doubtful accounts for estimated losses resulting from the inability of EarthLink's customers to make payments. In assessing the adequacy of the allowance for doubtful accounts, management considers multiple factors including the aging of its receivables, historical write-offs, the credit quality of its customers, the general economic environment and other factors that may affect customers' ability to pay. If the financial condition of EarthLink's customers were to deteriorate, resulting in an impairment of their ability to make payments, additional allowances may be required. The Company's allowance for doubtful accounts was $4.0 million and $1.7 million as of December 31, 2008 and 2009, respectively. The Company recorded bad debt expense of $26.3 million, $16.1 million and $6.2 million during the years ended December 31, 2007, 2008 and 2009, respectively. The Company's write-offs of uncollectible accounts were $28.0 million, $18.5 million and $8.5 million during the years ended December 31, 2007, 2008 and 2009, respectively.
Property and Equipment
Property and equipment are stated at cost less accumulated depreciation. Depreciation expense is determined using the straight-line method over the estimated useful lives of the various asset classes, which are generally three to five years for computers, telecommunications equipment and furniture and other office equipment and 15 years for buildings. Leasehold improvements are depreciated using the straight-line method over the shorter of their estimated useful lives or the remaining term of the lease. When leases are extended, the remaining useful lives of leasehold improvements are increased as appropriate, but not for a period in excess of the remaining lease term. Expenditures for maintenance and repairs are charged to operating expense as incurred. Upon retirements or sales, the original cost and related accumulated depreciation are removed from the respective accounts, and the gains and losses are included in interest income (expense) and other, net, or as facility exit and restructuring costs, as appropriate. Upon impairment, the Company accelerates depreciation of the asset and such cost is included in operating expenses or as facility exit and restructuring costs, as appropriate.
Investments
Investments in other companies are accounted for under the cost method of accounting because the Company does not have the ability to exercise significant influence over the companies' operations. Under the cost method of accounting, investments in private companies are carried at cost and are only adjusted for other-than-temporary declines in fair value and distributions of earnings. For cost method investments in public companies that have readily determinable fair values, the Company classifies its investments as available-for-sale and, accordingly, records these investments at their fair values with unrealized gains and losses included as a separate component of stockholders' equity and in total comprehensive income (loss). Upon sale or liquidation, realized gains and losses are included in the Consolidated Statement of Operations. Amounts reclassified out of accumulated other comprehensive income (loss) into earnings are determined on a specific identification basis.
73
EARTHLINK, INC.
NOTES TO CONSOLIDATED FINANCIAL STATEMENTS—(Continued)
Management regularly evaluates the recoverability of its investments based on the performance and the financial position of those companies as well as other evidence of market value. Such evaluation includes, but is not limited to, reviewing the investee's cash position, recent financings, projected and historical financial performance, cash flow forecasts and financing needs. Management also regularly evaluates whether declines in fair values of its investments below their cost are potentially other than temporary. This evaluation consists of several qualitative and quantitative factors regarding the severity and duration of the unrealized loss as well as the Company's ability and intent to hold the investment for a period of time to recover the cost basis of the investment.
The Company has a put right (herein referred to as "put right") to sell its existing auction rate securities back to the broker beginning on June 30, 2010. The put right was classified as long-term investments in the Consolidated Balance Sheet as of December 31, 2008 and as other current assets in the Consolidated Balance Sheet as of December 31, 2009. The Company elected the fair value option for the put right and records the put right at fair value, with changes in fair value recognized as gain (loss) on investments, net, in the Consolidated Statement of Operations. The fair value of the put right is estimated using a discounted cash flow analysis. See Note 5, "Investments," for more information.
Variable Interest Entities
Variable interest entities ("VIEs") are entities that either do not have equity investors with proportionate economic and voting rights or have equity investors that do not provide sufficient financial resources for the entity to support its activities. Consolidation is required if it is determined that the Company absorbs a majority of the expected losses and/or receives a majority of the expected returns. In determining if an investee is a VIE and whether EarthLink must consolidate its results, management evaluates whether the equity of the entity is sufficient to absorb its expected losses and whether EarthLink is the primary beneficiary. Management generally performs this assessment at the date EarthLink becomes involved with the entity and upon changes in the capital structure or related governing documents of the entity. Management has concluded that the Company does not have any arrangements with entities that would require consolidation.
Investment in Equity Affiliate
The Company had a joint venture with SK Telecom Co., Ltd. ("SK Telecom"), HELIO. HELIO was a non-facilities-based mobile virtual network operator offering mobile communications services and handsets to consumers in the U.S. The Company accounted for its investment in HELIO under the equity method of accounting because the Company was able to exert significant influence over HELIO's operating and financial policies. In accordance with the equity method of accounting, EarthLink's investment in HELIO was recorded at original cost and was subsequently adjusted to recognize EarthLink's proportionate share of HELIO's net loss, amortization of basis differences and additional contributions made. During the year ended December 31, 2007, EarthLink stopped recording additional net losses of equity affiliate because its investment in HELIO was reduced to zero. During the year ended December 31, 2008, Virgin Mobile USA, Inc. ("Virgin Mobile") acquired HELIO and the Company's investment in HELIO was exchanged for limited partnership units equivalent to approximately 1.8 million shares of Virgin Mobile common stock. As a result, the Company no longer has an investment in HELIO.
Goodwill and Purchased Intangible Assets
Goodwill is the excess of the purchase price over the fair value of identifiable net assets acquired in business combinations accounted for under the purchase method of accounting. Purchased intangible assets consist primarily of subscriber bases and customer relationships, acquired software and technology,
74
EARTHLINK, INC.
NOTES TO CONSOLIDATED FINANCIAL STATEMENTS—(Continued)
trade names and other assets acquired in conjunction with the purchases of businesses and subscriber bases from other companies. When management determines material intangible assets are acquired in conjunction with the purchase of a company, EarthLink determines the fair values of the identifiable intangible assets by taking into account management's own analysis and an independent third party appraisal. Intangible assets determined to have definite lives are amortized on a straight-line basis over their estimated useful lives. Subscriber bases acquired directly are valued at cost plus assumed service liabilities, which approximates fair value at the time of purchase.
The Company does not amortize goodwill and intangible assets deemed to have indefinite lives. The Company tests its goodwill and intangible assets deemed to have indefinite lives at least annually. The Company performs an impairment test of its goodwill and intangible assets deemed to have indefinite lives annually during the fourth quarter of its fiscal year or when events and circumstances indicate that those assets might be permanently impaired. Impairment testing of goodwill is required at the reporting unit level (operating segment or one level below operating segment) and involves a two-step process. The first step of the impairment test involves comparing the estimated fair value of the Company's reporting units with the reporting unit's carrying amount, including goodwill. The Company estimates the fair value of the reporting unit using discounted expected future cash flows. If the carrying amount of the reporting unit exceeds its fair value, a second step is performed to compare the carrying amount of goodwill to the implied fair value of that goodwill. If the carrying amount of goodwill exceeds the implied fair value of that goodwill, an impairment loss would be recognized in an amount equal to the excess. Impairment testing of intangible assets deemed to have indefinite lives is performed by comparing the carrying value of the asset to the fair value. If the carrying amount of an indefinite-lived intangible asset exceeds the fair value, an impairment loss is recognized equal to the excess.
Long-Lived Assets
The Company evaluates the recoverability of long-lived assets, including property and equipment and purchased definite-lived intangible assets, for impairment when events or changes in circumstances indicate that the carrying amount of an asset may not be recoverable. Conditions that would necessitate an impairment assessment include a significant decline in the observable market value of an asset, a significant change in the extent or manner in which an asset is used, or a significant adverse change that would indicate the carrying amount of an asset or group of assets is not recoverable. For long-lived assets to be held and used, EarthLink recognizes an impairment loss only if its carrying amount is not recoverable through its undiscounted cash flows and measures the impairment loss, if any, based on the difference between the carrying amount and fair value. Long-lived assets held for sale are reported at the lower of cost or fair value less costs to sell.
Leases
The Company categorizes leases at their inception as either operating or capital leases depending on certain criteria. The Company recognizes rent expense for operating leases on a straight-line basis without regard to deferred payment terms, such as rent holidays or fixed escalations. Incentives are treated as a reduction of the Company's rent costs over the term of the lease agreement. The Company records leasehold improvements funded by landlords under operating leases as leasehold improvements and deferred rent.
Facility Exit and Restructuring Costs
The Company recognizes a liability for costs associated with an exit or disposal activity when the liability is incurred. Facility exit and restructuring liabilities include estimates for, among other things,
75
EARTHLINK, INC.
NOTES TO CONSOLIDATED FINANCIAL STATEMENTS—(Continued)
severance payments and amounts due under lease obligations, net of estimated sublease income, if any. Key variables in determining lease estimates include operating expenses due under lease arrangements, the timing and amounts of sublease rental payments, tenant improvement costs and brokerage and other related costs. The Company periodically evaluates and, if necessary, adjusts its estimates based on currently-available information. Such adjustments are classified as facility exit and restructuring costs in the Consolidated Statements of Operations.
Post-Employment Benefits
Post-employment benefits primarily consist of the Company's severance plans. When the Company has either a formal severance plan or a history of consistently providing severance benefits representing a substantive plan, the Company recognizes severance costs when they are both probable and reasonably estimable.
Comprehensive Income (Loss)
Comprehensive income (loss) as presented in the Consolidated Statements of Stockholders' Equity and Comprehensive Income (Loss) includes unrealized gains and losses which are excluded from the Consolidated Statements of Operations. For the years ended December 31, 2007, 2008 and 2009, these amounts included changes in unrealized gains and losses, net of tax, on certain investments classified as available-for-sale.
Certain Risks and Concentrations
Credit Risk. By their nature, all financial instruments involve risk, including credit risk for non-performance by counterparties. Financial instruments that potentially subject the Company to credit risk consist principally of cash, cash equivalents, marketable securities, trade receivables and long-term investments. In addition, credit risk for the Company's cash, cash equivalents and marketable securities may be exacerbated by unfavorable economic conditions. If financial markets experience prolonged periods of decline, the value or liquidity of the Company's cash, cash equivalents and marketable securities could decline and result in an other-than-temporary decline in fair value, which could adversely affect the Company's financial position, results of operations and cash flows.
The Company's cash investment policy limits investments to investment grade instruments. Accounts receivable are typically unsecured and are derived from revenues earned from customers primarily located in the U.S. Credit risk with respect to trade receivables is limited due to the large number of customers comprising the Company's customer base. Additionally, the Company maintains allowances for potential credit losses. As of December 31, 2008, one company accounted for more than 10% of gross accounts receivable. As of December 31, 2009, two companies each accounted for more than 10% of gross accounts receivable. Management regularly evaluates the recoverability of its investments in other companies based on the performance and the financial position of those companies as well as other evidence of market value.
Regulatory Risk. EarthLink purchases broadband access from incumbent local exchange carriers, competitive local exchange carriers and cable providers. Please refer to "Regulatory Environment" in the Business section of this Annual Report on Form 10-K for a discussion of the regulatory environment as well as a discussion regarding the Company's contracts with broadband access providers.
Supply Risk. The Company's business depends on the capacity, affordability, reliability and security of third-party telecommunications service providers. Only a small number of providers offer the network
76
EARTHLINK, INC.
NOTES TO CONSOLIDATED FINANCIAL STATEMENTS—(Continued)
services the Company requires, and the majority of its telecommunications services are currently purchased from a limited number of telecommunications service providers. Although management believes that alternate telecommunications providers could be found in a timely manner, any disruption of these services could have a material adverse effect on the Company's financial position, results of operations and cash flows.
The Company also relies on the reliability, capacity and effectiveness of its outsourced customer service and technical support providers. The Company's Consumer Services segment relies primarily on one customer service and technical support vendor. The Company purchases customer service and technical support services primarily from geographically dispersed service providers. The customer service and technical support service providers may become subject to financial, economic, environmental and political risks, system failures or other services interruptions beyond the Company's or the providers' control which could jeopardize their ability to deliver services. Although management believes that alternate contact center service providers could be found in a timely manner, any disruption of these services could have a material adverse effect on the Company's financial position, results of operations and cash flows.
Fair Value of Financial Instruments
The carrying amounts of the Company's cash, cash equivalents, trade receivables and trade payables approximate their fair values because of their nature and respective durations. The Company's short- and long-term investments in marketable securities consist of available-for-sale and trading securities that are carried at market value. The Company's equity investments in publicly-held companies are stated at fair value, which is based on quoted market prices, with unrealized gains and losses included in stockholders' equity. The Company's investments in privately-held companies are stated at cost, net of other-than-temporary impairments, because it is impracticable to estimate fair value.
Reclassifications
Certain amounts in the prior year financial statements have been reclassified to conform to the current year presentation.
Recently Issued Accounting Pronouncements
In September 2009, the Financial Accounting Standards Board ("FASB") issued new guidance on revenue recognition. The new guidance addresses the accounting for multiple-deliverable arrangements to enable vendors to account for products or services (deliverables) separately rather than as a combined unit and to modify the manner in which the transaction consideration is allocated across the separately identifiable deliverables and how revenue is recognized. The new guidance also significantly expands the disclosure requirements for multiple-element arrangements. The new guidance is effective prospectively for revenue arrangements entered into or materially modified in fiscal years beginning on or after June 15, 2010. The Company does not expect the adoption of the new guidance to have a material impact on its financial statements.
In December 2009, the FASB issued new guidance regarding VIEs. The new guidance requires a qualitative approach to identifying a controlling financial interest in a VIE, and requires ongoing assessment of whether an entity is a VIE and whether an interest in a VIE makes the holder the primary beneficiary of the VIE. The new guidance is effective for annual reporting periods beginning after November 15, 2009. The Company does not expect the adoption of this new guidance to have a material impact on its consolidated financial statements.
77
EARTHLINK, INC.
NOTES TO CONSOLIDATED FINANCIAL STATEMENTS—(Continued)
Adoption of Recent Accounting Pronouncements
Codification. In the third quarter of 2009, the Company adopted the FASB Accounting Standards Codification ("ASC"). The ASC became the single official source of authoritative U.S. generally accepted accounting principles ("GAAP") recognized by the FASB, other than guidance issued by the Securities and Exchange Commission. The adoption of the ASC did not have a material impact on the Company's financial statements. However, the adoption of the ASC changed the Company's references to GAAP in its consolidated financial statements.
Convertible Debt. On January 1, 2009, the Company adopted new accounting guidance related to accounting for convertible debt instruments that may be settled in cash upon conversion. The new accounting guidance requires that the liability and equity components of convertible debt instruments that may be settled in cash upon conversion (including partial cash settlement) be separately accounted for in a manner that reflects an issuer's non-convertible debt borrowing rate. The resulting debt discount is accreted over the period the convertible debt is expected to be outstanding as additional non-cash interest expense. Retrospective application to all periods presented is required. The adoption of this new guidance on January 1, 2009 affected the accounting for the Company's Convertible Senior Notes due November 15, 2026 (the "Notes"), which were issued in November 2006. Upon adoption, the Company recorded an adjustment to increase additional paid-in capital as of the November 2006 issuance date by approximately $62.1 million. The Company is accreting the resulting debt discount to interest expense over the estimated five-year life of the Notes, which represents the first redemption date of November 2011. Upon adoption, the Company also recorded an adjustment to decrease additional paid-in capital and other long-term assets by approximately $1.8 million to reclassify debt issuance costs related to the equity component of the Notes. The Company recorded a pre-tax adjustment of approximately $22.3 million to accumulated deficit that represents accretion of the debt discount and decrease in amortization of debt issuance costs during the years ended December 31, 2006, 2007 and 2008, recognized additional non-cash interest expense of $12.2 million during the year ending December 31, 2009 and will recognize additional non-cash interest expense of $13.4 million and $12.4 million during the years ending December 31, 2010 and 2011, respectively, for accretion of the debt discount and decrease in amortization of debt issuance costs. As a result of the adoption of this new guidance, the Company reduced income from continuing operations and net income for the year ended December 31, 2009 by $12.2 million and reduced basic and diluted earnings per share by $0.11 per share. The Company also recorded a deferred tax liability for temporary tax differences. However, this was offset by a corresponding decrease in the valuation allowance for deferred tax assets.
78
EARTHLINK, INC.
NOTES TO CONSOLIDATED FINANCIAL STATEMENTS—(Continued)
The following tables present the effect of the adoption of this new guidance on the Company's affected financial statement line items for the years ended December 31, 2007 and 2008 and as of December 31, 2008:
| |
Year Ended December 31, 2007 | Year Ended December 31, 2008 | ||||||||||||||||||
|---|---|---|---|---|---|---|---|---|---|---|---|---|---|---|---|---|---|---|---|---|
| |
As Originally Reported |
As Adjusted |
Effect of Change |
As Originally Reported |
As Adjusted |
Effect of Change |
||||||||||||||
| |
(in thousands, except per share data) |
|||||||||||||||||||
Statement of Operations: |
||||||||||||||||||||
Interest income (expense) and other, net |
$ | 12,824 | $ | 2,824 | $ | (10,000 | ) | $ | (1,381 | ) | $ | (12,409 | ) | $ | (11,028 | ) | ||||
Income (loss) from continuing operations |
(54,795 | ) | (64,795 | ) | (10,000 | ) | 198,118 | 187,090 | (11,028 | ) | ||||||||||
Net income (loss) |
(135,097 | ) | (145,097 | ) | (10,000 | ) | 189,612 | 178,584 | (11,028 | ) | ||||||||||
Basic net income (loss) per share |
||||||||||||||||||||
Continuing operations |
$ | (0.45 | ) | $ | (0.53 | ) | $ | (0.08 | ) | $ | 1.81 | $ | 1.71 | $ | (0.10 | ) | ||||
Basic net income per share |
(1.11 | ) | (1.19 | ) | (0.08 | ) | 1.73 | 1.63 | (0.10 | ) | ||||||||||
Diluted net income (loss) per share |
||||||||||||||||||||
Continuing operations |
$ | (0.45 | ) | $ | (0.53 | ) | $ | (0.08 | ) | $ | 1.78 | $ | 1.68 | $ | (0.10 | ) | ||||
Diluted net income per share |
(1.11 | ) | (1.19 | ) | (0.08 | ) | 1.71 | 1.61 | (0.10 | ) | ||||||||||
| |
As of December 31, 2008 | |||||||||
|---|---|---|---|---|---|---|---|---|---|---|
| |
As Originally Reported |
As Adjusted |
Effect of Change |
|||||||
| |
(in thousands) |
|||||||||
Balance Sheet: |
||||||||||
Other long-term assets |
$ | 5,725 | $ | 4,698 | $ | (1,027 | ) | |||
Long-term debt |
258,750 | 219,733 | (39,017 | ) | ||||||
Additional paid-in capital |
2,075,571 | 2,135,887 | 60,316 | |||||||
Accumulated deficit |
(994,507 | ) | (1,016,833 | ) | (22,326 | ) | ||||
79
EARTHLINK, INC.
NOTES TO CONSOLIDATED FINANCIAL STATEMENTS—(Continued)
3. Facility Exit and Restructuring Costs
Facility exit and restructuring costs consisted of the following during the years ended December 31, 2007, 2008 and 2009:
| |
Year Ended December 31, | |||||||||
|---|---|---|---|---|---|---|---|---|---|---|
| |
2007 | 2008 | 2009 | |||||||
| |
(in thousands) |
|||||||||
2007 Restructuring Plan |
$ | 64,271 | $ | 9,394 | $ | 5,743 | ||||
Legacy Restructuring Plans |
1,110 | (252 | ) | (128 | ) | |||||
|
$ | 65,381 | $ | 9,142 | $ | 5,615 | ||||
2007 Restructuring Plan
In August 2007, EarthLink adopted a restructuring plan (the "2007 Plan") to reduce costs and improve the efficiency of the Company's operations. The 2007 Plan was the result of a comprehensive review of operations within and across the Company's functions and businesses. Under the 2007 Plan, the Company reduced its workforce by approximately 900 employees, closed office facilities in Orlando, Florida; Knoxville, Tennessee; Harrisburg, Pennsylvania and San Francisco, California and consolidated its office facilities in Atlanta, Georgia and Pasadena, California. The 2007 Plan was primarily implemented during the latter half of 2007 and during the year ended December 31, 2008. However, since management continues to evaluate EarthLink's businesses, there have been and may continue to be supplemental provisions for new cost savings initiatives as well as changes in estimates to amounts previously recorded.
The following table summarizes facility exit and restructuring costs during the years ended December 31, 2007, 2008 and 2009 and the cumulative costs incurred to date as a result of the 2007 Plan. Such costs have been classified as facility exit and restructuring costs in the Consolidated Statements of Operations.
| |
Year Ended December 31, | |
|||||||||||
|---|---|---|---|---|---|---|---|---|---|---|---|---|---|
| |
Cumulative Costs Incurred To Date |
||||||||||||
| |
2007 | 2008 | 2009 | ||||||||||
| |
(in thousands) |
||||||||||||
Severance and personnel-related costs |
$ | 30,303 | $ | 461 | $ | — | $ | 30,764 | |||||
Lease termination and facilities-related costs |
12,216 | 4,808 | 5,697 | 22,721 | |||||||||
Non-cash asset impairments |
20,621 | 4,125 | 46 | 24,792 | |||||||||
Other associated costs |
1,131 | — | — | 1,131 | |||||||||
|
$ | 64,271 | $ | 9,394 | $ | 5,743 | $ | 79,408 | |||||
The Company recorded $9.4 million and $5.7 million of facility exit and restructuring costs during the years ended December 31, 2008 and 2009, respectively, primarily as a result of changes to sublease estimates in its exited facilities and further consolidation in its Atlanta, Georgia facility. The asset impairment charges recorded during the years ended December 31, 2007 and 2008 primarily relate to fixed asset write-offs due to facility closings and consolidations and the termination of certain projects for which costs had been capitalized. These assets were impaired as the carrying values of the assets exceeded the expected future undiscounted cash flows to the Company. The impairment charges recorded during the years ended December 31, 2007 and 2008 have been classified as facility exit and restructuring costs in the Consolidated Statements of Operations.
80
EARTHLINK, INC.
NOTES TO CONSOLIDATED FINANCIAL STATEMENTS—(Continued)
The following table summarizes activity for the liability balances associated with the 2007 Plan for the years ended December 31, 2007, 2008 and 2009, including changes during the years attributable to costs incurred and charged to expense and costs paid or otherwise settled:
| |
Severance and Benefits |
Facilities | Asset Impairments |
Other Costs |
Total | |||||||||||
|---|---|---|---|---|---|---|---|---|---|---|---|---|---|---|---|---|
| |
(in thousands) |
|||||||||||||||
Balance as of December 31, 2006 |
$ | — | $ | — | $ | — | $ | — | $ | — | ||||||
Accruals |
30,303 | 12,216 | 20,621 | 1,131 | 64,271 | |||||||||||
Payments |
(18,262 | ) | (480 | ) | — | (760 | ) | (19,502 | ) | |||||||
Non-cash charges |
— | 4,388 | (20,621 | ) | (371 | ) | (16,604 | ) | ||||||||
Balance as of December 31, 2007 |
12,041 | 16,124 | — | — | 28,165 | |||||||||||
Accruals |
461 | 4,808 | 4,125 | — | 9,394 | |||||||||||
Payments |
(12,502 | ) | (6,174 | ) | — | — | (18,676 | ) | ||||||||
Non-cash charges |
— | 1,936 | (4,125 | ) | — | (2,189 | ) | |||||||||
Balance as of December 31, 2008 |
— | 16,694 | — | — | 16,694 | |||||||||||
Accruals |
— | 5,697 | 46 | — | 5,743 | |||||||||||
Payments |
— | (5,442 | ) | — | — | (5,442 | ) | |||||||||
Non-cash charges |
— | 489 | (46 | ) | — | 443 | ||||||||||
Balance as of December 31, 2009 |
$ | — | $ | 17,438 | $ | — | $ | — | $ | 17,438 | ||||||
Facility exit and restructuring liabilities due within one year of the balance sheet date are classified as other accrued liabilities and facility exit and restructuring liabilities due after one year are classified as other long-term liabilities in the Consolidated Balance Sheets. Of the unpaid balance as of December 31, 2008 and 2009, approximately $5.9 million and $5.1 million, respectively, was classified as other accrued liabilities and approximately $10.8 million and $12.3 million, respectively, was classified as other long-term liabilities.
Legacy Restructuring Plans
During the years ended December 31, 2003, 2004 and 2005, EarthLink executed a series of plans to restructure and streamline its contact center operations and outsource certain internal functions (collectively referred to as "Legacy Plans"). The Legacy Plans included facility exit costs, personnel-related costs and asset disposals. EarthLink periodically evaluates and adjusts its estimates for facility exit and restructuring costs based on currently-available information. Such adjustments are included as facility exit and restructuring costs in the Consolidated Statements of Operations. During the year ended December 31 2007, EarthLink recorded $1.1 million of facility exit and restructuring costs related to Legacy Plans as a result of changes in estimates. During the years ended December 31, 2008 and 2009, EarthLink recorded reductions of $0.3 million and $0.1 million, respectively, to facility exit and restructuring costs as a result of changes in estimates. As of December 31, 2009, the Company had a $0.5 million liability remaining for real estate commitments related to Legacy Plans which was classified as other accrued liabilities in the Consolidated Balance Sheet. All other costs have been paid.
4. Discontinued Operations
In November 2007, management concluded that its municipal wireless broadband operations were no longer consistent with the Company's strategic direction and the Company's Board of Directors authorized management to pursue the divestiture of the Company's municipal wireless broadband assets. As a result
81
EARTHLINK, INC.
NOTES TO CONSOLIDATED FINANCIAL STATEMENTS—(Continued)
of that decision, the Company classified the municipal wireless broadband assets as held for sale on the Consolidated Balance Sheets and presented the municipal wireless broadband results of operations as discontinued operations for all periods presented. The results of operations for municipal wireless broadband were previously included in the Consumer Services segment.
During the year ended December 31, 2008, the Company transferred its municipal wireless broadband networks to Corpus Christi, TX and Milpitas, CA in exchange for releasing the Company from its existing network agreements. The Company also transferred its municipal wireless broadband networks in the city of Philadelphia, PA to a local Philadelphia company. Additionally, the Company terminated its municipal wireless broadband service in New Orleans, LA and Anaheim, CA and removed its network equipment from those cities. As of December 31, 2008, the Company had completed the divestiture of its municipal wireless broadband assets.
The following table presents summarized results of operations related to the Company's discontinued operations for the years ended December 31, 2007 and 2008:
| |
Year Ended December 31, | ||||||
|---|---|---|---|---|---|---|---|
| |
2007 | 2008 | |||||
| |
(in thousands) |
|
|||||
Revenues |
$ | 2,097 | $ | 1,305 | |||
Operating costs and expenses |
(33,871 | ) | (4,569 | ) | |||
Impairment, facility exit and restructuring costs |
(48,528 | ) | (6,326 | ) | |||
Income tax benefit |
— | 1,084 | |||||
Loss from discontinued operations, net of tax |
$ | (80,302 | ) | $ | (8,506 | ) | |
The Company recorded a $27.6 million charge during the year ended December 31, 2007 to reduce the carrying value of the long-lived assets to their fair value less estimated costs to sell. The Company also recorded restructuring costs in connection with the 2007 Plan of $20.9 million during the year ended December 31, 2007 related to the municipal wireless broadband operations, including $5.0 million for severance and personnel-related costs; $6.9 million for non-cash asset impairments; and $9.0 million for other associated costs. During the year ended December 31, 2008, the Company recorded restructuring costs in connection with the 2007 Plan of $6.3 million related to the municipal wireless broadband operations. These charges are reflected within loss from discontinued operations, net of tax, in the Consolidated Statements of Operations. All costs have been paid or otherwise settled.
5. Investments
Marketable Securities
The Company's marketable securities consisted of the following as of December 31, 2008 and 2009:
| |
As of December 31, | |||||||
|---|---|---|---|---|---|---|---|---|
| |
2008 | 2009 | ||||||
| |
(in thousands) |
|||||||
Auction rate securities |
$ | 47,809 | $ | 42,906 | ||||
Government agency notes |
— | 42,060 | ||||||
Total marketable securities |
$ | 47,809 | $ | 84,966 | ||||
82
EARTHLINK, INC.
NOTES TO CONSOLIDATED FINANCIAL STATEMENTS—(Continued)
The Company's auction rate securities are variable-rate debt instruments whose underlying agreements have contractual maturities of up to 40 years, but have interest rate reset periods at pre-determined intervals, usually every 28 days. These securities are predominantly secured by student loans guaranteed by state related higher education agencies and reinsured by the U.S. Department of Education. Beginning in February 2008, auctions for these securities failed to attract sufficient buyers, resulting in the Company continuing to hold such securities. In October 2008, EarthLink entered into an agreement with the broker that sold the Company its auction rate securities that gives the Company the right to sell its existing auction rate securities back to the broker at par plus accrued interest, beginning on June 30, 2010 until July 2, 2012. The agreement also grants the broker the right to buy the Company's auction rate securities at par plus accrued interest, until July 2, 2012. These securities were classified as long-term marketable securities in the Consolidated Balance Sheet as of December 31, 2008. As a result of the put right, these securities were classified as short-term marketable securities in the Consolidated Balance Sheet as of December 31, 2009.
During the year ended December 31, 2008, the Company recorded an other-than-temporary impairment of $9.9 million to record the auction rate securities at their fair value, as the Company no longer had the intent to hold the securities until maturity. The Company also elected a one-time transfer of its auction rate securities from the available-for-sale category to the trading category. The Company recorded the value of the put right to long-term investments in its Consolidated Balance Sheet with a corresponding $9.8 million gain on investments. The Company elected the fair value option for the put right to offset the fair value changes of the auction rate securities. The fair value of the put right is estimated using a discounted cash flow analysis. The other-than-temporary impairment, net of the gain on the put right, was $0.1 million during the year ended December 31, 2008 and is included in gain (loss) on investments, net, in the Consolidated Statement of Operations. During the year ended December 31, 2009, the Company redeemed $9.6 million of auction rate securities at par, plus accrued interest. During the year ended December 31, 2009, the Company recorded a $4.7 million gain on investments related to the auction rate securities and recorded a $4.6 million loss on investments related to the put right. The net gain of $0.1 million during the year ended December 31, 2009 is included in gain on investments, net, in the Consolidated Statement of Operations. See Note 15, "Fair Value Measurements," for a table that reconciles the beginning and ending balances of the auction rate securities.
The Company's government agency notes consist of government-sponsored debt securities and are classified as available for sale. The amortized cost and aggregate fair value of the government agency notes was $42.1 million as of December 31, 2009. Gross unrealized losses and gross unrealized gains as of December 31, 2009 were nominal. These securities were classified as short-term marketable securities in the Consolidated Balance Sheet as of December 31, 2009.
83
EARTHLINK, INC.
NOTES TO CONSOLIDATED FINANCIAL STATEMENTS—(Continued)
Investments
The Company's investments consisted of the following as of December 31, 2008 and 2009:
| |
As of December 31, | |||||||
|---|---|---|---|---|---|---|---|---|
| |
2008 | 2009 | ||||||
| |
(in thousands) |
|||||||
Investments stated at fair value |
$ | 11,408 | $ | 6,768 | ||||
Investments stated at cost |
9,300 | — | ||||||
Total investments |
20,708 | 6,768 | ||||||
Less: classifed as other current assets |
— | (6,768 | ) | |||||
Total long-term investments |
$ | 20,708 | $ | — | ||||
As of December 31, 2008, gross unrealized losses were nominal and there were no gross unrealized gains. As of December 31, 2009, gross unrealized losses were nominal and gross unrealized gains were $0.5 million.
The Company's gain (loss) on investments, net, consisted of the following during the years ended December 31, 2007, 2008 and 2009:
| |
Year Ended December 31, | |||||||||
|---|---|---|---|---|---|---|---|---|---|---|
| |
2007 | 2008 | 2009 | |||||||
| |
(in thousands) |
|||||||||
Other-than-temporary impairment losses |
$ | (7,142 | ) | $ | (3,556 | ) | $ | (9,300 | ) | |
Cash distributions from investments |
1,557 | — | 231 | |||||||
Gain from sale of Covad common stock |
— | 2,025 | — | |||||||
Gain from receipt of Virgin Mobile shares |
— | 4,352 | — | |||||||
Gain from receipt and sale of Sprint Nextel shares |
— | — | 7,641 | |||||||
Net change in fair value of auction rate securities and put right |
— | (113 | ) | 107 | ||||||
|
$ | (5,585 | ) | $ | 2,708 | $ | (1,321 | ) | ||
The Company had an investment in Covad Communications Group, LLC ("Covad") consisting of 6.1 million shares of Covad common stock and $47.5 million aggregate principal amount of 12% Senior Secured Convertible Notes due 2011 (the "Covad Notes"). During the year ended December 31, 2008, Platinum Equity, LLC acquired all outstanding shares of Covad. Upon closing of the transaction, a change of control of Covad occurred, resulting in Covad's repurchase of all Covad Notes held by EarthLink at a purchase price equal to 100% of the principal amount thereof plus accrued and unpaid interest. As a result, the Company received cash of $50.8 million for the aggregate principal amount of the Covad Notes plus accrued interest and received cash of $6.3 million for its 6.1 million shares of Covad common stock. The Company recognized a gain of $2.0 million based on its cost basis of the Covad common stock, which was classified as gain (loss) on investments, net, in the Consolidated Statement of Operations.
During the year ended December 31, 2008, the Company received limited partnership units equivalent to approximately 1.8 million shares of Virgin Mobile common stock in exchange for its investment in HELIO. EarthLink had an approximate 2% ownership interest in Virgin Mobile following the transaction. EarthLink accounted for its investment in Virgin Mobile under the cost method and classified the investment as available for sale. As a result of the transaction, EarthLink recorded a gain of $4.4 million, which is included in gain (loss) on investments, net, in the Consolidated Statement of Operations.
84
EARTHLINK, INC.
NOTES TO CONSOLIDATED FINANCIAL STATEMENTS—(Continued)
During the year ended December 31, 2009, Sprint Nextel and Virgin Mobile completed a merger. As a result, EarthLink received 2.4 million shares of Sprint Nextel common stock for its Virgin Mobile common stock. During the year ended December 31, 2009, EarthLink sold 2.2 million of the Sprint Nextel shares for net proceeds of $8.2 million. EarthLink recorded a $7.6 million gain resulting from the receipt of Sprint Nextel shares and the subsequent sale, which is included in gain (loss) on investments, net, in the Consolidated Statement of Operations. The carrying value and fair value of the remaining 0.2 million Sprint Nextel shares was $0.9 million as of December 31, 2009 and included in other current assets in the Consolidated Balance Sheet. EarthLink accounts for its investment in Sprint Nextel under the cost method and classifies the investment as available for sale.
Investment in Equity Affiliate
The Company had a joint venture with SK Telecom, HELIO. HELIO was a non-facilities-based mobile virtual network operator offering mobile communications services and handsets to consumers in the U.S. EarthLink invested an aggregate of $220.0 million of cash and non-cash assets in HELIO, of which $19.5 million was contributed to HELIO during the year ended December 31, 2007. The Company also loaned HELIO $30.0 million during the year ended December 31, 2007. In August 2008, Virgin Mobile acquired HELIO. EarthLink's equity and debt investments in HELIO were exchanged for limited partnership units equivalent to approximately 1.8 million shares of Virgin Mobile common stock. In November 2009, Sprint Nextel and Virgin Mobile completed a merger and the Company received 2.4 million shares of Sprint Nextel common stock for its Virgin Mobile common stock. As a result, the Company no longer has an investment in HELIO.
Prior to the transaction with Virgin Mobile, the Company accounted for its investment in HELIO under the equity method of accounting because the Company was able to exert significant influence over HELIO's operating and financial policies. The Company had been recording its proportionate share of HELIO's net loss in its Consolidated Statements of Operations and amortizing the difference between the book value and fair value of non-cash assets contributed to HELIO over their estimated useful lives. The amortization increased the carrying value of the Company's investment and decreased the net losses of equity affiliate included in the Consolidated Statements of Operations. During the year ended December 31, 2007, the Company recorded $111.3 million of net losses of equity affiliate related to its HELIO investment, which is net of amortization of basis differences and certain other equity method accounting adjustments. During 2007, EarthLink discontinued recording additional net losses of equity affiliate because the carrying value of its investment in HELIO was reduced to zero.
The following is summarized statement of operations information of HELIO for the year ended December 31, 2007:
| |
Year Ended December 31, 2007 |
|||
|---|---|---|---|---|
| |
(in thousands) |
|||
Revenues |
$ | 170,988 | ||
Operating loss |
(328,196 | ) | ||
Net loss |
(326,562 | ) | ||
85
EARTHLINK, INC.
NOTES TO CONSOLIDATED FINANCIAL STATEMENTS—(Continued)
6. Property and Equipment
Property and equipment is recorded at cost and consisted of the following as of December 31, 2008 and 2009:
| |
As of December 31, | ||||||
|---|---|---|---|---|---|---|---|
| |
2008 | 2009 | |||||
| |
(in thousands) |
||||||
Data center and network equipment |
$ | 123,284 | $ | 125,166 | |||
Office and other equipment |
141,102 | 139,793 | |||||
Land and buildings |
17,188 | 17,243 | |||||
Leasehold improvements |
42,115 | 42,254 | |||||
Construction in progress |
194 | 1,051 | |||||
|
323,883 | 325,507 | |||||
Less accumulated depreciation |
(286,637 | ) | (291,240 | ) | |||
|
$ | 37,246 | $ | 34,267 | |||
Depreciation expense charged to continuing operations, which includes depreciation expense associated with property under capital leases, was $32.6 million, $23.0 million and $16.2 million for the years ended December 31, 2007, 2008 and 2009, respectively.
7. Goodwill and Purchased Intangible Assets
Goodwill
The changes in the carrying amount of goodwill by operating segment during the year ended December 31, 2009 were as follows:
| |
Consumer Services Segment |
Business Services Segment |
Total | ||||||||
|---|---|---|---|---|---|---|---|---|---|---|---|
| |
(in thousands) |
||||||||||
Balance as of December 31, 2008 |
|||||||||||
Goodwill |
$ | 88,920 | $ | 87,878 | $ | 176,798 | |||||
Accumulated impairment loss |
— | (63,986 | ) | (63,986 | ) | ||||||
|
88,920 | 23,892 | 112,812 | ||||||||
Impairment loss |
— | (23,892 | ) | (23,892 | ) | ||||||
Balance as of December 31, 2009 |
|||||||||||
Goodwill |
88,920 | 87,878 | 176,798 | ||||||||
Accumulated impairment loss |
— | (87,878 | ) | (87,878 | ) | ||||||
|
$ | 88,920 | $ | — | $ | 88,920 | |||||
86
EARTHLINK, INC.
NOTES TO CONSOLIDATED FINANCIAL STATEMENTS—(Continued)
Purchased Intangible Assets
The following table presents the components of the Company's acquired identifiable intangible assets included in the accompanying Consolidated Balance Sheets as of December 31, 2008 and 2009:
| |
As of December 31, 2008 | As of December 31, 2009 | ||||||||||||||||||
|---|---|---|---|---|---|---|---|---|---|---|---|---|---|---|---|---|---|---|---|---|
| |
Gross Carrying Value |
Accumulated Amortization |
Net Carrying Value |
Gross Carrying Value |
Accumulated Amortization |
Net Carrying Value |
||||||||||||||
| |
(in thousands) |
|||||||||||||||||||
Intangible assets subject to amortization: |
||||||||||||||||||||
Subscriber bases and customer relationships |
$ | 94,039 | $ | (77,758 | ) | $ | 16,281 | $ | 79,413 | $ | (70,487 | ) | $ | 8,926 | ||||||
Software, technology and other |
739 | (649 | ) | 90 | 711 | (711 | ) | — | ||||||||||||
Trade names |
1,521 | (304 | ) | 1,217 | 1,521 | (608 | ) | 913 | ||||||||||||
|
96,299 | (78,711 | ) | 17,588 | 81,645 | (71,806 | ) | 9,839 | ||||||||||||
Intangible assets not subject to amortization: |
||||||||||||||||||||
Trade names |
1,964 | — | 1,964 | 1,711 | — | 1,711 | ||||||||||||||
|
$ | 98,263 | $ | (78,711 | ) | $ | 19,552 | $ | 83,356 | $ | (71,806 | ) | $ | 11,550 | ||||||
Amortization of intangible assets in the Consolidated Statements of Operations for the years ended December 31, 2007, 2008 and 2009 represents the amortization of definite-lived intangible assets. The Company's definite-lived intangible assets primarily consist of subscriber bases and customer relationships, acquired software and technology, trade names and other assets acquired in conjunction with the purchases of businesses and subscriber bases from other companies that are not deemed to have indefinite lives. The Company's identifiable indefinite-lived intangible assets consist of certain trade names. Definite-lived intangible assets are amortized on a straight-line basis over their estimated useful lives, which are generally three to six years for subscriber bases and customer relationships and three years for acquired software and technology. As of December 31, 2009, the weighted average amortization periods were 4.4 years for subscriber base assets and customer relationships, 3.0 years for software and technology and 5.0 years for trade names. Based on the current amount of definite-lived intangible assets, the Company expects to record amortization expense of approximately $4.1 million, $2.9 million, $1.5 million, $0.8 million and $0.5 million during the years ending December 31, 2010, 2011, 2012, 2013 and 2014, respectively. Actual amortization expense to be reported in future periods could differ materially from these estimates as a result of asset acquisitions, changes in useful lives and other relevant factors.
During the year ended December 31, 2009, the Company removed fully amortized intangible assets that had a gross carrying value and accumulated amortization of $14.6 million.
Impairment of Goodwill and Intangible Assets
During the years ended December 31, 2007, 2008 and 2009, the Company recorded non-cash impairment charges of $4.3 million, $78.7 million and $24.1 million, respectively, which are included in impairment of goodwill and intangible assets in the Consolidated Statements of Operations.
After completing its annual impairment test during the fourth quarter of 2008, the Company concluded that goodwill and certain intangible assets recorded as a result of its April 2006 acquisition of New Edge were impaired and recorded non-cash impairment charges related to the New Edge reporting unit of $64.0 million for goodwill, $3.1 million for the indefinite-lived trade name and $11.6 million for customer relationships. The primary factor contributing to the impairment charge was the recent significant economic downturn. New Edge serves a large percentage of small and medium-sized business customers, especially retail businesses, which have been particularly affected by the recent economic
87
EARTHLINK, INC.
NOTES TO CONSOLIDATED FINANCIAL STATEMENTS—(Continued)
downturn. Economic conditions affecting retail businesses worsened substantially during the "holiday season" in the fourth quarter of 2008. As a result, the Company updated its long-range financial outlook in the fourth quarter of 2008, which reflected decreased expectations of future growth rates and cash flows for New Edge. The Company used this updated financial outlook in conjunction with its annual impairment test.
After completing its annual impairment test during the fourth quarter of 2009, the Company concluded that goodwill and certain intangible assets recorded as a result of the New Edge acquisition were further impaired and recorded non-cash impairment charges related to the New Edge reporting unit of $23.9 million for goodwill and $0.2 million for the indefinite-lived trade name. As a result, there is no remaining carrying value related to New Edge goodwill. The primary factor contributing to the impairment charge was continued sales pressure in the small and medium-sized business market due to the economy, which adversely impacted the Company's long-range financial outlook. The Company used this updated financial outlook in conjunction with its annual impairment test.
Goodwill. Impairment testing of goodwill is required at the reporting unit level and involves a two-step process. Although the Company operates two reportable segments, Consumer Services and Business Services, the Company has identified three reporting units for evaluating goodwill, which are Consumer Services, New Edge and Web Hosting. The Consumer Services reportable segment is one reporting unit, while the Business Services reportable segment consists of two reporting units, New Edge and Web Hosting. Each of these reporting units constitutes a business for which discrete financial information is available and segment management regularly reviews the operating results.
The first step of the annual impairment test involves comparing the estimated fair value of the Company's reporting units with the reporting unit's carrying amount, including goodwill. The Company estimated the fair values of its reporting units primarily using the income approach valuation methodology that includes the discounted cash flow method, taking into consideration the market approach and certain market multiples as a validation of the values derived using the discounted cash flow methodology. The discounted cash flows for each reporting unit were based on discrete financial forecasts developed by management for planning purposes. Cash flows beyond the discrete forecasts were estimated using a terminal value calculation, which incorporated historical and forecasted financial trends for each identified reporting unit.
Upon completion of the first step during the years ended December 31, 2008 and 2009, the Company determined that the carrying value of its New Edge reporting unit exceeded its estimated fair value. Because indicators of impairment existed for this reporting unit, the Company performed the second step of the test. The implied fair value of goodwill was determined in the same manner as utilized to estimate the amount of goodwill recognized in a business combination. To determine the implied value of goodwill, fair values were allocated to the assets and liabilities of the New Edge reporting unit. The implied fair value of goodwill was measured as the excess of the fair value of the New Edge reporting unit over the amounts assigned to its assets and liabilities. The impairment losses of $64.0 million and $23.9 million during the years ended December 31, 2008 and 2009, respectively, were measured as the amount the carrying value of goodwill exceeded the implied fair value of the goodwill.
Indefinite-lived intangible assets. The impairment test for the Company's indefinite-lived intangible assets, which consist of trade names, involves a comparison of the estimated fair value of the intangible asset with its carrying value. The Company determined the fair values of its trade names using the royalty savings method, in which the fair value of the asset was calculated based on the present value of the royalty stream that we are saving by owning the asset. Given the economic environment and other factors noted above, the Company decreased its estimates for revenues associated with its New Edge trade name. As a
88
EARTHLINK, INC.
NOTES TO CONSOLIDATED FINANCIAL STATEMENTS—(Continued)
result, the Company recorded non-cash impairment charges of $3.1 million and $0.2 million during the years ended December 31, 2008 and 2009, respectively, related to its New Edge trade name. The Company also recorded a non-cash impairment charge of $4.3 million during the year ended December 31, 2007 related to the analysis of its other indefinite-lived trade names.
Definite-lived intangible assets. As a result of the goodwill and indefinite-lived asset impairments in the New Edge reporting unit, the Company also tested this segment's definite-lived intangible assets for impairment. Because of the decrease in expected future cash from such definite-lived intangible assets, the Company concluded certain customer relationships were not fully recoverable and recorded a non-cash impairment charge of $11.6 million during the year ended December 31, 2008. The Company did not record any impairment charges for its definite-lived intangible assets during the years ended December 31, 2007 and 2009.
8. Other Accrued Liabilities
Other accrued liabilities consisted of the following as of December 31, 2008 and 2009:
| |
As of December 31, | ||||||
|---|---|---|---|---|---|---|---|
| |
2008 | 2009 | |||||
| |
(in thousands) |
||||||
Accrued communications costs |
$ | 7,214 | $ | 4,621 | |||
Accrued advertising |
2,570 | 1,255 | |||||
Accrued taxes |
4,224 | 3,413 | |||||
Accrued professional fees and settlements |
932 | 6,073 | |||||
Facility exit and restructuring liabilities |
6,750 | 5,643 | |||||
Accrued outsourced customer support |
3,067 | 1,537 | |||||
Deposits and due to customers |
2,550 | 1,619 | |||||
Accrued interest |
2,022 | 2,507 | |||||
Other |
10,086 | 7,991 | |||||
|
$ | 39,415 | $ | 34,659 | |||
9. Convertible Senior Notes
General
In November 2006, the Company issued $258.8 million aggregate principal amount of Convertible Senior Notes due November 15, 2026 in a registered offering. The Company received net proceeds of $251.6 million after transaction fees of $7.2 million. The Notes bear interest at 3.25% per year on the principal amount of the Notes until November 15, 2011, and 3.50% interest per year on the principal amount of the Notes thereafter, payable semi-annually in May and November of each year. The Notes rank as senior unsecured obligations of the Company.
The Notes are payable with cash and, if applicable, are convertible into shares of the Company's common stock. The initial conversion rate was 109.6491 shares per $1,000 principal amount of Notes (which represented an initial conversion price of approximately $9.12 per share). As a result of the Company's cash dividend payments in September and December 2009, the conversion rate was adjusted and is 113.4422 shares per $1,000 principal amount of Notes (which represents a conversion price of approximately $8.82 per share), subject to further adjustment. Upon conversion, a holder will receive cash up to the principal amount of the Notes and, at the Company's option, cash, or shares of the Company's
89
EARTHLINK, INC.
NOTES TO CONSOLIDATED FINANCIAL STATEMENTS—(Continued)
common stock or a combination of cash and shares of common stock for the remainder, if any, of the conversion obligation. The conversion obligation is based on the sum of the "daily settlement amounts" for the 20 consecutive trading days that begin on, and include, the second trading day after the day the notes are surrendered for conversion. The Notes will be convertible only in the following circumstances: (1) during any calendar quarter after the calendar quarter ending December 31, 2006 (and only during such calendar quarter), if the closing sale price of the Company's common stock for each of 20 or more trading days in a period of 30 consecutive trading days ending on the last trading day of the immediately preceding calendar quarter exceeds 130% of the conversion price in effect on the last trading day of the immediately preceding calendar quarter; (2) during the five consecutive business days immediately after any five consecutive trading day period in which the average trading price per $1,000 principal amount of Notes was equal to or less than 98% of the average conversion value of the Notes during the note measurement period; (3) upon the occurrence of specified corporate transactions, including the payment of dividends in certain circumstances; (4) if the Company has called the Notes for redemption; and (5) at any time from, and including, October 15, 2011 to, and including, November 15, 2011 and at any time on or after November 15, 2024. The Company has the option to redeem the Notes, in whole or in part, for cash, on or after November 15, 2011, provided that the Company has made at least ten semi-annual interest payments. In addition, the holders may require the Company to purchase all or a portion of their Notes on each of November 15, 2011, November 15, 2016 and November 15, 2021.
In connection with the issuance of the Notes, the Company entered into separate convertible note hedge transactions and separate warrant transactions with respect to the Company's common stock to reduce the potential dilution upon conversion of the Notes (collectively referred to as the "Call Spread Transactions"). During 2008, the Company terminated the convertible note hedge and warrant agreements. See Note 10, "Shareholders' Equity," for more information on the Call Spread Transactions.
As of December 31, 2008 and 2009, the fair value of the Notes was approximately $236.6 million and $279.8 million, respectively, based on quoted market prices.
Adoption of New Accounting Guidance
On January 1, 2009, the Company adopted new accounting guidance related to accounting for convertible debt instruments that may be settled in cash upon conversion, which requires that the liability and equity components of convertible debt instruments that may be settled in cash upon conversion (including partial cash settlement) be separately accounted for in a manner that reflects an issuer's non-convertible debt borrowing rate. The resulting debt discount is accreted over the period the convertible debt is expected to be outstanding as additional non-cash interest expense. The adoption of the new guidance on January 1, 2009 affected the Company's accounting for the Notes. Upon adoption, the Company recorded an adjustment to increase additional paid-in capital as of the November 2006 issuance date by approximately $62.1 million. The Company is accreting the resulting debt discount to interest expense over the estimated five-year life of the Notes, which represents the first redemption date of November 2011. Upon adoption, the Company also recorded an adjustment to decrease additional paid-in capital and other long-term assets by approximately $1.8 million to reclassify debt issuance costs related to the equity component of the Notes. The Company recorded a pre-tax adjustment of approximately $22.3 million to accumulated deficit that represents accretion of the debt discount and decrease in amortization of debt issuance costs during the years ended December 31, 2006, 2007 and 2008, recognized additional non-cash interest expense of $12.2 million during the year ended December 31, 2009 and will recognize additional non-cash interest expense of $13.4 million and $12.4 million during the years ending December 31, 2010 and 2011, respectively, for accretion of the debt discount and decrease in amortization of debt issuance costs.
90
EARTHLINK, INC.
NOTES TO CONSOLIDATED FINANCIAL STATEMENTS—(Continued)
The principal amount, unamortized discount and net carrying amount of the debt and equity components as of December 31, 2008 and 2009 are presented below:
| |
As of December 31, | ||||||
|---|---|---|---|---|---|---|---|
| |
2008 | 2009 | |||||
| |
(in thousands) |
||||||
Principal amount |
$ | 258,750 | $ | 258,750 | |||
Unamortized discount |
(39,017 | ) | (26,502 | ) | |||
Net carrying amount |
$ | 219,733 | $ | 232,248 | |||
Carrying amount of the equity component |
$ | 62,095 | $ | 62,095 | |||
As of December 31, 2009, the remaining amortization period for the discount is 22 months. As of December 31, 2009, the conversion price was approximately $8.82 per share, resulting in 29.4 million shares issuable upon conversion.
The following table presents the associated interest cost related to the Notes during the years ended December 31, 2007, 2008 and 2009, which consists of both the contractual interest coupon and amortization of the discount on the liability component:
| |
Year Ended December 31, | |||||||||
|---|---|---|---|---|---|---|---|---|---|---|
| |
2007 | 2008 | 2009 | |||||||
| |
(in thousands) |
|||||||||
Contractual interest recognized |
$ | 8,895 | $ | 8,895 | $ | 8,895 | ||||
Discount amortization |
10,358 | 11,386 | 12,516 | |||||||
Effective interest rate |
9.5 | % | 9.5 | % | 9.5 | % | ||||
Classification
In 2009, the Company began paying quarterly cash dividends on its common stock. The Company currently intends to pay regular quarterly dividends on its common stock. Under the terms of the indenture governing the Notes, the Company's payment of cash dividends requires an adjustment to the conversion rate for the Notes. In addition, as a result of the adjustment, the Notes may be surrendered for conversion for a period of time between the declaration date and the record date, as defined in the indenture, for the consideration provided for in the indenture. As a result, the Company classified the Notes as a current liability in the Consolidated Balance Sheet as of December 31, 2009. The Notes were classified as a long-term liability in the Consolidated Balance Sheet as of December 31, 2008.
91
EARTHLINK, INC.
NOTES TO CONSOLIDATED FINANCIAL STATEMENTS—(Continued)
10. Shareholders' Equity
Shareholder Rights Plan
During 2002, the Board of Directors adopted a shareholder rights plan (the "Rights Plan"). In connection with the Rights Plan, the Board of Directors also declared a dividend of one right for each outstanding share of EarthLink's common stock for stockholders of record at the close of business on August 5, 2002.
Each right entitles the holder to purchase one one-thousandth (1/1000) of a share (a "Unit") of EarthLink's Series D Junior Preferred Stock at a price of $60.00 per Unit upon certain events. Generally, in the event a person or entity acquires, or initiates a tender offer to acquire, at least 15% of EarthLink's then outstanding common stock, the rights will become exercisable for common stock having a value equal to two times the exercise price of the right, or effectively at one-half of EarthLink's then-current stock price. The rights are redeemable under certain circumstances at $0.01 per right and will expire, unless earlier redeemed, on August 6, 2012.
Share Repurchases
Since the inception of the Company's share repurchase program, the Board of Directors has authorized a total of $750.0 million for the repurchase of EarthLink's common stock. As of December 31, 2009, the Company had $146.8 million available under the current authorizations. The Company may repurchase its common stock from time to time in compliance with the Securities and Exchange Commission's regulations and other legal requirements, including through the use of derivative transactions, and subject to market conditions and other factors. The share repurchase program does not require the Company to acquire any specific number of shares and may be terminated by the Board of Directors at any time.
The following table summarizes share repurchases during the years ended December 31, 2007, 2008 and 2009 pursuant to the share repurchase program, which have been recorded as treasury stock:
| |
Year Ended December 31, | |||||||||
|---|---|---|---|---|---|---|---|---|---|---|
| |
2007 | 2008 | 2009 | |||||||
| |
(in thousands) |
|||||||||
Number of shares repurchased |
14,032 | 3,805 | 3,592 | |||||||
Aggregate purchase price |
$ | 94,332 | $ | 31,856 | $ | 22,340 | ||||
Dividends
In July 2009, the Company's Board of Directors declared a quarterly cash dividend on its common stock of $0.14 per share to stockholders of record on September 14, 2009. The dividend was paid on September 28, 2009 and totaled $15.0 million. In October 2009, the Company's Board of Directors declared a quarterly cash dividend on its common stock of $0.14 per share to stockholders of record on December 9, 2009. The dividend was paid on December 23, 2009 and totaled $15.0 million. The Company currently intends to pay regular quarterly dividends on its common stock. The Board of Directors also approved the payment of cash dividend amounts on each outstanding restricted stock unit to be paid at the time the restricted stock unit vests. Cash dividend amounts are forfeited if the restricted stock units do not vest. Any decision to declare future dividends will be made at the discretion of the Board of Directors and will depend on, among other things, the Company's results of operations, financial condition, cash requirements, investment opportunities and other factors the Board of Directors may deem relevant.
92
EARTHLINK, INC.
NOTES TO CONSOLIDATED FINANCIAL STATEMENTS—(Continued)
Call Spread Transactions
In connection with the issuance of the Notes (see Note 9, "Convertible Senior Notes"), the Company entered into separate convertible note hedge transactions and separate warrant transactions with respect to the Company's common stock to minimize the impact of the potential dilution upon conversion of the Notes. The Company purchased call options in private transactions to cover approximately 28.4 million shares of the Company's common stock at a strike price of $9.12 per share, subject to adjustment in certain circumstances, for $47.2 million. The Company also sold warrants permitting the purchasers to acquire up to approximately 28.4 million shares of the Company's common stock at an exercise price of $11.20 per share, subject to adjustments in certain circumstances, in private transactions for total proceeds of approximately $32.1 million. In September 2008, the Company terminated its convertible note hedge and warrant agreements. The Company received an aggregate payment from the counterparties to the agreements, which was recorded as additional paid-in capital. Upon termination of the agreements, the Company purchased approximately 2.5 million shares of common stock the counterparties held in hedge positions for approximately $22.7 million, based on the closing price of the EarthLink common stock on the purchase date.
11. Stock-Based Compensation
Stock-based compensation expense was $19.6 million, $20.1 million and $13.2 million during the years ended December 31, 2007, 2008 and 2009, respectively. The Company has classified stock-based compensation expense within the same operating expense line items as cash compensation paid to employees.
Included in stock-based compensation expense for the year ended December 31, 2007 was $4.9 million of stock-based compensation expense related to Charles G. Betty, EarthLink's former President and Chief Executive Officer. Mr. Betty passed away on January 2, 2007. Pursuant to Mr. Betty's employment agreement, all unvested stock options and restricted stock units immediately vested and became fully exercisable upon death. In addition, the Leadership and Compensation Committee of the Board of Directors extended the exercise period of Mr. Betty's stock options until December 31, 2008. This date represents the exercise period if Mr. Betty had terminated employment after serving the full term of his employment agreement, which was set to expire in July 2008. During the year ended December 31, 2007, EarthLink recorded stock-based compensation of $3.5 million related to the accelerated vesting of 1.1 million stock options and 120,000 restricted stock units and recorded stock-based compensation expense of $1.4 million related to the extension of the exercise period for Mr. Betty's stock options.
Stock Incentive Plans
The Company has granted options to employees and non-employee directors to purchase the Company's common stock under various stock incentive plans. The Company has also granted restricted stock units to employees and non-employee directors under various stock incentive plans. Under the plans, employees and non-employee directors are eligible to receive awards of various forms of equity-based incentive compensation, including stock options, restricted stock, restricted stock units, phantom share units and performance awards, among others. The plans are administered by the Board of Directors or the Leadership and Compensation Committee of the Board of Directors, which determine the terms of the awards granted. Stock options are generally granted with an exercise price equal to the market value of EarthLink, Inc. common stock on the date of grant, have a term of ten years or less, and vest over terms of four years from the date of grant. Restricted stock units are granted with various vesting terms that range from one to six years from the date of grant. The Company's various stock incentive plans provide for the issuance of a maximum of 31.0 million shares, of which approximately 13.8 million shares were still
93
EARTHLINK, INC.
NOTES TO CONSOLIDATED FINANCIAL STATEMENTS—(Continued)
available for grant as of December 31, 2009. Upon exercise of stock options or vesting of restricted stock units, the Company will issue authorized but unissued common stock.
Deferred Compensation Plan
The Company had a Deferred Compensation Plan for Directors and Certain Key Employees that permitted members of the Board of Directors and eligible employees to elect to defer receipt of shares of common stock pursuant to vested restricted stock units and various cash consideration, such as directors' fees and bonuses. The cash consideration was converted into phantom share units at the closing price on the date the consideration would otherwise be paid, and vested restricted stock units were converted into phantom share units on a one-for-one basis. Phantom share units are fully vested at the date of grant and are converted to common stock upon the occurrence of various events. As of December 31, 2008, approximately 24,000 phantom share units were outstanding. During the year ended December 31, 2008, the plan was discontinued for further deferral elections. All phantom share units were converted to common stock during the year ended December 31, 2009.
Options Outstanding
The following table summarizes information concerning stock option activity as of and for year ended December 31, 2009:
| |
Stock Options |
Weighted Average Exercise Price |
Weighted Average Remaining Contractual Term (Years) |
Aggregate Intrinsic Value |
||||||||||
|---|---|---|---|---|---|---|---|---|---|---|---|---|---|---|
| |
(shares and dollars in thousands) |
|||||||||||||
Outstanding as of December 31, 2008 |
7,159 | $ | 9.58 | |||||||||||
Granted |
— | |||||||||||||
Exercised |
(1,952 | ) | 6.92 | |||||||||||
Forfeited and expired |
(1,291 | ) | 13.50 | |||||||||||
Outstanding as of December 31, 2009 |
3,916 | 9.61 | 4.6 | $ | 1,662 | |||||||||
Vested and expected to vest as of December 31, 2009 |
3,803 | $ | 9.68 | 4.5 | $ | 1,542 | ||||||||
Exercisable as of December 31, 2009 |
3,136 | $ | 10.07 | 4.0 | $ | 995 | ||||||||
The aggregate intrinsic value amounts in the table above represent the closing price of the Company's common stock on December 31, 2009 in excess of the exercise price, multiplied by the number of stock options outstanding or exercisable, when the closing price is greater than the exercise price. This represents the amount that would have been received by the stock option holders if they had all exercised their stock options on December 31, 2009. The total intrinsic value of options exercised during the years ended December 31, 2007, 2008 and 2009 was $1.0 million, $2.2 million and $2.5 million, respectively. The intrinsic value of stock options exercised represents the difference between the market value of Company's common stock at the time of exercise and the exercise price, multiplied by the number of stock options exercised. To the extent the forfeiture rate is different than what the Company has anticipated, stock-based compensation related to these awards will be different from the Company's expectations. As of December 31, 2009, there was $1.8 million of total unrecognized compensation cost related to stock options. That cost is expected to be recognized over a weighted-average period of 1.4 years.
94
EARTHLINK, INC.
NOTES TO CONSOLIDATED FINANCIAL STATEMENTS—(Continued)
The following table summarizes the status of the Company's stock options as of December 31, 2009:
| Stock Options Outstanding | Stock Options Exercisable | |||||||||||||||
|---|---|---|---|---|---|---|---|---|---|---|---|---|---|---|---|---|
| Range of Exercise Prices |
Number Outstanding |
Weighted Average Remaining Contractual Life |
Weighted Average Exercise Price |
Number Exercisable |
Weighted Average Exercise Price |
|||||||||||
| |
(in thousands) |
|
|
(in thousands) |
|
|||||||||||
| $ 5.10 to $ 6.86 | 324 | 5.0 | $ | 6.21 | 258 | $ | 6.05 | |||||||||
| 6.90 to 7.25 | 353 | 7.1 | 7.00 | 178 | 7.00 | |||||||||||
| 7.31 to 7.31 | 400 | 7.5 | 7.31 | 100 | 7.31 | |||||||||||
| 7.32 to 8.96 | 302 | 5.2 | 8.11 | 241 | 8.21 | |||||||||||
| 9.01 to 9.01 | 373 | 4.6 | 9.01 | 373 | 9.01 | |||||||||||
| 9.23 to 9.51 | 425 | 6.0 | 9.44 | 256 | 9.41 | |||||||||||
| 9.64 to 10.06 | 693 | 1.3 | 9.88 | 693 | 9.88 | |||||||||||
| 10.36 to 28.25 | 1,046 | 3.9 | 12.96 | 1,037 | 12.97 | |||||||||||
| $ 5.10 to $28.25 | 3,916 | 4.6 | $ | 9.61 | 3,136 | $ | 10.07 | |||||||||
Valuation Assumptions for Stock Options
The Company did not grant any stock options during the year ended December 31, 2009. The fair value of stock options granted during the years ended December 31, 2007 and 2008 was estimated using the Black-Scholes option-pricing model with the following assumptions:
| |
Year Ended December 31, | ||||||
|---|---|---|---|---|---|---|---|
| |
2007 | 2008 | |||||
Dividend yield |
0 | % | 0 | % | |||
Expected volatility |
39 | % | 39 | % | |||
Risk-free interest rate |
4.78 | % | 3.00 | % | |||
Expected life |
4.3 years | 4.2 years | |||||
The weighted average grant date fair value of options granted during the years ended December 31, 2007 and 2008 was $2.79 and $2.71, respectively.
The dividend yield assumption was based on the Company's history of dividend payouts at the time of grant. The expected volatility was based on a combination of the Company's historical stock price and implied volatility. The selection of implied volatility data to estimate expected volatility was based upon the availability of prices for actively traded options on the Company's stock. The risk-free interest rate assumption was based upon the U.S. Treasury yield curve in effect at the time of grant for periods corresponding with the expected life of the option. The expected life of employee stock options represents the weighted-average period the stock options are expected to remain outstanding.
95
EARTHLINK, INC.
NOTES TO CONSOLIDATED FINANCIAL STATEMENTS—(Continued)
Restricted Stock Units
The following table summarizes the Company's restricted stock units as of and for the year ended December 31, 2009:
| |
Restricted Stock Units |
Weighted Average Grant Date Fair Value |
||||||
|---|---|---|---|---|---|---|---|---|
| |
(in thousands) |
|
||||||
Nonvested as of December 31, 2008 |
4,123 | $ | 7.20 | |||||
Granted |
352 | 7.39 | ||||||
Vested |
(2,002 | ) | 7.17 | |||||
Forfeited |
(307 | ) | 7.18 | |||||
Nonvested as of December 31, 2009 |
2,166 | 7.25 | ||||||
The fair value of restricted stock units is determined based on the closing trading price of EarthLink's common stock on the grant date. The weighted-average grant date fair value of restricted stock units granted during the years ended December 31, 2007, 2008 and 2009 was $6.94, $7.20 and $7.39, respectively. As of December 31, 2009, there was $5.0 million of total unrecognized compensation cost related to nonvested restricted stock units. That cost is expected to be recognized over a weighted-average period of 1.4 years. The total fair value of shares vested during the years ended December 31, 2007, 2008 and 2009 was $2.7 million, $7.0 million and $15.4 million, respectively, which represents the closing price of the Company's common stock on the vesting date multiplied by the number of restricted stock units that vested.
12. Profit Sharing Plans
The Company sponsors the EarthLink, Inc. 401(k) Plan ("Plan"), which qualifies as a deferred salary arrangement under Section 401(k) of the Internal Revenue Code. Under the Plan, participating employees may defer a portion of their pretax earnings up to the Internal Revenue Service annual contribution limit. The Company makes a matching contribution of 50% of the first 6% of base compensation that a participant contributes to the Plan. The Company's matching contributions vest over four years from the participant's date of hire. The Company contributed $3.0 million, $1.3 million and $1.2 million during the years ended December 31, 2007, 2008 and 2009, respectively.
96
EARTHLINK, INC.
NOTES TO CONSOLIDATED FINANCIAL STATEMENTS—(Continued)
13. Income Taxes
The current and deferred income tax (provision) benefit from continuing operations for the years ended December 31, 2007, 2008 and 2009 were as follows:
| |
Year Ended December 31, | |||||||||||
|---|---|---|---|---|---|---|---|---|---|---|---|---|
| |
2007 | 2008 | 2009 | |||||||||
| |
(in thousands) |
|||||||||||
Current |
||||||||||||
Federal |
$ | — | $ | (20,618 | ) | $ | (4,103 | ) | ||||
State |
(220 | ) | (4,860 | ) | (5,184 | ) | ||||||
Total current |
(220 | ) | (25,478 | ) | (9,287 | ) | ||||||
Deferred |
||||||||||||
Federal |
1,244 | 52,475 | 124,357 | |||||||||
State |
203 | 5,187 | 11,015 | |||||||||
Total deferred |
1,447 | 57,662 | 135,372 | |||||||||
Income tax benefit |
$ | 1,227 | $ | 32,184 | $ | 126,085 | ||||||
During the year ended December 31, 2009, the Company released $199.0 million of its valuation allowance related to its deferred tax assets. Of the valuation allowance release, $198.8 million was recorded as an income tax benefit in the Consolidated Statement of Operations and $0.2 million related to temporary differences and was recorded to accumulated other comprehensive income (loss) on the Consolidated Balance Sheet. These deferred tax assets relate primarily to net operating loss carryforwards ("NOLs") which the Company determined it will more likely than not be able to utilize due to the generation of sufficient taxable income in the future.
During the year ended December 31, 2008, the Company released $65.6 million of its valuation allowance related to its deferred tax assets. These deferred tax assets relate primarily to NOLs which the Company determined it will more likely than not be able to utilize due to the generation of sufficient taxable income in the future. Of the total valuation allowance release, $56.1 million was recorded as an income tax benefit in the Consolidated Statement of Operations. The remaining $9.5 million related to acquired net operating losses and reduced goodwill on the Consolidated Balance Sheet.
97
EARTHLINK, INC.
NOTES TO CONSOLIDATED FINANCIAL STATEMENTS—(Continued)
The following table summarizes the significant differences between the U.S. federal statutory tax rate and the Company's effective tax rate for continuing operations for financial statement purposes for the years ended December 31, 2007, 2008 and 2009:
| |
Year Ended December 31, | |||||||||
|---|---|---|---|---|---|---|---|---|---|---|
| |
2007 | 2008 | 2009 | |||||||
| |
(in thousands) |
|||||||||
Federal income tax provision at statutory rate |
$ | 19,607 | $ | (58,077 | ) | $ | (56,362 | ) | ||
State income taxes, net of federal benefit |
1,382 | (2,995 | ) | (5,757 | ) | |||||
Nondeductible expenses |
(4,152 | ) | 1,841 | (269 | ) | |||||
Goodwill and intangible asset impairment |
— | (23,081 | ) | (8,362 | ) | |||||
Net change to valuation allowance |
(9,233 | ) | 114,808 | 198,767 | ||||||
Change in state effective tax rate |
(5,321 | ) | — | — | ||||||
Other |
(1,056 | ) | (312 | ) | (1,932 | ) | ||||
Income tax benefit |
$ | 1,227 | $ | 32,184 | $ | 126,085 | ||||
Deferred tax assets and liabilities from continuing operations include the following as of December 31, 2008 and 2009:
| |
As of December 31, | |||||||
|---|---|---|---|---|---|---|---|---|
| |
2008 | 2009 | ||||||
| |
(in thousands) |
|||||||
Current deferred tax assets: |
||||||||
Accrued liabilities and reserves |
$ | 16,237 | $ | 7,709 | ||||
Net operating loss carryforwards |
57,390 | 45,047 | ||||||
Other |
1,440 | 911 | ||||||
Valuation allowance |
(54,338 | ) | (6,995 | ) | ||||
Current deferred tax liabilities: |
||||||||
Other |
(475 | ) | (609 | ) | ||||
Total net current deferred tax assets |
20,254 | 46,063 | ||||||
Non-current deferred tax assets: |
||||||||
Net operating loss carryforwards |
$ | 123,296 | $ | 86,885 | ||||
Accrued liabilities and reserves |
332 | 2,078 | ||||||
Subscriber base and other intangible assets |
77,071 | 66,144 | ||||||
Valuation allowance |
(178,729 | ) | (27,116 | ) | ||||
Other |
57,523 | 52,863 | ||||||
Non-current deferred tax liabilities: |
||||||||
Subscriber base and other intangible assets |
(3,163 | ) | (3,010 | ) | ||||
Other |
(30,937 | ) | (22,912 | ) | ||||
Indefinite lived intangible assets |
(1,636 | ) | (1,800 | ) | ||||
Total net non-current deferred tax asset |
43,757 | 153,132 | ||||||
Net deferred tax asset |
$ | 64,011 | $ | 199,195 | ||||
As of December 31, 2008 and 2009, the Company had NOLs for federal income tax purposes totaling approximately $532.7 million and $350.0 million, respectively, which begin to expire in 2020. Of these federal NOLs approximately $100.0 million are limited under Internal Revenue Code Section 382. As of
98
EARTHLINK, INC.
NOTES TO CONSOLIDATED FINANCIAL STATEMENTS—(Continued)
December 31, 2008 and 2009, the Company had NOLs for state income tax purposes totaling approximately $165.9 million and $178.0 million, respectively, which started to expire in 2010. Under the Tax Reform Act of 1986, the Company's ability to use its federal and state NOLs and federal and state tax credit carryforwards to reduce future taxable income and future taxes, respectively, is subject to restrictions attributable to equity transactions that have resulted in a change of ownership as defined in Internal Revenue Code Section 382. As a result, the NOL amounts as of December 31, 2009 reflect the restriction on the Company's ability to use its acquired federal and state NOLs; however, the Company continues to evaluate potential changes to the Section 382 limitations associated with acquired federal and state NOLs. The utilization of these NOLs could be further restricted in future periods which could result in significant amounts of these NOLs expiring prior to benefiting the Company.
Future transactions and the timing of such transactions could cause an ownership change under Section 382 of the Internal Revenue Code. Such transactions may include our share repurchase program, additional issuances of common stock by us (including but not limited to issuances upon future conversion of our convertible senior notes), and acquisitions or sales of shares by certain holders of our shares, including persons who have held, currently hold, or may accumulate in the future five percent or more of our outstanding stock. Many of these transactions are beyond our control.
The Company continues to maintain a valuation allowance of $34.1 million against certain deferred tax assets. Of this amount, $31.7 million relates to net operating losses generated by the tax benefits of stock-based compensation. The valuation allowance will be removed upon utilization of these net operating losses by the Company as an adjustment to additional paid-in-capital. The remaining $2.4 million relates to net operating losses in certain jurisdictions where the Company believes it is not more likely than not to be realized in future periods.
As of December 31, 2009, the Company has alternative minimum tax credits of approximately $10.5 million. These credits do not have an expiration date.
The Company has identified its federal tax return and its state tax returns in California, Florida, Georgia and Illinois as "major" tax jurisdictions. Periods extending back to 1994 are still subject to examination for all "major" jurisdictions. The Company believes that its income tax filing positions and deductions through year ended December 31, 2009 will be sustained on audit and does not anticipate any adjustments that will result in material adverse effect on the Company's financial condition, results of operations or cash flow. The Company's policy for recording interest and penalties associated with audits is to record such items as a component of income tax expense.
A reconciliation of the beginning and ending amount of unrecognized tax benefits for the years ended December 31, 2008 and 2009 is as follows:
| |
Year Ended December 31, | ||||||
|---|---|---|---|---|---|---|---|
| |
2008 | 2009 | |||||
| |
(in thousands) |
||||||
Balance as of January 1 |
$ | 732 | $ | 732 | |||
Additions for tax positions of prior years |
— | 583 | |||||
Balance as of December 31 |
$ | 732 | $ | 1,315 | |||
99
EARTHLINK, INC.
NOTES TO CONSOLIDATED FINANCIAL STATEMENTS—(Continued)
14. Commitments and Contingencies
Leases
The Company leases certain of its facilities under various non-cancelable operating leases. The facility leases generally require the Company to pay operating costs, including property taxes, insurance and maintenance, and generally contain annual escalation provisions as well as renewal options. Total rent expense (including operating expenses) during the years ended December 31, 2007, 2008 and 2009 for all operating leases, excluding rent and operating expenses associated with facilities exited as part of the Company's restructuring plans, was $13.6 million, $7.1 million and $4.5 million, respectively.
Minimum lease commitments (including estimated operating expenses) under non-cancelable leases, including commitments associated with facilities exited as part of the Company's restructuring plans, as of December 31, 2009 are as follows:
Year Ending December 31,
|
Operating Leases |
|||
|---|---|---|---|---|
| |
(in thousands) |
|||
2010 |
$ | 12,531 | ||
2011 |
10,714 | |||
2012 |
10,083 | |||
2013 |
10,447 | |||
2014 |
7,089 | |||
Total minimum lease payments, including estimated operating expenses |
50,864 | |||
Less aggregate contracted sublease income |
(7,169 | ) | ||
|
$ | 43,695 | ||
Purchase Obligations
The Company leases network capacity from a number of third-party providers, such as Level 3 Communications, Inc. EarthLink is, in effect, buying this capacity in bulk at a discount, and providing access to EarthLink's customer base. The Company has commitments to purchase these telecommunications services and equipment under non-cancelable agreements. The Company also has commitments for certain advertising spending under non-cancelable agreements. The Company had minimum commitments under non-cancelable agreements and other purchase commitments of $0.5 million for the year ending December 31, 2010.
15. Fair Value Measurements
Fair value is defined as the price that would be received to sell an asset or paid to transfer a liability in an orderly transaction between market participants at the measurement date (an exit price). A three-tier fair value hierarchy is used to prioritize the inputs used in measuring fair value. These tiers include: Level 1, defined as observable inputs such as quoted prices in active markets; Level 2, defined as inputs other than quoted prices in active markets that are either directly or indirectly observable; and Level 3, defined as unobservable inputs in which little or no market data exists, therefore requiring an entity to develop its own assumptions.
As of December 31, 2008 and 2009, the Company held certain assets that are required to be measured at fair value on a recurring basis. These included the Company's cash equivalents, marketable securities, auction rate securities, investments equity securities and the Company's put right.
100
EARTHLINK, INC.
NOTES TO CONSOLIDATED FINANCIAL STATEMENTS—(Continued)
The following tables present the Company's assets that are measured at fair value on a recurring basis as of December 31, 2008 and 2009:
| |
|
|
Fair Value Measurements as of December 31, 2008 Using |
|||||||||||||||
|---|---|---|---|---|---|---|---|---|---|---|---|---|---|---|---|---|---|---|
Description
|
Carrying Value |
Fair Value |
Quoted Prices in Active Markets for Identical Assets (Level 1) |
Significant Other Observable Inputs (Level 2) |
Significant Unobservable Inputs (Level 3) |
|||||||||||||
| |
(in thousands) |
|||||||||||||||||
Cash equivalents |
$ | 483,916 | $ | 483,916 | $ | 483,916 | $ | — | $ | — | ||||||||
Auction rate securities |
47,809 | 47,809 | — | — | 47,809 | |||||||||||||
Equity investments in |
||||||||||||||||||
other companies |
1,580 | 1,580 | 84 | 1,496 | — | |||||||||||||
Put right |
9,828 | 9,828 | — | — | 9,828 | |||||||||||||
Total |
$ | 543,133 | $ | 543,133 | $ | 484,000 | $ | 1,496 | $ | 57,637 | ||||||||
| |
|
|
Fair Value Measurements as of December 31, 2009 Using |
|||||||||||||||
|---|---|---|---|---|---|---|---|---|---|---|---|---|---|---|---|---|---|---|
Description
|
Carrying Value |
Fair Value |
Quoted Prices in Active Markets for Identical Assets (Level 1) |
Significant Other Observable Inputs (Level 2) |
Significant Unobservable Inputs (Level 3) |
|||||||||||||
| |
(in thousands) |
|||||||||||||||||
Cash equivalents |
$ | 588,666 | $ | 588,666 | $ | 588,666 | $ | — | $ | — | ||||||||
Marketable securities |
42,060 | 42,060 | 42,060 | — | — | |||||||||||||
Auction rate securities |
42,906 | 42,906 | — | — | 42,906 | |||||||||||||
Equity investments in |
||||||||||||||||||
other companies |
1,529 | 1,529 | 1,529 | — | — | |||||||||||||
Put right |
5,239 | 5,239 | — | — | 5,239 | |||||||||||||
Total |
$ | 680,400 | $ | 680,400 | $ | 632,255 | $ | — | $ | 48,145 | ||||||||
Cash equivalents, marketable securities, auction rate securities, equity investments in other companies and the Company's put right are measured at fair value. Cash equivalents, marketable securities and equity investments in other companies that are valued using quoted market prices are classified within Level 1. The Company's investment in Virgin Mobile partnership units was valued using quoted prices for similar assets and was classified within Level 2 as of December 31, 2008. Investments in auction rate securities are classified within Level 3 because they are valued using a discounted cash flow model. Some of the inputs to this model are unobservable in the market and are significant. The Company's put right is estimated using a discounted cash flow analysis and is classified within Level 3. The Company has consistently applied these valuation techniques in all periods presented.
The Company has invested in auction rate securities, which are more fully described in Note 5, "Investments." Beginning in February 2008, these instruments held by the Company failed to attract sufficient buyers. As a result, these securities do not have a readily determinable market value and are not liquid. The fair values of the Company's auction rate securities as of December 31, 2008 and 2009 were estimated utilizing a discounted cash flow analysis. These analyses consider, among other items, the collateralization underlying the security investments, the creditworthiness of the counterparty, and the
101
EARTHLINK, INC.
NOTES TO CONSOLIDATED FINANCIAL STATEMENTS—(Continued)
timing and value of expected future cash flows. These securities were also compared, when possible, to other observable market data with similar characteristics to the securities held by the Company.
In October 2008, EarthLink entered into an agreement with the broker that sold the Company its auction rate securities that gives the Company the right to sell its existing auction rate securities back to the broker at par plus accrued interest, beginning on June 30, 2010 until July 2, 2012. The Company elected the fair value option for the put right to offset the fair value changes of the auction rate securities. The fair value of the put right was estimated using a discounted cash flow analysis and is classified as within Level 3.
The following table presents a reconciliation of the beginning and ending balances of the Company's assets measured at fair value on a recurring basis using significant unobservable inputs (Level 3) as of December 31, 2009:
| |
Auction Rate Securities |
Put Right |
Total | |||||||
|---|---|---|---|---|---|---|---|---|---|---|
| |
(in thousands) |
|||||||||
Balance as of December 31, 2008 |
$ | 47,809 | $ | 9,828 | $ | 57,637 | ||||
Total realized gains |
4,697 | — | 4,697 | |||||||
Total realized losses |
— | (4,589 | ) | (4,589 | ) | |||||
Settlements |
(9,600 | ) | — | (9,600 | ) | |||||
Balance as of December 31, 2009 |
$ | 42,906 | $ | 5,239 | $ | 48,145 | ||||
During the year ended December 31, 2009, the Company recorded realized gains of $4.7 million related to its auction rate securities and recorded realized losses of $4.6 million related to its put right, which are included in gain (loss) on investments, net, in the Consolidated Statement of Operations. Also during the year ended December 31, 2009, the Company redeemed $9.6 million of auction rate securities at par, plus accrued interest.
16. Supplemental Disclosure of Cash Flow Information
| |
Year Ended December 31, | |||||||||||
|---|---|---|---|---|---|---|---|---|---|---|---|---|
| |
2007 | 2008 | 2009 | |||||||||
| |
(in thousands) |
|||||||||||
Significant non-cash transactions |
||||||||||||
Assets acquired pursuant to capital lease agreement |
$ | 2,927 | $ | — | $ | — | ||||||
Additional cash flow information |
||||||||||||
Cash paid during the year for interest |
$ | 10,225 | $ | 10,355 | $ | 10,422 | ||||||
Cash paid during the year for income taxes |
68 | 4,109 | 4,261 | |||||||||
Purchase of businesses |
||||||||||||
Issuance of common stock |
$ | 379 | $ | — | $ | — | ||||||
Net liabilities incurred and assumed |
(379 | ) | — | — | ||||||||
Intangible assets acquired |
$ | — | $ | — | $ | — | ||||||
102
EARTHLINK, INC.
NOTES TO CONSOLIDATED FINANCIAL STATEMENTS—(Continued)
17. Related Party Transactions
As a result of EarthLink's prior ownership interest in HELIO, HELIO was considered a related party. In August 2008, Virgin Mobile acquired HELIO and EarthLink's equity and debt investments in HELIO were exchanged for limited partnership units of Virgin Mobile. EarthLink and HELIO had a services agreement pursuant to which EarthLink provides HELIO billing and other support services in exchange for management fees. The management fees were determined based on EarthLink's costs to provide the services, and management believed such fees were reasonable. Fees for services provided to HELIO were reflected as reductions to the associated expenses incurred by EarthLink to provide such services. During the years ended December 31, 2007 and 2008, fees received for services provided to HELIO were $1.6 million and $1.0 million, respectively.
18. Segment Information
The Company reports segment information along the same lines that its chief executive officer reviews its operating results in assessing performance and allocating resources. The Company operates two reportable segments, Consumer Services and Business Services. The Company's Consumer Services segment provides Internet access services and related value-added services to individual customers. These services include dial-up and high-speed Internet access and VoIP services, among others. The Company's Business Services segment provides integrated communications services and related value-added services to businesses and communications carriers. These services include managed IP-based wide area networks, dedicated Internet access and web hosting, among others.
The Company evaluates performance of its segments based on segment income from operations. Segment income from operations includes revenues from external customers, related cost of revenues and operating expenses directly attributable to the segment, which include costs over which segment managers have direct discretionary control, such as advertising and marketing programs, customer support expenses, operations expenses, product development expenses, certain technology and facilities expenses, billing operations and provisions for doubtful accounts. Segment income from operations excludes other income and expense items and certain expenses over which segment managers do not have discretionary control. Costs excluded from segment income from operations include various corporate expenses (consisting of certain costs such as corporate management, human resources, finance and legal), amortization of intangible assets, impairment of goodwill and intangible assets, facility exit and restructuring costs, and stock-based compensation expense, as they are not considered in the measurement of segment performance.
103
EARTHLINK, INC.
NOTES TO CONSOLIDATED FINANCIAL STATEMENTS—(Continued)
Information on the Company's reportable segments and a reconciliation to consolidated income from operations for the years ended December 31, 2007, 2008 and 2009 is as follows:
| |
Year Ended December 31, | ||||||||||
|---|---|---|---|---|---|---|---|---|---|---|---|
| |
2007 | 2008 | 2009 | ||||||||
| |
(in thousands) |
||||||||||
Consumer Services |
|||||||||||
Revenues |
$ | 1,025,408 | $ | 779,876 | $ | 575,412 | |||||
Cost of revenues |
324,465 | 259,851 | 186,570 | ||||||||
Gross margin |
700,943 | 520,025 | 388,842 | ||||||||
Direct segment operating expenses |
506,975 | 207,236 | 131,154 | ||||||||
Segment operating income |
$ | 193,968 | $ | 312,789 | $ | 257,688 | |||||
Business Services |
|||||||||||
Revenues |
$ | 190,586 | $ | 175,701 | $ | 148,317 | |||||
Cost of revenues |
118,232 | 101,069 | 87,185 | ||||||||
Gross margin |
72,354 | 74,632 | 61,132 | ||||||||
Direct segment operating expenses |
58,548 | 51,276 | 41,975 | ||||||||
Segment operating income |
$ | 13,806 | $ | 23,356 | $ | 19,157 | |||||
Consolidated |
|||||||||||
Revenues |
$ | 1,215,994 | $ | 955,577 | $ | 723,729 | |||||
Cost of revenues |
442,697 | 360,920 | 273,755 | ||||||||
Gross margin |
773,297 | 594,657 | 449,974 | ||||||||
Direct segment operating expenses |
565,523 | 258,512 | 173,129 | ||||||||
Segment operating income |
207,774 | 336,145 | 276,845 | ||||||||
Stock-based compensation expense |
19,553 | 20,133 | 13,231 | ||||||||
Impairment of goodwill and intangible assets |
4,250 | 78,672 | 24,145 | ||||||||
Amortization of intangible assets |
14,672 | 13,349 | 7,749 | ||||||||
Facility exit and restructuring costs |
65,381 | 9,142 | 5,615 | ||||||||
Other operating expenses |
55,884 | 50,242 | 43,947 | ||||||||
Income from operations |
$ | 48,034 | $ | 164,607 | $ | 182,158 | |||||
The primary component of the Company's revenues is access and service revenues, which consist of narrowband access services (including traditional, fully-featured narrowband access and value-priced narrowband access); broadband access services (including high-speed access via DSL and cable, VoIP and managed IP-based networks); and web hosting services. The Company also earns revenues from value-added services, which include ancillary services sold as add-on features to the Company's access services, search and advertising revenues.
Consumer access and service revenues consist of narrowband access and broadband access services. These revenues are derived from fees charged to customers for dial-up Internet access; fees charged for high-speed access services; fees charged for VoIP services; usage fees; shipping and handling fees; and termination fees. Consumer value-added services revenues consist of revenues from ancillary services sold as add-on features to the Company's Internet services, such as security products, premium email only, home networking, email storage and Internet call waiting; search revenues; and advertising revenues.
104
EARTHLINK, INC.
NOTES TO CONSOLIDATED FINANCIAL STATEMENTS—(Continued)
Business access and service revenues consist of fees charged for managed IP-based networks; fees charged for Internet access services; installation fees; termination fees; fees for equipment; usage fees; cost recovery fees billed to customers; and fees charged for leasing server space and providing web services that enable customers to build and maintain an effective online presence.
Information on revenues by groups of similar services and by segment for the years ended December 31, 2007, 2008 and 2009 is as follows:
| |
Year Ended December 31, | |||||||||||
|---|---|---|---|---|---|---|---|---|---|---|---|---|
| |
2007 | 2008 | 2009 | |||||||||
| |
(in thousands) |
|||||||||||
Consumer Services |
||||||||||||
Access and service |
$ | 897,423 | $ | 682,135 | $ | 503,769 | ||||||
Value-added services |
127,985 | 97,741 | 71,643 | |||||||||
Total revenues |
1,025,408 | 779,876 | 575,412 | |||||||||
Business Services |
||||||||||||
Access and service |
187,709 | 172,944 | 146,087 | |||||||||
Value-added services |
2,877 | 2,757 | 2,230 | |||||||||
Total revenues |
190,586 | 175,701 | 148,317 | |||||||||
Consolidated |
||||||||||||
Access and service |
1,085,132 | 855,079 | 649,856 | |||||||||
Value-added services |
130,862 | 100,498 | 73,873 | |||||||||
Total revenues |
$ | 1,215,994 | $ | 955,577 | $ | 723,729 | ||||||
The Company manages its working capital on a consolidated basis and does not allocate long-lived assets to segments. In addition, segment assets are not reported to, or used by, the chief operating decision maker and therefore, total segment assets have not been disclosed.
The Company has not provided information about geographic segments because substantially all of the Company's revenues, results of operations and identifiable assets are in the United States.
19. Quarterly Financial Data (Unaudited)
The following table sets forth certain unaudited quarterly consolidated financial data for the eight quarters in the period ended December 31, 2009. In the opinion of the Company's management, this unaudited information has been prepared on the same basis as the audited consolidated financial statements and includes all material adjustments (consisting of normal recurring accruals and adjustments)
105
EARTHLINK, INC.
NOTES TO CONSOLIDATED FINANCIAL STATEMENTS—(Continued)
necessary to present fairly the quarterly unaudited financial information. The operating results for any quarter are not necessarily indicative of results for any future period.
| |
Three Months Ended | |||||||||||||||||||||||||
|---|---|---|---|---|---|---|---|---|---|---|---|---|---|---|---|---|---|---|---|---|---|---|---|---|---|---|
| |
Mar. 31, 2008 |
June 30, 2008 |
Sept. 30, 2008 |
Dec. 31, 2008 |
Mar. 31, 2009 |
June 30, 2009 |
Sept. 30, 2009 |
Dec. 31, 2009 |
||||||||||||||||||
| |
(unaudited) (in thousands, except per share data) |
|||||||||||||||||||||||||
Revenues |
$ | 263,074 | $ | 245,603 | $ | 230,831 | $ | 216,069 | $ | 199,063 | $ | 185,597 | $ | 174,521 | $ | 164,548 | ||||||||||
Cost of revenues |
97,551 | 92,488 | 87,616 | 83,265 | 75,565 | 69,270 | 66,885 | 62,035 | ||||||||||||||||||
Operating costs and expenses (1) |
100,109 | 89,264 | 83,786 | 156,891 | 66,025 | 61,857 | 55,823 | 84,111 | ||||||||||||||||||
Income (loss) from operations |
65,414 | 63,851 | 59,429 | (24,087 | ) | 57,473 | 54,470 | 51,813 | 18,402 | |||||||||||||||||
Gain (loss) on investments in other companies, net |
— | 1,325 | 4,352 | (2,969 | ) | 259 | 11 | 35 | (1,626 | ) | ||||||||||||||||
Interest expense and other, net (2) |
(1,041 | ) | (3,482 | ) | (3,281 | ) | (4,604 | ) | (4,291 | ) | (5,100 | ) | (5,067 | ) | (5,346 | ) | ||||||||||
Income (loss) from continuing operations before income taxes |
64,373 | 61,694 | 60,500 | (31,660 | ) | 53,441 | 49,381 | 46,781 | 11,430 | |||||||||||||||||
Income tax (provision) benefit (3) |
(9,274 | ) | (6,725 | ) | (7,924 | ) | 56,107 | (20,944 | ) | (17,896 | ) | (16,914 | ) | 181,839 | ||||||||||||
Income from continuing operations |
55,099 | 54,969 | 52,576 | 24,447 | 32,497 | 31,485 | 29,867 | 193,269 | ||||||||||||||||||
Loss from discontinued operations, net of tax (4) |
(3,392 | ) | (4,365 | ) | (681 | ) | (68 | ) | — | — | — | — | ||||||||||||||
Net income |
$ | 51,707 | $ | 50,604 | $ | 51,895 | $ | 24,379 | $ | 32,497 | $ | 31,485 | $ | 29,867 | $ | 193,269 | ||||||||||
Basic net income per share (5): |
||||||||||||||||||||||||||
Income from continuing operations |
$ | 0.50 | $ | 0.50 | $ | 0.48 | $ | 0.23 | $ | 0.30 | $ | 0.30 | $ | 0.28 | $ | 1.80 | ||||||||||
Loss from discontinued operations |
(0.03 | ) | (0.04 | ) | (0.01 | ) | (0.00 | ) | — | — | — | — | ||||||||||||||
Net income |
$ | 0.47 | $ | 0.46 | $ | 0.47 | $ | 0.22 | $ | 0.30 | $ | 0.30 | $ | 0.28 | $ | 1.80 | ||||||||||
Diluted net income per share (5): |
||||||||||||||||||||||||||
Income from continuing operations |
$ | 0.50 | $ | 0.49 | $ | 0.47 | $ | 0.22 | $ | 0.30 | $ | 0.29 | $ | 0.28 | $ | 1.79 | ||||||||||
Loss from discontinued operations |
(0.03 | ) | (0.04 | ) | (0.01 | ) | (0.00 | ) | — | — | — | — | ||||||||||||||
Net income |
$ | 0.47 | $ | 0.45 | $ | 0.46 | $ | 0.22 | $ | 0.30 | $ | 0.29 | $ | 0.28 | $ | 1.79 | ||||||||||
Basic weighted average common shares outstanding |
109,493 | 110,033 | 110,153 | 108,449 | 108,071 | 105,908 | 106,615 | 107,075 | ||||||||||||||||||
Diluted weighted average common shares outstanding |
110,300 | 112,256 | 112,039 | 109,617 | 109,168 | 107,080 | 107,943 | 108,178 | ||||||||||||||||||
- (1)
- Operating
costs and expenses for the quarters ended December 31, 2008 and 2009 include non-cash impairment charges of
$78.7 million and $24.1 million, respectively, related to goodwill and certain intangible assets of New Edge in the Company's Business Services segment. EarthLink concluded the carrying
value of these assets were impaired in conjunction with its annual tests of goodwill and intangible assets deemed to have indefinite lives.
- (2)
- Interest
expense and other, net, reflects the adoption of new accounting guidance on January 1, 2009. This new guidance affected the accounting for
the Company's Notes and resulted in additional non-cash interest expense. Prior period amounts have been restated.
- (3)
- During
the quarters ended December 31, 2008 and 2009, EarthLink recorded income tax benefits in the Statement of Operations of $56.1 million
and $198.8 million, respectively, as a result of releases of its valuation allowance related to deferred tax assets. These deferred tax assets related primarily to net operating loss
carryforwards which the Company determined it will more likely than not be able to utilize due to the generation of sufficient taxable income in the future.
- (4)
- In
November 2007, management concluded that the municipal wireless broadband operations were no longer consistent with EarthLink's strategic direction and
the Company's Board of Directors authorized management to pursue the divestiture of the Company's municipal wireless broadband assets. As a result of that decision, the Company classified the
municipal wireless broadband assets as held for sale and presented the municipal wireless broadband operations as discontinued operations for all periods presented.
- (5)
- The quarterly net income per share amounts will not necessarily add to the net income per share computed for the year because of the method used in calculating per share data.
106
Item 9. Changes in and Disagreements with Accountants on Accounting and Financial Disclosure.
None.
Item 9A. Controls and Procedures.
Evaluation of Disclosure Controls and Procedures
Pursuant to Rule 13a-15(b) under the Securities Exchange Act of 1934, as amended (the "Exchange Act"), we carried out an evaluation, with the participation of our management, including our Chief Executive Officer and Chief Financial Officer, of the effectiveness of our disclosure controls and procedures (as defined under Rule 13a-15(e) under the Exchange Act) as of the end of the period covered by this report. Based upon that evaluation, our Chief Executive Officer and Chief Financial Officer concluded that our disclosure controls and procedures are effective to ensure that information required to be disclosed in the reports that are filed or submitted under the Exchange Act, is recorded, processed, summarized and reported, within the time periods specified in the Securities and Exchange Commission's rules and forms, and that such information is accumulated and communicated to management, including our Chief Executive Officer and Chief Financial Officer, as appropriate, to allow timely decisions regarding required disclosure.
Management's Report on Internal Control Over Financial Reporting
Our management is responsible for establishing and maintaining adequate internal control over financial reporting, as such term is defined in Exchange Act Rule 13a-15(f). Under the supervision and with the participation of our management, including our principal executive officer and principal financial officer, we conducted an evaluation of the effectiveness of our internal control over financial reporting based on the framework in Internal Control—Integrated Framework issued by the Committee of Sponsoring Organizations of the Treadway Commission. Based on our evaluation under the framework in Internal Control—Integrated Framework, our management concluded that our internal control over financial reporting was effective as of December 31, 2009.
The effectiveness of our internal control over financial reporting as of December 31, 2009 has been audited by Ernst & Young LLP, an independent registered public accounting firm, as stated in their report which is included herein.
Changes in Internal Control Over Financial Reporting
There were no changes in our internal control over financial reporting during the three months ended December 31, 2009 that have materially affected, or are reasonably likely to materially affect, our internal control over financial reporting.
There was no information required to be disclosed in a report on Form 8-K during the three months ended December 31, 2009 covered by this Annual Report on Form 10-K that was not reported.
107
Item 10. Directors, Executive Officers and Corporate Governance.
Information relating to the directors and nominees for directors of EarthLink will be set forth under the captions "Proposal 1—Election of Directors—Nominees Standing for Election" and "Proposal 1—Election of Directors—Directors Not Standing for Election" in our Proxy Statement for our 2010 Annual Meeting of Stockholders ("Proxy Statement") or in a subsequent amendment to this Annual Report on Form 10-K. Information relating to our executive officers will be set forth under the caption "Executive Officers" in the Proxy Statement or in a subsequent amendment to this Annual Report on Form 10-K. Information regarding compliance by our directors and executive officers and owners of more than 10% of EarthLink's common stock with the reporting requirements of Section 16(a) of the Securities Exchange Act of 1934, as amended, will be set forth under the caption "Executive Officers—Compliance with Section 16(a) of the Securities Exchange Act of 1934" in the Proxy Statement or in a subsequent amendment to this Annual Report on Form 10-K. Information relating to EarthLink's Code of Ethics for directors and officers will be set forth under the caption "Proposal 1—Election of Directors—Corporate Governance Matters—Codes of Ethics" in the Proxy Statement or in a subsequent amendment to this Annual Report on Form 10-K. Information relating to corporate governance will be set forth under the caption "Proposal 1—Election of Directors—Corporate Governance Matters" in the Proxy Statement or in a subsequent amendment to this Annual Report on Form 10-K. Such information is incorporated herein by reference.
Item 11. Executive Compensation.
Information relating to compensation of our directors and executive officers will be set forth under the captions "Proposal 1-Election of Directors-Director Compensation" and "Executive Compensation" in our Proxy Statement referred to in Item 10 above or in a subsequent amendment to this Annual Report on Form 10-K. Such information is incorporated herein by reference, except for the information set forth under the caption "Executive Compensation—Leadership and Compensation Committee Report," which specifically is not so incorporated by reference.
Item 12. Security Ownership of Certain Beneficial Owners and Management and Related Stockholder Matters.
Information regarding security ownership of certain beneficial owners and management of our voting securities will be set forth under the caption "Beneficial Ownership of Common Stock" in our Proxy Statement referred to in Item 10 above or in a subsequent amendment to this Annual Report on Form 10-K. Such information is incorporated herein by reference.
108
Securities Authorized for Issuance Under Equity Compensation Plans
The following table sets forth information as of December 31, 2009 concerning the shares of our common stock which are authorized for issuance under our equity compensation plans:
Plan Category
|
Number of Securities to Be Issued on Exercise of Outstanding Options (a) |
Weighted Average Exercise Price of Outstanding Options (b) |
Number of Securities Remaining Available for Future Issuance Under Equity Compensation Plans (Excluding Securities Reflected in Column (a)) (c) |
||||||
|---|---|---|---|---|---|---|---|---|---|
Equity Compensation Plans |
|||||||||
Approved By Stockholders |
3,916,182 (2) | $ | 9.61 | 13,786,919 (1) | |||||
- (1)
- This number includes shares available by plan as follows:
Plan
|
Securities Available for Future Issuance |
|||
|---|---|---|---|---|
EarthLink, Inc. 2006 Equity and Cash Incentive Plan |
4,569,288 | |||
EarthLink, Inc. Stock Incentive Plan (expires February 28, 2010) |
8,760,199 | |||
EarthLink, Inc. Equity Plan for Non-Employee Directors |
457,432 | |||
|
13,786,919 | |||
The grants of approximately 5.5 million restricted stock units and phantom share units have been deducted from the number of securities available for future issuance.
- (2)
- Pursuant to our merger agreement with New Edge Holding Company in 2006, we were required to grant options to purchase up to 657,000 shares of our Common Stock to New Edge employees. These options were "inducement grants" to new employees in connection with our acquisition of New Edge that qualified under the "inducement grant exception" to the shareholder approval requirement of NASD Marketplace Rule 4350(i)(1)(A). In connection with the closing, the Leadership and Compensation Committee approved the EarthLink, Inc. Stock Option Plan for Inducement Awards Relating to the Acquisition of New Edge Holding Company. The Leadership and Compensation Committee then granted options to purchase 657,000 shares of our Common Stock to these New Edge employees in accordance with this plan. As of December 31, 2009, 200,793 of these options were outstanding. The options have an exercise price equal to the last reported price of $9.48 and vest 25 percent after 12 months and then 6.25 percent each quarter thereafter. The options have a term of 10 years.
Item 13. Certain Relationships and Related Transactions, and Director Independence.
Information regarding certain relationships and transactions between EarthLink and certain of our affiliates is set forth under the caption "Executive Compensation—Leadership and Compensation Committee Interlocks" and "Executive Compensation—Certain Relationships and Related Transactions" in our Proxy Statement referred to in Item 10 above or in a subsequent amendment to this Report on Form 10-K. Information regarding director independence is set forth under the caption "Proposal I—Election of Directors—Director Independence" in our Proxy Statement referred to in Item 10 above or in a subsequent amendment to this Annual Report on Form 10-K. Such information is incorporated herein by reference.
Item 14. Principal Accounting Fees and Services.
Information regarding our principal accounting fees and services is set forth under the caption "Proposal 2—Ratification of Appointment of Independent Registered Public Accounting Firm" in our Proxy Statement referred to in Item 10 above or in a subsequent amendment to this Annual Report on Form 10-K. Such information is incorporated herein by reference.
109
Item 15. Exhibits, Financial Statement Schedules.
(a) Documents filed as part of this Annual Report on Form 10-K
- (1)
- Financial Statements
- 1.
- Reports
of Independent Registered Public Accounting Firm
- 2.
- Consolidated
Balance Sheets as of December 31, 2008 and 2009
- 3.
- Consolidated
Statements of Operations for the years ended December 31, 2007, 2008 and 2009
- 4.
- Consolidated
Statements of Stockholders' Equity and Comprehensive Income (Loss) for the years ended December 31, 2007, 2008 and 2009
- 5.
- Consolidated
Statements of Cash Flows for the years ended December 31, 2007, 2008 and 2009
- 6.
- Notes
to Consolidated Financial Statements
- (2)
- Financial Statement Schedules
The Financial Statement Schedule(s) described in Regulation S-X are omitted from this Annual Report on Form 10-K because they are either not required under the related instructions or are inapplicable.
- (3)
- Listing of Exhibits
3.1— |
Second Restated Certificate of Incorporation of EarthLink, Inc. (incorporated by reference to Exhibit 3.1 to the Registration Statement on Form S-3 of EarthLink, Inc.—File No. 333-109691). | |
3.2— |
Second Amended and Restated Bylaws of EarthLink, Inc. (incorporated by reference to Exhibit 3.1 of EarthLink, Inc.'s Report on Form 8-K dated July 18, 2007—File No. 001-15605). | |
4.1— |
Specimen Common Stock Certificate (incorporated by reference to Exhibit 4.3 of the Registration Statement on Form S-8 of EarthLink, Inc.—File No. 333-30024). | |
4.2— |
Rights Agreement, dated as of August 6, 2002, between EarthLink, Inc. and American Stock Transfer and Trust Co. (incorporated by reference to Exhibit 4.1 to EarthLink, Inc.'s Report on Form 8-K dated August 6, 2002—File No. 001-15605). | |
4.3— |
Indenture, dated November 17, 2006, by and between EarthLink, Inc. and Wells Fargo Bank, N.A. (incorporated by reference to Exhibit 4.1 to EarthLink, Inc.'s Report on Form 8-K dated November 17, 2006—File No. 001-15605). | |
10.1#— |
EarthLink, Inc. Stock Incentive Plan, as amended (incorporated by reference to Exhibit 4.4 of EarthLink, Inc.'s Post Effective Amendment to Registration Statement on Form S-8—File No. 333-39456). | |
10.2#— |
EarthLink, Inc. Equity Plan for Non-Employee Directors, as amended (incorporated by reference to Exhibit 4.4 of EarthLink, Inc.'s Post Effective Amendment to Registration Statement on Form S-8—File No. 333-108065). | |
10.3#— |
EarthLink, Inc. 2006 Equity and Cash Incentive Plan (incorporated by reference to Exhibit 10.1 to EarthLink, Inc.'s Report on Form 8-K dated May 5, 2006). | |
10.4#— |
EarthLink, Inc. Stock Option Plan for Inducement Awards Relating to the Acquisition of New Edge Holding Company (incorporated by reference to Exhibit 10.1 to EarthLink, Inc.'s Report on Form 8-K dated April 14, 2006). |
110
10.5#— |
1995 Stock Option Plan (incorporated by reference to Exhibit 4.4 of EarthLink, Inc.'s Registration Statement on Form S-8—File No. 333-30024). | |
10.6#— |
MindSpring Enterprises, Inc. 1995 Stock Option Plan, as amended (incorporated by reference to Exhibit 4.5 of EarthLink, Inc.'s Registration Statement on Form S-8—File No. 333-30024). | |
10.7#— |
MindSpring Enterprises, Inc. 1995 Directors Stock Option Plan, as amended (incorporated by reference to Exhibit 4.6 of EarthLink, Inc.'s Registration Statement on Form S-8—File No. 333-30024). | |
10.8#— |
Form of Incentive Stock Option Agreement (incorporated by reference to Exhibit 10.1 of EarthLink, Inc.'s Report on Form 10-Q for the quarterly period ended September 30, 2005—File No. 001-15605). | |
10.9#— |
Form of Nonqualified Stock Option Agreement (incorporated by reference to Exhibit 10.2 of EarthLink, Inc.'s Report on Form 10-Q for the quarterly period ended September 30, 2005—File No. 001-15605). | |
10.10#— |
Form of Performance Accelerated Nonqualified Stock Option Agreement (incorporated by reference to Exhibit 10.3 of EarthLink, Inc.'s Report on Form 10-Q for the quarterly period ended September 30, 2005—File No. 001-15605). | |
10.11#— |
Form of Restricted Stock Unit Agreement (incorporated by reference to Exhibit 10.4 of EarthLink, Inc.'s Report on Form 10-Q for the quarterly period ended September 30, 2005—File No. 001-15605). | |
10.12#— |
Form of Nonqualified Stock Option Agreement for Nonemployee Directors (incorporated by reference to Exhibit 10.5 of EarthLink, Inc.'s Report on Form 10-Q for the quarterly period ended September 30, 2005—File No. 001-15605). | |
10.13#— |
Form of Restricted Stock Unit Agreement for Nonemployee Directors (incorporated by reference to Exhibit 10.6 of EarthLink, Inc.'s Report on Form 10-Q for the quarterly period ended September 30, 2005—File No. 001-15605). | |
10.14#— |
Form of Incentive Stock Option Agreement under the EarthLink, Inc. 2006 Equity and Cash Incentive Plan (incorporated by reference to Exhibit 10.2 to EarthLink, Inc.'s Report on Form 8-K dated May 5, 2006). | |
10.15#— |
Form of Nonqualified Stock Option Agreement under the EarthLink, Inc. 2006 Equity and Cash Incentive Plan (incorporated by reference to Exhibit 10.3 to EarthLink, Inc.'s Report on Form 8-K dated May 5, 2006). | |
10.16#— |
Form of Nonqualified Stock Option Agreement for Directors under the EarthLink, Inc. 2006 Equity and Cash Incentive Plan (incorporated by reference to Exhibit 10.4 to EarthLink, Inc.'s Report on Form 8-K dated May 5, 2006). | |
10.17#— |
Form of Restricted Stock Unit Agreement under the EarthLink, Inc. 2006 Equity and Cash Incentive Plan (incorporated by reference to Exhibit 10.5 to EarthLink, Inc.'s Report on Form 8-K dated May 5, 2006). | |
10.18#— |
Form of Restricted Stock Unit Agreement under the EarthLink, Inc. 2006 Equity and Cash Incentive Plan (incorporated by reference to Exhibit 10.4 of EarthLink, Inc.'s Report on Form 10-K for the year ended December 31, 2007—File No. 001-15605). | |
10.19#*— |
Form of Restricted Stock Unit Agreement for Nonemployee Directors. | |
10.20#— |
Form of Award Agreement under EarthLink, Inc. Stock Option Plan for Inducement Awards Relating to the Acquisition of New Edge Holding Company (incorporated by reference to Exhibit 4.4 to the Registration Statement of Form S-8—File No. 333-133870). |
111
10.21#— |
Restricted Stock Unit Agreement dated as of February 8, 2008 for Rolla P. Huff under the EarthLink, Inc. 2006 Equity and Cash Incentive Plan (incorporated by reference to Exhibit 10.4 of EarthLink, Inc.'s Report on Form 10-Q for the quarterly period ended June 30, 2008—File No. 001-15605). | |
10.22— |
Office Lease Agreement dated November 16, 1999, between Kingston Atlanta Partners, L.P. and MindSpring Enterprises, Inc., as amended (incorporated by reference to Exhibit 10.1 of EarthLink, Inc.'s Report on Form 10-Q for the quarterly period ended March 31, 2001—File No. 001-15605). | |
10.23— |
Fourth Amendment to Office Lease between California State Teacher's Retirement System and EarthLink, Inc. (incorporated by reference to Exhibit 10.1 of EarthLink, Inc.'s Report on Form 8-K dated December 30, 2004—File No. 001-15605). | |
10.24— |
Office Lease by and between The Mutual Life Insurance Company of New York, and EarthLink Network, Inc., dated September 20, 1996, as amended (incorporated by reference to Exhibit 10.2 of EarthLink, Inc.'s Report on Form 10-Q for the quarterly period ended March 31, 2001—File No. 001-15605). | |
10.25— |
Lease Agreement Between WHMNY Real Estate Limited Partnership and EarthLink, Inc. Dated September 19, 2005 (incorporated by reference to Exhibit 10.1 of EarthLink, Inc.'s Report on Form 8-K dated October 14, 2005—File No. 001-15605). | |
10.26— |
Amended and Restated Employment Agreement, dated December 30, 2008, between EarthLink, Inc. and Rolla P. Huff, President and Chief Executive Officer of EarthLink, Inc. (incorporated by reference to Exhibit 10.1 of EarthLink, Inc.'s Report on Form 10-Q for the quarterly period ended March 31, 2009—File No. 001-15605). | |
10.27— |
Amended and Restated Employment Agreement, dated December 30, 2008, between EarthLink, Inc. and Joseph M. Wetzel, Chief Operating Officer of EarthLink, Inc. (incorporated by reference to Exhibit 10.2 of EarthLink, Inc.'s Report on Form 10-Q for the quarterly period ended March 31, 2009—File No. 001-15605). | |
10.28#*— |
EarthLink, Inc. Board of Directors Compensation Plan, effective January 2010. | |
10.29#*— |
Amended and Restated Change-in-Control Accelerated Vesting and Severance Plan, effective as of February 3, 2010. | |
10.30#— |
Executives' Position Elimination and Severance Plan, amended and restated effected as of December 15, 2008 (incorporated by reference to Exhibit 10.30 of EarthLink, Inc.'s Report on Form 10-K for the year ended December 31, 2008—File No. 001-15605). | |
10.31— |
Summary of 2009 bonus payments and 2010 salaries for executive officers (incorporated by reference to EarthLink, Inc.'s Report on Form 8-K dated February 4, 2010—File No. 001-15605). | |
10.32#* |
EarthLink, Inc. 2010 Short Term Incentive Bonus Plan. | |
10.33#— |
Form of Executive Retention Incentive Award Agreement under the EarthLink, Inc. 2006 Equity and Cash Incentive Plan (incorporated by reference to Exhibit 10.3 of EarthLink, Inc.'s Report on Form 10-Q for the quarterly period ended March 31, 2009—File No. 001-15605). | |
10.34#— |
Form of Retention Incentive Award Agreement for Rolla P. Huff under the EarthLink, Inc. 2006 Equity and Cash Incentive Plan (incorporated by reference to Exhibit 10.4 of EarthLink, Inc.'s Report on Form 10-Q for the quarterly period ended March 31, 2009—File No. 001-15605). |
112
10.35+— |
High-Speed Service Agreement between EarthLink, Inc. and Time Warner Cable Inc. (incorporated by reference to Exhibit 10.5 of EarthLink, Inc.'s Report on Form 10-Q for the quarterly period ended March 31, 2009—File No. 001-15605). | |
21.1*— |
Subsidiaries of the Registrant. | |
23.1*— |
Consent of Ernst & Young LLP, an independent registered public accounting firm. | |
24.1*— |
Power of Attorney (see the Power of Attorney in the signature page hereto). | |
31.1*— |
Certification of Chief Executive Officer pursuant to Securities Exchange Act Rules 13a-14 and 15d-14, as adopted pursuant to Section 302 of the Sarbanes-Oxley Act of 2002. | |
31.2*— |
Certification of Chief Financial Officer pursuant to Securities Exchange Act Rules 13a-14 and 15d-14, as adopted pursuant to Section 302 of the Sarbanes-Oxley Act of 2002. | |
32.1*— |
Certification of Chief Executive Officer pursuant to 18 U.S.C. Section 1350, as adopted pursuant to Section 906 of the Sarbanes-Oxley Act of 2002. | |
32.2*— |
Certification of Chief Financial Officer pursuant to 18 U.S.C. Section 1350, as adopted pursuant to Section 906 of the Sarbanes-Oxley Act of 2002. |
- *
- Filed
herewith.
- #
- Management
compensatory plan or arrangement.
- +
- Confidential treatment has been requested with respect to portions of this exhibit.
(b) Exhibits
The response to this portion of Item 15 is submitted as a separate section of this Annual Report on Form 10-K.
(c) Financial Statement Schedule
The Financial Statement Schedule(s) described in Regulation S-X are omitted from this Annual Report on Form 10-K because they are either not required under the related instructions or are inapplicable.
113
Pursuant to the requirements of Section 13 or 15(d) of the Securities Exchange Act of 1934, the registrant has duly caused this report to be signed on its behalf by the undersigned, thereunto duly authorized.
| EARTHLINK, INC. | ||||
By: |
/s/ ROLLA P. HUFF Rolla P. Huff, Chairman of the Board, Chief Executive Officer and President Date: February 26, 2010 |
|||
Each person whose signature appears below hereby constitutes and appoints Rolla P. Huff and Bradley A. Ferguson, the true and lawful attorneys-in-fact and agents of the undersigned, with full power of substitution and resubstitution, for and in the name, place and stead of the undersigned, in any and all capacities, to sign any and all amendments to this Report, and to file the same, with all exhibits thereto, and other documents in connection therewith, with the Securities and Exchange Commission, and hereby grants to such attorneys-in-fact and agents full power and authority to do and perform each and every act and thing requisite and necessary to be done, as fully to all intents and purposes as the undersigned might or could do in person, hereby ratifying and confirming all that said attorneys-in-fact and agents, or their substitute or substitutes, may lawfully do or cause to be done by virtue hereof.
Pursuant to the requirements of the Securities Exchange Act of 1934, this report has been signed below by the following persons on behalf of registrant and in the capacities and on the dates indicated.
| Date: | February 26, 2010 |
By: | /s/ ROLLA P. HUFF
Rolla P. Huff, Chairman of the Board, Chief Executive Officer and President (principal executive officer) |
|||||
Date: |
February 26, 2010 |
By: |
/s/ BRADLEY A. FERGUSON Bradley A. Ferguson, Chief Financial Officer (principal financial and accounting officer) |
|||||
Date: |
February 26, 2010 |
By: |
/s/ S. MARCE FULLER S. Marce Fuller, Lead Director |
|||||
Date: |
February 26, 2010 |
By: |
/s/ SUSAN D. BOWICK Susan D. Bowick, Director |
|||||
Date: |
February 26, 2010 |
By: |
/s/ TERRELL B. JONES Terrell B. Jones, Director |
|||||
Date: |
February 26, 2010 |
By: |
/s/ DAVID A. KORETZ David A. Koretz, Director |
|||||
Date: |
February 26, 2010 |
By: |
/s/ THOMAS E. WHEELER Thomas E. Wheeler, Director |
|||||
Date: |
February 26, 2010 |
By: |
/s/ M. WAYNE WISEHART M. Wayne Wisehart, Director |
114