Attached files
| file | filename |
|---|---|
| EX-31.2 - 302 CFO CERTIFICATION - CYMER INC | dex312.htm |
| EX-32.2 - 906 CFO CERTIFICATION - CYMER INC | dex322.htm |
| EX-23.1 - CONSENT OF KPMG LLP - CYMER INC | dex231.htm |
| EX-32.1 - 906 CEO CERTIFICATION - CYMER INC | dex321.htm |
| EX-31.1 - 302 CEO CERTIFICATION - CYMER INC | dex311.htm |
| EX-10.28 - MEMORANDUM OF UNDERSTANDING - CYMER INC | dex1028.htm |
| EX-10.17 - SEPARATION AGREEMENT - CYMER INC | dex1017.htm |
| EX-10.16 - EMPLOYMENT AGREEMENT - PAUL B. BOWMAN - CYMER INC | dex1016.htm |
Table of Contents
UNITED STATES
SECURITIES AND EXCHANGE COMMISSION
WASHINGTON, D.C. 20549
FORM 10-K
(Mark One)
| x | ANNUAL REPORT PURSUANT TO SECTION 13 OR 15(d) OF THE SECURITIES EXCHANGE ACT OF 1934 |
For the Fiscal Year Ended December 31, 2009
OR
| ¨ | TRANSITION REPORT PURSUANT TO SECTION 13 OR 15(d) OF THE SECURITIES EXCHANGE ACT OF 1934 |
For the transition period from to
Commission file number 0-21321
CYMER, INC.
(Exact name of registrant as specified in its charter)
| Nevada | 33-0175463 | |
| (State or other jurisdiction of incorporation or organization) |
(I.R.S. Employer Identification No.) | |
| 17075 Thornmint Court, San Diego, CA | 92127 | |
| (Address of principal executive offices) | (Zip Code) | |
Registrant’s telephone number, including area code: (858) 385-7300
Securities registered pursuant to Section 12(b) of the Act:
| Title of Each Class |
Name of each exchange on which registered | |
| Common stock, $0.001 par value |
The NASDAQ Stock Market LLC |
Securities registered pursuant to Section 12(g) of the Act: None
Indicate by check mark if the registrant is a well-known seasoned issuer, as defined in Rule 405 of the Securities Act. x Yes ¨ No
Indicate by check mark if the registrant is not required to file reports pursuant to Section 13 or Section 15(d) of the Act. ¨ Yes x No
Indicate by check mark whether the registrant (1) has filed all reports required to be filed by Section 13 or 15(d) of the Securities Exchange Act of 1934 during the preceding 12 months (or for such shorter period that the registrant was required to file such reports), and (2) has been subject to such filing requirements for the past 90 days. x Yes ¨ No
Indicate by check mark whether the registrant has submitted electronically and posted on its corporate Web site, if any, every Interactive Data File required to be submitted and posted pursuant to Rule 405 of Regulation S-T (§232.405 of this chapter) during the preceding 12 months (or for such shorter period that the registrant was required to submit and post such files). Yes ¨ No ¨
Indicate by check mark if disclosure of delinquent filers pursuant to Item 405 of Regulation S-K (§229.405 of this chapter) is not contained herein, and will not be contained, to the best of registrant’s knowledge, in definitive proxy or information statements incorporated by reference in Part III of this Form 10-K or any amendment to this Form 10-K. x
Indicate by check mark whether the registrant is a large accelerated filer, an accelerated filer, a non-accelerated filer, or a smaller reporting company. See the definitions of “large accelerated filer” “accelerated filer,” and “smaller reporting company” in Rule 12b-2 of the Exchange Act. (Check one):
| Large accelerated filer x |
Accelerated filer ¨ | Non-accelerated filer ¨ (Do not check if a smaller reporting company) |
Smaller reporting company ¨ |
Indicate by check mark whether the registrant is a shell company (as defined in Rule 12b-2 of the Exchange Act). ¨ Yes x No
The aggregate market value of the voting stock held by non-affiliates of the registrant, based upon the closing price of $29.73for shares of the registrant’s common stock on June 30, 2009 as reported on the NASDAQ Global Select Market, was $749,018,244. The registrant has no non-voting common stock. In calculating such aggregate market value, shares of common stock owned of record or beneficially by officers or directors, and persons known to the registrant to own more than ten percent of the registrant’s voting securities were excluded because such persons may be deemed to be affiliates. The registrant disclaims the existence of control or any admission thereof for any other purpose. As of February 22, 2010, there were 30,026,366 shares of common stock outstanding.
DOCUMENTS INCORPORATED BY REFERENCE
The following document is incorporated by reference in Part II (Item 5) and Part III (Items 10, 11, 12, 13 and 14) of this Annual Report on Form 10-K: portions of registrant’s definitive proxy statement for its annual meeting of stockholders to be held on May 20, 2010 which will be filed with the Securities and Exchange Commission within 120 days of December 31, 2009.
Table of Contents
CYMER, INC.
2009 Annual Report on Form 10-K
i
Table of Contents
Forward-Looking Statements
Statements in this Annual Report on Form 10-K that are not strictly historical in nature are forward-looking statements. These statements include, but are not limited to, references to the outlook for the semiconductor industry and us; expected timeline for the adoption of new photolithography and flat panel display technologies by customers; expected domestic and international product sales and development; our research and development activities and expenditures; adequacy of our capital resources and investments; effects of business cycles in the semiconductor business; our competitive position; and our relationships with customers and third-party manufacturers of our products, and may contain words such as “believes,” “anticipates,” “expects,” “plans,” “intends” and words of similar meaning. In addition, statements regarding backlog and book-to-bill ratios should not be read as predictions or projections of future performance. These statements are predictions based on current information and our expectations and involve a number of risks and uncertainties. The underlying information and our expectations are likely to change over time. Actual events or results may differ materially from those projected in the forward-looking statements due to various factors, including, but not limited to, those contained under the caption “Risk Factors” and elsewhere in this Annual Report on Form 10-K. Forward-looking statements herein speak only as of the date of this Annual Report on Form 10-K. Unless required by law, we undertake no obligation to update or revise any forward-looking statements to reflect new information or future events or developments. Thus, you should not assume that our silence over time means that actual events are bearing out as expressed or implied in such forward-looking statements.
Cymer, XLR, XLA, XL, Nanolith, GLX, OnPulse, and all other Cymer product or service names used herein are either registered trademarks or trademarks of Cymer, Inc. Other marks mentioned herein, if any, are the property of their respective holders.
PART I
| Item 1. | Business |
Overview
We are the world’s leading supplier of light sources used in the photolithography process for semiconductor, or chip, manufacturing. We provide state-of-the-art light sources designed to help enable the performance of leading edge wafer steppers and wafer scanners built by our lithography tool manufacturers. Additionally, we provide installed base products in support of chipmaker customers who use our light sources in their advanced wafer patterning production processes. We currently supply deep ultraviolet (“DUV”) light sources to our lithography tool manufacturer customers ASML, Canon and Nikon, who integrate the light source into their wafer steppers and scanners which they then provide to chipmakers. In addition, we sell replacement parts and support to lithography tool manufacturers as well as directly to chipmakers, who include all of the world’s largest semiconductor manufacturers. Our light source systems constitute a substantial majority of all DUV light sources incorporated in lithography stepper and scanner tools at chipmakers worldwide. As the leading supplier of these light sources, the majority of consumer electronics devices manufactured in the last several years contain a semiconductor manufactured using our light sources.
Cymer, Inc. was incorporated in California in 1986 and reincorporated in Nevada on July 12, 1996. Our headquarters is in San Diego, California, where we design, develop and manufacture our light source systems and the majority of our replacement parts. To provide better support to our customers located outside of the United States, we maintain a replacement parts refurbishment facility and field service office in Korea, and field service and support offices in Japan, the Netherlands, China, Singapore and Taiwan. We also maintain a field service office in the United States to support our installed base of light sources located at our U.S. based chipmaker customers.
As of December 31, 2009, we were the 60% owner of our joint venture entity, TCZ Pte. Ltd. (“TCZ”), which manufactures a laser crystallization tool targeting the growing market for low-temperature poly-silicon (“LTPS”) processing used in the manufacture of organic light emitting diode (“OLED”) flat panel displays. We
1
Table of Contents
formed TCZ with Carl Zeiss SMT AG, a German corporation, and Carl Zeiss Laser Optics Beteiligungsgesellschaft mbH, a German limited liability company (which we refer to collectively with their affiliated entities as “Zeiss”). Effective January 15, 2010, we purchased Zeiss’s 40% ownership in TCZ, resulting in full ownership of TCZ by us. Zeiss will continue to provide TCZ relevant intellectual property licenses, ongoing research and development, and manufacturing of optical modules. The change in ownership does not affect the current TCZ product and services roadmaps. See Note 15 to our Consolidated Financial Statements in Part II, Item 8 of this report for further information.
Financial Information about Segments and Geographic Areas
Financial information regarding our segments and the geographic areas where we operate is contained in Note 13 to our Consolidated Financial Statements for the years ended December 31, 2009, 2008 and 2007, and is included as part of Item 8—“Financial Statements and Supplementary Data.”.
Industry Background
The highly cyclical nature of the semiconductor industry is driven by demand for consumer electronic devices that contain semiconductor chips. The complexity of these chips has increased dramatically due to the demand for more sophisticated electronic devices that can provide more functionality, such as cellular phones with internet and video capability, video MP3 players, notebook computers that can download and play movies, automotive products, and advanced game consoles that are capable of driving the rapid action and vivid graphics that characterize today’s increasingly realistic and interactive video games. Additionally, there is growing consumer demand for this increased functionality to be available virtually everywhere, through wireless connectivity. These advances have been achieved without the devices increasing in size or price because chipmakers have been able, over the years, to make each generation of chips with smaller features and finer circuitry than the previous generation. Semiconductor equipment suppliers have partnered with their chipmaker customers to enable the features on the chip to continue to shrink. Photolithography is one of the key technologies that has enabled this process to continue.
The basic building block of semiconductor technology is a thin, flat, round disc of pure silicon called a wafer, which is polished to a mirror-like finish. After polishing, the wafer must go through a complex manufacturing process that involves several hundred steps—all of which must be executed with extreme precision at the level of a few nanometers (“nm”) (one nm is a billionth of a meter). Standard processes, such as photolithography, etch and deposition are repeated many times on the wafer, resulting in a buildup of microscopic structures, consisting of tens of millions of transistors. When the wafer processing is complete, a single wafer will contain hundreds of individual chips, which are then cut, tested, bonded onto lead-wire “legs,” and then packaged in a ceramic or epoxy container.
The Lithography Process
Photolithography is a process that uses light to print, or pattern, the complex circuit patterns onto the wafer. The ability to pattern smaller circuits depends, to a great degree, on the wavelength of the light used in the photolithography process. A shorter wavelength of light can pattern circuitry with smaller critical dimensions (“CD”), which in turn allows the transistors that serve as circuit switches to be smaller and the resulting chips to provide higher levels of functionality. Our light sources provide an extremely pure beam of ultraviolet light. The short wavelength of DUV light enables the required resolution, depth of focus and CD control required to pattern semiconductor circuits.
A lithography tool projects light from the light source through an image of the circuitry pattern on a photomask or reticle. A reticle is a glass plate with a layer of chrome on one side, on which the negative of the circuit pattern is etched. The image of the circuitry is transferred by the light being projected through a reduction lens onto a small portion of the surface of the silicon wafer.
2
Table of Contents
To print the projected optical pattern, the wafer is coated with a thin film of light-sensitive material, called photoresist. The light exposes the photoresist, which is then developed (somewhat like photographic film) to create a stenciled image pattern. Next, through a process called “etch”, the unnecessary underlying material is selectively removed, creating an extremely fine circuit pattern. The wafer is inspected, particularly for pattern defects, any hardened residual photoresist is removed, and then the wafer is measured to make sure it meets predetermined specifications. Then the wafer surface is cleaned, generally by immersing it in acid, solvent, or deionized water. The process is repeated over multiple layers to build the electrical circuit structure. Depending on the type of chip being made, a total of 30 to 50 layers are patterned precisely over the first to complete the circuit fabrication, at which time the wafer is fully processed.
The light from these DUV sources is generated by mixing two gases—either krypton and fluorine (“KrF”), or argon and fluorine (“ArF”)—inside a discharge chamber within the light source system. When a short electrical charge is applied to the gases, the gas atoms combine briefly to form a molecule known as an excited dimer, or “excimer.” These gas molecules remain together for a few nano-seconds, and when they separate, produce an intense pulse of DUV light that is then purified and directed out one end of the light source to the lithography tool. Depending on the repetition rate of the laser, this procedure is repeated between 400 and 6,000 times per second (1,000 pulses per second equals one kiloherz (“kHz”)).
Products and Support
Our products include photolithography light source systems and installed base products. We provide our customers with a complete line of light sources designed to cost-effectively deliver high levels of performance, availability, and reliability to enable chipmakers to achieve their production goals.
Photolithography Light Source Systems
Our light source systems include of the most advanced ArF immersion light sources for use on the most critical process layers. Chipmakers also use our ArF and Krf light sources to fill out or balance their production lines or add capacity to their manufacturing facilities (also referred to as “fabs”) for less critical layers. The extremely short wavelengths and highly narrowed bandwidths of our light sources work in concert with our lithography customers’ steppers and scanners and their sophisticated lens systems to help enable the very fine feature resolution required for patterning today’s most advanced circuitry. The pulse energy and repetition rate of our light sources enable our chipmaker customers to achieve high throughput in wafer processing. We have designed our light sources to be reliable, easy to install and compatible with existing semiconductor manufacturing processes.
Revenues generated from sales of light sources were approximately $68.9 million, $157.7 million and $245.8 million for 2009, 2008 and 2007, respectively.
3
Table of Contents
Current Light Source System Products
Included in our light source system products below are our more recent, most advanced light sources for use on the most critical process layers:
| Product |
Configuration |
Gas | Wavelength | Application | Power | Repetition Rate | ||||||
| XLR600ix |
Dual Chamber Recirculating Ring | ArF | 193 nm | Double Patterning / Immersion |
60W / 90W |
6 kHz | ||||||
| XLR 600i* |
Dual Chamber Recirculating Ring | ArF | 193 nm | Double Patterning / Immersion |
90W | 6 kHz | ||||||
| XLR 500i |
Dual Chamber Recirculating Ring | ArF | 193 nm | Immersion | 60W | 6 kHz | ||||||
| XLR 500d* |
Dual Chamber Recirculating Ring | ArF | 193 nm | Dry | 60W | 6 kHz | ||||||
| XLA 400 |
Dual Chamber | ArF | 193 nm | Immersion | 60W | 6 kHz | ||||||
| XLA 300 |
Dual Chamber | ArF | 193 nm | Immersion | 60W | 6 kHz | ||||||
| XLA 200 |
Dual Chamber | ArF | 193 nm | Dry | 60W | 4 kHz | ||||||
| XLA 105 |
Dual Chamber | ArF | 193 nm | Dry | 45W | 4 kHz | ||||||
| XLA 100 |
Dual Chamber | ArF | 193 nm | Dry | 40W | 4 kHz | ||||||
| NanoLith 7000 |
Single Chamber | ArF | 193 nm | Dry | 20W | 4 kHz | ||||||
| ELS-7010 |
Single Chamber | KrF | 248 nm | Dry | 40W | 4 kHz | ||||||
| ELS-7000 |
Single Chamber | KrF | 248 nm | Dry | 30W | 4 kHz | ||||||
| ELS-6010* |
Single Chamber | KrF | 248 nm | Dry | 20W | 2.5kHz | ||||||
| ELS-6010A* |
Single Chamber | ArF | 193 nm | Dry | 10W | 2 kHz | ||||||
| ELS-6000* |
Single Chamber | KrF | 248 nm | Dry | 20W | 2 kHz | ||||||
| 5000 Series* |
Single Chamber | KrF | 248 nm | Dry | 10W/15W | 1 kHz |
| * | Indicates legacy light source system. See further discussion below. |
193 nm ArF Immersion Light Sources. As chipmakers continue to reduce the feature sizes and shrink CDs on the wafer, they need to install the advanced tools required to enable patterning of the most critical layers. NAND flash memory and dynamic random access memory (“DRAM”) memory manufacturers have been the most aggressive chipmakers in shrinking CDs, and have been driving demand for our most advanced light sources for ArF immersion lithography applications. Some chipmakers are in development or in the early stages of chip production with CDs of approximately 32 nm. DRAM manufacturers are in production at 45 nm and began adopting immersion lithography in production during 2006. Leading edge semiconductor manufacturers in the memory, logic and foundry sectors have been developing ArF immersion extension down to the 22 nm technology and implementing the double patterning technique, which means the ArF immersion ramp could last for several years. These light sources are comprised of the XLR 600ix, XLR 600i, XLR 500i, XLA 400, and XLA 300.
193 nm ArF Dry Light Sources. Though no longer the leading edge technology, dry ArF lithography is still used to pattern a significant number of less-critical layers on wafers. Additionally, as CDs continue to shrink and drive demand for even finer resolution on the most critical layers, non-critical layers may be patterned with ArF dry scanners and drive continued demand for these tools. These light sources are comprised of the XLR 500d, XLA 200, XLA 105, XLA 100, the NanoLith 7000 and ELS-6010A.
248 nm KrF Light Sources. We have been providing KrF light sources for volume chip production since 1996, when chipmakers required the adoption of DUV light sources in their fabs. Over the years, we have developed and sold a variety of increasingly powerful and productive KrF light sources. These light sources are comprised of the ELS-7010, ELS-7000, ELS-6010 and 5000 series.
XLR Series. The XLR Series of ArF immersion light sources is comprised of our XLR 600ix, XLR 600i and XLR500i models. The XLR Series is based on our dual discharge chamber master oscillator power amplifier
4
Table of Contents
(“MOPA”) light source architecture, with a regenerative ring amplifier in place of the traditional power amplifier. Built on our XL universal platform, this product series offers a step function improvement in performance and cost of operation. Our XLR light sources are designed to enable our chipmaker customers to customize performance for specific applications through improved performance parameters and metrology options. Flexible power up to 90 watts (“W”), improved bandwidth stability and dose control enable higher CD control and yield, and this series offers longer pulse duration to extend the lifetime of the illuminator and lens, even at higher power levels. Cost of operation is reduced significantly through optical design and component robustness, leading to increased module lifetime. With active bandwidth stabilization and tuning capability, the XLR light sources offer improved bandwidth management for improved mask optical proximity correction matching and tool-to-tool matching, so customers can use multiple node mask sets in the same tool or the same mask in different tools.
XLA Series. The XLA Series of ArF light sources was the first product series to be based on our dual-discharge chamber MOPA architecture. MOPA represented a paradigm shift in excimer laser architecture when it was introduced in 2003. The master oscillator creates a narrow bandwidth beam of light at low power. The beam then is directed into the power amplifier, where the power is increased significantly while maintaining the narrow bandwidth. This combination of bandwidth and power enabled our chipmaker customers to continue reducing CDs and increasing processing speeds, capacity and functionality of chips, while giving them the performance and cost advantages they need. Each product in the XLA Series is based on the XL universal platform.
7000 Series. The 7000 Series is the first series that was designed and built on a common platform, enabling chipmakers to easily utilize the 193 nm wavelength produced by ArF and the 248 nm wavelength produced by KrF within the manufacturing environment. This “ease of use” feature was very important at the time, because chipmakers were introducing ArF production into their fabs with the NanoLith 7000, and the common platform simplified the introduction of this new technology. With a 4 kHz repetition rate and high output power, the 7000 Series provides our chipmaker customers with high wafer throughput and lower cost of operation by reason of advanced design and materials, and delivers a high level of tool availability to enable manufacturing efficiency and flexibility. Our best selling light source of the series, the ELS-7010 is still in demand as chipmakers continue to prefer the higher power and narrower bandwidth offered by this system.
Legacy Light Source Systems. In general, our legacy light source systems have been superseded and there is no longer demand for these systems. However, these systems are still widely used by our customers and make up a substantial portion of our installed base of light sources. We continue to provide installed base products for these systems. Our legacy light source systems include our XLR 600i, XLR 500d, 6000 Series and 5000 Series.
Emerging Light Source Systems. Extreme ultraviolet (“EUV”) lithography is currently forecasted by the International Technology Roadmap for Semiconductors (“ITRS”) to be the next critical dimension imaging solution after ArF immersion lithography and double patterning extensions. Some forms of memory devices, such as NAND Flash, may need this manufacturing technology after 32 nm node devices.
We believe the availability of a high power source for 13.5 nm radiation is one of the technologies requiring significant developments to enable the realization of EUV lithography. Other technologies that are needed to enable EUV photolithography include photoresist and mask. Photoresist performance parameters needing the greatest amount of development include sensitivity or speed, line-edge-roughness, and line-width-roughness. Photoresist sensitivity and scanner optical transmission are the basis to derive EUV source power requirements within a usable bandwidth.
Our laser-produced plasma EUV source system produces 13.5 nm radiation and is intended to provide a power source for EUV lithography. As currently configured, it consists of a carbon dioxide laser, a beam transport system, and a plasma chamber. The chamber contains a mirror which collects the emitted light and reimages the plasma source to the intermediate focus position at the entrance to the scanner system. The source plasma chamber is directly coupled to the scanner vacuum chamber and inside the scanner enclosure. We shipped our first EUV prototype source system to ASML in 2009, and expect to record our first sale of an EUV pilot source system to ASML during 2010.
5
Table of Contents
OLED Flat Panel Displays
TCZ’s production tool for flat panel display fabrication, the TCZ-900A, is designed to be used in the manufacture of both advanced liquid crystal displays (“LCD”) and next generation OLED displays, which are used in cell phones, laptops and televisions.
Laser crystallization is a key step in the manufacturing process for many types of LCD and OLED displays. A glass plate, coated with a thin film of amorphous silicon, is exposed to a high-power laser that converts the silicon into a poly-crystalline form, which is then used to create the pixel control circuit. The TCZ crystallization system uses a 600W laser with advanced beam shaping optics to form a very narrow line focus that is 730 mm long, allowing a generation 4 size glass plate (730mm x 920mm) to be processed in a single pass. This approach produces very uniform crystalline silicon material across the entire glass plate, which is needed to support the high-performance OLED pixel circuits.
TCZ shipped and installed its first laser crystallization system for the OLED flat panel display market at a large Korean display manufacturer in 2009. TCZ is working with this display maker to demonstrate the systems’ differentiated throughput and the superior uniformity of TCZ’s laser crystallization technology. This initial sale includes an acceptance provision, which had not been met as of December 31, 2009; therefore, no revenue has been recorded on this sale.
Installed Base Products
Contracts and Service Agreements
We provide light source system support to our customers through contracts and service agreements. Under these agreements, we provide both planned and reactive maintenance services to maintain the equipment within specifications. Certain contracts include the replacement of consumable and non-consumable parts.
OnPulse contracts offer a comprehensive approach to enhancing light source productivity. Through OnPulse, we offer our customers predictable light source running costs that scale directly with pulse utilization. With OnPulse, we provide on-site support from certified service engineers and continuous real-time light source monitoring. Replacement parts and support are covered under the OnPulse contract and include annual year over year per pulse cost decreases, as well as simplified order and asset management. We believe OnPulse offers our customers many compelling benefits and this product has been well received by our customers since its introduction in 2007.
Revenues generated from contracts and service agreements were approximately $122.1 million, $88.2 million and $48.8 million for 2009, 2008 and 2007, respectively.
Replacement Parts
Our light source systems incorporate certain modules and subassemblies that require replacement or refurbishment following extended operation. The expected lifetime of the replaceable modules varies depending on the light source model. At this time, the majority of modules replaced are discharge chambers, and we estimate that a light source used in a semiconductor production environment will require up to four replacement discharge chambers per year, depending upon the level of usage. Similarly, certain optical components of the light source, such as the line narrowing module and stabilization module, deteriorate with continued exposure to DUV light and require periodic replacement. We provide these and all other spare and replacement parts for our light source systems to our customers.
It has been our practice to continually improve the performance and extend the expected lifetimes of our replacement modules. The enhanced performance enables our customers to benefit from higher throughput and yield, while the extended lifetimes provide lower cost of operation. We continue to seek ways to add value for our customers and enable them to realize higher returns on their investment in light source systems purchased from us.
6
Table of Contents
Revenues generated from sales of replacement parts, excluding the receipt of reusable material, were approximately $101.7 million, $184.1 million and $197.5 million for 2009, 2008 and 2007, respectively.
Refurbishment Activities
We conduct parts refurbishment and materials reclaim activities related to some of our core modules, the majority of which involves our discharge chambers. These activities involve arrangements with our customers where we sell a new part to the customer at a reduced sales price if the customer returns the consumed core module that the new part replaces. These returned modules contain a certain amount of material, primarily metal components, that may be reused by us in future core assemblies. Since a portion of the module’s original sale price is related to the return of consumed parts, we record revenue based on the estimated fair value of the returned parts when we receive the returned modules from our customers.
Revenues generated from the receipt of reusable material contained within consumed assemblies returned from our customers were approximately $14.9 million, $28.7 million and $28.9 million for 2009, 2008 and 2007, respectively.
Customers and End-Users
We currently supply DUV light sources to each of the lithography tool manufacturers, ASML, Nikon, and Canon, who in turn supply their wafer steppers and scanners to chipmakers. In addition, we sell installed base products, which include replacement parts, various service and support offerings and upgrades to lithography tool manufacturers as well as directly to chipmakers. We sell to customers in the United States, Europe, Japan, Korea, Taiwan, China and other Asian countries. Our chipmaker customers include the world’s leading semiconductor manufacturers. We strive to maintain and strengthen our relationship with these lithography tool manufacturer customers by developing and providing compelling light source solutions in advance of their needs. We work closely with them to ensure that our product road map aligns with theirs, and that we can support each of them in a timely manner with the products required by our mutual chipmaker customers. We believe these efforts enhance our relationship with our lithography tool manufacturer customers and support our leadership position in the photolithography light source market.
Sales to ASML and Nikon, two of our three lithography tool manufacturing customers, and Samsung, which purchases installed base products from us, accounted for 15%, 18% and 13%, respectively, of total revenue in 2009. We expect that sales of our light source and other related products to these three customers will continue to account for a substantial portion of our revenue in the foreseeable future. The loss of any significant business from or production problems for any one of these customers would harm our business and financial condition. We believe there is limited credit risk exposure for us with these companies as they continue to demonstrate sound credit worthiness. However, our ability to collect future revenue from them is dependent on the strength of their business and their financial condition and liquidity.
Backlog
We base our light source production schedule upon order backlog as well as informal customer forecasts. Our backlog includes only those orders for DUV light source systems and replacement parts for which we have accepted a purchase order from a customer, and that will be delivered to the customer within the following 12 months. In addition, our backlog does not include service or support which will be provided to our customers in the future or under service contracts. Our backlog does not include orders for EUV light source systems or TCZ products, as these products are still in evaluation stages at our customers. Because it is the practice in our industry that customers may cancel or delay orders with little or no penalty, our backlog as of any particular date may not be a reliable indicator of actual sales for any succeeding period. At December 31, 2009, we had a DUV backlog of approximately $46.0 million compared with a DUV backlog of $33.7 million at December 31, 2008.
7
Table of Contents
Manufacturing
Our manufacturing activities, which consist of material management, assembly, integration and testing, are performed at our San Diego, California facility. This facility includes approximately 35,600 square feet of Class 10,000 cleanroom manufacturing and test space. Our San Diego facility also supports our EUV research, development and productization efforts. To better leverage our own resources, capitalize on the expertise of our key suppliers and respond more efficiently to our customers’ needs, we outsource the manufacture of many modules and subassemblies of our light source systems. The modular design of our light source products enables this manufacturing outsourcing strategy with substantially all manufacturing of nonproprietary subassemblies currently contracted to third-party suppliers. As a result, we are increasingly dependent upon these contract suppliers to meet our manufacturing schedules. We believe the highly outsourced content and design of our products allows for reduced manufacturing cycle times and increased output per employee. To improve current production efficiencies, control costs, and manage overall manufacturing capacity, we intend to continue training manufacturing personnel, improving our assembly and test processes to further reduce cycle time, investing in additional manufacturing tooling and further developing our supplier management and engineering capabilities.
In addition to our manufacturing facility in San Diego, we have a facility in Korea that refurbishes discharge chambers for light sources installed in Korea and the Asia-Pacific region. This facility includes 6,550 square feet of Class 10,000 cleanroom manufacturing space.
Our light sources contain a limited number of components and subassemblies that we obtain from a single supplier or a small group of suppliers. We currently use a single supplier for certain optical, control system and pulse power components and subassemblies. Whenever possible, we work with secondary suppliers to qualify additional sources of supply. To reduce the risk associated with a single supplier, we carry strategic inventories of these components (which are managed as a percentage of future demand), and we also have vendor-managed inventory of critical components. To date we have been able to obtain adequate light source components and subassemblies in a timely manner from existing suppliers.
TCZ utilizes laser technology from us and obtains its optical modules predominantly from Zeiss. Zeiss also continues to provide ongoing research and development for TCZ’s OLED flat panel display systems.
Sales and Marketing
We design and develop our sales and marketing to best serve our lithography tool manufacturer and chipmaker customers needs. We strive to understand their light source performance and production needs, and work to ensure their understanding of the significant value-add our products offer. We have established product development and marketing and applications engineering teams who work closely with our customers to understand their needs. These teams support our direct sales and marketing efforts.
Support Services
We warrant our new light source products against defects in design, materials, and workmanship. After a customer takes delivery of one of our light sources, we provide product warranty support for the duration of the new products standard warranty, which is typically two years. Upon expiration of the new products standard warranty, we may offer a comprehensive service contract, such as OnPulse, to continue providing replacement products and support. We believe our success depends on enabling our customer’s success through the realization of the highest possible return on their investment in our light sources. We provide our customers with on-site support at their manufacturing facilities, as well as with field service, technical support engineers and training programs. Prior to shipment, our support personnel typically assist the customer with site preparation, inspection and training. We also provide our customers with a comprehensive set of manuals which include light source operation, maintenance, service, diagnostic and safety.
Our field engineers and technical support specialists provide field maintenance and front-line technical support for our customers from our San Diego headquarters, from our field offices located throughout the United
8
Table of Contents
States, and from our field offices located in the Netherlands, Japan, Korea, Singapore, China, and Taiwan. To ensure that our customers receive replacement parts quickly and maintain the optimal level of productivity in their fabs, we maintain spares inventory at each of our field depot facilities per our customer support program. As our installed base of light source systems grows, it is critical that replacement parts, as well as our own logistics support organization, are available for quick response to the demands of our customers. We include a parts warranty on all replacements parts sold to our customers. The warranty coverage period varies by the type of part, since some part types include time-based warranty periods and others include usage-based warranty periods.
We believe that to provide the highly responsive and high quality support that our customers need to maximize their production efficiency, and provide it in a cost-effective manner, requires that we maintain a highly-trained, service support staff that can provide rapid global support solutions. Accordingly, we continuously develop and enhance our direct support infrastructure in both our international and domestic markets. To achieve this level of capability and strive for continuous improvement, we recruit highly qualified field service personnel and provide additional training and certification.
Product Research and Development
Our product development strategy has been to develop in rapid succession technologically innovative new products that deliver superior performance with higher throughput and lower cost of operation to meet the continually evolving needs of our customers. We believe we must continue to anticipate our customers’ future needs, and to develop and introduce new and enhanced light source products in order to support our customers, as well as to strengthen our leadership position in the industry. Execution of our strategy has enabled us to offer our customers increasingly higher value-added DUV light sources in advance of their needs, while establishing our position as the technology and market leader in our field. We intend to continue developing and enhancing our technology in order to provide our customers with innovative products to help ensure their success. Our EUV source efforts have been recognized as leading the industry in the effective development and commercialization of critical next generation technology.
We are currently developing enhancements to our products that will improve tool productivity for high volume memory manufacturing and provide new optical capabilities for process improvement in the foundry and logic sectors. We have historically devoted a significant portion of our financial resources to research and development. Research and development expenses for 2009, 2008 and 2007 were approximately $65.8 million, $96.5 million and $81.8 million, respectively. We also continue to invest in TCZ for low-temperature poly-silicon product development. We intend to continue to maintain a strategic investment in our product research and development activities in connection with our development of new products.
Patent and Other Property Rights
We seek to protect our intellectual property rights in a number of ways, one of which is to obtain patent protection for our technology. As of December 31, 2009, we own a number of United States and foreign patents covering certain aspects of technology related to light sources and piezoelectric techniques. These patents will expire at various times through 2027.
We also rely on trade secret protection, employee and third-party nondisclosure agreements and other intellectual property protection methods to protect our confidential information. These methods however may not be effective in protecting our confidential information, particularly our trade secrets, because third parties may independently develop substantially the same proprietary information and techniques, gain access to our trade secrets, or disclose our technology.
We have registered a number of trademarks in the United States and in some other countries. We are also trying to register additional trademarks in the United States and in other countries. We use these trademarks in our business and advertising materials, which are distributed throughout the world.
9
Table of Contents
Competition
We currently have one competitor, Gigaphoton, that sells light sources for DUV photolithography applications. Gigaphoton is a joint venture between two large companies, Komatsu and Ushio, and is headquartered in Japan. Our customers have purchased products from Gigaphoton and have qualified Gigaphoton’s light sources for use with their products. Additionally, Gigaphoton has been qualified by a number of chipmakers in Europe, Japan, other regions in Asia and the U.S., and has an installed base of light sources at chipmakers in these regions.
The principal elements of competition in our markets are the technical performance characteristics of the DUV light source products and the operating efficiency of the system, which is based on availability, reliability, performance efficiency, throughput, cost of ownership, and overall quality. We believe that we compete favorably with respect to these factors. Our management receives and evaluates internally-generated market research for the U.S. and foreign markets, as well as periodic public and customized market research data in order to gauge the effectiveness of our success rate in response to such factors.
Employees
From November 2008 through March 2009, we took action to reduce the size of our global workforce by approximately 38%. Such action was in response to reduced business levels in the lithography sector of the semiconductor capital equipment market and the effect of the global economic recession in an effort to reduce operating costs. As of December 31, 2009, we employed 816 full-time, part-time and temporary persons worldwide. The substantial majority of our employees are not party to a collective bargaining agreement, although we have seven employees in France and Italy who are subject to a collective bargaining agreement. We have not experienced work stoppages and believe that our employee relations are good.
Environmental Matters
We are subject to federal, state and local regulations, such as regulations related to the environment, land use, public utility utilization and the fire code, in connection with the storage, handling, discharge and disposal of substances that we use in our manufacturing process and in our facilities. We believe that our activities comply with current government regulations that are applicable to our operations and current facilities.
Available Information
Our filings with the Securities and Exchange Commission (“SEC”), including our annual reports on Form 10-K, quarterly reports on Form 10-Q, current reports on Form 8-K and any amendments to those reports filed or furnished pursuant to Section 13(a) or 15(d) of the Securities Exchange Act of 1934 (the “Exchange Act”) are available free of charge through the Investor Relations section of our company’s website at http://www.cymer.com and are accessible as soon as reasonably practicable after being electronically filed with or furnished to the SEC. Additionally, we regularly post copies of our press releases as well as additional information about us on our website. Interested persons can subscribe to email alerts that are sent automatically when we issue press releases, file our reports with the SEC or post certain other information to our website. Information accessible through our website does not constitute a part of this report.
Copies of this report are also available free of charge from Cymer Corporate Investor Communications, 17075 Thornmint Court, San Diego, CA 92127. In addition, our Corporate Governance Guidelines, Code of Conduct and written charters of the committees of the Board of Directors are accessible through the Corporate Governance tab in the Investor Relations section of our website and are available in print to any shareholder who requests a copy.
You may read and copy materials that we file with the SEC at the SEC’s Public Reference Room at 100 F Street, NE, Washington DC 20549. Information on the operation of the Public Reference Room is
10
Table of Contents
available by calling the SEC at 1-800-SEC-0330. The SEC maintains a website that contains reports, proxy statements and other information we file with the SEC. The address of the SEC’s website is http://www.sec.gov.
Executive Officers
Set forth below is certain information regarding our executive officers and their ages as of February 22, 2010.
| Name |
Age | Position | ||
| Robert P. Akins |
58 | Chairman of the Board and Chief Executive Officer | ||
| Edward J. Brown |
52 | President and Chief Operating Officer | ||
| Paul B. Bowman |
53 | Senior Vice President, Chief Financial Officer and Secretary | ||
| Karen K. McGinnis |
43 | Vice President, Corporate Controller and Chief Accounting Officer |
Robert P. Akins, co-founder, has served as our chairman and chief executive officer since our inception in 1986. He currently serves on the board of directors of KLA-Tencor Corporation and Semiconductor Equipment and Materials International (SEMI). He is also a member of the council of advisors to the Irwin and Joan Jacobs School of Engineering at the University of California, San Diego (“UCSD”), and serves on the board of the UCSD Foundation. Mr. Akins received the SEMI North America Award for contributions to the field of DUV lithography, the outstanding alumnus award from UCSD, and the 2007 William W. Otterson Award, which is awarded to the San Diego company whose products have demonstrated the most significant positive impact on society. Mr. Akins received a bachelor’s degree in physics and literature, and a doctorate in applied physics from UCSD.
Edward J. Brown, Jr. has served as our president and chief operating officer since his appointment in September 2005. From 1984 to 2005, Mr. Brown was employed at Applied Materials, Inc. where he held numerous high-level management positions including group vice president and senior advisor to the president, vice president and general manager of the Intel business unit, as well as managing director heading up their largest product division, global operations. Mr. Brown received a master’s degree in business administration from National University and a bachelor’s degree in industrial studies from San Diego State University.
Paul B. Bowman has served as our senior vice president, chief financial officer and secretary since his appointment in October 2009. From December 2008 until his appointment as chief financial officer in October 2009, he served as our interim chief financial officer, treasurer and secretary. From May 2008 until December 2008, Mr. Bowman served as our vice president of investor relations. Prior to joining us, Mr. Bowman served as chief financial officer of American Mold Guard, Inc. from April 2006 to April 2008. From 1996 to April 2006, Mr. Bowman was employed at Applied Materials, Inc., holding positions as the managing director of investor relations, managing director of finance for worldwide manufacturing and controller of the worldwide service division. Mr. Bowman received a bachelor’s degree in finance from Shippensburg State University.
Karen K. McGinnis joined us in November 2009 and serves as vice president, corporate controller, and chief accounting officer. Prior to joining us, Ms. McGinnis was employed by Insight Enterprises, Inc., a Fortune 500 global provider of information technology hardware, software and services as chief accounting officer from September 2006 until March 2009 and as senior vice president of finance from 2001 through September 2006. Ms. McGinnis is a certified public accountant and received her bachelor’s degree in accounting from the University of Oklahoma.
Executive officers serve at the discretion of the board of directors. There are no family relationships between any of the directors and our executive officers.
11
Table of Contents
| Item 1A. | Risk Factors |
The risks described below may not be the only risks we face. Additional risks that we do not currently believe are material may also impair our business operations. If any of the events or circumstances described in the following risks occur, our business, operating results, financial condition and cash flows could suffer, and the trading price of our common stock and our market capitalization could decline.
Our revenues and operating results from quarter to quarter and year to year have varied in the past and our future operating results may continue to fluctuate significantly.
Factors that contribute to fluctuations in our revenues and operating results include:
| • | cyclicality in the market for semiconductor manufacturing equipment; |
| • | rates at which our chipmaker customers take delivery of photolithography tools from our lithography tool manufacturer customers; |
| • | rates at which lithography tool manufacturer customers take delivery of light source systems from us; |
| • | timing and size of orders from our customers; |
| • | the ability of our customers to pay for products purchased from us; |
| • | our abilities to manage customer satisfaction and product reliability, and to provide effective field support to our customers; |
| • | changing or adverse global economic conditions, including their potential effects on our customers, suppliers, ability to sell products, and investments, and on energy prices, inflation, deflation, recession, unemployment, consumer confidence and demand, turmoil in the credit markets and financial services industry, and credit availability; |
| • | global demand for semiconductors in general and, in particular, for leading edge devices with smaller circuit geometries; |
| • | improved or reduced market penetration by our competitors; |
| • | demand for reduced product lead time from our customers; |
| • | the mix of light source models, and the level of installed base products revenues in our total revenues; |
| • | changes in the price and profitability of our products; |
| • | our ability to develop and implement new technologies and introduce new products that meet our customers’ needs; |
| • | research and development costs incurred to develop new technologies; |
| • | utilization rates of light sources by our chipmaker customers and pulse usage which affect our installed base products revenues and costs; |
| • | variability in amount and timing of parts replacement costs under our OnPulse contracts; |
| • | demand for TCZ’s production tool for LTPS processing in the manufacture of flat panel displays; |
| • | global demand for flat panel displays in general and, in particular, for OLED displays; |
| • | our ability to manage our manufacturing and inventory requirements, including our inventory levels and controls at our widely dispersed operations; |
| • | the financial condition of our suppliers which, if negative, could affect their ability to supply us with the parts that we need to manufacture our products; |
12
Table of Contents
| • | foreign currency exchange rate fluctuations and possible protectionist measures in the countries in which we do business; |
| • | our investments in marketable securities; |
| • | changes in our effective tax rate; |
| • | worldwide political instability; |
| • | intellectual property protection; and |
| • | potential impairments to our goodwill or long-lived assets. |
Prior to 2007, we derived the majority of our revenues from selling light source systems used in semiconductor manufacturing. In 2007, 2008 and 2009, our light source systems revenue represented 47%, 34% and 22% of total revenue, respectively. We expect that light source system revenue will continue to represent less than half of our total revenue due to higher growth rates in revenue associated with our installed base products. In recent years, chipmakers have been controlling the number of new tools they need to purchase by improving their manufacturing efficiency, utilization and repurposing of existing tools. For those reasons, we anticipate ongoing increases in utilization rates of our growing installed base. As our installed base of light source systems grows, the product revenues generated by the operation of these light sources have a significant effect on our business operations. The revenues from the operation of our installed base of light source systems depend on the rate at which our customers use these light source systems. Our operating results for a particular period may be adversely affected if our customers reduce usage rates, or change their buying patterns, or if we incur higher parts replacement costs.
Because we sell a limited number of light source system products, the precise timing for recognizing revenue from an order may have a significant effect on our total revenue for a particular period. As is the practice in our industry, our customers may cancel or reschedule orders with little or no penalty. Orders expected in one quarter could shift to another period due to changes in the anticipated timing of our customers’ purchase decisions or rescheduled delivery dates requested by our customers. Our operating results for a particular quarter or year may be adversely affected if our customers cancel or reschedule orders, or if we cannot fill orders in time due to unexpected delays in manufacturing, testing, shipping, or product acceptance. Our light source systems used in a production environment generate product revenues based on system usage, which may also vary period to period. Additionally, accounting guidance may require us to defer revenue associated with contracts that contain multiple deliverables.
We manage our expense levels based, in large part, on expected future revenues. As a result, if our actual revenue decreases below the level we expect, or we are not successful in aligning our manufacturing cost structure with decreasing production levels, our operating results will be adversely affected. As a result of these or other factors, we could fail to achieve our expectations as to future revenue, gross profit and gross margin, operating income, net income, earnings per share, and cash flows. Our failure to meet the performance expectations set and published by external sources could result in a sudden and significant drop in the price of our stock, particularly on a short- term basis, and could negatively affect the value of any investment in our stock.
Our business depends on the semiconductor and the semiconductor capital equipment industries, which are volatile and unpredictable.
We derive the majority of our revenues from our lithography tool manufacturer customers who, as original equipment manufacturers (“OEMs”), incorporate our light source systems in photolithography tools that they sell to semiconductor manufacturers, or chipmakers, and from our chipmaker customers who purchase installed base products directly from us in support of their light source systems. Like us, our OEM customers depend on market demand for their products from the chipmakers who supply the many products using semiconductors. This market demand can be volatile and unpredictable and can affect our ability to accurately predict future revenue
13
Table of Contents
and, therefore, our ability to manage our future expense levels. When cyclical fluctuations result in lower than expected revenue levels, operating results may be adversely affected and cost reduction actions may be necessary in order for us to remain competitive and financially stable. During a down cycle or slowdown, we must adjust our cost and expense structure to prevailing market conditions while maintaining our longer term strategies and motivating and retaining our key employees. In contrast, during periods of rapid growth, we must quickly increase manufacturing capacity and personnel to meet our customers’ needs. We can provide no assurance that these objectives can be met in a timely manner in response to industry cycles. We are not able to predict with any certainty the duration of any industry cycle or the timing or order of magnitude of any recovery from a down cycle or slowdown.
Downturns in the semiconductor industry often result in decreases in demand for semiconductor manufacturing equipment, including the photolithography tools that our OEM customers produce. Downturns in the semiconductor industry have generally had severe effects on the demand for semiconductor manufacturing equipment and to a lesser extent, the associated installed base products. Fluctuating levels of investment by chipmakers and resulting pricing volatility will continue to materially affect our aggregate bookings, revenues and operating results. Even during periods of reduced revenues, we believe we must continue to invest in research and development and maintain extensive ongoing worldwide customer support capabilities to meet our customers’ needs and to remain competitive. Continued spending to further these objectives may temporarily harm our financial results. Semiconductor industry downturns and slowdowns will likely continue to adversely affect our business, financial condition and operating results.
Market conditions in the semiconductor industry and our OEM customers’ production efficiency can cause them to expand or reduce their orders for new light source systems as they try to manage their inventories and production requirements. We continue to work closely with our OEM customers to better understand these issues. However, we cannot guarantee that we will be successful in understanding our OEM customers’ inventory management or production requirements or that our OEM customers will not build up an excess inventory of light source systems. If our OEM customers retain an excess inventory of light source systems, our revenue could be reduced in future periods as the excess inventory is utilized, which could adversely affect our operating results, financial condition and cash flows. If our OEM customers demand shorter product lead times to improve their inventory and cash positions, our inventory management and cash position may be negatively affected, which may adversely affect our operating results, financial condition and cash flows.
A significant percentage of our revenue is derived from sales to a limited number of customers, and if we are not able to retain these customers, or they reschedule, reduce or cancel orders, or delay or default on payments, we may experience material adverse effects on our operating results, financial condition and cash flows.
Two large companies, ASML and Nikon, dominate the photolithography tool business. ASML, Nikon and Samsung, one of our chipmaker customers that purchase our installed base products, accounted for the following percentages of our revenues during the periods indicated:
| Years Ended December 31, | |||||||||
| 2009 | 2008 | 2007 | |||||||
| ASML |
15 | % | 22 | % | 33 | % | |||
| Nikon |
18 | % | 20 | % | 19 | % | |||
| Samsung |
13 | % | 10 | % | 7 | % | |||
| 46 | % | 52 | % | 59 | % | ||||
14
Table of Contents
We expect that sales to these customers will continue to account for a substantial portion of our revenue in the foreseeable future. None of our customers are obligated to purchase a minimum number of our products in the aggregate or during any particular period. We can provide no assurance that any of our customers will continue to purchase our products at past or current levels. Sales to any of these customers may be affected by many factors, some of which are beyond our control. These factors include:
| • | changes in global economic or market conditions affecting the semiconductor or the photolithography tool industries; |
| • | a change in a customer’s competitive position in its industry; |
| • | a customer experiencing production problems; |
| • | a decision to purchase light sources or related products from other suppliers; |
| • | a change in a customer’s production or utilization rate; and |
| • | a decline in a customer’s financial condition. |
These companies accounted for the following percentages of our total accounts receivable at the dates indicated:
| December 31, | ||||||
| 2009 | 2008 | |||||
| ASML |
14 | % | 32 | % | ||
| Nikon |
12 | % | 23 | % | ||
| Samsung |
6 | % | 4 | % | ||
| 32 | % | 59 | % | |||
Although our overall risk is greater due to the downturn in the global economy, we believe there is limited credit risk exposure for us with these companies who continue to demonstrate sound creditworthiness. However, our ability to generate future revenue and collect accounts receivable from them is dependent on their ongoing financial condition and liquidity.
The loss of any significant business from, or production problems for, any one of these customers may have a material adverse effect on our operating results, financial condition and cash flows.
Our revenue is derived from the sale of our light source systems and of products in support of the installed base of light source systems being used in production.
We expect sales of our excimer light source systems, including KrF and ArF systems, and the products in support of the installed base of light source systems to continue to account for a majority of our revenues in the near term. Continued market acceptance of our light source systems and installed base products is, therefore, critical to our future success. The rate at which chipmakers adopt excimer light sources may vary, for reasons including:
| • | performance of ArF immersion-specific resists; |
| • | potential shortages of specialized materials used in DUV optics; |
| • | the productivity of double-patterning ArF lithography tools; |
| • | consolidation of chipmakers; and |
| • | the level of demand for chips with ever-smaller feature sizes. |
15
Table of Contents
We cannot guarantee that these factors can or will be overcome or that the demand for our excimer light source systems and installed base products will not be materially reduced. The demand for our light source systems and installed base products, and therefore our operating results, financial condition and cash flows could be adversely affected by a number of factors, including:
| • | a decline in demand for our customers’ DUV photolithography tools; |
| • | a failure to achieve continued market acceptance of our products; |
| • | a failure to manage customer satisfaction, product reliability, or maintain the effectiveness of direct field support; |
| • | a failure to release enhanced versions of our products on a timely basis; |
| • | a decline in chipmaker light source utilization rates or retirement of light sources in our installed base; |
| • | a deterioration in global economic conditions; |
| • | the introduction of one or more improved versions of products by a competitor in the market in which we participate; and |
| • | technological changes that we are unable to address with our products. |
Global economic conditions could affect our revenues and operating results.
We cannot predict either the depth or the duration of an economic downturn or the speed and sustainability of an economic recovery in the United States or other key global markets. A general weakening of, or declining corporate or consumer confidence in, the global economy, or a reduction in corporate or consumer spending, could delay or significantly decrease purchases of our products by our customers, which are driven in part by indirect consumer demand for the electronic devices that contain semiconductor chips. It could also decrease revenues from our installed base products by causing our chipmaker customers to reduce their usage rates. Our revenues and operating results will be affected by uncertain or changing economic and market conditions including inflation, deflation, prolonged weak consumer demand or other changes which may affect the principal markets in which we conduct business. If economic or market conditions in the United States or other key global markets deteriorate, we may experience material adverse effects on our business, operating results, financial condition and cash flows.
Adverse economic and market conditions could also harm our business by negatively affecting the parties with whom we do business, including our business partners, our customers and our suppliers. These conditions could impair the ability of our customers to pay for products they have purchased from us. As a result, allowances for doubtful accounts and write-offs of accounts receivable from our customers may increase. In addition, our suppliers may experience financial difficulties that could negatively affect their operations and their ability to supply us with the parts we need to manufacture our products.
We depend on a few key suppliers for purchasing components and subassemblies that are included in our products.
We purchase a limited number of components and subassemblies included in our light source systems and installed base products from a single supplier or a small group of suppliers. For certain optical, control system and pulse power components and subassemblies used in our light source systems and installed base products, we currently utilize a single supplier. To reduce the risk associated with this single supplier, we have supply agreements in place and carry a strategic inventory of these components. Strategic inventories are managed as a percentage of future demand. We also have vendor-managed inventory of critical components to further reduce the risk of a single supplier. In addition, we contract for the manufacture of various subassemblies of our products and depend on our contract manufacturers to deliver to our required specifications, schedule, and quality standards. Further, some of our suppliers have specialized in supplying equipment or manufacturing
16
Table of Contents
services to semiconductor equipment manufacturers and, therefore, are susceptible to industry fluctuations and subject to the same risks and uncertainties regarding their ability to respond to changing market and global economic conditions.
Because many of these suppliers reduce their workforce in an industry downturn and rehire in an upturn, they may not be able to meet our requirements or respond quickly enough as an upturn begins and gains momentum. Due to the nature of our product development requirements, these key suppliers must rapidly advance their own technologies and production capabilities in order to support the introduction schedule of our new products. These suppliers may not be able to provide new modules and subassemblies when they are needed to satisfy our manufacturing and delivery schedules. These suppliers may also be adversely affected by economic conditions, which could result in a lack of available capital and limit their ability to access such capital, if needed, to fund their operations. In addition, if we cannot purchase enough of these materials, components or subassemblies, or if these items do not meet our quality standards, there could be delays or reductions in our product shipments, which may have a material adverse effect on our business, operating results, financial condition and cash flows.
We depend on the introduction of new products for our success, and we are subject to risks associated with rapid technological change.
Rapid technological changes in semiconductor manufacturing processes subject us to increased pressure to develop technological advances which enable such processes. We believe that our future success depends in part upon our ability to develop, manufacture, and support new light source products with improved capabilities on a timely basis and to continue to enhance our existing light source systems and process capabilities. Due to the risks inherent in transitioning to new products, we must forecast accurate demand for new products while managing the transition from established products. After our chipmaker customers have built their capacity to levels appropriate to meet existing demand, their demand for our light source products will depend, in part, on their sales forecasts, their estimates regarding the duration and magnitude of the current industry cycle and whether their projected manufacturing process yields will enable ongoing investments at a suitable level of capacity.
To provide our customers with more productive and lower cost of operation systems, our existing light source products and their process capabilities must be enhanced, and we must develop and manufacture new products to serve other semiconductor applications and to continue to grow our business. We cannot guarantee that we will be able to manage our business growth effectively. We may not be able to develop and introduce new products or enhancements to our existing products and processes in a timely or cost effective manner that satisfies customer needs or achieves market acceptance. Development of new products and enhancements to existing products represent significant investments of our resources, and there is no guarantee that we will realize a return on these investments. Further, we may not be able to effectively integrate new products and applications into our current operations. Any of these risks could have a material adverse effect on our operating results, financial condition and cash flows.
We are currently developing EUV source technology for chip manufacturing. In the third quarter of 2009, we shipped the first prototype EUV source to ASML. We are currently integrating and testing the prototype source into an ASML EUV lithography scanner. If we are not able to meet customer specifications, or have reliability or quality problems, or if follow on pilot and eventually commercial systems are not introduced on time, we may experience reduced orders, higher manufacturing costs, delays in acceptance of and payment for new products, and additional service and warranty expenses. Any of these risks could have a material adverse effect on our operating results, financial condition and cash flows.
Current technologies which are still being commercialized, such as EUV, and future technologies such as nano-imprint lithography, and certain maskless lithography techniques may render our KrF and ArF excimer light source products obsolete. We must manage product transitions, as the introduction of new products could have a negative adverse affect our sales of existing products.
17
Table of Contents
TCZ could fail to penetrate the flat panel display market and may not achieve profitability.
Effective January 15, 2010, we acquired full ownership of TCZ. The manufacture of flat panel displays is a new market for us and involves numerous risks. TCZ has shipped, installed and is currently testing its first production system for flat panel display fabrication. If this system does not meet customer specifications or the customer decides not to place follow-on orders for additional systems, there is no guarantee that TCZ will be able to materially penetrate this market or ever achieve profitability. To the extent TCZ is unable to achieve profitability, or we are obligated to provide increasing financial resources to support TCZ’s operations, our business, operating results, financial condition and cash flows could be materially adversely affected.
We face competition from one company in the photolithography tool market and may face competition from additional competitors who enter the market.
Our future performance depends, in part, upon our ability to continue to compete successfully worldwide. The principal elements of competition in our markets are the technical performance characteristics of light source products and the operating efficiency of the system, which is based on availability, reliability, performance efficiency, cost of ownership, and overall quality.
We currently have one competitor, Gigaphoton, that sells light sources for DUV photolithography applications. Gigaphoton is a joint venture between two large companies, Komatsu and Ushio, and is headquartered in Japan. Our customers have purchased products from Gigaphoton and have qualified Gigaphoton’s light sources for use with their products. Additionally, Gigaphoton has been qualified by a number of chipmakers in Europe, Japan, other regions in Asia, and the U.S., and has an installed base of light sources at chipmakers in these regions.
Future competitors may develop systems and products that are competitive to our products. This competition may affect our ability to sell our products. Larger companies with substantially greater resources, such as other manufacturers of industrial light sources for advanced lithography, may attempt to sell competitive products to our customers. Potential competitors may also be attracted to our growing installed base of light sources which represents a significant revenue stream for us, and they may attempt to supply replacement parts to our customer base. If any existing or future competitors gain market acceptance, we could lose market share and our growth could slow or decline, which could have a material adverse effect on our business, operating results, financial condition and cash flows.
We must effectively manage changes in our business.
In order to respond to the business cycles of the semiconductor industry and overall economic conditions, we must constantly adjust our plans and cost structure. As the semiconductor equipment industry cycle moves between contraction and growth and the condition of the global economy changes, we need to:
| • | quickly adapt to changing sales and marketing channels; |
| • | effectively manage our inventory levels; |
| • | closely manage our global operations and cost structure; |
| • | attract, train, retain and motivate key personnel; |
| • | improve our product reliability through quality control, order fulfillment and customer support capabilities; and |
| • | improve our processes and other internal management systems. |
If we fail to effectively manage changes in our business, we may experience a material adverse effect on our operating results, financial condition and cash flows.
18
Table of Contents
Any failure to manage our inventory levels, particularly during adverse economic conditions, and our inventory controls at our widely dispersed operations could adversely affect our business, operating results, financial condition and cash flows.
We need to continually evaluate and monitor the adequacy of our inventory levels. We also need to closely manage the levels of obsolete and excess parts. We have inventory located at warehouses at our corporate office in the United States and at bonded warehouses near our subsidiaries in Korea, Taiwan and Europe. The success of our business depends to a significant degree on our ability to maintain or increase the sales of our products in the markets in which we do business. If we misjudge the market or demand for our products or the overall condition of the global economy, our revenues may decline significantly, which could result in excess inventory levels and unnecessary use of cash. As a result of such excess inventory, we may be required to significantly write down the value of our inventory, which would negatively affect our operating results and financial condition.
We also need to continually evaluate the risk of loss of inventory in bonded warehouses. We could also sustain a loss in the event of a catastrophe in any of the locations where we maintain our inventory or if the warehouse company’s insurance is inadequate to cover such losses. We will be required to continually analyze the sufficiency of our inventory distribution systems in order to support our operations. We may not adequately anticipate all of the changing demands that will be imposed on these systems. An inability or failure to update our internal inventory distribution systems or procedures, as required, could have a material adverse effect on our business, operating results and financial condition.
International operations expose us to foreign currency exchange rate fluctuations for all foreign currencies in which we do business, and we may be materially adversely affected by these fluctuations.
We have international subsidiaries that operate in foreign currencies. All of our international subsidiaries purchase inventory in U.S. Dollars from either our manufacturing facility in San Diego or from our Korean subsidiary and, in many cases, resell these products to their customers in their local currency. In addition, our TCZ subsidiary purchases certain inventory in Euros. We hedge the foreign currency risks associated with these intercompany transactions by entering into forward contracts. Although we enter into such forward contracts, they may not be adequate to eliminate the risk of foreign currency exchange rate exposures.
Prior to 2009, our hedging program only managed our exposure to the Japanese Yen. In the first quarter of 2009, we expanded our hedging program to include the Korean Won, the Euro and the Taiwanese Dollar due to growth in our exposure to these currencies driven primarily by increased intercompany payable balances of our international subsidiaries denominated in U.S. Dollars. These increased intercompany payable balances resulted from our initiative to better serve customers by providing faster replacement parts availability, which caused increased inventory levels at our international subsidiaries.
In addition to expanding our foreign currency hedging program, we have moved some of the inventory previously held by our international subsidiaries into bonded warehouses in Korea, Taiwan and Europe that are controlled by our corporate office. Moving inventory into these bonded warehouses returned title of the inventory to our corporate office in San Diego, which reduced the intercompany payable balances denominated in U.S. Dollars of our international subsidiaries. As a result, this decreased our foreign currency exposures in these locations and reduced the level of hedges required.
We have taken steps to mitigate our foreign currency exchange risks; however, these steps may fail to sufficiently hedge or otherwise manage our foreign currency risks properly and could have a material adverse effect on our operating results and financial condition.
International operations also expose us to currency fluctuations as we translate the financial statements of our international subsidiaries to U.S. Dollars.
19
Table of Contents
Failure to effectively maintain our direct service support operations could have a material adverse effect on our business.
We believe it is critical for us to provide quick and responsive support directly to our chipmaker and direct customers who use our light source products in their photolithography systems. It is also essential to have well trained field service engineers to provide the high level of support that our customers have come to expect. Accordingly, we have an ongoing effort to develop our direct support system with service locations in Europe, Korea, Japan, China, Singapore, Taiwan and the U.S. This requires us to do the following:
| • | recruit and train qualified support service personnel; and |
| • | maintain effective and highly trained resources who can provide support to our customers in various countries. |
We may not be able to attract and train qualified personnel to maintain our direct support operations successfully. Further, we may incur significant costs in providing this support. Failure to implement our direct support operation effectively could harm our operating results, financial condition and cash flows.
We are dependent on our suppliers and manufacturing facilities to assemble and test our products.
Operations at our primary manufacturing facility in San Diego and our refurbishment facility in Korea and operations at our suppliers are subject to disruption for a variety of reasons, including work stoppages, terrorism, fire, earthquake, energy shortages, flooding or other natural disasters. Such disruptions could cause delays in shipments of our products to our customers. Our San Diego facility, where we build our light source systems and replacement parts, poses the greatest risk. We provide no assurance that alternate production capacity would be available if a major disruption were to occur or that, if it were available, it could be obtained on favorable terms, or at all. Such disruption could result in cancellation of orders or loss of customers, which would have a material adverse effect on our operating results, financial condition and cash flows.
We depend on key personnel, particularly management and technical personnel, who may be difficult to attract and retain.
We are highly dependent on the services of many key employees in various areas, including:
| • | research and development; |
| • | engineering; |
| • | sales and marketing; |
| • | direct service support; |
| • | manufacturing; and |
| • | management or leadership roles. |
In particular, there are a limited number of experts in excimer light source technology, and we require highly skilled hardware and software engineers. Competition for qualified personnel is intense and we cannot guarantee that we will be able to continue to attract and retain qualified personnel. We believe that our future growth and operating results will depend on:
| • | the continued services of our research and development, engineering, sales and marketing, direct service support, manufacturing, and management personnel; |
| • | our ability to attract, train and retain highly-skilled key personnel, particularly in periods following reductions in our workforce, and uncertainty regarding the outlook for our business; and |
| • | the ability of key management to continue to expand, motivate and manage our employee base. |
20
Table of Contents
Stock option grants may not be viewed by key employees as a financial incentive during periods when stock price volatility could cause our stock price to fall below the option’s exercise price, reducing the effectiveness of stock options as a means to retain and incentivize these employees. Grants to our key employees have an exercise price per share at least equal to the fair market value of our common stock on the date of grant.
If we are unable to hire, train and retain key personnel as required, our operating results, financial condition and cash flows could be adversely affected.
Economic, political, regulatory and other events in geographic areas where we have significant revenue or operations could interfere with our business.
We serve a global market and a large portion of our revenue is derived from customers outside of the U.S. We expect our international sales to continue to account for the majority of our total revenues. In order to support our foreign customers, we maintain a refurbishment facility in Korea as well as field support facilities in Japan, the Netherlands, China, Singapore and Taiwan.
We may not be able to manage our operations to address and support our global customers effectively. Further, our investments in these types of activities may not be viably competitive in the global market, or we may not be able to meet the support or manufacturing levels required by our global customers. Additionally, we are subject to risks inherent in doing business globally, including but not limited to:
| • | fluctuations in exchange rates and currency controls; |
| • | political and economic conditions and instability, including economic turmoil in many parts of the world; |
| • | imposition of trade barriers and restrictions, such as the Foreign Corrupt Practices Act, including changes in tariff and freight rates, foreign customs and duties; |
| • | difficulty in coordinating our management and operations in different countries; |
| • | difficulties in staffing and managing foreign subsidiary and branch operations; |
| • | limited intellectual property protection in some countries; |
| • | potentially adverse tax consequences in some countries; |
| • | the possibility of challenging accounts receivable collections; |
| • | in Asia, the risk of business interruption and damage from earthquakes or tsunamis; |
| • | the effect of acts of terrorism and war; |
| • | the burdens of complying with foreign laws, including regulatory structures and unexpected changes in regulatory environments; and |
| • | distribution costs, disruptions in shipping or reduced availability of freight transportation. |
A significant portion of our customers are located in Asia. Political turmoil, economic problems and currency fluctuations affecting Asia could increase our risk in that region. It has not been difficult for us to comply with U.S. export controls; however changes to these controls in the future could make it more difficult or impossible for us to export our products to many countries. There are certain risks for which we do not purchase insurance, including earthquake risk. Any of these vulnerabilities could have a material adverse effect on our business, operating results, financial condition and cash flows. Currently, none of our U.S. or international employees are members of a labor union; however if such employees decide to join a union, our cost of doing business could increase, and we could experience contract delays, difficulty in adapting to a changing regulatory and economic environment, cultural conflicts between unionized and non-unionized employees, strikes and work stoppages, any of which could have a material adverse effect on our business, financial condition and operating results.
21
Table of Contents
Our ability to compete could be jeopardized if we are unable to protect our intellectual property rights. These types of claims could seriously harm our business or require us to incur significant costs.
We believe our success and ability to compete depend in part upon protecting our proprietary technology. We rely on a combination of patent, trade secret, copyright and trademark laws, nondisclosure and other contractual agreements and technical measures to protect our proprietary rights. We own and have numerous patents pending in the U.S. and various foreign countries covering certain aspects of technology related to light sources and piezoelectric techniques. These patents will expire at various times through 2027.
Our pending patent applications and any future applications might not be approved. Our patents may not provide us with a competitive advantage and may be successfully challenged by third parties. In addition, third parties’ patents might have an adverse effect on our ability to do business. Due to cost constraints, we do not seek international patent protection for all inventions that are covered by U.S. patents and patent applications. As a result, we do not have foreign patent protection for some of our inventions. Additionally, laws of some foreign countries in which our products are or may be developed, manufactured or sold, including various countries in Asia, may not protect our products or intellectual property rights to the same extent as do the laws of the U.S. Therefore, the likelihood of piracy of our technology and products is greater in these countries. Further, third parties might independently develop similar products, duplicate our products, or design around patents that are granted to us.
Other companies or persons may file or have filed patent applications that are similar or identical to ours. As a result, we may have to participate in appropriate proceedings in the courts or the patent offices to determine the priority of inventions. These proceedings may determine that these third-party patent applications have priority over our patent applications. Loss of priority in these interference proceedings could result in substantial cost to us and loss of rights.
We also rely on the following to protect our confidential information and our other intellectual property:
| • | trade secret protection; |
| • | employee nondisclosure agreements; |
| • | third-party nondisclosure agreements; and |
| • | other intellectual property protection methods. |
However, we may not be successful in protecting our confidential information or intellectual property, particularly our trade secrets, because third parties may:
| • | develop substantially the same proprietary information or techniques independently; |
| • | gain access to our trade secrets from unrelated third parties and/or without obligation of confidentiality; or |
| • | disclose our technology following expiration of their confidentiality obligation. |
We may be subject to patent litigation to enforce patents issued to us or defend ourselves against claimed infringement by our competitor or any other third party.
Third parties have notified us in the past, and may notify us in the future, that we are infringing their intellectual property rights. Also, we have notified third parties in the past, and may notify them in the future, that they may be infringing our intellectual property rights.
In the future, patent litigation may result due to a claim of infringement by our competitor or any other third party or may be necessary to enforce patents issued to us. Any such litigation could result in substantial cost to us and diversion from our primary business efforts, which would have an adverse effect on our business, financial
22
Table of Contents
condition and operating results. Furthermore, our customers and the end-users of our products might assert other claims for indemnification that arise from infringement claims against them. If these assertions are successful, it may have a material adverse effect on our business, operating results, financial condition and cash flows. Instead of litigation, or as a result thereof, we may seek a license from third parties to use their intellectual property. However, we may not be able to obtain a license. Alternatively, we may design around the third party’s intellectual property rights or we may challenge these claims in legal proceedings. Any adverse determination in a legal proceeding could result in one or more of the following:
| • | loss of our proprietary rights; |
| • | exposure to significant liabilities by other third parties; |
| • | a requirement that we get a license from third parties on terms that are not favorable to us or not available at all; or |
| • | an injunction that prohibits us from manufacturing or selling our products. |
Any of these actions could be costly and would divert the efforts and attention of our management and technical personnel, which could have a material adverse effect on our business, operating results, financial condition and cash flows.
Disputes may arise over the ownership of intellectual property resulting from our research and development activities that are partially funded by other parties.
Funds from research and development arrangements with third parties have been used to pay for a portion of our research and development costs associated with the design and development of specific products. Additionally, funds from lithography tool manufacturers and chipmaker customers have been used to fund a portion of our research and development efforts. In connection with providing these research and development services, we try to make contractually clear who owns the intellectual property that results from such activities. Disputes over the ownership or rights to use or market the resulting intellectual property could arise between the funding organizations and us. Any dispute over ownership of the intellectual property we develop could restrict our ability to market our products and have a material adverse effect on our business.
If our goodwill, definite lived intangible assets or our property, plant and equipment become impaired, we may be required to record a significant charge to earnings.
We review our amortizable intangible assets, which are primarily patents, and our property, plant and equipment, for impairment when events or changes in circumstances indicate that their carrying value may not be recoverable. Goodwill is also tested for impairment at least annually and more often if certain triggering events or circumstances occur. Factors that may be considered to be a change in circumstances that would indicate the carrying value of our goodwill, amortizable intangible assets or our property, plant and equipment may not be recoverable include reduced future cash flow estimates for our company, a decline in our stock price and market capitalization, slower growth rates in our industry and adverse global economic conditions. If, as a result of our impairment test, it is determined that our goodwill, amortizable intangible assets or property plant and equipment is impaired, we may be required to record a significant charge in our financial statements during the period in which such impairment is determined, which may have a material adverse affect on our operating results.
Our investments in marketable securities are subject to market, interest and credit risk that may reduce their value.
The value of our investments in marketable securities may be adversely affected by changes in interest rates, downgrades in the creditworthiness of bonds we hold, turmoil in the credit markets and financial services industry and by other factors which may result in other than temporary declines in the value of our investments. Each of these events may cause us to record charges to reduce the carrying value of our investment portfolio, which could have a material adverse effect on our operating results and financial position.
23
Table of Contents
Changes in our effective tax rate may have a material adverse effect on our operating results, financial position and cash flows.
Our future effective tax rate may be adversely affected by a number of factors including:
| • | changes in available tax credits, particularly the federal research and development tax credit, which expired at the end of 2009 and has yet to be reinstated for 2010 and later years; |
| • | the resolution of issues arising from tax audits with various tax authorities; |
| • | the jurisdictions in which profits are determined to be earned and taxed; |
| • | changes in the valuation of our deferred tax assets and liabilities; |
| • | adjustments to estimated taxes upon finalization of various tax returns; |
| • | increases in expenses not deductible for tax purposes; |
| • | changes in tax laws or the interpretation of such tax laws, such as the Internal Revenue Service (“IRS”) Code Section 199 manufacturing deduction which currently provides a tax benefit; and |
| • | the repatriation of non-U.S. earnings for which we have not previously provided for U.S. taxes. |
An adverse change in our future effective tax rate could in turn, adversely affect our operating results, financial position and cash flows.
We may not have sufficient cash to fund our current operations and future growth plans.
In February 2009, we paid approximately $143.2 million, including accrued interest, to redeem our outstanding convertible subordinated notes which had reached maturity. We believe that our cash resources remain sufficient for our planned operations; however, if global economic conditions deteriorate, our business conditions worsen, our plans change or other unanticipated events occur, we may need to raise additional cash through the establishment of financing facilities or the sale of equity or debt securities to fund our operations. Depending on market conditions, it could be difficult for us to raise the additional cash needed without incurring significant dilution of our existing stockholders or agreeing to significant restrictions on our ability to operate as currently planned. If we were unable to raise additional cash in such circumstances, we could be required to reduce costs further through the delay, reduction or curtailment of our operating plan, including further reductions in our global workforce or other cost reduction actions, any of which could have a material adverse effect on our operating results, financial condition or cash flows.
We may acquire a business or enter a new market that will involve numerous risks. We may not be able to address these risks successfully without substantial expense, delay or other operational and financial challenges.
The risks involved with mergers, acquisitions and joint ventures or entering a new market include the following:
| • | diversion of management’s attention and resources to integrate the new business opportunity; |
| • | failure to retain key personnel; |
| • | customer dissatisfaction or performance problems with the acquired company or new product in a new market; |
| • | costs associated with acquisitions and joint ventures and the integration of acquired operations; |
| • | costs associated with developing, marketing, introducing and supporting a new product in a new market; |
| • | failure to commercialize purchased technologies; |
24
Table of Contents
| • | ability of the acquired companies, joint ventures or new markets to meet their financial projections; |
| • | assumption of unknown liabilities or other unanticipated events or circumstances; and |
| • | compliance with the Sarbanes-Oxley Act of 2002, new SEC regulations, NASDAQ Stock Market rules and new accounting standards as they relate to the new company or joint venture. |
Mergers, acquisitions and joint ventures, as well as entry into new markets, are inherently subject to multiple significant risks, and the inability to effectively manage these risks could have a material adverse effect on our business. Further, any business that we acquire, any joint venture that we form or new market we may enter may not achieve anticipated revenues or operating results.
We may experience difficulties with our enterprise resource planning (“ERP”) system or other critical information systems that we use for the daily operations of our business. System failure or malfunction or loss of data contained in these information systems may result in disruption of our operations and result in our inability to process transactions, and this could adversely affect our financial results.
System failure, malfunction or loss of data which is housed in our critical information systems could disrupt our ability to timely and accurately process transactions and produce key financial reports, including information on our operating results, financial position and cash flows. Any disruptions or difficulties that may occur in connection with our ERP system or other critical systems could also adversely affect our ability to complete important business processes such as the evaluation of our internal controls and attestation activities pursuant to Section 404 of the Sarbanes-Oxley Act of 2002. We also regularly upgrade our information systems hardware and software to better meet the information requirements needed to effectively manage our business. If we encounter unforeseen problems with regard to our ERP system or other critical information systems, including those encountered during system upgrades, our business could be adversely affected.
Compliance with changing regulations and standards for accounting, corporate governance and public disclosure may result in additional expenses.
Changing laws, regulations and standards relating to corporate governance and public disclosure, including new SEC regulations, new NASDAQ Stock Market rules, new accounting requirements and the expected future requirement to transition to international financial reporting standards are creating uncertainty and additional complexities for companies such as ours. In particular, the Section 404 internal control evaluation requirements under the Sarbanes-Oxley Act of 2002 have added complexity and costs to our business and require a significant investment of our time and resources to complete each year. We take these requirements seriously and expect to continue to make every effort to ensure that we receive clean attestations on our internal controls each year from our outside auditors, but there is no guarantee that our efforts to do so will be successful. To maintain high standards of corporate governance and public disclosure, we intend to invest all reasonably necessary resources to comply with all other evolving standards. These investments may result in increased general and administrative expenses and a diversion of management time and attention from strategic revenue generating and cost management activities.
We are dependent on air transport to conduct our business and disruption of domestic and international air transport systems could adversely affect our business.
We depend on regular and reliable air transportation on a worldwide basis for many of our routine business functions. If civil aviation in the U.S. or abroad is disrupted by terrorist activities or security responses to the threat of terrorism, regulatory compliance issues or for any other reason, our business could be adversely affected in the following ways:
| • | supplies of raw materials and components for the manufacture of our products or our customers’ products may be disrupted; |
| • | we may not be able to deliver our products to our customers in a timely manner; |
25
Table of Contents
| • | we may not be able to provide timely service of or support for installed light sources for chipmakers; and |
| • | our sales and marketing efforts may be disrupted. |
We are subject to many standards and regulations of foreign governments and, even though we intend to comply, we may not always be in compliance with these rules, or we may be unable to design or redesign our products to comply with these rules.
Many foreign government standards and regulations apply to our products and these standards and regulations are frequently being amended. Although we intend to meet all foreign standards and regulations, our products may not comply with all of them. Further, it might not be cost effective for us to redesign our products to comply with these foreign government standards and regulations. Our inability to design products to fully comply with foreign standards, therefore, could have a material adverse effect on our business.
Our chipmaker customers’ prolonged use of our products in high volume production may not produce the results they desire and, as a result, our reputation and that of our customers who supply photolithography tools to the chipmakers could be damaged in the semiconductor industry.
Over time, our light source products may not meet our chipmaker customers’ production specifications or operating cost requirements after the light source has been used for a long period in high volume production. If any chipmaker cannot successfully achieve or sustain their volume production using our light sources, our reputation could be damaged with them and with lithography tool manufacturers. This would have a negative effect on our business.
Our operations are subject to environmental and other government regulations that may expose us to liabilities for noncompliance.
We are subject to federal, state and local regulations, such as regulations related to the environment, land use, public utility utilization and the fire code, in connection with the storage, handling, discharge and disposal of substances that we use in our manufacturing process and in our facilities. We believe that our activities comply with current government regulations that are applicable to our operations and current facilities. We may be required to purchase additional capital equipment or meet other requirements to comply with these government regulations in the future, if they change. Further, these government regulations may restrict us from expanding our operations. Adopting measures to comply with changes in the government regulations, our failure to comply with environmental and land use regulations, or restrictions on our ability to discharge hazardous substances, could subject us to future liability or cause our manufacturing operations to be reduced or stopped. This could have a material adverse effect on our business, operating results, financial condition and cash flows.
Our products are subject to potential product liability claims if personal injury or death results from their use.
We are exposed to significant risks for product liability claims if personal injury or death results from the use of our products. We may experience material product liability losses in the future. We maintain insurance against product liability claims; however, our insurance coverage may not continue to be available on terms that are acceptable to us. This insurance coverage also may not adequately cover liabilities that we incur. Further, if our products are defective, we may be required to recall or redesign these products. A successful claim against us that exceeds our insurance coverage level, or any claim or product recall that results in adverse publicity against us, could have a material adverse effect on our business, operating results, financial condition and cash flows.
Trademark infringement claims against our registered and unregistered trademarks would be expensive and we may have to stop using such trademarks and pay damages.
We have registered a number of trademarks including “CYMER” in the U.S. and in some other countries. We are also trying to register additional trademarks in the U.S. and in other countries. These registrations in other countries, or any new registrations we may undertake in the U.S., could be unsuccessful.
26
Table of Contents
We use these trademarks in the course of our business and in advertising materials, which are distributed throughout the world. While we take precautions against trademark infringement before using our trademarks in new markets, we may be subject to claims of trademark infringement. The process of negotiating a settlement or coexistence agreement to allow us to continue using our trademarks in a particular market could be expensive or distract us from our primary business efforts, potentially adversely affecting our financial condition or operations. Furthermore, if we must undertake negotiations, and the negotiations are ultimately unsuccessful, we would either need to discontinue using the trademarks in the new market, risk facing litigation or potentially pay damages. Even if we ultimately prevail, litigation could be expensive or distract us from our primary business efforts.
The price of our common stock has fluctuated and may continue to fluctuate widely.
The price of our common stock has historically been subject to significant fluctuations and could continue to fluctuate significantly in response to a variety of factors, including the risk factors contained in this report.
Various factors may significantly affect the market price and volatility of our common stock, including:
| • | the cyclical nature of the semiconductor industry; |
| • | actual or anticipated fluctuations in our operating results, including our net income, revenue and product gross margins; |
| • | conditions and trends in the light source device and other technology industries; |
| • | announcements of innovations in technology; |
| • | new products offered by us or our competitor; |
| • | developments of patents or proprietary rights; |
| • | changes in financial estimates by securities analysts; |
| • | global political, economic, and market conditions, including a recession or economic deterioration; and |
| • | failure to properly manage any single or combination of risk factors listed in this section. |
Stock markets in the United States can experience extraordinary volatility. Severe price fluctuations in a company’s stock have frequently been followed by securities litigation. If such litigation were initiated against us, it may result in substantial costs and a diversion of management’s attention and resources and, therefore, could have a material adverse effect on our business, operating results, financial condition and cash flows.
Some anti-takeover provisions contained in our articles of incorporation and bylaws, as well as provisions of Nevada law and our executive employment contracts, could impair a takeover attempt.
Our articles of incorporation and bylaws contain provisions which could have the effect (separately, or in combination) of rendering more difficult or discouraging a merger, acquisition or other change of control deemed undesirable by our Board of Directors. These include provisions:
| • | authorizing blank check preferred stock, which could be issued with voting, liquidation, dividend and other rights superior to our common stock; |
| • | limiting the liability of, and providing indemnification to, our directors and officers; |
| • | requiring advance notice of stockholder proposals for business to be conducted at meetings of our stockholders and for nominations of candidates for election to our Board of Directors; |
| • | controlling the procedures for conduct of stockholder meetings and election and removal of directors; and |
| • | specifying that stockholders may not take action by written consent. |
27
Table of Contents
These provisions, alone or together, could deter or delay hostile takeovers, proxy contests and changes in control or management.
As a Nevada corporation, we are subject to Nevada law. Nevada law does not grant stockholders the authority to call a special meeting unless the corporation’s articles of incorporation or bylaws otherwise provide; neither our articles of incorporation nor our bylaws contain such a provision. Nevada law may also limit the ability of certain stockholders to engage in certain business combinations with us and may limit the voting rights of stockholders who acquire 20% or more of our outstanding shares. Either limitation could discourage or increase the difficulty of an attempted merger, acquisition or other change of control.
Additionally, we have employment agreements with certain officers under which severance payments would become payable in the event of specified terminations without cause or terminations under certain circumstances after a change in control. If such persons were terminated without cause or under certain circumstances after a change of control, and the severance payments under the current employment agreements were to become payable, the officers would receive certain payments and other benefits which depend on the individual officer’s employment agreement but generally include continued base salary and health insurance payments for a period of time, lump sum bonus payments and accelerated vesting of equity awards.
Any provision of our articles of incorporation, bylaws, employment agreements or Nevada law that has the effect of delaying or deterring a change in control could limit the opportunity for our stockholders to receive a premium for their shares of our common stock in connection with such a transaction and also could affect the price that some investors are willing to pay for our common stock.
Sales of additional common stock and securities convertible into our common stock may dilute the voting power of current holders.
We may issue equity securities in the future the terms and rights of which are superior to those of our common stock. Our articles of incorporation authorize the issuance of up to 5,000,000 shares of preferred stock. These are “blank check” preferred shares, meaning that our Board of Directors is authorized, from time to time, to issue the shares and designate their voting, conversion and other rights, including rights superior, or preferential, to rights of already outstanding shares, all without stockholder consent. No preferred shares are outstanding, and we currently do not intend to issue any shares of preferred stock. Any shares of preferred stock that may be issued in the future could be given voting and conversion rights that could dilute the voting power and equity of existing holders of shares of common stock and have preferences over shares of common stock with respect to dividends and liquidation rights.
| Item 1B. | Unresolved Staff Comments |
None.
| Item 2. | Properties |
We conduct our operations in both owned and leased properties. Our corporate headquarters and primary manufacturing facilities, as well as a leased warehouse facility, are located in San Diego, California. We also own a manufacturing facility in Korea where we currently refurbish our discharge chamber assemblies for certain models of our light source systems. Additionally, we lease several domestic and international field service offices for our light source products business and an administrative and development facility in Singapore for TCZ. In 2009, we held leases for buildings we no longer occupied in San Diego, California, which were subleased to third parties. In January 2010, these San Diego, California leases and subleases expired and were not renewed. We believe that our facilities are adequate to meet the needs of our current business operations.
28
Table of Contents
At December 31, 2009, our principal leased and owned properties were as follows:
| Location |
Ownership/Lease Expiration |
Square Footage |
Primary Usage / Status | |||
| San Diego, California (1) |
Owned | 265,000 | Manufacturing and administrative offices | |||
| San Diego, California (1) |
Owned | 135,000 | Corporate headquarters, engineering, research and development facilities | |||
| San Diego, California (3) |
January 2010 | 108,290 | Facility subleased | |||
| San Diego, California (3) |
January 2010 | 61,300 | Facility subleased | |||
| San Diego, California (3) |
January 2010 | 36,959 | Facility subleased | |||
| San Diego, California |
April 2012 | 24,215 | Warehouse facility | |||
| Pyongtaek-city, Kyonggi, Korea (2) |
Owned | 26,000 | Manufacturing, sales and administrative | |||
| Motoyawata, Japan |
June 2010 | 13,831 | Field service and sales office | |||
| Hsin-Chu, Taiwan |
June 2011 | 7,963 | Field service and sales office | |||
| Singapore, Singapore |
September 2010 | 5,507 | TCZ headquarters | |||
| Pudong, Shanghai, China |
October 2010 | 4,746 | Field service and sales office | |||
| Singapore, Singapore |
June 2011 | 3,315 | Field service and sales office | |||
| Veldhoven, the Netherlands |
December 2013 | 2,605 | Field service and sales office |
| (1) | Building and land owned by us. |
| (2) | Building owned by us. Land leased through December 2020. |
| (3) | These leases were not renewed upon their expiration in January 2010. |
| Item 3. | Legal Proceedings |
None.
| Item 4. | Submission of Matters to a Vote of Security Holders |
None.
29
Table of Contents
PART II
| Item 5. | Market for Registrant’s Common Equity, Related Stockholder Matters and Issuer Purchases of Equity Securities. |
Market Information. Our common stock is publicly traded on the NASDAQ Global Select Market under the symbol “CYMI.” The following table sets forth, for the periods indicated, the high and low prices of our common stock as reported by the NASDAQ Global Select Market.
| 2009 | 2008 | |||||||||||
| High | Low | High | Low | |||||||||
| First quarter |
$ | 23.52 | $ | 16.66 | $ | 38.90 | $ | 24.33 | ||||
| Second quarter |
$ | 29.90 | $ | 21.64 | $ | 31.29 | $ | 22.86 | ||||
| Third quarter |
$ | 39.42 | $ | 27.30 | $ | 32.34 | $ | 24.70 | ||||
| Fourth quarter |
$ | 39.99 | $ | 32.00 | $ | 26.14 | $ | 18.36 | ||||
Registered Shareholders. On February 22, 2010, the closing sales price of our common stock on the NASDAQ Global Select Market was $32.94 and there were 194 registered holders of record as of that date.
Dividends. We have never declared or paid cash dividends on our common stock, and currently do not anticipate paying cash dividends in the future.
Securities Authorized for Issuance Under Equity Compensation Plans. The information required to be disclosed by Item 201(d) of Regulation S-K regarding our equity securities authorized for issuance under our equity incentive plans is incorporated herein by reference to the section entitled “Equity Compensation Plan Information” in our definitive Proxy Statement for our Annual Meeting of Stockholders to be held on May 20, 2010.
Issuer Purchases of Equity Securities. On April 21, 2008, we announced that our board of directors authorized us to repurchase up to $100 million of our common stock. The purchases have been made from time to time in the open market or in privately negotiated transactions. We did not repurchase any shares during 2009, and the approximate dollar value of remaining shares that we are authorized to purchase under the program was $77.1 million at December 31, 2009. The program does not have a fixed expiration date and may be discontinued at any time.
30
Table of Contents
Performance Measurement Comparison.
The following performance graph shows the total stockholder return of an investment of $100 in cash made on December 31, 2004 in each of (i) our common stock, (ii) a broad equity market index, the securities comprising the Nasdaq Composite Index, and (iii) a published industry or line of business index, the securities comprising the Philadelphia Semiconductor Index (the “PHLX Semiconductor Index”).
The performance graph assumes that $100 was invested on December 31, 2004 in our common stock at the closing price of $29.54 and in each index, and that all dividends were reinvested. No dividends have been declared nor paid on our common stock. The comparisons in the graph below are required by the SEC and are not intended to forecast or be indicative of possible future performance of our common stock.
COMPARISON OF 5 YEARS CUMULATIVE TOTAL RETURN *
Among Cymer, Inc., The NASDAQ Composite Index
And The PHLX Semiconductor Index
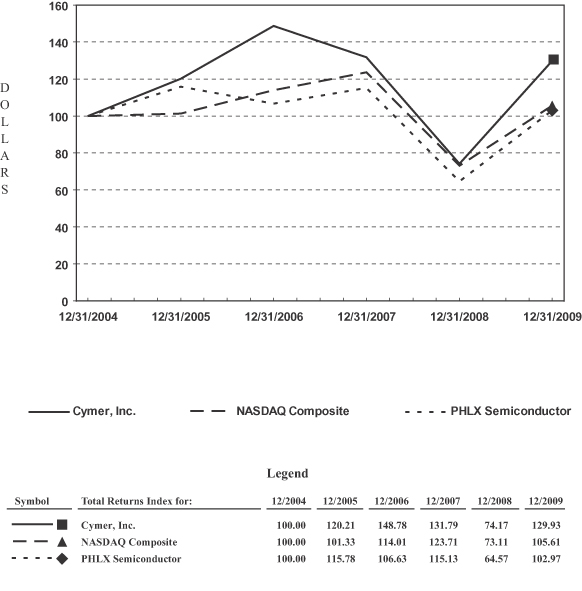
31
Table of Contents
| * | The material in this section is not “soliciting material” and is not deemed “filed” with the SEC. It is not to be incorporated by reference into any filing of Cymer, Inc. made under the Securities Act of 1933, as amended (the “Securities Act”), or the Exchange Act, whether made before or after the date hereof and irrespective of any general incorporation language in any such filing, except to the extent we specifically incorporate this section by reference. |
| Item 6. | Selected Financial Data |
The following selected consolidated financial data should be read in conjunction with “Management’s Discussion and Analysis of Financial Condition and Results of Operations” in Part II, Item 7 and our Consolidated Financial Statements in Part II, Item 8 of this report.
| Years Ended December 31, | ||||||||||||||||||||
| 2009 | 2008 | 2007 | 2006 | 2005 | ||||||||||||||||
| (in thousands, except per share data) | ||||||||||||||||||||
| Consolidated Statements of Operations Data: |
||||||||||||||||||||
| Revenues |
$ | 307,664 | $ | 459,010 | $ | 521,696 | $ | 543,855 | $ | 383,648 | ||||||||||
| Cost of revenues |
171,250 | 240,768 | 260,280 | 281,243 | 227,290 | |||||||||||||||
| Gross profit |
136,414 | 218,242 | 261,416 | 262,612 | 156,358 | |||||||||||||||
| Operating expenses: |
||||||||||||||||||||
| Research and development |
65,809 | 95,229 | 81,842 | 73,974 | 64,025 | |||||||||||||||
| Sales and marketing |
16,603 | 23,713 | 26,163 | 30,618 | 25,143 | |||||||||||||||
| General and administrative |
27,569 | 36,180 | 38,949 | 38,889 | 26,514 | |||||||||||||||
| Restructuring |
8,407 | 3,038 | — | — | — | |||||||||||||||
| Total operating expenses |
118,388 | 158,160 | 146,954 | 143,481 | 115,682 | |||||||||||||||
| Operating income |
18,026 | 60,082 | 114,462 | 119,131 | 40,676 | |||||||||||||||
| Other income (expense) |
(918 | ) | (9,818 | ) | 15,390 | 19,561 | 5,112 | |||||||||||||
| Income before income tax provision |
17,108 | 50,264 | 129,852 | 138,692 | 45,788 | |||||||||||||||
| Income tax provision |
8,389 | 16,587 | 44,413 | 46,137 | 262 | |||||||||||||||
| Net income |
8,719 | 33,677 | 85,439 | 92,555 | 45,526 | |||||||||||||||
| Net loss attributable to noncontrolling interest in subsidiary |
3,257 | 2,863 | 2,923 | 3,093 | 1,026 | |||||||||||||||
| Net income attributable to Cymer, Inc. |
$ | 11,976 | $ | 36,540 | $ | 88,362 | $ | 95,648 | $ | 46,552 | ||||||||||
| Basic earnings per share |
$ | 0.40 | $ | 1.22 | $ | 2.64 | $ | 2.53 | $ | 1.29 | ||||||||||
| Weighted average common shares outstanding—basic |
29,738 | 29,924 | 33,522 | 37,779 | 36,017 | |||||||||||||||
| Diluted earnings per share |
$ | 0.40 | $ | 1.22 | $ | 2.50 | $ | 2.40 | $ | 1.27 | ||||||||||
| Weighted average common shares outstanding—diluted |
29,945 | 29,992 | 36,784 | 41,397 | 36,544 | |||||||||||||||
| Consolidated Balance Sheet Data: |
||||||||||||||||||||
| Cash and cash equivalents |
$ | 118,381 | $ | 252,391 | $ | 305,707 | $ | 302,098 | $ | 233,745 | ||||||||||
| Working capital |
399,264 | 374,799 | 498,405 | 686,702 | 499,670 | |||||||||||||||
| Total assets |
664,918 | 777,444 | 794,152 | 949,094 | 791,376 | |||||||||||||||
| Total long-term liabilities |
19,657 | 30,238 | 181,440 | 155,503 | 151,304 | |||||||||||||||
| Treasury stock |
(473,580 | ) | (473,580 | ) | (450,704 | ) | (150,704 | ) | (50,000 | ) | ||||||||||
| Equity |
541,638 | 522,624 | 509,234 | 694,528 | 554,730 | |||||||||||||||
32
Table of Contents
| Item 7. | Management’s Discussion and Analysis of Financial Condition and Results of Operations |
The following discussion of our financial condition and results of operations should be read in conjunction with our Consolidated Financial Statements and notes thereto included in Part II, Item 8 of this report.
OVERVIEW
We derive a substantial portion of our revenues from lithography tool manufacturers and chipmakers; therefore, we are subject to the volatile and unpredictable cyclical nature of the semiconductor equipment industry. The semiconductor equipment industry historically has experienced ups and downs, some of them more pronounced than others. In the second half of 2008, global economic conditions deteriorated which negatively affected consumer spending on electronics and, as a result, the downturn in the semiconductor industry worsened significantly. Beginning in the fourth quarter of 2008 and continuing into 2009, we took various actions to reduce our cost structure, including reducing our worldwide workforce, salaries, bonuses, and other operating and capital expenditures. The economic trend continued through the first half of 2009. In the third quarter of 2009, we saw some strengthening of the global economy and the semiconductor industry and, due to our cost structure improvements and operational efficiencies, we were able to limit our losses to one quarter and generate positive earnings and operating cash flows for the full year 2009.
Our light source system shipments have historically tracked the semiconductor equipment cycle, while our installed base products and the associated revenue have scaled with utilization of our light sources in the field and the growth of our installed base of light source systems. As a result, for the full year 2009, our installed base products revenue was $238.7 million, or 78 percent of our total revenue. We also continued to make significant progress demonstrating the value of our OnPulse contracts, and we now have over 1,200 light sources globally under OnPulse coverage at the end of 2009.
In the third quarter of 2009, we shipped the industry’s first laser produced plasma EUV lithography prototype source system to ASML, and expect to record our first sale of an EUV pilot source system to ASML during 2010. Progress continues with our EUV source development and commercialization as we have several pilot units in assembly in our San Diego manufacturing facility. We plan to deliver these units to ASML in 2010, and we are focused on meeting ASML’s power and collector specifications and milestones. We are committed to successful EUV source development and commercialization, and we continue to make the necessary investment in support of this goal.
In the third quarter of 2009, TCZ shipped and installed its first laser crystallization system for the OLED flat panel display market at a large Korean display manufacturer. TCZ is working with this display maker to demonstrate the systems’ differentiated throughput and the superior uniformity of TCZ’s laser crystallization technology. In January 2010, we purchased Zeiss’s 40% ownership in TCZ, resulting in full ownership of TCZ by us. Zeiss will continue to provide TCZ relevant intellectual property licenses, ongoing research and development, and manufacturing of optical modules. The change in ownership does not affect the current TCZ product and services roadmaps.
In addition, 2009 marked the introduction and installation of the industry’s first field-selectable 60 to 90 watt immersion light source, the XLR600ix. Chipmaker light source investment was, and we expect will continue to be, focused on ArF immersion. We believe our immersion light source products are well positioned to support our direct lithography and chipmaker customers with our XLR platform, led by the XLR600ix.
We are proud of our quick return to operating profitability and positive operating cash flow generation in 2009. As we enter 2010, the outlook for our industry and our business is encouraging. Increased demand for consumer electronic products such as PCs, netbooks, smart phones, and solid state drives, is fueling the need for advanced semiconductors. This has resulted in improved DRAM prices, chipmaker profitability, and lower inventory levels, and is providing chipmakers with the confidence to make 45nm and below technology investments in immersion lithography. Our business environment is strengthening, and we view 2010 as a growth
33
Table of Contents
and investment year for the company. From a growth perspective, we expect increased chipmaker advanced ArF immersion lithography technology buys, combined with growing orders for KrF in support of capacity additions. We also expect chipmaker utilization to remain at or above fourth quarter 2009 levels for the foreseeable future, resulting in strong demand for installed base product support. From an investment perspective, we will continue to invest in our laser produced plasma EUV light source technology and commercialization, and we intend to work closely with leading OLED display makers on process development using TCZ’s laser crystallization system.
CRITICAL ACCOUNTING POLICIES AND ESTIMATES
General
The discussion and analysis of our financial condition and results of operations are based upon our consolidated financial statements, which have been prepared in accordance with accounting principles generally accepted in the United States of America. The preparation of these financial statements requires us to make estimates and use judgment that may impact the reported amounts of assets, liabilities, revenues, expenses, and related disclosure of contingent assets and liabilities. As a part of our ongoing internal processes, we regularly evaluate our estimates and judgments associated with revenue recognition, inventory valuation, warranty obligations, stock-based compensation, income taxes, allowances for doubtful accounts, long-lived assets valuation, goodwill valuation, assets and liabilities valuation, and contingencies and litigation. We base these estimates and judgments upon historical information, projected information, and other facts and assumptions that we believe to be valid and/or reasonable under the circumstances. These assumptions and facts form the basis for making judgments and estimates and for determining the carrying values of our assets and liabilities that are not apparent from other sources. Adverse global economic conditions, illiquid credit markets, volatile equity, foreign currency fluctuations and declines in consumer spending have increased the uncertainty inherent in such estimates and assumptions. As future events and their effects cannot be determined with precision, particularly those related to the condition of the economy, actual results could differ significantly from these estimates.
We believe that revenue recognition, inventory valuation, warranty obligations, stock-based compensation, allowance for doubtful accounts, long-lived assets valuation, and income taxes require more significant judgments and estimates in the preparation of our consolidated financial statements than do other of our accounting estimates and judgments.
Revenue Recognition
Our revenues include light source systems and installed base products, which consist of OnPulse contracts, service support and replacement parts, and to a lesser extent, training, service, upgrades, and refurbishments of our light source systems. We anticipate that our future revenues will also include sales of our EUV and TCZ systems and associated installed base products.
We recognize revenue when title and risk of loss have passed, evidence of an arrangement has been obtained, pricing is fixed or determinable at the date of sale, and collectibility is reasonably assured. Our sales arrangements do not include general rights of return or cancellation privileges.
Light Source Systems
We recognize light source system revenue at one of following three points, depending on the terms of our arrangement with our customer: 1) shipment of the light source system, 2) delivery of the light source system, or 3) receipt of an acceptance certificate from the customer. For the majority of our light source system sales, the shipping terms are F.O.B. shipping point, and revenue is recognized upon shipment.
On a limited basis, certain of our revenue arrangements include additional elements, such as future product upgrades or services. We adopted the revised authoritative guidance for revenue recognition arrangements with
34
Table of Contents
multiple deliverables during the fourth quarter of 2009, and retroactively applied the guidance to new or materially modified revenue arrangements entered into on or after January 1, 2009, in accordance with the early adoption rules. The guidance amends the criteria for separating consideration in multiple-deliverable arrangements, by establishing a revised hierarchy for determining the selling price of each deliverable. Under the new guidance, the selling price used for each deliverable is based on vendor-specific objective evidence if available, third-party evidence if vendor-specific objective evidence is not available, or estimated selling price if neither vendor-specific objective evidence nor third-party evidence is available. Under the prior guidance, elements could only be unbundled if vendor-specific objective evidence or third-party evidence of fair value was available for the undelivered elements. The revised guidance also eliminates the residual method of allocation and requires that arrangement consideration be allocated at the inception of the arrangement to all deliverables using the relative selling price method. The adoption of this guidance did not have an effect on our consolidated financial statements as all revenue recognized from multiple element arrangements during 2009 was computed using the relative fair value method as fair value existed for all elements within the arrangements. We have two arrangements that will require the use of an estimated selling price for certain of the elements within these arrangements, and all revenue has been deferred under both arrangements as the systems have not yet been accepted.
For arrangements that fall under the new multiple element guidance, we allocate consideration to the multiple elements using the relative selling price of the delivered and undelivered items, based on vendor specific objective evidence or estimated selling price, if vendor specific objective evidence is not available, as third party evidence is generally not available to us due to the proprietary nature of our products. Selling price is determined considering market conditions, estimated gross margins, as well as factors that are specific to us. For arrangements that fell under the prior multiple element guidance, we allocated consideration to the multiple elements using the relative fair value model if fair value (vendor specific objective evidence) existed for all elements in the arrangement. Alternatively, we applied the residual method of allocation if fair value (vendor specific objective evidence) only existed for the undelivered elements. If fair value did not exist for the undelivered elements, no revenue was recognized until such elements were delivered.
Through 2009, our light source system sales have been of our DUV light source systems only. We shipped our first EUV prototype source system to ASML in 2009, and expect to record our first sale of an EUV pilot source system to ASML during 2010.
Installed Base Products—OnPulse Contracts, Replacement Parts, and Service Support
Revenue associated with our OnPulse contracts, which include primarily replacement parts and to a much lesser extent services, is recognized monthly based on the number of pulses utilized by our customers on their laser source systems that are covered under their OnPulse arrangement. Revenue from service and training is recognized as the services are rendered. To date, the revenue associated with the service element of our OnPulse contracts when combined with our service revenue has been less than 10% of our total revenue.
For our replacement part sales, the shipping terms are F.O.B. shipping point, and revenue is recognized upon shipment. For a significant portion of our replacement parts revenue, our customers return the consumed assembly to us as part of the sale of the new part. We reuse some of the material within these core assemblies, mainly metal components, for the future build of core assemblies. As a result, our revenue consists of both cash and the fair value of the reusable parts received from our customers as consideration for these replacement part sales. Revenue associated with our customers’ return of core assemblies is recognized upon receipt of the returned core assembly. The amount of the revenue is determined based upon the fair value of the reusable parts that we expect to yield from the returned core assembly based on historical experience. If the return of the core assembly is related to a part being replaced under our warranty provisions or under a service or support contract with our customer, we will recognize the estimated fair value of the reusable component as a reduction to cost of revenue.
35
Table of Contents
On a limited basis, we sell upgrades for our light source systems or refurbish light source systems owned by our customers to their original or new condition. Revenue from upgrades is recognized when the upgrade has been successfully installed by us and accepted by the customer. Revenue from refurbished light source systems is recognized when the refurbishment process has been completed and, depending upon the customer, the proper delivery or acceptance terms have been met.
TCZ Products
The sale of our initial TCZ system includes installation services, training services and technical support services, which are expected to be delivered over discrete time periods. Revenue will be allocated to each deliverable in the transaction based on estimated selling prices. The initial TCZ sale also includes an acceptance provision, which had not been met as of December 31, 2009. Therefore, during 2009, we shipped one TCZ system, but did not recognize any revenue.
Deferred Revenue
Deferred revenue represents payments received from our customers in advance of the delivery of products and/or services, or before the satisfaction of all revenue recognition requirements as described above.
Inventory Valuation
Our inventories are recorded at the lower of cost, determined on a first-in, first-out basis, or estimated market value. Our inventories include raw materials, work-in-process, finished goods, and replacement and reusable parts, which we use in our refurbishment activities and our OnPulse arrangements.
As part of our regular business activities, we conduct parts refurbishment and material reclaim activities related to some of our core assemblies, particularly our chamber assemblies. These activities involve arrangements with our customers where we sell a new part to the customer at a reduced sales price if the customer returns the consumed core assembly that the new part replaces. The fair value of the reusable parts contained within the consumed assembly is recorded in inventory based upon historical data on the value of the reusable parts that we typically yield from a consumed core assembly.
Obsolete inventory, or inventory for which we do not have expected usage based on our forecasted demand, is written down to its estimated market value, if less than its cost. The methodologies used to analyze excess and obsolete inventory and determine the value of our inventory are significantly affected by future demand and usage of our products. There are many factors that could potentially affect the future demand or usage of our products, including the following:
| • | condition of the semiconductor industry, which is cyclical in nature; |
| • | rate at which our lithography tool manufacturers and chipmaker customers take delivery of our light source systems and our replacement parts; |
| • | loss of any of our major customers or a significant change in demand from any of these customers; |
| • | overall mix of light source system models or replacement parts and any changes to that mix required by our customers; |
| • | utilization rates of our light sources at chipmakers; |
| • | overall condition of the global economy which can positively or negatively impact the demand for our products; |
| • | customer acceptance of new products or discontinued use of our products; and |
| • | engineering change orders. |
36
Table of Contents
Based upon our experience, we believe that the estimates we use to calculate the value of our inventories are reasonable and properly reflect the risk of excess and obsolete inventory. During changing or adverse economic conditions, it is difficult to estimate the future demand for our products. As a result, the likelihood that the usage period for our inventory will substantially differ from our estimates is increased. If actual demand or the usage periods of our inventory are substantially different from our estimates, such differences may have a material adverse effect on our operating results and financial condition.
Warranty Obligations
We maintain an accrual for the estimated cost of product warranties associated with our sales of light source systems and replacement parts. Warranty costs include replacement parts and labor costs to repair our light source system products during the warranty period. At the time revenue is recognized for the sales of light source systems and replacement parts, we record a warranty provision in cost of revenues. The warranty coverage period is typically two years; however, the period and terms for light source systems and replacement parts can vary by light source system model. The warranty provision for our products is determined by using a statistical financial model, which takes into consideration actual historical expenses, product failure rates, and potential risks associated with our different products. This model is then used to estimate future warranty costs and the required warranty provision. The risk levels and historical cost data and failure rates used within this model are reviewed throughout the year and updated as these inputs change over the light source system product life cycle. Due to the highly technical nature of our light source system products, the newer model light sources and the modules contained within them have higher inherent warranty risks with their initial shipments and require higher warranty provisions until the technology becomes more mature.
We actively engage in product improvement programs and processes to limit our warranty costs; however, our warranty obligation is affected by the complexity of our product, product failure rates and costs incurred to correct those product failures at customer sites. The industry in which we operate is subject to rapid technological change, and as a result, we periodically introduce newer, more complex light source systems. Although we classify these newly released light source system models as having a higher risk in our warranty model resulting in higher warranty provisions, we are more likely to have differences between the estimated and actual warranty costs for these new light source system products. Warranty provisions for our older and more established light source system models are more predictable as more historical data is available on these products. If actual product failure rates or estimated costs to repair those product failures were to differ from our estimates, revisions to our estimated warranty provision would be required, which could have a material adverse affect on our operating results and financial condition.
Stock-Based Compensation
The fair value of stock-based compensation awards is measured on the grant date and is recognized as expense over the employee’s requisite service period. The fair value of the stock award is determined using the Black-Scholes option pricing model for stock options and the quoted price of our common stock on the grant date for restricted stock units. The Black-Scholes option pricing model requires the use of subjective assumptions including the expected term of the stock options and our expected stock price volatility over the expected term of the stock options. We use a combination of historical and implied volatility (“blended volatility”) to determine the expected stock volatility that we include in the Black-Scholes option pricing model to value our stock options. Historical volatility is based on a period commensurate with the expected term of the options. Implied volatility is derived based on six-month traded options of our common stock. An estimated forfeiture rate is applied and included in the calculation of stock-based compensation expense at the time that the stock option or other stock awards, such as our restricted stock unit awards, are granted and revised if necessary in subsequent periods if actual forfeiture rates differ from those estimates.
If we change any of the key assumptions that we use in the Black-Scholes option pricing model as described above, or if we decide to use a different valuation model in the future or change our forfeiture rate, the
37
Table of Contents
compensation expense that we record may differ significantly in the future from what we have recorded in prior periods and could materially affect our operating results. Our key assumptions, such as volatility and forfeiture rates, can be materially affected during changing or adverse economic conditions.
We also grant performance restricted stock units (“PRSUs”) to our executive officers and certain key employees under our Long-Term Incentive Program. PRSUs are a form of share-based award in which the number of shares ultimately received will be determined based on our relative performance compared to a specified group of peer companies over a three-year performance period and eligible individual’s management by objectives (“MBO”) achievement during the same three year performance period. We record compensation expense each period based on our estimate of the most probable number of PRSUs that will be issued. This estimate requires significant estimates and projections about our financial performance relative to the financial performance of the specified group of peer companies, and the performance of individuals against their specific MBOs. If our estimates change or actual results are different than the estimates used in prior periods, we would be required to increase or decrease compensation expense, which could materially affect our operating results.
Allowance for Doubtful Accounts
The majority of our trade receivables are derived from sales to lithography tool manufacturers or semiconductor manufacturer customers located throughout the world. In order to monitor potential credit losses, we perform periodic credit evaluations of our customers’ financial condition. We maintain an allowance for doubtful accounts for probable credit losses based upon our assessment of the expected collectability of our accounts receivable. We take into consideration the following when making this assessment;
| • | our customer’s payment history and how current they are on paying their outstanding receivables balance; |
| • | our history of successfully collecting on past due or aged receivables from our customers; |
| • | our customer’s current financial condition and any circumstances of which we are aware that would affect our customer’s ability to meet its financial obligations to us; and |
| • | our judgments as to prevailing economic conditions in the industry and global economy and their effect on our customers. |
If circumstances change, and the financial conditions of our customers are adversely affected and they are unable to meet their financial obligations to us, or the judgments used by us to determine a customer’s allowance prove to be incorrect, we may need to record additional allowances. When global economic conditions are changing or adverse, the likelihood that our customers will be unable to meet their financial obligations to us increases, and it becomes more difficult to assess our customers likelihood to meet their financial obligations to us. In addition, due to our concentrated customer base, the trade receivable balance owed by any one customer can be significant. As a result, if our assessment of the financial condition of our customers, even a single customer, proves to be incorrect, we would have to record additional and potentially significant allowances and bad debt expense, which would have a material effect on our business, operating results, financial condition and cash flows.
Long-Lived Assets Valuation
Included in our long-lived assets are property, plant and equipment and definite lived intangible assets. Long-lived assets are reviewed for impairment when events or circumstances indicate that the carrying amount of an asset may not be recoverable. Factors that would indicate potential impairment may include, but are not limited to, significant decreases in the market value of the long-lived assets, a significant change in the long-lived asset’s physical condition, and operating or cash flow losses associated with the use of the long-lived asset. Recoverability of assets to be held and used is measured by a comparison of the carrying amount of the assets to the future net cash flows (undiscounted and without interest) expected to be generated by the asset. Assets are
38
Table of Contents
grouped at the lowest level for which there are identifiable cash flows that are largely independent of the cash flows generated by other asset groups. If such assets are considered to be not recoverable (i.e. the carrying amount is greater than the undiscounted cash flows), the impairment is measured and recorded based upon the amount by which the carrying amount of the asset exceeds the fair value of the asset. Assets to be disposed of are reported at the lower of the carrying amount or fair value, less costs to sell.
Significant judgments and estimates by management are required to project cash flows and, if required, estimate the fair value of the long-lived assets. The estimated future cash flows are based upon, among other things, our strategic plans with regard to our business and operations, assumptions about expected future operating performance, and the interpretation of current and future economic indicators. When global economic conditions are changing or adverse, it is very difficult to estimate future cash flows as it requires management to make judgments on when and how quickly the economy and our business will recover. To the extent that the judgments used by us to calculate our future cash flows prove to be inaccurate or there are significant changes in market conditions, the overall condition of the global economy or our strategic plans change, it is possible that our conclusions regarding long-lived asset impairment could change. This could result in significant impairment charges, which would have a material adverse effect on our business, operating results and financial position.
Income Taxes
Our effective tax rate includes the effect of certain undistributed foreign earnings for which no U.S. taxes have been provided because such earnings are planned to be reinvested indefinitely outside the U.S. Earnings remittance amounts are planned based on the projected cash flow needs as well as the working capital and long-term investment requirements of our foreign subsidiaries and our domestic operations. Material changes in our estimates of cash, working capital and long-term investment requirements could affect our effective tax rate.
We record a valuation allowance to reduce our deferred tax assets to the amount that is more likely than not to be realized. We consider past operating results, future market growth, forecasted earnings, historical and projected taxable income, the mix of earnings in the jurisdictions in which we operate, prudent and feasible tax planning strategies and statutory tax law changes in determining the need for a valuation allowance. If we were to determine that it is more likely than not that we would not be able to realize all or part of our net deferred tax assets in the future, an adjustment to the deferred tax assets would be charged to income tax expense in the period such determination is made. Likewise, if we later determine that it is more likely than not that the net deferred tax assets would be realized, the previously provided valuation allowance would be reversed. These changes to the valuation allowance, and resulting increases or decreases in income tax expense, could have a material adverse affect on our operating results.
Our income tax returns are based on calculations and assumptions that are subject to examination by the Internal Revenue Service and other tax authorities. In addition, the calculation of our tax liabilities involves dealing with uncertainties in the application of complex tax regulations. We recognize liabilities for uncertain tax positions based on a two-step process. The first step is to evaluate the tax position for recognition by determining if the weight of available evidence indicates that it is more likely than not that the position will be sustained on audit, including resolution of related appeals or litigation processes, if any. The second step is to measure the tax benefit as the largest amount that is more than 50% likely of being realized upon settlement. While we believe we have appropriate support for the positions taken on our tax returns, we regularly assess the potential outcomes of examinations by tax authorities in determining the adequacy of our provision for income taxes, and adjust the income tax provision, income taxes payable and deferred taxes in the period in which the facts that give rise to a revision become known.
39
Table of Contents
RESULTS OF OPERATIONS
The following table sets forth certain items in our consolidated statements of operations as a percentage of total revenues for the periods indicated:
| Years Ended December 31, | |||||||||
| 2009 | 2008 | 2007 | |||||||
| Revenues: |
|||||||||
| Product sales |
99.7 | % | 99.5 | % | 99.3 | % | |||
| Product sales—related party |
0.3 | 0.5 | 0.7 | ||||||
| Total revenues |
100.0 | 100.0 | 100.0 | ||||||
| Cost of revenues |
55.7 | 52.4 | 49.9 | ||||||
| Gross profit |
44.3 | 47.6 | 50.1 | ||||||
| Operating expenses: |
|||||||||
| Research and development |
21.4 | 20.7 | 15.7 | ||||||
| Sales and marketing |
5.4 | 5.2 | 5.0 | ||||||
| General and administrative |
8.9 | 7.9 | 7.5 | ||||||
| Restructuring |
2.7 | 0.7 | — | ||||||
| Total operating expenses |
38.4 | 34.5 | 28.2 | ||||||
| Operating income |
5.9 | 13.1 | 21.9 | ||||||
| Other income (expense) |
(0.3 | ) | (2.1 | ) | 3.0 | ||||
| Income before income tax provision |
5.6 | 11.0 | 24.9 | ||||||
| Income tax provision |
2.7 | 3.6 | 8.5 | ||||||
| Net income |
2.9 | 7.4 | 16.4 | ||||||
| Net loss attributable to noncontrolling interest in subsidiary |
1.1 | 0.6 | 0.6 | ||||||
| Net income attributable to Cymer, Inc. |
4.0 | % | 8.0 | % | 17.0 | % | |||
We currently operate within two reportable segments, Cymer and TCZ. The Cymer segment of our business consists of products including photolithography light sources and installed base products. The TCZ segment is targeting the emerging market for LTPS processing used in the manufacture of OLED flat panel displays. The discussion which follows includes our consolidated expenses and identifies expenses associated with the TCZ segment for the years ended December 31, 2009, 2008 and 2007. Additional information regarding our reporting segments is contained in Note 13 to our Consolidated Financial Statements in Part II, Item 8 of this report.
YEARS ENDED DECEMBER 31, 2009, 2008 and 2007
Revenues. The following table summarizes the components of our revenue (in thousands, except units sold):
| Years Ended December 31, | 2009 vs. 2008 | 2008 vs. 2007 | |||||||||||||||||||||
| Increase (decrease) |
% Change |
Increase (decrease) |
% Change |
||||||||||||||||||||
| 2009 | 2008 | 2007 | |||||||||||||||||||||
| Light source systems: |
|||||||||||||||||||||||
| Revenue |
$ | 68,925 | $ | 157,739 | $ | 245,831 | $ | (88,814 | ) | (56 | )% | $ | (88,092 | ) | (36 | )% | |||||||
| Units sold |
38 | 100 | 196 | (62 | ) | (62 | )% | (96 | ) | (49 | )% | ||||||||||||
| Average selling price (1) |
$ | 1,852 | $ | 1,575 | $ | 1,260 | $ | 277 | 18 | % | $ | 315 | 25 | % | |||||||||
| Installed base product revenue |
$ | 238,739 | $ | 300,989 | $ | 275,180 | $ | (62,250 | ) | (21 | )% | $ | 25,809 | 9 | % | ||||||||
| Other revenue |
$ | — | $ | 282 | $ | 685 | $ | (282 | ) | (100 | )% | $ | (403 | ) | (59 | )% | |||||||
| Total revenue |
$ | 307,664 | $ | 459,010 | $ | 521,696 | $ | (151,346 | ) | (33 | )% | $ | (62,686 | ) | (12 | )% | |||||||
40
Table of Contents
| (1) | For purposes of calculating the average selling price, we have excluded the effect of deferred light source system revenue between periods in order to present the actual price per light source system sold. |
Total revenue decreased 33% in 2009 compared to 2008 due to a 56% decline in our light source system revenue and a 21% decline in our installed base product revenue. In 2009, the decrease in light source revenue was primarily due to the 62% decline in the number of light source systems sold as a result of the reduced need for capacity expansion by our chipmaker customers, the continued downturn in the semiconductor capital equipment industry and the continued deterioration of the global economy. This decline was offset partially by an 18% increase in the average selling price due to a higher concentration of sales of our most advanced ArF light sources for immersion productions applications, which include our XLR series light source systems. ArF light source systems accounted for 97% of light source system revenue for 2009 compared to 92% of light source system revenue for 2008. We expect sales of our ArF systems to continue to grow at a higher rate than sales of our KrF systems as customers continue to adopt more advanced technologies. Although our installed based product revenue declined 21% from 2008 to 2009 due to a decline in pulse utilizations by our chipmaker customers, it did not decline as significantly as our light source systems revenue. This was due to continued adoption of our OnPulse contracts and an increase in the number of installed light source systems from 3,374 as of December 31, 2008 to 3,449 as of December 31, 2009.
Total revenue decreased 12% in 2008 compared to 2007 due to a 36% decline in our light source system revenue, offset partially by a 9% increase in our installed base product revenue in 2008 as compared to 2007. A total of 100 light source systems were sold in 2008 compared to 196 light source systems sold in 2007. The decrease in light source systems revenue was due to the lower number of light source systems that we sold as a result of the reduced need for capacity expansion by our chipmaker customers, the downturn in the semiconductor capital equipment industry and the deterioration of the global economy in 2008. The average selling price of these light source systems increased 25% to $1.6 million in 2008 from $1.3 million in 2007. This increase in the average selling price was due to the continued adoption of our most advanced ArF light sources for high volume immersion production applications which include our XLR series light source system. ArF light source systems accounted for 92% of light source systems revenue for 2008 compared to 84% of light source system revenue for 2007. Our installed base product revenues increased 9% in 2008 from the 2007 levels. These higher revenues from year to year were due to the growth of our installed base and increasing pulse utilization in the first half of 2008, the strong adoption of our OnPulse contracts and the sale of other laser productivity enhancements such as GLX.
There were no revenues associated with our TCZ segment for the year ended December 31, 2009, 2008 or 2007. In August 2009, TCZ shipped one system but has not yet recognized revenue as the agreement includes acceptance provisions which have not yet been satisfied.
Our backlog includes only those orders for DUV light source systems and replacement parts for which we have accepted a purchase order from a customer, and that will be delivered to the customer within the following 12 months. In addition, our backlog does not include service or support which will be provided to our customers in the future or under service contracts. Our backlog does not include orders for EUV source systems or TCZ products, as these products are still in evaluation stages at our customers. Because it is the practice in our industry that customers may cancel or delay orders with little or no penalty, our backlog as of any particular date may not be a reliable indicator of actual sales for any succeeding period. Our DUV backlog at December 31, 2009 was $46.0 million compared to $33.7 million at December 31, 2008. DUV bookings for the year ended December 31, 2009 and 2008 were $320.0 million and $393.1, respectively. The DUV book-to-bill ratio for the quarter ended December 31, 2009 was 1.05 compared to 0.83 for the quarter ended December 31, 2008. The decrease in bookings year over year primarily reflects the downturn in the semiconductor capital equipment industry as a result of the global economy. The slight increase in DUV backlog and book-to-bill ratio reflects an increase in demand for our light source systems in the second half of 2009.
41
Table of Contents
Sales to ASML and Nikon, two of our three lithography tool manufacturing customers, and Samsung which purchases installed base products from us, amounted to 15%, 18% and 13%, respectively, of total revenue for 2009, and 22%, 20% and 10%, respectively, of total revenue for 2008, and 33%, 19% and 7%, respectively, of total revenue for 2007.
Our sales are generated primarily by shipments to customers in the United States, Japan, and Korea and, to a lesser extent, other Asian countries and Europe. Approximately 84%, 83% and 85% of our sales in 2009, 2008 and 2007, respectively, were derived from customers outside the U.S. We maintain a wholly owned Japanese subsidiary, Cymer Japan, which sells to our Japanese customers. Revenues from Japanese customers, generated primarily by Cymer Japan, accounted for 24%, 25% and 23% of total revenues for 2009, 2008 and 2007, respectively. The activities of Cymer Japan are limited to sales and service of products purchased by them from our corporate office. We anticipate that international sales will continue to account for a significant portion of our sales.
Cost of Revenues. Cost of revenues includes direct material and labor, warranty expenses, installation expenses, license fees, and manufacturing and service overhead. Cost of revenues also includes foreign exchange gains and losses on foreign currency exchange contracts (“forward contracts”) associated with purchases of our products by Cymer Japan for resale under firm third-party sales commitments. Costs incurred for shipping and handling are included in cost of revenues at the time the related revenue is recognized. Amounts billed to a customer, if any, for shipping and handling are reported as revenue.
The decrease in gross margin to 44.3% in 2009 from 47.6% in 2008 was primarily due to $5.8 million in idle capacity charges and higher costs associated with our installed base products. The idle capacity charges were associated with unabsorbed manufacturing costs resulting primarily from the decline in light source demand and reduced production levels during 2009. These declines in gross margin were offset partially by lower warranty expenses in 2009 as percentage of revenue due to a lower number of systems under warranty and a reduction in the write-down of inventory compared to 2008. We expect gross margin in 2010 to be higher than 2009 due primarily to a decrease in idle capacity charges.
The decrease in gross margin to 47.6% in 2008 from 50.1% in 2007 was primarily due to higher costs associated with our installed base products and a $5.9 million write down of our inventory in response to the decreased demand for our products and increased risk of parts on hand being in excess of demand, and increased warranty expenses compared to 2007.
Cost of revenues associated with the TCZ segment was $898,000 for 2009. This cost of revenues is associated with the installation costs incurred during the third quarter of 2009 to install the first system at a customer site. The customer is currently evaluating this system and TCZ is working with them to demonstrate the system’s capabilities. There were no costs of revenues associated with the TCZ segment for 2008 or 2007.
42
Table of Contents
CYMER AND TCZ SEGMENTS OPERATING EXPENSES AND OTHER INCOME (EXPENSE) FOR THE YEARS ENDED DECEMBER 31, 2009, 2008 AND 2007
The following table summarizes operating data for our Cymer and TCZ operating segments (in thousands):
| Years Ended December 31, | 2009 vs. 2008 | 2008 vs. 2007 | |||||||||||||||||||||||
| 2009 | 2008 | 2007 | Increase (decrease) |
% Change |
Increase (decrease) |
% Change |
|||||||||||||||||||
| Research and development expenses |
|||||||||||||||||||||||||
| Cymer consolidated |
$ | 65,809 | $ | 95,229 | $ | 81,842 | $ | (29,420 | ) | (30.9 | )% | $ | 13,387 | 16.4 | % | ||||||||||
| TCZ |
4,219 | 4,792 | 4,222 | (573 | ) | (12.0 | )% | 570 | 13.5 | % | |||||||||||||||
| Sales and marketing expenses |
|||||||||||||||||||||||||
| Cymer consolidated |
$ | 16,603 | $ | 23,713 | $ | 26,163 | $ | (7,110 | ) | (30.0 | )% | $ | (2,450 | ) | (9.4 | )% | |||||||||
| TCZ |
2,253 | 1,511 | 2,127 | 742 | 49.1 | % | (616 | ) | (29.0 | )% | |||||||||||||||
| General and administrative expenses |
|||||||||||||||||||||||||
| Cymer consolidated |
$ | 27,569 | $ | 36,180 | $ | 38,949 | $ | (8,611 | ) | (23.8 | )% | $ | (2,769 | ) | (7.1 | )% | |||||||||
| TCZ |
995 | 609 | 1,428 | 386 | 63.4 | % | (819 | ) | (57.4 | )% | |||||||||||||||
| Restructuring expenses |
|||||||||||||||||||||||||
| Cymer consolidated |
$ | 8,407 | $ | 3,038 | $ | — | $ | 5,369 | 176.7 | % | $ | 3,038 | — | ||||||||||||
| TCZ |
— | — | — | — | — | — | — | ||||||||||||||||||
| Total other income (expense)—net |
|||||||||||||||||||||||||
| Cymer consolidated |
$ | (918 | ) | $ | (9,818 | ) | $ | 15,390 | $ | 8,900 | (90.6 | )% | $ | (25,208 | ) | (163.8 | )% | ||||||||
| TCZ |
55 | (468 | ) | 564 | 523 | (111.8 | )% | (1,032 | ) | (183.0 | )% | ||||||||||||||
Research and Development. Research and development expenses include costs of continuing product development projects, which consist primarily of employee and material costs, depreciation of equipment and other engineering related costs. Research and development expenses were $65.8 million, $95.2 million and $81.8 million in 2009, 2008 and 2007, respectively. As a percentage of total revenues, research and development expenses were 21.4%, 20.7% and 15.7% in 2009, 2008 and 2007, respectively.
The decrease in research and expenses from 2008 to 2009 primarily reflects the reductions in our workforce and the effect of the other cost reduction actions we implemented in the fourth quarter of 2008 and continued into 2009. These activities resulted in lower employee compensation and benefit costs, reduced variable compensation costs, decreased travel and entertainment expenses. We anticipate that research and development expenses in 2010 will be higher than 2009 as we develop enhancements to our current DUV product line and continue to invest in EUV and TCZ product development. Additionally, we expect to incur increased compensation and benefit costs due to the reinstatement of certain employee benefits and variable compensation programs in 2010.
The increase in research and development costs in 2008 compared to 2007 were primarily due to costs associated with our increased focus on EUV light source development and product development efforts associated with TCZ, which were offset by decreases in variable compensation costs of $5.7 million associated with our incentive bonus program, some of which we were able to fund in 2007 but did not fund in 2008.
Research and development expenses for the TCZ segment decreased to $4.2 million for 2009 from $4.8 million for 2008 due primarily to a change in depreciation expense associated with certain demonstration equipment that was fully depreciated in 2008.
Sales and Marketing. Sales and marketing expenses include sales, marketing and customer support staff expenses and other marketing expenses. Sales and marketing expenses were $16.6 million, $23.7 million and $26.2 million in 2009, 2008 and 2007, respectively. As a percentage of total revenues, such sales and marketing expenses were 5.4%, 5.2% and 5.0% in 2009, 2008 and 2007, respectively.
43
Table of Contents
The decrease in sales and marketing expenses from 2008 to 2009 primarily reflects a decline of $7.1 million in employee compensation and benefits, travel and entertainment, and facilities costs as a result of the reductions in workforce and cost reduction actions we implemented in the fourth quarter of 2008 and continued in 2009. We anticipate that sales and marketing expenses in 2010 will be higher than 2009 as we incur increased compensation and benefit costs due to the reinstatement of certain employee benefits and variable compensation programs in 2010.
The decrease in sales and marketing expenses for 2008 compared to 2007 was primarily due to a $2.8 million decline in variable compensation costs associated with our incentive bonus programs, some of which we were able to fund in 2007 but did not fund in 2008. These decreases in sales and marketing expenses were partially offset by increases in salaries and benefits of $1.1 million.
Sales and marketing expenses associated with the TCZ segment were $2.3 million, $1.5 million and $2.1 million in 2009, 2008 and 2007, respectively. The increase in 2009 from 2008 was due to an increase in employee compensation and benefits expense and the utilization of outside services. The decline in 2008 from 2007 was due primarily to decreases in employee compensation and benefits related expenses and lower travel and entertainment expenses in 2008 as compared to 2007.
General and Administrative. General and administrative expenses consist primarily of management and administrative personnel costs, professional services, including external audit fees and consultant fees, and administrative operating costs. General and administrative expenses were $27.6 million, $36.2 million and $38.9 million in 2009, 2008 and 2007, respectively. As a percentage of total revenues, general and administrative expenses were 8.9%, 7.9% and 7.5% in 2009, 2008 and 2007, respectively. The decline in general and administrative expenses from 2008 to 2009 primarily reflects a decrease of $8.6 million in compensation and benefits, professional fees, travel, entertainment, and facilities related costs as a result of the reductions in our workforce and cost reduction actions which we implemented in the fourth quarter of 2008 and continued in 2009. In addition, we had a decrease in bad debt expense of $1.9 million. Higher bad debt expense in 2008, driven by the uncertain impact of the recessionary economy on our customers, drove a favorable year-over-year comparison. We anticipate that general and administrative expenses in 2010 will be higher than 2009 as we incur increased compensation and benefit costs due to the reinstatement of certain employee benefits and variable compensation programs in 2010.
The decrease in general and administrative expenses in 2008 compared to 2007 was primarily due to a $4.3 million decrease in variable compensation costs associated with our incentive bonus programs some of which we were able to fund in 2007 but did not fund in 2008. In 2008, we also reversed $1.0 million in bonuses recorded for 2007 long-term incentive bonus programs for employees who were terminated in 2008. In addition, professional fees decreased $2.4 million from 2007 to 2008 primarily due to decreases in professional accounting service fees related to the adoption and implementation of a new tax authoritative guidance. These decreased expenses were offset by increases in salaries, benefits and travel expenses of $1.8 million, and a $308,000 impairment expense related to certain capital equipment. We recorded bad debt expense of $1.9 million as a result of certain customers who were identified as being at risk as a result of the impact by the downturn in the semiconductor industry and the global economy. We also incurred increases in general operating expenses related to our facilities of $520,000 in 2008 compared to 2007.
General and administrative expenses associated with the TCZ segment were $995,000 in 2009, $609,000 in 2008 and $1.4 million in 2007. The increase in 2009 from 2008 was due primarily to an increase in compensation and benefits including variable costs associated with the TCZ incentive program, whereas the decrease in 2008 from 2007 was due primarily to a decrease in compensation and benefits including reduced variable costs associated with the TCZ incentive program.
Restructuring. We incurred restructuring expenses, primarily consisting of severance charges, of $8.4 million in 2009 compared to $3.0 million in 2008. In November 2008, we reduced our worldwide workforce by approximately 8 percent or a total of 85 employees. In the first quarter of 2009, we further reduced our worldwide workforce by approximately 26 percent or a total of 230 employees as part of our cost reduction efforts in response
44
Table of Contents
to the deterioration in the global economy and lithography sector of the semiconductor capital equipment market in the fourth quarter of 2008 and the first half of 2009. As a result of these actions to reduce our cost structure, we realized a cost savings of approximately $45.1 million from 2008 to 2009 in our research and development, sales and marketing, and general and administrative expenses. We did not record any restructuring expense in 2007, and there were no restructuring expenses associated with our TCZ segment for 2009, 2008, or 2007.
Total Other Income (Expense)—Net. Net other income (expense) consists primarily of interest income earned on our investment and cash portfolio, foreign currency exchange gains and losses associated with fluctuations in the value of the functional currencies of our foreign subsidiaries against the U.S. Dollar, interest expense incurred on our convertible subordinated notes that were outstanding until February 2009 and write-down of investments. Net other expense totaled $918,000 for 2009 compared to net other expense of $9.8 million for 2008 and net other income of $15.4 million for 2007. The reduction in expense from 2008 to 2009 was primarily due to a significant reduction in interest expense as a result of the repayment of our convertible subordinated note in February 2009, decreases in foreign currency losses and significantly reduced write downs on investments. Foreign currency losses were $1.1 million for 2009 and were primarily due to the lower volatility in the Korean Won against the U.S. Dollar as a result of the positive impact of our hedging program. In 2008 foreign currency losses were $6.6 million and were caused by a significant decline in the value of the Korean Won against the U.S Dollar. Impairment charges on the preferred stock that was distributed to us when the sole auction rate security was dissolved were $291,000 for 2009 which reduced the carrying amount of the auction rate preferred stock to zero, compared to impairment charges on our auction rate security of $5.3 million for 2008. In addition, these decreases in other expenses were partially offset by a $7.3 million reduction in interest and other income year over year as a result of lower overall cash and investment balances and lower interest rate yields.
The change from net other income in 2007 to net other expense in 2008 was primarily due to a significant reduction in interest income from year to year as a result of lower overall cash and investment balances and lower interest rate yields and foreign currency exchange losses of $6.6 million which we recorded during 2008 as compared to foreign currency gains of $2.0 million, which we recorded during 2007. This change from foreign currency exchange gains to losses from year to year is primarily due to the volatility of the foreign currencies in which our subsidiary offices conduct business as measured against the U.S. Dollar. In the second half of 2007, several of these currencies strengthened against the U.S. Dollar, whereas in the second half of 2008, their value, particularly that of the Korean Won and the Euro, significantly declined against the U.S. Dollar. In addition, in 2008 due to the crisis in the credit market and the significant downgrading of our sole auction rate security, we recorded an other-than-temporary impairment totaling $5.3 million.
Total net other income associated with the TCZ segment were $55,000 for 2009 compared to net other expense of $468,000 for 2008 and net other income of $564,000 for 2007. We recorded foreign currency exchange gains of $24,000 during 2009 as compared to foreign currency exchange losses of $586,000 during 2008. The foreign currency exchange gains in 2009 were primarily driven by changes in the value of trade payables denominated in Euro, partially offset by changes in the value of cash denominated in Euro, whereas the foreign currency exchange losses in 2008 were primarily due to cash balances held by TCZ during 2008 in Euro and Singapore dollars. In addition, we recorded lower interest income of $31,000 during 2009 compared to interest income of $118,000 during 2008 due to lower interest rates yields earned during 2009 as compared to 2008.
We recorded foreign currency exchange losses of $586,000 during 2008 as compared to foreign currency exchange gains of $115,000 during 2007 primarily due to cash balances held by TCZ during 2008 in non-functional currencies such as the Euro and Singapore dollars. In addition, we recorded interest income of $118,000 during 2008 compared to interest income of $449,000 during 2007 due to lower cash balances and lower interest rates during 2008 as compared to 2007.
Income Tax Expense. Income tax expense of $8.4 million, $16.6 million and $44.4 million for 2009, 2008 and 2007, respectively, reflects an annual effective rate of 49.0%, 33.0% and 34.2%, respectively. The increase in the effective rate from 2008 to 2009 was due primarily to an increase in the valuation allowance for deferred tax assets. During 2009, we realized a capital loss of $5.6 million and provided a full valuation allowance on the related $2.08 million deferred tax asset, as we believe it is more likely than not that we will not generate sufficient capital gains to
45
Table of Contents
utilize the capital loss after consideration of our available tax planning strategies. In addition, the effect of certain foreign losses with no tax benefit had a larger effect on 2009 than 2008 due to the fact that the foreign losses remained relatively constant, while pre-tax income declined significantly from 2008 to 2009.
The decrease in the effective rate from 2007 to 2008 was due to the large investment in EUV technology resulting in a research and development credit on lower profit before tax in 2008. The annual effective tax rates for 2008 and 2007 were less than the U.S. statutory rate of 35% primarily as a result of permanent book tax differences such as the research and development tax credits, and the manufacturing activity deduction under Internal Revenue Code Section 199.
Our future annual effective tax rate depends on various factors, such as potential changes to the tax laws in both the US and foreign jurisdictions and the geographic compositions of our pre-tax income.
LIQUIDITY AND CAPITAL RESOURCES
In recent years, we have funded our operations primarily from cash generated from operations, the proceeds from note offerings, and proceeds from employee stock option exercises. We have also from time to time utilized cash to repurchase shares of our common stock. At December 31, 2009, we had $118.4 million in cash and cash equivalents, $62.9 million in short-term investments, $5.2 million in long term investments, and $399.3 million in working capital. We also had $1.2 million in restricted cash which is associated with a secured refund bond that we entered into and was required by TCZ’s customer related to a sale to them. The decrease in cash and cash equivalents in 2009 as compared to 2008 was primarily due to the use of cash to repay our convertible subordinated notes and accrued interest which totaled $143.2 million, partially offset by cash generated by operating activities.
Operating Activities. Net cash provided by operating activities in 2009 totaled $39.4 million and primarily reflects net income for the year as adjusted to exclude the effects of non-cash charges including depreciation and amortization and stock-based compensation, a reduction in inventory levels, increases in accounts payable and accounts payable—related party, and increases in deferred revenue. These increases in cash were offset by increases in accounts receivable and decreases in accrued and other liabilities.
The $9.5 million decrease in inventory was primarily due to decreases in our spare parts inventory levels during 2009. These decreases in our spare parts inventory levels were partially offset by increases in inventory related to EUV systems that are being built to fulfill our first EUV order with ASML and increases in inventory related to TCZ systems. The increases in accounts payable and accounts payable – related party of $5.4 million and $3.9 million, respectively, primarily reflects inventory purchases related to EUV systems and inventory related to TCZ systems. The increase in deferred revenue of $7.4 million primarily reflects prepayments received from ASML during 2009 for purchase orders received from them under a multi-year EUV supply agreement. The increase in accounts receivable was primarily the result of a higher level of shipments occurring later in the fourth quarter, which resulted in higher accounts receivable balances at the end of the year. The decrease in accrued and other liabilities was primarily due to the decrease in our warranty provision as a result of reduced sales and the lower number of light source systems that are currently under warranty.
Net cash used in operating activities in 2008 totaled $11.2 million and primarily reflects lower net income for the year as adjusted to exclude the effects of non-cash charges, a significant increase in inventory levels, decreases in accounts payable, accrued expenses and other liabilities, and changes in the balances of income taxes payable and accrued income taxes. These uses of cash were partially offset by a decrease in accounts receivable and an increase in deferred revenue during 2008. The increase in inventory was primarily due to increases in our field inventory to support the increased utilization of our light sources, to provide replacement parts availability, optimize field inventory to support XLR light source systems installation and to support our OnPulse agreements. In addition, the increases in inventory also included inventory related to our EUV systems and TCZ joint venture. The use of cash for accrued expenses and other liabilities was due primarily to short-term bonuses that were earned in 2007 and paid in the first quarter of 2008. The decrease in accounts payable reflects
46
Table of Contents
the reduction in inventory purchases in the fourth quarter of 2008 due to the downturn in the global economy and semiconductor industry. The changes in income tax accounts were primarily due to significant tax payments made during 2008. The decrease in accounts receivable was primarily the result of collection efforts and lower accounts receivable balances. The increase in deferred revenue primarily reflects prepayments received from ASML during 2008 for purchase orders received from them under a multi-year EUV supply agreement.
Net cash provided by operating activities in 2007 of $142.1 million reflects net income, as adjusted to exclude the effects of non-cash charges, decreases in accounts receivable and increases in accounts payable and deferred revenue. These sources of operating cash were partially offset by an increase in inventory levels. The decrease in the receivable balance was primarily the result of collection efforts. The increase in deferred revenue primarily reflects prepayments received from ASML for purchase orders received from them under a multi-year EUV supply agreement. The increase in accounts payable was primarily related to the increased inventory levels and the increase in inventory was primarily due to the increased production of replacement parts to support and provide service to our installed base of light sources.
Investment Activities. Net cash used in investing activities in 2009 was $40.6 million, which consisted primarily of $28.3 million of purchases of short-term and long-term securities net of reinvestment of such securities during the year. In addition, cash used in investing activities included the acquisition of $12.3 million of property and equipment, a significant portion of which relates to equipment associated with our EUV research, development and productization efforts, software and equipment purchases, and equipment purchases related to TCZ.
Net cash used in investing activities in 2008 was $18.9 million, which consisted primarily of the acquisition of $23.7 million of property and equipment, a significant portion of which relates to building improvement costs and engineering equipment associated with our EUV research, development and productization efforts. This use of cash was offset by proceeds from sold or matured short-term and long-term securities net of reinvestment of such securities during the year. A portion of the proceeds from sold and matured investments during the year was used to fund our 2008 stock repurchase program.
Net cash provided by investing activities in 2007 was $138.5 million, which consisted primarily of proceeds from sold or matured investments, partially offset by purchases of investments and the acquisition of property and equipment used by us in the normal course of business. A portion of the proceeds from sold and matured investments during the year was used to fund our 2007 stock repurchase program.
Financing Activities. Net cash used in financing activities in 2009 was $132.9 million, which primarily reflects the payment of $140.7 million for the redemption of our outstanding convertible subordinated notes that matured on February 15, 2009. This payment was partially offset by proceeds received from the exercise of employee stock options and purchases under the employee stock purchase plan totaling $6.7 million, an additional cash investment received from Zeiss, the TCZ minority shareholder, in the amount of $800,000, and excess tax benefits from stock option exercises of $267,000.
Net cash used in financing activities for 2008 was $18.3 million which was due primarily to the repurchase of approximately $22.9 million of our common stock under our board approved stock repurchase program. This use of cash was partially offset by $2.5 million in proceeds received from the exercise of employee stock options and purchases under the employee stock purchase plan and $2.0 million additional cash investment received from Zeiss, the TCZ minority shareholder.
Net cash used in financing activities for 2007 was $281.0 million which was due primarily due to the repurchase of approximately $300.0 million of our common stock under our board approved stock repurchase program. This use of cash in financing activities was slightly offset by the $15.3 million in proceeds received from the exercise of employee stock options and purchases under the employee stock purchase plan, a $2.0 million additional cash investment received from Zeiss, the TCZ minority shareholder, and $1.7 million in excess tax benefits associated with stock option exercises.
47
Table of Contents
Effect of Exchange Rate Changes. Most of our foreign subsidiaries operate in currencies other than the U.S. Dollar, and the majority of their cash balances are denominated in these foreign currencies. As a result, our cash and cash equivalent balances are subject to the effects of the fluctuations in these currencies against the U.S. Dollar at the end of each reporting period. Several of the foreign currencies in which our subsidiaries operate have experienced volatility over the past several years. The net effect of exchange rate changes on cash and cash equivalents, when expressed in U.S. Dollar terms, was an increase in cash of $102,000 for the year ended December 31, 2009 compared to a decrease of $4.9 million for the year ended December 31, 2008 and an increase of $4.0 million for the year ended December 31, 2007. For the year ended December 31, 2009, the impact on cash was primarily due to the relationship of the Korean Won, the Euro and the Japanese Yen against the U.S. Dollar. Specifically, cash and cash equivalents were positively affected by $726,000 due to the Korean Won and the Euro strengthening against the U.S. Dollar and the effect it had on the cash balances denominated in these currencies held at our subsidiary offices. This increase was offset by $652,000 due to the weakening of the Japanese Yen against the U.S. Dollar.
For the year ended December 31, 2008, we experienced significant volatility in the value of the Korean Won, and to a lesser extent, the Euro, which resulted in a decrease of cash of $4.9 million for the year ended December 31, 2008. Not only did the Korean Won weaken dramatically against the U.S. Dollar in 2008, but we had significant cash balances denominated in Korean Won as of December 31, 2008. As a result, cash and cash equivalents were negatively impacted by $8.4 million due to the Korean Won weakening during the year. This decrease was offset by the strengthening of the Japanese Yen against the U.S. Dollar and as a result, the cash and cash equivalents were positively impacted by $3.4 million due to the Japanese Yen strengthening during the year.
For the year ended December 31, 2007, cash was positively impacted by $4.0 million primarily due to the Japanese Yen and the Euro strengthening against the U.S. Dollar and the impacts it had on the cash balances denominated in these currencies held at our subsidiary offices.
Prospective Capital Needs. We require substantial resources to fund the operations of our business, particularly to fund our investment in new technologies, including inventory and capital in support of these technologies. We expect purchases of property and equipment in 2010 to be approximately $20.0 million, a significant portion of which will relate to purchases of equipment associated with EUV research and development, as well as purchases of software and equipment. In addition, we require resources to fund our normal operations. Due to the acquisition of the remaining 40% interest in TCZ, effective January 15, 2010, we are obligated to pay our former partner in TCZ, Zeiss, approximately $2.3 million by September 30, 2010. We believe that our current cash, cash equivalents and marketable securities and, to a lesser extent, cash from the exercise of employee stock options and the purchase by our employees of common stock through our employee stock purchase plan, will be sufficient to cover our working capital needs for our normal operations, and our investments in our new technologies, including EUV and OLED display manufacturing, for at least the next 12 months. It is possible that we may need to raise additional funds to finance our activities or to acquire assets, products or new technologies beyond the next 12 months. We may also decide that it is prudent in the current business and economic environment to secure commitments to access additional capital, including equity or debt securities, to protect our long term liquidity position. We continue to monitor and control expenditures for on-going operations. In April 2008, our board of directors authorized us to repurchase up to $100.0 million of our common stock. As of December 31, 2009, we have $77.1 million remaining of this authorization.
Our future capital requirements may vary materially from those currently planned. We anticipate that the amount of capital we will need in the future will depend on many factors, including:
| • | the required investments in our new technologies such as EUV and OLED display manufacturing; |
| • | general economic and political conditions and specific conditions in the markets in which we operate, including the volatility in the semiconductor industry, and trends in the semiconductor markets in various geographic regions, including seasonality in sales of consumer products into which our products are incorporated; |
48
Table of Contents
| • | the overall levels of sales of our products and gross profit margins; |
| • | the timing and requirements of spending to support product development efforts and other operating costs; |
| • | our competitors’ responses to our products and our anticipation of and responses to their products; |
| • | the required investment to support TCZ; |
| • | our manufacturing activity; |
| • | the inability of certain of our customers who depend on credit to have access to their traditional sources of credit to finance the purchase of products from us, particularly during changing or adverse global economic conditions, which may lead them to reduce their level of purchases or to seek credit or other accommodations from us; |
| • | the levels of inventory and accounts receivable that we maintain; |
| • | the market acceptance of our products; |
| • | competitive labor market compensation requirements; |
| • | acquisitions of assets, products or new technologies; |
| • | capital improvements for new and existing facilities; |
| • | our relationships with suppliers and customers; and |
| • | the level of exercises of stock options and stock purchases by our employees under our employee stock purchase plan. |
TRANSACTIONS WITH RELATED PARTIES
We periodically sell our light source systems to Zeiss and we purchase certain optical parts from Zeiss. Zeiss is considered to be a related party as a result of its ownership interests in TCZ, our joint venture entity. For a discussion of the business and transactions with Zeiss, see Note 12, “Related Party Transactions.”
CONTRACTUAL OBLIGATIONS AND OFF BALANCE SHEET ARRANGEMENTS
The following summarizes our contractual obligations and other commitments as of December 31, 2009, and the effect such obligations could have on our liquidity and cash flow in future periods (in thousands):
| Contractual Obligations |
Total | Less than 1 year |
1 - 3 Years | 3 - 5 Years | More than 5 years | ||||||||||
| Operating leases |
$ | 3,554 | $ | 1,980 | $ | 1,528 | $ | 46 | $ | — | |||||
| Acquisition of noncontrolling interest in TCZ (1) |
2,300 | 2,300 | — | — | — | ||||||||||
| Purchase obligations (2) |
46,107 | 46,107 | — | — | — | ||||||||||
| Total commitments |
$ | 51,961 | $ | 50,387 | $ | 1,528 | $ | 46 | $ | — | |||||
| (1) | Effective January 15, 2010, we purchased Zeiss’s forty percent ownership in TCZ for approximately $2.3 million cash, to be paid in full no later than September 30, 2010. |
| (2) | Purchase obligations represent firm purchase commitments by us at December 31, 2009. |
In addition to the amounts shown in the table above, at December 31, 2009, we had a gross liability for income taxes associated with uncertain tax positions of approximately $27.6 million. Because the timing of any payments which could result from these unrecognized tax benefits will depend on a number of factors, we are unable to project if and when this might occur, if at all, within the next five years. Accordingly, we cannot make reasonably reliable estimates of the amount and period of potential cash settlements, if any, with taxing authorities.
49
Table of Contents
At December 31, 2009 and 2008, we did not have any relationships with unconsolidated entities or financial partnerships, such as entities often referred to as structured finance, variable interest, or special purpose entities, which would have been established for the purpose of facilitating off-balance sheet arrangements or other contractually narrow or limited purposes. In addition, we did not engage in trading activities involving non-exchange traded contracts. As a result, we are not exposed to any financing, liquidity, market or credit risk that could arise if we had engaged in such relationships. We do not have relationships with or enter into transactions with persons or entities that derive benefits from their non-independent relationship with us or our related parties except as disclosed herein.
We have no significant contractual obligations that are not recorded in our consolidated financial statements or fully disclosed in the notes thereto.
RECENTLY ISSUED ACCOUNTING STANDARDS
See Note 1 to our Consolidated Financial Statements in Part II, Item 8 of this report for a description of recent accounting standards, including our expected dates of adoption and the estimated effects on our results of operations and financial condition.
| Item 7A. | Quantitative and Qualitative Disclosures About Market Risk |
Foreign Currency Risk
We conduct business in several international currencies through our global operations. Prior to 2009, our foreign currency hedging program included only the Japanese Yen. In the first quarter of 2009, we expanded our foreign currency hedging program to include the Korean Won, the Euro and the Taiwanese Dollar due to increased exposures in these foreign currencies. Our foreign currency risk falls into two primary categories.
First, we are subject to uncertain gross profit margins when we forecast selling products in one currency and the product costs are denominated in a different currency. In this instance we enter into derivative financial instruments, principally forward contracts which we designate as cash flow hedges in order to mitigate fluctuations in the gross profit margins of these forecasted transactions.
Forward contracts on forecasted transactions that hedge uncertain gross profit margins generally qualify for cash flow hedge accounting treatment. Gains and losses on cash flow hedges are recorded in accumulated other comprehensive income (loss) until the hedged transaction is recorded in the financial statements. Once the underlying transaction is recorded in the financial statements, we de-designate the derivative, reclassify the accumulated gain or loss on the derivative into cost of revenues and cease to apply hedge accounting treatment. Once the derivative has been de-designated, any further gains or losses are recorded to other income (expense). If all or a portion the forecasted transaction were cancelled, this would render all or a portion of the cash flow hedge ineffective and we would reclassify the ineffective portion of the hedge into other income (expense). We generally have not experienced ineffectiveness of cash flow hedges from cancelled transactions. The fair value of all our forward contracts totaled to an asset of $26,000 at December 31, 2009. The deferred gain, net of tax, for those that qualified for hedge accounting treatment was $62,000 as of December 31, 2009.
At December 31, 2009, we had outstanding forward contracts to buy $20.6 million in exchange for Japanese Yen, $5.5 million in exchange for Korean Won and to sell $8.5 million in exchange for Euros. These contracts expire on various dates through July 2010.
The second category of foreign currency risk occurs when transactions are recorded to our consolidated financial statements in a currency other than the applicable entity’s functional currency and the cash settlement of the transaction occurs at some point in the future. When transactions in non-functional currency are recorded to our consolidated financial statements, any changes in the recorded amounts resulting from fluctuations in the value of that currency will be recorded to other income (expense). In order to mitigate these remeasurement gains
50
Table of Contents
and losses, we enter into derivative financial instruments, principally forward contracts. The forward contracts that hedge transactions that have been recorded to our consolidated financial statements are not designated as hedges and we record changes in their fair value to other income (expense) in order to attempt to offset gains and losses on the underlying transactions.
For the year ended December 31, 2009, we recorded a foreign currency exchange loss which totaled $1.1 million. The foreign currency exchange loss was primarily attributable to the lower volatility in the Korean Won against the U.S. Dollar as a result of the positive impact of our hedging program. This foreign currency loss is included in other income (expense), net on the accompanying consolidated statements of operations.
We considered the historical trends in currency exchange rates and determined that it was reasonably possible that adverse changes in exchange rates of 20% for all currencies could be experienced in the near term. These changes would have resulted in an adverse impact on income before taxes of approximately $2.6 million and $5.1 million at December 31, 2009 and December 31, 2008, respectively. The adverse impact at December 31, 2009 and December 31, 2008 is after consideration of the offsetting effect of approximately $5.5 million and $4.8 million, respectively from forward exchange contracts in place at that time. These reasonably possible adverse changes in foreign currency exchange rates of 20% were applied to net assets and liabilities denominated in currencies other than the functional currencies at the balance sheet date to compute the adverse impact these changes would have had on our income before taxes in the near term.
Investment and Debt Risk
We maintain an investment portfolio consisting primarily of government and corporate fixed income securities, commercial paper and money market funds. While it is our general intent to hold such securities until maturity, we will occasionally sell certain securities for cash flow purposes. Therefore, our investments are classified as available-for-sale and are carried on the balance sheet at fair value. A change in market interest rates of 10% would have impacted our net income from these investments by approximately $74,000 as of December 31, 2009.
We hold preferred stock that was distributed to us when our sole auction rate security was dissolved in April 2009. The auction rate security was purchased in October 2007 at a par value of $5.6 million and failed at every auction from November 2007 until its dissolution in April 2009. We recorded impairment charges in 2009 and 2008 totaling $291,000 and $5.3 million, respectively, associated with this security which was included in other income (expense) in the accompanying consolidated financial statements of operations. This preferred stock is valued at zero at December 31, 2009, as we believe it is unlikely we will receive any future cash flow from this preferred stock.
On February 17, 2009, our 3.50% convertible subordinated notes came due and we repaid the outstanding principal balance of $140.7 million plus accrued interest of $2.5 million.
| Item 8. | Financial Statements and Supplementary Data |
The information required by this Item is included in Part IV Items 15(a)(1) and (2) of this Annual Report on Form 10-K.
| Item 9. | Changes in and Disagreements with Accountants on Accounting and Financial Disclosure |
None.
51
Table of Contents
| Item 9A. | Controls and Procedures |
| 1. | Evaluation of Disclosure Controls and Procedures. Our chief executive officer and our chief financial officer, after evaluating the effectiveness of our disclosure controls and procedures (as defined in Rules 13a-15(e) and 15d-15(e) of the Securities Exchange Act of 1934, as amended (the “Exchange Act”)) as of December 31, 2009, have concluded that as of such date, our disclosure controls and procedures were effective in ensuring that information required to be disclosed by us in the reports that we file under the Exchange Act is recorded, processed, summarized and reported within the time period specified in the rules and forms of the Securities and Exchange Commission and that such information is accumulated and communicated to management, including our chief executive officer and chief financial officer, as appropriate, to allow timely decisions regarding required disclosure. |
| 2. | Management’s Report on Internal Control Over Financial Reporting. Our management is responsible for establishing and maintaining adequate internal control over our financial reporting (as defined in Rules 13a-15(f) and 15d-15(f) of the Exchange Act). |
We assessed the effectiveness of our internal control over financial reporting as of December 31, 2009, using the criteria established in Internal Control—Integrated Framework issued by the Committee of Sponsoring Organizations of the Treadway Commission (COSO). Based upon this assessment, we have concluded that, as of December 31, 2009, our internal control over financial reporting was effective.
KPMG LLP, an independent registered public accounting firm, also assessed the effectiveness of our internal control over financial reporting as of December 31, 2009 and their report with the results of this assessment appears on page F-2 of this Annual Report on Form 10-K.
| 3. | Changes in Internal Control Over Financial Reporting. There has been no change in our internal control over financial reporting during the fourth quarter ended December 31, 2009 that has materially affected, or is reasonably likely to materially affect, our internal control over financial reporting. |
| 4. | Inherent Limitations on the Effectiveness of Internal Control. There are inherent limitations in the effectiveness of any internal control, including the possibility of human error and the circumvention or overriding of controls. Accordingly, even effective internal controls can provide only reasonable assurances with respect to financial statement preparation. Further, because of changes in conditions, the effectiveness of internal controls may vary over time. |
| Item 9B. | Other Information |
None.
52
Table of Contents
PART III
Certain information required by Part III of this Annual Report on Form 10-K is omitted from this report because we expect to file a definitive proxy statement for our 2010 Annual Meeting of Stockholders (the “Proxy Statement”) within 120 days after the end of our fiscal year pursuant to Regulation 14A promulgated under the Exchange Act, and the information included in the Proxy Statement is incorporated herein by reference to the extent provided below. With the exception of the information specifically incorporated herein by reference from our definitive Proxy Statement into this Annual Report on Form 10-K, our definitive Proxy Statement shall not be deemed to be filed as part of this Annual Report. Without limiting the foregoing, the information contained in the sections entitled “Report of the Audit Committee” and the “Report of the Compensation Committee” in our definitive Proxy Statement is not incorporated by reference into this Annual Report on Form 10-K or deemed “filed” with the SEC.
| Item 10. | Directors, Executive Officers and Corporate Governance. |
Directors. The information required by Item 10 of Form 10-K regarding our directors is incorporated herein by reference to the information contained in the section entitled “Proposal 1—Election of Directors” in our definitive Proxy Statement.
Executive Officers. The information required by Item 10 of Form 10-K regarding our executive officers is disclosed in Part I, Item I of this Annual Report under the section entitled “Executive Officers.”
Corporate Governance. The information required by Item 10 of Form 10-K regarding compliance with Section 16(a) of the Exchange Act is incorporated herein by reference to the information contained in the section entitled “Section 16(a) Beneficial Ownership Reporting Compliance” in our definitive Proxy Statement.
The information required by Item 10 of Form 10-K regarding the members of our Audit Committee and our Audit Committee financial expert is incorporated herein by reference to the information contained in the section entitled “Information Regarding the Board of Directors and its Committees—Audit Committee” in our 2010 definitive Proxy Statement.
The information required by Item 10 of Form 10-K regarding the procedures by which stockholders may recommend candidates for director to the Nominating and Corporate Governance Committee is incorporated herein by reference to the information contained in the “Question and Answer” section and the section entitled “Information Regarding the Board of Directors and its Committees—Nominating and Corporate Governance Committee” in our definitive Proxy Statement.
Code of Ethics. We have adopted a code of ethics that applies to our principal executive officer, principal financial officer, principal accounting officer or corporate controller, or persons performing similar functions. We have posted the text of the code of ethics on our website which can be accessed at http://www.cymer.com under “Investor Relations.” In addition, we will promptly disclose on our website (1) the nature of any amendment to the code of ethics that applies to our principal executive officer, principal financial officer, principal accounting officer or corporate controller, or persons performing similar functions and (2) the nature of any waiver, including an implicit waiver, from a provision of the code of ethics that is granted to one of these specified officers, and the name of such person who is granted the waiver on our website in the future.
| Item 11. | Executive Compensation. |
The information required by Item 11 of Form 10-K regarding executive compensation is incorporated herein by reference to the information contained in the sections entitled “Executive Compensation” and “Compensation of Directors” in our definitive Proxy Statement.
53
Table of Contents
The information required by Item 11 of Form 10-K regarding compensation committee interlocks and insider participation and the report of the Compensation Committee of our Board of Directors is incorporated herein by reference to the information contained in the sections entitled “Compensation Committee Interlocks and Insider Participation” and “Compensation Committee Report” in our definitive Proxy Statement.
| Item 12. | Security Ownership of Certain Beneficial Owners and Management and Related Stockholder Matters. |
The information required by Item 12 of Form 10-K regarding equity compensation plans under which our common stock may be issued as of December 31, 2009 is incorporated herein by reference to the information contained in the section entitled “Equity Compensation Plan Information” in our definitive Proxy Statement. The information required by Item 12 of Form 10-K regarding security ownership of certain beneficial owners and management is incorporated herein by reference to the information contained in the section entitled “Security Ownership of Certain Beneficial Owners and Management” in our definitive Proxy Statement.
| Item 13. | Certain Relationships and Related Transactions, and Director Independence. |
The information required by Item 13 of Form 10-K regarding transactions with related persons, promoters and certain control persons, if any, is incorporated herein by reference to the information contained in the section entitled “Certain Relationships and Related Transactions” in our definitive Proxy Statement. The information required by Item 13 of Form 10-K regarding director independence is incorporated herein by reference to the information contained in the section entitled “Information Regarding the Board of Directors and its Committees—Independence of the Board of Directors” in our definitive Proxy Statement.
| Item 14. | Principal Accounting Fees and Services. |
The information required by Item 14 of Form 10-K is incorporated herein by reference to the information contained in the sections entitled “Independent Registered Public Accounting Firm Fees” and “Pre-Approval Policies and Procedures” in our definitive Proxy Statement.
54
Table of Contents
PART IV
| Item 15. | Exhibits, Financial Statement Schedules |
(a) The following documents are filed as part of, or incorporated by reference into, this Annual Report on Form 10-K:
(1)(2) Financial Statements and Financial Statement Schedule. The following Consolidated Financial Statements of Cymer, Inc., Financial Statement Schedule and Reports of Independent Registered Public Accounting Firm are included in a separate section of this Annual Report on Form 10-K beginning on page F-1:
All other financial statement schedules have been omitted because the required information is not applicable or not present in amounts sufficient to require submission of the schedule, or because the information required is included in our consolidated financial statements or the notes thereto.
(3) Exhibits. The exhibits listed under Item 15(b) hereof are filed with, or incorporated by reference into, this Annual Report on Form 10-K. Each management contract or compensatory plan or arrangement is identified separately in item 15(b) hereof.
(b) Exhibits. The following exhibits are filed as part of, or incorporated by reference into, this Annual Report on Form 10-K:
| 3.1 | Amended and Restated Articles of Incorporation of Cymer, Inc. (incorporated herein by reference to Exhibit 3.1 to Cymer’s Registration Statement on Form S-1, Reg. No. 333-08383). | |
| 3.2 | Amendment of Articles of Incorporation of Cymer, Inc. (incorporated herein by reference to Exhibit 3.1 to Cymer’s Quarterly Report on Form 10-Q for the quarter ended June 30, 2002). | |
| 3.3 | Bylaws of Cymer, as amended and restated (incorporated herein by reference to Exhibit 3.1 to Cymer’s Form 8-K filed on November 25, 2009). | |
| 10.1# | Form of Indemnification Agreement with Directors and Officers (incorporated herein by reference to Exhibit 10.1 to Cymer’s Annual Report on Form 10-K for the year ended December 31, 2003). | |
| 10.2# | 1996 Stock Option Plan, as amended (incorporated herein by reference to Exhibit 99.1 to Cymer’s Registration Statement on Form S-8, Registration No. 333-69736). | |
| 10.3# | Form of Stock Option Agreement used in connection with the 1996 Stock Option Plan, as amended (incorporated herein by reference to Exhibit 4.1 to Cymer’s Registration Statement on Form S-8, Registration No. 333-48242). | |
55
Table of Contents
| 10.4# | 1996 Employee Stock Purchase Plan, as amended (incorporated herein by reference to Exhibit 99.1 to Cymer’s Current Report on Form 8-K filed on May 19, 2006). | |
| 10.5# | 2000 Equity Incentive Plan (formerly known as the 2000 Nonstatutory Stock Option Plan and incorporated herein by reference to Exhibit 99.4 to Cymer’s Registration Statement on Form S-8, Registration No. 333-69736). | |
| 10.6# | Form of Stock Option Agreement used in connection with the 2000 Equity Incentive Plan (incorporated herein by reference to Exhibit 99.5 to Cymer’s Registration Statement on Form S-8, Registration No. 333-69736). | |
| 10.7# | Amended and Restated 2005 Equity Incentive Plan (incorporated herein by reference to Exhibit 99.1 to Cymer’s Current Report on Form 8-K filed on May 27, 2009). | |
| 10.8# | Form of Stock Option Grant Notice and form of Stock Option Agreement used in connection with the Amended and Restated 2005 Equity Incentive Plan (incorporated herein by reference to Exhibit 99.2 to Cymer’s Current Report on Form 8-K filed on May 20, 2005). | |
| 10.9# | Form of Stock Unit Grant Notice and Form of Stock Unit Agreement used in connection with the Amended and Restated 2005 Equity Incentive Plan (incorporated herein by reference to Exhibit 10.11 to Cymer’s Annual Report on Form 10-K for the year ended December 31, 2007). | |
| 10.10# | Form of Stock Unit Grant Notice for use in connection with the 2007 Long-Term Incentive Bonus Plan under the Amended and Restated 2005 Equity Incentive Plan (incorporated herein by reference to Exhibit 10.12 to Cymer’s Annual Report on Form 10-K for the year ended December 31, 2007). | |
| 10.11# | Form of Stock Unit Grant Notice and Form of Stock Unit Agreement for use with the Long-Term Bonus Program under the 2005 Amended and Restated Equity Incentive Plan (incorporated herein by reference to Exhibit 99.1 to Cymer’s Current Report on Form 8-K filed on December 21, 2007). | |
| 10.12# | Form of Performance Restricted Stock Unit Notice and Form of Performance Restricted Stock Unit Agreement for use with the Long-Term Incentive Program under the 2005 Amended and Restated Equity Incentive Plan (incorporated herein by reference to Exhibit 10.14 to Cymer’s Annual Report on Form 10-K for the year ended December 31, 2008.). | |
| 10.13# | Amended and Restated Employment Agreement, effective as of November 6, 2008, by and between Robert P. Akins and Cymer (incorporated herein by reference to Exhibit 10.15 to Cymer’s Annual Report on Form 10-K for the year ended December 31, 2008.). | |
| 10.14# | Amended and Restated Employment Agreement, effective as of November 6, 2008, by and between Edward Brown, Jr. and Cymer (incorporated herein by reference to Exhibit 10.16 to Cymer’s Annual Report on Form 10-K for the year ended December 31, 2008.). | |
| 10.15# | Amended and Restated Employment Agreement, effective as of November 6, 2008, by and between Rae Ann Werner and Cymer (incorporated herein by reference to Exhibit 10.18 to Cymer’s Annual Report on Form 10-K for the year ended December 31, 2008.). | |
| 10.16# | Employment Agreement, effective as of December 19, 2009, by and between Paul B. Bowman and Cymer. | |
| 10.17# | Separation agreement, effective as of October 19, 2009, by and between Rae Ann Werner and Cymer. | |
| 10.18# | Summary description of Cymer, Inc. 3-Year Bonus Program (incorporated herein by reference to Exhibit 99.1 to Cymer’s Current Report on Form 8-K filed on April 1, 2005). | |
| 10.19# | Summary description of Cymer, Inc. Short-Term Incentive Bonus Plan, as amended (incorporated herein by reference to Exhibit 99.1 to Cymer’s Current Report on Form 8-K filed on April 20, 2007). | |
56
Table of Contents
| 10.20# | Summary description of Cymer, Inc. Long-Term Incentive Bonus Plan for 2007, as amended (incorporated herein by reference to Exhibit 99.2 to Cymer’s Current Report on Form 8-K filed on April 20, 2007). | |
| 10.21# | Summary description of Cymer, Inc. Long-Term Incentive Bonus Program, effective January 1, 2008 (incorporated herein by reference to Exhibit 10.21 to Cymer’s Annual Report on Form 10-K for the year ended December 31, 2007). | |
| 10.22# | Summary description of Cymer, Inc. Long-Term Incentive Program, effective January 1, 2009 (incorporated herein by reference to Exhibit 10.23 to Cymer’s Annual Report on Form 10-K for the year ended December 31, 2008). | |
| 10.23# | Summary description of Cymer, Inc. 2H-2009 Bonus Plan, effective August 19, 2009 (incorporated herein by reference to Exhibit 10.1 to Cymer’s Quarterly Report on Form 10-Q for the quarter ended September 30, 2009). | |
| 10.24# | Executive Nonqualified Excess Plan, as amended and restated (incorporated herein by reference to Exhibit 10.1 to Cymer’s Quarterly Report on Form 10-Q for the quarter ended March 31, 2008). | |
| 10.25# | Amended and Restated Executive Option and Group Health Coverage Extension Program (incorporated herein by reference to Exhibit 10.24 to Cymer’s Annual Report on Form 10-K for the year ended December 31, 2007). | |
| 10.26* | Amended and Restated Joint Venture Agreement, dated September 12, 2006, among TCZ GmbH, Cymer, Inc., Carl Zeiss SMT AG and Carl Zeiss Laser Optics Beteiligungsgesellschaft mbH and TCZ Pte Ltd (incorporated herein by reference to Exhibit 10.2 to Cymer’s Quarterly Report on Form 10-Q for the quarter ended September 30, 2006). | |
| 10.27 | Amendment No. 1 to Amended and Restated Joint Venture Agreement dated January 9, 2009 by and between Cymer, Inc, and Carl Zeiss Laser Optics Beteiligungsgesellschaft mbH (incorporated herein by reference to Exhibit 10.28 to Cymer’s Annual Report on Form 10-K for the year ended December 31, 2008). | |
| 10.28 | Memorandum of Understanding, dated January 14, 2010, by and among Cymer, Inc. and Carl Zeiss Laser Optics Beteiligungsgesellschaft mbH, Carl Zeiss Optics GmbH, Carl Zeiss SMT AG (collectively, “Zeiss”) and TCZ Pte. Ltd. (“TCZ”), the joint venture between Cymer and Zeiss. | |
| 10.29* | Patent License Agreement, dated May 14, 2001, by and among Cymer, Inc., Linda B. Jacob, Joseph A. Mangano, and Science Research Laboratory, Inc. (incorporated herein by reference to Exhibit 10.2 to Cymer’s Quarterly Report on Form 10-Q for the quarter ended June 30, 2001). | |
| 10.30* | Patent Sublicense Agreement, dated May 14, 2001, by and between Science Research Laboratory, Inc. and Cymer, Inc. (incorporated herein by reference to Exhibit 10.2 to Cymer’s Quarterly Report on Form 10-Q for the quarter ended June 30, 2001). | |
| 10.31* | Patent Sublicense Agreement, dated November 7, 2003, by and between SRL-EUV, LLC and Cymer, Inc. (incorporated herein by reference to Exhibit 10.27 to Cymer’s Annual Report on Form 10-K for the year ended December 31, 2003). | |
| 10.32* | Patent Sublicense Agreement, dated November 7, 2003, by and between Science Research Laboratory, Inc. and Cymer, Inc. (incorporated herein by reference to Exhibit 10.28 to Cymer’s Annual Report on Form 10-K for the year ended December 31, 2003). | |
| 10.33* | Intellectual Property License Agreement dated February 4, 2004, by and between Cymer, Inc. and Intel Corporation (incorporated herein by reference to Exhibit 10.2 to Cymer’s Quarterly Report on Form 10-Q for the quarter ended March 31, 2004). | |
| 10.34* | Amended Intellectual Property License Agreement, effective June 27, 2006, by and between Intel Corporation and Cymer, Inc (incorporated herein by reference to Exhibit 10.2 to Cymer’s Quarterly Report on Form 10-Q for the quarter ended June 30, 2006). | |
57
Table of Contents
| 14.1 | Code of Ethics for Chief Executive, Chief Financial and Chief Accounting Officers (incorporated herein by reference to Exhibit 14.1 to Cymer’s Annual Report on Form 10-K for the year ended December 31, 2007) | |
| 21.1 | Subsidiaries of Cymer (incorporated herein by reference to Exhibit 21.1 to Cymer’s Annual Report on Form 10-K for the year ended December 31, 2007). | |
| 23.1 | Consent of KPMG LLP, Independent Registered Public Accounting Firm. | |
| 24.1 | Power of Attorney (reference is made to the signature page). | |
| 31.1 | Certification of Chief Executive Officer pursuant to Section 302 of the Sarbanes-Oxley Act. | |
| 31.2 | Certification of Chief Financial Officer pursuant to Section 302 of the Sarbanes-Oxley Act. | |
| 32.1 | Certification of Chief Executive Officer pursuant to Section 906 of the Sarbanes-Oxley Act. | |
| 32.2 | Certification of Chief Financial Officer pursuant to Section 906 of the Sarbanes-Oxley Act. | |
| # | Indicates management contract or compensatory plan or arrangement. |
| * | Confidential treatment was requested with respect to certain portions of this exhibit. Omitted portions were filed separately with the SEC. |
58
Table of Contents
Pursuant to the requirements of Section 13 or 15(d) of the Securities Exchange Act of 1934, the registrant has duly caused this report to be signed on its behalf by the undersigned, thereunto duly authorized.
| CYMER, INC. | ||
| By: | /s/ ROBERT P. AKINS | |
| Robert P. Akins, Chief Executive Officer and Chairman of the Board | ||
|
Dated: February 26, 2010 | ||
KNOW ALL PERSONS BY THESE PRESENTS, that each person whose signature appears below constitutes and appoints Robert P. Akins, Paul B. Bowman and Karen K. McGinnis, and each of them, as his or her true and lawful attorneys-in-fact and agents, with full power of substitution and resubstitution, for him or her and in his or her name, place, and stead, in any and all capacities, to sign any and all amendments to this Annual Report on Form 10-K, and to file the same, with all exhibits thereto, and other documents in connection therewith, with the Securities and Exchange Commission, granting unto said attorneys-in-fact and agents, and each of them, full power and authority to do and perform each and every act and thing requisite and necessary to be done in connection therewith, as fully to all intents and purposes as he or she might or could do in person, hereby ratifying and confirming that all said attorneys-in-fact and agents, or any of them or their or his or her substitute or substituted, may lawfully do or cause to be done by virtue hereof.
59
Table of Contents
Pursuant to the requirements of the Securities Exchange Act of 1934, this report has been signed below by the following persons on behalf of the registrant and in the capacities and on the date indicated.
| /s/ ROBERT P. AKINS Robert P. Akins |
Chief Executive Officer and Chairman of the Board (Principal Executive Officer) |
February 26, 2010 | ||
| /s/ PAUL B. BOWMAN Paul B. Bowman |
Senior Vice President and Chief Financial Officer |
February 26, 2010 | ||
| /s/ KAREN K. MCGINNIS Karen K. McGinnis |
Vice President, Corporate Controller and Chief Accounting Officer (Principal Accounting Officer) |
February 26, 2010 | ||
| /s/ CHARLES J. ABBE Charles J. Abbe |
Director |
February 26, 2010 | ||
| /s/ EDWARD H. BRAUN Edward H. Braun |
Director |
February 26, 2010 | ||
| /s/ MICHAEL R. GAULKE Michael R. Gaulke |
Director |
February 26, 2010 | ||
| /s/ WILLIAM G. OLDHAM William G. Oldham |
Director |
February 26, 2010 | ||
| /s/ ERIC M. RUTTENBERG Eric M. Ruttenberg |
Director |
February 26, 2010 | ||
| /s/ PETER J. SIMONE Peter J. Simone |
Director |
February 26, 2010 | ||
| /s/ YOUNG K. SOHN Young K. Sohn |
Director |
February 26, 2010 | ||
| /s/ JON D. TOMPKINS Jon D. Tompkins |
Director |
February 26, 2010 | ||
60
Table of Contents
Report of Independent Registered Public Accounting Firm
The Board of Directors and Stockholders
Cymer, Inc.:
We have audited the accompanying consolidated balance sheets of Cymer, Inc. and subsidiaries (the Company) as of December 31, 2009 and 2008, and the related consolidated statements of operations, comprehensive income, equity, and cash flows for each of the years in the three-year period ended December 31, 2009. In connection with our audits of the consolidated financial statements, we also have audited the consolidated financial statement schedule of valuation and qualifying accounts. These consolidated financial statements and consolidated financial statement schedule are the responsibility of the Company’s management. Our responsibility is to express an opinion on these consolidated financial statements and consolidated financial statement schedule based on our audits.
We conducted our audits in accordance with the standards of the Public Company Accounting Oversight Board (United States). Those standards require that we plan and perform the audit to obtain reasonable assurance about whether the financial statements are free of material misstatement. An audit includes examining, on a test basis, evidence supporting the amounts and disclosures in the financial statements. An audit also includes assessing the accounting principles used and significant estimates made by management, as well as evaluating the overall financial statement presentation. We believe that our audits provide a reasonable basis for our opinion.
In our opinion, the consolidated financial statements referred to above present fairly, in all material respects, the financial position of Cymer, Inc. and subsidiaries as of December 31, 2009 and 2008, and the results of their operations and their cash flows for each of the years in the three-year period ended December 31, 2009, in conformity with U.S. generally accepted accounting principles. Also, in our opinion, the related consolidated financial statement schedule of valuation and qualifying accounts, when considered in relation to the basic consolidated financial statements taken as a whole, presents fairly, in all material respects, the information set forth therein.
We also have audited, in accordance with the standards of the Public Company Accounting Oversight Board (United States), Cymer Inc.’s internal control over financial reporting as of December 31, 2009, based on criteria established in Internal Control—Integrated Framework issued by the Committee of Sponsoring Organizations of the Treadway Commission (COSO), and our report dated February 26, 2010 expressed an unqualified opinion on the effectiveness of the Company’s internal control over financial reporting.
/s/ KPMG LLP
San Diego, California
February 26, 2010
F-1
Table of Contents
Report of Independent Registered Public Accounting Firm
The Board of Directors and Stockholders
Cymer, Inc.:
We have audited Cymer, Inc.’s (the Company) internal control over financial reporting as of December 31, 2009, based on criteria established in Internal Control—Integrated Framework issued by the Committee of Sponsoring Organizations of the Treadway Commission (COSO). Cymer, Inc.’s management is responsible for maintaining effective internal control over financial reporting and for its assessment of the effectiveness of internal control over financial reporting, included in the accompanying Management’s Report on Internal Control Over Financial Reporting in Item 9A2. Our responsibility is to express an opinion on the Company’s internal control over financial reporting based on our audit.
We conducted our audit in accordance with the standards of the Public Company Accounting Oversight Board (United States). Those standards require that we plan and perform the audit to obtain reasonable assurance about whether effective internal control over financial reporting was maintained in all material respects. Our audit included obtaining an understanding of internal control over financial reporting, assessing the risk that a material weakness exists, and testing and evaluating the design and operating effectiveness of internal control based on the assessed risk. Our audit also included performing such other procedures as we considered necessary in the circumstances. We believe that our audit provides a reasonable basis for our opinion.
A company’s internal control over financial reporting is a process designed to provide reasonable assurance regarding the reliability of financial reporting and the preparation of financial statements for external purposes in accordance with generally accepted accounting principles. A company’s internal control over financial reporting includes those policies and procedures that (1) pertain to the maintenance of records that, in reasonable detail, accurately and fairly reflect the transactions and dispositions of the assets of the company; (2) provide reasonable assurance that transactions are recorded as necessary to permit preparation of financial statements in accordance with generally accepted accounting principles, and that receipts and expenditures of the company are being made only in accordance with authorizations of management and directors of the company; and (3) provide reasonable assurance regarding prevention or timely detection of unauthorized acquisition, use, or disposition of the company’s assets that could have a material effect on the financial statements.
Because of its inherent limitations, internal control over financial reporting may not prevent or detect misstatements. Also, projections of any evaluation of effectiveness to future periods are subject to the risk that controls may become inadequate because of changes in conditions, or that the degree of compliance with the policies or procedures may deteriorate.
In our opinion, Cymer, Inc. maintained, in all material respects, effective internal control over financial reporting as of December 31, 2009, based on criteria established in Internal Control—Integrated Framework issued by the Committee of Sponsoring Organizations of the Treadway Commission (COSO).
We also have audited, in accordance with the standards of the Public Company Accounting Oversight Board (United States), the consolidated balance sheets of Cymer, Inc. as of December 31, 2009 and 2008, and the related consolidated statements of operations, comprehensive income, equity, and cash flows for each of the years in the three year period ended December 31, 2009, and the related consolidated financial statement schedule, and our report dated February 26, 2010 expressed an unqualified opinion on those consolidated financial statements and consolidated financial statement schedule.
/s/ KPMG LLP
San Diego, California
February 26, 2010
F-2
Table of Contents
CONSOLIDATED BALANCE SHEETS
(In thousands, except share data)
| December 31, 2009 |
December 31, 2008 |
|||||||
| ASSETS |
||||||||
| CURRENT ASSETS: |
||||||||
| Cash and cash equivalents |
$ | 118,381 | $ | 252,391 | ||||
| Restricted cash |
1,200 | — | ||||||
| Short-term investments |
62,895 | 30,900 | ||||||
| Accounts receivable—net |
76,792 | 64,296 | ||||||
| Accounts receivable—related party |
732 | 818 | ||||||
| Inventories |
185,077 | 194,746 | ||||||
| Deferred and prepaid income taxes |
45,689 | 46,886 | ||||||
| Prepaid expenses and other assets |
12,121 | 9,344 | ||||||
| Total current assets |
502,887 | 599,381 | ||||||
| PROPERTY AND EQUIPMENT—NET |
106,755 | 114,390 | ||||||
| LONG-TERM INVESTMENTS |
5,167 | 9,456 | ||||||
| DEFERRED INCOME TAXES |
26,998 | 29,168 | ||||||
| GOODWILL |
8,833 | 8,833 | ||||||
| INTANGIBLE ASSETS—NET |
8,327 | 9,898 | ||||||
| OTHER ASSETS |
5,951 | 6,318 | ||||||
| TOTAL ASSETS |
$ | 664,918 | $ | 777,444 | ||||
| LIABILITIES |
||||||||
| CURRENT LIABILITIES: |
||||||||
| Accounts payable |
$ | 21,756 | $ | 15,003 | ||||
| Accounts payable—related party |
9,284 | 4,108 | ||||||
| Accrued warranty |
16,640 | 23,565 | ||||||
| Accrued payroll and benefits |
16,434 | 12,682 | ||||||
| Accrued patents, royalties and other fees |
3,501 | 3,795 | ||||||
| Convertible subordinated notes |
— | 140,722 | ||||||
| Deferred and accrued income taxes |
12,363 | 1,085 | ||||||
| Deferred revenue |
22,339 | 15,344 | ||||||
| Accrued and other current liabilities |
1,306 | 8,278 | ||||||
| Total current liabilities |
103,623 | 224,582 | ||||||
| ACCRUED INCOME TAXES |
11,562 | 18,447 | ||||||
| DEFERRED REVENUE |
525 | — | ||||||
| OTHER LIABILITIES |
7,570 | 11,791 | ||||||
| Total liabilities |
$ | 123,280 | $ | 254,820 | ||||
| COMMITMENTS AND CONTINGENCIES-Note 11 |
||||||||
| SUBSEQUENT EVENTS-Note 15 |
||||||||
| EQUITY |
||||||||
| CYMER, INC. STOCKHOLDERS’ EQUITY: |
||||||||
| Preferred stock—authorized 5,000,000 shares; $.001 par value; no shares issued or outstanding |
— | — | ||||||
| Common stock—authorized 100,000,000 shares; $.001 par value; 42,751,000 shares issued and 29,899,000 shares outstanding at December 31, 2009; 42,461,000 shares issued and 29,609,000 shares outstanding at December 31, 2008 |
43 | 42 | ||||||
| Additional paid-in capital |
598,314 | 586,539 | ||||||
| Treasury stock at cost (12,852,000 common shares at December 31, 2009 and December 31, 2008). |
(473,580 | ) | (473,580 | ) | ||||
| Accumulated other comprehensive loss |
(8,280 | ) | (5,999 | ) | ||||
| Retained earnings |
422,750 | 410,774 | ||||||
| Total Cymer, Inc. stockholders’ equity |
539,247 | 517,776 | ||||||
| Noncontrolling interest |
2,391 | 4,848 | ||||||
| Total equity |
541,638 | 522,624 | ||||||
| TOTAL LIABILITIES AND EQUITY |
$ | 664,918 | $ | 777,444 | ||||
See Notes to Consolidated Financial Statements.
F-3
Table of Contents
CONSOLIDATED STATEMENTS OF OPERATIONS
(In thousands, except per share data)
| Years Ended December 31, | ||||||||||||
| 2009 | 2008 | 2007 | ||||||||||
| REVENUES: |
||||||||||||
| Product sales |
$ | 306,795 | $ | 456,729 | $ | 517,980 | ||||||
| Product sales—related party |
869 | 2,281 | 3,716 | |||||||||
| Total revenues |
307,664 | 459,010 | 521,696 | |||||||||
| COST OF REVENUES |
171,250 | 240,768 | 260,280 | |||||||||
| GROSS PROFIT |
136,414 | 218,242 | 261,416 | |||||||||
| OPERATING EXPENSES: |
||||||||||||
| Research and development |
65,809 | 95,229 | 81,842 | |||||||||
| Sales and marketing |
16,603 | 23,713 | 26,163 | |||||||||
| General and administrative |
27,569 | 36,180 | 38,949 | |||||||||
| Restructuring |
8,407 | 3,038 | — | |||||||||
| Total operating expenses |
118,388 | 158,160 | 146,954 | |||||||||
| OPERATING INCOME |
18,026 | 60,082 | 114,462 | |||||||||
| OTHER INCOME (EXPENSE): |
||||||||||||
| Foreign currency exchange gain (loss) |
(1,107 | ) | (6,642 | ) | 2,025 | |||||||
| Write-down of investments |
(291 | ) | (5,309 | ) | — | |||||||
| Interest and other income |
1,509 | 8,845 | 20,074 | |||||||||
| Interest and other expense |
(1,029 | ) | (6,712 | ) | (6,709 | ) | ||||||
| Total other income (expense)—net |
(918 | ) | (9,818 | ) | 15,390 | |||||||
| INCOME BEFORE INCOME TAX PROVISION |
17,108 | 50,264 | 129,852 | |||||||||
| INCOME TAX PROVISION |
8,389 | 16,587 | 44,413 | |||||||||
| NET INCOME |
$ | 8,719 | $ | 33,677 | $ | 85,439 | ||||||
| Net loss attributable to noncontrolling interest in subsidiary |
3,257 | 2,863 | 2,923 | |||||||||
| NET INCOME ATTRIBUTABLE TO CYMER, INC. |
$ | 11,976 | $ | 36,540 | $ | 88,362 | ||||||
| EARNINGS PER SHARE: |
||||||||||||
| Basic earnings per share |
$ | 0.40 | $ | 1.22 | $ | 2.64 | ||||||
| Weighted average common shares outstanding—basic |
29,738 | 29,924 | 33,522 | |||||||||
| Diluted earnings per share |
$ | 0.40 | $ | 1.22 | $ | 2.50 | ||||||
| Weighted average common shares outstanding—diluted |
29,945 | 29,992 | 36,784 | |||||||||
See Notes to Consolidated Financial Statements.
F-4
Table of Contents
CONSOLIDATED STATEMENTS OF COMPREHENSIVE INCOME
(In thousands)
| Years Ended December 31, | ||||||||||||
| 2009 | 2008 | 2007 | ||||||||||
| Net income |
$ | 8,719 | $ | 33,677 | $ | 85,439 | ||||||
| Other comprehensive income (loss) |
||||||||||||
| Foreign currency translation adjustments |
(2,298 | ) | (5,921 | ) | 4,021 | |||||||
| Unrealized (losses) gains on available-for-sale investments, net of income tax (benefit) expense of $(97), $(42) and $197 |
(159 | ) | (68 | ) | 321 | |||||||
| Unrealized gains (losses) on foreign currency forward exchange contracts, net of income tax expense (benefit) of $154, $(173) and $50 |
226 | (254 | ) | 73 | ||||||||
| Unrealized pension (losses) gains, net of income tax (benefit) of $(43), $(21) and $(70) |
(50 | ) | 30 | (135 | ) | |||||||
| Total other comprehensive income (loss) |
(2,281 | ) | (6,213 | ) | 4,280 | |||||||
| Comprehensive income |
$ | 6,438 | $ | 27,464 | $ | 89,719 | ||||||
| Comprehensive loss attributable to noncontrolling interest in subsidiary |
3,257 | 2,863 | 2,923 | |||||||||
| Comprehensive income attributable to Cymer, Inc. |
$ | 9,695 | $ | 30,327 | $ | 92,642 | ||||||
See Notes to Consolidated Financial Statements.
F-5
Table of Contents
CONSOLIDATED STATEMENTS OF EQUITY
(in thousands)
| Common Stock | Additional Paid-in Capital |
Treasury Stock | Accumulated Other Comprehensive Income (Loss) |
Retained Earnings |
Total | Noncontrolling Interest |
Total | |||||||||||||||||||||||||||||
| Shares | Amount | Shares | Amount | |||||||||||||||||||||||||||||||||
| BALANCE, DECEMBER 31, 2006 |
41,774 | $ | 42 | $ | 557,082 | (4,536 | ) | ($ | 150,704 | ) | ($ | 4,066 | ) | $ | 285,540 | $ | 687,894 | $ | 6,634 | $ | 694,528 | |||||||||||||||
| Cumulative effect of adoption of authoritative guidance for uncertain tax positions |
— | — | — | — | — | — | 358 | 358 | — | 358 | ||||||||||||||||||||||||||
| Exercise of common stock options |
519 | — | 14,138 | — | — | — | — | 14,138 | — | 14,138 | ||||||||||||||||||||||||||
| Issuance of resticted stock awards |
18 | — | — | — | — | — | — | — | — | — | ||||||||||||||||||||||||||
| Issuance of employee stock purchase plan shares |
28 | — | 1,122 | — | — | — | — | 1,122 | — | 1,122 | ||||||||||||||||||||||||||
| Stock-based compensation |
— | — | 5,642 | — | — | — | — | 5,642 | — | 5,642 | ||||||||||||||||||||||||||
| Income tax benefit from stock options exercised |
— | — | 1,727 | — | — | — | — | 1,727 | — | 1,727 | ||||||||||||||||||||||||||
| Repurchase of common stock into treasury |
— | — | — | (7,513 | ) | (300,000 | ) | — | — | (300,000 | ) | (300,000 | ) | |||||||||||||||||||||||
| Capital contribution by minority shareholder |
2,000 | 2,000 | ||||||||||||||||||||||||||||||||||
| Net income |
— | — | — | — | — | — | 88,362 | 88,362 | (2,923 | ) | 85,439 | |||||||||||||||||||||||||
| Other comprehensive income: |
— | — | — | — | — | — | — | — | — | — | ||||||||||||||||||||||||||
| Foreign currency translation adjustment |
— | — | — | — | — | 4,021 | — | 4,021 | — | 4,021 | ||||||||||||||||||||||||||
| Unrealized gains on available-for-sale investments, net of tax |
— | — | — | — | — | 321 | — | 321 | — | 321 | ||||||||||||||||||||||||||
| Unrealized gains on forward exchange contracts, net of tax |
— | — | — | — | — | 73 | — | 73 | — | 73 | ||||||||||||||||||||||||||
| Unrealized pension losses, net of tax |
— | — | — | — | — | (135 | ) | — | (135 | ) | — | (135 | ) | |||||||||||||||||||||||
| BALANCE, DECEMBER 31, 2007 |
42,339 | $ | 42 | $ | 579,711 | (12,049 | ) | ($ | 450,704 | ) | $ | 214 | $ | 374,260 | $ | 503,523 | $ | 5,711 | $ | 509,234 | ||||||||||||||||
| Exercise of common stock options |
70 | — | 1,630 | — | — | — | — | 1,630 | — | 1,630 | ||||||||||||||||||||||||||
| Issuance of resticted stock awards |
15 | — | — | — | — | — | — | — | — | — | ||||||||||||||||||||||||||
| Issuance of employee stock purchase plan shares |
37 | — | 876 | — | — | — | — | 876 | — | 876 | ||||||||||||||||||||||||||
| Stock-based compensation |
— | — | 5,630 | — | — | — | — | 5,630 | — | 5,630 | ||||||||||||||||||||||||||
| Income tax shortfall from stock option exercises |
— | — | (1,308 | ) | — | — | — | — | (1,308 | ) | — | (1,308 | ) | |||||||||||||||||||||||
| Repurchase of common stock into treasury |
— | — | — | (803 | ) | (22,876 | ) | — | — | (22,876 | ) | — | (22,876 | ) | ||||||||||||||||||||||
| Capital contribution by minority shareholder |
— | — | — | — | — | — | — | — | 2,000 | 2,000 | ||||||||||||||||||||||||||
| Net income |
— | — | — | — | — | — | 36,540 | 36,540 | (2,863 | ) | 33,677 | |||||||||||||||||||||||||
| Other comprehensive income: |
— | — | — | — | — | — | — | — | — | — | ||||||||||||||||||||||||||
| Translation adjustment |
— | — | — | — | — | (5,921 | ) | — | (5,921 | ) | — | (5,921 | ) | |||||||||||||||||||||||
| Unrealized losses on available-for-sale investments, net of tax |
— | — | — | — | — | (68 | ) | — | (68 | ) | — | (68 | ) | |||||||||||||||||||||||
| Unrealized losses on forward exchange contracts, net of tax |
— | — | — | — | — | (254 | ) | — | (254 | ) | — | (254 | ) | |||||||||||||||||||||||
| Unrealized pension gains, net of tax |
— | — | — | — | — | 30 | — | 30 | — | 30 | ||||||||||||||||||||||||||
| Cumulative effect adjustment due to the adoption of the measurement date |
— | — | — | — | — | — | — | — | — | — | ||||||||||||||||||||||||||
| Provisions of authoritative guidance for retirement benefits, net of tax |
— | — | — | — | — | — | (26 | ) | (26 | ) | — | (26 | ) | |||||||||||||||||||||||
| BALANCE, DECEMBER 31, 2008 |
42,461 | $ | 42 | $ | 586,539 | (12,852 | ) | ($ | 473,580 | ) | ($ | 5,999 | ) | $ | 410,774 | $ | 517,776 | $ | 4,848 | $ | 522,624 | |||||||||||||||
| Exercise of common stock options |
232 | 1 | 6,202 | — | — | — | — | 6,203 | — | 6,203 | ||||||||||||||||||||||||||
| Issuance of resticted stock awards |
37 | — | — | — | — | — | — | — | — | — | ||||||||||||||||||||||||||
| Issuance of employee stock purchase plan shares |
21 | — | 622 | — | — | — | — | 622 | — | 622 | ||||||||||||||||||||||||||
| Stock-based compensation |
— | — | 5,667 | — | — | — | — | 5,667 | — | 5,667 | ||||||||||||||||||||||||||
| Income tax shortfall from stock option exercises |
— | — | (716 | ) | — | — | — | — | (716 | ) | — | (716 | ) | |||||||||||||||||||||||
| Capital contribution by minority shareholder |
— | — | — | — | — | — | — | — | 800 | 800 | ||||||||||||||||||||||||||
| Net income |
— | — | — | — | — | — | 11,976 | 11,976 | (3,257 | ) | 8,719 | |||||||||||||||||||||||||
| Other comprehensive income: |
— | — | — | — | — | — | — | — | — | — | ||||||||||||||||||||||||||
| Translation adjustment |
— | — | — | — | — | (2,298 | ) | — | (2,298 | ) | — | (2,298 | ) | |||||||||||||||||||||||
| Unrealized losses on available-for-sale investments, net of tax |
— | — | — | — | — | (159 | ) | — | (159 | ) | — | (159 | ) | |||||||||||||||||||||||
| Unrealized gains on forward exchange contracts, net of tax |
— | — | — | — | — | 226 | — | 226 | — | 226 | ||||||||||||||||||||||||||
| Unrealized pension losses, net of tax |
— | — | — | — | — | (50 | ) | — | (50 | ) | — | (50 | ) | |||||||||||||||||||||||
| BALANCE, DECEMBER 31, 2009 |
42,751 | $ | 43 | $ | 598,314 | (12,852 | ) | ($ | 473,580 | ) | ($ | 8,280 | ) | $ | 422,750 | $ | 539,247 | $ | 2,391 | $ | 541,638 | |||||||||||||||
See Notes to Consolidated Financial Statements.
F-6
Table of Contents
CONSOLIDATED STATEMENTS OF CASH FLOWS
(In thousands)
| Years Ended December 31, | ||||||||||||
| 2009 | 2008 | 2007 | ||||||||||
| OPERATING ACTIVITIES: |
||||||||||||
| Net income |
$ | 8,719 | $ | 33,677 | $ | 85,439 | ||||||
| Adjustments to reconcile net income to net cash provided by (used in) operating activities: |
||||||||||||
| Depreciation and amortization |
21,057 | 26,633 | 25,523 | |||||||||
| Stock-based compensation |
5,667 | 5,630 | 5,642 | |||||||||
| Bad debt expense |
2 | 1,885 | (323 | ) | ||||||||
| Excess tax benefits from stock option exercises |
(267 | ) | (58 | ) | (1,727 | ) | ||||||
| Provision for deferred income taxes |
(634 | ) | (14,006 | ) | 2,791 | |||||||
| Loss on disposal and impairment of property and equipment |
1,881 | 297 | 292 | |||||||||
| Write-down of investments |
291 | 5,309 | — | |||||||||
| Change in assets and liabilities: |
||||||||||||
| Restricted cash |
(1,200 | ) | — | — | ||||||||
| Accounts receivable |
(12,651 | ) | 26,275 | 24,305 | ||||||||
| Accounts receivable—related party |
86 | 294 | (278 | ) | ||||||||
| Inventories |
9,487 | (63,620 | ) | (25,461 | ) | |||||||
| Prepaid expenses and other assets |
(2,684 | ) | (2,414 | ) | (2,218 | ) | ||||||
| Accounts payable |
5,429 | (8,788 | ) | 5,269 | ||||||||
| Accounts payable—related party |
3,876 | (320 | ) | (430 | ) | |||||||
| Accrued expenses and other liabilities |
(14,536 | ) | (13,557 | ) | 185 | |||||||
| Deferred revenue |
7,379 | 4,909 | 7,992 | |||||||||
| Income taxes payable and accrued income taxes |
7,483 | (13,322 | ) | 15,077 | ||||||||
| Net cash provided by (used in) operating activities |
39,385 | (11,176 | ) | 142,078 | ||||||||
| INVESTING ACTIVITIES: |
||||||||||||
| Acquisition of property and equipment |
(12,334 | ) | (23,689 | ) | (26,637 | ) | ||||||
| Purchases of investments |
(94,161 | ) | (90,309 | ) | (91,440 | ) | ||||||
| Proceeds from sold or matured investments |
65,909 | 95,051 | 256,720 | |||||||||
| Acquisition of patents |
— | — | (121 | ) | ||||||||
| Net cash (used in) provided by investing activities |
(40,586 | ) | (18,947 | ) | 138,522 | |||||||
| FINANCING ACTIVITIES: |
||||||||||||
| Proceeds from issuance of common stock |
6,744 | 2,506 | 15,260 | |||||||||
| Cash investment in joint venture received from minority shareholder |
800 | 2,000 | 2,000 | |||||||||
| Repayment of convertible subordinated notes |
(140,722 | ) | — | — | ||||||||
| Excess tax benefit from stock option exercises |
267 | 58 | 1,727 | |||||||||
| Repurchase of common stock into treasury |
— | (22,876 | ) | (300,000 | ) | |||||||
| Net cash used in financing activities |
(132,911 | ) | (18,312 | ) | (281,013 | ) | ||||||
| EFFECT OF EXCHANGE RATE CHANGES ON CASH AND CASH EQUIVALENTS |
102 | (4,881 | ) | 4,022 | ||||||||
| NET (DECREASE) INCREASE IN CASH AND CASH EQUIVALENTS |
(134,010 | ) | (53,316 | ) | 3,609 | |||||||
| CASH AND CASH EQUIVALENTS AT BEGINNING OF THE YEAR |
252,391 | 305,707 | 302,098 | |||||||||
| CASH AND CASH EQUIVALENTS AT END OF THE YEAR |
$ | 118,381 | $ | 252,391 | $ | 305,707 | ||||||
| SUPPLEMENTAL DISCLOSURE OF CASH FLOW INFORMATION: |
||||||||||||
| Interest paid |
$ | 2,803 | $ | 5,549 | $ | 5,469 | ||||||
| Income taxes paid |
$ | 11,232 | $ | 45,770 | $ | 26,871 | ||||||
See Notes to Consolidated Financial Statements.
F-7
Table of Contents
NOTES TO CONSOLIDATED FINANCIAL STATEMENTS
1. DESCRIPTION OF BUSINESS AND SUMMARY OF SIGNIFICANT ACCOUNTING POLICIES
Nature of Operations. Cymer, Inc., together with its wholly-owned subsidiaries, is engaged primarily in the development, manufacturing and marketing of excimer light sources for sale to customers who manufacture photolithography tools in the semiconductor equipment industry. In addition, we sell replacement parts and support to our lithography tool manufacturer customers as well as directly to our chipmaker customers. As of December 31, 2009, we were the majority-owner of TCZ Pte. Ltd., (“TCZ”), located in Singapore. Effective January 15, 2010, we purchased the remaining 40% ownership interest in TCZ. TCZ is currently developing, and will integrate, market and sell, and support, production tools for the flat panel display manufacturing industry. See further information in Note 15, “Subsequent Events”.
We manufacture our products primarily at our San Diego headquarters, and we also conduct refurbishment manufacturing activities for replacement parts at our subsidiary office located in Korea. We sell our products to customers primarily in the United States, Europe, Japan, Taiwan, Korea and other Asian countries. We provide customer support from our San Diego headquarters, and from our field offices located throughout the United States, Europe, Japan, Korea, Singapore, China, and Taiwan.
Principles of Consolidation. The accompanying consolidated financial statements include the accounts of Cymer, Inc., the accounts of our wholly owned subsidiaries and the financial position and results of operations of TCZ. We reflect the noncontrolling interest of TCZ in our consolidated financial statements and any earnings or losses are distributed in accordance with the respective percentage interests of the joint owners. See further information surrounding TCZ at Note 15 “Subsequent Events.” All significant intercompany balances and transactions have been eliminated in consolidation.
Use of Estimates. The consolidated financial statements have been prepared in conformity with accounting principles generally accepted in the United States of America. The preparation of these financial statements requires us to make estimates and use judgment that may affect the reported amounts of assets, liabilities, revenues, expenses, and related disclosure of contingent assets and liabilities. As a part of our ongoing internal processes, we regularly evaluate our estimates and judgments associated with revenue recognition, inventory valuation, warranty obligations, stock-based compensation, income taxes, allowances for doubtful accounts, long-lived assets valuation, goodwill valuation, and contingencies and litigation. We base these estimates and judgments upon historical information, projected information, and other facts and assumptions that we believe to be valid and/or reasonable under the circumstances. These assumptions and facts form the basis for making judgments and estimates and for determining the carrying values of our assets and liabilities that are not apparent from other sources. Actual results could differ materially from management’s estimates.
Fair Value of Financial Instruments. The fair value of our cash and cash equivalents, restricted cash, accounts receivable, related party accounts receivable, accounts payable, related party accounts payable, and other current liabilities approximate their carrying amounts due to their short-term nature.
Fair Value Measurements. We account for our financial assets and liabilities that are being measured and reported on at fair value on a recurring basis per the provisions of the authoritative guidance for fair value measurements. This includes certain items we currently report in cash equivalents and available-for-sale securities within our cash and cash equivalents, short term and long term investments on the accompanying consolidated balance sheets. In addition, our derivatives, which consisted of foreign currency forward exchange contracts, are reported at fair value and are included in the scope of the authoritative guidance for fair value measurements and disclosures.
The authoritative guidance for fair value measurements stipulates that fair value is defined as the price at which an asset or liability could be exchanged in a current transaction between knowledgeable, willing parties. Where available, fair value is based on observable market prices or parameters or derived from such prices or
F-8
Table of Contents
NOTES TO CONSOLIDATED FINANCIAL STATEMENTS—(Continued)
parameters. Where observable prices or inputs are not available, valuation models are applied. These valuation techniques include unobservable inputs and involve some level of estimation and judgment on the part of the reporting entity, the degree of which is dependent on the price transparency for the instruments or market and the instruments’ complexity.
Per the authoritative guidance for fair value instruments, assets and liabilities recorded at fair value in our consolidated balance sheets are categorized based upon the level of judgment associated with the inputs used to measure their fair value. The levels as defined by the fair value hierarchy in the authoritative guidance for fair value instruments are as follows:
| Level 1— |
Inputs are unadjusted, quoted prices in active markets for identical assets or liabilities at the measurement date. | |
| Level 2— |
Inputs other than quoted prices included within Level 1 that are observable for the asset or liability, either directly or indirectly at the measurement date. | |
| Level 3— |
Inputs are unobservable for the asset or liability and usually reflect the reporting entity’s best estimate of what market participants would use in pricing the asset or liability at the measurement date. | |
Cash Equivalents and Investments. All highly liquid investments purchased with an original maturity of three months or less are considered to be cash equivalents. As of December 31, 2009 and 2008, we had $91.0 million and $170.3 million of cash equivalents, respectively.
Our short and long-term investment portfolio consists primarily of government and corporate fixed income securities, and commercial paper, all of which are classified as available-for-sale and are carried on the consolidated balance sheet at fair value, which is primarily based on quoted market prices for such securities. While it is our general intent to hold such investments until maturity, we occasionally sell our investments for cash flow purposes. Available-for-sale securities are recorded at fair value, and unrealized holding gains and losses are recorded, net of tax, as a separate component of accumulated other comprehensive income (loss). Available-for-sale securities with remaining maturities of less than one year are classified as short-term, and all other available-for-sale securities are classified as long-term. Unrealized losses are charged against net earnings when a decline in fair value is determined to be other than temporary. Management reviews several factors to determine whether a loss is other than temporary, such as the length of time a security is in an unrealized loss position, the extent to which fair value is less than its amortized cost, the impact of changing interest rates in the short and long term, the financial condition and near term prospects of the issuer and our intent and ability to hold the security for a period of time sufficient to allow for any anticipated recovery in fair value. Realized gains and losses are accounted for on the specific identification method. Purchases and sales are recorded on a trade date basis.
Restricted Cash. At December 31, 2009, we have $1.2 million in restricted cash which is associated with a secured refund bond that we entered into and was required by one of TCZ’s customers related to a sale to them.
Inventories. Inventories are recorded at the lower of cost, determined on a first-in, first-out basis, or estimated market value. Inventory costs include material, labor and manufacturing overhead costs. Our inventories include reusable parts that we receive from our customers as part of consumed assemblies. We refurbish these returned core assemblies, which consist primarily of metal components, and reuse them in future core assemblies. Refurbishment costs are capitalized as incurred. We review the components of our inventory on a quarterly basis for excess or obsolete inventory and make appropriate adjustments to the value of our inventory in the period that such excess or obsolete inventory is identified.
F-9
Table of Contents
NOTES TO CONSOLIDATED FINANCIAL STATEMENTS—(Continued)
As part of our regular business activities, we conduct significant parts refurbishment and material reclaim activities related to some of our core assemblies, particularly our chamber assemblies. These activities involve arrangements with our customers where we sell a new part to the customer at a reduced sales price if the customer returns the consumed core assembly that the new part replaces. These returned core assemblies contain a certain amount of material, primarily metal components, that may be reused by us in the manufacture of future core assemblies. Upon receipt of these consumed core assemblies from our customers, we record an entry to recognize the estimated fair value of the reusable components either 1) as revenue if the return of the core assembly relates to a spare part replacement sale or 2) as a reduction in cost of revenues if the return of the core assembly is related to a part being replaced under our warranty provisions. The fair value of the reusable parts contained within the consumed assembly is recorded in inventory based upon historical data on the value of the reusable parts that we typically yield from a consumed core assembly.
Property, Plant and Equipment. Our property, plant and equipment are recorded at cost. Depreciation is computed using the straight-line method over twenty years for buildings; one to five years for equipment; and three years for light source systems built for internal use. Amortization of leasehold improvements and leased equipment is calculated using the straight-line method over the lease term or the estimated useful life of the assets, whichever period is shorter. Additions and improvements are capitalized, while maintenance and repairs are expensed as incurred. When depreciable assets are retired, or otherwise disposed of, the cost and related accumulated depreciation are removed from the accounts and any related gains or losses are included in the consolidated statement of operations.
Goodwill. Goodwill is not amortized but instead is tested at least annually for impairment, or more frequently when events or changes in circumstances indicate that the assets might be impaired. This impairment test is performed annually during the fiscal fourth quarter. A two-step test is used to identify the potential impairment and to measure the amount of goodwill impairment, if any. The first step is to compare the fair value of the reporting unit with its carrying amount, including goodwill. If the fair value of the reporting unit exceeds its carrying amount, goodwill is considered not impaired; otherwise, goodwill is impaired and the loss is measured by performing step two. Under step two, the impairment loss is measured by comparing the implied fair value of the reporting unit goodwill with the carrying amount of goodwill.
Intangible Assets, Net. Our intangible assets consist of patents, which are amortized using the straight-line basis over their expected useful lives.
Valuation of Long-Lived Assets. We review the carrying value and remaining useful life of our long-lived assets, including property and equipment and intangible assets, for impairment when events or circumstances indicate that the carrying amount may not be recoverable. Other factors that would indicate potential impairment may include, but are not limited to, significant decreases in the market value of the long-lived asset, a significant change in the long-lived asset’s physical condition, and operating or cash flow losses associated with the use of the long-lived asset. Recoverability of assets to be held and used is measured by a comparison of the carrying amount of the asset to the future net cash flows, undiscounted and without interest, expected to be generated by the asset. If such assets are considered to be impaired, the impairment is measured and recorded based upon the amount by which the carrying amount of the asset exceeds the fair value of the asset. Assets to be disposed of are reported at the lower of the carrying amount or fair value less costs to sell.
Foreign Currency Translation. The financial statements of our foreign subsidiaries where the functional currency is the local currency are translated into U.S. Dollars using current rates of exchange for assets and liabilities and rates of exchange that approximate the rates in effect at the transaction date for revenues, cost of revenues, expenses, gains and losses. Gains and losses resulting from foreign currency translation are accumulated as a separate component of our consolidated statement of equity in accumulated other comprehensive income (loss). Gains and losses resulting from foreign currency transactions are included in the consolidated statements of operations.
F-10
Table of Contents
NOTES TO CONSOLIDATED FINANCIAL STATEMENTS—(Continued)
Derivative Instruments. We conduct business in several international currencies through our global operations. We maintain a foreign exchange risk management policy with the goal of protecting product margins and minimizing the short term volatility of reported earnings due to foreign currency risk exposure. In accordance with our policy, we use financial instruments, principally forward contracts, to manage certain of our foreign currency risk exposures. Forward contracts acquired to protect the product margins of forecasted transactions, primarily the purchases of our products by our Japanese subsidiary in U.S. Dollars for resale under firm third-party sales commitments denominated in Japanese Yen are accounted for in accordance with the provisions of the authoritative guidance for derivatives and hedging. We also enter into forward contracts to offset gains and losses on assets and liabilities held in non-functional currency, primarily the intercompany U.S. Dollar denominated liabilities of our foreign subsidiaries and do not designate these forward contracts as hedges pursuant to the authoritative guidance for derivatives and hedging. We record all forward contracts at fair value based on the quoted exchange rates for such instruments. We do not enter into forward contracts for speculative purposes. For further discussion, see Note 6, “Derivative Instruments and Hedging Activities”.
Convertible Subordinated Notes. In February 2002, we issued $250.0 million principal amount of unsecured fixed rate 3.50% convertible subordinated notes. Per the authoritative guidance for debt, the notes were recorded at their face value, which was $140.7 million at December 31, 2008. The fair value of such debt, based on quoted market prices at December 31, 2008 was $139.2 million. Since the issuance of these notes, we had repurchased, at a discount to par, a total of $109.3 million of the notes. On February 17, 2009, the convertible subordinated notes came due, and we repaid the outstanding principal balance of $140.7 million plus accrued interest of $2.5 million.
Guarantees and Warranties. In the ordinary course of business, we are not subject to potential obligations under guarantees that fall within the scope of the authoritative guidance for guarantees, with the exception of standard warranty provisions associated with product sales and indemnification provisions related to intellectual property that are contained within many of our lithography tool manufacturer agreements. See Note 11, “Commitments and Contingencies” for further information regarding our guarantees and warranties.
Revenue Recognition. We recognize revenue when title and risk of loss have passed, evidence of an arrangement has been obtained, pricing is fixed or determinable at the date of sale, and collectibility is reasonably assured. Our sales arrangements do not include general rights of return or cancellation privileges.
We recognize light source system revenue at one of following three points, depending on the terms of our arrangement with our customer: 1) shipment of the light source system, 2) delivery of the light source system, or 3) receipt of an acceptance certificate from the customer. For the majority of our light source system sales, the shipping terms are F.O.B. shipping point, and revenue is recognized upon shipment.
On a limited basis, certain of our revenue arrangements include additional elements, such as future product upgrades or services. We adopted the revised authoritative guidance for revenue recognition arrangements with multiple deliverables during the fourth quarter of 2009, and retroactively applied the guidance to new or materially modified revenue arrangements entered into on or after January 1, 2009, in accordance with the early adoption rules. The guidance amends the criteria for separating consideration in multiple-deliverable arrangements, by establishing a revised hierarchy for determining the selling price of each deliverable. Under the new guidance, the selling price used for each deliverable is based on vendor-specific objective evidence if available, third-party evidence if vendor-specific objective evidence is not available, or estimated selling price if neither vendor-specific objective evidence nor third-party evidence is available. Under the prior guidance, elements could only be unbundled if vendor–specific objective evidence or third-party evidence of fair value was available for the undelivered elements. The revised guidance also eliminates the residual method of allocation and requires that arrangement consideration be allocated at the inception of the arrangement to all deliverables using the relative selling price method. The adoption of this guidance did not have an effect on our consolidated
F-11
Table of Contents
NOTES TO CONSOLIDATED FINANCIAL STATEMENTS—(Continued)
financial statements as all revenue recognized from multiple element arrangements during 2009 was computed using the relative fair value method as fair value existed for all elements within the arrangements. We have two arrangements that will require the use of an estimated selling price for certain of the elements within these arrangements, and all revenue has been deferred under both arrangements as the systems have not yet been accepted.
For arrangements that fall under the new multiple element guidance, we allocate consideration to the multiple elements using the relative selling price of the delivered and undelivered items, based on vendor specific objective evidence or estimated selling price, if vendor specific objective evidence is not available, as third party evidence is generally not available to us due to the proprietary nature of our products. Selling price is determined considering market conditions, estimated gross margins, as well as factors that are specific to us. For arrangements that fell under the prior multiple element guidance, we allocated consideration to the multiple elements using the relative fair value model if fair value (vendor specific objective evidence) existed for all elements in the arrangement. Alternatively, we applied the residual method of allocation if fair value (vendor specific objective evidence) only existed for the undelivered elements, and if fair value did not exist for the undelivered elements, no revenue was recognized until such elements were delivered.
Revenue associated with our OnPulse contracts, which include primarily replacement parts and to a much lesser extent services, is recognized based on number of pulses utilized by our customers on their laser source systems covered under their OnPulse arrangement. Revenue from service and training is recognized as the services are rendered. To date, the revenue associated with the service element of our OnPulse contracts when combined with our service revenue has been less than 10% of our total revenue.
Revenue from upgrades and refurbished light source systems is recognized when the upgrade has been successfully installed or the refurbishment processes completed by us and proper delivery or acceptance terms by the customer have been met.
For our replacement part sales, the shipping terms are F.O.B. shipping point, and revenue is recognized upon shipment. For a significant portion of our replacement parts revenue, our customers return the consumed assembly to us as part of the sale of the new part. We reuse some of the material within these core assemblies, mainly metal components, for the future build of core assemblies. As a result, our revenue consists of both cash and the value of the reusable parts received from our customers as consideration for these replacement part sales. Revenue associated with our customers’ return of core assemblies is recognized upon receipt of the returned core assembly. The amount of the revenue is determined based upon the fair value of the reusable parts that we expect to yield from the returned core assembly based on historical experience. If the return of the core assembly is related to a part being replaced under our warranty provisions or under a service or support contract with our customer, we will recognize the estimated fair value of the reusable component as a reduction to cost of revenue.
Shipping and Handling Costs. Costs incurred for shipping and handling are included in cost of revenues at the time the related revenue is recognized. Amounts billed to a customer, if any, for shipping and handling are reported as revenue.
Research and Development Costs. We expense research and development costs in the period they are incurred.
Advertising Expenses. Advertising costs are expensed as incurred. Advertising expenses amounted to approximately $649,000, $946,000, and $715,000 for fiscal years 2009, 2008, and 2007, respectively.
Stock-Based Compensation. We grant stock options and stock units from our 2005 Equity Incentive Plan (the “Incentive Plan”), which provides for the issuance of incentive stock options, non-statutory stock options, stock appreciation rights, stock bonus awards, stock purchase awards, stock unit awards, performance-based stock unit awards, and other stock awards to our employees, non-employee directors and consultants.
F-12
Table of Contents
NOTES TO CONSOLIDATED FINANCIAL STATEMENTS—(Continued)
Under the fair value recognition provisions of the authoritative guidance for stock-based compensation awards, we measure the fair value of stock-based awards at the grant date and the fair value is recognized as expense over the requisite service period. The fair value of stock options is determined by a Black-Scholes option pricing model. We value stock unit awards based on the fair value of our common stock on the date that the stock unit award is granted. Stock-based compensation expense related to stock unit awards is recognized straight line over the service period. For those stock unit awards that have performance-based conditions, we adjust the compensation expense over the service period based upon the expected achievement of the performance conditions. An estimated forfeiture rate is applied and included in the calculation of stock-based compensation expense at the time that the stock option or stock unit awards are granted and revised if necessary in subsequent periods, if actual forfeiture rates differ from those estimates.
Income Taxes. We utilize the asset and liability method of accounting for income taxes. Deferred income taxes are recognized for the future tax consequences of temporary differences using enacted statutory tax rates expected to apply to taxable income in the years in which those temporary differences are expected to be recovered or settled. Temporary differences include the difference between the financial statement carrying amounts and the tax bases of existing assets and liabilities and operating loss and tax credit carryforwards. The effect on deferred taxes of a change in tax rates is recognized in income in the period that includes the enactment date. We assess the likelihood that its deferred tax assets will be recovered from future taxable income. To the extent management believes that recovery is more likely than not, we do not establish a valuation allowance. The calculation of our tax provision is dependent upon the geographic composition of our world-wide earnings, tax regulations governing each region and the availability of tax credits.
Our income tax returns are based on calculations and assumptions that are subject to examination by the Internal Revenue Service and other tax authorities. In addition, the calculation of our tax liabilities involves dealing with uncertainties in the application of complex tax regulations. We recognize liabilities for uncertain tax positions based on a two-step process. The first step is to evaluate the tax position for recognition by determining if the weight of available evidence indicates that it is more likely than not that the position will be sustained on audit, including resolution of related appeals or litigation processes, if any. The second step is to measure the tax benefit as the largest amount that is more than 50% likely of being realized upon settlement. While we believe we have appropriate support for the positions taken on our tax returns, we regularly assess the potential outcomes of examinations by tax authorities in determining the adequacy of our provision for income taxes, and adjust the income tax provision, income taxes payable and deferred taxes in the period in which the facts that give rise to a revision become known.
We are subject to taxation in many jurisdictions, and the calculation of our tax liabilities involves dealing with uncertainties in the application of complex tax laws and regulations in various taxing jurisdictions. If we ultimately determine that the payment of these liabilities will be unnecessary, we reverse the liability and recognize a tax benefit during the period in which we determine the liability no longer applies. Conversely, we record additional tax charges in a period in which we determine that a recorded tax liability is less than we expect the ultimate assessment to be. The application of tax laws and regulations is subject to legal and factual interpretation, judgment and uncertainty. Tax laws and regulations themselves are subject to change as a result of changes in fiscal policy, changes in legislation, the evolution of regulations and court rulings. Therefore, the actual liability for U.S. or foreign taxes may be materially different from our estimates, which could result in the need to record additional tax liabilities or potentially reverse previously recorded tax liabilities.
We recognize excess tax benefits associated with the exercise of stock options directly to stockholders’ equity only when realized. An excess tax benefit occurs when the actual tax benefit realized by us upon an employee’s disposition of a share-based award exceeds the deferred tax asset, if any, originally recorded for such award. When assessing whether a tax benefit relating to share-based compensation has been realized, we follow the tax law ordering method, under which current year share-based compensation deductions are assumed to be utilized before net operating loss carryforwards and other tax attributes.
F-13
Table of Contents
NOTES TO CONSOLIDATED FINANCIAL STATEMENTS—(Continued)
We use the “short-cut” method for calculating the tax effects of share-based compensation. The “short-cut” method includes simplified methods to establish the beginning balance of the additional paid-in capital pool (“APIC pool”) related to the tax effects of share-based compensation, and to determine the subsequent impact on the APIC pool.
In accordance with the authoritative guidance for stock compensation, we have presented excess tax benefits for the exercise of share-based compensation awards as a financing activity in the consolidated statement of cash flows.
Earnings Per Share Basic earnings per share (“EPS) is computed by dividing net income attributable to common stockholders by the weighted-average number of common shares outstanding for the period. Diluted EPS reflects the potential dilution that could occur if securities or other contracts to issue common stock were exercised or converted into common stock. Potential dilutive securities include our, common stock options, restricted stock units, performance restricted stock units (“PRSUs”) employee stock purchase plan (“ESPP”) shares, and convertible subordinated notes.
The following table sets forth the basic and diluted EPS for the years ended December 31, 2009, 2008 and 2007 (in thousands, except per share information):
| Years Ended December 31, | |||||||||
| 2009 | 2008 | 2007 | |||||||
| NET INCOME ATTRIBUTABLE TO CYMER, INC.: |
|||||||||
| Net income, as reported |
$ | 11,976 | $ | 36,540 | $ | 88,362 | |||
| Interest expense on convertible subordinated notes, net of taxes |
— | — | 3,657 | ||||||
| Net income available to common shareholders, diluted |
$ | 11,976 | $ | 36,540 | $ | 92,019 | |||
| WEIGHTED AVERAGE SHARES: |
|||||||||
| Basic weighted average common shares outstanding |
29,738 | 29,924 | 33,522 | ||||||
| Effect of dilutive securities: |
|||||||||
| Options, stock units and ESPP |
207 | 68 | 448 | ||||||
| Assumed conversion of subordinated notes |
— | — | 2,814 | ||||||
| Diluted weighted average common shares outstanding |
29,945 | 29,992 | 36,784 | ||||||
| Earnings per share: |
|||||||||
| Basic |
$ | 0.40 | $ | 1.22 | $ | 2.64 | |||
| Diluted |
$ | 0.40 | $ | 1.22 | $ | 2.50 | |||
For the years ended December 31, 2009, 2008 and 2007, weighted average options, restricted stock units, and PRSUs totaling 2,059,000, 3,008,000 and 741,000 shares, respectively, were not included in the computation of diluted earnings per share as their effect was anti-dilutive. In addition, for the year ended December 31, 2009 and 2008, weighted average common shares attributable to convertible subordinated notes consisting of 370,000 and 2,814,000 shares were not included in the computation of diluted earnings per share as their effect was also anti-dilutive.
Concentrations and Related Uncertainties
Credit Risk. Financial instruments, which potentially subject us to concentrations of credit risk, consist principally of cash and cash equivalents, accounts receivable, investments, and foreign exchange contracts receivable.
Cash and cash equivalents. We invest our excess cash in an effort to preserve capital, provide liquidity, maintain diversification and generate returns relative to our corporate investment policy and prevailing market
F-14
Table of Contents
NOTES TO CONSOLIDATED FINANCIAL STATEMENTS—(Continued)
conditions. We have not experienced any material losses in our cash and cash equivalents. The cash balances in financial institutions and cash equivalent securities that we hold are in excess of federally insured limits. We perform periodic evaluations of the relative credit standing of financial institutions and securities and limit the amount of risk by selecting financial institutions and securities with a strong relative credit standing. At December 31, 2009 and 2008, we had $117.9 million and $251.9 million, respectively, in deposits with major financial institutions and in cash equivalent securities that exceeded the federally insured limit of $250,000 at December 31, 2009 and 2008, respectively.
Accounts receivable. We maintain an allowance for doubtful accounts for estimated losses on accounts receivable based on evaluation of the aging of receivables, payment histories of our customers, financial condition of our customers, and the overall economic environment. We write off individual accounts against the allowance when we become aware of our customer’s inability to meet its financial obligation to us.
Investments. We have established investment credit policies that focus on the credit quality of obligors, limit credit concentrations, encourage diversification and require frequent creditworthiness reviews. Investment activity, including the setting of policy and defining acceptable risk levels, is subject to regular review and approval by senior management.
We invest primarily in debt securities which are rated investment grade and have established exposure limits, diversification standards and review procedures for all credit risks including borrower, issuer and counterparty. Creditworthiness of specific obligors is determined by consideration of external determinants, typically ratings assigned by nationally recognized ratings agencies, and is supplemented by an internal credit evaluation. Obligor, asset sector and industry concentrations are subject to established limits and are monitored on a regular basis.
Foreign exchange contracts receivable. We enter into foreign exchange forward contracts with major financial institutions in order to manage our risk of transacting business in several foreign currencies. Obligations under these forward contracts are unsecured, so we have established counterparty limits and we review the creditworthiness of these financial institutions on a regular basis. In addition, we have entered into ISDA master agreements that contain netting provisions in the event that one party defaults on its obligations to the other.
Supplier Risk. We obtain a limited number of components and subassemblies included in our products from a single supplier or a small group of suppliers. We currently utilize a single supplier for certain optical, control systems and pulse power components and subassemblies used in our light source systems. Where possible, we work with secondary suppliers to qualify additional supply sources. We carry strategic inventories of these components to reduce the risk associated with this single supplier. Strategic inventories are managed as a percentage of future demand. We also have vendor-managed inventory of critical components to further reduce the risk of a single supplier. To date we have been able to obtain adequate supplies of the components and subassemblies used in the production of our light source systems in a timely manner from existing sources.
Geographic and Customer Concentrations. Concentrations of revenue in excess of 10% of total revenue within the geographic areas in which we do business are detailed as follows.
| Years Ended December 31, |
|||||||||
| 2009 | 2008 | 2007 | |||||||
| U.S. |
30 | % | 38 | % | 47 | % | |||
| Japan |
24 | % | 25 | % | 23 | % | |||
| Korea |
20 | % | 16 | % | 12 | % | |||
| Other Asia (Taiwan, Singapore, China) |
19 | % | 15 | % | 12 | % | |||
| Total |
93 | % | 94 | % | 94 | % | |||
F-15
Table of Contents
NOTES TO CONSOLIDATED FINANCIAL STATEMENTS—(Continued)
We expect that sales of our light source products in these geographic areas will continue to account for a substantial portion of our revenue. The loss of business from any of these regions would have a material adverse effect on our operating results, financial condition, and cash flows. For further information about the revenue for all of our geographic regions see Note 13, “Segment and Geographic Information.”
Customers that accounted for more than 10% of accounts receivable are detailed as follows (in thousands):
| December 31, | ||||||
| 2009 | 2008 | |||||
| ASML |
$ | 10,891 | $ | 20,991 | ||
| Hynix |
11,240 | 5,798 | ||||
| Nikon |
9,249 | 15,042 | ||||
| Total |
$ | 31,380 | $ | 41,831 | ||
Customers that accounted for more than 10% of total revenues are detailed as follows (in thousands):
| Years Ended December 31, | |||||||||
| 2009 | 2008 | 2007 | |||||||
| ASML |
$ | 45,053 | $ | 102,166 | $ | 173,374 | |||
| Nikon |
56,324 | 92,780 | 99,728 | ||||||
| Samsung |
39,087 | 46,042 | 36,877 | ||||||
| Total |
$ | 140,464 | $ | 240,988 | $ | 309,979 | |||
We expect that sales of our light sources and our installed base products to these customers will continue to account for a substantial portion of our revenue. None of our customers are obligated to purchase a minimum number of our products in the aggregate or during any particular period. We can provide no assurance that any of our customers will continue to purchase our products at past or current levels. The loss of business from any of these customers would have a material adverse effect on our operating results, financial condition, and cash flows.
Recently Adopted Accounting Standards
In September 2006, the Financial Accounting Standards Board (“FASB”) issued authoritative guidance for fair value measurements and disclosures which defines fair value, establishes a framework for measuring fair value and expands disclosures related to assets and liabilities measured at fair value. In February 2008, the FASB issued additional authoritative guidance for fair value measurements which delayed the effective date of the authoritative guidance for fair value measurements to fiscal years beginning after November 15, 2008 for all nonfinancial assets and nonfinancial liabilities that are recognized or disclosed at fair value in the financial statements on a nonrecurring basis. We adopted all of the provisions of the authoritative guidance for fair value measurements on January 1, 2008 with the exception of the application of the guidance to non-recurring nonfinancial assets and nonfinancial liabilities, which we adopted on January 1, 2009. Our disclosures on the use of fair value measurements for our nonfinancial assets and liabilities are included in Note 4, “Fair Value Measurements.”
In December 2007, the FASB issued authoritative guidance for consolidations which states that accounting and reporting for minority interests will be recharacterized as noncontrolling interests and classified as a component of equity. The guidance also establishes reporting requirements that provide sufficient disclosures that clearly identify and distinguish between the interests of the parent and the interests of the noncontrolling
F-16
Table of Contents
NOTES TO CONSOLIDATED FINANCIAL STATEMENTS—(Continued)
owners. The guidance applies to all entities that prepare consolidated financial statements, except not-for-profit organizations, but will affect only those entities that have an outstanding noncontrolling interest in one or more subsidiaries or that deconsolidate a subsidiary. This guidance is effective for fiscal years beginning after December 15, 2008. We adopted this guidance as of January 1, 2009 and have updated the format of our consolidated financial statements to comply with this new reporting requirement.
In March 2008, the FASB issued authoritative guidance for derivatives and hedging which requires companies with derivative instruments to disclose information that should enable financial statement users to understand how and why a company uses derivative instruments, how derivative instruments and related hedged items are accounted for under the guidance, and how derivative instruments and related hedged items affect a company’s financial position, financial performance and cash. This guidance is effective for fiscal years and interim periods beginning after November 15, 2008. We adopted this guidance as of January 1, 2009 and have provided the required expanded disclosures on our derivative instruments in Note 6, “Derivative Instruments and Hedging Activities.”
In May 2008, the FASB issued authoritative guidance for debt which applies to all convertible debt instruments that have a “net settlement feature,” which means that such convertible debt instruments, by their terms, may be settled either wholly or partially in cash upon conversion. The guidance requires issuers of convertible debt instruments that may be settled wholly or partially in cash upon conversion to separately account for the liability and equity components in a manner reflective of the issuers’ nonconvertible debt borrowing rate. This guidance is effective for financial statements issued for fiscal years beginning after December 15, 2008 and interim periods within those fiscal years. The adoption of this guidance on January 1, 2009, did not have an effect on our consolidated financial statements.
In April 2008, the FASB issued authoritative guidance for intangibles – goodwill and other which amends the factors that should be considered in developing renewal or extension assumptions used to determine the useful life of a recognized intangible asset under the guidance. This guidance also requires enhanced disclosures concerning a company’s treatment of costs incurred to renew or extend the term of a recognized intangible asset. This guidance is effective for financial statements issued for fiscal years beginning after December 15, 2008. The adoption of this guidance on January 1, 2009 did not have an effect on our consolidated financial statements.
In June 2008, the FASB issued authoritative guidance for earnings per share. The guidance addresses whether instruments granted in share-based payment transactions may be participating securities prior to vesting and, therefore, need to be included in the earnings allocation in computing basic earnings per share pursuant to the two-class method of the guidance for earnings per share. This guidance is effective for financial statements issued for fiscal years beginning after December 15, 2008 and interim periods within those years. The adoption of this guidance on January 1, 2009 did not have an effect on our consolidated financial statements.
In December 2008, the FASB issued authoritative guidance for retirement benefits which requires an entity to disclose the following information related to its pension plan assets: 1) investment policies and strategies; 2) categories of plan assets; 3) fair value measurements of plan assets (following the fair value hierarchy of the authoritative guidance for fair value measurements and disclosures; and 4) any significant concentrations of risks. The authoritative guidance for retirement benefits is effective for fiscal years ending after December 15, 2009. We adopted the revised authoritative guidance for retirement benefits and included the required additional disclosures of our pension plan assets in Note 10, “Employee Benefit Plans”.
In April 2009, the FASB issued authoritative guidance for investments which provided recognition guidance for other than temporary impairments for debt securities classified as available-for-sale and held-to-maturity securities, and presentation and disclosure guidance for both debt and equity securities. This guidance is effective for interim reporting periods ending after June 15, 2009, with early adoption permitted for periods ending after March 15, 2009. The adoption of this guidance did not have an effect on our consolidated financial statements.
F-17
Table of Contents
NOTES TO CONSOLIDATED FINANCIAL STATEMENTS—(Continued)
In April 2009, the FASB issued authoritative guidance for fair value measurements and disclosures. This guidance provides companies with guidelines on how to determine fair value measurements when the volume and level of activity for an asset or liability have significantly decreased and how to identify transactions that are not orderly. This guidance is effective for interim reporting periods ending after June 15, 2009, with early adoption permitted for periods ending after March 15, 2009. The adoption of this guidance did not have an effect on our consolidated financial statements.
In June 2009, the FASB issued authoritative guidance on the Accounting Standards Codification (“Codification”) and the Hierarchy of Generally Accepted Accounting Principles (“U.S. GAAP”), which establishes the Codification as the single source for nongovernmental financial statements prepared in accordance with U.S. GAAP, except for SEC rules and interpretive releases, which is also authoritative guidance for SEC registrants. This guidance is effective for financial statements issued for interim and annual periods ending after September 15, 2009 and will supersede all then existing non-SEC accounting and reporting standards. The guidance is not intended to change or alter existing U.S. GAAP and will only impact references to accounting guidance. Accordingly, we have removed references to legacy U.S. GAAP in our consolidated financial statements.
In August 2009, the FASB issued authoritative guidance for fair value measurements and disclosures for liabilities to provide additional guidance on the valuation techniques used in fair value measurements of liabilities of a reporting entity. This authoritative guidance is effective for the first reporting period beginning after its issuance. The adoption of this guidance did not have an effect on our consolidated financial statements.
Recently Issued Accounting Standards
In January 2010, the Financial Accounting Standards Board (“FASB”) issued guidance to require additional disclosures for fair value measurements including the following: 1) amounts transferred in and out of Level 1 and 2 fair value measurements, which is effective for interim and annual reporting periods beginning after December 15, 2009, and 2) activities in level 3 fair value measurements including purchases, sales, issuances, and settlements, which is effective for interim and annual reporting periods beginning after December 15, 2010. We do not expect adoption of the revised guidance for fair value measurements disclosures will have a significant impact on our consolidation financial statements.
In January 2010, the FASB issued additional guidance to clarify the scope of the decrease in ownership provisions in the existing guidance for consolidation. The new guidance is effective in the first annual or interim reporting period ending on or after December 15, 2009 for an entity that previously adopted the FASB authoritative guidance for consolidations. We do not expect the adoption of this new guidance will have a significant impact on our consolidated financial statements.
F-18
Table of Contents
NOTES TO CONSOLIDATED FINANCIAL STATEMENTS—(Continued)
2. RESTRUCTURING COSTS
From November 2008 through March 2009, we reduced our worldwide workforce by approximately 38 percent in response to reduced business levels in the lithography sector of the semiconductor capital equipment market and the effect of the global economic market conditions. As a result of these 2008 and 2009 reductions in workforce, we recorded charges to restructuring expense of approximately $3.0 million and $8.4 million, respectively, which were primarily associated with severance charges. The activity for the year ended December 31, 2008 and 2009 related to our restructuring charges is summarized below (in thousands):
| Balance at January 1, 2008 |
$ | — | ||
| Restructuring costs |
3,038 | |||
| Payments |
(2,554 | ) | ||
| Balance at December 31, 2008 |
$ | 484 | ||
| Restructuring costs |
8,407 | |||
| Payments |
(8,891 | ) | ||
| Balance at December 31, 2009 |
$ | — | ||
3. BALANCE SHEET DETAILS
The consolidated balance sheets detail is as follows (in thousands):
| December 31, | ||||||||
| 2009 | 2008 | |||||||
| ACCOUNTS RECEIVABLE: |
||||||||
| Trade |
$ | 77,448 | $ | 65,091 | ||||
| Other |
1,641 | 1,500 | ||||||
| Subtotal |
79,089 | 66,591 | ||||||
| Less: allowance for doubtful accounts |
(2,297 | ) | (2,295 | ) | ||||
| $ | 76,792 | $ | 64,296 | |||||
| INVENTORIES: |
||||||||
| Raw materials |
$ | 59,189 | $ | 51,621 | ||||
| Work-in-progress |
41,014 | 29,177 | ||||||
| Finished goods |
84,874 | 113,948 | ||||||
| $ | 185,077 | $ | 194,746 | |||||
| PROPERTY, PLANT AND EQUIPMENT: |
||||||||
| Land |
9,080 | 9,080 | ||||||
| Building |
89,186 | 88,873 | ||||||
| Building improvements |
20,115 | 18,235 | ||||||
| Furniture and equipment |
103,495 | 105,086 | ||||||
| Capitalized light sources |
60,134 | 55,787 | ||||||
| Leasehold improvements |
2,748 | 4,264 | ||||||
| Construction in process |
1,683 | 4,508 | ||||||
| Subtotal |
286,441 | 285,833 | ||||||
| Less: accumulated depreciation |
(179,686 | ) | (171,443 | ) | ||||
| $ | 106,755 | $ | 114,390 | |||||
F-19
Table of Contents
NOTES TO CONSOLIDATED FINANCIAL STATEMENTS—(Continued)
Depreciation expense totaled $19.3 million, $22.8 million and $21.7 million for the years ended December 31, 2009, 2008 and 2007, respectively.
Deferred revenue details are as follows as of December 31, 2009 and 2008 (in thousands):
| December 31, | ||||||
| 2009 | 2008 | |||||
| DEFERRED REVENUE: |
||||||
| Light source systems |
$ | 17,378 | $ | 11,188 | ||
| Contracts and service revenue |
3,491 | 2,724 | ||||
| Other |
1,995 | 1,432 | ||||
| $ | 22,864 | $ | 15,344 | |||
| Current portion of deferred revenue |
$ | 22,339 | $ | 15,344 | ||
| Long-term portion of deferred revenue |
525 | — | ||||
| Total deferred revenue |
$ | 22,864 | $ | 15,344 | ||
4. FAIR VALUE MEASUREMENTS
Financial Assets and Liabilities
We analyze our financial assets and liabilities measured at fair value and categorize them within the fair value hierarchy based on the level of judgment associated with the inputs used to measure their fair value in accordance with the authoritative guidance for fair value instruments and the fair value option for financial assets and financial liabilities.
The majority of our available-for-sale securities and our foreign currency forward exchange contracts are priced via independent providers. In obtaining such valuation information from third parties, we have evaluated the valuation methodologies used to develop the fair values in order to determine whether such valuations are representative of an exit price in our principal markets.
Available-for-Sale Securities. The fair values of our available-for-sale securities are determined by a matrix pricing, which is a mathematical technique widely used to value securities without relying exclusively on quoted prices for the specific securities but rather by relying on the securities’ relationship to other benchmark-quoted securities. Such assets are classified as Level 2 inputs in the fair value hierarchy and typically include our commercial paper and government and corporate fixed income securities which are included in our investment portfolio. As a result of the turmoil in the credit market and the uncertainty of the U.S. and global economies, we have considered whether or not these Level 2 inputs are appropriate and are still reflective of fair value for our available-for-sale securities. Based upon the types of holdings which are included in our investment portfolio, we determined that these Level 2 inputs were reflective of fair value for our available-for-sale securities as of December 31, 2009 and 2008.
Preferred Stock. We hold preferred stock that was distributed to us when our sole auction rate security was dissolved in April 2009. The auction rate security was purchased in October 2007 at a par value of $5.6 million and failed at every auction from November 2007 until its dissolution in April 2009. We recorded impairment charges in 2009 and 2008 totaling $291,000 and $5.3 million, respectively, associated with this security. The preferred stock is valued at zero at December 31, 2009, as we believe it is unlikely we will receive any future cash flow from this preferred stock.
F-20
Table of Contents
NOTES TO CONSOLIDATED FINANCIAL STATEMENTS—(Continued)
Derivative Instruments. Our foreign currency forward exchange contracts are valued using an income approach which includes observable Level 2 market inputs at the measurement date and uses a standard valuation technique to convert future foreign currency amounts to a single discounted present amount assuming participants are motivated, but not compelled, to transact. Level 2 inputs are limited to quoted prices for similar assets or liabilities in active markets and inputs other than quoted prices that are observable for the asset or liability. Key inputs in this discounted calculation include spot currency exchange rates at the measurement date, interest rates, and credit default swap rates at standard quoted intervals. Credit default swaps on us are not available, so we estimated our credit risk premium based on a financing arrangement that was offered to us during the three month period ended December 31, 2009 by a third party. The principal market in which we execute our foreign currency forward exchange contracts is the retail market. Mid market pricing is used as a practical expedient for fair value measurements. Since significant inputs in the valuation of our foreign currency forward exchange contracts are observable in the active market, they are classified as Level 2 in the fair value hierarchy. As a result of turmoil in the credit market and the uncertain outlook for the U.S. and global economies, we have considered whether or not these Level 2 inputs are appropriate and are still reflective of fair value for our derivative instruments. Based upon our review of our derivative instruments and the credit worthiness of the parties associated with them, we determined that the Level 2 inputs currently being used were reflective of the fair value of our derivative instruments as of December 31, 2009 and 2008.
Our financial assets and financial liabilities measured at fair value on a recurring basis are as follows (in thousands):
| December 31, 2009 |
Fair Value Measurements at Reporting Date Using: | |||||||||||||
| (Level 1) | (Level 2) | (Level 3) | ||||||||||||
| Assets: |
||||||||||||||
| Investment securities: |
||||||||||||||
| Cash and cash equivalents |
$ | 118,381 | $ | 112,751 | $ | 5,630 | $ | — | ||||||
| Restricted cash |
1,200 | $ | 1,200 | — | — | |||||||||
| Short-term investments: |
||||||||||||||
| U.S. government securities |
32,430 | — | 32,430 | — | ||||||||||
| Corporate debt securities |
30,465 | — | 30,465 | — | ||||||||||
| Long-term investments—corporate debt securities |
5,167 | — | 5,167 | — | ||||||||||
| Foreign currency forward exchange contracts |
(1) | 208 | — | 208 | — | |||||||||
| Total assets |
$ | 187,851 | $ | 113,951 | $ | 73,900 | $ | — | ||||||
| Liabilities: |
||||||||||||||
| Foreign currency forward exchange contracts |
(2) | $ | 182 | $ | — | $ | 182 | $ | — | |||||
| Total liabilities |
$ | 182 | $ | — | $ | 182 | $ | — | ||||||
F-21
Table of Contents
NOTES TO CONSOLIDATED FINANCIAL STATEMENTS—(Continued)
| December 31, 2008 |
Fair Value Measurements at Reporting Date Using: | |||||||||||||
| (Level 1) | (Level 2) | (Level 3) | ||||||||||||
| Assets: |
||||||||||||||
| Investment securities: |
||||||||||||||
| Cash and cash equivalents |
$ | 252,391 | $ | 252,391 | $ | — | $ | — | ||||||
| Short-term investments: |
— | |||||||||||||
| Debt securities issued by U.S. Treasury and other governmental agencies |
18,620 | — | 18,620 | — | ||||||||||
| Corporate debt securities |
12,280 | — | 12,280 | — | ||||||||||
| Long-term investments: |
||||||||||||||
| Corporate debt securities |
9,165 | — | 9,165 | — | ||||||||||
| Auction rate security |
291 | — | — | 291 | ||||||||||
| Total assets |
$ | 292,747 | $ | 252,391 | $ | 40,065 | $ | 291 | ||||||
| Liabilities: |
||||||||||||||
| Foreign currency forward exchange contracts |
(2) | $ | 4,544 | $ | — | $ | 4,544 | $ | — | |||||
| Total liabilities |
$ | 4,544 | $ | — | $ | 4,544 | $ | — | ||||||
| (1) | Included in prepaid expenses and other assets on the accompanying consolidated balance sheets. |
| (2) | Included in accrued and other current liabilities on the accompanying consolidated balance sheets. |
The following table summarizes the change in the fair value during the period for the auction rate security using Level 3 inputs (in thousands):
| December 31, | |||||||||||
| 2009 | 2008 | ||||||||||
| Balance at January 1 |
$ | 291 | $ | — | |||||||
| Transfers in and out of Level 3 |
— | 5,600 | |||||||||
| Total realized losses included in earnings |
(3 | ) | (291 | ) | (5,309 | ) | |||||
| Included in other comprehensive income |
— | — | |||||||||
| Purchases, sales, issuances and settlements |
— | — | |||||||||
| Balance at December 31 |
$ | — | $ | 291 | |||||||
| (3) | Included in other income (expense) on the accompanying consolidated statements of operations. |
Non Financial Assets and Liabilities
We apply fair value techniques on a non-recurring basis associated with: (1) valuing potential impairment losses related to goodwill which are accounted for pursuant to the authoritative guidance for intangibles—goodwill and other; and (2) valuing potential impairment losses related to long-lived assets which are accounted for pursuant to the authoritative guidance for property, plant and equipment.
We currently have two separate reporting units: (1) our primary business to design, manufacture and sell excimer light source systems and installed base products for use in lithography systems used in the manufacture of semiconductors; and (2) TCZ, which is currently developing and producing a system for use in the manufacture of OLED flat panel displays. We test for goodwill impairment at the reporting unit level. All of our goodwill is associated with our primary business unit, and we determine the fair value of this reporting unit based on a combination of inputs including the market capitalization of the company, as well as Level 3 inputs such as discounted cash flows which are not observable from the market, directly or indirectly. We conduct our goodwill impairment analysis annually as of November 30 each year, or upon the occurrence of certain triggering events.
F-22
Table of Contents
NOTES TO CONSOLIDATED FINANCIAL STATEMENTS—(Continued)
No such triggering events occurred during the year ended December 31, 2009. Historically, the fair value of our primary business reporting unit has significantly exceeded its carrying value.
We test for the impairment of our long-lived assets when triggering events occur and such impairment, if any, is measured at fair value. The inputs for fair value of our long lived assets would be based on Level 3 inputs as data used for such fair value calculations would be based on discounted cash flows which are not observable from the market, directly or indirectly. During the year ended December 31, 2009, there have been no triggering events associated with our long-lived assets; therefore, no impairment analysis was conducted during the period.
5. INVESTMENTS
Investments at December 31, 2009 consisted of the following (in thousands):
| Amortized Cost |
Gross Unrealized Gains |
Gross Unrealized Losses |
Market Value | |||||||||
| Short-term: |
||||||||||||
| Corporate debt securities |
$ | 30,404 | $ | 63 | $ | 2 | $ | 30,465 | ||||
| U.S. government agencies |
32,443 | 1 | 14 | 32,430 | ||||||||
| Total |
$ | 62,847 | $ | 64 | $ | 16 | $ | 62,895 | ||||
| Long-term: |
||||||||||||
| Corporate debt securities |
$ | 5,181 | $ | — | $ | 14 | $ | 5,167 | ||||
| Total |
$ | 5,181 | $ | — | $ | 14 | $ | 5,167 | ||||
Investments at December 31, 2008 consisted of the following (in thousands):
| Amortized Cost |
Unrealized Gains |
Unrealized Losses |
Market Value | |||||||||
| Short-term: |
||||||||||||
| Corporate debt securities |
$ | 12,161 | $ | 131 | $ | 12 | $ | 12,280 | ||||
| U.S. government agencies |
18,500 | 120 | — | 18,620 | ||||||||
| Total |
$ | 30,661 | $ | 251 | $ | 12 | $ | 30,900 | ||||
| Long-term: |
||||||||||||
| Corporate debt securities |
$ | 9,145 | $ | 48 | $ | 28 | $ | 9,165 | ||||
| Auction rate securities |
291 | — | — | 291 | ||||||||
| Total |
$ | 9,436 | $ | 48 | $ | 28 | $ | 9,456 | ||||
As of December 31, 2009, the contractual maturities of our investments were as follows (in thousands):
| Less than One Year |
One to Two Years |
Total | |||||||
| Short-term: |
$ | 62,895 | $ | — | $ | 62,895 | |||
| Long-term: |
— | 5,167 | 5,167 | ||||||
| Total |
$ | 62,895 | $ | 5,167 | $ | 68,062 | |||
We did not have any investments in individual securities that have been in a continuous unrealized loss position deemed to be temporary for more than 12 months at December 31, 2009. See Note 4, “Fair Value Measurement” for further discussion of the auction rate security impairment realized during the years ended December 31, 2009 and 2008.
F-23
Table of Contents
NOTES TO CONSOLIDATED FINANCIAL STATEMENTS—(Continued)
6. DERIVATIVE INSTRUMENTS AND HEDGING ACTIVITIES
We conduct business in several currencies through our global operations and, as a result, are exposed to foreign currency risks associated with our international subsidiary offices, particularly those located in Japan, Korea, the Netherlands and Taiwan. Our foreign currency risk falls into two primary categories.
First, our gross profit margins are subject to change when we sell our products in one currency and the product costs are denominated in a different currency. To mitigate this risk, we enter into derivative financial instruments, principally forward contracts, which we designate as cash flow hedges to mitigate fluctuations in the gross profit margins of these forecasted transactions. Designated hedging instruments qualify for cash flow hedge accounting treatment if certain criteria are met. For example, at the inception of the hedge, we must have formal documentation of the hedging relationship and our management objective and strategy for undertaking the hedge, including identification of the hedging instrument, the hedged transaction, the nature of the risk being hedged, and how the hedging instrument’s effectiveness will be assessed. The hedging relationship must be highly effective in achieving offsetting cash flows attributable to the hedged risk during the term of the hedge. We record changes in the fair value of the effective portion of these hedges in accumulated other comprehensive income (loss), and subsequently reclassify the gain or loss to cost of revenues in the same period that the related sale is made to the third party. Interest charges or “forward points” on our forward contracts are excluded from the assessment of hedge effectiveness and are recorded in cost of revenues in the consolidated statements of operations.
As mentioned above, gains and losses on cash flow hedges are recorded in accumulated other comprehensive income (loss) until the hedged transaction is recorded in the consolidated financial statements. Once the underlying transaction is recorded in the consolidated financial statements, we de-designate the derivative, reclassify the accumulated gain or loss on the derivative into cost of revenues and cease to apply hedge accounting treatment. Once the derivative has been de-designated, any further gains or losses are recorded to other income (expense). If all or a portion of the forecasted transaction were cancelled, this would render all or a portion of the cash flow hedge ineffective, and we would reclassify the ineffective portion of the hedge into other income (expense). We generally do not experience ineffectiveness of our cash flow hedges as a result of cancelled transactions and the accompanying consolidated financial statements do not include such gains or losses.
The second category of foreign currency risk occurs when transactions are recorded in our consolidated financial statements in a currency other than the applicable subsidiary’s functional currency and the cash settlement of the transaction occurs at some point in the future. When transactions in non-functional currency are recorded to our consolidated financial statements, changes in the recorded amounts resulting from fluctuations in the value of that currency are recorded to other income (expense). In order to mitigate these remeasurement gains and losses, we enter into derivative financial instruments, principally forward contracts. The forward contracts that hedge these transactions that have been recorded to our financial statements are not designated as hedges and, therefore, we record changes in their fair value to other income (expense).
Derivatives designated as cash flow hedges generally have maturity dates of no more than twelve months. Non-designated derivatives that mitigate the revaluation of non-functional currency transactions generally have maturity dates of no more than three months in the case of ordinary payables and receivables or no more than twelve months in the case of inter-company loans. We do not have any derivatives hedging inter-company loans at December 31, 2009. We adjust the level and use of derivatives as soon as practicable after learning that an exposure has changed, and we review all exposures and derivative positions on a regular basis.
At December 31, 2009, we had outstanding forward contracts to buy $20.6 million in exchange for Japanese Yen, $5.5 million in exchange for Korean Won and to sell $8.5 million in exchange for Euros. The fair value of
F-24
Table of Contents
NOTES TO CONSOLIDATED FINANCIAL STATEMENTS—(Continued)
all of our forward contracts totaled to an asset of $26,000 at December 31, 2009. The deferred gain, net of tax, for those that qualified for hedge accounting treatment was $62,000 as of December 31, 2009. We expect that this unrealized gain will be reclassified from accumulated other comprehensive income into earnings at the then-current values over the next twelve months as the underlying hedged transactions occur.
We do not enter into derivative instruments for speculative purposes.
The fair value of derivative instruments in our consolidated balance sheet was as follows (in thousands):
| Asset Derivatives December 31, 2009 |
Liabilities Derivatives | |||||||||
| Balance sheet location |
Fair Value |
Balance sheet location |
Fair Value | |||||||
| Derivatives designated as hedging instruments Foreign exchange contracts |
Prepaid expenses and other assets | $ | 103 | Accrued and other current liabilities | — | |||||
| Derivatives not designated as hedging instruments Foreign exchange contracts |
Prepaid expenses and other assets | $ | 444 | Accrued and other current liabilities | $ | 521 | ||||
| Total derivatives |
$ | 547 | $ | 521 | ||||||
The effect of derivative instruments on our consolidated statement of operations was as follows (in thousands):
| Year Ended December 31, 2009 | |||||||||||||||
| Derivative in cash flow hedging relationships |
Gain (loss) recognized in other comprehensive income (“OCI”) on derivative (effective portion) |
Location of gain (loss) |
Gain (loss) reclassified from accumulated OCI into income (effective portion) |
Location of gain (loss) |
Gain (loss) recognized in income on derivative (ineffective portion and amount excluded from effectiveness testing) (1) |
||||||||||
| Foreign exchange contracts |
$ | 345 | Cost of revenues |
$ | (529 | ) | Cost of revenues | $ | 48 | ||||||
| Foreign currency exchange gain (loss) | (44 | ) | |||||||||||||
| Total |
$ | 345 | $ | (529 | ) | $ | 4 | ||||||||
| (1) | The $44,000 loss related to the ineffective portion of the hedging relationship and the $48,000 gain related to the amount excluded from the assessment of hedge effectiveness. |
| Year Ended December 31, 2009 | |||||
| Derivatives Not Designated as Hedging Instruments |
Location of gain (loss) |
Gain (loss) recognized in income on derivative | |||
| Foreign exchange contracts |
Foreign currency exchange gain (loss) | $ | 36 | ||
| Total |
$ | 36 | |||
F-25
Table of Contents
NOTES TO CONSOLIDATED FINANCIAL STATEMENTS—(Continued)
We are exposed to credit losses in the event of nonperformance by the banks with which we transact foreign currency hedges. We manage this credit risk by transacting foreign currency hedging with more than one institution, only executing hedges with counterparties that meet our minimum requirements, monitoring the credit ratings of our counterparties on a regular basis and negotiating contractual master netting provisions that allow us to record and offset liabilities to a counterparty against amounts due from that counterparty in an event of default. We do not receive collateral from our hedging counterparties. Our maximum credit exposure from nonperformance of foreign exchange hedging counterparties was $181,000 as of December 31, 2009.
7. GOODWILL AND INTANGIBLE ASSETS
Goodwill. Goodwill is tested at the reporting unit level on an annual basis and between annual tests if an event occurs or circumstances change, that would more likely than not reduce the fair value of the reporting unit below its carrying value. We have two reporting units, which are the same as our operating segments: our light source systems and installed base products business reporting unit, Cymer, and our OLED flat panel display reporting unit, TCZ. Our goodwill is tested for impairment in the fourth quarter of each year in two steps, first by comparing the fair value of the reporting unit to its carrying value. If after completion of this first step an impairment is indicated, the impairment is then calculated as the difference between the recorded value of goodwill and its implied fair value. After our completion of this first step in both 2009 and 2008, it was determined that the fair value of our light source system and installed base products business unit exceeded its carrying value; therefore, there was no impairment of goodwill. The goodwill balance of $8.8 million as of December 31, 2009 and 2008 is all allocated to our light source systems and installed base products business reporting unit.
Intangible Assets. Our intangible assets subject to amortization consist of patents. The expected useful life of these patents can vary depending on the nature of the technology and their remaining useful life. The expected useful lives of our patents range from five to sixteen years.
In November 2005, we purchased certain patents for use in our DUV light source applications in mask-based lithography for a total of $2.5 million in cash. The total value of these patents is being amortized over a period of 14.65 years, which represents the average useful life of the patents purchased under the agreement. The amortization of these patents is included in cost of product sales on the accompanying consolidated statements of operations as they are mainly being used in products which are currently being shipped to customers.
In June 2006, we acquired certain patent license rights valued at $8.2 million for use in our continuing research and development efforts related to extreme ultraviolet (“EUV”) light sources. The total value of these patent license rights is being amortized over a period of 16.29 years which represents the average useful life of all of the patents purchased under this amendment. The amortization of these patents is included in research and development expenses on the accompanying consolidated statements of operations as the field of use involves applications which were still in the research and development stages as of December 31, 2009.
Details of our intangible assets, net, are as follows (in thousands):
| December 31, | ||||||||
| 2009 | 2008 | |||||||
| Acquired patents |
$ | 27,133 | $ | 27,133 | ||||
| Less: accumulated amortization |
(18,806 | ) | (17,235 | ) | ||||
| $ | 8,327 | $ | 9,898 | |||||
Amortization expense associated with our acquired patents was $1.6 million for the year ended December 31, 2009 and $3.1 million for each of the years ended December 31, 2008 and 2007.
F-26
Table of Contents
NOTES TO CONSOLIDATED FINANCIAL STATEMENTS—(Continued)
As of December 31, 2009, the future estimated amortization expense for these acquired patents for the next five years and thereafter is expected to be as follows (in thousands):
| Years Ending December 31, |
Future Amortization Expense | ||
| 2010 |
$ | 682 | |
| 2011 |
682 | ||
| 2012 |
682 | ||
| 2013 |
682 | ||
| 2014 |
682 | ||
| Thereafter |
4,917 | ||
| $ | 8,327 | ||
8. EQUITY
Comprehensive Income (Loss). Comprehensive income (loss) includes net income, foreign currency translation adjustments, net unrealized gains and losses on available-for-sale securities, net unrealized gains and losses on effective foreign currency forward exchange contracts, and net unrealized pension gains and losses, which are recorded as short-term and long-term investments in the accompanying consolidated balance sheets. See the consolidated statements of comprehensive income for the effect of the components of comprehensive income (loss) to our net income.
The components of accumulated other comprehensive loss are as follows (in thousands):
| December 31, | ||||||||
| 2009 | 2008 | |||||||
| Foreign currency translation adjustments |
$ | (8,182 | ) | $ | (5,884 | ) | ||
| Unrealized gains on available-for-sale investments, net of tax |
2 | 161 | ||||||
| Net unrealized gains (losses) on foreign currency forward exchange contracts, net of tax |
62 | (164 | ) | |||||
| Unrealized pension loss, net of tax |
(162 | ) | (112 | ) | ||||
| Accumulated other comprehensive loss |
$ | (8,280 | ) | $ | (5,999 | ) | ||
Stock Repurchase Programs. In April 2007, our board of directors authorized us to purchase up to $300 million of our common stock. By December 31, 2007, we had repurchased the full $300 million authorized under the plan or 7.5 million shares. In April 2008, our board authorized us to purchase up to $100 million of our common stock. As of December 31, 2009, we had repurchased 803,500 shares for $22.9 million under this program, all of which were purchased in 2008. We did not repurchase any shares of common stock under this program during the year ended December 31, 2009, and approximately $77.1 million shares remain open and authorized to repurchase under this 2008 program. To date, purchases under our repurchase programs were $473.6 million or 12.9 million shares.
Stock Award Plans—We have the following equity incentive plans or incentive programs that include equity based awards:
2005 Equity Incentive Plan (the “Incentive Plan”). We grant stock options and stock units from our Incentive Plan, which provides for the issuance of incentive stock options, non-statutory stock options, stock appreciation rights, stock bonus awards, stock purchase awards, stock unit awards, performance-based stock unit
F-27
Table of Contents
NOTES TO CONSOLIDATED FINANCIAL STATEMENTS—(Continued)
awards, and other stock awards to our employees, non-employee directors and consultants. Stock options issued under the Incentive Plan expire ten years from the date of grant and generally vest and become exercisable ratably over a four-year period following the date of grant. Stock unit awards issued under the Incentive Plan generally vest one to four years from the date granted.
In May 2007 and 2009, our stockholders approved the amendment and restatement of our Incentive Plan to increase the number of shares of common stock authorized for issuance from a total of 1,000,000 shares to 2,000,000 shares, and from 2,000,000 shares to 3,250,000 shares, respectively. The amendment and restatement of our Incentive Plan in May 2007 also expanded the type and nature of the awards available for grant under the plan to include cash awards that qualify as “performance-based compensation.” Awards and options to purchase 1,326,640 shares were outstanding and 1,802,690 shares remained available for grant under this plan as of December 31, 2009.
1996 Stock Option Plan (the “1996 Plan”). The 1996 Plan provided for the grant of incentive stock options to our employees and nonqualified stock options to our employees, directors and consultants. The exercise prices of options granted under the 1996 Plan were at least equal to the fair market value of our common stock on the dates of grant. Options issued under the 1996 Plan expire five to ten years after the options were granted and generally vest and become exercisable ratably over a four-year period following the date of grant. The 1996 Plan was terminated in May 2005 with the approval of the 2005 Equity Incentive Plan. Options to purchase 642,354 shares were outstanding under this plan as of December 31, 2009.
2000 Equity Incentive Plan (the “2000 Plan”). The 2000 Plan provided for the grant of options to our employees or consultants who were neither directors nor officers. The exercise prices of the options granted under the 2000 Plan were equal to the fair market value of our common stock on the dates of grant. Options issued under the 2000 Plan expire ten years after the options were granted and generally vest and become exercisable ratably over a four-year period following the date of grant. The 2000 Plan was terminated in May 2005 with the approval of the 2005 Equity Incentive Plan. Options to purchase 558,186 shares were outstanding under this plan as of December 31, 2009.
Stock Options, Restricted Stock Unit Awards and Performance Based Stock Unit Awards
The majority of our equity awards are granted annually to our executive officers and certain key management under our long-term incentive program (“LTIP”) pursuant to our Incentive Plan. The table below summarizes the total number of shares granted under our LTIP during the years ended December 31, 2009, 2008 and 2007:
| Number of shares granted | ||||||||
| 2009 | 2008 | 2007 | ||||||
| Stock options |
(1) | — | 434,000 | — | ||||
| Restricted stock unit awards |
(2) | 206,700 | — | 66,000 | ||||
| Performance restricted stock unit awards |
(3) | 110,790 | 160,000 | — | ||||
| 317,490 | 594,000 | 66,000 | ||||||
| (1) | Stock option grants vest over a four-year period with 25% of the shares vesting on or about the first day of the fiscal year following the grant date, and the balance vesting in 36 equal monthly installments thereafter subject to the participant’s continued service through the applicable vesting dates. |
| (2) | RSU grants vest over a three-year period with 33% of the shares vesting on or about the first day of each of the next three fiscal years, subject to the participant’s continued service through the applicable vesting dates. |
| (3) | PRSU shares will vest and be issued, if at all, following the end of the three year performance period. A participant must be employed on the last day of the performance period in order to be eligible for any shares subject to the PRSU award to vest and become issuable to the participant. |
F-28
Table of Contents
NOTES TO CONSOLIDATED FINANCIAL STATEMENTS—(Continued)
PRSUs are a form of share-based award in which the number of shares ultimately received will be determined based on our relative performance compared to a specified group of peer companies over a three-year performance period and eligible individual’s management by objectives (“MBO”) achievement during the same three year performance period. We record compensation expense each period based on our estimate of the most probable number of PRSUs that will be issued. This estimate requires significant estimates and projections about our financial performance relative to the financial performance of the specified group of peer companies, and the performance of individuals against their specific MBOs. If our estimates change or actual results are different than the estimates used in the prior period, we would be required to increase or decrease compensation expense, which could materially affect our operating results.
We also grant annual RSU’s to non-employee directors pursuant to our Incentive Plan. The number of shares subject to each stock unit award is determined by dividing $100,000 by the closing price per share of our common stock as of the date of grant. Each stock unit award generally vests 100% after one year from the date of grant. In 2009, a newly elected non-employee director was granted an initial RSU determined by dividing $200,000 by the closing price per share of our common stock as of the date of grant. This initial RSU vests equally over a four-year period. During the years ended December 31, 2009 and 2008, we granted 36,688 and 18,354 RSU’s, respectively to non-employee directors.
A summary of the stock award activity under all equity incentive plans and incentive programs is as follows (in thousands, except per share and term data):
| Stock Options |
Number of Shares |
Weighted Average Exercie Price Per Share |
Weighted Average Remaining Contractual Term (Years) |
Aggregate Intrinsic Value | |||||||
| Balance at January 1, 2009 |
3,153 | $ | 34.92 | ||||||||
| Granted |
5 | 21.76 | |||||||||
| Exercised |
(233 | ) | 26.67 | ||||||||
| Forfeited |
(127 | ) | 36.66 | ||||||||
| Expired |
(745 | ) | 37.66 | ||||||||
| Balance at December 31, 2009 |
2,053 | $ | 34.73 | 4.49 | $ | 10,208 | |||||
| Exercisable at December 31, 2009 |
1,767 | $ | 34.84 | 3.93 | $ | 8,907 | |||||
| Vested and expected to vest at December 31, 2009 |
2,029 | $ | 34.75 | 4.45 | $ | 10,076 | |||||
| Restricted Stock Unit Awards |
Number of Shares |
Weighted Average Grant-Date Fair Value |
|||||||||
| Nonvested at January 1, 2009 |
74 | $ | 33.82 | ||||||||
| Granted |
246 | 23.66 | |||||||||
| Vested |
(37 | ) | 34.18 | ||||||||
| Forfeited |
(29 | ) | 26.40 | ||||||||
| Nonvested at December 31, 2009 |
254 | $ | 25.35 | 0.92 | $ | 9,739 | |||||
| Vested and expected to vest at December 31, 2009 |
229 | $ | 25.32 | 0.84 | $ | 8,792 | |||||
| Performance-Based Stock Unit Awards |
Number of Shares |
Weighted Average Grant-Date Fair Value |
|||||||||
| Nonvested at January 1, 2009 |
133 | $ | 36.04 | ||||||||
| Granted |
111 | 22.18 | |||||||||
| Vested |
— | — | |||||||||
| Forfeited |
(24 | ) | 25.12 | ||||||||
| Nonvested at December 31, 2009 |
220 | $ | 32.10 | 1.48 | $ | 8,448 | |||||
| Vested and expected to vest at December 31, 2009 |
183 | $ | 32.12 | 1.44 | $ | 7,010 | |||||
F-29
Table of Contents
NOTES TO CONSOLIDATED FINANCIAL STATEMENTS—(Continued)
The total cash received from employees as a result of employee stock option exercises for the years ended December 31, 2009, 2008 and 2007 was approximately $6.2 million, $1.6 million and $14.1 million, respectively. In connection with these exercises, the excess tax benefit recognized by us for the years ended December 31, 2009, 2008 and 2007 was $267,000, $58,000 and $1.7 million, respectively. We settle employee stock option exercises and restricted stock unit releases with newly issued shares of our common stock.
Employee Stock Purchase Plan
1996 Employee Stock Purchase Plan (the “ESPP”). Under the ESPP, eligible employees may purchase shares of our common stock through payroll deductions of up to 15% of his or her compensation (as defined in the plan), at a price per share equal to 95% of the fair market value of our common stock at the end of the purchase period. In 2006, our ESPP was amended to extend the expiration date of the plan until July 31, 2016 and increase the number of shares of common stock reserved for issuance under the plan by 300,000 shares from 1,200,000 shares to 1,500,000 shares.
The number of shares issuable under the ESPP as of December 31, 2009 was 280,138 and 1,219,862 shares have been previously issued. Because our ESPP is a non-compensatory plan as defined by the authoritative guidance for stock compensation, no stock-based compensation expense is recorded for our ESPP.
The total cash received from employees as a result of ESPP shares issued during the year ended December 31, 2009, 2008, and 2007 was approximately $622,000, $876,000 and $1.1 million, respectively.
Share-Based Compensation Valuation Assumptions
We use the Black-Scholes option pricing model to value our stock options. We utilize a blended volatility, a combination of historical and implied volatility in this valuation model. Historical volatility is based on a period commensurate with the expected term of the options. Implied volatility is derived based on a six-month period of traded options of our common stock. The expected term of our stock options represents the period of time options are expected to be outstanding and is based on observed historical exercise patterns for us which we believe are indicative of future exercise behavior. For the risk free interest rate, we use the then currently available rate on zero coupon U.S. Government issues with a remaining period commensurate with the expected term for valuing options.
The following weighted average assumptions were used for stock option grants issued in the years ended December 31, 2009, 2008 and 2007:
| Year Ended December 31, | |||||||||
| 2009 | 2008 | 2007 | |||||||
| Dividend yield |
None | None | None | ||||||
| Volatility rate |
53 | % | 42 | % | 52 | % | |||
| Risk free interest rate |
1.89 | % | 2.86 | % | 4.33 | % | |||
| Expected life |
3.1 years | 3.1 years | 3.1 years | ||||||
We value the stock unit awards using an intrinsic calculation based on the price of our stock on the date that the stock unit award is granted. Compensation expense related to these stock unit awards is recognized straight line over the service period. For those stock unit awards that have performance-based conditions, such as those granted under our LTIP, we adjust the compensation expense over the service period based upon the expected achievement of the performance conditions under the program. The fair value of stock-based awards granted, less expected forfeitures, is recognized to expense over the requisite service period.
F-30
Table of Contents
NOTES TO CONSOLIDATED FINANCIAL STATEMENTS—(Continued)
Share-Based Compensation Expense
The components of share-based compensation expense under the provisions of the authoritative guidance for stock-based compensation awards for the years ended December 31, 2009, 2008 and 2007 are as follows (in thousands):
| Years Ended December 31, | ||||||||||||
| 2009 | 2008 | 2007 | ||||||||||
| Stock options |
$ | 2,573 | $ | 3,542 | $ | 4,165 | ||||||
| Restricted stock unit awards—employees |
1,605 | 548 | 758 | |||||||||
| Performance restricted stock units |
777 | 811 | — | |||||||||
| Restricted stock units awards—non-employee directors |
712 | 729 | 719 | |||||||||
| Share-based compensation, before income taxes |
$ | 5,667 | $ | 5,630 | $ | 5,642 | ||||||
| Related income tax benefit |
$ | (2,118 | ) | $ | (1,991 | ) | $ | (1,983 | ) | |||
| Share-based compensation, net of income taxes |
$ | 3,549 | $ | 3,639 | $ | 3,659 | ||||||
The weighted-average grant-date fair value of options granted during the years ended December 31, 2009, 2008 and 2007 was $8.11, $10.78 and $15.43 per share, respectively. The total intrinsic value of options exercised during the years ended December 31, 2009, 2008 and 2007 was $1.6 million, $416,000 and $7.5 million, respectively.
As of December 31, 2009, the unamortized compensation expense related to outstanding unvested options and restricted stock unit awards was approximately $1.8 million and $2.4 million, respectively and is expected to be recognized over a weighted-average period of 2.09 and 1.68 years, respectively.
9. INCOME TAXES
The breakdown of U.S. and foreign income before income tax expense and the components of income tax expense are summarized as follows (in thousands):
| Years Ended December 31, | ||||||||||||
| 2009 | 2008 | 2007 | ||||||||||
| Income (loss) before income tax expense: |
||||||||||||
| U.S. |
$ | 22,970 | $ | 50,804 | $ | 121,116 | ||||||
| Foreign |
(5,862 | ) | (540 | ) | 8,736 | |||||||
| $ | 17,108 | $ | 50,264 | $ | 129,852 | |||||||
| Income tax expense (benefit): |
||||||||||||
| Current: |
||||||||||||
| Federal |
$ | 7,810 | $ | 21,687 | $ | 34,572 | ||||||
| State |
929 | 1,347 | 581 | |||||||||
| Foreign |
284 | 7,559 | 6,469 | |||||||||
| 9,023 | 30,593 | 41,622 | ||||||||||
| Deferred: |
||||||||||||
| Federal |
510 | (5,988 | ) | 4,560 | ||||||||
| State |
(1,670 | ) | (2,697 | ) | 889 | |||||||
| Foreign |
526 | (5,321 | ) | (2,658 | ) | |||||||
| (634 | ) | (14,006 | ) | 2,791 | ||||||||
| $ | 8,389 | $ | 16,587 | $ | 44,413 | |||||||
F-31
Table of Contents
NOTES TO CONSOLIDATED FINANCIAL STATEMENTS—(Continued)
The following schedule reconciles the difference between the U.S. federal income tax expense at the statutory rate (35%) to our income tax expense (in thousands):
| Years Ended December 31, | ||||||||||||
| 2009 | 2008 | 2007 | ||||||||||
| Income tax expense at U.S. federal statutory rate |
$ | 5,988 | $ | 17,593 | $ | 45,448 | ||||||
| Foreign provision in excess of federal statutory rate |
2,862 | 2,888 | 3,501 | |||||||||
| State income taxes (benefit), net of federal benefit |
(1,219 | ) | (892 | ) | 1,536 | |||||||
| U.S. manufacturing benefit |
(381 | ) | (1,692 | ) | (2,441 | ) | ||||||
| Federal tax credits |
(951 | ) | (2,205 | ) | (4,048 | ) | ||||||
| Change in cash surrender value of life insurance |
(215 | ) | (107 | ) | (210 | ) | ||||||
| Change in valuation allowance |
2,080 | 469 | 303 | |||||||||
| Other |
225 | 533 | 324 | |||||||||
| Income tax expense |
$ | 8,389 | $ | 16,587 | $ | 44,413 | ||||||
| Effective tax rate |
49.0 | % | 33.0 | % | 34.2 | % | ||||||
Deferred income taxes reflect the net tax effects of temporary differences between the carrying amounts of assets and liabilities for financial reporting purposes and the amounts used for income tax purposes. Significant components of our net deferred tax assets are as follows (in thousands):
| December 31, | ||||||||
| 2009 | 2008 | |||||||
| Deferred tax assets: |
||||||||
| Reserves and accruals not currently deductible |
$ | 30,860 | $ | 31,126 | ||||
| Difference between book and tax basis of inventory |
10,611 | 7,262 | ||||||
| Tax carryforwards |
15,849 | 11,637 | ||||||
| Foreign deferred tax assets |
7,264 | 10,387 | ||||||
| Total gross deferred tax assets |
64,584 | 60,412 | ||||||
| Valuation allowance |
(3,045 | ) | (918 | ) | ||||
| Net deferred tax assets |
61,539 | 59,494 | ||||||
| Deferred tax liabilities: |
||||||||
| Difference between book and tax basis of property and equipment |
(2,993 | ) | (2,321 | ) | ||||
| Total deferred tax liabilities |
(2,993 | ) | (2,321 | ) | ||||
| Net deferred tax assets |
$ | 58,546 | $ | 57,173 | ||||
In assessing the realizability of deferred tax assets, we consider whether it is more likely than not that some portion or all of the deferred tax assets will not be realized. With regard to certain deferred tax assets related to our TCZ joint venture, we believe there is insufficient evidence to conclude that realization of the benefit is more likely than not. Therefore, there is a valuation allowance of $965,000 and $918,000 against these assets for the years ended December 31, 2009 and 2008, respectively. An asset of $97,000 remains as of December 31, 2009 and 2008 as it is more likely than not that this federal tax asset will be realized.
During 2009, we realized a capital loss of $5.6 million and provided a full valuation allowance on the related $2.1 million deferred tax asset, as we believe it is more likely than not that we will not generate sufficient capital gains to utilize the capital loss after consideration of our available tax planning strategies.
F-32
Table of Contents
NOTES TO CONSOLIDATED FINANCIAL STATEMENTS—(Continued)
With regard to all other deferred tax assets, we believe that it is more likely than not that the results of future operations will generate sufficient taxable income to realize the benefit, and therefore no valuation allowance has been provided for these assets.
At December 31, 2009, we had state tax credit carry-forwards of $21.3 million, which may be carried forward indefinitely. At December 31, 2009, we had foreign net operating loss (“NOL”) carry-forwards of $25.9 million which may be carried forward indefinitely. The $25.9 million NOL carry-forwards originated in Singapore where we obtained Pioneer Status for a tax holiday. The tax holiday is awarded by Singapore’s Minister for Trade and Industry to promote capital investment in certain qualified high-technology businesses. The holiday is effective for a six year period, from 2007 through 2012, and provides exemption from corporate income tax on 100% of eligible income. We have not included any benefit from these NOL carryforwards in our tax expense.
The following is a reconciliation of the amount of gross unrecognized tax benefits (in thousands):
| 2009 | 2008 | |||||||
| Balance at January 1 |
$ | 25,604 | $ | 22,861 | ||||
| Additions based on tax positions related to the current year |
2,580 | 3,104 | ||||||
| Additions for tax positions of prior years |
2,433 | 6,862 | ||||||
| Reductions for tax positions of prior years |
(3,021 | ) | (7,223 | ) | ||||
| Settlements/expiration of statutes |
— | — | ||||||
| Balance at December 31 |
$ | 27,596 | $ | 25,604 | ||||
Included in the balance of unrecognized tax benefits at December 31, 2009 is $18.5 million of net tax benefits that, if recognized, would affect our effective tax rate.
We recognize interest and penalties related to uncertain tax positions in our income tax expense. As of December 31, 2009 and December 31, 2008, we had approximately $2.7 million and $2.5 million respectively, of accrued interest and penalties related to uncertain tax positions. During the years ended December 31, 2009, 2008, and 2007, we recorded interest and penalties of $185,700, $1.1 million, and $820,300, respectively.
We are subject to taxation in the United States and in various states and foreign jurisdictions. The field work for the 2003 through 2006 Internal Revenue Service (“IRS”) audit has closed. In connection with this audit, we have agreed to certain adjustments for our export income for the 2003 through 2006 tax years; however, this agreement did not result in a material change to our income tax expense. We have not agreed to proposed
F-33
Table of Contents
NOTES TO CONSOLIDATED FINANCIAL STATEMENTS—(Continued)
adjustments regarding the Research and Development Tax credit and are in the process of appealing the proposed adjustment with the IRS. If resolved in favor of the IRS, these adjustments would require a material increase to our income tax expense. However, we expect to prevail with our position and have determined that a change in our tax reserves is not appropriate at this time. In addition, we do not foresee material changes to the state or foreign uncertain tax positions within the next twelve months.
Our tax years 2007 and forward are subject to examination by the IRS, our tax years 2000 and forward are subject to examination by material state jurisdictions, and our tax years 2003 and forward are subject to examination by material foreign jurisdictions.
We benefit from a tax holiday in Korea where we manufacture certain of our replacement parts. The tax holiday is awarded by Korea’s Ministry of Finance and Economy to promote capital investment in certain qualified high-technology businesses. The holiday is effective for a 10-year period, from 2003 through 2012, and provides exemption from corporate income tax of 100% of eligible income through 2009 and 50% of eligible income from 2010 through 2012. Since inception, the tax holiday has produced tax benefits to us totaling $4.6 million.
It is our intention to reinvest undistributed earnings of our foreign subsidiaries and thereby indefinitely postpone their remittance, with the exception of our TCZ joint venture. Accordingly, we have not provided U.S. federal income and foreign withholding taxes on $58.3 million of undistributed earnings from non-U.S. operations as of December 31, 2009. It is not practicable to estimate the amount of the deferred tax liability on such unremitted earnings.
10. EMPLOYEE BENEFIT PLANS
Employee Savings Plan. We have a 401(k) plan that allows participating employees to contribute a percentage of their salary, subject to certain annual IRS limits. The plan is available to all U.S. employees and, per the terms of the plan, we are allowed to make a matching contribution of up to 5% of each participating employee’s compensation, not to exceed $5,000 per year. Under the plan, we contributed $2.3 million and $2.9 million for the years ended December 31, 2008 and 2007, respectively. In connection with our cost reduction actions conducted in the first quarter of 2009, we suspended our 401(k) matching program; therefore, no matching contributions were made for the year ended December 31, 2009.
Executive Deferred Compensation Plan. We have an executive deferred compensation plan for key management level employees in which the employee may elect to defer receipt of current compensation from us in order to provide retirement and other benefits on behalf of such employee. This plan is intended to be a nonqualified deferred compensation plan that complies with the provisions of Section 409A of the Internal Revenue Code. The plan is intended to be an unfunded plan maintained primarily for the purpose of providing deferred compensation benefits. We use corporate owned life insurance to support the plan. The cash surrender value of the company owned life insurance policies totaled $4.1 million and $3.4 million as of December 31, 2009 and 2008, respectively and is included in other assets in the consolidated balance sheets. Our liability for the deferred compensation plan totaled $4.3 million and $4.5 million as of December 31, 2009 and 2008, respectively, and is included in other liabilities in the consolidated balance sheets. Compensation expense under the plan totaled $59,000 and $196,000 for the years ended December 31, 2009 and 2007, respectively. For the year ended December 31, 2008, we recognized a benefit of $519,000 due to the decline in the plan liabilities value for the year.
Executive Option and Group Health Coverage Extension Program. We have an executive option and health coverage extension program for eligible executives who meet certain minimum service and age requirements. This program is designed to provide extended benefits to eligible executives who retire and cease
F-34
Table of Contents
NOTES TO CONSOLIDATED FINANCIAL STATEMENTS—(Continued)
to serve us on a full-time basis. Under the terms of the program, the executive acts as our consultant for a term of four years and in return for these services, the executive continues to vest in his or her eligible stock options after the retirement separation date. The program also provides the former executive with specified health insurance continuation benefits until they reach the age of 65. One former executive continued to participate in the health insurance benefits in 2009, 2008 and 2007.
Retirement Plans. Two of our subsidiary offices, Cymer Japan (“CJI”) and Cymer Korea (“CKI”), have retirement allowances and pension plans covering a substantial portion of their employees. Benefits under these plans are based upon years of service and compensation levels. The CJI pension plans consist of a Retirement Allowance and Pension Plan for all Cymer Japan employees. CKI has a government mandated Retirement Allowance and Pension Plan for all Cymer Korea employees. The expenses for the pension plans are recorded pursuant to the authoritative guidance for retirement benefits.
The reconciliation of beginning and ending balances of the projected benefit obligation and plan assets, and the funded status of the pension plans at December 31, 2009 and 2008 are as follows (in thousands):
| Years Ended December 31, | ||||||||
| 2009 | 2008 | |||||||
| Change in Benefit Obligation: |
||||||||
| Projected benefit obligation at end of prior year |
$ | 3,031 | $ | 3,049 | ||||
| Adjustment due to change in measurement date |
— | 28 | ||||||
| Service cost |
274 | 552 | ||||||
| Interest cost |
63 | 90 | ||||||
| Benefits paid |
(1,010 | ) | (835 | ) | ||||
| Actuarial loss |
179 | 47 | ||||||
| Effect of foreign currency |
8 | 100 | ||||||
| Projected benefit obligation at end of year |
$ | 2,545 | $ | 3,031 | ||||
| Change in Plan Assets: |
||||||||
| Fair value of assets at beginning of year |
$ | 462 | $ | 893 | ||||
| Expected return on plan assets |
16 | 28 | ||||||
| Actuarial gains (losses) on plan assets |
(5 | ) | 3 | |||||
| Company contributions |
134 | 64 | ||||||
| Benefits paid |
(321 | ) | (293 | ) | ||||
| Effect of foreign currency |
43 | (233 | ) | |||||
| Fair value of assets at end of year |
$ | 329 | $ | 462 | ||||
| Unfunded status at end of year |
$ | 2,216 | $ | 2,569 | ||||
| Unrecognized actuarial losses (before taxes) |
$ | 268 | $ | 177 | ||||
The authoritative guidance for retirement benefits requires employers to recognize the unfunded status of a benefit plan, measured as the difference between the plan assets at fair value and the projected benefit obligation, in their balance sheet. Therefore, we have recorded the unfunded status of the pension plans in the table above in other long-term liabilities. The recognition of the unfunded status on the balance sheet requires employers to recognize actuarial gains and losses as a component of other comprehensive income. We recorded the unrecognized actuarial gains and losses included in our pension plans in other comprehensive income (loss). The total amount recorded in accumulated other comprehensive income (loss) after taxes was an unrecognized actuarial loss of $162,000, $112,000 and $142,000 for the years ended December 31, 2009, 2008, and 2007,
F-35
Table of Contents
NOTES TO CONSOLIDATED FINANCIAL STATEMENTS—(Continued)
respectively. We do not expect to recognize any of the amount recorded in other comprehensive income (loss) as of December 31, 2009 as a component of net periodic benefit cost in 2010 as the net actuarial loss does not exceed 10 percent of the projected benefit obligation. There were no unrecognized transition costs or unrecognized prior service costs for either of the years ended December 31, 2009 or December 31, 2008.
Net period costs consisted of the following (in thousands):
| Years Ended December 31, | ||||||||||||
| 2009 | 2008 | 2007 | ||||||||||
| Service cost |
$ | 274 | $ | 552 | $ | 534 | ||||||
| Interest cost |
63 | 90 | 77 | |||||||||
| Expected return on plan asset |
(16 | ) | (28 | ) | (26 | ) | ||||||
| Amortization of net actuarial loss |
— | 3 | — | |||||||||
| Settlement gain |
(102 | ) | — | — | ||||||||
| Net periodic pension cost |
$ | 219 | $ | 617 | $ | 585 | ||||||
The reduction in work force and cost reduction actions taken in the first quarter of 2009 resulted in reduced plan participants and services eligible for retirement benefits, which constituted plan settlement under the authoritative guidance for retirement benefits. As a result, a settlement gain of $102,000 was recorded in the statement of operations for the year ended December 31, 2009.
The accumulated benefit obligation for our pension plans was as follows (in thousands):
| Years Ended December 31, | ||||||
| 2009 | 2008 | |||||
| Accumulated benefit obligation |
$ | 1,652 | $ | 2,295 | ||
The weighted average assumptions used in computing the projected benefit obligation and net periodic pension costs are as follows for the years presented:
| Years Ended December 31, | |||||||||
| 2009 | 2008 | 2007 | |||||||
| Discount rate |
2.26 | % | 2.66 | % | 3.34 | % | |||
| Rate of compensation increase |
5.20 | % | 4.45 | % | 4.88 | % | |||
| Expected return on plan assets |
5.25 | % | 4.90 | % | 4.60 | % | |||
The mortality rates for the CJI pension plan for both the years ended December 31, 2009 and 2008 were as announced by the Japanese Ministry of Health and Welfare in September 2009 and October 2004, respectively for use in funding valuation of the Employees Pension Fund. The mortality rates for the CKI pension plan were based upon data announced by the Korea Insurance Development Institute as required by Korean regulations for pension plans with less than 300 employees. To develop the expected long-term rate of return on plan assets assumption for our CKI pension plan, we considered the current level of expected returns on risk free investments (primarily government bonds), the historical level of the risk premium associated with the other asset classes in which the portfolio is invested and the expectations for future returns of each asset class. We then weighted the expected return for each asset class based on the target asset allocation to develop the expected long-term rate of return on plan assets assumption in the portfolio.
F-36
Table of Contents
NOTES TO CONSOLIDATED FINANCIAL STATEMENTS—(Continued)
Estimated future benefit payments expected under our pension plans are as follows (in thousands):
| 2010 |
123 | ||
| 2011 |
142 | ||
| 2012 |
160 | ||
| 2013 |
181 | ||
| 2014 |
205 | ||
| Thereafter |
1,318 | ||
| $ | 2,129 | ||
The CJI pension plan is an unfunded plan and includes no plan assets. Our pension plan assets are recorded based on the total amount contributed plus any compounded and accrued interest. CKI maintains a trust fund with a life insurance company which is a guaranteed investment product and heavily regulated by the Korean government. For CKI’s pension plan, this type of fund is the only investment option allowed by related laws and regulations. All of CKI pension plan assets are held in a Variable Rate Guaranteed Investment Fund. There are no other categories of pension plan assets. The vast majority of pension plan assets, as well as a minimum rate of return are guaranteed by the Korean government. We expect to make contributions of approximately $167,000 to the CKI pension plan in 2010.
11. COMMITMENTS AND CONTINGENCIES
TCZ. Due to the acquisition of the remaining 40% interest in TCZ effective January 15, 2010, we are obligated to pay our former partner in TCZ, Zeiss, approximately $2.3 million by September 31, 2010.
Leases. We lease certain facilities under non-cancelable operating leases. The lease terms on these facilities are through December 2014 and provide for certain rent abatements, and minimum annual increases and options to extend the terms. In addition, we have a land lease in Korea with a lease term that expires in December 2020. This land lease is exempt from lease payments because the building meets certain investment and operational criteria of the Korean government. From time to time, we lease certain equipment and vehicles under either capital or operating leases. We had no capital lease agreements as of December 31, 2009.
Building rent expense under operating leases, net of sublease building rental income, is recognized on a straight-line basis over the life of the related lease. Rent expense includes payments for building rent, utilities and services. Sublease rental income which concluded at the end of 2009, includes payments by our tenants for building rent and reimbursement of utilities and services. For the years ended December 31, 2009 and 2008, net rent expense totaled approximately $330,000 and $182,000, respectively. For the year ended December 31, 2007, sublease rental income exceeded rent expense by $1,000 for the year. Sublease rental income totaled approximately $5.2 million, $5.1 million and $4.9 million for the years ended December 31, 2009, 2008 and 2007, respectively.
Total future minimum lease commitments under operating leases are as follows (in thousands):
| Years Ending December 31, |
Operating Lease Payments | ||
| 2010 |
1,980 | ||
| 2011 |
1,176 | ||
| 2012 |
352 | ||
| 2013 |
45 | ||
| 2014 |
1 | ||
| Total |
$ | 3,554 | |
F-37
Table of Contents
NOTES TO CONSOLIDATED FINANCIAL STATEMENTS—(Continued)
Guarantees and Warranties. We record a provision for warranty, which is included in cost of revenues and is recorded at the time that the related revenue is recognized. The warranty period and terms for light source systems and replacement parts varies by light source system model. We review our warranty provision using a statistical financial model which calculates actual historical expenses, product failure rates, and potential risks associated with our different product models. We then use this financial model to calculate the future probable expenses related to warranty and the required level of the warranty provision. Throughout the year, we review the risk levels, historical cost information and failure rates used within this model and update them as information changes over the product’s life cycle. If actual warranty expenditures differ substantially from our estimates, revisions to the warranty provision would be required. Actual warranty expenditures are recorded against the warranty provision as they are incurred.
The following table provides the changes in the product warranty accrual (in thousands):
| Years Ended December 31, | ||||||||
| 2009 | 2008 | |||||||
| Balance as of January 1 |
$ | 23,565 | $ | 24,350 | ||||
| Accruals for warranties issued during the year |
11,849 | 24,097 | ||||||
| Changes in liability related to pre-existing warranties |
(8,263 | ) | (8,368 | ) | ||||
| Warranty expenditures during the year |
(10,511 | ) | (16,514 | ) | ||||
| Balance as of December 31 |
$ | 16,640 | $ | 23,565 | ||||
Intellectual Property Indemnifications. We agree to indemnify certain of our customers in the general purchase agreements with our three lithography tool manufacturer customers, ASML, Canon and Nikon, and under certain of our development and supply agreements. These indemnifications generally include both general and intellectual property indemnification provisions that provide we defend these parties against certain infringement claims directed against our products. Under the indemnification provisions, we would pay costs and damages attributable to the infringement claims, including attorney’s fees associated with settlements or defenses in respect of such claims, provided that certain conditions are satisfied. As of December 31, 2009, we were not subject to any pending general or intellectual property-related litigation. We have not received any requests for nor have we been required to make any payments under these indemnification provisions.
Contingencies. We are from time to time party to legal actions in the normal course of business. Based in part on the advice of legal counsel, our management does not expect the outcome of legal action in the normal course of business to have a material impact on our financial position, liquidity, or results of operations.
In May 2001, we acquired certain patents for use in our DUV light source applications and in November 2003, we acquired the rights to these same patents for use in EUV and future light source applications under this agreement. Per the terms of the May 2001 and November 2003 patent license agreements, we are required to pay a minimum $200,000 royalty annually in the event that we do not ship a certain number of production tools to third parties which contain the intellectual property that we in-licensed under these agreements. This royalty provision which applies to both agreements became effective on January 1, 2006; however this royalty provision was not triggered in 2009, 2008 or 2007 because the minimum unit shipment requirements were not met. The $200,000 in minimum royalty fees that we incurred in 2009, 2008 and 2007 associated with this agreement are included in research and development expenses on the accompanying consolidated statements of operations.
12. RELATED PARTY TRANSACTIONS
Carl Zeiss SMT AG and Carl Zeiss Laser Optics Beteiligungsgesellschaft mbH. Under the terms of the TCZ joint venture agreement, Zeiss is a related party. In addition to transactions that occur among us, Zeiss and TCZ related to the joint venture, we also purchase certain optical parts directly from Zeiss and periodically
F-38
Table of Contents
NOTES TO CONSOLIDATED FINANCIAL STATEMENTS—(Continued)
sell our light source system products to them. Associated with these transactions, we recorded revenue of $869,000, $2.3 million and $3.7 million for the years ended December 31, 2009, 2008 and 2007, respectively. As of December 31, 2009 and 2008, we had accounts receivable balances of $732,000 and $818,000, respectively, and accounts payable balances of $9.3 million and $4.1 million, respectively, all of which were associated with these related party transactions with Zeiss.
A $2.0 million capital contribution was made to TCZ by us and Zeiss during 2009. This additional capital contribution was allocated according to the terms of the joint venture agreement: 60% from us and 40% from Zeiss. During, 2009, Cymer also purchased a tool from Zeiss for $2.1 million, which it in turn sold to TCZ. Of the $2.1 million purchase price for this tool, Cymer immediately paid Zeiss $800,000 and the remaining $1.3 million is due to Zeiss in February 2010. Immediately following Cymer’s payment of $800,000 to Zeiss, Zeiss made their $800,000 capital contribution to TCZ. Effective January 15, 2010, we purchased the remaining 40% interest in TCZ owned by Zeiss. See further information in Note 15, “Subsequent Events”
13. SEGMENT AND GEOGRAPHIC INFORMATION
Operating segments are defined as components of a public entity which engage in business activity which may earn revenues and incur expenses and its operating results are reviewed regularly by the chief operating decision maker (“CODM”), or decision making group, in deciding how to allocate resources and in assessing performance. We develop, manufacture and market our products within two reportable business segments, Cymer and TCZ. Cymer’s primary business is to design, manufacture and sell excimer light source systems and installed base products for use in photolithography systems used in the manufacture of semiconductors. TCZ is currently developing and producing a system for use in the manufacture of OLED flat panel displays.
Our CODM is our chief operating officer and serves on the TCZ board of directors who review the operations and full financial statements of Cymer and TCZ on a quarterly basis. Our CODM uses this information in order to make decisions on resources needed for our light source systems and the OLED flat panel display systems businesses and to assess the overall performance of these components of our business. The accounting policies to derive our consolidated financial results are substantially the same as those used for our segment reporting. Information related to our Cymer and TCZ operating segments is as follows (in thousands):
| Year Ended December 31, 2009 (1) | ||||||||||||||
| Cymer | TCZ | Consolidation Adjustment |
Total | |||||||||||
| Revenue |
$ | 307,664 | $ | — | $ | — | $ | 307,664 | ||||||
| Operating Income (Loss) |
$ | 22,859 | $ | (5,108 | ) | $ | 275 | $ | 18,026 | |||||
| Total Assets |
$ | 648,911 | $ | 18,157 | $ | (2,150 | ) | $ | 664,918 | |||||
| Year Ended December 31, 2008 (1) | ||||||||||||||
| Cymer | TCZ | Consolidation Adjustment |
Total | |||||||||||
| Revenue |
$ | 459,010 | $ | — | $ | — | $ | 459,010 | ||||||
| Operating Income (Loss) |
$ | 63,771 | $ | (4,049 | ) | $ | 360 | $ | 60,082 | |||||
| Total Assets |
$ | 763,358 | $ | 17,657 | $ | (3,571 | ) | $ | 777,444 | |||||
F-39
Table of Contents
NOTES TO CONSOLIDATED FINANCIAL STATEMENTS—(Continued)
| Year Ended December 31, 2007 (1) | ||||||||||||||
| Cymer | TCZ | Consolidation Adjustment |
Total | |||||||||||
| Revenue |
$ | 521,696 | $ | — | $ | — | $ | 521,696 | ||||||
| Operating Income (Loss) |
$ | 118,934 | $ | (4,854 | ) | $ | 382 | $ | 114,462 | |||||
| Total Assets |
$ | 777,823 | $ | 18,725 | $ | (2,396 | ) | $ | 794,152 | |||||
| (1) | TCZ operating loss is presented net of noncontrolling interest. |
Geographic Information
Concentrations in revenue from our major customers are disclosed in Note 1, “Summary of Significant Accounting Policies—Concentrations & Related Uncertainties.” Sales to external customers, long-lived assets, all other identifiable assets and total identifiable assets, classified by operations located in the U.S., Japan, Korea, Taiwan, Singapore, China, and the Netherlands are as follows (in thousands):
| Year Ended December 31, 2009 | ||||||||||||||||||
| U.S. | Japan | Korea | Other Asia (Taiwan, Singapore and China) |
Europe (the Netherlands) |
Consolidated | |||||||||||||
| Sales to external customers (1) |
$ | 91,214 | $ | 74,331 | $ | 60,725 | $ | 57,732 | $ | 23,662 | $ | 307,664 | ||||||
| Long lived assets (2) |
$ | 100,356 | $ | 532 | $ | 2,600 | $ | 2,930 | $ | 337 | $ | 106,755 | ||||||
| All other identifiable assets |
372,848 | 55,765 | 38,659 | 66,636 | 24,255 | 558,163 | ||||||||||||
| Total identifiable assets |
$ | 473,204 | $ | 56,297 | $ | 41,259 | $ | 69,566 | $ | 24,592 | $ | 664,918 | ||||||
| Year Ended December 31, 2008 | ||||||||||||||||||
| U.S. | Japan | Korea | Other Asia (Taiwan, Singapore and China) |
Europe (the Netherlands) |
Consolidated | |||||||||||||
| Sales to external customers (1) |
$ | 172,993 | $ | 113,304 | $ | 72,122 | $ | 69,222 | $ | 31,369 | $ | 459,010 | ||||||
| Long lived assets (2) |
$ | 105,484 | $ | 1,233 | $ | 2,847 | $ | 4,254 | $ | 572 | $ | 114,390 | ||||||
| All other identifiable assets |
479,111 | 70,100 | 41,526 | 48,027 | 24,290 | 663,054 | ||||||||||||
| Total identifiable assets |
$ | 584,595 | $ | 71,333 | $ | 44,373 | $ | 52,281 | $ | 24,862 | $ | 777,444 | ||||||
| Year Ended December 31, 2007 | ||||||||||||||||||
| U.S. | Japan | Korea | Other Asia (Taiwan, Singapore and China) |
Europe (the Netherlands) |
Consolidated | |||||||||||||
| Sales to external customers (1) |
$ | 244,286 | $ | 120,403 | $ | 63,093 | $ | 64,067 | $ | 29,847 | $ | 521,696 | ||||||
| Long lived assets (2) |
$ | 104,451 | $ | 1,007 | $ | 4,367 | $ | 6,248 | $ | 652 | $ | 116,725 | ||||||
| All other identifiable assets |
496,340 | 56,902 | 60,399 | 41,036 | 22,750 | 677,427 | ||||||||||||
| Total identifiable assets |
$ | 600,791 | $ | 57,909 | $ | 64,766 | $ | 47,284 | $ | 23,402 | $ | 794,152 | ||||||
| (1) | Sales to external customers consist of sales generated from each of the geographic locations. These sales exclude export sales to other geographic locations. All significant intercompany balances are eliminated in consolidation. |
| (2) | Long-lived assets include net property, plant and equipment attributed to the geographic location in which they are located. |
F-40
Table of Contents
NOTES TO CONSOLIDATED FINANCIAL STATEMENTS—(Continued)
14. QUARTERLY FINANCIAL DATA (UNAUDITED)
The table below includes quarterly data (in thousands, except per share data):
| Year Ended December 31, 2009 | ||||||||||||||
| 1st | 2nd | 3rd | 4th | |||||||||||
| Revenues |
$ | 56,499 | $ | 62,433 | $ | 92,328 | $ | 96,404 | ||||||
| Operating income (loss) |
$ | (16,516 | ) | $ | (540 | ) | $ | 15,404 | $ | 19,678 | ||||
| Net income (loss) |
$ | (11,487 | ) | $ | 525 | $ | 10,785 | $ | 12,153 | |||||
| Basic earnings per share (1) |
$ | (0.39 | ) | $ | 0.02 | $ | 0.36 | $ | 0.41 | |||||
| Diluted earnings (loss) per share (1) |
$ | (0.39 | ) | $ | 0.02 | $ | 0.36 | $ | 0.40 | |||||
| Year Ended December 31, 2008 | ||||||||||||||
| 1st | 2nd | 3rd (2)(3) | 4th | |||||||||||
| Revenues |
$ | 123,952 | $ | 123,991 | $ | 110,619 | $ | 100,448 | ||||||
| Operating income |
$ | 19,734 | $ | 22,248 | $ | 13,720 | $ | 4,380 | ||||||
| Net income |
$ | 12,892 | $ | 14,333 | $ | 5,331 | $ | 3,984 | ||||||
| Basic earnings per share (1) |
$ | 0.43 | $ | 0.48 | $ | 0.18 | $ | 0.13 | ||||||
| Diluted earnings per share (1) |
$ | 0.41 | $ | 0.46 | $ | 0.18 | $ | 0.13 | ||||||
| (1) | Earnings per share are computed separately for each quarter and the full year using the respective weighted average shares. Therefore, the sum of the quarterly earnings per share amounts may not equal the annual amounts reported. |
| (2) | Includes a correction of an immaterial error for the third quarter of 2008 related to foreign currency translation of our foreign subsidiaries’ statements of operations. This correction decreased previously reported revenue by $774,000, previously reported net income by $404,000 and previously reported diluted earnings per share by $0.01 in the third quarter of 2008. |
| (3) | Includes a 2006 out-of-period immaterial correction which reduced income tax expense by $506,000 in the third quarter of 2008. |
15. SUBSEQUENT EVENTS
In accordance with the authoritative guidance for subsequent events, we have evaluated any events or transactions occurring after December 31, 2009, the balance sheet date, and noted that there have been no such events or transactions which would effect our consolidated financial statements for the year ended December 31, 2009, except as noted below.
Acquisition of Noncontrolling Interest in TCZ Joint Venture. On January 14, 2010, we entered into a memorandum of understanding with Zeiss and TCZ. We and Zeiss have agreed that effective January 15, 2010: (i) we will acquire Zeiss’ forty percent interest in TCZ for approximately $2.3 million cash to be paid in full no later than September 30, 2010, and (ii) Zeiss will not be required to make any further cash capital contributions to TCZ.
Zeiss will continue to provide TCZ relevant intellectual property licenses, ongoing research and development, and manufacturing of optical modules. This change in ownership does not affect the development timeline for TCZ’s products and services.
F-41
Table of Contents
SCHEDULE II
VALUATION AND QUALIFYING ACCOUNTS
Years Ended December 31, 2009, 2008 and 2007 (in thousands)
| Balance at Beginning of Year |
Additions (net) (1) |
Deductions | Balance at End of Year | |||||||||||
| Allowance for Doubtful Accounts |
||||||||||||||
| Year Ended December 31, 2009 |
$ | 2,295 | $ | 2 | $ | — | $ | 2,297 | ||||||
| Year Ended December 31, 2008 |
$ | 589 | $ | 1,885 | $ | (179 | ) | $ | 2,295 | |||||
| Year Ended December 31, 2007 |
$ | 943 | $ | (323 | ) | $ | (31 | ) | $ | 589 | ||||
| (1) | Includes reversal of allowance amounts as deemed necessary. |
See accompanying report of independent registered public accounting firm.
S-1